|
|
|
|
|
|
|
|
|
|
|
|
|
|
|
|
|
|
|
|
|
|
|
|
|
|
|
|
|
|
|
|
|
|
|
|
|
|
|
|
|
|
|
|
|
|
|
|
|
|
|
|
|
|
|
|
UNITED STATES
SECURITIES AND EXCHANGE COMMISSION
Washington, DC 20549
FORM
|
|
ANNUAL REPORT PURSUANT TO SECTION 13 OR 15(d) OF THE SECURITIES EXCHANGE ACT OF 1934 |
For the fiscal year ended
or
|
|
TRANSITION REPORT PURSUANT TO SECTION 13 OR 15(d) OF THE SECURITIES EXCHANGE ACT OF 1934 |
For the transition period from to
Commission File Number
Commission File Number
(Exact name of registrant as specified in its charter)
|
|
|
|
|
|
|
|
|
(State or other jurisdiction of incorporation or organization) |
(I.R.S. Employer Identification No.)
|
|
|
|
|
|
|
|
(
|
|
|
(Address of principal executive offices) (zip code) |
|
(Registrant's telephone number, including area code) |

Securities registered pursuant to Section 12(b) of the Act:
Regency Centers Corporation
|
Title of each class |
|
Trading Symbol |
|
Name of each exchange on which registered |
|
|
|
|
|
|
|
|
|
|
|
|
|
|
|
|
|
|
Regency Centers, L.P.
|
Title of each class |
|
Trading Symbol |
|
Name of each exchange on which registered |
|
None |
|
N/A |
|
N/A |
Securities registered pursuant to Section 12(g) of the Act:
Regency Centers Corporation: None
Regency Centers, L.P.: Units of Partnership Interest
Indicate by check mark if the registrant is a well-known seasoned issuer, as defined in Rule 405 of the Securities Act.
Regency Centers Corporation
Indicate by check mark if the registrant is not required to file reports pursuant to Section 13 or Section 15(d) of the Act
Regency Centers Corporation Yes
☐
Indicate by check mark whether the registrant (1) has filed all reports required to be filed by Section 13 or 15(d) of the Securities Exchange Act of 1934 during the preceding 12 months (or for such shorter period that the registrant was required to file such reports), and (2) has been subject to such filing requirements for the past 90 days.
Regency Centers Corporation
Indicate by check mark whether the registrant has submitted electronically every Interactive Data File required to be submitted pursuant to Rule 405 of Regulation S-T (§232.405 of this chapter) during the preceding 12 months (or for such shorter period that the registrant was required to submit such files).
Regency Centers Corporation
Indicate by check mark whether the registrant is a large accelerated filer, an accelerated filer, a non-accelerated filer, a smaller reporting company, or an emerging growth company. See the definitions of "large accelerated filer," "accelerated filer," "smaller reporting company," and "emerging growth company" in Rule 12b-2 of the Exchange Act. (Check one):
Regency Centers Corporation:
|
|
☒ |
Accelerated filer |
☐ |
Emerging growth company |
|
|
Non-accelerated filer |
☐ |
Smaller reporting company |
|
|
|
Regency Centers, L.P.:
|
Large accelerated filer |
☐ |
Accelerated filer |
☐ |
Emerging growth company |
|
|
|
☒ |
Smaller reporting company |
|
|
|
If an emerging growth company, indicate by check mark if the registrant has elected not to use the extended transition period for complying with any new or revised financial accounting standards provided pursuant to Section 13(a) of the Exchange Act.
Regency Centers Corporation ☐ Regency Centers, L.P. ☐
Indicate by check mark whether the registrant has filed a report on and attestation to its management’s assessment of the effectiveness of its internal control over financial reporting under Section 404(b) of the Sarbanes-Oxley Act (15 U.S.C. 7262(b)) by the registered public accounting firm that prepared or issued its audit report.
Regency Centers Corporation
If securities are registered pursuant to Section 12(b) of the Act, indicate by check mark whether the financial statements of the registrant included in the filing reflect the correction of an error to previously issued financial statements. 1
Regency Centers Corporation
Indicate by check mark whether any of those error corrections are restatements that required a recovery analysis of incentive-based compensation received by any of the registrant's executive officers during the relevant recovery period pursuant to Section 240.10D-1(b). 1
Regency Centers Corporation ☐ Regency Centers, L.P. ☐
Indicate by check mark whether the registrant is a shell company (as defined in Rule 12b-2 of the Act).
Regency Centers Corporation Yes
☐
No
State the aggregate market value of the voting and non-voting common equity held by non-affiliates computed by reference to the price at which the common equity was last sold, or the average bid and asked price of such common equity, as of the last business day of the registrants' most recently completed second fiscal quarter.
Regency Centers Corporation
$
The number of shares outstanding of the Regency Centers Corporation’s common stock was
Documents Incorporated by Reference
Portions of Regency Centers Corporation's proxy statement, prepared in connection with its upcomin g 2024 Annual Meeting of Shareholders, are incorporated by reference in Part III of this Annual Report on Form 10-K to the extent described therein.
1 Per SEC guidance, this blank checkbox is included on this cover page but no disclosure with respect thereto shall be made until the adoption and effectiveness of related stock exchange listing standards.
EXPLANATORY NOTE
This Annual Report on Form 10-K (this "Report") combines the annual reports on Form 10-K for the year ended December 31, 2023, of Regency Centers Corporation and Regency Centers, L.P. Unless stated otherwise or the context otherwise requires, references to "Regency Centers Corporation" or the "Parent Company" mean Regency Centers Corporation and its controlled subsidiaries and references to "Regency Centers, L.P." or the "Operating Partnership" mean Regency Centers, L.P. and its controlled subsidiaries. The terms "the Company," "Regency Centers," "Regency," "we," "our," and "us" as used in this Report mean the Parent Company and the Operating Partnership, collectively.
The Parent Company is a real estate investment trust ("REIT") and the general partner of the Operating Partnership. As the sole general partner of the Operating Partnership, the Parent Company has exclusive control of the Operating Partnership's day-to-day management. The Operating Partnership's capital includes general and limited common partnership units ("Common Units"). As of December 31, 2023, the Parent Company owned approximately 99.4% of the Common Units in the Operating Partnership. The remaining Common Units, which are all limited Common Units, are owned by third party investors. In addition to the Common Units, the Operating Partnership has also issued two series of preferred units: the 6.250% Series A Cumulative Redeemable Preferred Units (the “Series A Preferred Units”) and the 5.875% Series B Cumulative Redeemable Preferred Units (the “Series B Preferred Units”). The Parent Company currently owns all of the Series A Preferred Units and Series B Preferred Units. The Series A Preferred Units and Series B Preferred Units are sometimes referred to collectively as the “Preferred Units."
The Company believes combining the annual reports on Form 10-K of the Parent Company and the Operating Partnership into this single report provides the following benefits:
Management operates the Parent Company and the Operating Partnership as one business. The management of the Parent Company consists of the same individuals as the management of the Operating Partnership. These individuals are officers of the Parent Company, and officers and employees of the Operating Partnership.
The Company believes it is important to understand the key differences between the Parent Company and the Operating Partnership in the context of how the Parent Company and the Operating Partnership operate as a consolidated company. The Parent Company is a REIT, whose only material asset is its ownership of Common and Preferred Units of the Operating Partnership. As a result, the Parent Company does not conduct business itself, other than acting as the sole general partner of the Operating Partnership, issuing public equity from time to time and guaranteeing certain debt of the Operating Partnership. Except for $200 million of unsecured private placement debt, the Parent Company does not hold any indebtedness, but guarantees all of the unsecured debt of the Operating Partnership. The Operating Partnership, directly or indirectly, is also the co-issuer and guarantor of the $200 million Parent Company’s unsecured private placement debt referenced above. The Operating Partnership holds all the assets of the Company and ownership of the Company's subsidiaries and equity interests in its joint ventures. Except for net proceeds from public equity issuances by the Parent Company, which are contributed to the Operating Partnership in exchange for Common Units or Preferred Units, the Operating Partnership generates all other capital required by the Company's business. These sources include the Operating Partnership's operations, its direct or indirect incurrence of indebtedness, and the issuance of Common Units and Preferred Units
Shareholders' equity, partners' capital, and noncontrolling interests are the main areas of difference between the Consolidated Financial Statements of the Parent Company and those of the Operating Partnership. The Operating Partnership's capital includes the Common Units and the Preferred Units. The limited partners' Common Units in the Operating Partnership owned by third parties are accounted for in partners' capital in the Operating Partnership's financial statements and outside of shareholders' equity in noncontrolling interests in the Parent Company's financial statements. The Preferred Units owned by the Parent Company are eliminated in consolidation in the accompanying consolidated financial statements of the Parent Company and are classified as preferred units of general partner in the accompanying consolidated financial statements of the Operating Partnership.
In order to highlight the differences between the Parent Company and the Operating Partnership, there are sections in this Report that separately discuss the Parent Company and the Operating Partnership, including separate financial statements, controls and procedures sections, and separate Exhibit 31 and 32 certifications. In the sections that combine disclosure for the Parent Company and the Operating Partnership, this Report refers to actions or holdings as being actions or holdings of the Company.
As general partner with control of the Operating Partnership, the Parent Company consolidates the Operating Partnership for financial reporting purposes, and the Parent Company does not have assets other than its investment in the Operating Partnership. Therefore, while shareholders' equity and partners' capital differ as discussed above, the assets and liabilities of the Parent Company and the Operating Partnership are the same on their respective financial statements.
TABLE OF CONTENTS
|
|
||
|
|
|
|
|
Item No. |
|
Form 10-K Report Page |
|
|
|
|
|
|
PART I |
|
|
|
|
|
|
1. |
1 |
|
|
|
|
|
|
1A. |
9 |
|
|
|
|
|
|
1B. |
22 |
|
|
|
|
|
|
1C. |
22 |
|
|
|
|
|
|
2. |
24 |
|
|
|
|
|
|
3. |
41 |
|
|
|
|
|
|
4. |
41 |
|
|
|
|
|
|
|
PART II |
|
|
|
|
|
|
5. |
41 |
|
|
|
|
|
|
6. |
42 |
|
|
|
|
|
|
7. |
Management's Discussion and Analysis of Financial Condition and Results of Operations |
43 |
|
|
|
|
|
7A. |
58 |
|
|
|
|
|
|
8. |
59 |
|
|
|
|
|
|
9. |
Changes in and Disagreements with Accountants on Accounting and Financial Disclosure |
126 |
|
|
|
|
|
9A. |
126 |
|
|
|
|
|
|
9B. |
127 |
|
|
|
|
|
|
9C. |
Disclosure Regarding Foreign Jurisdictions that Prevent Inspection |
128 |
|
|
|
|
|
|
PART III |
|
|
|
|
|
|
10. |
128 |
|
|
|
|
|
|
11. |
128 |
|
|
|
|
|
|
12. |
Security Ownership of Certain Beneficial Owners and Management and Related Stockholder Matters |
128 |
|
|
|
|
|
13. |
Certain Relationships and Related Transactions, and Director Independence |
128 |
|
|
|
|
|
14. |
129 |
|
|
|
|
|
|
|
PART IV |
|
|
|
|
|
|
15. |
130 |
|
|
|
|
|
|
16. |
136 |
|
|
|
|
|
|
|
SIGNATURES |
|
|
|
|
|
|
17. |
137 |
|
Forward-Looking Statements
Certain statements in this document regarding anticipated financial, business, legal or other outcomes including business and market conditions, outlook and other similar statements relating to Regency's future events, developments, or financial or operational performance or results, are "forward-looking statements" made pursuant to the safe harbor provisions of the Private Securities Litigation Reform Act of 1995 and other federal securities laws. These forward-looking statements are identified by the use of words such as "may," "will," "could," "should," "would," "expect," "estimate," "believe," "intend," "forecast," "project," "plan," "anticipate," "guidance," and other similar language. However, the absence of these or similar words or expressions does not mean a statement is not forward-looking. While we believe these forward-looking statements are reasonable when made, forward-looking statements are not guarantees of future performance or events and undue reliance should not be placed on these statements. Although we believe the expectations reflected in any forward-looking statements are based on reasonable assumptions, we can give no assurance these expectations will be attained, and it is possible actual results may differ materially from those indicated by these forward-looking statements due to a variety of risks and uncertainties.
Our operations are subject to a number of risks and uncertainties including, but not limited to, risk factors described in "Item 1A. Risk Factors " of this Report. When considering an investment in our securities, you should carefully read and consider these risks, together with all other information in our Annual Reports on Form 10-K, Quarterly Reports on Form 10-Q, and our other filings with and submissions to the Securities and Exchange Commission ("SEC"), including those made in connection with the Company's acquisition of Urstadt Biddle Properties Inc. (“UBP” or “Urstadt Biddle”). If any of the events described in the risk factors actually occur, our business, financial condition or operating results, as well as the market price of our securities, could be materially adversely affected. Forward-looking statements are only as of the date they are made, and Regency undertakes no duty to update its forward-looking statements, whether as a result of new information, future events or developments or otherwise, except as and to the extent required by law.
PAR T I
Item 1. B usiness
Regency Centers Corporation is a fully integrated real estate company and self-administered and self-managed real estate investment trust that began its operations as a publicly-traded REIT in 1993. Our corporate headquarters are located at One Independent Drive, Suite 114, Jacksonville, Florida. Regency Centers, L.P. is a subsidiary through which Regency Centers Corporation conducts substantially all of its operations, and which owns, directly or indirectly, substantially all of its assets. Our business consists of acquiring, developing, owning, and operating income-producing retail real estate principally located in suburban trade areas with compelling demographics within the United States of America ("USA" or "United States"). We generate revenues by leasing space to necessity, service, convenience, and value-based retailers serving the essential needs of our communities. Regency has been an S&P 500 Index member since 2017. Our business experienced material growth in 2023 due to our acquisition of UBP which is further discussed in "Item 7. Management’s Discussion and Analysis of Financial Condition and Results of Operations.”
As of December 31, 2023, we had full or partial ownership interests in 482 properties, primarily anchored by market leading grocery stores, encompassing 56.8 million square feet ("SF") of gross leasable area ("GLA"). Our Pro-rata share of this GLA is 48.6 million square feet, including our share of properties owned through unconsolidated real estate partnerships.
We are a preeminent national owner, operator, and developer of neighborhood and community shopping centers predominantly located in suburban trade areas with compelling demographics that have strategic attributes supporting growth through economic cycles. Our mission is to create thriving environments for retailers and service providers to connect with surrounding neighborhoods and communities. Our vision is to elevate quality of life as an integral thread in the fabric of our communities. Our portfolio includes thriving properties merchandised with highly productive grocers, restaurants, service providers, and best-in-class retailers that connect with their neighborhoods, communities, and customers.
Our values:
1
Our goals are to:
Key strategies to achieve our goals are to:
Competition
We are among the largest owners of shopping centers in the USA based on revenues, number of properties, GLA, and market capitalization. There are numerous companies and individuals engaged in our line of business that compete with us in our targeted markets, including grocery store chains that own shopping centers and also anchor some of our shopping centers. This dynamic results in competition for attracting tenants as well as acquiring existing shopping centers and new development sites. In addition, brick and mortar shopping centers face continued competition from alternative shopping and delivery methods. We believe that our competitive advantages are driven by:
2
Corporate Responsibility and Human Capital
To execute our mission, which is to create thriving environments for retailers and service providers to connect with surrounding neighborhoods and communities, we strive to achieve best-in-class corporate responsibility. For this reason, corporate responsibility, including our focus on ESG practices that support and enhance our business, is a foundational strategy of Regency. We believe that alignment of strategy and business sustainability is critical to the long-term success of our Company, our shareholders, the environment, and the communities in which we operate. To achieve this alignment, our corporate responsibility (which term we use interchangeably with “ESG”) practices are built on four pillars:
These practices are guided by three overarching concepts: long-term value creation, our Regency brand and reputation, and the importance of maintaining our culture, which has been a crucial driver of our long-term success. Our continued commitment to these concepts helps to guide our business strategy, and identify and focus on key corporate responsibility-related drivers that we expect to contribute to our future success.
We regularly review our corporate responsibility strategies, goals, and objectives under these four pillars with our Board of Directors (or the "Board") and its committees, which oversee our programs. More information about our corporate responsibility strategy, goals, performance, and reporting, including our annual Corporate Responsibility Report, and our policies and practices related to corporate responsibility, is available on our website at www.regencycenters.com. The content of our website and other information contained therein, including relating to corporate responsibility, is not incorporated by reference into this Report or in any other report or document we file with the SEC, and any references to our website are intended to be inactive textual references only.
Our People – Our people are our most important asset, and we strive to ensure that they are engaged, passionate about their work, connected to their teams, and supported to deliver their best performance. Regency recognizes and values the importance to the Company's success of attracting and retaining talented individuals with different skills, backgrounds, and experiences to encourage diversity of thought and ideas. In addition, we strive to maintain a safe and healthy workspace, promote employee well-being, and empower our employees by focusing on their personal and professional development through training and education opportunities.
As of December 31, 2023, we had 497 employees, including 5 part-time employees. We presently maintain 24 market offices nationwide, including our corporate headquarters in Jacksonville, Florida. None of our employees are represented by a collective bargaining unit, and we believe our relationship with our employees is good.
In 2023, we continued implementing our comprehensive diversity, equity, and inclusion ("DEI") strategy focused on promoting and advancing diversity across our organization. The goals of this strategy are to attract, recruit, and retain a diverse group of employees to grow, develop, and succeed, as we collectively work to implement our mission and contribute to the long-term success of the organization. Furthermore, aligned with our near-and long-term human capital goals, we remained focused on employee engagement, leveraging our annual employee survey to identify opportunities to improve and further engage our people.
Diversity, Equity, and Inclusion - We believe that much of our success is rooted in the diversity and inclusion of our teams and our commitment to a diverse and inclusive culture. We continue to foster a culture in which everyone is respected, valued, and has an equal opportunity to contribute and thrive. Our shopping centers are in trade areas throughout the U.S. and our tenants and visitors to our centers represent a cross section of those communities. We remain focused on building a workforce that represents the many tenants and visitors to our centers we serve and the communities in which we operate.
Our most recent U.S. Equal Employment Opportunity Commission EEO-1 survey data can be found on our website, including additional information related to employee gender and ethnic diversity.
Human Rights – Regency is committed to a workplace free from discrimination and harassment and is focused on advancing fundamental human rights. Anti-discrimination and anti-harassment training is provided to all employees at orientation, and annually thereafter.
Talent Attraction and Retention – Our core values place a strong importance on our people, which we believe make us an employer of choice. We understand the importance of attracting and retaining the best talent to sustain our history of success and build long-term value. We strive to offer some of the most competitive pay and benefits in the industry in which we operate and are continually looking for new opportunities to ensure that we attract and retain our people.
3
Training and Development – We strive to provide an environment where our people are connected to their teams, passionate about what they do, and supported to deliver their best efforts and results. From individual contributors to managers and senior leaders, we want to empower our employees to take control of their career growth and realize their full potential through meaningful training and development opportunities.
Health, Safety, and Well-Being – The safety, health, and well-being of our people are a top priority for Regency. We strive to provide a benefit package that is comprehensive, competitive, and thoughtfully designed to attract and retain the best in the business. We prioritize employee safety at our centers and offices, and require contractors working at our sites to engage in safe work practices.
Our Communities – Our predominately grocery-anchored neighborhood and community shopping centers provide many benefits to the communities in which we live and work, including significant local economic impacts in the form of investment, jobs, and taxes. Our local teams are passionate about investing in and engaging with our communities as they customize and cultivate our centers to create a distinctive environment to bring our tenants and shoppers together for the best retail experience.
We believe philanthropy and charitable giving are important elements of our corporate responsibility commitment to the communities in which we operate. Throughout 2023, Regency supported its employees to serve and invest in community organizations through volunteer and financial support. Charitable contributions were made directly by the Company, as well as by the vast majority of our employees who donated their time and money to local non-profits directly serving their communities. Furthermore, as part of our strategy, we continued to improve our communities by investing in property enhancements and placemaking at our new and existing shopping centers.
Ethics and Governance – As long-term stewards of our investors’ capital, we are committed to best-in-class corporate governance. To create long-term value for our stakeholders, we place great emphasis on our culture and core values, the integrity and transparency of our reporting practices, and our overall governance structure in respect of oversight and shareholder rights.
To continue to strive for the best achievable mix of skills, experience, backgrounds, tenures, and competencies, including gender, ethnicity, age, and other attributes, Regency’s Board of Directors annually reviews its overall composition and succession planning process. As an outcome of this process, on September 26, 2022, the Company's Board of Directors elected Kristin A. Campbell to serve as one of the Regency's directors effective January 15, 2023. Ms. Campbell’s skill set, background, experience and competencies align with Regency’s ongoing commitment to board refreshment and best-in-class corporate governance.
Environmental Stewardship – We believe sustainability is in the best interest of our investors, tenants, employees, and the communities in which we operate, and we strive to integrate sustainable practices throughout our business.
We have identified eight strategic priorities to foster sustainable business practices and minimize both our environmental impact and the long-term risks to Regency’s business: green building, energy efficiency, electric vehicle charging stations, renewable energy, greenhouse gas emissions (“GHG”) reduction, water conservation, waste management, and climate change as it applies to our real estate portfolio. We believe these strategic priorities are not only the right thing to do to address environmental concerns such as climate change, resource scarcity and pollution (including GHG emissions reduction), but also support our achievement of key strategic financial and business objectives relating to our operations and development and redevelopment projects.
Throughout 2023, we continued to make progress towards our target to reduce GHG emissions and collaborate closely with our tenants to minimize their operational environmental impact. Aligned with the Science Based Targets initiative (SBTi), our target aims to reduce our absolute Scope 1 and 2 GHG emissions by 28% by 2030, measured against a 2019 baseline year, and to achieve net-zero Scope 1 and 2 GHG emissions across all operations by 2050. In addition, the Company has established targets to enhance energy efficiency, manage water and waste responsibly and invest in renewable energy sources and electric vehicle charging stations. These targets reflect our proactive stance in addressing environmental challenges and contributing to a more sustainable future. Regency’s progress towards these targets, together with our strategy and efforts influenced by climate change, are further described in our 2022 Corporate Responsibility Report. Based on our current estimates and asset base, we do not expect the pursuit of these targets to materially impact our operating results and financial condition.
As a long-term owner, operator, and developer of real estate, we acknowledge the potential for climate change to have a material impact on our properties, people, and long-term success. Regency wants to ensure that our properties can safely, sustainably, and responsibly withstand the test of time. We continue to refine our understanding of our exposure to climate-related impacts by conducting ongoing property-level analysis as well as the risks that climate change may pose to our business.
Compliance with Governmental Regulations
We are subject to various regulatory and tax-related requirements within the jurisdictions in which we operate. Changes to such requirements may result in unanticipated material financial impacts or adverse tax consequences and could materially affect our operating results and financial condition. Significant regulatory requirements include the laws and regulations described below.
4
REIT Laws and Regulations
We have elected to be taxed as a REIT under the federal income tax laws. As a REIT, we are generally not subject to federal income tax on taxable income that we distribute to our shareholders. Under the Internal Revenue Code (the "Code"), REITs are subject to numerous regulatory requirements, including the requirement to generally distribute at least 90% of taxable income each year. We will be subject to federal income tax on our taxable income at regular corporate rates if we fail to qualify as a REIT for tax purposes in any taxable year, or to the extent we distribute less than 100% of our taxable income. We will also generally not qualify for treatment as a REIT for federal income tax purposes for four years following the year during which qualification is lost. Even if we qualify as a REIT for federal income tax purposes, we may be subject to certain state and local income and franchise taxes and to federal income and excise taxes on our undistributed taxable income.
We have elected to treat certain of our subsidiaries as taxable REIT subsidiaries ("TRS"). In general, a TRS may engage in any real estate business and certain non-real estate businesses, subject to certain limitations under the Code. A TRS is subject to federal and state income taxes which, to date, have not been material to us.
Environmental Laws and Regulations
Under various federal, state and local laws, ordinances and regulations (collectively, "environmental laws"), we may be liable for some or all of the cost to assess and remediate certain hazardous substances at our shopping centers. To the extent any environmental issues arise, they most typically stem from the historic practices of current and former dry cleaners, gas stations, and other similar businesses at our centers, as well as the presence of asbestos in some structures. These environmental laws often impose liability without regard to whether the owner knew of, or committed the acts or omissions that caused the presence of the hazardous substances. The presence of such substances, or the failure to properly address contamination caused by such substances, may adversely affect our ability to sell or lease the property or borrow using the property as collateral, and could result in claims by and liabilities to third parties relating to contamination that emanated from our properties. Although we have a number of properties that could require or are currently undergoing varying levels of assessment and remediation, known environmental liabilities are not currently expected to have a material impact on our financial condition.
Information About Our Executive Officers
Our executive officers are appointed by our Board of Directors and each of our executive officers has been employed by us for more than five years. As of the date of this Report, our executive officers are:
|
Name |
Age |
|
Title |
Executive Officer in
|
|
|
Martin E. Stein, Jr. |
|
71 |
|
Executive Chairman of the Board of Directors |
2020 (1) |
|
Lisa Palmer |
|
56 |
|
President and Chief Executive Officer |
2020 (2) |
|
Michael J. Mas |
|
48 |
|
Executive Vice President, Chief Financial Officer |
2019 (3) |
|
Alan T. Roth |
|
48 |
|
East Region President & Chief Operating Officer |
2023 (4) |
|
Nicholas A. Wibbenmeyer |
|
43 |
|
West Region President & Chief Investment Officer |
2023 (5) |
Company Website Access and SEC Filings
Our website may be accessed at www.regencycenters.com . All of our filings with the SEC can be accessed free of charge through our website promptly after filing; however, in the event that the website is inaccessible, we will provide paper copies of our most recent annual report on Form 10-K, the most recent quarterly report on Form 10-Q, current reports filed or furnished on Form 8-K, and all
5
related amendments, excluding exhibits, free of charge upon request. These filings are also accessible on the SEC's website at www.sec.gov . The content of our website is not incorporated by reference into this Annual Report on Form 10-K or in any other report or document we file with the SEC, and any references to our website are intended to be inactive textual references only.
General Information
Our registrar and stock transfer agent is Broadridge Corporate Issuer Solutions, LLC ("Broadridge"), Edgewood, NY. We offer a dividend reinvestment plan ("DRIP") that enables our shareholders to reinvest dividends automatically, as well as to make voluntary cash payments toward the purchase of additional shares. For more information, contact Broadridge toll free at (877) 830-4936 or our Shareholder Relations Department at (904) 598-7000.
The Company's stock is listed on the NASDAQ Global Select Market, with its common stock traded under the ticker symbol "REG," and the Company's 6.250% Series A Cumulative Redeemable Preferred Stock, and 5.875% Series B Cumulative Redeemable Preferred Stock trade under the ticker symbols "REGCP", and "REGCO", respectively.
Our independent registered public accounting firm is
Annual Meeting of Shareholders
Our 2024 annual meeting of shareholders is currently expected to be held on Wednesday, May 1, 2024, and will be conducted in a virtual-only format to the extent permitted by applicable law.
Non-GAAP Measures
In addition to the required Generally Accepted Accounting Principles ("GAAP") presentations, we use and report certain non-GAAP measures as we believe these measures improve the understanding of our operational results. We believe these non-GAAP measures provide useful information to our Board of Directors, management and investors regarding certain trends relating to our financial condition and results of operations. Our management uses these non-GAAP measures to compare our performance to that of prior periods for trend analyses, purposes of determining management incentive compensation and budgeting, forecasting and planning purposes. We continually evaluate the usefulness, relevance, limitations, and calculation of our reported non-GAAP measures to determine how best to provide relevant information to the public, and thus such reported measures could change.
We do not consider non-GAAP measures an alternative to financial measures determined in accordance with GAAP, rather they supplement GAAP measures by providing additional information we believe to be useful to our shareholders. The principal limitation of these non-GAAP measures is that they may exclude significant expense and income items that are required by GAAP to be recognized in our Consolidated Financial Statements. In addition, they reflect the exercise of management's judgment about which expense and income items are excluded or included in determining these non-GAAP measures. In order to compensate for these limitations, reconciliations of the non-GAAP measures we use to their most directly comparable GAAP measures are provided. Non-GAAP measures should not be relied upon in evaluating the financial condition, results of operations, or future prospects of the Company.
Defined Terms
The following terms, as defined, are commonly used by management and the investing public to understand, and evaluate our operational results, and are included in this document:
6
Companies use different depreciable lives and methods, and real estate values historically fluctuate with market conditions. Since Nareit FFO excludes depreciation and amortization and gains on sale and impairments of real estate, it provides a performance measure that, when compared year over year, reflects the impact on operations from trends in percent leased, rental rates, operating costs, acquisition and development activities, and financing costs. This provides a perspective of our financial performance not immediately apparent from net income determined in accordance with GAAP. Thus, Nareit FFO is a supplemental non-GAAP financial measure of our operating performance, which does not represent cash generated from operating activities in accordance with GAAP; and, therefore, should not be considered a substitute measure of cash flows from operations. We provide a reconciliation of Net Income Attributable to Common Shareholders to Nareit FFO.
We provide Pro-rata financial information because we believe it assists investors and analysts in estimating our economic interest in our consolidated and unconsolidated partnerships, when read in conjunction with our reported results under GAAP. We believe presenting our Pro-rata share of assets, liabilities, operating results, and other metrics, along with certain other non-GAAP measures, makes comparisons of our operating results to those of other REITs more meaningful. The Pro-rata information provided is not, nor is it intended to be, presented in accordance with GAAP. The Pro-rata supplemental details of assets and liabilities and supplemental details of operations reflect our proportionate economic ownership of the assets, liabilities, and operating results of the properties in our portfolio
The Pro-rata information is prepared on a basis consistent with the comparable consolidated amounts and is intended to more accurately reflect our proportionate economic interest in the assets, liabilities, and operating results of properties in our portfolio. We do not control the unconsolidated investment partnerships, and the Pro-rata presentations of the assets and liabilities, and revenues and expenses do not represent our legal claim to such items. The partners are entitled to profit or loss allocations and distributions of cash flows according to the operating agreements, which generally provide for such allocations according to their invested capital. Our share of invested capital establishes the ownership interests we use to prepare our Pro-rata share.
The presentation of Pro-rata information has limitations which include, but are not limited to, the following:
Because of these limitations, the Pro-rata financial information should not be considered independently or as a substitute for our financial statements as reported under GAAP. We compensate for these limitations by relying primarily on our GAAP financial statements, using the Pro-rata information as a supplement.
7
8
Item 1A. R isk Factors
Our operations are subject to a number of risks and uncertainties including, but not limited to, those listed below. When considering an investment in our securities, carefully read and consider these risks, together with all other information in our other filings and submissions to the SEC, which provide much more information and detail. If any of the events described in the following risk factors actually occur, our business, financial condition and/ or operating results, as well as the market price of our securities, could be materially adversely affected.
Risk Factors Related to the Current Economic and Geopolitical Environments
Interest rates in the current economic environment may adversely impact our cost to borrow, real estate valuation, and stock price.
On multiple occasions during 2022 and 2023, the Board of Governors of the Federal Reserve System ("the U.S. Federal Reserve") raised its benchmark federal funds rate, which has led to numerous increases in interest rates in the credit markets, with further increases possible. Higher interest rates may negatively impact consumer spending, our tenants' businesses, and/or future demand for space in our shopping centers.
Additionally, higher interest rates adversely impact our cost of borrowing. Our exposure to higher interest rates in the short term includes our variable-rate borrowings, which consist of borrowings under our unsecured senior line of credit and variable rate based secured notes payable. Increases in interest rates could increase our financing costs over time, either through near-term borrowings on our floating-rate line of credit or refinancing of our existing borrowings that may incur higher interest expenses related to the issuance of new debt. Prolonged periods of higher interest rates may negatively impact the valuation of our real estate asset portfolio and could result in a decline of our stock price and market capitalization, which may adversely impact our ability and willingness to raise equity capital on favorable terms through sales of our common shares, including through our At the Market ("ATM") program.
Although the extent of any prolonged periods of higher interest rates remains unknown at this time, negative impacts to our cost of capital may also adversely affect our future business plans and growth, at least in the near term.
Current economic challenges, including the potential for recession, may adversely impact our tenants and our business.
The success of our tenants in operating their businesses and their corresponding ability to pay us rent continue to be significantly impacted by many current economic challenges, which impact their cost of doing business, including, but not limited to, inflation, labor shortages, supply chain constraints, decreasing consumer confidence and discretionary spending, and increasing energy prices and interest rates. Additionally, macroeconomic and geopolitical risks create challenges that may exacerbate current market conditions in the United States, including the potential for a recession.
These economic challenges could adversely impact our volume of leasing activity, which could include tenant move outs and/or higher levels of uncollectible lease income, as well as negatively affect the business and financial results of our tenants. The aggregate impacts of these current economic challenges may also negatively affect the overall market for retail space, resulting in decreased demand for space in our centers. This, in turn, could result in pricing pressure on rent that we are able to charge to new or renewing tenants, such that future rent spreads could be adversely impacted. Further, we may experience higher costs for tenant buildouts, as costs of materials and labor may increase and supply and availability of both may become more limited.
Unfavorable developments affecting the banking and financial services industry could adversely affect our business, liquidity and financial condition, and overall results of operations.
Actual events, concerns or speculation about disruption or instability in the banking and financial services industry, such as liquidity constraints or lack of available credit, the failure of individual institutions, or the inability of individual institutions or the banking and financial service industry generally to meet their contractual obligations, could significantly impair our access to capital, delay access to deposits or other financial assets, or cause actual loss of funds subject to cash management arrangements. Similarly, these events, concerns or speculation could result in less favorable commercial financing terms, including higher interest rates or costs and tighter financial and operating covenants, or systemic limitations on access to credit and liquidity sources, thereby making it more difficult for us and our tenants to acquire financing on acceptable terms or at all. Additionally, our critical vendors and business partners also could be adversely affected by these risks as described above, which in turn could result in their committing a breach or default under their contractual agreements with us, their insolvency or bankruptcy, or other adverse effects.
Any decline in available funding, lack of credit in the commercial real estate market, or access to cash and liquidity resources, or non-compliance of banking and financial services counterparties with their contractual commitments to us, our tenants or our critical vendors and business partners could, among other risks, have material adverse impacts on our ability to meet our operating expenses and other financial needs, could result in breaches of our financial and/or contractual obligations, and could have material adverse impacts on our business, financial condition and results of operations.
9
Current geopolitical challenges could impact the U.S. economy and consumer spending and our results of operations and financial condition.
The success of our business, and the businesses of our tenants, largely depends on consumer spending. While we currently own no shopping centers or other assets outside of the U.S. nor have meaningful direct international supply chain exposure, geopolitical challenges and their potential impact on the global macroeconomic environment, including the war involving Russia and Ukraine, Middle East conflicts and wars, and the economic and other possible conflicts involving China (including any slowing of its economy), could impact aspects of the U.S. economy and, therefore, consumer spending. In addition, these geopolitical challenges could impact other areas of the U.S. economy, which could impact our business and the businesses of our tenants through rising inflation and interest rates (and, hence, reduced availability and/or increased costs of borrowing), increased energy prices, labor shortages, supply chain constraints and, potentially, a U.S. economic recession. It is unclear whether and when these geopolitical challenges and uncertainties will be mitigated or resolved, and what effects they may have on global political and economic conditions over the long term. However, a substantial delay in or lack of resolution of these challenges could have an adverse impact on the U.S. economy and consumer spending and, therefore, an adverse effect on our results of operations and the financial condition of the Company.
Risks Relating to Regency's Financial Performance Relating to the Urstadt Biddle Merger
Regency may not realize the anticipated benefits and synergies from the Urstadt Biddle merger.
On August 18, 2023, Regency completed its merger with Urstadt Biddle. The success of the merger will depend, in part, on Regency’s ability to realize the anticipated benefits from successfully combining its and Urstadt Biddle’s businesses. Regency is devoting substantial management attention and resources to integrating its and Urstadt Biddle’s business practices and operations so that Regency can fully realize the anticipated benefits of the mergers. Nonetheless, the business and assets acquired may not be successful or continue to grow at the same rate as when operated independently or may require greater resources and investments than originally anticipated. The mergers could also result in the assumption of unknown or contingent liabilities. Potential difficulties Regency may encounter in the integration process include the following:
As a result, the anticipated benefits of the mergers may not be realized fully within the expected time frame or at all or may take longer to realize or cost more than expected, which could adversely affect Regency’s business, financial condition, results of operations and growth prospects.
Risk Factors Related to Pandemics or other Health Crises
Pandemics or other health crises, such as the COVID-19 pandemic, may adversely affect our tenants' financial condition, the profitability of our properties, and our access to the capital markets and could have a material adverse effect on our business, results of operations, cash flows and financial condition.
In response to the COVID-19 pandemic, federal, state, and local governments mandated or recommended various actions to reduce or prevent the spread of COVID-19, which altered customer behaviors and temporarily limited many of our tenants’ ability to operate. As a result, certain tenants requested rent concessions or sought to renegotiate future rents based on changes to the economic environment. Some tenants chose not to reopen or to honor the terms of their lease agreements. In addition, moratoria and other legal restrictions in certain states impacted our ability to bring legal action to enforce our leases and our ability to collect rent. Should
10
federal, state, and local governments mandate or recommend lockdowns again in the future due to a pandemic or other similar health crises, tenants could request rent concessions or seek to renegotiate future rents.
In the event of future pandemics or similar health crises, consumers could elect to make more of their purchases online instead of in physical stores and businesses could delay executing new or renewals of leases amidst the immediate and uncertain economic impacts. These developments, coupled with potential tenant failures and a reduction in newly-formed businesses, could result in decreased demand for retail space in our centers, which could result in lower occupancy or higher levels of uncollectible lease income, as well as downward pressure on rents. Additionally, delays in construction of tenant improvements due to the impacts of constraints on supply chains and labor, resulting from government ordered lockdowns, could result in delayed rent commencement due to it taking longer for new tenants to open and operate.
Although the vast majority of our lease income is derived from contractual rent payments, the ability of certain of our tenants to meet their lease obligations could be negatively impacted by the disruptions and uncertainties of a new virus strain of COVID-19 or any future pandemic or other health crisis. Our tenants' ability to respond to these disruptions and uncertainties, including adjusting to governmental orders and changes in their customers' shopping habits and behaviors, may impact their ability to survive, and ultimately, their ability to comply with their lease obligations. Our future results of operations and overall financial performance could be uncertain should a new virus strain of COVID-19, or any future pandemic or other health crises occur.
Risk Factors Related to Operating Retail-Based Shopping Centers
Economic and market conditions may adversely affect the retail industry and consequently reduce our revenues and cash flow, and increase our operating expenses.
Our properties are leased primarily to retail tenants from whom we derive most of our revenue in the form of base rent, expense recoveries and other income. Therefore, our performance and operating results are directly linked to the economic and market conditions occurring in the retail industry. We are subject to the risks that, upon expiration, leases for space in our properties are not renewed by existing tenants, vacant space is not leased to new tenants, and/or tenants demand modified lease terms, including costs for renovations or concessions. The economic and market conditions potentially affecting the retail industry and our properties specifically include the following:
To the extent that any or a combination of these conditions occur, they are likely to impact the retail industry, our retail tenants, the emergence of new tenants, the demand for retail space, market rents and rent growth, capital expenditures, the percent leased levels of our properties, the value of our properties, our ability to sell, acquire or develop properties, our operating results and our cash flows.
11
Shifts in retail trends, sales, and delivery methods between brick and mortar stores, e-commerce, home delivery, and curbside pick-up may adversely impact our revenues, results of operations, and cash flows.
Retailers are increasingly impacted by e-commerce and changes in customer buying habits, including shopping from home and the delivery or curbside pick-up of items ordered online. Retailers are considering these customer buying habits and other trends when making decisions regarding their brick and mortar stores and how they will compete and innovate in a rapidly changing retail environment. Many retailers in our shopping centers provide services or sell goods which have historically been less likely to be purchased online; however, the continuing change in customer buying habits, including increase in e-commerce sales in all retail categories may cause retailers to adjust the size or number of their retail locations in the future or close stores. For example, our grocer tenants are incorporating e-commerce concepts through home delivery and curbside pick-up, which could reduce foot traffic at our centers. These alternative delivery methods are more likely to impact foot traffic at our centers in certain higher-income markets where consumers are willing to pay premiums for such services. Changes in customer buying habits and shopping trends may also impact the profitability and financial condition of retailers that do not adapt to changes in market conditions, and therefore may impact their ability to pay rent. This shift may adversely impact our percent leased and rental rates, which would impact our results of operations and cash flows.
Changing economic and retail market conditions in geographic areas where our properties are concentrated may reduce our revenues and cash flow.
Economic conditions in markets where our properties are concentrated can greatly influence our financial performance. Our properties in California and Florida represent 23.4% and 19.3%, respectively, of our annualized base rent. Our revenues and cash flow may be adversely affected by this geographic concentration if market conditions, such as supply of or demand for retail space, deteriorate more significantly in these states compared to other geographic areas. Additionally, there is a risk that businesses and residents in major metropolitan cities may relocate to different states or suburban markets.
Our success depends on the continued presence and success of our "anchor" tenants.
"Anchor Tenants" (tenants occupying 10,000 square feet or more) operate large stores in our shopping centers, pay a significant portion of the total rent at a property and contribute to the attraction and success of other tenants by drawing shoppers to the property. Our net income and cash flow may be adversely affected by the loss of revenues and incurrence of additional costs in the event a significant Anchor Tenant:
Some anchors have the right to vacate their space and may prevent us from re-tenanting by continuing to comply and pay rent in accordance with their lease agreement. Vacated "Anchor Space" (spaces 10,000 square feet or more), including space that may be owned by the anchor (as discussed below), can reduce rental revenues generated by the shopping center in other spaces because of the loss of the departed anchor's customer drawing power. In addition, if a significant tenant vacates a property, so-called "co-tenancy clauses" in select leases may allow other tenants to modify or terminate their rent payment or other lease obligations. Co-tenancy clauses have several variants: they may allow a tenant to postpone a store opening if certain other tenants fail to open their stores; they may allow a tenant to close its store prior to lease expiration if another tenant closes its store prior to lease expiration; or more commonly, they may allow a tenant to pay reduced levels of rent until a certain number of tenants open their stores within the same shopping center.
Additionally, some of our shopping centers are anchored by retailers who own their space in a location that is within or immediately adjacent to our shopping center ("shadow anchors"). In those cases, the shadow anchors appear to the consumer as a retail tenant of the shopping center and, as a result, attract additional consumer traffic to the center. In the event that a shadow Anchor Space becomes vacant, it could negatively impact our center as consumer traffic would likely be reduced.
A percentage of our revenues are derived from "local" tenants and our net income may be adversely impacted if these tenants are not successful, or if the demand for the types or mix of tenants significantly change.
At December 31, 2023, tenants with less than three locations ("Local Tenants") represent approximately 22% of annualized base rent. Local Tenants vary from retail shops and restaurants to service providers. These Local Tenants may be more vulnerable to negative
12
economic conditions and changing customer buying habits and retail trends as they may have more limited resources and access to capital than other tenants. As such, in the event of such changing conditions, habits and trends, they may suffer disproportionately greater impacts and be at greater risk of lease default than other tenants.
We may be unable to collect balances due from tenants in bankruptcy.
Although lease income is supported by long-term lease contracts, tenants who file for bankruptcy have the legal right to reject any or all of their leases and close related stores. Any unsecured claim we hold against a bankrupt tenant for unpaid rent may be paid only to the extent that funds are available and only in the same percentage as is paid to all other holders of unsecured claims. As a result, it is likely that we would recover substantially less than the full value of any unsecured claims we hold. Additionally, we may incur significant expense to recover our claim and to re-lease the vacated space. In the event that a tenant with a significant number of leases in our shopping centers files for bankruptcy and rejects its leases, we may experience a significant reduction in our revenues and may not be able to collect all pre-petition amounts owed by the bankrupt tenant.
Many of our costs and expenses associated with operating our properties may remain constant or increase, even if our lease income decreases.
Certain costs and expenses associated with our operating our properties, such as real estate taxes, insurance, utilities and common area expenses, generally do not decrease in the event of reduced occupancy or rental rates, non-payment of rents by tenants, general economic downturns, pandemics or other similar circumstances. In fact, in some cases, such as real estate taxes and insurance, they may actually increase despite such events. As such, we may not be able to lower the operating expenses of our properties sufficiently to fully offset such circumstances and may not be able to fully recoup these costs from our tenants. In such cases, our cash flows, operating results and financial performance may be adversely impacted.
Compliance with the Americans with Disabilities Act and other building, fire, and safety regulations may have a material negative effect on us.
All of our properties are required to comply with the Americans with Disabilities Act ("ADA"), which generally requires that buildings be made accessible to people with disabilities. Compliance with ADA requirements may require removal of access barriers, and noncompliance may result in imposition of fines by the U.S. government or an award of damages to private litigants, or both. While the tenants to whom we lease space in our properties are obligated by law to comply with the ADA provisions, and typically under tenant leases are obligated to cover costs associated with compliance, if required changes involve greater expenditures than anticipated, or if the changes must be made on a more accelerated basis than anticipated, the ability of these tenants to cover costs may be adversely affected. In addition, we are required to operate the properties in compliance with fire and safety regulations and building codes as they may be adopted by governmental entities and become applicable to the properties. Costs to be in compliance with the ADA or any other building, fire, and safety regulations could have a material negative impact on our results of operations.
Risk Factors Related to Real Estate Investments
Our real estate assets may decline in value and be subject to impairment losses which may reduce our net income.
Our real estate properties are carried at cost unless circumstances indicate that the carrying value of these assets may not be recoverable which may result in impairment. We evaluate whether there are any indicators, including declines in property operating performance and general market conditions, such that the value of the real estate properties (including any related tangible or intangible assets or liabilities, including goodwill) may not be recoverable and therefore may be impaired. Our evaluation includes several key assumptions, including rental rates, costs of tenant improvements, leasing commissions, anticipated holding periods, and assumptions regarding the residual value upon disposition, including the exit capitalization rate. These key assumptions are subjective in nature and may differ materially from actual results. Changes in our investment, redevelopment, and disposition strategies or changes in the market where an asset is located may alter management's intended holding period of an asset or asset group, which may result in an impairment loss and such loss may be material to our financial condition or operating performance.
The fair value of real estate assets is subjective and is determined through the use of comparable sales information and other market data if available, or through use of an income approach such as the direct capitalization method or the discounted cash flow approach. Such cash flow projections take into account expected future operating income, trends and prospects, as well as the effects of demand, competition and other relevant criteria, and therefore are subject to management judgment. In estimating the fair value of undeveloped land, we generally use market data and comparable sales information.
These subjective assessments have a direct impact on our net income because recording an impairment charge results in an immediate negative adjustment to net income, which may be material. There can be no assurance that we will not record impairment charges in the future related to our assets.
13
We face risks associated with development, redevelopment, and expansion of properties.
We actively pursue opportunities for new retail development and existing property redevelopment and/or expansion. Development and redevelopment activities require various government and other approvals for entitlements, and any delay in such approvals may significantly delay development and redevelopment projects. We may not recover our investment in our projects for which approvals are not received, and delays may adversely impact our expected returns. Additionally, changes in political elections and policies may impact our ability to obtain favorable land use and zoning for in-process and future developments and redevelopment projects. We are subject to other risks associated with these activities, including the following:
We face risks associated with the development of mixed-use commercial properties.
If we engage in more complex acquisitions and mixed-use development and redevelopment projects, there could be more unique risks to our return on investment. Mixed-use projects refer to real estate projects that, in addition to retail space, may also include space for residential, office, hotel or other commercial purposes. We have less experience in developing and managing non-retail real estate than we do retail real estate. As a result, if a development or redevelopment project includes a non-retail use, we may seek to develop that component ourselves, sell the rights to that component to a third-party developer, or partner with a developer.
We face risks associated with the acquisition of properties.
Our investment strategy includes investing in high-quality shopping centers that are leased to market-leading grocers, category-leading anchors, specialty retailers, and/or restaurants located in areas with above average household incomes and population densities. The acquisition of properties and/or real estate entities entails risks that include, but are not limited to, the following, any of which may adversely affect our results of operations and cash flows:
14
We may be unable to sell properties when desired because of market conditions.
Our properties, including their related tangible and intangible assets, represent the majority of our total consolidated assets and they may not be readily convertible to cash. Market conditions, including macroeconomic events, pandemics and other health crises, may impact our ability to sell properties on our preferred timing and at prices and returns we deem acceptable. As a result, our ability to sell one or more of our properties, including properties held in joint ventures, in response to changes in economic, industry, financial market, or other conditions may be limited. The real estate market is affected by many factors, such as general economic conditions, availability and terms of financing, interest rates and other factors, including supply and demand for space, that are beyond our control. There may be less demand for lower quality properties that we have identified for ultimate disposition in markets with uncertain economic or retail environments, and where buyers are more reliant on the availability of third party mortgage financing. If we want to sell a property, we can provide no assurance that we will be able to dispose of it in the desired time period or at all or that the sales price of a property will be attractive at the relevant time or even exceed the carrying value of our investment.
Changes in tax laws could impact our acquisition or disposition of real estate.
Certain properties we own have a low tax basis, which may result in a meaningful taxable gain on sale. We utilize, and intend to continue to utilize, Internal Revenue Code Section 1031 like-kind exchanges to tax-efficiently buy and sell properties; however, there can be no assurance that we will identify properties that meet our investment objectives for acquisitions or that changes to the tax laws do not eliminate the benefits of effectuating 1031 exchanges, or significantly change the requirements for a transaction to qualify for 1031 exchange treatment. In the event that we cannot or do not utilize 1031 exchanges, we may be required to distribute the gain proceeds to shareholders or pay income tax, which may reduce our cash flow available to fund our commitments or other priorities.
Risk Factors Related to the Environment Affecting Our Properties
Climate change may adversely impact our properties directly and may lead to additional compliance obligations and costs as well as additional taxes and fees.
While we work with experts to plan for the impacts of climate change on our business, we cannot reliably predict the extent, rate, timing, or impact of climate change. To the extent climate change causes adverse changes in weather patterns, our properties in certain markets, especially those nearer to the coasts, may experience increases in storm frequency and intensity and rising sea‑levels. Further, population migration may occur in response to these or other factors and negatively impact our centers. For example, climate and other environmental changes may result in more unpredictable or decreased demand for retail space at certain of our properties, reduced rent or, in extreme cases, our inability to operate certain properties at all. Climate change may also have indirect effects on our business by increasing the cost of insurance or making insurance unavailable. While the federal government has not yet enacted comprehensive legislation to address climate change that would directly impact us, certain states in which we own and operate shopping centers, including California and New York, have done so. Compliance with these and future new laws or regulations related to climate change may require us to make additional investments in or for our existing properties, resulting in increased capital expenditures and operating costs, implement new or additional processes and controls to facilitate compliance, and/or pay additional energy, insurance, taxes and related fees and costs. At this time, there can be no assurance that we can anticipate all potential material impacts of climate change, or that climate change will not have a material adverse effect on the value of our properties and our financial performance in the future.
Geographic concentration of our properties makes our business more vulnerable to natural disasters, severe weather conditions and climate change.
A significant number of our properties are located in areas that are susceptible to earthquakes, tropical storms, hurricanes, tornadoes, wildfires, sea-level rise, and other natural disasters. At December 31, 2023, 18.7% of the GLA of our portfolio is located in the state of California, including a number of properties in the San Francisco Bay and Los Angeles areas. Additionally, 20.1% and 7.1% of the GLA of our portfolio is located in the states of Florida and Texas, respectively. Insurance costs for properties in these areas have increased significantly, and recent intense weather conditions may cause property insurance premiums to increase significantly in the future. We recognize that the frequency and / or intensity of extreme weather events, and other climatic changes may continue to increase, and as a result, our exposure to these events may increase. These weather conditions may disrupt our business and the business of our tenants, which may affect the ability of some tenants to pay rent and may reduce the willingness of tenants or residents to remain in or move to these affected areas. Therefore, as a result of the geographic concentration of our properties, we face risks, including disruptions to our business and the businesses of our tenants and higher costs, such as uninsured property losses, higher insurance premiums, and potential additional regulatory requirements by government agencies in response to perceived risks.
15
Costs of environmental remediation may adversely impact our financial performance and reduce our cash flow.
Under various federal, state, and local laws, an owner or manager of real property may be liable for some or all the costs to assess and remediate the presence of hazardous substances on the property, which in our case most typically arise from current or former dry cleaners, gas stations, asbestos usage, and historic land use practices. These laws often impose liability without regard to whether the owner knew of, or was responsible for, the presence of hazardous substances, which may adversely impact our financial performance and reduce our cash flow. The presence of, or the failure to properly address the presence of, hazardous substances may adversely affect our ability to sell or lease the property or borrow using the property as collateral. We can provide no assurance that we are aware of all potential environmental liabilities or their ultimate cost to address; that our properties will not be affected by tenants or nearby properties or other unrelated third parties; and that future uses or conditions, or changes in environmental laws and regulations, or their interpretation, will not result in additional material environmental liabilities to us.
Risk Factors Related to Corporate Matters
An increased focus on metrics and reporting related to environmental, social and governance ("ESG") factors, may impose additional costs and expose us to new risks.
Investors have become more focused on understanding how companies address a variety of ESG factors. As they evaluate investment decisions, many investors look not only at company disclosures but also to ESG rating systems that have been developed by third parties to allow ESG comparisons between companies. Although we participate in a number of these ratings systems, we do not participate in all such systems, and may not score as well in all of the available ratings systems as other REITs and real estate operators. Further, the criteria used in these ratings systems may conflict with each other and change frequently, and we cannot guaranty that we will be able to score well in the future. We supplement our participation in ratings systems by disclosing on our website information about our ESG activities, but some investors may desire additional disclosures that we do not provide. In addition, the SEC is currently considering adopting new regulations that would impose additional ESG disclosure and other compliance requirements on us. California has adopted a number of climate disclosure laws which will increase our compliance costs and require us to make additional climate disclosures. Other states are considering legislation similar to California’s new laws. Failure to participate in certain of the third-party ratings systems, failure to score well in those ratings systems or failure to provide certain ESG disclosures could adversely impact us when investors compare us against similar companies in our industry, and could cause certain investors to be unwilling to invest in our stock, which could adversely impact our stock price and our ability to raise capital. In addition, failure to comply with new government climate and other ESG disclosure obligations could subject us to significant fines and penalties.
An uninsured loss or a loss that exceeds the insurance coverage on our properties may subject us to loss of capital and revenue on those properties.
We carry liability, fire, flood, terrorism, business interruption, and environmental insurance for our properties. Some types of losses, such as losses from named windstorms, earthquakes, terrorism, or wars may have more limited coverage, or in some cases, can be excluded from insurance coverage. In addition, it is possible that the availability of insurance coverage in certain areas may decrease in the future, and the cost to procure such insurance may increase due to factors beyond our control. As a result, we may reduce the insurance we procure or we may elect or be compelled to self-insure or otherwise assume some of this risk. Should a loss occur at any of our properties that is in excess of the property or casualty insurance limits of our policies, we may lose part or all of our invested capital and revenues from such property, which may have a material adverse impact on our operating results, financial condition, and our ability to make distributions to stock and unit holders.
Terrorist activities or violence occurring at our properties also may directly affect the value of our properties through damage, destruction or loss. Insurance for such acts may be unavailable or cost more resulting in an increase to our operating expenses and adversely affect our results of operations. To the extent that our tenants are affected by such attacks and threats of violence, their businesses may be adversely affected, including their ability to continue to meet obligations under their existing leases.
Failure to attract and retain key personnel may adversely affect our business and operations.
The success of our business depends, in significant part, on the leadership and performance of our executive management team and other key personnel, and our ability to attract, retain and motivate talented and diverse employees may significantly impact our future performance. Competition for these individuals is intense, and we cannot be assured that we will retain all of our executive management team and other key personnel or that we will be able to attract and retain other highly qualified individuals for these positions in the future. Losing any key personnel may have an adverse effect on us.
16
Risk Factors Related to Our Partnerships and Joint Ventures
We do not have voting control over all of the properties owned in our real estate partnerships and joint ventures, so we are unable to ensure that our objectives will be pursued.
We have invested substantial capital as a partner in a number of partnerships and joint ventures to acquire, own, lease, develop or redevelop properties. These activities are subject to the same risks as our investments in our wholly-owned properties. However, these investments, and other future similar investments may involve risks that would not be present were a third party not involved, including the possibility that partners or other owners might become bankrupt, suffer a deterioration in their creditworthiness, or fail to fund their share of required capital contributions. Partners or other owners may have economic or other business interests or goals that are inconsistent with our own business interests or goals, and may be in a position to take actions contrary to our policies or objectives.
These investments, and other future similar investments, also have the potential risk of creating impasses on decisions, such as a sale or financing, because neither we nor our partner or other owner has full control over the partnership or joint venture. Disputes between us and partners or other owners might result in a premature termination of the applicable partnership or joint venture, or potentially litigation or arbitration, that may increase our investment and related risk as well as our costs and expenses associated with the investment, and distract management from sufficiently focusing their time and efforts on others areas of our business. In addition, we risk the possibility of being held liable for the actions of our partners or other owners. These factors may limit the return that we receive from such investments or cause our cash flows to be lower than our estimates.
The termination of our partnerships may adversely affect our cash flow, operating results, and our ability to make distributions to stock and unit holders.
If partnerships owning a significant number of properties were dissolved for any reason, we could lose the asset, property management, leasing and construction management fees from these partnerships as well as the operating income of the properties, which may adversely affect our operating results and our cash available for distribution to stock and unit holders. Certain of our partnership operating agreements provide either member the ability to elect buy/sell clauses. The election of these dissolution provisions could require us to invest additional capital to acquire the partners’ interest or to sell our share of the property thereby losing the operating income and cash flow.
Risk Factors Related to Funding Strategies and Capital Structure
Our ability to sell properties and fund acquisitions and developments may be adversely impacted by higher market capitalization rates and lower NOI at our properties which may dilute earnings.
As part of our funding strategy, we sell properties that no longer meet our strategic objectives or investment standards and/or those with a limited future growth profile. These sales proceeds are used to fund debt repayment, acquisition of other properties, and new developments and redevelopments. An increase in market capitalization rates (which may or may not be driven by an increase in interest rates) or a decline in NOI may cause a reduction in the value of centers identified for sale, which would have an adverse impact on the amount of cash generated. Additionally, the sale of properties resulting in significant tax gains may require higher distributions to our stockholders or payment of additional income taxes in order to maintain our REIT status.
We depend on external sources of capital, which may not be available in the future on favorable terms or at all.
To qualify as a REIT, the Parent Company must, among other things, distribute to its stockholders each year at least 90% of its REIT taxable income (excluding any net capital gains). Because of these distribution requirements, we may not be able to fund all future capital needs with income from operations. In such instances, we would rely on third-party sources of capital, which may or may not be available on favorable terms or at all. Our access to third-party sources of capital depends on a number of things, including the market's perception of our growth potential and our current and potential future earnings. Our access to debt depends on our credit rating, the willingness of creditors to lend to us and conditions in the capital markets. In addition to finding lenders willing to lend to us, we are dependent upon our joint venture partners to contribute their pro rata share of any amount needed to repay or refinance existing debt when lenders reduce the amount of debt our partnerships and joint ventures are eligible to refinance.
In addition, our existing debt arrangements also impose covenants that limit our flexibility in obtaining other financing. Additional equity offerings may result in substantial dilution of stockholders' interests and additional debt financing may substantially increase our degree of leverage.
Without access to external sources of capital, we would be required to pay outstanding debt with our operating cash flows and proceeds from property sales. Our operating cash flows may not be sufficient to pay our outstanding debt as it comes due and real estate investments generally cannot be sold quickly at a return we believe is appropriate. If we are required to deleverage our business
17
with operating cash flows and proceeds from property sales, we may be forced to reduce the amount of, or eliminate altogether, our distributions to stock and unit holders or refrain from making investments in our business.
Our debt financing may adversely affect our business and financial condition.
Our ability to make scheduled payments or to refinance our indebtedness will depend primarily on our future performance, which to a certain extent is subject to economic, financial, competitive and other factors beyond our control. In addition, we do not expect to generate sufficient operating cash flow to make balloon principal payments on our debt when due. If we are unable to refinance our debt on acceptable terms, we may be forced (i) to dispose of properties, which might result in losses, or (ii) to obtain financing at unfavorable terms, either of which may reduce the cash flow available for distributions to stock and unit holders. If we cannot make required mortgage loan payments, the mortgagee may foreclose on the property securing the mortgage.
Covenants in our debt agreements may restrict our operating activities and adversely affect our financial condition.
Our unsecured notes and unsecured line of credit (the "Line") contain customary covenants, including compliance with financial ratios, such as ratio of indebtedness to total asset value and fixed charge coverage ratio. These covenants may limit our operational flexibility and our investment activities. Moreover, if we breach any of the covenants in our debt agreements, and do not cure the breach within the applicable cure period, our lenders may require us to repay the debt immediately, even in the absence of a payment default. Many of our debt arrangements, including our unsecured notes and the Line, are cross-defaulted, which means that the lenders under those debt arrangements can require immediate repayment of their debt if we breach and fail to cure a default under certain of our other material debt obligations. As a result, any default under our debt covenants may have an adverse effect on our financial condition, our results of operations, our ability to meet our obligations, and the market value of our stock.
Increases in interest rates would cause our borrowing costs to rise and negatively impact our results of operations.
Although a significant amount of our outstanding debt has fixed interest rates, we do borrow funds at variable interest rates under our credit facility, and certain secured borrowings. As of December 31, 2023, less than 1.0% of our outstanding debt was variable rate debt not hedged to fixed rate debt. Increases in interest rates would increase our interest expense on any variable rate debt to the extent we have not hedged our exposure to changes in interest rates. In addition, increases in interest rates will affect the terms under which we refinance our existing debt as it matures, to the extent we have not hedged our exposure to changes in interest rates. This would reduce our future earnings and cash flows, which may adversely affect our ability to service our debt and meet our other obligations and also may reduce the amount we are able to distribute to our stock and unit holders.
Hedging activity may expose us to risks, including the risks that a counterparty will not perform and that the hedge will not yield the economic benefits we anticipate, which may adversely affect us.
We manage our exposure to interest rate volatility by using interest rate hedging arrangements. These arrangements involve risk, such as the risk that counterparties may fail to honor their obligations under these arrangements, and that these arrangements may not be effective in reducing our exposure to interest rate changes. There can be no assurance that our hedging arrangements will qualify for hedge accounting or that our hedging activities will have the desired beneficial impact on our results of operations. Should we desire to terminate a hedging arrangement, there may be significant costs and cash requirements involved to fulfill our obligations under the hedging arrangement. In addition, failure to effectively hedge against interest rate changes may adversely affect our results of operations.
Risk Factors Related to Information Management and Technology
The unauthorized access, use, theft or destruction of tenant or employee personal, financial or other data, or of Regency's proprietary or confidential information stored in our information systems or by third parties on our behalf could impact our reputation and brand and expose us to potential liabilities and adverse financial impact.
Many of our information technology systems (including the systems of our real estate partners and other third-party business partners and service providers, whether cloud-based or hosted in our servers) contain personal, financial or other information that is entrusted to us by our tenants and employees. Many of our information technology systems contain our proprietary information and other confidential information related to our business.
We are subject to attempts to compromise our information technology systems. To the extent we or a third party were to experience a material breach of our information technology systems that results in the unauthorized access, theft, use, destruction or other compromises of tenants' or employees' data or our confidential information stored in such systems, including through cyber-attacks such as ransomware, denial of service or other methods, such a breach may damage our reputation and cause us to lose tenants and employees, result in adverse financial impact, incur third party claims and cause disruption to our business and plans. Despite planning, preparation, and preventative measures, such attacks may be successful in the future and our business may be significantly
18
disrupted if unable to quickly recover. Such security breaches also could result in a violation of applicable U.S. privacy and other laws, and potentially subject us to litigation and governmental investigations and proceedings, any of which could result in our exposure to material civil or criminal liability, and we may not be able to recover these expenses from our service providers, responsible parties, or insurance carriers. Despite the ongoing significant investments in technology and training we make relating to cybersecurity, we can provide no assurance that we will avoid or prevent such breaches or attacks.
In addition, despite the implementation of security measures for our disaster recovery and business continuity plans, our information systems may be vulnerable to damage or other adverse impact from multiple sources other than cybersecurity risks, including computer viruses, energy blackouts, natural disasters, terrorism, war, and telecommunication failure. Any system failure or accident that causes disruption or interruptions to our information systems could result in a material disruption to our operations and business, and cause us to incur material costs to remedy such damages or adverse impacts.
The use of technology based on artificial intelligence presents risks relating to confidentiality, creation of inaccurate and flawed outputs and emerging regulatory risk, any or all of which may adversely affect our business and results of operations.
As with many technological innovations, artificial intelligence (“AI") presents great promise but also risks and challenges that could adversely affect our business. Sensitive, proprietary, or confidential information of the Company, our tenants and employees, could be leaked, disclosed, or revealed as a result of or in connection with the use of generative AI technologies by our employees or vendors. Any such information input into a third-party generative AI or machine learning platform could be revealed to others, including if information is used to train the third party's generative AI or machine learning models. Additionally, where a generative AI or machine learning model ingests personal information and makes connections using such data, those technologies may reveal other sensitive, proprietary, or confidential information generated by the model. Moreover, generative AI or machine learning models may create incomplete, inaccurate, or otherwise flawed outputs, some of which may appear correct. Due to these issues, these models could lead us to make flawed decisions that could result in adverse consequences to us, including exposure to reputational and competitive harm, customer loss, and legal liability. In addition, uncertainty in the legal regulatory regime relating to AI may require significant resources to modify and maintain business practices to comply with applicable law, the nature of which cannot be determined at this time. Several jurisdictions have already proposed or enacted laws governing AI. For example, on October 30, 2023, the Biden administration issued an Executive Order to, among other things, establish extensive new standards for AI safety and security. Other jurisdictions may decide to adopt similar or more restrictive legislation that may render the use of such technologies challenging. These obligations may prevent or limit our ability to use AI in our business, lead to regulatory fines or penalties, or require us to change our business practices. If we cannot use AI, or that use is restricted, our business may be less efficient, or we may be at a competitive disadvantage. Any of these factors could adversely affect our business, financial condition, and results of operations.
Risk Factors Related to the Market Price for Our Securities
Changes in economic and market conditions may adversely affect the market price of our securities.
The market price of our debt and equity securities may fluctuate significantly in response to many factors, many of which are out of our control, including:
19
These factors may cause the market price of our securities to decline, regardless of our financial condition, results of operations, business or prospects. It is impossible to ensure that the market price of our securities, including our common stock, will not fall in the future. A decrease in the market price of our common stock may reduce our ability to raise additional equity capital in the public markets. Selling common stock at a decreased market price would have a dilutive impact on existing stockholders.
There is no assurance that we will continue to pay dividends at current or historical rates.
Our ability to continue to pay dividends at current or historical rates or to increase our dividend rate will depend on a number of factors, including, among others, the following:
If we do not maintain or periodically increase the dividend on our common stock, it may have an adverse effect on the market price of our common stock and other securities.
Risk Factors Related to Taxes and the Parent the Company's Qualification as a REIT
If the Parent Company fails to qualify as a REIT for federal income tax purposes, it would be subject to federal income tax at regular corporate rates.
We believe that the Parent Company qualifies for taxation as a REIT for federal income tax purposes, and we plan to operate so that the Parent Company can continue to meet the requirements for taxation as a REIT. If the Parent Company continues to qualify as a REIT, it generally will not be subject to federal income tax on income that we distribute to our stockholders. Many REIT requirements, however, are highly technical and complex. The determination that the Parent Company is a REIT requires an analysis of various factual matters and circumstances, some of which may not be totally within our control and some of which involve questions of interpretation. For example, to qualify as a REIT, at least 95% of our gross income must come from specific passive sources, like rent, that are itemized in the REIT tax laws. There can be no assurance that the Internal Revenue Service ("IRS") or a court would agree with the positions we have taken in interpreting the REIT requirements. The Parent Company is also required to distribute to the stockholders at least 90% of its REIT taxable income, excluding net capital gains. The Parent Company will be subject to U.S. federal income tax on undistributed taxable income and net capital gains and to a 4% nondeductible excise tax on any amount by which distributions the Parent Company pays with respect to any calendar year are less than the sum of 85% of our ordinary income, 95% of our capital gain net income and 100% of our undistributed income from prior years. The fact that we hold many of our assets through real estate partnerships and their subsidiaries further complicates the application of the REIT requirements. Furthermore, Congress and the IRS might make changes to the tax laws and regulations, and the courts might issue new rulings, that make it more difficult for the Parent Company to remain qualified as a REIT.
Also, unless the IRS granted relief under certain statutory provisions, the Parent Company would remain disqualified as a REIT for four years following the year it first failed to qualify. If the Parent Company failed to qualify as a REIT (currently and/or with respect to any tax years for which the statute of limitations has not expired), the Parent Company would have to pay significant income taxes, reducing cash available to pay dividends, which would likely have a significant adverse effect on the value of our securities. In addition, we would no longer be required to pay any dividends to stockholders in order to maintain our REIT status. Although we believe that the Parent Company qualifies as a REIT, we cannot be assured that the Parent Company will continue to qualify or remain qualified as a REIT for tax purposes.
Even if the Parent Company qualifies as a REIT for federal income tax purposes, the Parent Company is required to pay certain federal, state, and local taxes on its income and property. For example, if we have net income from "prohibited transactions," that income will be subject to a 100% tax. In general, prohibited transactions include sales or other dispositions of property held primarily for sale to customers in the ordinary course of business. The determination as to whether a particular sale is a prohibited transaction depends on the facts and circumstances related to that sale. While we have undertaken a significant number of asset sales in recent years, we do not believe that those sales should be considered prohibited transactions, but there can be no assurance that the IRS would not contend otherwise.
New legislation, as well as new regulations, administrative interpretations, or court decisions may be introduced, enacted, or promulgated from time to time, that may change the tax laws or interpretations of the tax laws regarding qualification as a REIT, or the federal income tax consequences of that qualification, in a manner that is adverse to our stockholders.
Dividends paid by REITs generally do not qualify for reduced tax rates.
Subject to limited exceptions, dividends paid by REITs (other than distributions designated as capital gain dividends, qualified dividends or returns of capital) are not eligible for reduced rates for qualified dividends paid by "C" corporations and are taxable at ordinary income tax rates. Under the Tax Cuts and Jobs Act of 2017 (the "TCJA"), however, domestic shareholders that are individuals, trusts, and estates generally may deduct up to 20% of the ordinary dividends (e.g., dividends not designated as capital gain dividends or qualified dividend income) received from a REIT for taxable years beginning after December 3, 2017, and before
20
January 1, 2026. Although these rules do not adversely affect the taxation of REITs or dividends payable by REITs, investors who are individuals, trusts and estates may perceive investments in REITs to be relatively less attractive than investments in the stocks of non-REIT corporations that pay dividends, which may adversely affect the value of the shares of REITs, including the per share trading price of the Parent Company's capital stock.
Certain foreign stockholders may be subject to U.S. federal income tax on gain recognized on a disposition of our common stock if we do not qualify as a "domestically controlled" REIT.
A foreign person, other than a "qualified shareholder" or a "qualified foreign pension fund," as each is defined for purposes of the Code, disposing of a U.S. real property interest, including shares of a U.S. corporation whose assets consist principally of U.S. real property interests is generally subject to U.S. federal income tax on the gain recognized on the disposition. This tax does not apply, however, to the disposition of stock in a REIT if the REIT is "domestically controlled." In general, the Parent Company will be a domestically controlled REIT if, at all times during the five-year period ending on the applicable stockholder’s disposition of our stock, less than 50% in value of our stock was held directly or indirectly by non-U.S. persons. If the Parent Company were to fail to qualify as a domestically controlled REIT, gain recognized by a foreign stockholder on a disposition of our common stock would be subject to U.S. federal income tax unless our common stock was traded on an established securities market and the foreign stockholder did not at any time during a specified testing period directly or indirectly own more than 10% of our outstanding common stock.
We seek to act in the best interests of the Parent Company as a whole and do not take into consideration the particular tax consequences to any specific holder of our stock. Foreign persons should inform themselves as to the U.S. tax consequences, and the tax consequences within the countries of their citizenship, residence, domicile, and place of business, with respect to the purchase, ownership, and disposition of shares of our common stock.
Legislative or other actions affecting REITs may have a negative effect on us or our investors.
The rules dealing with federal income taxation are constantly under review by persons involved in the legislative process and by the IRS and the U.S. Department of the Treasury. Changes to the tax laws, with or without retroactive application, may adversely affect the Parent Company or our investors. We cannot predict how changes in the tax laws might affect the Parent Company or our investors. New legislation, Treasury Regulations, administrative interpretations or court decisions may significantly and negatively affect our ability to qualify as a REIT or the federal income tax consequences of such qualification, or the federal income tax consequences of an investment in us. There is also a risk that REIT status may be adversely impacted by a change in tax or other laws. Also, the law relating to the tax treatment of other entities, or an investment in other entities, may change, making an investment in such other entities more attractive relative to an investment in a REIT.
Complying with REIT requirements may limit our ability to hedge effectively and may cause us to incur tax liabilities.
The REIT provisions of the Code limit our ability to hedge our liabilities. Generally, income from a hedging transaction does not constitute "gross income" for purposes of the 75% or 95% gross income tests, provided that we properly identify the hedging transaction pursuant to the applicable sections of the Code and Treasury Regulations. To the extent that we enter into other types of hedging transactions, or fail to make the proper tax identifications, the income from those transactions is likely to be treated as non-qualifying income for purposes of both gross income tests. As a result of these rules, we may need to limit our use of otherwise advantageous hedging techniques or implement those hedges through a TRS.
Partnership tax audit rules could have a material adverse effect.
Under current federal partnership tax audit rules, subject to certain exceptions, any audit adjustment to items of income, gain, loss, deduction, or credit of a partnership (and a partner’s allocable share thereof) is determined, and taxes, interest, and penalties attributable thereto are assessed and collected, at the partnership level. With respect to any partnership in which we invest, unless such partnership makes an election or takes certain steps to require the partners to pay their tax on their allocable shares of the adjustment, it is possible that such partnership would be required to pay additional taxes, interest, and penalties as a result of an audit adjustment. We could be required to bear the economic burden of those taxes, interest, and penalties even though we may not otherwise have been required to pay additional taxes had we owned the assets of the partnership directly.
Risk Factors Related to the Company's Common Stock
Restrictions on the ownership of the Parent Company's capital stock to preserve its REIT status may delay or prevent a change in control.
Ownership of more than 7% by value of our outstanding capital stock is prohibited, with certain exceptions, by the Parent Company's articles of incorporation, for the purpose of maintaining its qualification as a REIT. This 7% limitation may discourage a change in control and may also (i) deter tender offers for our capital stock, which offers may be attractive to our stockholders, or (ii) limit the opportunity for our stockholders to receive a premium for their capital stock that might otherwise exist if an investor attempted to assemble a block in excess of 7% of our outstanding capital stock or to affect a change in control.
21
The issuance of the Parent Company's capital stock may delay or prevent a change in control.
The Parent Company's articles of incorporation authorize our Board of Directors to issue up to 30,000,000 shares of preferred stock (less the shares of preferred stock already issued and outstanding) and 10,000,000 shares of special common stock and to establish the preferences and rights of any shares issued. The issuance of preferred stock or special common stock may have the effect of delaying or preventing a change in control. The provisions of the Florida Business Corporation Act regarding affiliated transactions may also deter potential acquisitions by preventing the acquiring party from consummating a merger or other extraordinary corporate transaction without the approval of our disinterested stockholders.
Ownership in the Parent Company may be diluted in the future.
In the future, a stockholder's percentage ownership in the Company may be diluted because of equity issuances for acquisitions, capital market transactions or other corporate purposes, including equity awards we will grant to our directors, officers and employees. In the past we have issued equity in the secondary market and may do so again in the future, depending on the price of our stock and other factors.
In addition, our restated articles of incorporation, as amended, authorizes our Board of Directors to issue, without the approval of our stockholders, one or more classes or series of preferred stock having such preferences, limitations, and relative rights, including preferences over our common stock respecting dividends and distributions, as our Board of Directors generally may determine. The terms of one or more classes or series of preferred stock could dilute the voting power or reduce the value of our common stock. For example, we could grant the holders of preferred stock the right to elect some number of our directors in all events or on the happening of specified events or the right to veto specified transactions. Similarly, the repurchase or redemption rights or liquidation preferences we could assign to holders of preferred stock could affect the residual value of the common stock.
Item 1B. Unresolve d Staff Comments
None.
Item 1C. Cybersecurity
Cybersecurity Risk Management and Strategy
The Company employs a tiered structure of management and oversight for cybersecurity, characterized by distinct layers of responsibility and decision making, which includes operation staff, management, and senior management and board-level governance. As discussed in more detail below under “Cybersecurity Governance”, this involves management responsibility through a specialized Cyber Risk Committee (the “CRC”) and oversight of that committee by a group of the most senior leaders of the Company, which comprise the Company’s Executive Committee. At the Company’s Board of Directors (the “Board”) level, the Audit Committee oversees our cybersecurity risk management program.
Our strategy for managing cybersecurity risk is integrated into the Company’s overall risk management program and structure, as depicted in the Corporate Governance section of our Proxy under “Risk Oversight”.
The Company, through its Chief Information Security Officer (“CISO”), other Company employees experienced in information network security, and the use of third-party expertise, references various recognized cybersecurity frameworks. These frameworks are used to benchmark and tailor the Company’s cybersecurity strategies and program to our risk profile and specific operational needs and goals. Our core cybersecurity strategy focuses on five key pillars: identification, protection, detection, response, and recovery, each tailored to meet the specific challenges and needs of our business. The primary goal of this strategy is to proactively safeguard the confidentiality, security, and availability of the information we collect and store. This proactive approach includes identifying, preventing, and mitigating cybersecurity threats, as well as preparing to respond to cybersecurity incidents quickly and efficiently to minimize their impact. Under the leadership of our CISO and CRC, we are committed to a continuous evaluation and enhancement of our cybersecurity practices to facilitate adaptation to the constantly evolving landscape of cybersecurity threats.
We have adopted a risk-based strategy to manage cybersecurity risks associated with third parties. We prioritize our cybersecurity efforts relating to third parties based on the likelihood and potential impact of cybersecurity threats. This includes reviewing the security protocols of key vendors, service providers, and external users of our systems.
The CRC engages third-party expertise from time to time as it deems necessary or appropriate to test our cybersecurity defenses, to evaluate the cybersecurity programs of current and potential vendors and service providers, and to seek specialized legal advice regarding cybersecurity.
Since at least January 1, 2021, we are not aware of any cybersecurity incidents that have materially affected the Company. Based on our current understanding of the cyber risk environment and our preparedness level, we do not believe it to be reasonably likely in the near term that a cybersecurity threat will materially impact our business strategy, results of operations or financial condition.
22
Cybersecurity Governance
The Audit Committee of the Board is charged with overseeing our cybersecurity risk management program. The CRC Chair and the CISO provide the Audit Committee with quarterly updates. These updates cover the overall status of the Company’s cybersecurity program, as well as developments and potential new risks and trends. In the event of a significant cybersecurity threat or incident, the CRC would escalate communication frequency and intensity with the Audit Committee, Board, and the Company’s Executive Committee (discussed below).
As designated by the Company’s Executive Committee and the Audit Committee, our CRC leads Regency's cybersecurity risk management program. This includes risk identification, assessment, management, prevention and mitigation, as well as securing necessary resources and reporting on cybersecurity preparedness to the Executive Committee (which is currently comprised of the CEO, CFO, and several of the Company’s other senior leaders) and the Audit Committee.
CRC membership, which is subject to change from time to time, includes management leadership possessing a diverse range of education, experience and expertise, and is currently comprised of Company’s CISO, chief accounting officer, head of internal audit, general counsel and chief compliance officer, head of litigation, head of human resources, head of IT operations and the manager of network security. The collective experience of this committee encompasses areas such as IT, network security, change and incident management, public company governance, accounting, financial controls, insurance, risk management, communications, human capital, and legal matters including securities, privacy and technology contracting.
23
Item 2. P roperties
The following table is a list of our shopping centers, summarized by state and in order of largest holdings by number of properties, presented for consolidated properties (excludes properties owned by unconsolidated real estate partnerships):
|
|
|
December 31, 2023 |
|
|
December 31, 2022 |
|
||||||||||||||||||||||||||
|
Location |
|
Number of
|
|
|
GLA (in
|
|
|
Percent of
|
|
|
Percent
|
|
|
Number of
|
|
|
GLA (in
|
|
|
Percent of
|
|
|
Percent
|
|
||||||||
|
Florida |
|
|
88 |
|
|
|
10,767 |
|
|
|
24.6 |
% |
|
|
95.1 |
% |
|
|
88 |
|
|
|
10,783 |
|
|
|
27.8 |
% |
|
|
95.1 |
% |
|
California |
|
|
54 |
|
|
|
8,300 |
|
|
|
19.0 |
% |
|
|
94.9 |
% |
|
|
53 |
|
|
|
8,204 |
|
|
|
21.1 |
% |
|
|
93.9 |
% |
|
Connecticut |
|
|
43 |
|
|
|
3,702 |
|
|
|
8.5 |
% |
|
|
92.5 |
% |
|
|
14 |
|
|
|
1,452 |
|
|
|
3.7 |
% |
|
|
91.1 |
% |
|
New York |
|
|
42 |
|
|
|
3,399 |
|
|
|
7.8 |
% |
|
|
88.7 |
% |
|
|
16 |
|
|
|
1,953 |
|
|
|
5.0 |
% |
|
|
89.0 |
% |
|
Texas |
|
|
26 |
|
|
|
3,288 |
|
|
|
7.5 |
% |
|
|
97.3 |
% |
|
|
25 |
|
|
|
3,239 |
|
|
|
8.3 |
% |
|
|
98.0 |
% |
|
Georgia |
|
|
22 |
|
|
|
2,121 |
|
|
|
4.8 |
% |
|
|
94.2 |
% |
|
|
22 |
|
|
|
2,120 |
|
|
|
5.5 |
% |
|
|
92.9 |
% |
|
New Jersey |
|
|
17 |
|
|
|
1,585 |
|
|
|
3.6 |
% |
|
|
93.3 |
% |
|
|
2 |
|
|
|
573 |
|
|
|
1.5 |
% |
|
|
89.2 |
% |
|
Colorado |
|
|
13 |
|
|
|
1,097 |
|
|
|
2.5 |
% |
|
|
97.7 |
% |
|
|
13 |
|
|
|
1,097 |
|
|
|
2.8 |
% |
|
|
96.6 |
% |
|
North Carolina |
|
|
10 |
|
|
|
1,221 |
|
|
|
2.8 |
% |
|
|
98.1 |
% |
|
|
10 |
|
|
|
1,222 |
|
|
|
3.2 |
% |
|
|
98.2 |
% |
|
Washington |
|
|
10 |
|
|
|
962 |
|
|
|
2.2 |
% |
|
|
96.0 |
% |
|
|
10 |
|
|
|
963 |
|
|
|
2.5 |
% |
|
|
97.3 |
% |
|
Massachusetts |
|
|
9 |
|
|
|
996 |
|
|
|
2.3 |
% |
|
|
98.5 |
% |
|
|
8 |
|
|
|
897 |
|
|
|
2.3 |
% |
|
|
97.6 |
% |
|
Ohio |
|
|
8 |
|
|
|
1,221 |
|
|
|
2.8 |
% |
|
|
98.8 |
% |
|
|
8 |
|
|
|
1,224 |
|
|
|
3.2 |
% |
|
|
96.7 |
% |
|
Oregon |
|
|
7 |
|
|
|
741 |
|
|
|
1.7 |
% |
|
|
95.0 |
% |
|
|
7 |
|
|
|
742 |
|
|
|
1.9 |
% |
|
|
94.6 |
% |
|
Illinois |
|
|
6 |
|
|
|
1,085 |
|
|
|
2.5 |
% |
|
|
94.1 |
% |
|
|
6 |
|
|
|
1,085 |
|
|
|
2.8 |
% |
|
|
94.9 |
% |
|
Virginia |
|
|
6 |
|
|
|
939 |
|
|
|
2.1 |
% |
|
|
97.7 |
% |
|
|
6 |
|
|
|
939 |
|
|
|
2.4 |
% |
|
|
93.4 |
% |
|
Pennsylvania |
|
|
4 |
|
|
|
443 |
|
|
|
1.0 |
% |
|
|
99.5 |
% |
|
|
4 |
|
|
|
443 |
|
|
|
1.1 |
% |
|
|
98.7 |
% |
|
Missouri |
|
|
4 |
|
|
|
408 |
|
|
|
0.9 |
% |
|
|
98.9 |
% |
|
|
4 |
|
|
|
408 |
|
|
|
1.1 |
% |
|
|
99.5 |
% |
|
Tennessee |
|
|
3 |
|
|
|
314 |
|
|
|
0.7 |
% |
|
|
99.5 |
% |
|
|
3 |
|
|
|
314 |
|
|
|
0.8 |
% |
|
|
99.1 |
% |
|
Maryland |
|
|
2 |
|
|
|
244 |
|
|
|
0.6 |
% |
|
|
89.9 |
% |
|
|
2 |
|
|
|
250 |
|
|
|
0.6 |
% |
|
|
94.4 |
% |
|
Minnesota |
|
|
2 |
|
|
|
246 |
|
|
|
0.6 |
% |
|
|
100.0 |
% |
|
|
2 |
|
|
|
246 |
|
|
|
0.6 |
% |
|
|
100.0 |
% |
|
Indiana |
|
|
1 |
|
|
|
279 |
|
|
|
0.6 |
% |
|
|
100.0 |
% |
|
|
1 |
|
|
|
279 |
|
|
|
0.7 |
% |
|
|
100.0 |
% |
|
Delaware |
|
|
1 |
|
|
|
229 |
|
|
|
0.5 |
% |
|
|
96.2 |
% |
|
|
1 |
|
|
|
230 |
|
|
|
0.6 |
% |
|
|
94.5 |
% |
|
Michigan |
|
|
1 |
|
|
|
97 |
|
|
|
0.2 |
% |
|
|
74.0 |
% |
|
|
1 |
|
|
|
97 |
|
|
|
0.3 |
% |
|
|
74.0 |
% |
|
South Carolina |
|
|
1 |
|
|
|
51 |
|
|
|
0.1 |
% |
|
|
100.0 |
% |
|
|
1 |
|
|
|
51 |
|
|
|
0.1 |
% |
|
|
100.0 |
% |
|
District of Columbia |
|
|
1 |
|
|
|
23 |
|
|
|
0.1 |
% |
|
|
100.0 |
% |
|
|
1 |
|
|
|
23 |
|
|
|
0.1 |
% |
|
|
85.8 |
% |
|
Total |
|
|
381 |
|
|
|
43,758 |
|
|
|
100.0 |
% |
|
|
94.9 |
% |
|
|
308 |
|
|
|
38,834 |
|
|
|
100.0 |
% |
|
|
94.8 |
% |
The weighted average annual effective rent for the consolidated portfolio of properties, net of tenant concessions, is $24.67 and $23.95 per square foot ("PSF") as of December 31, 2023 and 2022, respectively.
24
The following table is a list of our shopping centers, summarized by state and in order of largest holdings by number of properties, presented for unconsolidated properties (properties owned by our unconsolidated real estate partnerships):
|
|
|
December 31, 2023 |
|
|
December 31, 2022 |
|
||||||||||||||||||||||||||
|
Location |
|
Number of
|
|
|
GLA (in
|
|
|
Percent of
|
|
|
Percent
|
|
|
Number of
|
|
|
GLA (in
|
|
|
Percent of
|
|
|
Percent
|
|
||||||||
|
California |
|
|
17 |
|
|
|
2,320 |
|
|
|
17.8 |
% |
|
|
98.4 |
% |
|
|
17 |
|
|
|
2,320 |
|
|
|
18.9 |
% |
|
|
97.4 |
% |
|
Virginia |
|
|
14 |
|
|
|
1,982 |
|
|
|
15.2 |
% |
|
|
92.7 |
% |
|
|
15 |
|
|
|
2,082 |
|
|
|
16.9 |
% |
|
|
93.9 |
% |
|
Maryland |
|
|
9 |
|
|
|
848 |
|
|
|
6.5 |
% |
|
|
96.0 |
% |
|
|
9 |
|
|
|
849 |
|
|
|
6.9 |
% |
|
|
96.3 |
% |
|
North Carolina |
|
|
7 |
|
|
|
1,237 |
|
|
|
9.5 |
% |
|
|
97.9 |
% |
|
|
7 |
|
|
|
1,197 |
|
|
|
9.7 |
% |
|
|
95.5 |
% |
|
Washington |
|
|
7 |
|
|
|
874 |
|
|
|
6.7 |
% |
|
|
98.0 |
% |
|
|
7 |
|
|
|
874 |
|
|
|
7.1 |
% |
|
|
97.4 |
% |
|
Colorado |
|
|
6 |
|
|
|
858 |
|
|
|
6.6 |
% |
|
|
95.5 |
% |
|
|
6 |
|
|
|
858 |
|
|
|
7.0 |
% |
|
|
93.3 |
% |
|
Florida |
|
|
6 |
|
|
|
669 |
|
|
|
5.1 |
% |
|
|
99.0 |
% |
|
|
6 |
|
|
|
663 |
|
|
|
5.4 |
% |
|
|
99.4 |
% |
|
Pennsylvania |
|
|
6 |
|
|
|
669 |
|
|
|
5.1 |
% |
|
|
96.0 |
% |
|
|
6 |
|
|
|
669 |
|
|
|
5.4 |
% |
|
|
84.5 |
% |
|
New York |
|
|
5 |
|
|
|
786 |
|
|
|
6.0 |
% |
|
|
98.0 |
% |
|
|
1 |
|
|
|
141 |
|
|
|
1.2 |
% |
|
|
100.0 |
% |
|
Illinois |
|
|
5 |
|
|
|
777 |
|
|
|
5.9 |
% |
|
|
98.6 |
% |
|
|
4 |
|
|
|
690 |
|
|
|
5.6 |
% |
|
|
91.9 |
% |
|
Texas |
|
|
5 |
|
|
|
741 |
|
|
|
5.7 |
% |
|
|
97.1 |
% |
|
|
5 |
|
|
|
742 |
|
|
|
6.0 |
% |
|
|
94.4 |
% |
|
New Jersey |
|
|
4 |
|
|
|
301 |
|
|
|
2.3 |
% |
|
|
85.4 |
% |
|
|
3 |
|
|
|
224 |
|
|
|
1.8 |
% |
|
|
81.8 |
% |
|
Minnesota |
|
|
3 |
|
|
|
423 |
|
|
|
3.2 |
% |
|
|
98.7 |
% |
|
|
3 |
|
|
|
423 |
|
|
|
3.4 |
% |
|
|
98.3 |
% |
|
Indiana |
|
|
2 |
|
|
|
139 |
|
|
|
1.1 |
% |
|
|
93.0 |
% |
|
|
2 |
|
|
|
139 |
|
|
|
1.1 |
% |
|
|
82.9 |
% |
|
Connecticut |
|
|
1 |
|
|
|
189 |
|
|
|
1.4 |
% |
|
|
98.1 |
% |
|
|
1 |
|
|
|
186 |
|
|
|
1.5 |
% |
|
|
98.1 |
% |
|
Oregon |
|
|
1 |
|
|
|
93 |
|
|
|
0.7 |
% |
|
|
100.0 |
% |
|
|
1 |
|
|
|
93 |
|
|
|
0.8 |
% |
|
|
97.7 |
% |
|
South Carolina |
|
|
1 |
|
|
|
80 |
|
|
|
0.6 |
% |
|
|
100.0 |
% |
|
|
1 |
|
|
|
80 |
|
|
|
0.7 |
% |
|
|
96.7 |
% |
|
Delaware |
|
|
1 |
|
|
|
64 |
|
|
|
0.5 |
% |
|
|
94.6 |
% |
|
|
1 |
|
|
|
64 |
|
|
|
0.5 |
% |
|
|
100.0 |
% |
|
District of Columbia |
|
|
1 |
|
|
|
17 |
|
|
|
0.1 |
% |
|
|
100.0 |
% |
|
|
1 |
|
|
|
17 |
|
|
|
0.1 |
% |
|
|
100.0 |
% |
|
Total |
|
|
101 |
|
|
|
13,067 |
|
|
|
100.0 |
% |
|
|
96.6 |
% |
|
|
96 |
|
|
|
12,311 |
|
|
|
100.0 |
% |
|
|
94.8 |
% |
The weighted average annual effective rent for the unconsolidated portfolio of properties, net of tenant concessions, is $24.04 and $23.15 PSF as of December 31, 2023 and 2022, respectively.
25
The following table summarizes our top tenants occupying our shopping centers for consolidated properties plus our Pro-rata share of unconsolidated properties, as of December 31, 2023, based upon a percentage of total annualized base rent (GLA and dollars in thousands):
|
Tenant |
|
GLA |
|
|
Percent of
|
|
|
Annualized
|
|
|
Percent of
|
|
|
Number of
|
|
|||||
|
Publix |
|
|
2,955 |
|
|
|
6.4 |
% |
|
$ |
33,949 |
|
|
|
3.0 |
% |
|
|
68 |
|
|
Albertsons Companies, Inc. |
|
|
2,192 |
|
|
|
4.8 |
% |
|
|
33,559 |
|
|
|
3.0 |
% |
|
|
53 |
|
|
Kroger Co. |
|
|
2,933 |
|
|
|
6.4 |
% |
|
|
30,228 |
|
|
|
2.7 |
% |
|
|
52 |
|
|
Amazon/Whole Foods |
|
|
1,255 |
|
|
|
2.7 |
% |
|
|
29,809 |
|
|
|
2.6 |
% |
|
|
38 |
|
|
TJX Companies, Inc. |
|
|
1,659 |
|
|
|
3.6 |
% |
|
|
29,715 |
|
|
|
2.6 |
% |
|
|
70 |
|
|
Ahold Delhaize |
|
|
906 |
|
|
|
2.0 |
% |
|
|
22,583 |
|
|
|
2.0 |
% |
|
|
20 |
|
|
CVS |
|
|
782 |
|
|
|
1.7 |
% |
|
|
20,628 |
|
|
|
1.8 |
% |
|
|
66 |
|
|
L.A. Fitness Sports Club |
|
|
516 |
|
|
|
1.1 |
% |
|
|
11,137 |
|
|
|
1.0 |
% |
|
|
14 |
|
|
Trader Joe's |
|
|
311 |
|
|
|
0.7 |
% |
|
|
11,023 |
|
|
|
1.0 |
% |
|
|
30 |
|
|
JPMorgan Chase Bank |
|
|
176 |
|
|
|
0.4 |
% |
|
|
10,667 |
|
|
|
0.9 |
% |
|
|
56 |
|
|
Ross Dress For Less |
|
|
534 |
|
|
|
1.2 |
% |
|
|
9,259 |
|
|
|
0.8 |
% |
|
|
24 |
|
|
Gap, Inc |
|
|
279 |
|
|
|
0.6 |
% |
|
|
8,933 |
|
|
|
0.8 |
% |
|
|
24 |
|
|
Bank of America |
|
|
154 |
|
|
|
0.3 |
% |
|
|
8,657 |
|
|
|
0.8 |
% |
|
|
44 |
|
|
Starbucks |
|
|
147 |
|
|
|
0.3 |
% |
|
|
8,617 |
|
|
|
0.8 |
% |
|
|
94 |
|
|
Nordstrom |
|
|
308 |
|
|
|
0.7 |
% |
|
|
8,573 |
|
|
|
0.8 |
% |
|
|
9 |
|
|
Wells Fargo Bank |
|
|
135 |
|
|
|
0.3 |
% |
|
|
7,800 |
|
|
|
0.7 |
% |
|
|
47 |
|
|
Petco Health and Wellness Company |
|
|
312 |
|
|
|
0.7 |
% |
|
|
7,534 |
|
|
|
0.7 |
% |
|
|
31 |
|
|
H.E. Butt Grocery Company |
|
|
482 |
|
|
|
1.0 |
% |
|
|
7,376 |
|
|
|
0.7 |
% |
|
|
6 |
|
|
Walgreens Boots Alliance |
|
|
266 |
|
|
|
0.6 |
% |
|
|
6,858 |
|
|
|
0.6 |
% |
|
|
24 |
|
|
JAB Holding Company |
|
|
164 |
|
|
|
0.4 |
% |
|
|
6,826 |
|
|
|
0.6 |
% |
|
|
59 |
|
|
Target |
|
|
654 |
|
|
|
1.4 |
% |
|
|
6,790 |
|
|
|
0.6 |
% |
|
|
6 |
|
|
Kohl's |
|
|
526 |
|
|
|
1.1 |
% |
|
|
6,247 |
|
|
|
0.6 |
% |
|
|
7 |
|
|
Xponential Fitness |
|
|
137 |
|
|
|
0.3 |
% |
|
|
5,402 |
|
|
|
0.5 |
% |
|
|
81 |
|
|
Walmart |
|
|
819 |
|
|
|
1.8 |
% |
|
|
5,362 |
|
|
|
0.5 |
% |
|
|
8 |
|
|
Ulta |
|
|
184 |
|
|
|
0.4 |
% |
|
|
5,288 |
|
|
|
0.5 |
% |
|
|
21 |
|
|
Best Buy |
|
|
229 |
|
|
|
0.5 |
% |
|
|
5,277 |
|
|
|
0.5 |
% |
|
|
7 |
|
|
Staples |
|
|
217 |
|
|
|
0.5 |
% |
|
|
5,109 |
|
|
|
0.5 |
% |
|
|
12 |
|
|
Top Tenants |
|
|
19,232 |
|
|
|
41.9 |
% |
|
$ |
353,206 |
|
|
|
31.6 |
% |
|
|
971 |
|
Our leases for tenant space under 10,000 square feet generally have initial terms ranging from three to seven years. Leases greater than 10,000 square feet ("Anchor Leases") generally have initial lease terms in excess of five years and are mostly comprised of Anchor Tenants. Many of the leases contain provisions allowing the tenant the option of extending the term of the lease at expiration. Our leases typically provide for the payment of fixed base rent, the tenant’s Pro-rata share of real estate taxes, insurance, and common area maintenance ("CAM") expenses, and reimbursement for utility costs if not directly metered.
26
The following table summarizes Pro-rata lease expirations for the next ten years and thereafter, for our consolidated and unconsolidated properties, assuming no tenants renew their leases (GLA and dollars of In Place Annual Base Rent Expiring Under Leases in thousands):
|
Lease Expiration Year |
|
Number of Tenants with Expiring Leases |
|
|
Pro-rata Expiring GLA |
|
|
Percent of Total Company GLA |
|
|
In Place Annual Base Rent Expiring Under Leases |
|
|
Percent of In Place Annual Base Rent |
|
|
Pro-rata Expiring Average Annual Base Rent PSF |
|
||||||
|
(1) |
|
|
180 |
|
|
|
312 |
|
|
|
0.7 |
% |
|
$ |
8,044 |
|
|
|
0.7 |
% |
|
$ |
25.76 |
|
|
2024 |
|
|
1,081 |
|
|
|
3,902 |
|
|
|
8.6 |
% |
|
|
92,635 |
|
|
|
8.4 |
% |
|
|
23.74 |
|
|
2025 |
|
|
1,358 |
|
|
|
5,552 |
|
|
|
12.3 |
% |
|
|
136,495 |
|
|
|
12.4 |
% |
|
|
24.58 |
|
|
2026 |
|
|
1,256 |
|
|
|
5,648 |
|
|
|
12.5 |
% |
|
|
137,458 |
|
|
|
12.5 |
% |
|
|
24.34 |
|
|
2027 |
|
|
1,316 |
|
|
|
6,280 |
|
|
|
13.9 |
% |
|
|
155,730 |
|
|
|
14.2 |
% |
|
|
24.80 |
|
|
2028 |
|
|
1,272 |
|
|
|
5,915 |
|
|
|
13.1 |
% |
|
|
154,464 |
|
|
|
14.1 |
% |
|
|
26.11 |
|
|
2029 |
|
|
712 |
|
|
|
4,305 |
|
|
|
9.5 |
% |
|
|
96,481 |
|
|
|
8.8 |
% |
|
|
22.41 |
|
|
2030 |
|
|
394 |
|
|
|
2,250 |
|
|
|
5.0 |
% |
|
|
57,467 |
|
|
|
5.2 |
% |
|
|
25.54 |
|
|
2031 |
|
|
394 |
|
|
|
1,889 |
|
|
|
4.2 |
% |
|
|
50,664 |
|
|
|
4.6 |
% |
|
|
26.83 |
|
|
2032 |
|
|
430 |
|
|
|
1,865 |
|
|
|
4.1 |
% |
|
|
52,983 |
|
|
|
4.8 |
% |
|
|
28.41 |
|
|
2033 |
|
|
542 |
|
|
|
1,947 |
|
|
|
4.3 |
% |
|
|
55,662 |
|
|
|
5.1 |
% |
|
|
28.59 |
|
|
Thereafter |
|
|
389 |
|
|
|
5,330 |
|
|
|
11.8 |
% |
|
|
100,519 |
|
|
|
9.2 |
% |
|
|
18.86 |
|
|
Total |
|
|
9,324 |
|
|
|
45,195 |
|
|
|
100.0 |
% |
|
$ |
1,098,602 |
|
|
|
100.0 |
% |
|
$ |
24.31 |
|
During 2024, we have a total of 1,081 leases expiring, representing 3.9 million square feet of GLA. These expiring leases have an average base rent of $23.74 PSF. The average base rent of new leases signed during 2023 was $29.89 PSF. During periods of economic weakness or when percent leased is low, tenants have more bargaining power, which may result in rental rate declines on new or renewal leases. In periods of recovery and/or when percent leased levels are high, landlords have more bargaining power, which generally results in rental rate growth on new and renewal leases.
Demand for retail space in high quality, community centers located in areas with compelling demographics remains strong, especially among successful business operators and growing innovative business concepts. However, inflationary challenges and the potential for an economic recession could result in pressure on base rent growth for new and renewal leases as businesses seek to manage costs.
27
The following table lists information about our consolidated and unconsolidated properties. For further information, see "Item 7, Management's Discussion and Analysis of Financial Condition and Results of Operations " of this Report.
|
Property Name |
|
CBSA (1) |
|
State |
|
Owner-
|
|
Year
|
|
Year
|
|
Mortgages or
|
|
|
Gross
|
|
|
Percent
|
|
Average
|
|
|
Major Tenant(s) (5) |
|||
|
Amerige Heights Town Center |
|
Los Angeles-Long Beach-Anaheim |
|
CA |
|
|
|
2000 |
|
2000 |
|
$ |
— |
|
|
|
97 |
|
|
98.0% |
|
$ |
32.06 |
|
|
Albertsons, (Target) |
|
Bloom on Third (fka Town and Country Center) |
|
Los Angeles-Long Beach-Anaheim |
|
CA |
|
35% |
|
2018 |
|
1992 |
|
|
107,893 |
|
|
|
73 |
|
|
100.0% |
|
|
57.60 |
|
|
Whole Foods, CVS, Citibank |
|
Brea Marketplace |
|
Los Angeles-Long Beach-Anaheim |
|
CA |
|
40% |
|
2005 |
|
1987 |
|
|
— |
|
|
|
352 |
|
|
100.0% |
|
|
21.19 |
|
|
24 Hour Fitness, Big 5 Sporting Goods, Childtime Childcare, Old Navy, Sprout's, Target, Smart Parke |
|
Circle Center West |
|
Los Angeles-Long Beach-Anaheim |
|
CA |
|
|
|
2017 |
|
1989 |
|
|
— |
|
|
|
63 |
|
|
100.0% |
|
|
39.20 |
|
|
Marshalls |
|
Circle Marina Center |
|
Los Angeles-Long Beach-Anaheim |
|
CA |
|
|
|
2019 |
|
1994 |
|
|
24,000 |
|
|
|
118 |
|
|
84.3% |
|
|
34.58 |
|
|
Sprouts, Big 5 Sporting Goods, Centinela Feed & Pet Supplies |
|
Culver Center |
|
Los Angeles-Long Beach-Anaheim |
|
CA |
|
|
|
2017 |
|
2000 |
|
|
— |
|
|
|
217 |
|
|
94.2% |
|
|
33.32 |
|
|
Ralphs, Best Buy, LA Fitness, Sit N' Sleep |
|
El Camino Shopping Center |
|
Los Angeles-Long Beach-Anaheim |
|
CA |
|
|
|
1999 |
|
2017 |
|
|
— |
|
|
|
136 |
|
|
100.0% |
|
|
43.60 |
|
|
Bristol Farms, CVS |
|
Granada Village |
|
Los Angeles-Long Beach-Anaheim |
|
CA |
|
40% |
|
2005 |
|
2012 |
|
|
50,000 |
|
|
|
226 |
|
|
100.0% |
|
|
27.98 |
|
|
Sprout's Markets, Rite Aid, PETCO, Homegoods, Burlington, TJ Maxx |
|
Hasley Canyon Village |
|
Los Angeles-Long Beach-Anaheim |
|
CA |
|
|
|
2003 |
|
2003 |
|
|
16,000 |
|
|
|
66 |
|
|
100.0% |
|
|
27.10 |
|
|
Ralphs |
|
Heritage Plaza |
|
Los Angeles-Long Beach-Anaheim |
|
CA |
|
|
|
1999 |
|
2012 |
|
|
— |
|
|
|
230 |
|
|
100.0% |
|
|
43.43 |
|
|
Ralphs, CVS, Daiso, Mitsuwa Marketplace, Big 5 Sporting Goods |
|
Laguna Niguel Plaza |
|
Los Angeles-Long Beach-Anaheim |
|
CA |
|
40% |
|
2005 |
|
1985 |
|
|
— |
|
|
|
42 |
|
|
100.0% |
|
|
31.01 |
|
|
CVS,(Albertsons) |
|
Morningside Plaza |
|
Los Angeles-Long Beach-Anaheim |
|
CA |
|
|
|
1999 |
|
1996 |
|
|
— |
|
|
|
91 |
|
|
100.0% |
|
|
25.58 |
|
|
Stater Bros. |
|
Newland Center |
|
Los Angeles-Long Beach-Anaheim |
|
CA |
|
|
|
1999 |
|
2016 |
|
|
— |
|
|
|
152 |
|
|
97.7% |
|
|
29.53 |
|
|
Albertsons |
|
Nohl Plaza (6) |
|
Los Angeles-Long Beach-Anaheim |
|
CA |
|
|
|
2023 |
|
1966 |
|
|
— |
|
|
|
104 |
|
|
92.8% |
|
|
16.36 |
|
|
Vons |
|
Plaza Hermosa |
|
Los Angeles-Long Beach-Anaheim |
|
CA |
|
|
|
1999 |
|
2013 |
|
|
— |
|
|
|
95 |
|
|
100.0% |
|
|
28.96 |
|
|
Von's, CVS |
|
Ralphs Circle Center |
|
Los Angeles-Long Beach-Anaheim |
|
CA |
|
|
|
2017 |
|
1983 |
|
|
— |
|
|
|
60 |
|
|
98.5% |
|
|
20.94 |
|
|
Ralphs |
|
Rona Plaza |
|
Los Angeles-Long Beach-Anaheim |
|
CA |
|
|
|
1999 |
|
1989 |
|
|
— |
|
|
|
52 |
|
|
98.1% |
|
|
22.12 |
|
|
Superior Super Warehouse |
|
Seal Beach |
|
Los Angeles-Long Beach-Anaheim |
|
CA |
|
20% |
|
2002 |
|
1966 |
|
|
— |
|
|
|
97 |
|
|
98.5% |
|
|
27.77 |
|
|
Pavilions, CVS |
|
Talega Village Center |
|
Los Angeles-Long Beach-Anaheim |
|
CA |
|
|
|
2017 |
|
2007 |
|
|
— |
|
|
|
102 |
|
|
92.9% |
|
|
22.25 |
|
|
Ralphs |
|
Tustin Legacy |
|
Los Angeles-Long Beach-Anaheim |
|
CA |
|
|
|
2016 |
|
2017 |
|
|
— |
|
|
|
112 |
|
|
100.0% |
|
|
35.66 |
|
|
Stater Bros, CVS |
|
Twin Oaks Shopping Center |
|
Los Angeles-Long Beach-Anaheim |
|
CA |
|
40% |
|
2005 |
|
2019 |
|
|
19,000 |
|
|
|
98 |
|
|
100.0% |
|
|
26.03 |
|
|
Ralphs, Ace Hardware |
|
Valencia Crossroads |
|
Los Angeles-Long Beach-Anaheim |
|
CA |
|
|
|
2002 |
|
2003 |
|
|
— |
|
|
|
173 |
|
|
100.0% |
|
|
29.08 |
|
|
Whole Foods, Kohl's |
|
Village at La Floresta |
|
Los Angeles-Long Beach-Anaheim |
|
CA |
|
|
|
2014 |
|
2014 |
|
|
— |
|
|
|
87 |
|
|
98.9% |
|
|
37.86 |
|
|
Whole Foods |
|
Von's Circle Center |
|
Los Angeles-Long Beach-Anaheim |
|
CA |
|
|
|
2017 |
|
1972 |
|
|
4,273 |
|
|
|
151 |
|
|
100.0% |
|
|
28.32 |
|
|
Von's, Ross Dress for Less, Planet Fitness |
|
Woodman Van Nuys |
|
Los Angeles-Long Beach-Anaheim |
|
CA |
|
|
|
1999 |
|
1992 |
|
|
— |
|
|
|
108 |
|
|
99.2% |
|
|
17.60 |
|
|
El Super |
|
Silverado Plaza |
|
Napa |
|
CA |
|
40% |
|
2005 |
|
1974 |
|
|
15,600 |
|
|
|
85 |
|
|
95.7% |
|
|
21.65 |
|
|
Nob Hill, CVS |
|
Gelson's Westlake Market Plaza |
|
Oxnard-Thousand Oaks-Ventura |
|
CA |
|
|
|
2002 |
|
2016 |
|
|
— |
|
|
|
85 |
|
|
98.8% |
|
|
32.94 |
|
|
Gelson's Markets, John of Italy Salon & Spa |
|
Oakbrook Plaza |
|
Oxnard-Thousand Oaks-Ventura |
|
CA |
|
|
|
1999 |
|
2017 |
|
|
— |
|
|
|
83 |
|
|
97.4% |
|
|
23.07 |
|
|
Gelson's Markets, (CVS), (Ace Hardware) |
|
Westlake Village Plaza and Center |
|
Oxnard-Thousand Oaks-Ventura |
|
CA |
|
|
|
1999 |
|
2015 |
|
|
— |
|
|
|
201 |
|
|
99.0% |
|
|
42.54 |
|
|
Von's, Sprouts, (CVS) |
|
French Valley Village Center |
|
Rvrside-San Bernardino-Ontario |
|
CA |
|
|
|
2004 |
|
2004 |
|
|
— |
|
|
|
99 |
|
|
100.0% |
|
|
28.28 |
|
|
Stater Bros, CVS |
|
Oakshade Town Center |
|
Sacramento-Roseville-Folsom |
|
CA |
|
|
|
2011 |
|
1998 |
|
|
4,085 |
|
|
|
104 |
|
|
59.5% |
|
|
22.19 |
|
|
Safeway |
|
Prairie City Crossing |
|
Sacramento-Roseville-Folsom |
|
CA |
|
|
|
1999 |
|
1999 |
|
|
— |
|
|
|
90 |
|
|
100.0% |
|
|
22.78 |
|
|
Safeway |
|
Raley's Supermarket |
|
Sacramento-Roseville-Folsom |
|
CA |
|
20% |
|
2007 |
|
1964 |
|
|
— |
|
|
|
63 |
|
|
100.0% |
|
|
14.00 |
|
|
Raley's |
|
The Marketplace |
|
Sacramento-Roseville-Folsom |
|
CA |
|
|
|
2017 |
|
1990 |
|
|
— |
|
|
|
111 |
|
|
100.0% |
|
|
27.60 |
|
|
Safeway, CVS, Petco |
|
4S Commons Town Center |
|
San Diego-Chula Vista-Carlsbad |
|
CA |
|
85% |
|
2004 |
|
2004 |
|
|
79,032 |
|
|
|
252 |
|
|
100.0% |
|
|
34.79 |
|
|
Restoration Hardware Outlet, Ace Hardware, Cost Plus World Market, CVS, Jimbo's…Naturally!, Ralphs, ULTA |
|
Balboa Mesa Shopping Center |
|
San Diego-Chula Vista-Carlsbad |
|
CA |
|
|
|
2012 |
|
2014 |
|
|
— |
|
|
|
207 |
|
|
100.0% |
|
|
29.43 |
|
|
CVS, Kohl's, Von's |
|
El Norte Pkwy Plaza |
|
San Diego-Chula Vista-Carlsbad |
|
CA |
|
|
|
1999 |
|
2013 |
|
|
— |
|
|
|
91 |
|
|
94.4% |
|
|
19.91 |
|
|
Von's, Children's Paradise, ACE Hardware |
|
Friars Mission Center |
|
San Diego-Chula Vista-Carlsbad |
|
CA |
|
|
|
1999 |
|
1989 |
|
|
— |
|
|
|
147 |
|
|
97.7% |
|
|
39.86 |
|
|
Ralphs, CVS |
28
|
Property Name |
|
CBSA (1) |
|
State |
|
Owner-
|
|
Year
|
|
Year
|
|
Mortgages or
|
|
|
Gross
|
|
|
Percent
|
|
Average
|
|
|
Major Tenant(s) (5) |
|||
|
Navajo Shopping Center |
|
San Diego-Chula Vista-Carlsbad |
|
CA |
|
40% |
|
2005 |
|
1964 |
|
|
11,000 |
|
|
|
102 |
|
|
98.7% |
|
|
15.47 |
|
|
Albertsons, Rite Aid, O'Reilly Auto Parts |
|
Point Loma Plaza |
|
San Diego-Chula Vista-Carlsbad |
|
CA |
|
40% |
|
2005 |
|
1987 |
|
|
38,900 |
|
|
|
205 |
|
|
98.6% |
|
|
23.75 |
|
|
Von's, Jo-Ann Fabrics, Marshalls, UFC Gym |
|
Rancho San Diego Village |
|
San Diego-Chula Vista-Carlsbad |
|
CA |
|
40% |
|
2005 |
|
1981 |
|
|
— |
|
|
|
153 |
|
|
93.9% |
|
|
25.15 |
|
|
Smart & Final, 24 Hour Fitness, (Longs Drug) |
|
Scripps Ranch Marketplace |
|
San Diego-Chula Vista-Carlsbad |
|
CA |
|
|
|
2017 |
|
2017 |
|
|
— |
|
|
|
132 |
|
|
100.0% |
|
|
35.29 |
|
|
Vons, CVS |
|
The Hub Hillcrest Market |
|
San Diego-Chula Vista-Carlsbad |
|
CA |
|
|
|
2012 |
|
2015 |
|
|
— |
|
|
|
149 |
|
|
96.9% |
|
|
43.33 |
|
|
Ralphs, Trader Joe's |
|
Twin Peaks |
|
San Diego-Chula Vista-Carlsbad |
|
CA |
|
|
|
1999 |
|
1988 |
|
|
— |
|
|
|
208 |
|
|
99.4% |
|
|
24.18 |
|
|
Target, Grocer |
|
200 Potrero |
|
San Francisco-Oakland-Berkeley |
|
CA |
|
|
|
2017 |
|
1928 |
|
|
— |
|
|
|
31 |
|
|
100.0% |
|
|
11.92 |
|
|
Gizmo Art Production, INC. |
|
Bayhill Shopping Center |
|
San Francisco-Oakland-Berkeley |
|
CA |
|
40% |
|
2005 |
|
2019 |
|
|
28,800 |
|
|
|
122 |
|
|
97.4% |
|
|
29.15 |
|
|
CVS, Mollie Stone's Market |
|
Clayton Valley Shopping Center |
|
San Francisco-Oakland-Berkeley |
|
CA |
|
|
|
2003 |
|
2004 |
|
|
— |
|
|
|
260 |
|
|
90.8% |
|
|
23.67 |
|
|
Grocery Outlet, Central, CVS, Dollar Tree, Ross Dress For Less |
|
Diablo Plaza |
|
San Francisco-Oakland-Berkeley |
|
CA |
|
|
|
1999 |
|
1982 |
|
|
— |
|
|
|
63 |
|
|
100.0% |
|
|
43.59 |
|
|
Bevmo!, (Safeway), (CVS) |
|
El Cerrito Plaza |
|
San Francisco-Oakland-Berkeley |
|
CA |
|
|
|
2000 |
|
2000 |
|
|
— |
|
|
|
256 |
|
|
96.6% |
|
|
29.49 |
|
|
Barnes & Noble, Jo-Ann Fabrics, PETCO, Ross Dress For Less, Trader Joe's, Marshalls, (CVS) |
|
Encina Grande |
|
San Francisco-Oakland-Berkeley |
|
CA |
|
|
|
1999 |
|
2016 |
|
|
— |
|
|
|
106 |
|
|
100.0% |
|
|
36.12 |
|
|
Whole Foods, Walgreens |
|
Persimmon Place |
|
San Francisco-Oakland-Berkeley |
|
CA |
|
|
|
2014 |
|
2014 |
|
|
— |
|
|
|
153 |
|
|
100.0% |
|
|
37.86 |
|
|
Whole Foods, Nordstrom Rack, Homegoods |
|
Plaza Escuela |
|
San Francisco-Oakland-Berkeley |
|
CA |
|
|
|
2017 |
|
2002 |
|
|
— |
|
|
|
154 |
|
|
93.5% |
|
|
44.22 |
|
|
The Container Store, Trufusion, Talbots, The Cheesecake Factory, Barnes & Noble |
|
Pleasant Hill Shopping Center |
|
San Francisco-Oakland-Berkeley |
|
CA |
|
40% |
|
2005 |
|
2016 |
|
|
50,000 |
|
|
|
227 |
|
|
100.0% |
|
|
24.52 |
|
|
Target, Burlington, Ross Dress for Less, Homegoods |
|
Potrero Center |
|
San Francisco-Oakland-Berkeley |
|
CA |
|
|
|
2017 |
|
1997 |
|
|
— |
|
|
|
227 |
|
|
70.9% |
|
|
34.12 |
|
|
Safeway, 24 Hour Fitness, Ross Dress for Less, Petco |
|
Powell Street Plaza |
|
San Francisco-Oakland-Berkeley |
|
CA |
|
|
|
2001 |
|
1987 |
|
|
— |
|
|
|
166 |
|
|
97.1% |
|
|
35.91 |
|
|
Trader Joe's, Bevmo!, Ross Dress For Less, Marshalls, Old Navy |
|
San Carlos Marketplace |
|
San Francisco-Oakland-Berkeley |
|
CA |
|
|
|
2017 |
|
2007 |
|
|
— |
|
|
|
154 |
|
|
87.2% |
|
|
39.10 |
|
|
TJ Maxx, Best Buy, PetSmart, Bassett Furniture |
|
San Leandro Plaza |
|
San Francisco-Oakland-Berkeley |
|
CA |
|
|
|
1999 |
|
1982 |
|
|
— |
|
|
|
50 |
|
|
100.0% |
|
|
41.14 |
|
|
(Safeway), (CVS) |
|
Serramonte Center |
|
San Francisco-Oakland-Berkeley |
|
CA |
|
|
|
2017 |
|
2018 |
|
|
— |
|
|
|
1,072 |
|
|
97.6% |
|
|
27.48 |
|
|
Buy Buy Baby, Cost Plus World Market, Crunch Fitness, DAISO, Dave & Buster's, Dick's Sporting Goods, Divano Homes, H&M, Macy's, Nordstrom Rack, Old Navy, Party City, Ross Dress for Less, Target, TJ Maxx, Uniqlo, Jagalchi |
|
Tassajara Crossing |
|
San Francisco-Oakland-Berkeley |
|
CA |
|
|
|
1999 |
|
1990 |
|
|
— |
|
|
|
146 |
|
|
96.9% |
|
|
26.56 |
|
|
Safeway, CVS, Alamo Hardware |
|
Willows Shopping Center (6) |
|
San Francisco-Oakland-Berkeley |
|
CA |
|
|
|
2017 |
|
2015 |
|
|
— |
|
|
|
241 |
|
|
82.7% |
|
|
30.58 |
|
|
REI, UFC Gym, Old Navy, Ulta, Five Below |
|
Woodside Central |
|
San Francisco-Oakland-Berkeley |
|
CA |
|
|
|
1999 |
|
1993 |
|
|
— |
|
|
|
81 |
|
|
93.4% |
|
|
26.39 |
|
|
Chuck E. Cheese, Marshalls, (Target) |
|
Ygnacio Plaza |
|
San Francisco-Oakland-Berkeley |
|
CA |
|
40% |
|
2005 |
|
1968 |
|
|
25,850 |
|
|
|
110 |
|
|
97.6% |
|
|
40.58 |
|
|
Sports Basement,TJ Maxx |
|
Blossom Valley |
|
San Jose-Sunnyvale-Santa Clara |
|
CA |
|
|
|
1999 |
|
1990 |
|
|
22,300 |
|
|
|
93 |
|
|
97.7% |
|
|
28.61 |
|
|
Safeway |
|
Mariposa Shopping Center |
|
San Jose-Sunnyvale-Santa Clara |
|
CA |
|
40% |
|
2005 |
|
2020 |
|
|
26,950 |
|
|
|
127 |
|
|
94.0% |
|
|
22.24 |
|
|
Safeway, CVS, Ross Dress for Less |
|
Shoppes at Homestead |
|
San Jose-Sunnyvale-Santa Clara |
|
CA |
|
|
|
1999 |
|
1983 |
|
|
— |
|
|
|
116 |
|
|
96.7% |
|
|
26.25 |
|
|
CVS, Crunch Fitness, (Orchard Supply Hardware) |
|
Snell & Branham Plaza |
|
San Jose-Sunnyvale-Santa Clara |
|
CA |
|
40% |
|
2005 |
|
1988 |
|
|
19,200 |
|
|
|
92 |
|
|
98.5% |
|
|
22.25 |
|
|
Safeway |
|
The Pruneyard |
|
San Jose-Sunnyvale-Santa Clara |
|
CA |
|
|
|
2019 |
|
2014 |
|
|
2,200 |
|
|
|
260 |
|
|
97.9% |
|
|
42.54 |
|
|
Trader Joe's, The Sports Basement, Camera Cinemas, Marshalls |
|
West Park Plaza |
|
San Jose-Sunnyvale-Santa Clara |
|
CA |
|
|
|
1999 |
|
1996 |
|
|
— |
|
|
|
88 |
|
|
100.0% |
|
|
22.07 |
|
|
Safeway, Crunch Fitness |
|
Golden Hills Plaza |
|
San Luis Obispo-Paso Robles |
|
CA |
|
|
|
2006 |
|
2017 |
|
|
— |
|
|
|
244 |
|
|
87.0% |
|
|
7.13 |
|
|
Lowe's, TJ Maxx |
|
Five Points Shopping Center |
|
Santa Maria-Santa Barbara |
|
CA |
|
40% |
|
2005 |
|
2014 |
|
|
— |
|
|
|
145 |
|
|
97.6% |
|
|
31.02 |
|
|
Smart & Final, CVS, Ross Dress for Less, Big 5 Sporting Goods, PETCO |
|
Corral Hollow |
|
Stockton |
|
CA |
|
|
|
2000 |
|
2000 |
|
|
— |
|
|
|
167 |
|
|
70.4% |
|
|
20.82 |
|
|
Safeway, CVS |
|
Alcove On Arapahoe |
|
Boulder |
|
CO |
|
40% |
|
2005 |
|
2019 |
|
|
26,700 |
|
|
|
159 |
|
|
91.8% |
|
|
19.79 |
|
|
Petco, HomeGoods, Jo-Ann Fabrics, Safeway, Ulta Salon |
|
Crossroads Commons |
|
Boulder |
|
CO |
|
20% |
|
2001 |
|
1986 |
|
|
34,500 |
|
|
|
143 |
|
|
93.6% |
|
|
30.27 |
|
|
Whole Foods, Barnes & Noble |
29
|
Property Name |
|
CBSA (1) |
|
State |
|
Owner-
|
|
Year
|
|
Year
|
|
Mortgages or
|
|
|
Gross
|
|
|
Percent
|
|
Average
|
|
|
Major Tenant(s) (5) |
|||
|
Crossroads Commons II |
|
Boulder |
|
CO |
|
20% |
|
2018 |
|
1995 |
|
|
5,500 |
|
|
|
18 |
|
|
100.0% |
|
|
41.45 |
|
|
(Whole Foods), (Barnes & Noble) |
|
Falcon Marketplace |
|
Colorado Springs |
|
CO |
|
|
|
2005 |
|
2005 |
|
|
— |
|
|
|
22 |
|
|
100.0% |
|
|
26.36 |
|
|
(Wal-Mart) |
|
Marketplace at Briargate |
|
Colorado Springs |
|
CO |
|
|
|
2006 |
|
2006 |
|
|
— |
|
|
|
29 |
|
|
100.0% |
|
|
36.20 |
|
|
(King Soopers) |
|
Monument Jackson Creek |
|
Colorado Springs |
|
CO |
|
|
|
1998 |
|
1999 |
|
|
— |
|
|
|
85 |
|
|
100.0% |
|
|
12.99 |
|
|
King Soopers |
|
Woodmen Plaza |
|
Colorado Springs |
|
CO |
|
|
|
1998 |
|
1998 |
|
|
— |
|
|
|
116 |
|
|
97.6% |
|
|
13.93 |
|
|
King Soopers |
|
Applewood Shopping Ctr |
|
Denver-Aurora-Lakewood |
|
CO |
|
40% |
|
2005 |
|
2020 |
|
|
— |
|
|
|
360 |
|
|
95.8% |
|
|
16.51 |
|
|
Applejack Liquors, Hobby Lobby, Homegoods, King Soopers, PetSmart, Sierra Trading Post, Ulta, Three Little Mingos |
|
Belleview Square |
|
Denver-Aurora-Lakewood |
|
CO |
|
|
|
2004 |
|
2013 |
|
|
— |
|
|
|
117 |
|
|
96.1% |
|
|
21.81 |
|
|
King Soopers |
|
Boulevard Center |
|
Denver-Aurora-Lakewood |
|
CO |
|
|
|
1999 |
|
1986 |
|
|
— |
|
|
|
77 |
|
|
91.5% |
|
|
32.51 |
|
|
Eye Care Specialists, (Safeway) |
|
Buckley Square |
|
Denver-Aurora-Lakewood |
|
CO |
|
|
|
1999 |
|
1978 |
|
|
— |
|
|
|
116 |
|
|
93.6% |
|
|
11.90 |
|
|
Ace Hardware, King Soopers |
|
Cherrywood Square Shop Ctr |
|
Denver-Aurora-Lakewood |
|
CO |
|
40% |
|
2005 |
|
1978 |
|
|
9,650 |
|
|
|
97 |
|
|
100.0% |
|
|
13.03 |
|
|
King Soopers |
|
Hilltop Village |
|
Denver-Aurora-Lakewood |
|
CO |
|
|
|
2002 |
|
2018 |
|
|
— |
|
|
|
101 |
|
|
100.0% |
|
|
13.58 |
|
|
King Soopers |
|
Littleton Square |
|
Denver-Aurora-Lakewood |
|
CO |
|
|
|
1999 |
|
2015 |
|
|
— |
|
|
|
99 |
|
|
97.2% |
|
|
11.50 |
|
|
King Soopers |
|
Lloyd King Center |
|
Denver-Aurora-Lakewood |
|
CO |
|
|
|
1998 |
|
1998 |
|
|
— |
|
|
|
83 |
|
|
100.0% |
|
|
12.25 |
|
|
King Soopers |
|
Ralston Square Shopping Center |
|
Denver-Aurora-Lakewood |
|
CO |
|
40% |
|
2005 |
|
1977 |
|
|
— |
|
|
|
83 |
|
|
98.5% |
|
|
16.44 |
|
|
King Soopers |
|
Shops at Quail Creek |
|
Denver-Aurora-Lakewood |
|
CO |
|
|
|
2008 |
|
2008 |
|
|
— |
|
|
|
38 |
|
|
96.3% |
|
|
28.22 |
|
|
(King Soopers) |
|
Stroh Ranch |
|
Denver-Aurora-Lakewood |
|
CO |
|
|
|
1998 |
|
1998 |
|
|
— |
|
|
|
93 |
|
|
100.0% |
|
|
14.43 |
|
|
King Soopers |
|
Centerplace of Greeley III |
|
Greeley |
|
CO |
|
|
|
2007 |
|
2007 |
|
|
— |
|
|
|
119 |
|
|
100.0% |
|
|
12.31 |
|
|
Hobby Lobby, Best Buy, TJ Maxx |
|
22 Crescent Road |
|
Bridgeport-Stamford-Norwalk |
|
CT |
|
|
|
2017 |
|
1984 |
|
|
— |
|
|
|
4 |
|
|
100.0% |
|
|
69.00 |
|
|
- |
|
25 Valley Drive |
|
Bridgeport-Stamford-Norwalk |
|
CT |
|
|
|
2023 |
|
1977 |
|
|
— |
|
|
|
18 |
|
|
100.0% |
|
|
46.25 |
|
|
- |
|
321-323 Railroad Ave |
|
Bridgeport-Stamford-Norwalk |
|
CT |
|
|
|
2023 |
|
1983 |
|
|
— |
|
|
|
21 |
|
|
100.0% |
|
|
37.48 |
|
|
- |
|
470 Main Street |
|
Bridgeport-Stamford-Norwalk |
|
CT |
|
|
|
2023 |
|
1972 |
|
|
— |
|
|
|
23 |
|
|
98.5% |
|
|
29.32 |
|
|
- |
|
530 Old Post Rd |
|
Bridgeport-Stamford-Norwalk |
|
CT |
|
|
|
2023 |
|
1979 |
|
|
— |
|
|
|
8 |
|
|
75.0% |
|
|
43.25 |
|
|
- |
|
7 Riversville |
|
Bridgeport-Stamford-Norwalk |
|
CT |
|
|
|
2023 |
|
1978 |
|
|
— |
|
|
|
11 |
|
|
80.9% |
|
|
39.61 |
|
|
- |
|
91 Danbury Road |
|
Bridgeport-Stamford-Norwalk |
|
CT |
|
|
|
2017 |
|
1965 |
|
|
— |
|
|
|
5 |
|
|
77.3% |
|
|
29.44 |
|
|
- |
|
970 High Ridge Center |
|
Bridgeport-Stamford-Norwalk |
|
CT |
|
|
|
2023 |
|
1960 |
|
|
— |
|
|
|
27 |
|
|
89.6% |
|
|
36.15 |
|
|
BevMax |
|
Airport Plaza |
|
Bridgeport-Stamford-Norwalk |
|
CT |
|
|
|
2023 |
|
1974 |
|
|
— |
|
|
|
33 |
|
|
100.0% |
|
|
31.48 |
|
|
- |
|
Bethel Hub Center |
|
Bridgeport-Stamford-Norwalk |
|
CT |
|
|
|
2023 |
|
1957 |
|
|
— |
|
|
|
31 |
|
|
60.8% |
|
|
14.91 |
|
|
La Placita Bethel Market |
|
Black Rock |
|
Bridgeport-Stamford-Norwalk |
|
CT |
|
80% |
|
2014 |
|
1996 |
|
|
15,342 |
|
|
|
95 |
|
|
97.7% |
|
|
29.89 |
|
|
Old Navy, The Clubhouse |
|
Brick Walk (6) |
|
Bridgeport-Stamford-Norwalk |
|
CT |
|
80% |
|
2014 |
|
2007 |
|
|
30,919 |
|
|
|
123 |
|
|
96.2% |
|
|
46.08 |
|
|
- |
|
Compo Acres Shopping Center |
|
Bridgeport-Stamford-Norwalk |
|
CT |
|
|
|
2017 |
|
2011 |
|
|
— |
|
|
|
43 |
|
|
95.9% |
|
|
55.85 |
|
|
Trader Joe's |
|
Copps Hill Plaza |
|
Bridgeport-Stamford-Norwalk |
|
CT |
|
|
|
2017 |
|
2002 |
|
|
7,706 |
|
|
|
173 |
|
|
88.1% |
|
|
22.26 |
|
|
Stop & Shop, Homegoods, Marshalls, Rite Aid, Michael's |
|
Cos Cob Commons |
|
Bridgeport-Stamford-Norwalk |
|
CT |
|
|
|
2023 |
|
1986 |
|
|
13,142 |
|
|
|
48 |
|
|
93.9% |
|
|
53.16 |
|
|
CVS |
|
Cos Cob Plaza |
|
Bridgeport-Stamford-Norwalk |
|
CT |
|
|
|
2023 |
|
1947 |
|
|
3,902 |
|
|
|
15 |
|
|
93.4% |
|
|
52.79 |
|
|
- |
|
Danbury Green |
|
Bridgeport-Stamford-Norwalk |
|
CT |
|
|
|
2017 |
|
2006 |
|
|
— |
|
|
|
124 |
|
|
99.0% |
|
|
27.17 |
|
|
Trader Joe's, Hilton Garden Inn, DSW, Staples, Rite Aid, Warehouse Wines & Liquors |
|
Danbury Square |
|
Bridgeport-Stamford-Norwalk |
|
CT |
|
|
|
2023 |
|
1987 |
|
|
— |
|
|
|
194 |
|
|
73.2% |
|
|
13.80 |
|
|
Ocean State Job Lot, Planet Fitness, Elicit Brewing Company |
|
Darinor Plaza (6) |
|
Bridgeport-Stamford-Norwalk |
|
CT |
|
|
|
2017 |
|
1978 |
|
|
— |
|
|
|
153 |
|
|
100.0% |
|
|
20.45 |
|
|
Kohl's, Old Navy, Party City |
|
Fairfield Center (6) |
|
Bridgeport-Stamford-Norwalk |
|
CT |
|
80% |
|
2014 |
|
2000 |
|
|
— |
|
|
|
95 |
|
|
87.8% |
|
|
34.04 |
|
|
Fairfield University Bookstore, Merril Lynch |
|
Fairfield Crossroads |
|
Bridgeport-Stamford-Norwalk |
|
CT |
|
|
|
2023 |
|
1995 |
|
|
— |
|
|
|
62 |
|
|
100.0% |
|
|
25.28 |
|
|
Marshalls, DSW |
|
Goodwives Shopping Center |
|
Bridgeport-Stamford-Norwalk |
|
CT |
|
|
|
2023 |
|
1955 |
|
|
23,078 |
|
|
|
96 |
|
|
90.1% |
|
|
41.03 |
|
|
Stop & Shop |
|
Greens Farms Plaza |
|
Bridgeport-Stamford-Norwalk |
|
CT |
|
|
|
2023 |
|
1958 |
|
|
— |
|
|
|
40 |
|
|
51.3% |
|
|
25.81 |
|
|
BevMax |
|
Greenwich Commons |
|
Bridgeport-Stamford-Norwalk |
|
CT |
|
|
|
2023 |
|
1961 |
|
|
4,866 |
|
|
|
10 |
|
|
100.0% |
|
|
89.23 |
|
|
- |
|
High Ridge Center |
|
Bridgeport-Stamford-Norwalk |
|
CT |
|
100% |
|
2023 |
|
1968 |
|
|
9,047 |
|
|
|
91 |
|
|
69.2% |
|
|
56.28 |
|
|
Trader Joe's |
|
Knotts Landing |
|
Bridgeport-Stamford-Norwalk |
|
CT |
|
|
|
2023 |
|
1994 |
|
|
— |
|
|
|
3 |
|
|
100.0% |
|
|
76.05 |
|
|
- |
|
Main & Bailey |
|
Bridgeport-Stamford-Norwalk |
|
CT |
|
|
|
2023 |
|
1950 |
|
|
— |
|
|
|
62 |
|
|
96.1% |
|
|
26.17 |
|
|
- |
|
Newfield Green |
|
Bridgeport-Stamford-Norwalk |
|
CT |
|
|
|
2023 |
|
1966 |
|
|
19,278 |
|
|
|
74 |
|
|
95.8% |
|
|
38.15 |
|
|
Grade A Market, CVS |
|
Old Greenwich CVS |
|
Bridgeport-Stamford-Norwalk |
|
CT |
|
100% |
|
2023 |
|
1941 |
|
|
891 |
|
|
|
8 |
|
|
100.0% |
|
|
30.17 |
|
|
- |
30
|
Property Name |
|
CBSA (1) |
|
State |
|
Owner-
|
|
Year
|
|
Year
|
|
Mortgages or
|
|
|
Gross
|
|
|
Percent
|
|
Average
|
|
|
Major Tenant(s) (5) |
|||
|
Post Road Plaza |
|
Bridgeport-Stamford-Norwalk |
|
CT |
|
|
|
2017 |
|
1978 |
|
|
— |
|
|
|
20 |
|
|
100.0% |
|
|
59.79 |
|
|
Trader Joe's |
|
Ridgeway Shopping Center |
|
Bridgeport-Stamford-Norwalk |
|
CT |
|
|
|
2023 |
|
1952 |
|
|
43,150 |
|
|
|
365 |
|
|
91.7% |
|
|
30.17 |
|
|
Stop & Shop, LA Fitness, Marshalls, Michael's, Staples, Ashley Furniture, Old Navy, ULTA |
|
Shelton Square |
|
Bridgeport-Stamford-Norwalk |
|
CT |
|
|
|
2023 |
|
1982 |
|
|
— |
|
|
|
189 |
|
|
99.1% |
|
|
19.12 |
|
|
Stop & Shop, Homegoods, Hawley Lane, Edge Fitness |
|
Station Centre @ Old Greenwich |
|
Bridgeport-Stamford-Norwalk |
|
CT |
|
|
|
2023 |
|
1952 |
|
|
6,770 |
|
|
|
39 |
|
|
91.4% |
|
|
35.73 |
|
|
Kings Food Markets |
|
The Dock-Dockside |
|
Bridgeport-Stamford-Norwalk |
|
CT |
|
|
|
2023 |
|
1974 |
|
|
33,667 |
|
|
|
278 |
|
|
100.0% |
|
|
19.81 |
|
|
Stop & Shop, BJ's Whole Sale, Edge Fitness, West Marine, Petco, Dollar Tree, Osaka Hibachi |
|
Walmart Norwalk |
|
Bridgeport-Stamford-Norwalk |
|
CT |
|
|
|
2017 |
|
2003 |
|
|
— |
|
|
|
142 |
|
|
100.0% |
|
|
0.56 |
|
|
WalMart, HomeGoods |
|
Westport Row |
|
Bridgeport-Stamford-Norwalk |
|
CT |
|
|
|
2017 |
|
2020 |
|
|
— |
|
|
|
95 |
|
|
100.0% |
|
|
45.10 |
|
|
The Fresh Market, Pottery Barn |
|
Brookside Plaza |
|
Hartford-E Hartford-Middletown |
|
CT |
|
|
|
2017 |
|
2006 |
|
|
— |
|
|
|
227 |
|
|
95.8% |
|
|
16.41 |
|
|
Burlington Coat Factory, PetSmart, ShopRite, Staples, TJ Maxx, LL Bean |
|
Corbin's Corner |
|
Hartford-E Hartford-Middletown |
|
CT |
|
40% |
|
2005 |
|
2015 |
|
|
53,000 |
|
|
|
189 |
|
|
98.1% |
|
|
32.12 |
|
|
Best Buy, Edge Fitness, Old Navy, The Tile Shop, Total Wine and More, Trader Joe's |
|
Aldi Square |
|
New Haven-Milford |
|
CT |
|
|
|
2023 |
|
2014 |
|
|
— |
|
|
|
38 |
|
|
100.0% |
|
|
16.19 |
|
|
Aldi |
|
Orange Meadows |
|
New Haven-Milford |
|
CT |
|
|
|
2023 |
|
1990 |
|
|
— |
|
|
|
78 |
|
|
100.0% |
|
|
24.13 |
|
|
Trader Joe's, TJMaxx, Bob's Discount Furniture, Ulta |
|
Southbury Green |
|
New Haven-Milford |
|
CT |
|
|
|
2017 |
|
2002 |
|
|
— |
|
|
|
156 |
|
|
87.5% |
|
|
22.41 |
|
|
ShopRite, Homegoods |
|
New Milford Plaza |
|
Torrington |
|
CT |
|
|
|
2023 |
|
1970 |
|
|
— |
|
|
|
235 |
|
|
100.0% |
|
|
9.31 |
|
|
Walmart, Stop & Shop, Club 24, Dollar Tree |
|
Sunny Valley Shops |
|
Torrington |
|
CT |
|
|
|
2023 |
|
2003 |
|
|
— |
|
|
|
72 |
|
|
55.5% |
|
|
15.62 |
|
|
Staples |
|
Veterans Plaza |
|
Torrington |
|
CT |
|
|
|
2023 |
|
1966 |
|
|
— |
|
|
|
80 |
|
|
100.0% |
|
|
12.23 |
|
|
Big Y World Class Market, BevMax |
|
Shops at The Columbia |
|
Washington-Arlington-Alexandri |
|
DC |
|
|
|
2006 |
|
2006 |
|
|
— |
|
|
|
23 |
|
|
100.0% |
|
|
38.34 |
|
|
Trader Joe's |
|
Spring Valley Shopping Center |
|
Washington-Arlington-Alexandri |
|
DC |
|
40% |
|
2005 |
|
1930 |
|
|
13,000 |
|
|
|
17 |
|
|
100.0% |
|
|
101.60 |
|
|
- |
|
Pike Creek |
|
Philadelphia-Camden-Wilmington |
|
DE |
|
|
|
1998 |
|
2013 |
|
|
— |
|
|
|
229 |
|
|
96.2% |
|
|
17.39 |
|
|
Acme Markets, Edge Fitness, Pike Creek Community Hardware |
|
Shoppes of Graylyn |
|
Philadelphia-Camden-Wilmington |
|
DE |
|
40% |
|
2005 |
|
1971 |
|
|
— |
|
|
|
64 |
|
|
94.6% |
|
|
25.73 |
|
|
Rite Aid |
|
Corkscrew Village |
|
Cape Coral-Fort Myers |
|
FL |
|
|
|
2007 |
|
1997 |
|
|
— |
|
|
|
82 |
|
|
97.8% |
|
|
15.55 |
|
|
Publix |
|
Shoppes of Grande Oak |
|
Cape Coral-Fort Myers |
|
FL |
|
|
|
2000 |
|
2000 |
|
|
— |
|
|
|
79 |
|
|
98.5% |
|
|
17.93 |
|
|
Publix |
|
Millhopper Shopping Center |
|
Gainesville |
|
FL |
|
|
|
1993 |
|
2017 |
|
|
— |
|
|
|
80 |
|
|
100.0% |
|
|
19.82 |
|
|
Publix |
|
Newberry Square |
|
Gainesville |
|
FL |
|
|
|
1994 |
|
1986 |
|
|
— |
|
|
|
181 |
|
|
89.7% |
|
|
9.63 |
|
|
Publix, Floor & Décor, Dollar Tree |
|
Anastasia Plaza |
|
Jacksonville |
|
FL |
|
|
|
1993 |
|
1988 |
|
|
— |
|
|
|
102 |
|
|
95.0% |
|
|
15.39 |
|
|
Publix |
|
Atlantic Village |
|
Jacksonville |
|
FL |
|
|
|
2017 |
|
2014 |
|
|
— |
|
|
|
110 |
|
|
100.0% |
|
|
19.09 |
|
|
LA Fitness, Pet Supplies Plus |
|
Brooklyn Station on Riverside |
|
Jacksonville |
|
FL |
|
|
|
2013 |
|
2013 |
|
|
— |
|
|
|
50 |
|
|
100.0% |
|
|
28.73 |
|
|
The Fresh Market |
|
Courtyard Shopping Center |
|
Jacksonville |
|
FL |
|
|
|
1993 |
|
1987 |
|
|
— |
|
|
|
137 |
|
|
100.0% |
|
|
3.68 |
|
|
Target, (Publix) |
|
East San Marco |
|
Jacksonville |
|
FL |
|
|
|
2007 |
|
2022 |
|
|
— |
|
|
|
59 |
|
|
100.0% |
|
|
28.33 |
|
|
Publix |
|
Fleming Island |
|
Jacksonville |
|
FL |
|
|
|
1998 |
|
2000 |
|
|
— |
|
|
|
132 |
|
|
97.3% |
|
|
17.69 |
|
|
Publix, PETCO, Planet Fitness, (Target) |
|
Hibernia Pavilion |
|
Jacksonville |
|
FL |
|
|
|
2006 |
|
2006 |
|
|
— |
|
|
|
51 |
|
|
100.0% |
|
|
16.52 |
|
|
Publix |
|
John's Creek Center |
|
Jacksonville |
|
FL |
|
20% |
|
2003 |
|
2004 |
|
|
9,000 |
|
|
|
82 |
|
|
100.0% |
|
|
16.67 |
|
|
Publix |
|
Julington Village |
|
Jacksonville |
|
FL |
|
20% |
|
1999 |
|
1999 |
|
|
10,000 |
|
|
|
82 |
|
|
100.0% |
|
|
17.65 |
|
|
Publix, (CVS) |
|
Mandarin Landing |
|
Jacksonville |
|
FL |
|
|
|
2017 |
|
1976 |
|
|
— |
|
|
|
129 |
|
|
98.3% |
|
|
23.52 |
|
|
Whole Foods, Aveda Institute, Baptist Health, Cooper's Hawk |
|
Nocatee Town Center |
|
Jacksonville |
|
FL |
|
|
|
2007 |
|
2017 |
|
|
— |
|
|
|
114 |
|
|
100.0% |
|
|
23.56 |
|
|
Publix |
|
Oakleaf Commons |
|
Jacksonville |
|
FL |
|
|
|
2006 |
|
2006 |
|
|
— |
|
|
|
77 |
|
|
100.0% |
|
|
16.93 |
|
|
Publix |
|
Old St Augustine Plaza |
|
Jacksonville |
|
FL |
|
|
|
1996 |
|
2020 |
|
|
— |
|
|
|
248 |
|
|
100.0% |
|
|
11.52 |
|
|
Publix, Burlington Coat Factory, Hobby Lobby, LA Fitness, Ross Dress for Less |
|
Pablo Plaza |
|
Jacksonville |
|
FL |
|
|
|
2017 |
|
2020 |
|
|
— |
|
|
|
161 |
|
|
100.0% |
|
|
18.80 |
|
|
Whole Foods, Office Depot, Marshalls, HomeGoods, PetSmart |
|
Pine Tree Plaza |
|
Jacksonville |
|
FL |
|
|
|
1997 |
|
1999 |
|
|
— |
|
|
|
63 |
|
|
96.9% |
|
|
14.97 |
|
|
Publix |
31
|
Property Name |
|
CBSA (1) |
|
State |
|
Owner-
|
|
Year
|
|
Year
|
|
Mortgages or
|
|
|
Gross
|
|
|
Percent
|
|
Average
|
|
|
Major Tenant(s) (5) |
|||
|
Seminole Shoppes |
|
Jacksonville |
|
FL |
|
50% |
|
2009 |
|
2018 |
|
|
7,272 |
|
|
|
87 |
|
|
100.0% |
|
|
24.27 |
|
|
Publix |
|
Shoppes at Bartram Park |
|
Jacksonville |
|
FL |
|
50% |
|
2005 |
|
2017 |
|
|
— |
|
|
|
135 |
|
|
100.0% |
|
|
22.67 |
|
|
Publix, (Kohl's), (Tutor Time) |
|
Shops at John's Creek |
|
Jacksonville |
|
FL |
|
|
|
2003 |
|
2004 |
|
|
— |
|
|
|
15 |
|
|
100.0% |
|
|
27.73 |
|
|
- |
|
South Beach Regional |
|
Jacksonville |
|
FL |
|
|
|
2017 |
|
1990 |
|
|
— |
|
|
|
303 |
|
|
86.7% |
|
|
17.95 |
|
|
Trader Joe's, Home Depot, Ross Dress for Less, Staples, Nordstrom Rack |
|
Starke (6) |
|
Jacksonville |
|
FL |
|
|
|
2000 |
|
2000 |
|
|
— |
|
|
|
13 |
|
|
100.0% |
|
|
27.05 |
|
|
CVS |
|
Avenida Biscayne (fka Aventura Square) (6) |
|
Miami-Ft Lauderdale-PompanoBch |
|
FL |
|
|
|
2017 |
|
1991 |
|
|
— |
|
|
|
143 |
|
|
83.5% |
|
|
52.86 |
|
|
DSW, Jewelry Exchange, Old Navy, The Fresh Market |
|
Aventura Shopping Center |
|
Miami-Ft Lauderdale-PompanoBch |
|
FL |
|
|
|
1994 |
|
2017 |
|
|
— |
|
|
|
97 |
|
|
94.9% |
|
|
38.14 |
|
|
CVS, Publix |
|
Banco Popular Building |
|
Miami-Ft Lauderdale-PompanoBch |
|
FL |
|
|
|
2017 |
|
1971 |
|
|
— |
|
|
|
5 |
|
|
100.0% |
|
|
92.31 |
|
|
- |
|
Bird 107 Plaza |
|
Miami-Ft Lauderdale-PompanoBch |
|
FL |
|
|
|
2017 |
|
1990 |
|
|
— |
|
|
|
40 |
|
|
100.0% |
|
|
22.51 |
|
|
Walgreens |
|
Bird Ludlam |
|
Miami-Ft Lauderdale-PompanoBch |
|
FL |
|
|
|
2017 |
|
1998 |
|
|
— |
|
|
|
192 |
|
|
97.6% |
|
|
26.34 |
|
|
CVS, Goodwill, Winn-Dixie |
|
Boca Village Square |
|
Miami-Ft Lauderdale-PompanoBch |
|
FL |
|
|
|
2017 |
|
2014 |
|
|
— |
|
|
|
92 |
|
|
100.0% |
|
|
23.14 |
|
|
CVS, Publix |
|
Boynton Lakes Plaza |
|
Miami-Ft Lauderdale-PompanoBch |
|
FL |
|
|
|
1997 |
|
2012 |
|
|
— |
|
|
|
110 |
|
|
91.9% |
|
|
16.98 |
|
|
Citi Trends, Pet Supermarket, Publix |
|
Boynton Plaza |
|
Miami-Ft Lauderdale-PompanoBch |
|
FL |
|
|
|
2017 |
|
2015 |
|
|
— |
|
|
|
105 |
|
|
100.0% |
|
|
21.54 |
|
|
CVS, Publix |
|
Caligo Crossing |
|
Miami-Ft Lauderdale-PompanoBch |
|
FL |
|
|
|
2007 |
|
2007 |
|
|
— |
|
|
|
11 |
|
|
100.0% |
|
|
47.17 |
|
|
(Kohl's) |
|
Chasewood Plaza |
|
Miami-Ft Lauderdale-PompanoBch |
|
FL |
|
|
|
1993 |
|
2015 |
|
|
— |
|
|
|
152 |
|
|
97.1% |
|
|
28.26 |
|
|
Publix, Pet Smart |
|
Concord Shopping Plaza |
|
Miami-Ft Lauderdale-PompanoBch |
|
FL |
|
|
|
2017 |
|
1993 |
|
|
— |
|
|
|
309 |
|
|
100.0% |
|
|
14.90 |
|
|
Big Lots, Dollar Tree, Home Depot, Winn-Dixie, YouFit Health Club |
|
Coral Reef Shopping Center |
|
Miami-Ft Lauderdale-PompanoBch |
|
FL |
|
|
|
2017 |
|
1990 |
|
|
— |
|
|
|
75 |
|
|
98.7% |
|
|
33.13 |
|
|
Aldi, Walgreens |
|
Country Walk Plaza |
|
Miami-Ft Lauderdale-PompanoBch |
|
FL |
|
|
|
2017 |
|
2008 |
|
|
16,000 |
|
|
|
101 |
|
|
94.8% |
|
|
22.71 |
|
|
Publix, CVS |
|
Countryside Shops |
|
Miami-Ft Lauderdale-PompanoBch |
|
FL |
|
|
|
2017 |
|
2018 |
|
|
— |
|
|
|
193 |
|
|
72.6% |
|
|
25.82 |
|
|
Publix, Ross Dress for Less |
|
Fountain Square |
|
Miami-Ft Lauderdale-PompanoBch |
|
FL |
|
|
|
2013 |
|
2013 |
|
|
— |
|
|
|
177 |
|
|
100.0% |
|
|
29.26 |
|
|
Publix, Ross Dress for Less, TJ Maxx, Ulta, (Target) |
|
Gardens Square |
|
Miami-Ft Lauderdale-PompanoBch |
|
FL |
|
|
|
1997 |
|
1991 |
|
|
— |
|
|
|
90 |
|
|
100.0% |
|
|
19.66 |
|
|
Publix |
|
Greenwood Shopping Centre |
|
Miami-Ft Lauderdale-PompanoBch |
|
FL |
|
|
|
2017 |
|
1994 |
|
|
— |
|
|
|
133 |
|
|
96.8% |
|
|
17.36 |
|
|
Publix, Bealls |
|
Hammocks Town Center |
|
Miami-Ft Lauderdale-PompanoBch |
|
FL |
|
|
|
2017 |
|
1993 |
|
|
— |
|
|
|
187 |
|
|
92.2% |
|
|
18.87 |
|
|
CVS, Goodwill, Publix, Metro-Dade Public Library, YouFit Health Club, (Kendall Ice Arena) |
|
Pine Island |
|
Miami-Ft Lauderdale-PompanoBch |
|
FL |
|
|
|
2017 |
|
1999 |
|
|
— |
|
|
|
255 |
|
|
99.5% |
|
|
15.39 |
|
|
Publix, Burlington Coat Factory, Beall's Outlet, YouFit Health Club, Floor and Décor |
|
Pine Ridge Square |
|
Miami-Ft Lauderdale-PompanoBch |
|
FL |
|
|
|
2017 |
|
2013 |
|
|
— |
|
|
|
118 |
|
|
72.7% |
|
|
20.51 |
|
|
The Fresh Market, Marshalls, Ulta |
|
Pinecrest Place (6) |
|
Miami-Ft Lauderdale-PompanoBch |
|
FL |
|
|
|
2017 |
|
2017 |
|
|
— |
|
|
|
70 |
|
|
96.3% |
|
|
42.97 |
|
|
Whole Foods, (Target) |
|
Point Royale Shopping Center |
|
Miami-Ft Lauderdale-PompanoBch |
|
FL |
|
|
|
2017 |
|
2018 |
|
|
— |
|
|
|
202 |
|
|
100.0% |
|
|
17.02 |
|
|
Winn-Dixie, Burlington Coat Factory, Pasteur Medical Center, Planet Fitness, Rana Furniture |
|
Prosperity Centre |
|
Miami-Ft Lauderdale-PompanoBch |
|
FL |
|
|
|
2017 |
|
1993 |
|
|
— |
|
|
|
124 |
|
|
69.6% |
|
|
26.61 |
|
|
Office Depot, TJ Maxx, CVS |
|
Sawgrass Promenade |
|
Miami-Ft Lauderdale-PompanoBch |
|
FL |
|
|
|
2017 |
|
1998 |
|
|
— |
|
|
|
107 |
|
|
89.9% |
|
|
15.40 |
|
|
Publix, Walgreens, Dollar Tree |
|
Sheridan Plaza |
|
Miami-Ft Lauderdale-PompanoBch |
|
FL |
|
|
|
2017 |
|
2022 |
|
|
— |
|
|
|
507 |
|
|
95.3% |
|
|
20.47 |
|
|
Publix, Kohl's, LA Fitness, Ross Dress for Less, Pet Supplies Plus, Wellmax, Burlington, Marshalls |
|
Shoppes @ 104 |
|
Miami-Ft Lauderdale-PompanoBch |
|
FL |
|
|
|
1998 |
|
2018 |
|
|
— |
|
|
|
112 |
|
|
95.0% |
|
|
20.73 |
|
|
Fresco y Mas, CVS |
|
Shoppes at Lago Mar |
|
Miami-Ft Lauderdale-PompanoBch |
|
FL |
|
|
|
2017 |
|
1995 |
|
|
— |
|
|
|
83 |
|
|
91.0% |
|
|
16.11 |
|
|
Publix, YouFit Health Club |
|
Shoppes of Jonathan's Landing |
|
Miami-Ft Lauderdale-PompanoBch |
|
FL |
|
|
|
2017 |
|
1997 |
|
|
— |
|
|
|
27 |
|
|
94.2% |
|
|
31.19 |
|
|
(Publix) |
|
Shoppes of Oakbrook |
|
Miami-Ft Lauderdale-PompanoBch |
|
FL |
|
|
|
2017 |
|
2003 |
|
|
— |
|
|
|
200 |
|
|
53.8% |
|
|
22.37 |
|
|
Publix, Duffy's Sports Bar, CVS |
|
Shoppes of Silver Lakes |
|
Miami-Ft Lauderdale-PompanoBch |
|
FL |
|
|
|
2017 |
|
1997 |
|
|
— |
|
|
|
127 |
|
|
97.1% |
|
|
21.03 |
|
|
Publix, Goodwill |
|
Shoppes of Sunset |
|
Miami-Ft Lauderdale-PompanoBch |
|
FL |
|
|
|
2017 |
|
2009 |
|
|
— |
|
|
|
22 |
|
|
71.2% |
|
|
26.90 |
|
|
- |
|
Shoppes of Sunset II |
|
Miami-Ft Lauderdale-PompanoBch |
|
FL |
|
|
|
2017 |
|
2009 |
|
|
— |
|
|
|
28 |
|
|
89.9% |
|
|
24.32 |
|
|
- |
|
Shops at Skylake |
|
Miami-Ft Lauderdale-PompanoBch |
|
FL |
|
|
|
2017 |
|
2006 |
|
|
— |
|
|
|
287 |
|
|
98.0% |
|
|
25.49 |
|
|
Publix, LA Fitness, TJ Maxx, Goodwill, Pasteur Medical |
|
Tamarac Town Square |
|
Miami-Ft Lauderdale-PompanoBch |
|
FL |
|
|
|
2017 |
|
1987 |
|
|
— |
|
|
|
125 |
|
|
84.8% |
|
|
13.28 |
|
|
Publix, Dollar Tree, Retro Fitness |
|
University Commons (6) |
|
Miami-Ft Lauderdale-PompanoBch |
|
FL |
|
|
|
2015 |
|
2001 |
|
|
— |
|
|
|
180 |
|
|
100.0% |
|
|
35.02 |
|
|
Whole Foods, Nordstrom Rack, Barnes & Noble, Bed Bath & Beyond |
32
|
Property Name |
|
CBSA (1) |
|
State |
|
Owner-
|
|
Year
|
|
Year
|
|
Mortgages or
|
|
|
Gross
|
|
|
Percent
|
|
Average
|
|
|
Major Tenant(s) (5) |
|||
|
Waterstone Plaza |
|
Miami-Ft Lauderdale-PompanoBch |
|
FL |
|
|
|
2017 |
|
2005 |
|
|
— |
|
|
|
61 |
|
|
100.0% |
|
|
18.36 |
|
|
Publix |
|
Welleby Plaza |
|
Miami-Ft Lauderdale-PompanoBch |
|
FL |
|
|
|
1996 |
|
1982 |
|
|
— |
|
|
|
110 |
|
|
98.9% |
|
|
15.28 |
|
|
Publix, Dollar Tree |
|
Wellington Town Square |
|
Miami-Ft Lauderdale-PompanoBch |
|
FL |
|
|
|
1996 |
|
2022 |
|
|
— |
|
|
|
108 |
|
|
97.4% |
|
|
25.62 |
|
|
Publix, CVS |
|
West Bird Plaza |
|
Miami-Ft Lauderdale-PompanoBch |
|
FL |
|
|
|
2017 |
|
2021 |
|
|
— |
|
|
|
99 |
|
|
97.9% |
|
|
26.51 |
|
|
Publix |
|
West Lake Shopping Center |
|
Miami-Ft Lauderdale-PompanoBch |
|
FL |
|
|
|
2017 |
|
2000 |
|
|
— |
|
|
|
101 |
|
|
100.0% |
|
|
23.33 |
|
|
Fresco y Mas, CVS |
|
Westport Plaza |
|
Miami-Ft Lauderdale-PompanoBch |
|
FL |
|
|
|
2017 |
|
2002 |
|
|
— |
|
|
|
47 |
|
|
100.0% |
|
|
22.93 |
|
|
Publix |
|
Berkshire Commons |
|
Naples-Marco Island |
|
FL |
|
|
|
1994 |
|
1992 |
|
|
— |
|
|
|
110 |
|
|
100.0% |
|
|
16.18 |
|
|
Publix, Walgreens |
|
Naples Walk |
|
Naples-Marco Island |
|
FL |
|
|
|
2007 |
|
1999 |
|
|
— |
|
|
|
125 |
|
|
96.6% |
|
|
19.57 |
|
|
Publix |
|
Pavillion |
|
Naples-Marco Island |
|
FL |
|
|
|
2017 |
|
2011 |
|
|
— |
|
|
|
168 |
|
|
100.0% |
|
|
24.44 |
|
|
LA Fitness, Paragon Theaters, J. Lee Salon Suites |
|
Shoppes of Pebblebrook Plaza |
|
Naples-Marco Island |
|
FL |
|
50% |
|
2000 |
|
2000 |
|
|
— |
|
|
|
80 |
|
|
97.0% |
|
|
16.70 |
|
|
Publix, (Walgreens) |
|
Glengary Shoppes |
|
North Port-Sarasota-Bradenton |
|
FL |
|
|
|
2017 |
|
1995 |
|
|
— |
|
|
|
93 |
|
|
97.0% |
|
|
20.50 |
|
|
Best Buy, Barnes & Noble |
|
Alafaya Village |
|
Orlando-Kissimmee-Sanford |
|
FL |
|
|
|
2017 |
|
1986 |
|
|
— |
|
|
|
39 |
|
|
100.0% |
|
|
25.80 |
|
|
- |
|
Kirkman Shoppes |
|
Orlando-Kissimmee-Sanford |
|
FL |
|
|
|
2017 |
|
2015 |
|
|
— |
|
|
|
116 |
|
|
100.0% |
|
|
26.68 |
|
|
LA Fitness, Walgreens |
|
Lake Mary Centre |
|
Orlando-Kissimmee-Sanford |
|
FL |
|
|
|
2017 |
|
2015 |
|
|
— |
|
|
|
356 |
|
|
94.8% |
|
|
18.15 |
|
|
The Fresh Market, Academy Sports, Hobby Lobby, LA Fitness, Ross Dress for Less, Office Depot |
|
Plaza Venezia |
|
Orlando-Kissimmee-Sanford |
|
FL |
|
20% |
|
2016 |
|
2000 |
|
|
36,500 |
|
|
|
203 |
|
|
98.0% |
|
|
34.21 |
|
|
Publix, Eddie V's |
|
Town and Country |
|
Orlando-Kissimmee-Sanford |
|
FL |
|
|
|
2017 |
|
1993 |
|
|
— |
|
|
|
78 |
|
|
100.0% |
|
|
11.75 |
|
|
Ross Dress for Less |
|
Unigold Shopping Center |
|
Orlando-Kissimmee-Sanford |
|
FL |
|
|
|
2017 |
|
1987 |
|
|
— |
|
|
|
115 |
|
|
91.2% |
|
|
15.99 |
|
|
YouFit Health Club, Ross Dress for Less |
|
Willa Springs |
|
Orlando-Kissimmee-Sanford |
|
FL |
|
|
|
2000 |
|
2000 |
|
|
16,700 |
|
|
|
90 |
|
|
100.0% |
|
|
24.76 |
|
|
Publix |
|
Cashmere Corners |
|
Port St. Lucie |
|
FL |
|
|
|
2017 |
|
2016 |
|
|
— |
|
|
|
86 |
|
|
100.0% |
|
|
14.82 |
|
|
WalMart |
|
The Plaza at St. Lucie West |
|
Port St. Lucie |
|
FL |
|
|
|
2017 |
|
2006 |
|
|
— |
|
|
|
27 |
|
|
100.0% |
|
|
26.33 |
|
|
- |
|
Charlotte Square |
|
Punta Gorda |
|
FL |
|
|
|
2017 |
|
1980 |
|
|
— |
|
|
|
91 |
|
|
94.1% |
|
|
11.94 |
|
|
WalMart, Buffet City |
|
Ryanwood Square |
|
Sebastian-Vero Beach |
|
FL |
|
|
|
2017 |
|
1987 |
|
|
— |
|
|
|
115 |
|
|
93.3% |
|
|
12.84 |
|
|
Publix, Beall's, Harbor Freight Tools |
|
South Point |
|
Sebastian-Vero Beach |
|
FL |
|
|
|
2017 |
|
2003 |
|
|
— |
|
|
|
65 |
|
|
100.0% |
|
|
16.66 |
|
|
Publix |
|
Treasure Coast Plaza |
|
Sebastian-Vero Beach |
|
FL |
|
|
|
2017 |
|
1983 |
|
|
— |
|
|
|
134 |
|
|
100.0% |
|
|
19.28 |
|
|
Publix, TJ Maxx |
|
Carriage Gate |
|
Tallahassee |
|
FL |
|
|
|
1994 |
|
2013 |
|
|
— |
|
|
|
73 |
|
|
100.0% |
|
|
25.58 |
|
|
Trader Joe's, TJ Maxx |
|
Ocala Corners (6) |
|
Tallahassee |
|
FL |
|
|
|
2000 |
|
2000 |
|
|
— |
|
|
|
93 |
|
|
93.0% |
|
|
14.51 |
|
|
Publix |
|
Bloomingdale Square |
|
Tampa-St Petersburg-Clearwater |
|
FL |
|
|
|
1998 |
|
2021 |
|
|
— |
|
|
|
252 |
|
|
96.9% |
|
|
20.57 |
|
|
Bealls, Dollar Tree, Home Centric, LA Fitness, Publix |
|
Northgate Square |
|
Tampa-St Petersburg-Clearwater |
|
FL |
|
|
|
2007 |
|
1995 |
|
|
— |
|
|
|
75 |
|
|
100.0% |
|
|
16.74 |
|
|
Publix |
|
Regency Square |
|
Tampa-St Petersburg-Clearwater |
|
FL |
|
|
|
1993 |
|
2013 |
|
|
— |
|
|
|
352 |
|
|
98.4% |
|
|
20.68 |
|
|
AMC Theater, Dollar Tree, Five Below, Marshalls, Michael's, PETCO, Shoe Carnival, Staples, TJ Maxx, Ulta, Old Navy, (Best Buy), (Macdill) |
|
Shoppes at Sunlake Centre |
|
Tampa-St Petersburg-Clearwater |
|
FL |
|
|
|
2017 |
|
2008 |
|
|
— |
|
|
|
117 |
|
|
100.0% |
|
|
25.32 |
|
|
Publix |
|
Suncoast Crossing |
|
Tampa-St Petersburg-Clearwater |
|
FL |
|
|
|
2007 |
|
2007 |
|
|
— |
|
|
|
118 |
|
|
98.8% |
|
|
7.34 |
|
|
Kohl's, (Target) |
|
The Village at Hunter's Lake |
|
Tampa-St Petersburg-Clearwater |
|
FL |
|
|
|
2018 |
|
2018 |
|
|
— |
|
|
|
72 |
|
|
100.0% |
|
|
28.47 |
|
|
Sprouts |
|
Town Square |
|
Tampa-St Petersburg-Clearwater |
|
FL |
|
|
|
1997 |
|
1999 |
|
|
— |
|
|
|
44 |
|
|
100.0% |
|
|
35.55 |
|
|
PETCO, Barnes & Noble |
|
Village Center |
|
Tampa-St Petersburg-Clearwater |
|
FL |
|
|
|
1995 |
|
2014 |
|
|
— |
|
|
|
186 |
|
|
100.0% |
|
|
22.80 |
|
|
Publix, PGA Tour Superstore, Walgreens |
|
Westchase |
|
Tampa-St Petersburg-Clearwater |
|
FL |
|
|
|
2007 |
|
1998 |
|
|
— |
|
|
|
79 |
|
|
100.0% |
|
|
17.97 |
|
|
Publix |
|
Ashford Place |
|
Atlanta-SandySprings-Alpharett |
|
GA |
|
|
|
1997 |
|
1993 |
|
|
— |
|
|
|
53 |
|
|
89.3% |
|
|
26.57 |
|
|
Harbor Freight Tools |
|
Briarcliff La Vista |
|
Atlanta-SandySprings-Alpharett |
|
GA |
|
|
|
1997 |
|
1962 |
|
|
— |
|
|
|
43 |
|
|
100.0% |
|
|
22.64 |
|
|
Michael's |
|
Briarcliff Village |
|
Atlanta-SandySprings-Alpharett |
|
GA |
|
|
|
1997 |
|
1990 |
|
|
— |
|
|
|
189 |
|
|
100.0% |
|
|
17.51 |
|
|
Burlington, Party City, Publix, Shoe Carnival, TJ Maxx |
|
Bridgemill Market |
|
Atlanta-SandySprings-Alpharett |
|
GA |
|
|
|
2017 |
|
2000 |
|
|
— |
|
|
|
89 |
|
|
96.3% |
|
|
19.02 |
|
|
Publix |
|
Brighten Park |
|
Atlanta-SandySprings-Alpharett |
|
GA |
|
|
|
1997 |
|
2016 |
|
|
— |
|
|
|
137 |
|
|
97.1% |
|
|
28.81 |
|
|
Lidl, Big Blue Swim School, Kohl's |
|
Buckhead Court |
|
Atlanta-SandySprings-Alpharett |
|
GA |
|
|
|
1997 |
|
1984 |
|
|
— |
|
|
|
49 |
|
|
93.8% |
|
|
32.18 |
|
|
- |
|
Buckhead Landing |
|
Atlanta-SandySprings-Alpharett |
|
GA |
|
|
|
2017 |
|
1998 |
|
|
— |
|
|
|
152 |
|
|
81.7% |
|
|
32.88 |
|
|
Binders Art Supplies & Frames, Publix |
|
Buckhead Station |
|
Atlanta-SandySprings-Alpharett |
|
GA |
|
|
|
2017 |
|
1996 |
|
|
— |
|
|
|
234 |
|
|
82.9% |
|
|
26.80 |
|
|
Cost Plus World Market, DSW Warehouse, Nordstrom Rack, Old Navy, Saks Off 5th, TJ Maxx, Ulta |
33
|
Property Name |
|
CBSA (1) |
|
State |
|
Owner-
|
|
Year
|
|
Year
|
|
Mortgages or
|
|
|
Gross
|
|
|
Percent
|
|
Average
|
|
|
Major Tenant(s) (5) |
|||
|
Cambridge Square |
|
Atlanta-SandySprings-Alpharett |
|
GA |
|
|
|
1996 |
|
1979 |
|
|
— |
|
|
|
70 |
|
|
97.2% |
|
|
24.98 |
|
|
Publix |
|
Chastain Square |
|
Atlanta-SandySprings-Alpharett |
|
GA |
|
|
|
2017 |
|
2001 |
|
|
— |
|
|
|
92 |
|
|
100.0% |
|
|
24.11 |
|
|
Publix |
|
Cornerstone Square |
|
Atlanta-SandySprings-Alpharett |
|
GA |
|
|
|
1997 |
|
1990 |
|
|
— |
|
|
|
80 |
|
|
100.0% |
|
|
19.24 |
|
|
Aldi, Barking Hound Village, CVS, HealthMarkets Insurance |
|
Dunwoody Hall |
|
Atlanta-SandySprings-Alpharett |
|
GA |
|
|
|
1997 |
|
1986 |
|
|
13,800 |
|
|
|
86 |
|
|
100.0% |
|
|
21.71 |
|
|
Publix |
|
Dunwoody Village |
|
Atlanta-SandySprings-Alpharett |
|
GA |
|
|
|
1997 |
|
1975 |
|
|
— |
|
|
|
121 |
|
|
89.4% |
|
|
22.27 |
|
|
The Fresh Market, Walgreens, Dunwoody Prep |
|
Howell Mill Village |
|
Atlanta-SandySprings-Alpharett |
|
GA |
|
|
|
2004 |
|
1984 |
|
|
— |
|
|
|
92 |
|
|
97.6% |
|
|
25.42 |
|
|
Publix |
|
Paces Ferry Plaza |
|
Atlanta-SandySprings-Alpharett |
|
GA |
|
|
|
1997 |
|
2018 |
|
|
— |
|
|
|
82 |
|
|
97.0% |
|
|
42.09 |
|
|
Whole Foods |
|
Powers Ferry Square |
|
Atlanta-SandySprings-Alpharett |
|
GA |
|
|
|
1997 |
|
2013 |
|
|
— |
|
|
|
97 |
|
|
100.0% |
|
|
36.45 |
|
|
HomeGoods, PETCO |
|
Powers Ferry Village |
|
Atlanta-SandySprings-Alpharett |
|
GA |
|
|
|
1997 |
|
1994 |
|
|
— |
|
|
|
69 |
|
|
98.3% |
|
|
10.25 |
|
|
Publix, Barrel Town |
|
Russell Ridge |
|
Atlanta-SandySprings-Alpharett |
|
GA |
|
|
|
1994 |
|
1995 |
|
|
— |
|
|
|
108 |
|
|
91.4% |
|
|
12.98 |
|
|
Kroger |
|
Sandy Springs |
|
Atlanta-SandySprings-Alpharett |
|
GA |
|
|
|
2012 |
|
2006 |
|
|
— |
|
|
|
113 |
|
|
100.0% |
|
|
27.21 |
|
|
Trader Joe's, Fox's, Peter Glenn Ski & Sports |
|
Sope Creek Crossing |
|
Atlanta-SandySprings-Alpharett |
|
GA |
|
|
|
1998 |
|
2016 |
|
|
— |
|
|
|
99 |
|
|
95.5% |
|
|
17.06 |
|
|
Publix |
|
The Shops at Hampton Oaks |
|
Atlanta-SandySprings-Alpharett |
|
GA |
|
|
|
2017 |
|
2009 |
|
|
— |
|
|
|
21 |
|
|
89.8% |
|
|
12.30 |
|
|
(CVS) |
|
Williamsburg at Dunwoody |
|
Atlanta-SandySprings-Alpharett |
|
GA |
|
|
|
2017 |
|
1983 |
|
|
— |
|
|
|
45 |
|
|
95.6% |
|
|
25.72 |
|
|
- |
|
Civic Center Plaza |
|
Chicago-Naperville-Elgin |
|
IL |
|
40% |
|
2005 |
|
1989 |
|
|
22,000 |
|
|
|
265 |
|
|
96.6% |
|
|
10.78 |
|
|
Super H Mart, Home Depot, O'Reilly Automotive, King Spa |
|
Clybourn Commons |
|
Chicago-Naperville-Elgin |
|
IL |
|
|
|
2014 |
|
1999 |
|
|
— |
|
|
|
32 |
|
|
100.0% |
|
|
37.82 |
|
|
PETCO |
|
Glen Oak Plaza |
|
Chicago-Naperville-Elgin |
|
IL |
|
|
|
2010 |
|
1967 |
|
|
— |
|
|
|
63 |
|
|
96.2% |
|
|
27.83 |
|
|
Trader Joe's, Walgreens, Northshore University Healthsystems |
|
Hinsdale Lake Commons |
|
Chicago-Naperville-Elgin |
|
IL |
|
|
|
1998 |
|
2015 |
|
|
— |
|
|
|
185 |
|
|
94.3% |
|
|
16.68 |
|
|
Whole Foods, Goodwill, Charter Fitness, Petco |
|
Mellody Farm |
|
Chicago-Naperville-Elgin |
|
IL |
|
|
|
2017 |
|
2017 |
|
|
— |
|
|
|
259 |
|
|
97.1% |
|
|
31.25 |
|
|
Whole Foods, Nordstrom Rack, REI, HomeGoods, Barnes & Noble, West Elm |
|
Naperville Plaza |
|
Chicago-Naperville-Elgin |
|
IL |
|
20% |
|
2023 |
|
1961 |
|
|
23,000 |
|
|
|
115 |
|
|
100.0% |
|
|
26.91 |
|
|
Casey's Foods, Trader Joe's, Oswald's Pharmacy |
|
Old Town Square |
|
Chicago-Naperville-Elgin |
|
IL |
|
20% |
|
2023 |
|
1998 |
|
|
14,000 |
|
|
|
87 |
|
|
97.5% |
|
|
27.10 |
|
|
Jewel-Osco |
|
Riverside Sq & River's Edge |
|
Chicago-Naperville-Elgin |
|
IL |
|
40% |
|
2005 |
|
1986 |
|
|
— |
|
|
|
169 |
|
|
100.0% |
|
|
18.66 |
|
|
Mariano's Fresh Market, Dollar Tree, Party City, Blink Fitness |
|
Roscoe Square |
|
Chicago-Naperville-Elgin |
|
IL |
|
40% |
|
2005 |
|
2012 |
|
|
24,500 |
|
|
|
140 |
|
|
100.0% |
|
|
24.78 |
|
|
Mariano's Fresh Market, Walgreens, Altitude Trampoline Park |
|
Westchester Commons |
|
Chicago-Naperville-Elgin |
|
IL |
|
|
|
2001 |
|
2014 |
|
|
— |
|
|
|
143 |
|
|
93.1% |
|
|
18.28 |
|
|
Mariano's Fresh Market, Goodwill |
|
Willow Festival |
|
Chicago-Naperville-Elgin |
|
IL |
|
|
|
2010 |
|
2007 |
|
|
— |
|
|
|
404 |
|
|
91.7% |
|
|
19.23 |
|
|
Whole Foods, Lowe's, CVS, HomeGoods, REI, Ulta |
|
Shops on Main |
|
Chicago-Naperville-Elgin |
|
IN |
|
94% |
|
2007 |
|
2020 |
|
|
— |
|
|
|
279 |
|
|
100.0% |
|
|
16.54 |
|
|
Whole Foods, Dick's Sporting Goods, Ross Dress for Less, HomeGoods, DSW, Nordstrom Rack, Marshalls |
|
Willow Lake Shopping Center |
|
Indianapolis-Carmel-Anderson |
|
IN |
|
40% |
|
2005 |
|
1987 |
|
|
— |
|
|
|
86 |
|
|
88.6% |
|
|
17.44 |
|
|
Indiana Bureau of Motor Vehicles, Snipes USA, (Kroger) |
|
Willow Lake West Shopping Center |
|
Indianapolis-Carmel-Anderson |
|
IN |
|
40% |
|
2005 |
|
2001 |
|
|
10,000 |
|
|
|
53 |
|
|
100.0% |
|
|
28.23 |
|
|
Trader Joe's |
|
Fellsway Plaza |
|
Boston-Cambridge-Newton |
|
MA |
|
75% |
|
2013 |
|
2016 |
|
|
34,873 |
|
|
|
158 |
|
|
100.0% |
|
|
27.34 |
|
|
Stop & Shop, Planet Fitness, BioLife Plasma Services |
|
Shaw's at Plymouth |
|
Boston-Cambridge-Newton |
|
MA |
|
|
|
2017 |
|
1993 |
|
|
— |
|
|
|
60 |
|
|
100.0% |
|
|
19.34 |
|
|
Shaw's |
|
Shops at Saugus |
|
Boston-Cambridge-Newton |
|
MA |
|
|
|
2006 |
|
2006 |
|
|
— |
|
|
|
87 |
|
|
100.0% |
|
|
31.64 |
|
|
Trader Joe's, La-Z-Boy, PetSmart |
|
Star's at Cambridge |
|
Boston-Cambridge-Newton |
|
MA |
|
|
|
2017 |
|
1997 |
|
|
— |
|
|
|
66 |
|
|
100.0% |
|
|
41.18 |
|
|
Star Market |
|
Star's at Quincy |
|
Boston-Cambridge-Newton |
|
MA |
|
|
|
2017 |
|
1995 |
|
|
— |
|
|
|
101 |
|
|
100.0% |
|
|
23.63 |
|
|
Star Market |
|
Star's at West Roxbury |
|
Boston-Cambridge-Newton |
|
MA |
|
|
|
2017 |
|
2006 |
|
|
— |
|
|
|
76 |
|
|
100.0% |
|
|
27.61 |
|
|
Shaw's |
|
The Abbot |
|
Boston-Cambridge-Newton |
|
MA |
|
|
|
2017 |
|
1912 |
|
|
— |
|
|
|
64 |
|
|
77.1% |
|
|
94.03 |
|
|
Center for Effective Alturism |
|
Twin City Plaza |
|
Boston-Cambridge-Newton |
|
MA |
|
|
|
2006 |
|
2004 |
|
|
— |
|
|
|
285 |
|
|
100.0% |
|
|
22.43 |
|
|
Shaw's, Marshall's, Extra Space Storage, Walgreens, K&G Fashion, Dollar Tree, Everfitness, Formlabs |
|
The Longmeadow Shops |
|
Springfield, MA |
|
MA |
|
|
|
2023 |
|
1962 |
|
|
13,000 |
|
|
|
99 |
|
|
100.0% |
|
|
32.16 |
|
|
CVS |
34
|
Property Name |
|
CBSA (1) |
|
State |
|
Owner-
|
|
Year
|
|
Year
|
|
Mortgages or
|
|
|
Gross
|
|
|
Percent
|
|
Average
|
|
|
Major Tenant(s) (5) |
|||
|
Festival at Woodholme |
|
Baltimore-Columbia-Towson |
|
MD |
|
40% |
|
2005 |
|
1986 |
|
|
18,510 |
|
|
|
81 |
|
|
95.1% |
|
|
40.40 |
|
|
Trader Joe's |
|
Parkville Shopping Center |
|
Baltimore-Columbia-Towson |
|
MD |
|
40% |
|
2005 |
|
2013 |
|
|
23,200 |
|
|
|
165 |
|
|
96.6% |
|
|
17.61 |
|
|
Giant, Parkville Lanes, Dollar Tree, Petco, The Cellar Parkville |
|
Southside Marketplace |
|
Baltimore-Columbia-Towson |
|
MD |
|
40% |
|
2005 |
|
2011 |
|
|
24,800 |
|
|
|
125 |
|
|
93.5% |
|
|
24.51 |
|
|
Giant |
|
Village at Lee Airpark |
|
Baltimore-Columbia-Towson |
|
MD |
|
|
|
2005 |
|
2014 |
|
|
— |
|
|
|
118 |
|
|
97.8% |
|
|
31.38 |
|
|
Giant, (Sunrise) |
|
Burnt Mills |
|
Washington-Arlington-Alexandri |
|
MD |
|
20% |
|
2013 |
|
2004 |
|
|
— |
|
|
|
31 |
|
|
92.3% |
|
|
38.58 |
|
|
Trader Joe's |
|
Cloppers Mill Village |
|
Washington-Arlington-Alexandri |
|
MD |
|
40% |
|
2005 |
|
1995 |
|
|
— |
|
|
|
137 |
|
|
94.7% |
|
|
19.48 |
|
|
Shoppers Food Warehouse, Dollar Tree |
|
Firstfield Shopping Center |
|
Washington-Arlington-Alexandri |
|
MD |
|
40% |
|
2005 |
|
2014 |
|
|
— |
|
|
|
22 |
|
|
100.0% |
|
|
44.25 |
|
|
- |
|
Takoma Park |
|
Washington-Arlington-Alexandri |
|
MD |
|
40% |
|
2005 |
|
1960 |
|
|
— |
|
|
|
107 |
|
|
97.4% |
|
|
15.05 |
|
|
Planet Fitness |
|
Watkins Park Plaza |
|
Washington-Arlington-Alexandri |
|
MD |
|
40% |
|
2005 |
|
1985 |
|
|
— |
|
|
|
111 |
|
|
98.5% |
|
|
29.47 |
|
|
LA Fitness, CVS |
|
Westbard Square |
|
Washington-Arlington-Alexandri |
|
MD |
|
|
|
2017 |
|
2001 |
|
|
— |
|
|
|
126 |
|
|
82.5% |
|
|
36.56 |
|
|
Giant, Bowlmor AMF |
|
Woodmoor Shopping Center |
|
Washington-Arlington-Alexandri |
|
MD |
|
40% |
|
2005 |
|
1954 |
|
|
19,000 |
|
|
|
68 |
|
|
96.3% |
|
|
37.93 |
|
|
CVS |
|
Fenton Marketplace |
|
Flint |
|
MI |
|
|
|
1999 |
|
1999 |
|
|
— |
|
|
|
97 |
|
|
74.0% |
|
|
9.14 |
|
|
Family Farm & Home |
|
Apple Valley Square |
|
Minneapol-St. Paul-Bloomington |
|
MN |
|
|
|
2006 |
|
1998 |
|
|
— |
|
|
|
179 |
|
|
100.0% |
|
|
17.01 |
|
|
Jo-Ann Fabrics, PETCO, Savers, Experience Fitness, (Burlington Coat Factory), (Aldi) |
|
Cedar Commons |
|
Minneapol-St. Paul-Bloomington |
|
MN |
|
|
|
2011 |
|
1999 |
|
|
— |
|
|
|
66 |
|
|
100.0% |
|
|
28.59 |
|
|
Whole Foods |
|
Colonial Square |
|
Minneapol-St. Paul-Bloomington |
|
MN |
|
40% |
|
2005 |
|
2014 |
|
|
19,700 |
|
|
|
93 |
|
|
97.9% |
|
|
27.54 |
|
|
Lund's |
|
Rockford Road Plaza |
|
Minneapol-St. Paul-Bloomington |
|
MN |
|
40% |
|
2005 |
|
1991 |
|
|
20,000 |
|
|
|
204 |
|
|
99.4% |
|
|
14.27 |
|
|
Kohl's, PetSmart, HomeGoods, TJ Maxx, ULTA |
|
Rockridge Center |
|
Minneapol-St. Paul-Bloomington |
|
MN |
|
20% |
|
2011 |
|
2006 |
|
|
14,500 |
|
|
|
125 |
|
|
98.2% |
|
|
14.71 |
|
|
CUB Foods |
|
Brentwood Plaza |
|
St. Louis |
|
MO |
|
|
|
2007 |
|
2002 |
|
|
— |
|
|
|
60 |
|
|
92.6% |
|
|
10.38 |
|
|
Schnucks |
|
Bridgeton |
|
St. Louis |
|
MO |
|
|
|
2007 |
|
2005 |
|
|
— |
|
|
|
71 |
|
|
100.0% |
|
|
12.87 |
|
|
Schnucks, (Home Depot) |
|
Dardenne Crossing |
|
St. Louis |
|
MO |
|
|
|
2007 |
|
1996 |
|
|
— |
|
|
|
67 |
|
|
100.0% |
|
|
11.72 |
|
|
Schnucks |
|
Kirkwood Commons |
|
St. Louis |
|
MO |
|
|
|
2007 |
|
2000 |
|
|
— |
|
|
|
210 |
|
|
100.0% |
|
|
10.39 |
|
|
Walmart, TJ Maxx, HomeGoods, Famous Footwear, (Target), (Lowe's) |
|
Blakeney Town Center |
|
Charlotte-Concord-Gastonia |
|
NC |
|
|
|
2021 |
|
2006 |
|
|
— |
|
|
|
384 |
|
|
99.7% |
|
|
27.08 |
|
|
Harris Teeter, Marshalls, Best Buy, Petsmart, Off Broadway Shoes, Old Navy, (Target) |
|
Carmel Commons |
|
Charlotte-Concord-Gastonia |
|
NC |
|
|
|
1997 |
|
2012 |
|
|
— |
|
|
|
141 |
|
|
89.4% |
|
|
25.09 |
|
|
Chuck E. Cheese, The Fresh Market, Party City |
|
Cochran Commons |
|
Charlotte-Concord-Gastonia |
|
NC |
|
20% |
|
2007 |
|
2003 |
|
|
2,975 |
|
|
|
66 |
|
|
100.0% |
|
|
17.91 |
|
|
Harris Teeter, (Walgreens) |
|
Willow Oaks |
|
Charlotte-Concord-Gastonia |
|
NC |
|
|
|
2014 |
|
2014 |
|
|
— |
|
|
|
65 |
|
|
97.9% |
|
|
17.89 |
|
|
Publix |
|
Shops at Erwin Mill |
|
Durham-Chapel Hill |
|
NC |
|
55% |
|
2012 |
|
2012 |
|
|
10,000 |
|
|
|
91 |
|
|
100.0% |
|
|
20.47 |
|
|
Harris Teeter |
|
Southpoint Crossing |
|
Durham-Chapel Hill |
|
NC |
|
|
|
1998 |
|
1998 |
|
|
— |
|
|
|
103 |
|
|
100.0% |
|
|
17.42 |
|
|
Harris Teeter |
|
Village Plaza |
|
Durham-Chapel Hill |
|
NC |
|
20% |
|
2012 |
|
2020 |
|
|
11,793 |
|
|
|
73 |
|
|
100.0% |
|
|
25.22 |
|
|
Whole Foods |
|
Woodcroft Shopping Center |
|
Durham-Chapel Hill |
|
NC |
|
|
|
1996 |
|
1984 |
|
|
— |
|
|
|
90 |
|
|
95.4% |
|
|
14.52 |
|
|
Food Lion, ACE Hardware |
|
Glenwood Village |
|
Raleigh-Cary |
|
NC |
|
|
|
1997 |
|
1983 |
|
|
— |
|
|
|
43 |
|
|
100.0% |
|
|
18.71 |
|
|
Harris Teeter |
|
Holly Park |
|
Raleigh-Cary |
|
NC |
|
|
|
2013 |
|
1969 |
|
|
— |
|
|
|
158 |
|
|
99.0% |
|
|
20.54 |
|
|
DSW Warehouse, Trader Joe's, Ross Dress For Less, Staples, US Fitness Products, Jerry's Artarama, Pet Supplies Plus, Ulta |
|
Lake Pine Plaza |
|
Raleigh-Cary |
|
NC |
|
|
|
1998 |
|
1997 |
|
|
— |
|
|
|
88 |
|
|
100.0% |
|
|
14.55 |
|
|
Harris Teeter |
|
Market at Colonnade Center |
|
Raleigh-Cary |
|
NC |
|
|
|
2009 |
|
2009 |
|
|
— |
|
|
|
58 |
|
|
100.0% |
|
|
28.83 |
|
|
Whole Foods |
|
Midtown East |
|
Raleigh-Cary |
|
NC |
|
50% |
|
2017 |
|
2017 |
|
|
36,000 |
|
|
|
159 |
|
|
100.0% |
|
|
24.51 |
|
|
Wegmans |
|
Ridgewood Shopping Center |
|
Raleigh-Cary |
|
NC |
|
20% |
|
2018 |
|
1951 |
|
|
9,025 |
|
|
|
94 |
|
|
89.9% |
|
|
28.41 |
|
|
Whole Foods, Walgreens |
|
Shoppes of Kildaire |
|
Raleigh-Cary |
|
NC |
|
40% |
|
2005 |
|
1986 |
|
|
20,000 |
|
|
|
145 |
|
|
100.0% |
|
|
21.28 |
|
|
Trader Joe's, Aldi, Staples, Barnes & Noble |
|
Sutton Square |
|
Raleigh-Cary |
|
NC |
|
20% |
|
2006 |
|
1985 |
|
|
— |
|
|
|
101 |
|
|
93.8% |
|
|
21.21 |
|
|
The Fresh Market |
35
|
Property Name |
|
CBSA (1) |
|
State |
|
Owner-
|
|
Year
|
|
Year
|
|
Mortgages or
|
|
|
Gross
|
|
|
Percent
|
|
Average
|
|
|
Major Tenant(s) (5) |
|||
|
Village District |
|
Raleigh-Cary |
|
NC |
|
30% |
|
2004 |
|
2018 |
|
|
75,000 |
|
|
|
599 |
|
|
98.3% |
|
|
25.47 |
|
|
Harris Teeter, The Fresh Market, The Oberlin, Wake Public Library, Walgreens, Talbots, Great Outdoor Provision Co., York Properties,The Cheshire Cat Gallery, Crunch Fitness Select Club, Bailey's Fine Jewelry, Sephora, Barnes & Noble, Goodnight's Comedy Club, Ballard Designs |
|
Bloomfield Crossing |
|
New York-Newark-Jersey City |
|
NJ |
|
|
|
2023 |
|
0 |
|
|
— |
|
|
|
59 |
|
|
100.0% |
|
|
15.17 |
|
|
Superfresh |
|
Boonton ACME Shopping Center |
|
New York-Newark-Jersey City |
|
NJ |
|
|
|
2023 |
|
1999 |
|
|
10,585 |
|
|
|
63 |
|
|
97.1% |
|
|
24.19 |
|
|
Acme Markets |
|
Cedar Hill Shopping Center |
|
New York-Newark-Jersey City |
|
NJ |
|
|
|
2023 |
|
1971 |
|
|
7,035 |
|
|
|
43 |
|
|
100.0% |
|
|
30.72 |
|
|
Walgreens |
|
Chestnut Ridge Shopping Center |
|
New York-Newark-Jersey City |
|
NJ |
|
50% |
|
2023 |
|
1965 |
|
|
— |
|
|
|
76 |
|
|
94.2% |
|
|
30.43 |
|
|
Fresh Market, Drop Fitness |
|
Chimney Rock |
|
New York-Newark-Jersey City |
|
NJ |
|
|
|
2016 |
|
2016 |
|
|
— |
|
|
|
218 |
|
|
91.9% |
|
|
39.18 |
|
|
Whole Foods, Nordstrom Rack, Saks Off 5th, The Container Store, Ulta |
|
District at Metuchen |
|
New York-Newark-Jersey City |
|
NJ |
|
20% |
|
2018 |
|
2017 |
|
|
16,000 |
|
|
|
67 |
|
|
100.0% |
|
|
32.89 |
|
|
Whole Foods |
|
Emerson Plaza |
|
New York-Newark-Jersey City |
|
NJ |
|
|
|
2023 |
|
1981 |
|
|
— |
|
|
|
93 |
|
|
84.9% |
|
|
14.14 |
|
|
Shoprite, K-9 Resorts Luxury Pet Hotel |
|
Ferry Street Plaza |
|
New York-Newark-Jersey City |
|
NJ |
|
|
|
2023 |
|
1995 |
|
|
8,796 |
|
|
|
108 |
|
|
100.0% |
|
|
21.49 |
|
|
Seabra Foods, Flaming Grill |
|
H Mart Plaza |
|
New York-Newark-Jersey City |
|
NJ |
|
|
|
2023 |
|
1967 |
|
|
— |
|
|
|
7 |
|
|
100.0% |
|
|
46.32 |
|
|
- |
|
Meadtown Shopping Center |
|
New York-Newark-Jersey City |
|
NJ |
|
|
|
2023 |
|
1961 |
|
|
9,364 |
|
|
|
77 |
|
|
100.0% |
|
|
25.09 |
|
|
Marshalls, Petco, Walgreens |
|
Midland Park Shopping Center |
|
New York-Newark-Jersey City |
|
NJ |
|
|
|
2023 |
|
1966 |
|
|
17,722 |
|
|
|
129 |
|
|
81.5% |
|
|
25.21 |
|
|
Kings Food Markets, Crunch Fitness |
|
Plaza Square |
|
New York-Newark-Jersey City |
|
NJ |
|
40% |
|
2005 |
|
1990 |
|
|
— |
|
|
|
104 |
|
|
62.0% |
|
|
19.91 |
|
|
Grocer |
|
Pompton Lakes Towne Square |
|
New York-Newark-Jersey City |
|
NJ |
|
|
|
2023 |
|
2000 |
|
|
— |
|
|
|
66 |
|
|
92.8% |
|
|
25.82 |
|
|
Planet Fitness |
|
Rite Aid Plaza-Waldwick Plaza |
|
New York-Newark-Jersey City |
|
NJ |
|
|
|
2023 |
|
1953 |
|
|
— |
|
|
|
20 |
|
|
100.0% |
|
|
30.42 |
|
|
Rite Aid |
|
South Pass Village |
|
New York-Newark-Jersey City |
|
NJ |
|
|
|
2023 |
|
1965 |
|
|
20,144 |
|
|
|
109 |
|
|
97.0% |
|
|
30.18 |
|
|
Acme Markets |
|
Valley Ridge Shopping Center |
|
New York-Newark-Jersey City |
|
NJ |
|
|
|
2023 |
|
1962 |
|
|
16,775 |
|
|
|
103 |
|
|
93.4% |
|
|
28.44 |
|
|
Whole Foods |
|
Van Houten Plaza |
|
New York-Newark-Jersey City |
|
NJ |
|
|
|
2023 |
|
1974 |
|
|
— |
|
|
|
37 |
|
|
91.4% |
|
|
11.70 |
|
|
Dollar Tree |
|
Waldwick Plaza |
|
New York-Newark-Jersey City |
|
NJ |
|
|
|
2023 |
|
1960 |
|
|
— |
|
|
|
27 |
|
|
90.3% |
|
|
28.06 |
|
|
- |
|
Washington Commons |
|
New York-Newark-Jersey City |
|
NJ |
|
100% |
|
2023 |
|
1992 |
|
|
8,766 |
|
|
|
74 |
|
|
99.1% |
|
|
25.95 |
|
|
Stop & Shop |
|
Glenwood Green (7) |
|
Philadelphia-Camden-Wilmington |
|
NJ |
|
70% |
|
2023 |
|
2023 |
|
|
— |
|
|
|
353 |
|
|
92.4% |
|
|
15.25 |
|
|
ShopRite, Target, Rendina |
|
Haddon Commons |
|
Philadelphia-Camden-Wilmington |
|
NJ |
|
40% |
|
2005 |
|
1985 |
|
|
— |
|
|
|
54 |
|
|
100.0% |
|
|
15.24 |
|
|
Acme Markets |
|
101 7th Avenue |
|
New York-Newark-Jersey City |
|
NY |
|
|
|
2017 |
|
1930 |
|
|
— |
|
|
|
57 |
|
|
0.0% |
|
|
- |
|
|
- |
|
111 Kraft Avenue |
|
New York-Newark-Jersey City |
|
NY |
|
|
|
2023 |
|
1902 |
|
|
— |
|
|
|
9 |
|
|
100.0% |
|
|
47.40 |
|
|
- |
|
1175 Third Avenue |
|
New York-Newark-Jersey City |
|
NY |
|
|
|
2017 |
|
1995 |
|
|
— |
|
|
|
25 |
|
|
35.9% |
|
|
185.00 |
|
|
- |
|
1225-1239 Second Ave |
|
New York-Newark-Jersey City |
|
NY |
|
|
|
2017 |
|
1987 |
|
|
— |
|
|
|
18 |
|
|
100.0% |
|
|
137.95 |
|
|
CVS |
|
260-270 Sawmill Road |
|
New York-Newark-Jersey City |
|
NY |
|
|
|
2023 |
|
1953 |
|
|
— |
|
|
|
3 |
|
|
100.0% |
|
|
1.69 |
|
|
- |
|
27 Purchase Street |
|
New York-Newark-Jersey City |
|
NY |
|
|
|
2023 |
|
0 |
|
|
— |
|
|
|
10 |
|
|
82.6% |
|
|
40.30 |
|
|
- |
|
410 South Broadway |
|
New York-Newark-Jersey City |
|
NY |
|
|
|
2023 |
|
1936 |
|
|
— |
|
|
|
7 |
|
|
100.0% |
|
|
1.21 |
|
|
- |
|
48 Purchase Street |
|
New York-Newark-Jersey City |
|
NY |
|
|
|
2023 |
|
0 |
|
|
— |
|
|
|
6 |
|
|
100.0% |
|
|
78.05 |
|
|
- |
|
90 - 30 Metropolitan Avenue |
|
New York-Newark-Jersey City |
|
NY |
|
|
|
2017 |
|
2007 |
|
|
— |
|
|
|
60 |
|
|
100.0% |
|
|
36.15 |
|
|
Michaels, Staples, Trader Joe's |
|
Arcadian Shopping Center |
|
New York-Newark-Jersey City |
|
NY |
|
|
|
2023 |
|
1978 |
|
|
13,033 |
|
|
|
166 |
|
|
97.9% |
|
|
23.90 |
|
|
Stop & Shop, Westchester Community College, The 19th Hole |
|
Biltmore Shopping Center |
|
New York-Newark-Jersey City |
|
NY |
|
|
|
2023 |
|
1967 |
|
|
— |
|
|
|
17 |
|
|
100.0% |
|
|
38.93 |
|
|
- |
|
Broadway Plaza |
|
New York-Newark-Jersey City |
|
NY |
|
|
|
2017 |
|
2014 |
|
|
— |
|
|
|
147 |
|
|
88.5% |
|
|
40.28 |
|
|
Aldi, Best Buy, Bob's Discount Furniture, TJ Maxx, Blink Fitness |
|
Carmel ShopRite Plaza |
|
New York-Newark-Jersey City |
|
NY |
|
|
|
2023 |
|
1981 |
|
|
— |
|
|
|
145 |
|
|
95.1% |
|
|
14.06 |
|
|
Shoprite, Carmel Cinema, Gold's Gyn, Rite Aid |
|
Chilmark Shopping Center |
|
New York-Newark-Jersey City |
|
NY |
|
|
|
2023 |
|
1963 |
|
|
— |
|
|
|
47 |
|
|
100.0% |
|
|
34.28 |
|
|
CVS |
|
Clocktower Plaza Shopping Ctr |
|
New York-Newark-Jersey City |
|
NY |
|
|
|
2017 |
|
1995 |
|
|
— |
|
|
|
79 |
|
|
90.4% |
|
|
50.88 |
|
|
Stop & Shop |
|
DeCicco's Plaza |
|
New York-Newark-Jersey City |
|
NY |
|
|
|
2023 |
|
1978 |
|
|
— |
|
|
|
70 |
|
|
91.8% |
|
|
35.70 |
|
|
Decicco & Sons |
|
East Meadow |
|
New York-Newark-Jersey City |
|
NY |
|
|
|
2021 |
|
1980 |
|
|
— |
|
|
|
141 |
|
|
93.3% |
|
|
16.10 |
|
|
Marshalls, Stew Leonard's, Net Cost Market |
36
|
Property Name |
|
CBSA (1) |
|
State |
|
Owner-
|
|
Year
|
|
Year
|
|
Mortgages or
|
|
|
Gross
|
|
|
Percent
|
|
Average
|
|
|
Major Tenant(s) (5) |
|||
|
East Meadow Plaza |
|
New York-Newark-Jersey City |
|
NY |
|
|
|
2023 |
|
1971 |
|
|
— |
|
|
|
195 |
|
|
60.6% |
|
|
25.61 |
|
|
Lidl, Dollar Deal |
|
Eastchester Plaza |
|
New York-Newark-Jersey City |
|
NY |
|
|
|
2023 |
|
1963 |
|
|
— |
|
|
|
24 |
|
|
100.0% |
|
|
36.54 |
|
|
CVS |
|
Eastport |
|
New York-Newark-Jersey City |
|
NY |
|
|
|
2021 |
|
1980 |
|
|
— |
|
|
|
48 |
|
|
97.3% |
|
|
13.57 |
|
|
King Kullen, Rite Aid |
|
Gateway Plaza |
|
New York-Newark-Jersey City |
|
NY |
|
50% |
|
2023 |
|
0 |
|
|
14,000 |
|
|
|
198 |
|
|
100.0% |
|
|
9.46 |
|
|
Walmart, Bob's Discount Furniture |
|
Harrison Shopping Square |
|
New York-Newark-Jersey City |
|
NY |
|
|
|
2023 |
|
1958 |
|
|
— |
|
|
|
26 |
|
|
100.0% |
|
|
33.40 |
|
|
The Harrison Market |
|
Heritage 202 Center |
|
New York-Newark-Jersey City |
|
NY |
|
|
|
2023 |
|
1989 |
|
|
— |
|
|
|
19 |
|
|
100.0% |
|
|
33.99 |
|
|
- |
|
Hewlett Crossing I & II |
|
New York-Newark-Jersey City |
|
NY |
|
|
|
2018 |
|
1954 |
|
|
— |
|
|
|
52 |
|
|
100.0% |
|
|
39.41 |
|
|
- |
|
Lake Grove Commons |
|
New York-Newark-Jersey City |
|
NY |
|
40% |
|
2012 |
|
2008 |
|
|
49,895 |
|
|
|
141 |
|
|
100.0% |
|
|
37.08 |
|
|
Whole Foods, LA Fitness |
|
Lakeview Shopping Center |
|
New York-Newark-Jersey City |
|
NY |
|
|
|
2023 |
|
1981 |
|
|
10,944 |
|
|
|
165 |
|
|
92.6% |
|
|
18.20 |
|
|
Acme, Planet Fitness, Montclare Children's School, Rite Aid |
|
McLean Plaza |
|
New York-Newark-Jersey City |
|
NY |
|
100% |
|
2023 |
|
1982 |
|
|
5,000 |
|
|
|
58 |
|
|
86.9% |
|
|
19.23 |
|
|
Acme Markets |
|
Midway Shopping Center |
|
New York-Newark-Jersey City |
|
NY |
|
12% |
|
2023 |
|
1958 |
|
|
22,492 |
|
|
|
244 |
|
|
99.2% |
|
|
28.95 |
|
|
Shoprite, JoAnn, Amazing Savings, Daiso, CVS, Planet Fitness, Denny's Kids |
|
New City PCSB Bank Pad |
|
New York-Newark-Jersey City |
|
NY |
|
|
|
2023 |
|
1973 |
|
|
— |
|
|
|
3 |
|
|
100.0% |
|
|
53.28 |
|
|
- |
|
Orangetown Shopping Center |
|
New York-Newark-Jersey City |
|
NY |
|
100% |
|
2023 |
|
1966 |
|
|
6,005 |
|
|
|
74 |
|
|
95.4% |
|
|
22.01 |
|
|
CVS |
|
Pelham Manor Plaza |
|
New York-Newark-Jersey City |
|
NY |
|
|
|
2023 |
|
1960 |
|
|
— |
|
|
|
25 |
|
|
87.7% |
|
|
35.28 |
|
|
Manor Market |
|
Purchase Street Shops |
|
New York-Newark-Jersey City |
|
NY |
|
|
|
2023 |
|
0 |
|
|
— |
|
|
|
6 |
|
|
100.0% |
|
|
33.82 |
|
|
- |
|
Putnam Plaza |
|
New York-Newark-Jersey City |
|
NY |
|
67% |
|
2023 |
|
1971 |
|
|
17,284 |
|
|
|
189 |
|
|
92.9% |
|
|
16.16 |
|
|
Tops, NY Sports Club, Dollar World, Rite Aid |
|
Riverhead Plaza |
|
New York-Newark-Jersey City |
|
NY |
|
50% |
|
2023 |
|
0 |
|
|
— |
|
|
|
13 |
|
|
100.0% |
|
|
34.20 |
|
|
- |
|
Rivertowns Square |
|
New York-Newark-Jersey City |
|
NY |
|
|
|
2018 |
|
2016 |
|
|
— |
|
|
|
116 |
|
|
92.6% |
|
|
27.63 |
|
|
Ulta, The Learning Experience, Mom's Organic Market, Look Cinemas |
|
Somers Commons |
|
New York-Newark-Jersey City |
|
NY |
|
|
|
2023 |
|
2003 |
|
|
— |
|
|
|
135 |
|
|
89.3% |
|
|
17.01 |
|
|
Level Fitness, Tractor Supply, Goodwill |
|
Staples Plaza-Yorktown Heights |
|
New York-Newark-Jersey City |
|
NY |
|
|
|
2023 |
|
1970 |
|
|
— |
|
|
|
125 |
|
|
100.0% |
|
|
12.09 |
|
|
Level Fitness, Staples, Party City, Extra Space Storage |
|
Tanglewood Shopping Center |
|
New York-Newark-Jersey City |
|
NY |
|
|
|
2023 |
|
1953 |
|
|
3,163 |
|
|
|
27 |
|
|
100.0% |
|
|
40.47 |
|
|
- |
|
The Gallery at Westbury Plaza |
|
New York-Newark-Jersey City |
|
NY |
|
|
|
2017 |
|
2013 |
|
|
— |
|
|
|
312 |
|
|
100.0% |
|
|
53.17 |
|
|
Trader Joe's, Nordstrom Rack, Saks Fifth Avenue, Bloomingdale's, The Container Store, HomeGoods, Old Navy, Gap Outlet, Bassett Home Furnishings, Famous Footwear |
|
The Point at Garden City Park |
|
New York-Newark-Jersey City |
|
NY |
|
|
|
2016 |
|
2018 |
|
|
— |
|
|
|
105 |
|
|
100.0% |
|
|
30.73 |
|
|
King Kullen, Ace Hardware |
|
The Shops at SunVet (fka SunVet) (6)(7) |
|
New York-Newark-Jersey City |
|
NY |
|
100% |
|
2023 |
|
2023 |
|
|
— |
|
|
|
173 |
|
|
33.7% |
|
|
38.55 |
|
|
Whole Foods |
|
Towne Centre at Somers |
|
New York-Newark-Jersey City |
|
NY |
|
|
|
2023 |
|
1988 |
|
|
— |
|
|
|
84 |
|
|
100.0% |
|
|
31.08 |
|
|
CVS |
|
Valley Stream |
|
New York-Newark-Jersey City |
|
NY |
|
|
|
2021 |
|
1950 |
|
|
— |
|
|
|
99 |
|
|
95.0% |
|
|
28.68 |
|
|
King Kullen |
|
Village Commons |
|
New York-Newark-Jersey City |
|
NY |
|
|
|
2023 |
|
1980 |
|
|
— |
|
|
|
28 |
|
|
88.6% |
|
|
38.95 |
|
|
- |
|
Wading River |
|
New York-Newark-Jersey City |
|
NY |
|
|
|
2021 |
|
2002 |
|
|
— |
|
|
|
99 |
|
|
89.8% |
|
|
24.18 |
|
|
King Kullen, CVS, Ace Hardware |
|
Westbury Plaza |
|
New York-Newark-Jersey City |
|
NY |
|
|
|
2017 |
|
2004 |
|
|
88,000 |
|
|
|
390 |
|
|
100.0% |
|
|
27.26 |
|
|
WalMart, Costco, Marshalls, Total Wine and More, Olive Garden |
|
Marine's Taste of Italy |
|
Torrington |
|
NY |
|
|
|
2023 |
|
1988 |
|
|
— |
|
|
|
3 |
|
|
100.0% |
|
|
28.73 |
|
|
- |
|
Cherry Grove |
|
Cincinnati |
|
OH |
|
|
|
1998 |
|
2012 |
|
|
— |
|
|
|
203 |
|
|
99.0% |
|
|
13.05 |
|
|
Kroger, Shoe Carnival, TJ Maxx, Tuesday Morning |
|
Hyde Park |
|
Cincinnati |
|
OH |
|
|
|
1997 |
|
1995 |
|
|
— |
|
|
|
397 |
|
|
98.8% |
|
|
17.40 |
|
|
Kroger, Kohl's, Walgreens, Jo-Ann Fabrics, Ace Hardware, Staples, Marshalls, Five Below |
|
Red Bank Village |
|
Cincinnati |
|
OH |
|
|
|
2006 |
|
2018 |
|
|
— |
|
|
|
176 |
|
|
100.0% |
|
|
7.89 |
|
|
WalMart |
|
Regency Commons |
|
Cincinnati |
|
OH |
|
|
|
2004 |
|
2004 |
|
|
— |
|
|
|
34 |
|
|
78.8% |
|
|
27.76 |
|
|
- |
|
West Chester Plaza |
|
Cincinnati |
|
OH |
|
|
|
1998 |
|
1988 |
|
|
— |
|
|
|
88 |
|
|
100.0% |
|
|
10.56 |
|
|
Kroger |
|
East Pointe |
|
Columbus |
|
OH |
|
|
|
1998 |
|
2014 |
|
|
— |
|
|
|
111 |
|
|
100.0% |
|
|
11.53 |
|
|
Kroger |
|
Kroger New Albany Center |
|
Columbus |
|
OH |
|
|
|
1999 |
|
1999 |
|
|
— |
|
|
|
93 |
|
|
100.0% |
|
|
13.90 |
|
|
Kroger |
|
Northgate Plaza (Maxtown Road) |
|
Columbus |
|
OH |
|
|
|
1998 |
|
2017 |
|
|
— |
|
|
|
117 |
|
|
100.0% |
|
|
12.33 |
|
|
Kroger, (Home Depot) |
|
Corvallis Market Center |
|
Corvallis |
|
OR |
|
|
|
2006 |
|
2006 |
|
|
— |
|
|
|
85 |
|
|
100.0% |
|
|
22.68 |
|
|
Michaels, TJ Maxx, Trader Joe's |
|
Northgate Marketplace |
|
Medford |
|
OR |
|
|
|
2011 |
|
2011 |
|
|
— |
|
|
|
81 |
|
|
93.2% |
|
|
24.56 |
|
|
Trader Joe's, REI, PETCO |
37
|
Property Name |
|
CBSA (1) |
|
State |
|
Owner-
|
|
Year
|
|
Year
|
|
Mortgages or
|
|
|
Gross
|
|
|
Percent
|
|
Average
|
|
|
Major Tenant(s) (5) |
|||
|
Northgate Marketplace Ph II |
|
Medford |
|
OR |
|
|
|
2015 |
|
2015 |
|
|
— |
|
|
|
177 |
|
|
96.4% |
|
|
18.05 |
|
|
Dick's Sporting Goods, Homegoods, Marshalls |
|
Greenway Town Center |
|
Portland-Vancouver-Hillsboro |
|
OR |
|
40% |
|
2005 |
|
2014 |
|
|
— |
|
|
|
93 |
|
|
100.0% |
|
|
16.79 |
|
|
Dollar Tree, Rite Aid, Whole Foods |
|
Murrayhill Marketplace |
|
Portland-Vancouver-Hillsboro |
|
OR |
|
|
|
1999 |
|
2016 |
|
|
— |
|
|
|
150 |
|
|
85.9% |
|
|
20.98 |
|
|
Safeway, Planet Fitness |
|
Sherwood Crossroads |
|
Portland-Vancouver-Hillsboro |
|
OR |
|
|
|
1999 |
|
1999 |
|
|
— |
|
|
|
88 |
|
|
98.6% |
|
|
12.69 |
|
|
Safeway |
|
Tanasbourne Market |
|
Portland-Vancouver-Hillsboro |
|
OR |
|
|
|
2006 |
|
2006 |
|
|
— |
|
|
|
71 |
|
|
100.0% |
|
|
33.03 |
|
|
Whole Foods |
|
Walker Center |
|
Portland-Vancouver-Hillsboro |
|
OR |
|
|
|
1999 |
|
1987 |
|
|
— |
|
|
|
89 |
|
|
96.8% |
|
|
28.59 |
|
|
REI |
|
Allen Street Shopping Ctr |
|
Allentown-Bethlehem-Easton |
|
PA |
|
40% |
|
2005 |
|
1958 |
|
|
— |
|
|
|
46 |
|
|
100.0% |
|
|
19.07 |
|
|
Grocery Outlet Bargain Market |
|
Lower Nazareth Commons |
|
Allentown-Bethlehem-Easton |
|
PA |
|
|
|
2007 |
|
2012 |
|
|
— |
|
|
|
96 |
|
|
100.0% |
|
|
27.85 |
|
|
Burlington Coat Factory, PETCO, (Wegmans), (Target) |
|
Stefko Boulevard Shopping Center |
|
Allentown-Bethlehem-Easton |
|
PA |
|
40% |
|
2005 |
|
1976 |
|
|
— |
|
|
|
134 |
|
|
97.9% |
|
|
10.69 |
|
|
Valley Farm Market, Dollar Tree, Muscle Inc. Gym |
|
Hershey |
|
Harrisburg-Carlisle |
|
PA |
|
|
|
2000 |
|
2000 |
|
|
— |
|
|
|
6 |
|
|
100.0% |
|
|
30.00 |
|
|
- |
|
Baederwood Shopping Center |
|
Philadelphia-Camden-Wilmington |
|
PA |
|
80% |
|
2023 |
|
1999 |
|
|
24,365 |
|
|
|
117 |
|
|
100.0% |
|
|
28.11 |
|
|
Whole Foods, Planet Fitness |
|
City Avenue Shopping Center |
|
Philadelphia-Camden-Wilmington |
|
PA |
|
40% |
|
2005 |
|
1960 |
|
|
— |
|
|
|
162 |
|
|
89.4% |
|
|
21.77 |
|
|
Ross Dress for Less, TJ Maxx, Dollar Tree |
|
Gateway Shopping Center |
|
Philadelphia-Camden-Wilmington |
|
PA |
|
|
|
2004 |
|
2016 |
|
|
— |
|
|
|
224 |
|
|
99.0% |
|
|
35.87 |
|
|
Trader Joe's, Staples, TJ Maxx, Jo-Ann Fabrics |
|
Mercer Square Shopping Center |
|
Philadelphia-Camden-Wilmington |
|
PA |
|
40% |
|
2005 |
|
1988 |
|
|
— |
|
|
|
91 |
|
|
100.0% |
|
|
23.28 |
|
|
Weis Markets |
|
Newtown Square Shopping Center |
|
Philadelphia-Camden-Wilmington |
|
PA |
|
40% |
|
2005 |
|
2020 |
|
|
20,000 |
|
|
|
142 |
|
|
97.2% |
|
|
19.49 |
|
|
Acme Markets, Michael's |
|
Warwick Square Shopping Center |
|
Philadelphia-Camden-Wilmington |
|
PA |
|
40% |
|
2005 |
|
1999 |
|
|
— |
|
|
|
93 |
|
|
96.7% |
|
|
17.49 |
|
|
Grocery Outlet Bargain Market, Planet Fitness |
|
Indigo Square |
|
Charleston-North Charleston |
|
SC |
|
|
|
2017 |
|
2017 |
|
|
— |
|
|
|
51 |
|
|
100.0% |
|
|
30.99 |
|
|
Greenwise (Vac 8/29/20) |
|
Merchants Village |
|
Charleston-North Charleston |
|
SC |
|
40% |
|
1997 |
|
1997 |
|
|
9,000 |
|
|
|
80 |
|
|
100.0% |
|
|
18.63 |
|
|
Publix |
|
Harpeth Village Fieldstone |
|
Nashvil-Davdsn-Murfree-Frankln |
|
TN |
|
|
|
1997 |
|
1998 |
|
|
— |
|
|
|
70 |
|
|
100.0% |
|
|
17.31 |
|
|
Publix |
|
Northlake Village |
|
Nashvil-Davdsn-Murfree-Frankln |
|
TN |
|
|
|
2000 |
|
2013 |
|
|
— |
|
|
|
135 |
|
|
98.9% |
|
|
15.83 |
|
|
Kroger |
|
Peartree Village |
|
Nashvil-Davdsn-Murfree-Frankln |
|
TN |
|
|
|
1997 |
|
1997 |
|
|
— |
|
|
|
110 |
|
|
100.0% |
|
|
20.43 |
|
|
Kroger, PETCO |
|
Hancock |
|
Austin-Round Rock-Georgetown |
|
TX |
|
|
|
1999 |
|
1998 |
|
|
— |
|
|
|
263 |
|
|
98.1% |
|
|
20.04 |
|
|
24 Hour Fitness, Firestone Complete Auto Care, H.E.B, PETCO, Twin Liquors |
|
Market at Round Rock |
|
Austin-Round Rock-Georgetown |
|
TX |
|
|
|
1999 |
|
1987 |
|
|
— |
|
|
|
123 |
|
|
86.5% |
|
|
21.19 |
|
|
Sprout's Markets, Office Depot |
|
North Hills |
|
Austin-Round Rock-Georgetown |
|
TX |
|
|
|
1999 |
|
1995 |
|
|
— |
|
|
|
164 |
|
|
98.8% |
|
|
22.11 |
|
|
H.E.B. |
|
Shops at Mira Vista |
|
Austin-Round Rock-Georgetown |
|
TX |
|
|
|
2014 |
|
2002 |
|
|
165 |
|
|
|
68 |
|
|
100.0% |
|
|
26.25 |
|
|
Trader Joe's, Champions Westlake Gymnastics & Cheer |
|
Tech Ridge Center |
|
Austin-Round Rock-Georgetown |
|
TX |
|
|
|
2011 |
|
2020 |
|
|
— |
|
|
|
216 |
|
|
99.4% |
|
|
24.23 |
|
|
H.E.B., Pinstack, Baylor Scott & White |
|
Bethany Park Place |
|
Dallas-Fort Worth-Arlington |
|
TX |
|
|
|
1998 |
|
1998 |
|
|
10,200 |
|
|
|
99 |
|
|
100.0% |
|
|
12.23 |
|
|
Kroger |
|
CityLine Market |
|
Dallas-Fort Worth-Arlington |
|
TX |
|
|
|
2014 |
|
2014 |
|
|
— |
|
|
|
81 |
|
|
100.0% |
|
|
30.41 |
|
|
Whole Foods |
|
CityLine Market Phase II |
|
Dallas-Fort Worth-Arlington |
|
TX |
|
|
|
2015 |
|
2015 |
|
|
— |
|
|
|
22 |
|
|
100.0% |
|
|
28.58 |
|
|
CVS |
|
Hillcrest Village |
|
Dallas-Fort Worth-Arlington |
|
TX |
|
|
|
1999 |
|
1991 |
|
|
— |
|
|
|
15 |
|
|
100.0% |
|
|
51.23 |
|
|
- |
|
Keller Town Center |
|
Dallas-Fort Worth-Arlington |
|
TX |
|
|
|
1999 |
|
2014 |
|
|
— |
|
|
|
120 |
|
|
97.4% |
|
|
17.43 |
|
|
Tom Thumb |
|
Lebanon/Legacy Center |
|
Dallas-Fort Worth-Arlington |
|
TX |
|
|
|
2000 |
|
2002 |
|
|
— |
|
|
|
56 |
|
|
100.0% |
|
|
30.26 |
|
|
(WalMart) |
|
Market at Preston Forest |
|
Dallas-Fort Worth-Arlington |
|
TX |
|
|
|
1999 |
|
1990 |
|
|
— |
|
|
|
96 |
|
|
97.4% |
|
|
22.34 |
|
|
Tom Thumb |
|
Mockingbird Commons |
|
Dallas-Fort Worth-Arlington |
|
TX |
|
|
|
1999 |
|
1987 |
|
|
— |
|
|
|
120 |
|
|
95.9% |
|
|
21.36 |
|
|
Tom Thumb, Ogle School of Hair Design |
|
Preston Oaks |
|
Dallas-Fort Worth-Arlington |
|
TX |
|
|
|
2013 |
|
2022 |
|
|
— |
|
|
|
103 |
|
|
100.0% |
|
|
40.79 |
|
|
Central Market, Talbots |
|
Prestonbrook |
|
Dallas-Fort Worth-Arlington |
|
TX |
|
|
|
1998 |
|
1998 |
|
|
— |
|
|
|
92 |
|
|
98.9% |
|
|
15.57 |
|
|
Kroger |
|
Shiloh Springs |
|
Dallas-Fort Worth-Arlington |
|
TX |
|
|
|
1998 |
|
1998 |
|
|
— |
|
|
|
110 |
|
|
93.6% |
|
|
15.32 |
|
|
Kroger |
|
Alden Bridge |
|
Houston-Woodlands-Sugar Land |
|
TX |
|
|
|
2002 |
|
1998 |
|
|
26,000 |
|
|
|
139 |
|
|
98.4% |
|
|
21.64 |
|
|
Kroger, Walgreens |
|
Baybrook East (7) |
|
Houston-Woodlands-Sugar Land |
|
TX |
|
50% |
|
2020 |
|
2021 |
|
|
10,222 |
|
|
|
156 |
|
|
93.9% |
|
|
13.16 |
|
|
H.E.B |
|
Cochran's Crossing |
|
Houston-Woodlands-Sugar Land |
|
TX |
|
|
|
2002 |
|
1994 |
|
|
— |
|
|
|
138 |
|
|
100.0% |
|
|
20.77 |
|
|
Kroger |
|
Indian Springs Center |
|
Houston-Woodlands-Sugar Land |
|
TX |
|
|
|
2002 |
|
2003 |
|
|
— |
|
|
|
137 |
|
|
98.9% |
|
|
25.71 |
|
|
H.E.B. |
|
Market at Springwoods Village |
|
Houston-Woodlands-Sugar Land |
|
TX |
|
53% |
|
2016 |
|
2018 |
|
|
3,750 |
|
|
|
167 |
|
|
98.9% |
|
|
18.14 |
|
|
Kroger |
|
Panther Creek |
|
Houston-Woodlands-Sugar Land |
|
TX |
|
|
|
2002 |
|
1994 |
|
|
— |
|
|
|
166 |
|
|
100.0% |
|
|
25.24 |
|
|
CVS, The Woodlands Childrens Museum, Fitness Project |
38
|
Property Name |
|
CBSA (1) |
|
State |
|
Owner-
|
|
Year
|
|
Year
|
|
Mortgages or
|
|
|
Gross
|
|
|
Percent
|
|
Average
|
|
|
Major Tenant(s) (5) |
|||
|
Sienna (7) |
|
Houston-Woodlands-Sugar Land |
|
TX |
|
75% |
|
2023 |
|
2023 |
|
|
— |
|
|
|
30 |
|
|
19.2% |
|
|
37.38 |
|
|
- |
|
Southpark at Cinco Ranch |
|
Houston-Woodlands-Sugar Land |
|
TX |
|
|
|
2012 |
|
2017 |
|
|
— |
|
|
|
265 |
|
|
100.0% |
|
|
14.72 |
|
|
Kroger, Academy Sports, PETCO, Spec's Liquor and Finer Foods |
|
Sterling Ridge |
|
Houston-Woodlands-Sugar Land |
|
TX |
|
|
|
2002 |
|
2000 |
|
|
— |
|
|
|
129 |
|
|
98.9% |
|
|
22.48 |
|
|
Kroger, CVS |
|
Sweetwater Plaza |
|
Houston-Woodlands-Sugar Land |
|
TX |
|
20% |
|
2001 |
|
2000 |
|
|
20,000 |
|
|
|
134 |
|
|
98.1% |
|
|
19.07 |
|
|
Kroger, Walgreens |
|
The Village at Riverstone |
|
Houston-Woodlands-Sugar Land |
|
TX |
|
|
|
2016 |
|
2016 |
|
|
— |
|
|
|
165 |
|
|
95.1% |
|
|
17.19 |
|
|
Kroger |
|
Weslayan Plaza East |
|
Houston-Woodlands-Sugar Land |
|
TX |
|
40% |
|
2005 |
|
1969 |
|
|
— |
|
|
|
169 |
|
|
100.0% |
|
|
21.90 |
|
|
Berings, Ross Dress for Less, Michaels, The Next Level Fitness, Spec's Liquor, Trek Bicycle |
|
Weslayan Plaza West |
|
Houston-Woodlands-Sugar Land |
|
TX |
|
40% |
|
2005 |
|
1969 |
|
|
— |
|
|
|
186 |
|
|
98.1% |
|
|
21.79 |
|
|
Randalls Food, Walgreens, PETCO, Homegoods, Barnes & Noble |
|
Westwood Village |
|
Houston-Woodlands-Sugar Land |
|
TX |
|
|
|
2006 |
|
2006 |
|
|
— |
|
|
|
206 |
|
|
96.8% |
|
|
21.77 |
|
|
Fitness Project, PetSmart, Office Max, Ross Dress For Less, TJ Maxx, (Target) |
|
Woodway Collection |
|
Houston-Woodlands-Sugar Land |
|
TX |
|
40% |
|
2005 |
|
2012 |
|
|
25,900 |
|
|
|
97 |
|
|
94.2% |
|
|
32.19 |
|
|
Whole Foods |
|
Carytown Exchange |
|
Richmond |
|
VA |
|
68% |
|
2018 |
|
2022 |
|
|
— |
|
|
|
116 |
|
|
95.6% |
|
|
28.13 |
|
|
Publix, CVS |
|
Hanover Village Shopping Center |
|
Richmond |
|
VA |
|
40% |
|
2005 |
|
1971 |
|
|
— |
|
|
|
90 |
|
|
87.8% |
|
|
9.68 |
|
|
Aldi, Tractor Supply Company, Harbor Freight Tools |
|
Village Shopping Center |
|
Richmond |
|
VA |
|
40% |
|
2005 |
|
1948 |
|
|
24,250 |
|
|
|
116 |
|
|
84.1% |
|
|
25.64 |
|
|
Publix, CVS |
|
Ashburn Farm Village Center |
|
Washington-Arlington-Alexandri |
|
VA |
|
40% |
|
2005 |
|
1996 |
|
|
— |
|
|
|
92 |
|
|
100.0% |
|
|
17.76 |
|
|
Patel Brothers, The Shop Gym |
|
Belmont Chase |
|
Washington-Arlington-Alexandri |
|
VA |
|
|
|
2014 |
|
2014 |
|
|
— |
|
|
|
91 |
|
|
98.3% |
|
|
34.38 |
|
|
Cooper's Hawk Winery, Whole Foods |
|
Centre Ridge Marketplace |
|
Washington-Arlington-Alexandri |
|
VA |
|
40% |
|
2005 |
|
1996 |
|
|
11,640 |
|
|
|
107 |
|
|
100.0% |
|
|
21.37 |
|
|
United States Coast Guard Ex, Planet Fitness |
|
Festival at Manchester Lakes |
|
Washington-Arlington-Alexandri |
|
VA |
|
40% |
|
2005 |
|
2021 |
|
|
— |
|
|
|
169 |
|
|
100.0% |
|
|
31.35 |
|
|
Amazon Fresh, Homesense, Hyper Kidz |
|
Fox Mill Shopping Center |
|
Washington-Arlington-Alexandri |
|
VA |
|
40% |
|
2005 |
|
2013 |
|
|
22,500 |
|
|
|
103 |
|
|
97.6% |
|
|
27.22 |
|
|
Giant |
|
Greenbriar Town Center |
|
Washington-Arlington-Alexandri |
|
VA |
|
40% |
|
2005 |
|
1972 |
|
|
76,200 |
|
|
|
340 |
|
|
99.3% |
|
|
29.41 |
|
|
Big Blue Swim School, Bob's Discount Furniture, CVS, Giant, Marshalls, Planet Fitness, Ross Dress for Less, Total Wine and More |
|
Kamp Washington Shopping Center |
|
Washington-Arlington-Alexandri |
|
VA |
|
40% |
|
2005 |
|
1960 |
|
|
— |
|
|
|
71 |
|
|
93.8% |
|
|
33.91 |
|
|
PGA Tour Superstore |
|
Kings Park Shopping Center |
|
Washington-Arlington-Alexandri |
|
VA |
|
40% |
|
2005 |
|
2015 |
|
|
21,800 |
|
|
|
96 |
|
|
100.0% |
|
|
34.12 |
|
|
Giant, CVS |
|
Lorton Station Marketplace |
|
Washington-Arlington-Alexandri |
|
VA |
|
20% |
|
2006 |
|
2005 |
|
|
7,300 |
|
|
|
136 |
|
|
84.1% |
|
|
26.68 |
|
|
Amazon Fresh, Planet Fitness |
|
Point 50 |
|
Washington-Arlington-Alexandri |
|
VA |
|
|
|
2007 |
|
2021 |
|
|
— |
|
|
|
48 |
|
|
100.0% |
|
|
32.94 |
|
|
Amazon Fresh |
|
Saratoga Shopping Center |
|
Washington-Arlington-Alexandri |
|
VA |
|
40% |
|
2005 |
|
1977 |
|
|
22,800 |
|
|
|
113 |
|
|
93.4% |
|
|
21.77 |
|
|
Giant |
|
Shops at County Center |
|
Washington-Arlington-Alexandri |
|
VA |
|
|
|
2005 |
|
2005 |
|
|
— |
|
|
|
97 |
|
|
98.3% |
|
|
19.26 |
|
|
Harris Teeter, Planet Fitness |
|
The Crossing Clarendon |
|
Washington-Arlington-Alexandri |
|
VA |
|
|
|
2016 |
|
2023 |
|
|
— |
|
|
|
420 |
|
|
96.9% |
|
|
38.07 |
|
|
Whole Foods, Crate & Barrel, The Container Store, Barnes & Noble, Pottery Barn, Ethan Allen, The Cheesecake Factory, LifeTime, Corobus Sports |
|
The Field at Commonwealth |
|
Washington-Arlington-Alexandri |
|
VA |
|
|
|
2017 |
|
2018 |
|
|
— |
|
|
|
167 |
|
|
100.0% |
|
|
23.62 |
|
|
Wegmans |
|
Village Center at Dulles |
|
Washington-Arlington-Alexandri |
|
VA |
|
20% |
|
2002 |
|
1991 |
|
|
52,000 |
|
|
|
307 |
|
|
83.3% |
|
|
30.56 |
|
|
Giant, CVS, Advance Auto Parts, Chuck E. Cheese, HomeGoods, Goodwill, Furniture Max |
|
Willston Centre I |
|
Washington-Arlington-Alexandri |
|
VA |
|
40% |
|
2005 |
|
1952 |
|
|
— |
|
|
|
105 |
|
|
82.2% |
|
|
31.65 |
|
|
Fashion K City |
|
Willston Centre II |
|
Washington-Arlington-Alexandri |
|
VA |
|
40% |
|
2005 |
|
2010 |
|
|
23,823 |
|
|
|
136 |
|
|
94.4% |
|
|
27.81 |
|
|
Safeway, (Target), (PetSmart) |
|
6401 Roosevelt |
|
Seattle-Tacoma-Bellevue |
|
WA |
|
|
|
2019 |
|
1929 |
|
|
— |
|
|
|
8 |
|
|
100.0% |
|
|
27.10 |
|
|
- |
|
Aurora Marketplace |
|
Seattle-Tacoma-Bellevue |
|
WA |
|
40% |
|
2005 |
|
1991 |
|
|
13,400 |
|
|
|
107 |
|
|
100.0% |
|
|
18.92 |
|
|
Safeway, TJ Maxx |
|
Ballard Blocks I |
|
Seattle-Tacoma-Bellevue |
|
WA |
|
50% |
|
2018 |
|
2007 |
|
|
— |
|
|
|
132 |
|
|
98.4% |
|
|
28.01 |
|
|
LA Fitness, Ross Dress for Less, Trader Joe's |
|
Ballard Blocks II |
|
Seattle-Tacoma-Bellevue |
|
WA |
|
50% |
|
2018 |
|
2018 |
|
|
— |
|
|
|
117 |
|
|
98.4% |
|
|
35.12 |
|
|
Bright Horizons, Kaiser Permanente, PCC Community Markets, Prokarma, Trufusion, West Marine |
39
|
Property Name |
|
CBSA (1) |
|
State |
|
Owner-
|
|
Year
|
|
Year
|
|
Mortgages or
|
|
|
Gross
|
|
|
Percent
|
|
Average
|
|
|
Major Tenant(s) (5) |
|||
|
Broadway Market |
|
Seattle-Tacoma-Bellevue |
|
WA |
|
20% |
|
2014 |
|
1988 |
|
|
21,500 |
|
|
|
140 |
|
|
95.7% |
|
|
28.83 |
|
|
Gold's Gym, Mosaic Salon Group, Quality Food Centers |
|
Cascade Plaza |
|
Seattle-Tacoma-Bellevue |
|
WA |
|
20% |
|
1999 |
|
1999 |
|
|
— |
|
|
|
207 |
|
|
97.9% |
|
|
13.26 |
|
|
Big 5 Sporting Goods, Dollar Tree, Jo-Ann Fabrics, Planet Fitness, Ross Dress For Less, Safeway, Aaron's |
|
Eastgate Plaza |
|
Seattle-Tacoma-Bellevue |
|
WA |
|
40% |
|
2005 |
|
2021 |
|
|
22,000 |
|
|
|
85 |
|
|
96.5% |
|
|
32.61 |
|
|
Safeway, Rite Aid |
|
Grand Ridge Plaza |
|
Seattle-Tacoma-Bellevue |
|
WA |
|
|
|
2012 |
|
2018 |
|
|
— |
|
|
|
331 |
|
|
99.2% |
|
|
26.62 |
|
|
Bevmo!, Dick's Sporting Goods, Marshalls, Regal Cinemas,Safeway, Ulta |
|
Inglewood Plaza |
|
Seattle-Tacoma-Bellevue |
|
WA |
|
|
|
1999 |
|
1985 |
|
|
— |
|
|
|
17 |
|
|
95.9% |
|
|
47.01 |
|
|
- |
|
Island Village |
|
Seattle-Tacoma-Bellevue |
|
WA |
|
|
|
2023 |
|
2013 |
|
|
— |
|
|
|
106 |
|
|
100.0% |
|
|
16.38 |
|
|
Safeway, Rite Aid |
|
Klahanie Shopping Center |
|
Seattle-Tacoma-Bellevue |
|
WA |
|
|
|
2016 |
|
1998 |
|
|
— |
|
|
|
67 |
|
|
96.7% |
|
|
38.28 |
|
|
(QFC) |
|
Melrose Market |
|
Seattle-Tacoma-Bellevue |
|
WA |
|
|
|
2019 |
|
2009 |
|
|
— |
|
|
|
21 |
|
|
84.2% |
|
|
35.14 |
|
|
- |
|
Overlake Fashion Plaza |
|
Seattle-Tacoma-Bellevue |
|
WA |
|
40% |
|
2005 |
|
2020 |
|
|
— |
|
|
|
87 |
|
|
100.0% |
|
|
30.25 |
|
|
Marshalls, Bevmo!, Amazon Go Grocery |
|
Pine Lake Village |
|
Seattle-Tacoma-Bellevue |
|
WA |
|
|
|
1999 |
|
1989 |
|
|
— |
|
|
|
103 |
|
|
98.6% |
|
|
26.79 |
|
|
Quality Food Centers, Rite Aid |
|
Roosevelt Square |
|
Seattle-Tacoma-Bellevue |
|
WA |
|
|
|
2017 |
|
2017 |
|
|
— |
|
|
|
150 |
|
|
81.3% |
|
|
27.33 |
|
|
Whole Foods, Guitar Center, LA Fitness |
|
Sammamish-Highlands |
|
Seattle-Tacoma-Bellevue |
|
WA |
|
|
|
1999 |
|
2013 |
|
|
— |
|
|
|
101 |
|
|
100.0% |
|
|
38.84 |
|
|
Trader Joe's, Bartell Drugs, (Safeway) |
|
Southcenter |
|
Seattle-Tacoma-Bellevue |
|
WA |
|
|
|
1999 |
|
1990 |
|
|
— |
|
|
|
59 |
|
|
100.0% |
|
|
35.51 |
|
|
(Target) |
|
Regency Centers Total |
|
|
|
|
|
|
|
|
|
|
|
$ |
2,268,157 |
|
|
|
56,825 |
|
|
95.1% |
|
$ |
24.44 |
|
|
|
40
Item 3. Legal Proceedings
We are a party to various legal proceedings that arise in the ordinary course of our business. We are not currently involved in any litigation, nor, to our knowledge, is any litigation threatened against us, the outcome of which would, in our judgment based on information currently available to us, have a material adverse effect on our financial position or results of operations. However, no assurances can be given as to the outcome of any threatened or pending legal proceedings.
See Note 16 - Commitments and Contingencies in the Notes for discussion regarding material legal proceeds and contingencies.
Item 4. Mine Saf ety Disclosures
Not applicable.
PART II
Item 5. Market for the Registrant's Common Equity, Related St ockholder Matters, and Issuer Purchases of Equity Securities
Our common stock is listed on the NASDAQ Global Select Market under the symbol "REG."
As of February 05, 2024, there were 112,794 holders of our common stock.
We intend to pay regular quarterly distributions to Regency Centers Corporation's common shareholders. Future distributions will be declared and paid at the discretion of our Board of Directors and will depend upon cash generated by our operating results, our financial condition, cash flows, capital requirements, future business prospects, annual dividend requirements under the REIT provisions of the Internal Revenue Code of 1986, as amended, and such other factors as our Board of Directors deems relevant. In order to maintain Regency Centers Corporation's qualification as a REIT for federal income tax purposes, we are generally required to make annual distributions equal to at least 90% of our real estate investment trust taxable income for the taxable year. Under certain circumstances we could be required to make distributions in excess of cash available for distributions in order to meet such requirements. We have a dividend reinvestment plan under which our shareholders may elect to reinvest their dividends automatically in common stock. Under the plan, we may elect to purchase common stock in the open market on behalf of shareholders or may issue new common stock to such shareholders.
Under the revolving credit agreement of our Line, in the event of any monetary default, we may not make distributions to shareholders except to the extent necessary to maintain our REIT status.
During the quarter ended December 31, 2023, the Operating Partnership issued 181,885 exchangeable operating partnership units to partially fund the acquisition of an operating property. Such units were issued pursuant to the exemption from registration contained in Section 4(a)(2) of the Securities Act of 1933, as amended. No underwriting discounts or commissions were paid with respect to such issuances.
The following table represents information with respect to purchases by Regency of its common stock by months during the three month period ended December 31, 2023:
|
Period |
|
Total number of
|
|
|
Total number of shares
|
|
|
Average price
|
|
|
Maximum number or approximate
|
|
||||
|
October 1, 2023, through October 31, 2023 |
|
|
— |
|
|
|
— |
|
|
$ |
— |
|
|
$ |
230,000,011 |
|
|
November 1, 2023, through November 30, 2023 |
|
|
— |
|
|
|
— |
|
|
$ |
— |
|
|
$ |
230,000,011 |
|
|
December 1, 2023, through December 31, 2023 |
|
|
— |
|
|
|
— |
|
|
$ |
— |
|
|
$ |
230,000,011 |
|
41
The performance graph furnished below shows Regency's cumulative total shareholder return relative to the S&P 500 Index, the FTSE Nareit Equity REIT Index, and the FTSE Nareit Equity Shopping Centers index since December 31, 2018. The following performance graph and table do not constitute soliciting material and should not be deemed filed or incorporated by reference into any other previous or future filings by us under the Securities Act of 1933, as amended (the "Securities Act") or the Securities Exchange Act of 1934, as amended (the "Exchange Act").
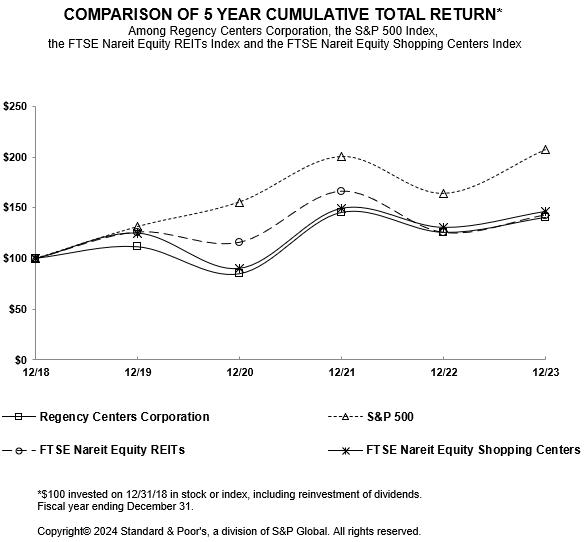
|
|
|
12/31/18 |
|
|
12/31/19 |
|
|
12/31/20 |
|
|
12/31/21 |
|
|
12/31/22 |
|
|
12/31/23 |
|
||||||
|
Regency Centers Corporation |
|
$ |
100.00 |
|
|
|
111.42 |
|
|
|
84.78 |
|
|
|
145.30 |
|
|
|
125.60 |
|
|
|
140.38 |
|
|
S&P 500 |
|
|
100.00 |
|
|
|
131.49 |
|
|
|
155.68 |
|
|
|
200.37 |
|
|
|
164.08 |
|
|
|
207.21 |
|
|
FTSE NAREIT Equity REITs |
|
|
100.00 |
|
|
|
126.00 |
|
|
|
115.92 |
|
|
|
166.04 |
|
|
|
125.58 |
|
|
|
142.83 |
|
|
FTSE NAREIT Equity Shopping Centers |
|
|
100.00 |
|
|
|
125.03 |
|
|
|
90.47 |
|
|
|
149.32 |
|
|
|
130.60 |
|
|
|
146.32 |
|
Item 6. [Reserved ]
42
Item 7. Management’s Discussion and Analysis of Financial Condition and Results of Operations
Executing on our Strategy
During the year ended December 31, 2023, we had Net income attributable to common shareholders of $359.5 million as compared to $482.9 million during the year ended December 31, 2022, which included gains on sale of real estate of $109.0 million.
During the year ended December 31, 2023:
We continued our development and redevelopment of high quality shopping centers:
We maintained liquidity and financial flexibility to cost effectively fund investment opportunities and debt maturities:
43
UBP Acquisition
On August 18, 2023, we completed the acquisition of UBP, which was structured as multiple mergers. Under the terms of the merger agreement, each share of Urstadt Biddle common stock and Urstadt Biddle Class A common stock was converted into 0.347 of a share of common stock of the Parent Company. Additionally, each share of UBP’s 6.25% Series H Cumulative Redeemable Preferred Stock and 5.875% Series K Cumulative Redeemable Preferred Stock was converted into one share of Parent Company Series A preferred stock and Parent Company Series B preferred stock, respectively.
The following table provides the components that make up the total purchase price for the UBP acquisition:
|
(in thousands, except stock price) |
|
Purchase Price |
|
|
|
Shares of common stock issued for acquisition |
|
|
13,568 |
|
|
Closing stock price on August 17, 2023 |
|
$ |
61.03 |
|
|
Value of common stock issued for acquisition |
|
$ |
828,025 |
|
|
Other adjustments |
|
|
(9,495 |
) |
|
Total value of common stock issued |
|
$ |
818,530 |
|
|
Debt repaid |
|
|
39,266 |
|
|
Preferred stock converted |
|
|
225,000 |
|
|
Transaction costs |
|
|
57,197 |
|
|
Other cash payments |
|
|
68 |
|
|
Total purchase price |
|
$ |
1,140,061 |
|
As part of the acquisition, Regency acquired 74 properties (all categorized as Non-Same Property for 2023 and 2024 reporting purposes) representing 5.3 million square feet of GLA, including 10 properties held through real estate partnerships. The consolidated results of operations of UBP are included in the consolidated financial statements from the closing date, August 18, 2023 through December 31, 2023.
Leasing Activity and Significant Tenants
We believe our high-quality, neighborhood and community shopping centers located in suburban trade areas with compelling demographics create attractive spaces for retail and service providers to operate their businesses.
Pro-rata Percent Leased
The following table summarizes Pro-rata percent leased of our combined consolidated and unconsolidated shopping center portfolio:
|
|
|
December 31, 2023 |
|
|
December 31, 2022 |
|
||
|
Percent Leased – All properties |
|
|
95.1 |
% |
|
|
94.8 |
% |
|
Anchor Space (spaces ≥ 10,000 SF) |
|
|
96.7 |
% |
|
|
96.8 |
% |
|
Shop Space (spaces < 10,000 SF) |
|
|
92.4 |
% |
|
|
91.5 |
% |
Our percent leased increased primarily due to favorable leasing activity in our Shop Space category during 2023.
Pro-rata Leasing Activity
The following table summarizes leasing activity, including our Pro-rata share of activity within the portfolio of our real estate partnerships (totals as a weighted-average PSF):
|
|
|
Year Ended December 31, 2023 |
|
|||||||||||||||||
|
|
|
Leasing
|
|
|
SF
|
|
|
Base
|
|
|
Tenant
|
|
|
Leasing
|
|
|||||
|
Anchor Space Leases |
|
|
|
|
|
|
|
|
|
|
|
|
|
|
|
|||||
|
New |
|
|
41 |
|
|
|
859 |
|
|
$ |
20.37 |
|
|
$ |
45.96 |
|
|
$ |
5.38 |
|
|
Renewal |
|
|
110 |
|
|
|
2,916 |
|
|
|
18.06 |
|
|
|
0.39 |
|
|
|
0.10 |
|
|
Total Anchor Space Leases |
|
|
151 |
|
|
|
3,775 |
|
|
$ |
18.58 |
|
|
$ |
10.77 |
|
|
$ |
1.30 |
|
|
Shop Space Leases |
|
|
|
|
|
|
|
|
|
|
|
|
|
|
|
|||||
|
New |
|
|
583 |
|
|
|
1,179 |
|
|
$ |
38.25 |
|
|
$ |
41.71 |
|
|
$ |
13.28 |
|
|
Renewal |
|
|
1,105 |
|
|
|
1,952 |
|
|
|
37.55 |
|
|
|
1.73 |
|
|
|
0.73 |
|
|
Total Shop Space Leases |
|
|
1,688 |
|
|
|
3,131 |
|
|
$ |
37.82 |
|
|
$ |
16.79 |
|
|
$ |
5.45 |
|
|
Total Leases |
|
|
1,839 |
|
|
|
6,906 |
|
|
$ |
27.30 |
|
|
$ |
13.50 |
|
|
$ |
3.19 |
|
44
|
|
|
Year Ended December 31, 2022 |
|
|||||||||||||||||
|
|
|
Leasing
|
|
|
SF
|
|
|
Base
|
|
|
Tenant
|
|
|
Leasing
|
|
|||||
|
Anchor Space Leases |
|
|
|
|
|
|
|
|
|
|
|
|
|
|
|
|||||
|
New |
|
|
24 |
|
|
|
632 |
|
|
$ |
15.09 |
|
|
$ |
24.36 |
|
|
$ |
5.32 |
|
|
Renewal |
|
|
108 |
|
|
|
3,252 |
|
|
|
16.36 |
|
|
|
1.07 |
|
|
|
0.23 |
|
|
Total Anchor Space Leases |
|
|
132 |
|
|
|
3,884 |
|
|
$ |
16.16 |
|
|
$ |
4.86 |
|
|
$ |
1.06 |
|
|
Shop Space Leases |
|
|
|
|
|
|
|
|
|
|
|
|
|
|
|
|||||
|
New |
|
|
562 |
|
|
|
1,058 |
|
|
$ |
37.55 |
|
|
$ |
36.17 |
|
|
$ |
11.48 |
|
|
Renewal |
|
|
1,287 |
|
|
|
2,395 |
|
|
|
35.94 |
|
|
|
1.66 |
|
|
|
0.77 |
|
|
Total Shop Space Leases |
|
|
1,849 |
|
|
|
3,453 |
|
|
$ |
36.44 |
|
|
$ |
12.23 |
|
|
$ |
4.05 |
|
|
Total Leases |
|
|
1,981 |
|
|
|
7,337 |
|
|
$ |
25.70 |
|
|
$ |
8.33 |
|
|
$ |
2.47 |
|
The weighted-average base rent PSF on signed Shop Space leases during 2023 was $37.82 PSF, which is higher than the weighted average annual base rent PSF of all Shop Space leases due to expire during the next 12 months of $34.73 PSF. New and renewal rent spreads, as compared to prior rents on these same spaces leased, were positive at 10.0% for the 12 months ended December 31, 2023, as compared to 7.4% for the 12 months ended December 31, 2022.
Significant Tenants and Concentrations of Risk
We seek to reduce our operating and leasing risks through geographic diversification of our properties, as seen in "Item 2. Properties " of this Report. We seek to avoid dependence on any single property, market, or tenant. Based on percentage of annualized base rent, the following table summarizes our most significant tenants, of which four of the top five are grocers:
|
|
|
December 31, 2023 |
|
|||||||||
|
Anchor |
|
Number of
|
|
|
Percentage of
|
|
|
Percentage of
|
|
|||
|
Publix |
|
|
68 |
|
|
|
6.4 |
% |
|
|
3.0 |
% |
|
Albertsons Companies, Inc. |
|
|
53 |
|
|
|
4.8 |
% |
|
|
3.0 |
% |
|
Kroger Co. |
|
|
52 |
|
|
|
6.4 |
% |
|
|
2.7 |
% |
|
Amazon/Whole Foods |
|
|
38 |
|
|
|
2.7 |
% |
|
|
2.6 |
% |
|
TJX Companies, Inc. |
|
|
70 |
|
|
|
3.6 |
% |
|
|
2.6 |
% |
Bankruptcies and Credit Concerns
Our management team devotes significant time to researching and monitoring consumer preferences and trends, customer shopping behaviors, changes in delivery methods, shifts to e-commerce, and changing demographics in order to anticipate the challenges and opportunities impacting our industry. We seek to mitigate these potential impacts through maintaining a high quality portfolio, diversifying our tenant mix, replacing less successful tenants with stronger operators, anchoring our centers with market leading grocery stores that drive customer traffic, and investing in suburban trade areas with compelling demographic populations benefiting from high levels of disposal income. The potential for a recession and the severity and duration of any economic downturn could negatively impact our existing tenants and their ability to continue to meet their lease obligations.
Although base rent is derived from long-term lease contracts, tenants that file for bankruptcy generally have the legal right to reject any or all of their leases and close related stores. Any unsecured claim we hold against a bankrupt tenant for unpaid rent might be paid only to the extent that funds are available and only in the same percentage as is paid to all other holders of unsecured claims. As a result, it is likely that we would recover substantially less than the full value of any unsecured claims we hold. Additionally, we may incur significant expense to adjudicate our claim and significant downtime to re-lease the vacated space. In the event that a tenant with a significant number of leases in our shopping centers files for bankruptcy and rejects its leases, we could experience a significant reduction in our revenues. Tenants who are currently in bankruptcy and continue to occupy space in our shopping centers represent an aggregate of 0.5% of our Pro-rata annual base rent which is primarily related to Rite Aid who filed in October 2023.
45
Results from Operations
Results from operations for the year ended December 31, 2023, include the results of our acquisition of UBP from August 18, 2023.
Comparison of the years ended December 31, 2023 and 2022:
Revenues changed as summarized in the following table:
|
(in thousands) |
|
2023 |
|
|
2022 |
|
|
Change |
|
|||
|
Lease income |
|
|
|
|
|
|
|
|
|
|||
|
Base rent |
|
$ |
897,451 |
|
|
|
821,755 |
|
|
|
75,696 |
|
|
Recoveries from tenants |
|
|
311,775 |
|
|
|
280,658 |
|
|
|
31,117 |
|
|
Percentage rent |
|
|
12,963 |
|
|
|
9,635 |
|
|
|
3,328 |
|
|
Uncollectible lease income |
|
|
(549 |
) |
|
|
13,841 |
|
|
|
(14,390 |
) |
|
Other lease income |
|
|
20,685 |
|
|
|
14,748 |
|
|
|
5,937 |
|
|
Straight-line rent |
|
|
10,788 |
|
|
|
24,272 |
|
|
|
(13,484 |
) |
|
Above/below market rent and tenant rent inducement amortization, net |
|
|
30,826 |
|
|
|
22,543 |
|
|
|
8,283 |
|
|
Total lease income |
|
$ |
1,283,939 |
|
|
|
1,187,452 |
|
|
|
96,487 |
|
|
Other property income |
|
|
11,573 |
|
|
|
10,719 |
|
|
|
854 |
|
|
Management, transaction, and other fees |
|
|
26,954 |
|
|
|
25,851 |
|
|
|
1,103 |
|
|
Total revenues |
|
$ |
1,322,466 |
|
|
|
1,224,022 |
|
|
|
98,444 |
|
Total lease income increased $96.5 million primarily driven by the following contractually billable components of rent to the tenants per the lease agreements:
Management, transaction, and other fees increased $1.1 million primarily due to increased debt placement, property management and development fees from our real estate partnerships.
46
Changes in our operating expenses are summarized in the following table:
|
(in thousands) |
|
2023 |
|
|
2022 |
|
|
Change |
|
|||
|
Depreciation and amortization |
|
$ |
352,282 |
|
|
|
319,697 |
|
|
|
32,585 |
|
|
Property operating expense |
|
|
229,209 |
|
|
|
196,148 |
|
|
|
33,061 |
|
|
Real estate taxes |
|
|
165,560 |
|
|
|
149,795 |
|
|
|
15,765 |
|
|
General and administrative |
|
|
97,806 |
|
|
|
79,903 |
|
|
|
17,903 |
|
|
Other operating expenses |
|
|
9,459 |
|
|
|
6,166 |
|
|
|
3,293 |
|
|
Total operating expenses |
|
$ |
854,316 |
|
|
|
751,709 |
|
|
|
102,607 |
|
Depreciation and amortization costs increased $32.6 million, as follows:
Property operating expense increased $33.1 million, on a net basis, as follows:
Real estate taxes increased $15.8 million, on a net basis, mainly due to the following:
General and administrative costs increased $17.9 million, on a net basis, mainly due to the following:
Other operating expenses increased $3.3 million, primarily due to transition costs related to the acquisition of UBP.
The following table presents the components of Other expense:
|
(in thousands) |
|
2023 |
|
|
2022 |
|
|
Change |
|
|||
|
Interest expense, net |
|
|
|
|
|
|
|
|
|
|||
|
Interest on notes payable |
|
$ |
154,647 |
|
|
|
148,803 |
|
|
|
5,844 |
|
|
Interest on unsecured credit facilities |
|
|
6,824 |
|
|
|
2,058 |
|
|
|
4,766 |
|
|
Capitalized interest |
|
|
(5,695 |
) |
|
|
(4,166 |
) |
|
|
(1,529 |
) |
|
Hedge expense |
|
|
438 |
|
|
|
438 |
|
|
|
— |
|
|
Interest income |
|
|
(1,965 |
) |
|
|
(947 |
) |
|
|
(1,018 |
) |
|
Interest expense, net |
|
|
154,249 |
|
|
|
146,186 |
|
|
|
8,063 |
|
|
Gain on sale of real estate, net of tax |
|
|
(661 |
) |
|
|
(109,005 |
) |
|
|
108,344 |
|
|
Early extinguishment of debt |
|
|
(99 |
) |
|
|
— |
|
|
|
(99 |
) |
|
Net investment (income) loss |
|
|
(5,665 |
) |
|
|
6,921 |
|
|
|
(12,586 |
) |
|
Total other expense (income) |
|
$ |
147,824 |
|
|
|
44,102 |
|
|
|
103,722 |
|
47
Interest expense, net increased $8.1 million primarily due to the following:
During 2023, we recognized gains on sale of $0.7 million from three land parcels. During 2022, we recognized gains on sale of $109.0 million from two operating property and five land parcels.
Net investment income increased $12.6 million primarily driven by $11.0 million gains on investments held in the non-qualified deferred compensation plan which have an offsetting expense in General and administrative costs noted above and $1.6 million gains on investments held in our captive insurance company.
Total equity in income of investments in real estate partnerships changed as follows:
|
(in thousands) |
|
Regency's
|
|
2023 |
|
|
2022 |
|
|
Change |
|
|||
|
GRI - Regency, LLC ("GRIR") |
|
40.00% |
|
$ |
35,901 |
|
|
|
35,819 |
|
|
|
82 |
|
|
Equity One JV Portfolio LLC ("NYC") (1) |
|
30.00% |
|
|
84 |
|
|
|
9,173 |
|
|
|
(9,089 |
) |
|
Columbia Regency Retail Partners, LLC ("Columbia I") |
|
20.00% |
|
|
1,630 |
|
|
|
1,817 |
|
|
|
(187 |
) |
|
Columbia Regency Partners II, LLC ("Columbia II") |
|
20.00% |
|
|
1,743 |
|
|
|
1,735 |
|
|
|
8 |
|
|
Columbia Village District, LLC |
|
30.00% |
|
|
2,199 |
|
|
|
1,669 |
|
|
|
530 |
|
|
RegCal, LLC ("RegCal") (2) |
|
25.00% |
|
|
2,912 |
|
|
|
4,499 |
|
|
|
(1,587 |
) |
|
Other investments in real estate partnerships |
|
11.80% - 66.67% |
|
|
6,072 |
|
|
|
5,112 |
|
|
|
960 |
|
|
Total equity in income of investments in real estate partnerships |
|
$ |
50,541 |
|
|
|
59,824 |
|
|
|
(9,283 |
) |
||
The $9.3 million decrease, on a net basis, in our equity in income of investments in real estate partnerships is largely attributable to the following changes:
The following represents the remaining components that comprise Net income attributable to common shareholders and unit holders:
|
(in thousands) |
|
2023 |
|
|
2022 |
|
|
Change |
|
|||
|
Net income |
|
$ |
370,867 |
|
|
|
488,035 |
|
|
|
(117,168 |
) |
|
Income attributable to noncontrolling interests |
|
|
(6,310 |
) |
|
|
(5,170 |
) |
|
|
(1,140 |
) |
|
Net income attributable to the Company |
|
|
364,557 |
|
|
|
482,865 |
|
|
|
(118,308 |
) |
|
Preferred stock dividends |
|
|
(5,057 |
) |
|
|
— |
|
|
|
(5,057 |
) |
|
Net income attributable to common shareholders |
|
$ |
359,500 |
|
|
|
482,865 |
|
|
|
(123,365 |
) |
|
Net income attributable to exchangeable operating partnership units |
|
|
2,008 |
|
|
|
2,105 |
|
|
|
(97 |
) |
|
Net income attributable to common unit holders |
|
$ |
361,508 |
|
|
|
484,970 |
|
|
|
(123,462 |
) |
Comparison of the years ended December 31, 2022 and 2021:
For a comparison of our results from operations for the years ended December 31, 2022 and 2021, see "Part II, Item 7. Management's Discussion and Analysis of Financial Condition and Results of Operations " of our Annual Report on Form 10-K for the year ended December 31, 2022, filed with the SEC on February 17, 2023.
48
Supplemental Earnings Information
We use certain non-GAAP measures, in addition to certain performance metrics determined under GAAP, as we believe these measures improve the understanding of the operating results. We believe these non-GAAP measures provide useful information to our Board of Directors, management and investors regarding certain trends relating to our financial condition and results of operations. Our management uses these non-GAAP measures to compare our performance to that of prior periods for trend analyses, purposes of determining management incentive compensation and budgeting, forecasting and planning purposes. We provide Pro-rata financial information because we believe it assists investors and analysts in estimating our economic interest in our consolidated and unconsolidated real estate partnerships, when read in conjunction with our reported results under GAAP. We believe presenting our Pro-rata share of operating results, along with other non-GAAP measures, may assist in comparing our operating results to other REITs. We continually evaluate the usefulness, relevance, limitations, and calculation of our reported non-GAAP measures to determine how best to provide relevant information to the public, and thus such reported non-GAAP measures could change. See "Defined Terms" in "Item 1. Business " for additional information regarding the definition of and other information regarding the non-GAAP measures we present in this Report.
We do not consider non-GAAP measures as an alternative to financial measures determined in accordance with GAAP, rather they supplement GAAP measures by providing additional information we believe to be useful to our shareholders. The principal limitation of these non-GAAP measures is they may exclude significant expense and income items that are required by GAAP to be recognized in our Consolidated Financial Statements. In addition, they reflect the exercise of management's judgment about which expense and income items are excluded or included in determining these non-GAAP measures. In order to compensate for these limitations, reconciliations of the non-GAAP measures we use to their most directly comparable GAAP measures are provided, including as set forth below. Non-GAAP measures should not be relied upon in evaluating the financial condition, results of operations, or future prospects.
Pro-rata Same Property NOI:
Pro-rata same property NOI, excluding termination fees/expenses, changed from the following major components:
|
(in thousands) |
|
2023 |
|
|
2022 |
|
|
Change |
|
|||
|
Real estate revenues: |
|
|
|
|
|
|
|
|
|
|||
|
Base rent |
|
$ |
940,556 |
|
|
|
908,351 |
|
|
|
32,205 |
|
|
Recoveries from tenants |
|
|
328,314 |
|
|
|
308,930 |
|
|
|
19,384 |
|
|
Percentage rent |
|
|
14,531 |
|
|
|
11,040 |
|
|
|
3,491 |
|
|
Termination fees |
|
|
7,833 |
|
|
|
5,007 |
|
|
|
2,826 |
|
|
Uncollectible lease income |
|
|
(361 |
) |
|
|
14,496 |
|
|
|
(14,857 |
) |
|
Other lease income |
|
|
12,450 |
|
|
|
11,945 |
|
|
|
505 |
|
|
Other property income |
|
|
9,229 |
|
|
|
8,580 |
|
|
|
649 |
|
|
Total real estate revenue |
|
|
1,312,552 |
|
|
|
1,268,349 |
|
|
|
44,203 |
|
|
Real estate operating expenses: |
|
|
|
|
|
|
|
|
|
|||
|
Operating and maintenance |
|
|
222,139 |
|
|
|
202,017 |
|
|
|
20,122 |
|
|
Real estate taxes |
|
|
168,825 |
|
|
|
162,926 |
|
|
|
5,899 |
|
|
Ground rent |
|
|
11,992 |
|
|
|
11,761 |
|
|
|
231 |
|
|
Total real estate operating expenses |
|
|
402,956 |
|
|
|
376,704 |
|
|
|
26,252 |
|
|
Pro-rata same property NOI |
|
$ |
909,596 |
|
|
|
891,645 |
|
|
|
17,951 |
|
|
Less: Termination fees / expense |
|
|
7,833 |
|
|
|
5,007 |
|
|
|
2,826 |
|
|
Pro-rata same property NOI, excluding termination fees / expense |
|
$ |
901,763 |
|
|
|
886,638 |
|
|
|
15,125 |
|
|
Pro-rata same property NOI growth, excluding termination fees / expense |
|
|
|
|
|
|
|
|
1.7 |
% |
||
Real estate revenue increased $44.2 million, on a net basis, as follows:
49
Total real estate operating expense increased $26.3 million, on a net basis, as follows:
Same Property Roll-forward:
Our same property pool includes the following property count, Pro-rata GLA, and changes therein:
|
|
|
2023 |
|
|
2022 |
|
||||||||||
|
(GLA in thousands) |
|
Property
|
|
|
GLA |
|
|
Property
|
|
|
GLA |
|
||||
|
Beginning same property count |
|
|
389 |
|
|
|
41,383 |
|
|
|
393 |
|
|
|
41,294 |
|
|
Acquired properties owned for entirety of comparable periods |
|
|
5 |
|
|
|
771 |
|
|
|
— |
|
|
|
327 |
|
|
Developments that reached completion by beginning of earliest comparable period presented |
|
|
— |
|
|
|
— |
|
|
|
1 |
|
|
|
72 |
|
|
Disposed properties |
|
|
(1 |
) |
|
|
(27 |
) |
|
|
(5 |
) |
|
|
(195 |
) |
|
SF adjustments (1) |
|
|
— |
|
|
|
8 |
|
|
|
— |
|
|
|
(115 |
) |
|
Change in intended property use |
|
|
1 |
|
|
|
— |
|
|
|
— |
|
|
|
— |
|
|
Ending same property count |
|
|
394 |
|
|
|
42,135 |
|
|
|
389 |
|
|
|
41,383 |
|
Nareit FFO and Core Operating Earnings:
Our reconciliation of net income attributable to common stock and unit holders to Nareit FFO and to Core Operating Earnings is as follows:
|
(in thousands, except share information) |
|
2023 |
|
|
2022 |
|
||
|
Reconciliation of Net income to Nareit FFO |
|
|
|
|
|
|
||
|
Net income attributable to common shareholders |
|
$ |
359,500 |
|
|
|
482,865 |
|
|
Adjustments to reconcile to Nareit FFO: (1) |
|
|
|
|
|
|
||
|
Depreciation and amortization (excluding FF&E) |
|
|
378,400 |
|
|
|
344,629 |
|
|
Gain on sale of real estate |
|
|
(3,822 |
) |
|
|
(121,835 |
) |
|
Exchangeable operating partnership units |
|
|
2,008 |
|
|
|
2,105 |
|
|
Nareit FFO attributable to common stock and unit holders |
|
$ |
736,086 |
|
|
|
707,764 |
|
|
Reconciliation of Nareit FFO to Core Operating Earnings |
|
|
|
|
|
|
||
|
Nareit Funds From Operations |
|
$ |
736,086 |
|
|
|
707,764 |
|
|
Adjustments to reconcile to Core Operating Earnings: (1) |
|
|
|
|
|
|
||
|
Not Comparable Items |
|
|
|
|
|
|
||
|
Merger transition costs |
|
|
4,620 |
|
|
|
— |
|
|
Early extinguishment of debt |
|
|
(99 |
) |
|
|
176 |
|
|
Certain Non Cash Items |
|
|
|
|
|
|
||
|
Straight-line rent |
|
|
(11,060 |
) |
|
|
(11,327 |
) |
|
Uncollectible straight-line rent |
|
|
(1,174 |
) |
|
|
(14,155 |
) |
|
Above/below market rent amortization, net |
|
|
(29,869 |
) |
|
|
(21,434 |
) |
|
Debt premium/discount amortization |
|
|
2,352 |
|
|
|
(184 |
) |
|
Core Operating Earnings |
|
$ |
700,856 |
|
|
|
660,840 |
|
50
Reconciliation of Same Property NOI to Nearest GAAP Measure:
Our reconciliation of Net income attributable to common shareholders to Same Property NOI, on a Pro-rata basis, is as follows:
|
(in thousands) |
|
2023 |
|
|
2022 |
|
||
|
Net income attributable to common shareholders |
|
$ |
359,500 |
|
|
|
482,865 |
|
|
Less: |
|
|
|
|
|
|
||
|
Management, transaction, and other fees |
|
|
26,954 |
|
|
|
25,851 |
|
|
Other (1) |
|
|
46,084 |
|
|
|
51,090 |
|
|
Plus: |
|
|
|
|
|
|
||
|
Depreciation and amortization |
|
|
352,282 |
|
|
|
319,697 |
|
|
General and administrative |
|
|
97,806 |
|
|
|
79,903 |
|
|
Other operating expense |
|
|
9,459 |
|
|
|
6,166 |
|
|
Other expense |
|
|
147,824 |
|
|
|
44,102 |
|
|
Equity in income of investments in real estate excluded from NOI (2) |
|
|
46,088 |
|
|
|
35,824 |
|
|
Net income attributable to noncontrolling interests |
|
|
6,310 |
|
|
|
5,170 |
|
|
Preferred stock dividends |
|
|
5,057 |
|
|
|
— |
|
|
Pro-rata NOI |
|
|
951,288 |
|
|
|
896,786 |
|
|
Less non-same property NOI (3) |
|
|
(41,692 |
) |
|
|
(5,141 |
) |
|
Pro-rata same property NOI |
|
$ |
909,596 |
|
|
|
891,645 |
|
Liquidity and Capital Resources
General
We use cash flows generated from operating, investing, and financing activities to strengthen our balance sheet, finance our development and redevelopment projects, fund our investment activities, and maintain financial flexibility. A significant portion of our cash from operations is distributed to our common shareholders in the form of dividends in order to maintain our status as a REIT.
Except for $200 million of private placement debt, our Parent Company has no capital commitments other than its guarantees of the commitments of our Operating Partnership. All remaining debt is held by our Operating Partnership, its subsidiaries, or by our real estate partnerships. The Operating Partnership is a co-issuer and a guarantor of the $200 million of outstanding debt of our Parent Company. The Parent Company will from time to time access the capital markets for the purpose of issuing new equity, and will simultaneously contribute all of the offering proceeds to the Operating Partnership in exchange for additional partnership units.
We continually assess our available liquidity and our expected cash requirements, including monitoring our tenant rent collections. We have access to and draw on multiple financing sources to fund our operations and our long-term capital needs, including the requirements of our in process and planned developments, redevelopments, other capital expenditures, and the repayment of debt. We expect to meet these needs by using a combination of the following: cash flow from operations after funding our common stock and preferred stock dividends, borrowings from our Line, proceeds from the sale of real estate, mortgage loan and unsecured bank financing, distributions received from our real estate partnerships, and when the capital markets are favorable, proceeds from the sale of equity securities or the issuance of new unsecured debt. We continually evaluate alternative financing options, and we believe we can obtain new financing on reasonable terms, although likely at higher interest rates than that of our debt currently outstanding, due to the current interest rate environment.
On January 8, 2024, Regency priced a public offering of $400 million of senior unsecured notes due 2034 (the “2024 Notes”) under our existing shelf registration filed with the SEC. The Notes mature on January 15, 2034, and were issued at 99.617% of par value with a coupon of 5.25%. We have $250 million of unsecured debt maturing in June 2024, which we intend to pay off by utilizing the proceeds available from the 2024 Notes. In addition, we have $148.3 million of secured mortgage maturities during the next 12 months, including mortgages within our real estate partnerships, which we intend to refinance or pay-off as they mature. Based upon our available cash balance, sources of capital, our current credit ratings, and the number of high quality, unencumbered properties we own, we believe our available capital resources are sufficient to meet our expected capital needs for the next year, although, in the longer term, we can provide no assurances.
51
In addition to our $85.0 million of unrestricted cash, we have the following additional sources of capital available:
|
(in thousands) |
|
December 31, 2023 |
|
|
|
ATM program (see note 12 to our Consolidated Financial Statements) |
|
|
|
|
|
Original offering amount |
|
$ |
500,000 |
|
|
Available capacity |
|
$ |
500,000 |
|
|
Line of Credit (see note 9 to our Consolidated Financial Statements) |
|
|
|
|
|
Total commitment amount (2) |
|
$ |
1,250,000 |
|
|
Available capacity (1) |
|
$ |
1,090,285 |
|
|
Maturity (2) |
|
March 23, 2025 |
|
|
The declaration of dividends is determined quarterly by our Board of Directors. On February 7, 2024, our Board of Directors:
While future dividends will be determined at the discretion of our Board of Directors, we plan to continue paying an aggregate amount of distributions to our stock and unit holders that, at a minimum, meet the requirements to continue qualifying as a REIT for federal income tax purposes. We have historically generated sufficient cash flow from operations to fund our dividend distributions. During the years ended December 31, 2023 and 2022, we generated cash flow from operations of $719.6 million and $655.8 million, respectively, and paid $458.8 million in dividends to our common and preferred stock and unit holders, and $430.1 million in dividends to our common stock and unit holders, respectively.
We currently have development and redevelopment projects in various stages of construction, along with a pipeline of potential projects for future development or redevelopment. After funding our common and preferred stock dividend payments in January 2024, we estimate that we will require capital during the next 12 months of approximately $677.8 million related to leasing commissions, tenant improvements, in-process developments and redevelopments, capital contributions to our real estate partnerships, and repaying maturing debt. These capital requirements are being impacted by inflation resulting in increased costs of construction materials, labor, and services from third party contractors and suppliers. Further, continued challenges from permitting delays and labor shortages may extend the time to completion of these projects. In response, we have implemented mitigation strategies such as entering into fixed cost construction contracts, pre-ordering materials, and other planning efforts.
If we start new developments or redevelopments, commit to property acquisitions, repay debt prior to maturity, declare future dividends, or repurchase shares of our common stock, our cash requirements will increase. If we refinance maturing debt, our cash requirements will decrease.
We endeavor to maintain a high percentage of unencumbered assets. As of December 31, 2023, 87.1% of our wholly-owned real estate assets were unencumbered. Our low level of encumbered assets allows us to more readily access the secured and unsecured debt markets and to maintain borrowing capacity on the Line. Our trailing 12 month fixed charge coverage ratio, including our Pro-rata share of our partnerships, was 4.7x and 4.6x for the periods ended December 31, 2023 and 2022, respectively, and our Pro-rata net debt and Preferred Stock-to-operating EBITDA re adjusted ratio on a trailing 12 month basis was 5.4x and 5.0x, respectively, for the same periods. In light of the merger with UBP on August 18, 2023, the adjusted debt metric calculations include legacy Regency results for the trailing 12 months and the annualized contribution from UBP post merger.
Our Line and unsecured debt require that we remain in compliance with various covenants, which are described in note 9 to the Consolidated Financial Statements. The debt assumed in conjunction with the UBP acquisition contain covenants that are consistent with our existing debt covenants. We were in compliance with these covenants at December 31, 2023, and expect to remain in compliance.
52
Summary of Cash Flow Activity
The following table summarizes net cash flows related to operating, investing, and financing activities of the Company:
|
(in thousands) |
|
2023 |
|
|
2022 |
|
|
Change |
|
|||
|
Net cash provided by operating activities |
|
$ |
719,591 |
|
|
|
655,815 |
|
|
|
63,776 |
|
|
Net cash used in investing activities |
|
|
(341,978 |
) |
|
|
(206,108 |
) |
|
|
(135,870 |
) |
|
Net cash used in financing activities |
|
|
(355,035 |
) |
|
|
(475,958 |
) |
|
|
120,923 |
|
|
Net change in cash, cash equivalents, and restricted cash |
|
|
22,578 |
|
|
|
(26,251 |
) |
|
|
48,829 |
|
|
Total cash, cash equivalents, and restricted cash |
|
$ |
91,354 |
|
|
|
68,776 |
|
|
|
22,578 |
|
Net cash provided by operating activities:
Net cash provided by operating activities increased $63.8 million due to:
Net cash used in investing activities:
Net cash used in investing activities changed by $135.9 million as follows:
|
(in thousands) |
|
2023 |
|
|
2022 |
|
|
Change |
|
|||
|
Cash flows from investing activities: |
|
|
|
|
|
|
|
|
|
|||
|
Acquisition of operating real estate, net of cash acquired of $0, $3,061 and $2,991 in 2023, 2022 and 2021, respectively |
|
$ |
(45,386 |
) |
|
|
(169,639 |
) |
|
|
124,253 |
|
|
Acquisition of UBP, net of cash acquired of $14,143 |
|
|
(82,389 |
) |
|
|
— |
|
|
|
(82,389 |
) |
|
Real estate development and capital improvements |
|
|
(232,855 |
) |
|
|
(195,418 |
) |
|
|
(37,437 |
) |
|
Proceeds from sale of real estate |
|
|
11,167 |
|
|
|
143,133 |
|
|
|
(131,966 |
) |
|
Issuance of notes receivable |
|
|
(4,000 |
) |
|
|
— |
|
|
|
(4,000 |
) |
|
Collection of notes receivable |
|
|
4,000 |
|
|
|
1,823 |
|
|
|
2,177 |
|
|
Investments in real estate partnerships |
|
|
(13,119 |
) |
|
|
(36,266 |
) |
|
|
23,147 |
|
|
Return of capital from investments in real estate partnerships |
|
|
11,308 |
|
|
|
48,473 |
|
|
|
(37,165 |
) |
|
Dividends on investment securities |
|
|
1,283 |
|
|
|
1,113 |
|
|
|
170 |
|
|
Acquisition of investment securities |
|
|
(7,990 |
) |
|
|
(21,112 |
) |
|
|
13,122 |
|
|
Proceeds from sale of investment securities |
|
|
16,003 |
|
|
|
21,785 |
|
|
|
(5,782 |
) |
|
Net cash used in investing activities |
|
$ |
(341,978 |
) |
|
|
(206,108 |
) |
|
|
(135,870 |
) |
Significant changes in investing activities include:
53
We plan to continue developing and redeveloping shopping centers for long-term investment. During 2023, we deployed capital of $232.9 million for the development, redevelopment, and improvement of our real estate properties, comprised of the following:
|
(in thousands) |
|
2023 |
|
|
2022 |
|
|
Change |
|
|||
|
Capital expenditures: |
|
|
|
|
|
|
|
|
|
|||
|
Land acquisitions |
|
$ |
2,580 |
|
|
|
12,484 |
|
|
|
(9,904 |
) |
|
Building and tenant improvements |
|
|
92,609 |
|
|
|
75,420 |
|
|
|
17,189 |
|
|
Redevelopment costs |
|
|
88,426 |
|
|
|
68,730 |
|
|
|
19,696 |
|
|
Development costs |
|
|
34,981 |
|
|
|
27,861 |
|
|
|
7,120 |
|
|
Capitalized interest |
|
|
5,505 |
|
|
|
4,133 |
|
|
|
1,372 |
|
|
Capitalized direct compensation |
|
|
8,754 |
|
|
|
6,790 |
|
|
|
1,964 |
|
|
Real estate development and capital improvements |
|
$ |
232,855 |
|
|
|
195,418 |
|
|
|
37,437 |
|
The following table summarizes our development projects in-process and completed:
|
(in thousands, except cost PSF) |
|
|
|
|
|
|
|
|
|
December 31, 2023 |
|
|||||||||||||
|
Property Name |
|
Market |
|
Ownership |
|
Start Date |
|
Estimated Stabilization Year (1) |
|
Estimated / Actual Net
|
|
|
GLA (3) |
|
|
Cost PSF
|
|
|
% of Costs
|
|
||||
|
|
|
|
|
|
|
|
|
|
|
|
|
|
|
|
|
|
|
|
|
|
||||
|
Developments In-Process |
|
|
|
|
|
|
|
|
|
|
|
|
|
|
|
|
||||||||
|
Glenwood Green |
|
Metro NYC |
|
70% |
|
Q1-22 |
|
2025 |
|
|
46,172 |
|
|
|
247 |
|
|
|
187 |
|
|
|
81 |
% |
|
Baybrook East - Phase 1B (4) |
|
Houston, TX |
|
50% |
|
Q2-22 |
|
2025 |
|
|
10,384 |
|
|
|
78 |
|
|
|
133 |
|
|
|
77 |
% |
|
Sienna - Phase 1 |
|
Houston, TX |
|
75% |
|
Q2-23 |
|
2027 |
|
|
9,409 |
|
|
|
23 |
|
|
|
409 |
|
|
|
26 |
% |
|
The Shops at SunVet |
|
Long Island, NY |
|
100% |
|
Q2-23 |
|
2027 |
|
|
86,872 |
|
|
|
167 |
|
|
|
520 |
|
|
|
36 |
% |
|
Total Developments In-Process |
|
|
|
|
|
|
|
$ |
152,837 |
|
|
|
515 |
|
|
$ |
297 |
|
|
|
51 |
% |
||
54
The following table summarizes our redevelopment projects in-process and completed:
|
(in thousands) |
|
|
|
|
|
|
|
December 31, 2023 |
|
|||||||||||
|
Property Name |
|
Market |
|
Ownership |
|
Start Date |
|
Estimated Stabilization Year (1) |
|
Estimated Incremental Project Costs (2) (3) |
|
|
GLA (3) |
|
|
% of Costs Incurred |
|
|||
|
|
|
|
|
|
|
|
|
|
|
|
|
|
|
|
|
|
|
|||
|
Redevelopments In-Process |
|
|
|
|
|
|
|
|
|
|
|
|
|
|||||||
|
The Abbot |
|
Boston, MA |
|
100% |
|
Q2-19 |
|
2025 |
|
$ |
58,973 |
|
|
|
64 |
|
|
|
95 |
% |
|
Westbard Square Phase I |
|
Bethesda, MD |
|
100% |
|
Q2-21 |
|
2025 |
|
|
37,000 |
|
|
|
126 |
|
|
|
74 |
% |
|
Buckhead Landing |
|
Atlanta, GA |
|
100% |
|
Q2-22 |
|
2025 |
|
|
30,859 |
|
|
|
152 |
|
|
|
37 |
% |
|
Bloom on Third (fka Town and Country Center) |
|
Los Angeles, CA |
|
35% |
|
Q4-22 |
|
2027 |
|
|
24,525 |
|
|
|
51 |
|
|
|
24 |
% |
|
Mandarin Landing |
|
Jacksonville, FL |
|
100% |
|
Q2-23 |
|
2025 |
|
|
16,422 |
|
|
|
140 |
|
|
|
22 |
% |
|
Serramonte Center - Phase 3 |
|
San Francisco, CA |
|
100% |
|
Q2-23 |
|
2025 |
|
|
36,989 |
|
|
|
1,072 |
|
|
|
13 |
% |
|
Circle Marina Center |
|
Los Angeles, CA |
|
100% |
|
Q3-23 |
|
2025 |
|
|
14,986 |
|
|
|
118 |
|
|
|
10 |
% |
|
Avenida Biscayne |
|
Miami, FL |
|
100% |
|
Q4-23 |
|
2026 |
|
|
22,743 |
|
|
|
29 |
|
|
|
12 |
% |
|
Cambridge Square |
|
Atlanta, GA |
|
100% |
|
Q4-23 |
|
2026 |
|
|
15,002 |
|
|
|
73 |
|
|
|
3 |
% |
|
Various Redevelopments |
|
Various |
|
20% - 100% |
|
Various |
|
Various |
|
|
57,762 |
|
|
|
1,368 |
|
|
|
40 |
% |
|
Total Redevelopments In-Process |
|
|
|
|
|
|
|
$ |
315,261 |
|
|
|
3,193 |
|
|
|
43 |
% |
||
|
|
|
|
|
|
|
|
|
|
|
|
|
|
|
|
|
|
|
|||
|
Redevelopments Completed |
|
|
|
|
|
|
|
|
|
|
|
|
|
|||||||
|
The Crossing Clarendon |
|
Metro DC |
|
100% |
|
Q4-18 |
|
2024 |
|
$ |
55,679 |
|
|
|
129 |
|
|
|
|
|
|
Various Properties |
|
Various |
|
20% - 100% |
|
Various |
|
Various |
|
|
32,345 |
|
|
|
1,648 |
|
|
|
|
|
|
Total Redevelopments Completed |
|
|
|
|
|
|
|
$ |
88,024 |
|
|
|
1,777 |
|
|
|
|
|||
Net cash used in financing activities:
Net cash flows used in financing activities changed during 2023, as follows:
|
(in thousands) |
|
2023 |
|
|
2022 |
|
|
Change |
|
|||
|
Cash flows from financing activities: |
|
|
|
|
|
|
|
|
|
|||
|
Net proceeds from common stock issuances |
|
$ |
(33 |
) |
|
|
61,284 |
|
|
|
(61,317 |
) |
|
Repurchase of common shares in conjunction with equity award plans |
|
|
(7,662 |
) |
|
|
(6,447 |
) |
|
|
(1,215 |
) |
|
Common shares repurchased through share repurchase program |
|
|
(20,006 |
) |
|
|
(75,419 |
) |
|
|
55,413 |
|
|
Proceeds from sale of treasury stock, net |
|
|
103 |
|
|
|
64 |
|
|
|
39 |
|
|
Contributions from (Distributions to) limited partners in consolidated partnerships, net |
|
|
2,425 |
|
|
|
(7,245 |
) |
|
|
9,670 |
|
|
Dividend payments and operating partnership distributions |
|
|
(458,846 |
) |
|
|
(430,143 |
) |
|
|
(28,703 |
) |
|
Redemption of exchangeable operating partnership units |
|
|
(9,163 |
) |
|
|
— |
|
|
|
(9,163 |
) |
|
Proceeds from unsecured credit facilities, net |
|
|
152,000 |
|
|
|
— |
|
|
|
152,000 |
|
|
Proceeds from debt issuance |
|
|
59,500 |
|
|
|
— |
|
|
|
59,500 |
|
|
Debt repayment, including early redemption costs |
|
|
(72,827 |
) |
|
|
(17,964 |
) |
|
|
(54,863 |
) |
|
Payment of loan costs |
|
|
(526 |
) |
|
|
(88 |
) |
|
|
(438 |
) |
|
Net cash used in financing activities |
|
$ |
(355,035 |
) |
|
|
(475,958 |
) |
|
|
120,923 |
|
Significant financing activities during the years ended December 31, 2023 and 2022 included the following:
55
Contractual Obligations
We have contractual obligations at December 31, 2023, which are discussed in our notes to Consolidated Financial Statements and include:
Critical Accounting Estimates
Knowledge about our significant accounting policies is necessary for a complete understanding of our Consolidated Financial Statements. The preparation of our Consolidated Financial Statements requires that we make certain estimates, judgments, and assumptions that impact the balance of assets and liabilities as of the financial statement date and the reported amount of income and expenses during the financial reporting period. These accounting estimates, judgments and assumptions are based upon, but not limited to historical experience, current trends, expected future results, current market conditions, and interpretation of industry accounting standards. While the following is not intended to be a comprehensive list of our accounting estimates, the estimates discussed below are believed to be critical because of their significance to the Consolidated Financial Statements and the possibility that future events may differ from those judgments, or that the use of different assumptions could result in materially different estimates. We review these estimates on a periodic basis to ensure reasonableness; however, the amounts we may ultimately realize could differ from such estimates.
Valuation of Real Estate Investments Acquired from Urstadt Biddle Properties, Inc.
We generally account for an acquisition of a single real estate property or portfolio of real estate properties as an asset acquisition. We measure the real estate assets acquired based on their total cost of the acquisition and the total cost is allocated to the real estate
56
properties acquired and related lease intangibles on a relative fair value basis. The fair value of the real estate properties acquired is based on a valuation utilizing an income approach methodology, primarily by applying a market-specific capitalization rate to the estimated stabilized net operating income of the individual real estate properties. The fair value of land acquired is generally based on a valuation utilizing a market approach methodology that identifies comparable land sales.
Key assumptions may include stabilized net operating income and capitalization rates. Stabilized net operating income is based on several factors including property operating history, market rents, location, property conditions, amenities, local demographics, economic trends, and size of the property. We determine capitalization rates by market based on recent transactions and other market data and adjust, if necessary, based on the property characteristics. The fair value of land is generally based on relevant market data, such as a comparison of the subject site to similar parcels that have recently been sold or are currently being offered on the market for sale. The use of different assumptions, judgments and estimates to value the acquired properties and allocate the most significant portion of the purchase price among the land, buildings and improvements and identified intangible assets and liabilities could affect the depreciation and amortization expense we recognize over the estimated remaining useful life.
Impairment of Real Estate Investments
In accordance with GAAP, we evaluate our real estate for impairment whenever there are events or changes in circumstances, including property operating performance, general market conditions or changes in expected hold periods, that indicate that the carrying value of our real estate properties (including any related amortizable intangible assets or liabilities) may not be recoverable. If such events or changes occur, we compare the current carrying value of the asset to the estimated undiscounted cash flows that are directly associated with the use and ultimate disposition of the asset. Our estimated cash flows are based on several key assumptions, including rental rates, expected leasing activity, costs of tenant improvements, leasing commissions, expected hold period, comparable sales information, and assumptions regarding the residual value upon disposition, including the exit capitalization rate. These key assumptions are subjective in nature and the resulting impairment, if any, could differ from the actual gain or loss recognized upon ultimate sale in an arm's length transaction. If the carrying value of the asset exceeds the estimated undiscounted cash flows, an impairment loss is recognized equal to the excess of carrying value over the estimated fair value.
The estimated fair value of real estate assets is subjective and is estimated through comparable sales information and other market data if available, as well as the use of an income approach such as the direct capitalization method or the discounted cash flow approach. The discounted cash flow method uses similar assumptions to the undiscounted cash flow method above, as well as a discount rate. Such cash flow projections and rates are subject to management judgment and changes in those assumptions could impact the estimation of fair value. In estimating the fair value of undeveloped land, we generally use market data and comparable sales information. Changes in events or changes in circumstances may alter the expected hold period of an asset or asset group, which may result in an impairment loss and such loss could be material to the Company's financial condition or operating performance.
Recent Accounting Pronouncements
See note 1 to Consolidated Financial Statements.
Environmental Matters
We are subject to numerous environmental laws and regulations, which primarily pertain to chemicals historically used by certain current and former dry cleaning and gas station tenants and the existence of asbestos in older shopping centers. We believe that the relatively few tenants who currently operate dry cleaning plants or gas stations do so in accordance with current laws and regulations. Generally, we endeavor to require tenants to remove dry cleaning plants from our shopping centers or convert them to more environmentally friendly systems, in accordance with the terms of our leases. We carry an environmental insurance policy for certain third-party liabilities and, in certain circumstances, remediation costs on shopping centers for currently unknown contamination. We have also secured environmental insurance policies, where appropriate, on a relatively small number of specific properties with known contamination, in order to mitigate our environmental risk. We monitor the shopping centers containing environmental issues and in certain cases voluntarily remediate the sites. We also have legal obligations to remediate certain sites and we are in the process of doing so.
As of December 31, 2023, we had accrued liabilities of $19.4 million for our Pro-rata share of environmental remediation, including our Investments in real estate partnerships. We believe that the ultimate remediation of currently known environmental matters will not have a material effect on our financial position, cash flows, or results of operations. We can give no assurance that existing environmental studies on our shopping centers have revealed all potential environmental contamination; that our estimate of liabilities will not change as more information becomes available; that any previous owner, occupant or tenant did not create any material environmental condition not known to us; that the current environmental condition of the shopping centers will not be affected by tenants and occupants, by the condition of nearby properties, or by unrelated third parties; or that changes in applicable environmental laws and regulations or their interpretation will not result in additional environmental liability to us.
57
Item 7A. Quantitative and Qualita tive Disclosures about Market Risk
We are exposed to two significant components of interest rate risk:
We continuously monitor the capital markets and evaluate our ability to issue new debt, to repay maturing debt, or to fund our commitments. We continue to believe, in light of our credit ratings, the available capacity under our unsecured credit facility, and the number of high quality, unencumbered properties that we own which could collateralize borrowings, we will be able to successfully issue new secured or unsecured debt to fund maturing debt obligations. It is uncertain the degree to which capital market volatility and rising interest rates will adversely impact the interest rates on any new debt that we may issue.
Our interest rate risk is monitored using a variety of techniques. The table below presents the principal cash flows, weighted average interest rates of remaining debt, and the fair value of total debt as of December 31, 2023. For variable rate mortgages and unsecured credit facilities for which we have interest rate swaps in place to fix the interest rate, they are included in the Fixed rate debt section below at their all-in fixed rate. The table is presented by year of expected maturity to evaluate the expected cash flows and sensitivity to interest rate changes. Although the average interest rate for variable rate debt is included in the table, those rates represent rates that existed as of December 31, 2023, and are subject to change on a monthly basis. In addition, we continually assess the market risk for floating rate debt and believe that a 1% increase in interest rates would decrease future earnings and cash flows by approximately $1,557,500 per year based on $155.8 million of floating rate mortgage debt and floating rate line of credit balances outstanding at December 31, 2023. If we increase our line of credit balance in the future, additional decreases to future earnings and cash flows could occur.
Further, the table below incorporates only those exposures that exist as of December 31, 2023, and does not consider exposures or positions that could arise after that date or obligations repaid before maturity. Since firm commitments are not presented, the table has limited predictive value. As a result, our ultimate realized gain or loss with respect to interest rate fluctuations will depend on the exposures that arise during the period, our hedging strategies at that time, and actual interest rates.
The table below presents the principal cash flow payments associated with our outstanding debt by year, weighted average interest rates on debt outstanding at each year-end, and fair value of total debt as of December 31, 2023.
|
(dollars in thousands) |
|
2024 |
|
|
2025 |
|
|
2026 |
|
|
2027 |
|
|
2028 |
|
|
Thereafter |
|
|
Total |
|
|
Fair Value |
|
||||||||
|
Fixed rate debt (1) |
|
$ |
395,978 |
|
|
|
309,882 |
|
|
|
359,273 |
|
|
|
756,170 |
|
|
|
343,580 |
|
|
|
1,864,200 |
|
|
|
4,029,083 |
|
|
|
3,759,418 |
|
|
Average interest rate for all fixed rate debt (2) |
|
|
3.86 |
% |
|
|
3.88 |
% |
|
|
3.88 |
% |
|
|
3.87 |
% |
|
|
3.94 |
% |
|
|
3.86 |
% |
|
|
|
|
|
|
||
|
Variable rate SOFR debt (1) |
|
$ |
— |
|
|
|
155,750 |
|
|
|
— |
|
|
|
— |
|
|
|
— |
|
|
|
— |
|
|
|
155,750 |
|
|
|
155,734 |
|
|
Average interest rate for all variable rate debt (2) |
|
|
5.89 |
% |
|
|
5.89 |
% |
|
|
— |
% |
|
|
— |
% |
|
|
— |
% |
|
|
— |
% |
|
|
|
|
|
|
||
58
Item 8. Consolidated Financial Statements and Supplementary Data
Regency Centers Corporation and Regency Centers, L.P.
Index to Financial Statements
All other schedules are omitted because of the absence of conditions under which they are required, materiality or because information required therein is shown in the Consolidated Financial Statements or notes thereto.
59
Rep ort of Independent Regist ered Public Accounting Firm
To the Shareholders and the Board of Directors of
Regency Centers Corporation:
Opinion on the Consolidated Financial Statements
We have audited the accompanying consolidated balance sheets of Regency Centers Corporation and subsidiaries (the Company) as of December 31, 2023 and 2022, the related consolidated statements of operations, comprehensive income, equity, and cash flows for each of the years in the three-year period ended December 31, 2023, and the related notes and financial statement schedule III - Consolidated Real Estate and Accumulated Depreciation (collectively, the consolidated financial statements). In our opinion, the consolidated financial statements present fairly, in all material respects, the financial position of the Company as of December 31, 2023 and 2022, and the results of its operations and its cash flows for each of the years in the three-year period ended December 31, 2023, in conformity with U.S. generally accepted accounting principles.
We also have audited, in accordance with the standards of the Public Company Accounting Oversight Board (United States) (PCAOB), the Company’s internal control over financial reporting as of December 31, 2023, based on criteria established in Internal Control – Integrated Framework (2013) issued by the Committee of Sponsoring Organizations of the Treadway Commission, and our report dated February 16, 2024 expressed an unqualified opinion on the effectiveness of the Company’s internal control over financial reporting.
Basis for Opinion
These consolidated financial statements are the responsibility of the Company’s management. Our responsibility is to express an opinion on these consolidated financial statements based on our audits. We are a public accounting firm registered with the PCAOB and are required to be independent with respect to the Company in accordance with the U.S. federal securities laws and the applicable rules and regulations of the Securities and Exchange Commission and the PCAOB.
We conducted our audits in accordance with the standards of the PCAOB. Those standards require that we plan and perform the audit to obtain reasonable assurance about whether the consolidated financial statements are free of material misstatement, whether due to error or fraud. Our audits included performing procedures to assess the risks of material misstatement of the consolidated financial statements, whether due to error or fraud, and performing procedures that respond to those risks. Such procedures included examining, on a test basis, evidence regarding the amounts and disclosures in the consolidated financial statements. Our audits also included evaluating the accounting principles used and significant estimates made by management, as well as evaluating the overall presentation of the consolidated financial statements. We believe that our audits provide a reasonable basis for our opinion.
Critical Audit Matter
The critical audit matters communicated below are matters arising from the current period audit of the consolidated financial statements that were communicated or required to be communicated to the audit committee and that: (1) relate to accounts or disclosures that are material to the consolidated financial statements and (2) involved our especially challenging, subjective, or complex judgments. The communication of critical audit matters does not alter in any way our opinion on the consolidated financial statements, taken as a whole, and we are not, by communicating the critical audit matters below, providing separate opinions on the critical audit matters or on the accounts or disclosures to which they relate.
Evaluation of expected hold periods for certain real estate assets
As discussed in Note 1 to the consolidated financial statements and presented on the consolidated balance sheet, real estate assets, less accumulated depreciation was $10.8 billion as of December 31, 2023. The Company evaluates real estate properties (including any related amortizable intangible assets or liabilities) for impairment whenever there are events or changes in circumstances that indicate the carrying value of the real estate properties may not be recoverable.
We identified the Company’s assessment of events or changes in circumstances that could indicate a shortened expected hold period for certain real estate properties as a critical audit matter. Subjective auditor judgment was required to evaluate the events or changes in circumstances assessed by the Company that could indicate shortened expected hold periods for certain real estate properties. A shortening of the expected hold period could indicate a potential impairment.
60
The following are the primary procedures we performed to address this critical audit matter. We evaluated the design and tested the operating effectiveness of a control related to the Company’s assessment of events or changes in circumstances that could indicate shortened expected hold periods for certain real estate properties. To evaluate relevant events or changes in circumstances indicating a potential shortening of the expected holding period, we:
Acquisition of Urstadt Biddle Properties, Inc.
As discussed in Note 1 and 2 to the consolidated financial statements, the Company acquired Urstadt Biddle Properties, Inc. (UBP) for $1.1 billion on August 18, 2023, and the acquisition was accounted for as an asset acquisition. In asset acquisitions, the Company measures the real estate assets acquired based on their total cost of the acquisition and the total cost is allocated to the real estate properties acquired and related lease intangibles on a relative fair value basis. The fair value of the real estate properties acquired is based on a valuation utilizing an income approach methodology, primarily by applying a market-specific capitalization rate to the estimated stabilized net operating income of the individual real estate properties. The fair value of land acquired is generally based on a valuation utilizing a market approach methodology that identifies comparable land sales.
We identified the evaluation of the fair value measurement of certain real estate properties acquired, including the fair value measurement of certain land acquired, in the UBP acquisition as a critical audit matter. Specifically, subjective auditor judgment and specialized skills and knowledge were required to evaluate the capitalization rates used to measure the fair value of certain real estate properties acquired and to assess the comparable land sales used to measure the fair value of certain land acquired.
The following are the primary procedures we performed to address this critical audit matter. We evaluated the design and tested the operating effectiveness of certain internal controls over the Company’s fair value measurement process for the real estate properties acquired. This included controls over the capitalization rates used to measure the fair value of certain real estate properties acquired and the comparable land sales used to measure the fair value of certain land acquired. For certain real estate properties and land acquired we involved valuation professionals with specialized skills and knowledge, who assisted in:
/s/ KPMG LLP
We have served as the Company's auditor since 1993.
Jacksonville, Florida
February 16, 2024
61
Report of Independent Registered Public Accounting Firm
To the Shareholders and the Board of Directors of
Regency Centers Corporation:
Opinion on Internal Control Over Financial Reporting
We have audited Regency Centers Corporation and subsidiaries' (the Company) internal control over financial reporting as of December 31, 2023, based on criteria established in Internal Control – Integrated Framework (2013) issued by the Committee of Sponsoring Organizations of the Treadway Commission. In our opinion, the Company maintained, in all material respects, effective internal control over financial reporting as of December 31, 2023, based on criteria established in Internal Control – Integrated Framework (2013) issued by the Committee of Sponsoring Organizations of the Treadway Commission.
We also have audited, in accordance with the standards of the Public Company Accounting Oversight Board (United States) (PCAOB), the consolidated balance sheets of the Company as of December 31, 2023 and 2022, the related consolidated statements of operations, comprehensive income, equity, and cash flows for each of the years in the three-year period ended December 31, 2023, and the related notes and financial statement schedule III - Consolidated Real Estate and Accumulated Depreciation (collectively, the consolidated financial statements), and our report dated February 16, 2024 expressed an unqualified opinion on those consolidated financial statements.
Basis for Opinion
The Company’s management is responsible for maintaining effective internal control over financial reporting and for its assessment of the effectiveness of internal control over financial reporting, included in the accompanying Management's Report on Internal Control Over Financial Reporting. Our responsibility is to express an opinion on the Company’s internal control over financial reporting based on our audit. We are a public accounting firm registered with the PCAOB and are required to be independent with respect to the Company in accordance with the U.S. federal securities laws and the applicable rules and regulations of the Securities and Exchange Commission and the PCAOB.
We conducted our audit in accordance with the standards of the PCAOB. Those standards require that we plan and perform the audit to obtain reasonable assurance about whether effective internal control over financial reporting was maintained in all material respects. Our audit of internal control over financial reporting included obtaining an understanding of internal control over financial reporting, assessing the risk that a material weakness exists, and testing and evaluating the design and operating effectiveness of internal control based on the assessed risk. Our audit also included performing such other procedures as we considered necessary in the circumstances. We believe that our audit provides a reasonable basis for our opinion.
Definition and Limitations of Internal Control Over Financial Reporting
A company’s internal control over financial reporting is a process designed to provide reasonable assurance regarding the reliability of financial reporting and the preparation of financial statements for external purposes in accordance with generally accepted accounting principles. A company’s internal control over financial reporting includes those policies and procedures that (1) pertain to the maintenance of records that, in reasonable detail, accurately and fairly reflect the transactions and dispositions of the assets of the company; (2) provide reasonable assurance that transactions are recorded as necessary to permit preparation of financial statements in accordance with generally accepted accounting principles, and that receipts and expenditures of the company are being made only in accordance with authorizations of management and directors of the company; and (3) provide reasonable assurance regarding prevention or timely detection of unauthorized acquisition, use, or disposition of the company’s assets that could have a material effect on the financial statements.
Because of its inherent limitations, internal control over financial reporting may not prevent or detect misstatements. Also, projections of any evaluation of effectiveness to future periods are subject to the risk that controls may become inadequate because of changes in conditions, or that the degree of compliance with the policies or procedures may deteriorate.
/s/ KPMG LLP
Jacksonville, Florida
February 16, 2024
62
Report of Independent Registered Public Accounting Firm
To the Board of Directors of Regency Centers Corporation
and the Partners of Regency Centers, L.P.:
Opinion on the Consolidated Financial Statements
We have audited the accompanying consolidated balance sheets of Regency Centers, L.P. and subsidiaries (the Partnership) as of December 31, 2023 and 2022, the related consolidated statements of operations, comprehensive income, capital, and cash flows for each of the years in the three-year period ended December 31, 2023, and the related notes and financial statement schedule III - Consolidated Real Estate and Accumulated Depreciation (collectively, the consolidated financial statements). In our opinion, the consolidated financial statements present fairly, in all material respects, the financial position of the Partnership as of December 31, 2023 and 2022, and the results of its operations and its cash flows for each of the years in the three-year period ended December 31, 2023, in conformity with U.S. generally accepted accounting principles.
We also have audited, in accordance with the standards of the Public Company Accounting Oversight Board (United States) (PCAOB), the Partnership’s internal control over financial reporting as of December 31, 2023, based on criteria established in Internal Control – Integrated Framework (2013) issued by the Committee of Sponsoring Organizations of the Treadway Commission, and our report dated February 16, 2024 expressed an unqualified opinion on the effectiveness of the Partnership’s internal control over financial reporting.
Basis for Opinion
These consolidated financial statements are the responsibility of the Partnership’s management. Our responsibility is to express an opinion on these consolidated financial statements based on our audits. We are a public accounting firm registered with the PCAOB and are required to be independent with respect to the Partnership in accordance with the U.S. federal securities laws and the applicable rules and regulations of the Securities and Exchange Commission and the PCAOB.
We conducted our audits in accordance with the standards of the PCAOB. Those standards require that we plan and perform the audit to obtain reasonable assurance about whether the consolidated financial statements are free of material misstatement, whether due to error or fraud. Our audits included performing procedures to assess the risks of material misstatement of the consolidated financial statements, whether due to error or fraud, and performing procedures that respond to those risks. Such procedures included examining, on a test basis, evidence regarding the amounts and disclosures in the consolidated financial statements. Our audits also included evaluating the accounting principles used and significant estimates made by management, as well as evaluating the overall presentation of the consolidated financial statements. We believe that our audits provide a reasonable basis for our opinion.
Critical Audit Matter
The critical audit matters communicated below are matters arising from the current period audit of the consolidated financial statements that were communicated or required to be communicated to the audit committee and that: (1) relate to accounts or disclosures that are material to the consolidated financial statements and (2) involved our especially challenging, subjective, or complex judgments. The communication of critical audit matters does not alter in any way our opinion on the consolidated financial statements, taken as a whole, and we are not, by communicating the critical audit matters below, providing separate opinions on the critical audit matters or on the accounts or disclosures to which they relate.
Evaluation of expected hold periods for certain real estate assets
As discussed in Note 1 to the consolidated financial statements and presented on the consolidated balance sheet, real estate assets, less accumulated depreciation was $10.8 billion as of December 31, 2023. The Partnership evaluates real estate properties (including any related amortizable intangible assets or liabilities) for impairment whenever there are events or changes in circumstances that indicate the carrying value of the real estate properties may not be recoverable.
We identified the Partnership’s assessment of events or changes in circumstances that could indicate a shortened expected hold period for certain real estate properties as a critical audit matter. Subjective auditor judgment was required to evaluate the events or changes in circumstances assessed by the Partnership that could indicate shortened expected hold periods for certain real estate properties. A shortening of the expected hold period could indicate a potential impairment.
63
The following are the primary procedures we performed to address this critical audit matter. We evaluated the design and tested the operating effectiveness of a control related to the Partnership’s assessment of events or changes in circumstances that could indicate shortened expected hold periods for certain real estate properties. To evaluate relevant events or changes in circumstances indicating a potential shortening of the expected holding period, we:
Acquisition of Urstadt Biddle Properties, Inc.
As discussed in Note 1 and 2 to the consolidated financial statements, the Partnership acquired Urstadt Biddle Properties, Inc. (UBP) for $1.1 billion on August 18, 2023, and the acquisition was accounted for as an asset acquisition. In asset acquisitions, the Partnership measures the real estate assets acquired based on their total cost of the acquisition and the total cost is allocated to the real estate properties acquired and related lease intangibles on a relative fair value basis. The fair value of the real estate properties acquired is based on a valuation utilizing an income approach methodology, primarily by applying a market-specific capitalization rate to the estimated stabilized net operating income of the individual real estate properties. The fair value of land acquired is generally based on a valuation utilizing a market approach methodology that identifies comparable land sales.
We identified the evaluation of the fair value measurement of certain real estate properties acquired, including the fair value measurement of certain land acquired, in the UBP acquisition as a critical audit matter. Specifically, subjective auditor judgment and specialized skills and knowledge were required to evaluate the capitalization rates used to measure the fair value of certain real estate properties acquired and to assess the comparable land sales used to measure the fair value of certain land acquired.
The following are the primary procedures we performed to address this critical audit matter. We evaluated the design and tested the operating effectiveness of certain internal controls over the Partnership's fair value measurement process for the real estate properties acquired. This included controls over the capitalization rates used to measure the fair value of certain real estate properties acquired and the comparable land sales used to measure the fair value of certain land acquired. For certain real estate properties and land acquired we involved valuation professionals with specialized skills and knowledge, who assisted in:
/s/ KPMG LLP
We have served as the Partnership's auditor since 1998.
Jacksonville, Florida
February 16, 2024
64
Report of Independent Registered Public Accounting Firm
To the Board of Directors of Regency Centers Corporation
and the Partners of Regency Centers, L.P.:
Opinion on Internal Control Over Financial Reporting
We have audited Regency Centers, L.P. and subsidiaries' (the Partnership) internal control over financial reporting as of December 31, 2023, based on criteria established in Internal Control – Integrated Framework (2013) issued by the Committee of Sponsoring Organizations of the Treadway Commission. In our opinion, the Partnership maintained, in all material respects, effective internal control over financial reporting as of December 31, 2023, based on criteria established in Internal Control – Integrated Framework (2013) issued by the Committee of Sponsoring Organizations of the Treadway Commission.
We also have audited, in accordance with the standards of the Public Company Accounting Oversight Board (United States) (PCAOB), the consolidated balance sheets of the Partnership as of December 31, 2023 and 2022, the related consolidated statements of operations, comprehensive income, capital, and cash flows for each of the years in the three-year period ended December 31, 2023, and the related notes and financial statement schedule III - Consolidated Real Estate and Accumulated Depreciation (collectively, the consolidated financial statements), and our report dated February 16, 2024 expressed an unqualified opinion on those consolidated financial statements.
Basis for Opinion
The Partnership’s management is responsible for maintaining effective internal control over financial reporting and for its assessment of the effectiveness of internal control over financial reporting, included in the accompanying Management's Report on Internal Control Over Financial Reporting. Our responsibility is to express an opinion on the Partnership’s internal control over financial reporting based on our audit. We are a public accounting firm registered with the PCAOB and are required to be independent with respect to the Partnership in accordance with the U.S. federal securities laws and the applicable rules and regulations of the Securities and Exchange Commission and the PCAOB.
We conducted our audit in accordance with the standards of the PCAOB. Those standards require that we plan and perform the audit to obtain reasonable assurance about whether effective internal control over financial reporting was maintained in all material respects. Our audit of internal control over financial reporting included obtaining an understanding of internal control over financial reporting, assessing the risk that a material weakness exists, and testing and evaluating the design and operating effectiveness of internal control based on the assessed risk. Our audit also included performing such other procedures as we considered necessary in the circumstances. We believe that our audit provides a reasonable basis for our opinion.
Definition and Limitations of Internal Control Over Financial Reporting
A company’s internal control over financial reporting is a process designed to provide reasonable assurance regarding the reliability of financial reporting and the preparation of financial statements for external purposes in accordance with generally accepted accounting principles. A company’s internal control over financial reporting includes those policies and procedures that (1) pertain to the maintenance of records that, in reasonable detail, accurately and fairly reflect the transactions and dispositions of the assets of the company; (2) provide reasonable assurance that transactions are recorded as necessary to permit preparation of financial statements in accordance with generally accepted accounting principles, and that receipts and expenditures of the company are being made only in accordance with authorizations of management and directors of the company; and (3) provide reasonable assurance regarding prevention or timely detection of unauthorized acquisition, use, or disposition of the company’s assets that could have a material effect on the financial statements.
Because of its inherent limitations, internal control over financial reporting may not prevent or detect misstatements. Also, projections of any evaluation of effectiveness to future periods are subject to the risk that controls may become inadequate because of changes in conditions, or that the degree of compliance with the policies or procedures may deteriorate.
/s/ KPMG LLP
Jacksonville, Florida
February 16, 2024
65
RE GENCY CENTERS CORPORATION
Consolidated Balance Sheets
December 31, 2023 and 2022
(in thousands, except share data)
|
|
|
2023 |
|
|
2022 |
|
||
|
Assets |
|
|
|
|
|
|
||
|
Net real estate investments: |
|
|
|
|
|
|
||
|
Real estate assets, at cost (note 1) |
|
$ |
|
|
|
|
|
|
|
Less: accumulated depreciation |
|
|
|
|
|
|
|
|
|
Real estate assets, net |
|
|
|
|
|
|
|
|
|
Investments in sales-type lease, net |
|
|
|
|
|
|
— |
|
|
Investments in real estate partnerships (note 4) |
|
|
|
|
|
|
|
|
|
Net real estate investments |
|
|
|
|
|
|
|
|
|
Properties held for sale |
|
|
|
|
|
|
— |
|
|
Cash, cash equivalents, and restricted cash, including $
|
|
|
|
|
|
|
|
|
|
Tenant and other receivables (note 1) |
|
|
|
|
|
|
|
|
|
Deferred leasing costs, less accumulated amortization of $
|
|
|
|
|
|
|
|
|
|
Acquired lease intangible assets, less accumulated amortization of $
|
|
|
|
|
|
|
|
|
|
Right of use assets, net |
|
|
|
|
|
|
|
|
|
Other assets (note 5) |
|
|
|
|
|
|
|
|
|
Total assets |
|
$ |
|
|
|
|
|
|
|
Liabilities and Equity |
|
|
|
|
|
|
||
|
Liabilities: |
|
|
|
|
|
|
||
|
Notes payable, net (note 9) |
|
$ |
|
|
|
|
|
|
|
Unsecured credit facility (note 9) |
|
|
|
|
|
|
— |
|
|
Accounts payable and other liabilities |
|
|
|
|
|
|
|
|
|
Acquired lease intangible liabilities, less accumulated amortization of $
|
|
|
|
|
|
|
|
|
|
Lease liabilities |
|
|
|
|
|
|
|
|
|
Tenants’ security, escrow deposits and prepaid rent |
|
|
|
|
|
|
|
|
|
Total liabilities |
|
|
|
|
|
|
|
|
|
Equity: |
|
|
|
|
|
|
||
|
Shareholders’ equity (note 12): |
|
|
|
|
|
|
||
|
Preferred stock $
|
|
|
|
|
|
|
— |
|
|
Common stock $
|
|
|
|
|
|
|
|
|
|
Treasury stock at cost,
|
|
|
(
|
) |
|
|
(
|
) |
|
Additional paid-in-capital |
|
|
|
|
|
|
|
|
|
Accumulated other comprehensive (loss) income |
|
|
(
|
) |
|
|
|
|
|
Distributions in excess of net income |
|
|
(
|
) |
|
|
(
|
) |
|
Total shareholders’ equity |
|
|
|
|
|
|
|
|
|
Noncontrolling interests (note 12): |
|
|
|
|
|
|
||
|
Exchangeable operating partnership units, aggregate redemption value of $
|
|
|
|
|
|
|
|
|
|
Limited partners’ interests in consolidated partnerships (note 1) |
|
|
|
|
|
|
|
|
|
Total noncontrolling interests |
|
|
|
|
|
|
|
|
|
Total equity |
|
|
|
|
|
|
|
|
|
Total liabilities and equity |
|
$ |
|
|
|
|
|
|
See accompanying notes to consolidated financial statements.
66
RE GENCY CENTERS CORPORATION
Consolidated Statements of Operations
For the years ended December 31, 2023, 2022, and 2021
(in thousands, except per share data)
|
|
|
2023 |
|
|
2022 |
|
|
2021 |
|
|||
|
Revenues: |
|
|
|
|
|
|
|
|
|
|||
|
Lease income |
|
$ |
|
|
|
|
|
|
|
|
|
|
|
Other property income |
|
|
|
|
|
|
|
|
|
|
|
|
|
Management, transaction, and other fees |
|
|
|
|
|
|
|
|
|
|
|
|
|
Total revenues |
|
|
|
|
|
|
|
|
|
|
|
|
|
Operating expenses: |
|
|
|
|
|
|
|
|
|
|||
|
Depreciation and amortization |
|
|
|
|
|
|
|
|
|
|
|
|
|
Property operating expense |
|
|
|
|
|
|
|
|
|
|
|
|
|
Real estate taxes |
|
|
|
|
|
|
|
|
|
|
|
|
|
General and administrative |
|
|
|
|
|
|
|
|
|
|
|
|
|
Other operating expenses |
|
|
|
|
|
|
|
|
|
|
|
|
|
Total operating expenses |
|
|
|
|
|
|
|
|
|
|
|
|
|
Other expense (income): |
|
|
|
|
|
|
|
|
|
|||
|
Interest expense, net |
|
|
|
|
|
|
|
|
|
|
|
|
|
Provision for impairment of real estate |
|
|
— |
|
|
|
— |
|
|
|
|
|
|
Gain on sale of real estate, net of tax |
|
|
(
|
) |
|
|
(
|
) |
|
|
(
|
) |
|
Early extinguishment of debt |
|
|
(
|
) |
|
|
— |
|
|
|
— |
|
|
Net investment (income) loss |
|
|
(
|
) |
|
|
|
|
|
|
(
|
) |
|
Total other expense |
|
|
|
|
|
|
|
|
|
|
|
|
|
Income from operations before equity in income of investments in real estate partnerships |
|
|
|
|
|
|
|
|
|
|
|
|
|
Equity in income of investments in real estate partnerships (note 4) |
|
|
|
|
|
|
|
|
|
|
|
|
|
Net income |
|
|
|
|
|
|
|
|
|
|
|
|
|
Noncontrolling interests: |
|
|
|
|
|
|
|
|
|
|||
|
Exchangeable operating partnership units |
|
|
(
|
) |
|
|
(
|
) |
|
|
(
|
) |
|
Limited partners’ interests in consolidated partnerships |
|
|
(
|
) |
|
|
(
|
) |
|
|
(
|
) |
|
Income attributable to noncontrolling interests |
|
|
(
|
) |
|
|
(
|
) |
|
|
(
|
) |
|
Net income attributable to the Company |
|
|
|
|
|
|
|
|
|
|
|
|
|
Preferred stock dividends |
|
|
(
|
) |
|
|
— |
|
|
|
— |
|
|
Net income attributable to common shareholders |
|
$ |
|
|
|
|
|
|
|
|
|
|
|
Income per common share - basic (note 15) |
|
$ |
|
|
|
|
|
|
|
|
|
|
|
Income per common share - diluted (note 15) |
|
$ |
|
|
|
|
|
|
|
|
|
|
See accompanying notes to consolidated financial statements.
67
REG ENCY CENTERS CORPORATION
Consolidated Statements of Comprehensive Income
For the years ended December 31, 2023, 2022, and 2021
(in thousands)
|
|
|
2023 |
|
|
2022 |
|
|
2021 |
|
|||
|
Net income |
|
$ |
|
|
|
|
|
|
|
|
|
|
|
Other comprehensive income: |
|
|
|
|
|
|
|
|
|
|||
|
Effective portion of change in fair value of derivative instruments: |
|
|
|
|
|
|
|
|
|
|||
|
Effective portion of change in fair value of derivative instruments |
|
|
(
|
) |
|
|
|
|
|
|
|
|
|
Reclassification adjustment of derivative instruments included in net income |
|
|
(
|
) |
|
|
|
|
|
|
|
|
|
Unrealized gain (loss) on available-for-sale debt securities |
|
|
|
|
|
|
(
|
) |
|
|
(
|
) |
|
Other comprehensive (loss) income |
|
|
(
|
) |
|
|
|
|
|
|
|
|
|
Comprehensive income |
|
|
|
|
|
|
|
|
|
|
|
|
|
Less: comprehensive income attributable to noncontrolling interests: |
|
|
|
|
|
|
|
|
|
|||
|
Net income attributable to noncontrolling interests |
|
|
|
|
|
|
|
|
|
|
|
|
|
Other comprehensive (loss) income attributable to noncontrolling interests |
|
|
(
|
) |
|
|
|
|
|
|
|
|
|
Comprehensive income attributable to noncontrolling interests |
|
|
|
|
|
|
|
|
|
|
|
|
|
Comprehensive income attributable to the Company |
|
$ |
|
|
|
|
|
|
|
|
|
|
See accompanying notes to consolidated financial statements.
68
REG ENCY CENTERS CORPORATION
Consolidated Statements of Equity
For the years ended December 31, 2023, 2022, and 2021
(in thousands, except per share data)
|
|
|
Shareholders' Equity |
|
|
Noncontrolling Interests |
|
|
|
|
|||||||||||||||||||||||||||||||||||
|
|
|
Preferred
|
|
|
Common
|
|
|
Treasury
|
|
|
Additional
|
|
|
Accumulated
|
|
|
Distributions
|
|
|
Total
|
|
|
Exchangeable
|
|
|
Limited
|
|
|
Total
|
|
|
Total
|
|
|||||||||||
|
Balance at December 31, 2020 |
|
$ |
— |
|
|
|
|
|
|
|
(
|
) |
|
|
|
|
|
|
(
|
) |
|
|
(
|
) |
|
|
|
|
|
|
|
|
|
|
|
|
|
|
|
|
|
|
|
|
|
Net income |
|
|
— |
|
|
|
— |
|
|
|
— |
|
|
|
— |
|
|
|
— |
|
|
|
|
|
|
|
|
|
|
|
|
|
|
|
|
|
|
|
|
|
|
|
|
|
|
Other comprehensive income |
|
|
|
|
|
|
|
|
|
|
|
|
|
|
|
|
|
|
|
|
|
|
|
|
|
|
|
|
|
|
|
|
|
|||||||||||
|
Other comprehensive income before reclassification |
|
|
— |
|
|
|
— |
|
|
|
— |
|
|
|
— |
|
|
|
|
|
|
|
— |
|
|
|
|
|
|
|
|
|
|
|
|
|
|
|
|
|
|
|
|
|
|
Amounts reclassified from accumulated other comprehensive income |
|
|
— |
|
|
|
— |
|
|
|
— |
|
|
|
— |
|
|
|
|
|
|
|
— |
|
|
|
|
|
|
|
|
|
|
|
|
|
|
|
|
|
|
|
|
|
|
Deferred compensation plan, net |
|
|
— |
|
|
|
— |
|
|
|
|
|
|
|
(
|
) |
|
|
— |
|
|
|
— |
|
|
|
|
|
|
|
— |
|
|
|
— |
|
|
|
— |
|
|
|
|
|
|
Restricted stock issued, net of amortization |
|
|
— |
|
|
|
|
|
|
|
— |
|
|
|
|
|
|
|
— |
|
|
|
— |
|
|
|
|
|
|
|
— |
|
|
|
— |
|
|
|
— |
|
|
|
|
|
|
Common stock repurchased for taxes withheld for stock-based compensation, net |
|
|
— |
|
|
|
— |
|
|
|
— |
|
|
|
(
|
) |
|
|
— |
|
|
|
— |
|
|
|
(
|
) |
|
|
— |
|
|
|
— |
|
|
|
— |
|
|
|
(
|
) |
|
Common stock issued under dividend reinvestment plan |
|
|
— |
|
|
|
— |
|
|
|
— |
|
|
|
|
|
|
|
— |
|
|
|
— |
|
|
|
|
|
|
|
— |
|
|
|
— |
|
|
|
— |
|
|
|
|
|
|
Common stock issued for partnership units exchanged |
|
|
— |
|
|
|
— |
|
|
|
— |
|
|
|
|
|
|
|
— |
|
|
|
— |
|
|
|
|
|
|
|
(
|
) |
|
|
— |
|
|
|
(
|
) |
|
|
— |
|
|
Common stock issued, net of issuance costs |
|
|
— |
|
|
|
|
|
|
|
— |
|
|
|
|
|
|
|
— |
|
|
|
— |
|
|
|
|
|
|
|
— |
|
|
|
— |
|
|
|
— |
|
|
|
|
|
|
Distributions to partners |
|
|
— |
|
|
|
— |
|
|
|
— |
|
|
|
— |
|
|
|
— |
|
|
|
— |
|
|
|
— |
|
|
|
— |
|
|
|
(
|
) |
|
|
(
|
) |
|
|
(
|
) |
|
Cash dividends declared: |
|
|
|
|
|
|
|
|
|
|
|
|
|
|
|
|
|
|
|
|
|
|
|
|
|
|
|
|
|
|
|
|
|
|||||||||||
|
Common stock/unit ($
|
|
|
— |
|
|
|
— |
|
|
|
— |
|
|
|
— |
|
|
|
— |
|
|
|
(
|
) |
|
|
(
|
) |
|
|
(
|
) |
|
|
— |
|
|
|
(
|
) |
|
|
(
|
) |
|
Balance at December 31, 2021 |
|
$ |
— |
|
|
|
|
|
|
|
(
|
) |
|
|
|
|
|
|
(
|
) |
|
|
(
|
) |
|
|
|
|
|
|
|
|
|
|
|
|
|
|
|
|
|
|
|
|
|
Net income |
|
|
— |
|
|
|
— |
|
|
|
— |
|
|
|
— |
|
|
|
— |
|
|
|
|
|
|
|
|
|
|
|
|
|
|
|
|
|
|
|
|
|
|
|
|
|
|
Other comprehensive income |
|
|
|
|
|
|
|
|
|
|
|
|
|
|
|
|
|
|
|
|
|
|
|
|
|
|
|
|
|
|
|
|
|
|||||||||||
|
Other comprehensive income before reclassification |
|
|
— |
|
|
|
— |
|
|
|
— |
|
|
|
— |
|
|
|
|
|
|
|
— |
|
|
|
|
|
|
|
|
|
|
|
|
|
|
|
|
|
|
|
|
|
|
Amounts reclassified from accumulated other comprehensive income |
|
|
— |
|
|
|
— |
|
|
|
— |
|
|
|
— |
|
|
|
|
|
|
|
— |
|
|
|
|
|
|
|
|
|
|
|
|
|
|
|
|
|
|
|
|
|
|
Deferred compensation plan, net |
|
|
— |
|
|
|
— |
|
|
|
(
|
) |
|
|
|
|
|
|
— |
|
|
|
— |
|
|
|
(
|
) |
|
|
— |
|
|
|
— |
|
|
|
— |
|
|
|
(
|
) |
|
Restricted stock issued, net of amortization |
|
|
— |
|
|
|
|
|
|
|
— |
|
|
|
|
|
|
|
— |
|
|
|
— |
|
|
|
|
|
|
|
— |
|
|
|
— |
|
|
|
— |
|
|
|
|
|
|
Common stock repurchased for taxes withheld for stock-based compensation, net |
|
|
— |
|
|
|
— |
|
|
|
— |
|
|
|
(
|
) |
|
|
— |
|
|
|
— |
|
|
|
(
|
) |
|
|
— |
|
|
|
— |
|
|
|
— |
|
|
|
(
|
) |
|
Common stock repurchased and retired |
|
|
— |
|
|
|
(
|
) |
|
|
— |
|
|
|
(
|
) |
|
|
— |
|
|
|
— |
|
|
|
(
|
) |
|
|
— |
|
|
|
— |
|
|
|
— |
|
|
|
(
|
) |
|
Common stock issued under dividend reinvestment plan |
|
|
— |
|
|
|
— |
|
|
|
— |
|
|
|
|
|
|
|
— |
|
|
|
— |
|
|
|
|
|
|
|
— |
|
|
|
— |
|
|
|
— |
|
|
|
|
|
|
Common stock issued for partnership units exchanged |
|
|
— |
|
|
|
— |
|
|
|
— |
|
|
|
|
|
|
|
— |
|
|
|
— |
|
|
|
|
|
|
|
(
|
) |
|
|
— |
|
|
|
(
|
) |
|
|
— |
|
|
Common stock issued, net of issuance costs |
|
|
— |
|
|
|
|
|
|
|
— |
|
|
|
|
|
|
|
— |
|
|
|
— |
|
|
|
|
|
|
|
— |
|
|
|
— |
|
|
|
— |
|
|
|
|
|
|
Reallocation of noncontrolling interests, net of transaction costs |
|
|
— |
|
|
|
— |
|
|
|
— |
|
|
|
(
|
) |
|
|
— |
|
|
|
— |
|
|
|
(
|
) |
|
|
— |
|
|
|
|
|
|
|
|
|
|
|
(
|
) |
|
Contributions from partners |
|
|
— |
|
|
|
— |
|
|
|
— |
|
|
|
— |
|
|
|
— |
|
|
|
— |
|
|
|
— |
|
|
|
— |
|
|
|
|
|
|
|
|
|
|
|
|
|
|
Distributions to partners |
|
|
— |
|
|
|
— |
|
|
|
— |
|
|
|
— |
|
|
|
— |
|
|
|
— |
|
|
|
— |
|
|
|
— |
|
|
|
(
|
) |
|
|
(
|
) |
|
|
(
|
) |
|
Cash dividends declared: |
|
|
|
|
|
|
|
|
|
|
|
|
|
|
|
|
|
|
|
|
— |
|
|
|
|
|
|
|
|
|
— |
|
|
|
— |
|
||||||||
|
Common stock/unit ($
|
|
|
— |
|
|
|
— |
|
|
|
— |
|
|
|
— |
|
|
|
— |
|
|
|
(
|
) |
|
|
(
|
) |
|
|
(
|
) |
|
|
— |
|
|
|
(
|
) |
|
|
(
|
) |
|
Balance at December 31, 2022 |
|
$ |
— |
|
|
$ |
|
|
|
|
(
|
) |
|
|
|
|
|
|
|
|
|
|
(
|
) |
|
|
|
|
|
|
|
|
|
|
|
|
|
|
|
|
|
|
|
|
69
|
|
|
Shareholders' Equity |
|
|
Noncontrolling Interests |
|
|
|
|
|||||||||||||||||||||||||||||||||||
|
|
|
Preferred
|
|
|
Common
|
|
|
Treasury
|
|
|
Additional
|
|
|
Accumulated
|
|
|
Distributions
|
|
|
Total
|
|
|
Exchangeable
|
|
|
Limited
|
|
|
Total
|
|
|
Total
|
|
|||||||||||
|
Balance at December 31, 2022 |
|
$ |
— |
|
|
|
|
|
|
|
(
|
) |
|
|
|
|
|
|
|
|
|
|
(
|
) |
|
|
|
|
|
|
|
|
|
|
|
|
|
|
|
|
|
|
|
|
|
Net income |
|
|
— |
|
|
|
— |
|
|
|
— |
|
|
|
— |
|
|
|
— |
|
|
|
|
|
|
|
|
|
|
|
|
|
|
|
|
|
|
|
|
|
|
|
|
|
|
Other comprehensive loss |
|
|
|
|
|
|
|
|
|
|
|
|
|
|
|
|
|
|
|
|
|
|
|
|
|
|
|
|
|
|
|
|
|
|||||||||||
|
Other comprehensive income before reclassification |
|
|
— |
|
|
|
— |
|
|
|
— |
|
|
|
— |
|
|
|
(
|
) |
|
|
— |
|
|
|
(
|
) |
|
|
(
|
) |
|
|
(
|
) |
|
|
(
|
) |
|
|
(
|
) |
|
Amounts reclassified from accumulated other comprehensive loss |
|
|
— |
|
|
|
— |
|
|
|
— |
|
|
|
— |
|
|
|
(
|
) |
|
|
— |
|
|
|
(
|
) |
|
|
(
|
) |
|
|
(
|
) |
|
|
(
|
) |
|
|
(
|
) |
|
Adjustment for noncontrolling interests in the Operating Partnership |
|
|
— |
|
|
|
— |
|
|
|
— |
|
|
|
|
|
|
|
— |
|
|
|
— |
|
|
|
|
|
|
|
(
|
) |
|
|
— |
|
|
|
(
|
) |
|
|
— |
|
|
Deferred compensation plan, net |
|
|
— |
|
|
|
— |
|
|
|
(
|
) |
|
|
|
|
|
|
— |
|
|
|
— |
|
|
|
— |
|
|
|
— |
|
|
|
— |
|
|
|
— |
|
|
|
— |
|
|
Restricted stock issued, net of amortization |
|
|
— |
|
|
|
|
|
|
|
— |
|
|
|
|
|
|
|
— |
|
|
|
— |
|
|
|
|
|
|
|
— |
|
|
|
— |
|
|
|
— |
|
|
|
|
|
|
Common stock repurchased for taxes withheld for stock-based compensation, net |
|
|
— |
|
|
|
— |
|
|
|
— |
|
|
|
(
|
) |
|
|
— |
|
|
|
— |
|
|
|
(
|
) |
|
|
— |
|
|
|
— |
|
|
|
— |
|
|
|
(
|
) |
|
Common stock repurchased and retired |
|
|
— |
|
|
|
(
|
) |
|
|
— |
|
|
|
(
|
) |
|
|
— |
|
|
|
— |
|
|
|
(
|
) |
|
|
— |
|
|
|
— |
|
|
|
— |
|
|
|
(
|
) |
|
Repurchase of exchangeable operating partnership units |
|
|
— |
|
|
|
— |
|
|
|
— |
|
|
|
— |
|
|
|
— |
|
|
|
— |
|
|
|
— |
|
|
|
(
|
) |
|
|
— |
|
|
|
(
|
) |
|
|
(
|
) |
|
Common stock issued under dividend reinvestment plan |
|
|
— |
|
|
|
— |
|
|
|
— |
|
|
|
|
|
|
|
— |
|
|
|
— |
|
|
|
|
|
|
|
— |
|
|
|
— |
|
|
|
— |
|
|
|
|
|
|
Common stock issued for partnership units exchanged |
|
|
— |
|
|
|
— |
|
|
|
— |
|
|
|
|
|
|
|
— |
|
|
|
— |
|
|
|
|
|
|
|
(
|
) |
|
|
— |
|
|
|
(
|
) |
|
|
— |
|
|
Common stock issued, net of issuance costs |
|
|
— |
|
|
|
|
|
|
|
— |
|
|
|
|
|
|
|
— |
|
|
|
— |
|
|
|
|
|
|
|
— |
|
|
|
— |
|
|
|
— |
|
|
|
|
|
|
Issuance of exchangeable operating partnership units |
|
|
— |
|
|
|
— |
|
|
|
— |
|
|
|
— |
|
|
|
— |
|
|
|
— |
|
|
|
— |
|
|
|
|
|
|
|
— |
|
|
|
|
|
|
|
|
|
|
Issuance of preferred stock |
|
|
|
|
|
|
— |
|
|
|
— |
|
|
|
— |
|
|
|
— |
|
|
|
— |
|
|
|
|
|
|
|
— |
|
|
|
— |
|
|
|
— |
|
|
|
|
|
|
Contributions from partners |
|
|
— |
|
|
|
— |
|
|
|
— |
|
|
|
— |
|
|
|
— |
|
|
|
— |
|
|
|
— |
|
|
|
— |
|
|
|
|
|
|
|
|
|
|
|
|
|
|
Distributions to partners |
|
|
— |
|
|
|
— |
|
|
|
— |
|
|
|
— |
|
|
|
— |
|
|
|
— |
|
|
|
— |
|
|
|
— |
|
|
|
(
|
) |
|
|
(
|
) |
|
|
(
|
) |
|
Cash dividends declared: |
|
|
|
|
|
|
|
|
|
|
|
|
|
|
|
|
|
|
|
|
|
|
|
|
|
|
|
|
|
|
|
|
|
|||||||||||
|
Preferred stock/unit |
|
|
— |
|
|
|
— |
|
|
|
— |
|
|
|
— |
|
|
|
— |
|
|
|
(
|
) |
|
|
(
|
) |
|
|
— |
|
|
|
— |
|
|
|
— |
|
|
|
(
|
) |
|
Common stock/unit ($
|
|
|
— |
|
|
|
— |
|
|
|
— |
|
|
|
— |
|
|
|
— |
|
|
|
(
|
) |
|
|
(
|
) |
|
|
(
|
) |
|
|
— |
|
|
|
(
|
) |
|
|
(
|
) |
|
Balance at December 31, 2023 |
|
$ |
|
|
|
|
|
|
|
|
(
|
) |
|
|
|
|
|
|
(
|
) |
|
|
(
|
) |
|
|
|
|
|
|
|
|
|
|
|
|
|
|
|
|
|
|
|
|
See accompanying notes to consolidated financial statements.
70
REG ENCY CENTERS CORPORATION
Consolidated Statements of Cash Flows
For the years ended December 31, 2023, 2022, and 2021
(in thousands)
|
|
|
2023 |
|
|
2022 |
|
|
2021 |
|
|||
|
Cash flows from operating activities: |
|
|
|
|
|
|
|
|
|
|||
|
Net income |
|
$ |
|
|
|
|
|
|
|
|
|
|
|
Adjustments to reconcile net income to net cash provided by operating activities: |
|
|
|
|
|
|
|
|
|
|||
|
Depreciation and amortization |
|
|
|
|
|
|
|
|
|
|
|
|
|
Amortization of deferred loan costs and debt premiums |
|
|
|
|
|
|
|
|
|
|
|
|
|
Accretion of above and below market lease intangibles, net |
|
|
(
|
) |
|
|
(
|
) |
|
|
(
|
) |
|
Stock-based compensation, net of capitalization |
|
|
|
|
|
|
|
|
|
|
|
|
|
Equity in income of investments in real estate partnerships |
|
|
(
|
) |
|
|
(
|
) |
|
|
(
|
) |
|
Gain on sale of real estate, net of tax |
|
|
(
|
) |
|
|
(
|
) |
|
|
(
|
) |
|
Provision for impairment of real estate, net of tax |
|
|
— |
|
|
|
— |
|
|
|
|
|
|
Early extinguishment of debt |
|
|
(
|
) |
|
|
— |
|
|
|
— |
|
|
Distribution of earnings from investments in real estate partnerships |
|
|
|
|
|
|
|
|
|
|
|
|
|
Settlement of derivative instruments |
|
|
— |
|
|
|
— |
|
|
|
(
|
) |
|
Deferred compensation expense (income) |
|
|
|
|
|
|
(
|
) |
|
|
|
|
|
Realized and unrealized (gain) loss on investments |
|
|
(
|
) |
|
|
|
|
|
|
(
|
) |
|
Changes in assets and liabilities: |
|
|
|
|
|
|
|
|
|
|||
|
Tenant and other receivables |
|
|
(
|
) |
|
|
(
|
) |
|
|
(
|
) |
|
Deferred leasing costs |
|
|
(
|
) |
|
|
(
|
) |
|
|
(
|
) |
|
Other assets |
|
|
|
|
|
|
|
|
|
|
(
|
) |
|
Accounts payable and other liabilities |
|
|
|
|
|
|
(
|
) |
|
|
|
|
|
Tenants’ security, escrow deposits and prepaid rent |
|
|
(
|
) |
|
|
|
|
|
|
|
|
|
Net cash provided by operating activities |
|
|
|
|
|
|
|
|
|
|
|
|
|
Cash flows from investing activities: |
|
|
|
|
|
|
|
|
|
|||
|
Acquisition of operating real estate, net of cash acquired of $
|
|
|
(
|
) |
|
|
(
|
) |
|
|
(
|
) |
|
Acquisition of UBP, net of cash acquired of $
|
|
|
(
|
) |
|
|
— |
|
|
|
— |
|
|
Real estate development and capital improvements |
|
|
(
|
) |
|
|
(
|
) |
|
|
(
|
) |
|
Proceeds from sale of real estate |
|
|
|
|
|
|
|
|
|
|
|
|
|
Issuance of notes receivable |
|
|
(
|
) |
|
|
— |
|
|
|
(
|
) |
|
Collection of notes receivable |
|
|
|
|
|
|
|
|
|
|
— |
|
|
Investments in real estate partnerships |
|
|
(
|
) |
|
|
(
|
) |
|
|
(
|
) |
|
Return of capital from investments in real estate partnerships |
|
|
|
|
|
|
|
|
|
|
|
|
|
Dividends on investment securities |
|
|
|
|
|
|
|
|
|
|
|
|
|
Acquisition of investment securities |
|
|
(
|
) |
|
|
(
|
) |
|
|
(
|
) |
|
Proceeds from sale of investment securities |
|
|
|
|
|
|
|
|
|
|
|
|
|
Net cash used in investing activities |
|
|
(
|
) |
|
|
(
|
) |
|
|
(
|
) |
|
Cash flows from financing activities: |
|
|
|
|
|
|
|
|
|
|||
|
Net proceeds from common stock issuance |
|
|
(
|
) |
|
|
|
|
|
|
|
|
|
Repurchase of common shares in conjunction with equity award plans |
|
|
(
|
) |
|
|
(
|
) |
|
|
(
|
) |
|
Common shares repurchased through share repurchase program |
|
|
(
|
) |
|
|
(
|
) |
|
|
— |
|
|
Proceeds from sale of treasury stock |
|
|
|
|
|
|
|
|
|
|
|
|
|
Contributions from limited partners in consolidated partnerships |
|
|
|
|
|
|
— |
|
|
|
— |
|
|
Distributions to limited partners in consolidated partnerships |
|
|
(
|
) |
|
|
(
|
) |
|
|
(
|
) |
|
Distributions to exchangeable operating partnership unit holders |
|
|
(
|
) |
|
|
(
|
) |
|
|
(
|
) |
|
Redemption of exchangeable operating partnership units |
|
|
(
|
) |
|
|
— |
|
|
|
— |
|
|
Dividends paid to common shareholders |
|
|
(
|
) |
|
|
(
|
) |
|
|
(
|
) |
|
Dividends paid to preferred shareholders |
|
|
(
|
) |
|
|
— |
|
|
|
— |
|
|
Proceeds from unsecured credit facilities |
|
|
|
|
|
|
|
|
|
|
— |
|
|
Repayment of unsecured credit facilities |
|
|
(
|
) |
|
|
(
|
) |
|
|
(
|
) |
|
Proceeds from notes payable |
|
|
|
|
|
|
— |
|
|
|
— |
|
|
Repayment of notes payable |
|
|
(
|
) |
|
|
(
|
) |
|
|
(
|
) |
|
Scheduled principal payments |
|
|
(
|
) |
|
|
(
|
) |
|
|
(
|
) |
|
Payment of loan costs |
|
|
(
|
) |
|
|
(
|
) |
|
|
(
|
) |
|
Net cash used in financing activities |
|
|
(
|
) |
|
|
(
|
) |
|
|
(
|
) |
|
Net change in cash, cash equivalents, and restricted cash |
|
|
|
|
|
|
(
|
) |
|
|
(
|
) |
|
Cash, cash equivalents, and restricted cash at beginning of the year |
|
|
|
|
|
|
|
|
|
|
|
|
|
Cash, cash equivalents, and restricted cash at end of the year |
|
$ |
|
|
|
|
|
|
|
|
|
|
71
|
|
|
2023 |
|
|
2022 |
|
|
2021 |
|
|||
|
Supplemental disclosure of cash flow information: |
|
|
|
|
|
|
|
|
|
|||
|
Cash paid for interest (net of capitalized interest of $
|
|
$ |
|
|
|
|
|
|
|
|
|
|
|
Cash paid for income taxes, net of refunds |
|
$ |
|
|
|
|
|
|
|
|
|
|
|
Supplemental disclosure of non-cash transactions: |
|
|
|
|
|
|
|
|
|
|||
|
Common and Preferred stock, and exchangeable operating partnership dividends declared but not paid |
|
$ |
|
|
|
|
|
|
|
|
|
|
|
Previously held equity investments in real estate assets acquired |
|
$ |
— |
|
|
|
|
|
|
|
(
|
) |
|
Mortgage loans assumed by Company with the acquisition of real estate |
|
$ |
|
|
|
|
|
|
|
|
|
|
|
Right of use assets obtained in exchange for new operating lease liabilities |
|
$ |
|
|
|
|
— |
|
|
|
— |
|
|
Sale of leased asset in exchange for net investment in sales-type lease |
|
$ |
|
|
|
|
— |
|
|
|
— |
|
|
UBP Acquisition: |
|
|
|
|
|
|
|
|
|
|||
|
Notes payable assumed in acquisition, at fair value |
|
$ |
|
|
|
|
— |
|
|
|
— |
|
|
Noncontrolling interest assumed in acquisition, at fair value |
|
$ |
|
|
|
|
— |
|
|
|
— |
|
|
Common stock exchanged for UBP shares |
|
$ |
|
|
|
|
— |
|
|
|
— |
|
|
Preferred stock exchanged for UBP shares |
|
$ |
|
|
|
|
— |
|
|
|
— |
|
|
Common stock issued for partnership units exchanged |
|
$ |
|
|
|
|
|
|
|
|
|
|
|
Exchangeable operating partnership units issued for acquisition of real estate |
|
$ |
|
|
|
|
— |
|
|
|
— |
|
|
Real estate received in lieu of promote interest |
|
$ |
— |
|
|
|
— |
|
|
|
|
|
|
Change in accrued capital expenditures |
|
$ |
|
|
|
|
|
|
|
|
|
|
|
Common stock issued under dividend reinvestment plan |
|
$ |
|
|
|
|
|
|
|
|
|
|
|
Stock-based compensation capitalized |
|
$ |
|
|
|
|
|
|
|
|
|
|
|
Contributions to investments in real estate partnerships |
|
$ |
|
|
|
|
— |
|
|
|
— |
|
|
Contributions from limited partners in consolidated partnerships, net |
|
$ |
— |
|
|
|
|
|
|
|
— |
|
|
Reallocation of equity upon acquisition of a limited partner's interest in a consolidated partnership |
|
$ |
— |
|
|
|
|
|
|
|
— |
|
|
Adjustment for noncontrolling interests in the operating partnership |
|
$ |
— |
|
|
|
— |
|
|
|
— |
|
|
Common stock issued for dividend reinvestment in trust |
|
$ |
|
|
|
|
|
|
|
|
|
|
|
Contribution of stock awards into trust |
|
$ |
|
|
|
|
|
|
|
|
|
|
|
Distribution of stock held in trust |
|
$ |
|
|
|
|
|
|
|
|
|
|
|
Change in fair value of securities |
|
$ |
|
|
|
|
|
|
|
|
|
|
See accompanying notes to consolidated financial statements.
72
RE GENCY CENTERS, L.P.
Consolidated Balance Sheets
December 31, 2023 and 2022
(in thousands, except unit data)
|
|
|
2023 |
|
|
2022 |
|
||
|
Assets |
|
|
|
|
|
|
||
|
Net real estate investments: |
|
|
|
|
|
|
||
|
Real estate assets, at cost (note 1) |
|
$ |
|
|
|
|
|
|
|
Less: accumulated depreciation |
|
|
|
|
|
|
|
|
|
Real estate assets, net |
|
|
|
|
|
|
|
|
|
Investments in sales-type lease, net |
|
|
|
|
|
|
— |
|
|
Investments in real estate partnerships (note 4) |
|
|
|
|
|
|
|
|
|
Net real estate investments |
|
|
|
|
|
|
|
|
|
Properties held for sale |
|
|
|
|
|
|
— |
|
|
Cash, cash equivalents, and restricted cash, including $
|
|
|
|
|
|
|
|
|
|
Tenant and other receivables (note 1) |
|
|
|
|
|
|
|
|
|
Deferred leasing costs, less accumulated amortization of $
|
|
|
|
|
|
|
|
|
|
Acquired lease intangible assets, less accumulated amortization of $
|
|
|
|
|
|
|
|
|
|
Right of use assets, net |
|
|
|
|
|
|
|
|
|
Other assets (note 5) |
|
|
|
|
|
|
|
|
|
Total assets |
|
$ |
|
|
|
|
|
|
|
Liabilities and Capital |
|
|
|
|
|
|
||
|
Liabilities: |
|
|
|
|
|
|
||
|
Notes payable, net (note 9) |
|
$ |
|
|
|
|
|
|
|
Unsecured credit facility (note 9) |
|
|
|
|
|
|
— |
|
|
Accounts payable and other liabilities |
|
|
|
|
|
|
|
|
|
Acquired lease intangible liabilities, less accumulated amortization of $
|
|
|
|
|
|
|
|
|
|
Lease liabilities |
|
|
|
|
|
|
|
|
|
Tenants’ security, escrow deposits and prepaid rent |
|
|
|
|
|
|
|
|
|
Total liabilities |
|
|
|
|
|
|
|
|
|
Capital: |
|
|
|
|
|
|
||
|
Partners’ capital (note 12): |
|
|
|
|
|
|
||
|
Preferred units $
|
|
|
|
|
|
|
— |
|
|
General partner;
|
|
|
|
|
|
|
|
|
|
Limited partners;
|
|
|
|
|
|
|
|
|
|
Accumulated other comprehensive (loss) income |
|
|
(
|
) |
|
|
|
|
|
Total partners’ capital |
|
|
|
|
|
|
|
|
|
Noncontrolling interest: Limited partners’ interests in consolidated partnerships |
|
|
|
|
|
|
|
|
|
Total capital |
|
|
|
|
|
|
|
|
|
Total liabilities and capital |
|
$ |
|
|
|
|
|
|
See accompanying notes to consolidated financial statements.
73
REG ENCY CENTERS, L.P.
Consolidated Statements of Operations
For the years ended December 31, 2023, 2022, and 2021
(in thousands, except per unit data)
|
|
|
2023 |
|
|
2022 |
|
|
2021 |
|
|||
|
Revenues: |
|
|
|
|
|
|
|
|
|
|||
|
Lease income |
|
$ |
|
|
|
|
|
|
|
|
|
|
|
Other property income |
|
|
|
|
|
|
|
|
|
|
|
|
|
Management, transaction, and other fees |
|
|
|
|
|
|
|
|
|
|
|
|
|
Total revenues |
|
|
|
|
|
|
|
|
|
|
|
|
|
Operating expenses: |
|
|
|
|
|
|
|
|
|
|||
|
Depreciation and amortization |
|
|
|
|
|
|
|
|
|
|
|
|
|
Property operating expense |
|
|
|
|
|
|
|
|
|
|
|
|
|
Real estate taxes |
|
|
|
|
|
|
|
|
|
|
|
|
|
General and administrative |
|
|
|
|
|
|
|
|
|
|
|
|
|
Other operating expenses |
|
|
|
|
|
|
|
|
|
|
|
|
|
Total operating expenses |
|
|
|
|
|
|
|
|
|
|
|
|
|
Other expense (income): |
|
|
|
|
|
|
|
|
|
|||
|
Interest expense, net |
|
|
|
|
|
|
|
|
|
|
|
|
|
Provision for impairment of real estate |
|
|
— |
|
|
|
— |
|
|
|
|
|
|
Gain on sale of real estate, net of tax |
|
|
(
|
) |
|
|
(
|
) |
|
|
(
|
) |
|
Early extinguishment of debt |
|
|
(
|
) |
|
|
— |
|
|
|
— |
|
|
Net investment (income) loss |
|
|
(
|
) |
|
|
|
|
|
|
(
|
) |
|
Total other expense |
|
|
|
|
|
|
|
|
|
|
|
|
|
Income from operations before equity in income of investments in real estate partnerships |
|
|
|
|
|
|
|
|
|
|
|
|
|
Equity in income of investments in real estate partnerships (note 4) |
|
|
|
|
|
|
|
|
|
|
|
|
|
Net income |
|
|
|
|
|
|
|
|
|
|
|
|
|
Limited partners’ interests in consolidated partnerships |
|
|
(
|
) |
|
|
(
|
) |
|
|
(
|
) |
|
Net income attributable to the Partnership |
|
|
|
|
|
|
|
|
|
|
|
|
|
Preferred unit distributions and issuance costs |
|
|
(
|
) |
|
|
— |
|
|
|
— |
|
|
Net income attributable to common unit holders |
|
$ |
|
|
|
|
|
|
|
|
|
|
|
Income per common unit - basic (note 15): |
|
$ |
|
|
|
|
|
|
|
|
|
|
|
Income per common unit - diluted (note 15): |
|
$ |
|
|
|
|
|
|
|
|
|
|
See accompanying notes to consolidated financial statements.
74
REG ENCY CENTERS, L.P.
Consolidated Statements of Comprehensive Income
For the years ended December 31, 2023, 2022, and 2021
(in thousands)
|
|
|
2023 |
|
|
2022 |
|
|
2021 |
|
|||
|
Net income |
|
$ |
|
|
|
|
|
|
|
|
|
|
|
Other comprehensive income: |
|
|
|
|
|
|
|
|
|
|||
|
Effective portion of change in fair value of derivative instruments: |
|
|
|
|
|
|
|
|
|
|||
|
Effective portion of change in fair value of derivative instruments |
|
|
(
|
) |
|
|
|
|
|
|
|
|
|
Reclassification adjustment of derivative instruments included in net income |
|
|
(
|
) |
|
|
|
|
|
|
|
|
|
Unrealized gain (loss) on available-for-sale debt securities |
|
|
|
|
|
|
(
|
) |
|
|
(
|
) |
|
Other comprehensive (loss) income |
|
|
(
|
) |
|
|
|
|
|
|
|
|
|
Comprehensive income |
|
|
|
|
|
|
|
|
|
|
|
|
|
Less: comprehensive income attributable to noncontrolling interests: |
|
|
|
|
|
|
|
|
|
|||
|
Net income attributable to noncontrolling interests |
|
|
|
|
|
|
|
|
|
|
|
|
|
Other comprehensive (loss) income attributable to noncontrolling interests |
|
|
(
|
) |
|
|
|
|
|
|
|
|
|
Comprehensive income attributable to noncontrolling interests |
|
|
|
|
|
|
|
|
|
|
|
|
|
Comprehensive income attributable to the Company |
|
$ |
|
|
|
|
|
|
|
|
|
|
See accompanying notes to consolidated financial statements.
75
REG ENCY CENTERS, L.P.
Consolidated Statements of Capital
For the years ended December 31, 2023, 2022, and 2021
(in thousands)
|
|
|
General Partner
|
|
|
Limited
|
|
|
Accumulated
|
|
|
Total
|
|
|
Noncontrolling
|
|
|
Total
|
|
||||||
|
Balance at December 31, 2020 |
|
$ |
|
|
|
|
|
|
|
|
(
|
) |
|
|
|
|
|
|
|
|
|
|
|
|
|
Net income |
|
|
|
|
|
|
|
|
|
|
— |
|
|
|
|
|
|
|
|
|
|
|
|
|
|
Other comprehensive income |
|
|
|
|
|
|
|
|
|
|
|
— |
|
|
|
|
|
|
|
|||||
|
Other comprehensive income before reclassifications |
|
|
— |
|
|
|
|
|
|
|
|
|
|
|
|
|
|
|
|
|
|
|
|
|
|
Amounts reclassified from accumulated other comprehensive income |
|
|
— |
|
|
|
|
|
|
|
|
|
|
|
|
|
|
|
|
|
|
|
|
|
|
Deferred compensation plan, net |
|
|
|
|
|
|
— |
|
|
|
— |
|
|
|
|
|
|
|
— |
|
|
|
|
|
|
Distributions to partners |
|
|
(
|
) |
|
|
(
|
) |
|
|
— |
|
|
|
(
|
) |
|
|
(
|
) |
|
|
(
|
) |
|
Restricted units issued as a result of restricted stock issued by Parent Company, net of amortization |
|
|
|
|
|
|
— |
|
|
|
— |
|
|
|
|
|
|
|
— |
|
|
|
|
|
|
Common units issued as a result of common stock issued by Parent Company, net of issuance costs |
|
|
|
|
|
|
— |
|
|
|
— |
|
|
|
|
|
|
|
— |
|
|
|
|
|
|
Common units repurchased as a result of common stock repurchased by Parent Company, net of issuances |
|
|
(
|
) |
|
|
— |
|
|
|
— |
|
|
|
(
|
) |
|
|
— |
|
|
|
(
|
) |
|
Common units exchanged for common stock of Parent Company |
|
|
|
|
|
|
(
|
) |
|
|
— |
|
|
|
— |
|
|
|
— |
|
|
|
— |
|
|
Balance at December 31, 2021 |
|
$ |
|
|
|
|
|
|
|
|
(
|
) |
|
|
|
|
|
|
|
|
|
|
|
|
|
Net income |
|
|
|
|
|
|
|
|
|
|
— |
|
|
|
|
|
|
|
|
|
|
|
|
|
|
Other comprehensive income |
|
|
|
|
|
|
|
|
|
|
|
— |
|
|
|
|
|
|
— |
|
||||
|
Other comprehensive income before reclassifications |
|
|
— |
|
|
|
|
|
|
|
|
|
|
|
|
|
|
|
|
|
|
|
|
|
|
Amounts reclassified from accumulated other comprehensive income |
|
|
— |
|
|
|
|
|
|
|
|
|
|
|
|
|
|
|
|
|
|
|
|
|
|
Deferred compensation plan, net |
|
|
(
|
) |
|
|
— |
|
|
|
— |
|
|
|
(
|
) |
|
|
— |
|
|
|
(
|
) |
|
Contribution from partners |
|
|
— |
|
|
|
— |
|
|
|
— |
|
|
|
— |
|
|
|
|
|
|
|
|
|
|
Distributions to partners |
|
|
(
|
) |
|
|
(
|
) |
|
|
— |
|
|
|
(
|
) |
|
|
(
|
) |
|
|
(
|
) |
|
Reallocation of limited partners' interest, net of transaction costs |
|
|
(
|
) |
|
|
— |
|
|
|
— |
|
|
|
(
|
) |
|
|
|
|
|
|
(
|
) |
|
Restricted units issued as a result of restricted stock issued by Parent Company, net of amortization |
|
|
|
|
|
|
— |
|
|
|
— |
|
|
|
|
|
|
|
— |
|
|
|
|
|
|
Common units repurchased and retired as a result of common stock repurchased and retired by Parent Company |
|
|
(
|
) |
|
|
— |
|
|
|
— |
|
|
|
(
|
) |
|
|
— |
|
|
|
(
|
) |
|
Common units issued as a result of common stock issued by Parent Company, net of issuance costs |
|
|
|
|
|
|
— |
|
|
|
— |
|
|
|
|
|
|
|
— |
|
|
|
|
|
|
Common units repurchased as a result of common stock repurchased by Parent Company, net of issuances |
|
|
(
|
) |
|
|
— |
|
|
|
— |
|
|
|
(
|
) |
|
|
— |
|
|
|
(
|
) |
|
Common units exchanged for common stock of Parent Company |
|
|
|
|
|
|
(
|
) |
|
|
— |
|
|
|
— |
|
|
|
— |
|
|
|
— |
|
|
Balance at December 31, 2022 |
|
$ |
|
|
|
|
|
|
|
|
|
|
|
|
|
|
|
|
|
|
|
|
|
|
76
|
|
|
General Partner
|
|
|
Limited
|
|
|
Accumulated
|
|
|
Total
|
|
|
Noncontrolling
|
|
|
Total
|
|
||||||
|
Balance at December 31, 2022 |
|
$ |
|
|
|
|
|
|
|
|
|
|
|
|
|
|
|
|
|
|
|
|
|
|
|
Net income |
|
|
|
|
|
|
|
|
|
|
— |
|
|
|
|
|
|
|
|
|
|
|
|
|
|
Other comprehensive loss |
|
|
|
|
|
|
|
|
|
|
|
|
|
|
|
|
|
|
||||||
|
Other comprehensive loss before reclassifications |
|
|
— |
|
|
|
(
|
) |
|
|
(
|
) |
|
|
(
|
) |
|
|
(
|
) |
|
|
(
|
) |
|
Amounts reclassified from accumulated other comprehensive loss |
|
|
— |
|
|
|
(
|
) |
|
|
(
|
) |
|
|
(
|
) |
|
|
(
|
) |
|
|
(
|
) |
|
Adjustment for noncontrolling interests in the Operating Partnership |
|
|
|
|
|
|
(
|
) |
|
|
— |
|
|
|
— |
|
|
|
— |
|
|
|
— |
|
|
Contribution from partners |
|
|
— |
|
|
|
— |
|
|
|
— |
|
|
|
— |
|
|
|
|
|
|
|
|
|
|
Issuance of exchangeable operating partnership units |
|
|
— |
|
|
|
|
|
|
|
— |
|
|
|
|
|
|
|
— |
|
|
|
|
|
|
Distributions to partners |
|
|
(
|
) |
|
|
(
|
) |
|
|
— |
|
|
|
(
|
) |
|
|
(
|
) |
|
|
(
|
) |
|
Preferred unit distributions |
|
|
(
|
) |
|
|
— |
|
|
|
— |
|
|
|
(
|
) |
|
|
— |
|
|
|
(
|
) |
|
Restricted units issued as a result of restricted stock issued by Parent Company, net of amortization |
|
|
|
|
|
|
— |
|
|
|
— |
|
|
|
|
|
|
|
— |
|
|
|
|
|
|
Preferred units issued as a result of preferred stock issued by Parent Company, net of issuance costs |
|
|
|
|
|
|
— |
|
|
|
— |
|
|
|
|
|
|
|
— |
|
|
|
|
|
|
Common units repurchased and retired as a result of common stock repurchased and retired by Parent Company |
|
|
(
|
) |
|
|
— |
|
|
|
— |
|
|
|
(
|
) |
|
|
— |
|
|
|
(
|
) |
|
Common units issued as a result of common stock issued by Parent Company, net of issuance costs |
|
|
|
|
|
|
— |
|
|
|
— |
|
|
|
|
|
|
|
— |
|
|
|
|
|
|
Repurchase of exchangeable operating partnership units |
|
|
— |
|
|
|
(
|
) |
|
|
— |
|
|
|
(
|
) |
|
|
— |
|
|
|
(
|
) |
|
Common units repurchased as a result of common stock repurchased by Parent Company, net of issuances |
|
|
(
|
) |
|
|
— |
|
|
|
— |
|
|
|
(
|
) |
|
|
— |
|
|
|
(
|
) |
|
Common units exchanged for common stock of Parent Company |
|
|
|
|
|
|
(
|
) |
|
|
— |
|
|
|
— |
|
|
|
— |
|
|
|
— |
|
|
Balance at December 31, 2023 |
|
$ |
|
|
|
|
|
|
|
|
(
|
) |
|
|
|
|
|
|
|
|
|
|
|
|
See accompanying notes to consolidated financial statements.
77
REG ENCY CENTERS, L.P.
Consolidated Statements of Cash Flows
For the years ended December 31, 2023, 2022, and 2021
(in thousands)
|
|
|
2023 |
|
|
2022 |
|
|
2021 |
|
|||
|
Cash flows from operating activities: |
|
|
|
|
|
|
|
|
|
|||
|
Net income |
|
$ |
|
|
|
|
|
|
|
|
|
|
|
Adjustments to reconcile net income to net cash provided by operating activities: |
|
|
|
|
|
|
|
|
|
|||
|
Depreciation and amortization |
|
|
|
|
|
|
|
|
|
|
|
|
|
Amortization of deferred loan costs and debt premiums |
|
|
|
|
|
|
|
|
|
|
|
|
|
Accretion of above and below market lease intangibles, net |
|
|
(
|
) |
|
|
(
|
) |
|
|
(
|
) |
|
Stock-based compensation, net of capitalization |
|
|
|
|
|
|
|
|
|
|
|
|
|
Equity in income of investments in real estate partnerships |
|
|
(
|
) |
|
|
(
|
) |
|
|
(
|
) |
|
Gain on sale of real estate, net of tax |
|
|
(
|
) |
|
|
(
|
) |
|
|
(
|
) |
|
Provision for impairment of real estate, net of tax |
|
|
— |
|
|
|
— |
|
|
|
|
|
|
Early extinguishment of debt |
|
|
(
|
) |
|
|
— |
|
|
|
— |
|
|
Distribution of earnings from investments in real estate partnerships |
|
|
|
|
|
|
|
|
|
|
|
|
|
Settlement of derivative instruments |
|
|
— |
|
|
|
— |
|
|
|
(
|
) |
|
Deferred compensation expense (income) |
|
|
|
|
|
|
(
|
) |
|
|
|
|
|
Realized and unrealized (gain) loss on investments |
|
|
(
|
) |
|
|
|
|
|
|
(
|
) |
|
Changes in assets and liabilities: |
|
|
|
|
|
|
|
|
|
|||
|
Tenant and other receivables |
|
|
(
|
) |
|
|
(
|
) |
|
|
(
|
) |
|
Deferred leasing costs |
|
|
(
|
) |
|
|
(
|
) |
|
|
(
|
) |
|
Other assets |
|
|
|
|
|
|
|
|
|
|
(
|
) |
|
Accounts payable and other liabilities |
|
|
|
|
|
|
(
|
) |
|
|
|
|
|
Tenants’ security, escrow deposits and prepaid rent |
|
|
(
|
) |
|
|
|
|
|
|
|
|
|
Net cash provided by operating activities |
|
|
|
|
|
|
|
|
|
|
|
|
|
Cash flows from investing activities: |
|
|
|
|
|
|
|
|
|
|||
|
Acquisition of operating real estate, net of cash acquired of $
|
|
|
(
|
) |
|
|
(
|
) |
|
|
(
|
) |
|
Acquisition of UBP, net of cash acquired of $
|
|
|
(
|
) |
|
|
— |
|
|
|
— |
|
|
Real estate development and capital improvements |
|
|
(
|
) |
|
|
(
|
) |
|
|
(
|
) |
|
Proceeds from sale of real estate |
|
|
|
|
|
|
|
|
|
|
|
|
|
Issuance of notes receivable |
|
|
(
|
) |
|
|
— |
|
|
|
(
|
) |
|
Collection of notes receivable |
|
|
|
|
|
|
|
|
|
|
— |
|
|
Investments in real estate partnerships |
|
|
(
|
) |
|
|
(
|
) |
|
|
(
|
) |
|
Return of capital from investments in real estate partnerships |
|
|
|
|
|
|
|
|
|
|
|
|
|
Dividends on investment securities |
|
|
|
|
|
|
|
|
|
|
|
|
|
Acquisition of investment securities |
|
|
(
|
) |
|
|
(
|
) |
|
|
(
|
) |
|
Proceeds from sale of investment securities |
|
|
|
|
|
|
|
|
|
|
|
|
|
Net cash used in investing activities |
|
|
(
|
) |
|
|
(
|
) |
|
|
(
|
) |
|
Cash flows from financing activities: |
|
|
|
|
|
|
|
|
|
|||
|
Net proceeds from common stock issuance |
|
|
(
|
) |
|
|
|
|
|
|
|
|
|
Repurchase of common units in conjunction with equity award plans |
|
|
(
|
) |
|
|
(
|
) |
|
|
(
|
) |
|
Common units repurchased through share repurchase program |
|
|
(
|
) |
|
|
(
|
) |
|
|
— |
|
|
Proceeds from sale of treasury stock |
|
|
|
|
|
|
|
|
|
|
|
|
|
Contributions from limited partners in consolidated partnerships |
|
|
|
|
|
|
— |
|
|
|
— |
|
|
Distributions to limited partners in consolidated partnerships |
|
|
(
|
) |
|
|
(
|
) |
|
|
(
|
) |
|
Distributions to partners |
|
|
(
|
) |
|
|
(
|
) |
|
|
(
|
) |
|
Dividends paid to preferred shareholders |
|
|
(
|
) |
|
|
— |
|
|
|
— |
|
|
Redemption of exchangeable operating partnership units |
|
|
(
|
) |
|
|
— |
|
|
|
— |
|
|
Proceeds from unsecured credit facilities |
|
|
|
|
|
|
|
|
|
|
— |
|
|
Repayment of unsecured credit facilities |
|
|
(
|
) |
|
|
(
|
) |
|
|
(
|
) |
|
Proceeds from notes payable |
|
|
|
|
|
|
— |
|
|
|
— |
|
|
Repayment of notes payable |
|
|
(
|
) |
|
|
(
|
) |
|
|
(
|
) |
|
Scheduled principal payments |
|
|
(
|
) |
|
|
(
|
) |
|
|
(
|
) |
|
Payment of loan costs |
|
|
(
|
) |
|
|
(
|
) |
|
|
(
|
) |
|
Net cash used in financing activities |
|
|
(
|
) |
|
|
(
|
) |
|
|
(
|
) |
|
Net change in cash, cash equivalents, and restricted cash |
|
|
|
|
|
|
(
|
) |
|
|
(
|
) |
|
Cash, cash equivalents, and restricted cash at beginning of the year |
|
|
|
|
|
|
|
|
|
|
|
|
|
Cash, cash equivalents, and restricted cash at end of the year |
|
$ |
|
|
|
|
|
|
|
|
|
|
78
|
|
|
2023 |
|
|
2022 |
|
|
2021 |
|
|||
|
Supplemental disclosure of cash flow information: |
|
|
|
|
|
|
|
|
|
|||
|
Cash paid for interest (net of capitalized interest of $
|
|
$ |
|
|
|
|
|
|
|
|
|
|
|
Cash paid for income taxes, net of refunds |
|
$ |
|
|
|
|
|
|
|
|
|
|
|
Supplemental disclosure of non-cash transactions: |
|
|
|
|
|
|
|
|
|
|||
|
Common and Preferred stock, and exchangeable operating partnership dividends declared but not paid |
|
$ |
|
|
|
|
|
|
|
|
|
|
|
Previously held equity investments in real estate assets acquired |
|
$ |
— |
|
|
|
|
|
|
|
(
|
) |
|
Mortgage loans assumed by Company with the acquisition of real estate |
|
$ |
|
|
|
|
|
|
|
|
|
|
|
Right of use assets obtained in exchange for new operating lease liabilities |
|
$ |
|
|
|
|
— |
|
|
|
— |
|
|
Sale of leased asset in exchange for net investment in sales-type lease |
|
$ |
|
|
|
|
— |
|
|
|
— |
|
|
UBP Acquisition: |
|
|
|
|
|
|
|
|
|
|||
|
Notes payable assumed in acquisition, at fair value |
|
$ |
|
|
|
|
— |
|
|
|
— |
|
|
Noncontrolling interest assumed in acquisition, at fair value |
|
$ |
|
|
|
|
— |
|
|
|
— |
|
|
Common stock exchanged for UBP shares |
|
$ |
|
|
|
|
— |
|
|
|
— |
|
|
Preferred stock exchanged for UBP shares |
|
$ |
|
|
|
|
— |
|
|
|
— |
|
|
Common stock issued by Parent Company for partnership units exchanged |
|
$ |
|
|
|
|
|
|
|
|
|
|
|
Exchangeable operating partnership units issued for acquisition of real estate |
|
$ |
|
|
|
|
— |
|
|
|
— |
|
|
Real estate received in lieu of promote interest |
|
$ |
— |
|
|
|
— |
|
|
|
|
|
|
Change in accrued capital expenditures |
|
$ |
|
|
|
|
|
|
|
|
|
|
|
Common stock issued by Parent Company for dividend reinvestment plan |
|
$ |
|
|
|
|
|
|
|
|
|
|
|
Stock-based compensation capitalized |
|
$ |
|
|
|
|
|
|
|
|
|
|
|
Contributions to investments in real estate partnerships |
|
$ |
|
|
|
|
— |
|
|
|
— |
|
|
Contributions from limited partners in consolidated partnerships, net |
|
$ |
— |
|
|
|
|
|
|
|
— |
|
|
Reallocation of equity upon acquisition of a limited partner's interest in a consolidated partnership |
|
$ |
— |
|
|
|
|
|
|
|
— |
|
|
Adjustment for noncontrolling interests in the operating partnership |
|
$ |
— |
|
|
|
— |
|
|
|
— |
|
|
Common stock issued for dividend reinvestment in trust |
|
$ |
|
|
|
|
|
|
|
|
|
|
|
Contribution of stock awards into trust |
|
$ |
|
|
|
|
|
|
|
|
|
|
|
Distribution of stock held in trust |
|
$ |
|
|
|
|
|
|
|
|
|
|
|
Change in fair value of securities |
|
$ |
|
|
|
|
|
|
|
|
|
|
See accompanying notes to consolidated financial statements.
79
REGENCY CENTERS CORPORATION AND REGENCY CENTERS, L.P.
Notes to Consolidated Financial Statements
December 31, 2023
General
Regency Centers Corporation (the "Parent Company") began its operations as a REIT in 1993 and is the general partner of Regency Centers, L.P. (the "Operating Partnership"). The Parent Company primarily engages in the ownership, management, leasing, acquisition, development, and redevelopment of shopping centers through the Operating Partnership, and has no other assets other than through its investment in the Operating Partnership, and its only liabilities are $
As of December 31, 2023, the Parent Company, the Operating Partnership, and their controlled subsidiaries on a consolidated basis (the "Company" or "Regency") owned
Acquisition of Urstadt Biddle Properties Inc.
On
The closing of the mergers completed on August 18, 2023 and each share of Urstadt Biddle’s common stock, par value $
Estimates, Risks, and Uncert ainties
The success of the Company's tenants in operating their businesses and their corresponding ability to pay rent continue to be influenced by current economic challenges, which impact their cost of doing business, including but not limited to the impact of inflation, the cost and availability of labor, increasing energy prices and interest rates, and access to credit. Additionally, macroeconomic and geopolitical challenges, including the war involving Russia and Ukraine, Middle East conflicts and wars, and the economic and other possible conflicts involving China (including any slowing of its economy), could impact aspects
80
REGENCY CENTERS CORPORATION AND REGENCY CENTERS, L.P.
Notes to Consolidated Financial Statements
December 31, 2023
of the U.S. economy and, therefore, consumer spending. The policies implemented by the U.S. government to address these issues, including raising interest rates, could result in adverse impacts on the U.S. economy, including a slowing of growth and potentially a recession, thereby impacting consumer spending, tenants' businesses, and/or decreasing future demand for space in shopping centers. The potential impact of current macroeconomic and geopolitical challenges on the Company's financial condition, results of operations, and cash flows is subject to change and continues to depend on the extent and duration of these risks and uncertainties.
Consolidation
The accompanying Consolidated Financial Statements include the accounts of the Parent Company, the Operating Partnership, its wholly-owned subsidiaries, and consolidated partnerships in which the Company has a controlling financial interest. Investments in real estate partnerships not controlled by the Company are accounted for under the equity method of accounting. All significant inter-company balances and transactions are eliminated in the Consolidated Financial Statements.
The Company consolidates properties that are wholly-owned and properties where it owns less than 100% but has control over the activities most important to the overall success of the partnership. Control is determined using an evaluation based on accounting standards related to the consolidation of Variable Interest Entities ("VIEs") and voting interest entities. For joint ventures that are determined to be a VIE, the Company consolidates the entity where it is deemed to be the primary beneficiary. Determination of the primary beneficiary is based on whether an entity has (1) the power to direct the activities of the VIE that most significantly impact the entity's economic performance, and (2) the obligation to absorb losses of the entity that could potentially be significant to the VIE or the right to receive benefits from the entity that could potentially be significant to the VIE.
Ownership of the Parent Company
The Parent Company has a single class of common stock and two series of preferred stock outstanding.
Ownership of the Operating Partnership
The Operating Partnership's capital includes Common Units and Preferred Units. As of December 31, 2023, the Parent Company owned approximately
Each EOP unit is exchangeable for cash or one share of common stock of the Parent Company, at the discretion of the Parent Company, and the unit holder cannot require redemption in cash or common stock (i.e., registered shares of the Parent). The Parent Company has evaluated the conditions as specified under Accounting Standards Codification ("ASC") Topic 480, Distinguishing Liabilities from Equity , as it relates to EOP units outstanding and concluded that the Parent Company has the right to satisfy the redemption requirements of the units by delivering shares of unregistered common stock. Accordingly, the Parent Company classifies EOP units as permanent equity in the accompanying Consolidated Balance Sheets and Consolidated Statements of Equity and Comprehensive Income. The Parent Company serves as general partner of the Operating Partnership. The EOP unit holders have limited rights over the Operating Partnership such that they do not have the power to direct the activities that most significantly impact the Operating Partnership’s economic performance. As such, the Operating Partnership is considered a VIE, and the Parent Company, which consolidates it, is the primary beneficiary. The Parent Company's only investment is the Operating Partnership. Net income and distributions of the Operating Partnership are allocable to the general and limited common Partnership Units in accordance with their ownership percentages.
Real Estate Partnerships
As of December 31, 2023, Regency held partial ownership interests in
81
REGENCY CENTERS CORPORATION AND REGENCY CENTERS, L.P.
Notes to Consolidated Financial Statements
December 31, 2023
The assets of these partnerships are restricted to the use of the partnerships and cannot be reached by general creditors of the Company. Similarly, the obligations of the partnerships can only be settled by the assets of these partnerships or additional contributions by the partners. As managing member, Regency maintains the books and records and typically provides leasing property and asset management services to the partnerships. The Partners' level of involvement in these partnerships varies from protective decisions (debt, bankruptcy, selling primary asset(s) of business) to participating involvement such as approving leases, operating budgets, and capital budgets.
The net difference in the carrying amount of investments in real estate partnerships and the underlying equity in net assets is accreted to earnings and recorded in Equity in income of investments in real estate partnerships in the accompanying Consolidated Statements of Operations over the expected useful lives of the properties and other intangible assets, which range from
The majority of the operations of the VIEs are funded with cash flows generated by the properties, or in the case of developments, with capital contributions or third-party construction loans.
|
(in thousands) |
|
December 31, 2023 |
|
|
December 31, 2022 |
|
||
|
Assets |
|
|
|
|
|
|
||
|
Net real estate investments |
|
$ |
|
|
|
|
|
|
|
Cash, cash equivalents, and restricted cash |
|
|
|
|
|
|
|
|
|
Liabilities |
|
|
|
|
|
|
||
|
Notes payable |
|
|
|
|
|
|
|
|
|
Equity |
|
|
|
|
|
|
||
|
Limited partners’ interests in consolidated partnerships |
|
|
|
|
|
|
|
|
Noncontrolling Interests
The Company accounts for noncontrolling interests in accordance with the Consolidation guidance and the Distinguishing Liabilities from Equity guidance issued by the FASB. Noncontrolling interests represent the portion of equity that the Company does not own in those entities it consolidates. Noncontrolling interests also include amounts related to partnership units issued by consolidated subsidiaries of the Company in connection with certain property acquisitions. These partnership units have a defined redemption amount and the unit holders generally have the right to redeem their units at any time after a certain period from issuance. For these partnership units, the Company has the option to settle redemption amounts in cash or common stock. The Company evaluates the terms of the partnership units issued in accordance with the FASB’s Distinguishing Liabilities from Equity guidance. The partnership units for which the Company has the option to settle redemption amounts in cash or common stock are included in the caption Noncontrolling interests within the equity section on the Company’s Consolidated Balance Sheets.
82
REGENCY CENTERS CORPORATION AND REGENCY CENTERS, L.P.
Notes to Consolidated Financial Statements
December 31, 2023
Noncontrolling Interests of the Parent Company
The Consolidated Financial Statements of the Parent Company include the following ownership interests held by owners other than the common shareholders of the Parent Company: (i) the EOP units and (ii) the minority-owned interest held by third parties in consolidated partnerships ("Limited partners' interests in consolidated partnerships"). The Parent Company has included all of these noncontrolling interests in permanent equity, separate from the Parent Company's shareholders' equity, in the accompanying Consolidated Balance Sheets and Consolidated Statements of Equity. The portion of net income or comprehensive income attributable to these noncontrolling interests is included in net income and comprehensive income in the accompanying Consolidated Statements of Operations and Consolidated Statements of Comprehensive Income of the Parent Company.
The Parent Company also evaluated its fiduciary duties to itself, its shareholders, and, as the managing general partner of the Operating Partnership, to the Operating Partnership, and concluded its fiduciary duties are not in conflict with each other or the underlying agreements. Therefore, the Parent Company classifies such units and interests as permanent equity in the accompanying Consolidated Balance Sheets and Consolidated Statements of Equity.
Noncontrolling Interests of the Operating Partnership
The Operating Partnership has determined that limited partners' interests in consolidated partnerships are noncontrolling interests. Subject to certain conditions and pursuant to the terms of the partnership agreements, the Company generally has the right, but not the obligation, to purchase the other members' interest or sell its own interest in these consolidated partnerships. The Operating Partnership has included these noncontrolling interests in permanent capital, separate from partners' capital, in the accompanying Consolidated Balance Sheets and Consolidated Statements of Capital. The portion of net income (loss) or comprehensive income (loss) attributable to these noncontrolling interests is included in Net income and Comprehensive income in the accompanying Consolidated Statements of Operations and Consolidated Statements Comprehensive Income of the Operating Partnership.
Leasing Income and Tenant Receivables
The Company leases space to tenants under agreements with varying terms that generally provide for fixed payments of base rent, with stated increases over the term of the lease. Some of the lease agreements contain provisions that provide for additional rents based on tenants' sales volume ("percentage rent"), which are recognized when the tenants achieve the specified targets as defined in their lease agreements. Additionally, most lease agreements contain provisions for reimbursement of the tenants' share of actual real estate taxes and insurance and common area maintenance ("CAM") costs (collectively "Recoverable Costs") incurred.
Lease terms generally range from
to
The Company accounts for its leases under ASC Topic 842, Leases ("Topic 842"), as follows:
Classification
Under Topic 842, new leases or modifications thereto must be evaluated against specific classification criteria, which, based on the customary terms of the Company's leases, are classified as operating leases. However, certain longer-term leases (both lessee and lessor leases) may be classified as direct financing or sales type leases, which may result in selling profit and an accelerated pattern of earnings recognition. At December 31, 2023, the Company classified one lease as a sales type lease, with all others classified as operating leases.
83
REGENCY CENTERS CORPORATION AND REGENCY CENTERS, L.P.
Notes to Consolidated Financial Statements
December 31, 2023
Recognition and Presentation
Lease income for operating leases with fixed payment terms is recognized on a straight-line basis over the expected term of the lease for all leases for which collectibility is considered probable. CAM is considered a non-lease component of the lease contract under Topic 842. However, as the timing and pattern of providing the CAM service to the tenant is the same as the timing and pattern of the tenant's use of the underlying lease asset, the Company elected, as part of an available practical expedient, to combine CAM with the remaining lease components, along with tenant's reimbursement of real estate taxes and insurance, and recognize them together as Lease income in the accompanying Consolidated Statements of Operations.
For sales type leases, the Company records any selling profit or loss arising from the lease at inception within Gain on sale of real estate, net of tax in the accompanying Consolidated Statement of Operations, as well as any initial direct costs recorded as an expense if, at commencement, the fair value of the underlying asset differs from its carrying amount, otherwise, they are deferred and included in the net investment in the lease. The net investment in the sales-type lease represents the lease receivable, the components of which are the future lease payments and any guaranteed residual value for the underlying assets, as well as any unguaranteed residual asset expected at the end of the lease term, each measured at net present value discounted using a rate implicit in the lease. Interest income is recorded within Lease income in the accompanying Consolidated Statements of Operations over the lease term so as to produce a constant periodic rate of return on the Company’s net investment in the leases. At the commencement date, the Company derecognizes the carrying amount of the underlying asset. When measuring the net investment in a long-term ground lease, the undiscounted residual value of the land will be limited to its fair value at commencement which will likely equate to its cost.
Collectibility
At lease commencement, the Company generally expects that collectibility of substantially all payments due under the lease is probable due to the Company's credit checks on tenants and other creditworthiness analysis undertaken before entering into a new lease; therefore, income from most operating leases is initially recognized on a straight-line basis. For operating leases in which collectibility of Lease income is not considered probable, Lease income is recognized on a cash basis and all previously recognized straight-line rent receivables are reversed in the period in which the Lease income is determined not to be probable of collection. Should collectibility of Lease income become probable again, through evaluation of qualitative and quantitative measures on a tenant by tenant basis, accrual basis accounting resumes and all commencement-to-date straight-line rent is recognized in that period.
In addition to the lease-specific collectibility assessment performed under Topic 842, the Company may also recognize a general reserve, as a reduction to Lease income, for its portfolio of operating lease receivables which are not expected to be fully collectible based on the Company's historical collection experience. The Company estimates the collectibility of the accounts receivable related to base rents, straight-line rents, recoveries from tenants, and other revenue taking into consideration the Company's historical write-off experience, tenant credit-worthiness, current economic trends, and remaining lease terms. Uncollectible lease income is a direct charge against Lease income. Although we estimate uncollectible receivables and provide for them through charges against income, actual experience may differ from those estimates.
The following table represents the components of Tenant and other receivables, net of amounts considered uncollectible, in the accompanying Consolidated Balance Sheets:
|
|
|
December 31, |
|
|||||
|
(in thousands) |
|
2023 |
|
|
2022 |
|
||
|
Tenant receivables |
|
$ |
|
|
|
|
|
|
|
Straight-line rent receivables |
|
|
|
|
|
|
|
|
|
Other receivables (1) |
|
|
|
|
|
|
|
|
|
Total tenant and other receivables, net |
|
$ |
|
|
|
|
|
|
84
REGENCY CENTERS CORPORATION AND REGENCY CENTERS, L.P.
Notes to Consolidated Financial Statements
December 31, 2023
Real Estate Sales
The Company accounts for sales of nonfinancial assets under ASC Subtopic 610-20, Other Income - Gains and Losses from the Derecognition of Nonfinancial Assets , whereby the Company derecognizes real estate and recognizes a gain or loss on sales when a contract exists and control of the property has transferred to the buyer. Control of the property, including controlling financial interest, is generally considered to transfer upon closing through transfer of the legal title and possession of the property. While generally rare, any retained noncontrolling interest is measured at fair value at that time.
Management Services and Other Property Income
The Company recognizes revenue under ASC Topic 606, Revenue from Contracts with Customers ("Topic 606") , when or as control of the promised services are transferred to its customers, in an amount that reflects the consideration the Company expects to be entitled to in exchange for those services. The following is a description of the Company's revenue from contracts with customers within the scope of Topic 606.
Property and Asset Management Services
The Company is engaged under agreements with its joint venture partnerships, which are generally perpetual in nature and cancellable through unanimous partner approval, absent an event of default. Under these agreements, the Company is to provide asset and property management and leasing services for the joint ventures' shopping centers. The fees are market-based, generally calculated as a percentage of either revenues earned or the estimated values of the properties managed or the proceeds received, and are recognized over the monthly or quarterly periods as services are rendered. Property management and asset management services represent a series of distinct daily services. Accordingly, the Company satisfies its performance obligation as service is rendered each day and the variability associated with that compensation is resolved each day. Amounts due from the partnerships for such services are paid during the month following the monthly or quarterly service periods.
Several of the Company's partnership agreements provide for incentive payments, generally referred to as "promotes" or "earnouts," to Regency for appreciation in property values in Regency's capacity as managing member. The terms of these promotes are based on appreciation in real estate value over designated time intervals or upon designated events. The Company evaluates its expected promote payout at each reporting period, which generally does not result in revenue recognition until the measurement period has completed, when the amount can be reasonably determined and the amount is not probable of significant reversal.
Leasing Services
Leasing service fees are based on a percentage of the total rent due under the lease. The leasing service is considered performed upon successful execution of an acceptable tenant lease for the joint ventures' shopping centers, at which time revenue is recognized. Payment of the first half of the fee is generally due upon lease execution and the second half is generally due upon tenant opening or the commencement of rent payments.
Transaction Services
The Company also receives transaction fees, as contractually agreed upon with each joint venture, which include acquisition fees, disposition fees, and financing service fees. Control of these services is generally transferred at the time the related transaction closes, which is the point in time when the Company recognizes the related fee revenue. Any unpaid amounts related to transaction-based fees are included in Tenant and other receivables within the Consolidated Balance Sheets.
Other Property Income
Other property income includes parking fees and other incidental income from the properties and is generally recognized at the point in time that the performance obligation is met.
85
REGENCY CENTERS CORPORATION AND REGENCY CENTERS, L.P.
Notes to Consolidated Financial Statements
December 31, 2023
Income within Management, transaction, and other fees on the Consolidated Statements of Operations is primarily from contracts with the Company's real estate partnerships.
|
|
|
|
|
Year ended December 31, |
|
|
|||||||||
|
(in thousands) |
|
Timing of
|
|
2023 |
|
|
2022 |
|
|
2021 |
|
|
|||
|
Management, transaction, and other fees: |
|
|
|
|
|
|
|
|
|
|
|
|
|||
|
Property management services |
|
|
|
$ |
|
|
|
|
|
|
|
|
|
|
|
|
Asset management services |
|
|
|
|
|
|
|
|
|
|
|
|
|
|
|
|
Promote income |
|
|
|
|
— |
|
|
|
— |
|
|
|
|
|
(1) |
|
Leasing services |
|
|
|
|
|
|
|
|
|
|
|
|
|
|
|
|
Other transaction fees |
|
|
|
|
|
|
|
|
|
|
|
|
|
|
|
|
Total management, transaction, and other fees |
|
$ |
|
|
|
|
|
|
|
|
|
|
|
||
The accounts receivable for management services, which are included within Tenant and other receivables in the accompanying Consolidated Balance Sheets, are $
The following table details the components of Real estate assets in the Consolidated Balance Sheets:
|
(in thousands) |
|
December 31, 2023 |
|
|
December 31, 2022 |
|
||
|
Land |
|
$ |
|
|
|
|
|
|
|
Land improvements |
|
|
|
|
|
|
|
|
|
Buildings |
|
|
|
|
|
|
|
|
|
Building and tenant improvements |
|
|
|
|
|
|
|
|
|
Construction in progress |
|
|
|
|
|
|
|
|
|
Total real estate assets |
|
$ |
|
|
|
|
|
|
Capitalization and Depreciation
Real estate assets are stated at cost, less accumulated depreciation, and amortization. The Company periodically assesses the useful lives of its depreciable real estate assets, including those intended to be redeveloped in the near term, and accounts for any revisions prospectively. Expenditures for maintenance, repairs and demolition costs are charged to operations as incurred. Significant renovations and replacements, which improve or extend the life of the asset, are capitalized.
As part of the leasing process, the Company may provide lessees with allowances for the construction of leasehold improvements. These leasehold improvements are capitalized and recorded as tenant improvements and depreciated over the shorter of the useful life of the improvements or the remaining lease term. If the allowance represents a payment for a purpose other than funding leasehold improvements, or in the event the Company is not considered the owner of the improvements, the allowance is considered to be a lease incentive and is recognized over the lease term as a reduction of Lease income. Factors considered during this evaluation include, among other things, who holds legal title to the improvements as well as other controlling rights provided by the lease agreement and provisions for substantiation of such costs (e.g. unilateral control of the tenant space during the build-out process). Determination of the appropriate accounting for the payment of a tenant allowance is made on a lease-by-lease basis, considering the facts and circumstances of the individual tenant lease.
Depreciation is computed using the straight-line method over estimated useful lives of approximately
86
REGENCY CENTERS CORPORATION AND REGENCY CENTERS, L.P.
Notes to Consolidated Financial Statements
December 31, 2023
Development and Redevelopment Costs
All specifically identifiable costs related to development and redevelopment activities are capitalized into Real estate assets in the accompanying Consolidated Balance Sheets, and are included in Construction in progress within the above table. The capitalized costs include pre-development costs essential to the development or redevelopment of the property, construction costs, interest costs, real estate taxes, insurance, legal costs, salaries and related costs of personnel directly involved and other costs incurred during the period of development or redevelopment.
Pre-development costs represent the costs the Company incurs prior to land acquisition or pursuing a redevelopment including contract deposits, as well as legal, engineering, and other external professional fees related to evaluating the feasibility of developing or redeveloping a shopping center. As of December 31, 2023 and 2022, the Company had nonrefundable deposits and other pre-development costs of approximately
$
Interest costs are capitalized into each development and redevelopment project based upon applying the Company's weighted average borrowing rate to that portion of the actual development or redevelopment costs incurred. The Company discontinues interest and real estate tax capitalization when a project is no longer being developed or is available for occupancy upon substantial completion of tenant improvements, but in no event would the Company capitalize interest on a project beyond
We have a staff of employees directly supporting our development and redevelopment program. All direct internal costs attributable to these development activities are capitalized as part of each development and redevelopment project. The capitalization of costs is directly related to the actual level of development activity occurring. During the years ended December 31, 2023, 2022, and 2021, we capitalized
$
Acquisitions
Upon acquisition of operating real estate properties, the Company estimates the fair value of acquired tangible assets (consisting of land, land improvements, buildings, building improvements and tenant improvements) and identified intangible assets and liabilities (consisting of above and below-market leases and in-place leases), assumed debt, and any noncontrolling interest in the acquiree at the date of acquisition, based on evaluation of information and estimates available at that date. Based on these estimates, the Company allocates the purchase price of the acquired properties based on their relative fair value to the applicable assets and liabilities. Acquisitions of operating properties are generally considered asset acquisitions and therefore transaction costs are capitalized. Fair value is determined based on an exit price approach, which contemplates the price that would be received to sell an asset or paid to transfer a liability in an orderly transaction between market participants at the measurement date.
The Company's methodology includes estimating an "as-if vacant" fair value of the physical property, which includes land, building, and improvements. In addition, the Company determines the estimated fair value of identifiable intangible assets and liabilities, considering the following categories: (i) value of in-place leases, and (ii) above and below-market value of in-place leases.
The value of in-place leases is estimated based on the value associated with the costs avoided in originating leases compared to the acquired in-place leases as well as the value associated with lost rental and recovery revenue during the assumed lease-up period. The value of in-place leases is recorded to Depreciation and amortization expense in the Consolidated Statements of Operations over the remaining expected term of the respective leases.
Above-market and below-market in-place lease values for acquired properties are recorded based on the present value of the difference between (i) the contractual amounts to be paid pursuant to the in-place leases and (ii) management's estimate of market lease rates for comparable in-place leases, measured over a period equal to the remaining non-cancelable term of the lease, including below-market renewal options, if applicable. The value of above-market leases is amortized as a reduction of Lease income over the remaining terms of the respective leases and the value of below-market leases is accreted to Lease income over the remaining terms of the respective leases, including below-market renewal options, if applicable.
87
REGENCY CENTERS CORPORATION AND REGENCY CENTERS, L.P.
Notes to Consolidated Financial Statements
December 31, 2023
The Company does not assign value to customer relationship intangibles if it has pre-existing business relationships with major retailers at the acquired property since they do not provide incremental value over the Company's existing relationships.
Held for Sale
The Company classifies real estate assets as held-for-sale upon satisfaction of all the following criteria: (i) management commits to a plan to sell a property (or group of properties), (ii) the property is available for immediate sale in its present condition subject only to terms that are usual and customary for sales of such properties, (iii) an active program to locate a buyer and other actions required to complete the plan to sell the property have been initiated, (iv) the sale of the property is probable and transfer of the asset is expected to be completed within one year, (v) the property is being actively marketed for sale, and (vi) actions required to complete the plan indicate that it is unlikely that significant changes to the plan will be made or that the plan will be withdrawn. Upon the determination to classify a property as held for sale, the Company ceases depreciation and amortization on the real estate property held for sale, as well as the amortization of any related intangible assets. Such properties are recorded at the lesser of the carrying value or estimated fair value less estimated costs to sell.
Valuation of Real Estate Investments and Impairments
The Company continually evaluates whether there are any events or changes in circumstances, that could indicate the carrying values of the real estate properties (including any related amortizable intangible assets or liabilities) may not be recoverable. When indicators of potential impairment suggest that the carrying value of real estate assets may not be recoverable, the Company assesses the recoverability of the asset group by estimating whether the Company will recover the carrying value of the asset group through its undiscounted future cash flows, including eventual disposition. Based on this analysis, if the Company does not believe that it will be able to recover the carrying value of the asset group, an impairment charge will be recorded to the extent that the carrying value exceeds the estimated fair value of the asset group.
Estimated cash flows are based on several key assumptions, including rental rates, expected leasing activity, costs of tenant improvements, leasing commissions, expected hold period, and assumptions regarding the residual value upon disposition, including the exit capitalization rate. These key assumptions are subjective in nature and could differ materially from actual results. Changes in events or changes in circumstances may alter the hold period of an asset or asset group which may result in an impairment loss and such loss could be material to the Company's financial condition or operating performance. If a property previously classified as held and used is changed to held for sale, the Company estimates fair value, less expected costs to sell, which could cause the Company to determine that the property is impaired.
The estimated fair value of real estate assets is subjective and is estimated through comparable sales information and other market data if available, or through use of an income approach such as the direct capitalization method or the discounted cash flow approach. The discounted cash flow approach uses similar assumptions to the undiscounted cash flow approach above, as well as a discount rate. Such cash flow projections and rates are subject to management judgment and changes in those assumptions could impact the estimate of fair value. In estimating the fair value of undeveloped land, the Company generally uses market data and comparable sales information.
Any instruments which have
an original maturity of
Goodwill
Goodwill represents the excess of the purchase price consideration from the Equity One merger in 2017 over the fair value of the assets acquired and liabilities assumed. The Company accounts for goodwill in accordance with ASC Topic 350, Intangibles - Goodwill and Other , and allocates its goodwill to its reporting units, which have been determined to be at the individual property level. The Company performs an impairment evaluation of its goodwill at least annually, in November of each year, or more frequently as triggers occur. See note 5.
The goodwill impairment evaluation is completed using either a qualitative or quantitative approach. Under a qualitative approach, the impairment review for goodwill consists of an assessment of whether it is more-likely-than-not that the reporting unit's fair value is less than its carrying value, including goodwill. If a qualitative approach indicates it is more
88
REGENCY CENTERS CORPORATION AND REGENCY CENTERS, L.P.
Notes to Consolidated Financial Statements
December 31, 2023
likely-than-not that the estimated carrying value of a reporting unit (including goodwill) exceeds its fair value, or if the Company chooses to bypass the qualitative approach for any reporting unit, the Company will perform the quantitative approach described below.
The quantitative approach consists of estimating the fair value of each reporting unit using discounted projected future cash flows and comparing those estimated fair values with the carrying values, which include the allocated goodwill. If the estimated fair value is less than the carrying value, the Company would then recognize a goodwill impairment charge for the amount by which the carrying amount exceeds the reporting unit's fair value, not to exceed the total amount of goodwill allocated to that reporting unit.
Investments
The Company determines the appropriate classification of its investments in debt and equity securities at the time of purchase and reevaluates such determinations at each balance sheet date. The fair value of securities is determined using quoted market prices.
Debt securities are classified as held to maturity when the Company has the positive intent and ability to hold the securities to maturity. Debt securities that are bought and held principally for the purpose of selling them in the near term are classified as trading securities and are reported at fair value, with unrealized gains and losses recognized through earnings in Investment income in the Consolidated Statements of Operations. Debt securities not classified as held to maturity or as trading, are classified as available-for-sale, and are carried at fair value, with the unrealized gains and losses, net of tax, included in the determination of comprehensive income and reported in the Consolidated Statements of Comprehensive Income.
Equity securities with readily determinable fair values are measured at fair value with changes in the fair value recognized through net income and presented within Investment income in the Consolidated Statements of Operations.
Derivative Instruments
The Company manages economic risks, including interest rate, liquidity, and credit risk primarily by managing the amount, sources, and duration of its debt funding and the use of derivative instruments. Specifically, the Company enters into derivative instruments to manage exposures that arise from business activities that result in the receipt or future payment of known and uncertain cash amounts, the amount of which are determined by interest rates. The Company's derivative instruments are used to manage fluctuations in the amount, timing, and duration of the Company's known or expected cash payments principally related to the Company's borrowings.
All derivative instruments, whether designated in hedging relationships or not, are recorded on the accompanying Consolidated Balance Sheets at their fair value. The accounting for changes in the fair value of derivatives depends on the intended use of the derivative, whether the Company has elected to designate a derivative in a hedging relationship and apply hedge accounting, and whether the hedging relationship has satisfied the criteria necessary to apply hedge accounting. Derivatives designated and qualifying as a hedge of the exposure to variability in expected future cash flows, or other types of forecasted transactions, are considered cash flow hedges. Hedge accounting generally provides for the matching of the timing of gain or loss recognition on the hedging instrument with the earnings effect of the hedged forecasted transactions in a cash flow hedge. The Company may enter into derivative contracts that are intended to economically hedge certain risks, even though hedge accounting does not apply or the Company elects not to apply hedge accounting.
The Company uses interest rate swaps to mitigate its interest rate risk on a related financial instrument or forecasted transaction, and the Company designates these interest rate swaps as cash flow hedges. Interest rate swaps designated as cash flow hedges generally involve the receipt of variable-rate amounts from a counterparty in exchange for the Company making fixed-rate payments over the life of the agreements without exchange of the underlying notional amount. The Company may also utilize cash flow hedges to lock U.S. Treasury rates in anticipation of future fixed-rate debt issuances. The gains or losses resulting from changes in fair value of derivatives that qualify as cash flow hedges are recognized in Accumulated other comprehensive income (loss) ("AOCI"). Upon the settlement of a hedge, gains and losses remaining in AOCI are amortized through earnings over the underlying term of the hedged transaction. The cash receipts or payments related to interest rate swaps are presented in cash flows provided by operating activities in the accompanying Consolidated Statements of Cash Flows.
89
REGENCY CENTERS CORPORATION AND REGENCY CENTERS, L.P.
Notes to Consolidated Financial Statements
December 31, 2023
The Company formally documents all relationships between hedging instruments and hedged items, as well as its risk management objectives and strategies for undertaking various hedge transactions. The Company assesses, both at inception of the hedge and on an ongoing basis, whether the derivatives that are used in hedging transactions are highly effective in offsetting changes in the cash flows and/or forecasted cash flows of the hedged items.
In assessing the valuation of the hedges, the Company uses standard market conventions and techniques such as discounted cash flow analysis, option pricing models, and termination costs at each balance sheet date. All methods of assessing fair value result in a general approximation of value, and such value may never actually be realized.
Deferred leasing costs consist of costs associated with leasing the Company's shopping centers, and are presented net of accumulated amortization. Such costs are amortized over the period through lease expiration. If the lease is terminated early, the remaining leasing costs are written off.
Under ASC Topic 842, the Company, as a lessor, may only defer as initial direct costs the incremental costs of a tenant's operating lease that would not have been incurred if the lease had not been obtained. These costs generally consist of third party broker payments. Non-contingent internal leasing and legal costs associated with leasing activities are expensed within General and administrative expenses.
The Parent Company believes it qualifies, and intends to continue to qualify, as a REIT under the Code. As a REIT, the Parent Company will generally not be subject to federal income tax, provided that distributions to its shareholders are at least equal to REIT taxable income. All wholly-owned corporate subsidiaries of the Operating Partnership have elected to be a TRS or qualify as a REIT. The TRS's are subject to federal and state income taxes and file separate tax returns. As a pass through entity, the Operating Partnership generally does not pay taxes, but its taxable income or loss is reported by its partners, of which the Parent Company, as general partner and approximately
The Company accounts for income taxes related to its TRS's under the asset and liability approach, which requires the recognition of the amount of taxes payable or refundable for the current year and deferred tax assets and liabilities for the expected future tax consequences of events that have been recognized in the financial statements. Under this method, deferred tax assets and liabilities are determined based on the differences between the financial statement and tax basis of assets and liabilities using enacted tax rates in effect for the year in which the differences are expected to reverse. The Company records net deferred tax assets to the extent it believes it is more likely than not that these assets will be realized. A valuation allowance is recorded to reduce deferred tax assets when it is believed that it is more likely than not that all or some portion of the deferred tax asset will not be realized. The Company considers all available positive and negative evidence, including forecasts of future taxable income, the reversal of other existing temporary differences, available net operating loss carryforwards, tax planning strategies and recent and projected results of operations in order to make that determination.
In addition, tax positions are initially recognized in the financial statements when it is more likely than not the position will be sustained upon examination by the tax authorities. Such tax positions shall initially and subsequently be measured as the largest amount of tax benefit that has a greater than 50% likelihood of being realized upon ultimate settlement with the tax authority assuming full knowledge of the position and relevant facts. The Company believes that it has appropriate support for the income tax positions taken and to be taken on its tax returns and that its accruals for tax liabilities are adequate for all open tax years (2020 and forward for federal and state) based on an assessment of many factors including past experience and interpretations of tax laws applied to the facts of each matter.
The Company has certain properties within its consolidated real estate portfolio that are either partially or completely on land subject to ground leases with third parties, which are all classified as operating leases. Accordingly, the Company owns only a long-term leasehold or similar interest in these properties. The building and improvements constructed on the leased land are capitalized as Real estate assets in the accompanying Consolidated Balance Sheets and depreciated over the shorter of the useful life of the improvements or the lease term.
90
REGENCY CENTERS CORPORATION AND REGENCY CENTERS, L.P.
Notes to Consolidated Financial Statements
December 31, 2023
In addition, the Company has non-cancelable operating leases pertaining to office space from which it conducts its business. Leasehold improvements are capitalized as tenant improvements, included in Other assets in the Consolidated Balance Sheets, and depreciated over the shorter of the useful life of the improvements or the lease term.
Under Topic 842, the Company recognizes Lease liabilities on its Consolidated Balance Sheets for its ground and office leases and corresponding Right of use assets related to these same ground and office leases which are classified as operating leases. A key input in estimating the Lease liabilities and resulting Right of use assets is establishing the discount rate in the lease, which since the rates implicit in the lease contracts are not readily determinable, requires additional inputs for the longer-term ground leases, including market-based interest rates that correspond with the remaining term of the lease, the Company's credit spread, and a securitization adjustment necessary to reflect the collateralized payment terms present in the lease. This discount rate is applied to the remaining unpaid minimum rental payments for each lease to measure the operating lease liabilities.
Basic earnings per share of common stock and unit are computed based upon the weighted average number of common shares and units, respectively, outstanding during the period. Diluted earnings per share and unit reflect the conversion of obligations and the assumed exercises of securities including the effects of shares issuable under the Company's share-based payment arrangements, if dilutive. Dividends paid on the Company's share-based compensation awards are not participating securities as they are forfeitable.
The Company grants stock-based compensation to its employees and directors. The Company recognizes the cost of stock-based compensation based on the grant-date fair value of the award, which is expensed over the vesting period.
When the Parent Company issues common stock as compensation, it receives an equal number of common units from the Operating Partnership. The Company is committed to contributing to the Operating Partnership all proceeds from the share-based awards granted under the Parent Company's Long-Term Omnibus Plan (the "Plan"). Accordingly, the Parent Company's ownership in the Operating Partnership will increase based on the amount of proceeds contributed to the Operating Partnership for the common units it receives. As a result of the issuance of common units to the Parent Company for stock-based compensation, the Operating Partnership records the effect of stock-based compensation for awards of equity in the Parent Company.
The Company's business is investing in retail shopping centers through direct ownership or partnership interests. The Company actively manages its portfolio of retail shopping centers and may from time to time make decisions to sell lower performing properties or developments not meeting its long-term investment objectives. The proceeds from sales are generally reinvested into higher quality retail shopping centers, through acquisitions, new developments, or redevelopment of existing centers, which management believes will generate sustainable revenue growth and attractive returns. It is management's intent that all retail shopping centers will be owned or developed for investment purposes; however, the Company may decide to sell all or a portion of a development upon completion. The Company's revenues and net income are generated from the operation of its investment portfolio. The Company also earns fees for services provided to manage and lease retail shopping centers owned through joint ventures.
The Company's portfolio is located throughout the United States. Management does not distinguish or group its operations on a geographical basis for purposes of allocating resources or capital. The Company’s chief operating decision maker evaluates operating and financial performance for each property on an individual property level; therefore, the Company defines an operating segment as its individual properties. The individual properties have been aggregated into one reportable segment based upon their similarities with regard to both the nature and economics of the centers, tenants and operational processes, as well as long-term average financial performance.
Grocer anchor tenants represent approximately
91
REGENCY CENTERS CORPORATION AND REGENCY CENTERS, L.P.
Notes to Consolidated Financial Statements
December 31, 2023
ASC 820, Fair Value Measurements and Disclosures, or ASC 820, defines fair value, establishes a framework for measuring fair value in accordance with GAAP and expands disclosures about fair value measurements. ASC 820 emphasizes that fair value is intended to be a market-based measurement, as opposed to a transaction-specific measurement. Fair value is defined by ASC 820 as the price that would be received to sell an asset or paid to transfer a liability in an orderly transaction between market participants at the measurement date. Therefore, a fair value measurement is determined based on the assumptions that market participants would use in pricing the asset or liability. As a basis for considering market participant assumptions in fair value measurements, the Company uses a fair value hierarchy that distinguishes between market participant assumptions based on market data obtained from independent sources (observable inputs that are classified within Levels 1 and 2 of the hierarchy) and the Company's own assumptions about market participant assumptions (unobservable inputs classified within Level 3 of the hierarchy). The three levels of inputs used to measure fair value are as follows:
92
REGENCY CENTERS CORPORATION AND REGENCY CENTERS, L.P.
Notes to Consolidated Financial Statements
December 31, 2023
(n) Recent Accounting Pronouncements
The following table provides a brief description of recent accounting pronouncements and expected impact on our financial statements:
|
Standard |
|
Description |
|
Date of adoption |
|
Effect on the financial statements or other significant matters |
|
Recently
|
|
|
|
|
|
|
|
|
|
|
|
|
|
|
|
|
|
In March 2020, the Financial Accounting Standards Board ("FASB") issued ASU 2020-04, Reference Rate Reform (Topic 848). ASU 2020-04 contains practical expedients for reference rate reform related to activities that impact debt, leases, derivatives, and other contracts. The guidance in ASU 2020-04 is optional and may be elected over time as reference rate reform activities occur. The amendments in this update provide exceptions to the guidance in Topic 815 related to changes to the critical terms of a hedging relationship due to reference rate reform, which if criteria are met, provide such changes should not result in the dedesignation and redesignation of the hedging relationship. |
|
through March 31, 2023 |
|
The Company has elected to apply the hedge accounting expedients and exceptions related to changes to the reference rate from LIBOR to SOFR in the Company's interest rate swaps, which it completed during the three months ended March 31, 2023. Application of these exceptions preserves the hedge designation of interest rate swaps and the related accounting and presentation consistent with past presentation. |
|
|
|
|
|
|
|
|
|
|
|
The amendments in this update require acquiring entities to apply Topic 606 to recognize and measure contract assets and contract liabilities in a business combination rather than at fair value on the acquisition date required by Topic 805. |
|
|
|
The adoption of this ASU did
|
|
|
|
|
|
|
|
|
|
|
|
The amendments are aimed at enhancing the disclosures public entities provide regarding significant segment expenses so that investors can “better understand an entity’s overall performance” and assess “potential future cash flows.” |
|
|
|
The Company is assessing the impact this ASU will have on the Company’s financial statement disclosures. |
|
|
|
|
|
|
|
|
|
ASU 2023-09, Income Taxes (Topic 740):Improvements to Income Tax Disclosures. |
|
ASU 2023-09 requires public business entities to disclose additional information in specified categories with respect to the reconciliation of the effective tax rate to the statutory rate for federal, state, and foreign income taxes. It also requires greater detail about individual reconciling items in the rate reconciliation to the extent the impact of those items exceeds a specified threshold. |
|
January 1, 2025 |
|
The Company is assessing the impact this ASU will have on the Company’s financial statement disclosures. |
93
REGENCY CENTERS CORPORATION AND REGENCY CENTERS, L.P.
Notes to Consolidated Financial Statements
December 31, 2023
UBP Acquisition
General
With respect to the acquisition of UBP discussed in Note 1 - Acquisition of Urstadt Biddle Properties Inc,
|
(in thousands, except stock price) |
|
Purchase Price |
|
|
|
Shares of common stock issued for acquisition |
|
|
|
|
|
Closing stock price on August 17, 2023 |
|
$ |
|
|
|
Value of common stock issued for acquisition |
|
$ |
|
|
|
Other adjustments |
|
|
(
|
) |
|
Total value of common stock issued |
|
$ |
|
|
|
Debt repaid |
|
|
|
|
|
Preferred stock converted |
|
|
|
|
|
Transaction costs |
|
|
|
|
|
Other cash payments |
|
|
|
|
|
Total purchase price |
|
$ |
|
|
Purchase Price Allocation
The acquisition has been accounted for using the asset acquisition method of accounting in accordance with ASC 805, Business Combinations, which requires, among other things, that the total cost or total consideration exchanged be allocated to the real estate properties and related lease intangibles on a relative fair value basis. All the other assets acquired, and liabilities assumed, including notes payable, are recorded at fair value.
|
(in thousands) |
|
Purchase Price Allocation |
|
|
|
Real estate assets |
|
$ |
|
|
|
Investments in unconsolidated real estate partnerships |
|
|
|
|
|
Real estate assets |
|
|
|
|
|
Cash, accounts receivable and other assets |
|
|
|
|
|
Lease intangible assets |
|
|
|
|
|
Total assets acquired |
|
|
|
|
|
|
|
|
|
|
|
Notes payable |
|
|
|
|
|
Accounts payable, accrued expenses, and other liabilities |
|
|
|
|
|
Lease intangible liabilities |
|
|
|
|
|
Total liabilities assumed |
|
|
|
|
|
Non-controlling interest |
|
|
|
|
|
Total purchase price |
|
$ |
|
|
The acquired assets and assumed liabilities for an acquired operating property generally include, but are not limited to: land, buildings and improvements, identified tangible and intangible assets and liabilities associated with in-place leases, including tenant improvements, leasing costs, value of above-market and below-market leases, and value of acquired in-place leases. This methodology includes estimating an “as-if vacant” fair value of the physical property, which includes land, building, and improvements and also determines the estimated fair value of identifiable intangible assets and liabilities, considering the following categories: (i) value of in-place leases, and (ii) above and below-market value of in-place leases. The fair market value of the acquired operating properties is based on a valuation prepared by Regency with assistance of a third party valuation specialist. The third-party specialist utilized stabilized NOI and market specific capitalization rates as the primary valuation inputs in determining the fair value of the real estate assets. The fair value of land is generally based on relevant market data, such as a comparison of the subject site to similar parcels that have recently been sold or are currently being offered on the market for sale. Management reviews the inputs used by the third-party specialist as well as the allocation of the purchase price to ensure reasonableness and that the procedures are performed in accordance with management's policy. Management and the third-party valuation specialist prepared their fair value estimates for each of the operating properties acquired. The allocation of the purchase price described above requires a significant amount of judgment and represents management's best estimate of the fair value as of the acquisition date.
94
REGENCY CENTERS CORPORATION AND REGENCY CENTERS, L.P.
Notes to Consolidated Financial Statements
December 31, 2023
The following table details the weighted average amortization and net accretion periods, in years, of the major classes of intangible assets and intangible liabilities arising from the UBP acquisition:
|
(in years) |
|
Weighted Average Amortization Period |
|
|
|
Assets: |
|
|
|
|
|
In-place leases |
|
|
|
|
|
Above-market leases |
|
|
|
|
|
Liabilities: |
|
|
|
|
|
Below-market leases |
|
|
|
|
Other Acquisitions
The following tables detail the other properties acquired for the periods set forth below:
|
(in thousands) |
|
December 31, 2023 |
|
|||||||||||||||||||||
|
Date
|
|
Property Name |
|
City/State |
|
Property
|
|
Regency Ownership |
|
Purchase
|
|
|
Debt
|
|
|
Intangible
|
|
|
Intangible
|
|
||||
|
|
|
|
|
|
|
Development |
|
|
|
$ |
|
|
|
|
— |
|
|
|
— |
|
|
|
— |
|
|
|
|
|
|
|
|
Development |
|
|
|
|
|
|
|
|
— |
|
|
|
— |
|
|
|
— |
|
|
|
|
|
|
|
|
Operating |
|
|
|
|
|
|
|
|
— |
|
|
|
|
|
|
|
|
|
|
|
|
|
|
|
|
Operating |
|
|
|
|
|
|
|
|
— |
|
|
|
|
|
|
|
|
|
|
Total property acquisitions |
|
|
|
|
|
|
|
$ |
|
|
|
|
— |
|
|
|
|
|
|
|
|
|
||
|
(in thousands) |
|
December 31, 2022 |
|
|||||||||||||||||||||
|
Date
|
|
Property Name |
|
City/State |
|
Property
|
|
Regency Ownership |
|
Purchase
|
|
|
Debt
|
|
|
Intangible
|
|
|
Intangible
|
|
||||
|
|
|
|
|
|
|
Development |
|
|
|
$ |
|
|
|
|
— |
|
|
|
— |
|
|
|
— |
|
|
|
|
|
|
|
|
Operating |
|
|
|
|
|
|
|
|
— |
|
|
|
|
|
|
|
|
|
|
|
|
|
|
|
|
Operating |
|
|
|
|
|
|
|
|
— |
|
|
|
|
|
|
|
|
|
|
|
|
|
|
|
|
Operating |
|
|
|
|
|
|
|
|
— |
|
|
|
|
|
|
|
|
|
|
|
|
|
|
|
|
Operating |
|
|
|
|
|
|
|
|
— |
|
|
|
|
|
|
|
|
|
|
|
|
|
|
|
|
Operating |
|
|
|
|
|
|
|
|
— |
|
|
|
|
|
|
|
|
|
|
|
|
|
|
|
|
Operating |
|
|
|
|
|
|
|
|
|
|
|
|
|
|
|
|
|
|
|
|
|
|
|
|
|
Operating |
|
|
|
|
|
|
|
|
— |
|
|
|
|
|
|
|
|
|
|
Total property acquisitions |
|
|
|
|
|
|
|
$ |
|
|
|
|
|
|
|
|
|
|
|
|
|
|
||
In addition to the acquisitions listed above, the Company acquired, for $
The following table provides a summary of consolidated shopping centers and land parcels sold during the periods set forth below:
|
|
|
Year ended December 31, |
|
|||||||||
|
(in thousands, except number sold data) |
|
2023 |
|
|
2022 |
|
|
2021 |
|
|||
|
Net proceeds from sale of real estate investments |
|
$ |
|
|
|
|
|
|
|
|
|
|
|
Gain on sale of real estate, net of tax |
|
$ |
|
|
|
|
|
|
|
|
|
|
|
Provision for impairment of real estate sold |
|
$ |
— |
|
|
|
— |
|
|
|
|
|
|
Number of operating properties sold |
|
|
— |
|
|
|
|
|
|
|
|
|
|
Number of land parcels sold |
|
|
|
|
|
|
|
|
|
|
|
|
|
Percent interest sold |
|
|
|
|
|
|
|
|
|
% |
||
95
REGENCY CENTERS CORPORATION AND REGENCY CENTERS, L.P.
Notes to Consolidated Financial Statements
December 31, 2023
The Company invests in real estate partnerships, which consist of the following:
|
|
|
December 31, 2023 |
|
|||||||||||||||||||
|
(in thousands) |
|
Regency's Ownership |
|
Number of Properties |
|
|
Total Investment |
|
|
Total Assets of the Partnership |
|
|
The Company's Share of Net Income of the Partnership |
|
|
Net Income of the Partnership |
|
|||||
|
GRI - Regency, LLC (GRIR) |
|
|
|
|
|
|
|
$ |
|
|
|
|
|
|
|
|
|
|
|
|
|
|
|
Columbia Regency Retail Partners, LLC (Columbia I) |
|
|
|
|
|
|
|
|
|
|
|
|
|
|
|
|
|
|
|
|
|
|
|
Columbia Regency Partners II, LLC (Columbia II) |
|
|
|
|
|
|
|
|
|
|
|
|
|
|
|
|
|
|
|
|
|
|
|
Columbia Village District, LLC |
|
|
|
|
|
|
|
|
|
|
|
|
|
|
|
|
|
|
|
|
|
|
|
Individual Investors |
|
|
|
|
|
|
|
|
|
|
|
|
|
|
|
|
|
|||||
|
Ballard Bocks |
|
|
|
|
|
|
|
|
|
|
|
|
|
|
|
|
|
|
|
|
|
|
|
Town & Country Center |
|
|
|
|
|
|
|
|
|
|
|
|
|
|
|
|
|
|
|
|
|
|
|
Others (1) |
|
|
|
|
|
|
|
|
|
|
|
|
|
|
|
|
|
|
|
|
|
|
|
Total investments in real estate partnerships |
|
|
|
|
|
$ |
|
|
|
|
|
|
|
|
|
|
|
|
|
|
||
|
|
|
December 31, 2022 |
|
|||||||||||||||||||
|
(in thousands) |
|
Regency's Ownership |
|
Number of Properties |
|
|
Total Investment |
|
|
Total Assets of the Partnership |
|
|
The Company's Share of Net Income of the Partnership |
|
|
Net Income of the Partnership |
|
|||||
|
GRI - Regency, LLC (GRIR) |
|
|
|
|
|
|
|
$ |
|
|
|
|
|
|
|
|
|
|
|
|
|
|
|
New York Common Retirement Fund (NYC) (1) |
|
|
|
|
— |
|
|
|
|
|
|
|
|
|
|
|
|
|
|
|
|
|
|
Columbia Regency Retail Partners, LLC (Columbia I) |
|
|
|
|
|
|
|
|
|
|
|
|
|
|
|
|
|
|
|
|
|
|
|
Columbia Regency Partners II, LLC (Columbia II) |
|
|
|
|
|
|
|
|
|
|
|
|
|
|
|
|
|
|
|
|
|
|
|
Columbia Village District, LLC |
|
|
|
|
|
|
|
|
|
|
|
|
|
|
|
|
|
|
|
|
|
|
|
RegCal, LLC (RegCal) (2) |
|
|
|
|
|
|
|
|
|
|
|
|
|
|
|
|
|
|
|
|
|
|
|
Individual Investors |
|
|
|
|
|
|
|
|
|
|
|
|
|
|
|
|
|
|||||
|
Ballard Bocks |
|
|
|
|
|
|
|
|
|
|
|
|
|
|
|
|
|
|
|
|
|
|
|
Town & Country Center |
|
|
|
|
|
|
|
|
|
|
|
|
|
|
|
|
|
|
|
|
|
|
|
Others |
|
|
|
|
|
|
|
|
|
|
|
|
|
|
|
|
|
|
|
|
|
|
|
Total investments in real estate partnerships |
|
|
|
|
|
$ |
|
|
|
|
|
|
|
|
|
|
|
|
|
|
||
96
REGENCY CENTERS CORPORATION AND REGENCY CENTERS, L.P.
Notes to Consolidated Financial Statements
December 31, 2023
The summarized balance sheet information for the investments in real estate partnerships, on a combined basis, is as follows:
|
|
|
December 31, |
|
|||||
|
(in thousands) |
|
2023 |
|
|
2022 |
|
||
|
Investments in real estate, net |
|
$ |
|
|
|
|
|
|
|
Acquired lease intangible assets, net |
|
|
|
|
|
|
|
|
|
Other assets |
|
|
|
|
|
|
|
|
|
Total assets |
|
$ |
|
|
|
|
|
|
|
Notes payable |
|
$ |
|
|
|
|
|
|
|
Acquired lease intangible liabilities, net |
|
|
|
|
|
|
|
|
|
Other liabilities |
|
|
|
|
|
|
|
|
|
Capital - Regency |
|
|
|
|
|
|
|
|
|
Capital - Third parties |
|
|
|
|
|
|
|
|
|
Total liabilities and capital |
|
$ |
|
|
|
|
|
|
The following table reconciles the Company's capital recorded by the unconsolidated partnerships to the Company's investments in real estate partnerships reported in the accompanying Consolidated Balance Sheet:
|
|
|
December 31, |
|
|||||
|
(in thousands) |
|
2023 |
|
|
2022 |
|
||
|
Capital - Regency |
|
$ |
|
|
|
|
|
|
|
Basis difference |
|
|
(
|
) |
|
|
(
|
) |
|
Investments in real estate partnerships |
|
$ |
|
|
|
|
|
|
The revenues and expenses for the investments in real estate partnerships, on a combined basis, are summarized as follows:
|
|
|
Year ended December 31, |
|
|||||||||
|
(in thousands) |
|
2023 |
|
|
2022 |
|
|
2021 |
|
|||
|
Total revenues |
|
$ |
|
|
|
|
|
|
|
|
|
|
|
Operating expenses: |
|
|
|
|
|
|
|
|
|
|||
|
Depreciation and amortization |
|
|
|
|
|
|
|
|
|
|
|
|
|
Property operating expense |
|
|
|
|
|
|
|
|
|
|
|
|
|
Real estate taxes |
|
|
|
|
|
|
|
|
|
|
|
|
|
General and administrative |
|
|
|
|
|
|
|
|
|
|
|
|
|
Other operating expenses |
|
|
|
|
|
|
|
|
|
|
|
|
|
Total operating expenses |
|
$ |
|
|
|
|
|
|
|
|
|
|
|
Other expense (income): |
|
|
|
|
|
|
|
|
|
|||
|
Interest expense, net |
|
|
|
|
|
|
|
|
|
|
|
|
|
Gain on sale of real estate |
|
|
(
|
) |
|
|
(
|
) |
|
|
(
|
) |
|
Early extinguishment of debt |
|
|
|
|
|
|
|
|
|
|
|
|
|
Provision for impairment |
|
|
|
|
|
|
|
|
|
|
|
|
|
Total other expense (income) |
|
|
|
|
|
|
|
|
|
|
(
|
) |
|
Net income of the Partnerships |
|
$ |
|
|
|
|
|
|
|
|
|
|
|
The Company's share of net income of the Partnerships |
|
$ |
|
|
|
|
|
|
|
|
|
|
97
REGENCY CENTERS CORPORATION AND REGENCY CENTERS, L.P.
Notes to Consolidated Financial Statements
December 31, 2023
Acquisitions
The following table provides a summary of shopping centers and land parcels acquired through our unconsolidated real estate partnerships for the periods set forth below:
|
(in thousands) |
|
Year ended December 31, 2023 |
|
|||||||||||||||||||||||
|
Date
|
|
Property
|
|
City/State |
|
Property
|
|
Real Estate Partner |
|
Ownership
|
|
Purchase Price (1) |
|
|
Debt Assumed, Net of Premiums (1) |
|
|
Intangible Assets (1) |
|
|
Intangible Liabilities (1) |
|
||||
|
|
|
|
|
|
|
|
|
|
|
|
|
|
|
|
|
|
— |
|
|
|
|
|
|
|
|
|
|
Total property acquisitions |
|
|
|
|
|
|
|
|
|
$ |
|
|
|
|
— |
|
|
|
|
|
|
|
|
|
||
|
(in thousands) |
|
Year ended December 31, 2022 |
|
|||||||||||||||||||||||
|
Date
|
|
Property
|
|
City/State |
|
Property
|
|
Real Estate Partner |
|
Ownership
|
|
Purchase Price (1) |
|
|
Debt Assumed, Net of Premiums (1) |
|
|
Intangible Assets (1) |
|
|
Intangible Liabilities (1) |
|
||||
|
|
|
|
|
|
|
|
|
|
|
|
|
$ |
|
|
|
|
|
|
|
|
|
|
|
|
|
|
|
|
|
|
|
|
|
|
|
|
|
|
|
$ |
|
|
|
|
— |
|
|
|
— |
|
|
|
— |
|
|
Total property acquisitions |
|
|
|
|
|
|
|
|
|
$ |
|
|
|
|
|
|
|
|
|
|
|
|
|
|
||
Dispositions
The following table provides a summary of shopping centers and land parcels disposed of through our unconsolidated real estate partnerships:
|
|
|
Year ended December 31, |
|
|||||||||
|
(in thousands) |
|
2023 |
|
|
2022 |
|
|
2021 |
|
|||
|
Proceeds from sale of real estate investments |
|
$ |
|
|
|
|
|
|
|
|
|
|
|
Gain on sale of real estate |
|
$ |
|
|
|
|
|
|
|
|
|
|
|
The Company's share of gain on sale of real estate |
|
$ |
|
|
|
|
|
|
|
|
|
|
|
Number of operating properties sold |
|
|
|
|
|
|
|
|
|
|
|
|
|
Number of land out-parcels sold |
|
|
|
|
|
|
|
|
|
|
|
|
Notes Payable
Scheduled principal repayments on notes payable held by our unconsolidated investments in real estate partnerships as of December 31, 2023, were as follows:
|
(in thousands)
|
|
Scheduled
|
|
|
Mortgage
|
|
|
Unsecured
|
|
|
Total |
|
|
Regency's
|
|
|||||
|
2024 |
|
$ |
|
|
|
|
|
|
|
|
|
|
|
|
|
|
|
|
|
|
|
2025 |
|
|
|
|
|
|
|
|
|
|
|
|
|
|
|
|
|
|
|
|
|
2026 |
|
|
|
|
|
|
|
|
|
|
|
|
|
|
|
|
|
|
|
|
|
2027 |
|
|
|
|
|
|
|
|
|
|
|
|
|
|
|
|
|
|
|
|
|
2028 |
|
|
|
|
|
|
|
|
|
|
|
|
|
|
|
|
|
|
|
|
|
Beyond 5 Years |
|
|
|
|
|
|
|
|
|
|
|
|
|
|
|
|
|
|
|
|
|
Net unamortized loan costs, debt premium / (discount) |
|
|
|
|
|
|
(
|
) |
|
|
|
|
|
|
(
|
) |
|
|
(
|
) |
|
Total notes payable |
|
$ |
|
|
|
|
|
|
|
|
|
|
|
|
|
|
|
|
|
|
These fixed and variable rate notes payable are all non-recourse to the partnerships, and mature through
98
REGENCY CENTERS CORPORATION AND REGENCY CENTERS, L.P.
Notes to Consolidated Financial Statements
December 31, 2023
As notes payable mature, they will be repaid from proceeds from new borrowings and/or partner capital contributions. Refinancing debt at maturity in the current interest rate environment could result in higher interest expense in future periods if rates remain elevated. The Company is obligated to contribute its Pro-rata share to fund maturities if the loans are not refinanced, and it has the capacity to do so from existing cash balances, availability on its line of credit, and operating cash flows. The Company believes that its partners are financially sound and have sufficient capital or access thereto to fund future capital requirements. In the event that a real estate partner was unable to fund its share of the capital requirements of the real estate partnership, the Company would have the right, but not the obligation, to loan the defaulting partner the amount of its capital call which would be secured by the partner's membership interest.
Management fee income
In addition to earning our Pro-rata share of net income or loss in each of these real estate partnerships, we receive fees as discussed in Note 1, as follows:
|
|
|
Year ended December 31, |
|
|
|||||||||
|
(in thousands) |
|
2023 |
|
|
2022 |
|
|
2021 |
|
|
|||
|
Asset management, property management, leasing, and investment and financing services |
|
$ |
|
|
|
|
|
|
|
|
|
|
(1) |
The following table represents the components of Other assets in the accompanying Consolidated Balance Sheets as of the periods set forth below:
|
(in thousands) |
|
December 31, 2023 |
|
|
December 31, 2022 |
|
||
|
Goodwill |
|
$ |
|
|
|
|
|
|
|
Investments |
|
|
|
|
|
|
|
|
|
Prepaid and other |
|
|
|
|
|
|
|
|
|
Derivative assets |
|
|
|
|
|
|
|
|
|
Furniture, fixtures, and equipment, net |
|
|
|
|
|
|
|
|
|
Deferred financing costs, net |
|
|
|
|
|
|
|
|
|
Total other assets |
|
$ |
|
|
|
|
|
|
The following table presents the goodwill balances and activity during the year to date periods ended:
|
|
|
December 31, 2023 |
|
|
December 31, 2022 |
|
||||||||||||||||||
|
(in thousands) |
|
Goodwill |
|
|
Accumulated
|
|
|
Total |
|
|
Goodwill |
|
|
Accumulated
|
|
|
Total |
|
||||||
|
Beginning of year balance |
|
$ |
|
|
|
|
(
|
) |
|
|
|
|
|
$ |
|
|
|
|
(
|
) |
|
|
|
|
|
Goodwill allocated to Properties held for sale |
|
|
(
|
) |
|
|
|
|
|
|
— |
|
|
|
— |
|
|
|
— |
|
|
|
— |
|
|
Goodwill associated with disposed reporting units: |
|
|
|
|
|
|
|
|
|
|
|
|
|
|
|
|
|
|
||||||
|
Goodwill allocated to Gain on sale of real estate |
|
|
— |
|
|
|
— |
|
|
|
— |
|
|
|
(
|
) |
|
|
— |
|
|
|
(
|
) |
|
End of year balance |
|
$ |
|
|
|
|
(
|
) |
|
|
|
|
|
$ |
|
|
|
|
(
|
) |
|
|
|
|
As the Company identifies properties ("reporting units") that no longer meet its investment criteria, it will evaluate the property for potential sale. A decision to sell a reporting unit results in the need to evaluate its goodwill for recoverability and may result in impairment. Additionally, other changes impacting a reporting unit may be considered a triggering event. If events occur that trigger an impairment evaluation at multiple reporting units, a goodwill impairment may be significant.
99
REGENCY CENTERS CORPORATION AND REGENCY CENTERS, L.P.
Notes to Consolidated Financial Statements
December 31, 2023
The Company had the following acquired lease intangibles as of the periods set forth below:
|
|
|
December 31, |
|
|||||
|
(in thousands) |
|
2023 |
|
|
2022 |
|
||
|
In-place leases |
|
$ |
|
|
|
|
|
|
|
Above-market leases |
|
|
|
|
|
|
|
|
|
Total intangible assets |
|
|
|
|
|
|
|
|
|
Accumulated amortization |
|
|
(
|
) |
|
|
(
|
) |
|
Acquired lease intangible assets, net |
|
$ |
|
|
|
|
|
|
|
Below-market leases |
|
|
|
|
|
|
|
|
|
Accumulated amortization |
|
|
(
|
) |
|
|
(
|
) |
|
Acquired lease intangible liabilities, net |
|
$ |
|
|
|
|
|
|
The following table provides a summary of amortization and net accretion amounts from acquired lease intangibles:
|
|
|
Year ended December 31, |
|
|
|
|||||||||
|
(in thousands) |
|
2023 |
|
|
2022 |
|
|
2021 |
|
|
Line item in Consolidated Statements of Operations |
|||
|
In-place lease amortization |
|
$ |
|
|
|
|
|
|
|
|
|
|
|
Depreciation and amortization |
|
Above-market lease amortization |
|
|
|
|
|
|
|
|
|
|
|
|
|
Lease income |
|
Acquired lease intangible asset amortization |
|
$ |
|
|
|
|
|
|
|
|
|
|
|
|
|
|
|
|
|
|
|
|
|
|
|
|
|
|||
|
Below-market lease amortization |
|
$ |
|
|
|
|
|
|
|
|
|
|
|
Lease income |
The estimated aggregate amortization and net accretion amounts from acquired lease intangibles for the next five years are as follows:
|
(in thousands) |
|
|
|
|
|
|
||
|
In Process Year Ending
|
|
Amortization of
|
|
|
Net accretion of Above
|
|
||
|
2024 |
|
$ |
|
|
|
|
|
|
|
2025 |
|
|
|
|
|
|
|
|
|
2026 |
|
|
|
|
|
|
|
|
|
2027 |
|
|
|
|
|
|
|
|
|
2028 |
|
|
|
|
|
|
|
|
Lessor Accounting
Substantially all of the Company's leases are classified as operating leases. The Company's Lease income is comprised of both fixed and variable income. Fixed and in-substance fixed lease income includes stated amounts per lease contracts, which are primarily related to base rent, and in some cases stated amounts for CAM, real estate taxes, and insurance ("Recoverable Costs"). Income for these amounts is recognized on a straight-line basis.
Variable lease income includes the following two main items in the lease contracts:
100
REGENCY CENTERS CORPORATION AND REGENCY CENTERS, L.P.
Notes to Consolidated Financial Statements
December 31, 2023
The following table provides a disaggregation of lease income recognized as either fixed or variable lease income based on the criteria specified in Topic 842:
|
(in thousands) |
|
December 31, 2023 |
|
|
December 31, 2022 |
|
|
December 31, 2021 |
|
|||
|
Operating lease income |
|
|
|
|
|
|
|
|
|
|||
|
Fixed and in-substance fixed lease income |
|
$ |
|
|
|
|
|
|
|
|
|
|
|
Variable lease income |
|
|
|
|
|
|
|
|
|
|
|
|
|
Other lease related income, net: |
|
|
|
|
|
|
|
|
|
|||
|
Above/below market rent and tenant rent inducement amortization, net |
|
|
|
|
|
|
|
|
|
|
|
|
|
Uncollectible straight-line rent |
|
|
|
|
|
|
|
|
|
|
|
|
|
Uncollectible amounts billable in lease income |
|
|
(
|
) |
|
|
|
|
|
|
|
|
|
Total lease income |
|
$ |
|
|
|
|
|
|
|
|
|
|
Future minimum rents under non-cancelable operating leases, excluding variable lease payments, are as follows:
|
(in thousands) |
|
|
|
|
|
For the year ended December 31, |
|
December 31, 2023 |
|
|
|
2024 |
|
$ |
|
|
|
2025 |
|
|
|
|
|
2026 |
|
|
|
|
|
2027 |
|
|
|
|
|
2028 |
|
|
|
|
|
Thereafter |
|
|
|
|
|
Total |
|
$ |
|
|
At December 31, 2023, the Company had one lease classified as a sales-type lease, with lease income recorded over the lease term in the form of variable interest income representing the constant periodic rate of return on the Company’s net investment in the lease, and fixed contractual obligations.
Lessee Accounting
The Company has shopping centers that are subject to non-cancelable, long-term ground leases where a third party owns the underlying land and has leased the land to the Company to construct and/or operate a shopping center.
The Company has
In addition, the Company has non-cancelable operating leases pertaining to office space from which it conducts its business. Office leases expire through the year
The ground and office lease expenses are recognized on a straight-line basis over the term of the leases, including management's estimate of expected optional renewal periods, with ground lease expense presented within Property operating expense, and office lease expense presented within General and administrative in the accompanying Consolidated Statements of Operations.
101
REGENCY CENTERS CORPORATION AND REGENCY CENTERS, L.P.
Notes to Consolidated Financial Statements
December 31, 2023
Operating lease expense under the Company's ground and office leases were as follows, including straight-line rent expense and variable lease expenses such as CPI increases, percentage rent and reimbursements of landlord costs:
|
(in thousands) |
|
December 31, 2023 |
|
|
December 31, 2022 |
|
|
December 31, 2021 |
|
|||
|
Fixed operating lease expense |
|
|
|
|
|
|
|
|
|
|||
|
Ground leases |
|
$ |
|
|
|
|
|
|
|
|
|
|
|
Office leases |
|
|
|
|
|
|
|
|
|
|
|
|
|
Total fixed operating lease expense |
|
|
|
|
|
|
|
|
|
|
|
|
|
Variable lease expense |
|
|
|
|
|
|
|
|
|
|||
|
Ground leases |
|
|
|
|
|
|
|
|
|
|
|
|
|
Office leases |
|
|
|
|
|
|
|
|
|
|
|
|
|
Total variable lease expense |
|
|
|
|
|
|
|
|
|
|
|
|
|
Total lease expense |
|
$ |
|
|
|
|
|
|
|
|
|
|
|
Cash paid for amounts included in the measurement of operating lease liabilities |
|
|
|
|
|
|
|
|
|
|||
|
Operating cash flows for operating leases |
|
$ |
|
|
|
|
|
|
|
|
|
|
The following table summarizes the undiscounted future cash flows by year attributable to the operating lease liabilities for ground and office leases as of December 31, 2023, and provides a reconciliation to the Lease liability included in the accompanying Consolidated Balance Sheets:
|
(in thousands) |
|
Lease Liabilities |
|
|||||||||
|
For the year ended December 31, |
|
Ground Leases |
|
|
Office Leases |
|
|
Total |
|
|||
|
2024 |
|
$ |
|
|
|
|
|
|
|
|
|
|
|
2025 |
|
|
|
|
|
|
|
|
|
|
|
|
|
2026 |
|
|
|
|
|
|
|
|
|
|
|
|
|
2027 |
|
|
|
|
|
|
|
|
|
|
|
|
|
2028 |
|
|
|
|
|
|
|
|
|
|
|
|
|
Thereafter |
|
|
|
|
|
|
|
|
|
|
|
|
|
Total undiscounted lease liabilities |
|
$ |
|
|
|
|
|
|
|
|
|
|
|
Present value discount |
|
|
(
|
) |
|
|
(
|
) |
|
|
(
|
) |
|
Lease liabilities |
|
$ |
|
|
|
|
|
|
|
|
|
|
|
Weighted average discount rate |
|
|
|
% |
|
|
|
% |
|
|
|
|
|
Weighted average remaining term (in years) |
|
|
|
|
|
|
|
|
|
|
|
|
8. Income Taxes
The Company has elected to be taxed as a REIT under the applicable provisions of the Internal Revenue Code with certain of its subsidiaries treated as taxable REIT subsidiary entities, which are subject to federal and state income taxes.
|
|
|
Year ended December 31, |
|
|
|||||||||
|
|
|
2023 |
|
|
2022 |
|
|
2021 |
|
|
|||
|
Dividend per share |
|
$ |
|
|
(1) |
|
|
|
(2) |
|
|
|
(3) |
|
Ordinary income |
|
|
|
% |
|
|
|
% |
|
|
|
% |
|
|
Capital gain (4) |
|
|
|
% |
|
|
|
% |
|
|
|
% |
|
|
Additional tax status information: |
|
|
|
|
|
|
|
|
|
|
|||
|
Qualified dividend income |
|
|
|
% |
|
|
|
% |
|
|
|
% |
|
|
Section 199A dividend |
|
|
|
% |
|
|
|
% |
|
|
|
% |
|
|
Section 897 ordinary dividends |
|
|
|
% |
|
|
|
% |
|
|
|
% |
|
|
Section 897 capital gains |
|
|
|
% |
|
|
|
% |
|
|
|
% |
|
102
REGENCY CENTERS CORPORATION AND REGENCY CENTERS, L.P.
Notes to Consolidated Financial Statements
December 31, 2023
The following table summarizes the tax status of dividends paid on our Series A preferred stock:
|
|
|
Year ended December 31, |
|
|
|
|
|
2023 |
|
|
|
Dividend per share |
|
$ |
|
|
|
Ordinary income |
|
|
|
% |
|
Capital gain |
|
|
|
% |
|
Additional tax status information: |
|
|
|
|
|
Qualified dividend income |
|
|
|
% |
|
Section 199A dividend |
|
|
|
% |
|
Section 897 ordinary dividends |
|
|
|
% |
|
Section 897 capital gains |
|
|
|
% |
The following table summarizes the tax status of dividends paid on our Series B preferred stock:
|
|
|
Year ended December 31, |
|
|
|
|
|
2023 |
|
|
|
Dividend per share |
|
$ |
|
|
|
Ordinary income |
|
|
|
% |
|
Capital gain |
|
|
|
% |
|
Additional tax status information: |
|
|
|
|
|
Qualified dividend income |
|
|
|
% |
|
Section 199A dividend |
|
|
|
% |
|
Section 897 ordinary dividends |
|
|
|
% |
|
Section 897 capital gains |
|
|
|
% |
Our consolidated expense (benefit) for income taxes for the years ended December 31, 2023, 2022, and 2021 was as follows:
|
|
|
Year ended December 31, |
|
|||||||||
|
(in thousands) |
|
2023 |
|
|
2022 |
|
|
2021 |
|
|||
|
Income tax expense (benefit): |
|
|
|
|
|
|
|
|
|
|||
|
Current |
|
$ |
|
|
|
|
(
|
) |
|
|
|
|
|
Deferred |
|
|
|
|
|
|
|
|
|
|
|
|
|
Total income tax expense (benefit) (1) |
|
$ |
|
|
|
|
(
|
) |
|
|
|
|
The TRS entities are subject to federal and state income taxes and file separate tax returns. Income tax expense (benefit) differed from the amounts computed by applying the U.S. Federal income tax rate to pretax income of the TRS entities, as follows:
|
|
|
Year ended December 31, |
|
|||||||||
|
(in thousands) |
|
2023 |
|
|
2022 |
|
|
2021 |
|
|||
|
Computed expected tax expense (benefit) |
|
$ |
|
|
|
|
|
|
|
|
|
|
|
State income tax, net of federal benefit |
|
|
|
|
|
|
|
|
|
|
|
|
|
Valuation allowance |
|
|
|
|
|
|
(
|
) |
|
|
|
|
|
Permanent items |
|
|
|
|
|
|
|
|
|
|
|
|
|
All other items |
|
|
|
|
|
|
(
|
) |
|
|
|
|
|
Total income tax expense (1) |
|
|
|
|
|
|
(
|
) |
|
|
|
|
|
Income tax expense attributable to operations (1) |
|
$ |
|
|
|
|
(
|
) |
|
|
|
|
103
REGENCY CENTERS CORPORATION AND REGENCY CENTERS, L.P.
Notes to Consolidated Financial Statements
December 31, 2023
The tax effects of temporary differences (included in Accounts payable and other liabilities in the accompanying Consolidated Balance Sheets) are summarized as follows:
|
|
|
December 31, |
|
|||||
|
(in thousands) |
|
2023 |
|
|
2022 |
|
||
|
Deferred tax assets |
|
|
|
|
|
|
||
|
Other |
|
|
|
|
|
|
|
|
|
Deferred tax assets |
|
|
|
|
|
|
|
|
|
Valuation allowance |
|
|
(
|
) |
|
|
(
|
) |
|
Deferred tax assets, net |
|
$ |
|
|
|
|
|
|
|
Deferred tax liabilities |
|
|
|
|
|
|
||
|
Fixed assets |
|
|
(
|
) |
|
|
(
|
) |
|
Other |
|
|
(
|
) |
|
|
(
|
) |
|
Deferred tax liabilities |
|
|
(
|
) |
|
|
(
|
) |
|
Net deferred tax liabilities |
|
$ |
(
|
) |
|
|
(
|
) |
The Company's outstanding debt, net of unamortized debt premium (discount) and debt issuance costs, consisted of the following as of the dates set forth below:
|
|
|
Maturing
|
|
Weighted
|
|
Weighted
|
|
December 31, |
|
|||||
|
(in thousands) |
|
|
|
|
|
|
|
2023 |
|
|
2022 |
|
||
|
Notes payable: |
|
|
|
|
|
|
|
|
|
|
|
|
||
|
Fixed rate mortgage loans |
|
|
|
|
|
|
|
$ |
|
|
|
|
|
|
|
Variable rate mortgage loans (1) |
|
|
|
|
|
|
|
|
|
|
|
|
|
|
|
Fixed rate unsecured debt |
|
|
|
|
|
|
|
|
|
|
|
|
|
|
|
Total notes payable |
|
|
|
|
|
|
|
|
|
|
|
|
|
|
|
Unsecured credit facilities: |
|
|
|
|
|
|
|
|
|
|
|
|
||
|
$
|
|
|
|
|
|
|
|
|
|
|
|
|
— |
|
|
Total unsecured credit facilities |
|
|
|
|
|
|
|
|
|
|
|
|
— |
|
|
Total debt outstanding |
|
|
|
|
|
|
|
$ |
|
|
|
|
|
|
Notes Payable
Notes payable consist of mortgage loans secured by properties and unsecured public and private debt. Mortgage loans may be repaid before maturity, but could be subject to yield maintenance premiums, and are generally due in monthly installments of principal and interest or interest only. Unsecured public debt may be repaid before maturity subject to accrued and unpaid interest through the proposed redemption date and a make-whole premium. Interest on unsecured public and private debt is payable semi-annually.
The Company is required to comply with certain financial covenants for its unsecured public debt as defined in the indenture agreements such as the following ratios: Consolidated Debt to Consolidated Assets, Consolidated Secured Debt to Consolidated Assets, Consolidated Income for Debt Service to Consolidated Debt Service, and Unencumbered Consolidated Assets to Unsecured Consolidated Debt. As of December 31, 2023, management of the Company believes it is in compliance with all financial covenants for its unsecured public debt.
104
REGENCY CENTERS CORPORATION AND REGENCY CENTERS, L.P.
Notes to Consolidated Financial Statements
December 31, 2023
Unsecured Credit Facilities
The Company has an unsecured line of credit commitment (the "Line") with a syndicate of banks. At December 31, 2023
, the Line had a borrowing capacity of $
The Company is required to comply with certain financial covenants as defined in the Line credit agreement, such as Ratio of Indebtedness to Total Asset Value ("TAV"), Ratio of Unsecured Indebtedness to Unencumbered Asset Value, Ratio of Adjusted EBITDA to Fixed Charges, Ratio of Secured Indebtedness to TAV, Ratio of Unencumbered Net Operating Income to Unsecured Interest Expense, and other covenants customary with this type of unsecured financing. As of December 31, 2023, the Company is in compliance with all financial covenants for the Line.
On January 8, 2024, the Company priced a public offering of $
On January 18, 2024, the Company entered into a Sixth Amended and Restated Credit Agreement (the "Credit Agreement"), with the financial institutions party thereto, as Lenders, and Wells Fargo Bank, National Association, as Administrative Agent. The Credit Agreement provides for an unsecured revolving credit facility in the amount of $
Scheduled principal payments and maturities on notes payable and unsecured credit facilities were as follows:
|
(in thousands) |
|
December 31, 2023 |
|
|||||||||||||
|
Scheduled Principal Payments and Maturities by Year: |
|
Scheduled
|
|
|
Mortgage
|
|
|
Unsecured
|
|
|
Total |
|
||||
|
2024 |
|
$ |
|
|
|
|
|
|
|
|
|
|
|
|
|
|
|
2025 |
|
|
|
|
|
|
|
|
|
|
|
|
|
|
|
|
|
2026 |
|
|
|
|
|
|
|
|
|
|
|
|
|
|
|
|
|
2027 |
|
|
|
|
|
|
|
|
|
|
|
|
|
|
|
|
|
2028 |
|
|
|
|
|
|
|
|
|
|
|
|
|
|
|
|
|
Beyond 5 Years |
|
|
|
|
|
|
|
|
|
|
|
|
|
|
|
|
|
Unamortized debt premium/(discount) and issuance costs |
|
|
— |
|
|
|
(
|
) |
|
|
(
|
) |
|
|
(
|
) |
|
Total |
|
$ |
|
|
|
|
|
|
|
|
|
|
|
|
|
|
105
REGENCY CENTERS CORPORATION AND REGENCY CENTERS, L.P.
Notes to Consolidated Financial Statements
December 31, 2023
In connection with the acquisition of UBP on August 18, 2023, the Company completed the following debt transactions:
The Company was in compliance as of December 31, 2023, with all financial and other covenants under its unsecured public and private placement debt and unsecured credit facilities.
The Company may use derivative financial instruments, including interest rate swaps, caps, options, floors, and other interest rate derivative contracts, to hedge all or a portion of the interest rate risk associated with its borrowings. The principal objective of such arrangements is to minimize the risks and/or costs associated with the Company's operating and financial structure as well as to hedge specific anticipated transactions. The Company does not intend to utilize derivatives for speculative transactions or purposes other than mitigation of interest rate risk. The use of derivative financial instruments carries certain risks, including the risk that the counterparties to these contractual arrangements are not able to perform under the agreements. To mitigate this risk, the Company only enters into derivative financial instruments with counterparties with quality credit ratings. The Company does not anticipate that any of the counterparties will fail to meet their obligations.
The Company's objectives in using interest rate derivatives are to attempt to stabilize interest expense where possible and to manage its exposure to interest rate movements. To accomplish this objective, the Company primarily uses interest rate swaps as part of its interest rate risk management strategy. Interest rate swaps designated as cash flow hedges involve the receipt of variable-rate amounts from a counterparty in exchange for the Company making fixed-rate payments over the life of the agreements without exchange of the underlying notional amount.
The following table summarizes the terms and fair values of the Company's derivative financial instruments, as well as their classification on the Consolidated Balance Sheets:
|
|
|
|
|
|
|
|
|
|
|
|
Fair Value at December 31, |
|
||||||
|
(in thousands) |
|
|
|
|
|
|
|
|
Assets (Liabilities) (1) |
|
||||||||
|
Effective
|
|
Maturity
|
|
Notional
|
|
|
Bank Pays Variable
|
|
Regency Pays
|
|
2023 |
|
|
2022 |
|
|||
|
|
|
|
|
|
|
|
|
|
|
|
|
|
|
|
|
|
|
|
|
|
|
|
|
|
|
|
|
|
|
|
|
|
|
|
|
|
|
|
|
|
|
|
|
|
|
|
|
|
|
|
|
|
|
|
|
|
- |
|
|
|
|
|
|
|
|
|
|
|
|
|
|
|
|
|
|
|
- |
|
|
|
|
|
|
|
|
|
|
|
|
|
|
|
|
|
|
|
- |
|
|
|
|
|
|
|
|
|
|
|
|
|
|
|
|
|
|
|
- |
|
|
|
|
|
|
|
|
|
|
|
|
|
|
|
|
|
|
|
- |
|
|
|
|
|
|
|
|
|
|
|
|
|
|
|
|
|
|
|
- |
|
|
|
|
|
|
|
|
|
|
|
|
|
|
|
|
|
|
|
- |
|
|
|
|
|
|
|
|
|
|
|
|
|
|
|
|
|
|
|
- |
|
|
|
|
|
|
|
|
|
|
|
|
|
|
|
(
|
) |
|
|
|
|
|
|
|
|
|
|
|
|
|
|
|
|
|
|
|
|
|
|
|
|
|
|
|
|
|
|
|
|
|
|
|
|
|
|
(
|
) |
|
|
|
|
|
|
|
|
|
|
|
|
|
|
|
|
|
|
|
|
|
|
- |
|
|
|
|
|
|
|
|
|
|
|
|
|
|
|
(
|
) |
|
|
- |
|
|
Total derivative financial instruments |
|
|
|
|
|
|
$ |
|
|
|
|
|
|
|||||
106
REGENCY CENTERS CORPORATION AND REGENCY CENTERS, L.P.
Notes to Consolidated Financial Statements
December 31, 2023
These derivative financial instruments are all interest rate swaps, which are designated and qualify as cash flow hedges. The Company does not use derivatives for trading or speculative purposes and, as of December 31, 2023, does not have any derivatives that are not designated as hedges.
The changes in the fair value of derivatives designated and qualifying as cash flow hedges are recorded in Accumulated other comprehensive income ("AOCI") and subsequently reclassified into earnings in the period that the hedged forecasted transaction affects earnings.
The following table represents the effect of the derivative financial instruments on the accompanying Consolidated Financial Statements:
|
Location and Amount of Gain (Loss)
|
|
|
Location and Amount of Loss (Gain)
|
|
|
Total amounts presented in the Consolidated
|
|
|||||||||||||||||||||||||||||||||
|
|
|
Year ended December 31, |
|
|
|
|
Year ended December 31, |
|
|
|
|
Year ended December 31, |
|
|||||||||||||||||||||||||||
|
(in thousands) |
|
2023 |
|
|
2022 |
|
|
2021 |
|
|
|
|
2023 |
|
|
2022 |
|
|
2021 |
|
|
|
|
2023 |
|
|
2022 |
|
|
2021 |
|
|||||||||
|
Interest
|
|
$ |
(
|
) |
|
|
|
|
|
|
|
|
|
|
|
$ |
(
|
) |
|
|
|
|
|
|
|
|
|
Interest
|
|
$ |
|
|
|
|
|
|
|
|
|
|
|
|
|
|
|
|
|
|
|
|
|
|
|
|
|
|
|
|
|
|
|
|
|
Early extinguishment of debt |
|
$ |
(
|
) |
|
|
— |
|
|
|
— |
|
||||||
As of December 31, 2023, the Company expects approximately $
All financial instruments of the Company are reflected in the accompanying Consolidated Balance Sheets at amounts which, in management's estimation, reasonably approximate their fair values, except for the following:
|
|
|
December 31, |
|
|||||||||||||
|
|
|
2023 |
|
|
2022 |
|
||||||||||
|
(in thousands) |
|
Carrying
|
|
|
Fair Value |
|
|
Carrying
|
|
|
Fair Value |
|
||||
|
Financial assets: |
|
|
|
|
|
|
|
|
|
|
|
|
||||
|
Notes receivable |
|
$ |
|
|
|
|
|
|
|
$ |
— |
|
|
|
— |
|
|
Financial liabilities: |
|
|
|
|
|
|
|
|
|
|
|
|
||||
|
Notes payable, net |
|
$ |
|
|
|
|
|
|
|
$ |
|
|
|
|
|
|
|
Unsecured credit facilities |
|
$ |
|
|
|
|
|
|
|
$ |
— |
|
|
|
— |
|
The above fair values represent management's estimate of the amounts that would be received from selling those assets or that would be paid to transfer those liabilities in an orderly transaction between market participants as of December 31, 2023 and 2022, respectively. These fair value measurements maximize the use of observable inputs which are classified within Level 2 of the fair value hierarchy. However, in situations where there is little, if any, market activity for the asset or liability at the measurement date, the fair value measurement reflects the Company's own judgments about the assumptions that market participants would use in pricing the asset or liability.
The Company develops its judgments based on the best information available at the measurement date, including expected cash flows, appropriate risk-adjusted discount rates, and available observable and unobservable inputs. Service providers involved in fair value measurements are evaluated for competency and qualifications on an ongoing basis. As considerable judgment is often necessary to estimate the fair value of these financial instruments, the fair values presented above are not necessarily indicative of amounts that will be realized upon disposition of the financial instruments.
107
REGENCY CENTERS CORPORATION AND REGENCY CENTERS, L.P.
Notes to Consolidated Financial Statements
December 31, 2023
The following financial instruments are measured at fair value on a recurring basis:
Securities
The Company has investments in marketable securities that are included within Other assets on the accompanying Consolidated Balance Sheets. The fair value of the securities was determined using quoted prices in active markets, which are considered Level 1 inputs of the fair value hierarchy. Changes in the value of securities are recorded within Net investment (income) loss in the accompanying Consolidated Statements of Operations, and include unrealized gains of
$
Available-for-Sale Debt Securities
Available-for-sale debt securities consist of investments in certificates of deposit and corporate bonds, and are recorded at fair value using either recent trade prices for the identical debt instrument or comparable instruments by issuers of similar industry sector, issuer rating, and size, to estimate fair value, which are considered Level 2 inputs of the fair value hierarchy. Unrealized gains or losses on these debt securities are recognized through Other comprehensive income.
Interest Rate Derivatives
The fair value of the Company's interest rate derivatives is determined using widely accepted valuation techniques including discounted cash flow analysis on the expected cash flows of each derivative. This analysis reflects the contractual terms of the derivatives, including the period to maturity, and uses observable market-based inputs, including interest rate curves and implied volatilities. The Company incorporates credit valuation adjustments to appropriately reflect both its own nonperformance risk and the respective counterparty's nonperformance risk in the fair value measurements.
Although the Company has determined that the majority of the inputs used to value its derivatives fall within Level 2 of the fair value hierarchy, the credit valuation adjustments associated with its derivatives utilize Level 3 inputs, such as estimates of current credit spreads, to evaluate the likelihood of default by the Company and its counterparties. The Company has assessed the significance of the impact of the credit valuation adjustments on the overall valuation of its derivative positions and has determined that the credit valuation adjustments are not significant to the overall valuation of its interest rate swaps. As a result, the Company determined that its interest rate swaps valuation in its entirety is classified in Level 2 of the fair value hierarchy.
The following tables present the placement in the fair value hierarchy of assets and liabilities that are measured at fair value on a recurring basis:
|
|
|
Fair Value Measurements as of December 31, 2023 |
|
|||||||||||||
|
(in thousands) |
|
Balance |
|
|
Quoted Prices in Active Markets for Identical Assets
|
|
|
Significant Other Observable Inputs
|
|
|
Significant Unobservable Inputs
|
|
||||
|
Assets: |
|
|
|
|
|
|
|
|
|
|
|
|
||||
|
Securities |
|
$ |
|
|
|
|
|
|
|
|
— |
|
|
|
— |
|
|
Available-for-sale debt securities |
|
|
|
|
|
|
— |
|
|
|
|
|
|
|
— |
|
|
Interest rate derivatives |
|
|
|
|
|
|
— |
|
|
|
|
|
|
|
— |
|
|
Total |
|
$ |
|
|
|
|
|
|
|
|
|
|
|
|
— |
|
|
Liabilities: |
|
|
|
|
|
|
|
|
|
|
|
|
||||
|
Interest rate derivatives |
|
$ |
(
|
) |
|
|
— |
|
|
|
(
|
) |
|
|
— |
|
108
REGENCY CENTERS CORPORATION AND REGENCY CENTERS, L.P.
Notes to Consolidated Financial Statements
December 31, 2023
|
|
|
Fair Value Measurements as of December 31, 2022 |
|
|||||||||||||
|
(in thousands) |
|
Balance |
|
|
Quoted Prices in Active Markets for Identical Assets
|
|
|
Significant Other Observable Inputs
|
|
|
Significant Unobservable Inputs
|
|
||||
|
Assets: |
|
|
|
|
|
|
|
|
|
|
|
|
||||
|
Securities |
|
$ |
|
|
|
|
|
|
|
|
— |
|
|
|
— |
|
|
Available-for-sale debt securities |
|
|
|
|
|
|
— |
|
|
|
|
|
|
|
— |
|
|
Interest rate derivatives |
|
|
|
|
|
|
— |
|
|
|
|
|
|
|
— |
|
|
Total |
|
$ |
|
|
|
|
|
|
|
|
|
|
|
|
— |
|
During the year ended December 31, 2023 and December 31, 2022 , there were no real estate assets re-measured to estimated fair value on a nonrecurring basis.
UBP Acquisition
See Note 1 — Acquisition of Urstadt Biddle Properties Inc, for discussion regarding UBP acquisition.
Preferred Stock of the Parent Company
Terms and conditions of the preferred stock outstanding are summarized as follows:
|
|
Preferred Stock Outstanding as of December 31, 2023 |
||||||||||||
|
|
Date of Issuance |
|
Shares Issued and Outstanding |
|
|
Liquidation Preference |
|
|
Distribution Rate |
|
Callable By Company |
||
|
Series A |
|
|
|
|
|
|
$ |
|
|
|
|
|
On demand |
|
Series B |
|
|
|
|
|
|
|
|
|
|
|
|
On or after
|
|
|
|
|
|
|
|
|
$ |
|
|
|
|
|
|
Each series of Preferred Stock is non-voting, has no stated maturity and is redeemable for cash at $
Dividends Declared
On
109
REGENCY CENTERS CORPORATION AND REGENCY CENTERS, L.P.
Notes to Consolidated Financial Statements
December 31, 2023
Common Stock of the Parent Company
Dividends Declared
On
At the Market ("ATM") Program
Under the Parent Company's ATM program, as authorized by the Board, the Parent Company may sell up to $
Stock Repurchase Program
The Board has authorized a
During the year ended December 31, 2023
, the Company executed multiple trades to repurchase
Preferred Units of the Operating Partnership
The number of Series A Preferred Units and Series B Preferred Units, respectively, issued by RCLP is equal to the number of Series A Preferred Stock and Series B Preferred Stock, respectively, issued by the Company.
Common Units of the Operating Partnership
Common Units are issued, or redeemed and retired, for each share of Parent Company stock issued or redeemed, or retired, as described above. During the year ended December 31, 2023, the Operating Partnership issued
General Partners
The Parent Company, as general partner, owned the following Partnership Units outstanding:
|
|
|
December 31, |
|
|||||
|
(in thousands) |
|
2023 |
|
|
2022 |
|
||
|
Partnership units owned by the general partner |
|
|
|
|
|
|
|
|
|
Partnership units owned by the limited partners |
|
|
|
|
|
|
|
|
|
Total partnership units outstanding |
|
|
|
|
|
|
|
|
|
Percentage of partnership units owned by the general partner |
|
|
|
% |
|
|
|
% |
110
REGENCY CENTERS CORPORATION AND REGENCY CENTERS, L.P.
Notes to Consolidated Financial Statements
December 31, 2023
The Company recorded stock-based compensation in General and administrative expenses in the accompanying Consolidated Statements of Operations, the components of which are further described below:
|
|
|
Year ended December 31, |
|
|||||||||
|
(in thousands) |
|
2023 |
|
|
2022 |
|
|
2021 |
|
|||
|
Restricted stock (1) |
|
$ |
|
|
|
|
|
|
|
|
|
|
|
Directors' fees paid in common stock and other employee stock grants |
|
|
|
|
|
|
|
|
|
|
|
|
|
Capitalized stock-based compensation |
|
|
(
|
) |
|
|
(
|
) |
|
|
(
|
) |
|
Stock-based compensation, net of capitalization |
|
$ |
|
|
|
|
|
|
|
|
|
|
The Company established its Omnibus Incentive Plan (the "Plan") under which the Board of Directors may grant stock options and other stock-based awards to officers, directors, and other key employees. The Plan allows the Company to issue up
to
Restricted Stock Awards
The Company grants restricted stock under the Plan to its employees as a form of long-term compensation and retention. The terms of each restricted stock grant vary depending upon the participant's responsibilities and position within the Company. The Company's stock grants can be categorized as either time-based awards, performance-based awards, or market-based awards. All awards are valued at fair value, earn dividends throughout the vesting period, and have no voting rights. Fair value is measured using the grant date market price for all time-based or performance-based awards. Market based awards are valued using a Monte Carlo simulation to estimate the fair value based on the probability of satisfying the market conditions and the projected stock price at the time of payout, discounted to the valuation date over a three year performance period. Assumptions include historic volatility over the previous three year period, risk-free interest rates, and Regency's historic daily return as compared to the market index. Since the award payout includes dividend equivalents and the total shareholder return includes the value of dividends, no dividend yield assumption is required for the valuation. Compensation expense is measured at the grant date and recognized on a straight-line basis over the requisite vesting period for the entire award.
111
REGENCY CENTERS CORPORATION AND REGENCY CENTERS, L.P.
Notes to Consolidated Financial Statements
December 31, 2023
The following table summarizes non-vested restricted stock activity:
|
|
|
Year ended December 31, 2023 |
|
|||||||||
|
|
|
Number of Shares |
|
|
Intrinsic Value (in thousands) |
|
|
Weighted Average Grant Price |
|
|||
|
Non-vested as of December 31, 2022 |
|
|
|
|
|
|
|
|
|
|
||
|
Time-based awards granted (1) (4) |
|
|
|
|
|
|
|
|
$ |
|
|
|
|
Performance-based awards granted (2) (4) |
|
|
|
|
|
|
|
|
$ |
|
|
|
|
Market-based awards granted (3) (4) |
|
|
|
|
|
|
|
|
$ |
|
|
|
|
Change in market-based awards earned for performance (3) |
|
|
|
|
|
|
|
|
$ |
|
|
|
|
Vested (5) |
|
|
(
|
) |
|
|
|
|
$ |
|
|
|
|
Forfeited |
|
|
(
|
) |
|
|
|
|
$ |
|
|
|
|
Non-vested as of December 31, 2023 (6) |
|
|
|
|
|
$ |
|
|
|
|
|
|
|
|
|
Year ended December 31, |
|
|||||||||
|
|
|
2023 |
|
|
2022 |
|
|
2021 |
|
|||
|
Volatility |
|
|
|
% |
|
|
|
% |
|
|
|
% |
|
Risk free interest rate |
|
|
|
% |
|
|
|
% |
|
|
|
% |
|
|
|
Year ended December 31, |
|
|||||||||
|
|
|
2023 |
|
|
2022 |
|
|
2021 |
|
|||
|
Weighted-average grant price for restricted stock |
|
$ |
|
|
|
$ |
|
|
|
$ |
|
|
|
|
|
Year ended December 31, |
|
|||||||||
|
|
|
2023 |
|
|
2022 |
|
|
2021 |
|
|||
|
Intrinsic value of restricted stock vested |
|
$ |
|
|
|
$ |
|
|
|
$ |
|
|
112
REGENCY CENTERS CORPORATION AND REGENCY CENTERS, L.P.
Notes to Consolidated Financial Statements
December 31, 2023
401(k) Retirement Plan
The Company maintains a 401(k) retirement plan covering substantially all employees and permits participants to defer eligible compensation up to the maximum allowable amount determined by the IRS. This deferred compensation, together with Company matching contributions equal to
Non-Qualified Deferred Compensation Plan ("NQDCP")
The Company maintains a NQDCP which allows select employees and directors to defer part or all of their cash bonus, director fees, and vested restricted stock awards. All contributions into the participants' accounts are fully vested upon contribution to the NQDCP and are deposited in a Rabbi trust.
The following table reflects the balances of the assets and deferred compensation liabilities of the Rabbi trust and related participant account obligations in the accompanying Consolidated Balance Sheets, excluding Regency stock:
|
|
|
Year ended December 31, |
|
|
|
|||||
|
(in thousands) |
|
2023 |
|
|
2022 |
|
|
Location in Consolidated Balance Sheets |
||
|
Assets: |
|
|
|
|
|
|
|
|
||
|
Securities |
|
$ |
|
|
|
|
|
|
|
Other assets |
|
Liabilities: |
|
|
|
|
|
|
|
|
||
|
Deferred compensation obligation |
|
$ |
|
|
|
|
|
|
|
Accounts payable and other liabilities |
Realized and unrealized gains and losses on securities held in the NQDCP are recognized within Net investment (income) loss in the accompanying Consolidated Statements of Operations. Changes in participant obligations, which is based on changes in the value of their investment elections, is recognized within General and administrative expenses within the accompanying Consolidated Statements of Operations.
Investments in shares of the Company's common stock are included, at cost, as Treasury stock in the accompanying Consolidated Balance Sheets of the Parent Company and as a reduction of General partner capital in the accompanying Consolidated Balance Sheets of the Operating Partnership. The participant's deferred compensation liability attributable to the participants' investments in shares of the Company's common stock are included, at cost, within Additional paid in capital in the accompanying Consolidated Balance Sheets of the Parent Company and as a reduction of General partner capital in the accompanying Consolidated Balance Sheets of the Operating Partnership. Changes in participant account balances related to the Regency common stock fund are recorded directly within shareholders' equity.
Parent Company Earnings per Share
The following summarizes the calculation of basic and diluted earnings per share:
|
|
|
Year ended December 31, |
|
|||||||||
|
(in thousands, except per share data) |
|
2023 |
|
|
2022 |
|
|
2021 |
|
|||
|
Numerator: |
|
|
|
|
|
|
|
|
|
|||
|
Income attributable to common shareholders - basic |
|
$ |
|
|
|
|
|
|
|
|
|
|
|
Income attributable to common shareholders - diluted |
|
$ |
|
|
|
|
|
|
|
|
|
|
|
Denominator: |
|
|
|
|
|
|
|
|
|
|||
|
Weighted average common shares outstanding for basic EPS |
|
|
|
|
|
|
|
|
|
|
|
|
|
Weighted average common shares outstanding for diluted EPS (1) (2) |
|
|
|
|
|
|
|
|
|
|
|
|
|
Income per common share – basic |
|
$ |
|
|
|
|
|
|
|
|
|
|
|
Income per common share – diluted |
|
$ |
|
|
|
|
|
|
|
|
|
|
113
REGENCY CENTERS CORPORATION AND REGENCY CENTERS, L.P.
Notes to Consolidated Financial Statements
December 31, 2023
The effect of the assumed conversion of certain convertible units had an anti-dilutive effect upon the calculation of income to the common shareholders per share. Accordingly, the impact of such conversions has not been included in the determination of diluted income per share calculations.
Operating Partnership Earnings per Unit
The following summarizes the calculation of basic and diluted earnings per unit ("EPU"):
|
|
|
Year ended December 31, |
|
|||||||||
|
(in thousands, except per share data) |
|
2023 |
|
|
2022 |
|
|
2021 |
|
|||
|
Numerator: |
|
|
|
|
|
|
|
|
|
|||
|
Income attributable to common unit holders - basic |
|
$ |
|
|
|
|
|
|
|
|
|
|
|
Income attributable to common unit holders - diluted |
|
$ |
|
|
|
|
|
|
|
|
|
|
|
Denominator: |
|
|
|
|
|
|
|
|
|
|||
|
Weighted average common units outstanding for basic EPU |
|
|
|
|
|
|
|
|
|
|
|
|
|
Weighted average common units outstanding for diluted EPU (1) (2) |
|
|
|
|
|
|
|
|
|
|
|
|
|
Income per common unit – basic |
|
$ |
|
|
|
|
|
|
|
|
|
|
|
Income per common unit – diluted |
|
$ |
|
|
|
|
|
|
|
|
|
|
The effect of the assumed conversion of certain convertible units had an anti-dilutive effect upon the calculation of income to the common unit holders per share. Accordingly, the impact of such conversions has not been included in the determination of diluted income per unit calculations.
Litigation
The Company is a party to litigation, and is subject to other disputes, in each case that arise in the ordinary course of business. While the outcome of any particular lawsuit or dispute cannot be predicted with certainty, in the opinion of management, the Company's currently pending litigation and disputes are not expected to have a material adverse effect on the Company's consolidated financial position, results of operations, or liquidity. Legal fees are expensed as incurred.
Environmental
The Company is subject to numerous environmental laws and regulations. With respect to applicability to the Company, these pertain primarily to chemicals historically used by certain current and former dry cleaning tenants, the existence of asbestos in older shopping centers, older underground petroleum storage tanks and other historic land uses. The Company believes that the ultimate disposition of currently known environmental matters will not have a material effect on its financial position, liquidity, or operations. The Company can give no assurance that existing environmental studies with respect to its shopping centers have revealed all potential environmental contaminants; that its estimate of liabilities will not change as more information becomes available; that any previous owner, occupant or tenant did not create any material environmental condition not known to the Company; that the current environmental condition of the shopping centers will not be affected by tenants and occupants, by the condition of nearby properties, or by unrelated third parties; and that changes in applicable environmental laws and regulations or their interpretation will not result in additional environmental liability to the Company.
Letters of Credit
The Company has the right to issue letters of credit under the Line up to an aggregate amount not to exceed $
114
REGENCY CENTERS CORPORATION AND REGENCY CENTERS, L.P.
Schedule III - Consolidated Real Estate and Accumulated Depreciation
December 31, 2023
(in thousands)
|
|
|
Initial Cost |
|
|
|
|
|
Total Cost |
|
|
|
|
|
Net Cost |
|
|
|
|
||||||||||||||||||
|
Shopping Centers (1) |
|
Land & Land
|
|
|
Building &
|
|
|
Cost
|
|
|
Land & Land
|
|
|
Building &
|
|
|
Total |
|
|
Accumulated
|
|
|
Net of
|
|
|
Mortgages or
|
|
|||||||||
|
101 7th Avenue |
|
$ |
|
|
|
|
|
|
|
|
(
|
) |
|
|
|
|
|
|
|
|
|
|
|
|
|
|
(
|
) |
|
|
|
|
|
|
— |
|
|
111 Kraft Avenue |
|
|
|
|
|
|
|
|
|
|
— |
|
|
|
|
|
|
|
|
|
|
|
|
|
|
|
(
|
) |
|
|
|
|
|
|
— |
|
|
1175 Third Avenue |
|
|
|
|
|
|
|
|
|
|
|
|
|
|
|
|
|
|
|
|
|
|
|
|
|
|
(
|
) |
|
|
|
|
|
|
— |
|
|
1225-1239 Second Ave |
|
|
|
|
|
|
|
|
|
|
(
|
) |
|
|
|
|
|
|
|
|
|
|
|
|
|
|
(
|
) |
|
|
|
|
|
|
— |
|
|
200 Potrero |
|
|
|
|
|
|
|
|
|
|
|
|
|
|
|
|
|
|
|
|
|
|
|
|
|
|
(
|
) |
|
|
|
|
|
|
— |
|
|
22 Crescent Road |
|
|
|
|
|
|
|
|
|
|
(
|
) |
|
|
|
|
|
|
— |
|
|
|
|
|
|
|
— |
|
|
|
|
|
|
|
— |
|
|
25 Valley Drive |
|
|
|
|
|
|
|
|
|
|
|
|
|
|
|
|
|
|
|
|
|
|
|
|
|
|
(
|
) |
|
|
|
|
|
|
— |
|
|
260-270 Sawmill Road |
|
|
|
|
|
|
|
|
|
|
|
|
|
|
|
|
|
|
|
|
|
|
|
|
|
|
(
|
) |
|
|
|
|
|
|
— |
|
|
27 Purchase Street |
|
|
|
|
|
|
|
|
|
|
|
|
|
|
|
|
|
|
|
|
|
|
|
|
|
|
(
|
) |
|
|
|
|
|
|
— |
|
|
321-323 Railroad Ave |
|
|
|
|
|
|
|
|
|
|
|
|
|
|
|
|
|
|
|
|
|
|
|
|
|
|
(
|
) |
|
|
|
|
|
|
— |
|
|
410 South Broadway |
|
|
|
|
|
|
|
|
|
|
|
|
|
|
|
|
|
|
|
|
|
|
|
|
|
|
(
|
) |
|
|
|
|
|
|
— |
|
|
470 Main Street |
|
|
|
|
|
|
|
|
|
|
(
|
) |
|
|
|
|
|
|
|
|
|
|
|
|
|
|
(
|
) |
|
|
|
|
|
|
— |
|
|
48 Purchase Street |
|
|
|
|
|
|
|
|
|
|
|
|
|
|
|
|
|
|
|
|
|
|
|
|
|
|
(
|
) |
|
|
|
|
|
|
— |
|
|
4S Commons Town Center |
|
|
|
|
|
|
|
|
|
|
|
|
|
|
|
|
|
|
|
|
|
|
|
|
|
|
(
|
) |
|
|
|
|
|
|
(
|
) |
|
530 Old Post Rd |
|
|
|
|
|
|
|
|
|
|
|
|
|
|
|
|
|
|
|
|
|
|
|
|
|
|
(
|
) |
|
|
|
|
|
|
— |
|
|
6401 Roosevelt |
|
|
|
|
|
|
|
|
|
|
|
|
|
|
|
|
|
|
|
|
|
|
|
|
|
|
(
|
) |
|
|
|
|
|
|
— |
|
|
7 Riversville |
|
|
|
|
|
|
|
|
|
|
|
|
|
|
|
|
|
|
|
|
|
|
|
|
|
|
(
|
) |
|
|
|
|
|
|
— |
|
|
90 - 30 Metropolitan Avenue |
|
|
|
|
|
|
|
|
|
|
|
|
|
|
|
|
|
|
|
|
|
|
|
|
|
|
(
|
) |
|
|
|
|
|
|
— |
|
|
91 Danbury Road |
|
|
|
|
|
|
|
|
|
|
|
|
|
|
|
|
|
|
|
|
|
|
|
|
|
|
(
|
) |
|
|
|
|
|
|
— |
|
|
970 High Ridge Center |
|
|
|
|
|
|
|
|
|
|
(
|
) |
|
|
|
|
|
|
|
|
|
|
|
|
|
|
(
|
) |
|
|
|
|
|
|
— |
|
|
Airport Plaza |
|
|
|
|
|
|
|
|
|
|
|
|
|
|
|
|
|
|
|
|
|
|
|
|
|
|
(
|
) |
|
|
|
|
|
|
— |
|
|
Alafaya Village |
|
|
|
|
|
|
|
|
|
|
|
|
|
|
|
|
|
|
|
|
|
|
|
|
|
|
(
|
) |
|
|
|
|
|
|
— |
|
|
Alden Bridge |
|
|
|
|
|
|
|
|
|
|
|
|
|
|
|
|
|
|
|
|
|
|
|
|
|
|
(
|
) |
|
|
|
|
|
|
(
|
) |
|
Aldi Square |
|
|
|
|
|
|
|
|
|
|
|
|
|
|
|
|
|
|
|
|
|
|
|
|
|
|
(
|
) |
|
|
|
|
|
|
— |
|
|
Amerige Heights Town Center |
|
|
|
|
|
|
|
|
|
|
|
|
|
|
|
|
|
|
|
|
|
|
|
|
|
|
(
|
) |
|
|
|
|
|
|
— |
|
|
Anastasia Plaza |
|
|
|
|
|
|
|
|
|
|
|
|
|
|
|
|
|
|
|
|
|
|
|
|
|
|
(
|
) |
|
|
|
|
|
|
— |
|
|
Apple Valley Square |
|
|
|
|
|
|
|
|
|
|
(
|
) |
|
|
|
|
|
|
|
|
|
|
|
|
|
|
(
|
) |
|
|
|
|
|
|
— |
|
|
Arcadian Shopping Center |
|
|
|
|
|
|
|
|
|
|
|
|
|
|
|
|
|
|
|
|
|
|
|
|
|
|
(
|
) |
|
|
|
|
|
|
(
|
) |
|
Ashford Place |
|
|
|
|
|
|
|
|
|
|
|
|
|
|
|
|
|
|
|
|
|
|
|
|
|
|
(
|
) |
|
|
|
|
|
|
— |
|
|
Atlantic Village |
|
|
|
|
|
|
|
|
|
|
|
|
|
|
|
|
|
|
|
|
|
|
|
|
|
|
(
|
) |
|
|
|
|
|
|
— |
|
|
Avenida Biscayne (fka Aventura Square) |
|
|
|
|
|
|
|
|
|
|
|
|
|
|
|
|
|
|
|
|
|
|
|
|
|
|
(
|
) |
|
|
|
|
|
|
— |
|
|
Aventura Shopping Center |
|
|
|
|
|
|
|
|
|
|
|
|
|
|
|
|
|
|
|
|
|
|
|
|
|
|
(
|
) |
|
|
|
|
|
|
— |
|
|
Baederwood Shopping Center |
|
|
|
|
|
|
|
|
|
|
|
|
|
|
|
|
|
|
|
|
|
|
|
|
|
|
(
|
) |
|
|
|
|
|
|
(
|
) |
|
Balboa Mesa Shopping Center |
|
|
|
|
|
|
|
|
|
|
|
|
|
|
|
|
|
|
|
|
|
|
|
|
|
|
(
|
) |
|
|
|
|
|
|
— |
|
|
Banco Popular Building |
|
|
|
|
|
|
|
|
|
|
(
|
) |
|
|
|
|
|
|
— |
|
|
|
|
|
|
|
— |
|
|
|
|
|
|
|
— |
|
|
Belleview Square |
|
|
|
|
|
|
|
|
|
|
|
|
|
|
|
|
|
|
|
|
|
|
|
|
|
|
(
|
) |
|
|
|
|
|
|
— |
|
|
Belmont Chase |
|
|
|
|
|
|
|
|
|
|
(
|
) |
|
|
|
|
|
|
|
|
|
|
|
|
|
|
(
|
) |
|
|
|
|
|
|
— |
|
|
Berkshire Commons |
|
|
|
|
|
|
|
|
|
|
|
|
|
|
|
|
|
|
|
|
|
|
|
|
|
|
(
|
) |
|
|
|
|
|
|
— |
|
|
Bethany Park Place |
|
|
|
|
|
|
|
|
|
|
|
|
|
|
|
|
|
|
|
|
|
|
|
|
|
|
(
|
) |
|
|
|
|
|
|
(
|
) |
|
Bethel Hub Center |
|
|
|
|
|
|
|
|
|
|
|
|
|
|
|
|
|
|
|
|
|
|
|
|
|
|
(
|
) |
|
|
|
|
|
|
— |
|
115
REGENCY CENTERS CORPORATION AND REGENCY CENTERS, L.P.
Schedule III - Consolidated Real Estate and Accumulated Depreciation
December 31, 2023
(in thousands)
|
|
|
Initial Cost |
|
|
|
|
|
Total Cost |
|
|
|
|
|
Net Cost |
|
|
|
|
||||||||||||||||||
|
Shopping Centers (1) |
|
Land & Land
|
|
|
Building &
|
|
|
Cost
|
|
|
Land & Land
|
|
|
Building &
|
|
|
Total |
|
|
Accumulated
|
|
|
Net of
|
|
|
Mortgages or
|
|
|||||||||
|
Biltmore Shopping Center |
|
|
|
|
|
|
|
|
|
|
|
|
|
|
|
|
|
|
|
|
|
|
|
|
|
|
(
|
) |
|
|
|
|
|
|
— |
|
|
Bird 107 Plaza |
|
|
|
|
|
|
|
|
|
|
|
|
|
|
|
|
|
|
|
|
|
|
|
|
|
|
(
|
) |
|
|
|
|
|
|
— |
|
|
Bird Ludlam |
|
|
|
|
|
|
|
|
|
|
|
|
|
|
|
|
|
|
|
|
|
|
|
|
|
|
(
|
) |
|
|
|
|
|
|
— |
|
|
Black Rock |
|
|
|
|
|
|
|
|
|
|
|
|
|
|
|
|
|
|
|
|
|
|
|
|
|
|
(
|
) |
|
|
|
|
|
|
(
|
) |
|
Blakeney Town Center |
|
|
|
|
|
|
|
|
|
|
|
|
|
|
|
|
|
|
|
|
|
|
|
|
|
|
(
|
) |
|
|
|
|
|
|
— |
|
|
Bloomfield Crossing |
|
|
|
|
|
|
|
|
|
|
— |
|
|
|
|
|
|
|
|
|
|
|
|
|
|
|
(
|
) |
|
|
|
|
|
|
— |
|
|
Bloomingdale Square |
|
|
|
|
|
|
|
|
|
|
|
|
|
|
|
|
|
|
|
|
|
|
|
|
|
|
(
|
) |
|
|
|
|
|
|
— |
|
|
Blossom Valley |
|
|
|
|
|
|
|
|
|
|
|
|
|
|
|
|
|
|
|
|
|
|
|
|
|
|
(
|
) |
|
|
|
|
|
|
(
|
) |
|
Boca Village Square |
|
|
|
|
|
|
|
|
|
|
|
|
|
|
|
|
|
|
|
|
|
|
|
|
|
|
(
|
) |
|
|
|
|
|
|
— |
|
|
Boonton ACME Shopping Center |
|
|
|
|
|
|
|
|
|
|
— |
|
|
|
|
|
|
|
|
|
|
|
|
|
|
|
(
|
) |
|
|
|
|
|
|
(
|
) |
|
Boulevard Center |
|
|
|
|
|
|
|
|
|
|
|
|
|
|
|
|
|
|
|
|
|
|
|
|
|
|
(
|
) |
|
|
|
|
|
|
— |
|
|
Boynton Lakes Plaza |
|
|
|
|
|
|
|
|
|
|
|
|
|
|
|
|
|
|
|
|
|
|
|
|
|
|
(
|
) |
|
|
|
|
|
|
— |
|
|
Boynton Plaza |
|
|
|
|
|
|
|
|
|
|
|
|
|
|
|
|
|
|
|
|
|
|
|
|
|
|
(
|
) |
|
|
|
|
|
|
— |
|
|
Brentwood Plaza |
|
|
|
|
|
|
|
|
|
|
|
|
|
|
|
|
|
|
|
|
|
|
|
|
|
|
(
|
) |
|
|
|
|
|
|
— |
|
|
Briarcliff La Vista |
|
|
|
|
|
|
|
|
|
|
|
|
|
|
|
|
|
|
|
|
|
|
|
|
|
|
(
|
) |
|
|
|
|
|
|
— |
|
|
Briarcliff Village |
|
|
|
|
|
|
|
|
|
|
|
|
|
|
|
|
|
|
|
|
|
|
|
|
|
|
(
|
) |
|
|
|
|
|
|
— |
|
|
Brick Walk |
|
|
|
|
|
|
|
|
|
|
|
|
|
|
|
|
|
|
|
|
|
|
|
|
|
|
(
|
) |
|
|
|
|
|
|
(
|
) |
|
BridgeMill Market |
|
|
|
|
|
|
|
|
|
|
|
|
|
|
|
|
|
|
|
|
|
|
|
|
|
|
(
|
) |
|
|
|
|
|
|
— |
|
|
Bridgeton |
|
|
|
|
|
|
|
|
|
|
|
|
|
|
|
|
|
|
|
|
|
|
|
|
|
|
(
|
) |
|
|
|
|
|
|
— |
|
|
Brighten Park |
|
|
|
|
|
|
|
|
|
|
|
|
|
|
|
|
|
|
|
|
|
|
|
|
|
|
(
|
) |
|
|
|
|
|
|
— |
|
|
Broadway Plaza |
|
|
|
|
|
|
|
|
|
|
|
|
|
|
|
|
|
|
|
|
|
|
|
|
|
|
(
|
) |
|
|
|
|
|
|
— |
|
|
Brooklyn Station on Riverside |
|
|
|
|
|
|
|
|
|
|
|
|
|
|
|
|
|
|
|
|
|
|
|
|
|
|
(
|
) |
|
|
|
|
|
|
— |
|
|
Brookside Plaza |
|
|
|
|
|
|
|
|
|
|
|
|
|
|
|
|
|
|
|
|
|
|
|
|
|
|
(
|
) |
|
|
|
|
|
|
— |
|
|
Buckhead Court |
|
|
|
|
|
|
|
|
|
|
|
|
|
|
|
|
|
|
|
|
|
|
|
|
|
|
(
|
) |
|
|
|
|
|
|
— |
|
|
Buckhead Landing |
|
|
|
|
|
|
|
|
|
|
(
|
) |
|
|
|
|
|
|
|
|
|
|
|
|
|
|
(
|
) |
|
|
|
|
|
|
— |
|
|
Buckhead Station |
|
|
|
|
|
|
|
|
|
|
|
|
|
|
|
|
|
|
|
|
|
|
|
|
|
|
(
|
) |
|
|
|
|
|
|
— |
|
|
Buckley Square |
|
|
|
|
|
|
|
|
|
|
|
|
|
|
|
|
|
|
|
|
|
|
|
|
|
|
(
|
) |
|
|
|
|
|
|
— |
|
|
Caligo Crossing |
|
|
|
|
|
|
|
|
|
|
|
|
|
|
|
|
|
|
|
|
|
|
|
|
|
|
(
|
) |
|
|
|
|
|
|
— |
|
|
Cambridge Square |
|
|
|
|
|
|
|
|
|
|
|
|
|
|
|
|
|
|
|
|
|
|
|
|
|
|
(
|
) |
|
|
|
|
|
|
— |
|
|
Carmel Commons |
|
|
|
|
|
|
|
|
|
|
|
|
|
|
|
|
|
|
|
|
|
|
|
|
|
|
(
|
) |
|
|
|
|
|
|
— |
|
|
Carmel ShopRite Plaza |
|
|
|
|
|
|
|
|
|
|
— |
|
|
|
|
|
|
|
|
|
|
|
|
|
|
|
(
|
) |
|
|
|
|
|
|
— |
|
|
Carriage Gate |
|
|
|
|
|
|
|
|
|
|
|
|
|
|
|
|
|
|
|
|
|
|
|
|
|
|
(
|
) |
|
|
|
|
|
|
— |
|
|
Carytown Exchange |
|
|
|
|
|
|
|
|
|
|
(
|
) |
|
|
|
|
|
|
|
|
|
|
|
|
|
|
(
|
) |
|
|
|
|
|
|
— |
|
|
Cashmere Corners |
|
|
|
|
|
|
|
|
|
|
|
|
|
|
|
|
|
|
|
|
|
|
|
|
|
|
(
|
) |
|
|
|
|
|
|
— |
|
|
Cedar Commons |
|
|
|
|
|
|
|
|
|
|
|
|
|
|
|
|
|
|
|
|
|
|
|
|
|
|
(
|
) |
|
|
|
|
|
|
— |
|
|
Cedar Hill Shopping Center |
|
|
|
|
|
|
|
|
|
|
|
|
|
|
|
|
|
|
|
|
|
|
|
|
|
|
(
|
) |
|
|
|
|
|
|
(
|
) |
|
Centerplace of Greeley III |
|
|
|
|
|
|
|
|
|
|
|
|
|
|
|
|
|
|
|
|
|
|
|
|
|
|
(
|
) |
|
|
|
|
|
|
— |
|
|
Charlotte Square |
|
|
|
|
|
|
|
|
|
|
|
|
|
|
|
|
|
|
|
|
|
|
|
|
|
|
(
|
) |
|
|
|
|
|
|
— |
|
|
Chasewood Plaza |
|
|
|
|
|
|
|
|
|
|
|
|
|
|
|
|
|
|
|
|
|
|
|
|
|
|
(
|
) |
|
|
|
|
|
|
— |
|
|
Chastain Square |
|
|
|
|
|
|
|
|
|
|
|
|
|
|
|
|
|
|
|
|
|
|
|
|
|
|
(
|
) |
|
|
|
|
|
|
— |
|
|
Cherry Grove |
|
|
|
|
|
|
|
|
|
|
|
|
|
|
|
|
|
|
|
|
|
|
|
|
|
|
(
|
) |
|
|
|
|
|
|
— |
|
116
REGENCY CENTERS CORPORATION AND REGENCY CENTERS, L.P.
Schedule III - Consolidated Real Estate and Accumulated Depreciation
December 31, 2023
(in thousands)
|
|
|
Initial Cost |
|
|
|
|
|
Total Cost |
|
|
|
|
|
Net Cost |
|
|
|
|
||||||||||||||||||
|
Shopping Centers (1) |
|
Land & Land
|
|
|
Building &
|
|
|
Cost
|
|
|
Land & Land
|
|
|
Building &
|
|
|
Total |
|
|
Accumulated
|
|
|
Net of
|
|
|
Mortgages or
|
|
|||||||||
|
Chilmark Shopping Center |
|
|
|
|
|
|
|
|
|
|
— |
|
|
|
|
|
|
|
|
|
|
|
|
|
|
|
(
|
) |
|
|
|
|
|
|
— |
|
|
Chimney Rock |
|
|
|
|
|
|
|
|
|
|
|
|
|
|
|
|
|
|
|
|
|
|
|
|
|
|
(
|
) |
|
|
|
|
|
|
— |
|
|
Circle Center West |
|
|
|
|
|
|
|
|
|
|
|
|
|
|
|
|
|
|
|
|
|
|
|
|
|
|
(
|
) |
|
|
|
|
|
|
— |
|
|
Circle Marina Center |
|
|
|
|
|
|
|
|
|
|
|
|
|
|
|
|
|
|
|
|
|
|
|
|
|
|
(
|
) |
|
|
|
|
|
|
(
|
) |
|
CityLine Market |
|
|
|
|
|
|
|
|
|
|
|
|
|
|
|
|
|
|
|
|
|
|
|
|
|
|
(
|
) |
|
|
|
|
|
|
— |
|
|
CityLine Market Phase II |
|
|
|
|
|
|
|
|
|
|
|
|
|
|
|
|
|
|
|
|
|
|
|
|
|
|
(
|
) |
|
|
|
|
|
|
— |
|
|
Clayton Valley Shopping Center |
|
|
|
|
|
|
|
|
|
|
|
|
|
|
|
|
|
|
|
|
|
|
|
|
|
|
(
|
) |
|
|
|
|
|
|
— |
|
|
Clocktower Plaza Shopping Ctr |
|
|
|
|
|
|
|
|
|
|
|
|
|
|
|
|
|
|
|
|
|
|
|
|
|
|
(
|
) |
|
|
|
|
|
|
— |
|
|
Clybourn Commons |
|
|
|
|
|
|
|
|
|
|
|
|
|
|
|
|
|
|
|
|
|
|
|
|
|
|
(
|
) |
|
|
|
|
|
|
— |
|
|
Cochran's Crossing |
|
|
|
|
|
|
|
|
|
|
|
|
|
|
|
|
|
|
|
|
|
|
|
|
|
|
(
|
) |
|
|
|
|
|
|
— |
|
|
Compo Acres Shopping Center |
|
|
|
|
|
|
|
|
|
|
|
|
|
|
|
|
|
|
|
|
|
|
|
|
|
|
(
|
) |
|
|
|
|
|
|
— |
|
|
Concord Shopping Plaza |
|
|
|
|
|
|
|
|
|
|
|
|
|
|
|
|
|
|
|
|
|
|
|
|
|
|
(
|
) |
|
|
|
|
|
|
— |
|
|
Copps Hill Plaza |
|
|
|
|
|
|
|
|
|
|
|
|
|
|
|
|
|
|
|
|
|
|
|
|
|
|
(
|
) |
|
|
|
|
|
|
(
|
) |
|
Coral Reef Shopping Center |
|
|
|
|
|
|
|
|
|
|
|
|
|
|
|
|
|
|
|
|
|
|
|
|
|
|
(
|
) |
|
|
|
|
|
|
— |
|
|
Corkscrew Village |
|
|
|
|
|
|
|
|
|
|
|
|
|
|
|
|
|
|
|
|
|
|
|
|
|
|
(
|
) |
|
|
|
|
|
|
— |
|
|
Cornerstone Square |
|
|
|
|
|
|
|
|
|
|
|
|
|
|
|
|
|
|
|
|
|
|
|
|
|
|
(
|
) |
|
|
|
|
|
|
— |
|
|
Corral Hollow |
|
|
|
|
|
|
|
|
|
|
|
|
|
|
|
|
|
|
|
|
|
|
|
|
|
|
(
|
) |
|
|
|
|
|
|
— |
|
|
Corvallis Market Center |
|
|
|
|
|
|
|
|
|
|
|
|
|
|
|
|
|
|
|
|
|
|
|
|
|
|
(
|
) |
|
|
|
|
|
|
— |
|
|
Cos Cob Commons |
|
|
|
|
|
|
|
|
|
|
|
|
|
|
|
|
|
|
|
|
|
|
|
|
|
|
(
|
) |
|
|
|
|
|
|
(
|
) |
|
Cos Cob Plaza |
|
|
|
|
|
|
|
|
|
|
— |
|
|
|
|
|
|
|
|
|
|
|
|
|
|
|
(
|
) |
|
|
|
|
|
|
(
|
) |
|
Country Walk Plaza |
|
|
|
|
|
|
|
|
|
|
|
|
|
|
|
|
|
|
|
|
|
|
|
|
|
|
(
|
) |
|
|
|
|
|
|
(
|
) |
|
Countryside Shops |
|
|
|
|
|
|
|
|
|
|
|
|
|
|
|
|
|
|
|
|
|
|
|
|
|
|
(
|
) |
|
|
|
|
|
|
— |
|
|
Courtyard Shopping Center |
|
|
|
|
|
|
|
|
|
|
|
|
|
|
|
|
|
|
|
|
|
|
|
|
|
|
(
|
) |
|
|
|
|
|
|
— |
|
|
Culver Center |
|
|
|
|
|
|
|
|
|
|
|
|
|
|
|
|
|
|
|
|
|
|
|
|
|
|
(
|
) |
|
|
|
|
|
|
— |
|
|
Danbury Green |
|
|
|
|
|
|
|
|
|
|
|
|
|
|
|
|
|
|
|
|
|
|
|
|
|
|
(
|
) |
|
|
|
|
|
|
— |
|
|
Danbury Square |
|
|
|
|
|
|
|
|
|
|
|
|
|
|
|
|
|
|
|
|
|
|
|
|
|
|
(
|
) |
|
|
|
|
|
|
— |
|
|
Dardenne Crossing |
|
|
|
|
|
|
|
|
|
|
|
|
|
|
|
|
|
|
|
|
|
|
|
|
|
|
(
|
) |
|
|
|
|
|
|
— |
|
|
Darinor Plaza |
|
|
|
|
|
|
|
|
|
|
|
|
|
|
|
|
|
|
|
|
|
|
|
|
|
|
(
|
) |
|
|
|
|
|
|
— |
|
|
DeCicco's Plaza |
|
|
|
|
|
|
|
|
|
|
|
|
|
|
|
|
|
|
|
|
|
|
|
|
|
|
(
|
) |
|
|
|
|
|
|
— |
|
|
Diablo Plaza |
|
|
|
|
|
|
|
|
|
|
|
|
|
|
|
|
|
|
|
|
|
|
|
|
|
|
(
|
) |
|
|
|
|
|
|
— |
|
|
Dunwoody Hall |
|
|
|
|
|
|
|
|
|
|
|
|
|
|
|
|
|
|
|
|
|
|
|
|
|
|
(
|
) |
|
|
|
|
|
|
(
|
) |
|
Dunwoody Village |
|
|
|
|
|
|
|
|
|
|
|
|
|
|
|
|
|
|
|
|
|
|
|
|
|
|
(
|
) |
|
|
|
|
|
|
— |
|
|
East Meadow |
|
|
|
|
|
|
|
|
|
|
|
|
|
|
|
|
|
|
|
|
|
|
|
|
|
|
(
|
) |
|
|
|
|
|
|
— |
|
|
East Meadow Plaza |
|
|
|
|
|
|
|
|
|
|
(
|
) |
|
|
|
|
|
|
|
|
|
|
|
|
|
|
(
|
) |
|
|
|
|
|
|
— |
|
|
East Pointe |
|
|
|
|
|
|
|
|
|
|
|
|
|
|
|
|
|
|
|
|
|
|
|
|
|
|
(
|
) |
|
|
|
|
|
|
— |
|
|
East San Marco |
|
|
|
|
|
|
|
|
|
|
(
|
) |
|
|
|
|
|
|
|
|
|
|
|
|
|
|
(
|
) |
|
|
|
|
|
|
— |
|
|
Eastchester Plaza |
|
|
|
|
|
|
|
|
|
|
|
|
|
|
|
|
|
|
|
|
|
|
|
|
|
|
(
|
) |
|
|
|
|
|
|
— |
|
|
Eastport |
|
|
|
|
|
|
|
|
|
|
|
|
|
|
|
|
|
|
|
|
|
|
|
|
|
|
(
|
) |
|
|
|
|
|
|
— |
|
|
El Camino Shopping Center |
|
|
|
|
|
|
|
|
|
|
|
|
|
|
|
|
|
|
|
|
|
|
|
|
|
|
(
|
) |
|
|
|
|
|
|
— |
|
|
El Cerrito Plaza |
|
|
|
|
|
|
|
|
|
|
|
|
|
|
|
|
|
|
|
|
|
|
|
|
|
|
(
|
) |
|
|
|
|
|
|
— |
|
|
El Norte Pkwy Plaza |
|
|
|
|
|
|
|
|
|
|
|
|
|
|
|
|
|
|
|
|
|
|
|
|
|
|
(
|
) |
|
|
|
|
|
|
— |
|
|
Emerson Plaza |
|
|
|
|
|
|
|
|
|
|
|
|
|
|
|
|
|
|
|
|
|
|
|
|
|
|
(
|
) |
|
|
|
|
|
|
— |
|
117
REGENCY CENTERS CORPORATION AND REGENCY CENTERS, L.P.
Schedule III - Consolidated Real Estate and Accumulated Depreciation
December 31, 2023
(in thousands)
|
|
|
Initial Cost |
|
|
|
|
|
Total Cost |
|
|
|
|
|
Net Cost |
|
|
|
|
||||||||||||||||||
|
Shopping Centers (1) |
|
Land & Land
|
|
|
Building &
|
|
|
Cost
|
|
|
Land & Land
|
|
|
Building &
|
|
|
Total |
|
|
Accumulated
|
|
|
Net of
|
|
|
Mortgages or
|
|
|||||||||
|
Encina Grande |
|
|
|
|
|
|
|
|
|
|
|
|
|
|
|
|
|
|
|
|
|
|
|
|
|
|
(
|
) |
|
|
|
|
|
|
— |
|
|
Fairfield Center |
|
|
|
|
|
|
|
|
|
|
|
|
|
|
|
|
|
|
|
|
|
|
|
|
|
|
(
|
) |
|
|
|
|
|
|
— |
|
|
Fairfield Crossroads |
|
|
|
|
|
|
|
|
|
|
(
|
) |
|
|
|
|
|
|
|
|
|
|
|
|
|
|
(
|
) |
|
|
|
|
|
|
— |
|
|
Falcon Marketplace |
|
|
|
|
|
|
|
|
|
|
|
|
|
|
|
|
|
|
|
|
|
|
|
|
|
|
(
|
) |
|
|
|
|
|
|
— |
|
|
Fellsway Plaza |
|
|
|
|
|
|
|
|
|
|
|
|
|
|
|
|
|
|
|
|
|
|
|
|
|
|
(
|
) |
|
|
|
|
|
|
(
|
) |
|
Fenton Marketplace |
|
|
|
|
|
|
|
|
|
|
(
|
) |
|
|
|
|
|
|
|
|
|
|
|
|
|
|
(
|
) |
|
|
|
|
|
|
— |
|
|
Ferry Street Plaza |
|
|
|
|
|
|
|
|
|
|
|
|
|
|
|
|
|
|
|
|
|
|
|
|
|
|
(
|
) |
|
|
|
|
|
|
(
|
) |
|
Fleming Island |
|
|
|
|
|
|
|
|
|
|
|
|
|
|
|
|
|
|
|
|
|
|
|
|
|
|
(
|
) |
|
|
|
|
|
|
— |
|
|
Fountain Square |
|
|
|
|
|
|
|
|
|
|
|
|
|
|
|
|
|
|
|
|
|
|
|
|
|
|
(
|
) |
|
|
|
|
|
|
— |
|
|
French Valley Village Center |
|
|
|
|
|
|
|
|
|
|
|
|
|
|
|
|
|
|
|
|
|
|
|
|
|
|
(
|
) |
|
|
|
|
|
|
— |
|
|
Friars Mission Center |
|
|
|
|
|
|
|
|
|
|
|
|
|
|
|
|
|
|
|
|
|
|
|
|
|
|
(
|
) |
|
|
|
|
|
|
— |
|
|
Gardens Square |
|
|
|
|
|
|
|
|
|
|
|
|
|
|
|
|
|
|
|
|
|
|
|
|
|
|
(
|
) |
|
|
|
|
|
|
— |
|
|
Gateway Shopping Center |
|
|
|
|
|
|
|
|
|
|
|
|
|
|
|
|
|
|
|
|
|
|
|
|
|
|
(
|
) |
|
|
|
|
|
|
— |
|
|
Gelson's Westlake Market Plaza |
|
|
|
|
|
|
|
|
|
|
|
|
|
|
|
|
|
|
|
|
|
|
|
|
|
|
(
|
) |
|
|
|
|
|
|
— |
|
|
Glen Oak Plaza |
|
|
|
|
|
|
|
|
|
|
|
|
|
|
|
|
|
|
|
|
|
|
|
|
|
|
(
|
) |
|
|
|
|
|
|
— |
|
|
Glenwood Village |
|
|
|
|
|
|
|
|
|
|
|
|
|
|
|
|
|
|
|
|
|
|
|
|
|
|
(
|
) |
|
|
|
|
|
|
— |
|
|
Golden Hills Plaza |
|
|
|
|
|
|
|
|
|
|
|
|
|
|
|
|
|
|
|
|
|
|
|
|
|
|
(
|
) |
|
|
|
|
|
|
— |
|
|
Goodwives Shopping Center |
|
|
|
|
|
|
|
|
|
|
|
|
|
|
|
|
|
|
|
|
|
|
|
|
|
|
(
|
) |
|
|
|
|
|
|
(
|
) |
|
Grand Ridge Plaza |
|
|
|
|
|
|
|
|
|
|
|
|
|
|
|
|
|
|
|
|
|
|
|
|
|
|
(
|
) |
|
|
|
|
|
|
— |
|
|
Greens Farms Plaza |
|
|
|
|
|
|
|
|
|
|
(
|
) |
|
|
|
|
|
|
|
|
|
|
|
|
|
|
(
|
) |
|
|
|
|
|
|
— |
|
|
Greenwich Commons |
|
|
|
|
|
|
|
|
|
|
|
|
|
|
|
|
|
|
|
|
|
|
|
|
|
|
(
|
) |
|
|
|
|
|
|
(
|
) |
|
Greenwood Shopping Centre |
|
|
|
|
|
|
|
|
|
|
|
|
|
|
|
|
|
|
|
|
|
|
|
|
|
|
(
|
) |
|
|
|
|
|
|
— |
|
|
H Mart Plaza |
|
|
|
|
|
|
|
|
|
|
— |
|
|
|
|
|
|
|
|
|
|
|
|
|
|
|
(
|
) |
|
|
|
|
|
|
— |
|
|
Hammocks Town Center |
|
|
|
|
|
|
|
|
|
|
|
|
|
|
|
|
|
|
|
|
|
|
|
|
|
|
(
|
) |
|
|
|
|
|
|
— |
|
|
Hancock |
|
|
|
|
|
|
|
|
|
|
(
|
) |
|
|
|
|
|
|
|
|
|
|
|
|
|
|
(
|
) |
|
|
|
|
|
|
— |
|
|
Harpeth Village Fieldstone |
|
|
|
|
|
|
|
|
|
|
|
|
|
|
|
|
|
|
|
|
|
|
|
|
|
|
(
|
) |
|
|
|
|
|
|
— |
|
|
Harrison Shopping Square |
|
|
|
|
|
|
|
|
|
|
— |
|
|
|
|
|
|
|
|
|
|
|
|
|
|
|
(
|
) |
|
|
|
|
|
|
— |
|
|
Hasley Canyon Village |
|
|
|
|
|
|
|
|
|
|
|
|
|
|
|
|
|
|
|
|
|
|
|
|
|
|
(
|
) |
|
|
|
|
|
|
(
|
) |
|
Heritage 202 Center |
|
|
|
|
|
|
|
|
|
|
(
|
) |
|
|
|
|
|
|
|
|
|
|
|
|
|
|
(
|
) |
|
|
|
|
|
|
— |
|
|
Heritage Plaza |
|
|
|
|
|
|
|
|
|
|
|
|
|
|
|
|
|
|
|
|
|
|
|
|
|
|
(
|
) |
|
|
|
|
|
|
— |
|
|
Hershey |
|
|
|
|
|
|
|
|
|
|
|
|
|
|
|
|
|
|
|
|
|
|
|
|
|
|
(
|
) |
|
|
|
|
|
|
— |
|
|
Hewlett Crossing I & II |
|
|
|
|
|
|
|
|
|
|
|
|
|
|
|
|
|
|
|
|
|
|
|
|
|
|
(
|
) |
|
|
|
|
|
|
— |
|
|
Hibernia Pavilion |
|
|
|
|
|
|
|
|
|
|
|
|
|
|
|
|
|
|
|
|
|
|
|
|
|
|
(
|
) |
|
|
|
|
|
|
— |
|
|
High Ridge Center |
|
|
|
|
|
|
|
|
|
|
|
|
|
|
|
|
|
|
|
|
|
|
|
|
|
|
(
|
) |
|
|
|
|
|
|
(
|
) |
|
Hillcrest Village |
|
|
|
|
|
|
|
|
|
|
|
|
|
|
|
|
|
|
|
|
|
|
|
|
|
|
(
|
) |
|
|
|
|
|
|
— |
|
|
Hilltop Village |
|
|
|
|
|
|
|
|
|
|
|
|
|
|
|
|
|
|
|
|
|
|
|
|
|
|
(
|
) |
|
|
|
|
|
|
— |
|
|
Hinsdale Lake Commons |
|
|
|
|
|
|
|
|
|
|
|
|
|
|
|
|
|
|
|
|
|
|
|
|
|
|
(
|
) |
|
|
|
|
|
|
— |
|
|
Holly Park |
|
|
|
|
|
|
|
|
|
|
|
|
|
|
|
|
|
|
|
|
|
|
|
|
|
|
(
|
) |
|
|
|
|
|
|
— |
|
|
Howell Mill Village |
|
|
|
|
|
|
|
|
|
|
|
|
|
|
|
|
|
|
|
|
|
|
|
|
|
|
(
|
) |
|
|
|
|
|
|
— |
|
|
Hyde Park |
|
|
|
|
|
|
|
|
|
|
|
|
|
|
|
|
|
|
|
|
|
|
|
|
|
|
(
|
) |
|
|
|
|
|
|
— |
|
118
REGENCY CENTERS CORPORATION AND REGENCY CENTERS, L.P.
Schedule III - Consolidated Real Estate and Accumulated Depreciation
December 31, 2023
(in thousands)
|
|
|
Initial Cost |
|
|
|
|
|
Total Cost |
|
|
|
|
|
Net Cost |
|
|
|
|
||||||||||||||||||
|
Shopping Centers (1) |
|
Land & Land
|
|
|
Building &
|
|
|
Cost
|
|
|
Land & Land
|
|
|
Building &
|
|
|
Total |
|
|
Accumulated
|
|
|
Net of
|
|
|
Mortgages or
|
|
|||||||||
|
Indian Springs Center |
|
|
|
|
|
|
|
|
|
|
|
|
|
|
|
|
|
|
|
|
|
|
|
|
|
|
(
|
) |
|
|
|
|
|
|
— |
|
|
Indigo Square |
|
|
|
|
|
|
|
|
|
|
(
|
) |
|
|
|
|
|
|
|
|
|
|
|
|
|
|
(
|
) |
|
|
|
|
|
|
— |
|
|
Inglewood Plaza |
|
|
|
|
|
|
|
|
|
|
|
|
|
|
|
|
|
|
|
|
|
|
|
|
|
|
(
|
) |
|
|
|
|
|
|
— |
|
|
Island Village |
|
|
|
|
|
|
|
|
|
|
|
|
|
|
|
|
|
|
|
|
|
|
|
|
|
|
(
|
) |
|
|
|
|
|
|
— |
|
|
Keller Town Center |
|
|
|
|
|
|
|
|
|
|
|
|
|
|
|
|
|
|
|
|
|
|
|
|
|
|
(
|
) |
|
|
|
|
|
|
— |
|
|
Kirkman Shoppes |
|
|
|
|
|
|
|
|
|
|
|
|
|
|
|
|
|
|
|
|
|
|
|
|
|
|
(
|
) |
|
|
|
|
|
|
— |
|
|
Kirkwood Commons |
|
|
|
|
|
|
|
|
|
|
|
|
|
|
|
|
|
|
|
|
|
|
|
|
|
|
(
|
) |
|
|
|
|
|
|
— |
|
|
Klahanie Shopping Center |
|
|
|
|
|
|
|
|
|
|
|
|
|
|
|
|
|
|
|
|
|
|
|
|
|
|
(
|
) |
|
|
|
|
|
|
— |
|
|
Knotts Landing |
|
|
|
|
|
|
|
|
|
|
— |
|
|
|
|
|
|
|
|
|
|
|
|
|
|
|
(
|
) |
|
|
|
|
|
|
— |
|
|
Kroger New Albany Center |
|
|
|
|
|
|
|
|
|
|
|
|
|
|
|
|
|
|
|
|
|
|
|
|
|
|
(
|
) |
|
|
|
|
|
|
— |
|
|
Lake Mary Centre |
|
|
|
|
|
|
|
|
|
|
|
|
|
|
|
|
|
|
|
|
|
|
|
|
|
|
(
|
) |
|
|
|
|
|
|
— |
|
|
Lake Pine Plaza |
|
|
|
|
|
|
|
|
|
|
|
|
|
|
|
|
|
|
|
|
|
|
|
|
|
|
(
|
) |
|
|
|
|
|
|
— |
|
|
Lakeview Shopping Center |
|
|
|
|
|
|
|
|
|
|
|
|
|
|
|
|
|
|
|
|
|
|
|
|
|
|
(
|
) |
|
|
|
|
|
|
(
|
) |
|
Lebanon/Legacy Center |
|
|
|
|
|
|
|
|
|
|
|
|
|
|
|
|
|
|
|
|
|
|
|
|
|
|
(
|
) |
|
|
|
|
|
|
— |
|
|
Littleton Square |
|
|
|
|
|
|
|
|
|
|
(
|
) |
|
|
|
|
|
|
|
|
|
|
|
|
|
|
(
|
) |
|
|
|
|
|
|
— |
|
|
Lloyd King Center |
|
|
|
|
|
|
|
|
|
|
|
|
|
|
|
|
|
|
|
|
|
|
|
|
|
|
(
|
) |
|
|
|
|
|
|
— |
|
|
Lower Nazareth Commons |
|
|
|
|
|
|
|
|
|
|
|
|
|
|
|
|
|
|
|
|
|
|
|
|
|
|
(
|
) |
|
|
|
|
|
|
— |
|
|
Main & Bailey |
|
|
|
|
|
|
|
|
|
|
— |
|
|
|
|
|
|
|
|
|
|
|
|
|
|
|
(
|
) |
|
|
|
|
|
|
— |
|
|
Mandarin Landing |
|
|
|
|
|
|
|
|
|
|
|
|
|
|
|
|
|
|
|
|
|
|
|
|
|
|
(
|
) |
|
|
|
|
|
|
— |
|
|
Marine's Taste of Italy |
|
|
|
|
|
|
|
|
|
|
— |
|
|
|
|
|
|
|
|
|
|
|
|
|
|
|
(
|
) |
|
|
|
|
|
|
— |
|
|
Market at Colonnade Center |
|
|
|
|
|
|
|
|
|
|
|
|
|
|
|
|
|
|
|
|
|
|
|
|
|
|
(
|
) |
|
|
|
|
|
|
— |
|
|
Market at Preston Forest |
|
|
|
|
|
|
|
|
|
|
|
|
|
|
|
|
|
|
|
|
|
|
|
|
|
|
(
|
) |
|
|
|
|
|
|
— |
|
|
Market at Round Rock |
|
|
|
|
|
|
|
|
|
|
|
|
|
|
|
|
|
|
|
|
|
|
|
|
|
|
(
|
) |
|
|
|
|
|
|
— |
|
|
Market at Springwoods Village |
|
|
|
|
|
|
|
|
|
|
|
|
|
|
|
|
|
|
|
|
|
|
|
|
|
|
(
|
) |
|
|
|
|
|
|
(
|
) |
|
Marketplace at Briargate |
|
|
|
|
|
|
|
|
|
|
|
|
|
|
|
|
|
|
|
|
|
|
|
|
|
|
(
|
) |
|
|
|
|
|
|
— |
|
|
McLean Plaza |
|
|
|
|
|
|
|
|
|
|
|
|
|
|
|
|
|
|
|
|
|
|
|
|
|
|
(
|
) |
|
|
|
|
|
|
(
|
) |
|
Meadtown Shopping Center |
|
|
|
|
|
|
|
|
|
|
|
|
|
|
|
|
|
|
|
|
|
|
|
|
|
|
(
|
) |
|
|
|
|
|
|
(
|
) |
|
Mellody Farm |
|
|
|
|
|
|
|
|
|
|
(
|
) |
|
|
|
|
|
|
|
|
|
|
|
|
|
|
(
|
) |
|
|
|
|
|
|
— |
|
|
Melrose Market |
|
|
|
|
|
|
|
|
|
|
(
|
) |
|
|
|
|
|
|
|
|
|
|
|
|
|
|
(
|
) |
|
|
|
|
|
|
— |
|
|
Midland Park Shopping Center |
|
|
|
|
|
|
|
|
|
|
|
|
|
|
|
|
|
|
|
|
|
|
|
|
|
|
(
|
) |
|
|
|
|
|
|
(
|
) |
|
Millhopper Shopping Center |
|
|
|
|
|
|
|
|
|
|
|
|
|
|
|
|
|
|
|
|
|
|
|
|
|
|
(
|
) |
|
|
|
|
|
|
— |
|
|
Mockingbird Commons |
|
|
|
|
|
|
|
|
|
|
|
|
|
|
|
|
|
|
|
|
|
|
|
|
|
|
(
|
) |
|
|
|
|
|
|
— |
|
|
Monument Jackson Creek |
|
|
|
|
|
|
|
|
|
|
|
|
|
|
|
|
|
|
|
|
|
|
|
|
|
|
(
|
) |
|
|
|
|
|
|
— |
|
|
Morningside Plaza |
|
|
|
|
|
|
|
|
|
|
|
|
|
|
|
|
|
|
|
|
|
|
|
|
|
|
(
|
) |
|
|
|
|
|
|
— |
|
|
Murrayhill Marketplace |
|
|
|
|
|
|
|
|
|
|
|
|
|
|
|
|
|
|
|
|
|
|
|
|
|
|
(
|
) |
|
|
|
|
|
|
— |
|
|
Naples Walk |
|
|
|
|
|
|
|
|
|
|
|
|
|
|
|
|
|
|
|
|
|
|
|
|
|
|
(
|
) |
|
|
|
|
|
|
— |
|
|
New City PCSB Bank Pad |
|
|
|
|
|
|
|
|
|
|
(
|
) |
|
|
|
|
|
|
|
|
|
|
|
|
|
|
(
|
) |
|
|
|
|
|
|
— |
|
|
New Milford Plaza |
|
|
|
|
|
|
|
|
|
|
|
|
|
|
|
|
|
|
|
|
|
|
|
|
|
|
(
|
) |
|
|
|
|
|
|
— |
|
|
Newberry Square |
|
|
|
|
|
|
|
|
|
|
|
|
|
|
|
|
|
|
|
|
|
|
|
|
|
|
(
|
) |
|
|
|
|
|
|
— |
|
|
Newfield Green |
|
|
|
|
|
|
|
|
|
|
|
|
|
|
|
|
|
|
|
|
|
|
|
|
|
|
(
|
) |
|
|
|
|
|
|
(
|
) |
|
Newland Center |
|
|
|
|
|
|
|
|
|
|
|
|
|
|
|
|
|
|
|
|
|
|
|
|
|
|
(
|
) |
|
|
|
|
|
|
— |
|
119
REGENCY CENTERS CORPORATION AND REGENCY CENTERS, L.P.
Schedule III - Consolidated Real Estate and Accumulated Depreciation
December 31, 2023
(in thousands)
|
|
|
Initial Cost |
|
|
|
|
|
Total Cost |
|
|
|
|
|
Net Cost |
|
|
|
|
||||||||||||||||||
|
Shopping Centers (1) |
|
Land & Land
|
|
|
Building &
|
|
|
Cost
|
|
|
Land & Land
|
|
|
Building &
|
|
|
Total |
|
|
Accumulated
|
|
|
Net of
|
|
|
Mortgages or
|
|
|||||||||
|
Nocatee Town Center |
|
|
|
|
|
|
|
|
|
|
|
|
|
|
|
|
|
|
|
|
|
|
|
|
|
|
(
|
) |
|
|
|
|
|
|
— |
|
|
Nohl Plaza |
|
|
|
|
|
|
|
|
|
|
— |
|
|
|
|
|
|
|
|
|
|
|
|
|
|
|
(
|
) |
|
|
|
|
|
|
— |
|
|
North Hills |
|
|
|
|
|
|
|
|
|
|
|
|
|
|
|
|
|
|
|
|
|
|
|
|
|
|
(
|
) |
|
|
|
|
|
|
— |
|
|
Northgate Marketplace |
|
|
|
|
|
|
|
|
|
|
|
|
|
|
|
|
|
|
|
|
|
|
|
|
|
|
(
|
) |
|
|
|
|
|
|
— |
|
|
Northgate Marketplace Ph II |
|
|
|
|
|
|
|
|
|
|
|
|
|
|
|
|
|
|
|
|
|
|
|
|
|
|
(
|
) |
|
|
|
|
|
|
— |
|
|
Northgate Plaza (Maxtown Road) |
|
|
|
|
|
|
|
|
|
|
|
|
|
|
|
|
|
|
|
|
|
|
|
|
|
|
(
|
) |
|
|
|
|
|
|
— |
|
|
Northgate Square |
|
|
|
|
|
|
|
|
|
|
|
|
|
|
|
|
|
|
|
|
|
|
|
|
|
|
(
|
) |
|
|
|
|
|
|
— |
|
|
Northlake Village |
|
|
|
|
|
|
|
|
|
|
|
|
|
|
|
|
|
|
|
|
|
|
|
|
|
|
(
|
) |
|
|
|
|
|
|
— |
|
|
Oakbrook Plaza |
|
|
|
|
|
|
|
|
|
|
|
|
|
|
|
|
|
|
|
|
|
|
|
|
|
|
(
|
) |
|
|
|
|
|
|
— |
|
|
Oakleaf Commons |
|
|
|
|
|
|
|
|
|
|
|
|
|
|
|
|
|
|
|
|
|
|
|
|
|
|
(
|
) |
|
|
|
|
|
|
— |
|
|
Oakshade Town Center |
|
|
|
|
|
|
|
|
|
|
|
|
|
|
|
|
|
|
|
|
|
|
|
|
|
|
(
|
) |
|
|
|
|
|
|
(
|
) |
|
Ocala Corners |
|
|
|
|
|
|
|
|
|
|
|
|
|
|
|
|
|
|
|
|
|
|
|
|
|
|
(
|
) |
|
|
|
|
|
|
— |
|
|
Old Greenwich CVS |
|
|
|
|
|
|
|
|
|
|
— |
|
|
|
|
|
|
|
|
|
|
|
|
|
|
|
(
|
) |
|
|
|
|
|
|
(
|
) |
|
Old St Augustine Plaza |
|
|
|
|
|
|
|
|
|
|
|
|
|
|
|
|
|
|
|
|
|
|
|
|
|
|
(
|
) |
|
|
|
|
|
|
— |
|
|
Orange Meadows |
|
|
|
|
|
|
|
|
|
|
|
|
|
|
|
|
|
|
|
|
|
|
|
|
|
|
(
|
) |
|
|
|
|
|
|
— |
|
|
Orangetown Shopping Center |
|
|
|
|
|
|
|
|
|
|
|
|
|
|
|
|
|
|
|
|
|
|
|
|
|
|
(
|
) |
|
|
|
|
|
|
(
|
) |
|
Pablo Plaza |
|
|
|
|
|
|
|
|
|
|
|
|
|
|
|
|
|
|
|
|
|
|
|
|
|
|
(
|
) |
|
|
|
|
|
|
— |
|
|
Paces Ferry Plaza |
|
|
|
|
|
|
|
|
|
|
|
|
|
|
|
|
|
|
|
|
|
|
|
|
|
|
(
|
) |
|
|
|
|
|
|
— |
|
|
Panther Creek |
|
|
|
|
|
|
|
|
|
|
|
|
|
|
|
|
|
|
|
|
|
|
|
|
|
|
(
|
) |
|
|
|
|
|
|
— |
|
|
Pavillion |
|
|
|
|
|
|
|
|
|
|
|
|
|
|
|
|
|
|
|
|
|
|
|
|
|
|
(
|
) |
|
|
|
|
|
|
— |
|
|
Peartree Village |
|
|
|
|
|
|
|
|
|
|
|
|
|
|
|
|
|
|
|
|
|
|
|
|
|
|
(
|
) |
|
|
|
|
|
|
— |
|
|
Pelham Manor Plaza |
|
|
|
|
|
|
|
|
|
|
|
|
|
|
|
|
|
|
|
|
|
|
|
|
|
|
(
|
) |
|
|
|
|
|
|
— |
|
|
Persimmon Place |
|
|
|
|
|
|
|
|
|
|
|
|
|
|
|
|
|
|
|
|
|
|
|
|
|
|
(
|
) |
|
|
|
|
|
|
— |
|
|
Pike Creek |
|
|
|
|
|
|
|
|
|
|
|
|
|
|
|
|
|
|
|
|
|
|
|
|
|
|
(
|
) |
|
|
|
|
|
|
— |
|
|
Pine Island |
|
|
|
|
|
|
|
|
|
|
|
|
|
|
|
|
|
|
|
|
|
|
|
|
|
|
(
|
) |
|
|
|
|
|
|
— |
|
|
Pine Lake Village |
|
|
|
|
|
|
|
|
|
|
|
|
|
|
|
|
|
|
|
|
|
|
|
|
|
|
(
|
) |
|
|
|
|
|
|
— |
|
|
Pine Ridge Square |
|
|
|
|
|
|
|
|
|
|
|
|
|
|
|
|
|
|
|
|
|
|
|
|
|
|
(
|
) |
|
|
|
|
|
|
— |
|
|
Pine Tree Plaza |
|
|
|
|
|
|
|
|
|
|
|
|
|
|
|
|
|
|
|
|
|
|
|
|
|
|
(
|
) |
|
|
|
|
|
|
— |
|
|
Pinecrest Place |
|
|
|
|
|
|
|
|
|
|
(
|
) |
|
|
|
|
|
|
|
|
|
|
|
|
|
|
(
|
) |
|
|
|
|
|
|
— |
|
|
Plaza Escuela |
|
|
|
|
|
|
|
|
|
|
|
|
|
|
|
|
|
|
|
|
|
|
|
|
|
|
(
|
) |
|
|
|
|
|
|
— |
|
|
Plaza Hermosa |
|
|
|
|
|
|
|
|
|
|
|
|
|
|
|
|
|
|
|
|
|
|
|
|
|
|
(
|
) |
|
|
|
|
|
|
— |
|
|
Point 50 |
|
|
|
|
|
|
|
|
|
|
|
|
|
|
|
|
|
|
|
|
|
|
|
|
|
|
(
|
) |
|
|
|
|
|
|
— |
|
|
Point Royale Shopping Center |
|
|
|
|
|
|
|
|
|
|
|
|
|
|
|
|
|
|
|
|
|
|
|
|
|
|
(
|
) |
|
|
|
|
|
|
— |
|
|
Pompton Lakes Towne Square |
|
|
|
|
|
|
|
|
|
|
|
|
|
|
|
|
|
|
|
|
|
|
|
|
|
|
(
|
) |
|
|
|
|
|
|
— |
|
|
Post Road Plaza |
|
|
|
|
|
|
|
|
|
|
|
|
|
|
|
|
|
|
|
|
|
|
|
|
|
|
(
|
) |
|
|
|
|
|
|
— |
|
|
Potrero Center |
|
|
|
|
|
|
|
|
|
|
(
|
) |
|
|
|
|
|
|
|
|
|
|
|
|
|
|
(
|
) |
|
|
|
|
|
|
— |
|
|
Powell Street Plaza |
|
|
|
|
|
|
|
|
|
|
|
|
|
|
|
|
|
|
|
|
|
|
|
|
|
|
(
|
) |
|
|
|
|
|
|
— |
|
|
Powers Ferry Square |
|
|
|
|
|
|
|
|
|
|
|
|
|
|
|
|
|
|
|
|
|
|
|
|
|
|
(
|
) |
|
|
|
|
|
|
— |
|
|
Powers Ferry Village |
|
|
|
|
|
|
|
|
|
|
|
|
|
|
|
|
|
|
|
|
|
|
|
|
|
|
(
|
) |
|
|
|
|
|
|
— |
|
|
Prairie City Crossing |
|
|
|
|
|
|
|
|
|
|
|
|
|
|
|
|
|
|
|
|
|
|
|
|
|
|
(
|
) |
|
|
|
|
|
|
— |
|
|
Preston Oaks |
|
|
|
|
|
|
|
|
|
|
|
|
|
|
|
|
|
|
|
|
|
|
|
|
|
|
(
|
) |
|
|
|
|
|
|
— |
|
120
REGENCY CENTERS CORPORATION AND REGENCY CENTERS, L.P.
Schedule III - Consolidated Real Estate and Accumulated Depreciation
December 31, 2023
(in thousands)
|
|
|
Initial Cost |
|
|
|
|
|
Total Cost |
|
|
|
|
|
Net Cost |
|
|
|
|
||||||||||||||||||
|
Shopping Centers (1) |
|
Land & Land
|
|
|
Building &
|
|
|
Cost
|
|
|
Land & Land
|
|
|
Building &
|
|
|
Total |
|
|
Accumulated
|
|
|
Net of
|
|
|
Mortgages or
|
|
|||||||||
|
Prestonbrook |
|
|
|
|
|
|
|
|
|
|
(
|
) |
|
|
|
|
|
|
|
|
|
|
|
|
|
|
(
|
) |
|
|
|
|
|
|
— |
|
|
Prosperity Centre |
|
|
|
|
|
|
|
|
|
|
|
|
|
|
|
|
|
|
|
|
|
|
|
|
|
|
(
|
) |
|
|
|
|
|
|
— |
|
|
Purchase Street Shops |
|
|
|
|
|
|
|
|
|
|
|
|
|
|
|
|
|
|
|
|
|
|
|
|
|
|
(
|
) |
|
|
|
|
|
|
— |
|
|
Ralphs Circle Center |
|
|
|
|
|
|
|
|
|
|
|
|
|
|
|
|
|
|
|
|
|
|
|
|
|
|
(
|
) |
|
|
|
|
|
|
— |
|
|
Red Bank Village |
|
|
|
|
|
|
|
|
|
|
|
|
|
|
|
|
|
|
|
|
|
|
|
|
|
|
(
|
) |
|
|
|
|
|
|
— |
|
|
Regency Commons |
|
|
|
|
|
|
|
|
|
|
|
|
|
|
|
|
|
|
|
|
|
|
|
|
|
|
(
|
) |
|
|
|
|
|
|
— |
|
|
Regency Square |
|
|
|
|
|
|
|
|
|
|
|
|
|
|
|
|
|
|
|
|
|
|
|
|
|
|
(
|
) |
|
|
|
|
|
|
— |
|
|
Ridgeway Shopping Center |
|
|
|
|
|
|
|
|
|
|
|
|
|
|
|
|
|
|
|
|
|
|
|
|
|
|
(
|
) |
|
|
|
|
|
|
(
|
) |
|
Rite Aid Plaza-Waldwick Plaza |
|
|
|
|
|
|
|
|
|
|
|
|
|
|
|
|
|
|
|
|
|
|
|
|
|
|
(
|
) |
|
|
|
|
|
|
— |
|
|
Rivertowns Square |
|
|
|
|
|
|
|
|
|
|
|
|
|
|
|
|
|
|
|
|
|
|
|
|
|
|
(
|
) |
|
|
|
|
|
|
— |
|
|
Rona Plaza |
|
|
|
|
|
|
|
|
|
|
|
|
|
|
|
|
|
|
|
|
|
|
|
|
|
|
(
|
) |
|
|
|
|
|
|
— |
|
|
Roosevelt Square |
|
|
|
|
|
|
|
|
|
|
|
|
|
|
|
|
|
|
|
|
|
|
|
|
|
|
(
|
) |
|
|
|
|
|
|
— |
|
|
Russell Ridge |
|
|
|
|
|
|
|
|
|
|
|
|
|
|
|
|
|
|
|
|
|
|
|
|
|
|
(
|
) |
|
|
|
|
|
|
— |
|
|
Ryanwood Square |
|
|
|
|
|
|
|
|
|
|
|
|
|
|
|
|
|
|
|
|
|
|
|
|
|
|
(
|
) |
|
|
|
|
|
|
— |
|
|
Sammamish-Highlands |
|
|
|
|
|
|
|
|
|
|
|
|
|
|
|
|
|
|
|
|
|
|
|
|
|
|
(
|
) |
|
|
|
|
|
|
— |
|
|
San Carlos Marketplace |
|
|
|
|
|
|
|
|
|
|
|
|
|
|
|
|
|
|
|
|
|
|
|
|
|
|
(
|
) |
|
|
|
|
|
|
— |
|
|
San Leandro Plaza |
|
|
|
|
|
|
|
|
|
|
|
|
|
|
|
|
|
|
|
|
|
|
|
|
|
|
(
|
) |
|
|
|
|
|
|
— |
|
|
Sandy Springs |
|
|
|
|
|
|
|
|
|
|
|
|
|
|
|
|
|
|
|
|
|
|
|
|
|
|
(
|
) |
|
|
|
|
|
|
— |
|
|
Sawgrass Promenade |
|
|
|
|
|
|
|
|
|
|
|
|
|
|
|
|
|
|
|
|
|
|
|
|
|
|
(
|
) |
|
|
|
|
|
|
— |
|
|
Scripps Ranch Marketplace |
|
|
|
|
|
|
|
|
|
|
|
|
|
|
|
|
|
|
|
|
|
|
|
|
|
|
(
|
) |
|
|
|
|
|
|
— |
|
|
Serramonte Center |
|
|
|
|
|
|
|
|
|
|
|
|
|
|
|
|
|
|
|
|
|
|
|
|
|
|
(
|
) |
|
|
|
|
|
|
— |
|
|
Shaw's at Plymouth |
|
|
|
|
|
|
|
|
|
|
— |
|
|
|
|
|
|
|
|
|
|
|
|
|
|
|
(
|
) |
|
|
|
|
|
|
— |
|
|
Shelton Square |
|
|
|
|
|
|
|
|
|
|
|
|
|
|
|
|
|
|
|
|
|
|
|
|
|
|
(
|
) |
|
|
|
|
|
|
— |
|
|
Sheridan Plaza |
|
|
|
|
|
|
|
|
|
|
|
|
|
|
|
|
|
|
|
|
|
|
|
|
|
|
(
|
) |
|
|
|
|
|
|
— |
|
|
Sherwood Crossroads |
|
|
|
|
|
|
|
|
|
|
|
|
|
|
|
|
|
|
|
|
|
|
|
|
|
|
(
|
) |
|
|
|
|
|
|
— |
|
|
Shiloh Springs |
|
|
|
|
|
|
|
|
|
|
|
|
|
|
|
|
|
|
|
|
|
|
|
|
|
|
(
|
) |
|
|
|
|
|
|
— |
|
|
Shoppes @ 104 |
|
|
|
|
|
|
— |
|
|
|
|
|
|
|
|
|
|
|
|
|
|
|
|
|
|
|
(
|
) |
|
|
|
|
|
|
— |
|
|
Shoppes at Homestead |
|
|
|
|
|
|
|
|
|
|
|
|
|
|
|
|
|
|
|
|
|
|
|
|
|
|
(
|
) |
|
|
|
|
|
|
— |
|
|
Shoppes at Lago Mar |
|
|
|
|
|
|
|
|
|
|
|
|
|
|
|
|
|
|
|
|
|
|
|
|
|
|
(
|
) |
|
|
|
|
|
|
— |
|
|
Shoppes at Sunlake Centre |
|
|
|
|
|
|
|
|
|
|
|
|
|
|
|
|
|
|
|
|
|
|
|
|
|
|
(
|
) |
|
|
|
|
|
|
— |
|
|
Shoppes of Grande Oak |
|
|
|
|
|
|
|
|
|
|
|
|
|
|
|
|
|
|
|
|
|
|
|
|
|
|
(
|
) |
|
|
|
|
|
|
— |
|
|
Shoppes of Jonathan's Landing |
|
|
|
|
|
|
|
|
|
|
|
|
|
|
|
|
|
|
|
|
|
|
|
|
|
|
(
|
) |
|
|
|
|
|
|
— |
|
|
Shoppes of Oakbrook |
|
|
|
|
|
|
|
|
|
|
|
|
|
|
|
|
|
|
|
|
|
|
|
|
|
|
(
|
) |
|
|
|
|
|
|
— |
|
|
Shoppes of Silver Lakes |
|
|
|
|
|
|
|
|
|
|
|
|
|
|
|
|
|
|
|
|
|
|
|
|
|
|
(
|
) |
|
|
|
|
|
|
— |
|
|
Shoppes of Sunset |
|
|
|
|
|
|
|
|
|
|
|
|
|
|
|
|
|
|
|
|
|
|
|
|
|
|
(
|
) |
|
|
|
|
|
|
— |
|
|
Shoppes of Sunset II |
|
|
|
|
|
|
|
|
|
|
|
|
|
|
|
|
|
|
|
|
|
|
|
|
|
|
(
|
) |
|
|
|
|
|
|
— |
|
|
Shops at County Center |
|
|
|
|
|
|
|
|
|
|
|
|
|
|
|
|
|
|
|
|
|
|
|
|
|
|
(
|
) |
|
|
|
|
|
|
— |
|
|
Shops at Erwin Mill |
|
|
|
|
|
|
|
|
|
|
|
|
|
|
|
|
|
|
|
|
|
|
|
|
|
|
(
|
) |
|
|
|
|
|
|
(
|
) |
|
Shops at John's Creek |
|
|
|
|
|
|
|
|
|
|
(
|
) |
|
|
|
|
|
|
|
|
|
|
|
|
|
|
(
|
) |
|
|
|
|
|
|
— |
|
|
Shops at Mira Vista |
|
|
|
|
|
|
|
|
|
|
|
|
|
|
|
|
|
|
|
|
|
|
|
|
|
|
(
|
) |
|
|
|
|
|
|
(
|
) |
|
Shops at Quail Creek |
|
|
|
|
|
|
|
|
|
|
|
|
|
|
|
|
|
|
|
|
|
|
|
|
|
|
(
|
) |
|
|
|
|
|
|
— |
|
121
REGENCY CENTERS CORPORATION AND REGENCY CENTERS, L.P.
Schedule III - Consolidated Real Estate and Accumulated Depreciation
December 31, 2023
(in thousands)
|
|
|
Initial Cost |
|
|
|
|
|
Total Cost |
|
|
|
|
|
Net Cost |
|
|
|
|
||||||||||||||||||
|
Shopping Centers (1) |
|
Land & Land
|
|
|
Building &
|
|
|
Cost
|
|
|
Land & Land
|
|
|
Building &
|
|
|
Total |
|
|
Accumulated
|
|
|
Net of
|
|
|
Mortgages or
|
|
|||||||||
|
Shops at Saugus |
|
|
|
|
|
|
|
|
|
|
|
|
|
|
|
|
|
|
|
|
|
|
|
|
|
|
(
|
) |
|
|
|
|
|
|
— |
|
|
Shops at Skylake |
|
|
|
|
|
|
|
|
|
|
|
|
|
|
|
|
|
|
|
|
|
|
|
|
|
|
(
|
) |
|
|
|
|
|
|
— |
|
|
Shops at The Columbia |
|
|
|
|
|
|
|
|
|
|
— |
|
|
|
|
|
|
|
|
|
|
|
|
|
|
|
(
|
) |
|
|
|
|
|
|
— |
|
|
Shops on Main |
|
|
|
|
|
|
|
|
|
|
|
|
|
|
|
|
|
|
|
|
|
|
|
|
|
|
(
|
) |
|
|
|
|
|
|
— |
|
|
Somers Commons |
|
|
|
|
|
|
|
|
|
|
|
|
|
|
|
|
|
|
|
|
|
|
|
|
|
|
(
|
) |
|
|
|
|
|
|
— |
|
|
Sope Creek Crossing |
|
|
|
|
|
|
|
|
|
|
|
|
|
|
|
|
|
|
|
|
|
|
|
|
|
|
(
|
) |
|
|
|
|
|
|
— |
|
|
South Beach Regional |
|
|
|
|
|
|
|
|
|
|
|
|
|
|
|
|
|
|
|
|
|
|
|
|
|
|
(
|
) |
|
|
|
|
|
|
— |
|
|
South Pass Village |
|
|
|
|
|
|
|
|
|
|
|
|
|
|
|
|
|
|
|
|
|
|
|
|
|
|
(
|
) |
|
|
|
|
|
|
(
|
) |
|
South Point |
|
|
|
|
|
|
|
|
|
|
|
|
|
|
|
|
|
|
|
|
|
|
|
|
|
|
(
|
) |
|
|
|
|
|
|
— |
|
|
Southbury Green |
|
|
|
|
|
|
|
|
|
|
|
|
|
|
|
|
|
|
|
|
|
|
|
|
|
|
(
|
) |
|
|
|
|
|
|
— |
|
|
Southcenter |
|
|
|
|
|
|
|
|
|
|
|
|
|
|
|
|
|
|
|
|
|
|
|
|
|
|
(
|
) |
|
|
|
|
|
|
— |
|
|
Southpark at Cinco Ranch |
|
|
|
|
|
|
|
|
|
|
|
|
|
|
|
|
|
|
|
|
|
|
|
|
|
|
(
|
) |
|
|
|
|
|
|
— |
|
|
SouthPoint Crossing |
|
|
|
|
|
|
|
|
|
|
|
|
|
|
|
|
|
|
|
|
|
|
|
|
|
|
(
|
) |
|
|
|
|
|
|
— |
|
|
Staples Plaza-Yorktown Heights |
|
|
|
|
|
|
|
|
|
|
|
|
|
|
|
|
|
|
|
|
|
|
|
|
|
|
(
|
) |
|
|
|
|
|
|
— |
|
|
Starke |
|
|
|
|
|
|
|
|
|
|
|
|
|
|
|
|
|
|
|
|
|
|
|
|
|
|
(
|
) |
|
|
|
|
|
|
— |
|
|
Star's at Cambridge |
|
|
|
|
|
|
|
|
|
|
(
|
) |
|
|
|
|
|
|
|
|
|
|
|
|
|
|
(
|
) |
|
|
|
|
|
|
— |
|
|
Star's at Quincy |
|
|
|
|
|
|
|
|
|
|
|
|
|
|
|
|
|
|
|
|
|
|
|
|
|
|
(
|
) |
|
|
|
|
|
|
— |
|
|
Star's at West Roxbury |
|
|
|
|
|
|
|
|
|
|
|
|
|
|
|
|
|
|
|
|
|
|
|
|
|
|
(
|
) |
|
|
|
|
|
|
— |
|
|
Station Centre @ Old Greenwich |
|
|
|
|
|
|
|
|
|
|
— |
|
|
|
|
|
|
|
|
|
|
|
|
|
|
|
(
|
) |
|
|
|
|
|
|
(
|
) |
|
Sterling Ridge |
|
|
|
|
|
|
|
|
|
|
|
|
|
|
|
|
|
|
|
|
|
|
|
|
|
|
(
|
) |
|
|
|
|
|
|
— |
|
|
Stroh Ranch |
|
|
|
|
|
|
|
|
|
|
|
|
|
|
|
|
|
|
|
|
|
|
|
|
|
|
(
|
) |
|
|
|
|
|
|
— |
|
|
Suncoast Crossing |
|
|
|
|
|
|
|
|
|
|
|
|
|
|
|
|
|
|
|
|
|
|
|
|
|
|
(
|
) |
|
|
|
|
|
|
— |
|
|
Sunny Valley Shops |
|
|
|
|
|
|
|
|
|
|
|
|
|
|
|
|
|
|
|
|
|
|
|
|
|
|
(
|
) |
|
|
|
|
|
|
— |
|
|
Talega Village Center |
|
|
|
|
|
|
|
|
|
|
|
|
|
|
|
|
|
|
|
|
|
|
|
|
|
|
(
|
) |
|
|
|
|
|
|
— |
|
|
Tamarac Town Square |
|
|
|
|
|
|
|
|
|
|
|
|
|
|
|
|
|
|
|
|
|
|
|
|
|
|
(
|
) |
|
|
|
|
|
|
— |
|
|
Tanasbourne Market |
|
|
|
|
|
|
|
|
|
|
(
|
) |
|
|
|
|
|
|
|
|
|
|
|
|
|
|
(
|
) |
|
|
|
|
|
|
— |
|
|
Tanglewood Shopping Center |
|
|
|
|
|
|
|
|
|
|
|
|
|
|
|
|
|
|
|
|
|
|
|
|
|
|
(
|
) |
|
|
|
|
|
|
(
|
) |
|
Tassajara Crossing |
|
|
|
|
|
|
|
|
|
|
|
|
|
|
|
|
|
|
|
|
|
|
|
|
|
|
(
|
) |
|
|
|
|
|
|
— |
|
|
Tech Ridge Center |
|
|
|
|
|
|
|
|
|
|
|
|
|
|
|
|
|
|
|
|
|
|
|
|
|
|
(
|
) |
|
|
|
|
|
|
— |
|
|
The Abbot |
|
|
|
|
|
|
|
|
|
|
|
|
|
|
|
|
|
|
|
|
|
|
|
|
|
|
(
|
) |
|
|
|
|
|
|
— |
|
|
The Crossing Clarendon |
|
|
|
|
|
|
|
|
|
|
|
|
|
|
|
|
|
|
|
|
|
|
|
|
|
|
(
|
) |
|
|
|
|
|
|
— |
|
|
The Dock-Dockside |
|
|
|
|
|
|
|
|
|
|
|
|
|
|
|
|
|
|
|
|
|
|
|
|
|
|
(
|
) |
|
|
|
|
|
|
(
|
) |
|
The Field at Commonwealth |
|
|
|
|
|
|
|
|
|
|
|
|
|
|
|
|
|
|
|
|
|
|
|
|
|
|
(
|
) |
|
|
|
|
|
|
— |
|
|
The Gallery at Westbury Plaza |
|
|
|
|
|
|
|
|
|
|
|
|
|
|
|
|
|
|
|
|
|
|
|
|
|
|
(
|
) |
|
|
|
|
|
|
— |
|
|
The Hub Hillcrest Market |
|
|
|
|
|
|
|
|
|
|
|
|
|
|
|
|
|
|
|
|
|
|
|
|
|
|
(
|
) |
|
|
|
|
|
|
— |
|
|
The Longmeadow Shops |
|
|
|
|
|
|
|
|
|
|
|
|
|
|
|
|
|
|
|
|
|
|
|
|
|
|
(
|
) |
|
|
|
|
|
|
(
|
) |
|
The Marketplace |
|
|
|
|
|
|
|
|
|
|
|
|
|
|
|
|
|
|
|
|
|
|
|
|
|
|
(
|
) |
|
|
|
|
|
|
— |
|
|
The Plaza at St. Lucie West |
|
|
|
|
|
|
|
|
|
|
|
|
|
|
|
|
|
|
|
|
|
|
|
|
|
|
(
|
) |
|
|
|
|
|
|
— |
|
|
The Point at Garden City Park |
|
|
|
|
|
|
|
|
|
|
|
|
|
|
|
|
|
|
|
|
|
|
|
|
|
|
(
|
) |
|
|
|
|
|
|
— |
|
|
The Pruneyard |
|
|
|
|
|
|
|
|
|
|
|
|
|
|
|
|
|
|
|
|
|
|
|
|
|
|
(
|
) |
|
|
|
|
|
|
(
|
) |
|
The Shops at Hampton Oaks |
|
|
|
|
|
|
|
|
|
|
(
|
) |
|
|
|
|
|
|
|
|
|
|
|
|
|
|
(
|
) |
|
|
|
|
|
|
— |
|
|
The Village at Hunter's Lake |
|
|
|
|
|
|
|
|
|
|
|
|
|
|
|
|
|
|
|
|
|
|
|
|
|
|
(
|
) |
|
|
|
|
|
|
— |
|
122
REGENCY CENTERS CORPORATION AND REGENCY CENTERS, L.P.
Schedule III - Consolidated Real Estate and Accumulated Depreciation
December 31, 2023
(in thousands)
|
|
|
Initial Cost |
|
|
|
|
|
Total Cost |
|
|
|
|
|
Net Cost |
|
|
|
|
||||||||||||||||||
|
Shopping Centers (1) |
|
Land & Land
|
|
|
Building &
|
|
|
Cost
|
|
|
Land & Land
|
|
|
Building &
|
|
|
Total |
|
|
Accumulated
|
|
|
Net of
|
|
|
Mortgages or
|
|
|||||||||
|
The Village at Riverstone |
|
|
|
|
|
|
|
|
|
|
(
|
) |
|
|
|
|
|
|
|
|
|
|
|
|
|
|
(
|
) |
|
|
|
|
|
|
— |
|
|
Town and Country |
|
|
|
|
|
|
|
|
|
|
|
|
|
|
|
|
|
|
|
|
|
|
|
|
|
|
(
|
) |
|
|
|
|
|
|
— |
|
|
Town Square |
|
|
|
|
|
|
|
|
|
|
|
|
|
|
|
|
|
|
|
|
|
|
|
|
|
|
(
|
) |
|
|
|
|
|
|
— |
|
|
Towne Centre at Somers |
|
|
|
|
|
|
|
|
|
|
|
|
|
|
|
|
|
|
|
|
|
|
|
|
|
|
(
|
) |
|
|
|
|
|
|
— |
|
|
Treasure Coast Plaza |
|
|
|
|
|
|
|
|
|
|
|
|
|
|
|
|
|
|
|
|
|
|
|
|
|
|
(
|
) |
|
|
|
|
|
|
— |
|
|
Tustin Legacy |
|
|
|
|
|
|
|
|
|
|
|
|
|
|
|
|
|
|
|
|
|
|
|
|
|
|
(
|
) |
|
|
|
|
|
|
— |
|
|
Twin City Plaza |
|
|
|
|
|
|
|
|
|
|
|
|
|
|
|
|
|
|
|
|
|
|
|
|
|
|
(
|
) |
|
|
|
|
|
|
— |
|
|
Twin Peaks |
|
|
|
|
|
|
|
|
|
|
|
|
|
|
|
|
|
|
|
|
|
|
|
|
|
|
(
|
) |
|
|
|
|
|
|
— |
|
|
Unigold Shopping Center |
|
|
|
|
|
|
|
|
|
|
|
|
|
|
|
|
|
|
|
|
|
|
|
|
|
|
(
|
) |
|
|
|
|
|
|
— |
|
|
University Commons |
|
|
|
|
|
|
|
|
|
|
|
|
|
|
|
|
|
|
|
|
|
|
|
|
|
|
(
|
) |
|
|
|
|
|
|
— |
|
|
Valencia Crossroads |
|
|
|
|
|
|
|
|
|
|
|
|
|
|
|
|
|
|
|
|
|
|
|
|
|
|
(
|
) |
|
|
|
|
|
|
— |
|
|
Valley Ridge Shopping Center |
|
|
|
|
|
|
|
|
|
|
|
|
|
|
|
|
|
|
|
|
|
|
|
|
|
|
(
|
) |
|
|
|
|
|
|
(
|
) |
|
Valley Stream |
|
|
|
|
|
|
|
|
|
|
|
|
|
|
|
|
|
|
|
|
|
|
|
|
|
|
(
|
) |
|
|
|
|
|
|
— |
|
|
Van Houten Plaza |
|
|
|
|
|
|
|
|
|
|
— |
|
|
|
|
|
|
|
|
|
|
|
|
|
|
|
(
|
) |
|
|
|
|
|
|
— |
|
|
Veterans Plaza |
|
|
|
|
|
|
|
|
|
|
|
|
|
|
|
|
|
|
|
|
|
|
|
|
|
|
(
|
) |
|
|
|
|
|
|
— |
|
|
Village at La Floresta |
|
|
|
|
|
|
|
|
|
|
(
|
) |
|
|
|
|
|
|
|
|
|
|
|
|
|
|
(
|
) |
|
|
|
|
|
|
— |
|
|
Village at Lee Airpark |
|
|
|
|
|
|
|
|
|
|
|
|
|
|
|
|
|
|
|
|
|
|
|
|
|
|
(
|
) |
|
|
|
|
|
|
— |
|
|
Village Center |
|
|
|
|
|
|
|
|
|
|
|
|
|
|
|
|
|
|
|
|
|
|
|
|
|
|
(
|
) |
|
|
|
|
|
|
— |
|
|
Village Commons |
|
|
|
|
|
|
|
|
|
|
|
|
|
|
|
|
|
|
|
|
|
|
|
|
|
|
(
|
) |
|
|
|
|
|
|
— |
|
|
Von's Circle Center |
|
|
|
|
|
|
|
|
|
|
|
|
|
|
|
|
|
|
|
|
|
|
|
|
|
|
(
|
) |
|
|
|
|
|
|
(
|
) |
|
Wading River |
|
|
|
|
|
|
|
|
|
|
|
|
|
|
|
|
|
|
|
|
|
|
|
|
|
|
(
|
) |
|
|
|
|
|
|
— |
|
|
Waldwick Plaza |
|
|
|
|
|
|
|
|
|
|
— |
|
|
|
|
|
|
|
|
|
|
|
|
|
|
|
(
|
) |
|
|
|
|
|
|
— |
|
|
Walker Center |
|
|
|
|
|
|
|
|
|
|
|
|
|
|
|
|
|
|
|
|
|
|
|
|
|
|
(
|
) |
|
|
|
|
|
|
— |
|
|
Walmart Norwalk |
|
|
|
|
|
|
|
|
|
|
|
|
|
|
|
|
|
|
|
|
|
|
|
|
|
|
(
|
) |
|
|
|
|
|
|
— |
|
|
Washington Commons |
|
|
|
|
|
|
|
|
|
|
|
|
|
|
|
|
|
|
|
|
|
|
|
|
|
|
(
|
) |
|
|
|
|
|
|
(
|
) |
|
Waterstone Plaza |
|
|
|
|
|
|
|
|
|
|
|
|
|
|
|
|
|
|
|
|
|
|
|
|
|
|
(
|
) |
|
|
|
|
|
|
— |
|
|
Welleby Plaza |
|
|
|
|
|
|
|
|
|
|
|
|
|
|
|
|
|
|
|
|
|
|
|
|
|
|
(
|
) |
|
|
|
|
|
|
— |
|
|
Wellington Town Square |
|
|
|
|
|
|
|
|
|
|
|
|
|
|
|
|
|
|
|
|
|
|
|
|
|
|
(
|
) |
|
|
|
|
|
|
— |
|
|
West Bird Plaza |
|
|
|
|
|
|
|
|
|
|
|
|
|
|
|
|
|
|
|
|
|
|
|
|
|
|
(
|
) |
|
|
|
|
|
|
— |
|
|
West Chester Plaza |
|
|
|
|
|
|
|
|
|
|
|
|
|
|
|
|
|
|
|
|
|
|
|
|
|
|
(
|
) |
|
|
|
|
|
|
— |
|
|
West Lake Shopping Center |
|
|
|
|
|
|
|
|
|
|
|
|
|
|
|
|
|
|
|
|
|
|
|
|
|
|
(
|
) |
|
|
|
|
|
|
— |
|
|
West Park Plaza |
|
|
|
|
|
|
|
|
|
|
|
|
|
|
|
|
|
|
|
|
|
|
|
|
|
|
(
|
) |
|
|
|
|
|
|
— |
|
|
Westbard Square |
|
|
|
|
|
|
|
|
|
|
(
|
) |
|
|
|
|
|
|
|
|
|
|
|
|
|
|
(
|
) |
|
|
|
|
|
|
— |
|
|
Westbury Plaza |
|
|
|
|
|
|
|
|
|
|
|
|
|
|
|
|
|
|
|
|
|
|
|
|
|
|
(
|
) |
|
|
|
|
|
|
(
|
) |
|
Westchase |
|
|
|
|
|
|
|
|
|
|
|
|
|
|
|
|
|
|
|
|
|
|
|
|
|
|
(
|
) |
|
|
|
|
|
|
— |
|
|
Westchester Commons |
|
|
|
|
|
|
|
|
|
|
|
|
|
|
|
|
|
|
|
|
|
|
|
|
|
|
(
|
) |
|
|
|
|
|
|
— |
|
|
Westlake Village Plaza and Center |
|
|
|
|
|
|
|
|
|
|
|
|
|
|
|
|
|
|
|
|
|
|
|
|
|
|
(
|
) |
|
|
|
|
|
|
— |
|
|
Westport Plaza |
|
|
|
|
|
|
|
|
|
|
(
|
) |
|
|
|
|
|
|
|
|
|
|
|
|
|
|
(
|
) |
|
|
|
|
|
|
— |
|
|
Westport Row |
|
|
|
|
|
|
|
|
|
|
|
|
|
|
|
|
|
|
|
|
|
|
|
|
|
|
(
|
) |
|
|
|
|
|
|
— |
|
|
Westwood Village |
|
|
|
|
|
|
|
|
|
|
(
|
) |
|
|
|
|
|
|
|
|
|
|
|
|
|
|
(
|
) |
|
|
|
|
|
|
— |
|
|
Willa Springs |
|
|
|
|
|
|
|
|
|
|
|
|
|
|
|
|
|
|
|
|
|
|
|
|
|
|
(
|
) |
|
|
|
|
|
|
(
|
) |
123
REGENCY CENTERS CORPORATION AND REGENCY CENTERS, L.P.
Schedule III - Consolidated Real Estate and Accumulated Depreciation
December 31, 2023
(in thousands)
|
|
|
Initial Cost |
|
|
|
|
|
Total Cost |
|
|
|
|
|
Net Cost |
|
|
|
|
||||||||||||||||||
|
Shopping Centers (1) |
|
Land & Land
|
|
|
Building &
|
|
|
Cost
|
|
|
Land & Land
|
|
|
Building &
|
|
|
Total |
|
|
Accumulated
|
|
|
Net of
|
|
|
Mortgages or
|
|
|||||||||
|
Williamsburg at Dunwoody |
|
|
|
|
|
|
|
|
|
|
|
|
|
|
|
|
|
|
|
|
|
|
|
|
|
|
(
|
) |
|
|
|
|
|
|
— |
|
|
Willow Festival |
|
|
|
|
|
|
|
|
|
|
|
|
|
|
|
|
|
|
|
|
|
|
|
|
|
|
(
|
) |
|
|
|
|
|
|
— |
|
|
Willow Oaks |
|
|
|
|
|
|
|
|
|
|
(
|
) |
|
|
|
|
|
|
|
|
|
|
|
|
|
|
(
|
) |
|
|
|
|
|
|
— |
|
|
Willows Shopping Center |
|
|
|
|
|
|
|
|
|
|
|
|
|
|
|
|
|
|
|
|
|
|
|
|
|
|
(
|
) |
|
|
|
|
|
|
— |
|
|
Woodcroft Shopping Center |
|
|
|
|
|
|
|
|
|
|
|
|
|
|
|
|
|
|
|
|
|
|
|
|
|
|
(
|
) |
|
|
|
|
|
|
— |
|
|
Woodman Van Nuys |
|
|
|
|
|
|
|
|
|
|
|
|
|
|
|
|
|
|
|
|
|
|
|
|
|
|
(
|
) |
|
|
|
|
|
|
— |
|
|
Woodmen Plaza |
|
|
|
|
|
|
|
|
|
|
|
|
|
|
|
|
|
|
|
|
|
|
|
|
|
|
(
|
) |
|
|
|
|
|
|
— |
|
|
Woodside Central |
|
|
|
|
|
|
|
|
|
|
|
|
|
|
|
|
|
|
|
|
|
|
|
|
|
|
(
|
) |
|
|
|
|
|
|
— |
|
|
Corporate Assets |
|
|
— |
|
|
|
|
|
|
|
|
|
|
|
— |
|
|
|
|
|
|
|
|
|
|
|
(
|
) |
|
|
|
|
|
|
— |
|
|
Land held for future development |
|
|
|
|
|
|
— |
|
|
|
(
|
) |
|
|
|
|
|
|
— |
|
|
|
|
|
|
|
— |
|
|
|
|
|
|
|
— |
|
|
Construction in progress |
|
|
— |
|
|
|
— |
|
|
|
|
|
|
|
— |
|
|
|
|
|
|
|
|
|
|
|
— |
|
|
|
|
|
|
|
— |
|
|
|
|
$ |
|
|
|
|
|
|
|
|
|
|
|
|
|
|
|
|
|
|
|
|
|
|
|
|
(
|
) |
|
|
|
|
|
|
(
|
) |
See accompanying report of independent registered public accounting firm.
124
REGENCY CENTERS CORPORATION AND REGENCY CENTERS, L.P.
Schedule III - Consolidated Real Estate and Accumulated Depreciation
December 31, 2023
(in thousands)
Depreciation and amortization of the Company's investment in buildings and improvements reflected in the statements of operations is calculated over the estimated useful lives of the assets, which are up to
The changes in total real estate assets for the years ended December 31, 2023, 2022, and 2021 are as follows:
|
(in thousands) |
|
2023 |
|
|
2022 |
|
|
2021 |
|
|||
|
Beginning balance |
|
$ |
|
|
|
|
|
|
|
|
|
|
|
Acquired properties and land |
|
|
|
|
|
|
|
|
|
|
|
|
|
Developments and improvements |
|
|
|
|
|
|
|
|
|
|
|
|
|
Disposal of building and tenant improvements |
|
|
(
|
) |
|
|
(
|
) |
|
|
(
|
) |
|
Sale of properties |
|
|
(
|
) |
|
|
(
|
) |
|
|
(
|
) |
|
Properties held for sale |
|
|
(
|
) |
|
|
— |
|
|
|
(
|
) |
|
Provision for impairment |
|
|
— |
|
|
|
— |
|
|
|
(
|
) |
|
Ending balance |
|
$ |
|
|
|
|
|
|
|
|
|
|
The changes in accumulated depreciation for the years ended December 31, 2023, 2022, and 2021 are as follows:
|
(in thousands) |
|
2023 |
|
|
2022 |
|
|
2021 |
|
|||
|
Beginning balance |
|
$ |
|
|
|
|
|
|
|
|
|
|
|
Depreciation expense |
|
|
|
|
|
|
|
|
|
|
|
|
|
Disposal of building and tenant improvements |
|
|
(
|
) |
|
|
(
|
) |
|
|
(
|
) |
|
Sale of properties |
|
|
(
|
) |
|
|
(
|
) |
|
|
(
|
) |
|
Accumulated depreciation related to properties held for sale |
|
|
(
|
) |
|
|
— |
|
|
|
(
|
) |
|
Provision for impairment |
|
|
— |
|
|
|
— |
|
|
|
(
|
) |
|
Ending balance |
|
$ |
|
|
|
|
|
|
|
|
|
|
See accompanying report of independent registered public accounting firm.
125
Item 9. Changes in and Disagreements with Acco untants on Accounting and Financial Disclosure
None.
Item 9A. Controls and Procedures
Controls and Procedures (Regency Centers Corporation)
Conclusion Regarding the Effectiveness of Disclosure Controls and Procedures
Under the supervision and with the participation of the Parent Company's management, including its chief executive officer and chief financial officer, the Parent Company conducted an evaluation of its disclosure controls and procedures, as such term is defined under Rule 13a-15(e) and 15d-15(e) promulgated under the Exchange Act. Based on this evaluation, the Parent Company's chief executive officer and chief financial officer concluded that as of December 31, 2023, the Parent Company's disclosure controls and procedures were effective to ensure information required to be disclosed in the reports filed or submitted under the Exchange Act is recorded, processed, summarized and reported, within the time period specified in the SEC's rules and forms. These disclosure controls and procedures include controls and procedures designed to ensure that information required to be disclosed by the Parent Company in the reports it files or submits is accumulated and communicated to management, including its chief executive officer and chief financial officer, as appropriate, to allow timely decisions regarding required disclosure.
Management's Report on Internal Control over Financial Reporting
The Parent Company's management is responsible for establishing and maintaining adequate internal control over financial reporting, as such term is defined in Exchange Act Rules 13a-15(f) and 15d-15(f). Under the supervision and with the participation of its management, including its chief executive officer and chief financial officer, the Parent Company conducted an evaluation of the effectiveness of its internal control over financial reporting based on the framework in Internal Control - Integrated Framework (2013) issued by the Committee of Sponsoring Organizations of the Treadway Commission. Based on its evaluation under the framework in Internal Control - Integrated Framework (2013) , the Parent Company's management concluded that its internal control over financial reporting was effective as of December 31, 2023.
KPMG LLP, an independent registered public accounting firm, has audited the Consolidated Financial Statements included in this Report and, as part of their audit, has issued a report, included within "Item 8. Financial Statements and Supplementary Data " of this Report, on the effectiveness of the Parent Company's internal control over financial reporting.
The Parent Company's system of internal control over financial reporting was designed to provide reasonable assurance regarding the preparation and fair presentation of published financial statements in accordance with accounting principles generally accepted in the United States. All internal control systems, no matter how well designed, have inherent limitations. Therefore, even those systems determined to be effective can provide only reasonable assurance and may not prevent or detect misstatements. Also, projections of any evaluation of effectiveness to future periods are subject to the risk that controls may become inadequate because of changes in conditions, or that the degree of compliance with the policies or procedures may deteriorate.
Changes in Internal Controls
There have been no changes in the Parent Company's internal controls over financial reporting identified in connection with this evaluation that occurred during the quarter ended December 31, 2023 that have materially affected, or are reasonably likely to materially affect, our internal controls over financial reporting.
Controls and Procedures (Regency Centers, L.P.)
Conclusion Regarding the Effectiveness of Disclosure Controls and Procedures
Under the supervision and with the participation of the Operating Partnership's management, including the chief executive officer and chief financial officer of its general partner, the Operating Partnership conducted an evaluation of its disclosure controls and procedures, as such term is defined under Rule 13a-15(e) and 15d-15(e) promulgated under the Exchange Act. Based on this evaluation, the chief executive officer and chief financial officer of its general partner concluded that, as of December 31, 2023, the Operating Partnership's disclosure controls and procedures were effective to ensure information required to be disclosed in the reports filed or submitted under the Exchange Act is recorded, processed, summarized and reported, within the time period specified in the SEC's rules and forms. These disclosure controls and procedures include controls and procedures designed to ensure that information required to be disclosed by the Operating Partnership in the reports it files or submits is accumulated and communicated to management, including the chief executive officer and chief financial officer of its general partner, as appropriate, to allow timely decisions regarding required disclosure.
126
Management's Report on Internal Control over Financial Reporting
The Operating Partnership's management is responsible for establishing and maintaining adequate internal control over financial reporting, as such term is defined in Exchange Act Rules 13a-15(f) and 15d-15(f). Under the supervision and with the participation of its management, including the chief executive officer and chief financial officer of its general partner, the Operating Partnership conducted an evaluation of the effectiveness of its internal control over financial reporting based on the framework in Internal Control - Integrated Framework (2013) issued by the Committee of Sponsoring Organizations of the Treadway Commission. Based on its evaluation under the framework in Internal Control - Integrated Framework (2013) , the Operating Partnership's management concluded that its internal control over financial reporting was effective as of December 31, 2023.
KPMG LLP, an independent registered public accounting firm, has audited the Consolidated Financial Statements included in this Report and, as part of their audit, has issued a report, included within "Item 8. Financial Statements and Supplementary Data " of this Report, on the effectiveness of the Operating Partnership's internal control over financial reporting.
The Operating Partnership's system of internal control over financial reporting was designed to provide reasonable assurance regarding the preparation and fair presentation of published financial statements in accordance with accounting principles generally accepted in the United States. All internal control systems, no matter how well designed, have inherent limitations. Therefore, even those systems determined to be effective can provide only reasonable assurance and may not prevent or detect misstatements. Also, projections of any evaluation of effectiveness to future periods are subject to the risk that controls may become inadequate because of changes in conditions, or that the degree of compliance with the policies or procedures may deteriorate.
Changes in Internal Controls
There have been no changes in the Operating Partnership's internal controls over financial reporting identified in connection with this evaluation that occurred during the quarter ended December 31, 2023 that have materially affected, or are reasonably likely to materially affect, our internal controls over financial reporting.
Item 9B. Other Information
Rule 10b5-1 Trading Plans
On
(i) Mr. Stein terminated a trading arrangement he had previously adopted with respect to the sale of the Company’s common stock (a “Rule 10b5-1 Trading Plan”). Mr. Stein’s Rule 10b5-1 Trading Plan was adopted on
(ii) Mr. Stein adopted a new Rule 10b5-1 Trading Plan that is intended to satisfy the affirmative defense conditions of Securities Exchange Act Rule 10b5-1(c). Mr. Stein’s Rule 10b5-1 Trading Plan, which
on
Entry into Material Definitive Agreements
Indemnification Agreements
On November 2, 2023, the Company entered into an indemnification agreement (an “Indemnification Agreement”) with each current member of its Board of Directors and each of its executive officers (each being referred to as an “Indemnified Party” and collectively as the “Indemnified Parties”). These Indemnification Agreements require the Company, among other things, to indemnify and hold harmless its directors and executive officers against claims, lawsuits, proceedings and liabilities (collectively, “Claims”) that may arise by reason of their status or capacity with, or service to, the Company and its subsidiaries, to the fullest extent permitted by the Company’s Articles of Incorporation, Bylaws and the Florida Business Corporation Act. These Indemnification Agreements also require the Company to advance expenses incurred by the Indemnified Parties in investigating or defending any such Claims, and sets forth various procedures in respect of such advancement and indemnification. The Indemnification Agreements also require the Company to procure customary directors and officers liability insurance, subject to certain conditions. The Company believes that these agreements are appropriate and necessary to attract and retain qualified individuals to serve as directors and executive officers.
127
The foregoing summary of the terms of the Indemnification Agreements does not purport to be complete and is qualified in its entirety by reference to the full text of the “form of” Indemnification Agreement, a copy of which is incorporated by reference as Exhibit 10(k) herein.
Item 9C. Disclosure Regarding Foreign Jurisdictions that Prevent Inspections
Not applicable
PART III
Item 10. Directors, Executive Officers, and Corporate Governance
Information concerning our directors, executive officers, and corporate governance is incorporated herein by reference to our definitive proxy statement to be filed with the SEC within 120 days after the end of the fiscal year covered by this Report with respect to the 2024 Annual Meeting of Shareholders. Information regarding executive officers is included in Part I of this Form 10-K as permitted by General Instruction G(3).
Code of Ethics.
We have a code of ethics applicable to our Board of Directors, principal executive officers, principal financial officer, principal accounting officer and persons performing similar functions. The text of this code of ethics may be found on our website at https://investors.regencycenters.com/corporate-governance/governance-overview. We will post a notice of any waiver from, or amendment to, any provision of our code of ethics on our website.
Item 11. Executi ve Compensation
Incorporated herein by reference to our definitive proxy statement to be filed with the SEC within 120 days after the end of the fiscal year covered by this Report with respect to the 2024 Annual Meeting of Shareholders.
Item 12. Security Ownership of Certain Beneficial Ow ners and Management and Related Stockholder Matters
The following table provides information about securities that may be issued under our existing equity compensation plans:
Equity Compensation Plan Information
(as of December 31, 2023)
|
|
|
(a) |
|
|
(b) |
|
|
(c) |
|
|||
|
Plan Category |
|
Number of securities to be issued upon exercise of outstanding options, warrants and rights (1) |
|
|
Weighted-average exercise price of outstanding options, warrants and rights (2) |
|
|
Number of securities remaining available for future issuance under equity compensation plans (excluding securities reflected in column a) (3) |
|
|||
|
Equity compensation plans approved by security holders |
|
|
— |
|
|
$ |
— |
|
|
|
4,138,535 |
|
|
Equity compensation plans not approved by security holders |
|
N/A |
|
|
N/A |
|
|
N/A |
|
|||
|
Total |
|
|
— |
|
|
$ |
— |
|
|
|
4,138,535 |
|
Information about security ownership is incorporated herein by reference to our definitive proxy statement to be filed with the SEC within 120 days after the end of the fiscal year covered by this Report with respect to the 2024 Annual Meeting of Shareholders.
Incorporated herein by reference to our definitive proxy statement to be filed with the SEC within 120 days after the end of the fiscal year covered by this Report with respect to the 2024 Annual Meeting of Shareholders.
128
Item 14. Principal Accou ntant Fees and Services
Incorporated herein by reference to our definitive proxy statement to be filed with the SEC within 120 days after the end of the fiscal year covered by this Report with respect to the 2024 Annual Meeting of Shareholders.
129
PAR T IV
Item 15. Exhibits and Fina ncial Statement Schedules
Regency Centers Corporation and Regency Centers, L.P. 2023 financial statements and financial statement schedule, together with the reports of KPMG LLP are listed on the index immediately preceding the financial statements within "Item 8. Financial Statements and Supplementary Data " of this Report.
In reviewing the agreements included as exhibits to this Report, please remember they are included to provide you with information regarding their terms and are not intended to provide any other factual or disclosure information about the Company, its subsidiaries or other parties to the agreements. The agreements contain representations and warranties by each of the parties to the applicable agreement. These representations and warranties have been made solely for the benefit of the other parties to the applicable agreement and:
Accordingly, these representations and warranties may not describe the actual state of affairs as of the date they were made or at any other time. We acknowledge that, notwithstanding the inclusion of the foregoing cautionary statements, we are responsible for considering whether additional specific disclosures of material information regarding material contractual provisions are required to make the statements in this Report not misleading. Additional information about the Company may be found elsewhere in this Report and the Company's other public files, which are available without charge through the SEC's website at http://www.sec.gov .
Unless otherwise indicated below, the Commission file number to the exhibit is No. 001-12298.
|
1. |
Underwriting Agreement |
|||
|
|
|
|
|
|
|
|
|
(a) |
||
|
|
|
|
|
|
|
|
|
|
(i) |
Equity Distribution Agreement dated May 17, 2017 among Regency Centers Corporation, Regency Centers, L.P. and Wells Fargo Securities, LLC; |
|
|
|
|
|
|
|
|
|
|
(ii) |
Equity Distribution Agreement dated May 17, 2017 among Regency Centers Corporation, Regency Centers, L.P. and J.P. Morgan Securities LLC; |
|
|
|
|
|
|
|
|
|
|
(iii) |
Equity Distribution Agreement dated May 17, 2017 among Regency Centers Corporation, Regency Centers, L.P. and Merrill Lynch, Pierce, Fenner & Smith Incorporated; |
|
|
|
|
|
|
|
|
|
|
(iv) |
Equity Distribution Agreement dated May 17, 2017 among Regency Centers Corporation, Regency Centers, L.P. and Mizuho Securities USA LLC. |
|
|
|
|
|
|
|
|
|
(b) |
||
130
|
|
|
|
|||
|
|
|
|
|
||
|
|
|
(c) |
|||
|
|
|
|
|
|
|
|
|
|
|
(i) |
Amendment No. 2 to the Equity Distribution Agreement, dated May 8, 2020, among Regency Centers Corporation, Regency Centers, L.P. and Wells Fargo Bank, National Association and Wells Fargo Securities, LLC. |
|
|
|
|
|
|
|
|
|
|
|
|
(ii) |
Amendment No. 2 to the Equity Distribution Agreement, dated May 8, 2020, among Regency Centers Corporation, Regency Centers, L.P., JPMorgan Chase Bank, National Association and J.P. Morgan Securities LLC |
|
|
|
|
|
|
|
|
|
|
|
|
(iii) |
Amendment No. 2 to the Equity Distribution Agreement, dated May 8, 2020, among Regency Centers Corporation, Regency Centers, L.P., Bank of America, N.A. and BofA Securities, Inc. |
|
|
|
|
(d) |
|||
|
|
|
|
|
||
|
|
|
(e) |
|
||
|
|
|
|
|
|
|
|
|
|
|
(i) |
Equity Distribution Agreement, dated May 8, 2020, among Regency Centers Corporation, Regency Centers, L.P. and Jefferies LLC. |
|
|
|
|
|
|
|
|
|
|
|
|
(ii) |
Equity Distribution Agreement, dated May 8, 2020, among Regency Centers Corporation, Regency Centers, L.P., The Bank of Nova Scotia and Scotia Capital (USA) Inc. |
|
|
|
|
|
|
|
|
|
|
|
|
(iii) |
Equity Distribution Agreement, dated May 8, 2020, among Regency Centers Corporation, Regency Centers, L.P., Bank of Montreal and BMO Capital Markets Corp. |
|
|
|
|
|
|
|
|
|
|
|
|
(iv) |
Equity Distribution Agreement, dated May 8, 2020, among Regency Centers Corporation, Regency Centers, L.P., TD Securities (USA) LLC and The Toronto-Dominion Bank |
|
|
|
|
|
|
|
|
|
|
|
(f) |
|
||
|
|
|
|
|
|
|
|
|
|
(g) |
|
||
|
|
|
|
|
|
|
|
|
|
|
(i) |
Equity Distribution Agreement, dated August 8, 2023, among Regency Centers Corporation, Regency Centers, L.P. and Regions Securities LLC. |
|
|
|
|
|
|
|
|
|
|
|
|
(ii) |
Equity Distribution Agreement, dated August 8, 2023, among Regency Centers Corporation, Regency Centers, L.P. and Truist Securities, Inc. |
|
|
|
|
|
|
|
|
131
|
|
|
|
|
|
|
|
|
|
|
|
|
|
|
|
|
|
|
|
|
|
|
|
(h) |
|
||
|
|
|
|
|
|
|
|
|
|
|
(i) |
Forward Master Confirmation, dated May 8, 2020, by and between Regency Centers Corporation and Wells Fargo Bank, National Association and Wells Fargo Securities, LLC. |
|
|
|
|
|
|
|
|
|
|
|
|
(ii) |
Forward Master Confirmation, dated May 8, 2020, by and between Regency Centers Corporation and Bank of America, N.A. |
|
|
|
|
|
|
|
|
|
|
|
|
(iii) |
Forward Master Confirmation, dated May 8, 2020, by and between Regency Centers Corporation and JPMorgan Chase Bank, National Association, New York Branch |
|
|
|
|
|
|
|
|
|
|
|
|
(iv) |
Forward Master Confirmation, dated May 8, 2020, by and between Regency Centers Corporation and Bank of Montreal |
|
|
|
|
|
|
|
|
|
|
|
|
(v) |
Forward Master Confirmation, dated May 8, 2020, by and between Regency Centers Corporation and Mizuho Markets Americas LLC |
|
|
|
|
|
|
|
|
|
|
|
|
(vi) |
Forward Master Confirmation, dated May 8, 2020, by and between Regency Centers Corporation and Jefferies LLC |
|
|
|
|
|
|
|
|
|
|
|
|
(vii) |
Forward Master Confirmation, dated May 8, 2020, by and between Regency Centers Corporation and The Bank of Nova Scotia |
|
|
|
|
|
|
|
|
|
|
|
|
(viii) |
Forward Master Confirmation, dated May 8, 2020, by and between Regency Centers Corporation and The Toronto-Dominion Bank. |
|
|
|
|
|
|
|
|
|
|
|
(i) |
|||
|
|
|
|
|
|
|
|
|
|
(j) |
|||
|
|
|
|
|
|
|
|
|
|
(k) |
|||
|
|
|
|
|
|
|
|
|
|
(l) |
|||
|
|
|
|
|
|
|
|
2. |
Plan of Acquisition, Reorganization, Arrangement, Liquidation or Succession |
||||
|
|
|
(a) |
|
3. |
Articles of Incorporation and Bylaws |
|||
|
|
|
|
|
|
|
|
|
(a) |
||
|
|
|
|
|
|
132
|
|
|
(b) |
||
|
|
|
|
|
|
|
|
|
(c) |
||
|
|
|
|
|
|
|
|
|
(d) |
||
|
|
|
|
|
|
|
|
|
(e) |
||
|
|
|
|
|
|
|
|
|
(f) |
||
|
|
|
|
|
|
|
|
|
(g) |
||
|
|
|
|
|
|
|
|
|
(h) |
||
|
|
|
|
|
|
|
4. |
Instruments Defining Rights of Security Holders |
|||
|
|
|
|
|
|
|
|
|
(a) |
See Exhibits 3(a), 3(b), 3(c), 3(d) and 3(e) for provisions of the Articles of Incorporation and Bylaws of the Company defining the rights of security holders. See Exhibits 3(f), 3(g) and 3 (h) for provisions of the Partnership Agreement of Regency Centers, L.P. defining rights of security holders. |
|
|
|
|
|
|
|
|
|
|
(b) |
||
|
|
|
|
|
|
|
|
|
|
(i) |
|
|
|
|
|
|
|
|
|
|
|
(ii) |
|
|
|
|
|
|
|
|
|
|
|
(iii) |
|
|
|
|
|
|
|
|
|
|
|
(iv) |
|
|
|
|
|
|
|
|
|
|
|
(v) |
|
|
|
|
|
|
|
133
|
|
|
|
(vi) |
|
|
|
|
|
|
|
|
|
|
|
(vi) |
|
|
|
|
|
|
|
|
|
|
(c) |
||
|
|
|
|
|
|
|
|
|
(d) |
Description of the Company’s Securities Registered under Section 12 of the Exchange Act. |
|
|
|
|
|
|
|
|
10. |
Material Contracts (~ indicates management contract or compensatory plan) |
|||
|
|
|
|
|
|
|
|
|
~(a) |
||
|
|
|
|
|
|
|
|
|
~(b) |
||
|
|
|
|
|
|
|
|
|
~(c) |
||
|
|
|
|
|
|
|
|
|
~(d) |
||
|
|
|
|
|
|
|
|
|
~(e) |
||
|
|
|
|
|
|
|
|
|
~(f) |
||
|
|
|
|
|
|
|
|
|
~(g) |
||
|
|
|
|
|
|
|
|
|
~(h) |
||
|
|
|
|
|
|
|
|
|
~(i) |
||
|
|
|
|
|
|
|
|
|
~(j) |
||
|
|
|
|
|
|
|
|
|
~(k) |
||
|
|
|
|
|
|
|
|
|
~(l) |
||
|
|
|
|
|
|
|
|
|
|
(i) |
Severance and Change of Control Agreement dated as of January 1, 2022, by and between Regency Center Corporation, Regency Centers, L.P. and Martin E. Stein, Jr. |
134
|
|
|
|
|
|
|
|
|
|
(ii) |
Severance and Change of Control Agreement dated as of January 1, 2022, by and between Regency Center Corporation, Regency Centers, L.P. and Lisa Palmer |
|
|
|
|
|
|
|
|
|
|
(iii) |
Severance and Change of Control Agreement dated as of January 1, 2022, by and between Regency Center Corporation, Regency Centers, L.P. and Michael J. Mas |
|
|
|
|
|
|
|
|
|
~(m) |
The following Severance and Change of Control Agreement dated as of January 1, 2022, among Regency Centers Corporation, Regency Centers, L.P. and the executives listed below. The Severance and Change of Control Agreements listed below are substantially identical except for the identities of the parties and the amount of severance. |
|
|
|
|
|
|
|
|
|
|
|
(i) |
|
|
|
|
|
|
|
|
|
|
|
(ii) |
|
|
|
|
|
|
|
|
|
|
(n) |
||
|
|
|
|
|
|
|
|
|
(o) |
||
|
|
|
|
|
|
|
|
|
|
(i) |
|
|
|
|
|
|
|
|
19. |
||||
|
|
|
|||
|
21. |
||||
|
|
|
|
|
|
|
22. |
||||
|
|
|
|
|
|
|
23. |
Consent of Independent Accountants |
|||
|
|
|
|
|
|
|
|
23.1 |
Consent of KPMG LLP for Regency Centers Corporation and Regency Centers, L.P. |
||
|
|
|
|
|
|
|
31. |
Rule 13a-14(a)/15d-14(a) Certifications. |
|||
|
|
|
|
|
|
|
|
31.1 |
Rule 13a-14 Certification of Chief Executive Officer for Regency Centers Corporation. |
||
|
|
|
|
||
|
|
31.2 |
Rule 13a-14 Certification of Chief Financial Officer for Regency Centers Corporation. |
||
|
|
|
|
||
|
|
31.3 |
Rule 13a-14 Certification of Chief Executive Officer for Regency Centers, L.P. |
||
|
|
|
|
||
|
|
31.4 |
Rule 13a-14 Certification of Chief Financial Officer for Regency Centers, L.P. |
||
|
|
|
|
||
|
32. |
Section 1350 Certifications. |
|||
135
The certifications in this exhibit 32 are being furnished solely to accompany this Report pursuant to 18 U.S.C. § 1350, and are not being filed for purposes of Section 18 of the Exchange Act, or otherwise subject to the liability of that section and shall not be deemed to be incorporated by reference into any of the Company's filings under the Securities Act or the Exchange Act, whether made before or after the date hereof, except to the extent that the Company specifically incorporates it by reference.
|
|
32.1 |
18 U.S.C. § 1350 Certification of Chief Executive Officer for Regency Centers Corporation. |
|
|
|
|
|
|
32.2 |
18 U.S.C. § 1350 Certification of Chief Financial Officer for Regency Centers Corporation. |
|
|
|
|
|
|
32.3 |
18 U.S.C. § 1350 Certification of Chief Executive Officer for Regency Centers, L.P. |
|
|
|
|
|
|
32.4 |
18 U.S.C. § 1350 Certification of Chief Financial Officer for Regency Centers, L.P. |
|
|
|
|
|
97. |
Restatement Clawback Policy of Regency Centers Corporation, effective as of November 15, 2023. |
|
|
|
|
|
|
101. |
Interactive Data Files |
|
|
|
|
|
|
|
101.INS+ |
Inline XBRL Instance Document - the instance document does not appear in the Interactive Data File because its XBRL tags are embedded within the Inline XBRL document |
|
|
|
|
|
|
101.SCH+ |
Inline XBRL Taxonomy Extension Schema with embedded linkbases document |
|
|
|
|
|
104. |
Cover Page Interactive Data File (formatted as inline XBRL and contained in Exhibit 101) |
|
+ Submitted electronically with this Annual Report
Item 16. Form 10-K Summary
None.
136
SIGNA TURES
Pursuant to the requirements of Section 13 or 15(d) of the Securities Exchange Act of 1934, the registrant has duly caused this report to be signed on its behalf by the undersigned, thereunto duly authorized.
|
|
|
|||
|
|
|
|
|
|
|
February 16, 2024 |
REGENCY CENTERS CORPORATION |
|||
|
|
|
|
|
|
|
|
|
By: |
/s/ Lisa Palmer |
|
|
|
|
|
Lisa Palmer, President and Chief Executive Officer |
|
|
February 16, 2024 |
REGENCY CENTERS, L.P. |
||
|
|
|
By: |
Regency Centers Corporation, General Partner |
|
|
|
|
|
|
|
|
By: |
/s/ Lisa Palmer |
|
|
|
|
Lisa Palmer, President and Chief Executive Officer |
Pursuant to the requirements of the Securities Exchange Act of 1934, this report has been signed below by the following persons on behalf of the registrant and in the capacities and on the dates indicated.
|
February 16, 2024 |
|
/s/ Martin E. Stein, Jr. |
|
|
|
Martin E. Stein. Jr., Executive Chairman of the Board |
|
|
|
|
|
February 16, 2024 |
|
/s/ Lisa Palmer |
|
|
|
Lisa Palmer, President, Chief Executive Officer, and Director |
|
|
|
|
|
February 16, 2024 |
|
/s/ Michael J. Mas |
|
|
|
Michael J. Mas, Executive Vice President, Chief Financial Officer (Principal Financial Officer) |
|
|
|
|
|
February 16, 2024 |
|
/s/ Terah L. Devereaux |
|
|
|
Terah L. Devereaux, Senior Vice President, Chief Accounting Officer (Principal Accounting Officer) |
|
|
|
|
|
February 16, 2024 |
|
/s/ Bryce Blair |
|
|
|
Bryce Blair, Director |
|
|
|
|
|
February 16, 2024 |
|
/s/ C. Ronald Blankenship |
|
|
|
C. Ronald Blankenship, Director |
|
|
|
|
|
February 16, 2024 |
|
/s/ Kristin A. Campbell |
|
|
|
Kristin A. Campbell, Director |
|
|
|
|
|
February 16, 2024 |
|
/s/ Deirdre J. Evens |
|
|
|
Deirdre J. Evens, Director |
|
|
|
|
|
February 16, 2024 |
|
/s/ Thomas W. Furphy |
|
|
|
Thomas W. Furphy, Director |
|
|
|
|
|
February 16, 2024 |
|
/s/ Karin M. Klein |
|
|
|
Karin M. Klein, Director |
|
|
|
|
|
February 16, 2024 |
|
/s/ Peter Linneman |
|
|
|
Peter Linneman, Director |
|
|
|
|
|
February 16, 2024 |
|
/s/ David P. O'Connor |
|
|
|
David P. O'Connor, Director |
|
|
|
|
|
February 16, 2024 |
|
/s/ James H Simmons |
|
|
|
James H. Simmons, Director |
|
|
|
|
137