STURM RUGER & CO INC
10-Ks and 10-Qs
|
|
|
|
|
|
|
|
|
|
|
|
|
|
|
|
|
|
|
|
|
|
|
|
|
|
|
|
|
|
|
|
|
|
|
|
|
|
|
|
|
|
|
|
|
|
|
|
|
|
|
|
|
|
|
|
SECURITIES AND EXCHANGE COMMISSION
WASHINGTON, D.C. 20549
FORM 10-K
FOR ANNUAL AND TRANSITION REPORTS
PURSUANT TO SECTION 13 OR 15(d) THE SECURITIES EXCHANGE ACT OF 1934
(Mark One)
þ
ANNUAL REPORT PURSUANT TO SECTION 13 OR 15(d) OF THE SECURITIES EXCHANGE ACT OF 1934
For the fiscal year ended December 31, 2011
OR
o
TRANSITION REPORT PURSUANT TO SECTION 13 OR 15(d) OF THE SECURITIES EXCHANGE ACT OF 1934
For the transition period from ____________ to ___________
Commission File Number 0-4776
STURM, RUGER & COMPANY, INC.
(Exact Name of Registrant as Specified in Its Charter)
| Delaware | 06-0633559 |
|
(State or Other Jurisdiction of
Incorporation or Organization)
|
(I.R.S. Employer
Identification No.)
|
| Lacey Place, Southport, Connecticut | 06890 |
|
(Address of Principal Executive Offices)
|
(Zip Code)
|
(203) 259-7843
(Registrant’s telephone number, including area code)
Securities registered pursuant to Section 12(b) of the Act:
| Title of Each Class | Name of Each Exchange on Which Registered |
|
Common Stock, $1 par value
|
New York Stock Exchange
|
Securities registered pursuant to Section 12(g) of the Act:
None
(Title of Class)
Indicate by check mark if the registrant is a well-known seasoned issuer, as defined in Rule 405 of the Securities Act.
YES
o
NO
þ
Indicate by check mark if the registrant is not required to file reports pursuant to Section 13 or Section 15(d) of the Act.
YES
o
NO
þ
Indicate by check mark whether the registrant (1) has filed all reports required to be filed by Section 13 or 15(d) of the Securities Exchange Act of 1934 during the preceding 12 months (or for such shorter period that the registrant was required to file such reports), and (2) has been subject to such filing requirements for the past 90 days.
YES
þ
NO
o
Indicate by check mark if disclosure of delinquent filers pursuant to Item 405 of Regulation S-K is not contained herein, and will not be contained, to the best of registrant's knowledge, in definitive proxy or information statements incorporated by reference in Part III of this Form 10-K or any amendment to this Form 10-K
þ
.
Indicate by check mark whether the registrant is a large accelerated filer, an accelerated filer, or a non-accelerated filer. See definition of “accelerated filer and large accelerated filer” in Rule 12b-2 of the Exchange Act. Large accelerated filer
o
Accelerated filer
þ
Non-accelerated filer
o
Smaller reporting company
o
.
Indicate by check mark whether the registrant is a shell company (as defined in Rule 12b-2 of the Exchange Act).
YES
o
NO
þ
Indicate by check mark whether the registrant has submitted electronically and posted on its corporate Web site, if any, every Interactive Data File required to be submitted and posted pursuant to Rule 405 of Regulation S-T (§ 232.405 of this chapter) during the preceding 12 months (or for such shorter period that the registrant was required to submit and post such files).
YES
þ
NO
o
The aggregate market value of the voting and non-voting common equity held by non-affiliates of the registrant computed by reference to the price at which the common equity was last sold, or the average bid and asked price of such common equity, as of June 30, 2011:
Common Stock, $1 par value - $405,197,000
The number of shares outstanding of the registrant's common stock as of February 15, 2012:
Common Stock, $1 par value –19,117,900 shares
DOCUMENTS INCORPORATED BY REFERENCE.
Portions of the registrant’s Proxy Statement relating to the 2012 Annual Meeting of Stockholders to be held May 2, 2012 are incorporated by reference into Part III (Items 10 through 14) of this Report.
1
TABLE OF CONTENTS
|
PART I
|
||
|
Item 1.
|
Business
|
4
|
|
Item 1A.
|
Risk Factors
|
10
|
|
Item 1B.
|
Unresolved Staff Comments
|
12
|
|
Item 2.
|
Properties
|
12
|
|
Item 3.
|
Legal Proceedings
|
13
|
|
Item 4.
|
Mine Safety Disclosures
|
13
|
|
PART II
|
||
|
Item 5.
|
Market for Registrant’s Common Equity, Related Stockholder Matters and Issuer
Purchases of Equity Securities
|
13
|
|
Item 6.
|
Selected Financial Data
|
17
|
|
Item 7.
|
Management’s Discussion and Analysis of Financial Condition and Results of Operations
|
18
|
|
Item 7A.
|
Quantitative and Qualitative Disclosures About Market Risk
|
40
|
|
Item 8.
|
Financial Statements and Supplementary Data
|
41
|
|
Item 9.
|
Changes in and Disagreements With Accountants on Accounting and Financial Disclosure
|
69
|
|
Item 9A.
|
Controls and Procedures
|
69
|
|
Item 9B.
|
Other Information
|
70
|
|
PART III
|
||
|
Item 10.
|
Directors, Executive Officers and Corporate Governance
|
71
|
|
Item 11.
|
Executive Compensation
|
71
|
|
Item 12.
|
Security Ownership of Certain Beneficial Owners and Management and Related Stockholder
Matters
|
71
|
|
Item 13.
|
Certain Relationships and Related Transactions, and Director Independence
|
71
|
|
Item 14.
|
Principal Accountant Fees and Services
|
71
|
2
|
PART IV
|
||
|
Item 15.
|
Exhibits and Financial Statement Schedules
|
72
|
|
Signature
|
|
77
|
|
Exhibit Index
|
|
78
|
|
Financial Statement Schedule
|
83
|
|
|
Exhibits
|
|
|
EXPLANATORY NOTE:
In this Annual Report on Form 10-K, Sturm, Ruger & Company, Inc. (the “Company”) makes forward-looking statements and projections concerning future expectations. Such statements are based on current expectations and are subject to certain qualifying risks and uncertainties, such as market demand, sales levels of firearms, anticipated castings sales and earnings, the need for external financing for operations or capital expenditures, the results of pending litigation against the Company, the impact of future firearms control and environmental legislation, and accounting estimates, any one or more of which could cause actual results to differ materially from those projected.
Words such as “expect,” “believe,”
“anticipate,” “intend,” “estimate,” “will,” “should,” “could” and other words and terms of similar meaning, typically identify such forward-looking statements.
Readers are cautioned not to place undue reliance on these forward-looking statements, which speak only as of the date made. The Company undertakes no obligation to publish revised forward-looking statements to reflect events or circumstances after the date such forward-looking statements are made or to reflect the occurrence of subsequent unanticipated events.
3
Company Overview
Sturm, Ruger & Company, Inc. (the “Company”) is principally engaged in the design, manufacture, and sale of firearms to domestic customers. Approximately 99% of the Company’s total sales for the year ended December 31, 2011 were from the firearms segment, and approximately 1% was from investment castings. Export sales represent approximately 5% of firearms sales. The Company’s design and manufacturing operations are located in the United States and almost all product content is domestic.
The Company has been in business since 1949 and was incorporated in its present form under the laws of Delaware in 1969. The Company offers products in four industry product categories – rifles, shotguns, pistols, and revolvers. The Company’s firearms are sold through independent wholesale distributors, principally to the commercial sporting market.
The Company manufactures and sells investment castings made from steel alloys for both outside customers and internal use in the firearms segment. Investment castings sold to outside customers, either directly to or through manufacturers’ representatives, represented approximately 1% of the Company’s total sales for the year ended December 31, 2011.
For the years ended December 31, 2011, 2010, and 2009, net sales attributable to the Company's firearms operations were approximately $324.2 million, $251.7 million and $266.6 million or approximately 99%, 99%, and 98%, respectively, of total net sales. The balance of the Company's net sales for the aforementioned periods was attributable to its investment castings operations.
Firearms Products
The Company presently manufactures firearm products, under the “Ruger” name and trademark, in the following industry categories:
|
Rifles
|
Revolvers
|
|||
|
●
|
Single-shot
|
●
|
Single-action
|
|
|
●
|
Autoloading
|
●
|
Double-action
|
|
|
●
|
Bolt-action
|
|||
|
●
|
Modern sporting
|
|||
Pistols
|
●
|
Rimfire autoloading
|
|
●
|
Centerfire autoloading
|
Most firearms are available in several models based upon caliber, finish, barrel length, and other features.
Rifles
A rifle is a long gun with spiral grooves cut into the interior of the barrel to give the bullet a stabilizing spin after it leaves the barrel. Sales of rifles by the Company accounted for approximately $83.4 million, $63.5 million, and $102.2 million of revenues for the years 2011, 2010, and 2009, respectively.
4
Shotguns
A shotgun is a long gun with a smooth barrel interior which fires lead or steel pellets. Sales of shotguns by the Company were insignificant in the past three years.
Pistols
A pistol is a handgun in which the ammunition chamber is an integral part of the barrel and which typically is fed ammunition from a magazine contained in the grip. Sales of pistols by the Company accounted for approximately $150.0 million, $108.1 million, and $87.5 million of revenues for the years 2011, 2010, and 2009, respectively.
Revolvers
A revolver is a handgun that has a cylinder that holds the ammunition in a series of chambers which are successively aligned with the barrel of the gun during each firing cycle. There are two general types of revolvers, single-action and double-action. To fire a single-action revolver, the hammer is pulled back to cock the gun and align the cylinder before the trigger is pulled. To fire a double-action revolver, a single trigger pull advances the cylinder and cocks and releases the hammer. Sales of revolvers by the Company accounted for approximately $69.9 million, $67.1 million, and $58.3 million of revenues for the years 2011, 2010, and 2009, respectively.
Accessories
The Company also manufactures and sells accessories and replacement parts for its firearms. These sales accounted for approximately $20.2 million, $11.5 million, and $17.4 million of revenues for the years 2011, 2010 and 2009, respectively.
Investment Casting Products
Net sales attributable to the Company’s investment casting operations (excluding intercompany transactions) accounted for approximately $4.6 million, $3.5 million, and $4.4 million, or approximately 1%, 1%, and 2% of revenues for 2011, 2010, and 2009, respectively.
Manufacturing
Firearms
The Company produces one model of pistol and all of its rifles, shotguns, and revolvers at the Newport, New Hampshire facility. All other pistols are produced at the Prescott, Arizona facility.
Many of the basic metal component parts of the firearms manufactured by the Company are produced by the Company's castings facility through a process known as precision investment casting. See "Manufacturing-Investment Castings" for a description of the investment casting process. The Company initiated the use of this process in the production of component parts for firearms in 1953. The Company believes that the investment casting process provides greater design flexibility and results in component parts which are generally close to their ultimate shape and, therefore, require less machining than processes requiring machining a solid billet of metal to obtain a part. Through the use of investment castings, the Company endeavors to produce durable and less costly component parts for its
firearms.
5
All assembly, inspection, and testing of firearms manufactured by the Company are performed at the Company's manufacturing facilities. Every firearm, including every chamber of every revolver manufactured by the Company, is test-fired prior to shipment.
Investment Castings
To produce a product by the investment casting method, a wax model of the part is created and coated (“invested”) with several layers of ceramic material. The shell is then heated to melt the interior wax, which is poured off, leaving a hollow mold. To cast the desired part, molten metal is poured into the mold and allowed to cool and solidify. The mold is then broken off to reveal a near net shape cast metal part.
Marketing and Distribution
Firearms
The Company's firearms are primarily marketed through a network of selected, federally licensed, independent wholesale distributors who purchase the products directly from the Company. They resell to federally licensed, independent retail firearms dealers who in turn resell to legally authorized end users. All retail purchasers are subject to a point-of-sale background check by law enforcement. These end users include sportsmen, hunters, people interested in self-defense, law enforcement and other governmental organizations, and gun collectors. Each distributor carries the entire line of firearms manufactured by the Company for the commercial market. Currently, 14 distributors service the domestic commercial market, with an additional 20 distributors servicing the domestic law enforcement
market and two distributors servicing the Canadian market.
In 2011, the Company’s largest customers and the percent of total sales they represented were as follows: Jerry’s/Ellett Brothers-15%; Davidson’s-14%; Sports South-12%; and Lipsey’s-12%. In 2010, the Company’s largest customers and the percent of total sales they represented were as follows: Jerry’s/Ellett Brothers-16%; Davidson’s-12%; Lipsey’s-11%; and Sports South-11%. In 2009, the Company’s largest customers and the percent of total sales they represented were as follows: Jerry’s/Ellett Brothers-16%; Davidson’s-11%, Lipsey’s-11%; Sports South-11% and Big Rock-10%.
The Company employs nine employees and one independent contractor who service these distributors and call on retailers and law enforcement agencies. Because the ultimate demand for the Company's firearms comes from end users rather than from the independent wholesale distributors, the Company believes that the loss of any distributor would not have a material, long-term adverse effect on the Company, but may have a material adverse effect on the Company’s financial results for a particular period. The Company considers its relationships with its distributors to be satisfactory.
The Company also exports its firearms through a network of selected commercial distributors and directly to certain foreign customers, consisting primarily of law enforcement agencies and foreign governments. Foreign sales were less than 6% of the Company's consolidated net sales for each of the past three fiscal years.
As of February 1, 2012, the order backlog was approximately $
138
million. As of February 1, 2011, order backlog was approximately $59 million.
The Company does not consider its overall firearms business to be predictably seasonal; however, orders of many models of firearms from the distributors tend to be stronger in the first quarter of the year and weaker in the third quarter of the year. This is due in part to the timing of the distributor show season, which occurs during the first quarter.
6
Investment Castings
The investment castings segment provides castings for the Company’s firearms segment. In addition, the investment castings segment produces various products for a number of customers in a variety of industries, including approximately 20 firearms and firearms component manufacturers.
Competition
Firearms
Competition in the firearms industry is intense and comes from both foreign and domestic manufacturers. While some of these competitors concentrate on a single industry product category such as rifles or pistols, several competitors manufacture products in the same four industry categories as the Company (rifles, shotguns, pistols, and revolvers). Some of these competitors are subsidiaries of larger corporations than the Company with substantially greater financial resources than the Company, which could affect the Company’s ability to compete. The principal methods of competition in the industry are product innovation, quality, availability, and price. The Company believes that it can compete effectively with all of its present competitors.
Investment Castings
There are a large number of investment castings manufacturers, both domestic and foreign, with which the Company competes. Competition varies based on the type of investment castings products and the end use of the product (commercial, sporting goods, or military). Companies offering alternative methods of manufacturing such as metal injection molding (MIM), wire electric discharge machining (EDM) and advancements in computer numeric controlled (CNC) machining also compete the Company’s investment castings segment. Many of these competitors are larger corporations than the Company with substantially greater financial resources than the Company, which could affect the Company’s ability to compete with these competitors. The principal methods of competition in the industry are
quality, price, and production lead time.
Employees
As of February 1, 2012, the Company employed approximately 1,230 full-time employees of which approximately 49% had at least ten years of service with the Company. The Company uses temporary employees to supplement its workforce. As of February 1, 2012, there were approximately 310 temporary employees.
None of the Company's employees are subject to a collective bargaining agreement.
Research and Development
In 2011, 2010, and 2009, the Company spent approximately $4.0 million, $3.2 million, and $2.0 million, respectively, on research activities relating to the development of new products and the improvement of existing products. As of February 1, 2012, the Company had approximately 70 employees whose primary responsibilities were research and development activities.
7
Patents and Trademarks
The Company owns various United States and foreign patents and trademarks which have been secured over a period of years and which expire at various times. It is the policy of the Company to apply for patents and trademarks whenever new products or processes deemed commercially valuable are developed or marketed by the Company. However, none of these patents and trademarks are considered to be fundamental to any important product or manufacturing process of the Company and, although the Company deems its patents and trademarks to be of value, it does not consider its business materially dependent on patent or trademark protection.
Environmental Matters
The Company is committed to achieving high standards of environmental quality and product safety, and strives to provide a safe and healthy workplace for its employees and others in the communities in which it operates. The Company has programs in place that monitor compliance with various environmental regulations. However, in the normal course of its manufacturing operations the Company is subject to governmental proceedings and orders pertaining to waste disposal, air emissions, and water discharges into the environment. These regulations are integrated into the Company’s manufacturing, assembly, and testing processes. The Company believes that it is generally in compliance with applicable environmental regulations and that the outcome of any environmental proceedings and orders will not have
a material adverse effect on the financial position of the Company, but could have a material adverse effect on the financial results for a particular period.
Executive Officers of the Company
Set forth below are the names, ages, and positions of the executive officers of the Company. Officers serve at the discretion of the Board of Directors of the Company.
|
Name
|
Age
|
Position With Company
|
|
Michael O. Fifer
|
54
|
President and Chief Executive Officer
|
|
Thomas A. Dineen
|
43
|
Vice President, Treasurer and Chief Financial Officer
|
|
Christopher J. Killoy
|
53
|
Vice President of Sales and Marketing
|
|
Mark T. Lang
|
55
|
Group Vice President
|
|
Thomas P. Sullivan
|
51
|
Vice President of Newport Operations
|
|
Kevin B. Reid, Sr.
|
51
|
Vice President and General Counsel
|
|
Steven M. Maynard
|
57
|
Vice President of Lean Business Development
|
|
Leslie M. Gasper
|
58
|
Corporate Secretary
|
Michael O. Fifer joined the Company as Chief Executive Officer on September 25, 2006, and was named to the Board of Directors on October 19, 2006. Mr. Fifer was named President on April 23, 2008.
8
Thomas A. Dineen became Vice President on May 24, 2006. Previously he served as Treasurer and Chief Financial Officer since May 6, 2003 and had been Assistant Controller since 2001. Prior to that, Mr. Dineen had served as Manager, Corporate Accounting since 1997.
Christopher J. Killoy rejoined the Company as Vice President of Sales and Marketing on November 27, 2006. Mr. Killoy originally joined the Company in 2003 as Executive Director of Sales and Marketing, and subsequently served as Vice President of Sales and Marketing from November 1, 2004 to January 25, 2005.
Mark T. Lang joined the Company as Group Vice President on February 18, 2008. Mr. Lang is responsible for management of the Prescott Firearms Division and the Company’s acquisition efforts. Prior to joining the Company, Mr. Lang was President of the Custom Products Business at Mueller Industries, Inc. Prior to joining Mueller, Mr. Lang was the Vice President of Operations for the Automotive Division of Thomas and Betts, Inc.
Thomas P. Sullivan joined the Company as Vice President of Newport Operations for the Newport, New Hampshire Firearms and Pine Tree Castings divisions on August 14, 2006.
Kevin B. Reid, Sr. became Vice President and General Counsel on April 23, 2008. Previously he served as the Company’s Director of Marketing from June 4, 2007. Mr. Reid joined the Company in July 2001 as an Assistant General Counsel.
Steven M. Maynard joined the Company as Vice President of Lean Business Development on April 24, 2007. Prior to joining the Company, Mr. Maynard served as Vice President of Engineering and CIO at the Wiremold Company.
Leslie M. Gasper has been Secretary of the Company since 1994. Prior to that, Ms. Gasper was the Administrator of the Company’s pension plans.
Where You Can Find More Information
The Company is subject to the informational requirements of the Securities and Exchange Act of 1934, as amended (the "Exchange Act"), and accordingly files its Annual Report on Form 10-K, Quarterly Reports on Form 10-Q, Definitive Proxy Statements, Current Reports on Form 8-K, and other information with the Securities and Exchange Commission (the "SEC"). The public may read and copy any materials filed with the SEC at the SEC's Public Reference Room at 100 F Street NE, Washington, DC 20549. Please call the SEC at (800) SEC-0330 for further information on the Public Reference Room. As an electronic filer, the Company's public filings are maintained on the SEC's Internet site that contains reports, proxy and information statements, and other information regarding issuers that file electronically with the
SEC. The address of that website is http://www.sec.gov.
The Company files its Annual Report on Form 10-K, Quarterly Reports on Form 10-Q, Definitive Proxy Statements, Current Reports on Form 8-K and amendments to those reports filed or furnished pursuant to Section 13(a) or 15(d) of the Exchange Act accessible free of charge through the Company's Internet site after the Company has electronically filed such material with, or furnished it to, the SEC. The address of that website is http://www.ruger.com. However, such reports may not be accessible through the Company's website as promptly as they are accessible on the SEC’s website.
Additionally, the Company’s corporate governance materials, including its Corporate Governance Guidelines, the charters of the Audit, Compensation, and Nominating and Corporate Governance
9
committees, and the Code of Business Conduct and Ethics may also be found under the “Stockholder Relations” section of the Company’s Internet site at http://www.ruger.com. A copy of the foregoing corporate governance materials is available upon written request to the Corporate Secretary at Sturm, Ruger & Company, Inc., Lacey Place, Southport, Connecticut 06890.
The Company’s operations could be affected by various risks, many of which are beyond its control. Based on current information, the Company believes that the following identifies the most significant risk factors that could adversely affect its business. Past financial performance may not be a reliable indicator of future performance and historical trends should not be used to anticipate results or trends in future periods.
In evaluating the Company’s business, the following risk factors, as well as other information in this report, should be carefully considered.
Changes in government policies and firearms legislation could adversely affect the Company’s financial results.
The sale, purchase, ownership, and use of firearms are subject to thousands of federal, state and local governmental regulations. The basic federal laws are the National Firearms Act, the Federal Firearms Act, and the Gun Control Act of 1968. These laws generally prohibit the private ownership of fully automatic weapons and place certain restrictions on the interstate sale of firearms unless certain licenses are obtained. The Company does not manufacture fully automatic weapons, other than for the law enforcement market, and holds all necessary licenses under these federal laws. From time to time, congressional committees review proposed bills relating to the regulation of firearms. These proposed bills generally seek either to restrict or ban the sale and, in some cases, the
ownership of various types of firearms. Several states currently have laws in effect similar to the aforementioned legislation.
Until November 30, 1998, the “Brady Law” mandated a nationwide five-day waiting period and background check prior to the purchase of a handgun. As of November 30, 1998, the National Instant Check System, which applies to both handguns and long guns, replaced the five-day waiting period. The Company believes that the “Brady Law” and the National Instant Check System have not had a significant effect on the Company’s sales of firearms, nor does it anticipate any significant impact on sales in the future. On September 13, 1994, the “Violent Crime Control and Law Enforcement Act” banned so-called “assault weapons.” All the Company’s then-manufactured commercially-sold long guns were exempted by name as “legitimate sporting
firearms.” This ban expired by operation of law on September 13, 2004. The Company remains strongly opposed to laws which would restrict the rights of law-abiding citizens to lawfully acquire firearms. The Company believes that the lawful private ownership of firearms is guaranteed by the Second Amendment to the United States Constitution and that the widespread private ownership of firearms in the United States will continue. However, there can be no assurance that the regulation of firearms will not become more restrictive in the future and that any such restriction would not have a material adverse effect on the business of the Company.
The Company’s results of operations could be adversely affected by litigation.
The Company faces risks arising from various asserted and unasserted litigation matters. These matters include, but are not limited to, assertions of allegedly defective product design or manufacture, purported class actions against firearms manufacturers, generally seeking relief such as medical expense reimbursement, property damages and punitive damages arising from accidents involving firearms or the criminal misuse of firearms, and those lawsuits filed on behalf of municipalities alleging harm to the
10
general public. Various factors or developments can lead to changes in current estimates of liabilities such as final adverse judgment, significant settlement or changes in applicable law. A future adverse outcome in any one or more of these matters could have a material adverse effect on the Company’s financial results. See Note 16 to the financial statements which are included in this Form 10-K.
The Company must comply with various laws and regulations pertaining to workplace safety, environmental matters, and firearms manufacture.
In the normal course of its manufacturing operations, the Company is subject to numerous federal, state and local laws and governmental regulations and related state laws, and governmental proceedings and orders. These laws and regulations pertain to workplace safety, firearms serial number tracking and control, waste disposal, air emissions and water discharges into the environment. Noncompliance with any one or more of these laws and regulations could have a material adverse impact on the Company.
Business disruptions at one of the Company’s manufacturing facilities could adversely affect the Company’s financial results.
The Newport, New Hampshire and Prescott, Arizona facilities are critical to the Company’s success. These facilities house the Company’s principal production, research, development, engineering, design, and shipping operations. Any event that causes a disruption of the operation of either of these facilities for even a relatively short period of time could have a material adverse effect on the Company’s ability to produce and ship products and to provide service to its customers.
Price increases for raw materials could adversely affect the Company’s financial results.
Third parties supply the Company with various raw materials for its firearms and castings, such as fabricated steel components, walnut, birch, beech, maple and laminated lumber for rifle and shotgun stocks, wax, ceramic material, metal alloys, various synthetic products and other component parts. There is a limited supply of these materials in the marketplace at any given time, which can cause the purchase prices to vary based upon numerous market factors. The Company believes that it has adequate quantities of raw materials in inventory to provide ample time to locate and obtain additional items at then-current market cost without interruption of its manufacturing operations. However, if market conditions result in a significant prolonged inflation of certain prices or if adequate quantities of raw
materials can not be obtained, the Company’s manufacturing processes could be interrupted and the Company’s financial condition or results of operations could be materially adversely affected.
The implementation of a new enterprise resource planning (“ERP”) system could cause disruption to the Company’s operations.
The Company is transitioning to a new enterprise resource planning ERP system and has converted one of its manufacturing facilities and a portion of its support functions, including sales and finance during 2011. The Company expects to have the new system fully implemented in the second half of 2012. However, if the implementation of the ERP does not proceed as expected, it could impede the Company’s ability to manufacture products, order materials, generate management reports, invoice customers, and comply with laws and regulations. Any of these types of disruptions could have a material adverse effect on the financial position and the financial results of the Company.
Retention of key management is critical to the success of the Company
.
We rely on the management and leadership skills of our senior management team. Our senior executives are not bound by employment agreements. The loss of the services of one or more of our senior executive or other key personnel could have a significant adverse impact on our business.
11
The healthcare legislation passed in 2010 could have a material adverse impact on the Company.
Certain provisions of the recently passed federal healthcare legislation, in particular the “unlimited lifetime benefit” which eliminated the practice of capping the amount of medical benefits available to an individual, could have a material adverse effect on the Company’s financial position. The Company self insures the cost of the medical benefits for its employees up to an annual and lifetime maximum per individual. It supplements this self-insurance with “stop loss” insurance for costs incurred above these maximum thresholds. In the past, the medical benefit costs for several employees of the Company have exceeded this maximum each year, in some cases significantly. It is the Company’s expectation that if it
is forced to provide an “unlimited lifetime benefit” its medical costs would likely increase significantly which would have a material adverse effect on its financial condition.
None
The Company’s manufacturing operations are carried out at two facilities. The following table sets forth certain information regarding each of these facilities:
|
Approximate
Aggregate Usable
Square Feet
|
Status
|
Segment
|
||||
|
Newport, New Hampshire
|
350,000
|
Owned
|
Firearms/Castings
|
|||
|
Prescott, Arizona
|
230,000
|
Leased
|
Firearms
|
Each facility contains enclosed ranges for testing firearms and also contains modern tool room facilities. The lease of the Prescott facility provides for rental payments, which are approximately equivalent to estimated rates for real property taxes.
The Company has four other facilities that were not used in its manufacturing operations in 2011:
|
Approximate
Aggregate Usable
Square Feet
|
Status
|
Segment
|
||||
|
Southport, Connecticut (Station Street property)
|
5,000
|
Owned
|
Not Utilized
|
|||
|
Southport, Connecticut
(Lacey Place property)
|
25,000
|
Owned
|
Corporate
|
|||
| Newport, New Hampshire (Dorr Woolen Building) | 45,000 | Owned |
Firearms
|
|||
|
Enfield, Connecticut
|
10,000
|
Leased
|
Firearms
|
|||
There are no mortgages or any other major encumbrance on any of the real estate owned by the Company.
The Company’s principal executive offices are located in Southport, Connecticut. The Company believes that its existing facilities are suitable and adequate for its present purposes.
12
The nature of the legal proceedings against the Company is discussed at Note 16 to the financial statements, which are included in this Form 10-K.
The Company has reported all cases instituted against it through October 1, 2011, and the results of those cases, where terminated, to the SEC on its previous Form 10-Q and 10-K reports, to which reference is hereby made.
During the three months ending December 31, 2011, no cases were formally instituted against the Company nor were any previously reported cases settled.
|
ITEM 5—
|
MARKET FOR REGISTRANT'S COMMON EQUITY, RELATED STOCKHOLDER MATTERS AND ISSUER PURCHASES OF EQUITY SECURITIES
|
The Company’s Common Stock is traded on the New York Stock Exchange under the symbol “RGR.” At February 1, 2012, the Company had 1,866 stockholders of record.
The following table sets forth, for the periods indicated, the high and low sales prices for the Common Stock as reported on the New York Stock Exchange and dividends paid on Common Stock.
|
High
|
Low
|
Dividends
Per Share |
||||||||||
|
2010:
|
||||||||||||
|
First Quarter
|
$ | 13.02 | $ | 10.01 | $ | 0.060 | ||||||
|
Second Quarter
|
17.97 | 12.06 | 0.093 | |||||||||
|
Third Quarter
|
16.69 | 12.66 | 0.100 | |||||||||
|
Fourth Quarter
|
16.38 | 13.02 | 0.078 | |||||||||
|
2011:
|
||||||||||||
|
First Quarter
|
$ | 23.23 | $ | 14.65 | $ | 0.050 | ||||||
|
Second Quarter
|
24.05 | 18.65 | 0.097 | |||||||||
|
Third Quarter
|
36.85 | 21.91 | 0.142 | |||||||||
|
Fourth Quarter
|
34.95 | 23.86 | 0.141 | |||||||||
13
Issuer Repurchase of Equity Securities
In the first quarter of 2011 the Company repurchased shares of its common stock. Details of these purchases are as follows:
|
Period
|
Total Number of Shares Purchased
|
Average Price Paid per Share
|
Total Number of Shares Purchased as Part of Publicly Announced Program
|
Maximum Dollar Value of Shares that May Yet Be Purchased Under the Program
|
||||||||||||
|
January 4, 2011 to January 28, 2011
|
133,400 | $ | 14.94 | 133,400 | ||||||||||||
|
Total
|
133,400 | $ | 14.94 | 133,400 | $ | 8,000,000 | ||||||||||
In 2010, the Company repurchased 412,000 shares of its common stock, representing 2.1% of the then outstanding shares, in the open market at an average price of $13.83 per share.
In 2009, the Company repurchased 2,400 shares of its common stock, representing 0.1% of the then outstanding shares, in the open market at an average price of $6.03 per share.
In 2008, the Company repurchased 1,535,000 shares of its common stock, representing 7.5% of the then outstanding shares, in the open market at an average price of $6.57 per share.
14
Comparison of Five-Year Cumulative Total Return*
Sturm, Ruger & Co., Inc., Standard & Poor’s 500, Recreation And Value Line Smith & Wesson Holding Index
(Performance Results Through 12/31/11)
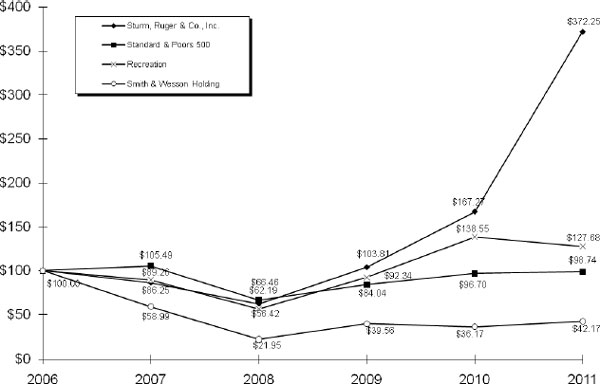
Assumes $100 invested at the close of trading 12/06 in Sturm, Ruger & Co., Inc. common stock,
Standard & Poor’s 500, Recreation, and Smith & Wesson Holding.
* Cumulative total return assumes reinvestment of dividends.
Source: Value Line Publishing LLC
|
2006
|
2007
|
2008
|
2009
|
2010
|
2011
|
|||||||||||||||||||
|
Sturm, Ruger & Co., Inc.
|
100.00 | 86.25 | 62.19 | 103.81 | 167.27 | 372.25 | ||||||||||||||||||
|
Standard & Poor’s 500
|
100.00 | 105.49 | 66.46 | 84.04 | 96.70 | 98.74 | ||||||||||||||||||
|
Recreation
|
100.00 | 89.26 | 56.42 | 92.34 | 138.55 | 127.68 | ||||||||||||||||||
|
Smith & Wesson Holding
|
100.00 | 58.99 | 21.95 | 39.56 | 36.17 | 42.17 | ||||||||||||||||||
15
Securities Authorized for Issuance Under Equity Compensation Plans
The following table provides information regarding compensation plans under which equity securities of the Company are authorized for issuance as of December 31, 2011:
|
Equity Compensation Plan Information
|
||||||
|
Plan category
|
Number of securities to be issued upon exercise of outstanding options, warrants and rights
(a)
|
Weighted-average exercise price of outstanding options, warrants and rights
(b)
*
|
Number of securities remaining available for future issuance under equity compensation plans (excluding securities reflected in column (a))
(c)
|
|||
|
Equity compensation plans approved by security holders
|
||||||
|
2001 Stock Option Plan for Non-Employee Directors
|
56,100
|
$6.15 per share
|
-
|
|||
|
2007 Stock Incentive Plan
|
272,614
|
$9.09 per share
|
1,011,000
|
|||
|
Equity compensation plans not approved by security holders
|
||||||
|
None.
|
||||||
|
Total
|
328,714
|
$8.58 per share
|
1,011,000
|
|||
|
*
|
Restricted stock units are settled in shares of common stock on a one-for-one basis. Accordingly, such units have been excluded for purposes of computing the weighted-average exercise price.
|
16
(Dollars in thousands, except per share data)
|
December 31,
|
||||||||||||||||||||
|
2011
|
2010
|
2009
|
2008
|
2007
|
||||||||||||||||
|
Net firearms sales
|
$ | 324,200 | $ | 251,680 | $ | 266,566 | $ | 174,416 | $ | 144,222 | ||||||||||
|
Net castings sales
|
4,616 | 3,526 | 4,419 | 7,067 | 12,263 | |||||||||||||||
|
Total net sales
|
328,816 | 255,206 | 270,985 | 181,483 | 156,485 | |||||||||||||||
|
Cost of products sold
|
217,058 | 171,224 | 183,380 | 138,730 | 117,186 | |||||||||||||||
|
Gross profit
|
111,758 | 83,982 | 87,605 | 42,753 | 39,299 | |||||||||||||||
|
Income before income taxes
|
63,516 | 44,149 | 44,360 | 13,978 | 16,659 | |||||||||||||||
|
Income taxes
|
23,501 | 15,894 | 16,857 | 5,312 | 6,330 | |||||||||||||||
|
Net income
|
$ | 40,015 | $ | 28,255 | $ | 27,503 | $ | 8,666 | $ | 10,329 | ||||||||||
|
Basic earnings per share
|
2.12 | 1.48 | 1.44 | 0.43 | 0.46 | |||||||||||||||
|
Diluted earnings per share
|
2.09 | 1.46 | 1.42 | 0.43 | 0.46 | |||||||||||||||
|
Cash dividends per share
|
$ | 0.43 | $ | 0.33 | $ | 0.31 | $ | 0.00 | $ | 0.00 | ||||||||||
|
December 31,
|
||||||||||||||||||||
|
2011
|
2010
|
2009
|
2008
|
2007
|
||||||||||||||||
|
Working capital
|
$ | 96,646 | $ | 71,885 | $ | 65,377 | $ | 46,250 | $ | 53,264 | ||||||||||
|
Total assets
|
206,510 | 157,761 | 141,679 | 112,760 | 101,882 | |||||||||||||||
|
Total stockholders’ equity
|
137,391 | 114,480 | 95,516 | 65,603 | 76,069 | |||||||||||||||
|
Book value per share
|
$ | 7.20 | $ | 6.08 | $ | 5.01 | $ | 3.44 | $ | 3.57 | ||||||||||
|
Return on stockholders’ equity
|
32.0 | % | 26.9 | % | 34.1 | % | 12.2 | % | 12.6 | % | ||||||||||
|
Current ratio
|
3.0 to 1
|
3.2 to 1
|
3.0 to 1
|
2.6 to 1
|
3.6 to 1
|
|||||||||||||||
|
Common shares outstanding
|
19,083,100 | 18,837,300 | 19,072,800 | 19,047,300 | 20,571,800 | |||||||||||||||
|
Number of stockholders of record
|
1,860 | 1,841 | 1,827 | 1,841 | 1,769 | |||||||||||||||
|
Number of employees
|
1,224 | 1,164 | 1,145 | 1,145 | 1,154 | |||||||||||||||
17
|
ITEM 7—
|
MANAGEMENT'S DISCUSSION AND ANALYSIS OF FINANCIAL CONDITION AND RESULTS OF OPERATIONS
|
Company Overview
Sturm, Ruger & Company, Inc. (the “Company”) is principally engaged in the design, manufacture, and sale of firearms to domestic customers. Approximately 99% of the Company’s total sales for 2011 were firearms sales, and 1% was investment castings sales. Export sales represent approximately 5% of total sales. The Company’s design and manufacturing operations are located in the United States and almost all product content is domestic. The Company’s firearms are sold through a select number of independent wholesale distributors, principally to the commercial sporting market.
The Company also manufactures investment castings made from steel alloys for internal use in its firearms and utilizes excess investment casting capacity to manufacture and sell castings to unaffiliated, third-party customers.
Orders of many models of firearms from the independent distributors tend to be stronger in the first quarter of the year and weaker in the third quarter of the year. This is due in part to the timing of the distributor show season, which occurs during the first quarter.
|
Results of Operations - 2011
|
|
Product Demand
|
The estimated sell-through of the Company’s products from distributors to retailers in 2011 increased 20% from 2010. During this period, National Instant Criminal Background Check System (“NICS”) background checks (as adjusted by the National Shooting Sports Foundation) increased 14%.
We believe the year-over-year increase in estimated sell-through from distributors to retailers from 2010 is due to the following:
| ● | The strong demand for the new products launched in 2011, including the new LC9 pistol, the SR1911 pistol, the SR40c pistol, the Gunsite Scout rifle, the Single-Ten revolver, and the SP-101 double-action revolver chambered in 22LR. New product introductions remain a strong driver of demand and represented $98.6 million or 30% of sales in 2011. The Ruger American Rifle and the SR22 pistol were introduced during the latter part of the fourth quarter and did not have a significant impact in 2011 sales, |
| ● | Strong demand for certain mature products, and |
| ● | Increased manufacturing capacity and greater product availability for certain products in strong demand. |
18
Estimated sell-through from distributors to retailers and total NICS background checks follow:
|
2011
|
2010
|
2009
|
||||||||||
|
Estimated Units Sold from Distributors to Retailers (1)
|
1,085,200 | 901,500 | 887,400 | |||||||||
|
Total Adjusted NICS Background Checks (thousands) (2)
|
10,800 | 9,400 | 9,500 | |||||||||
|
(1)
|
The estimates for each period were calculated by taking the beginning inventory at the distributors, plus shipments from the Company to distributors during the period, less the ending inventory at distributors. These estimates are only a proxy for actual market demand as they:
|
| ● |
Rely on data provided by independent distributors that are not verified by the Company,
|
|
| ● |
Do not consider potential timing issues within the distribution channel, including goods-in-transit, and
|
|
| ● | Do not consider fluctuations in inventory at retail. |
|
(2)
|
While NICS background checks are not a precise measure of retail activity, they are commonly used as a proxy for retail demand. NICS background checks are performed when the ownership of most firearms, either new or used, is transferred by a Federal Firearms Licensee. NICS background checks are also performed for permit applications, permit renewals, and other administrative reasons.
|
|
|
The adjusted NICS data presented above was derived by the National Shooting Sports Foundation (“NSSF”) by subtracting out NICS checks that are not directly related to the sale of a firearm, including checks used for concealed carry (“CCW”) permit application checks as well as checks on active CCW permit databases. While not a direct correlation to firearms sales, the NSSF-adjusted NICS data provides a more accurate picture of current market conditions than raw NICS data.
|
Orders Received and Ending Backlog
(in millions except average sales price, net of Federal Excise Tax):
|
2011
|
2010
|
2009
|
||||||||||
|
Orders Received
|
$ | 385.9 | $ | 229.4 | $ | 269.5 | ||||||
|
Average Sales Price of Orders Received
|
$ | 278 | $ | 272 | $ | 281 | ||||||
|
Ending Backlog
|
$ | 98.2 | $ | 34.9 | $ | 59.6 | ||||||
|
Average Sales Price of Ending Backlog
|
$ | 291 | $ | 326 | $ | 330 | ||||||
The increase in orders received and the increase in the ending backlog in 2011 are due primarily to strong for demand new products, including
the Ruger American Rifle and the SR22 pistol which were introduced in the latter part of the fourth quarter of 2011,
and certain mature products.
19
Production
Total unit production in 2011 increased 23% from 2010. The increased production was due in part to the Company’s previously disclosed strategy of changing production rates less frequently in 2011 in a more deliberate effort to “level load” production throughout the year.
The intention of this planned change in production volumes was to build finished goods inventory during the period when we expect lesser demand (typically the third quarter and the first half of the fourth quarter) so that we have more finished goods inventory available to ship during the period when we expect greater demand (typically the end of the fourth quarter and the first quarter). The annual output of our manufacturing plants in 2011 did increase under this plan which, in turn, allowed us to better capitalize on sales opportunities, particularly during the fourth quarter.
The Company continues to further implement lean manufacturing principles across its facilities. This ongoing process began in 2006, and includes the following current initiatives:
|
●
|
transitioning from batch production to single-piece flow manufacturing,
|
|
●
|
refining existing cells and, where practical, consolidating smaller cells into value-stream super cells,
|
|
●
|
developing pull systems and managing vendors,
|
|
●
|
increasing capacity for the products with the greatest unmet demand, and
|
|
●
|
re-engineering mature product designs for improved manufacturability.
|
The Company is transitioning to a new enterprise resource planning system and converted one of its manufacturing facilities and a portion of its support functions, including sales and finance during 2011. The Company expects to have the new system fully implemented by the end of 2012.
Annual Summary Unit Data
Firearms unit data for orders, production, shipments and backorders follows:
|
2011
|
2010
|
2009
|
||||||||||
|
Units Ordered
|
1,388,100 | 842,700 | 958,700 | |||||||||
|
Units Produced
|
1,114,700 | 906,200 | 934,300 | |||||||||
|
Units Shipped
|
1,123,100 | 903,200 | 925,800 | |||||||||
|
Average Sales Price
|
$ | 289 | $ | 279 | $ | 288 | ||||||
|
Units on Backorder
|
337,400 | 106,800 | 181,000 | |||||||||
Inventories
The Company’s finished goods inventory decreased 7,400 units during 2011 and remains significantly below what the Company believes to be optimal levels to support rapid fulfillment of distributor demand. The Company expects to replenish its finished goods inventory in future periods to levels that will better serve its customers. This replenishment could increase the FIFO value of finished goods inventory by as much as $15 million from the current level upon the attainment of the desired levels of finished goods inventory.
20
Distributor inventories of the Company’s products increased 37,900 units during 2011 and are closer to the levels the Company believes are needed to support rapid fulfillment of retailer demand. If the independent distributors attempt to increase their inventory turns, future increases to distributor inventories of the Company’s products may occur at a slower rate than 2011, or distributor inventories of the Company’s products could decrease. Distributor investments in other manufacturers’ products, some of which may not be turning as fast as the Company’s products turn, may further impede this inventory replenishment.
Inventory data follows:
|
December 31,
|
||||||||||||
|
2011
|
2010
|
2009
|
||||||||||
|
Units – Company Inventory
|
16,200 | 23,600 | 20,100 | |||||||||
|
Units – Distributor Inventory (3)
|
135,600 | 97,700 | 96,200 | |||||||||
|
Total inventory (4)
|
151,800 | 121,300 | 116,300 | |||||||||
|
(3)
|
Distributor ending inventory as provided by the independent distributors of the Company’s products. These numbers do not include goods-in-transit inventory that has been shipped from the Company but not yet received by the distributors.
|
|
(4)
|
This total does not include inventory at retailers. The Company does not have access to data on retailer inventories.
|
Year ended December 31, 2011, as compared to year ended December 31, 2010:
Net Sales
Consolidated net sales were $328.8 million in 2011. This represents an increase of $73.6 million or 28.8% from 2010 consolidated net sales of $255.2 million.
Firearms segment net sales were $324.2 million in 2011. This represents an increase of $72.5 million or 28.8% from 2010 firearm net sales of $251.7 million. Firearms unit shipments increased 24.4% in 2011.
Casting segment net sales were $4.6 million in 2011. This represents an increase of $1.1 million or 30.9% from 2010 casting sales of $3.5 million.
Cost of Products Sold and Gross Profit
Consolidated cost of products sold was $217.1 million in 2011. This represents an increase of $45.8 million or 26.8% from 2010 consolidated cost of products sold of $171.2 million.
The gross margin was 34.0% in 2011. This represents an increase from the 2010 gross margin of 32.9% as illustrated below:
21
(in thousands)
|
Year Ended December 31
|
2011
|
2010
|
||||||||||||||
|
Net sales
|
$ | 328,816 | 100.0 | % | $ | 255,206 | 100.0 | % | ||||||||
|
Cost of products sold, before LIFO, overhead and labor rate adjustments to inventory, product liability and product recall
|
214,506 | 65.2 | % | 173,198 | 67.8 | % | ||||||||||
|
LIFO expense (income)
|
122 | 0 | % | (1,039 | ) | (0.4 | )% | |||||||||
|
Overhead rate adjustments to inventory
|
700 | 0.3 | % | (618 | ) | (0.2 | )% | |||||||||
|
Labor rate adjustments to inventory
|
95 | 0 | % | (364 | ) | (0.1 | )% | |||||||||
|
Product liability
|
1,617 | 0.5 | % | 9 | 0 | % | ||||||||||
|
Product recalls
|
18 | 0 | % | 38 | 0 | % | ||||||||||
|
Total cost of products sold
|
217,058 | 66.0 | % | 171,224 | 67.1 | % | ||||||||||
|
Gross profit
|
$ | 111,758 | 34.0 | % | $ | 83,982 | 32.9 | % | ||||||||
Cost of products sold, before LIFO, overhead and labor rate adjustments to inventory, product liability, and product recall
- In 2011, cost of products sold, before LIFO, overhead and labor rate adjustments to inventory, product liability, and product recall decreased as a percentage of sales by 2.6% compared to 2010.
The main contributors to this decrease include the increased overall volume which favorably leveraged manufacturing overhead and improved productivity from continued emphasis on lean manufacturing techniques, partially offset by a modest increase in input costs.
LIFO
- Gross inventories increased by $0.2 million in 2011 and decreased by $2.2 million in 2010. In 2011, the Company recognized LIFO expense of $0.1 million which increased cost of products sold. In 2010, the Company recognized a LIFO credit of $1.0 million which decreased cost of products sold.
Overhead Rate Change
- The net impact on inventory in 2011 from the change in the overhead rates used to absorb overhead expenses into inventory was a decrease of $0.7 million, reflecting increased overhead efficiency. This decrease in inventory value resulted in a corresponding increase to cost of products sold in 2011. In 2010, the change in inventory value resulting from the change in the overhead rate used to absorb overhead expenses into inventory was an increase of $1.1 million, reflecting decreased overhead efficiency. This increase in inventory value resulted in a corresponding decrease to cost of products sold.
Labor Rate Adjustments
- In 2011, the change in inventory value resulting from the change in the labor rates used to absorb labor expenses into inventory was a decrease of $0.6 million, reflecting increased
22
labor efficiency. This decrease in inventory value resulted in a corresponding increase to cost of products sold. The net impact in 2010 from the change in the labor rates used to absorb labor expenses into inventory was an increase to inventory of $0.4 million, reflecting decreased labor efficiency. This increase in inventory value resulted in a corresponding decrease to cost of sales.
Product Liability
—
This expense includes the cost of outside legal fees, insurance, and other expenses incurred in the management and defense of product liability matters. These costs totaled $1.6 million in 2011. The negligible expense in 2010 reflects favorable experience in product liability matters that were resolved during 2010. See Note 16 to the notes to the financial statements “Contingent Liabilities” for further discussion of the Company’s product liability.
Gross Profit
—Gross profit was $111.8 million or 34.0% of sales in 2011. This is an increase of $27.8 million from 2010 gross profit of $84.0 million or 32.9% of sales.
Selling, General and Administrative
Selling, general and administrative expenses were $49.7 million in 2011, an increase of $9.5 million from 2010, and a decrease from 15.7% of sales in 2010 to 15.1% of sales in 2011. The increase in selling, general and administrative expenses is attributable to the following:
|
●
|
increased promotional and advertising expenses, including the Million Gun Challenge to benefit the National Rifle Association,
|
|
●
|
increased expenses related to the implementation of a new information technology infrastructure,
|
|
●
|
increased equity-based and incentive compensation, and
|
|
●
|
increased freight expense due to increased sales volume.
|
Other Operating Expenses (Income), net
Other operating expenses (income), net consist of the following (in thousands):
|
2011
|
2010
|
|||||||
|
Loss (gain) on sale of operating assets (a)
|
$ | (83 | ) | $ | 22 | |||
|
Frozen defined-benefit pension plan (income) expense
|
(236 | ) | 398 | |||||
|
Total other operating (income) expenses, net
|
$ | (319 | ) | $ | 420 | |||
|
(a)
|
The loss (gain) on sale of operating assets was generated primarily from the sale of used machinery and equipment.
|
Operating Income
Operating income was $62.4 million or 19% of sales in 2011. This is an increase of $19.0 million from 2010 operating income of $43.4 million or 17.0% of sales.
Royalty Income
Royalty income was $0.9 million in 2011. This represents an increase of $0.5 million from 2010 royalty income of $0.4 million. The increase is primarily attributable to increased income from licensing agreements.
23
Interest Income
Interest income was negligible in 2011 and 2010
.
Interest Expense
Interest expense was negligible in 2011 and 2010
.
Other Income, Net
Other income, net was $0.3 million in 2011, a decrease of $0.1 million from a $0.4 million in 2010. This income is attributable primarily to the sale of by-products of our manufacturing processes.
Income Taxes and Net Income
The effective income tax rate in 2011 was 37.0%, compared to 36.0% in 2010. The increase in the income tax rate reflects an increase in permanent differences.
As a result of the foregoing factors, consolidated net income was $40.0 million in 2011. This represents an increase of $11.7 million from 2010 consolidated net income of $28.3 million.
Quarterly Data
To supplement the summary annual unit data and discussion above, the same data for the last eight quarters follows:
|
2011
|
||||||||||||||||
| Q4 | Q3 | Q2 | Q1 | |||||||||||||
|
Units Ordered
|
452,300 | 168,700 | 263,500 | 503,500 | ||||||||||||
|
Units Produced
|
302,000 | 289,700 | 281,200 | 241,800 | ||||||||||||
|
Units Shipped
|
315,100 | 276,500 | 279,600 | 251,800 | ||||||||||||
|
Estimated Units Sold from
Distributors to Retailers
|
291,800 | 244,700 | 264,400 | 284,300 | ||||||||||||
|
Total Adjusted NICS Background
Checks (thousands)
|
3,500 | 2,400 | 2,200 | 2,700 | ||||||||||||
|
Average Sales Price
|
$ | 289 | $ | 286 | $ | 281 | $ | 296 | ||||||||
|
Units on Backorder
|
337,400 | 204,500 | 315,500 | 332,700 | ||||||||||||
|
Units – Company Inventory
|
16,200 | 28,800 | 15,500 | 13,700 | ||||||||||||
|
Units – Distributor Inventory (5)
|
135,600 | 112,300 | 80,500 | 65,300 | ||||||||||||
24
|
2010
|
||||||||||||||||
| Q4 | Q3 | Q2 | Q1 | |||||||||||||
|
Units Ordered
|
241,900 | 156,500 | 138,400 | 305,900 | ||||||||||||
|
Units Produced
|
218,300 | 207,100 | 238,900 | 241,900 | ||||||||||||
|
Units Shipped
|
236,200 | 204,200 | 225,500 | 237,300 | ||||||||||||
|
Estimated Units Sold from
Distributors to Retailers
|
235,200 | 198,700 | 213,400 | 254,200 | ||||||||||||
|
Total Adjusted NICS Background
Checks (thousands)
|
2,900 | 2,100 | 2,000 | 2,400 | ||||||||||||
|
Average Sales Price
|
$ | 268 | $ | 282 | $ | 282 | $ | 283 | ||||||||
|
Units on Backorder
|
106,800 | 99,800 | 147,900 | 239,900 | ||||||||||||
|
Units – Company Inventory
|
23,600 | 40,600 | 37,700 | 24,400 | ||||||||||||
|
Units – Distributor Inventory (5)
|
97,700 | 96,700 | 91,200 | 79,100 | ||||||||||||
|
(5)
|
Distributor ending inventory as provided by the independent distributors of the Company’s products.
|
(in millions except average sales price, net of Federal Excise Tax)
|
2011
|
||||||||||||||||
| Q4 | Q3 | Q2 | Q1 | |||||||||||||
|
Orders Received
|
$ | 120.3 | $ | 49.6 | $ | 81.4 | $ | 134.7 | ||||||||
|
Average Sales Price of Orders Received
|
$ | 266 | $ | 294 | $ | 309 | $ | 268 | ||||||||
|
Ending Backlog
|
$ | 98.2 | $ | 69.8 | $ | 97.4 | $ | 92.9 | ||||||||
|
Average Sales Price of Ending Backlog
|
$ | 291 | $ | 341 | $ | 309 | $ | 279 | ||||||||
|
2010
|
||||||||||||||||
| Q4 | Q3 | Q2 | Q1 | |||||||||||||
|
Orders Received
|
$ | 63.3 | $ | 45.6 | $ | 38.7 | $ | 81.8 | ||||||||
|
Average Sales Price of Orders Received
|
$ | 262 | $ | 291 | $ | 279 | $ | 270 | ||||||||
|
Ending Backlog
|
$ | 34.9 | $ | 34.1 | $ | 44.9 | $ | 71.8 | ||||||||
|
Average Sales Price of Ending Backlog
|
$ | 326 | $ | 342 | $ | 304 | $ | 299 | ||||||||
25
Fourth Quarter Gross Profit Analysis
The gross margin for the fourth quarter of 2011 and 2010 was 32.4% and 32.0%, respectively. Details of the gross profit are illustrated below:
(in thousands)
|
Three Months Ended December 31
|
2011
|
2010
|
||||||||||||||
|
Net sales
|
$ | 93,241 | 100.0 | % | $ | 64,138 | 100.0 | % | ||||||||
|
Cost of products sold, before LIFO, overhead and labor rate adjustments to inventory, product liability and product recall
|
62,528 | 67.1 | % | 45,401 | 70.8 | % | ||||||||||
|
LIFO expense (income)
|
374 | 0.4 | % | (1,264 | ) | (2.0 | )% | |||||||||
|
Overhead rate adjustments to inventory
|
(141 | ) | (0.1 | )% | (584 | ) | (0.9 | )% | ||||||||
|
Labor rate adjustments to inventory
|
(189 | ) | (0.2 | )% | (98 | ) | (0.1 | )% | ||||||||
|
Product liability
|
493 | 0.4 | % | 150 | 0.2 | % | ||||||||||
|
Product recalls
|
4 | 0 | % | 6 | 0.0 | % | ||||||||||
|
Total cost of products sold
|
63,069 | 67.6 | % | 43,611 | 68.0 | % | ||||||||||
|
Gross profit
|
$ | 30,172 | 32.4 | % | $ | 20,527 | 32.0 | % | ||||||||
Note: For a discussion of the captions in the above table, please see the “Cost of Products Sold and Gross Profit” discussion above.
26
Results of Operations - 2010
Year ended December 31, 2010, as compared to year ended December 31, 2009:
Annual Summary Unit Data
Firearms unit data for orders, production, shipments and ending inventory, and castings setups (a measure of foundry production) are as follows:
|
2010
|
2009
|
2008
|
||||||||||
|
Units Ordered
|
842,700 | 958,700 | 776,400 | |||||||||
|
Units Produced
|
906,200 | 934,300 | 600,600 | |||||||||
|
Units Shipped
|
903,200 | 925,800 | 626,500 | |||||||||
|
Average Sales Price
|
$ | 279 | $ | 288 | $ | 278 | ||||||
|
Units on Backorder
|
106,800 | 181,000 | 175,900 | |||||||||
|
Units – Company Inventory
|
23,600 | 20,100 | 12,400 | |||||||||
|
Units – Distributor Inventory (1)
|
97,700 | 96,200 | 57,500 | |||||||||
|
Castings Setups
|
155,100 | 202,800 | 144,600 | |||||||||
Orders Received and Ending Backlog
(in millions except average sales price, net of Federal Excise Tax):
|
2010
|
2009
|
|||||||
|
Orders Received
|
$ | 229.4 | $ | 269.5 | ||||
|
Average Sales Price of Orders Received (2)
|
$ | 272 | $ | 281 | ||||
|
Ending Backlog (2)
|
$ | 34.9 | $ | 59.6 | ||||
|
Average Sales Price of Ending Backlog (2)
|
$ | 326 | $ | 330 | ||||
|
(1)
|
Distributor ending inventory as provided by the independent distributors of the Company’s products.
|
|
(2)
|
Average sales price for orders received and ending backlog is net of Federal Excise Tax of 10% for handguns and 11% for long guns.
|
27
Product Demand
The estimated sell-through of the Company’s products from distributors to retailers in 2010 increased 2% from 2009. During this period, National Instant Criminal Background Check System (“NICS”) background checks (as adjusted by the National Shooting Sports Foundation) decreased 1%.
We believe the year-over-year increase in estimated sell-through from distributors to retailers from 2009 is likely due to the following factors:
|
●
|
Increased demand for handguns,
|
|
●
|
The Company’s commitment to new product development which yielded several new product launches in 2010 which generated continued demand, and
|
|
●
|
Increased manufacturing capacity for certain products in strong demand.
|
Estimated sell-through from distributors to retailers and total NICS background checks follow:
|
2010
|
2009 |
2008
|
||||||||||
|
Estimated Units Sold from Distributors to Retailers (1)
|
901,500 | 887,400 | 631,000 | |||||||||
|
Total Adjusted NICS Background Checks (thousands) (2)
|
9,400 | 9,500 | 9,000 | |||||||||
|
(1)
|
The estimates for each period were calculated by taking the beginning inventory at the distributors, plus shipments from the Company to distributors during the period, less the ending inventory at distributors. These estimates are only a proxy for actual market demand as they:
|
|
●
|
Rely on data provided by independent distributors that are not verified by the Company,
|
|
●
|
Do not consider potential timing issues within the distribution channel, including goods-in-transit, and
|
| ● | Do not consider fluctuations in inventory at retail. |
|
(2)
|
The adjusted NICS data presented above was derived by the National Shooting Sports Foundation (“NSSF”) by subtracting out NICS purpose code permit checks used by several states such as Kentucky and Utah for concealed carry (“CCW”) permit application checks as well as checks on active CCW permit databases. While not a direct correlation to firearms sales, the NSSF adjusted NICS data provides a more accurate picture of current market conditions.
|
|
|
While NICS background checks are not a precise measure of retail activity, they are commonly used as a proxy for retail demand. NICS background checks are performed when the ownership of most firearms, either new or used, is transferred by a Federal Firearms Licensee. NICS background checks are also performed for permit applications, permit renewals, and other administrative reasons.
|
The Company launched the SR9c compact pistol, the LCR357 revolver, and the SR40 striker-fired pistol in 2010. New product introductions, including the aforementioned products, remain a strong driver of demand and represented $62.3 million or 24.8% of sales in 2010.
28
The decrease in orders received and the ending backlog in 2010 is due to the strong retail demand that began in late 2008 and resulted in large orders from distributors in 2009. The backlog was higher than normal for most of 2009.
The average sales price of orders received and ending backlog in 2010 decreased from 2009 due to significant orders in 2009 for certain higher-priced rifles, including the SR-556.
Production
After three years of increased production, the Company intentionally reduced its output in 2010 by 3% compared to 2009 while closely monitoring its finished goods inventory growth and distributor sell-through to retailers. Production of certain products was limited to rates moderately in excess of estimated retail demand for those products, to allow for only modest increased finished goods inventory levels for those products.
The Company continues to further implement lean manufacturing principles across its facilities. This ongoing process began in 2006, and includes initiatives such as the following:
|
●
|
transitioning from batch production to single-piece flow manufacturing,
|
|
●
|
refining existing cells and, where practical, consolidating smaller cells into value-stream super cells,
|
|
●
|
developing pull systems and managing vendors,
|
|
●
|
increasing capacity for the products with the greatest unmet demand, and
|
|
●
|
re-engineering mature-product designs for improved manufacturability.
|
Inventories
Finished goods unit inventory levels for the Company and distributors increased slightly in 2010, and remain below optimal levels to support rapid order fulfillment.
29
Quarterly Summary Unit Data
To supplement the summary annual unit data and discussion above, the same data for the last eight quarters follows:
|
2010
|
||||||||||||||||
| Q4 | Q3 | Q2 | Q1 | |||||||||||||
|
Units Ordered
|
241,900 | 156,500 | 138,400 | 305,900 | ||||||||||||
|
Units Produced
|
218,300 | 207,100 | 238,900 | 241,900 | ||||||||||||
|
Units Shipped
|
236,200 | 204,200 | 225,500 | 237,300 | ||||||||||||
|
Estimated Units Sold from
Distributors to Retailers
|
235,200 | 198,700 | 213,400 | 254,200 | ||||||||||||
|
Total Adjusted NICS Background
Checks (thousands)
|
2,900 | 2,100 | 2,000 | 2,400 | ||||||||||||
|
Average Sales Price
|
$ | 268 | $ | 282 | $ | 282 | $ | 283 | ||||||||
|
Units on Backorder
|
106,800 | 99,800 | 147,900 | 239,900 | ||||||||||||
|
Units – Company Inventory
|
23,600 | 40,600 | 37,700 | 24,400 | ||||||||||||
|
Units – Distributor Inventory (1)
|
97,700 | 96,700 | 91,200 | 79,100 | ||||||||||||
|
2009
|
||||||||||||||||
| Q4 | Q3 | Q2 | Q1 | |||||||||||||
|
Units Ordered (2)
|
173,000 | 80,000 | 204,700 | 501,000 | ||||||||||||
|
Units Produced
|
234,600 | 242,500 | 247,300 | 209,900 | ||||||||||||
|
Units Shipped
|
228,500 | 237,400 | 246,200 | 213,700 | ||||||||||||
|
Estimated Units Sold from
Distributors to Retailers
|
209,400 | 214,500 | 227,500 | 236,000 | ||||||||||||
|
Total Adjusted NICS Background
Checks (thousands)
|
2,700 | 2,000 | 2,100 | 2,700 | ||||||||||||
|
Average Sales Price
|
$ | 276 | $ | 295 | $ | 286 | $ | 283 | ||||||||
|
Units on Backorder (2)
|
181,000 | 240,700 | 412,300 | 458,900 | ||||||||||||
|
Units – Company Inventory
|
20,100 | 15,100 | 9,600 | 8,800 | ||||||||||||
|
Units – Distributor Inventory (1)
|
96,200 | 76,800 | 53,900 | 35,200 | ||||||||||||
30
|
(1)
|
Distributor ending inventory as provided by the independent distributors of the Company’s products.
|
|
(2)
|
During the third quarter of 2009, the Company unilaterally cancelled all of the unshipped orders for Mini-14 and Mini Thirty autoloading rifles, and asked the distributors to submit new orders that better represented their forecasted needs. The cancellation of these unshipped orders, partially offset by the submission of new orders for these products, resulted in a net reduction to the backlog of approximately 34,000 units or $20 million. Had these orders not been cancelled, the Units Ordered in the third quarter would have been approximately 114,000 units.
|
(in millions except average sales price, net of Federal Excise Tax)
|
2010
|
||||||||||||||||
| Q4 | Q3 | Q2 | Q1 | |||||||||||||
|
Orders Received
|
$ | 63.3 | $ | 45.6 | $ | 38.7 | $ | 81.8 | ||||||||
|
Average Sales Price of Orders Received(4)
|
$ | 262 | $ | 291 | $ | 279 | $ | 270 | ||||||||
|
Ending Backlog
|
$ | 34.9 | $ | 34.1 | $ | 44.9 | $ | 71.8 | ||||||||
|
Average Sales Price of Ending Backlog(4)
|
$ | 326 | $ | 342 | $ | 304 | $ | 299 | ||||||||
|
2009
|
||||||||||||||||
| Q4 | Q3 | Q2 | Q1 | |||||||||||||
|
Orders Received(3)
|
$ | 42.9 | $ | 14.1 | $ | 73.6 | $ | 138.9 | ||||||||
|
Average Sales Price of Orders Received(3)(4)
|
$ | 275 | $ | 196 | $ | 400 | $ | 308 | ||||||||
|
Ending Backlog(3)
|
$ | 59.6 | $ | 78.0 | $ | 138.0 | $ | 136.3 | ||||||||
|
Average Sales Price of Ending Backlog(3)(4)
|
$ | 330 | $ | 324 | $ | 335 | $ | 297 | ||||||||
|
(3)
|
See description in Note 2 above for information relating to Q3 2009 order cancellations. The cancellation of these orders reduced Orders Received in the third quarter of 2009 by $20 million and decreased the Average Sales Price of Orders Received by $115 per unit. Had these orders not been cancelled, the Average Sales Price of Orders Received would have been $311 per unit. The Average Sales Price of the Ending Backlog was also impacted for the same reasons.
|
|
(4)
|
Average sales price for orders received and ending backlog is net of Federal Excise Tax of 10% for handguns and 11% for long guns.
|
31
Net Sales
Consolidated net sales were $255.2 million in 2010. This represents a decrease of $15.8 million or 5.8% from 2009 consolidated net sales of $271.0 million.
Firearms segment net sales were $251.7 million in 2010. This represents a decrease of $14.9 million or 5.9% from 2009 firearm net sales of $266.6 million. Firearms unit shipments decreased 2.5% in 2010. A shift in product mix toward firearms with lower unit sales prices resulted in the relatively lower percentage decrease in unit shipments compared to the percentage decrease in sales.
Casting segment net sales were $3.5 million in 2010. This represents a decrease of $0.9 million or 20.1% from 2009 casting sales of $4.4 million.
Cost of Products Sold and Gross Profit
Consolidated cost of products sold was $171.2 million in 2010. This represents a decrease of $12.2 million or 6.6% from 2009 consolidated cost of products sold of $183.4 million.
The gross margin was 32.9% in 2010. This represents a slight increase from the 2009 gross margin of 32.3% as illustrated below:
(in thousands)
|
Year Ended December 31
|
2010
|
2009
|
||||||||||||||
|
Net sales
|
$ | 255,206 | 100.0 | % | $ | 270,985 | 100.0 | % | ||||||||
|
Cost of products sold, before LIFO, overhead and labor rate adjustments to inventory, product liability and product recall
|
173,198 | 67.8 | % | 183,540 | 67.7 | % | ||||||||||
|
LIFO expense (income)
|
(1,039 | ) | (0.4 | )% | (4,216 | ) | (1.6 | )% | ||||||||
|
Overhead rate adjustments to inventory
|
(618 | ) | (0.2 | )% | 1,324 | 0.5 | % | |||||||||
|
Labor rate adjustments to inventory
|
(364 | ) | (0.1 | )% | 436 | 0.2 | % | |||||||||
|
Product liability
|
9 | 0 | % | 1,618 | 0.6 | % | ||||||||||
|
Product recalls
|
38 | 0 | % | 678 | 0.3 | % | ||||||||||
|
Total cost of products sold
|
171,224 | 67.1 | % | 183,380 | 67.7 | % | ||||||||||
|
Gross profit
|
$ | 83,982 | 32.9 | % | $ | 87,605 | 32.3 | % | ||||||||
Cost of products sold, before LIFO, overhead and labor rate adjustments to inventory, product liability, and product recall
- In 2010, cost of products sold, before LIFO, overhead and labor rate adjustments to
32
inventory, product liability, and product recall increased as a percentage of sales by 0.1% compared to 2009.
LIFO
- Gross inventories were reduced by $2.2 million in 2010 and $8.8 million in 2009. In 2010, the Company recognized a LIFO credit resulting in decreased cost of products sold of $1.0 million. In 2009, the Company recognized a LIFO credit and decreased cost of products sold of $4.2 million.
Overhead Rate Change
- The net impact on inventory in 2010 from the change in the overhead rates used to absorb overhead expenses into inventory was an increase of $0.6 million, reflecting decreased overhead efficiency. This increase in inventory value resulted in a corresponding decrease to cost of products sold in 2010. In 2009, the change in inventory value resulting from the change in the overhead rate used to absorb overhead expenses into inventory was a decrease of $1.3 million, reflecting an improvement in overhead efficiency. This decrease in inventory value resulted in a corresponding increase to cost of products sold.
Labor Rate Adjustments
- In 2010, the change in inventory value resulting from the change in the labor rates used to absorb labor expenses into inventory was an increase of $0.4 million, reflecting decreased labor efficiency. This increase in inventory value resulted in a corresponding decrease to cost of products sold. The net impact in 2009 from the change in the labor rates used to absorb labor expenses into inventory was a decrease to inventory of $0.4 million, reflecting an improvement in labor efficiency. This decrease in inventory value resulted in a corresponding increase to cost of sales.
Product Liability
—The Company’s product liability expense was negligible in 2010, and $1.6 million in 2009. This expense includes the cost of outside legal fees, insurance, and other expenses incurred in the management and defense of product liability matters. The negligible expense in 2010 reflects favorable experience in product liability matters during the year. See Note 16 to the notes to the financial statements “Contingent Liabilities” for further discussion of the Company’s product liability.
Product Recalls
—There were no product recalls initiated in 2010 or 2009. In
2008, the Company received a small number of reports from the field that its SR9 pistols, and later, its LCP pistols, could discharge if dropped onto a hard surface. The Company began recalling SR9 pistols in April 2008 and LCP pistols in October 2008 to offer free safety retrofits. The cost of these safety retrofit programs was negligible in 2010 and $0.7 million in 2009.
Gross Profit
—Gross profit was $84.0 million or 32.9% of sales in 2010. This is a decrease of $3.6 million from 2009 gross profit of $87.6 million or 32.3% of sales.
Selling, General and Administrative
Selling, general and administrative expenses were $40.2 million in 2010. This represents a decrease of $2.0 million or 5% from 2009 selling, general and administrative expenses of $42.2 million. The decrease reflects decreased personnel-related expenses including stock-based compensation and bonuses.
33
Other Operating Expenses (Income), net
Other operating expenses (income), net consist of the following (in thousands):
|
2010
|
2009
|
|||||||
|
Loss (gain) on sale of operating assets (a)
|
$ | 22 | $ | (45 | ) | |||
|
Frozen defined-benefit pension plan expense
|
398 | 1,537 | ||||||
|
Total other operating expenses, net
|
$ | 420 | $ | 1,492 | ||||
|
(a)
|
The loss (gain) on sale of operating assets was generated primarily from the sale of used machinery and equipment.
|
Operating Income
Operating income was $43.4 million or 17.0% of sales in 2010. This is a decrease of $0.5 million from 2009 operating income of $43.9 million or 16.2% of sales.
Royalty Income
Royalty income was $0.4 million in 2010. This represents a decrease of $0.1 million from 2009 royalty income of $0.5 million. The decrease is primarily attributable to decreased income from licensing agreements.
Interest Income
Interest income was negligible in 2010, a slight decrease from 2009 interest income of $0.1 million. The decrease is attributable primarily to decreased interest rates in 2010.
Other Income (Expense), Net
Other income (expense), net was $0.4 million in 2010, an increase from a negligible amount in 2009. This income is attributable primarily to the sale of by-products of our manufacturing processes.
Income Taxes and Net Income
The effective income tax rate in 2010 was 36.0%, a decrease from the 2009 effective income tax rate of 38.0%. The decrease in the income tax rate results primarily from an increased benefit from the American Jobs Creation Act of 2004 that was effective January 1, 2010.
As a result of the foregoing factors, consolidated net income was $28.3 million in 2010. This represents an increase of $0.8 million from 2009 consolidated net income of $27.5 million.
34
Financial Condition
Liquidity
At December 31, 2011, the Company had cash, cash equivalents and short-term investments of $81.1 million. Our pre-LIFO working capital of $133.0 million, less the LIFO reserve of $37.5 million, resulted in working capital of $96.6 million and a current ratio of 3.0 to 1.
The Company would like to replenish its finished goods inventory to levels that will better serve its customers. This replenishment, which could take more than one year to accomplish, could increase the FIFO value of finished goods inventory by as much as $15 million from the current levels upon the attainment of the desired levels of finished goods inventory.
Operations
Cash provided by operating activities was $57.4 million, $32.5 million, and $46.7 million in 2011, 2010, and 2009, respectively. The increase in cash provided in 2011 compared to 2010 is attributable to increased profitability in 2011 and increased accounts payable and accrued liabilities in 2011, due in part to greater accruals for sales promotions and excise tax payments. The decrease in cash provided in 2010 compared to 2009 was attributable to a greater reduction in inventory in 2009, an increase in employee benefits and compensation in 2009, and an increase in accounts receivable in 2010.
Third parties supply the Company with various raw materials for its firearms and castings, such as fabricated steel components, walnut, birch, beech, maple and laminated lumber for rifle stocks, wax, ceramic material, metal alloys, various synthetic products and other component parts. There is a limited supply of these materials in the marketplace at any given time, which can cause the purchase prices to vary based upon numerous market factors. The Company believes that it has adequate quantities of raw materials in inventory to provide sufficient time to locate and obtain additional items at then-current market cost without interruption of its manufacturing operations. However, if market conditions result in a significant prolonged inflation of certain prices or if adequate quantities of raw materials
can not be obtained, the Company’s manufacturing processes could be interrupted and the Company’s financial condition or results of operations could be materially adversely affected.
Investing and Financing
Capital expenditures were $22.1 million, $19.4 million, and $13.8 million in 2011, 2010, and 2009, respectively. In 2012,
the Company expects to spend $20 million on capital expenditures to purchase tooling and fixtures for new product introductions, to increase production capacity, and to upgrade and modernize manufacturing equipment. The Company finances, and intends to continue to finance, all of these activities with funds provided by operations and current cash and short-term investments.
During the past several years, the Board of Directors authorized the Company to repurchase shares of its common stock. In 2011, the Company repurchased approximately 133,400 shares of its common stock under a 10b5-1 program, representing 0.7% of the then outstanding shares, in the open market at an average price of $14.94 per share. In 2010, the Company repurchased approximately 412,000 shares of its common stock under a 10b5-1 program, representing 2.1% of the then outstanding shares, in the open market at an average price of $13.83 per share. In 2009, the Company repurchased approximately 2,400 shares of its common stock under a 10b5-1 program, representing 0.01% of the then outstanding shares, in the open market at an average price of $6.03 per share. All of these purchases were made with
cash held by the Company and no debt was incurred.
At December 31, 2011, $8.0 million remained authorized for share repurchases.
35
The Company paid dividends totaling $8.2 million, $6.3 million and $5.8 million in 2011, 2010 and 2009, respectively.
On February 14, 2012, the Company’s Board of Directors authorized a dividend of 21.2¢ per share to shareholders of record on March 23, 2012. The payment of future dividends depends on many factors, including internal estimates of future performance, then-current cash and short-term investments, and the Company’s need for funds.
During the second quarter of 2011, the Company made a $969,000 minority investment in a pepper spray company for which it received a 12% interest. This investment is included in Other Assets on the balance sheet.
The Company has migrated its retirement benefits from defined-benefit pension plans to defined-contribution retirement plans, utilizing its current 401(k) plan.
In 2007, the Company amended its hourly and salaried defined-benefit pension plans so that employees no longer accrue benefits under them effective December 31, 2007. This action “froze” the benefits for all employees and prevented future hires from joining the plans, effective December 31, 2007. Currently, the Company provides supplemental discretionary contributions to substantially all employees’ individual 401(k) accounts.
Minimum cash contributions of $1.7 million were required for the defined-benefit plans for 2011. The Company contributed $2 million to the defined-benefit plans in both 2011 and 2010.
In future years, the Company may again be required to make cash contributions to the two defined-benefit pension plans. The annual contributions will be based on the amount of the unfunded plan liabilities derived from the frozen benefits and will not include liabilities for any future accrued benefits for any new or existing participants. The total amount of these future cash contributions will depend on the investment returns generated by the plans’ assets and the then-applicable discount rates used to calculate the plans’ liabilities.
The Company plans to contribute approximately $3 million in 2012, but will increase the amount of the contribution if required to do so. The intent of these contributions is to reduce the amount of time that the Company will be required to continue to operate the frozen plans. The ongoing cost of running the plans (even if frozen) is approximately $200,000 per year, which includes PBGC premiums, actuary and audit fees, and other expenses.
Based on its unencumbered assets, the Company believes it has the ability to raise substantial amounts of cash through issuance of short-term or long-term debt. The Company’s unsecured $25 million credit facility, which expires on June 15, 2013, remains unused and the Company has no debt.
Contractual Obligations
The table below summarizes the Company’s significant contractual obligations at December 31, 2011, and the effect such obligations are expected to have on the Company’s liquidity and cash flows in future periods. This table excludes amounts already recorded on the Company’s balance sheet as current liabilities at December 31, 2011.
“Purchase Obligations” as used in the below table includes all agreements to purchase goods or services that are enforceable and legally binding on the Company and that specify all significant terms, including: fixed or minimum quantities to be purchased; fixed, minimum or variable price provisions;
36
and the approximate timing of the transaction. Certain of the Company’s purchase orders or contracts for the purchase of raw materials and other goods and services that may not necessarily be enforceable or legally binding on the Company, are also included in “Purchase Obligations” in the table. Certain of the Company’s purchase orders or contracts therefore included in the table may represent authorizations to purchase rather than legally binding agreements. The Company expects to fund all of these commitments with cash flows from operations and current cash and short-terms investments.
37
|
Payment due by period (in thousands)
|
||||||||||||||||||||
|
Contractual Obligations
|
Total
|
Less than
1 year
|
1-3 years
|
3-5 years
|
More than 5 years
|
|||||||||||||||
|
Long-Term Debt Obligations
|
- | - | - | - | - | |||||||||||||||
|
Capital Lease Obligations
|
- | - | - | - | - | |||||||||||||||
|
Operating Lease Obligations
|
- | - | - | - | - | |||||||||||||||
|
Purchase Obligations
|
$ | 26,600 | $ | 26,600 | - | - | - | |||||||||||||
|
Other Long-Term Liabilities
Reflected on the
Registrant’s Balance
Sheet under GAAP
|
- | - | - | - | - | |||||||||||||||
|
Total
|
$ | 26,600 | $ | 26,600 | - | - | - | |||||||||||||
The expected timing of payment of the obligations discussed above is estimated based on current information. Timing of payments and actual amounts paid may be different depending on the time of receipt of goods or services or changes to agreed-upon amounts for some obligations.
Firearms Legislation and Litigation
See Item 1A - Risk Factors and Note 16 to the financial statements for discussion of firearms legislation and litigation.
Other Operational Matters
In the normal course of its manufacturing operations, the Company is subject to occasional governmental proceedings and orders pertaining to workplace safety, firearms serial number tracking and control, waste disposal, air emissions and water discharges into the environment. The Company believes that it is generally in compliance with applicable BATFE, environmental, and safety regulations and the outcome of any proceedings or orders will not have a material adverse effect on the financial position or results of operations of the Company.
The Company self-insures a significant amount of its product liability, workers’ compensation, medical, and other insurance. It also carries significant deductible amounts on various insurance policies.
The valuation of the future defined-benefit pension obligations at December 31, 2011 and 2010 indicated that these plans were underfunded by $19.1 million and $9.4 million, respectively, and resulted in a cumulative other comprehensive loss of $27.5 million and $19.6 million on the Company’s balance sheet at December 31, 2011 and 2010, respectively.
The Company expects to realize its deferred tax assets through tax deductions against future taxable income.
38
Critical Accounting Policies and Estimates
The preparation of financial statements in accordance with accounting principles generally accepted in the United States requires management to make assumptions and estimates that affect the reported amounts of assets and liabilities as of the balance sheet date and net sales and expenses recognized and incurred during the reporting period then ended. The Company bases estimates on prior experience, facts and circumstances, and other assumptions, including those reviewed with actuarial consultants and independent counsel, when applicable, that are believed to be reasonable. However, actual results may differ from these estimates.
The Company believes the determination of its product liability accrual is a critical accounting policy. The Company’s management reviews every lawsuit and claim and is in contact with independent and corporate counsel on an ongoing basis. The provision for product liability claims is based upon many factors, which vary for each case. These factors include the type of claim, nature and extent of injuries, historical settlement ranges, jurisdiction where filed, and advice of counsel. An accrual is established for each lawsuit and claim, when appropriate, based on the nature of each such lawsuit or claim.
Amounts are charged to product liability expense in the period in which the Company becomes aware that a claim or, in some instances a threat of claim, has been made when potential losses or costs of defense are probable and can be reasonably estimated. Such amounts are determined based on the Company’s experience in defending similar claims. Occasionally, charges are made for claims made in prior periods because the cumulative actual costs incurred for that claim, or reasonably expected to be incurred in the future, exceed amounts already provided. Likewise, credits may be taken if cumulative actual costs incurred for that claim, or reasonably expected to be incurred in the future, are less than amounts previously provided.
While it is not possible to forecast the outcome of litigation or the timing of costs, in the opinion of management, after consultation with independent and corporate counsel, it is not reasonably possible that litigation, including punitive damage claims, will have a material adverse effect on the financial position of the Company, but may have a material impact on the Company’s financial results for a particular period.
The Company believes the valuation of its inventory and the related excess and obsolescence reserve is also a critical accounting policy. Inventories are carried at the lower of cost, principally determined by the last-in, first-out (LIFO) method, or market. An actual valuation of inventory under the LIFO method is made at the end of each year based on the inventory levels and prevailing inventory costs existing at that time.
The Company determines its excess and obsolescence reserve by projecting the year in which inventory will be consumed into a finished product. Given ever-changing market conditions, customer preferences and the anticipated introduction of new products, it does not seem prudent nor supportable to carry inventory at full cost beyond that needed during the next 36 months.
39
Forward-Looking Statements and Projections
The Company may, from time to time, make forward-looking statements and projections concerning future expectations. Such statements are based on current expectations and are subject to certain qualifying risks and uncertainties, such as market demand, sales levels of firearms, anticipated castings sales and earnings, the need for external financing for operations or capital expenditures, the results of pending litigation against the Company, the impact of future firearms control and environmental legislation and accounting estimates, any one or more of which could cause actual results to differ materially from those projected. Words such as “expect,” “believe,” “anticipate,” “intend,” “estimate,” “will,” “should,”
“could” and other words and terms of similar meaning, typically identify such forward-looking statements. Readers are cautioned not to place undue reliance on these forward-looking statements, which speak only as of the date made. The Company undertakes no obligation to publish revised forward-looking statements to reflect events or circumstances after the date such forward-looking statements are made or to reflect the occurrence of subsequent unanticipated events.
The Company is exposed to changing interest rates on its investments, which consist primarily of United States Treasury instruments with short-term (less than one year) maturities and cash. The interest rate market risk implicit in the Company's investments at any given time is low, as the investments mature within short periods and the Company does not have significant exposure to changing interest rates on invested cash.
The Company has not undertaken any actions to cover interest rate market risk and is not a party to any interest rate market risk management activities.
A hypothetical 100 basis point change in market interest rates over the next year would not materially impact the Company’s earnings or cash flows. A hypothetical 100 basis point change in market interest rates would not have a material effect on the fair value of the Company’s investments.
40
INDEX TO FINANCIAL STATEMENTS
|
Reports of Independent Registered Public Accounting Firm
|
42
|
|
|
Balance Sheets at December 31, 2011 and 2010
|
44
|
|
|
Statements of Income for the years ended December 31, 2011, 2010 and 2009
|
46
|
|
|
Statements of Stockholders’ Equity for the years ended December 31, 2011, 2010 and 2009
|
47
|
|
|
Statements of Cash Flows for the years ended December 31, 2011, 2010 and 2009
|
48
|
|
|
Notes to Financial Statements
|
49
|
41
Report of Independent Registered Public Accounting Firm
To the Board of Directors and Stockholders
Sturm, Ruger & Company, Inc.
We have audited Sturm, Ruger & Company, Inc.'s internal control over financial reporting as of December 31, 2011, based on
criteria established in
Internal Control—Integrated Framework
issued by the Committee of Sponsoring Organizations of the Treadway Commission. Sturm, Ruger & Company, Inc.’s management is responsible for maintaining effective internal control over financial reporting and for its assessment of the effectiveness of internal control over financial reporting included in Management’s Report on Internal Control over Financial Reporting appearing under Item 9A. Our responsibility is to express an opinion on the Company's internal control over financial
reporting based on our audit.
We conducted our audit in accordance with the standards of the Public Company Accounting Oversight Board
(United States). Those standards require that we plan and perform the audit to obtain reasonable assurance about whether effective internal control over financial reporting was maintained in all material respects. Our audit included obtaining an understanding of internal control over financial reporting, assessing the risk that a material weakness exists, and testing and evaluating the design and operating effectiveness of internal control based on the assessed risk. Our audit also included performing such other procedures as we considered necessary in the circumstances. We believe that our audit provides a reasonable
basis for our opinion.
A company's internal control over financial reporting is a process designed to provide reasonable assurance regarding the reliability of financial reporting and the preparation of financial statements for external purposes in accordance with generally accepted accounting principles. A company's internal control over financial reporting includes those policies and procedures that (a) pertain to the maintenance of records that, in reasonable detail, accurately and fairly reflect the transactions and dispositions of the assets of the company; (b) provide reasonable assurance that transactions are recorded as necessary to permit preparation of financial statements in accordance with generally accepted accounting principles, and that receipts and expenditures of the company are being made only in accordance with authorizations of
management and directors of the company; and (c) provide reasonable assurance regarding prevention or timely detection of unauthorized acquisition, use, or disposition of the company's assets that could have a material effect on the financial statements.
Because of its inherent limitations, internal control over financial reporting may not prevent or detect misstatements. Also, projections of any evaluation of effectiveness to future periods are subject to the risk that controls may become inadequate because of changes in conditions, or that the degree of compliance with the policies or procedures may deteriorate.
In our opinion, Sturm, Ruger & Company, Inc. maintained, in all material respects, effective internal control over financial reporting as of December 31, 2011, based on
criteria established in
Internal Control—Integrated Framework
issued by the Committee of Sponsoring Organizations of the Treadway Commission.
We have also audited, in accordance with the standards
of the Public Company Accounting Oversight Board (United States), the balance sheets of Sturm, Ruger & Company, Inc. as of December 31, 2011 and 2010, and the related statements of income, stockholders’ equity
and cash flows for each of the three years in the period ended December 31, 2011, and our report dated February 22, 2012 expressed an unqualified opinion.
/s/ McGladrey & Pullen, LLP
Stamford, Connecticut
February 22, 2012
42
Report of Independent Registered Public Accounting Firm
To the Board of Directors and Stockholders
Sturm, Ruger & Company, Inc.
We have audited the accompanying balance sheets of Sturm, Ruger & Company, Inc. as of December 31, 2011 and 2010, and the related statements of income, stockholders’ equity, and cash flows for each of the three years in the period ended December 31, 2011. Our audits also included the financial statement schedule of Sturm, Ruger & Company, Inc. listed in Item 15(a). These financial statements and financial statement schedule are the responsibility of the Company's management. Our responsibility is to express an opinion on these financial statements based on our audits.
We conducted our audits in accordance with the standards of the Public Company Accounting Oversight Board (United States). Those standards require that we plan and perform the audit to obtain reasonable assurance about whether the financial statements are free of material misstatement. An audit includes examining, on a test basis, evidence supporting the amounts and disclosures in the financial statements. An audit also includes assessing the accounting principles used and significant estimates made by management, as well as evaluating the overall financial statement presentation. We believe that our audits provide a reasonable basis for our opinion.
In our opinion, the financial statements referred to above present fairly, in all material respects, the financial position of Sturm, Ruger & Company, Inc. as of December 31, 2011 and 2010, and the results of its operations and its cash flows for each of the three years in the period ended December 31, 2011, in conformity with U.S. generally accepted accounting principles. Also, in our opinion, the related financial statement schedule, when considered in relation to the basic financial statements taken as a whole, presents fairly in all material respects the information set forth therein.
We also have audited, in accordance with the standards of the Public Company Accounting Oversight Board (United States), Sturm, Ruger & Company, Inc.’s internal control over financial reporting as of December 31, 2011, based on
criteria established in
Internal Control—Integrated Framework
issued by the Committee of Sponsoring Organizations of the Treadway Commission, and our report dated February 22, 2012 expressed an unqualified opinion on the effectiveness of Sturm, Ruger & Company, Inc.’s internal control over financial reporting.
/s/ McGladrey & Pullen, LLP
Stamford, Connecticut
February 22, 2012
43
Balance Sheets
(Dollars in thousands, except per share data)
|
December 31,
|
2011
|
2010
|
||||||
|
Assets
|
||||||||
|
Current Assets
|
||||||||
|
Cash and cash equivalents
|
$ | 81,056 | $ | 5,132 | ||||
|
Short-term investments
|
- | 52,493 | ||||||
|
Trade receivables, net
|
42,225 | 31,565 | ||||||
| Gross inventories | 49,004 | 48,820 | ||||||
| Less LIFO reserve | (37,476 | ) | (37,448 | ) | ||||
|
Less excess and obsolescence reserve
|
(1,311 | ) | (1,545 | ) | ||||
|
Net inventories
|
10,217 | 9,827 | ||||||
|
Deferred income taxes
|
5,776 | 4,780 | ||||||
|
Prepaid expenses and other current assets
|
6,968 | 1,427 | ||||||
|
Total Current Assets
|
146,242 | 105,224 | ||||||
|
Property, Plant, and Equipment
|
169,142 | 150,379 | ||||||
|
Less allowances for depreciation
|
(116,195 | ) | (107,458 | ) | ||||
|
Net property, plant and equipment
|
52,947 | 42,921 | ||||||
|
Deferred income taxes
|
32 | 5,443 | ||||||
|
Other assets
|
7,289 | 4,173 | ||||||
|
Total Assets
|
$ | 206,510 | $ | 157,761 | ||||
See accompanying notes to financial statements.
44
|
December 31,
|
2011
|
2010
|
||||||
|
Liabilities and Stockholders’ Equity
|
||||||||
|
Current Liabilities
|
||||||||
|
Trade accounts payable and accrued expenses
|
$ | 28,592 | $ | 16,492 | ||||
|
Product liability
|
1,305 | 449 | ||||||
|
Employee compensation and benefits
|
14,882 | 10,923 | ||||||
|
Workers’ compensation
|
4,600 | 4,893 | ||||||
|
Income taxes payable
|
217 | 582 | ||||||
|
Total Current Liabilities
|
49,596 | 33,339 | ||||||
|
Accrued pension liability
|
19,082 | 9,369 | ||||||
|
Product liability
|
441 | 573 | ||||||
|
Contingent liabilities (Note 16)
|
- | - | ||||||
|
Stockholders’ Equity
|
||||||||
|
Common stock, non-voting, par value $1:
|
||||||||
| Authorized shares – 50,000; none issued | ||||||||
|
Common stock, par value $1:
|
||||||||
| Authorized shares – 40,000,000 | ||||||||
| 2011 – 23,382,566 issued, 19,083,132 outstanding | ||||||||
| 2010 – 23,003,285 issued, 18,837,251 outstanding | 23,383 | 23,003 | ||||||
|
Additional paid-in capital
|
10,454 | 9,885 | ||||||
|
Retained earnings
|
168,981 | 137,125 | ||||||
| Less: Treasury stock – at cost | ||||||||
| 2011 – 4,299,434 shares | ||||||||
|
2010 – 4,166,034, shares
|
(37,884 | ) | (35,885 | ) | ||||
|
Accumulated other comprehensive loss
|
(27,543 | ) | (19,648 | ) | ||||
|
Total Stockholders’ Equity
|
137,391 | 114,480 | ||||||
|
Total Liabilities and Stockholders’ Equity
|
$ | 206,510 | $ | 157,761 | ||||
See accompanying notes to financial statements.
45
Statements of Income
(In thousands, except per share data)
|
Year ended December 31,
|
2011
|
2010
|
2009
|
|||||||||
|
Net firearms sales
|
$ | 324,200 | $ | 251,680 | $ | 266,566 | ||||||
|
Net castings sales
|
4,616 | 3,526 | 4,419 | |||||||||
|
Total net sales
|
328,816 | 255,206 | 270,985 | |||||||||
|
Cost of products sold
|
217,058 | 171,224 | 183,380 | |||||||||
|
Gross profit
|
111,758 | 83,982 | 87,605 | |||||||||
|
Operating Expenses:
|
||||||||||||
|
Selling
|
28,691 | 23,517 | 21,822 | |||||||||
|
General and administrative
|
20,970 | 16,652 | 20,387 | |||||||||
|
Other operating (income) expenses, net
|
(319 | ) | 420 | 1,492 | ||||||||
|
Total operating expenses
|
49,342 | 40,589 | 43,701 | |||||||||
|
Operating income
|
62,416 | 43,393 | 43,904 | |||||||||
|
Other income:
|
||||||||||||
|
Royalty income
|
873 | 429 | 490 | |||||||||
|
Interest income
|
29 | 48 | 118 | |||||||||
|
Interest expense
|
(110 | ) | (143 | ) | (158 | ) | ||||||
|
Other income, net
|
308 | 422 | 6 | |||||||||
|
Total other income, net
|
1,100 | 756 | 456 | |||||||||
|
Income before income taxes
|
63,516 | 44,149 | 44,360 | |||||||||
|
Income taxes
|
23,501 | 15,894 | 16,857 | |||||||||
|
Net income
|
$ | 40,015 | $ | 28,255 | $ | 27,503 | ||||||
|
Basic Earnings Per Share
|
$ | 2.12 | $ | 1.48 | $ | 1.44 | ||||||
|
Fully Diluted Earnings Per Share
|
$ | 2.09 | $ | 1.46 | $ | 1.42 | ||||||
|
Cash Dividends Per Share
|
$ | 0.43 | $ | 0.33 | $ | 0.31 | ||||||
See accompanying notes to financial statements.
46
Statements of Stockholders’ Equity
(Dollars in thousands)
|
Common
Stock
|
Additional Paid-in Capital
|
Retained Earnings
|
Treasury Stock
|
Accumulated Other Comprehensive Loss
|
Total
|
|||||||||||||||||||
|
Balance at December 31, 2008
|
$ | 22,799 | $ | 2,442 | $ | 93,500 | $ | (30,153 | ) | $ | (22,985 | ) | $ | 65,603 | ||||||||||
|
Net income
|
27,503 | 27,503 | ||||||||||||||||||||||
|
Pension liability, net of
deferred taxes of $1,608
|
2,623 | 2,623 | ||||||||||||||||||||||
|
Comprehensive income
|
30,126 | |||||||||||||||||||||||
|
Dividends paid
|
(5,816 | ) | (5,816 | ) | ||||||||||||||||||||
|
Stock-based compensation
|
4,205 | 4,205 | ||||||||||||||||||||||
|
Tax benefit realized from exercise of stock options
|
1,412 | 1,412 | ||||||||||||||||||||||
|
Common stock issued – compensation plans
|
28 | (28 | ) | - | ||||||||||||||||||||
|
Repurchase of 2,401 shares of common stock
|
(14 | ) | (14 | ) | ||||||||||||||||||||
|
Balance at December 31, 2009
|
22,827 | 8,031 | 115,187 | (30,167 | ) | (20,362 | ) | 95,516 | ||||||||||||||||
|
Net income
|
28,255 | 28,255 | ||||||||||||||||||||||
|
Pension liability, net of
deferred taxes of $460
|
714 | 714 | ||||||||||||||||||||||
|
Comprehensive income
|
28,969 | |||||||||||||||||||||||
|
Dividends paid
|
(6,317 | ) | (6,317 | ) | ||||||||||||||||||||
|
Stock-based compensation
|
2,589 | 2,589 | ||||||||||||||||||||||
|
Exercise of stock options and vesting of RSU’s
|
(1,367 | ) | (1,367 | ) | ||||||||||||||||||||
|
Tax benefit realized from exercise of stock options and vesting of RSU’s
|
808 | 808 | ||||||||||||||||||||||
|
Common stock issued – compensation plans
|
176 | (176 | ) | - | ||||||||||||||||||||
|
Repurchase of 412,213 shares of common stock
|
(5,718 | ) | (5,718 | ) | ||||||||||||||||||||
|
Balance at December 31, 2010
|
23,003 | 9,885 | 137,125 | (35,885 | ) | (19,648 | ) | 114,480 | ||||||||||||||||
|
Net income
|
40,015 | 40,015 | ||||||||||||||||||||||
|
Pension liability,
net of
deferred taxes of $4,133
|
(7,895 | ) | (7,895 | ) | ||||||||||||||||||||
|
Comprehensive income
|
32,120 | |||||||||||||||||||||||
|
Dividends paid
|
(8,159 | ) | (8,159 | ) | ||||||||||||||||||||
|
Stock-based compensation
|
2,953 | 2,953 | ||||||||||||||||||||||
|
Exercise of stock options and vesting of RSU’s
|
(5,859 | ) | (5,859 | ) | ||||||||||||||||||||
|
Tax benefit realized from exercise of stock options and vesting of RSU’s
|
3,855 | 3,855 | ||||||||||||||||||||||
|
Common stock issued – compensation plans
|
380 | (380 | ) | - | ||||||||||||||||||||
|
Repurchase of 133,400 shares of common stock
|
(1,999 | ) | (1,999 | ) | ||||||||||||||||||||
|
Balance at December 31, 2011
|
$ | 23,383 | $ | 10,454 | $ | 168,981 | $ | (37,884 | ) | $ | (27,543 | ) | $ | 137,391 | ||||||||||
See accompanying notes to financial statements.
47
Statements of Cash Flows
(In thousands)
|
Year ended December 31,
|
2011
|
2010
|
2009
|
|||||||||
|
Operating Activities
|
||||||||||||
|
Net income
|
$ | 40,015 | $ | 28,255 | $ | 27,503 | ||||||
|
Adjustments to reconcile net income to cash
provided by operating activities:
|
||||||||||||
|
Depreciation
|
12,148 | 9,207 | 7,300 | |||||||||
|
Stock-based compensation
|
2,953 | 2,589 | 4,205 | |||||||||
|
Slow moving inventory valuation adjustment
|
(234 | ) | (1,057 | ) | 239 | |||||||
|
Loss (gain) on sale of assets
|
(26 | ) | 22 | (45 | ) | |||||||
|
Deferred income taxes
|
8,205 | 493 | 2,060 | |||||||||
|
Changes in operating assets and liabilities:
|
||||||||||||
|
Trade receivables
|
(10,660 | ) | (6,516 | ) | 760 | |||||||
|
Inventories
|
(156 | ) | 888 | 2,042 | ||||||||
|
Trade accounts payable and accrued expenses
|
11,807 | 3,932 | 2,150 | |||||||||
|
Employee compensation and benefits
|
3,959 | (1,967 | ) | 4,896 | ||||||||
|
Product liability
|
724 | (1,060 | ) | 339 | ||||||||
|
Prepaid expenses, other assets and other liabilities
|
(10,961 | ) | (1,333 | ) | (2,132 | ) | ||||||
|
Income taxes payable
|
(365 | ) | (962 | ) | (2,628 | ) | ||||||
|
Cash provided by operating activities
|
57,409 | 32,491 | 46,689 | |||||||||
|
Investing Activities
|
||||||||||||
|
Property, plant, and equipment additions
|
(22,135 | ) | (19,409 | ) | (13,819 | ) | ||||||
|
Purchases of short-term investments
|
(122,978 | ) | (164,966 | ) | (77,281 | ) | ||||||
|
Proceeds from sales or maturities of short-term investments
|
175,471 | 163,214 | 45,098 | |||||||||
|
Net proceeds from sale of assets
|
319 | 21 | 51 | |||||||||
|
Cash provided by (used for) investing activities
|
30,677 | (21,140 | ) | (45,951 | ) | |||||||
|
Financing Activities
|
||||||||||||
|
Dividends paid
|
(8,159 | ) | (6,317 | ) | (5,816 | ) | ||||||
|
Tax benefit from exercise of stock options
|
3,855 | 1,923 | 1,442 | |||||||||
| Repurchase of common stock | (1,999 | ) | (5,718 | ) | (14 | ) | ||||||
|
Payment of employee withholding tax related to share-based compensation
|
(5,859 | ) | (1,115 | ) | (30 | ) | ||||||
|
Repayment of line of credit
|
- | - | (1,000 | ) | ||||||||
|
Cash used for financing activities
|
(12,162 | ) | (11,227 | ) | (5,418 | ) | ||||||
|
Increase (decrease) in cash and cash equivalents
|
75,924 | 124 | (4,680 | ) | ||||||||
|
Cash and cash equivalents at beginning of year
|
5,132 | 5,008 | 9,688 | |||||||||
|
Cash and cash equivalents at end of year
|
$ | 81,056 | $ | 5,132 | $ | 5,008 | ||||||
See accompanying notes to financial statements.
48
Notes to Financial Statements
(Dollars in thousands, except per share)
1. Summary of Significant Accounting Policies
Organization
Sturm, Ruger & Company, Inc. (the “Company”) is principally engaged in the design, manufacture, and sale of firearms to domestic customers. Approximately 99% of the Company’s total sales for the year ended December 31, 2011 were from the firearms segment. Export sales represent approximately 5% of firearms sales. The Company’s design and manufacturing operations are located in the United States and almost all product content is domestic. The Company’s firearms are sold through a select number of independent wholesale distributors principally to the commercial sporting market.
The Company also manufactures and sells investment castings made from steel alloys for both outside customers and internal use in the firearms segment. Investment castings sold to outside customers, either directly to or through manufacturers’ representatives, were approximately 1% of the Company’s total sales for the year ended December 31, 2011.
Preparation of Financial Statements
The Company follows United States generally accepted accounting principles (“GAAP”). The preparation of financial statements in conformity with GAAP requires management to make estimates and assumptions that affect the reported amounts of assets and liabilities and disclosure of contingent liabilities at the date of the financial statements and the reported amounts of revenues and expenses during the reporting period. Actual results could differ from these estimates.
The significant accounting policies described below, together with the notes that follow, are an integral part of the Financial Statements.
Revenue Recognition
Substantially all product sales are sold FOB (free on board) shipping point. Revenue is recognized when product is shipped and the customer takes ownership and assumes the risk of loss. Accruals are made for sales discounts and incentives based on the Company’s experience. The Company accounts for cash sales discounts as a reduction in sales and sales incentives as a charge to selling expense. Amounts billed to customers for shipping and handling fees are included in net sales and costs incurred by the Company for the delivery of goods are classified as selling expenses in the Statement of Income. Taxes on revenue producing transactions are excluded from net sales.
Cash and Cash Equivalents
The Company considers interest-bearing deposits with financial institutions with remaining maturities of three months or less at the time of acquisition to be cash equivalents.
Short-term Investments
49
Short-term investments consist principally of United States Treasury instruments, all maturing within one year, and are recorded at cost plus accrued interest, which approximates fair value. The income from short-term investments is included in other income, net. As of December 31, 2011, the Company held no short-term investments.
Accounts Receivable
The Company establishes an allowance for doubtful accounts based on the credit worthiness of its customers and historical experience. While the Company uses the best information available to make its evaluation, future adjustments to the allowance for doubtful accounts may be necessary if there are significant changes in economic and industry conditions or any other factors considered in the Company’s evaluation. Bad debt expense has been immaterial during each of the last three years.
Inventories
The majority of the Company’s inventories are valued at the lower of cost, principally determined by the last-in, first-out (LIFO) method, or market. Elements of cost in inventories include raw materials, direct labor and manufacturing overhead.
Property, Plant, and Equipment
Property, plant, and equipment are carried at cost. Depreciation is computed over useful lives using the straight-line and declining balance methods predominately over 15 years for buildings, 10 years for machinery and equipment and 3 years for tools and dies. When assets are retired, sold or otherwise disposed of, their gross carrying values and related accumulated depreciation are removed from the accounts and a gain or loss on such disposals is recognized when appropriate.
Maintenance and repairs are charged to operations; replacements and improvements are capitalized.
Long-lived Assets
The Company evaluates the carrying value of long-lived assets to be held and used when events or changes in circumstances indicate the carrying value may not be recoverable. In performing this review, the carrying value of the assets is compared to the projected undiscounted cash flows to be generated from the assets. If the sum of the undiscounted expected future cash flows is less than the carrying value of the assets, the assets are considered to be impaired. Impairment losses are measured as the amount by which the carrying value of the assets exceeds their fair value. The Company bases fair value of the assets on quoted market prices if available or, if not available, quoted market prices of similar assets. Where quoted market prices are not available, the Company estimates fair value using the estimated
future cash flows generated by the assets discounted at a rate commensurate with the risks associated with the recovery of the assets.
Income Taxes
Income taxes are accounted for using the asset and liability method. Under this method, deferred income taxes are recognized for the tax consequences of “temporary differences” by applying enacted statutory rates applicable to future years to temporary differences between the financial statement carrying amounts and the tax basis of the Company’s assets and liabilities.
50
Product Liability
The Company provides for product liability claims including estimated legal costs to be incurred defending such claims. The provision for product liability claims is charged to cost of products sold.
Advertising Costs
The Company expenses advertising costs as incurred. Advertising expenses for the years ended December 31, 2011, 2010, and 2009, were $2.9 million, $2.3 million, and $2.7 million, respectively.
Shipping Costs
Costs incurred related to the shipment of products are included in selling expense. Such costs totaled $3.5 million, $3.0 million, and $2.7 million in 2011, 2010, and 2009, respectively.
Research and Development
In 2011, 2010, and 2009, the Company spent approximately $4.0 million, $3.2 million, and $2.0 million, respectively, on research activities relating to the development of new products and the improvement of existing products. Research and development costs are expensed as incurred.
Earnings per Share
Basic earnings per share is based upon the weighted-average number of shares of common stock outstanding during the year. Diluted earnings per share reflect the impact of options, restricted stock units, and deferred stock outstanding using the treasury stock method.
Reclassifications
Certain prior year balances have been reclassified to conform to current year presentation.
2. Trade Receivables, Net
Trade receivables consist of the following:
|
December 31,
|
2011
|
2010
|
||||||
|
Trade receivables
|
$ | 43,217 | $ | 32,469 | ||||
|
Allowance for doubtful accounts
|
(185 | ) | (277 | ) | ||||
|
Allowance for discounts
|
(807 | ) | (627 | ) | ||||
| $ | 42,225 | $ | 31,565 | |||||
In 2011, the largest individual trade receivable balances accounted for 19%, 15%, 14%, and 12% of total trade receivables, respectively.
In 2010, the largest individual trade receivable balances accounted for 15%, 15%, 12%, 12%, 11% and 10% of total trade receivables, respectively.
3. Inventories
51
Inventories consist of the following:
|
December 31,
|
2011
|
2010
|
||||||
|
Finished products
|
$ | 3,317 | $ | 5,833 | ||||
|
Materials and products in process
|
44,376 | 41,442 | ||||||
| 47,693 | 47,275 | |||||||
|
Adjustment of inventories to a LIFO basis
|
(37,476 | ) | (37,448 | ) | ||||
| $ | 10,217 | $ | 9,827 | |||||
In 2011, inventory quantities increased. In 2010, inventory quantities were reduced. This reduction resulted in a liquidation of LIFO inventory quantities carried at lower costs prevailing in prior years as compared with the current cost of purchases, the effect of which decreased costs of products sold by approximately $2.3 million in 2010.
4. Property, Plant and Equipment
Property, plant and equipment consist of the following:
|
December 31,
|
2011
|
2010
|
||||||
|
Land and improvements
|
$ | 1,266 | $ | 1,266 | ||||
|
Buildings and improvements
|
27,961 | 26,609 | ||||||
|
Machinery and equipment
|
111,558 | 97,514 | ||||||
|
Dies and tools
|
28,357 | 24,990 | ||||||
| $ | 169,142 | $ | 150,379 | |||||
5. Other Assets
Other assets consist of the following:
|
December 31,
|
2011
|
2010
|
||||||
|
Patents, at cost
|
$ | 4,900 | $ | 4,689 | ||||
|
Less: accumulated amortization
|
(2,583 | ) | (2,342 | ) | ||||
|
Deposits on capital items
|
1,618 | 570 | ||||||
|
Software development costs
|
1,911 | 756 | ||||||
|
Other
|
1,443 | 500 | ||||||
| $ | 7,289 | $ | 4,173 | |||||
The capitalized cost of patents is amortized using the straight-line method over their useful lives. The cost of patent amortization was $0.2 million, $0.2 million and $0.3 million in 2011, 2010 and 2009, respectively. The estimated annual patent amortization cost for each of the next five years is $0.2 million. Costs incurred to maintain existing patents are charged to expense in the year incurred.
Software development costs were incurred to develop and implement an integrated ERP system prior to the time the system became operational. These costs are being amortized using the straight line
52
method over a period of sixty months. Costs incurred subsequent to the system becoming operational are being expensed.
6. Trade Accounts Payable and Accrued Expenses
Trade accounts payable and accrued expenses consist of the following:
|
December 31,
|
2011
|
2010
|
||||||
|
Trade accounts payable
|
$ | 12,263 | $ | 6,597 | ||||
|
Accrued expenses
|
16,329 | 9,895 | ||||||
| $ | 28,592 | $ | 16,492 | |||||
7. Line of Credit
In December 2007, the Company established an unsecured $25 million revolving line of credit with a bank. This facility is renewable annually and now terminates on June 15, 2013. The credit facility remained unused and throughout 2010 and 2011. Borrowings under this facility would bear interest at LIBOR (1.13% at December 31, 2011) plus 200 basis points and the Company is charged three-eighths of a percent (.375%) per year on the unused portion. At December 31, 2011 and 2010, the Company was in compliance with the terms and covenants of the credit facility.
8. Employee Benefit Plans
The Company has migrated its retirement benefits from defined-benefit pension plans to defined-contribution retirement plans, utilizing its current 401(k) plan.
Defined-Benefit Plans
The Company sponsors two qualified defined-benefit pension plans that cover substantially all employees. A third defined-benefit pension plan is non-qualified and covered certain executive officers of the Company. The Company also sponsors a defined-contribution 401(k) plan that covers substantially all employees.
In 2007, the Company amended its hourly and salaried defined-benefit pension plans so that employees no longer accrue benefits under them effective December 31, 2007. This action “froze” the benefits for all employees and prevented future hires from joining the plans, effective December 31, 2007. Currently, the Company provides supplemental discretionary contributions to substantially all employees’ individual 401(k) accounts.
Minimum cash contributions of $2.0 million were required for the defined-benefit plans for 2011. The Company contributed $2 million to the defined-benefit plans in both 2011 and 2010.
In future years, the Company may again be required to make cash contributions to the two defined-benefit pension plans. The annual contributions will be based on the amount of the unfunded plan liabilities derived from the frozen benefits and will not include liabilities for any future accrued benefits for any new or existing participants. The total amount of these future cash contributions will depend on the investment returns generated by the plans’ assets and the then-applicable discount rates used to calculate the plans’ liabilities.
53
The Company plans to contribute approximately $3 million in 2012, but will increase the amount of the contribution if required to do so. The intent of these contributions is to reduce the amount of time that the Company will be required to continue to operate the frozen plans. The ongoing cost of running the plans (even if frozen) is approximately $0.2 million per year, which includes PBGC premiums, actuary and audit fees, and other expenses.
The measurement dates of the assets and liabilities of all plans presented for 2011 and 2010 were December 31, 2011 and December 31, 2010, respectively.
In the first quarter of 2009, the Company settled $2.1 million of pension liabilities through the purchases of group annuities. This transaction resulted in an insignificant actuarial gain.
Summarized information on the Company’s defined-benefit pension plans is as follows:
|
Obligations and Funded Status at December 31,
|
2011
|
2010
|
||||||
|
Change in Benefit Obligation
|
||||||||
|
Benefit obligation at beginning of year
|
$ | 68,793 | $ | 64,140 | ||||
|
Service cost
|
- | - | ||||||
|
Interest cost
|
3,545 | 3,576 | ||||||
|
Actuarial loss
|
7,662 | 3,694 | ||||||
|
Benefits paid
|
(2,770 | ) | (2,617 | ) | ||||
|
Benefit obligation at end of year
|
77,230 | 68,793 | ||||||
|
Change in Plan Assets
|
||||||||
|
Fair value of plan assets at beginning of year
|
59,423 | 51,946 | ||||||
|
Actual return on plan assets
|
(661 | ) | 7,940 | |||||
|
Employer contributions
|
2,156 | 2,155 | ||||||
|
Benefits paid
|
(2,770 | ) | (2,617 | ) | ||||
|
Fair value of plan assets at end of year
|
58,148 | 59,424 | ||||||
|
Funded Status
|
||||||||
|
Funded status
|
(19,082 | ) | (9,369 | ) | ||||
|
Unrecognized net actuarial loss
|
43,719 | 31,691 | ||||||
|
Unrecognized prior service cost
|
- | - | ||||||
|
Net amount recognized
|
$ | 24,637 | $ | 22,322 | ||||
|
Weighted Average Assumptions for the years
ended December 31,
|
2011
|
2010
|
||||||
|
Discount rate
|
5.25 | % | 5.75 | % | ||||
|
Expected long-term return on plan assets
|
8.00 | % | 8.00 | % | ||||
|
Rate of compensation increases
|
N/A | N/A | ||||||
54
|
Components of Net Periodic Pension Cost
|
2011
|
2010
|
||||||
|
Service cost
|
$ | - | $ | - | ||||
|
Interest cost
|
3,546 | 3,576 | ||||||
|
Expected return on assets
|
(4,739 | ) | (4,127 | ) | ||||
|
Recognized gains
|
1,034 | 1,031 | ||||||
|
Prior service cost recognized
|
- | - | ||||||
|
Net periodic pension cost
|
$ | (159 | ) | $ | 480 | |||
|
Amounts Recognized on the Balance Sheet
|
2011
|
2010
|
||||||
|
Accrued benefit liability
|
$ | (19,082 | ) | $ | (9,369 | ) | ||
|
Accumulated other comprehensive loss, net of tax
|
27,543 | 19,648 | ||||||
|
Deferred tax asset
|
16,176 | 12,043 | ||||||
| $ | 24,637 | $ | 22,322 | |||||
|
Weighted Average Assumptions as of December 31,
|
2011
|
2010
|
||||||
|
Discount rate
|
4.75 | % | 5.25 | % | ||||
|
Rate of compensation increases
|
N/A | N/A | ||||||
|
Information for Pension Plans with an Accumulated Benefit Obligation in excess of plan assets
|
2011 | 2010 | ||||||
|
Projected benefit obligation
|
$ | 77,230 | $ | 68,793 | ||||
|
Accumulated benefit obligation
|
$ | 77,230 | $ | 68,793 | ||||
|
Fair value of plan assets
|
$ | 58,148 | $ | 59,424 | ||||
|
Pension Weighted Average Asset Allocations as of December 31,
|
2011 | 2010 | ||||||
|
Debt securities
|
27 | % | 26 | % | ||||
|
Equity securities
|
67 | % | 68 | % | ||||
|
Real estate
|
5 | % | 5 | % | ||||
|
Money market funds
|
1 | % | 1 | % | ||||
| 100 | % | 100 | % | |||||
The estimated future benefit payments for the defined-benefit plans for each of the next five years and the total amount for years six through ten, are as follows: 2012-$3.2 million, 2013-$3.4 million, 2014-$3.6 million, 2015-$3.8 million, 2016-$4.0 million and for the five year period ending 2021-$22.0 million.
The Company determines the expected return on plan assets based on the target asset allocations. In addition, the historical returns of the plan assets are also considered in arriving at the expected rate of return.
55
The Company recorded an additional minimum pension liability adjustment, net of tax, which decreased comprehensive income by $7.9 million in 2011 and increased comprehensive income by $2.6 million and $0.7 million in 2010 and 2009, respectively.
Plan Assets
The current investment objective is to produce income and long-term appreciation through a target asset allocation of 35% debt securities and other fixed income investments including cash and short-term instruments, and 65% equity investments, to provide for the current and future benefit payments of the plans. The pension plans are not invested in the common stock of the Company.
The Company adopted the provisions of ASC 820.10 which defines fair value, establishes a framework for measuring fair value in generally accepted accounting principles, and expands disclosures about fair value measurements. The Company has determined that all financial assets of both its defined-benefit pension plans are level 2 in the fair value hierarchy established by ASC 820.10. The valuation of level 2 assets are based on inputs, other than quoted prices in active markets, that are either directly or indirectly observable for the assets.
The disclosures focus on the inputs used to measure fair value. The following is a description of the valuation methodologies used to measure the plans’ assets at fair value:
Pooled separate accounts
: Valued at the net asset value (“NAV”) of units held by the plans at year end, which is determined by aggregating the quoted market values of the underlying assets.
Money market funds
: Valued at the NAV of shares held by the plans at year end, which is generally intended to approximate one dollar per share.
The following table sets forth the defined-benefit plans’ assets at fair value:
|
December 31,
|
2011
|
2010
|
||||||
|
Pooled separate accounts:
|
||||||||
|
Equity securities:
|
|
|
||||||
|
U.S. small cap equity funds
|
$ | 6,742 | $ | 7,190 | ||||
|
U.S. mid-cap equity funds
|
16,037 | 16,987 | ||||||
|
U.S. large-cap equity funds
|
5,236 | 5,700 | ||||||
|
International equity funds
|
11,229 | 10,866 | ||||||
|
Domestic real estate funds
|
3,136 | 3,013 | ||||||
|
Fixed income securities:
|
||||||||
|
Corporate bond funds
|
15,459 | 15,615 | ||||||
|
Money market fund
|
309 | 53 | ||||||
| $ | 58,148 | $ | 59,424 | |||||
Defined-Contribution Plans
Prior to 2007, the Company also sponsored two qualified defined-contribution plans that covered substantially all of its hourly and salaried employees. Effective January 1, 2007, the qualified defined-contribution plans were merged into a single 401(k) plan. Under the terms of the 401(k) plan, the
56
Company matches a certain portion of employee contributions. Expenses related to matching employee contributions to the 401(k) plan were $2.0 million, $1.8 million and $1.8 million in 2011, 2010 and 2009, respectively.
Additionally, in 2011, 2010 and 2009 the Company provided supplemental discretionary contributions to the individual 401(k) accounts of substantially all employees. Each employee received a supplemental contribution to their account based on a uniform percentage of qualifying base compensation established annually. The cost of these supplemental contributions totaled $2.1 million, $1.8 million and $1.7 million in 2011, 2010 and 2009, respectively.
Non-Qualified Plan
The Company also sponsors a non-qualified defined-contribution plan, the Supplemental Executive Retirement Plan, which covered certain of its salaried employees. Only one participant, who is retired, remains in this plan.
9. Other Operating Expenses (Income), net
Other operating expenses (income), net consist of the following:
|
Year ended December 31,
|
2011
|
2010
|
2009
|
|||||||||
|
Loss (gain) on sale of operating assets (a)
|
$ | (83 | ) | $ | 22 | $ | (45 | ) | ||||
|
Frozen defined-benefit pension plan expense (income)
|
(236 | ) | 398 | 1,537 | ||||||||
|
Total other operating expenses (income), net
|
$ | (319 | ) | $ | 420 | $ | 1,492 | |||||
|
(a)
|
The gain on sale of operating assets was generated primarily from the sale of used machinery and equipment related to firearms.
|
10. Income Taxes
The Company files income tax returns in the U.S. federal jurisdiction and various state jurisdictions. With few exceptions, the Company is no longer subject to U.S. federal and state income tax examinations by tax authorities for years before 2006.
The federal and state income tax provision consisted of the following:
|
Year ended December 31,
|
2011
|
2010
|
2009
|
|||||||||||||||||||||
|
Current
|
Deferred
|
Current
|
Deferred
|
Current
|
Deferred
|
|||||||||||||||||||
|
Federal
|
$ | 11,371 | $ | 7,948 | $ | 11,675 | $ | 1,112 | $ | 13,572 | $ | 230 | ||||||||||||
|
State
|
3,926 | 256 | 2,814 | 293 | 3,005 | 50 | ||||||||||||||||||
| $ | 15,297 | $ | 8,204 | $ | 14,489 | $ | 1,405 | $ | 16,577 | $ | 280 | |||||||||||||
57
The effective income tax rate varied from the statutory federal income tax rate as follows:
|
Year ended December 31,
|
2011
|
2010
|
2009
|
|||||||||
|
Statutory federal income tax rate
|
35.0 | % | 35.0 | % | 35.0 | % | ||||||
|
State income taxes, net of federal tax benefit
|
4.3 | 4.6 | 4.5 | |||||||||
|
Domestic production activities deduction
|
(1.8 | ) | (2.7 | ) | (2.1 | ) | ||||||
|
Other items
|
(0.5 | ) | (0.9 | ) | 0.6 | |||||||
|
Effective income tax rate
|
37.0 | % | 36.0 | % | 38.0 | % | ||||||
Significant components of the Company’s deferred tax assets and liabilities are as follows:
|
December 31,
|
2011
|
2010
|
||||||
|
Deferred tax assets:
|
||||||||
|
Product liability
|
$ | 646 | $ | 368 | ||||
|
Employee compensation and benefits
|
3,374 | 3,222 | ||||||
|
Allowances for doubtful accounts and discounts
|
1,625 | 859 | ||||||
|
Inventories
|
533 | 603 | ||||||
|
Additional minimum pension liability
|
16,176 | 12,043 | ||||||
|
Stock-based compensation
|
1,089 | 1,840 | ||||||
|
Other
|
259 | 244 | ||||||
|
Total deferred tax assets
|
23,702 | 19,179 | ||||||
|
Deferred tax liabilities:
|
||||||||
|
Pension plans
|
9,217 | 8,134 | ||||||
|
Depreciation
|
8,401 | 629 | ||||||
|
Other
|
276 | 193 | ||||||
|
Total deferred tax liabilities
|
17,894 | 8,956 | ||||||
|
Net deferred tax assets
|
$ | 5,808 | $ | 10,223 | ||||
Changes in deferred tax assets relating to the additional minimum pension liability are not charged to expense and are therefore not included in the deferred tax provision; instead they are charged to other comprehensive income.
The Company made income tax payments of approximately $16.4 million, $14.6 million, and $18.9 million, during 2011, 2010, and 2009, respectively. The Company expects to realize its deferred tax assets through tax deductions against future taxable income or carry back against taxes previously paid. In 2009, the Company received a tax refund of $1.4 million related to the exercise of stock options in prior years.
The Company does not believe it has included any “uncertain tax positions” in its federal income tax return or any of the state income tax returns it is currently filing. The Company has made an evaluation of the potential impact of additional state taxes being assessed by jurisdictions in which the Company does not currently consider itself liable. The Company does not anticipate that such additional taxes, if any, would result in a material change to its financial position.
58
11. Earnings Per Share
Set forth below is a reconciliation of the numerator and denominator for basic and diluted earnings per share calculations for the periods indicated:
|
Year ended December 31,
|
2011
|
2010
|
2009
|
|||||||||
|
Numerator:
|
||||||||||||
|
Net income
|
$ | 40,015 | $ | 28,255 | $ | 27,503 | ||||||
|
Denominator:
|
||||||||||||
|
Weighted average number of common shares outstanding – Basic
|
18,919,489 | 19,032,557 | 19,061,321 | |||||||||
|
Dilutive effect of options and restricted stock units outstanding under the Company’s employee compensation plans
|
232,909 | 266,636 | 259,735 | |||||||||
|
Weighted average number of common shares outstanding – Diluted
|
19,152,398 | 19,299,193 | 19,321,056 | |||||||||
The dilutive effect of outstanding options and restricted stock units is calculated using the treasury stock method. The weighted average number of common shares outstanding decreased from the previous year in 2011 and 2010 as a result of the Company’s stock repurchase plans, which were authorized by the Board of Directors in 2008 and 2010. See Note 12 for further information.
The following average numbers of stock options are anti-dilutive and therefore are not included in the diluted earnings per share calculation:
|
Year ended December 31,
|
2011
|
2010
|
2009
|
|
Average number of stock options
|
-
|
-
|
456,250
|
There are no anti-dilutive stock options in 2011 and 2010 because the closing price of the Company’s stock on December 31, 2011 and 2010 exceeded the strike price of all outstanding options on that date.
59
12. Stock Repurchases
In the third quarter of 2010 and the first quarter of 2011 the Company repurchased shares of its common stock. Details of these purchases are as follows:
|
Period
|
Total Number of Shares Purchased
|
Average Price Paid per Share
|
Total Number of Shares Purchased as Part of Publicly Announced Program
|
Maximum Dollar Value of Shares that May Yet Be Purchased Under the Program
|
||||||||||||
|
8/3/10-8/31/10
|
339,000 | $ | 14.08 | 339,000 | ||||||||||||
|
9/1/10-9/22/10
|
73,000 | $ | 12.92 | 73,000 | ||||||||||||
|
1/4/11-1/29/11
|
133,400 | $ | 14.94 | 133,400 | ||||||||||||
|
Total
|
545,400 | $ | 14.15 | 545,400 | $ | 8,000,000 | ||||||||||
In 2009, the Company repurchased 2,400 shares of its common stock, representing 0.1% of the then outstanding shares, in the open market at an average price of $6.03 per share.
All of these purchases were made with cash held by the Company and no debt was incurred.
At December 31, 2011, $8.0 million remained authorized for share repurchases.
13. Compensation Plans
In 1998, the Company adopted, and in May 1999 the shareholders approved, the 1998 Stock Incentive Plan (the “1998 Plan”) under which employees were granted options to purchase shares of the Company’s Common Stock and stock appreciation rights. The Company reserved 2,000,000 shares for issuance under the 1998 Plan. These options have an exercise price equal to the fair market value of the shares of the Company at the date of grant, become vested ratably over five years, and expire ten years from the date of grant. In April 2007, all reserved shares for which a stock option had not been granted under the 1998 Plan were deregistered. No further stock options or stock will be granted under the 1998 Plan.
On December 18, 2000, the Company adopted, and in May 2001 the shareholders approved, the 2001 Stock Option Plan for Non-Employee Directors (the “2001 Plan”) under which non-employee directors were granted options to purchase shares of the Company’s authorized but unissued stock. The Company reserved 200,000 shares for issuance under the 2001 Plan. Options granted under the 2001 Plan have an exercise price equal to the fair market value of the shares of the Company at the date of grant and expire ten years from the date of grant. Twenty-five percent of the options vest immediately upon grant and the remaining options vest ratably over three years. In April 2007, all reserved shares for which a stock option had not been granted under the 2001 Plan were
deregistered. No further stock options or stock will be granted under the 2001 Plan.
60
In April 2007, the Company adopted and the shareholders approved the 2007 Stock Incentive Plan (the “2007 SIP”) under which employees, independent contractors, and non-employee directors may be granted stock options, restricted stock, deferred stock awards, restricted stock units, and stock appreciation rights, any of which may or may not require the achievement of performance objectives. Vesting requirements are determined by the Compensation Committee or the Board of Directors. The Company reserved 2,550,000 shares for issuance under the 2007 SIP. At December 31, 2011, an aggregate of 984,000 shares remain available for grant under the Plan.
Compensation expense related to stock options is recognized based on the grant-date fair value of the awards estimated using the Black-Scholes option pricing model. Compensation expense related to deferred stock, restricted stock, and restricted stock units is recognized based on the grant-date fair value of the Company’s common stock. The total stock-based compensation cost included in the Statements of Income was $3.0 million, $2.6 million and $4.2 million in 2011, 2010 and 2009, respectively. The 2009 expense was unusually high because performance based stock options and restricted stock units that had been granted over several years vested in 2009 as a result of the operating performance in that year.
Stock Options
There were no stock options granted in 2011.
For purposes of determining the fair value of stock option awards granted in 2010 and 2009, the Company used the Black-Scholes option pricing model and the assumptions set forth in the table below.
|
2010
|
2009
|
|||||||
|
Dividend yield
|
0.0 | % | 0.0 | % | ||||
|
Expected volatility
|
40.0 | % | 41.0 | % | ||||
|
Risk free rate of return
|
4.0 | % | 4.0 | % | ||||
|
Expected lives
|
6.7 years
|
8.0 years
|
||||||
The estimated fair value of options granted is subject to the assumptions made and if the assumptions changed, the estimated fair value amounts could be significantly different.
61
The following table summarizes the stock option activity of the Plans:
|
Shares
|
Weighted Average Exercise Price
|
Weighted Average Grant Date
Fair Value
|
Weighted Average Remaining
Contractual
Life (Years)
|
|||||||||||||
|
Outstanding at December 31, 2008
|
1,420,250 | 9.02 | 3.99 | 7.0 | ||||||||||||
|
Granted
|
115,900 | 8.69 | 4.57 | 9.3 | ||||||||||||
|
Exercised
|
(38,000 | ) | 8.73 | 2.56 | 4.1 | |||||||||||
|
Canceled
|
- | - | - | - | ||||||||||||
|
Outstanding at December 31, 2009
|
1,498,150 | 9.00 | 4.13 | 7.1 | ||||||||||||
|
Granted
|
40,000 | 9.70 | 4.80 | 9.0 | ||||||||||||
|
Exercised
|
(366,000 | ) | 8.11 | 3.15 | 4.5 | |||||||||||
|
Canceled
|
- | - | - | - | ||||||||||||
|
Outstanding at December 31, 2010
|
1,172,150 | 9.30 | 4.46 | 6.7 | ||||||||||||
|
Granted
|
||||||||||||||||
|
Exercised
|
(843,450 | ) | 9.58 | 4.48 | 5.0 | |||||||||||
|
Canceled
|
||||||||||||||||
|
Outstanding at December 31, 2011
|
328,700 | 8.58 | 4.42 | 6.2 | ||||||||||||
|
Exercisable Options Outstanding at December 31, 2011
|
223,700 | 8.37 | 4.28 | 6.0 | ||||||||||||
|
Non-Vested Options Outstanding at December 31, 2011
|
105,000 | $ | 9.05 | $ | 4.71 | 6.7 | ||||||||||
At December 31, 2011, the aggregate intrinsic value of all options, including exercisable options, was $8.2 million.
At December 31, 2011, there was $0.4 million of unrecognized compensation cost related to stock options that is expected to be recognized over a weighted-average period of 2.0 years.
Deferred Stock
Deferred stock awards vest based on the passage of time or the Company’s attainment of performance objectives. Upon vesting, these awards convert one-for-one to common stock.
In 2011, 9,487 deferred stock awards were issued to non-employee directors that will vest in April 2012 and 12,744 deferred stock awards were issued to non-employee directors that will vest in April 2014.
In 2010, 12,902 deferred stock awards were issued to non-employee directors that will vest in April 2011 and 17,331 deferred stock awards were issued to non-employee directors that will vest in April 2013.
In 2009, 13,360 deferred stock awards were issued to non-employee directors that vested in April 2010.
Compensation expense related to these awards is amortized ratably over the vesting period. Compensation expense related to these awards was $0.5 million, $0.3 million and $0.2 million in 2011, 2010 and 2009, respectively.
62
Restricted Stock Units
Beginning in the second quarter of 2009, the Company began granting restricted stock units in lieu of incentive stock options to senior employees. The vesting of these RSU’s is dependent on the achievement of various corporate objectives established by the Compensation Committee of the Board of Directors, as well as, in certain instances, the passage of time.
During 2011, 524,000 restricted stock units were issued. Compensation costs related to these restricted stock units was $10.7 million, of which $1.8 was recognized in 2011. The remaining costs will be recognized ratably over the remaining period required before the units to vest, which ranges from three to five years.
During 2010, 76,000 restricted stock units were issued. Compensation costs related to these restricted stock units was $1.1 million, all of which was recognized in 2010 because the performance objectives were attained and the awards became fully vested.
During 2009, 60,100 restricted stock units were issued. Compensation costs related to these restricted stock units was $0.7 million, all of which was recognized in 2009 because the performance objectives were attained and the awards became fully vested.
14. Operating Segment Information
The Company has two reportable operating segments: firearms and investment castings. The firearms segment manufactures and sells rifles, pistols, revolvers, and shotguns principally to a select number of licensed independent wholesale distributors primarily located in the United States. The investment castings segment manufactures and sells steel investment castings.
Corporate segment income relates to interest income on short-term investments, the sale of non-operating assets, and other non-operating activities. Corporate segment assets consist of cash and short-term investments and other non-operating assets.
63
The Company evaluates performance and allocates resources, in part, based on profit and loss before taxes. The accounting policies of the reportable segments are the same as those described in the summary of significant accounting policies (see Note 1). Intersegment sales are recorded at the Company’s cost plus a fixed profit percentage.
|
Year ended December 31,
|
2011
|
2010
|
2009
|
|||||||||
|
Net Sales
|
||||||||||||
|
Firearms
|
$ | 324,200 | $ | 251,680 | $ | 266,566 | ||||||
|
Castings
|
||||||||||||
|
Unaffiliated
|
4,616 | 3,526 | 4,419 | |||||||||
|
Intersegment
|
18,122 | 14,677 | 16,159 | |||||||||
| 22,738 | 18,203 | 20,578 | ||||||||||
|
Eliminations
|
(18,122 | ) | (14,677 | ) | (16,159 | ) | ||||||
| $ | 328,816 | $ | 255,206 | $ | 270,985 | |||||||
|
Income (Loss) Before Income Taxes
|
||||||||||||
|
Firearms
|
$ | 66,484 | $ | 48,160 | $ | 46,339 | ||||||
|
Castings
|
(2,254 | ) | (1,637 | ) | (443 | ) | ||||||
|
Corporate
|
(714 | ) | (2,374 | ) | (1,536 | ) | ||||||
| $ | 63,516 | $ | 44,149 | $ | 44,360 | |||||||
|
Identifiable Assets
|
||||||||||||
|
Firearms
|
$ | 103,545 | $ | 82,179 | $ | 66,011 | ||||||
|
Castings
|
5,290 | 4,683 | 4,643 | |||||||||
|
Corporate
|
97,675 | 70,899 | 71,025 | |||||||||
| $ | 206,510 | $ | 157,761 | $ | 141,679 | |||||||
|
Depreciation
|
||||||||||||
|
Firearms
|
$ | 11,373 | $ | 8,502 | $ | 6,561 | ||||||
|
Castings
|
775 | 705 | 739 | |||||||||
| $ | 12,148 | $ | 9,207 | $ | 7,300 | |||||||
|
Capital Expenditures
|
||||||||||||
|
Firearms
|
$ | 20,719 | $ | 18,904 | $ | 13,045 | ||||||
|
Castings
|
1,416 | 505 | 774 | |||||||||
| $ | 22,135 | $ | 19,409 | $ | 13,819 | |||||||
In 2011, the Company’s largest customers and the percent of total sales they represented were as follows: Jerry’s/Ellett Brothers-15%; Davidson’s-14%; Sports South-12%; and Lipsey’s-12%.
In 2010, the Company’s largest customers and the percent of total sales they represented were as follows: Jerry’s/Ellett Brothers-16%; Davidson’s-12%; Lipsey’s-11% and Sports South-11%.
In 2009, the Company’s largest customers and the percent of total sales they represented were as follows: Jerry’s/Ellett Brothers-16%; Davidson’s-11%; Lipsey’s-11%; Sports South-11% and Big Rock-10%.
The Company’s assets are located entirely in the United States and domestic sales represent greater than 95% of total sales in 2011, 2010, and 2009.
64
15. Quarterly Results of Operations (Unaudited)
The following is a tabulation of the unaudited quarterly results of operations for the two years ended December 31, 2011:
| Three Months Ended | ||||||||||||||||
|
4/02/11
|
7/02/11
|
10/01/11
|
12/31/11
|
|||||||||||||
|
Net Sales
|
$ | 75,441 | $ | 79,622 | $ | 80,512 | $ | 93,241 | ||||||||
|
Gross profit
|
23,995 | 28,465 | 29,127 | 30,172 | ||||||||||||
|
Net income
|
7,947 | 10,813 | 10,737 | 10,518 | ||||||||||||
|
Basic earnings per share
|
0.42 | 0.57 | 0.57 | 0.55 | ||||||||||||
|
Diluted earnings per share
|
$ | 0.42 | $ | 0.56 | $ | 0.56 | $ | 0.54 | ||||||||
| Three Months Ended | ||||||||||||||||
|
4/03/10
|
7/03/10
|
10/02/10
|
12/31/10
|
|||||||||||||
|
Net Sales
|
$ | 68,276 | $ | 64,389 | $ | 58,401 | $ | 64,138 | ||||||||
|
Gross profit
|
23,131 | 21,740 | 18,583 | 20,527 | ||||||||||||
|
Net income
|
8,316 | 8,184 | 6,041 | 5,713 | ||||||||||||
|
Basic earnings per share
|
0.44 | 0.43 | 0.32 | 0.30 | ||||||||||||
|
Diluted earnings per share
|
$ | 0.43 | $ | 0.42 | $ | 0.31 | $ | 0.30 | ||||||||
16. Contingent Liabilities
As of December 31, 2011, the Company was a defendant in approximately four (4) lawsuits. The Company is aware of certain other such claims.
Lawsuits involving the Company’s products generally fall into one of two categories:
|
(i)
|
Those that claim damages from the Company related to allegedly defective product design and/or manufacture which stem from a specific incident. Pending lawsuits and claims are based principally on the theory of “strict liability” but also may be based on negligence, breach of warranty, and other legal theories; or
|
|
(ii)
|
Those brought by cities or other governmental entities, and individuals against firearms manufacturers, distributors and retailers seeking to recover damages allegedly arising out of the misuse of firearms by third-parties in the commission of homicides, suicides and other shootings involving juveniles and adults.
|
As to lawsuits of the first type, management believes that, in every case involving firearms, the allegations are unfounded, and that the shootings and any results therefrom were due to negligence or misuse of the firearms by third-parties or the claimant, and that there should be no recovery against the Company.
The only remaining lawsuit of the second type is the lawsuit filed by the City of Gary. The complaint in that case seeks damages, among other things, for the costs of medical care, police and emergency services, public health services, and other services as well as punitive damages. In addition, nuisance
65
abatement and/or injunctive relief is sought to change the design, manufacture, marketing and distribution practices of the various defendants. The suit alleges, among other claims, negligence in the design of products, public nuisance, negligent distribution and marketing, negligence per se and deceptive advertising. The case does not allege a specific injury to a specific individual as a result of the misuse or use of any of the Company’s products. Market share allegations have been held inapplicable by the Indiana Supreme Court.
The Indiana Court of Appeals affirmed the dismissal of the
Gary
case by the trial court, but the Indiana Supreme Court reversed this dismissal and remanded the case for discovery proceedings on December 23, 2003. On November 23, 2005, the defendants filed a motion to dismiss pursuant to the PLCAA. The state court judge held the PLCAA unconstitutional and the defendants filed a motion with the Indiana Court of Appeals asking it to accept interlocutory appeal on the issue, which appeal was accepted on February 5, 2007. On October 29, 2007, the Indiana Appellate Court affirmed, holding that the PLCAA does not apply to the City’s claims. A petition for rehearing was filed in the Appellate Court and denied on January 9,
2008. On February 8, 2008, a Petition to Transfer the appeal to the Supreme Court of Indiana was filed. The petition was denied on January 13, 2009 and the case was remanded to the trial court. No trial date has been set.
In addition to the foregoing, on August 18, 2009, the Company was served with a complaint captioned Steamfitters Local 449 Pension Fund, on Behalf of Itself and All Others Similarly Situated v. Sturm, Ruger & Co. Inc., et al. pending in the United States District Court for the District of Connecticut. The complaint seeks unspecified damages for alleged violations of the Securities Exchange Act of 1934 and is a purported class action on behalf of purchasers of the Company’s common stock between April 23, 2007 and October 29, 2007. On October 9, 2009, the Company waived service of a complaint captioned Alan R. Herrett, Individually and On Behalf of All Others Similarly Situated v. Sturm, Ruger & Co. Inc., et al. pending in the United States District Court for the District of
Connecticut. This matter is based upon the same facts and basic allegations set forth in the Steamfitters Local 449 Pension Fund litigation. On October 12, 2009, a motion to consolidate the two actions was filed by counsel for the Steamfitters. On January 11, 2010, the court entered an order consolidating the two matters. A consolidated amended complaint was filed on March 11, 2010. The defendants, including the Company, filed a motion to dismiss on April 26, 2010 and plaintiffs filed a response on June 18, 2010. Defendants then filed a reply in support of the motion on July 19, 2010. Oral argument was held on November 22, 2010. On February 4, 2011, the Court entered an order granting the motion to dismiss in part and denying it in part. The matter is ongoing and no scheduling order has yet been entered.
Punitive damages, as well as compensatory damages, are demanded in certain of the lawsuits and claims. Aggregate claimed amounts presently exceed product liability accruals and applicable insurance coverage. For claims made after July 10, 2000, coverage is provided on an annual basis for losses exceeding $5 million per claim, or an aggregate maximum loss of $10 million annually, except for certain new claims which might be brought by governments or municipalities after July 10, 2000, which are excluded from coverage.
The Company management monitors the status of known claims and the product liability accrual, which includes amounts for asserted and unasserted claims. While it is not possible to forecast the outcome of litigation or the timing of costs, in the opinion of management, after consultation with special and corporate counsel, it is not reasonably possible that litigation, including punitive damage claims, will have a material adverse effect on the financial position of the Company, but may have a material impact on the Company’s financial results for a particular period.
66
Product liability claim payments are made when appropriate if, as, and when claimants and the Company reach agreement upon an amount to finally resolve all claims. Legal costs are paid as the lawsuits and claims develop, the timing of which may vary greatly from case to case. A time schedule cannot be determined in advance with any reliability concerning when payments will be made in any given case.
Provision is made for product liability claims based upon many factors related to the severity of the alleged injury and potential liability exposure, based upon prior claim experience. Because our experience in defending these lawsuits and claims is that unfavorable outcomes are typically not probable or estimable, only in rare cases is an accrual established for such costs. In most cases, an accrual is established only for estimated legal defense costs. Product liability accruals are periodically reviewed to reflect then-current estimates of possible liabilities and expenses incurred to date and reasonably anticipated in the future. Threatened product liability claims are reflected in our product liability accrual on the same basis as actual claims;
i.e.
, an accrual is made for reasonably anticipated possible liability and claims-handling expenses on an ongoing basis.
A range of reasonably possible loss relating to unfavorable outcomes cannot be made. However, in product liability cases in which a dollar amount of damages is claimed, the amount of damages claimed, which totaled $5.4 million and $0.0 million at December 31, 2011 and 2010, respectively, are set forth as an indication of possible maximum liability that the Company might be required to incur in these cases (regardless of the likelihood or reasonable probability of any or all of this amount being awarded to claimants) as a result of adverse judgments that are sustained on appeal.
As of December 31, 2011 and 2010, the Company was a defendant in 3 and 1 lawsuits, respectively, involving its products and is aware of other such claims. As of December 31, 2011 and 2010, there were 1 and 1 ongoing lawsuits involving the Company’s products, respectively, from which the Company was dismissed, though the dismissals were not final. During the year ended December 31, 2011 and 2010, 2 and 0 lawsuits involving the Company’s products, respectively, were filed against the Company, 0 and 1 lawsuits involving the Company’s products, were dismissed, and 0 and 2 lawsuits involving the Company’s products, were settled.
The Company’s product liability expense was $1.6 million in 2011 and negligible in 2010. This expense includes the cost of outside legal fees, insurance, and other expenses incurred in the management and defense of product liability matters.
67
A roll-forward of the product liability reserve and detail of product liability expense for the three years ended December 31, 2011 follows:
| Cash Payments | ||||||||||||||||||||
|
Balance Beginning of Year (a
)
|
Accrued Legal Expense (Income) (b)
|
Legal Fees
(c)
|
Settlements (d)
|
Balance End of Year (a)
|
||||||||||||||||
|
2009
|
1,744 | 873 | (274 | ) | (261 | ) | 2,082 | |||||||||||||
|
2010
|
2,082 | (834 | ) | (64 | ) | (162 | ) | 1,022 | ||||||||||||
|
2011
|
1,022 | 755 | (31 | ) | - | 1,746 | ||||||||||||||
Income Statement Detail for Product Liability Expense
|
Accrued Legal Expense (b)
|
Insurance Premium Expense (e)
|
Total Product Liability Expense
|
||||||||||
|
2009
|
873 | 745 | 1,618 | |||||||||
|
2010
|
(834 | ) | 843 | 9 | ||||||||
|
2011
|
755 | 862 | 1,617 | |||||||||
Notes
| (a) |
The beginning and ending liability balances represent accrued legal fees only. Settlements and administrative costs are expensed as incurred. Only in rare instances is an accrual established for settlements.
|
| (b) | The expense accrued in the liability is for legal fees only. In 2010, the costs incurred related to cases that were settled or dismissed were less than the amounts accrued for these cases in prior years. |
| (c) | Legal fees represent payments to outside counsel related to product liability matters. |
| (d) |
Settlements represent payments made to plaintiffs or allegedly injured parties in exchange for a full and complete release of liability.
|
| (e) | Insurance expense represents the cost of insurance premiums. |
There were no insurance recoveries during any of the above years.
68
17. Financial Instruments
The Company does not hold or
issue financial instruments for trading or hedging purposes, nor does it hold interest rate, leveraged, or other types of derivative financial instruments. Fair values of short-term investments,
accounts receivable, accounts payable, accrued expenses and income taxes payable reflected in the December 31, 2011 and 2010 balance sheets approximate carrying values at those dates.
18. Subsequent Events
On February 14, 2012, the Company’s Board of Directors authorized a dividend of 21.2¢ per share to shareholders of record on March 9, 2012.
The Company’s management has evaluated transactions occurring subsequent to December 31, 2011 and determined that there were no events or transactions during that period that would have a material impact on the Company’s results of operations or financial position.
|
ITEM 9
—
|
CHANGES IN AND DISAGREEMENTS WITH ACCOUNTANTS ON
ACCOUNTING AND FINANCIAL DISCLOSURE
|
None.
Evaluation of Disclosure Controls and Procedures
The Company conducted an evaluation, with the participation of its Chief Executive Officer and Chief Financial Officer, of the effectiveness of the design and operation of the Company’s disclosure controls and procedures, as defined in Rules 13a-15(e) and 15d-15(e) under the Securities Exchange Act of 1934, as amended, as of December 31, 2011. Based upon that evaluation, the Chief Executive Officer and Chief Financial Officer have concluded that as of December 31, 2011, the Company’s disclosure controls and procedures over financial reporting were effective.
Management’s Report on Internal Control over Financial Reporting
The Company’s management is responsible for establishing and maintaining adequate internal control over financial reporting as defined in Rules 13a-15(f) and 15d-15(f) under the Securities Exchange Act of 1934. Because of its inherent limitations, internal control over financial reporting may not prevent or detect misstatements. Also, projections of any evaluation of effectiveness to future periods are subject to the risk that controls may become inadequate because of changes in conditions, or that the degree of compliance with the policies or procedures may deteriorate.
The Company conducted an evaluation, with the participation of its Chief Executive Officer and Chief Financial Officer, of the effectiveness of its internal control over financial reporting as of December 31, 2011. This evaluation was performed based on the criteria established in “Internal Control — Integrated Framework” issued by the Committee of Sponsoring Organizations of the Treadway Commission (“COSO”).
69
Management has concluded that the Company maintained effective internal control over financial reporting as of December 31, 2011, based on criteria established in “Internal Control — Integrated Framework” issued by the COSO.
The effectiveness of the Company’s internal control over financial reporting as of December 31, 2011 has been audited by McGladrey & Pullen, LLP, an independent registered public accounting firm, as stated in their report which is included in this Form 10-K.
Changes in Internal Control over Financial Reporting
There were no changes in our internal control over financial reporting that occurred during our most recently completed fiscal quarter that has materially affected, or is reasonably likely to materially affect, our internal control over financial reporting.
New York Stock Exchange Certification
Pursuant to Section 303A.12(a) of the New York Stock Exchange Listed Company Manual, the Company submitted an unqualified certification of our Chief Executive Officer to the New York Stock Exchange on May 15, 2007. The Company has also filed, as exhibits to this Annual Report on Form 10-K, the Chief Executive Officer and Chief Financial Officer Certifications required under the Sarbanes-Oxley Act of 2002.
None.
70
Information concerning the Company’s directors, including the Company’s separately designated standing audit committee, and on the Company’s code of business conduct and ethics required by this Item is incorporated by reference from the Company’s Proxy Statement relating to the 2012 Annual Meeting of Stockholders scheduled to be held May 2, 2012.
Information concerning the Company’s executive officers required by this Item is set forth in Item 1 of this Annual Report on Form 10-K under the caption “Executive Officers of the Company.”
Information concerning beneficial ownership reporting compliance required by this Item is incorporated by reference from the Company’s Proxy Statement relating to the 2012 Annual Meeting of Stockholders scheduled to be held May 2, 2012.
Information concerning director and executive compensation required by this Item is incorporated by reference from the Company’s Proxy Statement relating to the 2012 Annual Meeting of Stockholders scheduled to be held May 2, 2012.
|
ITEM 12—
|
SECURITY OWNERSHIP OF CERTAIN BENEFICIAL OWNERS AND MANAGEMENT AND RELATED STOCKHOLDER MATTERS
|
Information concerning the security ownership of certain beneficial owners and management and related stockholder matters required by this Item is incorporated by reference from the Company’s Proxy Statement relating to the 2012 Annual Meeting of Stockholders scheduled to be held May 2, 2012.
|
ITEM 13—
|
CERTAIN RELATIONSHIPS AND RELATED TRANSACTIONS AND DIRECTOR INDEPENDENCE
|
Information concerning certain relationships and related transactions required by this Item is incorporated by reference from the Company’s Proxy Statement relating to the 2012 Annual Meeting of Stockholders scheduled to be held May 2, 2012.
Information concerning the Company’s principal accountant fees and services and the pre-approval policies and procedures of the audit committee of the board of directors required by this Item is incorporated by reference from the Company’s Proxy Statement relating to the 2012 Annual Meeting of Stockholders scheduled to be held May 2, 2012.
71
|
(a)
|
Exhibits and Financial Statement Schedules
|
|
|
(1)
|
Financial Statements can be found under Item 8 of Part II of this Form 10-K
|
|
|
(2)
|
Schedules can be found on Page 8
4
of this Form 10-K
|
|
|
(3)
|
Listing of Exhibits:
|
|
Exhibit 3.1
|
Certificate of Incorporation of the Company, as amended (Incorporated by reference to Exhibits 4.1 and 4.2 to the Form S-3 Registration Statement previously filed by the Company File No. 33-62702).
|
||
|
Exhibit 3.2
|
Bylaws of the Company, as amended.
|
||
|
Exhibit 3.3
|
Amended and restated Article 3, Section 2 of Bylaws (Incorporated by reference to Exhibit 3.1 to the Company’s Current Report on Form 8-K filed with the SEC on April 24, 2007).
|
||
|
Exhibit 3.4
|
Amended and restated Article 3, Section 4 and Article 4, Section 5 of Bylaws (Incorporated by reference to Exhibit 3.1 to the Company’s Current Report on Form 8-K filed with the SEC on April 24, 2007).
|
||
|
Exhibit 3.5
|
Amended and restated Bylaws (Incorporated by reference to Exhibit 3.1 to the Company’s Current Report on Form 8-K filed with the SEC on July 26, 2007).
|
||
|
Exhibit 3.6
|
Amended and restated Bylaws (Incorporated by reference to Exhibit 3.1 to the Company’s Current Report on Form 8-K filed with the SEC on April 25, 2008).
|
||
|
Exhibit 3.7
|
Amendment to Article 5, Section 1 of Bylaws (Incorporated by reference to Exhibit 3.1 to the Company’s Current Report on Form 8-K filed with the SEC on February 6, 2009).
|
||
|
Exhibit 10.1
|
Sturm, Ruger & Company, Inc. 1986 Stock Bonus Plan (Incorporated by reference to Exhibit 10.1 to the Company’s Annual Report on Form 10-K for the year ended December 31, 1988, as amended by Form 8 filed March 27, 1990, SEC File No. 1-10435).
|
||
|
Exhibit 10.2
|
Amendment to Sturm, Ruger & Company, Inc. 1986 Stock Bonus Plan (Incorporated by reference to Exhibit 10.3 to the Company’s Annual Report on Form 10-K for the year ended December 31, 1991, SEC File No. 1-10435).
|
72
|
Exhibit 10.3
|
Sturm, Ruger & Company, Inc. Supplemental Executive Profit Sharing Retirement Plan (Incorporated by reference to Exhibit 10.4 to the Company’s Annual Report on Form 10-K for the year ended December 31, 1991, SEC File No. 1-10435).
|
||
|
Exhibit 10.4
|
Agreement and Assignment of Lease dated September 30, 1987 by and between Emerson Electric Co. and Sturm, Ruger & Company, Inc. (Incorporated by reference to Exhibit 10.2 to the Company’s Annual Report on Form 10-K for the year ended December 31, 1991, SEC File No. 1-10435).
|
||
|
Exhibit 10.5
|
Sturm, Ruger & Company, Inc. Supplemental Executive Retirement Plan (Incorporated by reference to Exhibit 10.5 to the Company’s Annual Report on Form 10-K for the year ended December 31, 1995, SEC File No. 1-10435).
|
||
|
Exhibit 10.6
|
[Intentionally omitted.]
|
|
Exhibit 10.7
|
Sturm, Ruger & Company, Inc. 1998 Stock Incentive Plan. (Incorporated by reference to Exhibit 10.7 to the Company’s Annual Report on Form 10-K for the year ended December 31, 1998, SEC File No. 1-10435).
|
||
|
Exhibit 10.8
|
Sturm, Ruger & Company, Inc. 2001 Stock Option Plan for Non-Employee Directors (Incorporated by reference to Exhibit 4 to the Form S-8 Registration Statement filed by the Company File No. 33-53234).
|
||
|
Exhibit 10.9
|
Agreement and Release, dated as of February 28, 2006, by and between Sturm, Ruger & Company, Inc. and William B. Ruger (Incorporated by reference to Exhibit 10.1 to the Company’s Current Report on Form 8-K filed with the SEC on April 4, 2006, SEC File No. 1-10435).
|
||
|
Exhibit 10.10
|
Sale and Purchase Agreement, dated as of September 26, 2006, by and between Sturm, Ruger & Company, Inc. and Ruger Business Holdings, L.P. (Incorporated by reference to Exhibit 10.1 to the Company’s Current Report on Form 8-K filed with the SEC on September 26, 2006, SEC File No. 1-10435).
|
||
|
Exhibit 10.11
|
Severance Agreement, dated as of September 21, 2006, by and between Sturm, Ruger & Company, Inc. and Stephen L. Sanetti (Incorporated by reference to Exhibit 10.1 to the Company’s Current Report on Form 8-K filed with the SEC on September 27, 2006, SEC File No. 1-10435).
|
||
|
Exhibit 10.12
|
Severance Agreement, dated as of September 21, 2006, by and between Sturm, Ruger & Company, Inc. and Thomas A. Dineen (Incorporated by reference to Exhibit 10.2 to the Company’s Current Report on Form 8-K filed with the SEC on September 27, 2006, SEC File No. 1-10435).
|
73
|
Exhibit 10.13
|
Severance Agreement, dated as of September 21, 2006, by and between Sturm, Ruger & Company, Inc. and Robert R. Stutler (Incorporated by reference to Exhibit 10.4 to the Company’s Current Report on Form 8-K filed with the SEC on September 27, 2006, SEC File No. 1-10435).
|
||
|
Exhibit 10.14
|
Offer Letter, dated as of September 5, 2006, by and between Sturm, Ruger & Company, Inc. and Michael O. Fifer (Incorporated by reference to Exhibit 10.1 to the Company’s Current Report on Form 8-K filed with the SEC on September 28, 2006, SEC File No. 1-10435).
|
||
|
Exhibit 10.15
|
Severance Agreement, dated as of December 15, 2006, by and between Sturm, Ruger & Company, Inc. and Michael O. Fifer (Incorporated by reference to Exhibit 10.1 to the Company’s Current Report on Form 8-K filed with the SEC on December 19, 2006, SEC File No. 1-10435).
|
|
Exhibit 10.16
|
Severance Agreement, dated as of December 15, 2006, by and between Sturm, Ruger & Company, Inc. and Christopher John Killoy (Incorporated by reference to Exhibit 10.2 to the Company’s Current Report on Form 8-K filed with the SEC on December 19, 2006, SEC File No. 1-10435).
|
||
|
Exhibit 10.17
|
Amended Severance Agreement, dated as of December 15, 2006, by and between Sturm, Ruger & Company, Inc. and Thomas P. Sullivan (Incorporated by reference to Exhibit 10.3 to the Company’s Current Report on Form 8-K filed with the SEC on December 19, 2006, SEC File No. 1-10435).
|
||
|
Exhibit 10.18
|
Retention and Consultation Agreement, dated December 4, 2007, by and between Sturm, Ruger & Company, Inc. and Robert R. Stutler.
|
||
|
Exhibit 10.19
|
Credit Agreement, dated as of December 14, 2007, by and between the Company and Bank of America (Incorporated by reference to Exhibit 10.18 to the Company's Current Report on Form 8-K filed with the SEC on December 20, 2007).
|
||
|
Exhibit 10.20
|
Severance Agreement, dated as of April 10, 2008, by and between the Company and Michael O. Fifer (Incorporated by reference to Exhibit 10.1 to the Company's Current Report on Form 8-K filed with the SEC on April 11, 2008).
|
||
|
Exhibit 10.21
|
Severance Agreement, dated as of April 10, 2008, by and between the Company and Thomas A. Dineen (Incorporated by reference to Exhibit 10.2 to the Company's Current Report on Form 8-K filed with the SEC on April 11, 2008).
|
||
|
Exhibit 10.22
|
Severance Agreement, dated as of April 10, 2008, by and between the Company and Mark T. Lang (Incorporated by reference to Exhibit 10.3 to the Company's Current Report on Form 8-K filed with the SEC on April 11, 2008).
|
74
|
Exhibit 10.23
|
Severance Agreement, dated as of April 10, 2008, by and between the Company and Christopher J. Killoy (Incorporated by reference to Exhibit 10.4 to the Company's Current Report on Form 8-K filed with the SEC on April 11, 2008).
|
||
|
Exhibit 10.24
|
Severance Agreement, dated as of April 10, 2008, by and between the Company and Steven M. Maynard Incorporated by reference to Exhibit 10.5 to the Company's Current Report on Form 8-K filed with the SEC on April 11, 2008).
|
||
|
Exhibit 10.25
|
Severance Agreement, dated as of April 10, 2008, by and between the Company and Thomas P. Sullivan (Incorporated by reference to Exhibit 10.6 to the Company's Current Report on Form 8-K filed with the SEC on April 11, 2008).
|
||
|
Exhibit 10.26
|
Severance Agreement, dated as of April 10, 2008, by and between the Company and Leslie M. Gasper (Incorporated by reference to Exhibit 10.7 to the Company's Current Report on Form 8-K filed with the SEC on April 11, 2008).
|
||
|
Exhibit 10.27
|
Agreement, dated as of April 10, 2008, by and between the Company and Stephen L. Sanetti (Incorporated by reference to Exhibit 10.8 to the Company's Current Report on Form 8-K/A filed with the SEC on April 30, 2008).
|
||
|
Exhibit 10.28
|
Severance Agreement, dated as of May 2, 2008 by and between the Company and Kevin B. Reid, Sr. (Incorporated by reference to Exhibit 10.1 to the Company's Current Report on Form 8-K filed with the SEC on May 5, 2008).
|
||
|
Exhibit 10.29
|
First Amendment to Credit Agreement, dated as of December 15, 2008, by and between the Company and Bank of America (Incorporated by reference to Exhibit 99.1 to the Company's Current Report on Form 8-K filed with the SEC on December 22, 2008).
|
||
|
Exhibit 10.30
|
Second Amendment to Credit Agreement, dated December 11, 2009, by and between the Company and Bank of America (Incorporated by reference to Exhibit 99.1 to the Company's Current Report on Form 8-K filed with the SEC on December 21, 2009).
|
||
|
Exhibit 23.1
|
Consent of McGladrey & Pullen, LLP
|
||
|
Exhibit 31.1
|
Certification of Chief Executive Officer Pursuant to Rule 13a-14(a) of the Exchange Act.
|
||
|
Exhibit 31.2
|
Certification of Treasurer and Chief Financial Officer Pursuant to Rule 13a-14(a) of the Exchange Act.
|
|
Exhibit 32.1
|
Certification of the Chief Executive Officer Pursuant to Rule 13a-14(b) of the Exchange Act and 18 U.S.C. Section 1350, as Adopted Pursuant to Section 906 of the Sarbanes-Oxley Act of 2002.
|
75
|
Exhibit 32.2
|
Certification of the Treasurer and Chief Financial Officer Pursuant to Rule 13a-14(b) of the Exchange Act and 18 U.S.C. Section 1350, as Adopted Pursuant to Section 906 of the Sarbanes-Oxley Act of 2002.
|
|
Exhibit 99.1
|
Item 1 LEGAL PROCEEDINGS from the Quarterly Report on Form 10-Q of the Company for the quarter ended September 30, 1999, SEC File No. 1-10435, incorporated by reference in Item 3 LEGAL PROCEEDINGS.
|
||
|
Exhibit 99.2
|
Item 1 LEGAL PROCEEDINGS from the Quarterly Report on Form 10-Q of the Company for the quarter ended July 2, 2011, SEC File No. 1-10435, incorporated by reference in Item 3 LEGAL PROCEEDINGS.
|
||
| Exhibit 99.3 |
Item 1 LEGAL PROCEEDINGS from the Quarterly Report on
Form 10-Q of the Company for the quarter ended October 1,
2011, SEC File No. 1-10435, incorporated by reference in Item 3
LEGAL PROCEEDINGS.
|
76
SIGNATURES
Pursuant to the requirements of Section 13 or 15(d) of the Securities Exchange Act of 1934, the registrant has duly caused this report to be signed on its behalf by the undersigned, thereunto duly authorized.
| STURM, RUGER & COMPANY, INC . | |
| (Registrant) | |
| /S/ THOMAS A. DINEEN | |
| Thomas A. Dineen | |
| Principal Financial Officer, | |
| Principal Accounting Officer, Vice President, | |
| Treasurer and Chief Financial Officer | |
| February 22, 2012 | |
| Date |
Pursuant to the requirements of the Securities Exchange Act of 1934, this report has been signed below by the following persons on behalf of the registrant and in the capacities and on the dates indicated.
| /S/ MICHAEL O. FIFER | 2/22/12 | /S/ JOHN A. COSENTINO, JR. | 2/22/12 | |
|
Michael O. Fifer
Chief Executive Officer, Director
(Principal Executive Officer)
|
John A. Cosentino, Jr.
Director
|
|||
| /S/ JAMES E. SERVICE | 2/22/12 | /S/ RONALD C. WHITAKER | 2/22/12 | |
|
James E. Service
Director
|
Ronald C. Whitaker
Director
|
|||
| /S/ C. MICHAEL JACOBI | 2/22/12 | /S/ PHILLIP C. WIDMAN | 2/22/12 | |
|
C. Michael Jacobi
Director
|
Phillip C. Widman
Director
|
|||
| /S/ AMIR P. ROSENTHAL | 2/22/12 | /S/ THOMAS A. DINEEN | 2/22/12 | |
|
Amir P. Rosenthal
Director
|
Thomas A. Dineen
Principal Financial Officer,
Principal Accounting Officer, Vice President, Treasurer and Chief Financial Officer
|
77
EXHIBIT INDEX
|
Page No.
|
||||
|
Exhibit 3.1
|
Certificate of Incorporation of the Company, as amended (Incorporated by reference to Exhibits 4.1 and 4.2 to the Form S-3 Registration Statement previously filed by the Company File No. 33-62702).
|
|||
|
Exhibit 3.2
|
Bylaws of the Company, as amended.
|
|||
|
Exhibit 3.3
|
Amended and restated Article 3, Section 2 of Bylaws (Incorporated by reference to Exhibit 3.1 to the Company’s Current Report on Form 8-K filed with the SEC on April 24, 2007).
|
|||
|
Exhibit 3.4
|
Amended and restated Article 3, Section 4 and Article 4, Section 5 of Bylaws (Incorporated by reference to Exhibit 3.1 to the Company’s Current Report on Form 8-K filed with the SEC on April 24, 2007).
|
|||
|
Exhibit 3.5
|
Amended and restated Bylaws (Incorporated by reference to Exhibit 3.1 to the Company’s Current Report on Form 8-K filed with the SEC on July 26, 2007).
|
|||
|
Exhibit 3.6
|
Amended and restated Bylaws (Incorporated by reference to Exhibit 3.1 to the Company’s Current Report on Form 8-K filed with the SEC on April 25, 2008).
|
|||
|
Exhibit 3.7
|
Amendment to Article 5, Section 1 of Bylaws (Incorporated by reference to Exhibit 3.1 to the Company’s Current Report on Form 8-K filed with the SEC on February 6, 2009).
|
|||
|
Exhibit 10.1
|
Sturm, Ruger & Company, Inc. 1986 Stock Bonus Plan (Incorporated by reference to Exhibit 10.1 to the Company’s Annual Report on Form 10-K for the year ended December 31, 1988, as amended by Form 8 filed March 27, 1990, SEC File No. 1-10435).
|
|||
|
Exhibit 10.2
|
Amendment to Sturm, Ruger & Company, Inc. 1986 Stock Bonus Plan (Incorporated by reference to Exhibit 10.3 to the Company’s Annual Report on Form 10-K for the year ended December 31, 1991, SEC File No. 1-10435).
|
|||
|
Exhibit 10.3
|
Sturm, Ruger & Company, Inc. Supplemental Executive Profit Sharing Retirement Plan (Incorporated by reference to Exhibit 10.4 to the Company’s Annual Report on Form 10-K for the year ended December 31, 1991, SEC File No. 1-10435).
|
|||
|
Exhibit 10.4
|
Agreement and Assignment of Lease dated September 30, 1987 by and between Emerson Electric Co. and Sturm, Ruger & Company, Inc. (Incorporated by reference to Exhibit 10.2 to the Company’s Annual Report on Form 10-K for the year ended December 31, 1991, SEC File No. 1-10435).
|
78
EXHIBIT INDEX (continued)
|
Exhibit 10.5
|
Sturm, Ruger & Company, Inc. Supplemental Executive Retirement Plan (Incorporated by reference to Exhibit 10.5 to the Company’s Annual Report on Form 10-K for the year ended December 31, 1995, SEC File No. 1-10435).
|
||
|
Exhibit 10.6
|
[Intentionally omitted.]
|
||
|
Exhibit 10.7
|
Sturm, Ruger & Company, Inc. 1998 Stock Incentive Plan. (Incorporated by reference to Exhibit 10.7 to the Company’s Annual Report on Form 10-K for the year ended December 31, 1998, SEC File No. 1-10435).
|
||
|
Exhibit 10.8
|
Sturm, Ruger & Company, Inc. 2001 Stock Option Plan for Non-Employee Directors (Incorporated by reference to Exhibit 4 to the Form S-8 Registration Statement filed by the Company File No. 33-53234).
|
||
|
Exhibit 10.9
|
Agreement and Release, dated as of February 28, 2006, by and between Sturm, Ruger & Company, Inc. and William B. Ruger (Incorporated by reference to Exhibit 10.1 to the Company’s Current Report on Form 8-K filed with the SEC on April 4, 2006, SEC File No. 1-10435).
|
||
|
Exhibit 10.10
|
Sale and Purchase Agreement, dated as of September 26, 2006, by and between Sturm, Ruger & Company, Inc. and Ruger Business Holdings, L.P. (Incorporated by reference to Exhibit 10.1 to the Company’s Current Report on Form 8-K filed with the SEC on September 26, 2006, SEC File No. 1-10435).
|
||
|
Exhibit 10.11
|
Severance Agreement, dated as of September 21, 2006, by and between Sturm, Ruger & Company, Inc. and Stephen L. Sanetti (Incorporated by reference to Exhibit 10.1 to the Company’s Current Report on Form 8-K filed with the SEC on September 27, 2006, SEC File No. 1-10435).
|
||
|
Exhibit 10.12
|
Severance Agreement, dated as of September 21, 2006, by and between Sturm, Ruger & Company, Inc. and Thomas A. Dineen (Incorporated by reference to Exhibit 10.2 to the Company’s Current Report on Form 8-K filed with the SEC on September 27, 2006, SEC File No. 1-10435).
|
||
|
Exhibit 10.13
|
Severance Agreement, dated as of September 21, 2006, by and between Sturm, Ruger & Company, Inc. and Robert R. Stutler (Incorporated by reference to Exhibit 10.4 to the Company’s Current Report on Form 8-K filed with the SEC on September 27, 2006, SEC File No. 1-10435).
|
||
|
Exhibit 10.14
|
Offer Letter, dated as of September 5, 2006, by and between Sturm, Ruger & Company, Inc. and Michael O. Fifer (Incorporated by reference to Exhibit 10.1 to the Company’s Current Report on Form 8-K filed with the SEC on September 28, 2006, SEC File No. 1-10435).
|
79
EXHIBIT INDEX (continued)
|
Exhibit 10.15
|
Severance Agreement, dated as of December 15, 2006, by and between Sturm, Ruger & Company, Inc. and Michael O. Fifer (Incorporated by reference to Exhibit 10.1 to the Company’s Current Report on Form 8-K filed with the SEC on December 19, 2006, SEC File No. 1-10435).
|
||
|
Exhibit 10.16
|
Severance Agreement, dated as of December 15, 2006, by and between Sturm, Ruger & Company, Inc. and Christopher John Killoy (Incorporated by reference to Exhibit 10.2 to the Company’s Current Report on Form 8-K filed with the SEC on December 19, 2006, SEC File No. 1-10435).
|
||
|
Exhibit 10.17
|
Amended Severance Agreement, dated as of December 15, 2006, by and between Sturm, Ruger & Company, Inc. and Thomas P. Sullivan (Incorporated by reference to Exhibit 10.3 to the Company’s Current Report on Form 8-K filed with the SEC on December 19, 2006, SEC File No. 1-10435).
|
||
|
Exhibit 10.18
|
Retention and Consultation Agreement, dated December 4, 2007, by and between Sturm, Ruger & Company, Inc. and Robert R. Stutler.
|
||
|
Exhibit 10.19
|
Credit Agreement, dated as of December 14, 2007, by and between the Company and Bank of America (Incorporated by reference to Exhibit 10.18 to the Company's Current Report on Form 8-K filed with the SEC on December 20, 2007).
|
||
|
Exhibit 10.20
|
Severance Agreement, dated as of April 10, 2008, by and between the Company and Michael O. Fifer (Incorporated by reference to Exhibit 10.1 to the Company's Current Report on Form 8-K filed with the SEC on April 11, 2008).
|
||
|
Exhibit 10.21
|
Severance Agreement, dated as of April 10, 2008, by and between the Company and Thomas A. Dineen (Incorporated by reference to Exhibit 10.2 to the Company's Current Report on Form 8-K filed with the SEC on April 11, 2008).
|
||
|
Exhibit 10.22
|
Severance Agreement, dated as of April 10, 2008, by and between the Company and Mark T. Lang (Incorporated by reference to Exhibit 10.3 to the Company's Current Report on Form 8-K filed with the SEC on April 11, 2008).
|
||
|
Exhibit 10.23
|
Severance Agreement, dated as of April 10, 2008, by and between the Company and Christopher J. Killoy (Incorporated by reference to Exhibit 10.4 to the Company's Current Report on Form 8-K filed with the SEC on April 11, 2008).
|
||
|
Exhibit 10.24
|
Severance Agreement, dated as of April 10, 2008, by and between the Company and Steven M. Maynard Incorporated by reference to Exhibit 10.5 to the Company's Current Report on Form 8-K filed with the SEC on April 11, 2008).
|
80
EXHIBIT INDEX (continued)
|
Exhibit 10.25
|
Severance Agreement, dated as of April 10, 2008, by and between the Company and Thomas P. Sullivan (Incorporated by reference to Exhibit 10.6 to the Company's Current Report on Form 8-K filed with the SEC on April 11, 2008).
|
||
|
Exhibit 10.26
|
Severance Agreement, dated as of April 10, 2008, by and between the Company and Leslie M. Gasper (Incorporated by reference to Exhibit 10.7 to the Company's Current Report on Form 8-K filed with the SEC on April 11, 2008).
|
||
|
Exhibit 10.27
|
Agreement, dated as of April 10, 2008, by and between the Company and Stephen L. Sanetti (Incorporated by reference to Exhibit 10.8 to the Company's Current Report on Form 8-K/A filed with the SEC on April 30, 2008).
|
||
|
Exhibit 10.28
|
Severance Agreement, dated as of May 2, 2008 by and between the Company and Kevin B. Reid, Sr. (Incorporated by reference to Exhibit 10.1 to the Company's Current Report on Form 8-K filed with the SEC on May 5, 2008).
|
||
|
Exhibit 10.29
|
First Amendment to Credit Agreement, dated as of December 15, 2008, by and between the Company and Bank of America (Incorporated by reference to Exhibit 99.1 to the Company's Current Report on Form 8-K filed with the SEC on December 22, 2008).
|
||
|
Exhibit 10.30
|
Second Amendment to Credit Agreement, dated December 11, 2009, by and between the Company and Bank of America (Incorporated by reference to Exhibit 99.1 to the Company's Current Report on Form 8-K filed with the SEC on December 21, 2009).
|
||
|
Exhibit 23.1
|
Consent of McGladrey & Pullen, LLP
|
||
|
Exhibit 31.1
|
Certification of Chief Executive Officer Pursuant to Rule 13a-14(a) of the Exchange Act.
|
|
|
|
Exhibit 31.2
|
Certification of Treasurer and Chief Financial Officer Pursuant to Rule 13a-14(a) of the Exchange Act.
|
|
|
|
Exhibit 32.1
|
Certification of the Chief Executive Officer Pursuant to Rule 13a-14(b) of the Exchange Act and 18 U.S.C. Section 1350, as Adopted Pursuant to Section 906 of the Sarbanes-Oxley Act of 2002.
|
|
|
|
Exhibit 32.2
|
Certification of the Treasurer and Chief Financial Officer Pursuant to Rule 13a-14(b) of the Exchange Act and 18 U.S.C. Section 1350, as Adopted Pursuant to Section 906 of the Sarbanes-Oxley Act of 2002.
|
|
81
EXHIBIT INDEX (continued)
|
Exhibit 99.1
|
Item 1 LEGAL PROCEEDINGS from the Quarterly Report on Form 10-Q of the Company for the quarter ended September 30, 1999, SEC File No. 1-10435, incorporated by reference in Item 3 LEGAL PROCEEDINGS.
|
||
|
Exhibit 99.2
|
Item 1 LEGAL PROCEEDINGS from the Quarterly Report on Form 10-Q of the Company for the quarter ended July 2, 2011, SEC File No. 1-10435, incorporated by reference in Item 3 LEGAL PROCEEDINGS.
|
||
|
Exhibit 99.3
|
Form 10-Q of the Company for the quarter ended October 1,
2011, SEC File No. 1-10435, incorporated by reference in Item 3 LEGAL PROCEEDINGS.
|
82
YEAR ENDED DECEMBER 31, 2011
STURM, RUGER & COMPANY, INC.
ITEMS 15(a)
FINANCIAL STATEMENT SCHEDULE
83
Sturm, Ruger & Company, Inc.
Schedule II—Valuation and Qualifying Accounts
(In Thousands)
|
COL. A
|
COL. B
|
COL. C
|
COL. D
|
COL. E
|
|||||||||||||
|
ADDITIONS
|
|||||||||||||||||
| (1) | (2) | ||||||||||||||||
|
Description
|
Balance at
Beginning
of Period
|
Charged
(Credited)to
Costs and
Expenses
|
Charged to
Other
Accounts
–Describe
|
Deductions
|
Balance
at End
of Period
|
||||||||||||
|
Deductions from asset accounts:
|
|||||||||||||||||
|
Allowance for doubtful accounts:
|
|||||||||||||||||
|
Year ended December 31, 2011
|
$ | 277 | $ | 92 | (a) | $ | 185 | ||||||||||
|
Year ended December 31, 2010
|
$ | 209 | $ | 68 | $ | 277 | |||||||||||
|
Year ended December 31, 2009
|
$ | 126 | $ | 92 | $ | 9 | (a) | $ | 209 | ||||||||
|
Allowance for discounts:
|
|||||||||||||||||
|
Year ended December 31, 2011
|
$ | 627 | $ | 6,148 | $ | 5,968 | (b) | $ | 807 | ||||||||
|
Year ended December 31, 2010
|
$ | 492 | $ | 5,520 | $ | 5,385 | (b) | $ | 627 | ||||||||
|
Year ended December 31, 2009
|
$ | 449 | $ | 4,869 | $ | 4,826 | (b) | $ | 492 | ||||||||
|
Excess and obsolete inventory reserve:
|
|||||||||||||||||
|
Year ended December 31, 2011
|
$ | 1,545 | $ | (225 | ) | $ | 9 | (c) | $ | 1,311 | |||||||
|
Year ended December 31, 2010
|
$ | 2,727 | $ | (1,057 | ) | $ | 125 | (c) | $ | 1,545 | |||||||
|
Year ended December 31, 2009
|
$ | 3,569 | $ | 239 | $ | 1,081 | (c) | $ | 2,727 | ||||||||
|
(a)
|
Accounts written off
|
|
(b)
|
Discounts taken
|
|
(c)
|
Inventory written off
|
84
TABLE OF CONTENTS
Part IItem 1 BusinessItem 1A Risk FactorsItem 1B Unresolved Staff CommentsItem 2 PropertiesItem 3 Legal ProceedingsItem 4 Mine Safety Disclosures Not ApplicablePart IIItem 5 Market For Registrant's Common Equity, Related Stockholder Matters and Issuer Purchases Of Equity SecuritiesItem 6 Selected Financial DataItem 7 Management's Discussion and Analysis Of Financial Condition and Results Of Operations Company OverviewItem 7 Management's Discussion and Analysis Of Financial Condition and Results Of OperationsItem 7A Quantitative and Qualitative Disclosures About Market RiskItem 8 Financial Statements and Supplementary DataItem 9 Changes in and Disagreements with Accountants on Accounting and Financial DisclosureItem 9A Controls and ProceduresItem 9B Other InformationPart IIIItem 10 Directors, Executive Officers and Corporate GovernanceItem 11 Executive CompensationItem 12 Security Ownership Of Certain Beneficial Owners and Management and Related Stockholder MattersItem 13 Certain Relationships and Related Transactions and Director IndependenceItem 14 Principal Accountant Fees and ServicesPart IVItem 15 Exhibits and Financial Statement SchedulesItem 1 Legal Proceedings From The Quarterly Report onItem 15(a)--financial Statement Schedule