|
|
|
|
|
|
|
|
|
|
|
|
|
|
|
|
|
|
|
|
|
|
|
|
|
|
|
|
|
|
|
|
|
|
|
|
|
|
|
|
|
|
|
|
|
|
|
|
|
|
|
|
|
|
|
|
Use these links to rapidly review the document
TABLE OF CONTENTS
Item 8. Financial Statements and Supplementary Data
PROVALLIANCE SAS CONSOLIDATED FINANCIAL STATEMENTS FOR THE YEARS ENDED DECEMBER 31, 2009 AND 2008
TABLE OF CONTENTS CONSOLIDATED FINANCIAL STATEMETS
UNITED STATES
SECURITIES AND EXCHANGE COMMISSION
Washington, D.C. 20549
FORM 10-K
| (Mark One) | ||
|
ý |
|
ANNUAL REPORT PURSUANT TO SECTION 13 OR 15(d) OF THE SECURITIES EXCHANGE ACT OF 1934 |
|
For the fiscal year ended June 30, 2010 |
||
|
OR |
||
|
o |
|
TRANSITION REPORT PURSUANT TO SECTION 13 OR 15(d) OF THE SECURITIES EXCHANGE ACT OF 1934 |
|
For the transition period from to |
||
Commission file number 1-12725
Regis Corporation
(Exact name of registrant as specified in its charter)
|
Minnesota
State or other jurisdiction of incorporation or organization |
41-0749934
(I.R.S. Employer Identification No.) |
|
|
7201 Metro Boulevard, Edina, Minnesota (Address of principal executive offices) |
|
55439 (Zip Code) |
(952) 947-7777
(registrant's telephone number, including area code)
Securities registered pursuant to Section 12(b) of the Act:
| Title of each class | Name of each exchange on which registered | |
|---|---|---|
|
Common Stock, par value $0.05 per share
Preferred Share Purchase Rights |
New York Stock Exchange
New York Stock Exchange |
Securities registered pursuant to Section 12(g) of the Act: None
Indicate by check mark if the registrant is a well-known seasoned issuer, as defined in Rule 405 of the Securities Act. Yes ý No o
Indicate by check mark if the registrant is not required to file reports pursuant to Section 13 or Section 15(d) of the Act. Yes o No ý
Indicate by check mark whether the registrant (1) has filed all reports required to be filed by Section 13 or 15(d) of the Securities Exchange Act of 1934 during the preceding 12 months (or for such shorter period that the registrant was required to file such reports), and (2) has been subject to such filing requirements for the past 90 days. Yes ý No o
Indicate by check mark whether the registrant has submitted electronically and posted on its corporate Web site, if any, every Interactive Data File required to be submitted and posted pursuant to Rule 405 of Regulation S-T (§ 232.405 of this chapter) during the preceding 12 months (or for such shorter period that the registrant was required to submit and post such files). Yes o No o
Indicate by check mark if disclosure of delinquent filers pursuant to Item 405 of Regulation S-K (§ 229.405 of this chapter) is not contained herein, and will not be contained, to the best of registrant's knowledge, in definitive proxy or information statements incorporated by reference in Part III of this Form 10-K or any amendment to this Form 10-K. ý
Indicate by check mark whether the registrant is a large accelerated filer, an accelerated filer, a non-accelerated filer, or a smaller reporting company. See the definitions of "large accelerated filer," "accelerated filer" and "smaller reporting company" in Rule 12b-2 of the Exchange Act.
| Large accelerated filer ý | Accelerated filer o |
Non-accelerated filer
o
(Do not check if a smaller reporting company) |
Smaller reporting company o |
Indicate by check mark whether the registrant is a shell company (as defined by Rule 12b-2 of the Act). Yes o No ý
The aggregate market value of the voting common equity held by non-affiliates computed by reference to the price at which common equity was last sold as of the last business day of the registrant's most recently completed second fiscal quarter, December 31, 2009, was approximately $879,000,000. The registrant has no non-voting common equity.
As of August 19, 2010, the registrant had 57,552,882 shares of Common Stock, par value $0.05 per share, issued and outstanding.
DOCUMENTS INCORPORATED BY REFERENCE
Portions of the registrant's definitive Proxy Statement for the annual meeting of shareholders to be held on October 28, 2010 (the "2010 Proxy Statement") (to be filed pursuant to Regulation 14A within 120 days after the registrant's fiscal year-end of June 30, 2010) are incorporated by reference into Part III.
REGIS CORPORATION
FORM 10-K
FOR THE FISCAL YEAR ENDED JUNE 30, 2010
2
Unless the context otherwise provides, when we refer to the "Company," "we," "our," or "us," we are referring to Regis Corporation, the Registrant, together with its subsidiaries.
(a) General Development of Business
In 1922, Paul and Florence Kunin opened Kunin Beauty Salon, which quickly expanded into a chain of value priced salons located in department stores. In 1958, the chain was purchased by their son and renamed Regis Corporation. In December 2004, the Company purchased Hair Club for Men and Women. On August 1, 2007, the Company contributed its 51 wholly-owned accredited cosmetology schools to Empire Education Group, Inc (EEG). On January 31, 2008, the Company merged its continental European franchise salon operations with the operations of the Franck Provost Salon Group. On February 20, 2008, the Company acquired the capital stock of Cameron Capital I, Inc. (CCI), a wholly-owned subsidiary of Cameron Capital Investments, Inc. CCI owned and operated PureBeauty and BeautyFirst salons. On February 16, 2009, the Company sold its Trade Secret salon concept (Trade Secret), which included CCI. Additionally, the Company continues to acquire hair and retail product salons. Regis Corporation is listed on the NYSE under the ticker symbol "RGS." Discussions of the general development of the business take place throughout this Annual Report on Form 10-K.
(b) Financial Information about Segments
Segment data for the years ended June 30, 2010, 2009 and 2008 are included in Note 16 to the Consolidated Financial Statements in Part II, Item 8, of this Form 10-K.
(c) Narrative Description of Business
The following topical areas are discussed below in order to aid in understanding the Company and its operations:
|
Topic
|
Page(s) | |||
|---|---|---|---|---|
|
Background |
4 | |||
|
Industry Overview |
5 | |||
|
Salon Business Strategy |
5 | |||
|
Salon Concepts |
8 | |||
|
Salon Franchising Program |
15 | |||
|
Salon Markets and Marketing |
17 | |||
|
Salon Education and Training Programs |
17 | |||
|
Salon Staff Recruiting and Retention |
17 | |||
|
Salon Design |
18 | |||
|
Salon Management Information Systems |
18 | |||
|
Salon Competition |
18 | |||
|
Hair Restoration Business Strategy |
19 | |||
|
Affiliated Ownership Interest |
20 | |||
|
Corporate Trademarks |
21 | |||
|
Corporate Employees |
21 | |||
|
Executive Officers |
21 | |||
|
Corporate Community Involvement |
22 | |||
|
Governmental Regulations |
22 | |||
3
Background:
Based in Minneapolis, Minnesota, the Company's primary business is owning, operating and franchising hair and retail product salons. In addition to the primary hair and retail product salons, the Company owns Hair Club for Men and Women, a provider of hair restoration services. As of June 30, 2010, the Company owned, franchised or held ownership interests in over 12,700 worldwide locations. The Company's locations consisted of 9,929 company-owned and franchise salons, 95 hair restoration centers, and 2,704 locations in which the Company maintains an ownership interest of less than 100 percent. Each of the Company's salon concepts offer similar salon products and services and serve the mass market consumer marketplace. The Company's hair restoration centers offer three hair restoration solutions; hair systems, hair transplants and hair therapy, which are targeted at the mass market consumer.
The Company is organized to manage its operations based on significant lines of business—salons and hair restoration centers. Salon operations are managed based on geographical location—North America and international. The Company's North American salon operations are comprised of 7,505 company-owned salons and 2,020 franchise salons operating in the United States, Canada and Puerto Rico. The Company's international operations are comprised of 404 company-owned salons. The Company's worldwide salon locations operate primarily under the trade names of Regis Salons, MasterCuts, SmartStyle, Supercuts, Cost Cutters, and Sassoon. The Company's hair restoration centers are located in the United States and Canada. During fiscal year 2010, the number of customer visits at the Company's company-owned salons approximated 94 million. The Company had approximately 56,000 corporate employees worldwide during fiscal year 2010.
On August 1, 2007, the Company contributed 51 of its wholly-owned accredited cosmetology schools to EEG in exchange for a 49.0 percent equity interest in EEG. EEG is the largest beauty school operator in North America with 96 accredited cosmetology schools with revenues of approximately $175 million annually and is overseen by the Empire Beauty School management team.
In January 2008, the Company's effective ownership interest increased to 55.1 percent related to the buyout of EEG's minority interest shareholder. The Company will continue to account for the investment in EEG under the equity method of accounting as Empire Beauty School retains majority voting interest and has full responsibility for managing EEG. Refer to Note 6 to the Consolidated Financial Statements for additional information.
On January 31, 2008, the Company merged its continental European franchise salon operations with the operations of the Franck Provost Salon Group in exchange for a 30.0 percent equity interest in the newly formed Provalliance entity (Provalliance). The merger with the operations of the Franck Provost Salon Group which are also located in continental Europe, created Europe's largest salon operator with approximately 2,500 company-owned and franchise salons as of June 30, 2010.
The Company contributed to Provalliance the shares of each of its European operating subsidiaries, other than the Company's operating subsidiaries in the United Kingdom and Germany. The contributed subsidiaries operate retail hair salons in France, Spain, Switzerland and several other European countries primarily under the Jean Louis David™ and Saint Algue™ brands. This transaction has created significant growth opportunities for Europe's salon brands. The Franck Provost Salon Group management structure has a proven platform to build and acquire company-owned stores as well as a strong franchise operating group that is positioned for expansion. The Company recorded a $25.7 million "other-than-temporary" impairment charge in its fourth quarter ended June 30, 2009 on its investment in Provalliance as a result of increased debt and reduced earnings expectations that reduced the fair value of Provalliance below carrying value as of June 30, 2009.
On February 16, 2009, the Company sold Trade Secret. The Company concluded, after a comprehensive review of its strategic and financial options, to divest Trade Secret. The sale of Trade
4
Secret included 655 company-owned salons and 57 franchise salons, all of which had historically been reported within the Company's North America reportable segment. The Company recorded an impairment charge related to this transaction of $183.3 million during the year ended June 30, 2009.
Industry Overview:
Management estimates that annual revenues of the hair care industry are approximately $50 to $55 billion in the United States and approximately $150 to $170 billion worldwide. The Company estimates that it holds approximately two percent of the worldwide market. The hair salon and hair restoration markets are each highly fragmented, with the vast majority of locations independently owned and operated. However, the influence of salon chains on these markets, both franchise and company-owned, has increased substantially. Management believes that salon chains will continue to have a significant influence on these markets and will continue to increase their presence. As the Company is the principal consolidator of these chains in the hair care industry, it prevails as an established exit strategy for independent salon owners and operators, which affords the Company numerous opportunities for continued selective acquisitions.
Salon Business Strategy:
The Company's goal is to provide high quality, affordable hair care services and products to a wide range of mass market consumers, which enables the Company to expand in a controlled manner. The key elements of the Company's strategy to achieve these goals are taking advantage of (1) growth opportunities, (2) economies of scale and (3) centralized control over salon operations in order to ensure (i) consistent, quality services and (ii) a superior selection of high quality, professional products. Each of these elements is discussed below.
Salon Growth Opportunities. The Company's salon expansion strategy focuses on organic (new salon construction and same-store sales growth of existing salons) and salon acquisition growth.
Organic Growth. The Company executes its organic growth strategy through a combination of new construction of company-owned and franchise salons, as well as same-store sales increases. The square footage requirements related to opening new salons allow the Company great flexibility in securing real estate for new salons as the Company has small or flexible square footage requirements for its salons. The Company's long-term outlook for organic expansion remains strong. The Company has at least one salon in all major cities in the U.S. and has penetrated every viable U.S. market with at least one concept. However, because the Company has a variety of concepts, it can place several of its salons within any given market. Once the economy normalizes, the Company plans to continue to expand in North America.
A key component to successful North American organic growth relates to site selection, as discussed in the following paragraphs.
Salon Site Selection. The Company's salons are located in high-traffic locations such as regional shopping malls, strip centers, lifestyle centers, Wal-Mart Supercenters, high-street locations and department stores. The Company is an attractive tenant to landlords due to its financial strength, successful salon operations and international recognition. In evaluating specific locations for both company-owned and franchise salons, the Company seeks conveniently located, visible sites which allow customers adequate parking and quick and easy location access. Various other factors are considered in evaluating sites, including area demographics, availability and cost of space, the strength of the major retailers within the area, location and strength of competitors, proximity of other company-owned and franchise salons, traffic volume, signage and other leasehold factors in a given center or area.
5
Because the Company's various salon concepts target slightly different mass market customer groups, more than one of the Company's salon concepts may be located in the same real estate development without impeding sales of either concept. As a result, there are numerous leasing opportunities for all of its salon concepts.
While same-store sales growth plays an important role in the Company's organic growth strategy, it is not critical to achieving the Company's long-term revenue growth objectives. However, same-store sales growth is important to achieving improved annual operating profit. New salon construction and salon acquisitions (described below) are expected to generate low single-digit annual revenue growth. The recent trend has been declining visitation patterns due to the current global economic condition and increasing average ticket price resulting in negative to low single-digit same-store sales growth. The Company expects fiscal year 2011 same-store sales to be in the range of negative 1.0 to positive 2.0 percent.
Pricing is a factor in same-store sales growth. The Company actively monitors the prices charged by its competitors in each market and makes every effort to maintain prices which remain competitive with prices of other salons offering similar services. Price increases are considered on a market-by-market basis and are established based on local market conditions.
Salon Acquisition Growth. In addition to organic growth, another key component of the Company's growth strategy is the acquisition of salons. With an estimated two percent worldwide market share, management believes the opportunity to continue to make selective acquisitions exists.
Over the past 16 years, the Company has acquired 8,023 salons, expanding both in North America and internationally. When contemplating an acquisition, the Company evaluates the existing salon or salon group with respect to the same characteristics as discussed above in conjunction with site selection for constructed salons (conveniently located, visible, strong retailers within the area, etc.). The Company generally acquires mature strip center locations, which are systematically integrated within the salon concept that it most clearly emulates.
In addition to adding new salon locations each year, the Company has an ongoing program of remodeling its existing salons, ranging from redecoration to substantial reconstruction. This program is implemented as management determines that a particular location will benefit from remodeling, or as required by lease renewals. A total of 333 and 280 salons had major remodels in fiscal years 2010 and 2009, respectively.
Recent Salon Additions. During fiscal year 2010, the Company constructed 217 new salons (139 company-owned and 78 franchise). Additionally, the Company acquired 26 company-owned salons, including 23 franchise salon buybacks.
During fiscal year 2009, the Company constructed 275 new salons (182 company-owned and 93 franchise). Additionally, the Company acquired 177 company-owned salons, including 83 franchise salon buybacks.
Salon Closures. The Company evaluates its salon performance on a regular basis. Upon evaluation, the Company may close a salon for operational performance or real estate issues. In either case, the closures generally occur at the end of a lease term and typically do not require significant lease buyouts. In addition, during the Company's acquisition evaluation process, the Company may identify acquired salons that do not meet operational or real estate requirements. Generally, at the time of acquisition limited value is allocated to these salons, which are usually closed within the first year.
During fiscal year 2010, 269 salons were closed, including 204 company-owned salons and 65 franchise salons (excluding 23 franchise buybacks). In June of 2009, the Company approved a
6
plan to close up to 80 underperforming United Kingdom company-owned salons in fiscal year 2010, in addition to the normal closure activity of salons at the end of a lease term. As of June 30, 2010, 36 stores under the June 2009 plan ceased using the rights to use the leased property or negotiated a lease termination agreement with the lessor in which the Company ceased using the right to the leased property subsequent to June 30, 2010. We expect to close approximately 175 company-owned salons in fiscal year 2011.
During fiscal year 2009, 313 salons were closed, including 255 company-owned salons and 58 franchise salons (excluding 83 franchise buybacks). In February of 2009, the Company sold its Trade Secret salon concept which consisted of 655 company-owned locations and 57 franchise locations. See Note 2 to the Consolidated Financial Statements for additional information. In July of 2008 (fiscal year 2009), the Company approved a plan to close up do 160 underperforming company-owned salons in fiscal year 2009. As of June 30, 2009, 69 stores under the July 2008 plan ceased using the leased property or negotiated a lease termination agreement with the lessor in which the Company will cease using the right to the leased property subsequent to June 30, 2009. See Note 11 to the Consolidated Financial Statements for additional information.
Economies of Scale. Management believes that due to its size and number of locations, the Company has certain advantages which are not available to single location salons or small chains. The Company has developed a comprehensive point of sale system to accumulate and monitor service and product sales trends, as well as assist in payroll and cash management. Economies of scale are realized through the centralized support system offered by the home office. Additionally, due to its size, the Company has numerous financing and capital expenditure alternatives, as well as the benefits of buying retail products, supplies and salon fixtures directly from manufacturers. Furthermore, the Company can offer employee benefit programs, training and career path opportunities that are often superior to its smaller competitors.
Centralized Control Over Salon Operations. The Company manages its expansive salon base through a combination of area and regional supervisors, corporate salon directors and chief operating officers. Each area supervisor is responsible for the management of approximately ten to 12 salons. Regional supervisors oversee the performance of five to seven area supervisors or approximately 50 to 80 salons. Salon directors manage approximately 200 to 300 salons while chief operating officers are responsible for the oversight of an entire salon concept. This operational hierarchy is key to the Company's ability to expand successfully. In addition, the Company has an extensive training program, including the production of training DVDs for use in the salons, to ensure its stylists are knowledgeable in the latest haircutting and fashion trends and provide consistent quality hair care services. Finally, the Company tracks salon activity for all of its company-owned salons through the utilization of daily sales detail delivered from the salons' point of sale system. This information is used to reconcile cash on a daily basis.
Consistent, Quality Service. The Company is committed to meeting its customers' hair care needs by providing competitively priced services and products with professional and knowledgeable stylists. The Company's operations and marketing emphasize high quality services to create customer loyalty, to encourage referrals and to distinguish the Company's salons from its competitors. To promote quality and consistency of services provided throughout the Company's salons, the Company employs full and part-time artistic directors whose duties are to train salon stylists in current styling trends. The major services supplied by the Company's salons are haircutting and styling (including shampooing and conditioning), hair coloring and waving. During
7
fiscal years 2010, 2009, and 2008, the percentage of company-owned service revenues attributable to each of these services was as follows:
|
|
2010 | 2009 | 2008 | |||||||
|---|---|---|---|---|---|---|---|---|---|---|
|
Haircutting and styling (including shampooing & conditioning) |
72 | % | 73 | % | 72 | % | ||||
|
Hair coloring |
18 | 17 | 18 | |||||||
|
Hair waving |
4 | 4 | 4 | |||||||
|
Other |
6 | 6 | 6 | |||||||
|
|
100 | % | 100 | % | 100 | % | ||||
High Quality, Professional Products. The Company's salons sell nationally recognized hair care and beauty products as well as a complete line of private label products sold under the Regis, MasterCuts and Cost Cutters labels. The retail products offered by the Company are intended to be sold only through professional salons. The top selling brands include Paul Mitchell, Biolage, Redken, Regis designLINE, Nioxin, It's a 10, Sexy Hair Concepts, Tigi Bedhead, Kenra, Sebastian and the Company's various private label brands.
The Company has launched a product diversion website for the entire industry to use as a measurement tool to track diversion. Diversion involves the selling of salon exclusive hair care products to unauthorized distribution channels such as discount retailers and pharmacies. Diversion is harmful to the consumer because diverted product can be old, tainted or damaged. It is also harmful to the salon owners and stylists because their credibility with the consumer may be questioned.
The Company has the most comprehensive assortment of retail products in the industry. Although the Company constantly strives to carry an optimal level of inventory in relation to consumer demand, it is more economical for the Company to have a higher amount of inventory on hand than to run the risk of being under stocked should demand prove higher than expected. The extended shelf life and lack of seasonality related to the beauty products allows the cost of carrying inventory to be relatively low and lessens the importance of inventory turnover ratios. The Company's primary goal is to maximize revenues rather than inventory turns.
The retail portion of the Company's business complements its salon services business. The Company's stylists and beauty consultants are compensated and regularly trained to sell hair care and beauty products to their customers. Additionally, customers are enticed to purchase products after a stylist demonstrates its effect by using it in the styling of the customer's hair.
Salon Concepts:
The Company's salon concepts focus on providing high quality hair care services and professional products, primarily to the middle consumer market. The Company's North American salon operations consist of 9,525 salons (including 2,020 franchise salons), operating under several concepts, each offering attractive and affordable hair care products and services in the United States, Canada and Puerto Rico. The Company's international salon operations consist of 404 hair care salons located in Europe, primarily in the United Kingdom. The number of new salons expected to be opened within the upcoming fiscal year is discussed within Management's Discussion and Analysis of Financial Condition and Results of Operations. In addition to these openings, the Company typically acquires several hundred salons each year. The number of acquired salons, and the concept under which the acquisitions will fall, vary based on the acquisition opportunities which develop throughout the year.
8
Salon Development
The table on the following pages set forth the number of system wide salons (company-owned and franchise) opened at the beginning and end of each of the last five years, as well as the number of salons opened, closed, relocated, converted and acquired during each of these periods.
COMPANY-OWNED AND FRANCHISE LOCATION SUMMARY
|
NORTH AMERICAN SALONS:
|
2010 | 2009 | 2008 | 2007 | 2006 | |||||||||||||
|---|---|---|---|---|---|---|---|---|---|---|---|---|---|---|---|---|---|---|
|
REGIS SALONS |
||||||||||||||||||
|
Open at beginning of period |
1,071 | 1,078 | 1,099 | 1,079 | 1,093 | |||||||||||||
|
Salons constructed |
14 | 20 | 14 | 17 | 38 | |||||||||||||
|
Acquired |
3 | 23 | 4 | 49 | 14 | |||||||||||||
|
Less relocations |
(11 | ) | (14 | ) | (11 | ) | (14 | ) | (16 | ) | ||||||||
|
Salon openings |
6 | 29 | 7 | 52 | 36 | |||||||||||||
|
Conversions |
— | — | 1 | (1 | ) | — | ||||||||||||
|
Salons closed |
(28 | ) | (36 | ) | (29 | ) | (31 | ) | (50 | ) | ||||||||
|
Total, Regis Salons |
1,049 | 1,071 | 1,078 | 1,099 | 1,079 | |||||||||||||
|
MASTERCUTS |
||||||||||||||||||
|
Open at beginning of period |
602 | 615 | 629 | 642 | 636 | |||||||||||||
|
Salons constructed |
15 | 14 | 7 | 15 | 32 | |||||||||||||
|
Acquired |
— | — | — | — | — | |||||||||||||
|
Less relocations |
(7 | ) | (10 | ) | (6 | ) | (12 | ) | (8 | ) | ||||||||
|
Salon openings |
8 | 4 | 1 | 3 | 24 | |||||||||||||
|
Conversions |
— | — | — | — | (2 | ) | ||||||||||||
|
Salons closed |
(10 | ) | (17 | ) | (15 | ) | (16 | ) | (16 | ) | ||||||||
|
Total, MasterCuts |
600 | 602 | 615 | 629 | 642 | |||||||||||||
|
TRADE SECRET |
||||||||||||||||||
|
Company-owned salons: |
||||||||||||||||||
|
Open at beginning of period |
— | 674 | 613 | 615 | 597 | |||||||||||||
|
Salons constructed |
— | 10 | 16 | 20 | 33 | |||||||||||||
|
Acquired |
— | — | 65 | 3 | 2 | |||||||||||||
|
Franchise buybacks |
— | — | 5 | — | 5 | |||||||||||||
|
Less relocations |
— | (4 | ) | (11 | ) | (11 | ) | (6 | ) | |||||||||
|
Salon openings |
— | 6 | 75 | 12 | 34 | |||||||||||||
|
Conversions |
— | — | 5 | 1 | 1 | |||||||||||||
|
Salons sold |
— | (655 | ) | — | — | — | ||||||||||||
|
Salons closed |
— | (25 | ) | (19 | ) | (15 | ) | (17 | ) | |||||||||
|
Total company-owned salons |
— | — | 674 | 613 | 615 | |||||||||||||
9
|
NORTH AMERICAN SALONS:
|
2010 | 2009 | 2008 | 2007 | 2006 | |||||||||||||
|---|---|---|---|---|---|---|---|---|---|---|---|---|---|---|---|---|---|---|
|
Franchise salons: |
||||||||||||||||||
|
Open at beginning of period |
— | 106 | 19 | 19 | 24 | |||||||||||||
|
Salons constructed |
— | 1 | 2 | — | — | |||||||||||||
|
Acquired |
— | — | 93 | — | — | |||||||||||||
|
Less relocations |
— | — | (1 | ) | — | — | ||||||||||||
|
Salon openings |
— | 1 | 94 | — | — | |||||||||||||
|
Franchise buybacks |
— | — | (5 | ) | — | (5 | ) | |||||||||||
|
Interdivisional reclassification(4) |
— | (43 | ) | — | — | — | ||||||||||||
|
Salons sold |
— | (57 | ) | — | — | — | ||||||||||||
|
Salons closed |
— | (7 | ) | (2 | ) | — | — | |||||||||||
|
Total franchise salons |
— | — | 106 | 19 | 19 | |||||||||||||
|
Total, Trade Secret |
— | — | 780 | 632 | 634 | |||||||||||||
|
SMARTSTYLE/COST CUTTERS IN WAL-MART |
||||||||||||||||||
|
Company-owned salons: |
||||||||||||||||||
|
Open at beginning of period |
2,300 | 2,212 | 2,000 | 1,739 | 1,497 | |||||||||||||
|
Salons constructed |
80 | 71 | 207 | 242 | 215 | |||||||||||||
|
Acquired |
— | — | — | — | — | |||||||||||||
|
Franchise buybacks |
5 | 24 | 12 | 21 | 31 | |||||||||||||
|
Less relocations |
(3 | ) | (2 | ) | (3 | ) | (2 | ) | (2 | ) | ||||||||
|
Salon openings |
82 | 93 | 216 | 261 | 244 | |||||||||||||
|
Conversions |
— | — | — | — | 1 | |||||||||||||
|
Salons closed |
(8 | ) | (5 | ) | (4 | ) | — | (3 | ) | |||||||||
|
Total company-owned salons |
2,374 | 2,300 | 2,212 | 2,000 | 1,739 | |||||||||||||
|
Franchise salons: |
||||||||||||||||||
|
Open at beginning of period |
122 | 146 | 151 | 164 | 184 | |||||||||||||
|
Salons constructed |
2 | 1 | 7 | 8 | 11 | |||||||||||||
|
Salon openings |
2 | 1 | 7 | 8 | 11 | |||||||||||||
|
Franchise buybacks |
(5 | ) | (24 | ) | (12 | ) | (21 | ) | (31 | ) | ||||||||
|
Salons closed |
— | (1 | ) | — | — | — | ||||||||||||
|
Total franchise salons |
119 | 122 | 146 | 151 | 164 | |||||||||||||
|
Total, SmartStyle/Cost Cutters in Wal-Mart |
2,493 | 2,422 | 2,358 | 2,151 | 1,903 | |||||||||||||
|
SUPERCUTS |
||||||||||||||||||
|
Company-owned salons: |
||||||||||||||||||
|
Open at beginning of period |
1,114 | 1,132 | 1,094 | 1,036 | 915 | |||||||||||||
|
Salons constructed |
10 | 27 | 33 | 45 | 76 | |||||||||||||
|
Acquired |
— | — | 3 | — | — | |||||||||||||
|
Franchise buybacks |
12 | 6 | 38 | 37 | 77 | |||||||||||||
|
Less relocations |
(2 | ) | (2 | ) | (6 | ) | (5 | ) | (9 | ) | ||||||||
|
Salon openings |
20 | 31 | 68 | 77 | 144 | |||||||||||||
|
Conversions |
— | (2 | ) | — | — | (1 | ) | |||||||||||
|
Salons closed |
(34 | ) | (47 | ) | (30 | ) | (19 | ) | (22 | ) | ||||||||
|
Total company-owned salons |
1,100 | 1,114 | 1,132 | 1,094 | 1,036 | |||||||||||||
10
|
NORTH AMERICAN SALONS:
|
2010 | 2009 | 2008 | 2007 | 2006 | |||||||||||||
|---|---|---|---|---|---|---|---|---|---|---|---|---|---|---|---|---|---|---|
|
Franchise salons: |
||||||||||||||||||
|
Open at beginning of period |
1,022 | 997 | 990 | 978 | 1,017 | |||||||||||||
|
Salons constructed |
42 | 51 | 71 | 69 | 74 | |||||||||||||
|
Acquired(2) |
— | — | — | — | — | |||||||||||||
|
Less relocations |
(6 | ) | (7 | ) | (6 | ) | (7 | ) | (7 | ) | ||||||||
|
Salon openings |
36 | 44 | 65 | 62 | 67 | |||||||||||||
|
Conversions |
9 | 1 | — | 1 | 5 | |||||||||||||
|
Franchise buybacks |
(12 | ) | (6 | ) | (38 | ) | (37 | ) | (77 | ) | ||||||||
|
Salons closed |
(21 | ) | (14 | ) | (20 | ) | (14 | ) | (34 | ) | ||||||||
|
Total franchise salons |
1,034 | 1,022 | 997 | 990 | 978 | |||||||||||||
|
Total, Supercuts |
2,134 | 2,136 | 2,129 | 2,084 | 2,014 | |||||||||||||
|
PROMENADE |
||||||||||||||||||
|
Company-owned salons: |
||||||||||||||||||
|
Open at beginning of period |
2,450 | 2,399 | 2,223 | 1,995 | 1,813 | |||||||||||||
|
Salons constructed |
18 | 36 | 33 | 56 | 104 | |||||||||||||
|
Acquired |
— | 71 | 135 | 193 | 122 | |||||||||||||
|
Franchise buybacks |
6 | 53 | 95 | 35 | 27 | |||||||||||||
|
Less relocations |
(10 | ) | (16 | ) | (8 | ) | (12 | ) | (12 | ) | ||||||||
|
Salon openings |
14 | 144 | 255 | 272 | 241 | |||||||||||||
|
Conversions |
— | 1 | (5 | ) | — | (1 | ) | |||||||||||
|
Salons closed |
(82 | ) | (94 | ) | (74 | ) | (44 | ) | (58 | ) | ||||||||
|
Total company-owned salons |
2,382 | 2,450 | 2,399 | 2,223 | 1,995 | |||||||||||||
|
Franchise salons: |
||||||||||||||||||
|
Open at beginning of period |
901 | 914 | 1,008 | 1,026 | 1,085 | |||||||||||||
|
Salons constructed |
34 | 40 | 49 | 66 | 61 | |||||||||||||
|
Acquired(2) |
— | — | — | — | — | |||||||||||||
|
Less relocations |
(9 | ) | (7 | ) | (5 | ) | (12 | ) | (11 | ) | ||||||||
|
Salon openings |
25 | 33 | 44 | 54 | 50 | |||||||||||||
|
Conversions |
(9 | ) | — | — | (1 | ) | (3 | ) | ||||||||||
|
Franchise buybacks |
(6 | ) | (53 | ) | (95 | ) | (35 | ) | (27 | ) | ||||||||
|
Interdivisional reclassification(4) |
— | 43 | — | — | — | |||||||||||||
|
Salons closed |
(44 | ) | (36 | ) | (43 | ) | (36 | ) | (79 | ) | ||||||||
|
Total franchise salons |
867 | 901 | 914 | 1,008 | 1,026 | |||||||||||||
|
Total, Promenade |
3,249 | 3,351 | 3,313 | 3,231 | 3,021 | |||||||||||||
11
|
INTERNATIONAL SALONS(1):
|
2010 | 2009 | 2008 | 2007 | 2006 | |||||||||||||
|---|---|---|---|---|---|---|---|---|---|---|---|---|---|---|---|---|---|---|
|
Company-owned salons: |
||||||||||||||||||
|
Open at beginning of period |
444 | 472 | 481 | 453 | 426 | |||||||||||||
|
Salons constructed |
2 | 4 | 15 | 25 | 33 | |||||||||||||
|
Acquired |
— | — | 25 | 12 | 10 | |||||||||||||
|
Franchise buybacks |
— | — | — | 4 | 2 | |||||||||||||
|
Less relocations |
— | (1 | ) | (1 | ) | (3 | ) | (4 | ) | |||||||||
|
Salon openings |
2 | 3 | 39 | 38 | 41 | |||||||||||||
|
Conversions |
— | — | 1 | — | (2 | ) | ||||||||||||
|
Affiliated joint ventures |
— | — | (40 | ) | — | — | ||||||||||||
|
Salons closed |
(42 | ) | (31 | ) | (9 | ) | (10 | ) | (12 | ) | ||||||||
|
Total company-owned salons |
404 | 444 | 472 | 481 | 453 | |||||||||||||
|
Franchise salons: |
||||||||||||||||||
|
Open at beginning of period |
— | — | 1,574 | 1,587 | 1,592 | |||||||||||||
|
Salons constructed |
— | — | 50 | 110 | 111 | |||||||||||||
|
Acquired(2) |
— | — | — | — | — | |||||||||||||
|
Less relocations |
— | — | — | (1 | ) | — | ||||||||||||
|
Salon openings |
— | — | 50 | 109 | 111 | |||||||||||||
|
Conversions |
— | — | 3 | — | 2 | |||||||||||||
|
Franchise buybacks |
— | — | — | (4 | ) | (2 | ) | |||||||||||
|
Affiliated joint ventures(3) |
— | — | (1,587 | ) | — | — | ||||||||||||
|
Salons closed |
— | — | (40 | ) | (118 | ) | (116 | ) | ||||||||||
|
Total franchise salons |
— | — | — | 1,574 | 1,587 | |||||||||||||
|
Total, International Salons |
404 | 444 | 472 | 2,055 | 2,040 | |||||||||||||
|
TOTAL SYSTEM WIDE SALONS |
||||||||||||||||||
|
Company-owned salons: |
||||||||||||||||||
|
Open at beginning of period |
7,981 | 8,582 | 8,139 | 7,559 | 6,977 | |||||||||||||
|
Salons constructed |
139 | 182 | 325 | 420 | 531 | |||||||||||||
|
Acquired |
3 | 94 | 232 | 257 | 148 | |||||||||||||
|
Franchise buybacks |
23 | 83 | 150 | 97 | 142 | |||||||||||||
|
Less relocations |
(33 | ) | (49 | ) | (46 | ) | (59 | ) | (57 | ) | ||||||||
|
Salon openings |
132 | 310 | 661 | 715 | 764 | |||||||||||||
|
Conversions |
— | (1 | ) | 2 | — | (4 | ) | |||||||||||
|
Affiliated joint ventures |
— | — | (40 | ) | — | — | ||||||||||||
|
Salons sold |
— | (655 | ) | — | — | — | ||||||||||||
|
Salons closed |
(204 | ) | (255 | ) | (180 | ) | (135 | ) | (178 | ) | ||||||||
|
Total company-owned salons |
7,909 | 7,981 | 8,582 | 8,139 | 7,559 | |||||||||||||
12
|
INTERNATIONAL SALONS(1):
|
2010 | 2009 | 2008 | 2007 | 2006 | |||||||||||||
|---|---|---|---|---|---|---|---|---|---|---|---|---|---|---|---|---|---|---|
|
Franchise salons: |
||||||||||||||||||
|
Open at beginning of period |
2,045 | 2,163 | 3,742 | 3,774 | 3,902 | |||||||||||||
|
Salons constructed |
78 | 93 | 179 | 253 | 257 | |||||||||||||
|
Acquired(2) |
— | — | 93 | — | — | |||||||||||||
|
Less relocations |
(15 | ) | (14 | ) | (12 | ) | (20 | ) | (18 | ) | ||||||||
|
Salon openings |
63 | 79 | 260 | 233 | 239 | |||||||||||||
|
Conversions |
— | 1 | 3 | — | 4 | |||||||||||||
|
Franchise buybacks |
(23 | ) | (83 | ) | (150 | ) | (97 | ) | (142 | ) | ||||||||
|
Affiliated joint ventures |
— | — | (1,587 | ) | — | — | ||||||||||||
|
Salons sold |
— | (57 | ) | — | — | — | ||||||||||||
|
Salons closed |
(65 | ) | (58 | ) | (105 | ) | (168 | ) | (229 | ) | ||||||||
|
Total franchise salons |
2,020 | 2,045 | 2,163 | 3,742 | 3,774 | |||||||||||||
|
Total Salons |
9,929 | 10,026 | 10,745 | 11,881 | 11,333 | |||||||||||||
- (1)
-
Canadian
and Puerto Rican salons are included in the Regis Salons, MasterCuts, Supercuts, and Promenade and not included in the international salon totals.
- (2)
-
Represents
primarily the acquisition of franchise networks.
- (3)
-
Represents
European operating subsidiaries contributed to Franck Provost Salon Group.
- (4)
- On February 16, 2009, the Company announced the completion of the sale of its Trade Secret retail product division. As a result of this transaction, the Company reported the Trade Secret operations as discontinued operations for all periods presented. Forty-three franchise salons were not included in the sale of Trade Secret to the purchaser of Trade Secret and are not reported as discontinued operations. These franchise salons are now included in Promenade salons.
In the preceding table, relocations represent a transfer of location by the same salon concept and conversions represent the transfer of one concept to another concept.
Regis Salons. Regis Salons are primarily mall based, full service salons providing complete hair care and beauty services aimed at moderate to upscale, fashion conscious consumers. In recent years, the Company has expanded its Regis Salons into strip centers. As of June 30, 2010, of the 1,049 total Regis Salons, 157 Regis Salons were located in strip centers. The customer mix at Regis Salons is approximately 78 percent women and both appointments and walk-in customers are common. These salons offer a full range of custom styling, cutting, hair coloring and waving services, as well as, professional hair care products. Service revenues represent approximately 84 percent of the concept's total revenues. The average ticket is approximately $41. Regis Salons compete in their existing markets primarily by emphasizing the high quality of the services provided. Included within the Regis Salon concept are various other trade names, including Carlton Hair, Sassoon, Mia & Maxx Hair Studios, Hair by Stewarts and Heidi's.
The average initial capital investment required for a new Regis Salon is approximately $175,000 to $225,000, excluding average opening inventory costs of approximately $19,100. Average annual salon revenues in a Regis Salon which has been open five years or more are approximately $411,000.
MasterCuts. MasterCuts is a full service, mall based salon group which focuses on the walk-in consumer (no appointment necessary) that demands moderately priced hair care services. MasterCuts salons emphasize quality hair care services, affordable prices and time saving services for the entire family. These salons offer a full range of custom styling, cutting, hair coloring and waving services as well as professional hair care products. The customer mix at MasterCuts is split relatively evenly between men and women. Service revenues compose approximately 82 percent of the concept's total revenues. The average ticket is approximately $21.
13
The average initial capital investment required for a new MasterCuts salon is approximately $150,000 to $200,000, excluding average opening inventory costs of approximately $14,600. Average annual salon revenues in a MasterCuts salon which has been open five years or more are approximately $283,000.
SmartStyle. The SmartStyle salons share many operating characteristics of the Company's other salon concepts; however, they are located exclusively in Wal-Mart Supercenters. SmartStyle has a walk-in customer base, pricing is promotional and services are focused on the family. These salons offer a full range of custom styling, cutting, hair coloring and waving services as well as professional hair care products. The customer mix at SmartStyle Salons is approximately 76 percent women. Professional retail product sales contribute considerably to overall revenues at approximately 34 percent. Additionally, the Company has 119 franchise salons located in Wal-Mart Supercenters. The average ticket is approximately $20.
The average initial capital investment required for a new SmartStyle salon is approximately $35,000 to $45,000, excluding average opening inventory costs of approximately $14,800. Average annual salon revenues in a SmartStyle salon which has been open five years or more are approximately $258,000.
Strip Center Salons. The Company's Strip Center Salons are comprised of company-owned and franchise salons operating in strip centers across North America under the following concepts:
Supercuts. The Supercuts concept provides consistent, high quality hair care services and professional products to its customers at convenient times and locations and at a reasonable price. This concept appeals to men, women and children, although male customers account for approximately 65 percent of the customer mix. Service revenues represent approximately 89 percent of total company-owned Supercuts revenues. The average ticket is approximately $17.
The average initial capital investment required for a new Supercuts salon is approximately $110,000 to $120,000, excluding average opening inventory costs of approximately $8,100. Average annual salon revenues in a company-owned Supercuts salon which has been open five years or more are approximately $269,000.
The Supercuts franchise salons provide consistent, high quality hair care services and professional products to customers at convenient times and locations and at a reasonable price. These Supercuts franchise salons appeal to men, women and children. Service revenues represent approximately 93 percent of the Supercuts franchise total revenues. Average annual revenues in a Supercuts franchise salon which has been open five years or more are approximately $332,000.
Cost Cutters (franchise salons). The Cost Cutters concept is a full service salon concept providing value priced hair care services for men, women and children. These full service salons also sell a complete line of professional hair care products. The customer mix at Cost Cutters is split relatively evenly between men and women. Average annual salon revenues in a franchised Cost Cutters salon which has been open five years or more are approximately $277,000.
In addition to the franchise salons, the Company operates company-owned Cost Cutters salons, as discussed below under Promenade Salons.
Promenade Salons. Promenade Salons are made up of successful regional company-owned salon groups acquired over the past several years operating under the primary concepts of Hair Masters, Cool Cuts for Kids, Style America, First Choice Haircutters, Famous Hair, Cost Cutters, BoRics, Magicuts, Holiday Hair and TGF, as well as other concept names. Most concepts offer a full range of custom hairstyling, cutting, coloring and waving, as well as hair care products. Hair Masters offers moderately-priced services to a predominately female demographic, while the other concepts primarily cater to time-pressed, value-oriented families. The customer mix is split relatively evenly between men
14
and women at most concepts. Service revenues represent approximately 89 percent of total company-owned Promenade revenues. The average ticket is approximately $19.
The average initial capital investment required for a new Promenade Salon is approximately $85,000 to $95,000, excluding average opening inventory costs of approximately $8,600. Average annual salon revenues in a Promenade Salon which has been open five years or more are approximately $239,000.
Other Franchise Concepts. This group of franchise salons includes primarily First Choice Haircutters, Magicuts, Beauty Supply Outlets and Pro-Cuts. These concepts function primarily in the high volume, value priced hair care market segment, with key selling features of value, convenience, quality and friendliness, as well as a complete line of professional hair care products. In addition to these franchise salons, the Company operates company-owned First Choice Haircutters and Magicuts salons, as previously discussed above under Strip Center Salons.
International Salons. The Company's international salons are comprised of company-owned salons operating in the United Kingdom primarily under the Supercuts, Regis and Sassoon concepts. These salons offer similar levels of service as the North American salons previously mentioned. However, the initial capital investment required is typically between £135,000, and £145,000, for a Regis salon, between £55,000 and £65,000 for a Supercuts salon. Average annual salon revenues for a salon which has been open five years or more are approximately £222,000 in a Regis salon and £209,000 in a Supercuts salon. Sassoon is one of the world's most recognized names in hair fashion and appeals to women and men looking for a prestigious full service hair salon. Salons are usually located on prominent high-street locations and offer a full range of custom hairstyling, cutting, coloring and waving, as well as professional hair care products. The initial capital investment required is approximately £450,000. Average annual salon revenues for a salon which has been open five years or more is approximately £882,000.
Salon Franchising Program:
General. The Company has various franchising programs supporting its 2,020 franchise salons as of June 30, 2010, consisting mainly of Supercuts, Cost Cutters, First Choice Haircutters, Magicuts, and Pro Cuts. These salons have been included in the discussions regarding salon counts and concepts on the preceding pages.
The Company provides its franchisees with a comprehensive system of business training, stylist education, site approval and lease negotiation, professional marketing, promotion and advertising programs, and other forms of support designed to help the franchisee build a successful business.
Standards of Operations. The Company does not control the day to day operations of its franchisees, including hiring and firing, establishing prices to charge for products and services, business hours, personnel management and capital expenditure decisions. However, the franchise agreements afford certain rights to the Company, such as the right to approve location, suppliers and the sale of a franchise. Additionally, franchisees are required to conform to the Company's established operational policies and procedures relating to quality of service, training, design and decor of stores, and trademark usage. The Company's field personnel make periodic visits to franchise stores to ensure that the stores are operating in conformity with the standards for each franchising program. All of the rights afforded the Company with regard to the franchise operations allow the Company to protect its brands, but do not allow the Company to control the franchise operations or make decisions that have a significant impact on the success of the franchise salons.
To further ensure conformity, the Company may enter into the lease for the store site directly with the landlord, and subsequently sublease the site to the franchisee. The franchise agreement and sublease provide the Company with the right to terminate the sublease and gain possession of the store
15
if the franchisee fails to comply with the Company's operational policies and procedures. See Note 10 to the Consolidated Financial Statements for further information about the Company's commitments and contingencies, including leases.
Franchise Terms. Pursuant to their franchise agreement with the Company, each franchisee pays an initial fee for each store and ongoing royalties to the Company. In addition, for most franchise concepts, the Company collects advertising funds from franchisees and administers the funds on behalf of the concept. Franchisees are responsible for the costs of leasehold improvements, furniture, fixtures, equipment, supplies, inventory, payroll costs and certain other items, including initial working capital.
Additional information regarding each of the major franchisee brands is listed below:
Supercuts (North America)
The majority of existing Supercuts franchise agreements have a perpetual term, subject to termination of the underlying lease agreement or termination of the franchise agreement by either the Company or the franchisee. The agreements also provide the Company a right of first refusal if the store is to be sold. The franchisee must obtain the Company's approval in all instances where there is a sale of the franchise. The current franchise agreement is site specific and does not provide any territorial protection to a franchisee, although some older franchise agreements do include limited territorial protection. Development agreements for new markets include limited territory protection for the Supercuts concept. The Company has a comprehensive impact policy that resolves potential conflicts among Supercuts franchisees and/or the Company's Supercuts locations regarding proposed salon sites.
Cost Cutters, First Choice Haircutters and Magicuts (North America)
The majority of existing Cost Cutters' franchise agreements have a 15 year term with a 15 year option to renew (at the option of the franchisee), while the majority of First Choice Haircutters' franchise agreements have a ten year term with a five year option to renew. The majority of Magicuts' franchise agreements have a term equal to the greater of five years or the current initial term of the lease agreement with an option to renew for two additional five year periods. All of the agreements also provide the Company a right of first refusal if the store is to be sold. The franchisee must obtain the Company's approval in all instances where there is a sale of the franchise. The current franchise agreement is site specific. Franchisees may enter into development agreements with the Company which provide limited territorial protection.
Pro Cuts (North America)
The majority of existing Pro Cuts franchise agreements have a ten year term with a ten year option to renew. The agreements also provide the Company a right of first refusal if the store is to be sold or transferred. The current franchise agreement is site specific. Franchisees may enter into development agreements with the Company which provide limited territorial protection.
Franchisee Training. The Company provides new franchisees with training, focusing on the various aspects of store management, including operations, personnel management, marketing fundamentals and financial controls. Existing franchisees receive training, counseling and information from the Company on a continuous basis. The Company provides store managers and stylists with extensive technical training for Supercuts franchises. For further description of the Company's education and training programs, see the "Salon Education and Training Programs" section of this document.
16
Salon Markets and Marketing:
The Company maintains various advertising, sales and promotion programs for its salons, budgeting a predetermined percent of revenues for such programs. The Company has developed promotional tactics and institutional sales messages for each of its concepts targeting certain customer types and positioning each concept in the marketplace. Print, radio, television and billboard advertising are developed and supervised at the Company's headquarters, but most advertising is done in the immediate market of the particular salon.
Most franchise concepts maintain separate advertising funds (the Funds), that provide comprehensive advertising and sales promotion support for each system. The Supercuts advertising fund is the Company's largest advertising fund and is administered by a council consisting of primarily franchisee representatives. The council has overall control of all of the funds expenditures and operates in accordance with terms of the franchise operating and other agreements. All stores, company-owned and franchised, contribute to the Funds, the majority of which are allocated to the contributing market for media placement and local marketing activities. The remainder is allocated for the creation of national advertising campaigns and system wide activities. This intensive advertising program creates significant consumer awareness, a strong concept image and high loyalty.
Salon Education and Training Programs:
The Company has an extensive hands-on training program for its stylists which emphasizes both technical training in hairstyling and cutting, hair coloring, waving and hair treatment regimes as well as customer service and product sales. The objective of the training programs is to ensure that customers receive professional and quality services, which the Company believes will result in more repeat customers, referrals and product sales.
The Company has full- and part-time artistic directors who train the stylists in techniques for providing the salon services and instruct the stylists in current styling trends. Stylist training is achieved through seminars, workshops and DVD based programs. The Company was the first in its industry to develop a DVD based training system in its salons and currently has over 200 DVD titles designed to enhance technical skills of stylists.
The Company has a customer service training program to improve the interaction between employees and customers. Staff members are trained in the proper techniques of customer greeting, telephone courtesy and professional behavior through a series of professionally designed video tapes and instructional seminars.
The Company also provides regulatory compliance training for all its field employees. This training is designed to help supervisors and stylists understand employee regulatory requirements and compliance with these standards.
Salon Staff Recruiting and Retention:
Recruiting quality managers and stylists is essential to the establishment and operation of successful salons. In search of salon managers, the Company's supervisory team recruits or develops and promotes from within those stylists that display initiative and commitment. The Company has been and believes it will continue to be successful in recruiting capable managers and stylists. The Company believes that its compensation structure for salon managers and stylists is competitive within the industry. Stylists benefit from the Company's high-traffic locations and receive a steady source of new business from walk-in customers. In addition, the Company offers a career path with the opportunity to move into managerial and training positions within the Company.
17
Salon Design:
The Company's salons are designed, built and operated in accordance with uniform standards and practices developed by the Company based on its experience. Salon fixtures and equipment are generally uniform, allowing the Company to place large orders for these items with cost savings due to the economies of scale.
The size of the Company's salons ranges from 500 to 5,000 square feet, with the typical salon having about 1,200 square feet. At present, the cost to the Company of normal tenant improvements and furnishing of a new salon, including inventories, ranges from approximately $25,000 to $225,000, depending on the size of the salon and the concept. Less than ten percent of all new salons will have costs greater than normal with a cost between $225,000 and $500,000 to furnish. International Sassoon salons costs could be even greater than the ranges above. Of the total leasehold costs, approximately 70 percent of the cost is for leasehold improvements and the balance is for salon fixtures, equipment and inventories.
The Company maintains its own design and real estate department, which designs and supervises the leasehold installations, furnishing and fixturing of all new company-owned salons and certain franchise locations. The Company has developed considerable expertise in designing salons. The design and real estate staff focus on visual appeal, efficient use of space, cost and rapid completion times.
Salon Management Information Systems:
At all of its company-owned salons, the Company utilizes a point-of-sale (POS) information system to collect daily sales information and customer demographics. Salon employees deposit cash receipts into a local bank account on a daily basis. The POS system sends the amount expected to be deposited to the corporate office, where the amount is reconciled daily with local deposits transferred into a centralized corporate bank account. The customer information is then used to determine effectiveness of promotions and the loyalty base of each salon that feed into salon operational decisions. The information is also used to generate payroll information, monitor salon performance, manage salon staffing and payroll costs, and anticipate industry pricing and staffing trends. The corporate information systems deliver information on product sales to improve its inventory control system, including recommendations for each salon of monthly product replenishments. Recent innovations to increase inventory cycle counts and install high speed connections at each salon are expected to improve stylist productivity and improve customer satisfaction with the checkout process.
Management believes that its information systems provide the Company with operational efficiencies as well as advantages in planning and analysis which are generally not available to competitors. The Company continually reviews and improves its information systems to ensure systems and processes are kept up to date and that they will meet the growing needs of the Company. The goal of information systems is to maximize the overall value to the business while improving the output per dollar spent by implementing cost-effective solutions and services.
Salon Competition:
The hair care industry is highly fragmented and competitive. In every area in which the Company has a salon, there are competitors offering similar hair care services and products at similar prices. The Company faces competition within malls from companies which operate salons within department stores and from smaller chains of salons, independently owned salons and, to a lesser extent, salons which, although independently owned, are operating under franchises from a franchising company that may assist such salons in areas of training, marketing and advertising.
At the individual salon level the barriers to enter the market are not considerable, however, significant barriers exist for chains to expand nationally due to the need to establish systems and
18
infrastructure, recruitment of experienced hair care management and adequate store staff, and leasing of quality sites. The principal factors of competition in the affordable hair care category are quality, consistency and convenience. The Company continually strives to improve its performance in each of these areas and to create additional points of differentiation versus the competition. In order to obtain locations in shopping malls, the Company must be competitive as to rentals and other customary tenant obligations.
Hair Restoration Business Strategy:
In December 2004, the Company acquired Hair Club for Men and Women (Hair Club), the largest U.S. provider of hair loss solutions and the only company offering a comprehensive menu of proven hair loss products and services. The Company leverages its strong brand, best-in-class service model and comprehensive menu of hair restoration alternatives to build an increasing base of repeat customers that generate recurring cash flow for the Company. From its traditional non-surgical hair replacement systems, to hair transplants, hair therapies and hair care products and services, Hair Club offers a solution for anyone experiencing or anticipating hair loss. The Company's operations consist of 95 locations (33 franchise locations) in the United States and Canada. The domestic hair restoration market is estimated to generate over $4 billion annually. The competitive landscape is highly fragmented and comprised of approximately 4,000 locations. Hair Club and its franchisees have the largest market share, with approximately five percent based on customer count.
In an effort to provide privacy to its customers, Hair Club offices are located primarily in office and professional buildings within larger metropolitan areas. Following is a summary of the company-owned and franchise hair restoration centers in operation at June 30, 2010, 2009, and 2008:
|
|
2010 | 2009 | 2008 | |||||||||
|---|---|---|---|---|---|---|---|---|---|---|---|---|
|
Company-owned hair restoration centers: |
||||||||||||
|
Open at beginning of period |
62 | 57 | 49 | |||||||||
|
Constructed |
4 | 8 | 3 | |||||||||
|
Acquired |
— | — | — | |||||||||
|
Franchise buybacks |
— | 2 | 6 | |||||||||
|
Less relocations |
(4 | ) | (5 | ) | (1 | ) | ||||||
|
Site openings |
— | 5 | 8 | |||||||||
|
Sites closed |
— | — | — | |||||||||
|
Total company-owned hair restoration centers |
62 | 62 | 57 | |||||||||
|
Franchise hair restoration centers: |
||||||||||||
|
Open at beginning of period |
33 | 35 | 41 | |||||||||
|
Acquired |
— | — | 2 | |||||||||
|
Franchise buybacks |
— | (2 | ) | (6 | ) | |||||||
|
Less Relocations |
— | — | (2 | ) | ||||||||
|
Site openings |
— | (2 | ) | (6 | ) | |||||||
|
Sites closed |
— | — | — | |||||||||
|
Total franchise hair restoration centers |
33 | 33 | 35 | |||||||||
|
Total hair restoration centers |
95 | 95 | 92 | |||||||||
Hair Restoration Growth Opportunities. The Company's hair restoration center expansion strategy focuses on organic growth (successfully converting new leads into customers at existing centers, broadening the menu of services and products at each location and to a lesser extent, new center construction) and acquisition growth.
19
Organic Growth. The hair restoration centers' business model is driven by productive lead generation that ultimately produces recurring customers. The primary marketing vehicle is direct response television in the form of infomercials that create leads into the hair restoration centers' telemarketing center. Call center employees receive calls and schedule a consultation at a local hair restoration company-owned or franchise center. At the consultation, sales consultants assess the needs of each individual client and educate them on the hair restoration centers' suite of hair loss solutions.
The Company's long term outlook for organic expansion remains favorable due to several factors, including favorable industry dynamics, addressing new market opportunities, menu expansion, developing new locations and new cross marketing initiatives. The aging "baby boomer" population is expanding the number of individuals within the hair restoration centers' target market. This group of individuals is entering their peak years of disposable income and has demonstrated a willingness to improve their physical appearance.
In 2003, Hair Club began marketing to women and changed its name to Hair Club for Men and Women. This represents a large and relatively untapped market. Women now represent approximately 35 percent of new customers.
Currently, all locations offer hair systems, hair therapy and hair care products. Among the hair restoration centers' product offerings are hair transplants. The hair restoration centers employ a hub and spoke strategy for hair transplants. As of June 30, 2010, 29 locations were equipped and staffed to perform the procedure. Currently, a total of 65 hair restoration centers offer this service to their customers. The Company plans to add the capability to conduct hair transplants to more centers in future periods.
Company-owned-and franchise hair restoration centers are located in markets representing 74 percent of all U.S. television (TV) households. The Company's hair restoration centers advertise on cable TV to over 85 million households. There is an opportunity to add a limited number of new centers in under penetrated markets.
Hair Restoration Acquisition Growth. The Company plans to supplement organic growth with opportunistic acquisition activity. The hair restoration industry is comprised of a highly-fragmented group of 4,000 locations. This landscape provides an opportunity for consolidation. Given the existing coverage of Hair Club locations, it is anticipated that transactions may involve the acquisition of customer lists, rather than physical locations.
Affiliated Ownership Interests:
The Company maintains ownership interests in salons and beauty schools. The primary ownership interests are in Provalliance, EEG and Hair Club for Men, Ltd., which are accounted for as equity method investments.
The Company maintains a 30.0 percent ownership interest in Provalliance. The fiscal year 2008 merger of the operations of the European operating subsidiaries with the Franck Provost Salon Group created a newly formed entity, Provalliance. The Franck Provost Salon Group management structure has a proven platform to build and acquire company-owned stores as well as a strong franchise operating group that is positioned for expansion.
The Company maintains a 55.1 percent ownership interest in EEG. Contributing the Company's beauty schools in fiscal year 2008 to EEG leverages EEG's management expertise, while enabling the Company to maintain a vested interest in the highly profitable beauty school industry.
The Company maintains a 50.0 percent ownership in Hair Club for Men, Ltd. Hair Club for Men, Ltd. operates Hair Club centers in Illinois and Wisconsin.
20
Corporate Trademarks:
The Company holds numerous trademarks, both in the United States and in many foreign countries. The most recognized trademarks are "Regis Salons," "Supercuts," "MasterCuts," "SmartStyle," "Cost Cutters," "Hair Masters," "First Choice Haircutters," "Magicuts" and "Hair Club for Men and Women."
"Sassoon" is a registered trademark of Procter & Gamble. The Company has a license agreement to use the Sassoon name for existing salons and academies, and new salon development.
Although the Company believes the use of these trademarks is an element in establishing and maintaining its reputation as a national operator of high quality hairstyling salons, and is committed to protecting these trademarks by vigorously challenging any unauthorized use, the Company's success and continuing growth are the result of the quality of its salon location selections and real estate strategies.
Corporate Employees:
During fiscal year 2010, the Company had approximately 56,000 full- and part-time employees worldwide, of which approximately 49,000 employees were located in the United States. None of the Company's employees are subject to a collective bargaining agreement and the Company believes that its employee relations are amicable.
Information relating to Executive Officers of the Company follows:
|
Name
|
Age | Position | |||
|---|---|---|---|---|---|
|
Paul D. Finkelstein |
68 | Chairman of the Board of Directors, President and Chief Executive Officer | |||
|
Randy L. Pearce |
55 | Senior Executive Vice President, Chief Financial and Administrative Officer | |||
|
Bruce Johnson |
57 | Executive Vice President, Design and Construction | |||
|
Mark Kartarik |
54 | Executive Vice President, Regis Corporation and President, Franchise Division | |||
|
Norma Knudsen |
52 | Executive Vice President, Merchandising | |||
|
Gordon Nelson |
59 | Executive Vice President, Fashion, Education and Marketing | |||
|
Eric A. Bakken |
43 | Executive Vice President, General Counsel and Secretary | |||
Paul D. Finkelstein has served as Chairman of the Board of Directors and CEO since 2004. He served as President and Chief Executive Officer from 1996 to 2004, as President and Chief Operating Officer from 1988 to 1996 and as Executive Vice President from 1987 to 1988.
Randy L. Pearce has served as Senior Executive Vice President since 2006. He served as Executive Vice President from 1999 to 2006, as Chief Administrative Officer since 1999 and as Chief Financial Officer since 1998. Additionally, he was Senior Vice President, Finance from 1998 to 1999, Vice President of Finance from 1995 to 1997 and Vice President of Financial Reporting from 1991 to 1994. During fiscal year 2006, he was also elected Director and Audit Committee Chair of Dress Barn, Inc., which operates a chain of women's apparel specialty stores.
Bruce Johnson has served as Executive Vice President of Real Estate and Construction since 2007. He served as Senior Vice President from 1997 to 2007 and in other roles with the Company from 1977 to 1997.
Mark Kartarik has served as Executive Vice President of Regis Corporation since 2007. He served as Senior Vice President from 2001 to 2007, as President of Supercuts, Inc. from 1998 to 2001, as Chief
21
Operating Officer of Supercuts, Inc. from 1997 to 1998 and in other roles with the Company from 1984 to 1997.
Norma Knudsen has served as Executive Vice President, Merchandising since July 2006. She served as Chief Operating Officer, Trade Secret from February 1999 through 2009 and as Vice President, Trade Secret Operations from 1995 to 1999.
Gordon Nelson has served as Executive Vice President, Fashion, Education and Marketing of the Company since 2006. He served as Senior Vice President from 1994 to 2006 and in other roles with the Company from 1977 to 1994.
Eric A. Bakken has served as Executive Vice President since 2010. He served as Senior Vice President from 2006 to 2009, General Counsel from 2004 to 2006, as Vice President, Law from 1998 to 2004 and as a lawyer to the Company from 1994 to 1998.
Corporate Community Involvement:
Many of the Company's stylists volunteer their time to support charitable events for breast cancer research. Proceeds collected from such events are distributed through the Regis Foundation for Breast Cancer Research. The Company's community involvement also includes a major sponsorship role for the Susan G. Komen Twin Cities Race for the Cure. This 5K run and one mile walk is held in Minneapolis, Minnesota on Mother's Day to help fund breast cancer research, education, screening and treatment. Through its community involvement efforts, the Company has helped raise millions of dollars in fundraising for breast cancer research.
Governmental Regulations:
The Company is subject to various federal, state, local and provincial laws affecting its business as well as a variety of regulatory provisions relating to the conduct of its beauty related business, including health and safety.
In the United States, the Company's franchise operations are subject to the Federal Trade Commission's Trade Regulation Rule on Franchising (the FTC Rule) and by state laws and administrative regulations that regulate various aspects of franchise operations and sales. The Company's franchises are offered to franchisees by means of an offering circular/disclosure document containing specified disclosures in accordance with the FTC Rule and the laws and regulations of certain states. The Company has registered its offering of franchises with the regulatory authorities of those states in which it offers franchises and in which such registration is required. State laws that regulate the franchisor-franchisee relationship presently exist in a substantial number of states and, in certain cases, apply substantive standards to this relationship. Such laws may, for example, require that the franchisor deal with the franchisee in good faith, may prohibit interference with the right of free association among franchisees, and may limit termination of franchisees without payment of reasonable compensation. The Company believes that the current trend is for government regulation of franchising to increase over time. However, such laws have not had, and the Company does not expect such laws to have, a significant effect on the Company's operations.
In Canada, the Company's franchise operations are subject to both the Alberta Franchise Act and the Ontario Franchise Act. The offering of franchises in Canada occurs by way of a disclosure document, which contains certain disclosures required by the Ontario and Alberta Franchise Acts. Both the Ontario and Alberta Franchise Acts primarily focus on disclosure requirements, although each requires certain relationship requirements such as a duty of fair dealing and the right of franchisees to associate and organize with other franchisees.
22
Governmental regulations surrounding franchise operations in Europe are similar to those in the United States. The Company believes it is operating in substantial compliance with applicable laws and regulations governing all of its operations.
The Company maintains an ownership interest in EEG. Beauty schools derive a significant portion of their revenue from student financial assistance originating from the U.S Department of Education's Title IV Higher Education Act of 1965. For the students to receive financial assistance at the school, the beauty schools must maintain eligibility requirements established by the U.S Department of Education.
Financial Information about Foreign and North American Operations
Financial information about foreign and North American markets is incorporated herein by reference to Management's Discussion and Analysis of Financial Condition and Results of Operations in Part II, Item 7 and segment information in Note 16 to the Consolidated Financial Statements in Part II, Item 8 of this Form 10-K.
Available Information
The Company is subject to the informational requirements of the Securities and Exchange Act of 1934 (Exchange Act). The Company therefore files periodic reports, proxy statements and other information with the Securities and Exchange Commission (SEC). Such reports may be obtained by visiting the Public Reference Room of the SEC at 100 F Street NE, Washington, DC 20549, or by calling the SEC at 1-800-SEC-0330. In addition, the SEC maintains an internet site ( http://www.sec.gov ) that contains reports, proxy and information statements and other information regarding issuers that file electronically.
Financial and other information can be accessed in the Investor Information section of the Company's website at www.regiscorp.com . The Company makes available, free of charge, copies of its annual report on Form 10-K, quarterly reports on Form 10-Q, current reports on Form 8-K, and amendments to those reports filed or furnished pursuant to Section 13(a) or 15(d) of the Exchange Act as soon as reasonably practicable after filing such material electronically or otherwise furnishing it to the SEC.
The results and impact of our announcement that our Board authorized the exploration of strategic alternatives to enhance shareholder value are uncertain and cannot be determined.
In August 2010, we announced that our Board authorized the exploration of strategic alternatives to enhance shareholder value, which could result in, among other things, a sale of the Company. There can be no assurance that the review of strategic alternatives will result in any agreement or transaction, or that if an agreement is executed, that a transaction will be consummated. We do not intend to disclose developments with respect to this review (whether or not material) unless and until the Board has approved a specific course of action or terminated the exploration of strategic alternatives. In connection with our exploration of strategic alternatives, we expect to incur expenses associated with identifying and evaluating strategic alternatives. The process of exploring strategic alternatives may be disruptive to our business operations and could make it more difficult to pursue acquisitions and retain personnel. The inability to effectively manage the process and any resulting agreement or transaction could materially and adversely affect our business, financial condition or results of operations.
23
Our business and our industry are affected by cyclical and global economic factors, including the risk of a prolonged recession.
Our financial results are substantially dependent upon overall economic conditions in the United States and in Europe. A prolonged or a deepening recession in the United States, or globally, could further decrease the demand for our products and services substantially below current levels and adversely affect our business. Our industry has historically been vulnerable to significant declines in consumption and product and service pricing during prolonged periods of economic downturn such as at present.
Recessions and other periods of economic dislocation typically result in a lower level of discretionary income for consumers. To the extent discretionary income declines, consumers may be more likely to reduce discretionary spending. This could result in our salon customers lengthening their visitation patterns, foregoing salon treatments or using home treatments as a substitute. It could also result in our hair restoration patients decreasing the amount spent on hair restoration treatments.
The current economic conditions have affected our financial results for the fiscal years ended June 30, 2010 and 2009. Our comparable same-store sales results for the twelve months ended June 30, 2010 declined 3.2 percent compared to the twelve months ended June 30, 2009. We impaired $35.3 million of goodwill associated with our Regis salon concept during fiscal year 2010. Also, we impaired $41.7 million of goodwill associated with our salon concepts in the United Kingdom and $25.7 million of our investment in Provalliance during fiscal year 2009. If the economic downturn continues to result in negative same-store sales and we are unable to offset the impact with operational savings, our financial results may be further affected. We may be required to take additional impairment charges and to impair certain long-lived assets, goodwill and investments, and such impairments could be material to our consolidated balance sheet and results of operations. The concepts that have the highest likelihood of impairment are Regis and Promenade.
Changes in the general economic environment may impact our business and results of operations.
Changes to the United States, Canadian, United Kingdom, Asian and other European economies have an impact on our business. General economic factors that are beyond our control, such as interest rates, recession, inflation, deflation, tax rates and policy, energy costs, unemployment trends, and other matters that influence consumer confidence and spending, may impact our business. In particular, visitation patterns to our salons and hair restoration centers can be adversely impacted by increases in unemployment rates and decreases in discretionary income levels.
If we continue to have negative same-store sales our business and results of operations may be affected.
Our success depends, in part, upon our ability to improve sales, as well as both gross margins and operating margins. Comparable same-store sales are affected by average ticket and same-store customer visits. A variety of factors affect same-store customer visits, including fashion trends, competition, current economic conditions, changes in our product assortment, the success of marketing programs and weather conditions. These factors may cause our comparable same-store sales results to differ materially from prior periods and from our expectations. Our comparable same-store sales results for the twelve months ended June 30, 2010 declined 3.2 percent compared to the twelve months ended June 30, 2009.
If we are unable to improve our comparable same-store sales on a long-term basis or offset the impact with operational savings, our financial results may be affected. Furthermore, continued declines in same-store sales performance may cause us to be in default of certain covenants in our financing arrangements.
24
Changes in our key relationships may adversely affect our operating results.
We maintain key relationships with certain companies, including Wal-Mart. Termination or modification of any of these relationships, including Wal-Mart, could significantly reduce our revenues and have a material and adverse impact on our business, our operating results and our ability to grow.
Changes in fashion trends may impact our revenue.
Changes in consumer tastes and fashion trends can have an impact on our financial performance. For example, trends in wearing longer hair may reduce the number of visits to, and therefore, sales at our salons.
Changes in regulatory and statutory laws may result in increased costs to our business.
With approximately 12,700 locations and 56,000 employees worldwide, our financial results can be adversely impacted by regulatory or statutory changes in laws. Due to the number of people we employ, laws that increase minimum wage rates or increase costs to provide employee benefits may result in additional costs to our company. Compliance with new, complex and changing laws may cause our expenses to increase. In addition, any non-compliance with these laws could result in fines, product recalls and enforcement actions or otherwise restrict our ability to market certain products, which could adversely affect our business, financial condition and results of operations. We are also subject to laws that affect the franchisor-franchisee relationship.
If we are not able to successfully compete in our business segments, our financial results may be affected.
Competition on a market by market basis remains strong. Therefore, our ability to raise prices in certain markets can be adversely impacted by this competition. If we are not able to raise prices, our ability to grow same-store sales and increase our revenue and earnings may be impaired.
If our joint ventures are unsuccessful our financial results may be affected.
We have entered into joint venture arrangements with other companies in the hair salon and beauty school businesses in order to maintain and expand our operations in the United States, Asia and continental Europe. If our joint venture partners are unwilling or unable to devote their financial resources or marketing and operational capabilities to our joint venture businesses, or if any of our joint ventures are terminated, we may not be able to realize anticipated revenues and profits in the countries where our joint ventures operate and our business could be materially adversely affected. If our joint venture arrangements are not successful, we may have a limited ability to terminate or modify these arrangements. If any of our joint ventures are terminated, there can be no assurance that we will be able to attract new joint venture partners to continue the activities of the terminated joint venture or to operate independently in the countries in which the terminated joint venture conducted business.
We are subject to default risk on our accounts and notes receivable.
We have outstanding accounts and notes receivable subject to collectability. For example, as of June 30, 2010, $31.6 million was due to the Company from the purchaser of Trade Secret. On July 6, 2010, the purchaser of Trade Secret filed for Chapter 11 bankruptcy. The Company has a security interest in the assets of the purchaser of Trade Secret, that the Company believes fully collateralizes the $31.6 million. If the counterparties are unable to repay the amounts due or if payment becomes unlikely our results of operations would be adversely affected.
25
Changes in manufacturers' choice of distribution channels may negatively affect our revenues.
The retail products that we sell are licensed to be carried exclusively by professional salons. The products we purchase for sale in our salons are purchased pursuant to purchase orders, as opposed to long-term contracts and generally can be terminated by the producer without much advance notice. Should the various product manufacturers decide to utilize other distribution channels, such as large discount retailers, it could negatively impact the revenue earned from product sales.
Changes to interest rates and foreign currency exchange rates may impact our results from operations.
Changes in interest rates will have an impact on our expected results from operations. Currently, we manage the risk related to fluctuations in interest rates through the use of variable rate debt instruments and other financial instruments.
If we fail to protect the security of personal information about our customers, we could be subject to costly government enforcement actions or private litigation and our reputation could suffer.
The nature of our business involves processing, transmission and storage of personal information about our customers. If we experience a data security breach, we could be exposed to government enforcement actions and private litigation. In addition, our customers could lose confidence in our ability to protect their personal information, which could cause them to stop visiting our salons altogether. Such events could lead to lost future sales and adversely affect our results of operations.
Certain of the terms and provisions of the convertible notes we issued in July 2009 may adversely affect our financial condition and operating results and impose other risks.
In July 2009, we issued $172.5 million aggregate principal amount of our 5.0 percent convertible senior notes due 2014 in a public offering. Certain terms of the notes we issued may adversely affect our financial condition and operating results or impose other risks, such as the following:
- •
-
Holders of notes may convert their notes into shares of our common stock, which may dilute the ownership interest of our
shareholders,
- •
-
If we elect to settle all or a portion of the conversion obligation exercised by holders of the notes through the payment
of cash, it could adversely affect our liquidity,
- •
-
Holders of notes may require us to purchase their notes upon certain fundamental changes, and any failure by us to
purchase the notes in such event would result in an event of default with respect to the notes,
- •
-
The fundamental change provisions contained in the notes may delay or prevent a takeover attempt of the Company that might
otherwise be beneficial to our investors,
- •
-
Recent changes in the accounting method for convertible debt securities that may be settled in cash require us to include
both the current period's amortization of the debt discount and the instrument's coupon interest as interest expense, which will decrease our financial results,
- •
-
Our ability to pay principal and interest on the notes depends on our future operating performance and any failure by us
to make scheduled payments could allow the note holders to declare all outstanding principal and interest to be due and payable, result in termination of other debt commitments and foreclosure
proceedings by other lenders, or force us into bankruptcy or liquidation, and
- •
- The debt obligations represented by the notes may limit our ability to obtain additional financing, require us to dedicate a substantial portion of our cash flow from operations to pay our debt, limit our ability to adjust rapidly to changing market conditions and increase our vulnerability to downtowns in general economic conditions in our business.
26
None.
The Company's corporate offices are headquartered in a 270,000 square foot, four building complex in Edina, Minnesota owned or leased by the Company. The Company also operates small offices in Toronto, Canada; Coventry and London, England; and Boca Raton, Florida. These offices are occupied under long-term leases.
The Company owns distribution centers located in Chattanooga, Tennessee and Salt Lake City, Utah. The Chattanooga facility currently utilizes 250,000 square feet while the Salt Lake City facility utilizes 210,000 square feet. The Salt Lake City facility may be expanded to 290,000 square feet to accommodate future growth.
The Company operates all of its salon locations and hair replacement centers under leases or license agreements. Substantially all of its North American locations in regional malls are operating under leases with an original term of at least ten years. Salons operating within strip centers and Wal-Mart Supercenters have leases with original terms of at least five years, generally with the ability to renew, at the Company's option, for one or more additional five year periods. Salons operating within department stores in Canada and Europe operate under license agreements, while freestanding or shopping center locations in those countries have real property leases comparable to the Company's domestic locations.
The Company also leases the premises in which certain franchisees operate and has entered into corresponding sublease arrangements with the franchisees. These leases have a five year initial term and one or more five year renewal options. All lease costs are passed through to the franchisees. Remaining franchisees, who do not enter into sublease arrangements with the Company, negotiate and enter into leases on their own behalf.
None of the Company's salon leases is individually material to the operations of the Company, and the Company expects that it will be able to renew its leases on satisfactory terms as they expire. See Note 10 to the Consolidated Financial Statements in Part II, Item 8 of this Form 10-K.
The Company is a defendant in various lawsuits and claims arising out of the normal course of business. Like certain other large retail employers, the Company has been faced with allegations of purported class-wide consumer and wage and hour violations. Litigation is inherently unpredictable and the outcome of these matters cannot presently be determined. Although company counsel believes that the Company has valid defenses in these matters, it could in the future incur judgments or enter into settlements of claims that could have a material adverse effect on its results of operations in any particular period.
During fiscal year 2010, the Company recorded a $5.2 million charge related to the settlement of two legal claims regarding certain customer and employee matters. Additionally, the Company has commitment to provide discount coupons. As of June 30, 2010, there was a $4.3 million remaining liability recorded within accrued expenses related to the settlements.
27
(a) Market Price of and Dividends on the Registrant's Common Equity and Related Stockholder Matters; Performance Graph
Regis common stock is listed and traded on the New York Stock Exchange under the symbol "RGS."
The accompanying table sets forth the high and low closing bid quotations for each quarter during fiscal years 2010 and 2009 as reported by the New York Stock Exchange (under the symbol "RGS"). The quotations reflect inter-dealer prices, without retail mark-up, mark-down or commission, and may not necessarily represent actual transactions.
As of August 19, 2010, Regis shares were owned by approximately 22,400 shareholders based on the number of record holders and an estimate of individual participants in security position listings. The common stock price was $17.03 per share on August 19, 2010.
|
|
2010 | 2009 | |||||||||||
|---|---|---|---|---|---|---|---|---|---|---|---|---|---|
|
Fiscal Quarter
|
High | Low | High | Low | |||||||||
|
1 st Quarter |
$ | 18.46 | $ | 11.90 | $ | 31.96 | $ | 24.34 | |||||
|
2 nd Quarter |
17.54 | 14.89 | 27.83 | 8.21 | |||||||||
|
3 rd Quarter |
19.02 | 14.95 | 16.02 | 9.81 | |||||||||
|
4 th Quarter |
20.46 | 15.55 | 20.36 | 13.94 | |||||||||
The Company paid quarterly dividends of $0.04 per share in fiscal years 2010 and 2009. The Company expects to continue paying regular quarterly dividends for the foreseeable future.
Notwithstanding anything to the contrary set forth in any of our previous filings under the Securities Act of 1933 or the Securities Exchange Act of 1934 that might incorporate future filings or this Annual Report, the following performance graph and accompanying data shall not be deemed to be incorporated by reference into any such filings. In addition, they shall not be deemed to be "soliciting material" or "filed" with the SEC.
The following graph compares the cumulative total shareholder return on the Company's stock for the last five years with the cumulative total return of the Standard and Poor's 500 Stock Index and the cumulative total return of a peer group index (the "Peer Group") constructed by the Company. In addition, the Company has included the Standard and Poor's 400 Midcap Index and the Dow Jones Consumer Services Index in this analysis because the Company believes these two indices provide a comparative correlation to the cumulative total return of an investment in shares of Regis Corporation.
The Peer Group consists of the following companies: Advance Auto Parts, Inc., AutoZone, Inc., Brinker International, Inc., CBRL Group, Inc., DineEquity, Inc., Foot Locker, Inc., GameStop Corp., H&R Block, Inc., Jack in the Box, Inc., Papa John's International, Inc., PetSmart, Inc., RadioShack Corp., Service Corporation International, and Starbucks Corp. The Peer Group is a self-constructed peer group of companies with comparable annual revenues, the customer service element is a critical component to the business and targets moderate customers in terms of income and style, excluding apparel companies.
The comparison assumes the initial investment of $100 in the Company's Common Stock, the S&P 500 Index, the Peer Group, the S&P 400 Midcap Index and the Dow Jones Consumer Services Index on June 30, 2005 and those dividends, if any, were reinvested.
28
Comparison of 5 Year Cumulative Total Return
Assumes Initial Investment of $100
June 2010
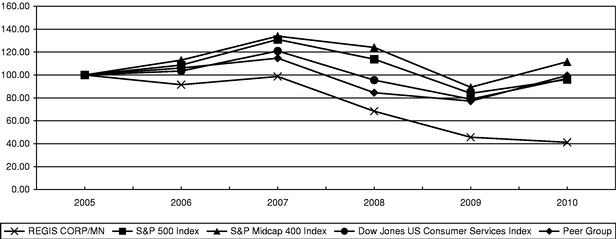
|
|
2005 | 2006 | 2007 | 2008 | 2009 | 2010 | |||||||||||||
|---|---|---|---|---|---|---|---|---|---|---|---|---|---|---|---|---|---|---|---|
|
Regis |
100.00 | 91.51 | 98.70 | 68.37 | 45.66 | 41.23 | |||||||||||||
|
S & P 500 |
100.00 | 108.63 | 131.00 | 113.81 | 83.98 | 96.09 | |||||||||||||
|
S & P 400 Midcap |
100.00 | 112.98 | 133.89 | 124.07 | 89.30 | 111.56 | |||||||||||||
|
Dow Jones Consumer Service Index |
100.00 | 103.47 | 120.97 | 95.54 | 78.85 | 96.92 | |||||||||||||
|
Peer Group |
100.00 | 106.08 | 114.69 | 84.53 | 77.20 | 99.54 | |||||||||||||
(b) Share Repurchase Program
In May 2000, the Company's Board of Directors (BOD) approved a stock repurchase program. Originally, the program authorized up to $50.0 million to be expended for the repurchase of the Company's stock. The BOD elected to increase this maximum to $100.0 million in August 2003, to $200.0 million on May 3, 2005, and to $300.0 million on April 26, 2007. The timing and amounts of any repurchases will depend on many factors, including the market price of the common stock and overall market conditions. Historically, the repurchases to date have been made primarily to eliminate the dilutive effect of shares issued in conjunction with acquisitions, restricted stock grants and stock option exercises. All repurchased shares become authorized but unissued shares of the Company. This repurchase program has no stated expiration date. As of June 30, 2010, 2009, and 2008, a total accumulated 6.8 million shares have been repurchased for $226.5 million. As of June 30, 2010, $73.5 million remains to be spent on share repurchases under this program.
The Company did not repurchase any of its common stock through its share repurchase program during the twelve months ended June 30, 2010.
CEO and CFO Certifications
The certifications by our chief executive officer and chief financial officer required under Section 302 of the Sarbanes-Oxley Act of 2002, have been filed as exhibits to this Annual Report on Form 10-K. Our CEO's annual certification pursuant to NYSE Corporate Governance Standards Section 303A.12(a) that our CEO was not aware of any violation by the Company of the NYSE's Corporate Governance listing standards was submitted to the NYSE on November 9, 2009.
29
Beginning with the period ended December 31, 2008 the operations of Trade Secret concept within the North American reportable segment were accounted for as a discontinued operation. All periods presented will reflect Trade Secret as a discontinued operation. The following discussion of results of operations will reflect results from continuing operations. Discontinued operations will be discussed at the end of this section.
The following table sets forth, in thousands (except per share data), for the periods indicated, selected financial data derived from the Company's Consolidated Financial Statements in Part II, Item 8.
|
|
2010 | 2009 | 2008 | 2007 | 2006 | |||||||||||
|---|---|---|---|---|---|---|---|---|---|---|---|---|---|---|---|---|
|
Revenues(a) |
$ | 2,358,434 | $ | 2,429,787 | $ | 2,481,391 | $ | 2,373,338 | $ | 2,168,002 | ||||||
|
Operating income(b) |
97,218 | 109,073 | 173,340 | 141,506 | 179,147 | |||||||||||
|
Income from continuing operations(c) |
39,579 | 6,970 | 83,901 | 67,739 | 92,903 | |||||||||||
|
Income from continuing operations per diluted share(c) |
0.71 | 0.16 | 1.92 | 1.48 | 2.00 | |||||||||||
|
Total assets |
1,919,572 | 1,892,486 | 2,235,871 | 2,132,114 | 1,985,324 | |||||||||||
|
Long-term debt, including current portion |
440,029 | 634,307 | 764,747 | 709,231 | 622,269 | |||||||||||
|
Dividends declared |
$ | 0.16 | $ | 0.16 | $ | 0.16 | $ | 0.16 | $ | 0.16 | ||||||
- a)
-
Revenues
from salons, schools or hair restorations centers acquired each year were $17.8, $82.1, $110.0, $105.1, and $158.3 million during fiscal
years 2010, 2009, 2008, 2007, and 2006, respectively. Revenues from the 51 accredited cosmetology schools contributed to Empire Education Group, Inc. on August 1, 2007 were $5.6, $68.5,
and $48.2 million in fiscal years 2008, 2007, and 2006, respectively. Revenues from the deconsolidated European franchise salon operations were $36.2, $57.0, and $52.7 million in fiscal
years 2008, 2007, and 2006, respectively.
- b)
-
The
following significant items affected operating income:
- •
-
An impairment charge of $35.3 million associated with the Company's Regis salon concept, was recorded in fiscal
year 2010. An impairment charge of $41.7 million associated with the Company's United Kingdom salon division, was recorded in fiscal year 2009. An impairment charge of $23.0 million
associated with the Company's accredited cosmetology schools was recorded in fiscal year 2007.
- •
-
Adjustments were recorded in fiscal years 2010, 2009, 2008, 2007, and 2006 related to a change in estimate of the
Company's self-insurance accruals, primarily prior years' workers' compensation claims reserves, due to the continued improvement of our safety and return-to-work
programs over the recent years as well as changes in state laws. Site operating expenses decreased by $1.7, $9.9, $6.9, and $10.0 million in fiscal years 2010, 2009, 2008, and 2007,
respectively, and increased by $0.9 million in fiscal year 2006 as a result in the change in estimate.
- •
-
Expenses of $6.4, $10.2, $6.1, $5.1, $6.9 million related to the impairment of property and equipment at
underperforming locations were recorded during fiscal years 2010, 2009, 2008, 2007, and 2006, respectively.
- •
- Charges of $2.1, $5.7, and $5.7 million were recorded in fiscal years 2010, 2009, and 2006, respectively associated with disposal charges and lease termination fees related to the closure of salons other than in the normal course of business.
30
- •
-
During fiscal year 2010, the Company recorded a $5.2 million charge related to the settlement of two legal claims
regarding certain customer and employee matters. Fiscal year 2006 includes a $2.8 million charge related to the settlement of a wage and hour lawsuit under the Fair Labor Standards Act (FLSA).
- •
-
Operating (loss) income from the 51 accredited cosmetology schools contributed to Empire Education Group, Inc. on
August 1, 2007 was $(0.3), $(18.6), and $2.3 million in fiscal years 2008, 2007, and 2006, respectively. Operating income from the deconsolidated European franchise salon operations was
$5.1, $7.5, and $4.8 million in fiscal years 2008, 2007, and 2006, respectively.
- •
-
A net settlement gain of $33.7 million was recognized during fiscal year 2006 stemming from a termination fee
collected from Alberto-Culver Company due to the terminated merger agreement for Sally Beauty Company. The termination fee gain is net of direct transaction-related expenses associated with the
terminated merger agreement.
- c)
-
The
following significant items affected income from continuing operations and income from continuing operations per diluted
share:
- •
-
Fiscal year 2010 includes interest expense of $18.0 million related to make-whole payments and other
fees associated with the repayment of private placement debt.
- •
-
An income tax charge of approximately $3.8 million was recorded during fiscal year 2009 associated with an
adjustment to correct our prior year deferred income tax balances. An income tax charge of approximately $3.0 million of which $1.3 million was recorded through income tax expense and
$1.7 million was recorded through other comprehensive income during fiscal year 2008 was associated with repatriating approximately $30.0 million of cash previously considered to be
indefinitely reinvested outside of the United States.
- •
- Impairment charges of $25.7 and $7.8 million associated with the Company's investment in Provalliance and for the full carrying value of our investment in and loans to Intelligent Nutrients, LLC were recorded in fiscal year 2009.
Management's Discussion and Analysis of Financial Condition and Results of Operations (MD&A) is designed to provide a reader of our financial statements with a narrative from the perspective of our management on our financial condition, results of operations, liquidity and certain other factors that may affect our future results. Our MD&A is presented in five sections:
- •
-
Management's Overview
- •
-
Critical Accounting Policies
- •
-
Overview of Fiscal Year 2010 Results
- •
-
Results of Operations
- •
- Liquidity and Capital Resources
MANAGEMENT'S OVERVIEW
Regis Corporation (RGS) owns or franchises beauty salons and hair restoration centers. As of June 30, 2010, we owned, franchised or held ownership interests in over 12,700 worldwide locations. Our locations consisted of 9,929 system wide North American and international salons, 95 hair restoration centers, and 2,704 locations in which we maintain an ownership interest less than 100 percent. Our salon concepts offer generally similar products and services and serve mass market
31
consumers. Our salon operations are organized to be managed based on geographical location. Our North American salon operations include 9,525 salons, including 2,020 franchise salons, operating in the United States, Canada and Puerto Rico primarily under the trade names of Regis Salons, MasterCuts, SmartStyle, Supercuts and Cost Cutters. Our international salon operations include 404 salons located in Europe, primarily in the United Kingdom. Hair Club for Men and Women includes 95 North American locations, including 33 franchise locations. During fiscal year 2010, we had approximately 56,000 corporate employees worldwide.
Our growth strategy consists of two primary, but flexible, components. Through a combination of organic and acquisition growth, we seek to achieve our long-term objective of six to ten percent annual revenue growth. We anticipate that going forward, the mix of organic and acquisition growth will be roughly equal. However, depending on several factors, including the ability of our salon development program to keep pace with the availability of real estate for new construction, hair restoration lead generation, the availability of attractive acquisition candidates and same-store sales trends, this mix will vary from year to year. Due to the current economic conditions we have recently reduced the pace of our new salon development and salon acquisitions. We expect to continue with our historical trend of building and/or acquiring 700 to 1,000 salons each year once the economy normalizes.
Maintaining financial flexibility is a key element in continuing our successful growth. With strong operating cash flow and balance sheet, we are confident that we will be able to financially support our long-term growth objectives.
Salon Business
The strength of our salon business is in the fundamental similarity and broad appeal of our salon concepts that allow flexibility and multiple salon concept placements in shopping centers and neighborhoods. Each concept generally targets the middle market customer, however, each attracts a different demographic. We believe there are growth opportunities in all of our salon concepts. When commercial opportunities arise, we anticipate testing and developing new salon concepts to complement our existing concepts.
We execute our salon growth strategy by focusing on real estate. Our salon real estate strategy is to add new units in convenient locations with good visibility and customer traffic, as well as appropriate trade demographics. Our various salon and product concepts operate in a wide range of retailing environments, including regional shopping malls, strip centers and Wal-Mart Supercenters. We believe that the availability of real estate will augment our ability to achieve the aforementioned long-term growth objectives. In fiscal year 2011, our outlook for constructed salons will be 160 units. Capital expenditures and acquisitions are expected to be approximately $95.0 and $25.0 million in fiscal year 2011, respectively.
Organic salon revenue growth is achieved through the combination of new salon construction and salon same-store sales increases. Once the economy normalizes, we expect we will continue with our historical trend of building several hundred company-owned salons. We anticipate our franchisees will open approximately 70 to 100 salons in fiscal year 2011. Older, unprofitable salons will be closed or relocated. Our long-term outlook for our salon business is for annual consolidated low single digit same-store sales increases. Based on current fashion and economic cycles (i.e., longer hairstyles and lengthening of customer visitation patterns), we project our annual fiscal year 2011 consolidated same-store sales to be in the range of negative 1.0 percent to positive 2.0 percent.
Historically, our salon acquisitions have varied in size from as small as one salon to over one thousand salons. The median acquisition size is approximately ten salons. From fiscal year 1994 to fiscal year 2010, we acquired 8,023 salons, net of franchise buybacks. Once the economy normalizes, we anticipate adding several hundred company-owned salons each year from acquisitions. Some of these acquisitions may include buying salons from our franchisees.
32
Hair Restoration Business
In December 2004, we acquired Hair Club for Men and Women. Hair Club for Men and Women is a provider of hair loss solutions with an estimated five percent share of the $4 billion domestic market. This industry is comprised of numerous locations domestically and is highly fragmented. As a result, we believe there is an opportunity to consolidate this industry through acquisition. Expanding the hair loss business organically and through acquisition would allow us to add incremental revenue which is neither dependent upon, nor dilutive to, our existing salon businesses.
Our organic growth plans for hair restoration include the construction of a modest number of new locations in untapped markets domestically and internationally. However, the success of our hair restoration business is not dependent on the same real estate criteria used for salon expansion. In an effort to provide confidentiality for our customers, hair restoration centers operate primarily in professional or medical office buildings. Further, the hair restoration business is more marketing intensive. As a result, organic growth at our hair restoration centers will be dependent on successfully generating new leads and converting them into hair restoration customers. Our growth expectations for our hair restoration business are not dependent on referral business from, or cross marketing with, our hair salon business, but these concepts continue to be evaluated closely for additional growth opportunities.
CRITICAL ACCOUNTING POLICIES
The Consolidated Financial Statements are prepared in conformity with accounting principles generally accepted in the United States of America. In preparing the Consolidated Financial Statements, we are required to make various judgments, estimates and assumptions that could have a significant impact on the results reported in the Consolidated Financial Statements. We base these estimates on historical experience and other assumptions believed to be reasonable under the circumstances. Estimates are considered to be critical if they meet both of the following criteria: (1) the estimate requires assumptions about material matters that are uncertain at the time the accounting estimates are made, and (2) other materially different estimates could have been reasonably made or material changes in the estimates are reasonably likely to occur from period to period. Changes in these estimates could have a material effect on our Consolidated Financial Statements.
Our significant accounting policies can be found in Note 1 to the Consolidated Financial Statements contained in Part II, Item 8 of this Form 10-K. We believe the following accounting policies are most critical to aid in fully understanding and evaluating our reported financial condition and results of operations.
Investment In and Loans to Affiliates
The Company has equity investments in securities of certain privately held entities. The Company accounts for these investments under the equity method of accounting. The Company also has loans receivable from certain of these entities. Investments accounted for under the equity method are recorded at the amount of the Company's investment and adjusted each period for the Company's share of the investee's income or loss. Investments are reviewed for changes in circumstance or the occurrence of events that suggest the Company's investment may not be recoverable. During fiscal year 2009, we recorded impairments of $25.7 and $7.8 million ($4.8 million net of tax) related to our investment in Provalliance and investment in and loans to Intelligent Nutrients, LLC, respectively.
Goodwill
Goodwill is tested for impairment annually or at the time of a triggering event. In evaluating whether goodwill is impaired, the Company compares the carrying value of each reporting unit, including goodwill, to the estimated fair value of the reporting unit. The carrying value of each
33
reporting unit is based on the assets and liabilities associated with the operations of the reporting unit, including allocation of shared or corporate balances among reporting units. Allocations are generally based on the number of salons in each reporting unit as a percent of total company-owned salons.
The Company calculates the estimated fair value of the reporting units based on discounted future cash flows that utilize estimates in annual revenue, gross margins, fixed expense rates, allocated corporate overhead, and long-term growth for determining terminal value. The Company's estimated future cash flows also take into consideration acquisition integration and maturation. Where available and as appropriate, comparative market multiples are used to corroborate the results of the discounted cash flow. The Company considers its various concepts to be reporting units when testing for goodwill impairment because that is where the Company believes the goodwill resides. The Company periodically engage third-party valuation consultants to assist in evaluation of the Company's estimated fair value calculations. The Company's policy is to perform its annual goodwill impairment test during its third quarter of each fiscal year ending June 30.
In the situations where a reporting unit's carrying value exceeds its estimated fair value, the amount of the impairment loss must be measured. The measurement of impairment is calculated by determining the implied fair value of a reporting unit's goodwill. In calculating the implied fair value of goodwill, the fair value of the reporting unit is allocated to all other assets and liabilities of that unit based on the relative fair values. The excess of the fair value of the reporting unit over the amount assigned to its assets and liabilities is the implied fair value of goodwill. The goodwill impairment is measured as the excess of the carrying value of goodwill over its implied fair value.
As a result of the Company's annual impairment analysis of goodwill during the third quarter of fiscal year 2010, a $35.3 million impairment charge was recorded within continuing operations for the excess of the carrying value of goodwill over the implied fair value of goodwill for the Regis salon concept.
As it is reasonably likely that there could be additional impairment of the Regis salon concept's goodwill in future periods along with the sensitivity of the Company's critical assumptions in estimating fair value of this reporting unit, the Company has provided additional information related to this reporting unit.
A summary of the critical assumptions utilized during the annual impairment test of the Regis salon concept as of March 31, 2010 are outlined below:
Annual revenue growth. Annual revenue growth is primarily driven by assumed same-store sales rates of negative 3.2 percent to positive 3.0 percent. Other considerations include anticipated negative economic conditions in the short-term and moderate acquisition growth.
Gross margin. Adjusted for anticipated salon closures, new salon construction and acquisitions, estimated future gross margins were held constant.
Fixed expense rates. Fixed expense rate increases of approximately 1.5 to 2.0 percent based on anticipated inflation. Fixed expenses consisted of rent, site operating, and allocated general and administrative corporate overhead.
Allocated corporate overhead. Corporate overhead incurred by the home office based on the number of Regis company-owned salons as a percent of total company-owned salons.
Long-term growth. A long-term growth rate of 2.5 percent was applied to terminal cash flow based on anticipated economic conditions.
Discount rate. A discount rate of 12.0 percent based of the weighted average cost of capital that equals the rate of return on debt capital and equity capital weighted in proportion to the capital structure common to the industry.
34
The following table summarizes the approximate impact that a change in certain critical assumptions would have on the estimated fair value of our Regis salon concept reporting unit (the approximate impact of the change in the critical assumptions assumes all other assumptions and factors remain constant, in thousands, except percentages):
|
Critical Assumptions
|
Increase
(Decrease) |
Approximate
Impact on Fair Value |
|||||
|---|---|---|---|---|---|---|---|
|
|
|
(in thousands)
|
|||||
|
Discount Rate |
1.0 | % | $ | (13,000 | ) | ||
|
Same-Store Sales |
(1.0 | )% | (12,000 | ) | |||
As of March 31, 2010, the estimated fair value of the Promenade salon concept exceeded its respective carrying value by approximately 10 percent. As it is reasonably likely that there could be impairment of the Promenade salon concept's goodwill in future periods along with the sensitivity of the Company's critical assumptions in estimating fair value of this reporting unit, the Company has provided additional information related to this reporting unit.
A summary of the critical assumptions utilized during the annual impairment test of the Promenade salon concept as of March 31, 2010 are outlined below:
Annual revenue growth. Annual revenue growth is primarily driven by assumed same-store sales rates of negative 1.1 percent to positive 3.0 percent. Other considerations include anticipated negative economic conditions in the short-term and moderate acquisition growth.
Gross margin. Adjusted for anticipated salon closures, new salon construction and acquisitions, estimated future gross margins were held constant.
Fixed expense rates. Fixed expense rate increases of approximately 1.5 to 2.0 percent based on anticipated inflation. Fixed expenses consisted of rent, site operating, and allocated general and administrative corporate overhead.
Allocated corporate overhead. Corporate overhead incurred by the home office based on the number of Promenade company-owned salons as a percent of total company-owned salons.
Long-term growth. A long-term growth rate of 2.5 percent was applied to terminal cash flow based on anticipated economic conditions.
Discount rate. A discount rate of 12.0 percent based of the weighted average cost of capital that equals the rate of return on debt capital and equity capital weighted in proportion to the capital structure common to the industry.
The following table summarizes the approximate impact that a change in certain critical assumptions would have on the estimated fair value of our Promenade salon concept reporting unit (the approximate impact of the change in the critical assumptions assumes all other assumptions and factors remain constant, in thousands, except percentages):
|
Critical Assumptions
|
Increase
(Decrease) |
Approximate
Impact on Fair Value |
|||||
|---|---|---|---|---|---|---|---|
|
|
|
(in thousands)
|
|||||
|
Discount Rate |
1.0 | % | $ | (29,000 | ) | ||
|
Same-Store Sales |
(1.0 | )% | (15,000 | ) | |||
The respective fair values of the Company's remaining reporting units exceeded fair value by greater than 20.0 percent. While the Company has determined the estimated fair values of Regis and Promenade to be appropriate based on the historical level of revenue growth, operating income and cash flows, it is reasonably likely that Regis and Promenade may become impaired in future periods.
35
The term "reasonably likely" refers to an occurrence that is more than remote but less than probable in the judgment of the Company. Because some of the inherent assumptions and estimates used in determining the fair value of the reportable segments are outside the control of management, changes in these underlying assumptions can adversely impact fair value. Potential impairment of a portion or all of the carrying value of the Regis salon concept and Promenade salon concept goodwill is dependent on many factors and cannot be predicted with certainty.
As of June 30, 2010, the Company's estimated fair value, as determined by the sum of our reporting units' fair value reconciled to within a reasonable range of our market capitalization which included an assumed control premium. The Company concluded there were no triggering events that would require the Company to perform an interim goodwill impairment test between the annual impairment testing and June 30, 2010.
A summary of the Company's goodwill balance as of June 30, 2010 by reporting unit is as follows:
|
Reporting Unit
|
As of June 30, 2010 | |||
|---|---|---|---|---|
|
|
(Dollars in thousands)
|
|||
|
Regis |
$ | 102,180 | ||
|
MasterCuts |
4,652 | |||
|
SmartStyle |
48,280 | |||
|
Supercuts |
121,693 | |||
|
Promenade |
309,804 | |||
|
Total North America Salons |
586,609 | |||
|
Hair Restoration Centers |
150,380 | |||
|
Consolidated Goodwill |
$ | 736,989 | ||
Prior to the annual goodwill impairment analysis for fiscal year 2009, the fair value of the Company's stock declined such that it began trading below book value per share. Due to the adverse changes in operating results and the continuation of the Company's stock trading below book value per share, the Company performed an interim impairment test of goodwill during the three months ended December 31, 2008.
As a result of the Company's interim impairment test of goodwill during the three months ended December 31, 2008, a $41.7 million impairment charge for the full carrying amount of goodwill within the salon concepts in the United Kingdom was recorded within continuing operations. The recent performance challenges of the international salon operations indicated that the estimated fair value was less than the current carrying of this reporting units net assets, including goodwill.
During the three months ended March 31 of fiscal year 2008, we performed our annual goodwill impairment analysis on our reporting units. No impairment charges were recorded during fiscal year 2008.
Long-Lived Assets, Excluding Goodwill
We assess the impairment of long-lived assets annually or when events or changes in circumstances indicate that the carrying value of the assets or the asset grouping may not be recoverable. Our impairment analysis on salon property and equipment is performed on a salon by salon basis. The Company's test for impairment is performed at a salon level as this is the lowest level for which identifiable cash flows are largely independent of the cash flows of other groups of assets and liabilities. Factors considered in deciding when to perform an impairment review include significant under-performance of an individual salon in relation to expectations, significant economic or geographic trends, and significant changes or planned changes in our use of the assets. Impairment is evaluated based on the sum of undiscounted estimated future cash flows expected to result from use of the
36
related salon assets that does not recover the carrying value of the salon assets. When the sum of a salon's undiscounted estimated future cash flow is zero or negative, impairment is measured as the full carrying value of the related salon's equipment and leasehold improvements. When the sum of a salon's undiscounted cash flows is greater than zero but less than the carrying value of the related salon's equipment and leasehold improvements, a discounted cash flow analysis is performed to estimate the fair value of the salon assets and impairment is measured as the difference between the carrying value of the salon assets and the estimated fair value. The fair value estimate is based on the best information available, including market data.
Judgments made by management related to the expected useful lives of long-lived assets and the ability to realize undiscounted cash flows in excess of the carrying amounts of such assets are affected by factors such as the ongoing maintenance and improvement of the assets, changes in economic conditions and changes in operating performance. As the ongoing expected cash flows and carrying amounts of long-lived assets are assessed, these factors could cause us to realize material impairment charges.
During fiscal years 2010, 2009, and 2008, $6.4, $10.2, and $6.1 million, respectively, of impairment was recorded within depreciation and amortization in the Consolidated Statement of Operations. In June 2009, we approved a plan to close up to 80 underperforming United Kingdom company-owned salons in fiscal year 2010 that was in addition to the July 2008 approved plan of closing up to 160 underperforming company-owned salons in fiscal year 2009. We also evaluated the appropriateness of the remaining useful lives of its affected property and equipment and whether a change to the depreciation charge was warranted. Impairment charges are included in depreciation related to company-owned salons in the Consolidated Statement of Operations.
Purchase Price Allocation
We make numerous acquisitions. The purchase prices are allocated to assets acquired, including identifiable intangible assets, and liabilities assumed based on their estimated fair values at the dates of acquisition. Fair value is estimated based on the amount for which the asset or liability could be bought or sold in a current transaction between willing parties. For our acquisitions, the majority of the purchase price that is not allocated to identifiable assets, or liabilities assumed, is accounted for as residual goodwill rather than identifiable intangible assets. This stems from the value associated with the walk-in customer base of the acquired salons, the value of which is not recorded as an identifiable intangible asset under current accounting guidance and the limited value of the acquired leased site and customer preference associated with the acquired hair salon brand. Residual goodwill further represents our opportunity to strategically combine the acquired business with our existing structure to serve a greater number of customers through our expansion strategies. Identifiable intangible assets purchased in fiscal year 2010, 2009, and 2008 acquisitions totaled $0.1, $1.3, $16.1 million, respectively. The residual goodwill generated by fiscal year 2010, 2009, and 2008 acquisitions totaled $2.6, $30.8, $105.3 million, respectively. See Note 4 to the Consolidated Financial Statements for further information.
Self-insurance Accruals
The Company uses a combination of third party insurance and self-insurance for a number of risks including workers' compensation, health insurance, employment practice liability and general liability claims. The liability represents an estimate of the undiscounted ultimate cost of uninsured claims incurred as of the balance sheet date.
The workers' compensation, general liability and employment practices liability analysis includes applying loss development factors to the Company's historical claims data (total paid and incurred amounts per claim) for all policy years where the Company has not reached its aggregate limits to
37
project the future development of incurred claims. The workers' compensation analysis is performed for four models; California, Ohio, Texas and all other states. A variety of accepted actuarial methodologies are followed to determine these liabilities, including several methods to predict the loss development factors for each policy period. These liabilities are determined by modeling the frequency (number of claims) and severity (cost of claims), fitting statistical distributions to the experience, and then running simulations. A similar analysis is performed for both general liability and employment practices liability; however, it is a single model for all liability claims rather than the four separate models used for workers' compensation.
The health insurance analysis utilizes trailing twelve months of paid and 24 months of incurred medical and prescription claims to project the amount of incurred but not yet reported claims liability amount. The lag factors are developed based on the Company's specific claim data utilizing a completion factor methodology. The developed factor, expressed as a percentage of paid claims, is applied to the trailing twelve months of paid claims to calculate the estimated liability amount. The calculated liability amount is reviewed for reasonableness based on reserve adequacy ranges for historical periods by testing prior reserve levels against actual expenses to date.
Although the Company does not expect the amounts ultimately paid to differ significantly from the estimates, self-insurance accruals could be affected if future claims experience differs significantly from the historical trends and actuarial assumptions. For fiscal years 2010, 2009, and 2008, we recorded decreases in expense from changes in estimates related to prior year open policy periods continuing operations of $1.7, $9.9, $6.9 million, respectively. A 10.0 percent change in the self-insurance reserve would affect income from continuing operations before income taxes and equity in income of affiliated companies by $4.5, $4.0, and $4.7 million for the three years ended June 30, 2010, 2009, and 2008, respectively. The Company updates loss projections each year and adjusts its recorded liability to reflect the current projections. The updated loss projections consider new claims and developments associated with existing claims for each open policy period. As certain claims can take years to settle, the Company has multiple policy periods open at any point in time.
Income Taxes
In determining income for financial statement purposes, management must make certain estimates and judgments. These estimates and judgments occur in the calculation of certain tax liabilities and in the determination of the recoverability of certain deferred tax assets, which arise from temporary differences between the tax and financial statement recognition of revenue and expense.
Management must assess the likelihood that deferred tax assets will be recovered. If recovery is not likely, we must increase our provision for taxes by recording a reserve, in the form of a valuation allowance, for the deferred tax assets that will not be ultimately recoverable. Should there be a change in our ability to recover our deferred tax assets, our tax provision would increase in the period in which it is determined that the recovery is not likely.
In addition, the calculation of tax liabilities involves dealing with uncertainties in the application of complex tax regulations. Management recognizes a reserve for potential liabilities for anticipated tax audit issues in the United States and other tax jurisdictions based on our estimate of whether and the extent to which additional taxes will be due. If payment of these amounts ultimately proves to be unnecessary, the reversal of the liabilities would result in tax benefits being recognized in the period when we determine the liabilities are no longer necessary. If our estimate of tax liabilities proves to be less than the ultimate assessment, a further charge to expense would result. In the United States, fiscal years 2007 and after remain open for Federal tax audit. The Company has been notified that the United States federal income tax returns for the years 2007 through 2009 have been selected for audit. For state tax audits, the statute of limitations generally spans three to four years, resulting in a number of states remaining open for tax audits dating back to fiscal year 2006. However, the company is under
38
audit in a number of states in which the statute of limitations has been extended to fiscal years 2000 and forward. Internationally (including Canada), the statute of limitations for tax audits varies by jurisdiction, but generally ranges from three to five years.
We adopted the FASB guidance regarding the recognition, measurement, presentation, and disclosure in the financial statements of tax positions taken or expected to be taken on a tax return, including the decision whether to file or not to file in a particular jurisdiction. As a result of the adoption, effective July 1, 2007, the Company recognized a $20.7 million increase in the liability for unrecognized income tax benefits, including interest and penalties. As of June 30, 2010 the Company's liability for uncertain tax positions was $16.9 million. See Note 13 to the Consolidated Financial Statements for further information.
Contingencies
We are involved in various lawsuits and claims that arise from time to time in the ordinary course of our business. Accruals are recorded for such contingencies based on our assessment that the occurrence is probable, and where determinable, an estimate of the liability amount. Management considers many factors in making these assessments including past history and the specifics of each case. However, litigation is inherently unpredictable and excessive verdicts do occur, which could have a material impact on our Consolidated Financial Statements.
During fiscal year 2010, the Company settled two legal claims regarding certain customer and employee matters for an aggregate of $5.2 million plus a commitment to provide discount coupons.
OVERVIEW OF FISCAL YEAR 2010 RESULTS
The following summarizes key aspects of our fiscal year 2010 results:
- •
-
Revenues decreased 2.9 percent to $2.4 billion during fiscal year 2010. The Company experienced a decline in
customer visitation as a result of the current global economic environment, partially offset by an increase in average ticket price, resulting in a decrease in consolidated same-store
sales of 3.2 percent. The revenue decrease was partially offset by a one-time sale of $20.0 million of product sold to the purchaser of Trade Secret. The Company expects
fiscal year 2011 same-store sales to be in the range of negative 1.0 percent to positive 2.0 percent.
- •
-
Goodwill impairment charges of $35.3 million associated with our Regis salon concept were recorded during fiscal
year 2010.
- •
-
Long-lived asset impairment charges of $6.4 million were recorded during fiscal year 2010.
- •
-
Total debt at the end of fiscal year 2010 declined to $440.0 million and our
debt-to-capitalization ratio, calculated as total debt as a percentage of total debt and shareholders' equity at fiscal year end, improved 1,380 basis points to
30.3 percent as compared to June 30, 2009. The decrease in debt-to-capitalization ratio from fiscal year 2009 to fiscal year 2010 was primarily due to the July
2009 common stock offering and decreased debt levels stemming from the repayment of private placement debt during fiscal year 2010.
- •
- The annual effective income tax rate of 48.1 percent was adversely impacted by the pre-tax non-cash goodwill impairment charge of $35.3 million recorded during the three months ended March 30, 2010. During fiscal year 2010, the Company recorded adjustments to correct its current income tax balances. The adjustments increased the Company's fiscal year 2010 income tax provision by $2.1 million and increased its effective income tax rate by 3.9 percent. Offsetting these amounts were increased employment credits related to the Small Business and Work Opportunity Tax Act of 2007 which benefited the effective income tax rate by 6.4 percent. Based upon current legislation these credits are scheduled to expire on September 1, 2011.
39
- •
-
Site operating expenses were positively impacted by a $1.7 million pre-tax change in estimate of the
Company's self-insurance accruals, primarily general liability.
- •
-
Lease termination costs of $2.1 million were incurred as a result of the Company's planned closure of up to 80
underperforming company-owned salons in the United Kingdom.
- •
-
The Company recorded a $5.2 million charge related to the settlement of two legal claims regarding certain customer
and employee matters.
- •
-
The Company recorded $18.0 million in charges related to make-whole payments and other fees associated
with the repayment of private placement debt.
- •
- In August 2010 the Company retained Peter J. Solomon Company, L.P. as its financial advisor and Faegre & Benson LLP and Wachtell, Lipton, Rosen & Katz as its legal advisors to explore strategic alternatives to enhance shareholder value. There can be no assurance that the review of strategic alternatives will result in any agreement or transaction.
RESULTS OF OPERATIONS
Beginning with the period ended December 31, 2008 the operations of Trade Secret concept within the North American reportable segment were accounted for as a discontinued operation. All periods presented will reflect Trade Secret as a discontinued operation. The following discussion of results of operations will reflect results from continuing operations. Discontinued operations will be discussed at the end of this section.
Consolidated Results of Operations
The following table sets forth, for the periods indicated, certain information derived from our Consolidated Statement of Operations in Item 8, expressed as a percent of revenues. The percentages are computed as a percent of total revenues, except as noted.
Results of Operations as a Percent of Revenues
|
|
For the Years Ended
June 30, |
|||||||||
|---|---|---|---|---|---|---|---|---|---|---|
|
|
2010 | 2009 | 2008 | |||||||
|
Service revenues |
75.6 | % | 75.5 | % | 75.1 | % | ||||
|
Product revenues |
22.7 | 22.9 | 22.2 | |||||||
|
Royalties and fees |
1.7 | 1.6 | 2.7 | |||||||
|
Operating expenses: |
||||||||||
|
Cost of service(1) |
56.9 | 57.0 | 57.1 | |||||||
|
Cost of product(2) |
49.4 | 50.9 | 48.0 | |||||||
|
Site operating expenses |
8.5 | 7.8 | 7.4 | |||||||
|
General and administrative |
12.4 | 12.0 | 13.0 | |||||||
|
Rent |
14.6 | 14.3 | 14.6 | |||||||
|
Depreciation and amortization |
4.6 | 4.8 | 4.6 | |||||||
|
Goodwill impairment |
1.5 | 1.7 | — | |||||||
|
Lease termination costs |
0.1 | 0.2 | — | |||||||
|
Operating income |
4.1 | 4.5 | 7.0 | |||||||
|
Income from continuing operations before income taxes and equity in income (loss) of affiliated companies |
2.3 | 3.2 | 5.5 | |||||||
|
Income from continuing operations |
1.7 | 0.3 | 3.4 | |||||||
|
Income (loss) from discontinued operations |
0.1 | (5.4 | ) | 0.1 | ||||||
|
Net income (loss) |
1.8 | (5.1 | ) | 3.4 | ||||||
- (1)
-
Computed
as a percent of service revenues and excludes depreciation expense.
- (2)
- Computed as a percent of product revenues and excludes depreciation expense.
40
Consolidated Revenues
Consolidated revenues primarily include revenues of company-owned salons, product and equipment sales to franchisees, hair restoration center revenues, and franchise royalties and fees. As compared to the prior fiscal year, consolidated revenues decreased 2.9 percent during fiscal year 2010 and decreased 2.1 percent during fiscal year 2009. The following table details our consolidated revenues by concept. All service revenues, product revenues (which include product and equipment sales to franchisees), and franchise royalties and fees are included within their respective concept within the table.
|
|
For the Years Ended June 30, | ||||||||||
|---|---|---|---|---|---|---|---|---|---|---|---|
|
|
2010 | 2009 | 2008 | ||||||||
|
|
(Dollars in thousands)
|
||||||||||
|
North American salons: |
|||||||||||
|
Regis |
$ | 437,990 | $ | 474,964 | $ | 514,219 | |||||
|
MasterCuts |
166,821 | 170,338 | 175,974 | ||||||||
|
SmartStyle |
533,094 | 529,782 | 507,349 | ||||||||
|
Supercuts(1) |
314,698 | 310,913 | 305,104 | ||||||||
|
Promenade(1)(6) |
607,960 | 631,701 | 581,542 | ||||||||
|
Other(3) |
— | — | 5,558 | ||||||||
|
Total North American Salons(5) |
2,060,563 | 2,117,698 | 2,089,746 | ||||||||
|
International salons(1)(2) |
156,085 | 171,569 | 256,063 | ||||||||
|
Hair restoration centers(1) |
141,786 | 140,520 | 135,582 | ||||||||
|
Consolidated revenues |
$ | 2,358,434 | $ | 2,429,787 | $ | 2,481,391 | |||||
|
Percent change from prior year |
(2.9 | )% | (2.1 | )% | 4.6 | % | |||||
|
Salon same-store sales (decrease) increase(4) |
(3.2 | )% | (3.1 | )% | 1.5 | % | |||||
- (1)
-
Includes
aggregate franchise royalties and fees of $39.7, $39.6, $67.6 million in fiscal years 2010, 2009, and 2008, respectively. North American
salon franchise royalties and fees represented 93.7, 93.7, and 58.6 percent of total franchise revenues in fiscal years 2010, 2009, and 2008, respectively. The decrease in aggregate franchise
royalties and fees and the increase in North American salon franchise royalties and fees as a percent of total revenues for fiscal years 2010 and 2009 is a result of the deconsolidation of the
Company's European franchise salon operations.
- (2)
-
On
January 31, 2008, the Company deconsolidated the results of operations of its European franchise salon operations. Accordingly, revenue growth was
negatively impacted as a result of the deconsolidation. See Item 6, Selected Financial Data, for further information.
- (3)
-
On
August 1, 2007, the Company contributed its 51 accredited cosmetology schools to Empire Education Group, Inc. Accordingly, revenue growth
was negatively impacted as a result of the deconsolidation. See Item 6, Selected Financial Data, for further information. For the fiscal year ended June 30, 2008, the results of
operations for the month ended July 31, 2007 for the accredited cosmetology schools are reported in the North American salons segment. The Company retained ownership of its one North American
and four United Kingdom Sassoon schools. Subsequent to August 1, 2007 results of operations for the Sassoon schools are included in the respective North American and international salon
segments.
- (4)
- Same-store sales increases or decreases are calculated on a daily basis as the total change in sales for company-owned locations which were open on a specific day of the week during the current period and the corresponding prior period. Annual same-store sales increases are the sum of the same-store sales increases computed on a daily basis. Salons relocated within a one mile radius are included in same-store sales as they are considered to have been open in the prior period.
41
International same-store sales are calculated in local currencies so that foreign currency fluctuations do not impact the calculation. Management believes that same-store sales, a component of organic growth, are useful in order to help determine the increase in salon revenues attributable to its organic growth (new salon construction and same-store sales growth) versus growth from acquisitions.
- (5)
-
Beginning
with the period ended December 31, 2008, the operations of Trade Secret concept within the North American reportable segment were accounted
for as a discontinued operation. All periods presented reflect Trade Secret as a discontinued operation. Accordingly, Trade Secret revenues are excluded from this presentation.
- (6)
- Trade Secret, Inc. was sold by Regis Corporation on February 16, 2009. The agreement included a provision that the Company would supply product to the buyer of Trade Secret and provide certain administrative services for a transition period. For the fiscal year ended June 30, 2010, and 2009, the Company generated revenue of $20.0, and $32.2 million in product revenues, respectively, which represented 0.8 and 1.3 percent of consolidated revenues, respectively. The agreement was substantially complete as of September 30, 2009.
The decreases of 2.9, and 2.1 percent, and the increase of 4.6 percent in consolidated revenues during fiscal years 2010, 2009, and 2008, respectively, were driven by the following:
|
|
Percentage
Increase (Decrease) in Revenues For the Years Ended June 30, |
|||||||||
|---|---|---|---|---|---|---|---|---|---|---|
|
Factor
|
2010 | 2009 | 2008 | |||||||
|
Acquisitions (previous twelve months) |
0.8 | % | 3.4 | % | 4.6 | % | ||||
|
Organic |
(3.0 | ) | (1.4 | ) | 3.4 | |||||
|
Foreign currency |
0.2 | (2.2 | ) | 1.1 | ||||||
|
Franchise revenues |
0.0 | (1.1 | ) | (0.6 | ) | |||||
|
Closed salons |
(0.9 | ) | (0.8 | ) | (3.9 | ) | ||||
|
|
(2.9 | )% | (2.1 | )% | 4.6 | % | ||||
We acquired 26 company-owned salons (including 23 franchise buybacks), and bought back zero hair restoration centers from franchisees during fiscal year 2010 compared to 177 company-owned salons (including 83 franchise buybacks), and bought back two hair restoration centers from franchisees during fiscal year 2009. The decline in organic sales during fiscal year 2010 was primarily due to consolidated same-store sales decrease of 3.2 percent due to a decline in same-store customer visits, partially offset by an increase in average ticket. The decline in organic sales was also due to the completion of an agreement to supply the purchaser of Trade Secret product at cost. The Company generated revenues of $20.0 and $32.2 million for product sold to the purchaser of Trade Secret during the twelve months ended June 30, 2010 and 2009, respectively. Partially offsetting the organic sales decrease was the construction of 143 company-owned salons during the twelve months ended June 30, 2010. We closed 269 and 281 salons (including 65 and 51 franchise salons) during the twelve months ended June 30, 2010 and 2009, respectively.
We acquired 177 company-owned salons (including 83 franchise buybacks), and bought back two hair restoration centers from franchisees during fiscal year 2009 compared to 354 company-owned salons (including 145 franchise buybacks) and bought back six hair restoration centers from franchisees during fiscal year 2008. The organic decrease was primarily due to consolidated same-store sales decrease of 3.1 percent, partially offset by the construction of 172 company-owned salons during the twelve months ended June 30, 2009. The organic increase was primarily from the construction of 309 company-owned salons during the 12 months ended June 30, 2008, as well as consolidated same-store
42
sales of 1.5 percent. We closed 281 and 264 salons (including 51 and 103 franchise salons) during the twelve months ended June 30, 2009 and 2008, respectively
During fiscal year 2010, the foreign currency impact was driven by the weakening of the United States dollar against the Canadian dollar, partially offset by the strengthening of the United Stated dollar against the British pound and Euro as compared to the prior fiscal year's exchange rates. During fiscal years 2009 and 2008, the foreign currency impact was driven by the strengthening of the United States dollar against the Canadian dollar, British pound, and Euro as compared to the prior fiscal year's exchange rates. Consolidated revenues are primarily composed of service and product revenues, as well as franchise royalties and fees. Fluctuations in these three major revenue categories were as follows:
Service Revenues. Service revenues include revenues generated from company-owned salons and service revenues generated by hair restoration centers. Consolidated service revenues were as follows:
|
|
|
(Decrease) Increase
Over Prior Fiscal Year |
||||||||
|---|---|---|---|---|---|---|---|---|---|---|
|
Years Ended June 30,
|
Revenues | Dollar | Percentage | |||||||
|
|
(Dollars in thousands)
|
|||||||||
|
2010 |
$ | 1,784,137 | $ | (49,821 | ) | (2.7 | )% | |||
|
2009 |
1,833,958 | (28,532 | ) | (1.5 | ) | |||||
|
2008 |
1,862,490 | 98,010 | 5.6 | |||||||
The decrease in service revenues during fiscal year 2010 was due to same-store service sales decreasing 3.4 percent, as many consumers have continued to lengthen their visitation pattern due to the economy. In addition, service revenues decreased due to the strengthening of the United States dollar against the British pound. Partially offsetting the decrease was growth due to acquisitions during the twelve months and the weakening of the United States dollar against the Canadian dollar during the twelve months ended June 30, 2010.
The decrease in service revenues during fiscal year 2009 was due to same-store service sales decreasing 2.5 percent. Same-store service sales decreased 2.5 percent due to a decline in customer visits. Service revenues were also negatively impacted due to the strengthening of the United States dollar against the Canadian dollar, British pound, and Euro and the deconsolidation of the European franchise salon operations on January 31, 2008. Partially offsetting the decrease was growth due to acquisitions during the twelve months and an increase in average ticket.
The growth in service revenues during fiscal year 2008 was driven by acquisitions and new salon construction (a component of organic growth). Service revenue growth was driven by a consolidated same-store service sales increase of 2.2 percent during the twelve months ended June 30, 2008 as a result of price increases. Growth was negatively impacted as a result of the deconsolidation of our 51 accredited cosmetology schools to Empire Education Group, Inc. on August 31, 2007.
Product Revenues. Product revenues are primarily sales at company-owned salons, hair restoration centers, and sales of product and equipment to franchisees. Consolidated product revenues were as follows:
|
|
|
(Decrease) Increase
Over Prior Fiscal Year |
||||||||
|---|---|---|---|---|---|---|---|---|---|---|
|
Years Ended June 30,
|
Revenues | Dollar | Percentage | |||||||
|
|
(Dollars in thousands)
|
|||||||||
|
2010 |
$ | 534,593 | $ | (21,612 | ) | (3.9 | )% | |||
|
2009 |
556,205 | 4,919 | 0.9 | |||||||
|
2008 |
551,286 | 22,374 | 4.2 | |||||||
43
The decrease in product revenues during fiscal year 2010 was primarily due to the decrease in product sales to the purchaser of Trade Secret from $32.2 in fiscal year 2009 to $20.0 in fiscal year 2010, as well as due to same-store product sales decreasing 2.3 percent and the strengthening of the United States dollar against the British pound. Partially offsetting the decrease was the weakening of the United States dollar against the Canadian dollar during the twelve months ended June 30, 2010.
The growth in product revenues during fiscal year 2009 was primarily due to product sales of $32.2 million to the purchaser of Trade Secret, partially offset by same-store product sales decreasing 5.1 percent. Same-store product sales decreased 5.1 percent during the fiscal year 2009 due to a decline in customer visits and a change in product mix, as a larger percentage of product sales came from promotional items.
The growth in product revenues during fiscal year 2008 was primarily due to acquisitions, offset by same-store product sales decrease of 0.8 percent during the twelve months ended June 30, 2008. This decrease is due to the recent decline in the global economic condition and the continued trend of product diversion and increased appeal of mass hair care lines by the consumer.
Royalties and Fees. Consolidated franchise revenues, which include royalties and franchise fees, were as follows:
|
|
|
Increase (Decrease)
Over Prior Fiscal Year |
||||||||
|---|---|---|---|---|---|---|---|---|---|---|
|
Years Ended June 30,
|
Revenues | Dollar | Percentage | |||||||
|
|
(Dollars in thousands)
|
|||||||||
|
2010 |
$ | 39,704 | $ | 80 | 0.2 | % | ||||
|
2009 |
39,624 | (27,991 | ) | (41.4 | ) | |||||
|
2008 |
67,615 | (12,331 | ) | (15.4 | ) | |||||
Total franchise locations open at June 30, 2010 and 2009 were 2,053 (including 33 franchise hair restoration centers) and 2,078 (including 33 franchise hair restoration centers), respectively. The increase in consolidated franchise revenues during fiscal year 2010 was primarily due to the weakening of the United States dollar against the Canadian dollar during the twelve months ended June 30, 2010.
Total franchise locations open at June 30, 2009 and 2008 were 2,078 (including 33 franchise hair restoration centers) and 2,134 (including 35 franchise hair restoration centers), respectively. The decrease in consolidated franchise revenues during fiscal year 2009 was primarily due to the merger of the 1,587 European franchise salon operations with Franck Provost Salon Group on January 31, 2008.
Total franchise locations open at June 30, 2008 and 2007 were 2,134 (including 35 franchise hair restoration centers) and 3,764 (including 41 franchise hair restoration centers), respectively. The decrease in consolidated franchise revenues during fiscal year 2008 was primarily due to the merger of the 1,587 European franchise salon operations with Franck Provost Salon Group on January 31, 2008. The decrease in consolidated franchise revenues during fiscal year 2008 was partially offset due to the weakening of the United States dollar against the Canadian dollar, British pound and Euro as compared to the exchange rates for fiscal year 2007.
44
Gross Margin (Excluding Depreciation)
Our cost of revenues primarily includes labor costs related to salon employees and hair restoration center employees, the cost of product used in providing services and the cost of products sold to customers and franchisees. The resulting gross margin was as follows:
|
|
|
|
(Decrease) Increase Over
Prior Fiscal Year |
|||||||||||||
|---|---|---|---|---|---|---|---|---|---|---|---|---|---|---|---|---|
|
Years Ended June 30,
|
Gross
Margin |
Margin as % of
Service and Product Revenues |
Dollar | Percentage | Basis Point(1) | |||||||||||
|
|
(Dollars in thousands)
|
|||||||||||||||
|
2010 |
$ | 1,039,127 | 44.8 | % | $ | (23,279 | ) | (2.2 | )% | 40 | ||||||
|
2009 |
1,062,406 | 44.4 | (24,420 | ) | (2.2 | ) | (60 | ) | ||||||||
|
2008 |
1,086,826 | 45.0 | 40,643 | 3.9 | (60 | ) | ||||||||||
- (1)
- Represents the basis point change in gross margin as a percent of service and product revenues as compared to the corresponding period of the prior fiscal year.
Service Margin (Excluding Depreciation). Service margin was as follows:
|
|
|
|
(Decrease) Increase Over
Prior Fiscal Year |
|||||||||||||
|---|---|---|---|---|---|---|---|---|---|---|---|---|---|---|---|---|
|
Years Ended June 30,
|
Service
Margin |
Margin as % of
Service Revenues |
Dollar | Percentage | Basis Point(1) | |||||||||||
|
|
(Dollars in thousands)
|
|||||||||||||||
|
2010 |
$ | 768,417 | 43.1 | % | $ | (20,822 | ) | (2.6 | )% | 10 | ||||||
|
2009 |
789,239 | 43.0 | (10,692 | ) | (1.3 | ) | 10 | |||||||||
|
2008 |
799,931 | 42.9 | 24,397 | 3.1 | (110 | ) | ||||||||||
- (1)
- Represents the basis point change in service margin as a percent of service revenues as compared to the corresponding period of the prior fiscal year.
The basis point improvement in service margins as a percent of service revenues during fiscal year 2010 was primarily due to the benefit of the new leveraged salon pay plans implemented in the 2009 calendar year. Increases in salon health insurance and payroll taxes partially offset the basis point improvement.
The basis point improvement in service margins as a percent of service revenues during fiscal year 2009 was primarily due to an improvement in labor expenses. Labor expenses improved as a result of cost control initiatives and new leveraged salon pay plans.
The basis point decrease in service margins as a percent of service revenues during fiscal year 2008 was primarily due to the absence of the beauty school segment service revenue from consolidated service revenues. The decrease was also due to a change made during the first fiscal quarter as a result of refinements made to our inventory tracking systems. The refinements resulted in better tracking and accounting for retail products that our salon stylists transfer from retail shelves to the back bar for use in servicing customers. The cost of these products had historically been included as a component of our product gross margin, whereas they are now more appropriately included in our service margin.
45
Product Margin (Excluding Depreciation). Product margin was as follows:
|
|
|
|
(Decrease) Increase Over
Prior Fiscal Year |
|||||||||||||
|---|---|---|---|---|---|---|---|---|---|---|---|---|---|---|---|---|
|
Years Ended June 30,
|
Product
Margin |
Margin as % of
Product Revenues |
Dollar | Percentage | Basis Point(1) | |||||||||||
|
|
(Dollars in thousands)
|
|||||||||||||||
|
2010 |
$ | 270,710 | 50.6 | % | $ | (2,457 | ) | (0.9 | )% | 150 | ||||||
|
2009 |
273,167 | 49.1 | (13,728 | ) | (4.8 | ) | (290 | ) | ||||||||
|
2008 |
286,895 | 52.0 | 16,246 | 6.0 | 80 | |||||||||||
- (1)
- Represents the basis point change in product margin as a percent of product revenues as compared to the corresponding period of the prior fiscal year.
Trade Secret, Inc. was sold by Regis Corporation on February 16, 2009. The agreement included a provision that Regis Corporation would supply product to the purchaser at cost for a transition period.
The following tables breakout product revenue, cost of product and product margin as a percent of product revenues between product and product sold to the purchaser of Trade Secret.
|
|
For the Years Ended June 30, | |||||||||
|---|---|---|---|---|---|---|---|---|---|---|
|
Breakout of Product Revenue
|
2010 | 2009 | 2008 | |||||||
|
Product |
$ | 514,631 | $ | 523,968 | $ | 551,286 | ||||
|
Product sold to purchaser of Trade Secret |
19,962 | 32,237 | — | |||||||
|
Total product revenues |
$ | 534,593 | $ | 556,205 | $ | 551,286 | ||||
|
|
For the Years Ended June 30, | |||||||||
|---|---|---|---|---|---|---|---|---|---|---|
|
Breakout of Cost of Product
|
2010 | 2009 | 2008 | |||||||
|
Cost of product |
$ | 243,921 | $ | 250,801 | $ | 264,391 | ||||
|
Cost of product sold to purchaser of Trade Secret |
19,962 | 32,237 | — | |||||||
|
Total cost of product |
$ | 263,883 | $ | 283,038 | $ | 264,391 | ||||
|
|
For the Years Ended June 30, | |||||||||
|---|---|---|---|---|---|---|---|---|---|---|
|
Product Margin as % of Product Revenues
|
2010 | 2009 | 2008 | |||||||
|
Margin on product other than sold to purchaser of Trade Secret |
52.6 | % | 52.1 | % | 52.0 | % | ||||
|
Margin on product sold to purchaser of Trade Secret |
— | — | — | |||||||
|
Total product margin |
50.6 | % | 49.1 | % | 52.0 | % | ||||
The basis point improvement in product margin other than sold to purchaser of Trade Secret as a percentage of product revenues during fiscal year 2010 was due to a planned reduction in retail commissions paid to new employees on retail product sales.
The basis point improvement in product margin other than sold to purchaser of Trade Secret as a percentage of product revenues during fiscal year 2009 was due to selling higher cost inventories in fiscal year 2008 obtained in conjunction with several acquisitions. In addition, product margins improved due to the deconsolidation of the European franchise salon operations and a write-off of slow moving inventories in fiscal year 2008. Partially offsetting the improvement was mix play, as a larger than expected percentage of product sales came from lower-margin promotional items. We are not promoting or discounting at a higher rate, but we are continuing to see customers be more value-focused through buying promotional items at a higher rate than prior periods.
The 80 basis point improvement in product margins as a percentage of product revenues during fiscal year 2008 was due to refinements made to our inventory tracking systems. The refinements
46
resulted in better tracking and accounting for retail products that our salon stylists transfer from retail shelves to the back bar for use in servicing customers. The cost of these products had historically been included as a component of our product gross margin, whereas they are now more appropriately included in our service margin. In addition, product margins improved due to the deconsolidation of the beauty schools and European franchise salon operations.
Site Operating Expenses
This expense category includes direct costs incurred by our salons and hair restoration centers, such as on-site advertising, workers' compensation, insurance, utilities and janitorial costs. Site operating expenses were as follows:
|
|
|
|
Increase (Decrease) Over
Prior Fiscal Year |
|||||||||||||
|---|---|---|---|---|---|---|---|---|---|---|---|---|---|---|---|---|
|
Years Ended June 30,
|
Site
Operating |
Expense as %
of Consolidated Revenues |
Dollar | Percentage | Basis Point(1) | |||||||||||
|
|
(Dollars in thousands)
|
|||||||||||||||
|
2010 |
$ | 199,338 | 8.5 | % | $ | 8,882 | 4.7 | % | 70 | |||||||
|
2009 |
190,456 | 7.8 | 5,687 | 3.1 | 40 | |||||||||||
|
2008 |
184,769 | 7.4 | (5,845 | ) | (3.1 | ) | (60 | ) | ||||||||
- (1)
- Represents the basis point change in site operating expenses as a percent of consolidated revenues as compared to the corresponding period of the prior fiscal year.
The basis point increase in site operating expenses as a percent of consolidated revenues during fiscal year 2010 was primarily due to higher self insurance expense. The Company recorded a reduction in self insurance accruals of $1.7 million in fiscal year 2010 compared to a $9.9 million reduction in fiscal year 2009. In addition the Company settled two legal claims related to customer and employee matters resulting in a $5.2 million charge during fiscal year 2010.
The basis point increase in site operating expenses as a percent of consolidated revenues during fiscal year 2009 was primarily due to the reclassification of rubbish removal and utilities that we pay our landlords as part of our operating lease agreements from rent into site operating expense. Partially offsetting the basis point increase was an incremental $3.0 million benefit due to the reduction in self insurance accruals compared to the fiscal year 2008 reduction in self insurance accruals. The reduction was primarily related to prior years' workers' compensation reserves as a result of successful safety and return-to-work programs implemented over the past few years.
The basis point improvement in site operating expenses as a percent of consolidated revenues during fiscal year 2008 was primarily due to a decrease in workers' compensation expense due to a continued reduction in the frequency and severity of injury claims from our successful salon safety programs.
General and Administrative
General and administrative (G&A) includes costs associated with our field supervision, salon training and promotions, product distribution centers and corporate offices (such as salaries and
47
professional fees), including costs incurred to support franchise and hair restoration center operations. G&A expenses were as follows:
|
|
|
|
Increase (Decrease) Over
Prior Fiscal Year |
|||||||||||||
|---|---|---|---|---|---|---|---|---|---|---|---|---|---|---|---|---|
|
Years Ended June 30,
|
G&A |
Expense as %
of Consolidated Revenues |
Dollar | Percentage | Basis Point(1) | |||||||||||
|
|
(Dollars in thousands)
|
|||||||||||||||
|
2010 |
$ | 291,991 | 12.4 | % | $ | 330 | 0.1 | % | 40 | |||||||
|
2009 |
291,661 | 12.0 | (29,902 | ) | (9.3 | ) | (100 | ) | ||||||||
|
2008 |
321,563 | 13.0 | 3,840 | 1.2 | (40 | ) | ||||||||||
- (1)
- Represents the basis point change in G&A as a percent of consolidated revenues as compared to the corresponding period of the prior fiscal year.
The basis point increase in G&A costs as a percentage of consolidated revenues during fiscal year 2010 was primarily due to negative leverage from the decrease in same-store sales, partially offset by the continuation of cost savings initiatives implemented by the Company.
The basis point improvement in G&A costs as a percentage of consolidated revenues during fiscal year 2009 was primarily due to cost savings initiatives implemented by the Company during the first half of fiscal year 2009 including the reduction of field supervisory staff and the reduction of the fiscal year 2009 marketing budget. The basis point improvement was also related to the deconsolidation of the European franchise salon operations.
The basis point improvement in G&A costs as a percentage of consolidated revenues during fiscal year 2008 was primarily due to the deconsolidation of the European franchise salon operations and accredited cosmetology schools.
Rent
Rent expense, which includes base and percentage rent, common area maintenance and real estate taxes, was as follows:
|
|
|
|
(Decrease) Increase Over
Prior Fiscal Year |
|||||||||||||
|---|---|---|---|---|---|---|---|---|---|---|---|---|---|---|---|---|
|
Years Ended June 30,
|
Rent |
Expense as %
of Consolidated Revenues |
Dollar | Percentage | Basis Point(1) | |||||||||||
|
|
(Dollars in thousands)
|
|||||||||||||||
|
2010 |
$ | 344,098 | 14.6 | % | $ | (3,694 | ) | (1.1 | )% | 30 | ||||||
|
2009 |
347,792 | 14.3 | (13,684 | ) | (3.8 | ) | (30 | ) | ||||||||
|
2008 |
361,476 | 14.6 | 19,654 | 5.7 | 20 | |||||||||||
- (1)
- Represents the basis point change in rent expense as a percent of consolidated revenues as compared to the corresponding period of the prior fiscal year.
The basis point increase in rent expense as a percent of consolidated revenues during fiscal year 2010 was primarily due to negative leverage in this fixed cost category, partially offset by a reduction in our percentage rent payments, both due to negative same-store sales.
The basis point improvement in rent expense as a percent of consolidated revenues during fiscal year 2009 was primarily due to the reclassification of rubbish removal and utilities that we pay our landlords as part of our operating lease agreements to site operating expense from rent expense. Partially offsetting the basis point improvement was negative leverage in this fixed cost category due to negative same-store sales.
48
The basis point increase in rent expense as a percent of consolidated revenues during fiscal year 2008 was primarily due to rent expense increasing at a faster rate than location same-store sales and the deconsolidation of the schools and European franchise salon operations, offset by recent salon acquisitions having a lower occupancy cost.
Depreciation and Amortization
Depreciation and amortization expense (D&A) was as follows:
|
|
|
|
(Decrease) Increase Over
Prior Fiscal Year |
|||||||||||||
|---|---|---|---|---|---|---|---|---|---|---|---|---|---|---|---|---|
|
Years Ended June 30,
|
D&A |
Expense as %
of Consolidated Revenues |
Dollar | Percentage | Basis Point(1) | |||||||||||
|
|
(Dollars in thousands)
|
|||||||||||||||
|
2010 |
$ | 108,764 | 4.6 | % | $ | (6,891 | ) | (6.0 | )% | (20 | ) | |||||
|
2009 |
115,655 | 4.8 | 2,362 | 2.1 | 20 | |||||||||||
|
2008 |
113,293 | 4.6 | 1,829 | 1.6 | (10 | ) | ||||||||||
- (1)
- Represents the basis point change in depreciation and amortization as a percent of consolidated revenues as compared to the corresponding period of the prior fiscal year.
The basis point improvement in D&A as a percent of consolidated revenues during fiscal year 2010 was primarily due to a reduction in the impairment of property and equipment at underperforming locations as compared to fiscal year 2009. The Company recorded impairment charges of $6.4 and $10.2 million during fiscal years 2010 and 2009, respectively. Partially offsetting the improvements was a decline due to negative leverage from the decrease in same-store sales.
The basis point increase in D&A as a percent of consolidated revenues during fiscal year 2009 was primarily due to the decrease in same-store sales. In addition, the Company recorded impairment charges of $10.2 million related to the impairment of property and equipment at underperforming locations, including those salons under the Company approved plan to close up to 80 underperforming United Kingdom company-owned salons.
The basis point improvement in D&A as a percent of consolidated revenues during fiscal year 2008 was primarily due to same-store sales increasing at a faster rate than D&A. The improvement was partially offset by higher salon impairment charges in fiscal year 2008 related to the Company's decision to close 160 (112 continuing operations) underperforming salons in fiscal year 2009, when compared to salon impairment charges in fiscal year 2007. Impairment charges of $6.1 million were recorded during fiscal 2008 related to the impairment of property and equipment at underperforming locations. The majority of closings are expected to occur in the first half of fiscal year 2009. The decision to close the underperforming stores was the result of a comprehensive review of our salon portfolio, further continuing our initiative to enhance profitability.
49
Goodwill Impairment
Goodwill impairment was as follows:
|
|
|
|
(Decrease) Increase Over
Prior Fiscal Year |
|||||||||||||
|---|---|---|---|---|---|---|---|---|---|---|---|---|---|---|---|---|
|
Years Ended June 30,
|
Goodwill
Impairment |
Expense as %
of Consolidated Revenues |
Dollar | Percentage | Basis Point(1) | |||||||||||
|
|
(Dollars in thousands)
|
|||||||||||||||
|
2010 |
$ | 35,277 | 1.5 | % | $ | (6,384 | ) | 15.3 | % | (20 | ) | |||||
|
2009 |
41,661 | 1.7 | 41,661 | 100.0 | 170 | |||||||||||
|
2008 |
— | — | (23,000 | ) | (100.0 | ) | (100 | ) | ||||||||
- (1)
- Represents the basis point change in goodwill impairment as a percent of consolidated revenues as compared to the corresponding period of the prior fiscal year.
The Company recorded a $35.3 million goodwill impairment charge related to the Regis salon concept during fiscal year 2010. Due to the current economic conditions, the estimated fair value of the Regis salon operations was less than the carrying value of this concept's net assets, including goodwill. The $35.3 million impairment charge was the excess of the carrying value of goodwill over the implied fair value of goodwill for the Regis salon operations.
The Company recorded a $41.7 million goodwill impairment charge related to the salon concepts in the United Kingdom during fiscal year 2009. The recent performance challenges of the international salon operations indicated that the estimated fair value of the international salon operations was less than the current carrying value of the reporting unit's net assets, including goodwill. There is no remaining goodwill recorded within the salon concepts in the United Kingdom.
No impairment charges were recorded during fiscal years 2008.
Lease Termination Costs
Lease termination costs were as follows:
|
|
|
|
(Decrease) Increase Over
Prior Fiscal Year |
|||||||||||||
|---|---|---|---|---|---|---|---|---|---|---|---|---|---|---|---|---|
|
Years Ended June 30,
|
Lease
Termination Costs |
Expense as %
of Consolidated Revenues |
Dollar | Percentage | Basis Point(1) | |||||||||||
|
|
(Dollars in thousands)
|
|||||||||||||||
|
2010 |
$ | 2,145 | 0.1 | % | $ | (3,587 | ) | (62.6 | )% | (10 | ) | |||||
|
2009 |
5,732 | 0.2 | 5,732 | 100.0 | 20 | |||||||||||
|
2008 |
— | — | — | — | — | |||||||||||
- (1)
- Represents the basis point change in lease termination costs as a percent of consolidated revenues as compared to the corresponding periods of the prior fiscal year.
The fiscal year 2010 lease termination costs are associated with the Company's June 2009 plan to close underperforming United Kingdom company-owned salons in fiscal year 2010. During fiscal year 2010 we closed 29 salons under the June 2009 plan.
The fiscal year 2009 lease termination costs are primarily associated with the Company's July 2008 plan to close underperforming company-owned salons in fiscal year 2009. The planned closures in fiscal year 2009 included salons in North America and the United Kingdom. During fiscal year 2009 we closed 64 salons under the July 2008 plan.
See further discussion within Note 11 of the Consolidated Financial Statements.
50
Interest Expense
Interest expense was as follows:
|
|
|
|
Increase (Decrease) Over
Prior Fiscal Year |
|||||||||||||
|---|---|---|---|---|---|---|---|---|---|---|---|---|---|---|---|---|
|
Years Ended June 30,
|
Interest |
Expense as %
of Consolidated Revenues |
Dollar | Percentage | Basis Point(1) | |||||||||||
|
|
(Dollars in thousands)
|
|||||||||||||||
|
2010 |
$ | 54,414 | 2.3 | % | $ | 14,646 | 36.8 | % | 70 | |||||||
|
2009 |
39,768 | 1.6 | (4,511 | ) | (10.2 | ) | (20 | ) | ||||||||
|
2008 |
44,279 | 1.8 | 2,632 | 6.3 | — | |||||||||||
- (1)
- Represents the basis point change in interest expense as a percent of consolidated revenues as compared to the corresponding period of the prior fiscal year.
The basis point increase in interest as a percent of consolidated revenues during the twelve months ended June 30, 2010 was primarily due to $18.0 million of make-whole payments and other fees associated with the repayment of private placement debt. The increase due to the make-whole payments and other fees was partially offset by a reduction in interest expense due to decreased debt levels.
The basis point improvement in interest as a percent of consolidated revenues during the twelve months ended June 30, 2009 was primarily due to lower average interest rates on variable rate debt and decreased debt levels as a result of the Company's commitment to reduce debt levels.
Interest as a percent of consolidated revenues during the twelve months ended June 30, 2008 was consistent with the twelve months ended June 30, 2007.
Interest Income and Other, net
Interest income and other, net was as follows:
|
|
|
|
Increase Over Prior Fiscal Year | |||||||||||||
|---|---|---|---|---|---|---|---|---|---|---|---|---|---|---|---|---|
|
Years Ended June 30,
|
Interest |
Income as %
of Consolidated Revenues |
Dollar | Percentage | Basis Point(1) | |||||||||||
|
|
(Dollars in thousands)
|
|||||||||||||||
|
2010 |
$ | 10,410 | 0.4 | % | $ | 949 | 10.0 | % | — | |||||||
|
2009 |
9,461 | 0.4 | 1,288 | 15.8 | 10 | |||||||||||
|
2008 |
8,173 | 0.3 | 3,120 | 61.7 | 10 | |||||||||||
- (1)
- Represents the basis point change in interest income and other, net as a percent of consolidated revenues as compared to the corresponding period of the prior fiscal year.
Interest income and other, net as a percent of consolidated revenues during the twelve months ended June 30, 2010 was consistent with the twelve months ended June 30, 2009. Interest income increased as a result of higher cash balances available to earn interest, partially offset by a decline in rates.
The basis point improvement in interest income and other, net as a percent of consolidated revenues during the twelve months ended June 30, 2009 was primarily due to the Company receiving $2.9 million for administrative services from the purchaser of Trade Secret and foreign currency transaction gains. Partially offsetting the basis point improvement was a decrease in interest income due to a decline in interest rates.
51
The basis point improvement in interest income and other, net as a percent of consolidated revenues during the twelve months ended June 30, 2008 was primarily due to the increased interest income as a result of higher cash balances available to earn interest.
Income Taxes
Our reported effective tax rate was as follows:
|
Years Ended June 30,
|
Effective
Rate |
Basis Point
(Decrease) Increase |
|||||
|---|---|---|---|---|---|---|---|
|
2010 |
48.1 | % | (520 | ) | |||
|
2009 |
53.3 | 1,380 | |||||
|
2008 |
39.5 | 410 | |||||
The basis point improvement in our overall effective income tax rate for the fiscal year ended June 30, 2010 was primarily due to a decrease in the impact of the non-cash goodwill impairment charge recorded during the year ended June 30, 2010 compared to the impact of the non-cash goodwill impairment charge recorded during the year ended June 30, 2009 and an increase in the employment credits received. In addition, a 0.9 percent decrease in the tax rate was due to adjustments to the income tax balances, which had a smaller impact than the charge recorded in the prior year related to the adjustment of prior year deferred income taxes.
The basis point increase in our overall effective income tax rate for the fiscal year ended June 30, 2009 was primarily the result of the pre-tax non-cash goodwill impairment charge of $41.7 million recorded during the three months ended December 31, 2008 which caused an increase in the tax rate of 14.5 percent. The majority of the impairment charge was not deductible for tax purposes. In addition, a 4.8 percent increase in the tax rate was due to an adjustment of prior year deferred income taxes. Offsetting the unfavorable shifts in the income tax rate was a 7.3 percent decrease in the tax rate due to the release of reserves for unrecognized tax benefits upon the expiration of the statute of limitation in federal, state and international jurisdictions.
The basis point increase in our overall effective income tax rate for the fiscal year ended June 30, 2008 was primarily the result of the shift in income from low to high tax jurisdictions as a result of the merger of European franchise salon operations with the Franck Provost Salon Group. As a result of the merger with the Franck Provost Salon Group, the Company repatriated approximately $30 million cash previously considered to be indefinitely reinvested outside of the United States. In addition, certain costs related to the transaction were not deductible for tax purposes. The combined effect of these items caused an increase in the tax rate of 2.1 percent. In addition, Texas and other states introduced new taxes or restrictive rules. The combined effect of these new taxes, together with other adjustments, caused an increase in the tax rate of 1.9 percent.
Equity in Income (Loss) of Affiliated Companies, Net of Income Taxes
Equity in income (loss) of affiliates, represents the income or loss generated by our equity investment in Empire Education Group, Inc., Provalliance, and other equity method investments was as follows:
|
|
|
Increase (Decrease)
Over Prior Fiscal Year |
||||||||
|---|---|---|---|---|---|---|---|---|---|---|
|
|
Equity
Income (Loss) |
|||||||||
|
Years Ended June 30,
|
Dollar | Percentage | ||||||||
|
|
(Dollars in thousands)
|
|||||||||
|
2010 |
$ | 11,942 | $ | 41,788 | 140.0 | % | ||||
|
2009 |
(29,846 | ) | (30,695 | ) | (3,615.4 | ) | ||||
|
2008 |
849 | 849 | 100.0 | |||||||
52
Equity in income of affiliated companies, net of taxes for the year ended June 30, 2010 was due to equity in income of $4.1, $6.4 and $0.9 million recorded for our investments in Provalliance, EEG and Hair Club for Men, Ltd., respectively.
The increase in losses of affiliated companies, net of taxes for the year ended June 30, 2009 was primarily due to the impairment losses of $25.7 and $4.8 million, on our investment in Provalliance and investment in and loans to Intelligent Nutrients, LLC, respectively. Primarily the result of the weakened economy across continental Europe, Provalliance had recorded income at levels much less than expected by Regis management during the Company's fiscal year ended June 30, 2009. In addition, Provalliance significantly increased its debt levels resulting from acquisitions since January 31, 2008 but had significantly reduced future income expectations as a result of current economic conditions. The Company calculated the estimated fair value of Provalliance based on discounted future cash flows that utilize estimates in annual revenue growth, gross margins, capital expenditures, income taxes and long-term growth for determining terminal value. The discounted cash flow model utilizes projected financial results based on Provalliance's business plans and historical trends. The increased debt and reduced earnings expectations reduced the fair value of Provalliance as of June 30, 2009. Accordingly, the Company could no longer justify the carrying amount of its investment in Provalliance and recorded a $25.7 million "other-than-temporary" impairment charge in its fourth quarter ended June 30, 2009. The $4.8 million impairment charge was based on Intelligent Nutrients, LLC's inability to develop a professional organic brand of shampoo and conditioner with broad consumer appeal. The Company determined the losses in value to be "other-than-temporary." Partially offsetting the impairment losses was equity in income recorded for our investments in Provalliance, EEG and Hair Club for Men, Ltd. See Note 6 to the Consolidated Financial Statements for further discussion of each respective affiliated company.
Equity in income of affiliated companies, net of taxes for the year ended June 30, 2008 was due to equity in income recorded for our investments in Provalliance and EEG, partially offset by equity in losses recorded for our investments in Intelligent Nutrients, LLC and PureBeauty and BeautyFirst.
Income (Loss) from Discontinued Operations, net of Taxes
Income (loss) from discontinued operations was as follows:
|
|
|
Increase (Decrease) Over
Prior Fiscal Year |
||||||||
|---|---|---|---|---|---|---|---|---|---|---|
|
|
Income (Loss)
from Discontinued Operations, Net of Taxes |
|||||||||
|
Years Ended June 30, 2009
|
Dollar | Percentage | ||||||||
|
|
(Dollars in thousands)
|
|||||||||
|
2010 |
$ | 3,161 | $ | 134,597 | 102.4 | % | ||||
|
2009 |
(131,436 | ) | (132,739 | ) | (10,187.2 | ) | ||||
|
2008 |
1,303 | (14,128 | ) | (91.6 | ) | |||||
During fiscal year 2010, the Company recorded a $3.0 million tax benefit in discontinued operations to correct the prior year calculation of the income tax benefit related to the disposition of the Trade Secret Salon concept.
During the quarter ended December 31, 2008, we concluded that our Trade Secret concept was held for sale and presented it as discontinued operations for all comparable prior periods. The loss from discontinued operations during fiscal year 2009 represents operating losses and non-cash impairment charges of $183.3 million. The decrease in income from discontinued operations during fiscal year 2008 was primarily due to same-store sales decreasing 7.9 percent and reduced retail product margins, largely the result of recent salon acquisitions which have lower product margins. The decrease in income from discontinued operations during fiscal year 2008 was also due to long-lived asset impairment charges of $4.4 million in fiscal year 2008 as compared to $1.7 million during fiscal year 2007. See Note 2 to the Consolidated Financial Statements for further discussion.
53
Recent Accounting Pronouncements
Recent accounting pronouncements are discussed in Note 1 to the Consolidated Financial Statements.
Effects of Inflation
We compensate some of our salon employees with percentage commissions based on sales they generate, thereby enabling salon payroll expense as a percent of company-owned salon revenues to remain relatively constant. Accordingly, this provides us certain protection against inflationary increases, as payroll expense and related benefits (our major expense components) are variable costs of sales. In addition, we may increase pricing in our salons to offset any significant increases in wages. Therefore, we do not believe inflation has had a significant impact on the results of our operations.
Constant Currency Presentation
The presentation below demonstrates the effect of foreign currency exchange rate fluctuations from year to year. To present this information, current period results for entities reporting in currencies other than United States dollars are converted into United States dollars at the average exchange rates in effect during the corresponding period of the prior fiscal year, rather than the actual average exchange rates in effect during the current fiscal year. Therefore, the foreign currency impact is equal to current year results in local currencies multiplied by the change in the average foreign currency exchange rate between the current fiscal period and the corresponding period of the prior fiscal year.
During the fiscal years ended June 30, 2010, foreign currency translation had a favorable impact on consolidated revenues due to the strengthening of the Canadian dollar against the United States dollar, partially offset by the weakening of the British pound and Euro against the United States dollar.
During the fiscal years ended June 30, 2009, foreign currency translation had an unfavorable impact on consolidated revenues due to the weakening of the Canadian dollar, British pound, and Euro against the United States dollar.
During the fiscal year ended June 30, 2008, foreign currency translation had a favorable impact on consolidated revenues due to the strengthening of the Canadian dollar, British pound, and Euro against the United States dollar.
|
|
Favorable (Unfavorable) Impact of Foreign Currency Exchange Rate Fluctuations | ||||||||||||||||||
|---|---|---|---|---|---|---|---|---|---|---|---|---|---|---|---|---|---|---|---|
|
|
|
|
|
Impact on Income Before Income Taxes | |||||||||||||||
|
|
Impact on Revenues | ||||||||||||||||||
|
|
Fiscal 2010 |
|
Fiscal 2008 | ||||||||||||||||
|
(Dollars in thousands)
Currency |
Fiscal 2010 | Fiscal 2009 | Fiscal 2008 | Fiscal 2009 | |||||||||||||||
|
Canadian dollar |
$ | 10,422 | $ | (18,509 | ) | $ | 14,400 | $ | 1,761 | $ | (3,009 | ) | $ | 2,487 | |||||
|
British pound |
(4,928 | ) | (36,624 | ) | 7,689 | (184 | ) | 7,248 | 134 | ||||||||||
|
Euro |
(34 | ) | (496 | ) | 3,831 | (5 | ) | (252 | ) | 755 | |||||||||
|
Total |
$ | 5,460 | $ | (55,629 | ) | $ | 25,920 | $ | 1,572 | $ | 3,987 | $ | 3,376 | ||||||
Results of Operations by Segment
Based on our internal management structure, we report three segments: North American salons, international salons and hair restoration centers. Significant results of operations are discussed below with respect to each of these segments.
54
North American Salons
North American Salon Revenues. Total North American salon revenues were as follows:
|
|
|
(Decrease) Increase Over
Prior Fiscal Year |
|
||||||||||
|---|---|---|---|---|---|---|---|---|---|---|---|---|---|
|
|
|
Same-Store
Sales (Decrease) Increase |
|||||||||||
|
Years Ended June 30,
|
Revenues | Dollar | Percentage | ||||||||||
|
|
(Dollars in thousands)
|
||||||||||||
|
2010 |
$ | 2,060,563 | $ | (57,135 | ) | (2.7 | )% | (3.3 | )% | ||||
|
2009 |
2,117,698 | 27,952 | 1.3 | (2.9 | ) | ||||||||
|
2008 |
2,089,746 | 177,566 | 9.3 | 1.8 | |||||||||
The percentage increases during the years ended June 30, 2010, 2009, and 2008 were due to the following factors:
|
|
Percentage Increase
(Decrease) in Revenues For the Years Ended June 30, |
|||||||||
|---|---|---|---|---|---|---|---|---|---|---|
|
Factor
|
2010 | 2009 | 2008 | |||||||
|
Acquisitions (previous twelve months) |
0.8 | % | 3.7 | % | 4.6 | % | ||||
|
Organic |
(3.6 | ) | (0.9 | ) | 4.2 | |||||
|
Foreign currency |
0.5 | (0.9 | ) | 0.8 | ||||||
|
Franchise revenues |
— | (0.1 | ) | 0.1 | ||||||
|
Closed salons |
(0.4 | ) | (0.5 | ) | (0.4 | ) | ||||
|
|
(2.7 | )% | 1.3 | % | 9.3 | % | ||||
We acquired 26 North American salons during the twelve months ended June 30, 2010, including 23 franchise buybacks. The decline in organic sales was the result of a same-store sales decrease of 3.3 percent due to a decline in same-store customer visits, partially offset by an increase in average ticket. Contributing to the organic sales decline during the twelve months ended June 30, 2010 was the completion of an agreement to supply the purchaser of Trade Secret product at cost. The Company generated revenues of $20.0 and $32.2 million for product sold to the purchaser of Trade Secret during the twelve months ended June 30, 2010 and 2009, respectively. The foreign currency impact during fiscal year 2010 resulted from the weakening of the United States dollar against the Canadian dollar as compared to the exchange rate for fiscal year 2009.
We acquired 177 North American salons during the twelve months ended June 30, 2009, including 83 franchise buybacks. The organic decrease was due primarily to same-store sales decrease of 2.9 percent, partially offset by the construction of 168 company-owned salons in North America and $32.2 million of product sales to the purchaser of Trade Secret during the twelve months ended June 30, 2009. The foreign currency impact during fiscal year 2009 resulted from the strengthening of the United States dollar against the Canadian dollar as compared to the exchange rate for fiscal year 2008.
We acquired 287 North American salons during the twelve months ended June 30, 2008, including 145 franchise buybacks. The organic growth was due primarily to the construction of 294 company-owned salons in North America during the twelve months ended June 30, 2008, and a same-store sales increase of 1.8 percent during the twelve months ended June 30, 2008. The Company experienced the largest comparable increase in same-store service sales in eight years during the third and fourth quarter of fiscal year 2008, 4.1 and 3.4 percent, respectively. The foreign currency impact during fiscal year 2008 was driven by the weakening of the United States dollar against the Canadian dollar as compared to the exchange rate for fiscal year 2007.
55
North American Salon Operating Income. Operating income for the North American salons was as follows:
|
|
|
|
(Decrease) Increase
Over Prior Fiscal Year |
|||||||||||||
|---|---|---|---|---|---|---|---|---|---|---|---|---|---|---|---|---|
|
|
|
Operating
Income as % of Total Revenues |
||||||||||||||
|
Years Ended June 30,
|
Operating
Income |
Dollar | Percentage | Basis Point(1) | ||||||||||||
|
|
(Dollars in thousands)
|
|||||||||||||||
|
2010 |
$ | 219,855 | 10.7 | % | (55,773 | ) | (20.2 | )% | (230 | ) | ||||||
|
2009 |
$ | 275,628 | 13.0 | (10,227 | ) | (3.6 | ) | (70 | ) | |||||||
|
2008 |
285,855 | 13.7 | 26,464 | 10.2 | 10 | |||||||||||
- (1)
- Represents the basis point change in North American salon operating income as a percent of total North American salon revenues as compared to the corresponding period of the prior fiscal year.
The basis point decrease in North American salon operating income as a percent of North American salon revenues during fiscal year 2010 was primarily due to the $35.3 million goodwill impairment of the Company's Regis salon concept and negative leverage in fixed cost categories due to negative same-store sales. In addition, the basis point decrease was due to the settlement of two legal claims regarding customer and employee matters totaling $5.2 million, higher self insurance expense (the Company recorded reduction in self insurance accruals of $1.7 million in the twelve months ended June 30, 2010 compared to a $9.9 million reduction in the twelve months ended June 30, 2009), partially offset by the Company's cost saving initiatives and gross margin improvement.
The basis point decrease in North American salon operating income as a percent of North American salon revenues during fiscal year 2009 was primarily due to negative leverage in fixed cost categories due to negative same-store sales and lease termination costs associated with the Company's plan to close underperforming company-owned salons. In addition, the basis point decrease was due to an increase in North American revenues of $32.2 million related to product sales to the purchaser of Trade Secret at cost.
The basis point increase in North American salon operating income as a percent of North American salon revenues during fiscal year 2008 was primarily due a decrease in workers' compensation expense due to a continued reduction in the frequency and severity of injury claims from our successful salon safety programs. Partially offsetting the increase was impairment losses on the disposal of property and equipment stemming from salon closures. In July 2008 (fiscal year 2009), we approved a plan to close up to 112 underperforming company-owned salon locations in fiscal year 2009 prior to the lease end date in order to enhance overall profitability, which resulted in impairment charges of $6.1 million.
International Salons
International Salon Revenues. Total international salon revenues were as follows:
|
|
|
(Decrease) Increase
Over Prior Fiscal Year |
|
||||||||||
|---|---|---|---|---|---|---|---|---|---|---|---|---|---|
|
|
|
Same-Store
Sales (Decrease) |
|||||||||||
|
Years Ended June 30,
|
Revenues | Dollar | Percentage | ||||||||||
|
|
(Dollars in thousands)
|
||||||||||||
|
2010 |
$ | 156,085 | $ | (15,484 | ) | (9.0 | )% | (3.8 | )% | ||||
|
2009 |
171,569 | (84,494 | ) | (33.0 | ) | (7.2 | ) | ||||||
|
2008 |
256,063 | 2,633 | 1.0 | (4.3 | ) | ||||||||
56
The percentage increases (decreases) during the years ended June 30, 2010, 2009, and 2008 were due to the following factors.
|
|
Percentage Increase
(Decrease) in Revenues For the Years Ended June 30, |
|||||||||
|---|---|---|---|---|---|---|---|---|---|---|
|
|
2010 | 2009 | 2008 | |||||||
|
Acquisitions (previous twelve months) |
— | % | — | % | 4.1 | % | ||||
|
Organic |
1.5 | (4.8 | ) | (0.7 | ) | |||||
|
Foreign currency |
(2.9 | ) | (14.5 | ) | 4.5 | |||||
|
Franchise revenues |
— | (9.2 | ) | (5.9 | ) | |||||
|
Closed salons |
(7.6 | ) | (4.5 | ) | (1.0 | ) | ||||
|
|
(9.0 | )% | (33.0 | )% | 1.0 | % | ||||
We did not acquire any international salons during the twelve months ended June 30, 2010. The organic sales increase was primarily due to the rebranding of certain salons that had previously been operating under a different salon concept, partially offset by a decrease in same-store sales of 3.8 percent for the twelve months ended June 30, 2010. The foreign currency impact during fiscal year 2010 resulted from the weakening of the United States dollar against the British Pound and Euro as compared to the exchange rates for fiscal year 2009. We closed 42 company-owned salons during the twelve months ended June 30, 2010, of which 29 related to the June 2009 plan to close underperforming salons in the United Kingdom.
We did not acquire any international salons during the twelve months ended June 30, 2009. The organic sales decline was primarily due to a decrease of same-store sales of 7.2 percent for the twelve months ended June 30, 2009, partially offset by the four company-owned international salons constructed. The foreign currency impact during fiscal year 2009 resulted from the strengthening of the United States dollar against the British Pound and Euro as compared to the exchange rates for fiscal year 2008. Franchise revenues decreased primarily due to the merger of our continental Europe franchise salon operations with Franck Provost Salon Group on January 31, 2008.
We acquired 25 international salons during the twelve months ended June 30, 2008, none of which were franchise buybacks. The decrease in organic growth was due to a decrease of same-store sales of 4.3 percent for the twelve months ended June 30, 2008 and due to an additional week in the fiscal year 2007 reporting period as compared to the fiscal year 2008 reporting period. This decrease was partially offset by the 15 company-owned international salons constructed and the inclusion of the four United Kingdom Sassoon schools for the twelve months ended June 30, 2008. The foreign currency impact during fiscal year 2008 was driven by the weakening of the United States dollar against the British Pound and Euro as compared to the exchange rates for fiscal year 2007. Franchise revenues decreased primarily due to the merger of our continental Europe franchise salon operations with Franck Provost Salon Group on January 31, 2008.
57
International Salon Operating Income (Loss). Operating income (loss) for the international salons was as follows:
|
|
|
|
Increase (Decrease)
Over Prior Fiscal Year |
|||||||||||||
|---|---|---|---|---|---|---|---|---|---|---|---|---|---|---|---|---|
|
|
|
Operating Income
(Loss) as % of Total Revenues |
||||||||||||||
|
Years Ended June 30,
|
Operating
Income (Loss) |
Dollar | Percentage | Basis Point(1) | ||||||||||||
|
|
(Dollars in thousands)
|
|||||||||||||||
|
2010 |
$ | 6,779 | 4.3 | % | $ | 52,260 | 114.9 | % | 3,080 | |||||||
|
2009 |
(45,481 | ) | (26.5 | ) | (57,132 | ) | (490.4 | ) | (3,110 | ) | ||||||
|
2008 |
11,651 | 4.6 | (5,897 | ) | (33.6 | ) | (230 | ) | ||||||||
- (1)
- Represents the basis point change in international salon operating income (loss) as a percent of total international salon revenues as compared to the corresponding period of the prior fiscal year.
The basis point improvement in international salon operating income as a percent of international salon revenues during fiscal year 2010 was primarily due to the comparable prior period including a $41.7 million goodwill impairment of the United Kingdom reporting unit and higher impairment charges related to the impairment of property and equipment at underperforming locations. In addition the Company's planned closure of underperforming United Kingdom salons and the continuation of the Company's expense control and payroll management contributed to the basis point improvement during fiscal year 2010.
The basis point decrease in international salon operating income as a percent of international salon revenues during fiscal year 2009 was primarily due to negative same-store sales and the $41.7 million goodwill impairment of the United Kingdom reporting unit during the fiscal year 2009.
The basis point decrease in international salon operating income as a percent of international salon revenues during fiscal year 2008 was primarily due to the deconsolidation of our European franchise salon operations, negative same-store sales, and higher impairment charges of $1.1 million related to the Company approved plan to close underperforming company-owned salon locations in fiscal year 2009. These decreases were offset by the inclusion of the Sassoon schools in the segment.
Hair Restoration Centers
Hair Restoration Center Revenues. Total hair restoration center revenues were as follows:
|
|
|
Increase Over Prior
Fiscal Year |
|
||||||||||
|---|---|---|---|---|---|---|---|---|---|---|---|---|---|
|
|
|
Same-Store
Sales Increase (Decrease) |
|||||||||||
|
Years Ended June 30,
|
Revenues | Dollar | Percentage | ||||||||||
|
|
(Dollars in thousands)
|
||||||||||||
|
2010 |
$ | 141,786 | $ | 1,266 | 0.9 | % | 0.4 | % | |||||
|
2009 |
140,520 | 4,938 | 3.6 | (0.8 | ) | ||||||||
|
2008 |
135,582 | 13,481 | 11.0 | 5.2 | |||||||||
58
The percentage increases during the years ended June 30, 2010, 2009, and 2008 were due to the following factors:
|
|
Percentage Increase
(Decrease) in Revenues For the Years Ended June 30, |
|||||||||
|---|---|---|---|---|---|---|---|---|---|---|
|
|
2010 | 2009 | 2008 | |||||||
|
Acquisitions (previous twelve months) |
0.2 | % | 5.9 | % | 8.1 | % | ||||
|
Organic |
1.0 | (0.9 | ) | 4.2 | ||||||
|
Franchise revenues |
(0.3 | ) | (1.4 | ) | (1.3 | ) | ||||
|
|
0.9 | % | 3.6 | % | 11.0 | % | ||||
We constructed four hair restoration centers during the twelve months ended June 30, 2010. The increase in organic hair restoration revenues during fiscal year 2010 was due to the increase in same-store sales of 0.4 percent.
We acquired two hair restoration centers during the twelve months ended June 30, 2009, both of which were franchise buybacks, and constructed eight hair restoration centers during the twelve months ended June 30, 2009. The decrease in organic hair restoration revenues during fiscal year 2009 was due to the decrease in same-store sales of 0.8 percent.
We acquired six hair restoration centers during the twelve months ended June 30, 2008, all of which were franchise buybacks, and constructed three hair restoration centers during the twelve months ended June 30, 2008. The increase in organic hair restoration revenues during fiscal year 2008 was due to the increase in same-store sales of 5.2 percent.
Hair Restoration Center Operating Income. Operating income for our hair restoration centers was as follows:
|
|
|
|
(Decrease) Increase
Over Prior Fiscal Year |
|||||||||||||
|---|---|---|---|---|---|---|---|---|---|---|---|---|---|---|---|---|
|
Years Ended June 30,
|
Operating
Income |
Operating Income
as % of Total Revenues |
Dollar | Percentage | Basis Point(1) | |||||||||||
|
|
(Dollars in thousands)
|
|||||||||||||||
|
2010 |
$ | 20,337 | 14.3 | % | $ | (3,534 | ) | (14.8 | )% | (270 | ) | |||||
|
2009 |
23,871 | 17.0 | (4,310 | ) | (15.3 | ) | (380 | ) | ||||||||
|
2008 |
28,181 | 20.8 | 2,620 | 10.3 | (10 | ) | ||||||||||
- (1)
- Represents the basis point change in hair restoration center operating income as a percent of total hair restoration center revenues as compared to the corresponding period of the prior fiscal year.
The basis point decrease in hair restoration operating income as a percent of hair restoration revenues during the twelve months ended June 30, 2010 was primarily due to an increase in advertising spend and the settlement of a vendor dispute totaling $0.6 million.
The basis point decrease in hair restoration operating income as a percent of hair restoration revenues during fiscal year 2009 was primarily due to lower operating margins on newly constructed and acquired centers and negative leverage in fixed cost categories due to negative same-store sales.
The basis point decrease in hair restoration operating income as a percent of hair restoration revenues during fiscal year 2008 was primarily due to lower operating margins at the six acquired franchise centers during the twelve months ended June 30, 2008.
59
LIQUIDITY AND CAPITAL RESOURCES
Overview
We continue to maintain a strong balance sheet to support system growth and financial flexibility. Our debt to capitalization ratio, calculated as total debt as a percentage of total debt and shareholders' equity at fiscal year end, was as follows:
|
As of June 30,
|
Debt to
Capitalization |
Basis
Point (Decrease) Increase(1) |
|||||
|---|---|---|---|---|---|---|---|
|
2010 |
30.3 | % | (1,380 | ) | |||
|
2009 |
44.1 | % | 20 | ||||
|
2008 |
43.9 | 20 | |||||
- (1)
- Represents the basis point change in debt to capitalization as compared to prior fiscal year end (June 30).
The basis point decrease in the debt to capitalization ratio as of June 30, 2010 compared to June 30, 2009 was primarily due to the July 2009 common stock offering and decreased debt levels stemming from the repayment of private placement debt during fiscal year 2010. Our principal on-going cash requirements are to finance construction of new stores, remodel certain existing stores, acquire salons and purchase inventory. Customers pay for salon services and merchandise in cash at the time of sale, which reduces our working capital requirements.
The basis point increase in the debt to capitalization ratio as of June 30, 2009 compared to June 30, 2008 was primarily due to a decrease in shareholders' equity from the non-cash goodwill impairment within the United Kingdom salon division, the loss from discontinued operations related to the sale of Trade Secret, the non-cash impairment of our investment in Provalliance and foreign currency due to the strengthening of the United States dollar against the Canadian dollar, Euro and British Pound. The impact of the decrease in shareholders' equity on the debt to capitalization ratio was partially offset by a decrease in debt from June 30, 2008 to June 30, 2009. As of June 30, 2009 and 2008, approximately $55.5 and $230.2 million, respectively, of our debt outstanding is classified as a current liability. As of June 30, 2009 and 2008 we had borrowings on our revolving credit facility of $5.0 and $139.1 million, respectively.
The basis point increase in the debt to capitalization ratio as of June 30, 2008 compared to June 30, 2007 was primarily due to increased debt levels stemming from share repurchases, acquisitions and timing of customary income tax payments made during fiscal year 2008 and 2007. As of June 30, 2008 and 2007, approximately $230.2 and $223.4 million, respectively, of our debt outstanding was classified as a current liability. We have a revolving credit facility which provides for possible acceleration of the maturity date based on provisions that are not objectively determinable and we have therefore included the outstanding borrowings under our revolving credit facility in our current portion of debt. As of June 30, 2008 and 2007 we had borrowings on our revolving credit facility of $139.1 and $147.8 million, respectively.
60
Total assets at June 30, 2010, 2009, and 2008 were as follows:
|
|
|
Increase (Decrease) Over
Prior Fiscal Year |
||||||||
|---|---|---|---|---|---|---|---|---|---|---|
|
|
Total
Assets |
|||||||||
|
As of June 30,
|
Dollar | Percentage | ||||||||
|
|
(Dollars in thousands)
|
|||||||||
|
2010 |
$ | 1,919,572 | $ | 27,086 | 1.4 | % | ||||
|
2009 |
1,892,486 | (343,385 | ) | (15.4 | ) | |||||
|
2008 |
2,235,871 | 103,757 | 4.9 | |||||||
Cash flows from operations, partially offset by the $35.3 million goodwill impairment charge related to the Regis salon concept were the primary factors for the increase in total assets as of June 30, 2010 compared to June 30, 2009.
The non-cash goodwill impairment within the United Kingdom salon division, non-cash impairment of our investment in Provalliance, non-cash impairment related to the sale of Trade Secret salon concept, and a planned reduction in inventory were the primary factors for the decrease in total assets as of June 30, 2009 compared to June 30, 2008.
Acquisitions and new salon construction (a component of organic growth) were the primary drivers of the increase in total assets as of June 30, 2008 compared to June 30, 2007. Acquisitions and new salon construction were primarily funded by a combination of operating cash flow, debt, and assumption of liabilities.
Total shareholders' equity at June 30, 2010, 2009, and 2008 was as follows:
|
|
|
(Decrease) Increase Over
Prior Fiscal Year |
||||||||
|---|---|---|---|---|---|---|---|---|---|---|
|
|
Shareholders'
Equity |
|||||||||
|
As of June 30,
|
Dollar | Percentage | ||||||||
|
|
(Dollars in thousands)
|
|||||||||
|
2010 |
$ | 1,013,293 | $ | 210,433 | 26.2 | % | ||||
|
2009 |
802,860 | (173,326 | ) | (17.8 | ) | |||||
|
2008 |
976,186 | 62,878 | 6.9 | |||||||
During the twelve months ended June 30, 2010, equity increased primarily as a result of the issuance of the $163.6 million in common stock, the $24.7 million ($15.2 million net of tax) equity component of the convertible debt, stock based compensation of $9.3 million and the $42.7 million of earnings during fiscal year 2010. Partially offsetting the increase was $9.1 million of dividends, $8.2 million in equity issuance costs and $5.4 million of foreign currency translation adjustments.
During the twelve months ended June 30, 2009, equity decreased primarily as a result of the non-cash goodwill impairment within the United Kingdom salon division, the non-cash impairment of our investment in Provalliance, the non-cash impairment related to the sale of Trade Secret and foreign currency due to the strengthening of the United States dollar against the Canadian dollar, Euro, and British Pound.
During the twelve months ended June 30, 2008, equity increased primarily as a result of net income and increased accumulated other comprehensive income due primarily to foreign currency translation adjustments as the result of the strengthening of foreign currencies that underlie our investments in those markets, partially offset by lower common stock and additional paid-in capital balances stemming from share repurchases during the twelve months ended June 30, 2008.
61
Cash Flows
Operating Activities
Net cash provided by operating activities during the twelve months ended June 30, 2010, 2009 and 2008 were a result of the following:
|
|
Operating Cash Flows
For the Years Ended June 30, |
|||||||||
|---|---|---|---|---|---|---|---|---|---|---|
|
|
2010 | 2009 | 2008 | |||||||
|
|
(Dollars in thousands)
|
|||||||||
|
Net income (loss) |
$ | 42,740 | $ | (124,466 | ) | $ | 85,204 | |||
|
Depreciation and amortization |
102,336 | 115,016 | 119,977 | |||||||
|
Equity in (income) loss of affiliated companies |
(11,942 | ) | 28,940 | (849 | ) | |||||
|
Deferred income taxes |
5,115 | (3,843 | ) | (3,789 | ) | |||||
|
Impairment on discontinued operations |
(154 | ) | 183,289 | — | ||||||
|
Goodwill and asset impairments |
41,705 | 51,862 | 10,471 | |||||||
|
Receivables |
1,192 | (12,104 | ) | (709 | ) | |||||
|
Inventories |
4,823 | 7,128 | (5,232 | ) | ||||||
|
Income tax receivable |
957 | (34,652 | ) | 20,605 | ||||||
|
Other current assets |
2,657 | (52 | ) | (18,051 | ) | |||||
|
Accounts payable and accrued expenses |
1,040 | (26,977 | ) | 9,249 | ||||||
|
Other noncurrent liabilities |
1,954 | 387 | (14,083 | ) | ||||||
|
Other |
(200 | ) | 3,536 | 19,590 | ||||||
|
|
$ | 192,223 | $ | 188,064 | $ | 222,383 | ||||
Fiscal year 2010 cash provided by operating activities was consistent with fiscal year 2009 cash provided by operating activities.
During fiscal year 2009, cash provided by operating activities was lower than in the twelve months ended June 30, 2008 primarily due to a decrease in working capital cash flow, primarily related to a current year receivable from the purchaser of Trade Secret and a decrease in accrued payroll.
During fiscal year 2008, cash provided by operating activities was lower than in the twelve months ended June 30, 2007 primarily due to a decrease in working capital cash flow.
62
Investing Activities
Net cash used in investing activities during the twelve months ended June 30, 2010, 2009 and 2008 was the result of the following:
|
|
Investing Cash Flows
For the Years Ended June 30, |
|||||||||
|---|---|---|---|---|---|---|---|---|---|---|
|
|
2010 | 2009 | 2008 | |||||||
|
|
(Dollars in thousands)
|
|||||||||
|
Business and salon acquisitions |
$ | (3,664 | ) | $ | (40,051 | ) | $ | (132,971 | ) | |
|
Capital expenditures for remodels or other additions |
(40,561 | ) | (35,081 | ) | (35,212 | ) | ||||
|
Capital expenditures for the corporate office (including all technology-related expenditures) |
(7,828 | ) | (13,113 | ) | (18,310 | ) | ||||
|
Capital expenditures for new salon construction |
(9,432 | ) | (25,380 | ) | (32,277 | ) | ||||
|
Proceeds from loans and investments |
16,099 | 19,008 | 10,000 | |||||||
|
Disbursements for loans and investments |
— | (20,971 | ) | (46,400 | ) | |||||
|
Transfer of cash related to contribution of schools and European franchise salon operations |
— | — | (10,906 | ) | ||||||
|
Freestanding derivative settlement |
736 | — | — | |||||||
|
Proceeds from sale of assets |
70 | 77 | 47 | |||||||
|
|
$ | (44,580 | ) | $ | (115,511 | ) | $ | (266,029 | ) | |
Cash used by investing activities was lower during fiscal year 2010 compared to fiscal year 2009 due to the planned reduction in acquisitions and capital expenditures and the receipt of $15.0 million on the revolving credit facility with EEG of which there was $0.0 and $15.0 million outstanding as of June 30, 2010 and 2009, respectively. The Company completed 333 major remodeling projects during fiscal year 2010, compared to 280 and 186 during fiscal years 2009 and 2008, respectively. We constructed 139 company-owned salons, 4 hair restoration centers and acquired 26 company-owned salons (23 of which were franchise buybacks) and zero hair restoration centers.
Cash used by investing activities was lower during fiscal year 2009 compared to fiscal year 2008 due to the planned reduction in acquisitions and capital expenditures. Acquisitions during fiscal year 2009 were primarily funded by a combination of operating cash flows and debt. Additionally, the Company completed 280 major remodeling projects during fiscal year 2009, compared to 186 during fiscal year 2008. We constructed 182 company-owned salons, eight hair restoration centers and acquired 177 company-owned salons (83 of which were franchise buybacks) and two hair restoration centers, all of which were franchise buybacks. In addition during fiscal year 2008, there was a $36.4 million loan to Empire Education Group, Inc. and a transfer of $10.9 million in cash related to the deconsolidation of our schools and European franchise salon business.
Acquisitions during fiscal year 2008 were primarily funded by a combination of operating cash flows and debt. Additionally the Company completed 186 major remodeling projects during fiscal year 2008, compared to 222 and 170 during fiscal years 2007 and 2006, respectively. We constructed 325 company-owned salons, three hair restoration centers and acquired 382 company-owned salons (150 of which were franchise buybacks) and six hair restoration centers, all of which were franchise buybacks. Investing activities also included a $36.4 million loan to Empire Education Group, Inc. In addition, there was $10.9 million in cash held by the schools and European salon businesses that were deconsolidated.
63
The company-owned constructed and acquired locations (excluding franchise buybacks) consisted of the following number of locations in each concept:
|
|
Years Ended June 30, | ||||||||||||||||||
|---|---|---|---|---|---|---|---|---|---|---|---|---|---|---|---|---|---|---|---|
|
|
2010 | 2009 | 2008 | ||||||||||||||||
|
|
Constructed | Acquired | Constructed | Acquired | Constructed | Acquired | |||||||||||||
|
Regis |
14 | 3 | 20 | 23 | 14 | 4 | |||||||||||||
|
MasterCuts |
15 | — | 14 | — | 7 | — | |||||||||||||
|
Trade Secret(1) |
— | — | 10 | — | 16 | 65 | |||||||||||||
|
SmartStyle |
80 | — | 71 | — | 207 | — | |||||||||||||
|
Supercuts |
10 | — | 27 | — | 33 | 3 | |||||||||||||
|
Promenade |
18 | — | 36 | 71 | 33 | 135 | |||||||||||||
|
International |
2 | — | 4 | — | 15 | 25 | |||||||||||||
|
Hair restoration centers |
4 | — | 8 | — | 3 | — | |||||||||||||
|
|
143 | 3 | 190 | 94 | 328 | 232 | |||||||||||||
- (1)
- Beginning with the period ended December 31, 2008, the operations of Trade Secret concept within the North American reportable segment were accounted for as discounted operations. All comparable periods will reflect Trade Secret as discontinued operations.
Financing Activities
Net cash used in financing activities during the twelve months ended June 30, 2010, 2009 and 2008 was the result of the following:
|
|
Financing Cash Flows
For the Years Ended June 30, |
|||||||||
|---|---|---|---|---|---|---|---|---|---|---|
|
|
2010 | 2009 | 2008 | |||||||
|
|
(Dollars in thousands)
|
|||||||||
|
Net repayments on revolving credit facilities |
$ | (5,000 | ) | $ | (134,100 | ) | $ | (8,613 | ) | |
|
Net (repayments) borrowings of long-term debt |
(181,850 | ) | (7,504 | ) | 46,839 | |||||
|
Proceeds from the issuance of common stock |
159,498 | 3,894 | 8,893 | |||||||
|
Repurchase of common stock |
— | — | (49,957 | ) | ||||||
|
Excess tax benefit from stock-based compensation plans |
243 | 163 | 1,420 | |||||||
|
Dividend payments |
(9,146 | ) | (6,912 | ) | (6,964 | ) | ||||
|
Other |
(2,878 | ) | (3,848 | ) | (2,622 | ) | ||||
|
|
$ | (39,133 | ) | $ | (148,307 | ) | $ | (11,004 | ) | |
During fiscal year 2010, the primary use of cash within financing activities was for net repayments of long-term debt, partially offset by the issuance of common stock.
During fiscal year 2009, the primary use of cash within financing activities was for net repayments on revolving credit facilities as reducing debt levels was one step the Company took to help maintain its compliance with debt covenants. The Company utilized intercompany borrowings on a short-term basis as allowed by a recently expanded IRS ruling to reduce debt.
During fiscal year 2008, net borrowings were primarily used to fund loans and acquisitions, share repurchases, and customary income tax payments. Acquisitions funded are discussed in Note 4 to the Consolidated Financial Statements. The proceeds from the issuance of common stock were related to the exercise of stock options. The excess tax benefit from stock-based employee compensation plans was recorded in accordance with the provisions of SFAS No. 123R.
64
New Financing Arrangements
Fiscal Year 2010
On July 8, 2009, the Company entered into an agreement to sell to underwriters $150 million aggregate principal amount of 5.0 percent convertible senior notes due 2014, and 11,500,000 shares of its common stock at $12.37 per share, which was the closing price per share on July 8, 2009. The Company completed the agreement on July 14, 2009. In addition, under the July 8, 2009 agreement, the Company granted the underwriters an over-allotment option to purchase up to an additional $22.5 million aggregate principal amount of notes, and up to an additional 1,725,000 shares of common stock, on the same terms and conditions. The underwriters exercised such options in their entirety and, on July 21, 2009, the Company completed the issuance of the additional shares and notes for the exercise by the underwriters of the over-allotment option of $22.5 million aggregate principal amount of notes and an additional 1,725,000 shares of common stock.
The notes are unsecured, senior obligations of the Company and interest will be payable semi-annually at a rate of 5.0 percent per year. The notes will mature on July 15, 2014. The notes will be convertible subject to certain conditions at an initial conversion rate of 64.6726 shares of the Company's common stock per $1,000 principal amount of notes (representing an initial conversion price of approximately $15.46 per share of the Company's common stock), subject to adjustment in certain circumstances.
The net proceeds to the Company from the offerings of convertible senior notes and common stock were approximately $323.8 million after deducting underwriting discounts and before estimated offering expenses. The Company utilized the proceeds to repay $267.0 million of private placement senior term notes of varying maturities and $30.0 million of senior term notes under the Private Shelf Agreement. As a result of the repayment of a portion of the senior term notes during the twelve months ended June 30, 2010, the Company incurred $12.8 million in make-whole payments and other fees along with $5.2 million in interest rate swap settlements, as discussed in Note 9 to the Consolidated Financial Statements, totaling $18.0 million that was recorded as interest expense within the Consolidated Statement of Operations. The remaining proceeds were used for general corporate purposes including the repayment of bank debt.
In connection with the offerings above, on July 14, 2009, the Company amended the Fourth Amended and Restated Credit Agreement, the Term Loan Agreement and the Amended and Restated Private Shelf Agreement, all subject to the completion of the issuances of the convertible senior notes and common stock discussed above. The amendments included increasing the Company's minimum net worth covenant from $675 to $800 million, lowering the fixed charge coverage ratio requirement from 1.5x to 1.3x, amending certain definitions, including EBITDA and Fixed Charges, and limiting the Company's Restricted Payments to $20 million if the Company's Leverage Ratio is greater than 2.0x. In addition, the amendments to the Fourth Amended and Restated Credit Agreement reduced the borrowing capacity of the revolving credit facility from $350.0 to $300.0 million and the amendments to the Restated Private Shelf Agreement incorporated a risk based capital fee calculated on the daily average outstanding principal amount equal to an annual rate of 1.0 percent which commences one year after the effective date of the amendment. We were in compliance with all covenants and other requirements of our credit agreement and senior notes as of June 30, 2010.
Fiscal Year 2009
During fiscal year 2009, we completed a $85 million term loan that matures in July 2012. The monthly interest payments are based on a one-month LIBOR plus a 1.75 percent spread. The term loan includes customary financial covenants including a leverage ratio, fixed charge ratio and minimum net equity test. We used the proceeds from the term loan to pay down our revolving line of credit
65
facility. We were in compliance with all covenants and other requirements of our credit agreement and senior notes as of June 30, 2009.
Fiscal Year 2008
During fiscal year 2008, we refinanced our $350.0 million revolving credit facility. Among other changes, this amendment extended the credit facility's expiration date to July 2012, reduced the interest rate on borrowings under the credit facility and modified certain financial covenants. Additionally, we borrowed $125.0 million, and amended the fixed charge coverage ratio under our Private Shelf Agreement.
Under the terms of the July 12, 2007 revolving credit agreement, our ratio of earnings before interest, taxes, depreciation, amortization, and rent expense (EBITDAR) to fixed charges (which includes rent and interest expenses) may not drop below 1.5 on a rolling four quarter basis. We were in compliance with all covenants and other requirements of our credit agreement and senior notes as of June 30, 2008. Additionally, the credit agreements do not include rating triggers or subjective clauses that would accelerate maturity dates.
Other Financing Arrangements
Private Shelf Agreement
At June 30, 2010 and 2009, we had $174.1 and $239.6 million, respectively, in unsecured, fixed rate, senior term notes outstanding under a Private Shelf Agreement. The notes require quarterly payments, and final maturity dates range from October 2010 through December 2017. The interest rates on the notes range from 5.65 to 8.39 percent as of June 30, 2010, and range from 4.65 to 8.39 percent as of June 30, 2009.
The Private Shelf Agreement includes financial covenants including debt to earnings before interest, taxes, depreciation and amortization (EBITDA) ratios, fixed charge coverage ratios and minimum net equity tests (as defined within the Private Shelf Agreement), as well as other customary terms and conditions. The maturity date for the debt may be accelerated upon the occurrence of various Events of Default, including breaches of the agreement, certain cross-default situations, certain bankruptcy related situations, and other customary events of default.
In July 2009, the Company amended the Restated Private Shelf Agreement. The amendments included increasing the Company's minimum net worth covenant from $675 to $800 million, lowering the fixed charge coverage ratio requirement from 1.5x to 1.3x, amending certain definitions, including EBITDA and Fixed Charges, limiting the Company's Restricted Payments to $20 million if the Company's Leverage Ratio is greater than 2.0x and the addition of a risk based capital fee calculated on the daily average outstanding principal amount equal to an annual rate of 1.0 percent that commences one year after the amendment date. During fiscal year 2010, the net proceeds from the convertible senior notes and common stock issuances in July 2009 were utilized in part to repay $30.0 million of senior term notes under the Private Shelf Agreement.
Private Placement Senior Term Notes
At June 30, 2010 and 2009, we had $0.0 and $267.0 million, respectively, in private placement senior term notes. On June 29, 2009, the Company entered into a prepayment amendment on the private placement senior term notes whereby the Company negotiated to prepay the notes with a premium over the principal amount that is less than the make-whole premium that is otherwise payable upon redemption. During fiscal year 2010, the net proceeds from the convertible senior notes and common stock issuances in July 2009 were utilized to repay the $267.0 million of private placement senior term notes.
66
As a result of the repayment of a portion of the senior term notes during the twelve months ended June 30, 2010, the Company incurred $12.8 million in make-whole payments and other fees along with $5.2 million in interest rate swap settlements, as discussed in Note 9 to the Consolidated Financial Statements, totaling $18.0 million that was recorded as interest expense within the Consolidated Statement of Operations.
Acquisitions
Acquisitions are discussed throughout Management's Discussion and Analysis in this Item 7, as well as in Note 4 to the Consolidated Financial Statements in Part II, Item 8 of this Form 10-K. The acquisitions were funded primarily from operating cash flow, debt and the issuance of common stock.
Contractual Obligations and Commercial Commitments
The following table reflects a summary of obligations and commitments outstanding by payment date as of June 30, 2010:
|
|
Payments due by period |
|
|||||||||||||||
|---|---|---|---|---|---|---|---|---|---|---|---|---|---|---|---|---|---|
|
Contractual Obligations
|
Within 1
years |
1 - 3
years |
3 - 5
years |
More than 5
years |
Total | ||||||||||||
|
|
(Dollars in thousands)
|
||||||||||||||||
|
On-balance sheet: |
|||||||||||||||||
|
Long-term debt obligations(a) |
$ | 41,216 | $ | 130,294 | $ | 187,475 | $ | 53,571 | $ | 412,556 | |||||||
|
Capital lease obligations |
10,413 | 13,518 | 3,542 | — | 27,473 | ||||||||||||
|
Other long-term liabilities |
1,856 | 2,867 | 1,906 | 19,306 | 25,935 | ||||||||||||
|
Total on-balance sheet |
53,485 | 146,679 | 192,923 | 72,877 | 465,964 | ||||||||||||
|
Off-balance sheet(b): |
|||||||||||||||||
|
Operating lease obligations |
301,865 | 425,379 | 209,865 | 107,976 | 1,045,085 | ||||||||||||
|
Interest on long-term debt and capital lease obligations |
25,689 | 40,349 | 21,077 | 8,036 | 95,151 | ||||||||||||
|
Total off-balance sheet |
327,554 | 465,728 | 230,942 | 116,012 | 1,140,236 | ||||||||||||
|
Total(c) |
$ | 381,039 | $ | 612,407 | $ | 423,865 | $ | 188,889 | $ | 1,606,200 | |||||||
- (a)
-
The
net proceeds of the July 2009 financing agreements were approximately $323.8 million after deducting underwriting discounts and before estimated
offering expenses. The Company utilized the proceeds to repay $267.0 million of private placement senior term notes of varying maturities and $30.0 million of senior term notes under the
Private Shelf Agreement. The remaining proceeds were used for general corporate purposes including the repayment of bank debt.
- (b)
-
In
accordance with accounting principles generally accepted in the United States of America, these obligations are not reflected in the Consolidated Balance
Sheet.
- (c)
- As of June 30, 2010, we have liabilities for uncertain tax positions. We are not able to reasonably estimate the amount by which the liabilities will increase or decrease over time; however, at this time, we do not expect a significant payment related to these obligations within the next fiscal year. See Note 13 to the Consolidated Financial Statements for more information on our uncertain tax positions.
On-Balance Sheet Obligations
Our long-term obligations are composed primarily of senior term notes, term loan and a revolving credit facility. A portion of the term loan is hedged by contracts with financial institutions commonly
67
referred to as interest rate swaps, as discussed in Part II, Item 7A, "Quantitative and Qualitative Disclosures about Market Risk." Additionally, no adjustment was necessary to mark the hedged portion of the debt obligation to fair value (a reduction to long-term debt). Interest payments on long-term debt and capital lease obligations were estimated based on each debt obligation's agreed upon rate as of June 30, 2010 and scheduled contractual repayments.
Other long-term liabilities include a total of $18.2 million related to the Executive Profit Sharing Plan and a salary deferral program, $7.8 million (including $0.3 million in interest) related to established contractual payment obligations under retirement and severance payment agreements for a small number of retired employees.
This table excludes the short-term liabilities, other than the current portion of long-term debt, disclosed on our balance sheet as the amounts recorded for these items will be paid in the next year. We have no unconditional purchase obligations, as defined by long-term obligations guidance. Also excluded from the contractual obligations table are payment estimates associated with employee health and workers' compensation claims for which we are self-insured. The majority of our recorded liability for self-insured employee health and workers' compensation losses represents estimated reserves for incurred claims that have yet to be filed or settled.
The Company has unfunded deferred compensation contracts covering certain management and executive personnel. The deferred compensation contracts are offered to key executives based on their accomplishments within the Company. Because we cannot predict the timing or amount of our future payments related to these contracts, such amounts were not included in the table above. Related obligations totaled $30.0, $24.5, and $20.2 million at June 30, 2010, 2009, and 2008, respectively, and are included in other noncurrent liabilities in the Consolidated Balance Sheet. Refer to Note 14 to the Consolidated Financial Statements for additional information. The obligations are funded by insurance contracts.
Off-Balance Sheet Arrangements
Operating leases primarily represent long-term obligations for the rental of salon and hair restoration center premises, including leases for company-owned locations, as well as future salon franchisee lease payments of approximately $138.1 million, which are reimbursed to the Company by franchisees. Regarding the franchisee subleases, we generally retain the right to the related salon assets net of any outstanding obligations in the event of a default by a franchise owner. Management has not experienced and does not expect any material loss to result from these arrangements.
We have interest rate swap contracts and forward foreign currency contracts. See Part II, Item 7A, "Quantitative and Qualitative Disclosures about Market Risk," for a detailed discussion of our derivative instruments. Future net settlements under these agreements are not included in the table above.
We are a party to a variety of contractual agreements under which we may be obligated to indemnify the other party for certain matters, which indemnities may be secured by operation of law or otherwise, in the ordinary course of business. These contracts primarily relate to our commercial contracts, operating leases and other real estate contracts, financial agreements, credit facility of EEG, agreements to provide services, and agreements to indemnify officers, directors and employees in the performance of their work. While our aggregate indemnification obligation could result in a material liability, we are not aware of any current matter that we expect to result in a material liability.
We do not have other unconditional purchase obligations or significant other commercial commitments such as commitments under lines of credit and standby repurchase obligations or other commercial commitments.
68
Under the terms of the revolving credit facility amended in July 2009, our ratio of earnings before interest, taxes, depreciation, amortization and rent expense (EBITDAR) to fixed charges (which includes rent and interest expenses) may not drop below 1.3 on a rolling four quarter basis. We were in compliance with all covenants and other requirements of our credit agreements and senior notes during fiscal year 2010 and are currently in fiscal 2011. Additionally, the credit agreements do not include rating triggers or subjective clauses that would accelerate maturity dates.
As a part of our salon development program, we continue to negotiate and enter into leases and commitments for the acquisition of equipment and leasehold improvements related to future salon locations, and continue to enter into transactions to acquire established hair care salons and businesses.
We do not have any relationships with unconsolidated entities or financial partnerships, such as entities often referred to as structured finance or special purpose entities, which would have been established for the purpose of facilitating off-balance sheet financial arrangements or other contractually narrow or limited purposes at June 30, 2010. As such, we are not materially exposed to any financing, liquidity, market or credit risk that could arise if we had engaged in such relationships.
Financing
Financing activities are discussed under "Liquidity and Capital Resources" in this Item 7 and in Note 8 to the Consolidated Financial Statements in Part II, Item 8. Derivative activities are discussed in Note 9 to the Consolidated Financial Statements in Part II, Item 8 and Part II, Item 7A, "Quantitative and Qualitative Disclosures about Market Risk."
Management believes that cash generated from operations and amounts available under existing debt facilities will be sufficient to fund its anticipated capital expenditures, acquisitions and required debt repayments for the foreseeable future. As of June 30, 2010, we have available an unused committed line of credit amount of $275.4 million under our existing revolving credit facility.
Dividends
We paid dividends of $0.16 per share during fiscal years 2010, 2009 and 2008. On August 25, 2010, the Board of Directors of the Company declared a $0.04 per share quarterly dividend payable September 22, 2010 to shareholders of record on September 8, 2010.
Share Repurchase Program
In May 2000, the Company's Board of Directors (BOD) approved a stock repurchase program. Originally, the program authorized up to $50.0 million to be expended for the repurchase of the Company's stock. The BOD elected to increase this maximum to $100.0 million in August 2003, to $200.0 million on May 3, 2005, and to $300.0 million on April 26, 2007. The timing and amounts of any repurchases will depend on many factors, including the market price of the common stock and overall market conditions. Historically, the repurchases to date have been made primarily to eliminate the dilutive effect of shares issued in conjunction with acquisitions, restricted stock grants and stock option exercises. All repurchased shares become authorized but unissued shares of the Company. This repurchase program has no stated expiration date. The Company did not repurchase any shares during fiscal year 2010. As of June 30, 2010, 2009, and 2008, a total accumulated 6.8 million shares have been repurchased for $226.5 million. As of June 30, 2010, $73.5 million remains to be spent on share repurchases under this program.
SAFE HARBOR PROVISIONS UNDER THE PRIVATE SECURITIES LITIGATION REFORM ACT OF 1995
This annual report, as well as information included in, or incorporated by reference from, future filings by the Company with the Securities and Exchange Commission and information contained in
69
written material, press releases and oral statements issued by or on behalf of the Company contains or may contain "forward-looking statements" within the meaning of the federal securities laws, including statements concerning anticipated future events and expectations that are not historical facts. These forward-looking statements are made pursuant to the safe harbor provisions of the Private Securities Litigation Reform Act of 1995. The forward-looking statements in this document reflect management's best judgment at the time they are made, but all such statements are subject to numerous risks and uncertainties, which could cause actual results to differ materially from those expressed in or implied by the statements herein. Such forward-looking statements are often identified herein by use of words including, but not limited to, "may," "believe," "project," "forecast," "expect," "estimate," "anticipate," and "plan." In addition, the following factors could affect the Company's actual results and cause such results to differ materially from those expressed in forward-looking statements. These factors include the results and impact of the Company's announcement to explore strategic alternatives, competition within the personal hair care industry, which remains strong, both domestically and internationally, price sensitivity; changes in economic conditions and in particular, continued weakness in the U.S. and global economies; changes in consumer tastes and fashion trends; the ability of the Company to implement its planned spending and cost reduction plan and to continue to maintain compliance with financial covenants in its credit agreements; labor and benefit costs; legal claims; risk inherent to international development (including currency fluctuations); the continued ability of the Company and its franchisees to obtain suitable locations and financing for new salon development and to maintain satisfactory relationships with landlords and other licensors with respect to existing locations; governmental initiatives such as minimum wage rates, taxes and possible franchise legislation; the ability of the Company to successfully identify, acquire and integrate salons that support its growth objectives; the ability of the Company to maintain satisfactory relationships with suppliers; the ability of the Company to consummate the planned closure of salons and the related realization of the anticipated costs, benefits and time frame; or other factors not listed above. The ability of the Company to meet its expected revenue growth is dependent on salon acquisitions, new salon construction and same-store sales increases, all of which are affected by many of the aforementioned risks. Additional information concerning potential factors that could affect future financial results is set forth under Item 1A of this Form 10-K. We undertake no obligation to publicly update or revise any forward-looking statements, whether as a result of new information, future events or otherwise. However, your attention is directed to any further disclosures made in our subsequent annual and periodic reports filed or furnished with the SEC on Forms 10-Q and 8-K and Proxy Statements on Schedule 14A.
The primary market risk exposure of the Company relates to changes in interest rates in connection with its debt, some of which bears interest at variable rates based on LIBOR plus an applicable borrowing margin. Additionally, the Company is exposed to foreign currency translation risk related to its net investments in its foreign subsidiaries and, to a lesser extent, changes in the Canadian dollar exchange rate. The Company has established policies and procedures that govern the management of these exposures through the use of derivative financial instrument contracts. By policy, the Company does not enter into such contracts for the purpose of speculation. The following details the Company's policies and use of financial instruments.
Interest Rate Risk:
The Company has established an interest rate management policy that attempts to minimize its overall cost of debt, while taking into consideration the earnings implications associated with the volatility of short-term interest rates. As part of this policy, the Company has elected to maintain a combination of variable and fixed rate debt. A one percent change in interest rates (including the impact of existing interest rate swap contracts) could impact the Company's interest expense by approximately $0.5 million. During fiscal year 2008, the National Association of Insurance
70
Commissioners downgraded Regis' private placement debt from investment-grade to non-investment grade. The downgrade did not have any effect on the private placement debt outstanding and corresponding interest rate as of June 30, 2010. The downgrade has no impact on the Company's current revolving credit facility or its ability to secure future bank borrowings. Considering the effect of interest rate swaps and including no increases to long-term debt related to fair value swaps at June 30, 2010 and 2009, the Company had the following outstanding debt balances:
|
|
As of June 30, | ||||||
|---|---|---|---|---|---|---|---|
|
|
2010 | 2009 | |||||
|
|
(Dollars in thousands)
|
||||||
|
Fixed rate debt |
$ | 395,029 | $ | 534,307 | |||
|
Variable rate debt |
45,000 | 100,000 | |||||
|
|
$ | 440,029 | $ | 634,307 | |||
The Company manages its interest rate risk by continually assessing the amount of fixed and variable rate debt. On occasion, the Company uses interest rate swaps to further mitigate the risk associated with changing interest rates and to maintain its desired balances of fixed and floating rate debt.
In addition, the Company has entered into the following financial instruments:
Interest Rate Swap Contracts:
The Company manages its interest rate risk by balancing the amount of fixed and variable rate debt. On occasion, the Company uses interest rate swaps to further mitigate the risk associated with changing interest rates and to maintain its desired balances of fixed and variable rate debt. Generally, the terms of the interest rate swap agreements contain monthly and quarterly settlement dates based on the notional amounts of the swap contracts.
Pay fixed rates, receive variable rates
During the three months ended December 31, 2008, the Company entered into two interest rate swap contracts that pay fixed rates of interest and receive variable rates of interest (based on the one-month LIBOR) on notional amounts of indebtedness of $20.0 million each as of June 30, 2010, and mature in July 2011, respectively. The Company will pay fixed rates of interest of approximately 3.0 percent and 3.4 percent on their respective $20.0 million. The contracts are on an aggregate notional amount of indebtedness of $40.0 million related to the $85.0 million term loan, which the Company entered into during the three months ended December 31, 2008. The contracts expire in July 2011 and the debt matures in July 2012. These interest rate swap contracts were designed and are effective as cash flow hedges. They were recorded at fair value within other noncurrent liabilities in the Consolidated Balance Sheet, with corresponding offset in deferred income taxes and other comprehensive income within shareholders' equity.
During the three months ended December 31, 2005, the Company entered into interest rate swap contracts that pay fixed rates of interest and receive variable rates of interest (based on the three-month LIBOR) on notional amounts of indebtedness of $35.0 and $15.0 million, and mature in March 2013 and March 2015, respectively. These swaps were designated and were effective as cash flow hedges. These cash flow hedges were recorded at fair value within other noncurrent liabilities in the Consolidated Balance Sheet, with a corresponding offset in other comprehensive income within shareholders' equity. These contracts were terminated during fiscal year 2010 in conjunction with the repayment of the private placement senior term notes as discussed in Note 17 to the Consolidated Financial Statements. These contracts were settled for an aggregate loss of $5.2 million recorded within interest expense in the Consolidated Statement of Operations.
71
Pay variable rates, receive fixed rates
The Company had interest rate swap contracts under which it paid variable rates of interest (based on the three-month LIBOR plus a credit spread) and received fixed rates of interest on an aggregate $5.0 million notional amount at June 30, 2008, with a maturation date of July 2008. These swaps were designated as hedges of a portion of the Company's senior term notes and were being accounted for as fair value hedges.
During fiscal year 2003, the Company terminated a portion of a $40.0 million interest rate swap contract. The remainder of this swap contract was terminated during the fourth quarter of fiscal year 2005. The terminations resulted in the Company realizing gains of $1.1 and $1.5 million during fiscal year 2005 and 2003, respectively, which were deferred in long-term debt in the Consolidated Balance Sheet and were being amortized against interest expense over the remaining life of the underlying debt that matured in July 2008. Approximately $0.3, $0.5, and $0.5 million of the deferred gain was amortized against interest expense during fiscal years 2009, 2008 and 2007, respectively, resulting in the deferred gain being fully amortized at June 30, 2009.
Tabular Presentation:
The following table presents information about the Company's debt obligations and derivative financial instruments that are sensitive to changes in interest rates. For fixed rate debt obligations, the table presents principal amounts and related weighted-average interest rates by fiscal year of maturity. For variable rate obligations, the table presents principal amounts and the weighted-average forward LIBOR interest rates as of June 30, 2010 through June 30, 2015. For the Company's derivative financial instruments, the table presents notional amounts and weighted-average interest rates by expected (contractual) maturity dates. Notional amounts are used to calculate the contractual payments to be exchanged under the contract.
|
|
Expected maturity date as of June 30, 2010 | June 30, 2010 |
June 30,
2009 |
|||||||||||||||||||||||||||
|---|---|---|---|---|---|---|---|---|---|---|---|---|---|---|---|---|---|---|---|---|---|---|---|---|---|---|---|---|---|---|
|
|
2011 | 2012 | 2013 | 2014 | 2015 | Thereafter | Total | Fair Value | Fair Value | |||||||||||||||||||||
|
Liabilities |
||||||||||||||||||||||||||||||
|
(U.S.$ equivalent in thousands) |
||||||||||||||||||||||||||||||
|
Long-term debt: |
||||||||||||||||||||||||||||||
|
Fixed rate (U.S.$) |
$ | 51,629 | $ | 30,834 | $ | 27,978 | $ | 172,440 | $ | 18,577 | $ | 53,571 | $ | 355,029 | $ | 373,582 | $ | 461,878 | ||||||||||||
|
Average interest rate |
6.9 | % | 7.7 | % | 7.6 | % | 5.3 | % | 7.6 | % | 7.5 | % | 6.4 | % | ||||||||||||||||
|
Variable rate (U.S.$) |
— | 85,000 | — | — | — | — | 85,000 | 85,000 | 190,000 | |||||||||||||||||||||
|
Average interest rate |
2.9 | % | ||||||||||||||||||||||||||||
|
Total liabilities |
$ | 51,629 | $ | 115,834 | $ | 27,978 | $ | 172,440 | $ | 18,577 | $ | 53,571 | $ | 440,029 | $ | 458,582 | $ | 651,878 | ||||||||||||
|
Interest rate derivatives |
||||||||||||||||||||||||||||||
|
(U.S.$ equivalent in thousands) |
||||||||||||||||||||||||||||||
|
Pay fixed/receive variable (U.S.$) |
$ | — | $ | 40,000 | $ | — | $ | — | $ | — | $ | — | $ | 40,000 | $ | 1,039 | $ | 5,786 | ||||||||||||
|
Average pay rate** |
3.2 | % | ||||||||||||||||||||||||||||
|
Average receive rate** |
0.4 | % | ||||||||||||||||||||||||||||
- **
- Represents the average expected cost of borrowing for outstanding derivative balances as of June 30, 2010.
72
Foreign Currency Exchange Risk:
The majority of the Company's revenue, expense and capital purchasing activities are transacted in United States dollars. However, because a portion of the Company's operations consists of activities outside of the United States, the Company has transactions in other currencies, primarily the Canadian dollar, British pound and Euro. In preparing the Consolidated Financial Statements, the Company is required to translate the financial statements of its foreign subsidiaries from the currency in which they keep their accounting records, generally the local currency, into United States dollars. Different exchange rates from period to period impact the amounts of reported income and the amount of foreign currency translation recorded in accumulated other comprehensive income. As part of its risk management strategy, the Company frequently evaluates its foreign currency exchange risk by monitoring market data and external factors that may influence exchange rate fluctuations. As a result, the Company may engage in transactions involving various derivative instruments to hedge assets, liabilities and purchases denominated in foreign currencies. As of June 30, 2010, the Company has entered into the following financial instruments to manage its foreign currency exchange risk:
Hedge of the Net Investment in Foreign Subsidiaries:
The Company has numerous investments in foreign subsidiaries, and the net assets of these subsidiaries are exposed to exchange rate volatility. The Company frequently evaluates its foreign currency exchange risk by monitoring market data and external factors that may influence exchange rate fluctuations. As a result, the Company may engage in transactions involving various derivative instruments to hedge assets, liabilities and purchases denominated in foreign currencies.
During September 2006, the Company's cross-currency swap (which had a notional amount of $21.3 million and hedged a portion of the Company's net investment in its foreign operations) was settled, resulting in a cash outlay of $8.9 million. This cash outlay was recorded within investing activities within the Consolidated Statement of Cash Flows. The related cumulative tax-effected net loss of $7.9 million was recorded in accumulated other comprehensive income (AOCI) in fiscal year 2007. This amount will remain deferred within AOCI indefinitely, as the event which would trigger its release from AOCI and recognition in earnings is the sale or liquidation of the Company's international operations that the cross-currency swap hedged. The Company currently has no intent to sell or liquidate this portion of its business operations.
Forward Foreign Currency Contracts:
The Company's exposure to foreign exchange risk includes risks related to fluctuations in the Canadian dollar relative to the U.S. dollar. The exposure to Canadian dollar exchange rates on the Company's fiscal year 2010 cash flows primarily includes payments in Canadian dollars from the Company's operations for retail inventory exported from the United States.
The Company seeks to manage exposure to changes in the value of the Canadian dollar. In order to do so, the Company has entered into forward currency contracts from fiscal year 2007 to fiscal year 2010 in order to reduce the risk of significant negative impact on its U.S. dollar cash flows or income. The Company does not hedge foreign currency exposure in a manner that would entirely eliminate the effect of changes in foreign currency exchange rates on net income and cash flows. On March 12, 2010 and June 30, 2010, the Company entered into several forward foreign currency contracts to sell Canadian dollars and buy an aggregate of $8.7 million U.S. dollars, respectively, with maturation dates between July 30, 2010 and September 30, 2011. The purpose of the forward contracts was to protect against adverse movements in the Canadian dollar exchange rate. The contracts were designated and were effective as cash flow hedges. They were recorded at fair value within other noncurrent liabilities or other current assets in the Consolidated Balance Sheet, with corresponding offsets primarily recorded in other comprehensive income (loss), net of tax. Forward currency contracts to sell Canadian
73
dollars and buy $8.7 million U.S. dollars were outstanding as of June 30, 2010 to hedge intercompany transactions. See Note 9 to the Consolidated Financial Statements for further discussion.
The Company uses freestanding derivative forward contracts to offset the Company's exposure to the change in fair value of certain foreign currency denominated intercompany assets and liabilities. These derivatives are not designated as hedges and therefore, changes in the fair value of these forward contracts are recognized currently in earnings thereby offsetting the current earnings effect of the related foreign currency denominated assets and liabilities.
On June 14, 2010, the Company entered into a freestanding derivative forward contract to sell Canadian dollars and buy an aggregate $14.0 million U.S. dollars, with a maturation date in July 2010.
The table below provides information about the Company's forecasted transactions in U.S. dollar equivalents. (The information is presented in U.S. dollars because that is the Company's reporting currency.) The table summarizes information on transactions that are sensitive to foreign currency exchange rates and the related foreign currency forward exchange agreements. For the foreign currency forward exchange agreements, the table presents the notional amounts and weighted average exchange rates by expected (contractual) maturity dates. These notional amounts generally are used to calculate the contractual payments to be exchanged under the contract.
|
|
Expected Transaction date June 30, |
|
||||||||||||||||||
|---|---|---|---|---|---|---|---|---|---|---|---|---|---|---|---|---|---|---|---|---|
|
|
June 30,
2010 Fair Value |
|||||||||||||||||||
|
|
2011 | 2012 | 2013 | 2014 | Total | |||||||||||||||
|
Forecasted Transactions |
||||||||||||||||||||
|
(U.S.$ equivalent in thousands) |
||||||||||||||||||||
|
Intercompany transactions with Canadian salons (U.S.$) |
$ | 7,040 | $ | 1,679 | $ | — | $ | — | $ | 8,719 | $ | 274 | ||||||||
|
Foreign currency denominated intercompany assets and liabilities (U.S.$) |
14,000 | — | — | — | 14,000 | — | ||||||||||||||
|
Total contracts |
$ | 21,040 | $ | 1,679 | $ | — | $ | — | $ | 22,719 | $ | 274 | ||||||||
|
Average contractual exchange rate |
1.0293 | 1.0722 | 1.0325 | |||||||||||||||||
74
75
Management's Statement of Responsibility for Financial Statements and
Report on Internal Control over Financial Reporting
Financial Statements
Management is responsible for preparation of the consolidated financial statements and other related financial information included in this annual report on Form 10-K. The consolidated financial statements have been prepared in conformity with accounting principles generally accepted in the United States of America, incorporating management's reasonable estimates and judgments, where applicable.
Management's Report on Internal Control over Financial Reporting
This report is provided by management pursuant to Section 404 of the Sarbanes-Oxley Act of 2002 and the SEC rules promulgated thereunder. Management, including the chief executive officer and chief financial officer, is responsible for establishing and maintaining adequate internal control over financial reporting and for assessing effectiveness of internal control over financial reporting.
The Company's internal control over financial reporting is a process designed to provide reasonable assurance regarding the reliability of financial reporting and the preparation of financial statements for external purposes in accordance with accounting principles generally accepted in the United States of America. The Company's internal control over financial reporting includes those policies and procedures that (i) pertain to the maintenance of records that, in reasonable detail, accurately and fairly reflect the transactions and dispositions of the assets of the Company; (ii) provide reasonable assurance that transactions are recorded as necessary to permit preparation of financial statements in accordance with accounting principles generally accepted in the United States of America, and that receipts and expenditures of the Company are being made only in accordance with authorizations of management and Directors of the Company; and (iii) provide reasonable assurance regarding prevention or timely detection of unauthorized acquisitions, use, or disposition of the Company's assets that could have a material effect on the financial statements.
Because of its inherent limitations, internal control over financial reporting may not prevent or detect misstatements. Also, projections of any evaluation of effectiveness to future periods are subject to the risk that controls may become inadequate because of changes in conditions, or that the degree of compliance with the policies or procedures may deteriorate.
Management has assessed the Company's internal control over financial reporting as of June 30, 2010, based on criteria established in Internal Control—Integrated Framework issued by the Committee of Sponsoring Organizations of the Treadway Commission (COSO). Based on the assessment of the Company's internal control over financial reporting, management has concluded that, as of June 30, 2010, the Company's internal control over financial reporting was effective.
The Company's independent registered public accounting firm, PricewaterhouseCoopers LLP, has audited the effectiveness of the Company's internal control over financial reporting as of June 30, 2010, as stated in their report which follows in Item 8 of this Form 10-K.
76
Report of Independent Registered Public Accounting Firm
To the Board of Directors and Shareholders of Regis Corporation:
In our opinion, the accompanying consolidated balance sheets and the related consolidated statements of operations, of changes in shareholders' equity and comprehensive income and of cash flows present fairly, in all material respects, the financial position of Regis Corporation and its subsidiaries at June 30, 2010 and June 30, 2009, and the results of their operations and their cash flows for each of the three years in the period ended June 30, 2010 in conformity with accounting principles generally accepted in the United States of America. Also in our opinion, the Company maintained, in all material respects, effective internal control over financial reporting as of June 30, 2010, based on criteria established in Internal Control—Integrated Framework issued by the Committee of Sponsoring Organizations of the Treadway Commission (COSO). The Company's management is responsible for these financial statements, for maintaining effective internal control over financial reporting and for its assessment of the effectiveness of internal control over financial reporting, included in Management's Statement of Responsibility for Financial Statements and Report on Internal Control over Financial Reporting. Our responsibility is to express opinions on these financial statements and on the Company's internal control over financial reporting based on our integrated audits. We conducted our audits in accordance with the standards of the Public Company Accounting Oversight Board (United States). Those standards require that we plan and perform the audits to obtain reasonable assurance about whether the financial statements are free of material misstatement and whether effective internal control over financial reporting was maintained in all material respects. Our audits of the financial statements included examining, on a test basis, evidence supporting the amounts and disclosures in the financial statements, assessing the accounting principles used and significant estimates made by management, and evaluating the overall financial statement presentation. Our audit of internal control over financial reporting included obtaining an understanding of internal control over financial reporting, assessing the risk that a material weakness exists, and testing and evaluating the design and operating effectiveness of internal control based on the assessed risk. Our audits also included performing such other procedures as we considered necessary in the circumstances. We believe that our audits provide a reasonable basis for our opinions.
A company's internal control over financial reporting is a process designed to provide reasonable assurance regarding the reliability of financial reporting and the preparation of financial statements for external purposes in accordance with generally accepted accounting principles. A company's internal control over financial reporting includes those policies and procedures that (i) pertain to the maintenance of records that, in reasonable detail, accurately and fairly reflect the transactions and dispositions of the assets of the company; (ii) provide reasonable assurance that transactions are recorded as necessary to permit preparation of financial statements in accordance with generally accepted accounting principles, and that receipts and expenditures of the company are being made only in accordance with authorizations of management and directors of the company; and (iii) provide reasonable assurance regarding prevention or timely detection of unauthorized acquisition, use, or disposition of the company's assets that could have a material effect on the financial statements.
Because of its inherent limitations, internal control over financial reporting may not prevent or detect misstatements. Also, projections of any evaluation of effectiveness to future periods are subject to the risk that controls may become inadequate because of changes in conditions, or that the degree of compliance with the policies or procedures may deteriorate.
/s/
PRICEWATERHOUSECOOPERS LLP
PricewaterhouseCoopers LLP
Minneapolis, Minnesota
August 27, 2010
77
REGIS CORPORATION
CONSOLIDATED BALANCE SHEET
(Dollars in thousands, except per share data)
|
|
June 30, | |||||||||
|---|---|---|---|---|---|---|---|---|---|---|
|
|
2010 | 2009 | ||||||||
|
ASSETS |
||||||||||
|
Current assets: |
||||||||||
|
Cash and cash equivalents |
$ | 151,871 | $ | 42,538 | ||||||
|
Receivables, net |
24,312 | 44,935 | ||||||||
|
Inventories |
153,380 | 158,570 | ||||||||
|
Deferred income taxes |
16,892 | 22,086 | ||||||||
|
Income tax receivable |
46,207 | 47,164 | ||||||||
|
Other current assets |
36,203 | 37,693 | ||||||||
|
Total current assets |
428,865 | 352,986 | ||||||||
|
Property and equipment, net |
359,250 | 391,538 | ||||||||
|
Goodwill |
736,989 | 764,422 | ||||||||
|
Other intangibles, net |
118,070 | 126,961 | ||||||||
|
Investment in and loans to affiliates |
195,786 | 211,400 | ||||||||
|
Other assets |
80,612 | 45,179 | ||||||||
|
Total assets |
$ | 1,919,572 | $ | 1,892,486 | ||||||
|
LIABILITIES AND SHAREHOLDERS' EQUITY |
||||||||||
|
Current liabilities: |
||||||||||
|
Long-term debt, current portion |
$ | 51,629 | $ | 55,454 | ||||||
|
Accounts payable |
57,683 | 62,394 | ||||||||
|
Accrued expenses |
160,797 | 156,638 | ||||||||
|
Total current liabilities |
270,109 | 274,486 | ||||||||
|
Long-term debt and capital lease obligations |
388,400 | 578,853 | ||||||||
|
Other noncurrent liabilities |
247,770 | 236,287 | ||||||||
|
Total liabilities |
906,279 | 1,089,626 | ||||||||
|
Commitments and contingencies (Note 10) |
||||||||||
|
Shareholders' equity: |
||||||||||
|
Common stock, $0.05 par value; issued and outstanding, 57,561,180 and 43,881,364 common shares at June 30, 2010 and 2009, respectively |
2,878 | 2,194 | ||||||||
|
Additional paid-in capital |
332,372 | 151,394 | ||||||||
|
Accumulated other comprehensive income |
47,032 | 51,855 | ||||||||
|
Retained earnings |
631,011 | 597,417 | ||||||||
|
Total shareholders' equity |
1,013,293 | 802,860 | ||||||||
|
Total liabilities and shareholders' equity |
$ | 1,919,572 | $ | 1,892,486 | ||||||
The accompanying notes are an integral part of the Consolidated Financial Statements.
78
REGIS CORPORATION
CONSOLIDATED STATEMENT OF OPERATIONS
(In thousands, except per share data)
|
|
Years Ended June 30, | |||||||||||||
|---|---|---|---|---|---|---|---|---|---|---|---|---|---|---|
|
|
2010 | 2009 | 2008 | |||||||||||
|
Revenues: |
||||||||||||||
|
Service |
$ | 1,784,137 | $ | 1,833,958 | $ | 1,862,490 | ||||||||
|
Product |
534,593 | 556,205 | 551,286 | |||||||||||
|
Royalties and fees |
39,704 | 39,624 | 67,615 | |||||||||||
|
|
2,358,434 | 2,429,787 | 2,481,391 | |||||||||||
|
Operating expenses: |
||||||||||||||
|
Cost of service |
1,015,720 | 1,044,719 | 1,062,559 | |||||||||||
|
Cost of product |
263,883 | 283,038 | 264,391 | |||||||||||
|
Site operating expenses |
199,338 | 190,456 | 184,769 | |||||||||||
|
General and administrative |
291,991 | 291,661 | 321,563 | |||||||||||
|
Rent |
344,098 | 347,792 | 361,476 | |||||||||||
|
Depreciation and amortization |
108,764 | 115,655 | 113,293 | |||||||||||
|
Goodwill impairment |
35,277 | 41,661 | — | |||||||||||
|
Lease termination costs |
2,145 | 5,732 | — | |||||||||||
|
Total operating expenses |
2,261,216 | 2,320,714 | 2,308,051 | |||||||||||
|
Operating income |
97,218 | 109,073 | 173,340 | |||||||||||
|
Other income (expense): |
||||||||||||||
|
Interest expense |
(54,414 | ) | (39,768 | ) | (44,279 | ) | ||||||||
|
Interest income and other, net |
10,410 | 9,461 | 8,173 | |||||||||||
|
Income from continuing operations before income taxes and equity in income (loss) of affiliated companies |
53,214 | 78,766 | 137,234 | |||||||||||
|
Income taxes |
(25,577 | ) | (41,950 | ) | (54,182 | ) | ||||||||
|
Equity in income (loss) income of affiliated companies, net of income taxes |
11,942 | (29,846 | ) | 849 | ||||||||||
|
Income from continuing operations |
39,579 | 6,970 | 83,901 | |||||||||||
|
Income (loss) from discontinued operations, net of taxes (Note 2) |
3,161 | (131,436 | ) | 1,303 | ||||||||||
|
Net income (loss) |
$ | 42,740 | $ | (124,466 | ) | $ | 85,204 | |||||||
|
Net income (loss) per share: |
||||||||||||||
|
Basic: |
||||||||||||||
|
Income from continuing operations |
0.71 | 0.16 | 1.94 | |||||||||||
|
Income (loss) from discontinued operations |
0.06 | (3.06 | ) | 0.03 | ||||||||||
|
Net income (loss) per share, basic(1) |
$ | 0.77 | $ | (2.90 | ) | $ | 1.97 | |||||||
|
Diluted: |
||||||||||||||
|
Income from continuing operations |
0.71 | 0.16 | 1.92 | |||||||||||
|
Income (loss) from discontinued operations |
0.05 | (3.05 | ) | 0.03 | ||||||||||
|
Net income (loss) income per share, diluted(1) |
$ | 0.75 | $ | (2.89 | ) | $ | 1.95 | |||||||
|
Weighted average common and common equivalent shares outstanding: |
||||||||||||||
|
Basic |
55,806 | 42,897 | 43,157 | |||||||||||
|
Diluted |
66,753 | 43,026 | 43,587 | |||||||||||
|
Cash dividends declared per common share |
$ | 0.16 | $ | 0.16 | $ | 0.16 | ||||||||
- (1)
- Total is a recalculation; line items calculated individually may not sum to total due to rounding.
The accompanying notes are an integral part of the Consolidated Financial Statements.
79
REGIS CORPORATION
CONSOLIDATED STATEMENT OF CHANGES
IN SHAREHOLDERS' EQUITY AND COMPREHENSIVE INCOME
(Dollars in thousands)
|
|
Common Stock |
|
|
|
|
|
||||||||||||||||
|---|---|---|---|---|---|---|---|---|---|---|---|---|---|---|---|---|---|---|---|---|---|---|
|
|
Additional Paid-In Capital | Accumulated Other Comprehensive Income | Retained Earnings |
|
Comprehensive Income | |||||||||||||||||
|
|
Shares | Amount | Total | |||||||||||||||||||
|
Balance, June 30, 2007 |
44,164,645 | $ | 2,209 | $ | 178,029 | $ | 78,278 | $ | 654,792 | $ | 913,308 | $ | 102,823 | |||||||||
|
Net income |
85,204 | 85,204 | 85,204 | |||||||||||||||||||
|
Foreign currency translation adjustments |
27,120 | 27,120 | 27,120 | |||||||||||||||||||
|
Changes in fair market value of financial instruments designated as cash flow hedges, net of taxes |
(2,557 | ) | (2,557 | ) | (2,557 | ) | ||||||||||||||||
|
Stock repurchase plan |
(1,701,089 | ) | (85 | ) | (49,872 | ) | (49,957 | ) | ||||||||||||||
|
Proceeds from exercise of stock options |
525,774 | 26 | 8,867 | 8,893 | ||||||||||||||||||
|
Stock-based compensation |
6,841 | 6,841 | ||||||||||||||||||||
|
Shares issued through franchise stock incentive program |
11,311 | — | 416 | 416 | ||||||||||||||||||
|
Adoption of FIN No.48 (Note 13) |
(237 | ) | (4,237 | ) | (4,474 | ) | ||||||||||||||||
|
Recognition of deferred compensation and other, net of taxes (Note 14) |
(868 | ) | (868 | ) | (868 | ) | ||||||||||||||||
|
Tax benefit realized upon exercise of stock options |
2,784 | 2,784 | ||||||||||||||||||||
|
Taxes related to restricted stock |
(54,914 | ) | (2 | ) | (663 | ) | (665 | ) | ||||||||||||||
|
Issuance of restricted stock |
125,200 | 5 | (5 | ) | — | |||||||||||||||||
|
Dividends |
(6,964 | ) | (6,964 | ) | ||||||||||||||||||
|
Payment for contingent consideration in salon acquisitions (Note 4) |
(2,895 | ) | (2,895 | ) | ||||||||||||||||||
|
Balance, June 30, 2008 |
43,070,927 | 2,153 | 143,265 | 101,973 | 728,795 | 976,186 | 108,899 | |||||||||||||||
|
Net loss |
(124,466 | ) | (124,466 | ) | (124,466 | ) | ||||||||||||||||
|
Foreign currency translation adjustments |
(47,666 | ) | (47,666 | ) | (47,666 | ) | ||||||||||||||||
|
Changes in fair market value of financial instruments designated as cash flow hedges, net of taxes |
(2,112 | ) | (2,112 | ) | (2,112 | ) | ||||||||||||||||
|
Proceeds from exercise of stock options |
234,523 | 12 | 3,882 | 3,894 | ||||||||||||||||||
|
Stock-based compensation |
7,525 | 7,525 | ||||||||||||||||||||
|
Shares issued through franchise stock incentive program |
13,808 | — | 378 | 378 | ||||||||||||||||||
|
Recognition of deferred compensation and other, net of taxes (Note 14) |
(340 | ) | (340 | ) | (340 | ) | ||||||||||||||||
|
Tax benefit realized upon exercise of stock options |
712 | 712 | ||||||||||||||||||||
|
Issuance of restricted stock |
617,550 | 31 | (31 | ) | — | |||||||||||||||||
|
Restricted stock forfeitures |
(28,119 | ) | (1 | ) | 1 | — | ||||||||||||||||
|
Taxes related to restricted stock |
(27,325 | ) | (1 | ) | (490 | ) | (491 | ) | ||||||||||||||
|
Dividends |
(6,912 | ) | (6,912 | ) | ||||||||||||||||||
|
Equity issuance costs |
(243 | ) | (243 | ) | ||||||||||||||||||
|
Adjustment to stock option tax benefit |
(3,605 | ) | (3,605 | ) | ||||||||||||||||||
|
Balance, June 30, 2009 |
43,881,364 | 2,194 | 151,394 | 51,855 | 597,417 | 802,860 | (174,584 | ) | ||||||||||||||
|
Net income |
42,740 | 42,740 | 42,740 | |||||||||||||||||||
|
Foreign currency translation adjustments |
(5,416 | ) | (5,416 | ) | (5,416 | ) | ||||||||||||||||
|
Changes in fair market value of financial instruments designated as cash flow hedges, net of taxes |
2,467 | 2,467 | 2,467 | |||||||||||||||||||
|
Issuance of common stock |
13,225,000 | 661 | 162,932 | 163,593 | ||||||||||||||||||
|
Equity component of convertible debt, net of taxes |
15,245 | 15,245 | ||||||||||||||||||||
|
Proceeds from exercise of stock options |
202,700 | 10 | 3,055 | 3,065 | ||||||||||||||||||
|
Stock-based compensation |
9,337 | 9,337 | ||||||||||||||||||||
|
Shares issued through franchise stock incentive program |
16,053 | 1 | 290 | 291 | ||||||||||||||||||
|
Recognition of deferred compensation and other, net of taxes (Note 14) |
(1,874 | ) | (1,874 | ) | (1,874 | ) | ||||||||||||||||
|
Tax benefit realized upon exercise of stock options |
262 | 262 | ||||||||||||||||||||
|
Issuance of restricted stock |
304,200 | 15 | (15 | ) | — | |||||||||||||||||
|
Restricted stock forfeitures |
(1,976 | ) | — | — | — | |||||||||||||||||
|
Taxes related to restricted stock |
(66,161 | ) | (3 | ) | (1,710 | ) | (1,713 | ) | ||||||||||||||
|
Dividends |
(9,146 | ) | (9,146 | ) | ||||||||||||||||||
|
Equity issuance costs |
(8,154 | ) | (8,154 | ) | ||||||||||||||||||
|
Adjustment to stock option tax benefit |
(264 | ) | (264 | ) | ||||||||||||||||||
|
Balance, June 30, 2010 |
57,561,180 | $ | 2,878 | $ | 332,372 | $ | 47,032 | $ | 631,011 | $ | 1,013,293 | $ | 37,917 | |||||||||
The accompanying notes are an integral part of the Consolidated Financial Statements.
80
REGIS CORPORATION
CONSOLIDATED STATEMENT OF CASH FLOWS
(In thousands)
|
|
Years Ended June 30, | |||||||||||||
|---|---|---|---|---|---|---|---|---|---|---|---|---|---|---|
|
|
2010 | 2009 | 2008 | |||||||||||
|
Cash flows from operating activities: |
||||||||||||||
|
Net income (loss) |
$ | 42,740 | $ | (124,466 | ) | $ | 85,204 | |||||||
|
Adjustments to reconcile net income (loss) to net cash provided by operating activities: |
||||||||||||||
|
Depreciation |
92,466 | 105,145 | 108,673 | |||||||||||
|
Amortization |
9,870 | 9,871 | 11,304 | |||||||||||
|
Equity in (income) loss of affiliated companies |
(11,942 | ) | 28,940 | (849 | ) | |||||||||
|
Deferred income taxes |
5,115 | (3,843 | ) | (3,789 | ) | |||||||||
|
Impairment on discontinued operations |
(154 | ) | 183,289 | — | ||||||||||
|
Goodwill impairment |
35,277 | 41,661 | — | |||||||||||
|
Salon asset impairments |
6,428 | 10,201 | 10,471 | |||||||||||
|
Excess tax benefits from stock-based compensation plans |
(243 | ) | (163 | ) | (1,420 | ) | ||||||||
|
Stock-based compensation |
9,337 | 7,525 | 6,841 | |||||||||||
|
Amortization of debt discount and financing costs |
6,406 | — | — | |||||||||||
|
Other noncash items affecting earnings |
(3,153 | ) | (3,405 | ) | (2,015 | ) | ||||||||
|
Changes in operating assets and liabilities*: |
||||||||||||||
|
Receivables |
1,192 | (12,104 | ) | (709 | ) | |||||||||
|
Inventories |
4,823 | 7,128 | (5,232 | ) | ||||||||||
|
Income tax receivable |
957 | (34,652 | ) | 20,605 | ||||||||||
|
Other current assets |
2,657 | (52 | ) | (18,051 | ) | |||||||||
|
Other assets |
(12,547 | ) | (421 | ) | 16,184 | |||||||||
|
Accounts payable |
(4,966 | ) | (3,613 | ) | (9,480 | ) | ||||||||
|
Accrued expenses |
6,006 | (23,364 | ) | 18,729 | ||||||||||
|
Other noncurrent liabilities |
1,954 | 387 | (14,083 | ) | ||||||||||
|
Net cash provided by operating activities |
192,223 | 188,064 | 222,383 | |||||||||||
|
Cash flows from investing activities: |
||||||||||||||
|
Capital expenditures |
(57,821 | ) | (73,574 | ) | (85,799 | ) | ||||||||
|
Proceeds from sale of assets |
70 | 77 | 47 | |||||||||||
|
Asset acquisitions, net of cash acquired and certain obligations assumed |
(3,664 | ) | (40,051 | ) | (132,971 | ) | ||||||||
|
Proceeds from loans and investments |
16,099 | 19,008 | 10,000 | |||||||||||
|
Disbursements for loans and investments |
— | (20,971 | ) | (46,400 | ) | |||||||||
|
Transfer of cash related to contribution of schools and European franchise salon operations |
— | — | (10,906 | ) | ||||||||||
|
Freestanding derivative settlement |
736 | — | — | |||||||||||
|
Net cash used in investing activities |
(44,580 | ) | (115,511 | ) | (266,029 | ) | ||||||||
|
Cash flows from financing activities: |
||||||||||||||
|
Borrowings on revolving credit facilities |
337,000 | 6,391,100 | 9,079,917 | |||||||||||
|
Payments on revolving credit facilities |
(342,000 | ) | (6,525,200 | ) | (9,088,530 | ) | ||||||||
|
Proceeds from issuance of long-term debt, net of $5.2 million underwriting discount |
167,325 | 85,000 | 125,000 | |||||||||||
|
Repayments of long-term debt and capital lease obligations |
(349,175 | ) | (92,504 | ) | (78,161 | ) | ||||||||
|
Excess tax benefits from stock-based compensation plans |
243 | 163 | 1,420 | |||||||||||
|
Repurchase of common stock |
— | — | (49,957 | ) | ||||||||||
|
Proceeds from issuance of common stock, net of $7.2 million underwriting discount |
159,498 | 3,894 | 8,893 | |||||||||||
|
Dividends paid |
(9,146 | ) | (6,912 | ) | (6,964 | ) | ||||||||
|
Other |
(2,878 | ) | (3,848 | ) | (2,622 | ) | ||||||||
|
Net cash used in financing activities |
(39,133 | ) | (148,307 | ) | (11,004 | ) | ||||||||
|
Effect of exchange rate changes on cash and cash equivalents |
823 | (9,335 | ) | (2,508 | ) | |||||||||
|
Increase (decrease) in cash and cash equivalents |
109,333 | (85,089 | ) | (57,158 | ) | |||||||||
|
Cash and cash equivalents: |
||||||||||||||
|
Beginning of year |
42,538 | 127,627 | 184,785 | |||||||||||
|
End of year |
$ | 151,871 | $ | 42,538 | $ | 127,627 | ||||||||
- *
-
Changes
in operating assets and liabilities exclude assets acquired and liabilities assumed through acquisitions
The accompanying notes are an integral part of the Consolidated Financial Statements.
81
NOTES TO CONSOLIDATED FINANCIAL STATEMENTS
1. BUSINESS DESCRIPTION AND SUMMARY OF SIGNIFICANT ACCOUNTING POLICIES
Business Description:
Regis Corporation (the Company) owns, operates and franchises hairstyling and hair care salons throughout the United States, the United Kingdom (U.K.), Canada, Puerto Rico and several other countries. In addition, the Company owns and operates hair restoration centers in the United States and Canada. Substantially all of the hairstyling and hair care salons owned and operated by the Company in the United States, Canada and Puerto Rico are located in leased space in enclosed mall shopping centers, strip shopping centers or Wal-Mart Supercenters. Franchise salons throughout the United States are primarily located in strip shopping centers. The company-owned salons in the U.K. are owned and operated in malls, leading department stores, mass merchants and high-street locations. The hair restoration centers, including both company-owned and franchise locations, are typically located in leased space within office buildings. The Company maintains ownership interest in salons, beauty schools and hair restoration centers through equity-method investments.
Consolidation:
The Consolidated Financial Statements include the accounts of the Company and all of its wholly-owned subsidiaries. In consolidation, all material intercompany accounts and transactions are eliminated.
Use of Estimates:
The preparation of Consolidated Financial Statements in conformity with accounting principles generally accepted in the United States of America requires management to make certain estimates and assumptions that affect the reported amounts of assets and liabilities and disclosure of contingent assets and liabilities at the date of the financial statements and the reported amounts of revenues and expenses during the reporting period. Actual results could differ from those estimates.
Foreign Currency Translation:
Financial position, results of operations and cash flows of the Company's international subsidiaries are measured using local currency as the functional currency. Assets and liabilities of these subsidiaries are translated at the exchange rates in effect at each fiscal year end. Translation adjustments arising from the use of differing exchange rates from period to period are included in accumulated other comprehensive income within shareholders' equity. Statement of Operations accounts are translated at the average rates of exchange prevailing during the year. The different exchange rates from period to period impact the amount of reported income from the Company's international operations.
Cash and Cash Equivalents:
Cash equivalents consist of investments in short-term, highly liquid securities having original maturities of three months or less, which are made as a part of the Company's cash management activity. The carrying values of these assets approximate their fair market values. The Company primarily utilizes a cash management system with a series of separate accounts consisting of lockbox accounts for receiving cash, concentration accounts that funds are moved to, and several "zero balance" disbursement accounts for funding of payroll and accounts payable. As a result of the Company's cash management system, checks issued, but not presented to the banks for payment, may create negative book cash balances. There were no checks outstanding in excess of related book cash balances at June 30, 2010 and 2009.
82
NOTES TO CONSOLIDATED FINANCIAL STATEMENTS (Continued)
1. BUSINESS DESCRIPTION AND SUMMARY OF SIGNIFICANT ACCOUNTING POLICIES (Continued)
Receivables and Allowance for Doubtful Accounts:
The receivable balance on the Company's Consolidated Balance Sheet primarily includes accounts and notes receivable from franchisees. The balance is presented net of an allowance for expected losses (i.e., doubtful accounts), primarily related to receivables from the Company's franchisees. The Company monitors the financial condition of its franchisees and records provisions for estimated losses on receivables when it believes that its franchisees are unable to make their required payments based on factors such as delinquencies and aging trends. The allowance for doubtful accounts is the Company's best estimate of the amount of probable credit losses related to existing accounts and notes receivable.
The following table summarizes the activity in the allowance for doubtful accounts:
|
|
For the Years Ended June 30, | |||||||||
|---|---|---|---|---|---|---|---|---|---|---|
|
|
2010 | 2009 | 2008 | |||||||
|
|
(Dollars in thousands)
|
|||||||||
|
Beginning balance |
$ | 2,382 | $ | 1,515 | $ | 6,399 | ||||
|
Bad debt expense |
1,040 | 1,089 | 3,900 | |||||||
|
Write-offs |
(252 | ) | (225 | ) | (8,784 | ) | ||||
|
Other (primarily the impact of foreign currency fluctuations) |
— | 3 | — | |||||||
|
Ending balance |
$ | 3,170 | $ | 2,382 | $ | 1,515 | ||||
Inventories:
Inventories consist principally of hair care products for retail product sales. A portion of inventories are also used for salon services consisting of hair color, hair care products including shampoo and conditioner and hair care treatments including permanents, neutralizers and relaxers. Inventories are stated at the lower of cost or market, with cost determined on a weighted average cost basis.
Physical inventory counts are performed semi-annually. Product and service inventories are adjusted based on the results of the physical inventory counts. Between the physical inventory counts, cost of retail product sold to salon customers is determined based on the weighted average cost of product sold, adjusted for an estimated shrinkage factor, and the cost of product used in salon services is determined by applying estimated gross profit margins to service revenues. The estimated gross profit margins related to service inventories are updated semi-annually based on the results of the physical inventory counts and other factors that could impact the Company's margin rate estimates such as mix of service sales, discounting and special promotions. Actual results for the estimated gross margin percentage as compared to the semi-annual estimates have not historically resulted in material adjustments to our Statement of Operations.
Property and Equipment:
Property and equipment are carried at cost, less accumulated depreciation and amortization. Depreciation and amortization of property and equipment are computed on the straight-line method over estimated useful asset lives (30 to 39 years for buildings, 10 years for improvements and three to 10 years for equipment, furniture and software). Depreciation expense was $92.5, $105.1, and
83
NOTES TO CONSOLIDATED FINANCIAL STATEMENTS (Continued)
1. BUSINESS DESCRIPTION AND SUMMARY OF SIGNIFICANT ACCOUNTING POLICIES (Continued)
$108.7 million in fiscal years 2010, 2009, and 2008, respectively. Leasehold improvements are amortized over the shorter of their estimated useful lives or the related lease term, generally 10 years. For leases with renewal periods at the Company's option, management may determine at the inception of the lease that renewal is reasonably assured if failure to exercise a renewal option imposes an economic penalty to the Company. In such cases, the Company will include the renewal option period along with the original lease term in the determination of appropriate estimated useful lives.
The Company capitalizes both internal and external costs of developing or obtaining computer software for internal use. Costs incurred to develop internal-use software during the application development stage are capitalized, while data conversion, training and maintenance costs associated with internal-use software are expensed as incurred. At June 30, 2010 and 2009, the net book value of capitalized software costs was $35.2 and $40.4 million, respectively. Amortization expense related to capitalized software was $8.5, $9.1, and $8.3 million in fiscal years 2010, 2009, and 2008, respectively, which has been determined based on an estimated useful life of five or seven years.
Expenditures for maintenance and repairs and minor renewals and betterments which do not improve or extend the life of the respective assets are expensed. All other expenditures for renewals and betterments are capitalized. The assets and related depreciation and amortization accounts are adjusted for property retirements and disposals with the resulting gain or loss included in operating income. Fully depreciated or amortized assets remain in the accounts until retired from service.
Investment In and Loans to Affiliates:
The Company has equity investments in securities of certain privately held entities. The Company accounts for these investments under the equity method of accounting. The Company also has loans receivable from certain of these entities. Investments accounted for under the equity method are recorded at the amount of the Company's investment and adjusted each period for the Company's share of the investee's income or loss. Investments are reviewed for changes in circumstance or the occurrence of events that suggest the Company's investment may not be recoverable. During fiscal year 2009, we recorded impairments of $25.7 million and $7.8 million ($4.8 million net of tax) related to our investment in Provalliance and investment in and loans to Intelligent Nutrients, LLC, respectively.
Self-insurance Accruals:
The Company uses a combination of third party insurance and self-insurance for a number of risks including workers' compensation, health insurance, employment practice liability and general liability claims. The liability represents an estimate of the undiscounted ultimate cost of uninsured claims incurred as of the balance sheet date.
The workers' compensation, general liability and employment practice liability analysis includes applying loss development factors to the Company's historical claims data (total paid and incurred amounts per claim) for all policy years where the Company has not reached its aggregate limits to project the future development of incurred claims. The workers' compensation analysis is performed for four models; California, Ohio, Texas and all other states. A variety of accepted actuarial methodologies are followed to determine these liabilities, including several methods to predict the loss development factors for each policy period. These liabilities are determined by modeling the frequency (number of claims) and severity (cost of claims), fitting statistical distributions to the experience, and then running simulations. A similar analysis is performed for both general liability and employment practices liability,
84
NOTES TO CONSOLIDATED FINANCIAL STATEMENTS (Continued)
1. BUSINESS DESCRIPTION AND SUMMARY OF SIGNIFICANT ACCOUNTING POLICIES (Continued)
however, it is a single model for all liability claims rather than the four separate models used for workers' compensation.
The health insurance analysis utilizes trailing twelve months of paid and 24 months of incurred medical and prescription claims to project the amount of incurred but not yet reported claims liability amount. The lag factors are developed based on the Company's specific claim data utilizing a completion factor methodology. The developed factor, expressed as a percentage of paid claims, is applied to the trailing twelve months of paid claims to calculate the estimated liability amount. The calculated liability amount is reviewed for reasonableness based on reserve adequacy ranges for historical periods by testing prior reserve levels against actual expenses to date.
Although the Company does not expect the amounts ultimately paid to differ significantly from the estimates, self-insurance accruals could be affected if future claims experience differs significantly from the historical trends and actuarial assumptions. For fiscal years 2010, 2009, and 2008, the Company recorded decreases in expense from changes in estimates related to prior year open policy periods related to continuing operations of $1.7, $9.9, and $6.9 million, respectively. A 10.0 percent change in the self-insurance reserve would affect income from continuing operations before income taxes and equity in income of affiliated companies by $4.5, $4.0, and $4.7 million for the three years ended June 30, 2010, 2009 and 2008, respectively. The Company updates loss projections each year and adjusts its recorded liability to reflect the current projections. The updated loss projections consider new claims and developments associated with existing claims for each open policy period. As certain claims can take years to settle, the Company has multiple policy periods open at any point in time.
As the workers' compensation accrual is the majority of the self-insurance accrual, below is a rollforward of the activity within the Company's workers' compensation self-insurance accrual:
|
|
For the Years Ended June 30, | |||||||||
|---|---|---|---|---|---|---|---|---|---|---|
|
|
2010 | 2009 | 2008 | |||||||
|
|
(Dollars in thousands)
|
|||||||||
|
Beginning balance |
$ | 31,505 | $ | 35,123 | $ | 39,727 | ||||
|
Provision for incurred losses |
14,739 | 14,676 | 16,652 | |||||||
|
Prior year actuarial adjustments |
35 | (7,715 | ) | (8,923 | ) | |||||
|
Claim payments |
(14,867 | ) | (12,145 | ) | (12,059 | ) | ||||
|
Other, net |
(1,330 | ) | 1,566 | (274 | ) | |||||
|
Ending balance |
$ | 30,082 | $ | 31,505 | $ | 35,123 | ||||
As of June 30, 2010, the Company has $18.4 and $26.5 million recorded in current liabilities and non-current liabilities, respectively, related to the Company's self-insurance accruals which includes the workers' compensation self-insurance accrual.
Goodwill:
Goodwill is tested for impairment annually or at the time of a triggering event. In evaluating whether goodwill is impaired, the Company compares the carrying value of each reporting unit, including goodwill, to the estimated fair value of the reporting unit. The carrying value of each reporting unit is based on the assets and liabilities associated with the operations of the reporting unit,
85
NOTES TO CONSOLIDATED FINANCIAL STATEMENTS (Continued)
1. BUSINESS DESCRIPTION AND SUMMARY OF SIGNIFICANT ACCOUNTING POLICIES (Continued)
including allocation of shared or corporate balances among reporting units. Allocations are generally based on the number of salons in each reporting unit as a percent of total company-owned salons.
The Company calculates the estimated fair value of the reporting units based on discounted future cash flows that utilize estimates in annual revenue, gross margins, fixed expense rates, allocated corporate overhead, and long-term growth for determining terminal value. The Company's estimated future cash flows also take into consideration acquisition integration and maturation. Where available and as appropriate, comparative market multiples are used to corroborate the results of the discounted cash flow. The Company considers its various concepts to be reporting units when testing for goodwill impairment because that is where the Company believes the goodwill resides. The Company periodically engage third-party valuation consultants to assist in evaluation of the Company's estimated fair value calculations. The Company's policy is to perform its annual goodwill impairment test during its third quarter of each fiscal year ending June 30.
In the situations where a reporting unit's carrying value exceeds its estimated fair value, the amount of the impairment loss must be measured. The measurement of impairment is calculated by determining the implied fair value of a reporting unit's goodwill. In calculating the implied fair value of goodwill, the fair value of the reporting unit is allocated to all other assets and liabilities of that unit based on the relative fair values. The excess of the fair value of the reporting unit over the amount assigned to its assets and liabilities is the implied fair value of goodwill. The goodwill impairment is measured as the excess of the carrying value of goodwill over its implied fair value.
The Regis salon concept reported same-store sales results of negative 5.8 percent for the three months ended March 31, 2010, which was unfavorable compared to the Company's budgeted same-store sales. Such results indicated customer visitation patterns were not rebounding as quickly as the Company had originally projected. Accordingly, the Company reduced the budgeted financial projections for the remainder of fiscal 2010 and all of fiscal year 2011. The lowered projections assume the higher price point Regis salon concept remains strong and viable but will require a longer, slower recovery. As a result of the lowered projections for the remainder of fiscal year 2010 and all of fiscal year 2011, the estimated fair value of the Regis salon concept decreased to a level below the Regis salon concept's carrying value. As a result of the Company's annual impairment analysis of goodwill during the third quarter of fiscal year 2010, a $35.3 million impairment charge was recorded within continuing operations for the excess of the carrying value of goodwill over the implied fair value of goodwill for the Regis salon concept.
As of March 31, 2010, the estimated fair value of the Promenade salon concept exceeded its respective carrying value by approximately 10.0 percent. The respective fair values of the Company's remaining reporting units exceeded fair value by greater than 20.0 percent. While the Company has determined the estimated fair values of Regis and Promenade to be appropriate based on the historical level of revenue growth, operating income and cash flows, it is reasonably likely that Regis and Promenade may become impaired in future periods. The term "reasonably likely" refers to an occurrence that is more than remote but less than probable in the judgment of the Company. Because some of the inherent assumptions and estimates used in determining the fair value of this reportable segment are outside the control of management, changes in these underlying assumptions can adversely impact fair value. Potential impairment of a portion or all of the carrying value of the Regis salon concept and Promenade salon concept goodwill is dependent on many factors and cannot be predicted with certainty.
86
NOTES TO CONSOLIDATED FINANCIAL STATEMENTS (Continued)
1. BUSINESS DESCRIPTION AND SUMMARY OF SIGNIFICANT ACCOUNTING POLICIES (Continued)
As of June 30, 2010, the Company's estimated fair value, as determined by the sum of our reporting units' fair value reconciled to within a reasonable range of our market capitalization which included an assumed control premium. The Company concluded there were no triggering events that would require the Company to perform an interim goodwill impairment test between the annual impairment testing and June 30, 2010.
A summary of the Company's goodwill balance as of June 30, 2010 by reporting unit is as follows:
|
Reporting Unit
|
As of June 30, 2010 | |||
|---|---|---|---|---|
|
|
(Dollars in thousands)
|
|||
|
Regis |
$ | 102,180 | ||
|
MasterCuts |
4,652 | |||
|
SmartStyle |
48,280 | |||
|
Supercuts |
121,693 | |||
|
Promenade |
309,804 | |||
|
Total North America Salons |
586,609 | |||
|
Hair Restoration Centers |
150,380 | |||
|
Consolidated Goodwill |
$ | 736,989 | ||
Long-Lived Asset Impairment Assessments, Excluding Goodwill:
The Company reviews long-lived assets for impairment at the salon level annually or if events or circumstances indicate that the carrying value of such assets may not be recoverable. The Company's test for impairment of property and equipment is performed at a salon level as this is the lowest level for which identifiable cash flows are largely independent of the cash flows of other groups of assets and liabilities. Impairment is evaluated based on the sum of undiscounted estimated future cash flows expected to result from use of the assets that does not recover the carrying value of the related salon assets. When the sum of a salon's undiscounted estimated future cash flow is zero or negative, impairment is measured as the full carrying value of the related salon's equipment and leasehold improvements. When the sum of a salon's undiscounted cash flows is greater than zero but less than the carrying value of the related salon's equipment and leasehold improvements, a discounted cash flow analysis is performed to estimate the fair value of the salon assets and impairment is measured as the difference between the carrying value of the salon assets and the estimated fair value. The fair value estimate is based on the best information available, including market data.
During fiscal year 2010, the Company tested its long-lived assets for impairment and recognized impairment charges related primarily to the carrying value of certain salons' property and equipment of $6.4 million. Of the $6.4 million in total impairment charges recognized in fiscal year 2010, $6.2 and $0.2 million related to North America and the United Kingdom, respectively. During fiscal year 2009, the Company tested its long-lived assets for impairment and recognized impairment charges related primarily to the carrying value of certain salons' property and equipment of $10.2 million. Of the $10.2 million in total impairment charges recognized in fiscal year 2009, $4.3 and $5.9 million related to North America and the United Kingdom, respectively. The United Kingdom impairment charges in fiscal year 2009 included charges related to the Company's June 2009 plan to close up to 80 underperforming company-owned salons in fiscal year 2010. During fiscal year 2008, the Company tested its long-lived assets for impairment and recognized impairment charges related primarily to the
87
NOTES TO CONSOLIDATED FINANCIAL STATEMENTS (Continued)
1. BUSINESS DESCRIPTION AND SUMMARY OF SIGNIFICANT ACCOUNTING POLICIES (Continued)
carrying value of certain salons' property and equipment of $10.5 million, related to the Company's July 2008 plan to close up to 160 underperforming company-owned salons in fiscal year 2009. Of the $10.5 million in total impairment charges recognized in fiscal year 2008, $5.0, $1.1, and $4.4 million related to North America, United Kingdom, and discontinued operations salons, respectively. The Company also evaluated the appropriateness of the remaining useful lives of its non-impaired property and equipment and whether a change to the depreciation charge was warranted. Impairment charges for continuing operations are included in depreciation related to company-owned salons in the Consolidated Statement of Operations.
Deferred Rent and Rent Expense:
The Company leases most salon and hair restoration center locations under operating leases. Rent expense is recognized on a straight-line basis over the lease term. Tenant improvement allowances funded by landlord incentives, rent holidays, and rent escalation clauses which provide for scheduled rent increases during the lease term or for rental payments commencing at a date other than the date of initial occupancy are recorded in the Consolidated Statements of Operations on a straight-line basis over the lease term (including one renewal option period if renewal is reasonably assured based on the imposition of an economic penalty for failure to exercise the renewal option). The difference between the rent due under the stated periods of the lease compared to that of the straight-line basis is recorded as deferred rent within other noncurrent liabilities in the Consolidated Balance Sheet.
For purposes of recognizing incentives and minimum rental expenses on a straight-line basis over the terms of the leases, the Company uses the date that it obtains the legal right to use and control the leased space to begin amortization, which is generally when the Company enters the space and begins to make improvements in preparation of intended use of the leased space.
Certain leases provide for contingent rents, which are determined as a percentage of revenues in excess of specified levels. The Company records a contingent rent liability in accrued expenses on the Consolidated Balance Sheet, along with the corresponding rent expense in the Consolidated Statement of Operations, when specified levels have been achieved or when management determines that achieving the specified levels during the fiscal year is probable.
Revenue Recognition and Deferred Revenue:
Company-owned salon revenues and related cost of sales are recognized at the time of sale, as this is when the services have been provided or, in the case of product revenues, delivery has occurred, and the salon receives the customer's payment. Revenues from purchases made with gift cards are also recorded when the customer takes possession of the merchandise or services are provided. Gift cards issued by the Company are recorded as a liability (deferred revenue) until they are redeemed. An accrual for estimated returns and credits has been recorded based on historical customer return data that management believes to be reasonable, and is less than one percent of sales.
Product sales by the Company to its franchisees are included within product revenues on the Consolidated Statement of Operations and recorded at the time product is shipped to franchise locations. The related cost of product sold to franchisees is included within cost of product in the Consolidated Statement of Operations.
88
NOTES TO CONSOLIDATED FINANCIAL STATEMENTS (Continued)
1. BUSINESS DESCRIPTION AND SUMMARY OF SIGNIFICANT ACCOUNTING POLICIES (Continued)
Company-owned hair restoration center revenues stem primarily from servicing hair systems and surgical procedures, as well as through product and hair system sales. The Company records deferred revenue for contracts related to the servicing of hair systems and recognizes the revenue ratably over the term of the service contract. Revenues are recognized related to surgical procedures when the procedure is performed. Product revenues, including sales of hair systems, are recognized at the time of application, as this is when delivery occurs and payment is probable.
Franchise revenues primarily include royalties, initial franchise fees and net rental income (see Note 10). Royalties are recognized as revenue in the month in which franchisee services are rendered. The Company recognizes revenue from initial franchise fees at the time franchise locations are opened, as this is generally when the Company has performed all initial services required under the franchise agreement.
Consideration Received from Vendors:
The Company receives consideration for a variety of vendor-sponsored programs. These programs primarily include volume rebates and promotion and advertising reimbursements. Promotion and advertising reimbursements are discussed under Advertising within this note.
With respect to volume rebates, the Company estimates the amount of rebate it will receive and accrues it as a reduction of the cost of inventory over the period in which the rebate is earned based upon historical purchasing patterns and the terms of the volume rebate program. A periodic analysis is performed, at least quarterly, in order to ensure that the estimated rebate accrued is reasonable, and any necessary adjustments are recorded.
Shipping and Handling Costs:
Shipping and handling costs are incurred to store, move and ship product from the Company's distribution centers to company-owned and franchise locations, and include an allocation of internal overhead. Such shipping and handling costs related to product shipped to company-owned locations are included in site operating expenses in the Consolidated Statement of Operations. Shipping and handling costs related to shipping product to franchise locations totaled $2.9, $2.7, and $3.4 million during fiscal years 2010, 2009, and 2008, respectively, and are included within general and administrative expenses. Any amounts billed to the franchisee for shipping and handling are included in product revenues within the Consolidated Statement of Operations.
Advertising:
Advertising costs, including salon collateral material, are expensed as incurred. The following table breaks out advertising costs expensed and included in continuing operations, and advertising costs expensed and included in discontinued operations in fiscal years 2010, 2009 and 2008:
|
|
For the Years Ended June 30, | |||||||||
|---|---|---|---|---|---|---|---|---|---|---|
|
Breakout of Advertising Costs
|
2010 | 2009 | 2008 | |||||||
|
Advertising costs included in continuing operations |
$ | 54,850 | $ | 56,926 | $ | 65,787 | ||||
|
Advertising costs included in discontinued operations |
— | 4,451 | 5,609 | |||||||
|
Total advertising costs |
$ | 54,850 | $ | 61,377 | $ | 71,396 | ||||
89
NOTES TO CONSOLIDATED FINANCIAL STATEMENTS (Continued)
1. BUSINESS DESCRIPTION AND SUMMARY OF SIGNIFICANT ACCOUNTING POLICIES (Continued)
The Company participates in cooperative advertising programs under which the vendor reimburses the Company for costs related to advertising for its products. The Company records such reimbursements as a reduction of advertising expense when the expense is incurred. During fiscal years 2010, 2009, and 2008, no amounts were received in excess of the Company's related expense.
Advertising Funds:
The Company has various franchising programs supporting its franchise salon concepts consisting of Supercuts, Cost Cutters, First Choice Haircutters, Magicuts, Pro Cuts , Beauty Supply Outlet and Hair Club. Most of the concepts maintain advertising funds that provide comprehensive advertising and sales promotion support.
The Supercuts advertising fund is the Company's largest advertising fund. The Supercuts advertising fund is administered by a council consisting primarily of franchisee representatives. The council has overall control of all of the fund's expenditures and operates in accordance with terms of the franchise operating and other agreements.
Each Supercuts salon contributes 5.0 percent of service revenues to the fund (contributions for other concepts range between 1.5 and 5.0 percent). The majority of the advertising funds are spent to support media placement and local marketing activities. The remainder is allocated for the creation of national advertising campaigns and system wide activities. None of the Supercuts advertising funds collected may be used by the Company as reimbursement for the cost of administering the advertising fund. Advertising funds can only be used as directed by the fund's council and are considered to be restricted.
The Company records all advertising funds as assets and liabilities within the Company's Consolidated Balance Sheet. As of June 30, 2010 and 2009, approximately $18.0 and $16.8 million, respectively, of the advertising funds' assets were recorded within total assets in the Company's Consolidated Balance Sheet. As of June 30, 2010 and 2009, approximately $18.0 and $16.8 million, respectively, of the advertising funds' liabilities were recorded within total liabilities in the Company's Consolidated Balance Sheet.
The Company records advertising expense in the period the company-owned salon makes contributions to the respective advertising fund. During fiscal years 2010, 2009, and 2008 total contributions to the franchise brand advertising funds totaled $39.8, $39.4, and $36.2 million, respectively.
The Company acts as an agent for the franchisees with regard to these contributions to the advertising funds. Thus, in accordance with guidance for accounting for franchise fee revenue, the Company does not reflect contributions to these advertising funds by its franchisees in its Consolidated Statement of Operations or Consolidated Statement of Cash Flows but reflects the related assets and liabilities in its Consolidated Balance Sheet.
Preopening Expenses:
Non-capital expenditures such as payroll, training costs and promotion incurred prior to the opening of a new location are expensed as incurred.
90
NOTES TO CONSOLIDATED FINANCIAL STATEMENTS (Continued)
1. BUSINESS DESCRIPTION AND SUMMARY OF SIGNIFICANT ACCOUNTING POLICIES (Continued)
Sales Taxes:
Sales taxes are recorded on a net basis (rather than as both revenue and an expense) within the Company's Consolidated Statement of Operations.
Income Taxes:
Deferred income tax assets and liabilities are recognized for the expected future tax consequences of events that have been included in the Consolidated Financial Statements or income tax returns. Deferred income tax assets and liabilities are determined based on the differences between the financial statement and tax basis of assets and liabilities using currently enacted tax rates in effect for the years in which the differences are expected to reverse. Realization of deferred tax assets is ultimately dependent upon future taxable income. Inherent in the measurement of deferred balances are certain judgments and interpretations of tax laws and published guidance with respect to the Company's operations. Income tax expense is primarily the current tax payable for the period and the change during the period in certain deferred tax assets and liabilities.
Net Income Per Share:
The Company's basic earnings per share is calculated as net income divided by weighted average common shares outstanding, excluding unvested outstanding restricted stock awards and restricted stock units. The Company's dilutive earnings per share is calculated as net income divided by weighted average common shares and common share equivalents outstanding, which includes shares issuable under the Company's stock option plan and long-term incentive plan, shares issuable under contingent stock agreements, and dilutive securities. Stock-based awards with exercise prices greater than the average market value of the Company's common stock are excluded from the computation of diluted earnings per share. The Company's diluted earnings per share will also reflect the assumed conversion under the Company's convertible debt if the impact is dilutive. The impact of the convertible debt is excluded from the computation of diluted earnings per share when interest expense per common share obtainable upon conversion is greater than basic earnings per share.
Comprehensive Income:
Components of comprehensive income for the Company include net income, changes in fair value of financial instruments designated as hedges of interest rate or foreign currency exposure and foreign currency translation charged or credited to the cumulative translation account within shareholders'
91
NOTES TO CONSOLIDATED FINANCIAL STATEMENTS (Continued)
1. BUSINESS DESCRIPTION AND SUMMARY OF SIGNIFICANT ACCOUNTING POLICIES (Continued)
equity. These amounts are presented in the Consolidated Statements of Changes in Shareholders' Equity and Comprehensive Income.
|
|
2010 | 2009 | 2008 | |||||||
|---|---|---|---|---|---|---|---|---|---|---|
|
|
(Dollars in thousands)
|
|||||||||
|
Accumulated Other Comprehensive Income, balance at July 1 |
$ | 51,855 | $ | 101,973 | $ | 78,278 | ||||
|
Cumulative translation adjustment: |
||||||||||
|
Balance at July 1 |
63,407 | 111,073 | 83,953 | |||||||
|
Pre-tax amount |
(5,416 | ) | (47,666 | ) | 28,804 | |||||
|
Tax effect |
— | — | (1,684 | ) | ||||||
|
Net of tax amount |
(5,416 | ) | (47,666 | ) | 27,120 | |||||
|
Balance at June 30 |
57,991 | 63,407 | 111,073 | |||||||
|
Changes in fair market value of financial instruments designated as cash flow hedges: |
||||||||||
|
Balance at July 1 |
(10,903 | ) | (8,791 | ) | (6,234 | ) | ||||
|
Pre-tax amount |
3,949 | (3,421 | ) | (3,811 | ) | |||||
|
Tax effect |
(1,482 | ) | 1,309 | 1,254 | ||||||
|
Net of tax amount |
2,467 | (2,112 | ) | (2,557 | ) | |||||
|
Balance at June 30 |
(8,436 | ) | (10,903 | ) | (8,791 | ) | ||||
|
Recognition of deferred compensation: |
||||||||||
|
Balance at July 1 |
(649 | ) | (309 | ) | 559 | |||||
|
Pre-tax amount |
3,184 | (514 | ) | (1,330 | ) | |||||
|
Tax effect |
(1,310 | ) | 174 | 462 | ||||||
|
Net of tax amount |
(1,874 | ) | (340 | ) | (868 | ) | ||||
|
Balance at June 30 |
(2,523 | ) | (649 | ) | (309 | ) | ||||
|
Accumulated Other Comprehensive Income, balance at June 30 |
$ | 47,032 | $ | 51,855 | $ | 101,973 | ||||
Derivative Instruments:
The Company may manage its exposure to interest rate and foreign currency risk within the Consolidated Financial Statements through the use of derivative financial instruments, according to its hedging policy. The Company does not use derivatives with a level of complexity or with a risk higher than the exposures to be hedged and does not hold or issue derivatives for trading or speculative purposes. The Company currently has or had interest rate swaps designated as both cash flow and fair value hedges, treasury locks designated as cash flow hedges, a hedge of its net investment in its European operations and forward foreign currency contracts designated as cash flow hedges of forecasted transactions denominated in a foreign currency. Refer to Note 9 to the Consolidated Financial Statements for further discussion.
The Company follows guidance for accounting for derivative instruments and hedging activities, as amended and interpreted, which requires that all derivatives be recorded on the balance sheet at fair value. This guidance also requires companies to designate all derivatives that qualify as hedging instruments as fair value hedges, cash flow hedges or hedges of net investments in foreign operations.
92
NOTES TO CONSOLIDATED FINANCIAL STATEMENTS (Continued)
1. BUSINESS DESCRIPTION AND SUMMARY OF SIGNIFICANT ACCOUNTING POLICIES (Continued)
This designation is based upon the exposure being hedged. Cash flow and fair value hedges are designated and documented at the inception of each hedge by matching the terms of the contract to the underlying transaction. At inception, as dictated by the facts and circumstances, all hedges are expected to be highly effective, as the critical terms of these instruments are generally the same as those of the underlying risks being hedged. All derivatives designated as hedging instruments are assessed for effectiveness on an on-going basis. For purposes of the Consolidated Statement of Cash Flows, cash flows associated with all derivatives (designated as hedges or freestanding economic hedges) are classified in the same category as the related cash flows subject to the hedging relationship.
Stock-Based Employee Compensation Plans:
Stock-based compensation awards are granted under the terms of the 2004 Long Term Incentive Plan (2004 Plan) and the 2000 Stock Option Plan. Additionally, the Company has outstanding stock options under its 1991 Stock Option Plan, although the Plan terminated in 2001. Under these plans, four types of stock-based compensation awards are granted: stock options, equity-based stock appreciation rights (SARs), restricted stock awards (RSAs) and restricted stock units (RSUs). The stock-based awards, other than the RSUs, expire within ten years from the grant date. The RSUs cliff vest after five years, and payment of the RSUs is deferred until January 31 of the year following vesting. Unvested awards are subject to forfeiture in the event of termination of employment. The Company utilizes an option-pricing model to estimate the fair value of options and SARs at their grant date. Stock options and SARs are granted at not less than fair market value on the date of grant. The Company generally recognizes compensation expense for its stock-based compensation awards on a straight-line basis over the five-year vesting period. Awards granted do not contain acceleration of vesting terms for retirement eligible recipients. The Company's primary employee stock-based compensation grant occurs during the fourth quarter.
Effective July 1, 2005, the Company adopted guidance for share-based payments using the modified prospective method of application. Under this method, compensation expense is recognized both for (i) awards granted, modified or settled subsequent to July 1, 2003 and (ii) the remaining vesting periods of awards issued prior to July 1, 2003. The impact of adopting this guidance during fiscal year 2010 and 2009 was zero and during fiscal year 2008 was an increase in compensation expense of $0.4 million. This increase in compensation expense did not impact basic or diluted earnings per share in fiscal year 2008. Compensation expense recorded during fiscal years 2010, 2009 and 2008 includes $9.3, $7.5, and $6.5 million, respectively, related to awards issued subsequent to July 1, 2003 and $0.0, $0.0, and $0.4 million, respectively, related to unvested awards previously being accounted for on the intrinsic value method of accounting.
Total compensation cost for stock-based payment arrangements totaled $9.3, $7.5, and $6.8 million for the fiscal years ended June 30, 2010, 2009 and 2008, respectively. Guidance adopted by the Company for share-based payments requires that the cash retained as a result of the tax deductibility of increases in the value of stock-based arrangements be presented as a cash inflow from financing activity in the Consolidated Statement of Cash Flows. The amount presented as a financing activity for fiscal years 2010, 2009 and 2008 was $0.2, $0.2, and $1.4 million, respectively.
93
NOTES TO CONSOLIDATED FINANCIAL STATEMENTS (Continued)
1. BUSINESS DESCRIPTION AND SUMMARY OF SIGNIFICANT ACCOUNTING POLICIES (Continued)
Recent Accounting Standards Adopted by the Company:
Accounting Standards Codification
In June 2009, the Financial Accounting Standards Board (FASB) issued guidance that establishes two levels of U.S. generally accepted accounting principles (GAAP), authoritative and nonauthoritative. The guidance establishes the FASB Accounting Standards Codification™ (Codification) as the source of authoritative accounting principles recognized by the FASB to be applied by nongovernmental entities in the preparation of financial statements in conformity with GAAP. Rules and interpretive releases of the SEC under federal securities laws are also sources of authoritative GAAP for SEC registrants. All guidance contained in the Codification carries an equal level of authority. The Codification was effective on a prospective basis for interim and annual reporting periods ending after September 15, 2009. The adoption of the Codification changed the Company's references to GAAP accounting standards, but did not impact the Company's financial position, results of operations and cash flows.
Fair Value Measurements
In February 2008, the FASB issued guidance for the accounting for non-financial assets and non-financial liabilities. The new guidance permitted a one-year deferral of the application of fair value accounting for all non-financial assets and non-financial liabilities, except those that are recognized or disclosed at fair value in the financial statements on a recurring basis (at least annually).
The adoption of the new guidance on July 1, 2009, for non-financial assets and non-financial liabilities, did not have a material effect on the Company's financial position, results of operations and cash flows.
Business Combinations
In December 2007, the FASB issued guidance for accounting for business combinations. The guidance establishes principles and requirements for how an acquirer recognizes and measures in its financial statements the identifiable assets acquired, the liabilities assumed, any noncontrolling interests in the acquiree and the goodwill acquired. Some of the key changes are the accounting treatment for certain specific acquisition related items including: (1) accounting for acquired in process research and development as an indefinite-lived intangible asset until approved or discontinued rather than as an immediate expense; (2) expensing acquisition costs rather than adding them to the cost of an acquisition; (3) expensing restructuring costs in connection with an acquisition rather than adding them to the cost of an acquisition; (4) including the fair value of contingent consideration at the date of an acquisition in the cost of an acquisition; and (5) recording an asset or liability arising from a contingency at the date of an acquisition at fair value if fair value can be reasonably determined. If fair value can not be determined, the asset or liability would be recognized in accordance with accounting for contingencies guidance.
The adoption of the new guidance on July 1, 2009, for business combinations, did not have a material effect on the Company's financial position, results of operations and cash flows for the twelve months ended June 30, 2010. The guidance may have a material impact on future fiscal periods in the event the Company's acquisition activity increases.
94
NOTES TO CONSOLIDATED FINANCIAL STATEMENTS (Continued)
1. BUSINESS DESCRIPTION AND SUMMARY OF SIGNIFICANT ACCOUNTING POLICIES (Continued)
Disclosures about Fair Value of Financial Instruments
In April 2009, the FASB issued guidance on disclosures about fair value of financial instruments to be presented in interim financial statements in addition to annual financial statements. The Company adopted the new disclosure guidance about fair value of financial instruments on July 1, 2009.
In January 2010, the FASB issued guidance to amend the disclosure requirements related to recurring and nonrecurring fair value measurements. The guidance requires new disclosures on the transfers of assets and liabilities between Level 1 (quoted prices in active market for identical assets or liabilities) and Level 2 (significant other observable inputs) of the fair value measurement hierarchy, including the reasons and the timing of the transfers. Additionally, the guidance requires a roll forward of activities on purchases, sales, issuance, and settlements of the assets and liabilities measured using significant unobservable inputs (Level 3 fair value measurements).
The Company adopted the new disclosure guidance on January 1, 2010, except for the disclosure on the roll forward activities for Level 3 fair value measurements, which will be adopted by the Company on July 1, 2011.
Participating Securities Granted in Share-Based Payment Transactions
In June 2008, the FASB issued guidance that clarified all share-based payment awards that contain rights to non-forfeitable dividends participate in undistributed earnings with common shareholders. Therefore, awards of this nature are considered participating securities and the two-class method of computing basic and diluted earnings per share must be applied rather than the treasury stock method. In addition, once effective, all prior period earnings per share data presented must be adjusted retrospectively to conform to the provisions of the guidance.
The Company's outstanding unvested restricted stock awards do not contain rights to non-forfeitable dividends and as a result, the adoption of the new guidance on July 1, 2009, had no impact on the Company's diluted earnings per share.
Equity Method Investment Accounting Considerations
In November 2008, the FASB issued guidance that indicates, among other things, that transaction costs for an investment should be included in the cost of the equity-method investment (and not expensed) and shares subsequently issued by the equity-method investee that reduce the investor's ownership percentage should be accounted for as if the investor had sold a proportionate share of its investment, with gains or losses recorded through earnings.
The adoption of the new guidance on July 1, 2009, for equity method investment accounting considerations did not have a material effect on the Company's financial position, results of operations and cash flows.
Accounting Standards Recently Issued But Not Yet Adopted by the Company:
Multiple-Deliverable Revenue Arrangements
In October 2009, the FASB issued guidance on the accounting for multiple-deliverable revenue arrangements. The guidance removes the criterion that entities must use objective and reliable evidence of fair value in separately accounting for deliverables and provides entities with a hierarchy of evidence
95
NOTES TO CONSOLIDATED FINANCIAL STATEMENTS (Continued)
1. BUSINESS DESCRIPTION AND SUMMARY OF SIGNIFICANT ACCOUNTING POLICIES (Continued)
that must be considered when allocating arrangement consideration. The new guidance also requires entities to allocate arrangement consideration to the separate units of accounting based on the deliverables' relative selling price. The provisions will be effective for revenue arrangements entered into or materially modified in the Company's fiscal year 2011 and must be applied prospectively. The adoption of the new guidance on July 1, 2010, for multiple-deliverable revenue arrangements, will not have a material effect on the Company's financial position, results of operations, and cash flows.
Amendments to Accounting for Variable Interest Entities
In June 2009, the FASB issued guidance on the accounting for variable interest entities. The guidance amends previous variable interest entity guidance to require an enterprise to perform an analysis to determine whether the enterprise's variable interest or interests give it a controlling financial interest in a variable interest entity. Additionally, an enterprise is required to assess whether it has an implicit financial responsibility to ensure that a variable interest entity operates as designed when determining whether it has the power to direct the activities of the variable interest entity that most significantly impact the entity's economic performance. This guidance requires enhanced disclosures that will provide users of financial statements with more transparent information about an enterprise's involvement in a variable interest entity. It would also require ongoing assessments to determine whether an entity is a variable interest entity and whether an enterprise is the primary beneficiary of a variable interest entity. The guidance is effective for the Company's fiscal year 2011. The adoption of the new guidance on July 1, 2010, for variable interest entities, will not have a material effect on the Company's financial position, results of operations, and cash flows.
On February 16, 2009, the Company sold its Trade Secret salon concept (Trade Secret). The Company concluded, after a comprehensive review of strategic and financial options, to divest Trade Secret. The sale of Trade Secret included 655 company-owned salons and 57 franchise salons, all of which had historically been reported within the Company's North America reportable segment. The sale of Trade Secret included CCI. CCI owned and operated PureBeauty and BeautyFirst salons which were acquired by the Company on February 20, 2008.
The Company concluded that Trade Secret qualified as held for sale as of December 31, 2008, under accounting for the impairment or disposal of long-lived asset guidance, and is presented as discontinued operations in the Consolidated Statements of Operations for all periods presented. The operations and cash flows of Trade Secret have been eliminated from ongoing operations of the Company and there will be no significant continuing involvement in the operations after disposal pursuant to guidance in determining whether to report discontinued operations. The agreement included a provision that the Company would supply product to the buyer of Trade Secret and provide certain administrative services for a transition period. Under this agreement, the Company recognized $20.0 and $32.2 million of product revenues on the supply of product sold to the purchaser of Trade Secret and $1.9 and $2.9 million of other income related to the administrative services during the years ended June 30, 2010 and 2009, respectively.
The agreement was substantially complete as of September 30, 2009. Beginning within the second quarter of fiscal year 2010, the Company has an agreement in which the Company provides warehouse services to the purchaser of Trade Secret. Under the warehouse services agreement, the Company
96
NOTES TO CONSOLIDATED FINANCIAL STATEMENTS (Continued)
2. DISCONTINUED OPERATIONS (Continued)
recognized $3.0 million of other income related to warehouse services during the twelve months ended June 30, 2010.
As of June 30, 2010, $31.6 million was due to the Company from the purchaser of Trade Secret, $2.6 million was classified within current assets and $29.0 million was classified within other assets. During fiscal year 2010, the Company entered into a formal note receivable agreement with the purchaser of Trade Secret that requires quarterly interest payments of 8.0 percent and quarterly principal payments that escalate until the final payment in November of 2014. The Company recognized $1.2 million of interest income related to the note receivable agreement for the twelve months ended June 30, 2010. On July 6, 2010, the purchaser of Trade Secret filed for Chapter 11 bankruptcy. Collateral for the receivables under the agreement is assets of the purchaser of Trade Secret, the Company believes fully collateralizes the $31.6 million.
The Company utilized the consolidation of variable interest entities guidance to determine whether or not Trade Secret was a variable interest entity (VIE), and if so, whether the Company was the primary beneficiary of the Trade Secret. The Company concluded that Trade Secret is a VIE based on the fact that the equity investment at risk in Trade Secret is insufficient. The Company determined that it is not the primary beneficiary of Trade Secret based on its exposure to the expected losses of Trade Secret and as it is not the variable interest holder that is most closely associated within the relationship and the significance of the activities of Trade Secret. The exposure to loss related to the Company's involvement with Trade Secret is the carrying value of the amount due from the purchaser of Trade Secret and the guarantee of 31 operating leases that the Company has determined the risk of loss to be remote.
The income (loss) from discontinued operations are summarized below:
|
|
For the Years Ended June 30, | |||||||||
|---|---|---|---|---|---|---|---|---|---|---|
|
|
2010 | 2009 | 2008 | |||||||
|
|
(Dollars in thousands)
|
|||||||||
|
Revenues |
$ | — | $ | 163,436 | $ | 257,474 | ||||
|
Income (loss) from discontinued operations, before income taxes |
154 | (190,433 | ) | 865 | ||||||
|
Income tax benefit on discontinued operations |
3,007 | 58,997 | 438 | |||||||
|
Income (loss) from discontinued operations, net of income taxes |
$ | 3,161 | $ | (131,436 | ) | $ | 1,303 | |||
During the first quarter of fiscal year 2010, the Company recorded a $3.0 million tax benefit in discontinued operations to correct the prior year calculation of the income tax benefit related to the disposition of the Trade Secret salon concept. The Company does not believe the adjustment is material to its results of operations for the twelve months ended June 30, 2010 or its financial position or results of operations of any prior periods.
97
NOTES TO CONSOLIDATED FINANCIAL STATEMENTS (Continued)
3. OTHER FINANCIAL STATEMENT DATA
The following provides additional information concerning selected balance sheet accounts as of June 30, 2010 and 2009:
|
|
2010 | 2009 | ||||||
|---|---|---|---|---|---|---|---|---|
|
|
(Dollars in thousands)
|
|||||||
|
Accounts receivable |
$ | 27,482 | $ | 47,317 | ||||
|
Less allowance for doubtful accounts |
(3,170 | ) | (2,382 | ) | ||||
|
|
$ | 24,312 | $ | 44,935 | ||||
|
Other current assets: |
||||||||
|
Prepaids |
$ | 31,760 | $ | 35,665 | ||||
|
Notes receivable, primarily affiliates |
4,443 | 2,028 | ||||||
|
|
$ | 36,203 | $ | 37,693 | ||||
|
Property and equipment: |
||||||||
|
Land |
$ | 3,864 | $ | 3,864 | ||||
|
Buildings and improvements |
48,837 | 48,472 | ||||||
|
Equipment, furniture and leasehold improvements |
736,469 | 737,967 | ||||||
|
Internal use software |
87,286 | 84,115 | ||||||
|
Equipment, furniture and leasehold improvements under capital leases |
88,534 | 78,374 | ||||||
|
|
964,990 | 952,792 | ||||||
|
Less accumulated depreciation and amortization |
(561,174 | ) | (527,823 | ) | ||||
|
Less amortization of equipment, furniture and leasehold improvements under capital leases |
(44,566 | ) | (33,431 | ) | ||||
|
|
$ | 359,250 | $ | 391,538 | ||||
|
Investment in and loans to affiliates: |
||||||||
|
Equity-method investments |
$ | 183,670 | $ | 198,682 | ||||
|
Noncurrent loans to affiliates |
12,116 | 12,718 | ||||||
|
|
$ | 195,786 | $ | 211,400 | ||||
|
Other assets: |
||||||||
|
Notes receivable |
$ | 30,200 | $ | 1,579 | ||||
|
Other noncurrent assets |
50,412 | 43,600 | ||||||
|
|
$ | 80,612 | $ | 45,179 | ||||
|
Accrued expenses: |
||||||||
|
Payroll and payroll related costs |
$ | 87,831 | $ | 82,153 | ||||
|
Insurance |
22,323 | 21,228 | ||||||
|
Deferred revenues |
8,455 | 9,026 | ||||||
|
Taxes payable |
9,206 | 8,741 | ||||||
|
Other |
32,982 | 35,490 | ||||||
|
|
$ | 160,797 | $ | 156,638 | ||||
|
Other noncurrent liabilities: |
||||||||
|
Deferred income taxes |
$ | 68,059 | $ | 58,338 | ||||
|
Deferred rent |
53,914 | 53,294 | ||||||
|
Deferred benefits |
55,706 | 49,262 | ||||||
|
Insurance |
26,455 | 23,804 | ||||||
|
Equity put option |
22,009 | 24,161 | ||||||
|
Other |
21,627 | 27,428 | ||||||
|
|
$ | 247,770 | $ | 236,287 | ||||
98
NOTES TO CONSOLIDATED FINANCIAL STATEMENTS (Continued)
3. OTHER FINANCIAL STATEMENT DATA (Continued)
The following provides additional information concerning the other intangibles, net, balance sheet account as of June 30, 2010 and 2009:
|
|
June 30, 2010 | June 30, 2009 | ||||||||||||||||||
|---|---|---|---|---|---|---|---|---|---|---|---|---|---|---|---|---|---|---|---|---|
|
|
Cost |
Accumulated
Amortization(1) |
Net | Cost |
Accumulated
Amortization(1) |
Net | ||||||||||||||
|
|
(Dollars in thousands)
|
|||||||||||||||||||
|
Amortized intangible assets: |
||||||||||||||||||||
|
Brand assets and trade names |
$ | 79,596 | $ | (12,139 | ) | $ | 67,457 | $ | 79,064 | $ | (9,964 | ) | $ | 69,100 | ||||||
|
Customer lists |
52,045 | (28,652 | ) | 23,393 | 52,045 | (23,252 | ) | 28,793 | ||||||||||||
|
Franchise agreements |
21,245 | (7,543 | ) | 13,702 | 20,691 | (6,299 | ) | 14,392 | ||||||||||||
|
Lease intangibles |
14,674 | (4,360 | ) | 10,314 | 14,615 | (3,737 | ) | 10,878 | ||||||||||||
|
Non-compete agreements |
320 | (146 | ) | 174 | 121 | (60 | ) | 61 | ||||||||||||
|
Other |
6,755 | (3,725 | ) | 3,030 | 6,887 | (3,150 | ) | 3,737 | ||||||||||||
|
|
$ | 174,635 | $ | (56,565 | ) | $ | 118,070 | $ | 173,423 | $ | (46,462 | ) | $ | 126,961 | ||||||
All intangible assets have been assigned an estimated finite useful life, and are amortized on a straight-line basis over the number of years that approximate their expected period of benefit (ranging from one to 40 years). The cost of intangible assets is amortized to earnings in proportion to the amount of economic benefits obtained by the Company in that reporting period. The weighted average amortization periods, in total and by major intangible asset class, are as follows:
|
|
Weighted
Average Amortization Period (In years) June 30, |
|||||||
|---|---|---|---|---|---|---|---|---|
|
|
2010 | 2009 | ||||||
|
Amortized intangible assets: |
||||||||
|
Brand assets and trade names |
39 | 39 | ||||||
|
Customer lists |
10 | 10 | ||||||
|
Franchise agreements |
22 | 22 | ||||||
|
Lease intangibles |
20 | 20 | ||||||
|
Non-compete agreements |
5 | 4 | ||||||
|
Other |
18 | 18 | ||||||
|
Total |
26 | 26 | ||||||
99
NOTES TO CONSOLIDATED FINANCIAL STATEMENTS (Continued)
3. OTHER FINANCIAL STATEMENT DATA (Continued)
Total amortization expense related to amortizable intangible assets during the years ended June 30, 2010, 2009, and 2008 was approximately $9.9, $9.9, and $11.1 million, respectively. As of June 30, 2010, future estimated amortization expense related to amortizable intangible assets is estimated to be:
|
Fiscal Year
|
(Dollars in
thousands) |
|||
|---|---|---|---|---|
|
2011 |
$ | 9,652 | ||
|
2012 |
9,407 | |||
|
2013 |
9,100 | |||
|
2014 |
8,906 | |||
|
2015 |
5,882 | |||
The following provides supplemental disclosures of cash flow activity:
|
|
2010 | 2009 | 2008 | ||||||||
|---|---|---|---|---|---|---|---|---|---|---|---|
|
|
(Dollars in thousands)
|
||||||||||
|
Cash paid during the year for: |
|||||||||||
|
Interest |
$ | 53,547 | $ | 40,992 | $ | 46,547 | |||||
|
Income taxes, net of refunds |
17,058 | 21,878 | 49,148 | ||||||||
Significant non-cash investing and financing activities include the following:
In fiscal years 2010, 2009, and 2008, the Company financed capital expenditures totaling $7.9, $7.5, and $10.4 million, respectively, through capital leases.
During fiscal years 2010, 2009, and 2008, the Company made acquisitions and the purchase prices have been allocated to assets acquired and liabilities assumed based on their estimated fair values at the dates of acquisition. These acquisitions individually and in the aggregate are not material to the Company's operations. Operations of the acquired companies have been included in the operations of the Company since the date of the respective acquisition.
100
NOTES TO CONSOLIDATED FINANCIAL STATEMENTS (Continued)
4. ACQUISITIONS (Continued)
Based upon purchase price allocations, the components of the aggregate purchase prices of the acquisitions made during fiscal years 2010, 2009, and 2008 and the allocation of the purchase prices were as follows:
|
|
2010 | 2009 | 2008 | ||||||||
|---|---|---|---|---|---|---|---|---|---|---|---|
|
|
(Dollars in thousands)
|
||||||||||
|
Components of aggregate purchase prices: |
|||||||||||
|
Cash |
$ | 3,664 | $ | 40,051 | $ | 132,971 | |||||
|
Note receivable applied to purchase price |
— | — | 10,000 | ||||||||
|
Common stock |
— | — | 4 | ||||||||
|
Liabilities assumed or payable |
— | 75 | 2,602 | ||||||||
|
|
$ | 3,664 | $ | 40,126 | $ | 145,577 | |||||
|
Allocation of the purchase prices: |
|||||||||||
|
Current assets |
$ | 178 | $ | 1,337 | $ | 16,631 | |||||
|
Property and equipment |
873 | 5,989 | 21,398 | ||||||||
|
Deferred income tax asset |
— | 1,787 | 1,789 | ||||||||
|
Other noncurrent assets |
— | — | 473 | ||||||||
|
Goodwill |
2,581 | 30,812 | 105,252 | ||||||||
|
Identifiable intangible assets |
134 | 1,322 | 16,114 | ||||||||
|
Accounts payable and accrued expenses |
(102 | ) | (818 | ) | (15,526 | ) | |||||
|
Deferred income tax liability |
— | — | — | ||||||||
|
Other noncurrent liabilities |
— | (303 | ) | (3,449 | ) | ||||||
|
Settlement of contingent purchase price(1) |
— | — | 2,895 | ||||||||
|
|
$ | 3,664 | $ | 40,126 | $ | 145,577 | |||||
- (1)
- During fiscal years 2005, the Company guaranteed that the stock issued in conjunction with one of its acquisitions would reach a certain market price by the fourth quarter of fiscal year 2008. The guaranteed stock price was factored into the purchase price at the acquisition date by recording an increase to additional paid-in-capital for the differential between the stock price at the date of acquisition and the guaranteed stock price. However, the stock did not reach this price during the agreed upon time frame. Therefore, the Company was obligated to issue $2.9 million in additional consideration to the sellers during the fourth quarter of fiscal year 2008. The $2.9 million in fiscal year 2008 represents the difference between the guaranteed stock price and the actual stock price on the last day of the agreed upon time frame, and was recorded as a reduction to additional paid-in capital.
101
NOTES TO CONSOLIDATED FINANCIAL STATEMENTS (Continued)
4. ACQUISITIONS (Continued)
The value and related weighted average amortization periods for the intangibles acquired during fiscal years 2010 and 2009 business acquisitions, in total and by major intangible asset class, are as follows:
|
|
Purchase Price
Allocation |
Weighted
Average Amortization Period |
||||||||||||
|---|---|---|---|---|---|---|---|---|---|---|---|---|---|---|
|
|
Year Ended
June 30, 2010 |
|||||||||||||
|
|
(in years) | |||||||||||||
|
|
2010 | 2009 | 2010 | 2009 | ||||||||||
|
|
(Dollars in
thousands) |
|
|
|||||||||||
|
Amortized intangible assets: |
||||||||||||||
|
Brand assets and trade names |
$ | 61 | $ | 204 | 20 | 20 | ||||||||
|
Customer lists |
— | 191 | — | 7 | ||||||||||
|
Franchise agreements |
— | 244 | — | 40 | ||||||||||
|
Lease intangibles |
15 | 480 | 20 | 20 | ||||||||||
|
Non-compete agreements |
— | — | — | — | ||||||||||
|
Other |
58 | 203 | 20 | 20 | ||||||||||
|
Total |
$ | 134 | $ | 1,322 | 20 | 22 | ||||||||
The majority of the purchase price in salon acquisitions is accounted for as residual goodwill rather than identifiable intangible assets. This stems from the value associated with the walk-in customer base of the acquired salons, which is not recorded as an identifiable intangible asset under current accounting guidance, as well as the limited value and customer preference associated with the acquired hair salon brand. Key factors considered by consumers of hair salon services include personal relationships with individual stylists, service quality and price point competitiveness. These attributes represent the "going concern" value of the salon.
Residual goodwill further represents the Company's opportunity to strategically combine the acquired business with the Company's existing structure to serve a greater number of customers through its expansion strategies. In the acquisitions of international salons and hair restoration centers, the residual goodwill primarily represents the growth prospects that are not captured as part of acquired tangible or identified intangible assets. Generally, the goodwill recognized in the North American salon transactions is expected to be fully deductible for tax purposes and the goodwill recognized in the international salon transactions is non-deductible for tax purposes. Goodwill generated in certain acquisitions, such as the acquisition of hair restoration centers, is not deductible for tax purposes due to the acquisition structure of the transaction.
During fiscal years 2010 and 2009, the Company purchased salon operations from its franchisees. The Company evaluated the effective settlement of the pre-existing franchise contracts and associated rights afforded by those contracts. The Company determined that the effective settlement of the pre-existing franchise contracts at the date of the acquisition did not result in a gain or loss, as the agreements were neither favorable nor unfavorable when compared to similar current market transactions, and no settlement provisions exist in the pre-existing contracts. Therefore, no settlement gain or loss was recognized with respect to the Company's franchise buybacks.
102
NOTES TO CONSOLIDATED FINANCIAL STATEMENTS (Continued)
The table below contains details related to the Company's recorded goodwill for the years ended June 30, 2010 and 2009 is as follows:
|
|
Salons |
|
|
||||||||||
|---|---|---|---|---|---|---|---|---|---|---|---|---|---|
|
|
Hair Restoration
Centers |
|
|||||||||||
|
|
North America | International | Consolidated | ||||||||||
|
|
(Dollars in thousands)
|
||||||||||||
|
Gross goodwill at June 30, 2008 |
$ | 668,799 | $ | 48,461 | $ | 153,733 | $ | 870,993 | |||||
|
Accumulated impairment losses |
— | — | — | — | |||||||||
|
Net goodwill at June 30, 2008 |
668,799 | 48,461 | 153,733 | 870,993 | |||||||||
|
Goodwill acquired(3) |
31,531 | (1,255 | ) | 536 | 30,812 | ||||||||
|
Translation rate adjustments |
(7,149 | ) | (5,545 | ) | (43 | ) | (12,737 | ) | |||||
|
Resolution to pre-acquisition income tax contingency |
— | — | (4,859 | ) | (4,859 | ) | |||||||
|
Goodwill impairment(2)(4) |
(78,126 | ) | (41,661 | ) | — | (119,787 | ) | ||||||
|
Gross goodwill at June 30, 2009 |
693,181 | 41,661 | 149,367 | 884,209 | |||||||||
|
Accumulated impairment losses(2)(4) |
(78,126 | ) | (41,661 | ) | — | (119,787 | ) | ||||||
|
Net goodwill at June 30, 2009 |
615,055 | — | 149,367 | 764,422 | |||||||||
|
Goodwill acquired |
2,581 | — | — | 2,581 | |||||||||
|
Translation rate adjustments |
4,250 | — | 13 | 4,263 | |||||||||
|
Resolution to pre-acquisition income tax contingency |
— | — | 1,000 | 1,000 | |||||||||
|
Goodwill impairment(1) |
(35,277 | ) | — | — | (35,277 | ) | |||||||
|
Gross goodwill at June 30, 2010 |
700,012 | 41,661 | 150,380 | 892,053 | |||||||||
|
Accumulated impairment losses(1)(2)(4) |
(113,403 | ) | (41,661 | ) | — | (155,064 | ) | ||||||
|
Net goodwill at June 30, 2010 |
$ | 586,609 | $ | — | $ | 150,380 | $ | 736,989 | |||||
- (1)
-
As
a result of the Company's annual impairment testing of goodwill during the three months ended March 31, 2010, a $35.3 million impairment
charge was recorded within continuing operations for the excess of the carrying value of goodwill over the implied fair value of goodwill for the Regis salon concept.
- (2)
-
During
the three months ended December 31, 2008 the fair value of the Company's stock declined such that it began trading below book value per share.
As a result of the Company's interim impairment test of goodwill during the three months ended December 31, 2008, a $41.7 million impairment charge for the full carrying amount of
goodwill within the salon concepts in the United Kingdom.
- (3)
-
Goodwill
acquired includes adjustments to prior year acquisitions, primarily representing the finalization of purchase price allocations. For the twelve
months ended June 30, 2009 the $1.3 million reduction to international goodwill related to the settlement of the escrow account on an acquisition that closed in September 2007.
- (4)
- As the proceeds the Company received from the sale of Trade Secret were negligible, the Company recognized a $78.1 million goodwill impairment charge within discontinued operations during fiscal year 2009.
103
NOTES TO CONSOLIDATED FINANCIAL STATEMENTS (Continued)
6. INVESTMENTS IN AND LOANS TO AFFILIATES
The table below presents the carrying amount of investments in and loans to affiliates as of June 30, 2010 and 2009:
|
|
Provalliance |
Empire
Education Group, Inc. |
Intelligent
Nutrients, LLC |
MY Style |
Hair Club
for Men, Ltd. |
Total | |||||||||||||
|---|---|---|---|---|---|---|---|---|---|---|---|---|---|---|---|---|---|---|---|
|
|
(Dollars in thousands)
|
||||||||||||||||||
|
Balance at June 30, 2008 |
$ | 119,353 | $ | 109,307 | $ | 5,657 | $ | 7,756 | $ | 5,029 | $ | 247,102 | |||||||
|
Loans to affiliates |
— | 15,000 | 3,000 | 2,971 | — | 20,971 | |||||||||||||
|
Payment of loans by affiliates |
— | (15,000 | ) | — | (613 | ) | — | (15,613 | ) | ||||||||||
|
Equity in income (loss) of affiliated companies, net of income taxes(2) |
1,979 | 2,065 | (541 | ) | (1,331 | ) | 600 | 2,772 | |||||||||||
|
Impairment(1)(2) |
(25,732 | ) | — | (4,800 | ) | — | — | (30,532 | ) | ||||||||||
|
Cash dividends received |
— | — | — | — | (906 | ) | (906 | ) | |||||||||||
|
Other, primarily translation rate adjustments(3) |
(13,465 | ) | 79 | (3,316 | ) | 3,935 | 373 | (12,394 | ) | ||||||||||
|
Balance at June 30, 2009 |
$ | 82,135 | $ | 111,451 | $ | — | $ | 12,718 | $ | 5,096 | $ | 211,400 | |||||||
|
Payment of loans by affiliates |
— | (15,000 | ) | — | — | — | (15,000 | ) | |||||||||||
|
Equity in income of affiliated companies, net of income taxes(4) |
4,134 | 6,431 | — | — | 909 | 11,474 | |||||||||||||
|
Cash dividends received |
— | — | — | — | (1,263 | ) | (1,263 | ) | |||||||||||
|
Other, primarily translation rate adjustments |
(10,788 | ) | — | — | (602 | ) | 565 | (10,825 | ) | ||||||||||
|
Balance at June 30, 2010 |
$ | 75,481 | $ | 102,882 | $ | — | $ | 12,116 | $ | 5,307 | $ | 195,786 | |||||||
|
Percentage ownership at June 30, 2010 |
30.0 | % | 55.1 | % | — | — | 50.0 | % | |||||||||||
- (1)
-
During
fiscal year 2009, the Company recorded impairments of $25.7 and $7.8 million ($4.8 million net of tax) related to its interest in
Provalliance and Intelligent Nutrients, LLC, respectively.
- (2)
-
Equity
in (loss) income of affiliated companies, net of income taxes per the Consolidated Statement of Operations includes $2.8 million in equity
income, $30.5 million of impairments and $2.1 million for the increase in the Provalliance equity put valuation.
- (3)
-
The
$3.3 million of other change for Intelligent Nutrients, LLC relates to the tax affect of the fiscal year 2009 impairment.
- (4)
- Equity in income of affiliated companies, net of income taxes per the Consolidated Statement of Operations includes $4.1 million in equity income of Provalliance and $0.5 million for the increase in the Provalliance equity put valuation.
104
NOTES TO CONSOLIDATED FINANCIAL STATEMENTS (Continued)
6. INVESTMENTS IN AND LOANS TO AFFILIATES (Continued)
The table below presents the summarized financial information of the equity method investees as of June 30, 2010 and 2009. The financial information of the equity investees was based on results as of June 30, 2010 and for the twelve months ended June 30, 2010.
|
|
Equity Method
Investee Greater Than 50 Percent Owned |
Equity Method
Investees Less Than 50 Percent Owned |
|||||||||||
|---|---|---|---|---|---|---|---|---|---|---|---|---|---|
|
|
2010 | 2009 | 2010 | 2009 | |||||||||
|
|
(Dollars in thousands)
|
||||||||||||
|
Summarized Balance Sheet Information: |
|||||||||||||
|
Current assets |
$ | 35,070 | $ | 34,990 | $ | 74,040 | $ | 109,700 | |||||
|
Noncurrent assets |
105,469 | 99,858 | 263,472 | 313,763 | |||||||||
|
Current liabilities |
27,458 | 25,583 | 91,077 | 137,169 | |||||||||
|
Noncurrent liabilities |
32,017 | 39,661 | 93,055 | 115,067 | |||||||||
|
Summarized Statement of Operations Information: |
|||||||||||||
|
Gross revenue |
$ | 176,535 | $ | 153,693 | $ | 299,188 | $ | 290,978 | |||||
|
Gross profit |
64,661 | 48,173 | 123,210 | 124,361 | |||||||||
|
Operating income |
19,752 | 7,656 | 21,227 | 19,047 | |||||||||
|
Net income |
11,082 | 3,611 | 14,763 | 13,295 | |||||||||
Investment in Provalliance
On January 31, 2008, the Company merged its continental European franchise salon operations with the operations of the Franck Provost Salon Group in exchange for a 30.0 percent equity interest in the newly formed Provalliance entity (Provalliance). The merger with the operations of the Franck Provost Salon Group which are also located in continental Europe, created Europe's largest salon operator with approximately 2,500 company-owned and franchise salons as of June 30, 2010.
The merger agreement contains a right (Equity Put) to require the Company to purchase an additional ownership interest in Provalliance between specified dates in 2010 to 2018. The acquisition price is determined based on a multiple of the earnings before interest, taxes, depreciation and amortization of Provalliance for a trailing twelve month period adjusted for certain items as defined in the agreement which is intended to approximate fair value. The initial estimated fair value of the Equity Put as of January 31, 2008, approximately $24.8 million, has been included as a component of the Company's investment in Provalliance. A corresponding liability for the same amount as the Equity Put was recorded in other noncurrent liabilities. Any changes in the estimated fair value of the Equity Put are recorded in the Company's consolidated statement of operations. The Company recorded a $0.5 million increase in the fair value of the Equity Put during fiscal year 2010, see further discussion within Note 7 to the Consolidated Financial Statements. The Company recorded a $2.1 million increase in the fair value of the Equity Put during fiscal year 2009. Any changes related to foreign currency translation are recorded in accumulated other comprehensive income. The Company recorded a $2.6 million decrease in the Equity Put related to foreign currency translation during fiscal year 2010, see further discussion within Note 7 to the Consolidated Financial Statements. If the Equity Put is exercised, and the Company fails to complete the purchase, the parties exercising the Equity Put will be entitled to exercise various remedies against the Company, including the right to purchase the Company's interest in Provalliance for a purchase price determined based on a discounted multiple of the earnings before interest and taxes of Provalliance for a trailing twelve month period. The merger agreement also contains an option (Equity Call) whereby the Company can acquire additional
105
NOTES TO CONSOLIDATED FINANCIAL STATEMENTS (Continued)
6. INVESTMENTS IN AND LOANS TO AFFILIATES (Continued)
ownership interest in Provalliance between specific dates in 2018 to 2020 at an acquisition price determined consistent with the Equity Put.
The Company utilized the consolidation of variable interest entities guidance to determine whether or not its investment in Provalliance was a VIE, and if so, whether the Company was the primary beneficiary of the VIE. The Company concluded that Provalliance is a VIE based on the fact that the holders of the equity investment at risk, as a group, lack the obligation to absorb the expected losses of the entity. The Equity Put is based on a formula that may or may not be at market when exercised, therefore, it could provide the Company with the characteristic of a controlling financial interest or could prevent the Franck Provost Salon Group from absorbing its share of expected losses by transferring such obligation to the Company. Under certain circumstances, including a decline in the fair value of Provalliance, the Equity Put could be exercised and the Franck Provost Group could be protected from absorbing the downside of the equity interest. As the Equity Put absorbs a large amount of variability this characteristic results in Provalliance being a VIE.
Regis determined that the relationship and the significance of the activities of Provalliance is more closely associated with the Franck Provost Group. Furthermore, the Company determined, based on a quantitative analysis that the Franck Provost Group has greater exposure to the expected losses of Provalliance. The variability that the Company could be required to absorb via its equity interest in Provalliance and its expanded interest via exercise of the Equity Put was determined to be well less than 50.0 percent. The Company concluded based on the considerations above that the primary beneficiary of Provalliance is the Franck Provost Group. The Company has accounted for its interest in Provalliance as an equity method investment.
During fiscal years 2010 and 2009, the Company recorded $4.1 and $2.0 million, respectively, of equity in income related to its investment in Provalliance. Due to increased debt and reduced earnings expectations, the Company could no longer justify the carrying amount of its investment in Provalliance and recorded a $25.7 million "other-than-temporary" impairment charge in its fourth quarter ended June 30, 2009. The exposure to loss related to the Company's involvement with Provalliance is the carrying value of the investment and future changes in fair value of the Equity Put.
Investment in Empire Education Group, Inc.
On August 1, 2007, the Company contributed its 51 wholly-owned accredited cosmetology schools to Empire Education Group, Inc. (EEG) in exchange for a 49.0 percent equity interest in EEG. In January 2008, the Company's effective ownership interest increased to 55.1 percent related to the buyout of EEG's minority interest shareholder. EEG operates 96 accredited cosmetology schools.
At June 30, 2010 and 2009, the Company had a $21.4 million outstanding loan receivable with EEG. The Company has also provided EEG with a $15.0 million revolving credit facility, against which there was no outstanding borrowings as of June 30, 2010 and $15.0 million outstanding as of June 30, 2009. During fiscal year 2010 and 2009, the Company recorded $0.7 and $0.9 million, respectively, of interest income related to the loan and revolving credit facility. The Company has also guaranteed a credit facility of EEG. The exposure to loss related to the Company's involvement with EEG is the carrying value of the investment, the outstanding loan and the guarantee of the credit facility.
The Company utilized consolidation of variable interest entities guidance to determine whether or not its investment in EEG was a variable interest entity (VIE), and if so, whether the Company was the primary beneficiary of the VIE. The Company concluded that EEG was not a VIE based on the fact that EEG had sufficient equity at risk. As the substantive voting control relates to the voting rights of
106
NOTES TO CONSOLIDATED FINANCIAL STATEMENTS (Continued)
6. INVESTMENTS IN AND LOANS TO AFFILIATES (Continued)
the Board of Directors, the Company granted the other shareholder a proxy to vote such number of the Company's shares such that the other shareholder would have voting control of 51.0 percent of the common stock of EEG. The Company accounts for EEG as an equity investment under the voting interest model. During fiscal years ended June 30, 2010 and 2009, the Company recorded $6.4 and $2.1 million of equity earnings related to its investment in EEG.
Investment in Intelligent Nutrients, LLC
Effective December 31, 2009, the Company transferred its ownership interest in Intelligent Nutrients, LLC to the other shareholder. In consideration for the transfer of the Company's ownership interest, Intelligent Nutrients, the other shareholder, and the individual owner of the other shareholder will indemnify and hold harmless the Company from all current and future obligations of Intelligent Nutrients. Until December 31, 2009, the Company held a 49.0 percent interest in Intelligent Nutrients, LLC. The Company's investment was previously accounted for under the equity method of accounting. During fiscal year 2009, the Company determined that its investment in and loans to Intelligent Nutrients, LLC were impaired and the fair value was zero due to Intelligent Nutrients, LLC's inability to develop a professional organic brand of shampoo and conditioner with a price point that would develop broad consumer appeal. The Company also determined that the loss in value was "other-than-temporary" and recognized a pretax, non-cash impairment charge of $7.8 million for the full carrying value of the investment and loans during fiscal year 2009. The Company has no further exposure to loss related to the Company's involvement with Intelligent Nutrients, LLC.
Investment in MY Style
In April 2007, the Company purchased exchangeable notes issued by Yamano Holding Corporation (Exchangeable Note) and a loan obligation of a Yamano Holdings subsidiary, MY Style, formally known as Beauty Plaza Co. Ltd., (MY Style Note) for an aggregate amount of $11.3 million (1.3 billion Yen as of April 2007). The Exchangeable Note contains an option for the Company to exchange a portion of the Exchangeable Note for shares of common stock of My Style. In connection with the issuance of the Exchangeable Note, the Company paid a premium of approximately $5.5 million (573,000,000 Yen as of April 2007).
Exchangeable Note. In September 2008, the Company advanced an additional $3.0 million (300,000,000 Yen as of September 2008) to Yamano Holding Corporation (Yamano). In connection with the 300,000,000 Yen advance, the exchangeable portion of the Exchangeable Note increased from approximately 14.8 percent to 27.1 percent of the 800 outstanding shares of MY Style for 21,700,000 Yen. This exchange feature is akin to a deep-in-the-money option permitting the Company to purchase shares of common stock of MY Style. The option is embedded in the Exchangeable Note and does not meet the criteria for separate accounting under accounting for derivative instruments and hedging activities.
The Company determined that the September 2008 modifications to the Exchangeable Note were more than minor and the loan modification should be treated as an extinguishment. The Company recorded a $2.1 million (224,000,000 Yen as of September 2008) gain related to the modification of the Exchangeable Note. However, based upon the overall fair value of the Exchangeable Note on the date of modification, the Company recorded an other than temporary impairment loss of $3.4 million (370,000,000 Yen as of September 2008). The $1.3 million net amount of the gain and other than
107
NOTES TO CONSOLIDATED FINANCIAL STATEMENTS (Continued)
6. INVESTMENTS IN AND LOANS TO AFFILIATES (Continued)
temporary impairment was recorded within equity in loss of affiliates within the Consolidated Statement of Operations during the fourth quarter of fiscal year 2009.
On March 28, 2010, the Company entered into an amendment agreement with Yamano in connection with the Exchangeable Note. The amendment revised the redemptions schedule for the 100,000,000 Yen and 211,131,284 Yen payments due September 30, 2013 and 2014, respectively, to March 28, 2010. The amendment was entered into in connection with a preferred share subscription agreement dated March 29, 2010 between the Company and Yamano. Under the preferred share subscription agreement, Yamano issued and the Company purchased one share of Yamano Class A Preferred Stock with a subscription amount of $1.1 million (100,000,000 Yen) and one share of Yamano Class B Preferred Stock with a subscription amount of $2.3 million (211,131,284 Yen), collectively the "Preferred Shares". The portions of the Exchangeable Note that became due as of March 28, 2010 were contributed in-kind as payment for the Preferred Shares. The Preferred Shares have the same terms and rights, yield a 5.0 percent dividend that accrues if not paid and have no voting rights.
The Company determined that the March 2010 modifications were minor and the loan modification should not be treated as an extinguishment. The preferred shares will be accounted for as an available-for-sale debt security and recorded as part of the Company's investment within the investment in and loans to affiliates line item on the Consolidated Balance Sheet with any changes in fair value recorded in other comprehensive income.
As June 30, 2010, the principal amount outstanding under the Exchangeable Note is $3.4 million (300,000,000 Yen). Principal payments of 100,000,000 Yen are due annually on September 30 through September 30, 2012. The Exchangeable Note accrues interest at 1.845 percent and interest is payable on September 30, 2012 with the final principal payment. The Company recorded approximately $0.1 million in interest income related to the Exchangeable Note during fiscal years 2010 and 2009.
MY Style Note. As of June 30, 2010, the principal amount outstanding under the MY Style Note is $1.8 million (156,492,000 Yen). Principal payments of 52,164,000 Yen along with accrued interest are due annually on May 31 through May 31, 2013. The MY Style Note accrues interest at 3.0 percent. The Company recorded less than $0.1 million in interest income related to the MY Style Note during fiscal years 2010 and 2009.
As of June 30, 2010, $1.7 and $12.1 million are recorded in the Consolidated Balance Sheet as current assets and investment in affiliates and loans, respectively, representing the Company's total investment in MY Style. The exposure to loss related to the Company's involvement with MY Style is the carrying value of the premium paid and the outstanding notes.
All foreign currency transaction gains and losses on the Exchangeable Note and MY Style Note are recorded through other income within the Consolidated Statement of Operations. The foreign currency transaction gain recorded through other income was $3.1 and $2.1 million during fiscal years 2010 and 2009, respectively.
Investment in Hair Club for Men, Ltd.
The Company acquired a 50.0 percent interest in Hair Club for Men, Ltd. through its acquisition of Hair Club in fiscal year 2005. The Company accounts for its investment in Hair Club for Men, Ltd. under the equity method of accounting. Hair Club for Men, Ltd. operates Hair Club centers in Illinois and Wisconsin. During fiscal year 2010 the Company recorded income of $0.9 million and received dividends of $1.3 million. During fiscal year 2009 the Company recorded income of $0.6 million and received dividends of $0.9 million. The exposure to loss related to the Company's involvement with Hair Club for Men, Ltd. is the carrying value of the investment.
108
NOTES TO CONSOLIDATED FINANCIAL STATEMENTS (Continued)
On July 1, 2008, the Company adopted fair value measurement guidance for financial assets and liabilities. On July 1, 2009, the Company adopted fair value measurement guidance for nonfinancial assets and liabilities. This guidance defines fair value, establishes a framework for measuring fair value and expands disclosure requirements about fair value measurements. This guidance defines fair value as the price that would be received to sell an asset or paid to transfer a liability (an exit price) in the principal or most advantageous market for the asset or liability in an orderly transaction between market participants on the measurement date. The fair value hierarchy prescribed by this guidance contains three levels as follows:
- •
-
Quoted prices for similar assets or liabilities in active markets;
- •
-
Quoted prices for identical or similar assets in non-active markets;
- •
-
Inputs other than quoted prices that are observable for the asset or liability; and
- •
- Inputs that are derived principally from or corroborated by other observable market data.
Level 1 —Unadjusted quoted prices that are available in active markets for the identical assets or liabilities at the measurement date.
Level 2 —Other observable inputs available at the measurement date, other than quoted prices included in Level 1, either directly or indirectly, including:
Level 3 —Unobservable inputs that cannot be corroborated by observable market data and reflect the use of significant management judgment. These values are generally determined using pricing models for which the assumptions utilize management's estimates of market participant assumptions.
Assets and Liabilities that are Measured at Fair Value on a Recurring Basis
The fair value hierarchy requires the use of observable market data when available. In instances in which the inputs used to measure fair value fall into different levels of the fair value hierarchy, the fair value measurement has been determined based on the lowest level input that is significant to the fair value measurement in its entirety. The Company's assessment of the significance of a particular item to the fair value measurement in its entirety requires judgment, including the consideration of inputs specific to the asset or liability. The following tables sets forth by level within the fair value hierarchy, the Company's financial assets and liabilities that were accounted for at fair value on a recurring basis
109
NOTES TO CONSOLIDATED FINANCIAL STATEMENTS (Continued)
7. FAIR VALUE MEASUREMENTS (Continued)
at June 30, 2010 and June 30, 2009, according to the valuation techniques the Company used to determine their fair values.
|
|
|
Fair Value Measurements
Using Inputs Considered as |
||||||||||||
|---|---|---|---|---|---|---|---|---|---|---|---|---|---|---|
|
|
Fair Value at
June 30, 2010 |
|||||||||||||
|
|
Level 1 | Level 2 | Level 3 | |||||||||||
|
|
|
(Dollars in thousands)
|
||||||||||||
|
ASSETS |
||||||||||||||
|
Non-current assets |
||||||||||||||
|
Derivative instruments |
$ | 274 | $ | — | $ | 274 | $ | — | ||||||
|
Preferred shares |
3,502 | — | — | 3,502 | ||||||||||
|
LIABILITIES |
||||||||||||||
|
Current liabilities |
||||||||||||||
|
Derivative instruments |
$ | 401 | $ | — | $ | 401 | $ | — | ||||||
|
Non-current liabilities |
||||||||||||||
|
Derivative instruments |
$ | 1,039 | $ | — | $ | 1,039 | $ | — | ||||||
|
Equity put option |
22,009 | — | — | 22,009 | ||||||||||
|
|
|
Fair Value Measurements
Using Inputs Considered as |
||||||||||||
|---|---|---|---|---|---|---|---|---|---|---|---|---|---|---|
|
|
Fair Value at
June 30, 2009 |
|||||||||||||
|
|
Level 1 | Level 2 | Level 3 | |||||||||||
|
|
|
(Dollars in thousands)
|
||||||||||||
|
ASSETS |
||||||||||||||
|
Current assets |
||||||||||||||
|
Derivative instruments |
$ | 1,543 | $ | — | $ | 1,543 | $ | — | ||||||
|
LIABILITIES |
||||||||||||||
|
Current liabilities |
||||||||||||||
|
Derivative instruments |
$ | 16 | $ | — | $ | 16 | $ | — | ||||||
|
Non-current liabilities |
||||||||||||||
|
Derivative instruments |
$ | 5,786 | $ | — | $ | 5,786 | $ | — | ||||||
|
Equity put option |
24,161 | — | — | 24,161 | ||||||||||
110
NOTES TO CONSOLIDATED FINANCIAL STATEMENTS (Continued)
7. FAIR VALUE MEASUREMENTS (Continued)
Changes in Financial Instruments Measured at Level 3 Fair Value on a Recurring Basis
The following tables present the changes during the twelve ended June 30, 2010 and 2009 in our Level 3 financial instruments that are measured at fair value on a recurring basis.
|
|
Changes in Financial Instruments
Measured at Level 3 Fair Value Classified as |
|||||||||||
|---|---|---|---|---|---|---|---|---|---|---|---|---|
|
|
Preferred Shares |
Equity Put
Option |
Total | |||||||||
|
|
(Dollars in thousands)
|
|||||||||||
|
Balance at July 1, 2009 |
$ | — | $ | 24,161 | $ | 24,161 | ||||||
|
Total realized and unrealized gains (losses): |
||||||||||||
|
Additions to Level 3 |
3,362 | — | 3,362 | |||||||||
|
Included in other comprehensive income |
140 | (2,620 | ) | (2,480 | ) | |||||||
|
Included in equity in income of affiliated companies |
— | 468 | 468 | |||||||||
|
Balance at June 30, 2010 |
$ | 3,502 | $ | 22,009 | $ | 25,511 | ||||||
|
|
Changes in Financial
Instruments Measured at Level 3 Fair Value Classified as |
||||||||
|---|---|---|---|---|---|---|---|---|---|
|
|
Equity Put Option | Total | |||||||
|
|
(Dollars in thousands)
|
||||||||
|
Balance at July 1, 2008 |
$ | 24,803 | $ | 24,803 | |||||
|
Total realized and unrealized gains (losses): |
|||||||||
|
Included in other comprehensive income |
(2,790 | ) | (2,790 | ) | |||||
|
Included in equity in income of affiliated companies |
2,148 | 2,148 | |||||||
|
Balance at June 30, 2009 |
$ | 24,161 | $ | 24,161 | |||||
The following methods and assumptions were used to estimate the fair value of each class of financial instrument:
Derivative instruments. The Company's derivative instrument liabilities consist of cash flow hedges represented by interest rate swaps and forward foreign currency contracts. The instruments are classified as Level 2 as the fair value is obtained using observable inputs available for similar liabilities in active markets at the measurement date, as provided by sources independent from the Company. See breakout by type of contract and reconciliation to the balance sheet line item that each contract is classified within Note 9 to the Consolidated Financial Statements.
Equity put option. The Company's merger of the European franchise salon operations with the operations of the Franck Provost Salon Group on January 31, 2008 contained an equity put and an equity call. See further discussion within Note 6 to the Consolidated Financial Statements. The equity put option is valued using binomial lattice models that incorporate assumptions including the business enterprise value at that date and future estimates of volatility and earnings before interest, taxes, and depreciation and amortization multiples. At June 30, 2010, the fair value of the equity put option was $22.0 million and is classified within other noncurrent liabilities on the balance sheet.
111
NOTES TO CONSOLIDATED FINANCIAL STATEMENTS (Continued)
7. FAIR VALUE MEASUREMENTS (Continued)
Preferred Shares. The Company has preferred shares in Yamano Holding Corporation. See further discussion within Note 6 to the Consolidated Financial Statements. The preferred shares are classified as Level 3 as there are no quoted market prices and minimal market participant data for preferred shares of similar rating. The preferred shares are classified within investment in and loans to affiliates on the Consolidated Balance Sheet. The fair value of the preferred shares is based on the financial health of Yamano Holding Corporation and terms within the preferred share agreement which allow the Company to convert the subscription amount of the preferred shares into equity of MY Style, a wholly owned subsidiary of Yamano Holding Corporation. As of June 30, 2010 the subscription value of the preferred shares of 311,131,284 Yen ($3.5 million) represents the fair value of the preferred shares.
Financial Instruments. In addition to the financial instruments listed above, the Company's financial instruments also include cash, cash equivalents, receivables, accounts payable and debt.
The fair value of cash and cash equivalents, receivables and accounts payable approximated the carrying values as of June 30, 2010. At June 30, 2010, the estimated fair values and carrying amounts of debt were $458.6 and $440.0 million, respectively. The estimated fair value of debt was determined based on internal valuation models, which utilize quoted market prices and interest rates for the same or similar instruments.
Assets and Liabilities Measured at Fair Value on a Nonrecurring Basis
We measure certain assets, including the Company's equity method investments, at fair value on a nonrecurring basis when they are deemed to be other-than-temporarily impaired. The fair values of our investments are determined based on valuation techniques using the best information available, and may include quoted market prices, market comparables, and discounted cash flow projections.
The following table presents the fair value in our assets measured at fair value on a nonrecurring basis during the twelve months ended June 30, 2010:
|
|
June 30, 2010 | Level 1 | Level 2 | Level 3 | Total Losses | ||||||||||||
|---|---|---|---|---|---|---|---|---|---|---|---|---|---|---|---|---|---|
|
|
(Dollars in thousands)
|
||||||||||||||||
|
Assets |
|||||||||||||||||
|
Goodwill—Regis(1) |
$ | 102,180 | $ | — | $ | — | $ | 102,180 | $ | (35,277 | ) | ||||||
|
Total |
$ | 102,180 | $ | — | $ | — | $ | 102,180 | $ | (35,277 | ) | ||||||
- (1)
- The Company recorded $0.8 million of translation rate adjustments during the fourth quarter of fiscal year 2010 on the Regis salon concept goodwill balance.
Goodwill of the Regis salon concept with a carrying value of $136.3 million was written down to its implied fair value, resulting in an impairment charge of $35.3 million, which was recorded during fiscal year 2010. See further discussion within Note 1 to the Consolidated Financial Statements.
The assets measured at fair value on a nonrecurring basis during the twelve months ended June 30, 2009 were goodwill of the salon concepts in the United Kingdom and the Company's investment in and loans to Intelligent Nutrients, LLC. During the twelve months ended June 30, 2009 the Company recorded $41.7 and $7.8 million of impairment charges for the entire carrying value of the United Kingdom salon concept goodwill and investment in and loans to Intelligent Nutrients, LLC, respectively.
112
NOTES TO CONSOLIDATED FINANCIAL STATEMENTS (Continued)
The Company's long-term debt as of June 30, 2010 and 2009 consists of the following:
|
|
|
Interest rate % | Amounts outstanding | |||||||||||||
|---|---|---|---|---|---|---|---|---|---|---|---|---|---|---|---|---|
|
|
Maturity
Dates (fiscal year) |
|||||||||||||||
|
|
2010 | 2009 | 2010 | 2009 | ||||||||||||
|
|
|
|
|
(Dollars in thousands)
|
||||||||||||
|
Senior term notes |
2011 - 2018 | 5.65 - 8.39 | % | 1.12 - 8.39 | % | $ | 174,107 | $ | 506,643 | |||||||
|
Convertible senior notes |
2014 | 5.00 | — | 151,760 | — | |||||||||||
|
Term loan |
2013 | 2.86 | 2.07 | 85,000 | 85,000 | |||||||||||
|
Revolving credit facility |
2013 | — | 1.00 | — | 5,000 | |||||||||||
|
Equipment and leasehold notes payable |
2011 - 2015 | 8.93 - 9.35 | 8.68 - 9.48 | 27,473 | 32,200 | |||||||||||
|
Other notes payable |
2011 - 2013 | 3.00 - 8.00 | 3.00 - 8.00 | 1,689 | 5,464 | |||||||||||
|
|
440,029 | 634,307 | ||||||||||||||
|
Less current portion |
(51,629 | ) | (55,454 | ) | ||||||||||||
|
Long-term portion |
$ | 388,400 | $ | 578,853 | ||||||||||||
The debt agreements contain covenants, including limitations on incurrence of debt, granting of liens, investments, merger or consolidation, and transactions with affiliates. In addition, the Company must adhere to specified fixed charge coverage and leverage ratios, as well as minimum net worth levels. We were in compliance with all covenants and other requirements of our financing arrangements as of June 30, 2010. Additional details are included below with the discussion of the specific categories of debt.
Aggregate maturities of long-term debt, including associated capital lease obligations of $27.5 million at June 30, 2010, are as follows:
|
Fiscal year
|
(Dollars in thousands) | |||
|---|---|---|---|---|
|
2011 |
$ | 51,629 | ||
|
2012 |
115,834 | |||
|
2013 |
27,978 | |||
|
2014 |
172,440 | |||
|
2015 |
18,577 | |||
|
Thereafter |
53,571 | |||
|
|
$ | 440,029 | ||
Senior Term Notes
Private Shelf Agreement
At June 30, 2010 and 2009, the Company had $174.1 and $239.6 million, respectively, in unsecured, fixed rate, senior term notes outstanding under a Private Shelf Agreement, of which $40.5 and $40.5 million were classified as part of the current portion of the Company's long-term debt at June 30, 2010 and 2009, respectively. The notes require quarterly payments, and final maturity dates range from October 2010 through December 2017.
The Private Shelf Agreement includes financial covenants including debt to EBITDA ratios, fixed charge coverage ratios and minimum net equity tests (as defined within the Private Shelf Agreement),
113
NOTES TO CONSOLIDATED FINANCIAL STATEMENTS (Continued)
8. FINANCING ARRANGEMENTS (Continued)
as well as other customary terms and conditions. The maturity date for the debt may be accelerated upon the occurrence of various events of default, including breaches of the agreement, certain cross- default situations, certain bankruptcy related situations, and other customary events of default.
In July 2009, the Company amended the Restated Private Shelf Agreement. The amendments included increasing the Company's minimum net worth covenant from $675 million to $800 million, lowering the fixed charge coverage ratio requirement from 1.5x to 1.3x, amending certain definitions, including EBITDA and Fixed Charges, limiting the Company's restricted payments to $20 million if the Company's leverage ratio is greater than 2.0x and the addition of a risk based capital fee calculated on the daily average outstanding principal amount equal to an annual rate of 1.0 percent that commences one year after the amendment date. During fiscal year 2010, the net proceeds from the convertible senior notes and common stock issuances in July 2009 were utilized in part to repay $30.0 million of senior term notes under the Restated Private Shelf Agreement.
Private Placement Senior Term Notes
On June 29, 2009, the Company entered into a prepayment amendment on the private placement senior term notes whereby the Company negotiated to prepay the notes with a premium over the principal amount that is less than the make-whole premium that is otherwise payable upon redemption. During fiscal year 2010, the net proceeds from the convertible senior notes and common stock issuances in July 2009 were utilized to repay the $267.0 million of private placement senior term notes of varying maturities and $30.0 million of additional senior term notes under a Private Shelf Agreement.
As a result of the repayment of a portion of the senior term notes during the twelve months ended June 30, 2010, the Company incurred $12.8 million in make-whole payments and other fees along with $5.2 million in interest rate swap settlements, as discussed in Note 9 of the Consolidated Financial Statements, totaling $18.0 million that was recorded as interest expense within the Consolidated Statement of Operations.
Convertible Senior Notes
In July 2009, the Company issued $172.5 million aggregate principal amount of 5.0 percent convertible senior notes due July 2014. The notes are unsecured, senior obligations of the Company and interest will be payable semi-annually in arrears on January 15 and July 15 of each year at a rate of 5.0 percent per year. The notes will be convertible subject to certain conditions further described below at an initial conversion rate of 64.6726 shares of the Company's common stock per $1,000 principal amount of notes (representing an initial conversion price of approximately $15.46 per share of the Company's common stock).
Holders may convert their notes at their option prior to April 15, 2014 if the Company's stock price meets certain price triggers or upon the occurrence of specified corporate events as defined in the convertible senior note agreement. On or after April 15, 2014, holders may convert each of their notes at their option at any time prior to the maturity date for the notes.
The Company has the choice of net-cash settlement, settlement in its own shares or a combination thereof and concluded the conversion option is indexed to its own stock. As a result, the Company allocated $24.7 million of the $172.5 million principal amount of the convertible senior notes to equity, which resulted in a $24.7 million debt discount. The allocation was based on measuring the fair value
114
NOTES TO CONSOLIDATED FINANCIAL STATEMENTS (Continued)
8. FINANCING ARRANGEMENTS (Continued)
of the convertible senior notes using a discounted cash flow analysis. The discount rate was based on an estimated credit rating for the Company. The estimated fair value of the convertible senior notes was $147.8 million, the resulting $24.7 million debt discount will be amortized over the period the convertible senior notes are expected to be outstanding, which is five years, as additional non-cash interest expense. The combined debt discount amortization and the contractual interest coupon resulted in an effective interest rate on the convertible debt of 8.9 percent.
The following table provides equity and debt information for the convertible senior notes:
|
(Dollars in thousands)
|
Convertible Senior Notes
Due 2014 June 30, 2010 |
|||
|---|---|---|---|---|
|
Principal amount on the convertible senior notes |
$ | 172,500 | ||
|
Unamortized debt discount |
(20,740 | ) | ||
|
Net carrying amount of convertible debt |
$ | 151,760 | ||
The following table provides interest rate and interest expense amounts related to the convertible senior notes:
|
(Dollars in thousands)
|
Convertible Senior Notes
Due 2014 Twelve Months Ended June 30, 2010 |
|||
|---|---|---|---|---|
|
Interest cost related to contractual interest coupon—5.0% |
$ | 8,266 | ||
|
Interest cost related to amortization of the discount |
3,956 | |||
|
Total interest cost |
$ | 12,222 | ||
In connection with the convertible senior note offering, the Company issued 13,225,000 shares of common stock resulting in net proceeds of $163.5 million.
Term Loan
During the three months ended December 31, 2008, the Company completed an $85.0 million term loan that matures in July 2012. As of June 30, 2010, the monthly interest payments are based on a one-month LIBOR plus 2.5 percent.
In July 2009 the Company amended its term loan. The amendment increased the Company's minimum net worth covenant from $675 million to $800 million, lowered the fixed charge coverage ratio from 1.5x to 1.3x, amended certain definitions, including EBITDA and fixed charges, and limits the Company's restricted payments (as defined in the agreement) to $20 million if the Company's leverage ratio is greater than 2.0x.
Revolving Credit Facility
The Company has an unsecured $300.0 million revolving credit facility with rates tied to LIBOR plus 225 basis points as of June 30, 2010. The revolving credit facility requires a quarterly facility fee on the average daily amount of the facility (whether used or unused) calculated at a rate of 25 basis points as of June 30, 2010. Both the LIBOR credit spread and the facility fee are based on the Company's debt to EBITDA ratio at the end of each fiscal quarter. The facility expires in July 2012.
115
NOTES TO CONSOLIDATED FINANCIAL STATEMENTS (Continued)
8. FINANCING ARRANGEMENTS (Continued)
On July 14, 2009, the Company amended its revolving credit agreement by reducing the borrowing capacity of the revolving credit facility from $350.0 million to $300.0 million. The amendment also increased the Company's minimum net worth covenant from $675 million to $800 million, lowering the fixed charge coverage ratio requirement from 1.5x to 1.3x, amending certain definitions, including EBITDA and fixed charges, and limiting the Company's restricted payments (as defined in the agreement) to $20 million if the Company's leverage ratio is greater than 2.0x.
The maturity date for the revolving credit facility may be accelerated upon the occurrence of various events of default, including breaches of the credit agreement, certain cross-default situations, certain bankruptcy related situations, and other customary events of default. The interest rates under the facility vary and are based on a bank's reference rate, the federal funds rate and/or LIBOR, as applicable, and a leverage ratio for the Company determined by a formula tied to the Company's debt and its adjusted income.
As of June 30, 2010 and 2009, the Company had outstanding borrowings under this facility of $0.0 and $5.0 million, respectively. As a result of the modification to the revolving credit agreement in July 2009 including changes to the financial covenants, the Company has classified the outstanding borrowings as of June 30, 2010 and 2009 as part of the long-term portion of the Company's long-term debt. Additionally, the Company had outstanding standby letters of credit under the facility of $24.6 and $28.0 million at June 30, 2010 and 2009, respectively, primarily related to its self-insurance program. Unused available credit under the facility at June 30, 2010 and 2009 was $275.4 and $317.0 million, respectively.
Equipment and Leasehold Notes Payable
The equipment and leasehold notes payable are primarily comprised of capital lease obligations which are payable in monthly installments through fiscal year 2015. The capital lease obligations are collateralized by the assets purchased under the agreement.
Other Notes Payable
The Company had $1.7 and $2.4 million in unsecured outstanding notes at June 30, 2010 and 2009, respectively, related to debt assumed in acquisitions. Additionally, within other notes payable are mortgage notes for $0.0 and $3.0 million at June 30, 2010 and 2009, respectively, related to the Company's distribution center in Salt Lake City, Utah. The note for the Salt Lake City distribution center was repaid during fiscal year 2010 and was secured by that distribution center.
9. DERIVATIVE FINANCIAL INSTRUMENTS
In January 2009, the Company adopted guidance for disclosures about derivative instruments and hedging activities in order to provide a reader of the financial statements an enhanced understanding of the Company's use of derivative instruments, how the Company accounts for its derivative instruments and the instruments' effects on financial position, financial performance and cash flows.
The Company's primary market risk exposures in the normal course of business are changes in interest rates and foreign currency exchange rates. The Company has established policies and procedures that govern the management of these exposures through the use of a variety of strategies, including the use of derivative financial instrument contracts. By policy, the Company does not enter into such contracts for the purpose of speculation or trading. Hedging transactions are limited to an
116
NOTES TO CONSOLIDATED FINANCIAL STATEMENTS (Continued)
9. DERIVATIVE FINANCIAL INSTRUMENTS (Continued)
underlying exposure. The Company has established an interest rate management policy that manages the interest rate mix of its total debt portfolio and related overall cost of borrowing. The Company's variable rate debt typically represents 35 to 45 percent of the total debt portfolio. The Company's foreign currency exchange rate risk management policy includes frequently monitoring market data and external factors that may influence exchange rate fluctuations in order to minimize fluctuation in earnings due to changes in exchange rates. The Company enters into arrangements with counterparties that the Company believes are creditworthy. Generally, derivative contract arrangements settle on a net basis. The Company assesses the effectiveness of its hedges on a quarterly basis using the critical terms method in accordance with guidance for accounting for derivative instruments and hedging activities.
The Company has primarily utilized derivatives which are designated as either cash flow or fair value hedges and qualify for hedge accounting treatment. For cash flow hedges and fair value hedges, changes in fair value are deferred in accumulated other comprehensive income (loss) within shareholders' equity until the underlying hedged item is recognized in earnings. Any hedge ineffectiveness is recognized immediately in current earnings. To the extent the changes offset, the hedge is effective. Any hedge ineffectiveness the Company has historically experienced has not been material. By policy, the Company designs its derivative instruments to be effective as hedges and aims to minimize fluctuations in earnings due to market risk exposures. If a derivative instrument is terminated prior to its contract date, the Company continues to defer the related gain or loss and recognizes it in current earnings over the remaining life of the related hedged item.
The Company also utilizes freestanding derivative contracts which do not qualify for hedge accounting treatment. The Company marks to market such derivatives with the resulting gains and losses recorded within current earnings in the Consolidated Statement of Operations. For purposes of the Consolidated Statement of Cash Flows, cash flows associated with all derivatives (designated as hedges or freestanding economic hedges) are classified in the same category as the related cash flows subject to the hedging relationship.
Cash Flow Hedges
The Company's cash flow hedges include interest rate swaps, forward foreign currency contracts and treasury lock agreements.
The Company uses interest rate swaps to maintain its variable to fixed rate debt ratio in accordance with its established policy. As of June 30, 2010, the Company had $85.0 million of total variable rate debt outstanding, of which $40.0 million was swapped to fixed rate debt, resulting in $45.0 million of variable rate debt. The interest rate swap contracts pay fixed rates of interest and receive variable rates of interest. The contracts and related debt have maturity dates during fiscal year 2012.
The Company repaid variable and fixed rate debt during the twelve months ended June 30, 2010. Prior to the repayments, the Company had two outstanding interest rate swaps totaling $50.0 million on $100.0 million aggregate variable rate debt with maturity dates between fiscal years 2013 and 2015. The interest rate swaps were terminated prior to the maturity dates in conjunction with the repayments of debt and were settled for an aggregate loss of $5.2 million. The $5.2 million loss recorded during the first quarter of fiscal year 2010 on the termination of the interest rate swaps was recorded within interest expense in the Consolidated Statement of Operations as described in Note 8 to the Consolidated Financial Statements. The Company also had two outstanding treasury lock agreements with maturity dates between fiscal years 2013 and 2015. The treasury lock agreements were terminated
117
NOTES TO CONSOLIDATED FINANCIAL STATEMENTS (Continued)
9. DERIVATIVE FINANCIAL INSTRUMENTS (Continued)
prior to the maturity dates in conjunction with the repayments of debt and were settled for a loss of less than $0.1 million during the twelve months ended June 30, 2010 and recorded within interest expense in the Consolidated Statement of Operations.
The Company uses forward foreign currency contracts to manage foreign currency rate fluctuations associated with certain forecasted intercompany transactions. The Company's primary forward foreign currency contracts hedge approximately $0.6 million of monthly payments in Canadian dollars for intercompany transactions. The Company's forward foreign currency contracts hedge transactions through fiscal year 2011.
These cash flow hedges were designed and are effective as cash flow hedges. They were recorded at fair value within other noncurrent liabilities or other current assets in the Consolidated Balance Sheet, with corresponding offsets primarily recorded in other comprehensive income (loss), net of tax.
Fair Value Hedges
In the past, the Company had two interest rate swaps designated as fair value hedges. The Company paid variable rates of interest and received fixed rates of interest under these contracts. The contracts and related debt matured during the twelve months ended June 30, 2009.
Freestanding Derivative Forward Contracts
The Company uses freestanding derivative forward contracts to offset the Company's exposure to the change in fair value of certain foreign currency denominated investments and intercompany assets and liabilities. These derivatives are not designated as hedges and therefore, changes in the fair value of these forward contracts are recognized currently in earnings, thereby offsetting the current earnings effect of the related foreign currency denominated assets and liabilities.
In November 2009, the Company terminated its freestanding derivative contract on its remaining payments on the MY Style Note and recorded a gain of $0.7 million. The contract was settled in cash, discounted to present value. Gains and losses were the life of the contract and are recognized currently in earnings in conjunction with marking the contract to fair value. A net loss of $0.2 million was recognized during fiscal year 2010. A net gain of $0.9 million was recognized during fiscal year 2009.
118
NOTES TO CONSOLIDATED FINANCIAL STATEMENTS (Continued)
9. DERIVATIVE FINANCIAL INSTRUMENTS (Continued)
The Company had the following derivative instruments in its Consolidated Balance Sheet as of June 30, 2010 and 2009:
|
|
Asset | Liability | |||||||||||||||
|---|---|---|---|---|---|---|---|---|---|---|---|---|---|---|---|---|---|
|
|
|
Fair Value |
|
Fair Value | |||||||||||||
|
Type
|
Classification |
June 30,
2010 |
June 30,
2009 |
Classification |
June 30,
2010 |
June 30,
2009 |
|||||||||||
|
|
|
(In thousands)
|
|
(In thousands)
|
|||||||||||||
|
Designated as hedging instruments—Cash Flow Hedges: |
|||||||||||||||||
|
Interest rate swaps |
— | $ | — | $ | — |
Other noncurrent
liabilities |
$ | (1,039 | ) | $ | (5,786 | ) | |||||
|
Forward foreign currency contracts |
Other current
assets |
$ | 274 | $ | 380 |
Other current
liabilities |
$ | — | $ | — | |||||||
|
Freestanding derivative contracts—not designated as hedging instruments: |
|||||||||||||||||
|
Forward foreign currency contracts |
Other current
assets |
$ | — | $ | 1,163 |
Other current
liabilities |
$ | (401 | ) | $ | (16 | ) | |||||
|
Total |
$ | 274 | $ | 1,543 | $ | (1,440 | ) | $ | (5,802 | ) | |||||||
The table below sets forth the (gain) or loss on the Company's derivative instruments as of June 30, 2010 and 2009 recorded within accumulated other comprehensive income (AOCI) in the Consolidated Balance Sheet. The table also sets forth the (gain) or loss on the Company's derivative instruments that has been reclassified from AOCI into current earnings during the years ended June 30, 2010 and 2009 within the following line items in the Consolidated Statement of Operations.
|
|
Other
Comprehensive Income (Gain)/Loss as of June 30, |
(Gain)/Loss Reclassified from
Accumulated OCI into Income (Loss) at June 30, |
|||||||||||||
|---|---|---|---|---|---|---|---|---|---|---|---|---|---|---|---|
|
Type
|
2010 | 2009 | Classification | 2010 | 2009 | ||||||||||
|
|
(In thousands)
|
|
(In thousands)
|
||||||||||||
|
Designated as hedging instruments—Cash Flow Hedges: |
|||||||||||||||
|
Interest rate swaps |
$ | 637 | $ | 3,605 | — | $ | — | $ | — | ||||||
|
Forward foreign currency contracts |
(133 | ) | (392 | ) | Cost of sales | (261 | ) | (142 | ) | ||||||
|
Treasury lock contracts |
— | (242 | ) | Interest income | — | (24 | ) | ||||||||
|
Total |
$ | 504 | $ | 2,971 | $ | (261 | ) | $ | (166 | ) | |||||
|
Designated as hedging instruments—Fair Value Hedges: |
|||||||||||||||
|
Cross-currency swap |
$ | 7,932 | $ | 7,932 | — | $ | — | $ | — | ||||||
|
Total |
$ | 8,436 | $ | 10,903 | $ | (261 | ) | $ | (166 | ) | |||||
119
NOTES TO CONSOLIDATED FINANCIAL STATEMENTS (Continued)
9. DERIVATIVE FINANCIAL INSTRUMENTS (Continued)
The table below sets forth the (gain) on the Company's derivative instruments for the years ended June 30, 2010 and 2009 recorded within interest income and other, net in the Consolidated Statement of Operations.
|
|
Derivatives Impact on
Income (Loss) at June 30, |
||||||||
|---|---|---|---|---|---|---|---|---|---|
|
Type
|
Classification | 2010 | 2009 | ||||||
|
|
|
(In thousands)
|
|||||||
|
Designated as hedging instruments—Fair Value Hedges: |
|||||||||
|
Fair value interest rate swap |
Interest income
and other, net |
$ | — | $ | (335 | ) | |||
|
Freestanding derivative contracts—not designated as hedging instruments: |
|||||||||
|
Forward foreign currency contracts |
Interest income
and other, net |
$ | (811 | ) | $ | (1,147 | ) | ||
|
|
$ | (811 | ) | $ | (1,482 | ) | |||
10. COMMITMENTS AND CONTINGENCIES:
Operating Leases:
The Company is committed under long-term operating leases for the rental of most of its company-owned salon and hair restoration center locations. The original terms of the leases range from one to 20 years, with many leases renewable for an additional five to ten year term at the option of the Company, and certain leases include escalation provisions. For certain leases, the Company is required to pay additional rent based on a percent of sales in excess of a predetermined amount and, in most cases, real estate taxes and other expenses. Rent expense for the Company's international department store salons is based primarily on a percent of sales.
The Company also leases the premises in which the majority of its franchisees operate and has entered into corresponding sublease arrangements with the franchisees. These leases, generally with terms of approximately five years, are expected to be renewed on expiration. All additional lease costs are passed through to the franchisees.
During fiscal year 2005, the Company entered into a lease agreement for a 102,448 square foot building, located in Edina, Minnesota. The Company began to recognize rent expense related to this property during the three months ended September 30, 2005, which was the date that it obtained the legal right to use and control the property. The original lease term ends in 2016 and the aggregate amount of lease payments to be made over the remaining original lease term are approximately $6.6 million. The lease agreement includes an option to purchase the property or extend the original term for two successive periods of five years.
Sublease income was $29.2, $29.9, and $30.3 million in fiscal years 2010, 2009 and 2008, respectively. Rent expense in the Consolidated Statement of Operations excludes $28.8, $29.5, and $29.9 million in fiscal years 2010, 2009 and 2008, respectively, of rent expense on premises subleased to franchisees. These amounts are netted against the related rental income on the sublease arrangements with franchisees. In most cases, the amount of rental income related to sublease arrangements with franchisees approximates the amount of rent expense from the primary lease, thereby having no net impact on rent expense or net income (loss). However, in limited cases, the Company charges a ten
120
NOTES TO CONSOLIDATED FINANCIAL STATEMENTS (Continued)
10. COMMITMENTS AND CONTINGENCIES: (Continued)
percent mark-up in its sublease arrangements. The net rental income resulting from such arrangements totaled $0.4 million for each fiscal year 2010, 2009 and 2008, and was classified in the royalties and fees caption of the Consolidated Statement of Operations.
Total rent expense, excluding rent expense on premises subleased to franchisees, includes the following:
|
|
2010 | 2009 | 2008 | |||||||
|---|---|---|---|---|---|---|---|---|---|---|
|
|
(Dollars in thousands)
|
|||||||||
|
Minimum rent |
$ | 259,984 | $ | 260,140 | $ | 270,988 | ||||
|
Percentage rent based on sales |
10,138 | 11,623 | 15,715 | |||||||
|
Real estate taxes and other expenses |
73,976 | 76,029 | 74,773 | |||||||
|
|
$ | 344,098 | $ | 347,792 | $ | 361,476 | ||||
As of June 30, 2010, future minimum lease payments (excluding percentage rents based on sales) due under existing noncancelable operating leases with remaining terms of greater than one year are as follows:
|
Fiscal year
|
Corporate
leases |
Franchisee
leases |
|||||
|---|---|---|---|---|---|---|---|
|
|
(Dollars in thousands)
|
||||||
|
2011 |
$ | 257,525 | $ | 44,340 | |||
|
2012 |
206,098 | 34,943 | |||||
|
2013 |
158,561 | 25,777 | |||||
|
2014 |
113,197 | 17,086 | |||||
|
2015 |
70,847 | 8,735 | |||||
|
Thereafter |
100,779 | 7,197 | |||||
|
Total minimum lease payments |
$ | 907,007 | $ | 138,078 | |||
Salon Development Program:
As a part of its salon development program, the Company continues to negotiate and enter into leases and commitments for the acquisition of equipment and leasehold improvements related to future salon locations, and continues to enter into transactions to acquire established hair care salons.
Contingencies:
The Company is self-insured for most workers' compensation, employment practice liability, and general liability. Workers' compensation and general liability losses are subject to per occurrence and aggregate annual liability limitations. The Company is insured for losses in excess of these limitations. The Company is also self-insured for health care claims for eligible participating employees subject to certain deductibles and limitations. The Company determines its liability for claims incurred but not reported on an actuarial basis.
In June 2009, the Company approved a plan to close up to 80 underperforming U.K. company-owned salons in fiscal year 2010. The Company believes the closure of these salons will add to future
121
NOTES TO CONSOLIDATED FINANCIAL STATEMENTS (Continued)
11. LEASE TERMINATION COSTS (Continued)
profitability. The Company recorded a write-off of salon assets in the fourth quarter of fiscal year 2009 of approximately $2.9 million related to the closures. The Company ceased using the right to use the leased property or negotiated a lease termination agreement with the lessor prior to June 30, 2010 and 2009 for 29 and seven U.K. company-owned salons, respectively. The June 2009 plan is substantially complete.
In July 2008, the Company approved a plan to close up to 160 underperforming company-owned salons in fiscal year 2009. Approximately 100 locations were regional mall based concepts, another 40 locations were strip center concepts and 20 locations were in the U.K. The timing of the closures was dependent on successfully completing lease termination agreements and was therefore subject to change. The Company offered employment to associates affected by such closings at nearby Regis-owned salons. The decision was a result of a comprehensive evaluation of the Company's salon portfolio, further continuing the Company's initiatives to enhance profitability. As lease settlements were negotiated the Company found that some lessors were willing to negotiate rent reductions which allowed the Company to keep operating certain stores. As a result, the number of stores closed was less than the 160 stores per the approved plan in July 2008. The July 2008 plan is substantially complete.
As of June 30, 2009, 69 stores under the July 2008 plan ceased using the right to use the leased property or negotiated a lease termination agreement with the lessor in which the Company will cease using the right to the leased property subsequent to June 30, 2009. Of the 69 stores, 63 stores were within the North America reportable segment, one store within the international segment, and five stores within discontinued operations. Lease termination costs from continuing operations are presented as a separate line item in the Consolidated Statement of Operations. Lease termination costs related to the Trade Secret salon concept are reported within discontinued operations.
During the twelve months ended June 30, 2010, an additional 42 stores under the July 2008 plan ceased using the right to use the leased property or negotiated a lease termination agreement with the lessor in which the Company will cease using the right to the leased property subsequent to June 30, 2010. The 42 stores were within the North America reportable segment.
Lease termination expense represents either the lease settlement or the net present value of remaining contractual lease payments related to closed stores, after reduction by estimated sublease rentals. The activity reflected in the accrual for lease termination costs is as follows:
|
|
For the Twelve
Months Ended June 30, |
||||||||
|---|---|---|---|---|---|---|---|---|---|
|
Accrual for Lease Terminations
|
2010 | 2009 | |||||||
|
|
(Dollars in thousands)
|
||||||||
|
Balance at July 1, |
$ | 2,760 | $ | — | |||||
|
Provision for lease termination costs: |
|||||||||
|
Provisions associated with store closings |
2,212 | 6,221 | |||||||
|
Change in assumptions about lease terminations and sublease income |
(67 | ) | — | ||||||
|
Cash payments |
(3,519 | ) | (3,461 | ) | |||||
|
Balance at June 30, |
$ | 1,386 | $ | 2,760 | |||||
122
NOTES TO CONSOLIDATED FINANCIAL STATEMENTS (Continued)
The Company is a defendant in various lawsuits and claims arising out of the normal course of business. Like certain other large retail employers, the Company has been faced with allegations of purported class-wide consumer and wage and hour violations. Litigation is inherently unpredictable and the outcome of these matters cannot presently be determined. Although the Company's counsel believes that the Company has valid defenses in these matters, it could in the future incur judgments or enter into settlements of claims that could have a material adverse effect on its results of operations in any particular period.
During fiscal year 2010, the Company recorded a $5.2 million charge related to the settlement of two legal claims regarding certain customer and employee matters. Additionally, the Company has commitment to provide discount coupons. As of June 30, 2010, there was a $4.3 million remaining liability recorded within accrued expenses related to the settlements.
The components of income before income taxes are as follows:
|
|
2010 | 2009 | 2008 | ||||||||
|---|---|---|---|---|---|---|---|---|---|---|---|
|
|
(Dollars in thousands)
|
||||||||||
|
Income before income taxes: |
|||||||||||
|
United States |
$ | 35,289 | $ | 112,524 | $ | 126,627 | |||||
|
International |
17,925 | (33,758 | ) | 10,607 | |||||||
|
|
$ | 53,214 | $ | 78,766 | $ | 137,234 | |||||
The provision for income taxes consists of:
|
|
2010 | 2009 | 2008 | ||||||||
|---|---|---|---|---|---|---|---|---|---|---|---|
|
|
(Dollars in thousands)
|
||||||||||
|
Current: |
|||||||||||
|
United States |
$ | 5,580 | $ | 48,935 | $ | 53,694 | |||||
|
International |
14,882 | (3,142 | ) | 4,262 | |||||||
|
Deferred: |
|||||||||||
|
United States |
4,007 | 568 | (4,674 | ) | |||||||
|
International |
1,108 | (4,411 | ) | 900 | |||||||
|
|
$ | 25,577 | $ | 41,950 | $ | 54,182 | |||||
123
NOTES TO CONSOLIDATED FINANCIAL STATEMENTS (Continued)
13. INCOME TAXES (Continued)
The provision for income taxes differs from the amount of income tax determined by applying the applicable United States (U.S.) statutory rate to earnings before income taxes, as a result of the following:
|
|
2010 | 2009 | 2008 | |||||||
|---|---|---|---|---|---|---|---|---|---|---|
|
U.S. statutory rate |
35.0 | % | 35.0 | % | 35.0 | % | ||||
|
State income taxes, net of federal income tax benefit |
3.4 | 3.4 | 3.0 | |||||||
|
Tax effect of goodwill impairment |
11.4 | 14.5 | — | |||||||
|
Foreign income taxes at other than U.S. rates |
(0.8 | ) | (1.6 | ) | (2.3 | ) | ||||
|
Work Opportunity and Welfare-to-Work Tax Credits |
(6.4 | ) | (4.9 | ) | (2.0 | ) | ||||
|
Adjustment of prior year income tax balances |
3.9 | 4.8 | — | |||||||
|
Other, net |
1.6 | 2.1 | 5.8 | |||||||
|
|
48.1 | % | 53.3 | % | 39.5 | % | ||||
During the fiscal year 2010, the Company recorded adjustments to correct its income tax balances. The adjustments increased the Company's fiscal year 2010 income tax provision by $2.1 million and increased its effective income tax rate by 3.9 percent. Included in the income tax provision are U.S. and international income tax adjustments resulting in a shift of the income tax provision between jurisdictions. On a world-wide basis the adjustments are immaterial. The Company does not believe the adjustments are material to its fiscal 2010 results of operations or its financial position or results of operations of any prior periods.
During the fourth quarter of fiscal year 2009, the Company recorded an adjustment to correct its prior year deferred income tax balances. The adjustment increased the Company's fiscal year 2009 income tax provision by $3.8 million and increased its effective income tax rate by 4.8 percent. The Company does not believe the adjustment is material to its fiscal 2009 results of operations or its financial position or results of operations of any prior periods.
124
NOTES TO CONSOLIDATED FINANCIAL STATEMENTS (Continued)
13. INCOME TAXES (Continued)
The components of the net deferred tax assets and liabilities are as follows:
|
|
2010 | 2009 | |||||
|---|---|---|---|---|---|---|---|
|
|
(Dollars in thousands)
|
||||||
|
Deferred tax assets: |
|||||||
|
Deferred rent |
$ | 15,677 | $ | 15,591 | |||
|
Payroll and payroll related costs |
34,294 | 32,712 | |||||
|
Net operating loss carryforwards |
2,106 | 2,078 | |||||
|
Salon asset impairment |
4,154 | 6,953 | |||||
|
Inventories |
3,136 | 4,478 | |||||
|
Derivatives |
311 | 1,798 | |||||
|
Deferred gift card revenue |
1.581 | 1,703 | |||||
|
Unrecognized tax benefits |
10,178 | 7,553 | |||||
|
Other |
12,357 | 10,851 | |||||
|
Total deferred tax assets |
$ | 83,794 | $ | 83,717 | |||
|
Deferred tax liabilities: |
|||||||
|
Depreciation |
$ | (17,603 | ) | $ | (17,454 | ) | |
|
Amortization of intangibles |
(107,392 | ) | (100,502 | ) | |||
|
Accrued property taxes |
(2,029 | ) | (2,001 | ) | |||
|
Deferred debt issuance costs |
(7,937 | ) | |||||
|
Other |
— | (11 | ) | ||||
|
Total deferred tax liabilities |
$ | (134,961 | ) | $ | (119,968 | ) | |
|
Net deferred tax liabilities |
$ | (51,167 | ) | $ | (36,251 | ) | |
At June 30, 2010, the Company had U.S. and foreign operating loss carryforwards of approximately $7.2 million relating to losses in Canada, the Netherlands, and the U.K. The Company has set up a valuation allowance of $1.0 million relating to the Netherlands tax losses. The Company expects to fully utilize all of the loss carryforwards from Canada and the United Kingdom.
As of June 30, 2010, undistributed earnings of international subsidiaries of approximately $23.8 million were considered to have been reinvested indefinitely and, accordingly, the Company has not provided for U.S. income taxes on such earnings.
The Company files tax returns and pays tax primarily in the United States, Canada, the U.K., and the Netherlands as well as states, cities, and provinces within these jurisdictions. In the United States, fiscal years 2007 and after remain open for federal tax audit. The Company has been notified that the United States federal income tax returns for year 2007 through 2009 have been selected for audit. For state tax audits, the statute of limitations generally spans three to four years, resulting in a number of states remaining open for tax audits dating back to fiscal year 2006. However, the company is under audit in a number of states in which the statute of limitations has been extended to fiscal years 2000 and forward. Internationally (including Canada), the statute of limitations for tax audits varies by jurisdiction, but generally ranges from three to five years.
The Company adopted the provisions of accounting for uncertainty in income taxes, effective July 1, 2007. Immediately prior to the adoption, the Company's tax reserves were $9.0 million. As a result of the adoption, the Company recognized a $20.7 million increase in the liability for
125
NOTES TO CONSOLIDATED FINANCIAL STATEMENTS (Continued)
13. INCOME TAXES (Continued)
unrecognized income tax benefits, including interest and penalties, which was accounted for through the following accounts:
|
|
(Dollars in thousands) | |||
|---|---|---|---|---|
|
Deferred income taxes |
$ | 10,128 | ||
|
Goodwill |
6,094 | |||
|
Additional paid-in capital |
237 | |||
|
Retained earnings |
4,237 | |||
|
Total increase |
$ | 20,696 | ||
A rollforward of the unrecognized tax benefits is as follows:
|
|
2010 | 2009 | 2008 | |||||||
|---|---|---|---|---|---|---|---|---|---|---|
|
Balance at beginning of period |
$ | 14,787 | $ | 20,400 | $ | 22,500 | ||||
|
Additions based on tax positions related to the current year |
5,549 | 2,765 | 2,466 | |||||||
|
Additions / (Reductions) based on tax positions of prior years |
(185 | ) | 121 | 1,498 | ||||||
|
Reductions on tax positions related to the expiration of the statue of limitations |
(2,993 | ) | (8,167 | ) | (5,446 | ) | ||||
|
Settlements |
(302 | ) | (332 | ) | (618 | ) | ||||
|
Balance at end of period |
$ | 16,856 | $ | 14,787 | $ | 20,400 | ||||
If the Company were to prevail on all unrecognized tax benefits recorded, approximately $8.2 million of the $16.9 million reserve would benefit the effective tax rate. Interest and penalties associated with unrecognized tax benefits are recorded within income tax expense. During the years ended June 30, 2010, 2009 and 2008 we recorded income tax (benefit)/expense of approximately $(1.1), $2.1 and $3.0 million, respectively, for the accrual of interest and penalties. As of June 30, 2010, the Company had accrued interest and penalties related to unrecognized tax benefits of $3.5 million. This amount is not included in the gross unrecognized tax benefits noted above.
It is reasonably possible that the amount of the unrecognized tax benefit with respect to certain of our unrecognized tax positions will increase or decrease during the next twelve months. However, we do not expect the change to have a significant effect on our results of operations or our financial position.
Regis Retirement Savings Plan
The Company maintains a defined contributed 401(k) plan, the Regis Retirement Savings Plan (the RRSP). The RRSP is a defined contribution profit sharing plan with a 401(k) feature that is intended to qualify with the Internal Revenue Code (Code) and is subject to the Employee Retirement Income Security Act of 1974.
The 401(k) portion of the Plan is a contributory defined contribution plan under which eligible employees may elect to contribute a percentage of their eligible compensation. Employees who are 18 years of age or older and who were not highly compensated employees as defined by the Code during the preceding Plan year are eligible to participate in the Plan commencing with the first day of the month following their completion of one month of service.
126
NOTES TO CONSOLIDATED FINANCIAL STATEMENTS (Continued)
14. BENEFIT PLANS (Continued)
The discretionary employer contribution profit sharing portion of the Plan is a noncontributory defined contribution component covering full-time and part-time employees of the Company who have at least one year of eligible service, 1,000 hours of service during the Plan year, are employed by the Employer on the last day of the Plan year and are employed at the home office or distribution centers, or as area or regional supervisors, artistic directors or educators, and that are not highly compensated employees as defined by the Code. Participants' interest in the noncontributory defined contribution component become 20.0 percent vested after completing two years of service with vesting increasing 20.0 percent for each additional year of service, and with participants becoming fully vested after six full years of service.
Nonqualified Deferred Salary Plan:
The Company maintains a Nonqualified Deferred Salary Plan (Executive Plan) with covers Company officers, field supervisors, warehouse and corporate office employees who are highly compensated. The discretionary employer contribution profit sharing portion of the Executive Plan is a noncontributory defined contribution component in which participants interest become 20.0 percent vested after completing two years of service with vesting increasing 20.0 percent for each additional year of service, and with participants becoming fully vested after six full years of service.
Stock Purchase Plan:
The Company has an employee stock purchase plan (ESPP) available to substantially all employees. Under the terms of the ESPP, eligible employees may purchase the Company's common stock through payroll deductions. The Company contributes an amount equal to 15.0 percent of the purchase price of the stock to be purchased on the open market and pays all expenses of the ESPP and its administration, not to exceed an aggregate contribution of $10.0 million. As of June 30, 2010, the Company's cumulative contributions to the ESPP totaled $8.0 million.
Franchise Stock Purchase Plan:
The Company has a franchise stock purchase plan (FSPP) available to substantially all franchisee employees. Under the terms of the plan, eligible franchisees and their employees may purchase the Company's common stock. The Company contributes an amount equal to five percent of the purchase price of the stock to be purchased on the open market and pays all expenses of the plan and its administration, not to exceed an aggregate contribution of $0.7 million. As of June 30, 2010, the Company's cumulative contributions to the FSPP totaled $0.2 million.
Deferred Compensation Contracts:
The Company has agreed to pay the Chief Executive Officer, commencing upon his retirement, an amount equal to 60.0 percent of his salary, adjusted for inflation, for the remainder of his life. Additionally, the Company has a survivor benefit plan payable upon his death at a rate of one half of his deferred compensation benefit, adjusted for inflation, for the remaining life of his spouse. In addition, the Company has other unfunded deferred compensation contracts covering key executives within the Company. The key executives' benefits are based on years of service and the employee's compensation prior to departure. The Company utilizes a June 30 measurement date for these deferred compensation contracts, a discount rate based on the Aa Bond index rate (5.4 and 6.20 percent at June 30, 2010 and 2009, respectively) and projected salary increases of 4.0 percent at June 30, 2010 and
127
NOTES TO CONSOLIDATED FINANCIAL STATEMENTS (Continued)
14. BENEFIT PLANS (Continued)
2009 to estimate the obligations associated with these deferred compensation contracts. Compensation associated with these agreements is charged to expense as services are provided. Associated costs included in general and administrative expenses on the Consolidated Statement of Operations totaled $5.2, $3.7, and $2.4 million for fiscal years 2010, 2009, and 2008, respectively. The accrued liability and projected benefit obligation of these deferred compensation contracts totaled $30.2 and $23.4 million at June 30, 2010 and 2009, respectively, in the Consolidated Balance Sheet. As of June 30, 2010 and 2009, $29.6 and $23.4 million is included in other noncurrent liabilities, respectively. As of June 30, 2010, $0.6 million of the balance is included in accrued liabilities. The tax-effected accumulated other comprehensive loss for the deferred compensation contracts, consisting of primarily unrecognized actuarial loss, was $1.9 and $0.6 million at June 30, 2010 and 2009, respectively. The amount included in accumulated other comprehensive loss expected to be recognized as a component of net periodic deferred compensation expense in fiscal year 2011 is approximately $0.2 million. The Company intends to fund its future obligations under these arrangements through company-owned life insurance policies on the participants. Cash values of these policies totaled $20.2 and $18.8 million at June 30, 2010 and 2009, respectively, and are included in other assets in the Consolidated Balance Sheet.
The Company has agreed to pay the former Vice Chairman an annual amount of $0.6 million, adjusted for inflation to $0.9 million in fiscal years 2010 and 2009, for the remainder of his life. The former Vice Chairman has agreed that during the period in which payments are made, as provided in the agreement, he will not engage in any business competitive with the business conducted by the Company. Additionally, the Company has a survivor benefit plan for the former Vice Chairman's spouse, payable upon his death, at a rate of one half of his deferred compensation benefit, adjusted for inflation, for the remaining life of his spouse. Estimated associated costs included in general and administrative expenses on the Consolidated Statement of Operations totaled $0.6, $0.8, and $0.7 million for each of fiscal years 2010, 2009, and 2008, respectively. Related obligations totaled $6.2 and $6.4 million at June 30, 2010 and 2009, respectively, and are included in other noncurrent liabilities in the Consolidated Balance Sheet. The Company intends to fund all future obligations under this agreement through company-owned life insurance policies on the former Vice Chairman. Cash values of these policies totaled $3.9 and $3.6 million at June 30, 2010 and 2009, respectively, and are included in other assets in the Consolidated Balance Sheet. The policy death benefits exceed the obligations under this agreement.
Compensation expense included in income before income taxes related to the aforementioned plans, excluding amounts paid for expenses and administration of the plans, for the three years ended June 30, 2010, 2009 and 2008, included the following:
|
|
2010 | 2009 | 2008 | |||||||
|---|---|---|---|---|---|---|---|---|---|---|
|
|
(Dollars in thousands)
|
|||||||||
|
Profit sharing plan |
$ | 3,206 | $ | 1,697 | $ | 3,373 | ||||
|
Executive Profit Sharing Plan |
654 | 303 | 497 | |||||||
|
ESPP |
484 | 634 | 711 | |||||||
|
FSPP |
8 | 12 | 18 | |||||||
|
Deferred compensation contracts |
5,814 | 4,479 | 3,122 | |||||||
128
NOTES TO CONSOLIDATED FINANCIAL STATEMENTS (Continued)
Net Income Per Share:
The Company's basic earnings per share is calculated as net income divided by weighted average common shares outstanding, excluding unvested outstanding RSAs and RSUs. The Company's dilutive earnings per share is calculated as net income divided by weighted average common shares and common share equivalents outstanding, which includes shares issuable under the Company's stock option plan and long-term incentive plan, shares issuable under contingent stock agreements, and dilutive securities. Stock-based awards with exercise prices greater than the average market value of the Company's common stock are excluded from the computation of diluted earnings per share. The Company's dilutive earnings per share will also reflect the assumed conversion under the Company's convertible debt if the impact is dilutive. The impact of the convertible debt is excluded from the computation of diluted earnings per share when interest expense per common share obtainable upon conversion is greater than basic earnings per share.
The following table sets forth a reconciliation of shares used in the computation of basic and diluted earnings per share:
|
|
2010 | 2009 | 2008 | ||||||||
|---|---|---|---|---|---|---|---|---|---|---|---|
|
|
(Shares in thousands)
|
||||||||||
|
Weighted average shares for basic earnings per share |
55,806 | 42,897 | 43,157 | ||||||||
|
Effect of dilutive securities: |
|||||||||||
|
Dilutive effect of convertible debt |
10,730 | — | — | ||||||||
|
Dilutive effect of stock-based compensation |
217 | 129 | 430 | ||||||||
|
Weighted average shares for diluted earnings per share |
66,753 | 43,026 | 43,587 | ||||||||
The following table sets forth the awards which are excluded from the various earnings per share calculations:
|
|
2010 | 2009 | 2008 | |||||||
|---|---|---|---|---|---|---|---|---|---|---|
|
|
(Shares in thousands)
|
|||||||||
|
Basic earnings per share: |
||||||||||
|
RSAs(1) |
931 | 817 | 308 | |||||||
|
RSUs(1) |
215 | 215 | 215 | |||||||
|
|
1,146 | 1,032 | 523 | |||||||
|
Diluted earnings per share: |
||||||||||
|
Stock options(2) |
960 | 899 | 517 | |||||||
|
SARs(2) |
1,110 | 613 | 416 | |||||||
|
RSAs(2) |
677 | 301 | 183 | |||||||
|
RSUs(2) |
— | 215 | 215 | |||||||
|
|
2,747 | 2,028 | 1,331 | |||||||
- (1)
-
Awards
were not vested
- (2)
- Awards were anti-dilutive
129
NOTES TO CONSOLIDATED FINANCIAL STATEMENTS (Continued)
15. SHAREHOLDERS' EQUITY (Continued)
The following table sets forth a reconciliation of the net income from continuing operations available to common shareholders and the net income from continuing operations for diluted earnings per share under the if-converted method:
|
|
2010 | 2009 | 2008 | ||||||||
|---|---|---|---|---|---|---|---|---|---|---|---|
|
|
(Dollars in thousands)
|
||||||||||
|
Net income from continuing operations available to common shareholders |
$ | 39,579 | $ | 6,970 | $ | 83,901 | |||||
|
Effect of dilutive securities: |
|||||||||||
|
Diluted effect of convertible debt |
7,520 | — | — | ||||||||
|
Net income from continuing operations for diluted earnings per share |
$ | 47,099 | $ | 6,970 | $ | 83,901 | |||||
Stock-based Compensation Award Plans:
In May of 2004, the Company's Board of Directors approved the 2004 Long Term Incentive Plan (2004 Plan). The 2004 Plan received shareholder approval at the annual shareholders' meeting held on October 28, 2004. The 2004 Plan provides for the granting of stock options, equity-based stock appreciation rights (SARs) and restricted stock, as well as cash-based performance grants, to employees and directors of the Company. On March 8, 2007, the Company's Board of Directors approved an amendment to the 2004 Plan to permit the granting and issuance of restricted stock units (RSUs). The 2004 Plan expires on May 26, 2014. A maximum of 2,500,000 shares of the Company's common stock are available for issuance pursuant to grants and awards made under the 2004 Plan. Stock options, SARs and restricted stock under the 2004 Plan generally vest pro rata over five years and have a maximum term of ten years. The cash-based performance grants will be tied to the achievement of certain performance goals during a specified performance period, not less than one fiscal year in length. The RSUs cliff vest after five years and payment of the RSUs is deferred until January 31 of the year following vesting. Unvested awards are subject to forfeiture in the event of termination of employment. See Note 1 to the Consolidated Financial Statements for discussion of the Company's measure of compensation cost for its incentive stock plans, as well as an estimate of future compensation expense related to these awards.
On October 24, 2000, the shareholders of Regis Corporation adopted the Regis Corporation 2000 Stock Option Plan (2000 Plan), which allows the Company to grant both incentive and nonqualified stock options and replaced the Company's 1991 Stock Option Plan (1991 Plan). Total options covering 3,500,000 shares of common stock may be granted under the 2000 Plan to employees of the Company for a term not to exceed ten years from the date of grant. The term may not exceed five years for incentive stock options granted to employees of the Company possessing more than ten percent of the total combined voting power of all classes of stock of the Company or any subsidiary of the Company. Options may also be granted to the Company's outside directors for a term not to exceed ten years from the grant date. The 2000 Plan contains restrictions on transferability, time of exercise, exercise price and on disposition of any shares acquired through exercise of the options. Stock options are granted at not less than fair market value on the date of grant. The Board of Directors determines the 2000 Plan participants and establishes the terms and conditions of each option.
The Company also has outstanding stock options under the 1991 Plan, although the Plan terminated in 2001. The terms and conditions of the 1991 Plan are similar to the 2000 Plan. Total
130
NOTES TO CONSOLIDATED FINANCIAL STATEMENTS (Continued)
15. SHAREHOLDERS' EQUITY (Continued)
options covering 5,200,000 shares of common stock were available for grant under the 1991 Plan and, as of June 30, 2001, all available shares were granted.
Common shares available for grant under the following plans as of June 30 were:
|
|
2010 | 2009 | 2008 | |||||||
|---|---|---|---|---|---|---|---|---|---|---|
|
|
(Shares in thousands)
|
|||||||||
|
2000 Plan |
4 | 268 | 232 | |||||||
|
2004 Plan |
12 | 103 | 1,220 | |||||||
|
|
16 | 371 | 1,452 | |||||||
Stock options outstanding and weighted average exercise prices were as follows:
|
|
Options Outstanding | ||||||
|---|---|---|---|---|---|---|---|
|
|
Shares |
Weighted
Average Exercise Price |
|||||
|
|
(in thousands)
|
|
|||||
|
Balance, June 30, 2007 |
2,193 | $ | 22.97 | ||||
|
Granted |
143 | 28.57 | |||||
|
Cancelled |
(97 | ) | 34.17 | ||||
|
Exercised |
(526 | ) | 16.91 | ||||
|
Balance, June 30, 2008 |
1,713 | 24.55 | |||||
|
Granted |
9 | 35.15 | |||||
|
Cancelled |
(102 | ) | 30.20 | ||||
|
Exercised |
(235 | ) | 16.60 | ||||
|
Balance, June 30, 2009 |
1,385 | 25.55 | |||||
|
Granted |
135 | 18.90 | |||||
|
Cancelled |
(337 | ) | 17.74 | ||||
|
Exercised |
(203 | ) | 15.12 | ||||
|
Balance, June 30, 2010 |
980 | $ | 29.48 | ||||
|
Exercisable June 30, 2010 |
703 | $ | 30.83 | ||||
Outstanding options of 979,821 at June 30, 2010 had an intrinsic value (the amount by which the stock price exceeded the exercise or grant date price) of less than $0.1 million and a weighted average remaining contractual term of 5.2 years. Exercisable options of 702,571 at June 30, 2010 had an intrinsic value of less than $0.1 million and a weighted average remaining contractual term of 3.9 years. An additional 252,560 options are expected to vest with a $26.44 per share weighted average exercise price and a weighted average remaining contractual life of 8.4 years that have a total intrinsic value of zero.
All options granted relate to stock option plans that have been approved by the shareholders of the Company. Stock options granted in fiscal year 2010 were granted under the 2000 and 2004 plan. Stock options granted in fiscal years 2009 and 2008 were granted under the 2004 Plan.
131
NOTES TO CONSOLIDATED FINANCIAL STATEMENTS (Continued)
15. SHAREHOLDERS' EQUITY (Continued)
A rollforward of RSAs, RSUs and SARs outstanding, as well as other relevant terms of the awards, were as follows:
|
|
Nonvested | SARs Outstanding | |||||||||||
|---|---|---|---|---|---|---|---|---|---|---|---|---|---|
|
|
Restricted
Stock Outstanding Shares/Units |
Weighted
Average Grant Date Fair Value |
Shares |
Weighted
Average Exercise Price |
|||||||||
|
|
(in thousands)
|
|
(in thousands)
|
|
|||||||||
|
Balance, June 30, 2007 |
474 | $ | 38.36 | 400 | $ | 37.53 | |||||||
|
Granted |
125 | 28.57 | 138 | 28.57 | |||||||||
|
Cancelled |
(10 | ) | 37.71 | (11 | ) | 38.53 | |||||||
|
Vested/Exercised |
(66 | ) | 38.05 | — | — | ||||||||
|
Balance, June 30, 2008 |
523 | 36.76 | 527 | 35.70 | |||||||||
|
Granted |
618 | 19.14 | 632 | 19.14 | |||||||||
|
Cancelled |
(28 | ) | 35.41 | (45 | ) | 35.73 | |||||||
|
Vested/Exercised |
(81 | ) | 35.72 | — | — | ||||||||
|
Balance, June 30, 2009 |
1,032 | 26.33 | 1,114 | 26.30 | |||||||||
|
Granted |
304 | 19.12 | 2 | 28.57 | |||||||||
|
Cancelled |
(2 | ) | 20.02 | (6 | ) | 38.63 | |||||||
|
Vested/Exercised |
(188 | ) | 24.74 | — | — | ||||||||
|
Balance, June 30, 2010 |
1,146 | $ | 24.70 | 1,110 | $ | 26.24 | |||||||
Outstanding and unvested RSAs of 931,348 at June 30, 2010 had an intrinsic value of $14.5 million and a weighted average remaining contractual term of 2.4 years. Due to forfeitures, 880,373 awards are expected to vest with a total intrinsic value of $13.7 million.
Outstanding and unvested RSUs of 215,000 at June 30, 2010 had an intrinsic value of $3.3 million and a weighted average remaining contractual term of 1.7 years. All unvested RSUs are expected to vest in fiscal year 2012.
Outstanding SARs of 1,110,100 at June 30, 2010 had a total intrinsic value of zero and a weighted average remaining contractual term of 7.7 years. Exercisable SARs of 465,420 at June 30, 2010 had a total intrinsic value of zero and a weighted average contractual term of 6.5 years. An additional 617,796 SARs are expected to vest with a $22.00 per share weighted average grant price, a weighted average remaining contractual life of 8.5 years and a total intrinsic value of zero.
Total cash received from the exercise of share-based instruments in fiscal years 2010 and 2009 was $3.1 and $3.9 million, respectively.
As of June 30, 2010, the total unrecognized compensation cost related to all unvested stock-based compensation arrangements was $28.4 million. The related weighted average period over which such cost is expected to be recognized was approximately 3.5 years as of June 30, 2010.
The total intrinsic value of all stock-based compensation that was exercised during fiscal years 2010, 2009 and 2008 was $0.7, $1.9, and $7.3 million, respectively.
132
NOTES TO CONSOLIDATED FINANCIAL STATEMENTS (Continued)
15. SHAREHOLDERS' EQUITY (Continued)
Using the fair value of each grant on the date of grant, the weighted average fair values per stock-based compensation award granted during fiscal years 2010, 2009 and 2008 were as follows:
|
|
2010 | 2009 | 2008 | |||||||
|---|---|---|---|---|---|---|---|---|---|---|
|
Stock options |
$ | 7.36 | $ | 8.60 | $ | 8.60 | ||||
|
SARs |
8.60 | 7.07 | 8.60 | |||||||
|
Restricted stock awards |
19.12 | 19.14 | 28.57 | |||||||
|
Restricted stock units |
— | — | — | |||||||
The expense associated with the RSA and RSU grants is based on the market price of the Company's stock at the date of grant. The significant assumptions used in determining the underlying fair value on the date of grant of each stock option and SAR grant issued during the fiscal years 2010, 2009 and 2008 is presented below:
|
|
2010 | 2009 | 2008 | ||||||
|---|---|---|---|---|---|---|---|---|---|
|
Risk-free interest rate |
2.79 | % | 2.45 - 3.29% | 3.29 | % | ||||
|
Expected term (in years) |
5.50 | 5.50 | 5.50 | ||||||
|
Expected volatility |
42.00 | % | 28.00 - 40.00% | 28.00 | % | ||||
|
Expected dividend yield |
0.85 | % | 0.56 - 0.84% | 0.56 | % | ||||
The risk free rate of return is determined based on the U.S. Treasury rates approximating the expected life of the options and SARs granted. Expected volatility is established based on historical volatility of the Company's stock price. Estimated expected life was based on an analysis of historical stock options granted data which included analyzing grant activity including grants exercised, expired, and canceled. The expected dividend yield is determined based on the Company's annual dividend amount as a percentage of the strike price at the time of the grant. The Company uses historical data to estimate pre-vesting forfeiture rates.
Compensation expense included in income before income taxes related to stock- based compensation was $9.3, $7.5, and $6.8 million for the three years ended June 30, 2010, 2009, and 2008, respectively.
Authorized Shares and Designation of Preferred Class:
The Company has 100 million shares of capital stock authorized, par value $0.05, of which all outstanding shares, and shares available under the Stock Option Plans, have been designated as common.
In addition, 250,000 shares of authorized capital stock have been designated as Series A Junior Participating Preferred Stock (preferred stock). None of the preferred stock has been issued.
Shareholders' Rights Plan:
The Company has a shareholders' rights plan pursuant to which one preferred share purchase right is held by shareholders for each outstanding share of common stock. The rights become exercisable only following the acquisition by a person or group, without the prior consent of the Board of Directors, of 15.0 percent or more of the Company's voting stock, or following the announcement of a tender offer or exchange offer to acquire an interest of 15.0 percent or more. If the rights become exercisable, they entitle all holders, except the takeover bidder, to purchase one one-thousandth of a
133
NOTES TO CONSOLIDATED FINANCIAL STATEMENTS (Continued)
15. SHAREHOLDERS' EQUITY (Continued)
share of preferred stock at an exercise price of $140, subject to adjustment, or in lieu of purchasing the preferred stock, to purchase for the same exercise price common stock of the Company (or in certain cases common stock of an acquiring company) having a market value of twice the exercise price of a right.
Share Repurchase Program:
In May 2000, the Company's Board of Directors (BOD) approved a stock repurchase program. Originally, the program authorized up to $50.0 million to be expended for the repurchase of the Company's stock. The BOD elected to increase this maximum to $100.0 million in August 2003, to $200.0 million on May 3, 2005, and to $300.0 million on April 26, 2007. The timing and amounts of any repurchases will depend on many factors, including the market price of the common stock and overall market conditions. Historically, the repurchases to date have been made primarily to eliminate the dilutive effect of shares issued in conjunction with acquisitions, restricted stock grants and stock option exercises. All repurchased shares become authorized but unissued shares of the Company. This repurchase program has no stated expiration date. As of June 30, 2010, 2009, and 2008, a total accumulated 6.8 million shares have been repurchased for $226.5 million. As of June 30, 2010, $73.5 million remains to be spent on share repurchases under this program.
As of June 30, 2010, the Company owned, franchised or held ownership interests in over 12,700 worldwide locations. The Company's locations consisted of 9,525 North American salons (located in the United States, Canada and Puerto Rico), 404 international salons, 95 hair restoration centers, and 2,704 locations in which the Company maintains an ownership interest through its investments in affiliates.
The Company operates its North American salon operations through five primary concepts: Regis Salons, MasterCuts, SmartStyle, Supercuts and Promenade salons. The concepts offer similar products and services, concentrate on the mass market consumer marketplace and have consistent distribution channels. All of the company-owned and franchise salons within the North American salon concepts are located in high traffic, retail shopping locations that attract mass market consumers, and the individual salons display similar long-term economic characteristics. The salons share interdependencies and a common support base.
The Company operates its international salon operations, primarily in the United Kingdom, through three primary concepts: Regis, Supercuts, and Sassoon salons. Consistent with the North American concepts, the international concepts offer similar products and services, concentrate on the mass market consumer marketplace and have consistent distribution channels. All of the international salon concepts are company-owned and are located in malls, leading department stores, and high-street locations. Individual salons display similar long-term economic characteristics. The salons share interdependencies and a common support base.
The Company's company-owned and franchise hair restoration centers are located in the United States and Canada. The Company's hair restoration centers offer three hair restoration solutions; hair systems, hair transplants, and hair therapy, which are targeted at the mass market consumer. Hair restoration centers are located primarily in office and professional buildings within larger metropolitan areas.
134
NOTES TO CONSOLIDATED FINANCIAL STATEMENTS (Continued)
16. SEGMENT INFORMATION (Continued)
Based on the way the Company manages its business, it has reported its North American salons, international salons, and hair restoration centers as three separate reportable segments.
The accounting policies of the reportable operating segments are the same as those described in Note 1 to the Consolidated Financial Statements. Corporate assets detailed below are primarily comprised of property and equipment associated with the Company's headquarters and distribution centers, corporate cash, inventories located at corporate distribution centers, deferred income taxes, franchise receivables and other corporate assets. Intersegment sales and transfers are not significant. Summarized financial information concerning the Company's reportable operating segments is shown in the following table as of June 30, 2010, 2009, and 2008:
|
|
For the Year Ended June 30, 2010 | ||||||||||||||||
|---|---|---|---|---|---|---|---|---|---|---|---|---|---|---|---|---|---|
|
|
Salons |
|
|
|
|||||||||||||
|
|
Hair
Restoration Centers |
Unallocated
Corporate |
|
||||||||||||||
|
|
North America | International | Consolidated | ||||||||||||||
|
|
(Dollars in thousands)
|
||||||||||||||||
|
Revenues: |
|||||||||||||||||
|
Service |
$ | 1,605,979 | $ | 111,833 | $ | 66,325 | $ | — | $ | 1,784,137 | |||||||
|
Product |
417,363 | 44,252 | 72,978 | — | 534,593 | ||||||||||||
|
Royalties and fees |
37,221 | — | 2,483 | — | 39,704 | ||||||||||||
|
|
2,060,563 | 156,085 | 141,786 | — | 2,358,434 | ||||||||||||
|
Operating expenses: |
|||||||||||||||||
|
Cost of service |
920,905 | 57,657 | 37,158 | — | 1,015,720 | ||||||||||||
|
Cost of product |
219,745 | 22,570 | 21,568 | — | 263,883 | ||||||||||||
|
Site operating expenses |
183,881 | 10,152 | 5,305 | — | 199,338 | ||||||||||||
|
General and administrative |
113,956 | 13,115 | 36,207 | 128,713 | 291,991 | ||||||||||||
|
Rent |
294,263 | 38,681 | 9,013 | 2,141 | 344,098 | ||||||||||||
|
Depreciation and amortization |
72,681 | 4,986 | 12,198 | 18,899 | 108,764 | ||||||||||||
|
Goodwill impairment |
35,277 | — | — | — | 35,277 | ||||||||||||
|
Lease termination costs |
— | 2,145 | — | — | 2,145 | ||||||||||||
|
Total operating expenses |
1,840,708 | 149,306 | 121,449 | 149,753 | 2,261,216 | ||||||||||||
|
Operating income (loss) |
219,855 | 6,779 | 20,337 | (149,753 | ) | 97,218 | |||||||||||
|
Other income (expense): |
|||||||||||||||||
|
Interest expense |
— | — | — | (54,414 | ) | (54,414 | ) | ||||||||||
|
Interest income and other, net |
— | — | — | 10,410 | 10,410 | ||||||||||||
|
Income (loss) from continuing operations before income taxes and equity in income (loss) of affiliated companies |
$ | 219,855 | $ | 6,779 | $ | 20,337 | $ | (193,757 | ) | $ | 53,214 | ||||||
|
Total assets |
$ | 992,410 | $ | 74,633 | $ | 284,615 | $ | 567,914 | $ | 1,919,572 | |||||||
|
Long-lived assets |
262,575 | 15,654 | 17,484 | 63,537 | 359,250 | ||||||||||||
|
Capital expenditures |
40,393 | 1,764 | 3,658 | 12,006 | 57,821 | ||||||||||||
|
Purchases of salon assets |
3,664 | — | — | — | 3,664 | ||||||||||||
135
NOTES TO CONSOLIDATED FINANCIAL STATEMENTS (Continued)
16. SEGMENT INFORMATION (Continued)
|
|
For the Year Ended June 30, 2009(1) | ||||||||||||||||
|---|---|---|---|---|---|---|---|---|---|---|---|---|---|---|---|---|---|
|
|
Salons |
|
|
|
|||||||||||||
|
|
Hair
Restoration Centers |
Unallocated
Corporate |
|
||||||||||||||
|
|
North America | International | Consolidated | ||||||||||||||
|
|
(Dollars in thousands)
|
||||||||||||||||
|
Revenues: |
|||||||||||||||||
|
Service |
$ | 1,646,239 | $ | 122,664 | $ | 65,055 | $ | — | $ | 1,833,958 | |||||||
|
Product |
434,340 | 48,905 | 72,960 | — | 556,205 | ||||||||||||
|
Royalties and fees |
37,119 | — | 2,505 | — | 39,624 | ||||||||||||
|
|
2,117,698 | 171,569 | 140,520 | — | 2,429,787 | ||||||||||||
|
Operating expenses: |
|||||||||||||||||
|
Cost of service |
944,782 | 64,326 | 35,611 | — | 1,044,719 | ||||||||||||
|
Cost of product |
235,520 | 25,855 | 21,663 | — | 283,038 | ||||||||||||
|
Site operating expenses |
173,457 | 11,762 | 5,237 | — | 190,456 | ||||||||||||
|
General and administrative |
117,673 | 15,720 | 33,924 | 124,344 | 291,661 | ||||||||||||
|
Rent |
292,253 | 44,492 | 8,887 | 2,160 | 347,792 | ||||||||||||
|
Depreciation and amortization |
73,395 | 12,492 | 11,327 | 18,441 | 115,655 | ||||||||||||
|
Goodwill impairment |
— | 41,661 | — | — | 41,661 | ||||||||||||
|
Lease termination costs |
4,990 | 742 | — | — | 5,732 | ||||||||||||
|
Total operating expenses |
1,842,070 | 217,050 | 116,649 | 144,945 | 2,320,714 | ||||||||||||
|
Operating income (loss) |
275,628 | (45,481 | ) | 23,871 | (144,945 | ) | 109,073 | ||||||||||
|
Other income (expense): |
|||||||||||||||||
|
Interest expense |
— | — | — | (39,768 | ) | (39,768 | ) | ||||||||||
|
Interest income and other, net |
— | — | — | 9,461 | 9,461 | ||||||||||||
|
Income (loss) from continuing operations before income taxes and equity in (loss) income of affiliated companies |
$ | 275,628 | $ | (45,481 | ) | $ | 23,871 | $ | (175,252 | ) | $ | 78,766 | |||||
|
Total assets |
$ | 966,596 | $ | 49,779 | $ | 293,017 | $ | 583,094 | $ | 1,892,486 | |||||||
|
Long-lived assets |
281,504 | 20,314 | 18,234 | 71,486 | 391,538 | ||||||||||||
|
Capital expenditures |
49,355 | 3,081 | 9,858 | 11,280 | 73,574 | ||||||||||||
|
Purchases of salon assets |
39,215 | 22 | 889 | — | 40,126 | ||||||||||||
- (1)
- Beginning with the period ended December 31, 2008, the operations of Trade Secret concept within the North American reportable segment were accounted for as discontinued operations. All comparable periods will reflect Trade Secret as discontinued operations. See further discussion at Note 2 to the Consolidated Financial Statements.
136
NOTES TO CONSOLIDATED FINANCIAL STATEMENTS (Continued)
16. SEGMENT INFORMATION (Continued)
|
|
For the Year Ended June 30, 2008(1)(2) | ||||||||||||||||
|---|---|---|---|---|---|---|---|---|---|---|---|---|---|---|---|---|---|
|
|
Salons |
|
|
|
|||||||||||||
|
|
Hair
Restoration Centers |
Unallocated
Corporate |
|
||||||||||||||
|
|
North America | International | Consolidated | ||||||||||||||
|
|
(Dollars in thousands)
|
||||||||||||||||
|
Revenues: |
|||||||||||||||||
|
Service |
$ | 1,635,238 | $ | 165,379 | $ | 61,873 | $ | — | $ | 1,862,490 | |||||||
|
Product |
414,909 | 67,078 | 69,299 | — | 551,286 | ||||||||||||
|
Royalties and fees |
39,599 | 23,606 | 4,410 | — | 67,615 | ||||||||||||
|
|
2,089,746 | 256,063 | 135,582 | — | 2,481,391 | ||||||||||||
|
Operating expenses: |
|||||||||||||||||
|
Cost of service |
939,242 | 89,617 | 33,700 | — | 1,062,559 | ||||||||||||
|
Cost of product |
208,705 | 35,702 | 19,984 | — | 264,391 | ||||||||||||
|
Site operating expenses |
165,185 | 14,410 | 5,174 | — | 184,769 | ||||||||||||
|
General and administrative |
121,345 | 37,143 | 30,941 | 132,134 | 321,563 | ||||||||||||
|
Rent |
295,659 | 56,571 | 7,313 | 1,933 | 361,476 | ||||||||||||
|
Depreciation and amortization |
73,755 | 10,969 | 10,289 | 18,280 | 113,293 | ||||||||||||
|
Total operating expenses |
1,803,891 | 244,412 | 107,401 | 152,347 | 2,308,051 | ||||||||||||
|
Operating income (loss) |
285,855 | 11,651 | 28,181 | (152,347 | ) | 173,340 | |||||||||||
|
Other income (expense): |
|||||||||||||||||
|
Interest expense |
— | — | — | (44,279 | ) | (44,279 | ) | ||||||||||
|
Interest income and other, net |
— | — | — | 8,173 | 8,173 | ||||||||||||
|
Income (loss) from continuing operations before income taxes and equity in income (loss) of affiliated companies |
$ | 285,855 | $ | 11,651 | $ | 28,181 | $ | (188,453 | ) | $ | 137,234 | ||||||
|
Total assets |
$ | 1,249,827 | $ | 120,443 | $ | 284,898 | $ | 580,703 | $ | 2,235,871 | |||||||
|
Long-lived assets |
355,287 | 35,902 | 11,616 | 79,046 | 481,851 | ||||||||||||
|
Capital expenditures |
51,057 | 10,624 | 4,191 | 19,927 | 85,799 | ||||||||||||
|
Purchases of salon assets |
119,822 | 6,719 | 19,036 | — | 145,577 | ||||||||||||
- (1)
-
On
August 1, 2007, the Company contributed its accredited cosmetology schools to Empire Education Group, Inc. For the year ended
June 30, 2008, the results of operations for the month ended July 31, 2007 for the accredited cosmetology schools are reported in the North American salons segment. The Company retained
ownership of its one North American and four United Kingdom Sassoon schools. Subsequent to August 1, 2007 results of operations for the Sassoon schools are included in their respective North
American and international salon segments.
On January 31, 2008, the Company merged its continental European franchise salon operations with the Franck Provost Salon Group. For the year ended June 30, 2008 the results of operations for the seven months ended January 31, 2008 are reported in the international salon segment.
- (2)
- Beginning with the period ended December 31, 2008, the operations of Trade Secret concept within the North American reportable segment were accounted for as discontinued operations. All comparable periods will reflect Trade Secret as discontinued operations. See further discussion at Note 2 to the Consolidated Financial Statements.
137
NOTES TO CONSOLIDATED FINANCIAL STATEMENTS (Continued)
16. SEGMENT INFORMATION (Continued)
Total revenues and long-lived assets associated with business operations in the United States and all other countries in aggregate were as follows:
|
|
Year Ended June 30, | ||||||||||||||||||
|---|---|---|---|---|---|---|---|---|---|---|---|---|---|---|---|---|---|---|---|
|
|
2010 | 2009 | 2008 | ||||||||||||||||
|
|
Total
Revenues |
Long-lived
Assets |
Total
Revenues |
Long-lived
Assets |
Total
Revenues |
Long-lived
Assets |
|||||||||||||
|
|
(Dollars in thousands)
|
||||||||||||||||||
|
United States |
$ | 2,055,059 | $ | 327,753 | $ | 2,121,531 | $ | 355,330 | $ | 2,080,178 | $ | 425,131 | |||||||
|
Other countries |
303,375 | 31,497 | 308,256 | 36,208 | 401,213 | 56,720 | |||||||||||||
|
Total |
$ | 2,358,434 | $ | 359,250 | $ | 2,429,787 | $ | 391,538 | $ | 2,481,391 | $ | 481,851 | |||||||
On August 4, 2010, the Company announced the Board of Directors authorized the exploration of strategic alternatives to enhance shareholder value. The Company retained Peter J. Solomon Company, L.P. as its financial advisor and Faegre & Benson LLP and Wachtell, Lipton, Rosen & Katz as its legal advisors. There can be no assurance that the review of strategic alternatives will result in any agreement or transaction. The Company does not intend to disclose developments with respect to this review unless and until the Board of Directors has approved a specific course of action.
138
NOTES TO CONSOLIDATED FINANCIAL STATEMENTS (Continued)
QUARTERLY FINANCIAL DATA
(Unaudited)
|
|
Quarter Ended |
|
||||||||||||||
|---|---|---|---|---|---|---|---|---|---|---|---|---|---|---|---|---|
|
|
Year
Ended |
|||||||||||||||
|
|
September 30 | December 31 | March 31 | June 30 | ||||||||||||
|
|
(Dollars in thousands, except per share amounts)
|
|||||||||||||||
|
2010 |
||||||||||||||||
|
Revenues |
$ | 605,550 | $ | 575,365 | $ | 587,571 | $ | 589,948 | $ | 2,358,434 | ||||||
|
Gross margin, excluding depreciation |
259,967 | 254,564 | 260,199 | 264,397 | 1,039,127 | |||||||||||
|
Operating income (loss)(a)(b)(c) |
28,257 | 32,063 | 1,184 | 35,714 | 97,218 | |||||||||||
|
Income (loss) from continuing operations(a)(b)(c)(d) |
4,611 | 18,154 | (1,525 | ) | 18,339 | 39,579 | ||||||||||
|
Income from discontinued operations(e) |
3,161 | — | — | — | 3,161 | |||||||||||
|
Net income (loss)(a)(b)(c)(d)(e) |
7,772 | 18,154 | (1,525 | ) | 18,339 | 42,740 | ||||||||||
|
Income (loss) from continuing operations per share, basic |
0.09 | 0.32 | (0.03 | ) | 0.32 | 0.71 | ||||||||||
|
Income (loss) from discontinued operations per share, basic(e) |
0.06 | 0.00 | 0.00 | 0.00 | 0.06 | |||||||||||
|
Net income (loss) per basic share(f) |
0.14 | 0.32 | (0.03 | ) | 0.32 | 0.77 | ||||||||||
|
Income (loss) from continuing operations per share, diluted |
0.09 | 0.30 | (0.03 | ) | 0.30 | 0.71 | ||||||||||
|
Income (loss) from discontinued operations per share, diluted(e) |
0.06 | 0.00 | 0.00 | 0.00 | 0.05 | |||||||||||
|
Net income (loss) per diluted share(f) |
0.14 | 0.30 | (0.03 | ) | 0.30 | 0.75 | ||||||||||
|
Dividends declared per share |
0.04 | 0.04 | 0.04 | 0.04 | 0.16 | |||||||||||
Refer to Management's Discussion and Analysis of Financial Condition and Results of Operations in Part II, Item 6 in this Form 10-K for explanations of items which impacted fiscal year 2010 revenues, operating and net income.
|
|
Quarter Ended |
|
||||||||||||||
|---|---|---|---|---|---|---|---|---|---|---|---|---|---|---|---|---|
|
|
Year
Ended |
|||||||||||||||
|
|
September 30 | December 31 | March 31 | June 30 | ||||||||||||
|
|
(Dollars in thousands, except per share amounts)
|
|||||||||||||||
|
2009 |
||||||||||||||||
|
Revenues |
$ | 613,529 | $ | 587,426 | $ | 604,086 | $ | 624,746 | $ | 2,429,787 | ||||||
|
Gross margin, excluding depreciation |
270,522 | 255,936 | 260,788 | 275,160 | 1,062,406 | |||||||||||
|
Operating income (loss)(a)(b)(c) |
34,037 | (6,649 | ) | 37,072 | 44,613 | 109,073 | ||||||||||
|
Income (loss) from continuing operations(a)(b)(c)(d) |
16,086 | (25,786 | ) | 21,025 | (4,355 | ) | 6,970 | |||||||||
|
Loss from discontinued operations(e) |
(1,600 | ) | (117,466 | ) | (12,171 | ) | (199 | ) | (131,436 | ) | ||||||
|
Net income (loss)(a)(b)(c)(d)(e) |
14,486 | (143,252 | ) | 8,854 | (4,554 | ) | (124,466 | ) | ||||||||
|
Income (loss) from continuing operations per share, basic |
0.38 | (0.60 | ) | 0.49 | (0.10 | ) | 0.16 | |||||||||
|
Loss from discontinued operations per share, basic(e) |
(0.04 | ) | (2.74 | ) | (0.28 | ) | (0.00 | ) | (3.06 | ) | ||||||
|
Net income (loss) per basic share(f) |
0.34 | (3.34 | ) | 0.21 | (0.11 | ) | (2.90 | ) | ||||||||
|
Income (loss) from continuing operations per share, diluted |
0.37 | (0.60 | ) | 0.49 | (0.10 | ) | 0.16 | |||||||||
|
Loss from discontinued operations per share, diluted(e) |
(0.04 | ) | (2.74 | ) | (0.28 | ) | (0.00 | ) | (3.05 | ) | ||||||
|
Net income (loss) per diluted share(f) |
0.34 | (3.34 | ) | 0.21 | (0.11 | ) | (2.89 | ) | ||||||||
|
Dividends declared per share |
0.04 | 0.04 | 0.04 | 0.04 | 0.16 | |||||||||||
Refer to Management's Discussion and Analysis of Financial Condition and Results of Operations in Part II, Item 6 in this Form 10-K for explanations of items which impacted fiscal year 2009 revenues, operating and net income.
- (a)
- Operating income and net income increased as a result of $1.9 million ($1.2 million net of tax), $3.2 million ($2.1 million net of tax), and $6.7 million ($4.1 million net of tax), that was recorded in the second quarter
139
NOTES TO CONSOLIDATED FINANCIAL STATEMENTS (Continued)
ended December 31, 2009, fourth quarter ended June 30, 2009, second quarter ended December 31, 2008, respectively, related to a change in estimate in the Company's self-insurance accruals, primarily, prior years' workers' compensation claims reserves, due to our safety and return-to-work programs over the recent years, as well as changes in state laws.
- (b)
-
Expense
of $35.3 million ($28.7 million net of tax) was recorded in the third quarter ended March 31, 2010 related to our Regis salon
concept goodwill impairment due to recent performance challenges in that concept and current economic conditions. Expense of $41.7 million ($40.3 million net of tax) was recorded in the
second quarter ended December 31, 2008 related to our United Kingdom salon business goodwill impairment as a result of the recent performance challenges of the International salon operations.
- (c)
-
Expenses
of $6.4 ($3.9 million net of tax) and $10.2 million ($6.8 million net of tax) was recorded in the fourth quarters ended June,
30, 2010 and 2009 related to the impairment of property and equipment at underperforming locations.
- (d)
-
Expense
of $7.8 million ($4.8 million net of tax) and $25.7 million ($25.7 million net of tax) was recorded in the second
quarter ended December 31, 2008 and fourth quarter ended June 30, 2009, respectively, related to the impairment of the Company's equity method investments in Intelligent
Nutrients, LLC. and Provalliance, respectively, as a result of the Company determining that the losses in value were "other-than-temporary."
- (e)
-
During
the second quarter ended December 31, 2008, the Company determined Trade Secret to be held for sale and accounted for it as a discontinued
operation. As a result, the Company recorded expense of $171.8 million ($115.8 million net of tax) as a result of the write-off of the net assets associated with the sale of
Trade Secret. An income tax benefit of $3.0 million was recorded in the first quarter ended September 30, 2009 to correct the prior year calculation of the income tax benefit related to
the disposition of the Trade Secret concept. Expenses of $11.3 million net of tax and $0.2 million net of tax were recorded in the third quarter ended March 31, 2009 and fourth
quarter ended June 30, 2009, respectively for the incremental write-off of primarily inventories and property and equipment.
- (f)
- Total is a recalculation; line items calculated individually may not sum to total.
140
None.
Evaluation of Disclosure Controls and Procedures
The Company maintains disclosure controls and procedures that are designed to ensure that information required to be disclosed in its Exchange Act reports is recorded, processed, summarized and reported within the time periods specified in the Securities and Exchange Commission's rules and forms, and that such information is accumulated and communicated to management, including the chief executive officer and chief financial officer, as appropriate, to allow timely decisions regarding required disclosure.
Our Disclosure Committee, consisting of certain members of management, assists in this evaluation. The Disclosure Committee meets on a quarterly basis and more often if necessary.
With the participation of management, the Company's chief executive officer and chief financial officer evaluated the effectiveness of the design and operation of the Company's disclosure controls and procedures (as defined in Rules 13a-5(e) and 15d-15(e) promulgated under the Exchange Act) at the conclusion of the period ended June 30, 2010. Based upon this evaluation, the chief executive officer and chief financial officer concluded that the Company's disclosure controls and procedures were effective.
Management's Report on Internal Control over Financial Reporting
In Part II, Item 8 above, management provided a report on internal control over financial reporting, in which management concluded that the Company's internal control over financial reporting was effective as of June 30, 2010. In addition, PricewaterhouseCoopers LLP, the Company's independent registered public accounting firm, provided a report on the Company's effectiveness of internal control over financial reporting. The full text of management's report and PricewaterhouseCoopers' report appears on pages 76 and 77 herein.
Changes in Internal Controls
Based on management's most recent evaluation of the Company's internal control over financial reporting, management determined that there were no changes in the Company's internal control over financial reporting that has materially affected, or is reasonably likely to materially affect, the Company's internal control over financial reporting that occurred during the Company's most recent fiscal quarter.
None.
141
Information regarding the Directors of the Company and Exchange Act Section 16(a) filings will be set forth in the sections titled "Item 1—Election of Directors", "Corporate Governance" and "Section 16(a) Beneficial Ownership Reporting Compliance" of the Company's 2010 Proxy, and is incorporated herein by reference. The information required by Item 401 of Regulation S-K regarding the Company's executive officers is included under "Executive Officers" in Item 1 of this Annual Report on Form 10-K. Additionally, information regarding the Company's audit committee and audit committee financial expert, as well nominating committee functions, will be set forth in the section titled "Committees of the Board" and shareholder communications with directors will be set forth in the section titled "Communications with the Board" of the Company's 2010 Proxy Statement, and is incorporated herein by reference.
The Company has adopted a code of ethics, known as the Code of Business Conduct & Ethics that applies to all employees, including the Company's chief executive officer, chief financial officer, directors and executive officers. The Code of Business Conduct & Ethics is available on the Company's website at www.regiscorp.com , under the heading "Corporate Governance / Guidelines" (within the "Investor Information" section). The Company intends to disclose any substantive amendments to, or waivers from, its Code of Business Conduct & Ethics on its website or in a report on Form 8-K. In addition, the charters of the Company's Audit Committee, Compensation Committee and Nominating and Corporate Governance Committee and the Company's Corporate Governance Guidelines may be found on the Company's website. Copies of any of these documents are available upon request to any shareholder of the Company by writing to the Company's Secretary at Regis Corporation, 7201 Metro Boulevard, Edina, Minnesota 55439.
Information about Executive and director compensation will be set forth in the section titled "Executive Compensation" of the Company's 2010 Proxy Statement, and is incorporated herein by reference.
Information regarding the Company's equity compensation plans will be set forth in the section titled "Equity Compensation Plan Information" of the Company's 2010 Proxy Statement, and is incorporated herein by reference.
Information regarding certain relationships and related transactions will be set forth in the section titled "Certain Relationships and Related Transactions" of the Company's 2010 Proxy Statement, and is incorporated herein by reference. Information regarding director independence is included in the section titled "Corporate Governance—Director Independence" of the Company's 2010 Proxy Statement, and is incorporated herein by reference.
A description of the fees paid to the independent registered public accounting firm will be set forth in the section titled "Item 2—Ratification of Appointment of Independent Registered Public Accounting Firm" of the Company's 2010 Proxy Statement and is incorporated herein by reference.
142
- (a)
- (1). All financial statements:
Consolidated Financial Statements filed as part of this report are listed under Part II, Item 8 of this Form 10-K.
The financial statements of Provalliance, an equity method investee, are filed as part of this report, beginning on page 148.
- (b)
- Exhibits:
The exhibits listed in the accompanying index are filed as part of this report. Except where otherwise indicated below, the SEC file number for each report and registration statement from which the exhibits are incorporated by reference is 1-12725.
Exhibit Number/Description
| 2 | (a) | Contribution Agreement, dated April 18, 2007, between the Company and Empire Beauty School Inc. (Incorporated by reference to Exhibit 2.1 of the Company's Report on Form 8-K filed on April 24, 2007.) | |
| 2 | (b) | Purchase Agreement, dated November 13, 2004, between the Company and Hair Club Group Inc. (Incorporated by reference to Exhibit 2 of the Company's Report on Form 10-Q filed on February 9, 2005, for the quarter ended December 31, 2004.) | |
| 2 | (c) | Stock Purchase Agreement dated as of January 26, 2009 between Regis Corporation, Trade Secret, Inc. and Premier Salons Beauty Inc. (Incorporated by reference to Exhibit 2.1 to the Company's Report on Form 8-K filed on January 27, 2009.) | |
| 3 | (a) | Election of the Company to become governed by Minnesota Statutes Chapter 302A and Restated Articles of Incorporation of the Company, dated March 11, 1983; Articles of Amendment to Restated Articles of Incorporation, dated October 29, 1984; Articles of Amendment to Restated Articles of Incorporation, dated August 14, 1987; Articles of Amendment to Restated Articles of Incorporation, dated October 21, 1987; Articles of Amendment to Restated Articles of Incorporation, dated November 20, 1996; Articles of Amendment to Restated Articles of Incorporation, dated July 25, 2000. (Incorporated by reference to Exhibit 3(a) of the Company's Report on Form 10-Q filed on February 8, 2006, for the quarter ended December 31, 2005.) | |
| 3 | (b) | By-Laws of the Company. (Incorporated by reference to Exhibit 3.1 of the Company's Report on Form 8-K filed on October 31, 2006.) | |
| 3 | (c) | Certificate of the Voting Powers, Designations, Preferences and Relative Participating, Optional and Other Special Rights and Qualifications, Limitations or Restrictions of Series A Junior Participating Preferred Stock of the Company. (Attached as Exhibit A to the Rights Agreement dated December 26, 2006, and incorporated by reference to Exhibit 2 of the Company's Registration Statement on Form 8-A12B filed on December 26, 2006.) | |
| 4 | (a) | Shareholder Rights Agreement, dated December 23, 1996, between the Company and Norwest Bank Minnesota, N.A. as Rights Agent. (Incorporated by reference to Exhibit 4 of the Company's Report on Form 8-A12G filed on February 4, 1997.) | |
143
| 4 | (b) | Rights Agreement, dated December 26, 2006, between the Company and Wells Fargo Bank, N.A., as Rights Agent, and Form of Right Certificate attached as Exhibit B to the Rights Agreement. (Incorporated by reference to Exhibits 1 and 3 of the Company's Registration Statement on Form 8-A12B, filed on December 26, 2006.) | |
| 4 | (c) | Amendment No. 1, dated as of October 29, 2008, to Rights Agreement, dated December 26, 2006, between Regis Corporation and Wells Fargo Bank, N.A. (Incorporated by reference to Exhibit 4 to the Company's Registration Statement on Form 8-A12B/A filed on October 29, 2008.) | |
| 4 | (d) | Form of Stock Certificate. (Incorporated by reference to Exhibit 4.1of the Company's Registration Statement on Form S-1 (Reg. No. 40142).) | |
| 4 | (e) | Indenture dated July 14, 2009 by and between the Company and Wells Fargo Bank, N.A, as Trustee (Incorporated by reference to Exhibit 4.1 of the Company's Report on Form 8-K filed July 17, 2009) | |
| 10 | (a)(*) | Survivor Benefit Agreement, dated June 27, 1994, between the Company and Myron Kunin. (Incorporated by reference to Exhibit 10(t) part of the Company's Report on Form 10-K filed on September 28, 1994, for the year ended June 30, 1994.) | |
| 10 | (b) | Series G Senior Note, dated July 10, 1998, between the Company and Prudential Insurance Company of America. (Incorporated by reference to Exhibit 10(jj) of the Company's Report on Form 10-K filed on September 17, 1998, for the year ended June 30, 1998.) | |
| 10 | (c) | Amended and Restated Private Shelf Agreement, dated October 3, 2000, between the Company and Prudential Insurance Company of America. (Incorporated by reference to Exhibit 10(ff) of the Company's Report on Form 10-Q filed on November 13, 2000, for the quarter ended September 30, 2000.) | |
| 10 | (d) | Senior Series I Note, dated October 3, 2000, between the Company and Prudential Insurance Company of America. (Incorporated by reference to Exhibit 10(aa) of the Company's Report on Form 10-K filed on September 12, 2001, for the year ended June 30, 2001.) | |
| 10 | (e) | Note Purchase Agreement, dated March 1, 2002, between the Company and purchasers listed in Schedule A attached thereto. (Incorporated by reference to Exhibit 10(aa) of the Company's Report on Form 10-K filed on September 24, 2002, for the year ended June 30, 2002.) | |
| 10 | (f) | Form of Series A Senior Note. (Attached as Exhibit 1(a) to the Note Purchase Agreement dated March 1, 2002, and incorporated by reference to Exhibit 10(aa) of the Company's Report on Form 10-K filed on September 24, 2002, for the year ended June 30, 2002.) | |
| 10 | (g) | Series J Senior Notes, dated June 9, 2003, between the Company and Prudential Insurance Company of America. (Incorporated by reference to Exhibit 10(dd) of the Company's Report on Form 10-K filed on September 17, 2003, for the year ended June 30, 2003.) | |
| 10 | (h) | Promissory Note dated November 26, 2003, between the Company and Information Leasing Corporation. (Incorporated by reference to Exhibit 10(ee) of the Company's Report on Form 10-K filed on September 10, 2004, for the year ended June 30, 2004.) | |
| 10 | (i) | Lease Agreement commencing October 1, 2005, between the Company and France Edina, Property, LLP. (Incorporated by reference to Exhibit 99 of the Company's Report on Form 8-K filed on May 6, 2005.) | |
144
| 10 | (j) | Third Amended and Restated Credit Agreement, dated April 7, 2005, among the Company, Bank of America, N.A., as Administrative Agent, LaSalle Bank National Association, as Co-Administrative Agent and Co-Arranger and as Swing-Line Lender, J.P. Morgan Chase Bank, N.A., as Syndication Agent, Wachovia Bank, National Association, as Documentation Agent, Other Financial Institutions Party thereto, and Banc of America Securities LLC as Co-Arranger and Sole Book Manager. (Incorporated by reference to Exhibit 99.1 of the Company's Report on Form 8-K filed April 12, 2005.) | |
| 10 | (k) | Prepayment Agreement between Regis Corporation and various holders of Senior Notes of Regis Corporation, dated June 29, 2010 (Incorporated by reference to Exhibit 10.1 of the Company's Report on Form 8-K filed July 6, 2009) | |
| 10 | (l) | First Amendment to Term Loan agreement dated as of October 3, 2008 among Regis Corporation and various lenders, and JP Morgan Chase Bank, N.A, dated July 3, 2009 (Incorporated by reference to Exhibit 10.2 of the Company's Report on Form 8-K filed July 6, 2009) | |
| 10 | (m) | First Amendment to Fourth Amendment and Restated Credit Agreement dated as of July 12, 2007 among Regis Corporation and various lenders and JP Morgan Chase Bank, N.A, dated July 3, 2009 (Incorporated by reference to Exhibit 10.3 of the Company's Report on Form 8-K filed July 6, 2009) | |
| 10 | (n) | Amendment No.6 to Amend and Restated Private Shelf Agreement between Regis Corporation and Prudential Investment Management, Inc., The Prudential Insurance Company of America, Pruco Life Insurance Company, Pruco Life Insurance Company of New Jersey and other Prudential affiliates dated July 3, 2009 (Incorporated by reference to Exhibit 10.4 of the Company's Report on From 8-K filed July 6, 2009) | |
| 10 | (o) | First Amendment to Note Purchase Agreement dated March 1, 2005, between the Company and the purchasers listed in Schedule I attached thereto. (Incorporated by reference to Exhibit 99.3 of the Company's Report on Form 8-K filed April 12, 2005.) | |
| 10 | (p)(*) | Short Term Incentive Compensation Plan, effective August 19, 2009. (Incorporated by reference to Appendix A of the Company's Proxy Statement on Form 14A filed on September 15, 2009, for the year ended June 30, 2009.) | |
| 10 | (q) | Consulting Agreement, dated April 18, 2007, between the Company and Empire Beauty School Inc. (Incorporated by reference to Exhibit 10.1 of the Company's Report on Form 8-K filed on April 24, 2007.) | |
| 10 | (r)(*) | Amended and Restated Compensation Agreement, dated June 29, 2007, between the Company and Myron Kunin. (Incorporated by reference to Exhibit 10.1 of the Company's Report on Form 8-K filed on July 5, 2007.) | |
| 10 | (s) | Master Agreement, dated October 11, 2007, between Mr. Yvon Provost, Mr. Fabien Provost, Mrs. Olivia Provost, Mrs. Monique La Rizza, Artal Services N.V., Mr. Jean Mouton, RHS Netherlands Holdings BV, RHS France SAS, the Company and Artal Group S.A. (Incorporated by reference to Exhibit 10 of the Company's Report on Form 10-Q filed on February 7, 2008, for the quarter ended December 31, 2007.) | |
| 10 | (t) | Stock Purchase Agreement, dated January 17, 2008, between the Company, Cameron Capital Investments, Inc., Stephen Powell and Mackenzie Limited Partnership. (Incorporated by reference to Exhibit 10(z) to the Company's Report on Form 10-K filed on August 29, 2008, for the year ended June 30, 2008.) | |
145
| 10 | (u)(*) | Regis Corporation Executive Retirement Savings Plan Adoption Agreement and Trust Agreement, dated November 15, 2008 between the Company and Fidelity Management Trust Company (The CORPORATE Plan for Retirement EXECUTIVE PLAN basic plan document is incorporated by reference to Exhibit 10(c) to the Company's Report on Form 10-K filed on August 29, 2007, for the year ended June 30, 2007). (Incorporated by reference to Exhibit 10(a) of the Company's Report on Form 10-Q filed February 9, 2009.) | |
| 10 | (v)(*) | Employment Agreement, as Amended and Restated effective December 31, 2008, between the Company and Paul D. Finkelstein. (Incorporated by reference to Exhibit 10(b) of the Company's Report on Form 10-Q filed February 9, 2009.) | |
| 10 | (w)(*) | Employment Agreement, as Amended and Restated effective December 31, 2008, between the Company and Randy L. Pearce. (Incorporated by reference to Exhibit 10(c) of the Company's Report on Form 10-Q filed February 9, 2009.) | |
| 10 | (x)(*) | Amended and Restated Senior Officer Employment and Deferred Compensation Agreement, dated December 31, 2008, between the Company and Gordon Nelson. (Incorporated by reference to Exhibit 10(d) of the Company's Report on Form 10-Q filed February 9, 2009.) | |
| 10 | (y)(*) | Form of Amended and Restated Senior Officer Employment and Deferred Compensation Agreement, dated December 31, 2008, between the Company and certain senior executive officers. (Incorporated by reference to Exhibit 10(e) of the Company's Report on Form 10-Q filed February 9, 2009.) | |
| 10 | (z)(*) | Amendment to Amend and Restated CompensationAgreement, dated December 23, 2008, between the Company, and Myron Kunin (Incorporated by reference to Exhibit 10(f) of the Company's Report on Form 10-Q filed February 9, 2009.). | |
| 10 | (aa)(*) | 2004 Long Term Incentive Plan as Amended and Restated, effective December 31, 2008, (Incorporated by reference to Exhibit 10(g) of the Company's Report on Form 10-Q filed February 9, 2009.) | |
| 10 | (bb)(*) | Amendment dated January 28, 2010 to the Employment Agreement, as Amended and Restated effective December 31, 2008, between the Company and Paul D. Finkelstein (Incorporated by referenced to Exhibit 10(a) of the Company's Report on Form 10-Q filed May 10, 2010). | |
| 21 | List of Subsidiaries of Regis Corporation. | ||
| 23 | Consent of PricewaterhouseCoopers LLP. | ||
| 31.1 | Chairman of the Board of Directors, President and Chief Executive Officer of the Company: Certification pursuant to Section 302 of the Sarbanes-Oxley Act of 2002. | ||
| 31.2 | Senior Executive Vice President, Chief Financial and Administrative Officer of the Company: Certification pursuant to Section 302 of the Sarbanes-Oxley Act of 2002. | ||
| 32.1 | Chairman of the Board of Directors, President and Chief Executive Officer of the Company: Certification pursuant to Section 906 of the Sarbanes-Oxley Act of 2002. | ||
| 32.2 | Senior Executive Vice President, Chief Financial and Administrative Officer of the Company: Certification pursuant to Section 906 of the Sarbanes-Oxley Act of 2002. |
- (*)
- Management contract, compensatory plan or arrangement required to be filed as an exhibit to the Company's Report on Form 10-K.
146
Pursuant to the requirements of Section 13 or 15(d) of the Securities Exchange Act of 1934, the Registrant has duly caused this report to be signed on its behalf by the undersigned, thereunto duly authorized.
| REGIS CORPORATION | ||||
|
|
|
By |
|
/s/ PAUL D. FINKELSTEIN Paul D. Finkelstein, Chairman of the Board of Directors, President and Chief Executive Officer |
|
|
|
By |
|
/s/ RANDY L. PEARCE Randy L. Pearce, Senior Executive Vice President, Chief Financial and Administrative Officer (Principal Financial and Accounting Officer) |
|
|
|
DATE: August 27, 2010 |
||
Pursuant to the requirements of the Securities Exchange Act of 1934, this report has been signed below by the following persons on behalf of the Registrant and in the capacities and on the dates indicated.
|
/s/ PAUL D. FINKELSTEIN
Paul D. Finkelstein, Chairman of the Board of Directors |
Date: August 27, 2010 | |
|
/s/ DAVID B. KUNIN David B. Kunin, Director |
|
Date: August 27, 2010 |
|
/s/ ROLF BJELLAND Rolf Bjelland, Director |
|
Date: August 27, 2010 |
|
/s/ VAN ZANDT HAWN Van Zandt Hawn, Director |
|
Date: August 27, 2010 |
|
/s/ SUSAN S. HOYT Susan S. Hoyt, Director |
|
Date: August 27, 2010 |
|
/s/ THOMAS L. GREGORY Thomas L. Gregory, Director |
|
Date: August 27, 2010 |
|
/s/ STEPHEN E. WATSON Stephen E. Watson, Director |
|
Date: August 27, 2010 |
|
/s/ JOSEPH L. CONNER Joseph L. Conner, Director |
|
Date: August 27, 2010 |
147
PROVALLIANCE SAS
CONSOLIDATED FINANCIAL STATEMENTS
FOR THE YEARS ENDED DECEMBER 31, 2009 AND 2008
148
To the board of Directors of Regis Corporation
Report of Independent Registered Public Accounting Firm
In our opinion, the accompanying consolidated balance sheet and the related consolidated statement of income, shareholders' equity and cash flow present fairly, in all material respects, the financial position of Provalliance and its subsidiaries at December 31, 2008, and the results of their operations and their cash flows for the year then ended in conformity with International Financial Reporting Standards (IFRS) as issued by the International Accounting Standards Board (IASB). These financial statements are the responsibility of the Company's management. Our responsibility is to express an opinion of these financial statements based on our audit.
We conducted our audit of these statements in accordance with the standards of the Public Company Accounting Oversight Board (United States). Those standards require that we plan and perform the audit to obtain reasonable assurance about whether the financial statements are free of material misstatement. An audit includes examining, on a test basis, evidence supporting the amounts and disclosures in the financial statements, assessing the accounting principles used and significant estimates made by management, and evaluating the overall financial statement presentation. We believe that our audit provide a reasonable basis for our opinion.
November 25, 2009
PricewaterhouseCoopers Audit
Christian
Perrier
Partner
149
PROVALLIANCE SAS
CONSOLIDATED FINANCIAL STATEMENTS
(in €)
|
|
Note |
(Not Covered
by Auditors' Report) Dec. 31, 2009 |
Dec. 31, 2008 | |||||||
|---|---|---|---|---|---|---|---|---|---|---|
|
ASSETS |
||||||||||
|
NON-CURRENT ASSETS |
||||||||||
|
Intangible assets |
4 | 178,437,343 | 177,220,141 | |||||||
|
Property, plant and equipment |
5 | 28,350,810 | 27,097,541 | |||||||
|
Financial assets |
6 | 5,561,464 | 5,178,659 | |||||||
|
Deferred tax assets |
7 | 2,508,968 | 6,429,308 | |||||||
|
TOTAL NON-CURRENT ASSETS |
214,858,585 | 215,925,649 | ||||||||
|
CURRENT ASSETS |
||||||||||
|
Inventories |
8 | 4,595,243 | 5,173,048 | |||||||
|
Trade receivables |
9 | 15,761,414 | 18,122,775 | |||||||
|
Other receivables |
10 | 23,026,896 | 20,233,906 | |||||||
|
Cash and cash equivalents |
11 | 16,936,017 | 21,763,329 | |||||||
|
TOTAL CURRENT ASSETS |
60,319,570 | 65,293,058 | ||||||||
|
TOTAL ASSETS |
275,178,155 | 281,218,707 | ||||||||
|
EQUITY AND LIABILITIES |
||||||||||
|
EQUITY |
||||||||||
|
Issued capital |
12 | 207,368,900 | 207,368,900 | |||||||
|
Share premium and other reserves |
(85,663,149 | ) | (94,842,914 | ) | ||||||
|
Treasury shares |
(7,368,900 | ) | (7,368,900 | ) | ||||||
|
Profit for the year |
10,464,391 | 9,772,384 | ||||||||
|
EQUITY ATTRIBUTABLE TO OWNERS OF THE PARENT |
124,801,242 | 114,929,470 | ||||||||
|
Non-controlling interests in equity |
483,077 | 1,282,427 | ||||||||
|
TOTAL EQUITY |
125,284,319 | 116,211,897 | ||||||||
|
NON-CURRENT LIABILITIES |
||||||||||
|
Long-term debt |
13 | 68,423,699 | 64,655,407 | |||||||
|
Deferred tax liabilities |
7 | 4,267,165 | 7,809,154 | |||||||
|
Provisions for liabilities and charges |
16 | 3,377,571 | 5,534,222 | |||||||
|
TOTAL NON-CURRENT LIABILITIES |
76,068,435 | 77,998,783 | ||||||||
|
CURRENT LIABILITIES |
||||||||||
|
Current portion of long-term debt |
13 | 19,755,424 | 22,970,688 | |||||||
|
Other short-term debt |
13 | 2,738,894 | 8,264,984 | |||||||
|
Trade payables |
17 | 20,633,343 | 22,065,421 | |||||||
|
Other payables |
17 | 30,697,740 | 33,706,934 | |||||||
|
TOTAL CURRENT LIABILITIES |
73,825,401 | 87,008,027 | ||||||||
|
TOTAL EQUITY AND LIABILITIES |
275,178,155 | 281,218,707 | ||||||||
150
PROVALLIANCE SAS
CONSOLIDATED FINANCIAL STATEMENTS
CONSOLIDATED INCOME STATEMENT
(in €)
|
|
Note |
(Not Covered
by Auditors' Report) Year ended Dec. 31, 2009 |
Year ended
Dec. 31, 2008 |
Year-on-year
change |
||||||||||
|---|---|---|---|---|---|---|---|---|---|---|---|---|---|---|
|
Revenue |
18 | 202,981,750 | 189,183,969 | 13,797,781 | ||||||||||
|
Other income from operations |
11,037 | (11,037 | ) | |||||||||||
|
Cost of sales |
(26,468,027 | ) | (22,751,529 | ) | (3,716,498 | ) | ||||||||
|
Payroll costs |
19 | (92,474,635 | ) | (86,242,742 | ) | (6,231,893 | ) | |||||||
|
External charges |
20 | (54,669,108 | ) | (54,375,066 | ) | (294,042 | ) | |||||||
|
Taxes other than on income |
(5,240,033 | ) | (4,390,924 | ) | (849,109 | ) | ||||||||
|
Depreciation, amortization and impairment |
(6,962,260 | ) | (4,324,515 | ) | (2,637,745 | ) | ||||||||
|
Net (additions to)/reversals from provisions |
(1,431,164 | ) | (2,072,888 | ) | 641,724 | |||||||||
|
Other operating income |
21 | 1,688,854 | 1,554,935 | 133,919 | ||||||||||
|
Other operating expenses |
21 | (2,413,974 | ) | (2,629,679 | ) | 215,705 | ||||||||
|
Operating profit |
15,011,403 |
13,962,598 |
1,048,805 |
|||||||||||
|
Income from cash and cash equivalents |
21 | 592,739 | 1,705,093 | (1,112,354 | ) | |||||||||
|
Finance costs—gross |
21 | (4,818,087 | ) | (4,426,821 | ) | (391,266 | ) | |||||||
|
Finance costs—net |
(4,225,348 |
) |
(2,721,728 |
) |
(1,503,620 |
) |
||||||||
|
Income tax expense |
7 |
(345,600 |
) |
(1,187,597 |
) |
841,997 |
||||||||
|
Share of profit of associates |
||||||||||||||
|
Profit for the year from continuing operations |
10,440,455 |
10,053,273 |
387,182 |
|||||||||||
|
Profit for the year from discontinued operations |
||||||||||||||
|
Profit for the year |
10,440,455 |
10,053,273 |
387,182 |
|||||||||||
|
Attributable to: |
||||||||||||||
|
—Owners of the parent |
10,464,391 | 9,772,384 | 692,007 | |||||||||||
|
—Non-controlling interests |
(23,936 | ) | 280,889 | (304,825 | ) | |||||||||
151
CONSOLIDATED FINANCIAL STATEMENTS
CONSOLIDATED STATEMENT OF COMPREHENSIVE INCOME
(in €)
|
|
Note |
(Not Covered
by Auditors' Report) Year ended Dec. 31, 2009 |
Year ended
Dec. 31, 2008 |
Year-on-year
change |
||||||||||
|---|---|---|---|---|---|---|---|---|---|---|---|---|---|---|
|
Profit for the year |
10,440,455 | 10,053,273 | 387,182 | |||||||||||
|
Other comprehensive income: |
||||||||||||||
|
Currency translation differences |
(84,064 | ) | (31,266 | ) | (52,798 | ) | ||||||||
|
Share-based payments(1) |
1,706,667 | 1,706,667 | ||||||||||||
|
Other |
||||||||||||||
|
Other comprehensive income for the year |
1,622,603 |
(31,266 |
) |
1,653,869 |
||||||||||
|
Total comprehensive income for the year |
12,063,058 |
10,022,007 |
2,041,051 |
|||||||||||
|
Attributable to: |
||||||||||||||
|
—Owners of the parent |
12,115,028 | 9,754,078 | 2,360,950 | |||||||||||
|
—Non-controlling interests |
(51,970 | ) | 267,929 | (319,899 | ) | |||||||||
152
CONSOLIDATED FINANCIAL STATEMENTS
CONSOLIDATED STATEMENT OF CHANGES IN EQUITY
(in €)
|
|
Share
capital |
Share
premium |
Treasury
shares |
Reserves
for equity- settled employee benefits |
Retained
earnings and other reserves |
Income
and expense recognized directly in equity |
Equity
attributable to owners of the parent |
Non-
controlling interests in equity |
Total
equity |
|||||||||||||||||||
|---|---|---|---|---|---|---|---|---|---|---|---|---|---|---|---|---|---|---|---|---|---|---|---|---|---|---|---|---|
|
At January 1, 2008 |
25,375,000 | 1,422,225 | 15,663,712 | 42,460,937 | 704,626 | 43,165,563 | ||||||||||||||||||||||
|
Profit for 2008 |
9,772,384 | 9,772,384 | 280,889 | 10,053,273 | ||||||||||||||||||||||||
|
Other comprehensive income for the year |
(18,306 | ) | (18,306 | ) | (12,960 | ) | (31,266 | ) | ||||||||||||||||||||
|
Total comprehensive income for the year |
9,772,384 | (18,306 | ) | 9,754,078 | 267,929 | 10,022,007 | ||||||||||||||||||||||
|
Change in consolidating legal entity |
(25,375,000 | ) | (1,422,225 | ) | 26,797,225 | |||||||||||||||||||||||
|
Share issues |
207,368,900 | 1,083,673 | (133,000,000 | ) | 75,452,573 | 75,452,573 | ||||||||||||||||||||||
|
Share-based payments |
||||||||||||||||||||||||||||
|
Sales/purchases of treasury shares |
(7,368,900 | ) | (7,368,900 | ) | (7,368,900 | ) | ||||||||||||||||||||||
|
Dividends |
(4,282,000 | ) | (4,282,000 | ) | (316,494 | ) | (4,598,494 | ) | ||||||||||||||||||||
|
Changes in Group structure |
(1,380,119 | ) | (1,380,119 | ) | ||||||||||||||||||||||||
|
Other movements |
(1,087,218 | ) | (1,087,218 | ) | 2,006,485 | 919,267 | ||||||||||||||||||||||
|
At December 31, 2008 |
207,368,900 | 1,083,673 | (7,368,900 | ) | (86,135,897 | ) | (18,306 | ) | 114,929,470 | 1,282,427 | 116,211,897 | |||||||||||||||||
|
Profit for 2009(2) |
10,464,391 | 10,464,391 | (23,936 | ) | 10,440,455 | |||||||||||||||||||||||
|
Other comprehensive income for the year(1)(2) |
1,706,667 | (56,030 | ) | 1,650,637 | (28,034 | ) | 1,622,603 | |||||||||||||||||||||
|
Total comprehensive income for the year(2) |
1,706,667 | 10,464,391 | (56,030 | ) | 12,115,028 | (51,970 | ) | 12,063,058 | ||||||||||||||||||||
|
Change in consolidating legal entity(2) |
||||||||||||||||||||||||||||
|
Share issues(2) |
||||||||||||||||||||||||||||
|
Sales/purchases of treasury shares(2) |
||||||||||||||||||||||||||||
|
Dividends(2) |
(2,930,000 | ) | (2,930,000 | ) | (99,119 | ) | (3,029,119 | ) | ||||||||||||||||||||
|
Changes in Group structure(2) |
||||||||||||||||||||||||||||
|
Other movements(2) |
686,744 | 686,744 | (648,261 | ) | 38,483 | |||||||||||||||||||||||
|
At December 31, 2009(2) |
207,368,900 | 1,083,673 | (7,368,900 | ) | 1,706,667 | (77,914,762 | ) | (74,336 | ) | 124,801,242 | 483,077 | 125,284,319 | ||||||||||||||||
- (1)
-
Including
€827,000 in share-based payments related to 2008
- (2)
- Information as of December 31, 2009 and for the year then ended Not Covered by Auditors' Report included herein
153
PROVALLIANCE SAS
CONSOLIDATED FINANCIAL STATEMENTS
CONSOLIDATED STATEMENT OF CASH FLOWS
(in €)
|
|
Note |
(Not Covered by
Auditors' Report) Year ended Dec. 31, 2009 |
Year ended
Dec. 31, 2008 |
|||||||||
|---|---|---|---|---|---|---|---|---|---|---|---|---|
|
Profit for the year of consolidated companies |
10,440,455 | 10,053,272 | ||||||||||
|
Elimination of non-cash items: |
||||||||||||
|
—Depreciation, amortization and provisions |
8,392,784 | 8,401,288 | ||||||||||
|
—Disposal gains and losses |
730,428 | 704,295 | ||||||||||
|
Cash flow after finance costs, net, and income tax expense |
19,563,667 |
19,158,855 |
||||||||||
|
Finance costs, net |
4,225,348 | 2,721,728 | ||||||||||
|
Income tax expense(3) |
345,600 | 1,187,597 | ||||||||||
|
Cash flow before finance costs, net, and income tax expense |
24,134,615 |
23,068,180 |
||||||||||
|
Income tax paid |
(1,700,521 | ) | (3,538,460 | ) | ||||||||
|
Change in net operating working capital(4) |
(6,011,589 | ) | (1,866,953 | ) | ||||||||
|
Net cash generated from operating activities |
16,422,505 |
17,662,767 |
||||||||||
|
Cash flows from investing activities: |
||||||||||||
|
Purchases of property, plant and equipment and intangible assets |
(9,999,294 | ) | (23,441,470 | ) | ||||||||
|
Proceeds from sale of property, plant and equipment and intangible assets |
1,656,666 | 2,131,645 | ||||||||||
|
Purchases of financial assets(2) |
(3,805 | ) | ||||||||||
|
Proceeds from sale of financial assets(2) |
30,979 | |||||||||||
|
Impact of business combinations(5) |
24 | (2,583,085 | ) | (32,652,715 | ) | |||||||
|
Dividends received(6) |
||||||||||||
|
Change in outstanding loans and advances |
(246,865 | ) | (62,203 | ) | ||||||||
|
Net cash used in investing activities |
(11,141,599 |
) |
(54,028,548 |
) |
||||||||
|
Cash flows from financing activities: |
||||||||||||
|
Proceeds from issuance of shares: |
8,083,673 | |||||||||||
|
• Paid by owners of the parent |
8,083,673 | |||||||||||
|
• Paid by minority shareholders of consolidated companies |
||||||||||||
|
Proceeds received on exercise of stock options |
||||||||||||
|
Purchases and sales of treasury shares |
||||||||||||
|
Dividends paid to: |
(3,029,119 | ) | (4,598,494 | ) | ||||||||
|
• Owners of the parent |
(2,930,000 | ) | (4,282,000 | ) | ||||||||
|
• Minority shareholders of consolidated companies |
(99,119 | ) | (316,494 | ) | ||||||||
|
Proceeds from new borrowings |
23,254,067 | 49,285,112 | ||||||||||
|
Repayments of borrowings |
(20,937,155 | ) | (9,429,059 | ) | ||||||||
|
Interest paid |
(4,818,087 | ) | (4,426,821 | ) | ||||||||
|
Interest received |
592,739 | 1,705,093 | ||||||||||
|
Other cash flows from financing activities |
354,246 | 6,016 | ||||||||||
|
Net cash (used in)/generated from financing activities |
(4,583,309 |
) |
40,625,520 |
|||||||||
|
Effect of changes in foreign exchange rates |
1,181 | (18,678 | ) | |||||||||
|
Net increase in cash and cash equivalents |
698,778 | 4,241,061 | ||||||||||
|
Net cash and cash equivalents at beginning of year |
13,498,345 | 9,257,284 | ||||||||||
|
Net cash and cash equivalents at end of year |
23 | 14,197,123 | 13,498,345 | |||||||||
- (2)
-
Investments
in non-consolidated companies and companies accounted for by the equity method
- (3)
-
Including
deferred tax
- (4)
-
Including
employee benefit obligations
- (5)
-
Purchase/sale
price plus or minus cash and cash equivalents acquired/transferred
- (6)
- From non-consolidated companies and companies accounted for by the equity method
154
PROVALLIANCE SAS
CONSOLIDATED FINANCIAL STATEMETS
DECEMBER 31, 2009 AND 2008
NOTES TO THE CONSOLIDATED FINANCIAL STATEMENTS
(INFORMATION AS OF DECEMBER 31, 2009 AND FOR THE YEAR THEN ENDED NOT
COVERED BY AUDITORS' REPORT INCLUDED HEREIN)
155
PROVALLIANCE SAS
CONSOLIDATED FINANCIAL STATEMETS
DECEMBER 31, 2009 AND 2008
NOTES TO THE CONSOLIDATED FINANCIAL STATEMENTS (Continued)
(INFORMATION AS OF DECEMBER 31, 2009 AND FOR THE YEAR THEN ENDED NOT
COVERED BY AUDITORS' REPORT INCLUDED HEREIN)
The Provalliance group operates hair salons and manages license agreements as well as a network of franchises under the following brand names:
- •
-
Franck Provost
- •
-
Fabio Salsa
- •
-
Jean-Louis David
- •
-
Saint-Algue
- •
-
Saint-Karl
- •
-
Coiff & Co
- •
-
Interview
- •
-
Lovely look
- •
-
Jean-Marc Maniatis
- •
-
Intermède
- •
- City-Look
The consolidated financial statements of Provalliance SAS for the year ended December 31, 2009 encompass the parent company and its subsidiaries (together "the Group") as well as the Group's jointly-controlled entities.
These consolidated financial statements were authorized for issue by the Chairman.
156
PROVALLIANCE SAS
CONSOLIDATED FINANCIAL STATEMETS
DECEMBER 31, 2009 AND 2008
NOTES TO THE CONSOLIDATED FINANCIAL STATEMENTS (Continued)
(INFORMATION AS OF DECEMBER 31, 2009 AND FOR THE YEAR THEN ENDED NOT
COVERED BY AUDITORS' REPORT INCLUDED HEREIN)
1.1 SUMMARY OF SIGNIFICANT ACCOUNTING POLICIES
1.1.1 Basis of preparation
The consolidated financial statements of Provalliance SAS have been prepared in accordance with International Financial Reporting Standards (IFRS) as issued by the International Accounting Standards Board (IASB) and IFRS as adopted by the European Union. The standards adopted by the European Union can be viewed on the European Commission's website at http://ec.europa.eu/internal_market/accounting/ias/index_en.htm.
The accounting policies applied in the preparation of the consolidated financial statements for the year ended December 31, 2009 are consistent with those applied for the consolidated financial statements for the year ended December 31, 2008, except for the adoption of the revised version of IAS 1, Presentation of Financial Statements. The main changes resulting from the adoption of this revised standard are as follows:
- (i)
-
all
changes in equity resulting from transactions with owners of the parent are presented separately from those due to transactions with minority
shareholders of subsidiaries;
- (ii)
-
income
and expenses for the period are presented in two separate statements—an income statement followed by a statement of comprehensive
income;
- (iii)
- total comprehensive income is presented as part of the financial statements.
The following new standards, amendments to existing standards and interpretations were applicable for the first time for the fiscal year beginning January 1, 2009 but did not have a material impact on the Provalliance group's consolidated financial statements at December 31, 2009:
- •
-
Revised version of IAS 23, Borrowing Costs, which requires the capitalization of borrowing costs directly
attributable to the acquisition, construction or production of qualifying assets.
- •
-
Amendment to IFRS 2, Share-based Payment—Vesting Conditions and Cancellations.
- •
-
Amendments to IAS 32 and IAS 1—Puttable Financial Instruments and Obligations Arising on
Liquidation.
- •
-
Amendments to IFRS 1 and IAS 27—Cost of an Investment in a Subsidiary, Jointly Controlled Entity
or Associate.
- •
-
Improvements to IFRSs (May 2008).
- •
-
Amendments to IFRS 7—Improving Disclosures about Financial Instruments.
- •
-
Amendments to IFRIC 9 and IAS 39—Embedded Derivatives.
- •
-
IFRIC 13, Customer Loyalty Programmes.
- •
-
Amendment to IAS 39, Financial Instruments: Recognition and Measurement.
- •
- IFRIC 11, IFRS 2—Group and Treasury Share Transactions.
157
PROVALLIANCE SAS
CONSOLIDATED FINANCIAL STATEMETS
DECEMBER 31, 2009 AND 2008
NOTES TO THE CONSOLIDATED FINANCIAL STATEMENTS (Continued)
(INFORMATION AS OF DECEMBER 31, 2009 AND FOR THE YEAR THEN ENDED NOT
COVERED BY AUDITORS' REPORT INCLUDED HEREIN)
1.1 SUMMARY OF SIGNIFICANT ACCOUNTING POLICIES (Continued)
- •
- IFRIC 14, IAS 19—The Limit on a Defined Benefit Asset, Minimum Funding Requirements and their Interaction.
The accounting policies applied by Provalliance SAS for the year ended December 31, 2009 are consistent with the IFRSs published by the IASB. Application by the Group of amendments and interpretations issued by the IASB and mandatory for accounting periods beginning on or after January 1, 2009, but which have not yet been adopted by the European Union, would not have had a material impact on the consolidated financial statements.
The consolidated financial statements are presented in euros. They have been prepared using the historical cost convention, with the exception of certain items which have been measured at fair value such as short-term cash investments and options on non-controlling interests.
Non-current assets (or disposal groups) held for sale are measured at the lower of their carrying amount and fair value less costs to sell.
1.1.2 Use of estimates
The preparation of financial statements in accordance with IFRS requires management to make estimates and assumptions that affect the amounts reported in the financial statements. These estimates and underlying assumptions are based on historical experience and other factors that are considered to be reasonable in light of the circumstances and the information available at the end of the reporting period. They provide a basis on which to exercise judgment in determining the carrying amounts of assets and liabilities that cannot be obtained directly from other sources.
The estimates and underlying assumptions used by the Group are reviewed on an ongoing basis. Given the still-unsettled worldwide economy at end-2009 it was difficult to determine forward-looking information at that date and actual amounts may therefore differ from the estimates applied.
The areas involving significant estimates and assumptions for the preparation of these consolidated financial statements were the fair value of intangible assets, impairment tests on intangible assets, deferred taxes and provisions for liabilities and charges.
1.1.3 Consolidation
Subsidiaries
Subsidiaries are entities that are controlled by the Group. Control is deemed to exist where the Group has the power to directly or indirectly govern the financial and operating policies of an entity so as to obtain benefits from its activities. The existence and effect of potential voting rights that are currently exercisable or convertible are considered when assessing whether the Group controls another entity. Subsidiaries are fully consolidated from the date on which control is transferred to the Group and are de-consolidated from the date that control ceases.
158
PROVALLIANCE SAS
CONSOLIDATED FINANCIAL STATEMETS
DECEMBER 31, 2009 AND 2008
NOTES TO THE CONSOLIDATED FINANCIAL STATEMENTS (Continued)
(INFORMATION AS OF DECEMBER 31, 2009 AND FOR THE YEAR THEN ENDED NOT
COVERED BY AUDITORS' REPORT INCLUDED HEREIN)
1.1 SUMMARY OF SIGNIFICANT ACCOUNTING POLICIES (Continued)
Associates
Associates are all entities over which the Group has significant influence. Significant influence is the power to participate in the financial and operating policy decisions of the investee but is not control over those policies. The results of associates are incorporated in these consolidated financial statements using the equity method of accounting as from the date that the Group begins to exercise significant influence until the date that such significant influence ceases. If the Group's share of losses of an associate exceeds its interest in the associate, the interest is written down to zero and the Group discontinues recognizing its share of further losses unless it has incurred legal or constructive obligations to participate in the losses or to make payments on behalf of the associate.
Interests in joint ventures
A joint venture is a contractual arrangement whereby the Group and other parties undertake an economic activity that is subject to joint control. The consolidated financial statements include the Group's share of each of the assets, liabilities, income and expenses of a jointly controlled entity, combined line by line with similar items in the Group's financial statements using the proportionate consolidation method. This accounting method is applied as from the date when joint control is obtained until the date that such control ceases.
Eliminations on consolidation
Inter-company transactions, balances and unrealized gains and losses on transactions between Group companies are eliminated in the consolidated financial statements. Unrealized gains on transactions with associates and jointly-controlled entities are eliminated to the extent of the Group's interest in the entity concerned. Unrealized losses are also eliminated unless the transaction provides evidence of an impairment of the asset transferred.
At December 31, 2009 all of the companies included in the scope of consolidation were subsidiaries except for one special purpose entity, A.F.A.P (Association de Formation Artistique Professionnelle). Prior to consolidation the financial statements of subsidiaries are restated to comply with Group accounting policies.
A list of consolidated companies is provided in Note 2.
1.1.4 Intangible assets
1.1.4.1 Business combinations—Goodwill
The Group has elected not to apply IFRS 3 retrospectively to business combinations that occurred prior to January 1, 2004. Goodwill arising prior to that date has continued to be recorded at deemed cost which represents their previous GAAP carrying amount.
159
PROVALLIANCE SAS
CONSOLIDATED FINANCIAL STATEMETS
DECEMBER 31, 2009 AND 2008
NOTES TO THE CONSOLIDATED FINANCIAL STATEMENTS (Continued)
(INFORMATION AS OF DECEMBER 31, 2009 AND FOR THE YEAR THEN ENDED NOT
COVERED BY AUDITORS' REPORT INCLUDED HEREIN)
1.1 SUMMARY OF SIGNIFICANT ACCOUNTING POLICIES (Continued)
Goodwill represents the excess of the cost of an acquisition over the fair value of the Group's share of the identifiable assets, liabilities and contingent liabilities of the acquired subsidiary at the date of acquisition. It is included in "intangible assets".
Negative goodwill is recognized in the income statement in the period in which it arises.
The identifiable assets, liabilities and contingent liabilities of companies consolidated for the first time are recorded in the consolidated balance sheet at their fair value, except for non-current assets classified as held for sale in accordance with IFRS 5, which are recognized at fair value less costs to sell.
Goodwill is carried at cost less any accumulated impairment losses. It is not amortized but is tested annually for impairment. For the purpose of these impairment tests goodwill is allocated to cash-generating units (see Note 1.1.6 "Impairment of non-current assets").
1.1.4.2 Lease premiums
On a business combination, lease premiums are recognized at fair value which represents the difference between (i) the market rent based on the revenue of the business concerned and the rent-to-income ratio and (ii) the actual rent.
Lease premiums have indefinite useful lives but a review is carried out each period to ensure that this classification is still justified based on the latest events and circumstances.
Lease premiums are not amortized but are tested annually for impairment in accordance with the principles described in Note 1.1.6 "Impairment of non-current assets".
As lease premiums correspond to identifiable assets they give rise to a deferred tax liability.
1.1.4.3 Trademarks
The "Franck Provost" and "Fabio Salsa" trademarks were acquired during 2007. In 2008, the Group acquired the following trademarks:
- •
-
Jean-Louis David
- •
-
Saint-Algue
- •
-
Saint-Karl
- •
-
Coiff & Co
- •
-
Intermède
- •
-
City-Look
- •
- Interview
160
PROVALLIANCE SAS
CONSOLIDATED FINANCIAL STATEMETS
DECEMBER 31, 2009 AND 2008
NOTES TO THE CONSOLIDATED FINANCIAL STATEMENTS (Continued)
(INFORMATION AS OF DECEMBER 31, 2009 AND FOR THE YEAR THEN ENDED NOT
COVERED BY AUDITORS' REPORT INCLUDED HEREIN)
1.1 SUMMARY OF SIGNIFICANT ACCOUNTING POLICIES (Continued)
These trademarks were recognized at fair value based on the expected profit to be generated through their related licenses and franchise network.
Trademarks are amortized over the following periods:
- •
-
Jean-Louis David and Saint-Algue: 25 years
- •
- Coiff & Co, Intermède and City-Look: 20 years
In addition, where there is an indication that the value of a trademark may be impaired it is tested for impairment in accordance with the principles described in Note 1.1.6 "Impairment of non-current assets".
As trademarks correspond to identifiable assets, they give rise to a deferred tax liability.
1.1.4.4 Franchise networks
Franchise agreements acquired as part of a business combination are measured based on the expected future cash flows to be generated by the franchise network, less the value of the brand and taking into account the probability of renewal of agreements reaching maturity.
Franchise networks are amortized over 15 years.
As franchise networks correspond to identifiable assets they give rise to a deferred tax liability.
1.1.4.5 Other intangible assets
The Group has not capitalized any development costs.
Other intangible assets—notably software acquired for internal use—are amortized over their estimated useful lives, which generally correspond to three years. In the income statement, amortization expense is recorded as an operating expense under the line "Depreciation, amortization and impairment".
Other intangible assets are carried at cost less accumulated amortization and any accumulated impairment losses.
1.1.5 Property, plant and equipment
The Group has opted to apply the cost model rather than the revaluation model for measuring property, plant and equipment. Consequently, property, plant and equipment are stated at cost less accumulated depreciation and any accumulated impairment losses. In accordance with IAS 23, borrowing costs are not included in the cost of property, plant and equipment.
161
PROVALLIANCE SAS
CONSOLIDATED FINANCIAL STATEMETS
DECEMBER 31, 2009 AND 2008
NOTES TO THE CONSOLIDATED FINANCIAL STATEMENTS (Continued)
(INFORMATION AS OF DECEMBER 31, 2009 AND FOR THE YEAR THEN ENDED NOT
COVERED BY AUDITORS' REPORT INCLUDED HEREIN)
1.1 SUMMARY OF SIGNIFICANT ACCOUNTING POLICIES (Continued)
Items of property, plant and equipment are depreciated over the following useful lives:
|
• Fixtures and fittings and leasehold improvements |
10 years | |
|
• Plant and equipment |
4 - 5 years | |
|
• Other property, plant and equipment |
3 - 5 years |
In the income statement, depreciation expense is recorded as an operating expense under the line "Depreciation, amortization and impairment".
The Group no longer has any finance leases that need to be accounted for in accordance with IAS 17.
1.1.5.1 Margin on disposals of non-current assets
Franck Provost Coiffure acts as a central purchasing unit for non-current assets on behalf of its subsidiaries. Internal margins arising on such transactions are eliminated in the consolidated financial statements.
1.1.6 Impairment of non-current assets
In accordance with IAS 36, the carrying amount of property, plant and equipment and intangible assets with finite useful lives is tested for impairment whenever there is an indication that the asset may be impaired. The Group assesses whether any such indications exist at each reporting date.
Goodwill and intangible assets with indefinite useful lives are tested for impairment at least once a year and more frequently if there is any indication that they may be impaired. For the purpose of impairment testing, assets are allocated to cash-generating units (CGUs). A CGU is defined as the smallest identifiable group of assets that generates cash inflows that are largely independent of the cash inflows from other assets or groups of assets.
1.1.6.1 Definition of cash-generating units
Previously, the Franck Provost Coiffure group's business was essentially operated through directly-owned salons under a single brand (as Fabio Salsa was not significant). Following the various acquisitions carried out in 2008, the Group now has a multi-brand franchising business and also manages license agreements.
As a result of these operational changes, the Group redefined its internal reporting structure, which is now based on the following three core businesses:
- •
-
management of directly-owned salons
- •
-
management of franchise networks
- •
- management of license agreements
162
CONSOLIDATED FINANCIAL STATEMETS
DECEMBER 31, 2009 AND 2008
NOTES TO THE CONSOLIDATED FINANCIAL STATEMENTS (Continued)
(INFORMATION AS OF DECEMBER 31, 2009 AND FOR THE YEAR THEN ENDED NOT
COVERED BY AUDITORS' REPORT INCLUDED HEREIN)
1.1 SUMMARY OF SIGNIFICANT ACCOUNTING POLICIES (Continued)
These three groups of assets have been defined by the Group as the smallest identifiable groups of assets that generate cash inflows that are largely independent of the cash inflows from other assets or groups of assets.
Consequently, since 2008 the Group has had the following CGUs:
- •
-
The "salons" CGU, which comprises all of the Group's directly-owned salons. The intangible assets allocated to this CGU
for impairment testing purposes include lease premiums.
- •
-
The "franchises" CGU, which comprises the franchise networks of each trademark. The intangible assets allocated to this
CGU for impairment testing purposes include the Group's portfolio of franchise agreements and a portion of the value of its trademarks.
- •
- The "licenses" CGU which corresponds to the license agreements signed by the Group with certain suppliers. The intangible assets allocated to this CGU for impairment testing purposes include the remaining portion of the value of the Group's trademarks.
Impairment tests consist of comparing the asset's carrying amount to its recoverable amount. Recoverable amount is the higher of the asset's fair value and its value in use, calculated using the discounted cash flow method. When an asset's carrying amount exceeds its recoverable amount, an impairment loss is recorded as an operating expense under either "Depreciation, amortization and impairment" or "Other operating expenses", depending on the type of asset concerned.
Impairment losses are allocated first to goodwill and then to the other assets of the cash-generating unit pro rata on the basis of the carrying amount of each asset in the unit.
1.1.6.2 Main criteria used by the Group's Accounting and Finance Departments for impairment test calculations
At December 31, 2009 the Group applied a post-tax discount rate of 10% (compared with 9.74% at December 31, 2008), which reflected the risk-free rate and the risk premium.
A five-year projection period is used and the terminal value is determined by extrapolating to perpetuity the discounted cash flows for the fifth year.
The sensitivity of the value of goodwill to a 0.5% increase or decrease in the weighted average cost of capital or the long-term growth rate corresponds to a negative €3.7 million and a positive €3.8 million respectively.
1.1.6.3 Monitoring the recoverable amount of goodwill
In view of its nature, goodwill cannot be allocated to individual CGUs because the expected synergies arising from the purchase of a company will affect all of the CGUs.
Impairment losses on goodwill are not reversed even if the asset's value in use is restored in subsequent years.
163
PROVALLIANCE SAS
CONSOLIDATED FINANCIAL STATEMETS
DECEMBER 31, 2009 AND 2008
NOTES TO THE CONSOLIDATED FINANCIAL STATEMENTS (Continued)
(INFORMATION AS OF DECEMBER 31, 2009 AND FOR THE YEAR THEN ENDED NOT
COVERED BY AUDITORS' REPORT INCLUDED HEREIN)
1.1 SUMMARY OF SIGNIFICANT ACCOUNTING POLICIES (Continued)
1.1.6.4 Monitoring the recoverable amount of other assets
Other assets are allocated either to individual CGUs or groups of CGUs. Impairment losses recognized for these assets may be reversed through profit under the line "Depreciation, amortization and impairment".
1.1.7 Financial assets
1.1.7.1 Investments in non-consolidated companies
In accordance with IAS 39, investments in non-consolidated companies are classified as available-for-sale financial assets and are therefore carried at fair value. If their fair value cannot be determined reliably, the shares are recognized at cost. Where there is objective evidence that the financial asset is impaired, an impairment loss is recognized in the income statement. Any such impairment is only reversed through profit on disposal of the shares.
1.1.7.2 Other financial assets
Other financial assets correspond to guarantee deposits paid in connection with commercial leases required to operate the Group's salons.
The Group's financial assets do not include any derivative instruments.
1.1.8 Inventories
Inventories are stated at the lower of cost and net realizable value. Net realizable value corresponds to the estimated selling price in the ordinary course of business, less the estimated costs necessary to make the sale.
Internal margins on inventories are eliminated in consolidation.
1.1.9 Revenue recognition—"Rendering of services"
In compliance with IAS 18, revenue generated from the rendering of services is recognized as the hairdressing services are performed and the trademark franchise fees are received.
1.1.10 Deferred taxes
In accordance with IAS 12, deferred taxes are recognized, using the liability method, for temporary differences between the carrying amounts of certain assets and liabilities and their tax base. They are calculated using tax rates that have been enacted or substantively enacted by the end of the reporting period.
Deferred tax assets are recognized for the carryforward of unused tax losses to the extent that it is probable that future taxable profit will be available against which the unused tax losses can be utilized.
164
PROVALLIANCE SAS
CONSOLIDATED FINANCIAL STATEMETS
DECEMBER 31, 2009 AND 2008
NOTES TO THE CONSOLIDATED FINANCIAL STATEMENTS (Continued)
(INFORMATION AS OF DECEMBER 31, 2009 AND FOR THE YEAR THEN ENDED NOT
COVERED BY AUDITORS' REPORT INCLUDED HEREIN)
1.1 SUMMARY OF SIGNIFICANT ACCOUNTING POLICIES (Continued)
1.1.11 Receivables
Receivables are carried at cost less any impairment losses. An impairment loss is recorded when the carrying amount of a receivable exceeds its recoverable amount, corresponding to the present value of estimated future cash flows.
None of the Group's receivables are due in more than one year.
1.1.12 Cash and cash equivalents
Short-term investments are measured at fair value through profit, in compliance with IAS 39.
In application of IAS 7, the balance sheet line "Cash and cash equivalents" includes cash in hand and short-term highly liquid investments that are readily convertible to known amounts of cash and are subject to an insignificant risk of changes in value.
The fair value of these assets corresponds to their market value at the end of the reporting period. Gains and losses from changes in fair value are immediately recognized in the income statement under "Income from cash and cash equivalents".
1.1.13 Non-current assets held for sale and related liabilities
Immediately before the initial classification of an asset (or disposal group) as held for sale, the carrying amounts of the asset (or all the assets and liabilities in the group) are measured in accordance with applicable IFRSs. Subsequently, non-current assets (or disposal groups) classified as held for sale are measured at the lower of their carrying amount and fair value less costs to sell.
Any impairment losses arising from the classification of an asset (or disposal group) as held for sale are recognized in profit as are any gains or losses resulting from subsequent remeasurements. However, such gains recognized may not exceed any cumulative impairment loss previously recorded.
1.1.14 Provision for statutory retirement bonuses
This provision is intended to cover the Group's obligations corresponding to the present value of employees' vested rights in relation to bonuses payable on retirement as required under the applicable collective bargaining agreements. The amount of these obligations is calculated using the projected unit credit method based on assumptions concerning life expectancy, staff seniority, staff turnover and future salary levels and the application of a discount rate.
The main assumptions used correspond to average forecasts determined by reference to historical data over recent years, as follows:
- •
-
voluntary retirement age: 65
- •
- staff turnover: 0 to 20% depending on the age bracket concerned
165
PROVALLIANCE SAS
CONSOLIDATED FINANCIAL STATEMETS
DECEMBER 31, 2009 AND 2008
NOTES TO THE CONSOLIDATED FINANCIAL STATEMENTS (Continued)
(INFORMATION AS OF DECEMBER 31, 2009 AND FOR THE YEAR THEN ENDED NOT
COVERED BY AUDITORS' REPORT INCLUDED HEREIN)
1.1 SUMMARY OF SIGNIFICANT ACCOUNTING POLICIES (Continued)
- •
-
average estimated rate of future salary increases: 3%
- •
-
discount rate: 5.25%
- •
-
payroll tax rate: 40%
- •
-
life expectancy based on the TM 04-06 mortality table
- •
-
collective bargaining agreements applicable within the Group:
- •
-
Hairdressing
- •
-
Syntec
- •
- Advertising
Actuarial gains and losses arising as a result of changes in assumptions are recognized directly in the income statement.
1.1.15 Other employee benefit obligations—statutory training entitlement and long-service awards
The Group did not record a provision at December 31, 2009 for its estimated obligation related to training hours accrued by employees under their statutory entitlement as the amount involved was not material. This was due to (i) the number of training courses already provided; and (ii) the low probability of a specific request being made to use these statutory training hours. The measurement of this obligation may be reviewed in future based on training requests actually received over the coming years, and if necessary a provision may be recorded.
The collective bargaining agreements in force within the Group's companies do not contain any specific clauses concerning long-service awards. In addition, no specific agreements relating to such awards have been signed within any of the Group's subsidiaries.
1.1.16 Provisions for liabilities and charges
In accordance with IAS 37, a provision is recognized when the Group has a present obligation (legal or constructive) as a result of a past event and it is probable that an outflow of resources embodying economic benefits will be required to settle the obligation.
Unused provisions are reversed through profit and an explanatory note is provided in the consolidated financial statements.
Long-term provisions are discounted when the effect of discounting is material.
166
PROVALLIANCE SAS
CONSOLIDATED FINANCIAL STATEMETS
DECEMBER 31, 2009 AND 2008
NOTES TO THE CONSOLIDATED FINANCIAL STATEMENTS (Continued)
(INFORMATION AS OF DECEMBER 31, 2009 AND FOR THE YEAR THEN ENDED NOT
COVERED BY AUDITORS' REPORT INCLUDED HEREIN)
1.1 SUMMARY OF SIGNIFICANT ACCOUNTING POLICIES (Continued)
1.1.17 Share grants
In 2008, Provalliance set up a share grant plan for which an expense was recorded under payroll costs, in accordance with IFRS 2. The expense corresponding to the shares to be granted free of consideration is being recognized over the term of the plan, based on the probability that the underlying targets will be achieved.
The main features of the plan are as follows:
- •
-
Maximum number of shares that may be granted: 10,527,000
- •
-
Value of shares used for calculation: €0.70 per share
- •
-
Vesting conditions:
- •
-
Eight tranches, all with conditions based on the grantees still forming part of the Group and achieving consolidated
EBITDA targets during the vesting period
- •
-
Vesting period: minimum of two years and maximum of 15 years depending on the different tranches
- •
-
Number of shares granted during the year: 0
- •
- Number of shares forfeited during the year: 0
An expense of €880,000 was recorded in relation to this plan in 2009, with a corresponding adjustment to equity.
1.1.18 Equity warrants
Provalliance set up an equity warrant plan during 2008 under which it issued 17,750,000 warrants in two tranches. The first tranche comprised 9,341,826 warrants with a per-warrant purchase price of €0.08 (based on fair value) and an exercise price of €1.02, and the second tranche represented 8,408,174 warrants with a per-warrant purchase price of €0.04 (based on fair value) and an exercise price of €1.27.
The warrants issued under both of the tranches have an exercise period running from July 30, 2010 to December 31, 2018 and are subject to performance conditions based on consolidated EBITDA targets.
At December 31, 2009 a total of 17,750,000 warrants were outstanding. No warrants were exercised or forfeited during the year.
The main data used to calculate the fair value of these warrants were as follows:
- •
- Valuation model: Black and Scholes.
167
PROVALLIANCE SAS
CONSOLIDATED FINANCIAL STATEMETS
DECEMBER 31, 2009 AND 2008
NOTES TO THE CONSOLIDATED FINANCIAL STATEMENTS (Continued)
(INFORMATION AS OF DECEMBER 31, 2009 AND FOR THE YEAR THEN ENDED NOT
COVERED BY AUDITORS' REPORT INCLUDED HEREIN)
1.1 SUMMARY OF SIGNIFICANT ACCOUNTING POLICIES (Continued)
- •
-
Volatility: the EWMA (Exponentially Weighted Moving Average) method applied to a sample group of comparable companies.
- •
-
Maturity: between two and ten years with probabilities focused on years three and five.
- •
- Risk-free interest rate: interest rate for French treasury bonds (OAT) at the warrant issue date.
1.1.19 Financial liabilities
The Group's financial liabilities do not include any derivative instruments other than the interest rate hedges described in Note 14, "Financial Instruments".
At December 31, 2009 the Group did not hold any financial liabilities measured at fair value through profit.
Other current financial liabilities primarily correspond to bank overdrafts and credit facilities.
Borrowings are stated at amortized cost using the effective interest method.
1.1.20 Trade and other payables
Trade and other payables are stated at cost. They are all due within one year.
1.1.21 Non-controlling interests
This item corresponds to the portion of profit or loss and net assets of a subsidiary attributable to equity interests that are not owned, directly or indirectly through subsidiaries, by the parent. In accordance with paragraph 35 of IAS 27, when losses applicable to the non-controlling interest in a consolidated subsidiary exceed the non-controlling interest in the subsidiary's equity, the excess, and any further losses applicable to the non-controlling interest, are allocated against the controlling interest except to the extent that the non-controlling interest has a binding obligation to make an additional investment to cover the losses. If the subsidiary subsequently reports profits, such profits are allocated to the controlling interest until the non-controlling interest's share of losses previously absorbed by the controlling interest has been recovered.
1.1.22 Disclosures concerning related parties
The Group has identified the following related parties:
- •
-
its corporate shareholders
- •
- its key executive managers
Compensation and other benefits paid to related parties in 2009 amounted to €1,620,000, compared with €1,706,000 in 2008. No payments were made during the year under share grant or equity warrant plans.
168
PROVALLIANCE SAS
CONSOLIDATED FINANCIAL STATEMETS
DECEMBER 31, 2009 AND 2008
NOTES TO THE CONSOLIDATED FINANCIAL STATEMENTS (Continued)
(INFORMATION AS OF DECEMBER 31, 2009 AND FOR THE YEAR THEN ENDED NOT
COVERED BY AUDITORS' REPORT INCLUDED HEREIN)
1.1 SUMMARY OF SIGNIFICANT ACCOUNTING POLICIES (Continued)
The parent company of Provalliance SAS is SAS Provost Participations, whose registered office is located at 133 rue du Faubourg Saint Honoré, 75008 Paris, France (registration no. 501 636 898).
Related-party transactions and balances with Provost Participations SAS were as follows for the year ended December 31, 2009:
|
Balance sheet/Income statement item
|
Amount | |||
|---|---|---|---|---|
|
RECEIVABLES |
||||
|
—Other receivables |
2,668,721 | |||
|
PAYABLES |
||||
|
—Miscellaneous debt |
2,332,293 | |||
|
FINANCIAL EXPENSES |
||||
|
—Interest expense |
62,127 | |||
|
FINANCIAL INCOME |
||||
|
—Income from receivables |
52,155 | |||
1.1.23 Events after the reporting period
No significant events occurred between the end of the reporting period and the date these financial statements were authorized for issue.
1.1.24 New standards, interpretations and amendments to existing standards not yet applied by the Group
The Group did not apply the following new standards, interpretations and amendments to existing standards in its 2009 consolidated financial statements as they had either not been adopted by the European Union at December 31, 2009 or their application was not mandatory at that date:
- •
-
Revised version of IFRS 3, Business Combinations
- •
-
Revised version of IAS 27, Consolidated and Separate Financial Statements
- •
-
Amendments to IFRIC 14, Prepayments of a Minimum Funding Requirement
- •
-
IFRIC 12, Service Concession Arrangements
- •
-
IFRIC 15, Agreements for the Construction of Real Estate
- •
-
IFRIC 16, Hedges of a Net Investment in a Foreign Operation
- •
-
IFRIC 17, Distributions of Non-cash Assets to Owners
- •
-
IFRIC 18, Transfers of Assets from Customers
- •
- IFRIC 19, Extinguishing Financial Liabilities with Equity Instruments
169
PROVALLIANCE SAS
CONSOLIDATED FINANCIAL STATEMETS
DECEMBER 31, 2009 AND 2008
NOTES TO THE CONSOLIDATED FINANCIAL STATEMENTS (Continued)
(INFORMATION AS OF DECEMBER 31, 2009 AND FOR THE YEAR THEN ENDED NOT
COVERED BY AUDITORS' REPORT INCLUDED HEREIN)
1.1 SUMMARY OF SIGNIFICANT ACCOUNTING POLICIES (Continued)
- •
-
Amendment to IAS 39, Financial Instruments: Recognition and Measurement—Eligible Hedged Items
- •
-
Revised version of IFRS 1, First-time Adoption of International Financial Reporting Standards
- •
-
Amendments to IFRS 1—Additional Exemptions for First-time Adopters
- •
-
Amendments to IFRS 2—Group Cash-settled Share-based Payment Transactions
- •
-
Improvements to IFRSs (April 2009)
- •
-
Amendment to IAS 32—Classification of Rights Issues
- •
-
Revised version of IAS 24, Related Party Disclosures
- •
- IFRS 9, Financial Instruments
Provalliance SAS is currently in the process of determining the potential impact of these new standards, interpretations and amendments on the Group's consolidated financial statements. At this stage, the Group does not expect the impact to be material, except for (i) the revised version of IFRS 3 which introduces changes in accounting for business combinations that are required to be applied prospectively and (ii) IFRS 9, for which the Group has not yet begun its analysis in view of the fact that the standard has only recently been published and is still incomplete.
The Group is exposed to the following inter-related risks:
- •
-
Credit risk
- •
-
Liquidity risk
- •
- Market risk
This note sets out information on the Group's exposure to each of these risks, as well as the Group's objectives, strategy and procedures for risk management and assessment and its capital management practices. Quantitative information on these issues is provided in other sections of the consolidated financial statements.
It is the responsibility of the Chairman to define and oversee the Group's risk management process.
1.2.1 Credit risk
Credit risk refers to the risk that a customer or counterparty to a financial instrument will default on its contractual obligations resulting in a financial loss to the Group. This risk mainly arises from trade receivables and marketable securities.
170
CONSOLIDATED FINANCIAL STATEMETS
DECEMBER 31, 2009 AND 2008
NOTES TO THE CONSOLIDATED FINANCIAL STATEMENTS (Continued)
(INFORMATION AS OF DECEMBER 31, 2009 AND FOR THE YEAR THEN ENDED NOT
COVERED BY AUDITORS' REPORT INCLUDED HEREIN)
1.2 FINANCIAL RISK MANAGEMENT (Continued)
1.2.1.1 Trade and other receivables
The Group does not have any significant credit risk exposure on trade receivables as hairdressing services are paid for by customers on a cash basis and defaults by franchisees are rare.
Other receivables mainly correspond to prepaid and recoverable payroll and other taxes.
1.2.1.2 Investments
The Group restricts its exposure to this type of credit risk by only using short-term liquid investments.
1.2.1.3 Guarantees
The Group only grants financial guarantees to wholly-owned subsidiaries.
1.2.1.4 Bank counterparties
The Group only enters into financial undertakings with major financial institutions.
1.2.2 Liquidity risk
Liquidity risk corresponds to the risk that the Group will experience difficulties in honoring its debts when they fall due. The Group manages liquidity risk by ensuring that, to the extent possible, it will always have sufficient liquidity to settle its liabilities when they fall due, either in normal conditions or in difficult circumstances, without incurring unacceptable losses or damaging the Group's image.
The Group draws up earnings and cash flow forecasts for each hair salon it owns, which helps it to manage its cash flow needs and optimize its cash return on investments.
The Group generally ensures that it has sufficient demand deposits to cover its expected operating expenses for each coming month, including the amounts required to service its debt. However, these funds do not factor in the potential impact of extreme circumstances that cannot be reasonably anticipated.
The Group has entered into bank covenants with several financial institutions for the purpose of setting up external financing. The applicable ratios under these covenants—which vary depending on the type of acquisition involved—are as follows:
- •
-
Consolidated net debt/consolidated equity < 1 and Consolidated net debt/consolidated cash
flow < 4
- •
-
Consolidated net debt/consolidated equity < 0.75 and Consolidated net debt/consolidated EBITDA < 3.5
- •
- Consolidated net debt/equity < 0.75 and Consolidated net debt/consolidated cash flow < 3.5
171
PROVALLIANCE SAS
CONSOLIDATED FINANCIAL STATEMETS
DECEMBER 31, 2009 AND 2008
NOTES TO THE CONSOLIDATED FINANCIAL STATEMENTS (Continued)
(INFORMATION AS OF DECEMBER 31, 2009 AND FOR THE YEAR THEN ENDED NOT
COVERED BY AUDITORS' REPORT INCLUDED HEREIN)
1.2 FINANCIAL RISK MANAGEMENT (Continued)
The Group complied with all of its bank covenants at December 31, 2009.
1.2.3 Market risk
Market risk corresponds to the risk that changes in market prices, such as exchange rates, interest rates and the prices of equity instruments, will impact the Group's earnings or the value of the financial instruments it holds.
The Group's market risk management objective is to manage and control its exposure to market risk within acceptable limits, while optimizing reward-to-risk ratios.
1.2.3.1 Interest rate risk
The majority of the Group's borrowings are at fixed rates. Its most significant variable-rate borrowings are hedged by interest-rate swaps that have the same characteristics as the underlying loans.
The procedures for managing interest rate risk are described in Note 14.3.
1.2.3.2 Foreign exchange risk
The Group's exposure to foreign exchange risk is not significant.
1.2.3.3 Other market risks
The Group has not identified any other market risks.
* * *
*
172
PROVALLIANCE SAS
CONSOLIDATED FINANCIAL STATEMETS
DECEMBER 31, 2009 AND 2008
NOTES TO THE CONSOLIDATED FINANCIAL STATEMENTS (Continued)
(INFORMATION AS OF DECEMBER 31, 2009 AND FOR THE YEAR THEN ENDED NOT
COVERED BY AUDITORS' REPORT INCLUDED HEREIN)
2. LIST OF CONSOLIDATED COMPANIES
|
Company
|
Country | % Control |
Consolidation
method |
||||
|---|---|---|---|---|---|---|---|
|
HAIR SAINT GERMAIN |
FRANCE | 100.0 | % | FULL | |||
|
HAIR LEVALLOIS |
FRANCE | 100.0 | % | FULL | |||
|
HAIR SQUARE |
FRANCE | 100.0 | % | FULL | |||
|
FRANCK PROVOST RIVE DROITE |
FRANCE | 100.0 | % | FULL | |||
|
HAIR SHOW |
FRANCE | 100.0 | % | FULL | |||
|
HAIR SAINT CYR |
FRANCE | 100.0 | % | FULL | |||
|
RUEIL COUNTRY |
FRANCE | 100.0 | % | FULL | |||
|
HAIR MALESHERBES |
FRANCE | 100.0 | % | FULL | |||
|
SAS FRANCK PROVOST COIFFURE |
FRANCE | 100.0 | % | FULL | |||
|
HAIR COLOMBUS |
FRANCE | 51.0 | % | FULL | |||
|
HAIR CROISSY |
FRANCE | 100.0 | % | FULL | |||
|
HAIR HAUSSMANN |
FRANCE | 100.0 | % | FULL | |||
|
HAIR VENETTE |
FRANCE | 100.0 | % | FULL | |||
|
SALSA LAFFITTE |
FRANCE | 100.0 | % | FULL | |||
|
HAIR NEUILLY |
FRANCE | 100.0 | % | FULL | |||
|
HAIR INVALIDES |
FRANCE | 100.0 | % | FULL | |||
|
HAIR CHELLES |
FRANCE | 100.0 | % | FULL | |||
|
HAIR PASTEUR |
FRANCE | 51.0 | % | FULL | |||
|
HAIR ISSY |
FRANCE | 51.0 | % | FULL | |||
|
HAIR ANTONY |
FRANCE | 51.0 | % | FULL | |||
|
HAIR ROUBAIX-MONTESSON |
FRANCE | 100.0 | % | FULL | |||
|
HAIR DUNKERQUE |
FRANCE | 100.0 | % | FULL | |||
|
HAIR VAUCRESSON |
FRANCE | 100.0 | % | FULL | |||
|
HAIR MANET |
FRANCE | 100.0 | % | FULL | |||
|
HAIR SENART |
FRANCE | 100.0 | % | FULL | |||
|
F.P. COMMERCE |
FRANCE | 100.0 | % | FULL | |||
|
HAIR LAFFITTE |
FRANCE | 100.0 | % | FULL | |||
|
SALSA SAINT CLOUD |
FRANCE | 100.0 | % | FULL | |||
|
HAIR MATHURINS |
FRANCE | 100.0 | % | FULL | |||
|
HAIR SAINT HONORE |
FRANCE | 100.0 | % | FULL | |||
|
HAIR PAU |
FRANCE | 100.0 | % | FULL | |||
|
HAIR MAINE |
FRANCE | 91.0 | % | FULL | |||
|
HAIR LA REOLE |
FRANCE | 100.0 | % | FULL | |||
|
HAIR PERRET |
FRANCE | 100.0 | % | FULL | |||
|
SALSA FRANCONVILLE |
FRANCE | 100.0 | % | FULL | |||
|
HAIR POMPE |
FRANCE | 100.0 | % | FULL | |||
|
HAIR VILLEBON |
FRANCE | 100.0 | % | FULL | |||
|
HAIR SERRIS |
FRANCE | 100.0 | % | FULL | |||
173
PROVALLIANCE SAS
CONSOLIDATED FINANCIAL STATEMETS
DECEMBER 31, 2009 AND 2008
NOTES TO THE CONSOLIDATED FINANCIAL STATEMENTS (Continued)
(INFORMATION AS OF DECEMBER 31, 2009 AND FOR THE YEAR THEN ENDED NOT
COVERED BY AUDITORS' REPORT INCLUDED HEREIN)
2. LIST OF CONSOLIDATED COMPANIES (Continued)
|
Company
|
Country | % Control |
Consolidation
method |
||||
|---|---|---|---|---|---|---|---|
|
HAIR TAVERNY |
FRANCE | 100.0 | % | FULL | |||
|
SALSA CHELLES |
FRANCE | 100.0 | % | FULL | |||
|
SALSA POITIERS |
FRANCE | 100.0 | % | FULL | |||
|
HAIR CAREME |
FRANCE | 100.0 | % | FULL | |||
|
HAIR ENGLOS |
FRANCE | 100.0 | % | FULL | |||
|
HAIR RONCQ |
FRANCE | 100.0 | % | FULL | |||
|
HAIR BOULOGNE 2 |
FRANCE | 100.0 | % | FULL | |||
|
SALSA SAINT GERMAN |
FRANCE | 100.0 | % | FULL | |||
|
SALSA SENART |
FRANCE | 100.0 | % | FULL | |||
|
HAIR LONGCHAMPS |
FRANCE | 100.0 | % | FULL | |||
|
HAIR ADAM |
FRANCE | 100.0 | % | FULL | |||
|
HAIR LABEGE |
FRANCE | 100.0 | % | FULL | |||
|
HAIR CHATOU |
FRANCE | 100.0 | % | FULL | |||
|
HAIR VILLABE |
FRANCE | 100.0 | % | FULL | |||
|
ROLAND SAINT-CLAIR |
FRANCE | 100.0 | % | FULL | |||
|
JFG GALAXIE |
FRANCE | 100.0 | % | FULL | |||
|
JFG ITALIE 2 |
FRANCE | 100.0 | % | FULL | |||
|
AULNAY COIFFURE |
FRANCE | 100.0 | % | FULL | |||
|
NEW HAIR |
FRANCE | 100.0 | % | FULL | |||
|
PROVASSISTANCE |
FRANCE | 100.0 | % | FULL | |||
|
HAIR ARCEUIL |
FRANCE | 100.0 | % | FULL | |||
|
HAIR TOURNEFEUILLE |
FRANCE | 100.0 | % | FULL | |||
|
HAIR DRAGUIGNAN |
FRANCE | 100.0 | % | FULL | |||
|
HAIR THOIRY |
FRANCE | 100.0 | % | FULL | |||
|
HAIR LOUVROIL |
FRANCE | 100.0 | % | FULL | |||
|
EURL CPHC |
FRANCE | 100.0 | % | FULL | |||
|
HAIR SAINT SEVER |
FRANCE | 100.0 | % | FULL | |||
|
J C MANAGEMENT |
FRANCE | 100.0 | % | FULL | |||
|
HAIR CORMONTREUIL FP |
FRANCE | 100.0 | % | FULL | |||
|
SALSA CORMONTREUIL |
FRANCE | 100.0 | % | FULL | |||
|
LEERS 2 D |
FRANCE | 100.0 | % | FULL | |||
|
HAIR CALUIRE |
FRANCE | 100.0 | % | FULL | |||
|
HAIR FREJUS |
FRANCE | 100.0 | % | FULL | |||
|
HAIR AURAY |
FRANCE | 100.0 | % | FULL | |||
|
HAIR VANNES |
FRANCE | 100.0 | % | FULL | |||
|
ARCNA 136 |
FRANCE | 100.0 | % | FULL | |||
|
SAINT ALGUE BOULOGNE |
FRANCE | 100.0 | % | FULL | |||
|
HAIR TIFS |
FRANCE | 100.0 | % | FULL | |||
174
PROVALLIANCE SAS
CONSOLIDATED FINANCIAL STATEMETS
DECEMBER 31, 2009 AND 2008
NOTES TO THE CONSOLIDATED FINANCIAL STATEMENTS (Continued)
(INFORMATION AS OF DECEMBER 31, 2009 AND FOR THE YEAR THEN ENDED NOT
COVERED BY AUDITORS' REPORT INCLUDED HEREIN)
2. LIST OF CONSOLIDATED COMPANIES (Continued)
|
Company
|
Country | % Control |
Consolidation
method |
||||
|---|---|---|---|---|---|---|---|
|
HAIR DOCKS ROUEN |
FRANCE | 100.0 | % | FULL | |||
|
FABIO SALSA |
FRANCE | 100.0 | % | FULL | |||
|
AFAP |
FRANCE | 100.0 | % | FULL | |||
|
PROVELITE ACADEMY |
FRANCE | 100.0 | % | FULL | |||
|
ECI-FPC |
FRANCE | 50.0 | % | PROP | |||
|
SOCIETE 34 |
FRANCE | 100.0 | % | PROP | |||
|
81 COIFF |
FRANCE | 50.0 | % | PROP | |||
|
LEMPDES COIFF' |
FRANCE | 50.0 | % | PROP | |||
|
CLERMONT COIFFURE |
FRANCE | 50.0 | % | PROP | |||
|
ALBI COIFF |
FRANCE | 50.0 | % | PROP | |||
|
CANET COIFF |
FRANCE | 50.0 | % | PROP | |||
|
IBOS COIFF |
FRANCE | 50.0 | % | PROP | |||
|
LONS COIFF |
FRANCE | 50.0 | % | PROP | |||
|
MONT DE MARSAN COIFF |
FRANCE | 50.0 | % | PROP | |||
|
PAU COIFF |
FRANCE | 50.0 | % | PROP | |||
|
ARGELES COIFF |
FRANCE | 50.0 | % | PROP | |||
|
FINANCIERE SAINT HONORE |
FRANCE | 100.0 | % | FULL | |||
|
PROVALLIANCE SAS |
FRANCE | 100.0 | % | FULL | |||
|
SAF |
FRANCE | 100.0 | % | FULL | |||
|
JEAN LOUIS DAVID FRANCE |
FRANCE | 100.0 | % | FULL | |||
|
GIE PROVALLIANCE |
FRANCE | 100.0 | % | FULL | |||
|
PROMODAVID |
FRANCE | 100.0 | % | FULL | |||
|
MS 3000 |
FRANCE | 100.0 | % | FULL | |||
|
HECH SAINT QUENTIN |
FRANCE | 100.0 | % | FULL | |||
|
COMPAGNIE GENERALE DE PARTNARIAT |
FRANCE | 100.0 | % | FULL | |||
|
SAINT KARL DIFFUSION |
FRANCE | 100.0 | % | FULL | |||
|
INT CASTRES |
FRANCE | 50.0 | % | PROP | |||
|
CLP COIFFURE |
FRANCE | 100.0 | % | FULL | |||
|
DAM COIFFURE |
FRANCE | 100.0 | % | FULL | |||
|
MAXILOO |
FRANCE | 100.0 | % | FULL | |||
|
CJM |
FRANCE | 100.0 | % | FULL | |||
|
CHAMBRAY COIFFURE |
FRANCE | 100.0 | % | FULL | |||
|
VILLEJUIF COIFFURE |
FRANCE | 90.0 | % | FULL | |||
|
ORMESSON COIFFURE |
FRANCE | 100.0 | % | FULL | |||
|
D'ARDON COIFFURE |
FRANCE | 90.0 | % | FULL | |||
|
VILLABE COIFFURE |
FRANCE | 100.0 | % | FULL | |||
|
SAINT PIERRE COIFFURE |
FRANCE | 85.0 | % | FULL | |||
|
BONNE SOURCE COIFFURE |
FRANCE | 90.0 | % | FULL | |||
175
PROVALLIANCE SAS
CONSOLIDATED FINANCIAL STATEMETS
DECEMBER 31, 2009 AND 2008
NOTES TO THE CONSOLIDATED FINANCIAL STATEMENTS (Continued)
(INFORMATION AS OF DECEMBER 31, 2009 AND FOR THE YEAR THEN ENDED NOT
COVERED BY AUDITORS' REPORT INCLUDED HEREIN)
2. LIST OF CONSOLIDATED COMPANIES (Continued)
|
Company
|
Country | % Control |
Consolidation
method |
||||
|---|---|---|---|---|---|---|---|
|
RJD COIFFURE |
FRANCE | 85.0 | % | FULL | |||
|
KAP COIFFURE |
FRANCE | 100.0 | % | FULL | |||
|
LJPP |
FRANCE | 90.0 | % | FULL | |||
|
WASQUEHAL COIFFURE |
FRANCE | 100.0 | % | FULL | |||
|
SAINT EULALIE COIFFURES |
FRANCE | 100.0 | % | FULL | |||
|
LIBOURNE COIFFURES |
FRANCE | 100.0 | % | FULL | |||
|
TVNP |
FRANCE | 100.0 | % | FULL | |||
|
LMH COIFFURE |
FRANCE | 100.0 | % | FULL | |||
|
COVEGA |
FRANCE | 100.0 | % | FULL | |||
|
SAINT KARL BILBAO |
FRANCE | 98.9 | % | FULL | |||
|
FIL O KAP |
FRANCE | 98.7 | % | FULL | |||
|
SOREFICO COIFFURE |
FRANCE | 100.0 | % | FULL | |||
|
SALONS DE FRANCE |
FRANCE | 100.0 | % | FULL | |||
|
HAIR CC BOULAZAC |
FRANCE | 100.0 | % | FULL | |||
|
HAIR CC MARSAC |
FRANCE | 100.0 | % | FULL | |||
|
HAIR CHAMPS |
FRANCE | 100.0 | % | FULL | |||
|
GUERIN COIFFURE |
FRANCE | 100.0 | % | FULL | |||
|
MARBEUF COIFFURE |
FRANCE | 100.0 | % | FULL | |||
|
FORUM COIFFURE |
FRANCE | 100.0 | % | FULL | |||
|
J.M.S. SERVICES |
FRANCE | 100.0 | % | FULL | |||
|
SALSA ANGERS |
FRANCE | 100.0 | % | FULL | |||
|
HAIR FRANCHEVILLE |
FRANCE | 100.0 | % | FULL | |||
|
HAIR IBIS |
FRANCE | 100.0 | % | FULL | |||
|
HAIR CC NIORT |
FRANCE | 100.0 | % | FULL | |||
|
HAIR CC DIJON |
FRANCE | 100.0 | % | FULL | |||
|
HAIR CC GERS |
FRANCE | 100.0 | % | FULL | |||
|
HAIR CC AQUITAINE |
FRANCE | 100.0 | % | FULL | |||
|
FP EXTENSIONS |
FRANCE | 100.0 | % | FULL | |||
|
HAIR POITIERS |
FRANCE | 100.0 | % | FULL | |||
|
AQUITAINE COIFFURE |
FRANCE | 100.0 | % | FULL | |||
|
DSL FINANCES |
FRANCE | 100.0 | % | FULL | |||
|
GIRONDE COIFFURE |
FRANCE | 100.0 | % | FULL | |||
|
SOREFICO |
FRANCE | 100.0 | % | FULL | |||
|
ELEXIA |
FRANCE | 66.7 | % | FULL | |||
|
BIG SERVICES |
FRANCE | 100.00 | % | FULL | |||
|
PROVALLIANCE SALONS |
FRANCE | 100.00 | % | FULL | |||
|
COMPAGNIE GENERALE DE COIFFURE AUVERGNAT |
FRANCE | 100.00 | % | FULL | |||
176
PROVALLIANCE SAS
CONSOLIDATED FINANCIAL STATEMETS
DECEMBER 31, 2009 AND 2008
NOTES TO THE CONSOLIDATED FINANCIAL STATEMENTS (Continued)
(INFORMATION AS OF DECEMBER 31, 2009 AND FOR THE YEAR THEN ENDED NOT
COVERED BY AUDITORS' REPORT INCLUDED HEREIN)
2. LIST OF CONSOLIDATED COMPANIES (Continued)
|
Company
|
Country | % Control |
Consolidation
method |
||||
|---|---|---|---|---|---|---|---|
|
CLUB DE LA COIFFURE |
FRANCE | 100.00 | % | FULL | |||
|
JM ATHIS MONS |
FRANCE | 100.00 | % | FULL | |||
|
SOREFICO COIFFURE EXPANSION |
FRANCE | 100.00 | % | FULL | |||
|
PROVALLIANCE SALONS LUXEMBOURG |
LUXEMBOURG | 100.0 | % | FULL | |||
|
PROVALLIANCE POLAND |
POLAND | 72.0 | % | FULL | |||
|
TWOJ FRYZJER |
POLAND | 72.0 | % | FULL | |||
|
ALLIANCE PROV |
SPAIN | 72.5 | % | FULL | |||
|
JLD FRANCHISES SPAIN |
SPAIN | 100.0 | % | FULL | |||
|
FRANCK PROVOST SALONS SPAIN |
SPAIN | 100.0 | % | FULL | |||
|
FILICUDI |
SPAIN | 100.0 | % | FULL | |||
|
FARAGLIONE |
SPAIN | 100.0 | % | FULL | |||
|
LINEA ESTILISMO |
SPAIN | 100.0 | % | FULL | |||
|
HAIR REYES |
SPAIN | 78.2 | % | FULL | |||
|
HAIR 124 |
SPAIN | 50.0 | % | PROP | |||
|
MAJUNGA |
SPAIN | 80.0 | % | FULL | |||
|
JLD SALONS SPAIN |
SPAIN | 100.0 | % | FULL | |||
|
ESPACE COIFFURE |
SPAIN | 100.0 | % | FULL | |||
|
SAINT KARL EXPANSAO |
PORTUGAL | 99.9 | % | FULL | |||
|
SKA CABELEIREIROS |
PORTUGAL | 85.0 | % | FULL | |||
|
SKABIS CABELEIREIROS |
PORTUGAL | 100.0 | % | FULL | |||
|
SKB CABELEIREIROS |
PORTUGAL | 100.0 | % | FULL | |||
|
SKB2 CABELEIREIROS |
PORTUGAL | 100.0 | % | FULL | |||
|
SKG CABELEIREIROS |
PORTUGAL | 85.0 | % | FULL | |||
|
SKV CABELEIREIROS |
PORTUGAL | 85.0 | % | FULL | |||
|
SKM CABELEIREIROS |
PORTUGAL | 100.0 | % | FULL | |||
|
SKN CABELEIREIROS |
PORTUGAL | 100.0 | % | FULL | |||
|
JPS CABELEIREIROS |
PORTUGAL | 85.0 | % | FULL | |||
|
PASMAR CABELEIREIROS |
PORTUGAL | 100.0 | % | FULL | |||
|
SKAL CABELEIREIROS |
PORTUGAL | 100.0 | % | FULL | |||
|
SKS CABELEIREIROS |
PORTUGAL | 85.0 | % | FULL | |||
|
SYLVAIN CABELEIREIROS |
PORTUGAL | 85.0 | % | FULL | |||
|
SKL CABELEIREIROS |
PORTUGAL | 100.0 | % | FULL | |||
|
RHS SWISS |
SWITZERLAND | 100.0 | % | FULL | |||
FULL: fully consolidated
PROP: proportionately consolidated
177
PROVALLIANCE SAS
CONSOLIDATED FINANCIAL STATEMETS
DECEMBER 31, 2009 AND 2008
NOTES TO THE CONSOLIDATED FINANCIAL STATEMENTS (Continued)
(INFORMATION AS OF DECEMBER 31, 2009 AND FOR THE YEAR THEN ENDED NOT
COVERED BY AUDITORS' REPORT INCLUDED HEREIN)
3.1. LIST OF NEWLY-CONSOLIDATED AND DECONSOLIDATED COMPANIES
|
Company
|
Consolidation method
Year ended Dec. 31, 2009 |
Consolidation method
Year ended Dec. 31, 2008 |
||
|---|---|---|---|---|
|
Newly-consolidated companies (11) |
||||
|
FRANCK PROVOST BOULOGNE (ETHANOUS) |
FULL | NC | ||
|
HAIR TIFS |
FULL | NC | ||
|
DOCKS ROUEN |
FULL | NC | ||
|
SARL HECH—SERGIO BOSSI |
FULL | NC | ||
|
GUERIN COIFFURE (MANIATIS) |
FULL | NC | ||
|
MARBEUF COIFFURE (MANIATIS) |
FULL | NC | ||
|
FORUM COIFFURE (MANIATIS) |
FULL | NC | ||
|
JMS SERVICES (MANIATIS) |
FULL | NC | ||
|
SALSA ANGERS |
FULL | NC | ||
|
HAIR FRANCHEVILLE |
FULL | NC | ||
|
ARGELES COIFF |
PROP | NC | ||
|
Deconsolidated companies (24) |
||||
|
AMEPAUL |
NC(1) | FULL | ||
|
HAIR ROUEN |
NC(1) | FULL | ||
|
HAIR CHERBOURG |
NC(1) | FULL | ||
|
HAIR CAEN |
NC(1) | FULL | ||
|
HAIR MONDEVILLE |
NC(1) | FULL | ||
|
SOHAIRA |
NC(1) | FULL | ||
|
INTERVIEW—VALENCE—CROISSANCE |
NC(1) | FULL | ||
|
INTERVIEW ORANGE |
NC(1) | FULL | ||
|
INTERVIEW—AVIGNON—BIG BBR |
NC(1) | FULL | ||
|
INTERVIEW CARRE SUD |
NC(1) | FULL | ||
|
INTERVIEW—SAINT MARTIN STUDIO COIFFURE |
NC(1) | FULL | ||
|
INTERVIEW—LES—ANGLES—MURIEL |
NC(1) | FULL | ||
|
INTERVIEW—ISTRES—ACTION |
NC(1) | FULL | ||
|
INTERVIEW—MONTPELLIER |
NC(1) | FULL | ||
|
INTERVIEW—BASSENS—COIFF MOD |
NC(1) | FULL | ||
|
INTERVIEW—JUVIGNAC—BIG JO |
NC(1) | FULL | ||
|
INTERVIEW—PEZENAS—BIG MASTER |
NC(1) | FULL | ||
|
INTERVIEW—PEROLS—BIG ONE |
NC(1) | FULL | ||
|
INTERVIEW—LATTES—BIG PLUS |
NC(1) | FULL | ||
|
ARLES—BIG MAR |
NC(1) | FULL | ||
|
BIGYANN |
NC(1) | FULL | ||
|
SALSA IFS |
NC(1) | FULL | ||
|
SOLI DEAUVILLE |
NC(1) | FULL |
178
PROVALLIANCE SAS
CONSOLIDATED FINANCIAL STATEMETS
DECEMBER 31, 2009 AND 2008
NOTES TO THE CONSOLIDATED FINANCIAL STATEMENTS (Continued)
(INFORMATION AS OF DECEMBER 31, 2009 AND FOR THE YEAR THEN ENDED NOT
COVERED BY AUDITORS' REPORT INCLUDED HEREIN)
3. BUSINESS COMBINATIONS (Continued)
|
Company
|
Consolidation method
Year ended Dec. 31, 2009 |
Consolidation method
Year ended Dec. 31, 2008 |
||
|---|---|---|---|---|
|
INTERVIEW NIMES |
NC(1) | FULL |
FULL: fully consolidated
PROP: proportionately consolidated
NC: not consolidated
- (1)
- Companies whose assets and liabilities were fully transferred during the year
3.2. IMPACT OF ALLOCATING THE PURCHASE PRICE OF THE MANIATIS GROUP
The purchase price allocation process for the acquisitions carried out during the period did not result in any material revaluations of assets and liabilities. These acquisitions generated €43,000 in unallocated goodwill and €2,265,000 in goodwill allocated to hair salons.
179
PROVALLIANCE SAS
CONSOLIDATED FINANCIAL STATEMETS
DECEMBER 31, 2009 AND 2008
NOTES TO THE CONSOLIDATED FINANCIAL STATEMENTS (Continued)
(INFORMATION AS OF DECEMBER 31, 2009 AND FOR THE YEAR THEN ENDED NOT
COVERED BY AUDITORS' REPORT INCLUDED HEREIN)
|
|
Unallocated
goodwill(1) |
Goodwill
allocated to hair salons(2) |
Lease
premiums |
Franchise
network |
Trademarks
and brands |
Patents and
licenses |
Other,
including assets in progress |
Total | |||||||||||||||||
|---|---|---|---|---|---|---|---|---|---|---|---|---|---|---|---|---|---|---|---|---|---|---|---|---|---|
|
At January 1, 2008 |
|||||||||||||||||||||||||
|
Cost |
20,036,477 | 43,767,072 | 1,298,176 | 1,175,703 | 21,098 | 66,298,526 | |||||||||||||||||||
|
Accumulated amortization and impairment |
(1,385,798 | ) | (1,462,636 | ) | (120,283 | ) | (15,000 | ) | (2,983,717 | ) | |||||||||||||||
|
Carrying amount |
18,650,679 | 42,304,436 | 1,298,176 | 1,055,420 | 6,098 | 63,314,809 | |||||||||||||||||||
|
Year ended December 31, 2008 |
|||||||||||||||||||||||||
|
Carrying amount at January 1 |
18,650,679 | 42,304,436 | 1,298,176 | 1,055,420 | 6,098 | 63,314,809 | |||||||||||||||||||
|
Acquisitions |
267,202 | 267,202 | |||||||||||||||||||||||
|
Assets held for sale |
21,057 | 43,136 | 64,193 | ||||||||||||||||||||||
|
Disposals |
(1,074,695 | ) | (233,091 | ) | (1,307,786 | ) | |||||||||||||||||||
|
Business combinations |
35,497,834 | 37,195,912 | 2,755,755 | 9,563,207 | 29,425,853 | 301,018 | 114,739,579 | ||||||||||||||||||
|
Other movements(3) |
3,103,000 | (10,917,449 | ) | 10,917,449 | 864,749 | (864,749 | ) | 3,103,000 | |||||||||||||||||
|
Impairment |
(1,174,246 | ) | (334 | ) | (1,174,580 | ) | |||||||||||||||||||
|
Amortization expense |
(584,418 | ) | (1,106,424 | ) | (201,906 | ) | (1,892,748 | ) | |||||||||||||||||
|
Reversals of provisions and amortization |
106,472 | 106,472 | |||||||||||||||||||||||
|
Carrying amount |
57,251,513 | 66,461,487 | 14,781,091 | 8,978,789 | 29,184,178 | 491,689 | 71,394 | 177,220,141 | |||||||||||||||||
|
At December 31, 2008 |
|||||||||||||||||||||||||
|
Cost |
58,637,311 | 68,991,897 | 14,781,425 | 9,563,207 | 30,290,602 | 611,972 | 288,300 | 183,164,714 | |||||||||||||||||
|
Accumulated amortization and impairment |
(1,385,798 | ) | (2,530,410 | ) | (334 | ) | (584,418 | ) | (1,106,424 | ) | (120,283 | ) | (216,906 | ) | (5,944,573 | ) | |||||||||
|
Carrying amount |
57,251,513 | 66,461,487 | 14,781,091 | 8,978,789 | 29,184,178 | 491,689 | 71,394 | 177,220,141 | |||||||||||||||||
|
Year ended December 31, 2009 |
|||||||||||||||||||||||||
|
Carrying amount at January 1 |
57,251,513 | 66,461,487 | 14,781,091 | 8,978,789 | 29,184,178 | 491,689 | 71,394 | 177,220,141 | |||||||||||||||||
|
Acquisitions |
2,168,350 | 240,760 | 269,294 | 2,184 | 2,680,588 | ||||||||||||||||||||
|
Assets held for sale |
|||||||||||||||||||||||||
|
Disposals |
(2,059,324 | ) | (242,934 | ) | (10,052 | ) | (105,933 | ) | (2,418,243 | ) | |||||||||||||||
|
Business combinations |
539,165 | 2,529,475 | 666,944 | 55,571 | 3,791,155 | ||||||||||||||||||||
|
Other movements(4) |
(146,900 | ) | 59,844 | 97,056 | 10,000 | ||||||||||||||||||||
|
Impairment |
(1,531,288 | ) | (132,363 | ) | (1,663,651 | ) | |||||||||||||||||||
|
Amortization expense |
(637,547 | ) | (1,207,007 | ) | (207,836 | ) | (57,508 | ) | (2,109,898 | ) | |||||||||||||||
|
Reversals of provisions and amortization |
866,119 | 1,052 | 60,080 | 927,251 | |||||||||||||||||||||
|
Carrying amount |
57,790,678 | 68,287,919 | 15,313,498 | 8,341,242 | 27,977,171 | 603,991 | 122,844 | 178,437,343 | |||||||||||||||||
|
At December 31, 2009 |
|||||||||||||||||||||||||
|
Cost |
59,176,476 | 71,483,498 | 15,446,195 | 9,563,207 | 30,290,602 | 931,058 | 337,178 | 187,228,214 | |||||||||||||||||
|
Accumulated amortization and impairment |
(1,385,798 | ) | (3,195,579 | ) | (132,697 | ) | (1,221,965 | ) | (2,313,431 | ) | (327,067 | ) | (214,334 | ) | (8,790,871 | ) | |||||||||
|
Carrying amount |
57,790,678 | 68,287,919 | 15,313,498 | 8,341,242 | 27,977,171 | 603,991 | 122,844 | 178,437,343 | |||||||||||||||||
- (1)
-
The
put options on minority shares in Elexia and Provalliance Spain generated goodwill totaling €2,253,000 at the year-end.
- (2)
-
Goodwill
allocated to hair salons corresponds to the value of customer relationships less the value of the applicable lease premiums.
- (3)
-
Reallocation
of intangible assets in accordance with the method described in Note 1.1.4.2.
- (4)
- Inter-account reclassifications.
180
PROVALLIANCE SAS
CONSOLIDATED FINANCIAL STATEMETS
DECEMBER 31, 2009 AND 2008
NOTES TO THE CONSOLIDATED FINANCIAL STATEMENTS (Continued)
(INFORMATION AS OF DECEMBER 31, 2009 AND FOR THE YEAR THEN ENDED NOT
COVERED BY AUDITORS' REPORT INCLUDED HEREIN)
5. PROPERTY, PLANT AND EQUIPMENT
|
|
Land | Buildings |
Plant and
equipment |
Other(1) |
Assets under
construction |
Advances and
downpayments |
Total | |||||||||||||||
|---|---|---|---|---|---|---|---|---|---|---|---|---|---|---|---|---|---|---|---|---|---|---|
|
At January 1, 2008 |
||||||||||||||||||||||
|
Cost |
130,544 | 2,767,734 | 22,680,320 | 65,800 | 58,528 | 25,702,926 | ||||||||||||||||
|
Accumulated depreciation and impairment |
(91,726 | ) | (1,835,809 | ) | (12,031,961 | ) | (13,959,496 | ) | ||||||||||||||
|
Carrying amount |
38,818 | 931,925 | 10,648,359 | 65,800 | 58,528 | 11,743,430 | ||||||||||||||||
|
Year ended December 31, 2008 |
||||||||||||||||||||||
|
Carrying amount at January 1 |
38,818 | 931,925 | 10,648,359 | 65,800 | 58,528 | 11,743,430 | ||||||||||||||||
|
Acquisitions |
184,163 | 3,094,820 | 9,011,404 | 192,628 | 632,649 | 13,115,664 | ||||||||||||||||
|
Assets held for sale |
||||||||||||||||||||||
|
Disposals |
(713,019 | ) | (932,271 | ) | (5,172,099 | ) | (92,987 | ) | (572,411 | ) | (7,482,787 | ) | ||||||||||
|
Business combinations |
777,358 | 1,597,061 | 5,261,518 | 27,187 | 31,429 | 7,694,553 | ||||||||||||||||
|
Other movements |
||||||||||||||||||||||
|
Impairment |
(363,923 | ) | (363,923 | ) | ||||||||||||||||||
|
Depreciation expense |
(48,065 | ) | (656,633 | ) | (2,905,837 | ) | (3,610,535 | ) | ||||||||||||||
|
Reversals of provisions and depreciation |
768,836 | 677,414 | 4,554,889 | (6,001,139 | ) | |||||||||||||||||
|
Carrying amount |
1,404,447 | 7,691,114 | 29,073,758 | 192,628 | 150,195 | 38,512,142 | ||||||||||||||||
|
At December 31, 2008 |
||||||||||||||||||||||
|
Cost |
379,046 | 6,527,344 | 31,781,143 | 192,628 | 150,195 | 39,030,356 | ||||||||||||||||
|
Accumulated depreciation and impairment |
265,122 | (1,815,028 | ) | (10,382,909 | ) | (11,932,815 | ) | |||||||||||||||
|
Carrying amount |
644,168 | 4,712,316 | 21,398,234 | 192,628 | 150,195 | 27,097,541 | ||||||||||||||||
|
Year ended December 31, 2009 |
||||||||||||||||||||||
|
Carrying amount at January 1 |
644,168 | 4,712,316 | 21,398,234 | 192,628 | 150,195 | 27,097,541 | ||||||||||||||||
|
Acquisitions |
167,162 | 1,182,870 | 5,392,890 | 158,400 | 414,647 | 7,315,969 | ||||||||||||||||
|
Assets held for sale |
||||||||||||||||||||||
|
Disposals |
(218,329 | ) | (1,614,018 | ) | (1,750,740 | ) | (188,265 | ) | (327,625 | ) | (4,098,977 | ) | ||||||||||
|
Business combinations |
80,176 | (35,871 | ) | 442,687 | 486,992 | |||||||||||||||||
|
Other movements(1) |
(36,267 | ) | (825,320 | ) | 916,092 | (65,078 | ) | (10,573 | ) | |||||||||||||
|
Impairment |
(9,346 | ) | (9,346 | ) | ||||||||||||||||||
|
Depreciation expense |
(164,612 | ) | (1,120,379 | ) | (4,973,150 | ) | (6,258,141 | ) | ||||||||||||||
|
Reversals of provisions and depreciation |
195,137 | 2,082,154 | 1,550,056 | 3,827,347 | ||||||||||||||||||
|
Carrying amount |
755,256 | 3,487,866 | 25,851,242 | 162,763 | 107,061 | 30,364,188 | ||||||||||||||||
|
At December 31, 2009 |
||||||||||||||||||||||
|
Cost |
371,788 | 5,235,005 | 36,782,072 | 162,763 | 172,139 | 42,723,767 | ||||||||||||||||
|
Accumulated depreciation and impairment |
286,301 | (853,253 | ) | (13,806,003 | ) | (14,372,955 | ) | |||||||||||||||
|
Carrying amount |
658,089 | 4,381,752 | 22,976,069 | 162,763 | 172,139 | 28,350,812 | ||||||||||||||||
- (1)
- Inter-account reclassifications.
181
PROVALLIANCE SAS
CONSOLIDATED FINANCIAL STATEMETS
DECEMBER 31, 2009 AND 2008
NOTES TO THE CONSOLIDATED FINANCIAL STATEMENTS (Continued)
(INFORMATION AS OF DECEMBER 31, 2009 AND FOR THE YEAR THEN ENDED NOT
COVERED BY AUDITORS' REPORT INCLUDED HEREIN)
6. NON-CURRENT FINANCIAL ASSETS
|
|
Investments in
non-consolidated companies |
Loans and
advances to subsidiaries and associates |
Other
investment securities |
Loans |
Other
non-current financial assets(1) |
Total | |||||||||||||
|---|---|---|---|---|---|---|---|---|---|---|---|---|---|---|---|---|---|---|---|
|
At January 1, 2008 |
|||||||||||||||||||
|
Cost |
158,813 | 1,601 | 3,419 | 2,575,551 | 2,739,384 | ||||||||||||||
|
Accumulated amortization and impairment |
(28,000 | ) | (45,761 | ) | (73,761 | ) | |||||||||||||
|
Carrying amount |
130,813 | 1,601 | 3,419 | 2,529,790 | 2,665,623 | ||||||||||||||
|
Year ended December 31, 2008 |
|||||||||||||||||||
|
Carrying amount at January 1 |
130,813 | 1,601 | 3,419 | 2,529,790 | 2,665,623 | ||||||||||||||
|
Acquisitions |
13,010 | 5,000 | 992,032 | 1,010,042 | |||||||||||||||
|
Assets held for sale |
|||||||||||||||||||
|
Disposals |
(35,307 | ) | (250,263 | ) | (285,570 | ) | |||||||||||||
|
Business combinations |
1,022,331 | 254,951 | 2,281 | 139,571 | 1,372,216 | 2,791,350 | |||||||||||||
|
Other movements |
|||||||||||||||||||
|
Impairment |
(1,048,547 | ) | (1,048,547 | ) | |||||||||||||||
|
Amortization expense |
|||||||||||||||||||
|
Reversals of provisions and amortization |
45,761 | 45,761 | |||||||||||||||||
|
Carrying amount |
104,597 | 267,961 | 3,882 | 112,683 | 4,689,536 | 5,178,659 | |||||||||||||
|
At December 31, 2008 |
|||||||||||||||||||
|
Cost |
1,181,144 | 267,961 | 3,882 | 112,683 | 4,689,536 | 6,255,206 | |||||||||||||
|
Accumulated amortization and impairment |
(1,076,547 | ) | (1,076,547 | ) | |||||||||||||||
|
Carrying amount |
104,597 | 267,961 | 3,882 | 112,683 | 4,689,536 | 5,178,659 | |||||||||||||
|
Year ended December 31, 2009 |
|||||||||||||||||||
|
Carrying amount at January 1 |
104,597 | 267,961 | 3,882 | 112,683 | 4,689,536 | 5,178,659 | |||||||||||||
|
Acquisitions |
473 | 33,225 | 533,878 | 567,576 | |||||||||||||||
|
Assets held for sale |
|||||||||||||||||||
|
Disposals |
(30,979 | ) | (120,380 | ) | (471 | ) | (55,250 | ) | (128,920 | ) | (336,000 | ) | |||||||
|
Business combinations |
74,044 | 5,791 | 84,110 | 163,945 | |||||||||||||||
|
Other movements |
37,200 | (37,200 | ) | ||||||||||||||||
|
Impairment |
(473 | ) | (12,365 | ) | (12,838 | ) | |||||||||||||
|
Amortization expense |
|||||||||||||||||||
|
Reversals of provisions and amortization |
|||||||||||||||||||
|
Carrying amount |
73,618 | 258,825 | 9,202 | 53,458 | 5,166,239 | 5,561,342 | |||||||||||||
|
At December 31, 2009 |
|||||||||||||||||||
|
Cost |
1,150,165 | 258,825 | 9,675 | 53,458 | 5,178,604 | 6,650,727 | |||||||||||||
|
Accumulated amortization and impairment |
(1,076,547 | ) | (473 | ) | (12,365 | ) | (1,089,385 | ) | |||||||||||
|
Carrying amount |
73,618 | 258,825 | 9,202 | 53,458 | 5,166,239 | 5,561,342 | |||||||||||||
- (1)
- Other non-current financial assets mainly correspond to guarantee deposits relating to the commercial leases of each salon.
182
PROVALLIANCE SAS
CONSOLIDATED FINANCIAL STATEMETS
DECEMBER 31, 2009 AND 2008
NOTES TO THE CONSOLIDATED FINANCIAL STATEMENTS (Continued)
(INFORMATION AS OF DECEMBER 31, 2009 AND FOR THE YEAR THEN ENDED NOT
COVERED BY AUDITORS' REPORT INCLUDED HEREIN)
7. CURRENT AND DEFERRED INCOME TAXES
7.1. Analysis of income tax expense
|
|
2009 | 2008 | |||||
|---|---|---|---|---|---|---|---|
|
Current taxes |
1,700,521 | 3,538,460 | |||||
|
Elimination of internal margin on non-current assets |
(25,526 | ) | (87,638 | ) | |||
|
Elimination of internal provision for impairment of current assets |
370,042 | 120,529 | |||||
|
Elimination of internal provision for negative net equity risk |
290,325 | 106,244 | |||||
|
Elimination of internal gains on inventories |
(6,729 | ) | 16,785 | ||||
|
Restatement of rental expense |
(295,201 | ) | |||||
|
Deferred taxes on fair value adjustments |
(363,655 | ) | (169,796 | ) | |||
|
Provisions for pension and other post-employment benefit obligations |
(56,674 | ) | (25,994 | ) | |||
|
Elimination of untaxed provisions |
41,652 | 33,340 | |||||
|
Recognition of unused tax losses |
(1,482,071 | ) | (1,391,697 | ) | |||
|
Fair value adjustments to financial instruments |
(118,081 | ) | |||||
|
Non-deductible provisions |
(681,702 | ) | |||||
|
Other |
(4,204 | ) | 24,267 | ||||
|
Actual income tax expense |
345,600 | 1,187,597 | |||||
7.2. Tax proof
|
|
2009 | 2008 | ||||||
|---|---|---|---|---|---|---|---|---|
|
Theoretical taxable profit |
10,786,055 | 11,240,870 | ||||||
|
Parent company tax rate |
33.33 | % | 33.33 | % | ||||
|
Theoretical income tax expense |
3,594,992 | 3,746,582 | ||||||
|
Actual income tax expense |
345,600 | 1,187,597 | ||||||
|
Difference between theoretical and actual income tax expense |
(3,249,392 | ) | (2,558,985 | ) | ||||
|
Analysis of difference |
||||||||
|
Impact of differences in tax rates |
(2,122,038 | ) | (2,139,806 | ) | ||||
|
Impact of permanent differences |
803,223 | (20,988 | ) | |||||
|
Impact of tax credits |
(362,795 | ) | (408,993 | ) | ||||
|
Impact of gains and losses on disposals of consolidated companies |
(178,740 | ) | 15,847 | |||||
|
Impact of unused tax losses not recognized as deferred tax assets |
(1,376,349 | ) | (28,829 | ) | ||||
|
Impact of goodwill impairment expense |
(24,664 | ) | ||||||
|
Other |
(12,693 | ) | 48,448 | |||||
|
TOTAL |
(3,249,392 | ) | (2,558,985 | ) | ||||
183
PROVALLIANCE SAS
CONSOLIDATED FINANCIAL STATEMETS
DECEMBER 31, 2009 AND 2008
NOTES TO THE CONSOLIDATED FINANCIAL STATEMENTS (Continued)
(INFORMATION AS OF DECEMBER 31, 2009 AND FOR THE YEAR THEN ENDED NOT
COVERED BY AUDITORS' REPORT INCLUDED HEREIN)
7. CURRENT AND DEFERRED INCOME TAXES (Continued)
7.3. Deferred tax assets
|
|
Dec. 31, 2009 | Dec. 31, 2008 | ||||||
|---|---|---|---|---|---|---|---|---|
|
Elimination of internal margin on non-current assets |
191,134 | 165,608 | ||||||
|
Elimination of internal gains on inventories |
44,325 | 37,596 | ||||||
|
Provisions for pension and other post-employment benefit obligations |
536,820 | 463,538 | ||||||
|
Fair value adjustments to lease premiums, trademarks and networks |
1,644,341 | 2,787,280 | ||||||
|
Fair value adjustments to financial instruments |
118,081 | |||||||
|
Temporary differences |
6,762,376 | 5,024,366 | ||||||
|
Other |
235,120 | 35,893 | ||||||
|
Offsetting of deferred tax assets and liabilities(1) |
(7,023,229 | ) | (2,084,973 | ) | ||||
|
TOTAL |
2,508,968 | 6,429,308 | ||||||
7.4. Deferred tax liabilities
|
|
Dec. 31, 2009 | Dec. 31, 2008 | ||||||
|---|---|---|---|---|---|---|---|---|
|
Elimination of impairment of securities and receivables |
(1,439,086 | ) | (944,544 | ) | ||||
|
Elimination of provisions for net negative equity risk of subsidiaries |
(649,924 | ) | (112,834 | ) | ||||
|
Elimination of untaxed provisions |
(91,648 | ) | (49,996 | ) | ||||
|
Fair value adjustments to lease premiums, trademarks and networks |
(8,740,196 | ) | (8,555,207 | ) | ||||
|
Temporary differences |
(176,200 | ) | (38,205 | ) | ||||
|
Share acquisition costs |
(193,340 | ) | (193,340 | ) | ||||
|
Offsetting of deferred tax assets and liabilities(1) |
7,023,229 | 2,084,973 | ||||||
|
TOTAL |
(4,267,165 | ) | (7,809,153 | ) | ||||
- (1)
- Deferred tax assets and liabilities are offset when they concern income tax levied by the same tax authorities.
184
PROVALLIANCE SAS
CONSOLIDATED FINANCIAL STATEMETS
DECEMBER 31, 2009 AND 2008
NOTES TO THE CONSOLIDATED FINANCIAL STATEMENTS (Continued)
(INFORMATION AS OF DECEMBER 31, 2009 AND FOR THE YEAR THEN ENDED NOT
COVERED BY AUDITORS' REPORT INCLUDED HEREIN)
|
|
Carrying
amount at Jan. 1, 2009 |
Changes in
inventories recognized in profit |
Impact of
business combinations |
Impairment
losses recognized in profit |
Impairment
losses reversed through profit |
Other
movements |
Carrying
amount at Dec. 31, 2009 |
||||||||||||||||
|---|---|---|---|---|---|---|---|---|---|---|---|---|---|---|---|---|---|---|---|---|---|---|---|
|
Raw materials |
82,493 | 163,422 | 245,915 | ||||||||||||||||||||
|
Work-in-progress |
|||||||||||||||||||||||
|
Finished and semi-finished products |
|||||||||||||||||||||||
|
Goods purchased for resale |
5,090,555 | (866,766 | ) | 91,531 | (42,381 | ) | 76,389 | 4,349,328 | |||||||||||||||
|
TOTAL |
5,173,048 | (703,344 | ) | 91,531 | (42,381 | ) | 76,389 | 4,595,243 | |||||||||||||||
|
|
Carrying
amount at Jan. 1, 2009 |
Change |
Impact of
business combinations |
Impairment
losses |
Reversals of
impairment losses |
Other
movements |
Carrying
amount at Dec. 31, 2009 |
||||||||||||||||
|---|---|---|---|---|---|---|---|---|---|---|---|---|---|---|---|---|---|---|---|---|---|---|---|
|
Miscellaneous trade receivables |
18,122,775 | (2,721,166 | ) | 30,207 | (928,873 | ) | 855,863 | 402,608 | 15,761,414 | ||||||||||||||
|
TOTAL |
18,122,775 | (2,721,166 | ) | 30,207 | (928,873 | ) | 855,863 | 402,608 | 15,761,414 | ||||||||||||||
|
|
Carrying
amount at Jan. 1, 2009 |
Change |
Impact of
business combinations |
Impairment
losses recognized in profit |
Impairment
losses reversed through profit |
Other
movements |
Carrying
amount at Dec. 31, 2009 |
||||||||||||||||
|---|---|---|---|---|---|---|---|---|---|---|---|---|---|---|---|---|---|---|---|---|---|---|---|
|
Prepayments to suppliers |
154,548 | (70,250 | ) | 5,472 | 89,770 | ||||||||||||||||||
|
Sundry receivables(1) |
16,479,113 | 917,448 | 672,327 | (49,389 | ) | 402,608 | 18,422,107 | ||||||||||||||||
|
Prepaid expenses |
3,600,245 | 817,491 | 97,283 | 4,515,019 | |||||||||||||||||||
|
TOTAL |
20,233,906 | 1,664,689 | 775,082 | (49,389 | ) | 402,608 | 23,026,896 | ||||||||||||||||
- (1)
- This item primarily corresponds to prepaid and recoverable taxes (e.g. VAT, corporate income tax).
185
PROVALLIANCE SAS
CONSOLIDATED FINANCIAL STATEMETS
DECEMBER 31, 2009 AND 2008
NOTES TO THE CONSOLIDATED FINANCIAL STATEMENTS (Continued)
(INFORMATION AS OF DECEMBER 31, 2009 AND FOR THE YEAR THEN ENDED NOT
COVERED BY AUDITORS' REPORT INCLUDED HEREIN)
|
|
Carrying
amount at Jan. 1, 2009 |
Change |
Impact of
business combinations |
Impairment
losses recognized in profit |
Impairment
losses reversed through profit |
Other
movements |
Carrying
amount at Dec. 31, 2009 |
||||||||||||||||
|---|---|---|---|---|---|---|---|---|---|---|---|---|---|---|---|---|---|---|---|---|---|---|---|
|
Marketable securities |
2,316,560 | (3,997,157 | ) | 3,511,983 | 1,831,386 | ||||||||||||||||||
|
Cash |
19,446,769 | (4,862,797 | ) | 520,659 | 15,104,631 | ||||||||||||||||||
|
TOTAL |
21,763,329 | (8,859,954 | ) | 4,032,642 | 16,936,017 | ||||||||||||||||||
Share capital and share premium
At December 31, 2009, the share capital of Provalliance SAS amounted to €207,368,900, divided into 296,241,286 shares all of the same class.
The Company's total equity amounted to €125,284,319 at end-2009.
During the year Provalliance bought back 10,527,000 of its own shares for allocation under the share grant plan. The corresponding treasury shares were eliminated on consolidation through a deduction from consolidated reserves.
Long- and short-term debt broke down as follows at December 31, 2009 and 2008:
|
Long-term debt
|
Dec. 31, 2009 | Dec. 31, 2008 |
Year-on-year
change |
||||||||
|---|---|---|---|---|---|---|---|---|---|---|---|
|
Bank borrowings |
59,636,042 | 53,595,052 | 6,040,990 | ||||||||
|
Other borrowings |
2,990,831 | 4,780,355 | (1,789,524 | ) | |||||||
|
Derivative instruments |
354,246 | ||||||||||
|
Debt related to the Elexia put option |
5,192,580 | 6,030,000 | (837,420 | ) | |||||||
|
Debt related to the Provalliance Poland put option |
250,000 | 250,000 | |||||||||
|
TOTAL LONG-TERM DEBT |
68,423,699 | 64,655,407 | 3,414,046 | ||||||||
|
Short-term debt
|
Dec. 31, 2009 | Dec. 31, 2008 |
Year-on-year
change |
|||||||||
|---|---|---|---|---|---|---|---|---|---|---|---|---|
|
Current portion of bank borrowings |
19,515,324 | 22,763,136 | (3,247,812 | ) | ||||||||
|
Bank overdrafts |
2,738,894 | 8,264,984 | (5,526,090 | ) | ||||||||
|
Accrued interest on borrowings |
240,100 | 207,552 | 32,548 | |||||||||
|
TOTAL SHORT-TERM DEBT |
22,494,318 | 31,235,672 | (8,741,354 | ) | ||||||||
|
TOTAL LONG- AND SHORT-TERM DEBT |
90,918,017 | 95,891,079 | (5,327,308 | ) | ||||||||
186
PROVALLIANCE SAS
CONSOLIDATED FINANCIAL STATEMETS
DECEMBER 31, 2009 AND 2008
NOTES TO THE CONSOLIDATED FINANCIAL STATEMENTS (Continued)
(INFORMATION AS OF DECEMBER 31, 2009 AND FOR THE YEAR THEN ENDED NOT
COVERED BY AUDITORS' REPORT INCLUDED HEREIN)
13. LONG- AND SHORT-TERM DEBT (Continued)
13.1 Breakdown of long- and short-term debt by maturity
|
|
At Dec. 31, 2009 | At Dec. 31, 2008 | ||||||||||||||||||
|---|---|---|---|---|---|---|---|---|---|---|---|---|---|---|---|---|---|---|---|---|
|
|
Principal | Interest | Total | Principal | Interest | Total | ||||||||||||||
|
2009 |
31,235,673 | 4,701,982 | 35,937,655 | |||||||||||||||||
|
2010 |
22,494,318 | 2,990,838 | 25,485,156 | 27,486,599 | 2,610,471 | 30,097,070 | ||||||||||||||
|
2011 |
22,456,534 | 2,105,827 | 24,562,361 | 14,620,448 | 1,155,247 | 15,775,695 | ||||||||||||||
|
2012 |
18,683,426 | 1,232,294 | 19,915,720 | 13,821,401 | 381,605 | 14,203,006 | ||||||||||||||
|
2013 |
12,075,359 | 551,950 | 12,627,309 | 6,684,891 | 132,074 | 6,816,965 | ||||||||||||||
|
2014 |
5,154,896 | 172,083 | 5,326,979 | 1,736,389 | 49,814 | 1,786,203 | ||||||||||||||
|
2015 |
2,728,415 | 56,171 | 2,784,586 | 305,678 | 31,705 | 337,383 | ||||||||||||||
|
2016 |
1,226,285 | 7,534 | 1,233,819 | |||||||||||||||||
|
2017 |
1,340,000 | 1,340,000 | ||||||||||||||||||
|
2018 |
4,758,784 | 4,758,784 | ||||||||||||||||||
|
TOTAL |
90,918,017 | 7,116,697 | 98,034,714 | 95,891,079 | 9,062,898 | 104,953,977 | ||||||||||||||
13.2 Bank borrowings
Analysis of bank borrowings at December 31, 2009:
|
Bank
|
Balance at
Dec. 31, 2009 |
Due in 1 year | Due in 1 to 5 years | Due beyond 5 years | Hedged | ||||||||||
|---|---|---|---|---|---|---|---|---|---|---|---|---|---|---|---|
|
BDPME |
53,440 | 53,440 | no | ||||||||||||
|
BECM |
11,302,768 | 2,824,568 | 7,878,200 | 600,000 | yes | ||||||||||
|
BICS |
1,292,149 | 439,394 | 813,322 | 39,433 | no | ||||||||||
|
BNP |
15,834,027 | 3,076,608 | 10,125,387 | 2,632,032 | no | ||||||||||
|
BRED |
13,337,051 | 3,533,378 | 8,696,711 | 1,106,962 | partially | ||||||||||
|
CA |
8,554,942 | 2,107,038 | 5,821,114 | 626,790 | yes | ||||||||||
|
CCSO |
155,619 | 109,786 | 45,833 | no | |||||||||||
|
CDN |
6,045,421 | 1,800,277 | 4,170,268 | 74,876 | yes | ||||||||||
|
CIC |
5,305,968 | 1,531,403 | 3,770,041 | 4,524 | yes | ||||||||||
|
FORTIS |
175,729 | 97,098 | 78,631 | no | |||||||||||
|
HSBC |
733,092 | 312,385 | 420,707 | no | |||||||||||
|
LCL |
109,311 | 90,002 | 19,309 | no | |||||||||||
|
NUGER |
1,170,016 | 314,875 | 777,292 | 77,849 | no | ||||||||||
|
OSEO |
205,946 | 43,804 | 162,142 | no | |||||||||||
|
SG |
13,739,596 | 3,451,139 | 9,900,197 | 388,260 | no | ||||||||||
|
OTHER |
1,136,261 | 1,136,261 | no | ||||||||||||
|
TOTAL |
79,151,336 | 19,785,195 | 53,815,415 | 5,550,726 | |||||||||||
The average interest rate on the Group's bank borrowings was 5.4% in 2009 (4.9% in 2008).
187
PROVALLIANCE SAS
CONSOLIDATED FINANCIAL STATEMETS
DECEMBER 31, 2009 AND 2008
NOTES TO THE CONSOLIDATED FINANCIAL STATEMENTS (Continued)
(INFORMATION AS OF DECEMBER 31, 2009 AND FOR THE YEAR THEN ENDED NOT
COVERED BY AUDITORS' REPORT INCLUDED HEREIN)
14.1 Analysis of financial instruments by category
|
|
|
Analysis by category of financial instrument | ||||||||||||||||
|---|---|---|---|---|---|---|---|---|---|---|---|---|---|---|---|---|---|---|
|
ASSETS
|
Dec. 31,
2009 Carrying amount |
Financial
assets at fair value through profit or loss |
Held-to-
maturity investments |
Loans and
receivables |
Available-
for-sale financial assets |
|||||||||||||
|
NON-CURRENT ASSETS |
||||||||||||||||||
|
Financial assets |
5,561,464 | 5,561,464 | ||||||||||||||||
|
TOTAL RECORDED UNDER NON-CURRENT ASSETS |
5,561,464 | 5,561,464 | ||||||||||||||||
|
CURRENT ASSETS |
||||||||||||||||||
|
Trade receivables |
15,761,414 | 15,761,414 | ||||||||||||||||
|
Other receivables |
23,026,896 | 23,026,896 | ||||||||||||||||
|
Cash and cash equivalents |
16,936,017 | 16,936,017 | ||||||||||||||||
|
TOTAL RECORDED UNDER CURRENT ASSETS |
55,724,327 | 16,936,017 | 38,788,310 | |||||||||||||||
|
|
|
Analysis by category of financial instrument | |||||||||||||
|---|---|---|---|---|---|---|---|---|---|---|---|---|---|---|---|
|
LIABILITIES
|
Dec. 31,
2009 Carrying amount |
Financial
liabilities at fair value through profit or loss |
Financial
liabilities at fair value through equity |
Financial
liabilities at amortized cost |
|||||||||||
|
NON-CURRENT LIABILITIES |
|||||||||||||||
|
Long-term debt |
68,423,699 | 354,246 | 68,069,453 | ||||||||||||
|
TOTAL RECORDED UNDER NON-CURRENT LIABILITIES |
68,423,699 | 354,246 | 68,069,453 | ||||||||||||
|
CURRENT LIABILITIES |
|||||||||||||||
|
Current portion of long-term debt |
19,755,424 | 19,755,424 | |||||||||||||
|
Other short-term debt |
2,738,894 | 2,738,894 | |||||||||||||
|
Trade payables |
20,633,343 | 20,633,343 | |||||||||||||
|
Other payables |
30,697,740 | 30,697,740 | |||||||||||||
|
TOTAL RECORDED UNDER CURRENT LIABILITIES |
73,825,401 | 73,825,401 | |||||||||||||
188
PROVALLIANCE SAS
CONSOLIDATED FINANCIAL STATEMETS
DECEMBER 31, 2009 AND 2008
NOTES TO THE CONSOLIDATED FINANCIAL STATEMENTS (Continued)
(INFORMATION AS OF DECEMBER 31, 2009 AND FOR THE YEAR THEN ENDED NOT
COVERED BY AUDITORS' REPORT INCLUDED HEREIN)
14. FINANCIAL INSTRUMENTS (Continued)
|
|
|
Analysis by category of financial instrument | ||||||||||||||||
|---|---|---|---|---|---|---|---|---|---|---|---|---|---|---|---|---|---|---|
|
ASSETS
|
Dec. 31,
2008 Carrying amount |
Financial
assets at fair value through profit or loss |
Held-to-
maturity investments |
Loans and
receivables |
Available-
for-sale financial assets |
|||||||||||||
|
NON-CURRENT ASSETS |
||||||||||||||||||
|
Financial assets |
5,178,659 | 5,178,659 | ||||||||||||||||
|
TOTAL RECORDED UNDER NON-CURRENT ASSETS |
5,178,659 | 5,178,659 | ||||||||||||||||
|
CURRENT ASSETS |
||||||||||||||||||
|
Trade receivables |
18,122,775 | 18,122,775 | ||||||||||||||||
|
Other receivables |
20,233,906 | 20,233,906 | ||||||||||||||||
|
Cash and cash equivalents |
21,763,329 | 21,763,329 | ||||||||||||||||
|
TOTAL RECORDED UNDER CURRENT ASSETS |
60,120,010 | 21,763,329 | 38,356,681 | |||||||||||||||
|
|
|
Analysis by category of financial instrument | |||||||||||||
|---|---|---|---|---|---|---|---|---|---|---|---|---|---|---|---|
|
LIABILITIES
|
Dec. 31,
2008 Carrying amount |
Financial
liabilities at fair value through profit or loss |
Financial
liabilities at fair value through equity |
Financial
liabilities at amortized cost |
|||||||||||
|
NON-CURRENT LIABILITIES |
|||||||||||||||
|
Long-term debt |
64,655,407 | 64,655,407 | |||||||||||||
|
TOTAL RECORDED UNDER NON-CURRENT LIABILITIES |
64,655,407 | 64,655,407 | |||||||||||||
|
CURRENT LIABILITIES |
|||||||||||||||
|
Current portion of long-term debt |
22,970,688 | 22,970,688 | |||||||||||||
|
Other short-term debt |
8,264,984 | 8,264,984 | |||||||||||||
|
Trade payables |
22,065,421 | 22,065,421 | |||||||||||||
|
Other payables |
33,706,934 | 33,706,934 | |||||||||||||
|
TOTAL RECORDED UNDER CURRENT LIABILITIES |
87,008,027 | 87,008,027 | |||||||||||||
189
PROVALLIANCE SAS
CONSOLIDATED FINANCIAL STATEMETS
DECEMBER 31, 2009 AND 2008
NOTES TO THE CONSOLIDATED FINANCIAL STATEMENTS (Continued)
(INFORMATION AS OF DECEMBER 31, 2009 AND FOR THE YEAR THEN ENDED NOT
COVERED BY AUDITORS' REPORT INCLUDED HEREIN)
14. FINANCIAL INSTRUMENTS (Continued)
14.2 Impact of financial instruments
|
2009
|
Impact on net
financial income/(expense) |
Impact on equity | ||||||
|---|---|---|---|---|---|---|---|---|
|
Non-current financial assets |
71,745 | |||||||
|
Non-current financial liabilities |
(354,246 | ) | ||||||
|
TOTAL |
(282,501 | ) | ||||||
|
2008
|
Impact on net
financial income/(expense) |
Impact on equity | ||||||
|---|---|---|---|---|---|---|---|---|
|
Non-current financial assets |
45,761 | |||||||
|
Non-current financial liabilities |
||||||||
|
TOTAL |
45,761 | |||||||
14.3 Management of interest rate risk
The Group is exposed to interest rate risk as its debt comprises both fixed and variable rate borrowings. The risk arising from fluctuations in variable interest rates is hedged using interest rate swaps whereby the Group receives (or pays) the difference between fixed and variable rate interest streams calculated on notional principal amounts. Interest rate swaps are qualified as cash flow hedges and are measured at fair value as determined based on prices quoted by the banks.
The following table shows the notional amounts and remaining duration of the interest rate swaps outstanding at the end of the reporting period.
|
At Dec. 31, 2009
|
Average
contractual fixed interest rate |
Notional
amount |
Fair value | ||||||||
|---|---|---|---|---|---|---|---|---|---|---|---|
|
Less than one year |
|||||||||||
|
Between one and five years |
3.45 | % | 11,653,468 | (230,271 | ) | ||||||
|
Beyond five years |
3.38 | % | 2,832,143 | (123,975 | ) | ||||||
|
TOTAL |
14,485,611 | (354,246 | ) | ||||||||
190
PROVALLIANCE SAS
CONSOLIDATED FINANCIAL STATEMETS
DECEMBER 31, 2009 AND 2008
NOTES TO THE CONSOLIDATED FINANCIAL STATEMENTS (Continued)
(INFORMATION AS OF DECEMBER 31, 2009 AND FOR THE YEAR THEN ENDED NOT
COVERED BY AUDITORS' REPORT INCLUDED HEREIN)
14. FINANCIAL INSTRUMENTS (Continued)
|
At Dec. 31, 2008
|
Average
contractual fixed interest rate |
Notional
amount |
Fair value | ||||||||
|---|---|---|---|---|---|---|---|---|---|---|---|
|
Less that one year |
|||||||||||
|
Between one and five years |
4.12 | % | 7,618,369 | — | |||||||
|
Beyond five years |
3.38 | % | 2,984,043 | — | |||||||
|
TOTAL |
10,602,412 | — | |||||||||
15.1 Put option granted to the minority shareholder of Elexia
On December 15, 2006, the Group granted a put option to the minority shareholder of Elexia on its 33.33% interest.
The Group's liability as seller of the put was recognized as other debt in the amount of €5,336,615, based on the pricing clause applicable in 2007, and non-controlling interests in Elexia at December 31, 2007 in the amount of €3,772,106 were cancelled from equity. The difference between these two amounts (€1,564,509) was recognized as an adjustment to goodwill.
At December 31, 2008, the Group's liability as seller of the put was recognized as other debt in the amount of €6,030,000, based on the pricing clause applicable in 2008, and non-controlling interests in Elexia at December 31, 2008 in the amount of €4,076,000 were cancelled from equity. The difference between these two amounts (€1,954,000) was recognized as an adjustment to goodwill.
At December 31, 2009, the Group's liability as seller of the put was recognized as other debt in the amount of €6,492,580, based on the pricing clause applicable in 2009, and a related prepayment of €1,300,000 was recorded. Non-controlling interests in Elexia at December 31, 2009 in the amount of €4,079,000 were cancelled from equity. The €2,513,580 difference between the amount recognized under other debt and the amount cancelled from equity was recognized as an adjustment to goodwill.
15.2 Put option granted to the minority shareholder of Provalliance Poland
On July 4, 2008, the Group granted a put option to the minority shareholder of Provalliance Poland on its 28% interest.
The Group's liability as seller of the put was recognized as other debt in the amount of €250,000, and non-controlling interests in Provalliance Poland at December 31, 2009 in the amount of €190,852 were cancelled from equity. The difference between these two amounts (€59,148) was recognized as an adjustment to goodwill.
191
PROVALLIANCE SAS
CONSOLIDATED FINANCIAL STATEMETS
DECEMBER 31, 2009 AND 2008
NOTES TO THE CONSOLIDATED FINANCIAL STATEMENTS (Continued)
(INFORMATION AS OF DECEMBER 31, 2009 AND FOR THE YEAR THEN ENDED NOT
COVERED BY AUDITORS' REPORT INCLUDED HEREIN)
15. PUT OPTIONS (Continued)
15.3 Put option granted to the minority shareholder of Alliance Prov
On May 23, 2008, the Group granted a put option to the minority shareholder of Alliance Prov on its 27.5% interest.
The option exercise price was set at €0.
Non-controlling interests in Alliance Prov's negative net worth at December 31, 2009 in the amount of €234,000 were cancelled from equity. The difference between these two amounts (€234,000) was recognized as an adjustment to goodwill.
* * *
*
16. PROVISIONS FOR LIABILITIES AND CHARGES
|
|
Carrying
amount at Jan. 1, 2009 |
Impact of
business combinations |
Additions |
Settled
employee benefits reclassified to equity |
Reversals
(utilized provisions) |
Reversals
(surplus provisions) |
Carrying
amount at Dec. 31, 2009 |
||||||||||||||||
|---|---|---|---|---|---|---|---|---|---|---|---|---|---|---|---|---|---|---|---|---|---|---|---|
|
Provisions for taxes |
598,452 | 307,270 | (55,211 | ) | 850,511 | ||||||||||||||||||
|
Provisions for claims and litigation(1) |
544,700 | 98,818 | (280,495 | ) | 363,023 | ||||||||||||||||||
|
Provisions for other liabilities and charges |
2,936,505 | 1,283,609 | (1,706,667 | ) | (1,854,441 | ) | 659,006 | ||||||||||||||||
|
Provisions for statutory retirement bonuses |
1,454,565 | 419,830 | (369,364 | ) | 1,505,031 | ||||||||||||||||||
|
TOTAL |
5,534,222 | 2,109,527 | (1,706,667 | ) | (2,559,511 | ) | 3,377,571 | ||||||||||||||||
- (1)
- Provisions for claims and litigation primarily concern industrial tribunal disputes which represent non-material amounts when taken individually.
192
PROVALLIANCE SAS
CONSOLIDATED FINANCIAL STATEMETS
DECEMBER 31, 2009 AND 2008
NOTES TO THE CONSOLIDATED FINANCIAL STATEMENTS (Continued)
(INFORMATION AS OF DECEMBER 31, 2009 AND FOR THE YEAR THEN ENDED NOT
COVERED BY AUDITORS' REPORT INCLUDED HEREIN)
|
|
At Dec. 31, 2009 | At Dec. 31, 2008 |
Year-on-year
change |
||||||||
|---|---|---|---|---|---|---|---|---|---|---|---|
|
Miscellaneous trade payables |
20,388,185 | 21,682,229 | (1,294,044 | ) | |||||||
|
Due to suppliers of non-current assets |
245,158 | 383,192 | (138,034 | ) | |||||||
|
Total trade payables |
20,633,343 | 22,065,421 | (1,432,078 | ) | |||||||
|
Customer prepayments |
35,957 |
31,528 |
4,429 |
||||||||
|
Accrued taxes and payroll costs |
28,093,495 | 27,515,401 | 578,094 | ||||||||
|
Miscellaneous other payables |
2,568,288 | 6,160,005 | (3,591,717 | ) | |||||||
|
Deferred income |
|||||||||||
|
Total other payables |
30,697,740 | 33,706,934 | (3,009,194 | ) | |||||||
|
TOTAL TRADE AND OTHER PAYABLES |
51,331,083 | 55,772,355 | (4,441,272 | ) | |||||||
In 2009 and 2008 the Group's revenue broke down as follows by business segment:
|
(in € thousands)
|
2009 | 2008 |
Year-on-year
change (amount) |
Year-on-year
change (%) |
||||||||||
|---|---|---|---|---|---|---|---|---|---|---|---|---|---|---|
|
Salons |
151,784 | 134,260 | 17,524 | 13.1 | % | |||||||||
|
Franchises |
47,615 | 51,538 | (3,923 | ) | (7.6 | )% | ||||||||
|
Licenses |
3,582 | 3,386 | 196 | 5.8 | % | |||||||||
|
Total revenue |
202,981 | 189,184 | 13,797 | 7.3 | % | |||||||||
Revenue broke down as follows by geographical segment:
|
(in € thousands)
|
2009 | 2008 |
Year-on-year
change (amount) |
Year-on-year
change (%) |
||||||||||
|---|---|---|---|---|---|---|---|---|---|---|---|---|---|---|
|
France |
171,493 | 163,762 | 7,731 | 4.7 | % | |||||||||
|
Spain |
9,870 | 7,804 | 2,066 | 26.5 | % | |||||||||
|
Portugal |
4,564 | 3,761 | 803 | 21.4 | % | |||||||||
|
Poland |
5,661 | 2,537 | 3,124 | 123.1 | % | |||||||||
|
Luxembourg |
10,841 | 10,786 | 55 | 0.5 | % | |||||||||
|
Switzerland |
552 | 534 | 18 | 3.4 | % | |||||||||
|
Total revenue |
202,981 | 189,184 | 13,797 | 7.3 | % | |||||||||
193
PROVALLIANCE SAS
CONSOLIDATED FINANCIAL STATEMETS
DECEMBER 31, 2009 AND 2008
NOTES TO THE CONSOLIDATED FINANCIAL STATEMENTS (Continued)
(INFORMATION AS OF DECEMBER 31, 2009 AND FOR THE YEAR THEN ENDED NOT
COVERED BY AUDITORS' REPORT INCLUDED HEREIN)
18. REVENUE (Continued)
The total number of Group salons can be analyzed as follows by brand:
|
|
2009 | 2008 |
Year-on-year
change (number) |
Year-on-year
change (%) |
||||||||||
|---|---|---|---|---|---|---|---|---|---|---|---|---|---|---|
|
Directly-owned salons |
388 | 343 | 45 | 13.1 | % | |||||||||
|
Franck Provost |
163 | 152 | 11 | 7.2 | % | |||||||||
|
Fabio Salsa |
65 | 65 | ||||||||||||
|
Jean-Louis David |
61 | 47 | 14 | 29.8 | % | |||||||||
|
Saint-Karl |
20 | 34 | (14 | ) | (41.2 | )% | ||||||||
|
Interview |
30 | 21 | 9 | 42.9 | % | |||||||||
|
Saint-Algue |
11 | 11 | ||||||||||||
|
Coiff & Co |
8 | 5 | 3 | 60.0 | % | |||||||||
|
Lovely look |
17 | 17 | ||||||||||||
|
Other |
13 | 8 | 5 | 62.5 | % | |||||||||
|
Franchised salons |
2,071 |
2,104 |
(33 |
) |
(1.6 |
)% |
||||||||
|
Franck Provost |
422 | 391 | 31 | 7.9 | % | |||||||||
|
Fabio Salsa |
97 | 79 | 18 | 22.8 | % | |||||||||
|
Jean-Louis David |
786 | 825 | (39 | ) | (4.7 | )% | ||||||||
|
Saint-Karl |
83 | 93 | (10 | ) | (10.8 | )% | ||||||||
|
Interview |
12 | 7 | 5 | 71.4 | % | |||||||||
|
Saint-Algue |
256 | 281 | (25 | ) | (8.9 | )% | ||||||||
|
Coiff & Co |
176 | 152 | 24 | 15.8 | % | |||||||||
|
Lovely look |
||||||||||||||
|
Other |
239 | 276 | (37 | ) | (13.4 | )% | ||||||||
|
Total directly-owned and franchised salons |
2,459 |
2,447 |
12 |
0.5 |
% |
|||||||||
|
Franck Provost |
585 | 543 | 42 | 7.7 | % | |||||||||
|
Fabio Salsa |
162 | 144 | 18 | 12.5 | % | |||||||||
|
Jean-Louis David |
847 | 872 | (25 | ) | (2.9 | )% | ||||||||
|
Saint-Karl |
103 | 127 | (24 | ) | (18.9 | )% | ||||||||
|
Interview |
42 | 28 | 14 | 50.0 | % | |||||||||
|
Saint-Algue |
267 | 292 | (25 | ) | (8.6 | )% | ||||||||
|
Coiff & Co |
184 | 157 | 27 | 17.2 | % | |||||||||
|
Lovely look |
17 | 17 | ||||||||||||
|
Other |
252 | 284 | (32 | ) | (11.3 | )% | ||||||||
194
PROVALLIANCE SAS
CONSOLIDATED FINANCIAL STATEMETS
DECEMBER 31, 2009 AND 2008
NOTES TO THE CONSOLIDATED FINANCIAL STATEMENTS (Continued)
(INFORMATION AS OF DECEMBER 31, 2009 AND FOR THE YEAR THEN ENDED NOT
COVERED BY AUDITORS' REPORT INCLUDED HEREIN)
|
|
2009 | 2008 |
Year-on-year
change |
||||||||
|---|---|---|---|---|---|---|---|---|---|---|---|
|
Wages and salaries |
70,639,889 | 64,751,229 | 5,888,660 | ||||||||
|
Provision for statutory retirement bonuses |
62,373 | 58,700 | 3,673 | ||||||||
|
Grants for apprenticeship contracts |
(249,833 | ) | (134,070 | ) | (115,763 | ) | |||||
|
Payroll taxes |
22,076,542 | 21,638,070 | 438,472 | ||||||||
|
Fringe benefits |
(54,336 | ) | (71,187 | ) | 16,851 | ||||||
|
TOTAL |
92,474,635 | 86,242,742 | 6,231,893 | ||||||||
|
|
2009 | 2008 |
Year-on-year
change |
||||||||
|---|---|---|---|---|---|---|---|---|---|---|---|
|
Water and electricity |
3,660,964 | 2,567,002 | 1,093,962 | ||||||||
|
Rental expense |
23,472,855 | 18,342,525 | 5,130,330 | ||||||||
|
Maintenance |
4,381,740 | 4,190,340 | 191,400 | ||||||||
|
Professional fees |
4,150,700 | 4,017,553 | 133,147 | ||||||||
|
Advertising, publications, public relations |
8,802,316 | 9,889,923 | (1,087,607 | ) | |||||||
|
Banking services |
1,609,991 | 1,495,175 | 114,816 | ||||||||
|
Other external charges |
8,590,542 | 13,872,548 | (5,282,006 | ) | |||||||
|
TOTAL |
54,669,108 | 54,375,066 | 294,042 | ||||||||
195
PROVALLIANCE SAS
CONSOLIDATED FINANCIAL STATEMETS
DECEMBER 31, 2009 AND 2008
NOTES TO THE CONSOLIDATED FINANCIAL STATEMENTS (Continued)
(INFORMATION AS OF DECEMBER 31, 2009 AND FOR THE YEAR THEN ENDED NOT
COVERED BY AUDITORS' REPORT INCLUDED HEREIN)
21. OTHER INCOME STATEMENT ITEMS BY NATURE
|
|
2009 | 2008 |
Year-on-year
change |
|||||||||
|---|---|---|---|---|---|---|---|---|---|---|---|---|
|
"Other operating income" includes: |
1,688,854 | 1,554,935 | 133,919 | |||||||||
|
Proceeds from disposals of property, plant and equipment and intangible assets |
1,688,854 | 1,554,935 | 133,919 | |||||||||
|
"Other operating expenses" includes: |
(2,413,974 |
) |
(2,629,679 |
) |
215,705 |
|||||||
|
Carrying amounts of property, plant and equipment and intangible assets |
(2,413,974 | ) | (2,629,679 | ) | 215,705 | |||||||
|
"Finance costs—net" includes: |
||||||||||||
|
• Income from cash and cash equivalents |
592,739 | 1,705,093 | (1,112,354 | ) | ||||||||
|
Interest income generated on cash and cash equivalents |
466,941 | 1,072,355 | (605,414 | ) | ||||||||
|
Other interest income |
51,265 | 579,334 | (528,069 | ) | ||||||||
|
Reversals of provisions against financial assets |
4,000 | 45,761 | (41,761 | ) | ||||||||
|
Net gains on disposals of cash equivalents |
9,701 | 4,366 | 5,335 | |||||||||
|
Net gains on interest rate and currency hedges of cash and cash equivalents |
60,832 | 3,277 | 57,555 | |||||||||
|
• Finance costs—gross |
(4,818,087 |
) |
(4,426,821 |
) |
(391,266 |
) |
||||||
|
Interest expense on financing transactions |
(4,118,163 | ) | (4,319,342 | ) | 201,179 | |||||||
|
Net losses on interest rate and currency hedges of gross debt |
(699,924 | ) | (107,479 | ) | (592,445 | ) | ||||||
22. TAX CONSOLIDATION AND UNUSED TAX LOSSES
Group companies file consolidated tax returns whenever permitted by the applicable regulations. At December 31, 2009 tax groups had been set up headed by the following companies:
- •
-
Provalliance,
- •
-
Sorefico Coiffure,
- •
-
Compagnie Générale de Partenariat, and
- •
- Elexia.
196
PROVALLIANCE SAS
CONSOLIDATED FINANCIAL STATEMETS
DECEMBER 31, 2009 AND 2008
NOTES TO THE CONSOLIDATED FINANCIAL STATEMENTS (Continued)
(INFORMATION AS OF DECEMBER 31, 2009 AND FOR THE YEAR THEN ENDED NOT
COVERED BY AUDITORS' REPORT INCLUDED HEREIN)
22. TAX CONSOLIDATION AND UNUSED TAX LOSSES (Continued)
At December 31, 2009 and 2008, no deferred tax assets were recognized for the following main unused tax losses as the Group deemed that their recovery was not probable:
|
|
Dec. 31, 2009 | Dec. 31, 2008 | |||||
|---|---|---|---|---|---|---|---|
|
—Sorefico Coiffure(1) |
5,568,449 | 11,526,845 | |||||
|
—Compagnie Générale de Partenariat |
2,769,556 | 1,797,604 | |||||
- (1)
- The total tax losses for the tax group headed by Sorefico Coiffure came to €10,278,029 at December 31, 2009. At that date the Group considered that the utilization of €5,568,449 of these losses was probable.
A tax benefit of €1,856,150 was therefore recorded in 2009.
23. NET CASH AND CASH EQUIVALENTS
|
|
2009 | 2008 |
Year-on-year
change |
||||||||
|---|---|---|---|---|---|---|---|---|---|---|---|
|
Marketable securities |
1,831,386 | 2,316,560 | (485,174 | ) | |||||||
|
Cash |
15,104,631 | 19,446,769 | (4,342,138 | ) | |||||||
|
Bank overdrafts |
(2,738,894 | ) | (8,264,984 | ) | 5,526,090 | ||||||
|
TOTAL NET CASH AND CASH EQUIVALENTS |
14,197,123 | 13,498,345 | 698,778 | ||||||||
24. IMPACT OF BUSINESS COMBINATIONS
|
|
Acquisitions |
Cash and cash
equivalents acquired |
Disposals |
Cash and cash
equivalents transferred |
Net impact | ||||||||||||
|---|---|---|---|---|---|---|---|---|---|---|---|---|---|---|---|---|---|
|
SA BOULOGNE shares |
(9,750 | ) | (3,557 | ) | (13,307 | ) | |||||||||||
|
HAIR TIFS shares |
(451,130 | ) | (29,735 | ) | (480,865 | ) | |||||||||||
|
SARL HECH—SERGIO BOSSI shares |
(332,402 | ) | (17,494 | ) | (349,896 | ) | |||||||||||
|
GUERIN COIFFURE (MANIATIS) shares |
(4,505,000 | ) | 3,212,221 | (1,292,779 | ) | ||||||||||||
|
MARBEUF COIFFURE (MANIATIS) shares |
(1,005,000 | ) | 580,859 | (424,141 | ) | ||||||||||||
|
FORUM COIFFURE (MANIATIS) shares |
(497,500 | ) | 364,893 | (132,607 | ) | ||||||||||||
|
JMS SERVICES (MANIATIS) shares |
(7,500 | ) | 118,011 | 110,511 | |||||||||||||
|
TOTAL |
(6,808,282 | ) | 4,225,198 | (2,583,084 | ) | ||||||||||||
197
PROVALLIANCE SAS
CONSOLIDATED FINANCIAL STATEMETS
DECEMBER 31, 2009 AND 2008
NOTES TO THE CONSOLIDATED FINANCIAL STATEMENTS (Continued)
(INFORMATION AS OF DECEMBER 31, 2009 AND FOR THE YEAR THEN ENDED NOT
COVERED BY AUDITORS' REPORT INCLUDED HEREIN)
25. OFF-BALANCE SHEET COMMITMENTS
|
|
Off-balance
sheet commitments at Dec. 31, 2009 |
Off-balance
sheet commitments at Dec. 31, 2008 |
Purpose | Bank/Beneficiary | |||||||
|---|---|---|---|---|---|---|---|---|---|---|---|
|
Promissory note—Franck Provost Coiffure joint and several guarantee |
850,000 | BECM | |||||||||
|
Promissory note—Franck Provost Coiffure joint and several guarantee |
700,000 | BRED | |||||||||
|
Promissory note—Franck Provost Coiffure joint and several guarantee |
700,000 | CDN | |||||||||
|
Promissory note—Franck Provost Coiffure joint and several guarantee |
1,700,000 | BNP | |||||||||
|
Promissory note—Franck Provost Coiffure joint and several guarantee |
300,000 | SG | |||||||||
|
Promissory note—Provalliance joint and several guarantee |
600,000 | BRED | |||||||||
|
Promissory note—Sorefico Coiffure joint and several guarantee |
600,000 | BECM | |||||||||
|
Loan—Provalliance joint and several guarantee |
2,832,143 | 2,984,043 | CA | ||||||||
|
Loan—Provalliance joint and several guarantee |
55,326 | 67,960 | BNP | ||||||||
|
Loan—Franck Provost Coiffure joint and several guarantee |
436,704 | 593,208 | Restructuring the Group's cash position | BNP | |||||||
|
Loan—Franck Provost Coiffure joint and several guarantee |
4,275,510 | 592,822 | Restructuring the Group's cash position | CA | |||||||
|
Loan—Franck Provost Coiffure joint and several guarantee |
781,001 | 411,979 | Purchase of a business base | BECM | |||||||
|
Loan—Franck Provost Coiffure joint and several guarantee |
32,102 | 213,691 | BICS | ||||||||
|
Loan—Franck Provost Coiffure joint and several guarantee |
36,753 | 74,957 | HSBC | ||||||||
|
Loan—Franck Provost Coiffure joint and several guarantee |
143,390 | NUGGER | |||||||||
|
Loan—Franck Provost Coiffure joint and several guarantee |
1,965,116 | BRED | |||||||||
|
Loan—Franck Provost Coiffure joint and several guarantee |
466,667 | CDN | |||||||||
|
Loan—Fabio Salsa joint and several guarantee |
351,235 | 209,809 | BNP | ||||||||
|
Loan—Fabio Salsa joint and several guarantee |
24,259 | SG | |||||||||
198
PROVALLIANCE SAS
CONSOLIDATED FINANCIAL STATEMETS
DECEMBER 31, 2009 AND 2008
NOTES TO THE CONSOLIDATED FINANCIAL STATEMENTS (Continued)
(INFORMATION AS OF DECEMBER 31, 2009 AND FOR THE YEAR THEN ENDED NOT
COVERED BY AUDITORS' REPORT INCLUDED HEREIN)
25. OFF-BALANCE SHEET COMMITMENTS (Continued)
|
|
Off-balance
sheet commitments at Dec. 31, 2009 |
Off-balance
sheet commitments at Dec. 31, 2008 |
Purpose | Bank/Beneficiary | |||||||
|---|---|---|---|---|---|---|---|---|---|---|---|
|
Loan—Franck Provost Coiffure joint and several guarantee and pledge of a business base |
633,266 | 737,863 | BECM | ||||||||
|
Loan—Franck Provost Coiffure joint and several guarantee and pledge of a business base |
166,956 | 223,397 | BICS | ||||||||
|
Loan—Franck Provost Coiffure joint and several guarantee and pledge of a business base |
1,999,087 | 2,121,713 | BNP | ||||||||
|
Loan—Franck Provost Coiffure joint and several guarantee and pledge of a business base |
190,559 | 244,050 | BRED | ||||||||
|
Loan—Franck Provost Coiffure joint and several guarantee and pledge of a business base |
780,829 | 5,529,315 | CA | ||||||||
|
Loan—Franck Provost Coiffure joint and several guarantee and pledge of a business base |
279,984 | 184,524 | CDN | ||||||||
|
Loan—Franck Provost Coiffure joint and several guarantee and pledge of a business base |
428,845 | 601,842 | CIC | ||||||||
|
Loan—Franck Provost Coiffure joint and several guarantee and pledge of a business base |
246,185 | 362,829 | HSBC | ||||||||
|
Loan—Franck Provost Coiffure joint and several guarantee and pledge of a business base |
477,062 | 666,190 | NUGGER | ||||||||
|
Loan—Franck Provost Coiffure joint and several guarantee and pledge of a business base |
205,946 | 247,702 | OSEO | ||||||||
|
Loan—Franck Provost Coiffure joint and several guarantee and pledge of a business base |
933,617 | 1,114,848 | SG | ||||||||
|
Loan—Franck Provost Coiffure joint and several guarantee and pledge of a business base |
53,512 | 111,784 | BDPME | ||||||||
|
Loan—Franck Provost Coiffure joint and several guarantee and pledge of a business base |
31,215 | CCSO | |||||||||
|
Loan—Provalliance joint and several guarantee and pledge of a business base |
957,189 | 874,969 | BNP | ||||||||
|
Loan—Provalliance joint and several guarantee and pledge of a business base |
5,737,317 | SG | |||||||||
199
PROVALLIANCE SAS
CONSOLIDATED FINANCIAL STATEMETS
DECEMBER 31, 2009 AND 2008
NOTES TO THE CONSOLIDATED FINANCIAL STATEMENTS (Continued)
(INFORMATION AS OF DECEMBER 31, 2009 AND FOR THE YEAR THEN ENDED NOT
COVERED BY AUDITORS' REPORT INCLUDED HEREIN)
25. OFF-BALANCE SHEET COMMITMENTS (Continued)
|
|
Off-balance
sheet commitments at Dec. 31, 2009 |
Off-balance
sheet commitments at Dec. 31, 2008 |
Purpose | Bank/Beneficiary | |||||||
|---|---|---|---|---|---|---|---|---|---|---|---|
|
Loan—Provalliance joint and several guarantee and pledge of a business base |
134,921 | CA | |||||||||
|
Loan—Provalliance joint and several guarantee and pledge of a business base |
5,210,000 | BECM | |||||||||
|
Loan—Elexia joint and several guarantee and pledge of a business base |
165,500 | 227,500 | BECM | ||||||||
|
Loan—Elexia joint and several guarantee and pledge of a business base |
27,292 | 126,757 | SG | ||||||||
|
Loan—pledge of shares |
28,199,628 | 19,322,960 | Miscellaneous banks | ||||||||
|
Loan—pledge of equity interests and business bases |
18,688,293 | 10,660,794 | Guarantees for the repayment of borrowings | Miscellaneous banks | |||||||
|
Real estate leases (see Note 26) |
72,469,601 | 71,466,962 | Lease agreements | Multiple lessors | |||||||
|
Interest rate swap (see Note 27) |
NM | NM | Interest rate swap agreements | BRED and BECM | |||||||
|
Deposits for rental payments, charges and incidental expenses(1) |
NM | NM | Guarantees for rental payments and incidental expenses | Multiple lessors | |||||||
|
Accrued interest |
7,116,697 | 9,062,898 | All banks | ||||||||
|
Two call options on two groups (33 salons in total) |
NM | NM | |||||||||
|
TOTAL |
153,853,000 | 137,168,073 | |||||||||
- (1)
- Deposits for rental payments, charges and incidental expenses relate to the following salons that do not form part of the consolidated Group: Hair Rivoli, Hair Brie, Hair Clichy, CSC Meaux, Hair St-Jean, Sarl Kanaan, Eurl Pecher, Salsa La Guenne, Vigneau Coiffure, Bagboy and Sechao Beauté.
26. SCHEDULE OF FUTURE LEASE PAYMENTS
|
|
Total amount due |
Due within 1
year |
Due in 1 to 5
years |
Due beyond 5
years |
||||||||||
|---|---|---|---|---|---|---|---|---|---|---|---|---|---|---|
|
Real estate lease payments |
72,469,601 | 15,871,044 | 37,442,359 | 19,156,198 | ||||||||||
|
TOTAL |
72,469,601 | 15,871,044 | 37,442,359 | 19,156,198 | ||||||||||
The Group's real-estate lease payments relate to renewable commercial lease agreements with variable rents based on revenue and an indexation clause.
200
PROVALLIANCE SAS
CONSOLIDATED FINANCIAL STATEMETS
DECEMBER 31, 2009 AND 2008
NOTES TO THE CONSOLIDATED FINANCIAL STATEMENTS (Continued)
(INFORMATION AS OF DECEMBER 31, 2009 AND FOR THE YEAR THEN ENDED NOT
COVERED BY AUDITORS' REPORT INCLUDED HEREIN)
|
|
Number of employees
at Dec. 31, 2009 |
Number of employees
at Dec. 31, 2008 |
Year-on-year
change |
||||||||
|---|---|---|---|---|---|---|---|---|---|---|---|
|
Managerial |
257 | 242 | 15 | ||||||||
|
Non-managerial |
3,107 | 2,980 | 127 | ||||||||
|
Apprentices |
235 | 248 | (13 | ) | |||||||
|
TOTAL |
3,599 | 3,470 | 129 | ||||||||
201