REGIS CORP
10-Ks and 10-Qs
|
|
|
|
|
|
|
|
|
|
|
|
|
|
|
|
|
|
|
|
|
|
|
|
|
|
|
|
|
|
|
|
|
|
|
|
|
|
|
|
|
|
|
|
|
|
|
|
|
|
|
|
|
|
|
|
UNITED STATES
SECURITIES AND EXCHANGE COMMISSION
WASHINGTON, D.C. 20549
FORM 10-Q
(Mark One)
|
x
|
QUARTERLY REPORT PURSUANT TO SECTION 13 OR 15(d) OF THE SECURITIES EXCHANGE ACT OF 1934
|
For the quarterly period ended
September 30, 2017
OR
|
¨
|
TRANSITION REPORT PURSUANT TO SECTION 13 OR 15(d) OF THE SECURITIES EXCHANGE ACT OF 1934
|
For the transition period from to
Commission file number 1-12725
Regis Corporation
(Exact name of registrant as specified in its charter)
|
Minnesota
|
41-0749934
|
|
|
(State or other jurisdiction of
incorporation or organization)
|
(I.R.S. Employer
Identification No.)
|
|
|
7201 Metro Boulevard, Edina, Minnesota
|
55439
|
|
|
(Address of principal executive offices)
|
(Zip Code)
|
|
(952) 947-7777
(Registrant’s telephone number, including area code)
N/A
(Former name, former address and former fiscal year, if changed since last report)
Indicate by check mark whether the registrant (1) has filed all reports required to be filed by Section 13 or 15(d) of the Securities Exchange Act of 1934 during the preceding 12 months (or for such shorter period that the registrant was required to file such reports), and (2) has been subject to such filing requirements for the past 90 days. Yes
x
No
¨
Indicate by check mark whether the registrant has submitted electronically and posted on its corporate Web site, if any, every Interactive Data File required to be submitted and posted pursuant to Rule 405 of Regulation S-T (§ 232.405 of this chapter) during the preceding 12 months (or for such shorter period that the registrant was required to be submit and post such files). Yes
x
No
¨
Indicate by check mark whether the registrant is a large accelerated filer, an accelerated filer, a non-accelerated filer, a smaller reporting company, or an emerging growth company. See definitions of “large accelerated filer,” “accelerated filer,” “smaller reporting company,” and "emerging growth company" in Rule 12b-2 of the Exchange Act.
|
Large accelerated filer
x
|
Accelerated filer
¨
|
|
|
|
|
|
|
Non-accelerated filer
¨
|
Smaller reporting company
¨
|
|
|
(Do not check if a smaller reporting company)
|
|
|
|
Emerging growth company
¨
|
||
If an emerging growth company, indicate by check mark if the registrant has elected not to use the extended transition period for complying with any new or revised financial accounting standards provided pursuant to Section 13(a) of the Exchange Act.
¨
Indicate by check mark whether the registrant is a shell company (as defined by Rule 12b-2 of the Act). Yes
¨
No
x
Indicate the number of shares outstanding of each of the issuer’s classes of common stock as of
October 24, 2017
:
|
Common Stock, $.05 par value
|
|
46,582,257
|
|
Class
|
|
Number of Shares
|
REGIS CORPORATION
INDEX
|
|
|||
|
|
|
|
|
|
|
|
||
|
|
|
|
|
|
|
|
||
|
|
|
|
|
|
|
|
||
|
|
|
|
|
|
|
|
||
|
|
|
|
|
|
|
|
||
|
|
|
|
|
|
|
|
||
|
|
|
|
|
|
|
|||
|
|
|
|
|
|
|
|||
|
|
|
|
|
|
|
|||
|
|
|
|
|
|
|
|
|
|
|
|
|||
|
|
|
|
|
|
|
|||
|
|
|
|
|
|
|
|||
|
|
|
|
|
|
|
|||
|
|
|
|
|
|
|
|
||
2
REGIS CORPORATION
(Dollars in thousands, except share data)
|
|
September 30, 2017
|
June 30,
2017 |
||||||
|
ASSETS
|
|
|
|
|
||||
|
Current assets:
|
|
|
|
|
||||
|
Cash and cash equivalents
|
$
|
176,312
|
|
$
|
171,044
|
|
||
|
Receivables, net
|
43,276
|
|
19,683
|
|
||||
|
Inventories
|
92,914
|
|
98,392
|
|
||||
|
Other current assets
|
44,043
|
|
48,114
|
|
||||
|
Current assets held for sale (Note 1)
|
34,743
|
|
32,914
|
|
||||
|
Total current assets
|
391,288
|
|
370,147
|
|
||||
|
Property and equipment, net
|
118,629
|
|
123,281
|
|
||||
|
Goodwill
|
418,209
|
|
416,987
|
|
||||
|
Other intangibles, net
|
11,805
|
|
11,965
|
|
||||
|
Other assets
|
52,544
|
|
61,756
|
|
||||
|
Noncurrent assets held for sale (Note 1)
|
24,443
|
|
27,352
|
|
||||
|
Total assets
|
$
|
1,016,918
|
|
$
|
1,011,488
|
|
||
|
LIABILITIES AND SHAREHOLDERS’ EQUITY
|
|
|
|
|
||||
|
Current liabilities:
|
|
|
|
|
||||
|
Accounts payable
|
$
|
51,769
|
|
$
|
54,501
|
|
||
|
Accrued expenses
|
102,727
|
|
110,435
|
|
||||
|
Current liabilities related to assets held for sale (Note 1)
|
46,786
|
|
13,126
|
|
||||
|
Total current liabilities
|
201,282
|
|
178,062
|
|
||||
|
Long-term debt, net
|
120,847
|
|
120,599
|
|
||||
|
Other noncurrent liabilities
|
198,304
|
|
197,374
|
|
||||
|
Noncurrent liabilities related to assets held for sale (Note 1)
|
8,018
|
|
7,232
|
|
||||
|
Total liabilities
|
528,451
|
|
503,267
|
|
||||
|
Commitments and contingencies (Note 6)
|
|
|
|
|
||||
|
Shareholders’ equity:
|
|
|
|
|
||||
|
Common stock, $0.05 par value; issued and outstanding 46,580,068 and 46,400,367 common shares at September 30, 2017 and June 30, 2017, respectively
|
2,329
|
|
2,320
|
|
||||
|
Additional paid-in capital
|
214,597
|
|
214,109
|
|
||||
|
Accumulated other comprehensive income
|
6,018
|
|
3,336
|
|
||||
|
Retained earnings
|
265,523
|
|
288,456
|
|
||||
|
Total shareholders’ equity
|
488,467
|
|
508,221
|
|
||||
|
Total liabilities and shareholders’ equity
|
$
|
1,016,918
|
|
$
|
1,011,488
|
|
||
The accompanying notes are an integral part of the unaudited Condensed Consolidated Financial Statements.
3
REGIS CORPORATION
For The
Three Months Ended September 30, 2017
and
2016
(Dollars and shares in thousands, except per share data amounts)
|
|
Three Months Ended September 30,
|
|||||||
|
|
2017
|
2016
|
||||||
|
Revenues:
|
||||||||
|
Service
|
$
|
235,559
|
|
$
|
243,091
|
|
||
|
Product
|
60,940
|
|
63,716
|
|
||||
|
Royalties and fees
|
13,374
|
|
12,024
|
|
||||
|
|
309,873
|
|
318,831
|
|
||||
|
Operating expenses:
|
||||||||
|
Cost of service
|
139,836
|
|
150,797
|
|
||||
|
Cost of product
|
30,162
|
|
30,815
|
|
||||
|
Site operating expenses
|
33,303
|
|
32,645
|
|
||||
|
General and administrative
|
35,165
|
|
35,916
|
|
||||
|
Rent
|
42,416
|
|
46,233
|
|
||||
|
Depreciation and amortization
|
12,255
|
|
12,109
|
|
||||
|
Total operating expenses
|
293,137
|
|
308,515
|
|
||||
|
Operating income
|
16,736
|
|
10,316
|
|
||||
|
Other (expense) income:
|
||||||||
|
Interest expense
|
(2,138
|
)
|
(2,163
|
)
|
||||
|
Interest income and other, net
|
1,027
|
|
327
|
|
||||
|
Income from continuing operations before income taxes
|
15,625
|
|
8,480
|
|
||||
|
Income tax expense
|
(4,832
|
)
|
(2,740
|
)
|
||||
|
Income from continuing operations
|
10,793
|
|
|
5,740
|
|
|||
|
Loss from discontinued operations (Note 1)
|
(33,768
|
)
|
(2,459
|
)
|
||||
|
Net (loss) income
|
$
|
(22,975
|
)
|
$
|
3,281
|
|
||
|
Net (loss) income per share:
|
||||||||
|
Basic and diluted:
|
||||||||
|
Income from continuing operations
|
0.23
|
|
0.12
|
|
||||
|
Loss from discontinued operations
|
(0.72
|
)
|
(0.05
|
)
|
||||
|
Net (loss) income per share, basic and diluted (1)
|
$
|
(0.49
|
)
|
$
|
0.07
|
|
||
|
Weighted average common and common equivalent shares outstanding:
|
||||||||
|
Basic
|
46,677
|
|
46,227
|
|
||||
|
Diluted
|
46,900
|
|
46,622
|
|
||||
_______________________________________________________________________________
|
(1)
|
Total is a recalculation; line items calculated individually may not sum to total due to rounding.
|
The accompanying notes are an integral part of the unaudited Condensed Consolidated Financial Statements.
4
REGIS CORPORATION
CONDENSED CONSOLIDATED STATEMENT OF COMPREHENSIVE (LOSS) INCOME (Unaudited)
For The
Three Months Ended September 30, 2017
and
2016
(Dollars in thousands)
|
|
Three Months Ended September 30,
|
|||||||
|
|
2017
|
2016
|
||||||
|
Net (loss) income
|
$
|
(22,975
|
)
|
$
|
3,281
|
|
||
|
Foreign currency translation adjustments
|
2,682
|
|
(2,516
|
)
|
||||
|
Comprehensive (loss) income
|
$
|
(20,293
|
)
|
$
|
765
|
|
||
The accompanying notes are an integral part of the unaudited Condensed Consolidated Financial Statements.
5
REGIS CORPORATION
For The
Three Months Ended September 30, 2017
and
2016
(Dollars in thousands)
|
|
Three Months Ended September 30,
|
|||||||
|
|
2017
|
2016
|
||||||
|
Cash flows from operating activities:
|
|
|
|
|
||||
|
Net (loss) income
|
$
|
(22,975
|
)
|
$
|
3,281
|
|
||
|
Adjustments to reconcile net loss to net cash provided by operating activities:
|
|
|
||||||
|
Non-cash impairment related to discontinued operations
|
29,169
|
|
—
|
|
||||
|
Depreciation and amortization
|
9,975
|
|
10,200
|
|
||||
|
Depreciation related to discontinued operations
|
2,129
|
|
3,840
|
|
||||
|
Deferred income taxes
|
3,777
|
|
1,969
|
|
||||
|
Gain on life insurance
|
(7,986
|
)
|
—
|
|
||||
|
Gain from sale of salon assets to franchisees, net(1)
|
(122
|
)
|
(32
|
)
|
||||
|
Salon asset impairments
|
2,280
|
|
1,909
|
|
||||
|
Stock-based compensation
|
2,030
|
|
1,865
|
|
||||
|
Amortization of debt discount and financing costs
|
351
|
|
351
|
|
||||
|
Other non-cash items affecting earnings
|
76
|
|
14
|
|
||||
|
Changes in operating assets and liabilities, excluding the effects of asset sales
|
(7,805
|
)
|
(11,067
|
)
|
||||
|
Net cash provided by operating activities
|
10,899
|
|
|
12,330
|
|
|||
|
Cash flows from investing activities:
|
|
|
||||||
|
Capital expenditures
|
(6,127
|
)
|
(9,776
|
)
|
||||
|
Capital expenditures related to discontinued operations
|
(1,007
|
)
|
(1,157
|
)
|
||||
|
Proceeds from sale of assets to franchisees(1)
|
1,472
|
|
163
|
|
||||
|
Change in restricted cash
|
(471
|
)
|
1,133
|
|
||||
|
Net cash used in investing activities
|
(6,133
|
)
|
|
(9,637
|
)
|
|||
|
Cash flows from financing activities:
|
|
|
||||||
|
Taxes paid for shares withheld
|
(1,530
|
)
|
(1,054
|
)
|
||||
|
Net cash used in financing activities
|
(1,530
|
)
|
|
(1,054
|
)
|
|||
|
Effect of exchange rate changes on cash and cash equivalents
|
680
|
|
(454
|
)
|
||||
|
Increase in cash and cash equivalents
|
3,916
|
|
|
1,185
|
|
|||
|
Cash and cash equivalents:
|
|
|
||||||
|
Beginning of period
|
171,044
|
|
147,346
|
|
||||
|
Cash and cash equivalents included in current assets held for sale
|
1,352
|
|
—
|
|
||||
|
Beginning of period, total cash and cash equivalents
|
172,396
|
|
147,346
|
|
||||
|
End of period
|
$
|
176,312
|
|
$
|
148,531
|
|
||
_____________________________
(1) Excludes loss from sale of salon assets and any proceeds from The Beautiful Group.
The accompanying notes are an integral part of the unaudited Condensed Consolidated Financial Statements.
6
REGIS CORPORATION
NOTES TO CONDENSED CONSOLIDATED FINANCIAL STATEMENTS
(Unaudited)
|
1.
|
BASIS OF PRESENTATION OF UNAUDITED INTERIM CONDENSED CONSOLIDATED FINANCIAL STATEMENTS AND SUMMARY OF SIGNIFICANT ACCOUNTING POLICIES:
|
The unaudited interim Condensed Consolidated Financial Statements of Regis Corporation (the Company) as of
September 30, 2017
and for the
three
months ended
September 30, 2017
and
2016
, reflect, in the opinion of management, all adjustments necessary to fairly state the consolidated financial position of the Company as of
September 30, 2017
and its consolidated results of operations, comprehensive (loss) income and cash flows for the interim periods. Adjustments consist only of normal recurring items, except for any discussed in the notes below. The results of operations and cash flows for any interim period are not necessarily indicative of results of operations and cash flows for the full year.
The Condensed Consolidated Balance Sheet data for
June 30, 2017
was derived from audited Consolidated Financial Statements, but includes unaudited adjustments for assets and liabilities held for sale and does not include all disclosures required by accounting principles generally accepted in the United States of America (GAAP). The unaudited interim Condensed Consolidated Financial Statements should be read in conjunction with the Company’s Annual Report on Form 10-K for the year ended
June 30, 2017
and other documents filed or furnished with the Securities and Exchange Commission (SEC) during the current fiscal year.
Discontinued Operations
In October 2017, the Company sold substantially all of
its mall-based salon business in
North America,
representing
858
salons, and substantially all of its International segment, representing approximately
250
salons in the UK, to The Bea
utiful Group, an affiliate of Regent, a private equity firm based in Los Angeles, California, who will operate these locations as franchise locations. As part of the sale of the mall-based business, The Beautiful Group
agreed to pay for the value of certain inventory and assume specific liabilities, including lease liabilities. For the International segment, the Company agreed to a share purchase agreement with The Beautiful Group for minimal consideration.
As of September 30, 2017, the Company classified the
results of its mall-based business and its International segment a
s discontinued operations for all periods presented in the Condensed Consolidated Statement of Operations. Included within discontinued operations are the impairment charge, results of operations for the three months ended September 30, 2017 and the professional fees associated with the transaction. The assets and liabilities of these businesses to be sold met the criteria to be classified as held for sale and have been aggregated and reported as current assets held for sale, noncurrent assets held for sale, current liabilities related to assets held for sale and noncurrent liabilities related to assets held for sale in the Condensed Consolidated Balance Sheet for all periods presented. The classification was based on the Company's Board of Directors' approval to s
ell its mall-based business and International segment,
the salons being available for sale in present condition, and the sale being probable as of September 30, 2017. The operations of
the mall-based business and International segment,
which were previously recorded in the North American Value, North American Premium and International
r
eporting segments, will be eliminated from ongoing operations of the Company.
7
The following summarizes the assets and liabilities of our mall-based business and International segment as of September 30, 2017 and June 30, 2017:
|
September 30, 2017
|
June 30, 2017
|
|||||||
|
(Dollars in thousands)
|
||||||||
|
Current assets held for sale
|
||||||||
|
Cash and cash equivalents
|
$
|
1,298
|
|
$
|
1,352
|
|
||
|
Receivables, net
|
4,674
|
|
3,792
|
|
||||
|
Inventories
|
24,310
|
|
23,712
|
|
||||
|
Other current assets
|
4,461
|
|
4,058
|
|
||||
|
Total current assets held for sale
|
$
|
34,743
|
|
$
|
32,914
|
|
||
|
Noncurrent assets held for sale
|
||||||||
|
Property and equipment, net
|
$
|
22,435
|
|
$
|
23,713
|
|
||
|
Other intangibles, net
|
1,676
|
|
1,669
|
|
||||
|
Other assets
|
332
|
|
1,970
|
|
||||
|
Total noncurrent assets held for sale
|
$
|
24,443
|
|
$
|
27,352
|
|
||
|
Current liabilities related to assets held for sale
|
||||||||
|
Accounts payable
|
$
|
2,283
|
|
$
|
1,548
|
|
||
|
Accrued expenses
|
14,036
|
|
11,578
|
|
||||
|
Accrued loss on assets held for sale
|
30,467
|
|
—
|
|
||||
|
Total current liabilities related to assets held for sale
|
$
|
46,786
|
|
$
|
13,126
|
|
||
|
Noncurrent liabilities related to assets held for sale
|
||||||||
|
Other noncurrent liabilities
|
$
|
8,018
|
|
$
|
7,232
|
|
||
|
Total noncurrent liabilities related to assets held for sale
|
$
|
8,018
|
|
$
|
7,232
|
|
||
In connection with the sale of the mall-based business and the International segment as part of our held for sale assessment at September 30, 2017, the Company performed an impairment assessment of the asset groups. The Company recognized net impairment charges within discontinued operations during the three months ended September 30, 2017 based on the difference between the expected sale prices and the carrying value of the asset groups.
The following summarizes the results of our discontinued operations for the periods presented:
|
For the Three Months Ended September 30,
|
||||||||
|
2017
|
2016
|
|||||||
|
(Dollars in thousands)
|
||||||||
|
Revenues
|
$
|
93,366
|
|
$
|
112,212
|
|
||
|
Loss from discontinued operations
|
(33,768
|
)
|
(2,459
|
)
|
||||
Included within the
$33.8 million
loss from discontinued operations are
$30.5 million
of loss on assets held for sale,
$1.7
million of loss from operations and
$1.6 million
of professional fees associated with the transaction.
No
income taxes have been allocated to discontinued operations due to the valuation allowance in place on all deferred tax assets associated with the mall-based business and the International segment.
Within salon asset impairments presented in the Consolidated Statement of Cash Flows for the three months ended September 30, 2016,
$0.9 million
of salon asset impairments were related to discontinued operations. Other than the salon asset impairments and the other items presented in the Consolidated Statement of Cash Flows, there were no other significant noncash operating activities or any significant noncash investing activities related to discontinued operations for the three months ended
September 30, 2017
and 2016.
8
Stock-Based Employee Compensation:
During the three months ended
September 30, 2017
, the Company granted
259,158
restricted stock units (RSUs).
Total compensation cost for stock-based payment arrangements totaled
$2.0
and
$1.9 million
for the three months ended
September 30, 2017
and
2016
, respectively, recorded within general and administrative expense on the unaudited Condensed Consolidated Statement of Operations.
Long-Lived Asset Impairment Assessments, Excluding Goodwill:
The Company assesses impairment of long-lived assets at the individual salon level, as this is the lowest level for which identifiable cash flows are largely independent of other groups of assets and liabilities, when events or changes in circumstances indicate the carrying value of the assets or the asset grouping may not be recoverable. Factors considered in deciding when to perform an impairment review include significant under-performance of an individual salon in relation to expectations, significant economic or geographic trends, and significant changes or planned changes in our use of the assets. Impairment is evaluated based on the sum of undiscounted estimated future cash flows expected to result from use of the long-lived assets. If the undiscounted estimated cash flows are less than the carrying value of the assets, the Company calculates an impairment charge based on the estimated fair value of the assets. The fair value of the long-lived assets is estimated using a discounted cash flow model based on the best information available, including salon level revenues and expenses. Long-lived asset impairment charges of
$2.3
and
$1.9 million
have been recorded within depreciation and amortization in the Consolidated Statement of Operations for the three months ended
September 30, 2017
and
2016
, respectively.
A
ccounting Standards Recently Issued But Not Yet Adopted by the Company:
Leases
In February 2016, the FASB issued updated guidance requiring organizations that lease assets to recognize the rights and obligations created by those leases on the consolidated balance sheet. The new standard is effective for the Company in the first quarter of fiscal year 2020, with early adoption permitted. The Company is currently evaluating the effect the new standard will have on the Company's consolidated financial statements but expects this adoption will result in a material increase in the assets and liabilities on the Company's consolidated balance sheet.
Revenue from Contracts with Customers
In May 2014, the FASB issued updated guidance for revenue recognition. The updated accounting guidance provides a comprehensive new revenue recognition model that requires a company to recognize revenue to depict the exchange for goods or services to a customer at an amount that reflects the consideration it expects to receive for those goods or services. The guidance also requires additional disclosure about the nature, amount, timing and uncertainty of revenue and cash flows arising from customer contracts. The guidance is effective for the Company in the first quarter of fiscal year 2019, with early adoption permitted at the beginning of fiscal year 2018. The standard allows for either full retrospective adoption, meaning the standard is applied to all of the periods presented, or modified retrospective adoption, meaning the standard is applied only to the most current period presented in the financial statements. The Company expects to adopt this guidance in fiscal year 2019 using the modified retrospective method of adoption. While the Company is continuing to assess all potential impacts of the standard, the Company currently believes the most significant impact relates to the timing of recognition for gift card breakage, although it is not expected to have a material impact on the Company's consolidated financial statements. The Company is continuing to evaluate the impact the adoption of this new guidance will have on these and other revenue transactions, in addition to the impact on related disclosures and internal controls.
Intra-Entity Transfers Other Than Inventory
In October 2016, the FASB issued guidance on the accounting for income tax effects of intercompany transfers of assets other than inventory. The guidance requires entities to recognize the income tax impact of an intra-entity transfer of an asset other than inventory when the transfer occurs, rather than when the assets have been sold to an outside party. The guidance is effective for the Company in the first quarter of fiscal year 2019, with early adoption permitted. The Company does not expect the adoption of this standard to have a material impact on the Company's consolidated financial statements.
9
Restricted Cash
In November 2016, the FASB issued updated cash flow guidance requiring restricted cash and restricted cash equivalents to be included in the cash and cash equivalent balances in the statement of cash flows. Transfers between cash and cash equivalents and restricted cash will no longer be presented in the statement of cash flows and a reconciliation between the balance sheet and statement of cash flows must be disclosed. The guidance is effective for the Company beginning in the first quarter of fiscal year 2019, with early adoption permitted. The Company is currently evaluating the impact this guidance will have on the Company's consolidated statement of cash flows.
Statement of Cash Flows
In August 2016, the FASB issued updated cash flow guidance clarifying cash flow classification and presentation for certain items. The guidance is effective for the Company beginning in the first quarter of fiscal year 2019, with early adoption permitted. The Company does not expect the adoption of this standard to have a material impact on the Company's consolidated statement of cash flows.
2.
INVESTMENT IN AFFILIATES:
Empire Education Group, Inc. (EEG)
As of
September 30, 2017
, the Company had a
54.6%
ownership interest in EEG and
no
remaining investment value as the Company fully impaired its investment in EEG as of December 31, 2015. The Company has not recorded any equity income or losses related to its investment in EEG subsequent to the impairment. The Company will record equity income related to the Company's investment in EEG once EEG's cumulative income exceeds its cumulative losses, measured from the date of impairment.
While the Company could be responsible for certain liabilities associated with this venture, the Company does not currently expect them to have a material impact on the Company's financial position.
The table below presents the summarized Statement of Operations information for EEG:
|
For the Three Months Ended September 30,
|
||||||||
|
2017
|
2016
|
|||||||
|
(Unaudited)
|
(Dollars in thousands)
|
|||||||
|
Gross revenues
|
$
|
32,637
|
|
$
|
30,036
|
|
||
|
Gross profit
|
9,679
|
|
8,110
|
|
||||
|
Operating loss
|
(192
|
)
|
(707
|
)
|
||||
|
Net loss
|
(344
|
)
|
(830
|
)
|
||||
10
|
3.
|
EARNINGS PER SHARE:
|
The Company’s basic earnings per share is calculated as net income (loss) divided by weighted average common shares outstanding, excluding unvested outstanding restricted stock awards, RSUs and PSUs. The Company’s diluted earnings per share is calculated as net income divided by weighted average common shares and common share equivalents outstanding, which includes shares issued under the Company’s stock-based compensation plans. Stock-based awards with exercise prices greater than the average market price of the Company’s common stock are excluded from the computation of diluted earnings per share.
For the three months ended September 30, 2017 and 2016,
223,526
and
394,847
common stock equivalents of dilutive common stock were included in the diluted earnings per share calculations due to the income from continuing operations.
The computation of weighted average shares outstanding, assuming dilution, excluded
2,530,400
and
2,505,850
of stock-based awards during the three months ended
September 30, 2017
and
2016
, respectively, as they were not dilutive under the treasury stock method.
|
4.
|
SHAREHOLDERS’ EQUITY:
|
Additional Paid-In Capital:
The
$0.5 million
increase in additional paid-in capital during the
three
months ended
September 30, 2017
was primarily due to
$2.0 million
of stock-based compensation, partly offset by other stock-based compensation activity of
$1.5 million
.
|
5.
|
INCOME TAXES:
|
During the
three
months ended
September 30, 2017
and
2016
, the Company recognized tax expense of
$4.8
and
$2.7 million
, respectively, with corresponding effective tax rates of
30.9%
and
32.3%
.
The recorded tax provision and effective tax rates for the
three
months ended
September 30, 2017
and
2016
were different than what would normally be expected primarily due to the impact of the deferred tax valuation allowance. The majority of the tax provision related to non-cash tax expense for tax benefits on certain indefinite-lived assets the Company cannot recognize for reporting purposes. This non-cash impact will continue as long as the Company has a valuation allowance in place against most of its deferred tax assets and is expected to approximate
$7.3 million
of expense for the fiscal year ending June 30, 2018.
The Company’s U.S. federal income tax returns for the fiscal years 2010 through 2013 have been examined by the Internal Revenue Service (IRS) and were moved to the IRS Appeals Division. The Company believes its income tax positions and deductions will be sustained and will continue to vigorously defend such positions. All earlier tax years are closed to examination. With limited exceptions, the Company is no longer subject to state and international income tax examinations by tax authorities for years before 2012.
|
6.
|
COMMITMENTS AND CONTINGENCIES:
|
The Company is a defendant in various lawsuits and claims arising out of the normal course of business. Like certain other large retail employers, the Company has been faced with allegations of purported class-wide consumer and wage and hour violations. Litigation is inherently unpredictable and the outcome of these matters cannot presently be determined. Although the actions are being vigorously defended, the Company could in the future incur judgments or enter into settlements of claims that could have a material adverse effect on its results of operations in any particular period.
See Note 5 to the unaudited Condensed Consolidated Financial Statements for discussion regarding certain issues that have resulted from the IRS' examination of fiscal 2010 through 2013 federal income tax returns. Final resolution of these issues is not expected to have a material impact on the Company's financial position.
11
7. GOODWILL AND OTHER INTANGIBLES:
During the first quarter of fiscal year 2018, the Company experienced a triggering event due to the redefining of its operating segments as a result of the sale of the mall-based business and the International segment. See Note 10 to the unaudited Condensed Consolidated Financial Statements. The Company now reports its operations in
two
reportable segments: Company-owned salons and Franchise salons. The Company considered whether any goodwill associated with the MasterCuts salons should be allocated as part of the sale of the mall-based business and considered for impairment. The Company determined
no
goodwill should be allocated to the mall-based business because the salons sold were projected to produce operating losses in the future and had minimal fair value. All goodwill associated with the North American Premium and International segments was previously impaired. Pursuant to the change in operating segments, the Company compared the fair value of the remaining salons in the Company-owned reporting unit to its carrying value and concluded the fair value exceeded its carrying value by a substantial margin, resulting in
no
goodwill impairment.
The table below contains details related to the Company's goodwill:
|
Company-owned
|
Franchise
|
Consolidated
|
||||||||||
|
(Dollars in thousands)
|
||||||||||||
|
Goodwill, net at June 30, 2017
|
$
|
188,888
|
|
$
|
228,099
|
|
$
|
416,987
|
|
|||
|
Translation rate adjustments
|
676
|
|
816
|
|
1,492
|
|
||||||
|
Derecognition related to sale of salon assets to franchisees (1)
|
(270
|
)
|
—
|
|
(270
|
)
|
||||||
|
Goodwill, net at September 30, 2017
|
$
|
189,294
|
|
$
|
228,915
|
|
$
|
418,209
|
|
|||
_______________________________________________________________________________
|
(1)
|
Goodwill is derecognized for salons sold to franchisees with positive cash flows (excluding the salons sold to The Beautiful Group). The amount of goodwill derecognized is determined by a fraction (the numerator of which is the EBITDA of the salon being sold and the denominator of which is the EBITDA of the Company-owned reporting unit) that is applied to the total goodwill balance of the Company-owned reporting unit.
|
The table below presents other intangible assets:
|
|
September 30, 2017
|
June 30, 2017
|
||||||||||||||||||||||
|
|
Cost (1)
|
Accumulated
Amortization (1)
|
Net
|
Cost (1)
|
Accumulated
Amortization (1)
|
Net
|
||||||||||||||||||
|
|
(Dollars in thousands)
|
|||||||||||||||||||||||
|
Amortized intangible assets:
|
|
|
|
|
|
|
|
|
|
|
|
|
||||||||||||
|
Brand assets and trade names
|
$
|
8,387
|
|
$
|
(4,173
|
)
|
$
|
4,214
|
|
$
|
8,187
|
|
$
|
(4,013
|
)
|
$
|
4,174
|
|
||||||
|
Franchise agreements
|
10,061
|
|
(7,685
|
)
|
2,376
|
|
9,832
|
|
(7,433
|
)
|
2,399
|
|
||||||||||||
|
Lease intangibles
|
14,041
|
|
(9,277
|
)
|
4,764
|
|
14,007
|
|
(9,077
|
)
|
4,930
|
|
||||||||||||
|
Other
|
2,036
|
|
(1,585
|
)
|
451
|
|
1,994
|
|
(1,532
|
)
|
462
|
|
||||||||||||
|
|
$
|
34,525
|
|
$
|
(22,720
|
)
|
$
|
11,805
|
|
$
|
34,020
|
|
$
|
(22,055
|
)
|
$
|
11,965
|
|
||||||
_____________________________
|
(1)
|
The change in the gross carrying value and accumulated amortization of other intangible assets is impacted by foreign currency.
|
|
8.
|
FINANCING ARRANGEMENTS:
|
The Company’s long-term debt consists of the following:
|
|
Maturity Dates
|
Interest Rate
|
September 30,
2017 |
June 30,
2017 |
||||||||
|
|
(fiscal year)
|
|
(Dollars in thousands)
|
|||||||||
|
Senior Term Notes, net
|
2020
|
5.50%
|
$
|
120,847
|
|
$
|
120,599
|
|
||||
|
Revolving credit facility
|
2018
|
—
|
—
|
|
—
|
|
||||||
|
|
|
|
$
|
120,847
|
|
$
|
120,599
|
|
||||
12
Senior Term Notes
In December 2015, the Company exchanged its
$120.0 million
5.75%
senior notes due December 2017 for
$123.0 million
5.5%
senior notes due December 2019 (Senior Term Notes). The Senior Term Notes were issued at a
$3.0 million
discount which is being amortized to interest expense over the term of the notes. Interest on the Senior Term Notes is payable semi-annually in arrears on June 1 and December 1 of each year. The Senior Term Notes are unsecured and not guaranteed by any of the Company’s subsidiaries or any third parties.
The following table contains details related to the Company's Senior Term Notes:
|
September 30, 2017
|
June 30, 2017
|
|||||||
|
(Dollars in thousands)
|
||||||||
|
Principal amount on the Senior Term Notes
|
$
|
123,000
|
|
$
|
123,000
|
|
||
|
Unamortized debt discount
|
(1,627
|
)
|
(1,815
|
)
|
||||
|
Unamortized debt issuance costs
|
(526
|
)
|
(586
|
)
|
||||
|
Senior Term Notes, net
|
$
|
120,847
|
|
$
|
120,599
|
|
||
Revolving Credit Facility
The Company has a
$200 million
five-year unsecured revolving credit facility that expires in June 2018. The revolving credit facility has interest rates tied to LIBOR credit spread. As of
September 30, 2017
and
June 30, 2017
, the Company had
no
outstanding borrowings under this credit facility. The Company had outstanding standby letters of credit under the facility of
$1.5 million
at
September 30, 2017
and
June 30, 2017
, primarily related to the Company's self-insurance program, therefore, unused available credit under the facility at
September 30, 2017
and
June 30, 2017
was
$198.5 million
.
The Company was in compliance with all covenants and requirements of its financing arrangements as of and during the three months ended
September 30, 2017
.
|
9.
|
FAIR VALUE MEASUREMENTS:
|
Fair value measurements are categorized into one of three levels based on the lowest level of significant input used: Level 1 (unadjusted quoted prices in active markets); Level 2 (observable market inputs available at the measurement date, other than quoted prices included in Level 1); and Level 3 (unobservable inputs that cannot be corroborated by observable market data).
Assets and Liabilities Measured at Fair Value on a Recurring Basis
As of
September 30, 2017
and
June 30, 2017
, the estimated fair value of the Company’s cash, cash equivalents, restricted cash, receivables and accounts payable approximated their carrying values. As of
September 30, 2017
, the estimated fair value of the Company's debt was
$126.4 million
and the carrying value was
$123.0 million
, excluding the
$1.6 million
unamortized debt discount and
$0.5 million
unamortized debt issuance costs. As of
June 30, 2017
, the estimated fair value of the Company's debt was
$125.9 million
and the carrying value was
$123.0 million
, excluding the
$1.8 million
unamortized debt discount and
$0.6 million
unamortized debt issuance costs. The estimated fair value of the Company's debt is based on Level 2 inputs.
Assets and Liabilities Measured at Fair Value on a Nonrecurring Basis
We measure certain assets, including the Company’s equity method investments, tangible fixed and other assets and goodwill, at fair value on a nonrecurring basis when they are deemed to be other than temporarily impaired. The fair values of these assets are determined based on valuation techniques using the best information available, and may include quoted market prices, market comparables, and discounted cash flow projections.
The following impairments were based on fair values using Level 3 inputs:
|
For the Three Months Ended September 30,
|
||||||||
|
2017
|
2016
|
|||||||
|
(Dollars in thousands)
|
||||||||
|
Long-lived assets (1)
|
$
|
(2,280
|
)
|
$
|
(1,909
|
)
|
||
_____________________________
|
(1)
|
See Note 1 to the unaudited Condensed Consolidated Financial Statements.
|
13
10.
SEGMENT INFORMATION:
Segment information is prepared on the same basis the chief operating decision maker reviews financial information for operational decision-making purposes. During the first quarter of fiscal year 2018, the Company redefined its operating segments to reflect how the chief operating decision maker now evaluates the business as a result of the Company's Board of Directors' approval of the mall-based business and International segment sale. See Note 1 to the unaudited Condensed Consolidated Financial Statements. The Company now reports its operations in
two
operating segments: Company-owned salons and Franchise salons. The Company's operating segments are its reportable operating segments. Prior to this change, the Company had
four
operating segments: North American Value, North American Premium, North American Franchise, and International. The Company did not operate under the realigned operating segment structure prior to the first quarter of fiscal year 2018.
As of
September 30, 2017
, the Company’s reportable operating segments consisted of the following salons:
|
Company-owned (1)
|
6,112
|
|
|
|
Franchise (1)
|
2,743
|
|
|
|
Total
|
8,855
|
|
|
_____________________________
|
(1)
|
In October 2017, the Company sold substantially all of its mall-based salon business in North America, representing
858
company-owned salons, and substantially all of its International segment, representing approximately
250
company-owned salons, to The Beautiful Group, who will operate these locations as franchise locations. As a result, company-owned salons will decrease and franchise salons will increase by approximately
1,108
salons in October 2017.
|
As of September 30, 2017, the Company-owned operating segment is comprised primarily of SmartStyle, Supercuts, Regis, MasterCuts, Cost Cutters, and other regional trade names and the Franchise operating segment is comprised primarily of Supercuts, SmartStyle, Cost Cutters, First Choice Haircutters, Roosters and Magicuts concepts. In connection with the sale of the mall-based business and International segment, the Regis and MasterCuts brands will be primarily franchise brands, beginning in October 2017. The Corporate segment represents home office and other unallocated costs.
Concurrent with the change in reportable segments, the Company recast its prior period financial information to reflect comparable financial information for the new segment structure. Historical financial information shown in the following table and elsewhere in this filing reflects this change. Financial information concerning the Company's reportable operating segments is shown in the following table:
14
|
|
For the Three Months Ended September 30, 2017
|
|||||||||||||||
|
Company-owned
|
Franchise
|
Corporate
|
Consolidated
|
|||||||||||||
|
|
(Dollars in thousands)
|
|||||||||||||||
|
Revenues:
|
||||||||||||||||
|
Service
|
$
|
235,559
|
|
$
|
—
|
|
$
|
—
|
|
$
|
235,559
|
|
||||
|
Product
|
53,218
|
|
7,722
|
|
—
|
|
60,940
|
|
||||||||
|
Royalties and fees
|
—
|
|
13,374
|
|
—
|
|
13,374
|
|
||||||||
|
288,777
|
|
21,096
|
|
—
|
|
309,873
|
|
|||||||||
|
Operating expenses:
|
||||||||||||||||
|
Cost of service
|
139,836
|
|
—
|
|
—
|
|
139,836
|
|
||||||||
|
Cost of product
|
24,447
|
|
5,715
|
|
—
|
|
30,162
|
|
||||||||
|
Site operating expenses
|
33,302
|
|
1
|
|
—
|
|
33,303
|
|
||||||||
|
General and administrative
|
15,824
|
|
5,546
|
|
13,795
|
|
35,165
|
|
||||||||
|
Rent
|
42,123
|
|
47
|
|
246
|
|
42,416
|
|
||||||||
|
Depreciation and amortization
|
9,894
|
|
92
|
|
2,269
|
|
12,255
|
|
||||||||
|
Total operating expenses
|
265,426
|
|
11,401
|
|
16,310
|
|
293,137
|
|
||||||||
|
Operating income (loss)
|
23,351
|
|
9,695
|
|
(16,310
|
)
|
16,736
|
|
||||||||
|
Other (expense) income:
|
||||||||||||||||
|
Interest expense
|
—
|
|
—
|
|
(2,138
|
)
|
(2,138
|
)
|
||||||||
|
Interest income and other, net
|
—
|
|
—
|
|
1,027
|
|
1,027
|
|
||||||||
|
Income (loss) from continuing operations before income taxes
|
$
|
23,351
|
|
$
|
9,695
|
|
$
|
(17,421
|
)
|
$
|
15,625
|
|
||||
|
|
For the Three Months Ended September 30, 2016
|
|||||||||||||||
|
Company-owned
|
Franchise
|
Corporate
|
Consolidated
|
|||||||||||||
|
|
(Dollars in thousands)
|
|||||||||||||||
|
Revenues:
|
||||||||||||||||
|
Service
|
$
|
243,091
|
|
$
|
—
|
|
$
|
—
|
|
$
|
243,091
|
|
||||
|
Product
|
56,313
|
|
7,403
|
|
—
|
|
63,716
|
|
||||||||
|
Royalties and fees
|
—
|
|
12,024
|
|
—
|
|
12,024
|
|
||||||||
|
299,404
|
|
19,427
|
|
—
|
|
318,831
|
|
|||||||||
|
Operating expenses:
|
||||||||||||||||
|
Cost of service
|
150,797
|
|
—
|
|
—
|
|
150,797
|
|
||||||||
|
Cost of product
|
25,347
|
|
5,468
|
|
—
|
|
30,815
|
|
||||||||
|
Site operating expenses
|
32,645
|
|
—
|
|
—
|
|
32,645
|
|
||||||||
|
General and administrative
|
11,542
|
|
5,397
|
|
18,977
|
|
35,916
|
|
||||||||
|
Rent
|
46,012
|
|
42
|
|
179
|
|
46,233
|
|
||||||||
|
Depreciation and amortization
|
9,595
|
|
90
|
|
2,424
|
|
12,109
|
|
||||||||
|
Total operating expenses
|
275,938
|
|
10,997
|
|
21,580
|
|
308,515
|
|
||||||||
|
Operating income (loss)
|
23,466
|
|
8,430
|
|
(21,580
|
)
|
10,316
|
|
||||||||
|
Other (expense) income:
|
||||||||||||||||
|
Interest expense
|
—
|
|
—
|
|
(2,163
|
)
|
(2,163
|
)
|
||||||||
|
Interest income and other, net
|
—
|
|
—
|
|
327
|
|
327
|
|
||||||||
|
Income (loss) from continuing operations before income taxes
|
$
|
23,466
|
|
$
|
8,430
|
|
$
|
(23,416
|
)
|
$
|
8,480
|
|
||||
15
Management’s Discussion and Analysis of Financial Condition and Results of Operations (MD&A) is designed to provide a reader of our financial statements with a narrative from the perspective of our management on our financial condition, results of operations, liquidity and certain other factors that may affect our future results. This MD&A should be read in conjunction with the MD&A included in our
June 30, 2017
Annual Report on Form 10-K and other documents filed or furnished with the Securities and Exchange Commission (SEC) during the current fiscal year.
MANAGEMENT’S OVERVIEW
Regis Corporation (RGS) owns, franchises and operates beauty salons. As of
September 30, 2017
, the Company owned, franchised or held ownership interests in
8,944
worldwide locations. Our locations consisted of
8,855
system-wide North American and International salons, and in
89
locations we maintain a non-controlling ownership interest less than 100 percent. Each of the Company’s salon concepts generally offer similar salon products and services and serve the mass market. As of
September 30, 2017
, we had approximately 40,000 corporate employees worldwide.
In October
2017, the Company sold substantially all of
its mall-based salon business in
North America, representing
858
company-owned salons, and substantially all of its International segment, representing approximately
250
company-owned salons, to The Beautiful Group, who will operate these locations as franchise locations. Accordingly, beginning with the period ended September 30, 2017, the mall-based business and International segment were accounted for as discontinued operations for all periods presented. Discontinued operations are discussed at the end of this section.
See Note 1 to the unaudited Condensed Consolidated Financial Statements for further discussion on this transaction.
CRITICAL ACCOUNTING POLICIES
The interim unaudited Condensed Consolidated Financial Statements are prepared in conformity with accounting principles generally accepted in the United States of America. In preparing the interim unaudited Condensed Consolidated Financial Statements, we are required to make various judgments, estimates and assumptions that could have a significant impact on the results reported in the interim unaudited Condensed Consolidated Financial Statements. We base these estimates on historical experience and other assumptions believed to be reasonable under the circumstances. Estimates are considered to be critical if they meet both of the following criteria: (1) the estimate requires assumptions about material matters that are uncertain at the time the accounting estimates are made, and (2) other materially different estimates could have been reasonably made or material changes in the estimates are reasonably likely to occur from period to period. Changes in these estimates could have a material effect on our interim unaudited Condensed Consolidated Financial Statements.
Our significant accounting policies can be found in Note 1 to the Consolidated Financial Statements contained in Part II, Item 8 of the
June 30, 2017
Annual Report on Form 10-K, as well as Note 1 to the unaudited Condensed Consolidated Financial Statements contained within this Quarterly Report on Form 10-Q. We believe the accounting policies related to investment in affiliates, the valuation of goodwill, the valuation and estimated useful lives of long-lived assets, estimates used in relation to tax liabilities and deferred taxes and legal contingencies are most critical to aid in fully understanding and evaluating our reported financial condition and results of operations. Discussion of each of these policies is contained under “Critical Accounting Policies” in Part II, Item 7 of our
June 30, 2017
Annual Report on Form 10-K.
Recent Accounting Pronouncements
Recent accounting pronouncements are discussed in Note 1 to the unaudited Condensed Consolidated Financial Statements.
RESULTS OF OPERATIONS
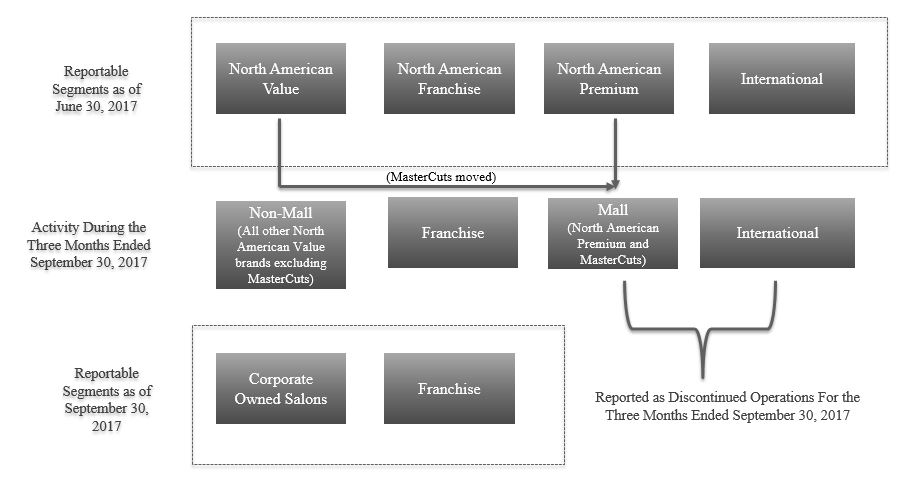
Beginning in the first quarter of fiscal year 2018, the Company redefined its operating segments to reflect how the chief operating decision maker evaluates the business as a result of the sale of the mall-based business (primarily comprised of MasterCuts and Regis branded salons) and International segment.
The Company now reports its operations in two operating segments: Company-owned salons and Franchise salons. The Company's operating segments are its reportable operating segments. Prior to this change, the Company had four operating segments: North American Value, North American Premium, North American Franchise, and International.
Beginning with the period ended September 30, 2017, the mall-based business and International segment were accounted for as discontinued operations for all periods presented. Discontinued operations are discussed at the end of this section.
See Note 1 to the unaudited Condensed Consolidated Financial Statements for further discussion on this transaction.
16
Beginning in the first quarter of fiscal year 2018, costs associated with field leaders that were previously recorded within Cost of Service and Site Operating expense are now categorized within General and Administrative expense as a result of the field reorganization that took place in the first quarter of fiscal year 2018. The estimated impact of the field reorganization (decreased) increased Cost of Service, Site Operating expense and General and Administrative expense by ($4.4), ($1.1) and $5.5 million, respectively, year over year.
This expense classification does not have a financial impact on the Company's reported operating income, reported net (loss) income or cash flows from operations.
In the past field leaders were responsible for a geographical area that included a variety of brands, with different business models, services, pay plans and guest expectations. They also served as salon managers with a home salon that they spent a large portion of their time serving guests rather than field leadership. Post-reorganization, each field leader is dedicated to a specific brand/concept, as well as geography, and are focused solely on field leadership.
Below is a graphic depicting the segment change as a result of the activity during the three months ended September 30, 2017:
The results of operations for the first quarter of fiscal year 2018 were impacted by Hurricanes Harvey, Irma and Maria. A total of 3,418 salon days were lost as 768 salons were closed at least one day in the quarter. The Company estimates revenues and expenses in the current year quarter were (reduced) increased by ($2.4) and $0.7 million, respectively.
17
Condensed Consolidated Results of Operations (Unaudited)
The following table sets forth, for the periods indicated, certain information derived from our unaudited Condensed Consolidated Statement of Operations. The percentages are computed as a percent of total consolidated revenues, except as otherwise indicated.
|
|
For the Periods Ended September 30,
|
||||||||||||||||||
|
Three Months
|
|||||||||||||||||||
|
|
2017
|
2016
|
2017
|
2016
|
2017
|
2016
|
|||||||||||||
|
|
($ in millions)
|
% of Total
Revenues (1) |
Basis Point
(Decrease) Increase |
||||||||||||||||
|
Service revenues
|
$
|
235.6
|
|
$
|
243.1
|
|
76.0
|
%
|
76.2
|
%
|
(20
|
)
|
(10
|
)
|
|||||
|
Product revenues
|
60.9
|
|
63.7
|
|
19.7
|
|
20.0
|
|
(30
|
)
|
—
|
|
|||||||
|
Franchise royalties and fees
|
13.4
|
|
12.0
|
|
4.3
|
|
3.8
|
|
50
|
|
10
|
|
|||||||
|
Cost of service (2)
|
139.8
|
|
150.8
|
|
59.4
|
|
62.0
|
|
(260
|
)
|
10
|
|
|||||||
|
Cost of product (2)
|
30.2
|
|
30.8
|
|
49.5
|
|
48.4
|
|
110
|
|
40
|
|
|||||||
|
Site operating expenses
|
33.3
|
|
32.6
|
|
10.7
|
|
10.2
|
|
50
|
|
(70
|
)
|
|||||||
|
General and administrative
|
35.2
|
|
35.9
|
|
11.3
|
|
11.3
|
|
—
|
|
(60
|
)
|
|||||||
|
Rent
|
42.4
|
|
46.2
|
|
13.7
|
|
14.5
|
|
(80
|
)
|
10
|
|
|||||||
|
Depreciation and amortization
|
12.3
|
|
12.1
|
|
4.0
|
|
3.8
|
|
20
|
|
(60
|
)
|
|||||||
|
Operating income
|
16.7
|
|
10.3
|
|
5.4
|
|
3.2
|
|
220
|
|
160
|
|
|||||||
|
Interest expense
|
2.1
|
|
2.2
|
|
0.7
|
|
0.7
|
|
—
|
|
—
|
|
|||||||
|
Interest income and other, net
|
1.0
|
|
0.3
|
|
0.3
|
|
0.1
|
|
20
|
|
(20
|
)
|
|||||||
|
Income taxes (3)
|
(4.8
|
)
|
(2.7
|
)
|
30.9
|
|
32.3
|
|
N/A
|
|
N/A
|
|
|||||||
|
Loss from discontinued operations, net of taxes
|
(33.8
|
)
|
(2.5
|
)
|
10.9
|
|
0.8
|
|
1,010
|
|
60
|
|
|||||||
_____________________________
|
(1)
|
Cost of service is computed as a percent of service revenues. Cost of product is computed as a percent of product revenues.
|
|
(2)
|
Excludes depreciation and amortization expense.
|
|
(3)
|
Computed as a percent of income (loss) before income taxes and equity in loss of affiliated companies. The income taxes basis point change is noted as not applicable (N/A) as the discussion within MD&A is related to the effective income tax rate.
|
18
Consolidated Revenues
Consolidated revenues primarily include revenues of company-owned salons, product and equipment sales to franchisees, and franchise royalties and fees. The following tables summarize revenues and same-store sales by concept as well as the reasons for the percentage change:
|
|
For the Three Months
Ended September 30, |
|||||||
|
|
2017
|
2016
|
||||||
|
|
(Dollars in thousands)
|
|||||||
|
Company-owned salons:
|
|
|
|
|
||||
|
SmartStyle
|
$
|
126,202
|
|
$
|
128,949
|
|
||
|
Supercuts
|
71,432
|
|
73,642
|
|
||||
|
Signature Style
|
91,143
|
|
96,813
|
|
||||
|
Total Company-owned salons
|
288,777
|
|
299,404
|
|
||||
|
Franchise salons:
|
||||||||
|
Product
|
7,722
|
|
7,403
|
|
||||
|
Royalties and fees
|
13,374
|
|
12,024
|
|
||||
|
Total Franchise salons
|
21,096
|
|
19,427
|
|
||||
|
Consolidated revenues
|
$
|
309,873
|
|
$
|
318,831
|
|
||
|
Percent change from prior year
|
(2.8
|
)%
|
(1.1
|
)%
|
||||
|
Salon same-store sales increase (1)
|
0.4
|
%
|
0.3
|
%
|
||||
_____________________________
|
(1)
|
Same-store sales are calculated on a daily basis as the total change in sales for company-owned locations that were open on a specific day of the week during the current period and the corresponding prior period. Quarterly and year-to-date same-store sales are the sum of the same-store sales computed on a daily basis. Locations relocated within a one-mile radius are included in same-store sales as they are considered to have been open in the prior period. International same-store sales are calculated in local currencies to remove foreign currency fluctuations from the calculation.
|
Decreases in consolidated revenues were driven by the following:
|
|
For the Three Months
Ended September 30, |
|||||
|
Factor
|
2017
|
2016
|
||||
|
Same-store sales
|
0.4
|
%
|
0.3
|
%
|
||
|
Closed salons
|
(3.6
|
)
|
(1.8
|
)
|
||
|
New stores and conversions
|
0.6
|
|
0.5
|
|
||
|
Foreign currency
|
0.3
|
|
—
|
|
||
|
Other
|
(0.5
|
)
|
(0.1
|
)
|
||
|
|
(2.8
|
)%
|
(1.1
|
)%
|
||
Same-store sales by concept are detailed in the table below:
|
|
For the Three Months
Ended September 30, |
|||||
|
|
2017
|
2016
|
||||
|
SmartStyle
|
0.6
|
%
|
0.1
|
%
|
||
|
Supercuts
|
1.8
|
|
1.1
|
|
||
|
Signature Style
|
(0.8
|
)
|
(0.1
|
)
|
||
|
Consolidated same-store sales
|
0.4
|
%
|
0.3
|
%
|
||
The same-store sales increase of
0.4%
during the
three
months ended
September 30, 2017
was due to an increase of
3.5%
in average ticket price, partly offset by a decrease of
3.1%
in same-store guest visits. The Company constructed (net of
19
relocations) and closed
21
and
191
company-owned salons, respectively, during the twelve months ended
September 30, 2017
and sold (net of buybacks)
181
company-owned salons to franchisees during the same period (2018 Net Salon Count Changes).
The same-store sales increase of 0.3% during the three months ended September 30, 2016 was due to an increase of 5.1% in average ticket price, partly offset by a decrease of 4.8% in same-store guest visits. The Company constructed (net of relocations) and closed
49
and
113
company-owned salons, respectively, during the twelve months ended September 30, 2016 and sold (net of buybacks)
41
company-owned salons to franchisees during the same period (2017 Net Salon Count Changes).
Consolidated revenues are primarily comprised of service and product revenues, as well as franchise royalties and fees. Fluctuations in these three major revenue categories, operating expenses and other income and expense were as follows:
Service Revenues
The
$7.5 million
decrease in service revenues during the
three
months ended
September 30, 2017
was primarily due to the 2018 Net Salon Count Changes and the impact of the hurricanes in the southern United States, partly offset by a same-store service sales increase of
0.9%
and foreign currency fluctuations, among other factors. The increase in same-store service sales was primarily the result of a
4.1%
increase in average ticket price, partly offset by a
3.2%
decrease in same-store guest visits during the
three
months ended
September 30, 2017
.
The $2.9 million decrease in service revenues during the three months ended September 30, 2016, was primarily due to the 2017 Net Salon Count Changes, partly offset by a same-store service sales increase of 0.4%. The increase in same-store service sales was primarily the result of a 5.0% increase in average ticket price, partly offset by a 4.6% decrease in same-store guest visits during the three months ended September 30, 2016.
Product Revenues
The
$2.8 million
decrease in product revenues during the
three
months ended
September 30, 2017
was primarily due to the 2018 Net Salon Count Changes, a same-store product sales decrease of
1.5%
and impact of the hurricanes in the southern United States, partly offset by foreign currency fluctuations. The decrease in same-store product sales was primarily the result of a decrease in same-store transactions of
5.0%
, partly offset by an increase in average ticket price of
3.5%
during the
three
months ended
September 30, 2017
.
The $0.1 million decrease in product revenues during the three months ended September 30, 2016 was primarily due to the 2017 Net Salon Count Changes and a same-store product sales decrease of 0.4%. The decrease in same-store product sales was primarily the result of a 2.6% decrease in same-store transactions, partly offset by a 2.2% increase in average ticket price.
Royalties and Fees
Total franchised locations open at
September 30, 2017
were
2,743
as compared to 2,528 at
September 30, 2016
. The increase of
$1.4 million
in royalties and fees for the three months ended
September 30, 2017
was primarily due to higher franchise fees due to an increase in the number of new salons opened in the quarter compared to the prior year and higher royalties due to the increased number of franchised locations.
Total franchised locations open at September 30, 2016 were 2,528 as compared to 2,374 at September 30, 2015. Royalties and fees were flat for the three months ended September 30, 2016 primarily due to the increased number of franchised locations and same-store sales increases at franchised locations, partly offset by lower franchise fees and a higher level of franchise termination fees in the prior year.
Cost of Service
The
260
basis point decrease in cost of service as a percent of service revenues during the
three
months ended
September 30, 2017
was primarily due to the change in expense categorization as a result of the field reorganization that took place during the first quarter of fiscal year 2018. After considering this change in expense categorization, cost of service as a percent of service revenues decreased 80 basis points as a result of improved stylist productivity and cost savings associated with salon tools, partly offset by state minimum wage increases, higher health insurance costs and impact of the hurricanes in the southern United States.
20
The
10
basis point increase in cost of service as a percent of service revenues during the three months ended September 30, 2016 was primarily the result of state minimum wage increases and a rebate in the prior year, partly offset by improved stylist productivity and lower bonuses.
Cost of Product
The
110
basis point increase in cost of product as a percent of product revenues during the three months ended
September 30, 2017
was primarily due to certain benefits in the prior year quarter and the first quarter of fiscal year 2016.
The
40
basis point increase in cost of product as a percent of product revenues during the three months ended September 30, 2016, was primarily due to inventory write-offs associated with salon closures and obsolescence.
Site Operating Expenses
Site operating expenses increased
$0.7 million
during the
three
months ended
September 30, 2017
. After considering the change in expense categorization as a result of the field reorganization that took place during the first quarter of fiscal year 2018, site operating expenses increased $1.8 million during the three months ended September 30, 2017, primarily as a result of the SmartStyle marketing campaign, partly offset by a net reduction in salon counts.
Site operating expenses decreased by
$2.7 million
during the three months ended September 30, 2016 primarily due to cost savings associated with salon telecom costs and workers' compensation, a net reduction in salon counts and timing of marketing expenses.
General and Administrative
General and administrative (G&A) decreased
$0.8 million
during the three months ended
September 30, 2017
. After considering the change in expense categorization as a result of the field reorganization that took place during the first quarter of fiscal year 2018, G&A decreased $6.3 million primarily as a result of a gain associated with life insurance proceeds in connection with passing of a former executive officer, partly offset by professional fees associated with the franchise strategy and timing of certain costs.
G&A decreased
$2.5 million
during the three months ended September 30, 2016 primarily due to timing of expenses, one-time compensation benefits, certain higher costs in the prior year and cost savings, partly offset by investments in training.
Rent
Rent expense decreased
$3.8 million
during the
three
months ended
September 30, 2017
due to a net reduction in salon counts, partly offset by rent inflation.
Rent expense decreased
$0.2 million
during the
three
months ended
September 30, 2016
due to salon closures, partly offset by lease termination fees and rent inflation.
Depreciation and Amortization
Depreciation and amortization (D&A) increased
$0.1 million
during the three months ended
September 30, 2017
primarily due to higher fixed asset impairment charges, partly offset by lower depreciation on a reduced salon base.
D&A decreased $1.9 million during the three months ended September 30, 2016 primarily due to lower depreciation on a reduced salon based and reduced fixed asset impairment charges.
Interest Expense
Interest expense was flat for the
three
months ended
September 30, 2017
compared to the prior year period.
Interest expense decreased
$0.2 million
for the three months ended September 30, 2016 primarily due to the senior term note modification and the amendment to the revolving credit facility in fiscal year 2016.
21
Interest Income and Other, net
The
$0.7 million
increase in interest income and other, net during the three months ended
September 30, 2017
was primarily due to the recognition of gift card breakage and gains on salon assets sold.
The
$0.5 million
decrease in interest income and other, net during the three months ended September 30, 2016 was primarily due to prior year gains on salon assets sold.
Income Taxes
During the
three
months ended
September 30, 2017
and
2016
, the Company recognized tax expense of
$4.8
and
$2.7 million
, respectively, with corresponding effective tax rates of
30.9%
and
32.3%
.
The recorded tax provision and effective tax rates for the
three
months ended
September 30, 2017
and
2016
were different than what would normally be expected primarily due to the impact of the deferred tax valuation allowance. The majority of the tax provision related to non-cash tax expense for tax benefits on certain indefinite-lived assets that the Company cannot recognize for reporting purposes. Income tax expense for the three months ended September 30, 2017 included non-cash expense of $3.7 million related to this matter. This non-cash tax expense will continue as long as the Company has a valuation allowance in place against most of its deferred tax assets and is expected to approximate $7.3 million of expense for the fiscal year ending June 30, 2018.
Additionally, the Company is currently paying taxes in Canada and certain states in which it has profitable entities.
See Note 5 to the unaudited Condensed Consolidated Financial Statements.
Loss from Discontinued Operations
During the three months ended
September 30, 2017
and
2016
, the Company recognized
$33.8
and
$2.5 million
, respectively, of loss associated with the discontinued operations of the mall-based business and International segment. The increase in the loss was due to a loss on assets held for sale of $30.5 million, the loss from operations and the professional fees associated with the transaction during the three months ended September 30, 2017. See Note 1 to the unaudited Condensed Consolidated Financial Statements.
Results of Operations by Segment
Based on our internal management structure, we now report two segments: Company-owned salons and Franchise salons. See Note 10 to the Consolidated Financial Statements. Significant results of operations are discussed below with respect to each of these segments.
Company-owned Salons
|
For the Three Months Ended September 30,
|
|||||||||||||||
|
2017
|
2016
|
2017
|
2016
|
||||||||||||
|
(Dollars in millions)
|
Increase (Decrease)
|
||||||||||||||
|
Total revenue
|
$
|
288.8
|
|
$
|
299.4
|
|
$
|
(10.6
|
)
|
$
|
(3.7
|
)
|
|||
|
Same-store sales
|
0.4
|
%
|
0.3
|
%
|
10 bps
|
|
(170 bps)
|
|
|||||||
|
Operating income
|
$
|
23.4
|
|
$
|
23.5
|
|
$
|
(0.1
|
)
|
$
|
3.2
|
|
|||
22
Company-owned Salon Revenues
Decreases in Company-owned salon revenues were driven by the following:
|
|
For the Three Months
Ended September 30, |
|||||
|
Factor
|
2017
|
2016
|
||||
|
Same-store sales
|
0.4
|
%
|
0.3
|
%
|
||
|
Closed salons
|
(3.8
|
)
|
(2.0
|
)
|
||
|
New stores and conversions
|
0.4
|
|
0.5
|
|
||
|
Foreign currency
|
0.3
|
|
—
|
|
||
|
Other
|
(0.8
|
)
|
—
|
|
||
|
(3.5
|
)%
|
(1.2
|
)%
|
|||
Company-owned salon revenues decreased
$10.6 million
during the three months ended
September 30, 2017
primarily due to the closure of
191
salons and the sale of
181
company-owned salons (net of buybacks) to franchisees during the twelve months ended
September 30, 2017
, partly offset by the
0.4%
increase in same-store sales. The same-store sales increase was due to a 3.5% increase in average ticket price, partly offset by a 3.1% decrease in same-store guest visits. Partly offsetting the decrease was revenue growth from construction (net of relocations) of
21
salons during the twelve months ended
September 30, 2017
.
Company-owned salon revenues decreased
$3.7 million
during the three months ended September 30, 2016 primarily due to the closure of
113
salons and the sale of
41
company-owned salons (net of buybacks) to franchisees during the twelve months ended September 30, 2016. Partly offsetting the decrease was the same-store sales increase of 0.3% and revenue growth from construction (net of relocations) of
49
salons during the twelve months ended September 30, 2016. The same-store sales increase was due to a 5.1% increase in average ticket price, partly offset by a 4.8% decrease in same-store guest visits.
Company-owned Salon Operating Income
Company-owned salon operating income decreased
$0.1 million
during the three months ended September 30, 2017 due to state minimum wage increases, costs associated with the SmartStyle marketing campaign, higher health insurance costs and the impact of the hurricanes in the southern United States, partly offset by improved stylist productivity, the closure of underperforming salons and prior year inventory expense related to salon tools.
Company-owned salon operating income increased
$3.2 million
during the three months ended September 30, 2016 primarily due to the same-store sales increases, reduced fixed asset impairment charges, cost savings associated with salon telecom and utilities costs and improved stylist productivity, partly offset by minimum wage increases.
Franchise Salons
|
For the Three Months Ended September 30,
|
|||||||||||||||
|
2017
|
2016
|
2017
|
2016
|
||||||||||||
|
(Dollars in millions)
|
Increase (Decrease)
|
||||||||||||||
|
Franchise salons:
|
|||||||||||||||
|
Product
|
$
|
7.7
|
|
$
|
7.4
|
|
$
|
0.3
|
|
$
|
(0.1
|
)
|
|||
|
Royalties and fees
|
13.4
|
|
12.0
|
|
1.4
|
|
—
|
|
|||||||
|
Total Franchise salons
|
$
|
21.1
|
|
$
|
19.4
|
|
$
|
1.7
|
|
$
|
(0.1
|
)
|
|||
|
Operating income
|
$
|
9.7
|
|
$
|
8.4
|
|
$
|
1.3
|
|
$
|
0.5
|
|
|||
Franchise Salon Revenues
Franchise salon revenues increased
$1.7 million
during the three months ended
September 30, 2017
due to a
$0.3 million
increase in franchise product sales and a
$1.4 million
increase in royalties and fees. Both of these increases are due to increased franchised locations. The increase in royalties and fees was also due to an increase in the number of new salons opened in the quarter compared to the prior year. During the twelve months ended
September 30, 2017
, franchisees constructed (net of relocations) and closed 124 and 94 franchise-owned salons, respectively, and purchased (net of Company buybacks) 185 salons from the Company during the same period.
Franchise salon revenues decreased
$0.1 million
during the three months ended September 30, 2016 due to a
$0.1 million
decrease in franchise product sales and flat royalties and fees. Royalties and fees were flat primarily due to the increased
23
number of franchised locations and same-store sales increases at franchised locations, partly offset by lower franchise fees and a higher level of franchise termination fees in the prior year. During the twelve months ended September 30, 2016, franchisees constructed (net of relocations) and closed 175 and 63 franchise-owned salons, respectively, and purchased (net of Company buybacks) 42 salons from the Company during the same period.
Franchise Salon Operating Income
Franchise salon operating income increased
$1.3 million
during fiscal year 2018 primarily due to the increased number of new franchised locations and the timing of the franchise convention costs in fiscal year 2018 compared to fiscal year 2017.
Franchise salon operating income increased
$0.5 million
during the three months ended September 30, 2016 primarily due to the timing of the franchise convention costs in fiscal year 2017 compared to fiscal year 2016.
Corporate
Corporate Operating Loss
Corporate operating loss decreased
$5.3 million
during the three months ended September 30, 2017 primarily driven by a gain associated with life insurance proceeds in connection with passing of a former executive officer, partly offset by professional fees associated with the franchise strategy and timing of certain costs.
Corporate operating loss decreased $2.4 million during the three months ended September 30, 2016 primarily due to timing of expenses, one-time compensation benefits and cost savings.
LIQUIDITY AND CAPITAL RESOURCES
Sources of Liquidity
Funds generated by operating activities, available cash and cash equivalents, and our borrowing agreements are our most significant sources of liquidity.
As of
September 30, 2017
, cash and cash equivalents were
$176.3
million, with
$155.1
,
$13.9
and
$7.3 million
within the United States, Canada, and Europe, respectively.
The Company's borrowing agreements include $123.0 million 5.5% senior notes due December 2019 (Senior Term Notes) and a $200.0 million five-year unsecured revolving credit facility that expires in June 2018, of which
$198.5 million
was unused as of
September 30, 2017
. See Note 8 to the unaudited Condensed Consolidated Financial Statements.
Uses of Cash
The Company has a capital allocation policy that focuses on three key principles. These principles focus on preserving a strong balance sheet and enhancing operating flexibility, preventing unnecessary dilution so the benefits of future value accrue to existing shareholders and deploying capital to the highest and best use by optimizing the tradeoff between risk and after-tax returns.
Cash Flows
Cash Flows from Operating Activities
During the
three
months ended
September 30, 2017
, cash provided by operating activities of
$10.9 million
decreased by
$1.4
million compared to the prior comparable period, primarily due to timing of working capital changes.
During the
three
months ended
September 30, 2016
, cash provided by operating activities of
$12.3 million
decreased by $0.2 million compared to the prior comparable period, primarily due to timing of working capital changes.
Cash Flows from Investing Activities
During the
three
months ended
September 30, 2017
, cash used in investing activities of
$6.1
million was primarily for capital expenditures of
$7.1 million
and a change in restricted cash of
$0.5 million
, partly offset by cash proceeds from sale of salon assets of
$1.5 million
.
24
During the
three
months ended
September 30, 2016
, cash used in investing activities of
$9.6 million
was primarily for capital expenditures of
$10.9 million
, partly offset by a change in restricted cash of
$1.1 million
and cash proceeds from the sale of salon assets of
$0.2 million
.
Cash Flows from Financing Activities
During the
three
months ended
September 30, 2017
, cash used in financing activities of
$1.5 million
was for employee taxes paid for shares withheld.
During the three months ended
September 30, 2016
, cash used in financing activities of
$1.1 million
was for employee taxes paid for shares withheld of
$1.1 million
.
Financing Arrangements
See Note 8 of the Notes to the unaudited Condensed Consolidated Financial Statements included in this Quarterly Report on Form 10-Q for the quarter ended
September 30, 2017
and Note 7 of the Notes to the Consolidated Financial Statements included in our Annual Report on Form 10-K for the fiscal year ended
June 30, 2017
, for additional information regarding our financing arrangements.
Our debt to capitalization ratio, calculated as the principal amount of debt as a percentage of the principal amount of debt and shareholders’ equity at fiscal quarter end, were as follows:
|
As of
|
Debt to
Capitalization
|
Basis Point
Increase (1)
|
||||
|
September 30, 2017
|
20.1
|
%
|
60
|
|
||
|
June 30, 2017
|
19.5
|
%
|
40
|
|
||
_____________________________
(1)
Represents the basis point change in debt to capitalization as compared to prior fiscal year end (June 30).
The
60
basis point increase in the debt to capitalization ratio as of
September 30, 2017
as compared to
June 30, 2017
was primarily due to reductions to shareholders equity resulting from net losses, partly offset by foreign currency translation adjustments during the three months ended
September 30, 2017
.
The
40
basis point increase in the debt to capitalization ratio as of June 30, 2017 compared to June 30, 2016 was primarily due to net reductions to shareholders' equity resulting from net losses and foreign currency translation adjustments.
Share Repurchase Program
In May 2000, the Company’s Board of Directors (Board) approved a stock repurchase program with no stated expiration date. Since that time and through
September 30, 2017
, the Board has authorized $450.0 million to be expended for the repurchase of the Company's stock under this program. All repurchased shares become authorized but unissued shares of the Company. The timing and amounts of any repurchases depend on many factors, including the market price of the common stock and overall market conditions. At
September 30, 2017
, 18.4 million shares have been cumulatively repurchased for $390.0 million, and $60.0 million remained outstanding under the approved stock repurchase program. No shares were repurchased in the three months ended
September 30, 2017
.
25
SAFE HARBOR PROVISIONS UNDER THE PRIVATE SECURITIES LITIGATION REFORM ACT OF 1995
This Quarterly Report on Form 10-Q, as well as information included in, or incorporated by reference from, future filings by the Company with the Securities and Exchange Commission and information contained in written material, press releases and oral statements issued by or on behalf of the Company contains or may contain “forward-looking statements” within the meaning of the federal securities laws, including statements concerning anticipated future events and expectations that are not historical facts. These forward-looking statements are made pursuant to the safe harbor provisions of the Private Securities Litigation Reform Act of 1995. The forward-looking statements in this document reflect management’s best judgment at the time they are made, but all such statements are subject to numerous risks and uncertainties, which could cause actual results to differ materially from those expressed in or implied by the statements herein. Such forward-looking statements are often identified herein by use of words including, but not limited to, “may,” “believe,” “project,” “forecast,” “expect,” “estimate,” “anticipate,” and “plan.” In addition, the following factors could affect the Company’s actual results and cause such results to differ materially from those expressed in forward-looking statements. These factors include the continued ability of the Company to implement its strategy, priorities and initiatives; our ability to attract, train and retain talented stylists; financial performance of our franchisees; acceleration of sale of certain salons to franchisees; the ability of the Company to maintain a satisfactory relationship with Walmart; the success of The Beautiful Group, our largest franchisee; marketing efforts to drive traffic; changes in regulatory and statutory laws including increases in minimum wages; our ability to manage cyber threats and protect the security of sensitive information about our guests, employees, vendors or Company information; reliance on information technology systems; reliance on external vendors; competition within the personal hair care industry; changes in tax exposure; changes in healthcare; changes in interest rates and foreign currency exchange rates; failure to standardize operating processes across brands; consumer shopping trends and changes in manufacturer distribution channels; financial performance of Empire Education Group; the continued ability of the Company to implement cost reduction initiatives; compliance with debt covenants; changes in economic conditions; changes in consumer tastes and fashion trends; exposure to uninsured or unidentified risks; reliance on our management team and other key personnel or other factors not listed above. Additional information concerning potential factors that could affect future financial results is set forth in the Company’s Annual Report on Form 10-K for the year ended
June 30, 2017
. We undertake no obligation to publicly update or revise any forward-looking statements, whether as a result of new information, future events or otherwise. However, your attention is directed to any further disclosures made in our subsequent annual and periodic reports filed or furnished with the SEC on Forms 10-K, 10-Q and 8-K and Proxy Statements on Schedule 14A.
26
There has been no material change to the factors discussed within Part II, Item 7A in the Company’s June 30, 2017 Annual Report on Form 10-K.
Evaluation of Disclosure Controls and Procedures
The Company maintains disclosure controls and procedures that are designed to ensure that information required to be disclosed in its Securities Exchange Act of 1934, as amended (the "Exchange Act”) reports is recorded, processed, summarized and reported within the time periods specified in the Securities and Exchange Commission’s rules and forms, and that such information is accumulated and communicated to management, including the Chief Executive Officer (CEO) and Chief Financial Officer (CFO), as appropriate, to allow timely decisions regarding required disclosure.
Management, with the participation of the CEO and CFO, evaluated the effectiveness of the design and operation of the Company's disclosure controls and procedures (as defined in Rules 13a-15(e) and 15d-15(e) promulgated under the Exchange Act) as of the end of the period. Based on their evaluation, our CEO and CFO concluded that our disclosure controls and procedures were effective as of
September 30, 2017
.
Changes in Internal Controls over Financial Reporting
There were no changes in our internal control over financial reporting during the most recent fiscal quarter that have materially affected, or are reasonably likely to materially affect, our internal control over financial reporting.
The Company is a defendant in various lawsuits and claims arising out of the normal course of business. Like certain other large retail employers, the Company has been faced with allegations of purported class-wide consumer and wage and hour violations. Litigation is inherently unpredictable and the outcome of these matters cannot presently be determined. Although the actions are being vigorously defended, the Company could in the future incur judgments or enter into settlements of claims that could have a material adverse effect on its results of operations in any particular period.
There have been no material changes in our risk factors from those disclosed in Part I, Item 1A of our Annual Report on Form 10-K for the fiscal year ended June 30, 2017, except for the revisions to the first three risk factors listed below and the addition of the last risk factor listed below:
We are in the process of implementing a new strategy, priorities and initiatives under our recently appointed President and Chief Executive Officer, and any inability to execute and evolve our strategy over time could adversely impact our financial condition and results of operations.
Hugh E. Sawyer became our President and Chief Executive Officer and a member of the Board of Directors effective as of April 17, 2017. The transition has resulted in, and could further result in, changes in business strategy as Mr. Sawyer seeks to continue to improve the performance of company-owned salons while at the same time accelerate the growth of our franchise model. As part of our strategic transformation, we announced that we were reviewing strategic alternatives for our mall-based salons, which culminated in the sale and franchise of those salons announced on October 1, 2017; reorganized our field structure by brand/concept in August 2017; and implemented a 120-day plan and other initiatives, including investments in marketing and a SmartStyle mobile app designed to improve the guest experience.
Our success depends, in part, on our ability to grow our franchise model. We announced plans in fall 2016 to expand the franchise side of our business, including by selling certain company-owned salons to franchisees over time. In January 2017, we began franchising the SmartStyle brand throughout the U.S. for the first time, and during fiscal 2017, we entered into agreements to sell 233 of our company-owned salons across our brands to new and existing franchisees. In October 2017, we sold substantially all of our mall-based salons, consisting of 858 Regis Salons and MasterCuts locations, and substantially all of our International business to a new, single franchisee, The Beautiful Group. Growth and development of our franchise model is
27
ongoing. It will take time to execute, and may create additional costs, expose us to additional legal and compliance risks, cause disruption to our current business and impact our short-term operating results.
Our success also depends, in part, on our ability to improve sales, as well as both cost of service and product and operating margins at our company-owned salons. Same-store sales are affected by average ticket and same-store guest visits. A variety of factors affect same-store guest visits, including the guest experience, staffing and retention of stylists and salon leaders, price competition, fashion trends, competition, current economic conditions, product assortment, customer traffic at Walmart where our SmartStyle locations reside, marketing programs and weather conditions. These factors may cause our same-store sales to differ materially from prior periods and from our expectations.
In addition to a new President and Chief Executive Officer, since May 2017 we have appointed a new President of Franchise, Chief Financial Officer, Chief Marketing Officer, Chief Human Resources Officer, Vice President of Walmart Relations and Vice President Creative, and over the next fiscal year we may add personnel in a number of key positions, which may further result in new strategies, priorities and initiatives. The process of implementing any new strategies, priorities and initiatives involves inherent risks and the changes we implement could harm our relationships with customers, suppliers, employees or other third parties and may be disruptive to our business. While we believe the pursuit of these changes will have a positive effect on our business in the long term, we cannot provide assurance that these changes will lead to the desired results. If we do not effectively and successfully execute on these changes, it could have a material adverse effect on our business.
Acceleration of the sale of certain company-owned salons to franchisees may not improve our operating results and could cause operational difficulties.
During fiscal 2017, we accelerated the sale of company-owned salons to new and existing franchisees. Specifically, in January 2017, we began offering SmartStyle franchises for the first time, and during fiscal 2017 we entered into agreements to refranchise 233 salons across our brands. In October 2017, we sold substantially all of our mall-based salons and substantially all of our International business to The Beautiful Group, who will operate these approximately 1,100 salons as our largest franchisee.
Success will depend on a number of factors, including franchisees’ ability to improve the results of the salons they purchase and their ability and interest in continuing to grow their business. We also must continue to attract qualified franchisees and work with them to make their business successful. Moving a salon from company-owned to franchise-owned is expected to reduce our consolidated revenues, increase our royalty revenue and decrease our operating costs; however, the actual benefit from a sale is uncertain and may not be sufficient to offset the loss of revenues.
In addition, challenges in supporting our expanding franchise system could cause our operating results to suffer. If we are unable to effectively select and train new franchisees and support and manage our growing franchisee base, it could affect our brand standards, cause disputes between us and our franchisees, and potentially lead to material liabilities.
Consumer shopping trends and changes in manufacturer choice of distribution channels may negatively affect both service and product revenues.
Both our owned and franchised salons are partly dependent on the volume of traffic around their locations in order to generate both service and product revenues. Supercuts salons and most of our other brands are located mainly in strip center locations, and our SmartStyle salons are located within Walmart Supercenters, so they are especially sensitive to Walmart traffic. Customer traffic may be adversely affected by changing consumer shopping trends that favor alternative shopping locations, such as the internet. In recent years we have experienced substantial declines in traffic in some shopping malls in particular. While we no longer own mall-based salons, as they are now operated by The Beautiful Group as our largest franchisee, traffic patterns at those salons will affect our potential franchise royalties and product sales revenue.
In addition, we are experiencing a proliferation of alternative channels of distribution, like blow dry bars, booth rental facilities, discount brick-and-mortar and online professional products retailers, and manufacturers selling direct to consumers online, which may negatively affect our product and service revenue. Also, product manufacturers may decide to utilize these other distribution channels to a larger extent than in the past and they generally have the right to terminate relationships with us without much advance notice. These trends could reduce the volume of traffic around our salons, and in turn, our revenues may be adversely affected.
28
A significant portion of our franchise business is dependent on the success of a new, single franchisee.
In October 2017, we sold substantially all of our mall-based salon business in North America and substantially all of our International segment to The Beautiful Group, an affiliate of Regent, who will operate them as our new, largest franchisee. The success of this franchise arrangement will depend upon a number of factors that are beyond our control, including, among other factors, market conditions, industry trends, the capabilities of the new franchisee, and technology and landlord issues. In particular, we remain liable under the leases for these salons until the end of their various terms, and so could be required to make payments if The Beautiful Group fails to do so, which could adversely impact our results of operations or cash flows.
Under the franchise agreement, we will receive franchise royalties, fees for certain transition services, and product sales revenue going forward; however, the amount of these items is tied to the success of the business as operated by The Beautiful Group. It will take time for The Beautiful Group to implement the changes intended to improve the business of the mall-based salons and the International business, and there is no assurance that it will be successful in doing so. Under our agreements, the franchise royalties are based on annual salon revenue and they increase over time. As a result, this transaction will provide minimal revenues to us in the short term and such revenues are uncertain in future periods. We have also agreed to provide ongoing and transition services to The Beautiful Group and it is possible that our costs to provide these services may be greater than the fees that we have negotiated in return for them. The inability of The Beautiful Group to transition and operate the salons successfully could adversely affect our business, financial condition and results of operations or cash flows, and could prevent the transaction from delivering the anticipated benefits and enhancing shareholder value.
In May 2000, the Company’s Board of Directors (Board) approved a stock repurchase program with no stated expiration date. Since that time and through
September 30, 2017
, the Board has authorized $450.0 million to be expended for the repurchase of the Company's stock under this program. All repurchased shares become authorized but unissued shares of the Company. The timing and amounts of any repurchases depend on many factors, including the market price of our common stock and overall market conditions. At
September 30, 2017
, 18.4 million shares have been cumulatively repurchased for $390.0 million, and $60.0 million remained outstanding under the approved stock repurchase program.
The Company did not repurchase any of its common stock through its share repurchase program during the three months ended
September 30, 2017
.
29
|
Asset Purchase Agreement, dated as of October 1, 2017, by and among Regis Corp., Regis, Inc. and The Beautiful Group Management, LLC. (Incorporated by reference to Exhibit 2.1 of the Company’s Current Report on Form 8-K filed on October 5, 2017)
|
||
|
Share Purchase Agreement, dated as of October 1, 2017, by and among Haircare Limited, Regis UK Limited and International Beauty Limited. (Incorporated by reference to Exhibit 2.2 of the Company’s Current Report on Form 8-K filed on October 5, 2017)
|
||
|
President and Chief Executive Officer of Regis Corporation: Certification pursuant to Section 302 of the Sarbanes-Oxley Act of 2002.
|
||
|
Executive Vice President and Chief Financial Officer of Regis Corporation: Certification pursuant to Section 302 of the Sarbanes-Oxley Act of 2002.
|
||
|
|
|
|
|
Chief Executive Officer and Chief Financial Officer of Regis Corporation: Certification pursuant to Section 906 of the Sarbanes-Oxley Act of 2002.
|
||
|
|
|
|
|
Exhibit 101
|
The following financial information from Regis Corporation's Quarterly Report on Form 10-Q for the quarterly period ended September 30, 2017, formatted in Extensible Business Reporting Language (XBRL) and filed electronically herewith: (i) the Condensed Consolidated Balance Sheets; (ii) the Condensed Consolidated Statements of Earnings; (iii) the Condensed Consolidated Statements of Comprehensive Income; (iv) the Condensed Consolidated Statements of Cash Flows; and (v) the Notes to the Consolidated Financial Statements.
|
|
30
SIGNATURES
Pursuant to the requirements of the Securities Exchange Act of 1934, the registrant has duly caused this report to be signed on its behalf by the undersigned thereunto duly authorized.
|
|
REGIS CORPORATION
|
|
|
|
|
|
|
Date: October 31, 2017
|
By:
|
/s/ Andrew H. Lacko
|
|
|
|
Andrew H. Lacko
|
|
|
|
Executive Vice President and Chief Financial Officer
|
|
|
|
(Signing on behalf of the registrant and as Principal Financial Officer)
|
|
|
|
|
|
|
|
|
|
Date: October 31, 2017
|
By:
|
/s/ Kersten D. Zupfer
|
|
|
|
Kersten D. Zupfer
|
|
|
|
Vice President, Controller and Chief Accounting Officer
|
|
|
|
(Principal Accounting Officer)
|
|
|
|
|
31
TABLE OF CONTENTS
Part I - Financial InformationItem 1. Financial StatementsItem 2. Management S Discussion and Analysis Of Financial Condition and Results Of OperationsItem 3. Quantitative and Qualitative Disclosures About Market RiskItem 4. Controls and ProceduresPart II Other InformationItem 1. Legal ProceedingsItem 1A. Risk FactorsItem 2. Unregistered Sales Of Equity Securities and Use Of ProceedsItem 6. Exhibits