RAYMOND JAMES FINANCIAL INC
10-Ks and 10-Qs
UNITED STATES
SECURITIES AND EXCHANGE COMMISSION
Washington, D.C. 20549
|
FORM 10-K
|
|
x
|
ANNUAL REPORT PURSUANT TO SECTION 13 OR 15(d) OF THE SECURITIES EXCHANGE ACT OF 1934
|
For the fiscal year ended
September 30, 2017
Or
|
o
|
TRANSITION REPORT PURSUANT TO SECTION 13 OR 15(d) OF THE SECURITIES EXCHANGE ACT OF 1934
|
For the transition period from
to
Commission file number
1-9109
RAYMOND JAMES FINANCIAL, INC.
(Exact name of registrant as specified in its charter)
|
Florida
|
No. 59-1517485
|
|
|
(State or other jurisdiction of
|
(I.R.S. Employer
|
|
|
incorporation or organization)
|
Identification No.)
|
|
|
880 Carillon Parkway, St. Petersburg, Florida
|
33716
|
|
|
(Address of principal executive offices)
|
(Zip Code)
|
|
|
Registrant’s telephone number, including area code
|
(
727) 567-1000
|
Securities registered pursuant to Section 12(b) of the Act:
|
Title of each class
|
Name of each exchange on which registered
|
|
|
Common Stock, $.01 par value
|
New York Stock Exchange
|
|
|
Securities registered pursuant to Section 12(g) of the Act:
|
None
|
Indicate by check mark if the registrant is a well-known seasoned issuer, as defined in Rule 405 of the Securities Act. Yes
x
No
o
Indicate by check mark if the registrant is not required to file reports pursuant to Section 13 or Section 15(d) of the Exchange Act. Yes
o
No
x
Indicate by check mark whether the registrant (1) has filed all reports required to be filed by Section 13 or 15(d) of the Securities Exchange Act of 1934 during the preceding 12 months (or such shorter period that the registrant was required to file such reports), and (2) has been subject to such filing requirements for the past 90 days. Yes
x
No
o
Indicate by check mark whether the registrant has submitted electronically and posted on its corporate Website, if any, every Interactive Data File required to be submitted and posted pursuant to Rule 405 of Regulation S-T (Section 232.405) during the preceding 12 months (or for such shorter period that the registrant was required to submit and post such files). Yes
x
No
o
Indicate by check mark if disclosure of delinquent filers pursuant to Item 405 of Regulation S-K (Section 229.405) is not contained herein, and will not be contained, to the best of registrant’s knowledge, in definitive proxy or information statements incorporated by reference in Part III of this Form 10-K or any amendment to this Form 10-K.
x
Indicate by check mark whether the registrant is a large accelerated filer, an accelerated filer, a non-accelerated filer, a smaller reporting company, or an emerging growth company. See the definitions of “large accelerated filer,” “accelerated filer,” “smaller reporting company,” and “emerging growth company” in Rule 12b-2 of the Exchange Act.
|
Large accelerated filer
x
|
Accelerated filer
o
|
|
Non-accelerated filer
o
(Do not check if a smaller reporting company)
|
Smaller reporting company
o
|
|
|
Emerging growth company
o
|
If an emerging growth company, indicate by check mark if the registrant has elected not to use the extended transition period for complying with any new or revised financial accounting standards provided pursuant to Section 13(a) of the Exchange Act.
¨
Indicate by check mark whether the registrant is a shell company (as defined in Rule 12b-2 of the Exchange Act). Yes
o
No
x
As of
March 31, 2017
, the aggregate market value of the registrant’s common stock held by non-affiliates of the registrant computed by reference to the price at which the common stock was last sold was $
9,811,540,297
.
The number of shares outstanding of the registrant’s common stock as of
November 16, 2017
was
144,400,529
.
DOCUMENTS INCORPORATED BY REFERENCE
Portions of the definitive Proxy Statement to be delivered to shareholders in connection with the Annual Meeting of Shareholders to be held
February 22, 2018
are incorporated by reference into Part III.
RAYMOND JAMES FINANCIAL, INC.
TABLE OF CONTENTS
|
|
|
|
PAGE
|
|
PART I.
|
|
|
|
|
|
|
|
|
|
Item 1.
|
|
Business
|
|
|
Item 1A.
|
|
Risk factors
|
|
|
Item 1B.
|
|
Unresolved staff comments
|
|
|
Item 2.
|
|
Properties
|
|
|
Item 3.
|
|
Legal proceedings
|
|
|
Item 4.
|
|
Mine safety disclosures
|
|
|
PART II.
|
|
||
|
|
|
|
|
|
Item 5.
|
|
Market for registrant’s common equity, related shareholder matters and issuer purchases of equity securities
|
|
|
Item 6.
|
|
Selected financial data
|
|
|
Item 7.
|
|
Management’s discussion and analysis of financial condition and results of operations
|
|
|
Item 7A.
|
|
Quantitative and qualitative disclosures about market risk
|
|
|
Item 8.
|
|
Financial statements and supplementary data
|
|
|
Item 9.
|
|
Changes in and disagreements with accountants on accounting and financial disclosure
|
|
|
Item 9A.
|
|
Controls and procedures
|
|
|
Item 9B.
|
|
Other information
|
|
|
PART III.
|
|||
|
Item 10.
|
|
Directors, executive officers and corporate governance
|
|
|
Item 11.
|
|
Executive compensation
|
|
|
Item 12.
|
|
Security ownership of certain beneficial owners and management and related shareholder matters
|
|
|
Item 13.
|
|
Certain relationships and related transactions, and director independence
|
|
|
Item 14.
|
|
Principal accountant fees and services
|
|
|
PART IV.
|
|
|
|
|
Item 15.
|
|
Exhibits and financial statement schedules
|
|
|
|
|
|
|
|
|
|
Signatures
|
|
2
RAYMOND JAMES FINANCIAL, INC. AND SUBSIDIARIES
|
Item 1.
|
BUSINESS
|
Raymond James Financial, Inc. (“RJF” or the “Company”) is a leading diversified financial services company providing private client group, capital markets, asset management, banking and other services to individuals, corporations and municipalities. RJF’s broker-dealer subsidiaries engage in various financial services businesses, including the underwriting, distribution, trading and brokerage of equity and debt securities and the sale of mutual funds and other investment products. RJF and its subsidiaries also provide investment management services for retail and institutional clients, corporate and retail banking services, and trust services.
Established in 1962 and public since 1983, RJF is listed on the New York Stock Exchange (the “NYSE”) under the symbol “RJF.” As a bank holding company and financial holding company, RJF is subject to supervision, examination and regulation by the Board of Governors of the Federal Reserve System (the “Fed”).
RJF’s principal subsidiaries are Raymond James & Associates, Inc. (“RJ&A”), Raymond James Financial Services, Inc. (“RJFS”), Raymond James Financial Services Advisors, Inc. (“RJFSA”), Raymond James Ltd. (“RJ Ltd.”), Eagle Asset Management, Inc. (“Eagle”), and Raymond James Bank, N.A. (“RJ Bank”). All of these subsidiaries are wholly owned by RJF. RJF and its subsidiaries are hereinafter collectively referred to as “the firm”, “our,” “we,” or “us.” Our operations are predominately conducted in the United States of America (“U.S.”) and Canada.
Among the keys to our historical and continued success, our emphasis on putting the client first is at the core of our corporate values. We also believe in maintaining a conservative, long-term focus in our decision making. We believe that this disciplined decision-making approach translates to a strong, stable financial services firm for clients, advisors, associates and shareholders.
REPORTABLE SEGMENTS
We currently operate through four operating segments and our Other segment. The four operating segments are Private Client Group (“PCG”), Capital Markets, Asset Management, and RJ Bank. The Other segment captures private equity activities as well as certain corporate overhead costs of RJF.
The graph below depicts the relative net revenue contribution of each of our operating segments for the fiscal year ended September 30, 2017:
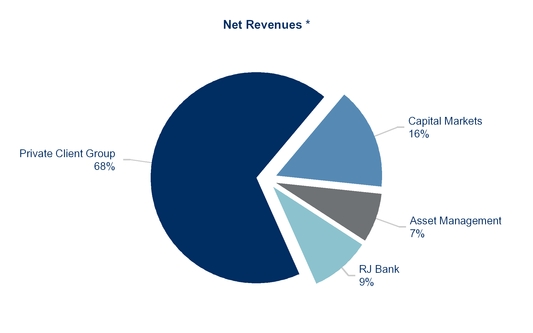
*Chart above does not include intersegment eliminations or the Other segment.
3
RAYMOND JAMES FINANCIAL, INC. AND SUBSIDIARIES
PRIVATE CLIENT GROUP
We provide financial planning and securities transaction services through branch office systems. Financial advisors have multiple affiliation options, which we refer to as AdvisorChoice. Our two primary affiliation options for financial advisors are the employee option and the independent contractor option.
We recruit experienced financial advisors from a wide variety of competitors. As a part of their agreement to join us, we may make loans to financial advisors and to certain other key revenue producers, primarily for transitional cost assistance and retention purposes.
Total assets under administration in the PCG segment as of
September 30, 2017
amount to
$659.5 billion
. We have
7,346
financial advisors affiliated with us as of
September 30, 2017
.
Employee Financial Advisors
Employee financial advisors work in a traditional branch setting supported by local management and administrative staff. They provide services predominately to individual clients. These financial advisors are our employees, and their compensation primarily includes commission payments and participation in the firm’s benefit plans.
Independent Contractor Financial Advisors
Our financial advisors who are independent contractors are responsible for all of their direct costs and, accordingly, are paid a larger percentage of commissions and fees than employee financial advisors. Our independent contractor financial advisor option is designed to help our advisors build their businesses with as much or as little of our support as they determine they need. With specific approval, they are permitted to conduct, on a limited basis, certain other approved business activities, such as offering insurance products, independent registered investment advisory services, and accounting and tax services.
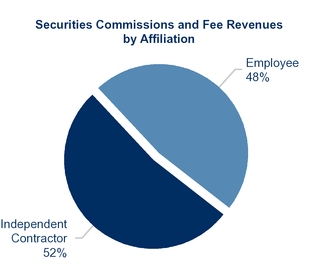
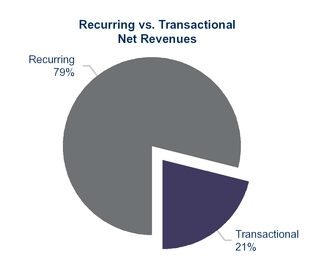
Irrespective of the affiliation choice, our financial advisors offer a broad range of investments and services, including both third party and proprietary products, and a variety of financial planning services. Revenues from this segment are typically driven by total client assets under administration, and are generally either recurring fee-based or transactional in nature. Recurring revenues include asset-based fees, trailing commissions from mutual funds and variable annuities/insurance products, mutual fund and annuity service fees, fees earned on funds in our multi-bank sweep program, and interest. The proportion of our securities commissions and fee revenues originating from the employee versus the independent contractor affiliation models is relatively balanced.
Securities commissions and fee revenues by affiliation, as well as the portion of segment net revenues that was recurring versus transactional in nature, for the fiscal year ended
September 30, 2017
, are presented below:
4
RAYMOND JAMES FINANCIAL, INC. AND SUBSIDIARIES
Through this segment:
|
•
|
We provide investment services for which we charge sales commissions or asset-based fees based on established schedules.
|
|
•
|
We offer investment advisory services. Fee revenues for such services are computed as either a percentage of the assets in the client account or a flat periodic fee charged to the client for investment advice.
|
|
•
|
We provide insurance and annuity products.
|
|
•
|
We offer a number of professionally managed load and no-load mutual funds.
|
|
•
|
We provide margin loans to clients that are collateralized by the securities purchased or by other securities owned by the client. Interest is charged to clients on the amount borrowed based on current interest rates.
|
|
•
|
We provide custodial, trading, research and other back office support and services (including access to clients’ account information and the services of the Asset Management segment) to the independent contractor registered investment advisors who are affiliated with us.
|
|
•
|
We conduct securities borrowing and lending activities with other broker-dealers, financial institutions, and other counterparties. The net revenues of this business consist of the interest spreads generated on these activities.
|
|
•
|
We provide diversification strategies and alternative investment products to qualified clients of our affiliated financial advisors. We provide strategies and products for portfolio investment allocation opportunities.
|
CAPITAL MARKETS
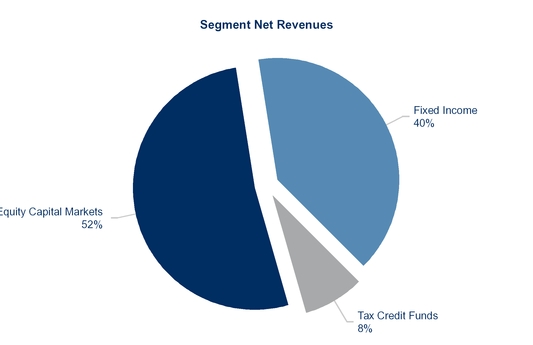
Our capital markets segment conducts institutional sales, securities trading, equity research, investment banking and the syndication of investments that qualify for tax credits (referred to as our “tax credit funds”). Within our management structure, we distinguish between activities that support equity and fixed income products and services. We primarily conduct these activities in the U.S., Canada, and Europe.
The graph below depicts the portions of this segment’s revenues that were derived from equity securities and products, fixed income securities and products, and our tax credit funds activities for the fiscal year ended September 30, 2017:
5
RAYMOND JAMES FINANCIAL, INC. AND SUBSIDIARIES
We provide the following services through this segment:
Equity Capital Markets
|
•
|
We earn institutional sales commissions on the sale of equity products. Sales volume is influenced by a combination of general market activity and the Capital Markets group’s ability to identify and promote attractive investment opportunities for our institutional clients. Commission amounts on equity transactions are based on trade size and the amount of business conducted annually with each institution.
|
|
•
|
We provide various investment banking services including public and private equity financing for corporate clients and merger & acquisition and advisory services. Our investment banking activities include a comprehensive range of strategic and financial advisory services tailored to our clients’ business life cycles and backed by our strategic industry focus.
|
|
•
|
Our global research department supports our institutional and retail sales efforts and publishes research on a wide variety of companies. This research primarily focuses on U.S., European and Canadian companies in specific industries, including agricultural, consumer, energy, clean energy, energy services, financial services, healthcare, industrial, mining and natural resources, forest products, real estate, technology, and communication and transportation. Proprietary industry studies and company-specific research reports are made available to both institutional and individual clients.
|
Fixed Income
|
•
|
We earn sales commissions from institutional clients who purchase and sell both taxable and tax-exempt fixed income products, primarily municipal, corporate, government agency and mortgage-backed bonds, and whole loans. The commissions that we charge on fixed income products are based on trade size and the characteristics of the specific security involved.
|
|
•
|
We carry inventories of taxable and tax-exempt securities to facilitate institutional sales activities. Our fixed income traders purchase and sell corporate, municipal, government, government agency, and mortgage-backed bonds, asset-backed securities, preferred stock, and certificates of deposit from and to our clients or other dealers.
|
|
•
|
Our fixed income investment banking services include public finance and debt underwriting activities where we serve as a financial advisor, placement agent or underwriter to various issuers, including state and local government agencies (and their political subdivisions), housing agencies, and non-profit entities including health care and higher education institutions. When underwriting new issue securities, we may agree to purchase the issue through a negotiated sale or submission of a competitive bid.
|
|
•
|
In our over-the-counter market activities, we enter into interest rate swaps and futures contracts either to facilitate client transactions or to actively manage risk exposures that arise from our client activity, including a portion of our trading inventory. In addition, we conduct a “matched book” derivatives business where we may enter into interest rate derivative transactions with clients. In this matched book business, for every derivative transaction we enter into with a client, we enter into an offsetting derivative transaction with a credit support provider that is a third party financial institution.
|
|
•
|
Through our fixed income public finance operations, we enter into forward commitments to purchase Government National Mortgage Association (“GNMA”) or Federal National Mortgage Association (“FNMA”) mortgage-backed securities (“MBS”). Such MBS are issued on behalf of various state and local housing finance agencies (“HFA”) clients and consist of the mortgages originated through their lending programs.
|
Tax Credit Funds
|
•
|
In our syndication of tax credit investments, one of our subsidiaries acts as the general partner or managing member in partnerships and limited liability companies that invest in real estate project entities which qualify for tax credits under Section 42 of the Internal Revenue Code. We earn fees for the origination and sale of these investment products as well as for the oversight and management of the investments over the statutory tax credit compliance period.
|
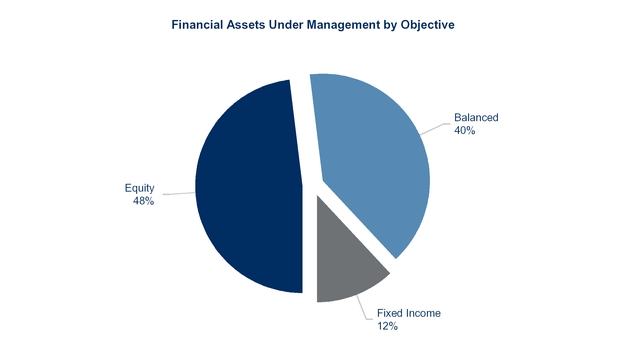
ASSET MANAGEMENT
Our Asset Management segment provides investment advisory and asset management services to individual and institutional investors, and also sponsors a family of mutual funds. We also provide services to our PCG clients through our asset management services division and through Raymond James Trust, N.A. (“RJ Trust”).
6
RAYMOND JAMES FINANCIAL, INC. AND SUBSIDIARIES
We earn investment advisory and related administrative fees on both managed and non-discretionary asset-based accounts. In managed programs, decisions are made by in-house or third-party portfolio managers or investment committees about how to invest the assets in accordance with such programs’ objectives. In non-discretionary asset-based programs, we provide administrative support, which may include trade execution, record-keeping and periodic investor reporting. We generally earn higher fees for managed programs than for non-discretionary asset-based programs, since we provide additional services to managed programs. As of
September 30, 2017
, there were
$96.4 billion
in financial assets held in managed programs and
$157.0 billion
in financial assets held in non-discretionary asset-based programs.
The graph below depicts financial assets under management in our managed programs by objective as of
September 30, 2017
:
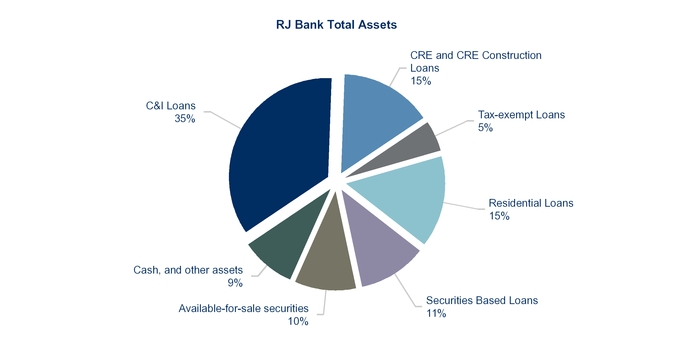
RJ BANK
RJ Bank provides corporate (commercial and industrial (“C&I”), commercial real estate (“CRE”) and CRE construction), securities-based (“SBL”), tax-exempt and residential loans. RJ Bank is active in corporate loan syndications and participations. RJ Bank also provides Federal Deposit Insurance Corporation (“FDIC”) insured deposit accounts to clients of our broker-dealer subsidiaries and to the general public. RJ Bank generates net interest revenue principally through the interest income earned on loans and an investment portfolio, which is offset by the interest expense it pays on client deposits and on its borrowings.
RJ Bank operates primarily from a branch location adjacent to RJF’s corporate office complex in St. Petersburg, Florida. Access to RJ Bank’s products and services is available through the offices of our affiliated broker-dealers as well as through electronic banking services. RJ Bank’s assets include C&I loans, commercial and residential real estate loans, tax-exempt loans, as well as loans fully collateralized by marketable securities. Corporate and tax-exempt loans represent approximately 67% of RJ Bank’s loan portfolio, of which 90% are U.S. and Canadian syndicated loans. Residential mortgage loans are originated or purchased and held for investment or sold in the secondary market. RJ Bank’s investment portfolio is comprised primarily of agency MBS and collateralized mortgage obligations (“CMOs”) and is classified as available-for-sale. RJ Bank’s liabilities primarily consist of deposits that are cash balances swept from the investment accounts of PCG clients.
7
RAYMOND JAMES FINANCIAL, INC. AND SUBSIDIARIES
RJ Bank had total assets of
$20.61 billion
at
September 30, 2017
, which were comprised of the following:
OTHER
Our Other segment includes our private equity activities as well as certain corporate overhead costs of RJF, such as the interest cost on our senior notes payable, and the acquisition and integration costs associated with certain acquisitions (See
Note 3
of the Notes to Consolidated Financial Statements in this Annual Report on Form 10-K (“Form 10-K”) for additional information on our acquisitions).
Our private equity activities include various direct and third party private equity investments and various private equity funds which we sponsor.
EMPLOYEES AND INDEPENDENT CONTRACTORS
Our employees and independent contractors (collectively “associates”) are vital to our success in the financial services industry. As of
September 30, 2017
, we had over 12,700 employees and over 4,300 affiliated independent contractor financial advisors.
OPERATIONS AND INFORMATION PROCESSING
We have operations personnel at various locations throughout the U.S. who are responsible for processing securities transactions, custody of client securities, support of client accounts, the receipt, identification and delivery of funds and securities, and compliance with regulatory and legal requirements for most of our U.S. securities brokerage operations. RJ Ltd. operations personnel have similar responsibilities at our Canadian brokerage operations located in Vancouver, British Columbia.
The information technology department develops and supports the integrated solutions that provide a differentiated platform for our businesses. This platform is designed to allow our financial advisors to spend more time with their clients and enhance and grow their businesses.
In the area of information security, we have developed and implemented a framework of principles, policies and technology to protect both our own information as well as that of our clients. We apply numerous safeguards to maintain the confidentiality, integrity and availability of both client and Company information.
Our business continuity program has been developed to provide reasonable assurance that we will continue to operate in the event of disruptions at our critical facilities. Our business departments have developed operational plans for such disruptions, and we have a staff which devotes its full time to monitoring and facilitating those plans. Our business continuity plan continues to be enhanced and
8
RAYMOND JAMES FINANCIAL, INC. AND SUBSIDIARIES
tested to allow for continuous operations in the event of weather-related or other interruptions at our corporate headquarters in Florida or one of our operations processing or data center sites in Florida, Colorado, Tennessee or Michigan.
We have also developed a business continuity plan for each of our PCG retail branches in the event any of these branches is impacted by severe weather.
COMPETITION
The financial services industry is an intensely competitive business. We compete with many other financial services firms, including a number of larger securities firms, most of which are affiliated with major financial services companies, insurance companies, banking institutions and other organizations. We also compete with companies that offer web-based financial services and discount brokerage services, usually with lower levels of service, to individual clients. We compete principally on the basis of the quality of our associates, services, product selection, location and reputation in local markets.
Our ability to compete effectively in these businesses is substantially dependent on our continuing ability to attract, retain and motivate qualified associates, including successful financial advisors, investment bankers, trading professionals, portfolio managers and other revenue producing or specialized personnel.
REGULATION
RJF is a bank holding company subject to the Bank Holding Company Act that has made an election to be a financial holding company. As a financial holding company, RJF is subject to regulation, oversight, and supervision, including periodic examination, by the Fed. RJ Bank is a national bank regulated, supervised and examined by the Office of the Comptroller of the Currency (“OCC”) and the Consumer Financial Protection Bureau (“CFPB”). Our trust company subsidiary also is regulated, supervised and examined by the OCC. The Fed and the FDIC also regulate and may examine RJ Bank and the trust company. Collectively, the rules and regulations of the Fed, the OCC, the FDIC and the CFPB cover all aspects of the banking business, including, for example, lending practices, the receipt of deposits, capital structure, transactions with affiliates, conduct and qualifications of personnel and, as discussed further below, capital requirements. This regulatory, supervisory and oversight framework is subject to significant changes that can affect the operating costs and permissible businesses of RJF, RJ Bank and the trust company. As a part of their supervisory functions, the Fed, the OCC, the FDIC, and the CFPB also have the power to bring enforcement actions for violations of law and, in the case of the Fed, the OCC and the FDIC, for unsafe or unsound practices. Our broker-dealer subsidiaries, which are also registered investment advisors, are subject to regulation and oversight by various regulatory and self-regulatory authorities discussed under “Other regulations applicable to our operations” below.
The following discussion summarizes the principal elements of the regulatory and supervisory framework applicable to RJF. The framework is intended to protect our clients, the integrity of the financial markets, our depositors and the Federal Deposit Insurance Fund and is not intended to protect our creditors or shareholders. These rules and regulations limit our ability to engage in certain activities, as well as our ability to submit funds to RJF from our regulated subsidiaries, which include RJ Bank and our broker-dealer subsidiaries. To the extent that the following information describes statutory and regulatory provisions, it is qualified in its entirety by reference to the particular statutory and regulatory provisions that are referenced. A change in applicable statutes or regulations or in regulatory or supervisory policy may have a material effect on our business.
Rules and regulations resulting from the Dodd-Frank Act
In July 2010, the U.S. government enacted sweeping changes to the supervision and regulation of the financial industry through the passage of the Dodd-Frank Wall Street Reform and Consumer Protection Act of 2010 (the “Dodd-Frank Act”). The Dodd-Frank Act required U.S. federal banking and other regulatory agencies to conduct hundreds of rulemakings, studies and reports. These regulatory agencies include: the Commodity Futures Trading Commission; the Securities and Exchange Commission (the “SEC”); the Fed; the OCC; the FDIC; the CFPB; and the Financial Stability Oversight Council. Certain elements of the Dodd-Frank Act became effective immediately; however, the details of some provisions are subject to implementing regulations. Furthermore, some provisions of the Dodd-Frank Act are still subject to further rulemaking proceedings and studies and will take effect over the next several years.
As a result of the Dodd-Frank Act and other regulatory reforms, we are experiencing a period of unprecedented change in financial regulation and supervision. These changes could have a significant impact on how we conduct our business. Many regulatory or supervisory policies remain in a state of flux and may be subject to amendment in the near future. As a result, we cannot specifically quantify the impact that such regulatory or supervisory requirements will have on our business and operations (see Item 1A, “Risk
9
RAYMOND JAMES FINANCIAL, INC. AND SUBSIDIARIES
Factors,” within this report for further discussion of the potential future impact on our operations). Below, we highlight certain of the more significant changes brought about as a result of the Dodd-Frank Act and related measures.
FDIC Assessment Rates
Since RJ Bank provides deposits covered by FDIC insurance, generally up to $250,000 per account ownership type, RJ Bank is subject to the Federal Deposit Insurance Act. In February 2011, pursuant to the Dodd-Frank Act, the FDIC issued a final rule changing its assessment base. For banks with greater than $10 billion in assets, the FDIC’s new rule changed the assessment rate calculation, which relies on a scorecard designed to measure financial performance and ability to withstand stress in addition to measuring the FDIC’s exposure should the bank fail.
CFPB Oversight
In July 2011, the CFPB began operations and was given rulemaking authority for a wide range of consumer protection laws applicable to all banks and was provided broad powers to supervise and enforce federal consumer protection laws. The CFPB has supervisory and enforcement powers under several consumer protection laws, including the: (i) Equal Credit Opportunity Act; (ii) Truth in Lending Act; (iii) Real Estate Settlement Procedures Act; (iv) Fair Credit Reporting Act; (v) Fair Debt Collection Act; (vi) Consumer Financial Privacy provisions of the Gramm-Leach-Bliley Act and unfair, deceptive or abusive acts or practices under section 1031 of the Dodd-Frank Act. Beginning with fiscal year 2014, the CFPB assumed supervisory authority over RJ Bank for its compliance with the various federal consumer protection laws. The CFPB has authority to promulgate regulations, issue orders, draft policy statements, conduct examinations, and bring enforcement actions. The creation of the CFPB has led to enhanced enforcement of consumer protection laws. To the extent that, as a result of such heightened scrutiny and oversight, we become the subject of any enforcement activity, we may be required to pay fines, incur penalties, or engage in certain remediation efforts.
Stress Tests
In October 2012, the Fed, FDIC and OCC jointly issued final rules requiring certain bank holding companies, state member banks, and savings and loan companies with total assets between $10 billion and $50 billion to conduct annual company-prepared stress tests, report the results to their primary regulator and the Fed (RJF’s primary regulator), and publish a summary of the results. Stress tests must be conducted using certain scenarios (baseline, adverse, and severely adverse) prescribed by the Fed. A summary of certain of our stress test results (RJF and RJ Bank) is available on our website at
www.raymondjames.com/investor-relations/financial-report
under “Other Reports and Information - 2017 Annual Dodd-Frank Act Stress Test Disclosure” (the information on our website is not incorporated by reference into this report).
The Volcker Rule
RJF is subject to the Volcker Rule, a provision of the Dodd-Frank Act which generally prohibits, subject to exceptions, insured depository institutions, bank holding companies and their affiliates (together, “banking entities”) from engaging in proprietary trading and limits investments in and relationships with hedge funds and private equity funds (“covered funds”). Banking entities must establish a Volcker Rule-specific compliance program. We have adopted a program, which is designed to be effective in ensuring compliance with the Volcker Rule; however, in connection with their examinations, regulators will assess the sufficiency and adequacy of our program.
We maintain a number of private equity investments, some of which meet the definition of covered funds under the Volcker Rule. The conformance period for compliance with the rule with respect to investments in covered funds was July 2017; however, banking entities were able to apply for an extension to provide up to an additional five years to conform investments in certain illiquid funds. The majority of our covered fund investments meet the criteria to be considered an illiquid fund under the Volcker Rule and we received approval from the Fed to continue to hold such investments until July 2022. The extension of the conformance deadline provides us with additional time to realize the value of these investments in due course and to execute appropriate strategies to comply with the Volcker Rule at such time. Our current focus is on the divestiture of our existing portfolio.
Basel III and U.S. Capital Rules
Both RJF, as a bank holding company, and RJ Bank are subject to capital requirements that have increased due to regulatory actions in recent years. In July 2013, the OCC, the Fed and the FDIC released final U.S. rules implementing the Basel III capital framework developed by the Basel Committee on Banking Supervision and certain Dodd-Frank Act and other capital provisions and updated the prompt corrective action framework to reflect the new regulatory capital minimums (the “U.S. Basel III Rules”). The U.S. Basel III Rules: (i) increase the quantity and quality of regulatory capital; (ii) establish a capital conservation buffer; and (iii) make changes to the calculation of risk-weighted assets. The U.S. Basel III Rules became effective for RJF on January 1, 2015, subject to applicable
10
RAYMOND JAMES FINANCIAL, INC. AND SUBSIDIARIES
phase-in periods. The rules governing the capital conservation buffer became effective for both RJF and RJ Bank as of January 1, 2016. See
Note 21
of the Notes to the Consolidated Financial Statements in this Form 10-K for information regarding RJF and RJ Bank regulatory capital levels and ratios, including information regarding the capital conservation buffer. The increased capital requirements could restrict our abilities to grow during favorable market conditions and to return capital to shareholders, or require us to raise additional capital. As a result, our business, results of operations, financial condition and prospects could be adversely affected. See Item 1A, “Risk Factors,” within this report for more information.
Failure to meet minimum capital requirements can trigger discretionary, and in certain cases, mandatory actions by regulators that could have a direct material effect on the financial results of RJF and RJ Bank. Under capital adequacy guidelines, RJF and RJ Bank must meet specific capital guidelines that involve quantitative measures of assets, liabilities, and certain off-balance sheet items as calculated under regulatory accounting practices. The capital amounts and classification for RJF and RJ Bank are also subject to the qualitative judgments of U.S. regulators based on components of capital, risk-weightings of assets, off-balance sheet transactions, and other factors. Quantitative measures established by federal banking regulations to ensure capital adequacy require that RJF, as a financial holding company, and RJ Bank maintain minimum amounts and ratios of: (i) Common Equity Tier 1 (or “CET1”), Tier 1 and Total capital to risk-weighted assets; (ii) Tier 1 capital to average assets; and (iii) capital conservation buffers. See
Note 21
of the Notes to the Consolidated Financial Statements in this Form 10-K, for further information.
Money Market Reform
In July 2014, the SEC adopted amendments to the rules that govern money market mutual funds. The amendments make structural and operational reforms to address risks of excessive withdrawals over relatively short time frames by investors from money market funds, while preserving the benefits of the funds. We do not sponsor any money market funds. We utilize such funds in limited circumstances for our own investment purposes as well as to offer our clients money market funds that are sponsored by third parties as one of several cash sweep alternatives.
Municipal Advisor Regulation
In 2013 as required under the Dodd-Frank Act, the SEC issued its final rule regarding the new category of regulated financial activity: “municipal advisors” (the “MA Rule”). The MA Rule, which became effective in 2014: (i) imposes a fiduciary duty on municipal advisors when advising municipal entities; (ii) may result in the need for new written representations by issuers; and (iii) may limit the manner in which we, in our capacity as an underwriter or in our other professional roles, interact with municipal issuers. In addition to the SEC rule, the Municipal Securities Rulemaking Board (“MSRB”) has developed a number of implementing rules and interpretive guidance relating to municipal advisors, and we have implemented policies and procedures reasonably designed to comply with such rules and guidance.
While over these past few years, broker-dealer and municipal advisor interaction with municipal entities has become an area of greater rulemaking and regulatory exam and enforcement interest, we do not expect a materially adverse impact on our public finance results of operations, which are included in our Capital Markets segment.
Fiduciary Duty Standard
Pursuant to the Dodd-Frank Act, the SEC was charged with considering whether broker-dealers should be subject to a standard of care similar to the fiduciary standard applicable to registered investment advisors. The SEC has stated that it will consider a heightened standard of care; however, to date, it has not yet proposed any rules. In April 2016, the U.S. Department of Labor (the “DOL”) issued its final regulation (the “DOL Rule”) expanding the definition of who is deemed an “investment advice fiduciary” under the Employee Retirement Income Security Act of 1974, as amended (“ERISA”), as a result of giving investment advice to a “plan,” “plan participant” or “beneficiary,” as well as under the Internal Revenue Code for individual retirement arrangements (“IRAs”) and non-ERISA plans (collectively, “qualified plans”). As a result of adopting a new definition of “fiduciary” under ERISA, the final rule extends fiduciary status to many investment professionals that had not been considered fiduciaries under previous law. A fiduciary is subject to strict duties to act solely in the interests of plan participants and beneficiaries and is personally liable to the ERISA plan for breaches in its discharge of its duties.
The DOL Rule also contains exemptions, including the Best Interest Contract exemption (the “BIC Exemption”) and Principal Transactions in Certain Assets exemption (the “Principal Transactions Exemption”), designed to enable investment professionals that become fiduciaries to continue to operate under existing business models that would otherwise be prohibited, subject to compliance with new conditions. In order to rely on these exemptions, we are required to: (i) act under defined impartial conduct standards that are in the best interest of our client; (ii) adopt certain anti-conflict policies and procedures; (iii) provide disclosure of certain information relating to fees, compensation and defined “material conflicts of interest;” (iv) provide a written acknowledgment of fiduciary status;
11
RAYMOND JAMES FINANCIAL, INC. AND SUBSIDIARIES
and (v) for IRAs and non-ERISA plans, enter into an enforceable contract with our client that contains extensive warranties and does not allow exculpatory provisions waiving the client’s rights and remedies, including the right to participate in a class action in court. The DOL Rule became effective as of June 2016, subject to a phase-in of the fiduciary definition in June 2017, and also subject to a further transition period until January 1, 2018 applying to both the BIC Exemption and Principal Transactions Exemption. In August 2017, the DOL recommended that the transition period be extended until July 1, 2019.
We have undertaken a comprehensive plan to comply with the DOL Rule. As qualified accounts, particularly IRA accounts, comprise a significant portion of our business, we expect that compliance with the DOL Rule and reliance on the BIC Exemption and the Principal Transactions Exemption will require us to continue to incur increased levels of legal, compliance and information technology costs. As discussed above, we may also face enhanced legal risks. We anticipate that amendments to the scope of the DOL Rule or the adoption of any new rule by the SEC will require us to review and possibly modify our compliance plan and approach, which may also lead to additional costs. In addition, state laws that impose a fiduciary duty also may require monitoring, as well as require that we undertake additional compliance measures.
Incentive-Based Compensation Arrangements
Pursuant to the Dodd-Frank Act, six federal agencies are charged with jointly prescribing regulations or guidelines related to the prohibition of incentive-based compensation arrangements that encourage inappropriate risks at certain financial institutions. The agencies have released a proposed rule that would prohibit certain forms of incentive-based compensation arrangements for financial institutions with greater than $1 billion in total assets (the “Incentive-Based Compensation Proposal”). Much of the Incentive-Based Compensation Proposal would apply to financial institutions categorized as either “Level 1” institutions (assets of $250 billion or more) or “Level 2” institutions (assets of $50 billion to $250 billion), while “Level 3” institutions (assets of $1 billion to $50 billion) would be subject to less extensive obligations. All covered financial institutions would be required to, among other requirements: (i) annually document the structure of their incentive-based compensation arrangements; (ii) retain records of such annual documentation for at least seven years; and (iii) comply with general prohibitions on incentive-based compensation arrangements that could encourage inappropriate risk-taking. Should the Incentive-Based Compensation Proposal be adopted, we would be subject to the rule’s requirements as a “Level 3” financial institution, which would require us to incur additional legal and compliance costs, as well as subject us to increased legal risks.
Other regulations applicable to our operations
The SEC is the federal agency charged with administration of the federal securities laws in the United States. Our broker-dealer subsidiaries are subject to SEC regulations relating to their business operations, including sales and trading practices, public offerings, publication of research reports, use and safekeeping of client funds and securities, capital structure, record-keeping, privacy requirements, and the conduct of directors, officers and employees. Financial services firms are also subject to regulation by state securities commissions in those states in which they conduct business. RJ&A and RJFS are currently registered as broker-dealers in all 50 states.
Broker-dealers are required to maintain the minimum net capital deemed necessary to meet their continuing commitments to customers and others, and are required to keep their assets in relatively liquid form. These rules also limit the ability of broker-dealers to transfer capital to parent companies and other affiliates. The SEC has adopted amendments to its financial stability rules, many of which became effective as of October 2013 and are applicable to our broker-dealer subsidiaries, including changes to the: (i) net capital rule; (ii) customer protection rule; (iii) record-keeping rules; and (iv) notification rules.
Financial services firms are subject to regulation by various foreign governments, securities exchanges, central banks and regulatory bodies, particularly in those countries where they have established offices. Outside of the United States, we have additional offices primarily in Canada and Europe and are subject to regulations in those areas. Much of the regulation of broker-dealers in the United States and Canada, however, has been delegated to self-regulatory organizations (“SROs”), the Financial Industry Regulatory Authority (“FINRA”), the Investment Industry Regulatory Organization of Canada (“IIROC”) and securities exchanges. These SROs adopt and amend rules for regulating the industry, subject to the approval of government agencies. These SROs also conduct periodic examinations of member broker-dealers.
The SEC, SROs and state securities commissions may conduct administrative proceedings that can result in censure, fine, suspension or expulsion of a broker-dealer, its officers or employees. Such administrative proceedings, whether or not resulting in adverse findings, can require substantial expenditures and may adversely impact the reputation of a broker-dealer.
Our U.S. broker-dealer subsidiaries are subject to the Securities Investor Protection Act (“SIPA”) and are required by federal law to be members of the Securities Investors Protection Corporation (“SIPC”). The SIPC was established under SIPA, and oversees the
12
RAYMOND JAMES FINANCIAL, INC. AND SUBSIDIARIES
liquidation of broker-dealers during liquidation or financial distress. The SIPC fund provides protection for cash and securities held in client accounts up to $500,000 per client, with a limitation of $250,000 on claims for cash balances.
Our investment advisory operations, including the mutual funds that we sponsor, are also subject to extensive regulation in the United States. Our U.S. asset managers are registered as investment advisors with the SEC under the Investment Advisers Act of 1940 as amended (the “Investment Advisers Act”), and are also required to make notice filings in certain states. Virtually all aspects of our asset management business are subject to various federal and state laws and regulations. These laws and regulations are primarily intended to benefit the asset management clients.
RJ Bank is also subject to the Community Reinvestment Act (the “CRA”). The CRA is intended to encourage banks to help meet the credit needs of their communities, including low and moderate income neighborhoods, consistent with safe and sound bank operations. Under the CRA, the Fed, the FDIC and the OCC are required to periodically examine and assign to each bank a public CRA rating. Members of the public may submit comments on a bank’s performance under the CRA; such comments will form part of the bank’s performance evaluation. The results of the evaluation, together with the bank’s CRA rating, are also taken into consideration when evaluating mergers, acquisitions, and applications to open a branch or facility. RJ Bank could face additional requirements and limitations should it fail to adequately meet the criteria stipulated under the CRA.
RJ Ltd. is currently registered in all provinces and territories in Canada. The financial services industry in Canada is subject to comprehensive regulation under both federal and provincial laws. Securities commissions have been established in all provinces and territorial jurisdictions, which are charged with the administration of securities laws. Investment dealers in Canada are also subject to regulation by SROs, which are responsible for the enforcement of, and conformity with, securities legislation for their members and have been granted the powers to prescribe their own rules of conduct and financial requirements of members. RJ Ltd. is regulated by each of the securities commissions in the jurisdictions of registration, as well as by the SROs and IIROC. IIROC requires that RJ Ltd. be a member of the Canadian Investors Protection Fund (the “CIPF”), whose primary role is investor protection. The CIPF provides protection for securities and cash held in client accounts up to $1 million Canadian currency (“CDN”) per client, with separate coverage of
CDN
$1 million for certain types of accounts. See
Note 21
of the Notes to Consolidated Financial Statements in this Form 10-K for further information on SEC, FINRA and IIROC regulations pertaining to broker-dealer regulatory minimum net capital requirements.
In Europe, the Markets in Financial Instruments Regulation and a revision of the Markets in Financial Instruments Directive (together, “MiFID II”), will take effect on January 3, 2018, and will introduce comprehensive and new trading and market infrastructure reforms in the European Union, including new trading venues, enhancements to pre- and post-trading transparency, and additional investor protection requirements, among others. Although the full impact of these changes remains unclear, we have made changes to our European operations, including systems and controls, in order to be in compliance with MiFID II.
Bank Secrecy Act and USA PATRIOT Act of 2001
The Bank Secrecy Act and the USA PATRIOT Act of 2001 (“Patriot Act”) and requirements administered by the Office of Foreign Assets Control (“OFAC”) require financial institutions, among other things, to implement a risk-based program reasonably designed to prevent money laundering and to combat the financing of terrorism, including through suspicious activity and currency transaction reporting, compliance, record-keeping and due diligence on customers. The Patriot Act also contains financial transparency laws and enhanced information collection tools and enforcement mechanisms for the U.S. government, including: due diligence and record-keeping requirements for private banking and correspondent accounts; standards for verifying customer identification at account opening; and rules to produce certain records upon request of a regulator or law enforcement and to promote cooperation among financial institutions, regulators, and law enforcement in identifying parties that may be involved in terrorism, money laundering and other crimes. Failure to meet the requirements of the Bank Secrecy Act, the Patriot Act, or OFAC can lead to supervisory actions including fines.
13
RAYMOND JAMES FINANCIAL, INC. AND SUBSIDIARIES
EXECUTIVE OFFICERS OF THE REGISTRANT
Executive officers of the registrant (which includes officers of certain significant subsidiaries) are as follows:
|
Jennifer C. Ackart
|
53
|
Senior Vice President since August 2009 and Controller since February 1995
|
|
Bella Loykhter Allaire
|
64
|
Executive Vice President - Technology and Operations - Raymond James & Associates, Inc. since June 2011; Managing Director and Chief Information Officer - UBS Wealth Management Americas, November 2006 - January 2011
|
|
Paul D. Allison
|
61
|
Chairman, President and CEO - Raymond James Ltd. since January 2009; Co-President and Co-CEO - Raymond James Ltd., August 2008 - January 2009
|
|
James E. Bunn
|
44
|
Co-President - Global Equities and Investment Banking - Raymond James & Associates, Inc. since October 2017; Head of Investment Banking - Raymond James & Associates, Inc. since January 2014; Co-Head of Technology Services Investment Banking - Raymond James & Associates, Inc., May 2009 - December 2013
|
|
John C. Carson, Jr.
|
61
|
President since April 2012; President - Morgan Keegan & Company, LLC, formerly known as Morgan Keegan & Company, Inc., since July 2013; Chief Executive Officer and Executive Managing Director - Morgan Keegan & Company, Inc., March 2008 - July 2013
|
|
George Catanese
|
58
|
Senior Vice President since October 2005 and Chief Risk Officer since February 2006
|
|
Scott A. Curtis
|
55
|
President - Raymond James Financial Services, Inc. since January 2012; Senior Vice President - Private Client Group - Raymond James & Associates, Inc., July 2005 - December 2011
|
|
Jeffrey A. Dowdle
|
53
|
President - Asset Management Group since May 2016; Executive Vice President - Asset Management Group, February 2014 - May 2016; President - Asset Management Services - Raymond James & Associates, Inc., January 2005 - February 2014; Senior Vice President - Raymond James & Associates, Inc., January 2005 - February 2014
|
|
Tashtego S. Elwyn
|
46
|
President - Private Client Group - Raymond James & Associates, Inc. since January 2012; Regional Director - Raymond James & Associates, Inc., October 2006 - December 2011
|
|
Thomas A. James
|
75
|
Chairman Emeritus since February 2017; Executive Chairman, May 2010 - February 2017
|
|
Jeffrey P. Julien
|
61
|
Executive Vice President - Finance since August 2009, Chief Financial Officer since April 1987 and Treasurer since February 2011; Director and/or officer of several RJF subsidiaries
|
|
Steven M. Raney
|
52
|
President and CEO - Raymond James Bank, N.A. since January 2006
|
|
Paul C. Reilly
|
63
|
Chairman since February 2017 and Chief Executive Officer since May 2010; Director since January 2006; President, May 2009 - April 2010
|
|
Jonathan N. Santelli
|
46
|
Executive Vice President, General Counsel and Secretary since May 2016; Senior Vice President and Deputy General Counsel - First Republic Bank, October 2013 to April 2016; Managing Director and Associate General Counsel - Preferred and Small Business Banking - Bank of America, December 2011 - August 2013; Managing Director and Associate General Counsel - Private Wealth Management - Bank of America, October 2009 - November 2011
|
|
Jeffrey E. Trocin
|
58
|
Co-President - Global Equities and Investment Banking - Raymond James & Associates, Inc. since October 2017; President - Global Equities and Investment Banking - Raymond James & Associates, Inc., July 2013 - October 2017; Executive Vice President - Equity Capital Markets - Raymond James & Associates, Inc., February 2001 - July 2013
|
|
Dennis W. Zank
|
63
|
Chief Operating Officer since January 2012; Chief Executive Officer - Raymond James & Associates, Inc. since January 2012; President - Raymond James & Associates, Inc., December 2002 - December 2011
|
Except where otherwise indicated, the executive officer has held his or her current position for more than five years.
14
RAYMOND JAMES FINANCIAL, INC. AND SUBSIDIARIES
OTHER INFORMATION
Our Internet address is www.raymondjames.com. We make available on our website, free of charge and in printer-friendly format including “.pdf” file extensions, our Annual Reports on Form 10-K, Quarterly Reports on Form 10-Q, Current Reports on Form 8-K and amendments to those reports filed or furnished pursuant to Section 13(a) or 15(d) of the Securities Exchange Act of 1934, as soon as reasonably practicable after we electronically file such material with, or furnish it to, the SEC.
Factors affecting “forward-looking statements”
Certain statements made in this Annual Report on Form 10-K may constitute “forward-looking statements” under the Private Securities Litigation Reform Act of 1995. Forward-looking statements include information concerning future strategic objectives, business prospects, anticipated savings, financial results (including expenses, earnings, liquidity, cash flow and capital expenditures), industry or market conditions, demand for and pricing of our products, acquisitions and divestitures, anticipated results of litigation and regulatory developments, effects of accounting pronouncements, or general economic conditions. In addition, words such as “believes,” “expects,” “anticipates,” “intends,” “plans,” “estimates,” “projects,” “forecasts,” and future or conditional verbs such as “will,” “may,” “could,” “should,” and “would,” as well as any other statement that necessarily depends on future events, are intended to identify forward-looking statements. Forward-looking statements are not guarantees, and they involve risks, uncertainties and assumptions. Although we make such statements based on assumptions that we believe to be reasonable, there can be no assurance that actual results will not differ materially from those expressed in the forward-looking statements. We caution investors not to rely unduly on any forward-looking statements and urge you to carefully consider the risks described in Item 1A, “Risk Factors,” in this report. We expressly disclaim any obligation to update any forward-looking statement in the event it later turns out to be inaccurate, whether as a result of new information, future events or otherwise.
Item 1A.
RISK FACTORS
Our operations and financial results are subject to various risks and uncertainties, including those described below, which could adversely affect our business, financial condition, results of operations, liquidity and the trading price of our common stock. The list of risk factors provided below is not exhaustive; there may be factors not discussed below or in this Form 10-K that adversely impact our results of operations, harm our reputation or inhibit our ability to generate new business prospects.
RISKS RELATED TO OUR BUSINESS AND INDUSTRY
Damage to our reputation could damage our businesses.
Maintaining our reputation is critical to attracting and maintaining clients, investors and associates. If we fail to address, or appear to fail to address, issues that may give rise to reputational risk, we could significantly harm our business prospects. These issues may include, but are not limited to, any of the risks discussed in this Item 1A, including appropriately dealing with potential conflicts of interest, legal and regulatory requirements, ethical issues, money laundering, cybersecurity and privacy, record-keeping, and sales and trading practices, the failure to sell securities we have underwritten at anticipated price levels, and the proper identification of the legal, reputational, credit, liquidity, and market risks inherent in our products. Failure to maintain appropriate service and quality standards, or a failure or perceived failure to treat clients fairly can result in client dissatisfaction, litigation and heightened regulatory scrutiny, all of which can lead to lost revenue, higher operating costs and reputational harm. Negative publicity about us, whether or not true, may also harm our future business prospects.
We are affected by domestic and international macroeconomic conditions that impact the global financial markets.
We are engaged in various financial services businesses. As such, we are affected by domestic and international macroeconomic and political conditions, including economic output levels, interest and inflation rates, employment levels, prices of commodities including oil and gas, consumer confidence levels, and fiscal and monetary policy. For example, Fed policies determine, in large part, the cost of funds for lending and investing and the return earned on those loans and investments. The market impact from such policies also can decrease materially the value of certain of our financial assets, most notably debt securities. Changes in Fed policies are beyond our control and, consequently, the impact of these changes on our activities and results of our operations are difficult to predict. Macroeconomic conditions also may directly and indirectly impact a number of factors in the global financial markets that may be detrimental to our operating results, including trading levels, investing, and origination activity in the securities markets, security valuations, the absolute and relative level and volatility of interest and currency rates, real estate values, the actual and perceived quality of issuers and borrowers, and the supply of and demand for loans and deposits.
15
RAYMOND JAMES FINANCIAL, INC. AND SUBSIDIARIES
At times over the last several years we have experienced operating cycles during weak and uncertain U.S. and global economic conditions, including low economic output levels, artificially maintained levels of historically low interest rates, relatively high unemployment rates, and significant uncertainty with respect to domestic and international fiscal and monetary policy. These conditions led to changes in the global financial markets that from time to time negatively impacted our net revenue and profitability. While global financial markets have improved, uncertainty remains. A period of sustained downturns and/or volatility in the securities markets, a return to very low levels of short-term interest rates, credit market dislocations, reductions in the value of real estate, and other negative market factors could significantly impair our revenues and profitability. Additionally, certain of our market-making activities depend on market volatility to provide trading opportunities for our clients and decreases in volatility may reduce these opportunities or adversely affect the results of these activities. We could experience a decline in commission revenue from lower trading volumes, a decline in fees from reduced portfolio values of securities managed on behalf of our clients, a reduction in revenue from capital markets and advisory transactions due to reduced activity, increased credit provisions and charge-offs, losses sustained from our customers’ and market participants’ failure to fulfill their settlement obligations, reduced net interest earnings, and other losses. Periods of reduced revenue and other losses could be accompanied by periods of reduced profitability because certain of our expenses, including, but not limited to, our interest expense on debt, rent, facilities and salary expenses are fixed and our ability to reduce them over short time periods is limited.
U.S. markets may also be impacted by political and civil unrest occurring in other parts of the world. Concerns about the European Union (“EU”), including Britain’s June 2016 referendum to exit the EU (“Brexit”), and the stability of the EU’s sovereign debt, has caused uncertainty and disruption for financial markets globally. Continued uncertainties loom over the outcome of the EU’s financial support programs. It is possible that other EU member states may experience financial troubles in the future, or may choose to follow Britain’s lead and leave the EU. Any negative impact on economic conditions and global markets from these developments could adversely affect our business, financial condition and liquidity.
U.S. state and local governments also continue to struggle with budget pressures and ongoing concerns regarding municipal issuer credit quality. If these trends continue or worsen, investor concerns could potentially reduce the number and size of transactions in which we participate and, in turn, reduce investment banking revenues. In addition, such factors could adversely affect the value of the municipal securities we hold in our trading securities portfolio.
RJ Bank is affected primarily by economic conditions in North America. Market conditions in the United States and Canada can be assessed through the following metrics: the level and volatility of interest rates; unemployment and under-employment rates; real estate prices; consumer confidence levels and changes in consumer spending; and the number of personal bankruptcies, among others. Deterioration of market conditions can diminish loan demand, lead to an increase in mortgage and other loan delinquencies, affect loan repayment performance and result in higher reserves and net charge-offs, which can adversely affect our earnings.
Lack of liquidity or access to capital could impair our business and financial condition.
We must maintain appropriate liquidity levels. Our inability to maintain adequate liquidity and readily available access to the credit and capital markets could have a significant negative effect on our financial condition. If liquidity from our brokerage or banking operations is inadequate or unavailable, we may be required to scale back or curtail our operations, including limiting our efforts to recruit additional financial advisors, selling assets at unfavorable prices, and cutting or eliminating dividend payments. Our liquidity could be negatively affected by the inability of our subsidiaries to generate cash in the form of dividends from earnings, regulatory changes to the liquidity or capital requirements applicable to our subsidiaries that may prevent us from upstreaming cash to the parent company, limited or no accessibility to credit markets for secured and unsecured borrowings by our subsidiaries, diminished access to the capital markets for RJF, and other commitments or restrictions on capital as a result of adverse legal settlements, judgments, or regulatory sanctions. Furthermore, as a bank holding company, we may become subject to prohibitions or limitations on our ability to pay dividends and/or repurchase our stock. The OCC, the Fed, the FDIC, and the SEC (through FINRA) have the authority, and under certain circumstances, the duty, to prohibit or to limit dividend payments by regulated subsidiaries to their parent.
The availability of financing, including access to the credit and capital markets, depends on various factors, such as conditions in the debt and equity markets, the general availability of credit, the volume of securities trading activity, the overall availability of credit to the financial services sector and our credit ratings. Our cost of capital and the availability of funding may be adversely affected by illiquid credit markets and wider credit spreads. Additionally, lenders may from time to time curtail, or even cease to provide, funding to borrowers as a result of future concerns over the strength of specific counterparties, as well as the stability of markets generally. See Item 7, “Management’s Discussion and Analysis of Financial Condition and Results of Operations - Liquidity and Capital Resources” in this report for additional information on liquidity and how we manage our liquidity risk.
16
RAYMOND JAMES FINANCIAL, INC. AND SUBSIDIARIES
We are exposed to credit risk.
We are generally exposed to the risk that third parties that owe us money, securities or other assets will fail to meet their performance obligations due to numerous causes, including bankruptcy, lack of liquidity, or operational failure, among others. We actively buy and sell securities from and to clients and counterparties in the normal course of our broker-dealers’ market making and underwriting businesses, which exposes us to credit risk. Although generally collateralized by the underlying security to the transaction, we still face risk associated with changes in the market value of collateral through settlement date. We also hold certain securities, loans and derivatives in our trading accounts. Deterioration in the actual or perceived credit quality of the underlying issuers of securities or loans, or the non-performance of issuers and counterparties to certain derivative contracts could result in trading losses.
We borrow securities from, and lend securities to, other broker-dealers, and may also enter into agreements to repurchase and/or resell securities as part of investing and financing activities. A sharp change in the security market values utilized in these transactions may result in losses if counterparties to these transactions fail to honor their commitments.
We manage the risk associated with these transactions by establishing and monitoring credit limits, as well as by monitoring collateral and transaction levels daily. Significant deterioration in the credit quality of one of our counterparties could lead to widespread concerns about the credit quality of other counterparties in the same industry, thereby exacerbating our credit risk exposure.
We permit our clients to purchase securities on margin. During periods of steep declines in securities prices, the value of the collateral securing client margin loans may fall below the amount of the purchaser’s indebtedness. If clients are unable to provide additional collateral for these margin loans, we may incur losses on those margin transactions. This may cause us to incur additional expenses defending or pursuing claims or litigation related to counterparty or client defaults.
We deposit our cash in depository institutions as a means of maintaining the liquidity necessary to meet our operating needs, and we also facilitate the deposit of cash awaiting investment in depository institutions on behalf of our clients. A failure of a depository institution to return these deposits could severely impact our operating liquidity, result in significant reputational damage, and adversely impact our financial performance.
We also incur credit risk by lending to businesses and individuals through the offering of loans, including C&I loans, commercial and residential mortgage loans, tax-exempt loans, home equity lines of credit, and margin and other loans collateralized by securities. We also incur credit risk through our investments. Our credit risk and credit losses can increase if our loans or investments are concentrated among borrowers or issuers engaged in the same or similar activities, industries, or geographies, or to borrowers or issuers who as a group may be uniquely or disproportionately affected by economic or market conditions. The deterioration of an individually large exposure, for example due to natural disasters, health emergencies or pandemics, acts of terrorism, severe weather events or other adverse economic events, could lead to additional loan loss provisions and/or charges-offs, or credit impairment of our investments, and subsequently have a material impact on our net income and regulatory capital.
Declines in the real estate market or sustained economic downturns may cause us to write down the value of some of the loans in RJ Bank’s portfolio, foreclose on certain real estate properties or write down the value of some of our securities. Credit quality generally may also be affected by adverse changes in the financial performance or condition of our debtors or deterioration in the strength of the U.S. economy.
See Item 7, “Management’s Discussion and Analysis of Financial Condition and Results of Operations - Risk Management,” in this report for additional information regarding our exposure to and approaches to managing credit risk.
We are exposed to market risk.
We are, directly and indirectly, affected by changes in market conditions. Market risk generally represents the risk that values of assets and liabilities or revenues will be adversely affected by changes in market conditions. For example, interest rate changes could adversely affect our net interest spread, the difference between the yield we earn on our assets and the interest rate we pay for deposits and other sources of funding, which in turn impacts our net interest income and earnings. Interest rate changes could affect the interest earned on assets differently than interest paid on liabilities. In our brokerage operations, a rising interest rate environment generally results in our earning a larger net interest spread. Conversely, in those operations, a falling interest rate environment generally results in our earning a smaller net interest spread. If we are unable to effectively manage our interest rate risk, changes in interest rates could have a material adverse effect on our profitability.
Market risk is inherent in the financial instruments associated with our operations and activities, including loans, deposits, securities, short-term borrowings, long-term debt, trading account assets and liabilities, derivatives and private equity investments. Market
17
RAYMOND JAMES FINANCIAL, INC. AND SUBSIDIARIES
conditions that change from time to time, thereby exposing us to market risk, include fluctuations in interest rates, equity prices, foreign exchange rates, and price deterioration or changes in value due to changes in market perception or actual credit quality of an issuer.
In addition, disruptions in the liquidity or transparency of the financial markets may result in our inability to sell, syndicate or realize the value of security positions, thereby leading to increased concentrations. The inability to reduce our positions in specific securities may not only increase the market and credit risks associated with such positions, but also increase the level of risk-weighted assets on our balance sheet, thereby increasing our capital requirements, which could have an adverse effect on our business results, financial condition and liquidity.
Our private equity investments are carried at fair value with unrealized gains and losses reflected in earnings. The value of our private equity portfolios can fluctuate and earnings from our investments can be volatile and difficult to predict. When, and if, we recognize gains can depend on a number of factors, including general economic conditions, the prospects of the companies in which we invest, when these companies go public, the size of our position relative to the public float and whether we are subject to any resale restrictions. Further, our investments could incur significant mark-to-market losses, especially if they have been written up in prior periods because of higher market prices.
See Item 7, “Management’s Discussion and Analysis of Financial Condition and Results of Operations - Risk Management,” in this report for additional information regarding our exposure to and approaches to managing market risk.
Our business depends on fees generated from the distribution of financial products, fees earned from the management of client accounts, and advisory fees.
A large portion of our revenues are derived from fees generated from the distribution of financial products, such as mutual funds and variable annuities. Changes in the structure or amount of the fees paid by the sponsors of these products could directly affect our revenues, business and financial condition. In addition, if these products experience losses or increased investor redemptions, we may receive lower fee revenue from the investment management and distribution services we provide on behalf of the mutual funds and annuities. The investment management fees we are paid may also decline over time due to factors such as increased competition and the renegotiation of contracts. In addition, the market environment in recent years has resulted in a shift to passive investment products, which generate lower fees than actively managed products. A continued trend toward passive investments or changes in market values or in the fee structure of asset management accounts would affect our revenues, business and financial condition. Asset management fees often are primarily comprised of base management and incentive fees. Management fees are primarily based on assets under management (“AUM”). AUM balances are impacted by net inflows/outflows of client assets and market values. Below-market investment performance by our funds and portfolio managers could result in a loss of managed accounts and could result in reputational damage that might make it more difficult to attract new investors and thus further impact our business and financial condition. If we were to experience the loss of managed accounts, our fee revenue would decline. In addition, in periods of declining market values, our values of AUM may resultantly decline, which would negatively impact our fee revenues.
Our underwriting, market-making, trading, and other business activities place our capital at risk.
We may incur losses and be subject to reputational harm to the extent that, for any reason, we are unable to sell securities we have underwritten at the anticipated price levels. As an underwriter, we also are subject to heightened standards regarding liability for material misstatements or omissions in prospectuses and other offering documents relating to offerings in which we are involved. As a market maker, we may own positions in specific securities, and these undiversified holdings concentrate the risk of market fluctuations and may result in greater losses than would be the case if our holdings were more diversified. In addition, despite risk mitigation policies, we may incur losses as a result of positions we hold in connection with our market making or underwriting activities.
From time to time and as part of our underwriting processes, we may carry significant positions in securities of a single issuer or issuers engaged in a specific industry. Sudden changes in the value of these positions could impact our financial results.
We have made and, to the limited extent permitted by applicable regulations, may continue to make principal investments in private equity funds and other illiquid investments; however, our current focus is on the divestiture of our existing portfolio. We may be unable to realize our investment objectives if we cannot sell or otherwise dispose of our interests at attractive prices or complete a desirable exit strategy. In particular, these risks could arise from changes in the financial condition or prospects of the portfolio companies in which investments are made, changes in economic conditions or changes in laws, regulations, fiscal policies or political conditions. It could take a substantial period of time to identify attractive investment opportunities and then to realize the cash value of such investments. Even if a private equity investment proves to be profitable, it may be several years or longer before any profits can be realized in cash.
18
RAYMOND JAMES FINANCIAL, INC. AND SUBSIDIARIES
Any cyber-attack or other security breach of our technology systems, or those of our clients or other third-party vendors we rely on, could subject us to significant liability and harm our reputation.
Our operations rely heavily on the secure processing, storage and transmission of sensitive and confidential financial, personal and other information in our computer systems and networks. There have been several highly publicized cases involving financial services companies reporting the unauthorized disclosure of client or other confidential information in recent years, as well as cyber-attacks involving the theft, dissemination and destruction of corporate information or other assets, in some cases as a result of failure to follow procedures by employees or contractors or as a result of actions by third parties. Like other financial services firms, we are regularly the target of attempted cyber-attacks, including unauthorized access, mishandling or misuse of information, computer viruses or malware, denial-of-service attacks, phishing or other forms of social engineering, and other events, and we seek to continuously monitor and develop our systems to protect our technology infrastructure and data from misappropriation or corruption. Cyber-attacks can originate from a variety of sources, including third parties affiliated with foreign governments, organized crime or terrorist organizations. Third parties may also attempt to place individuals within our firm or induce employees, clients or other users of our systems to disclose sensitive information or provide access to our data, and these types of risks may be difficult to detect or prevent. Although cyber security incidents among financial services firms are on the rise, we have not experienced any material losses relating to cyber-attacks or other information security breaches. However, the techniques used in these attacks are increasingly sophisticated, change frequently and are often not recognized until launched. Although we seek to maintain a robust suite of authentication and layered information security controls, including our cyber threat analytics, data encryption and tokenization technologies, anti-malware defenses and vulnerability management program, any one or combination of these controls could fail to detect, mitigate or remediate these risks in a timely manner. Despite our implementation of protective measures and endeavoring to modify them as circumstances warrant, our computer systems, software and networks may be vulnerable to human error, natural disasters, power loss, spam attacks, unauthorized access, distributed denial of service attacks, computer viruses and other malicious code, and other events that could result in significant liability and damage to our reputation, and have an ongoing impact on the security and stability of our operations.
We also rely on numerous third party service providers to conduct other aspects of our business operations, and we face similar risks relating to them. While we regularly conduct security assessments on these third party vendors, we cannot be certain that their information security protocols are sufficient to withstand a cyber-attack or other security breach. In addition, in order to access our products and services, our customers may use computers and other devices that are beyond our security control systems.
Notwithstanding the precautions we take, if a cyber-attack or other information security breach were to occur, this could jeopardize the information we confidentially maintain, or otherwise cause interruptions in our operations or those of our clients and counterparties, exposing us to liability. As attempted attacks continue to evolve in scope and sophistication, we may be required to expend substantial additional resources to modify or enhance our protective measures, to investigate and remediate vulnerabilities or other exposures or to communicate about cyber-attacks to our customers. Though we have insurance against some cyber-risks and attacks, we may be subject to litigation and financial losses that exceed our policy limits or are not covered under any of our current insurance policies. A technological breakdown could also interfere with our ability to comply with financial reporting and other regulatory requirements, exposing us to potential disciplinary action by regulators. Further, successful cyber-attacks at other large financial institutions or other market participants, whether or not we are affected, could lead to a general loss of customer confidence in financial institutions that could negatively affect us, including harming the market perception of the effectiveness of our security measures or the financial system in general, which could result in reduced use of our financial products and services.
Further, in light of the high volume of transactions we process, the large number of our clients, partners and counterparties, and the increasing sophistication of malicious actors, a cyber-attack could occur and persist for an extended period of time without detection. We expect that any investigation of a cyber-attack would take substantial amounts of time, and that there may be extensive delays before we obtain full and reliable information. During such time we would not necessarily know the extent of the harm or how best to remediate it, and certain errors or actions could be repeated or compounded before they are discovered and remediated, all of which would further increase the costs and consequences of such an attack.
We may also be subject to liability under various data protection laws. In providing services to clients, we manage, utilize and store sensitive or confidential client or employee data, including personal data. As a result, we are subject to numerous laws and regulations designed to protect this information, such as U.S. federal, state and international laws governing the protection of personally identifiable information. These laws and regulations are increasing in complexity and number. If any person, including any of our associates, negligently disregards or intentionally breaches our established controls with respect to client or employee data, or otherwise mismanages or misappropriates such data, we could be subject to significant monetary damages, regulatory enforcement actions, fines and/or criminal prosecution. In addition, unauthorized disclosure of sensitive or confidential client or employee data, whether through system failure, employee negligence, fraud or misappropriation, could damage our reputation and cause us to lose clients and related revenue. Potential liability in the event of a security breach of client data could be significant. Depending on the circumstances giving rise to the breach, this liability may not be subject to a contractual limit or an exclusion of consequential or indirect damages.
19
RAYMOND JAMES FINANCIAL, INC. AND SUBSIDIARIES
See Item 7, “Management’s Discussion and Analysis of Financial Condition and Results of Operations - Risk Management” in this report for additional information regarding our exposure to and approaches for managing these types of operational risks.
The soundness of other financial institutions and intermediaries affects us.
We face the risk of operational failure, termination or capacity constraints of any of the clearing agents, exchanges, clearing houses or other financial intermediaries that we use to facilitate our securities transactions. As a result of the consolidation over the years among clearing agents, exchanges and clearing houses, our exposure to certain financial intermediaries has increased and could affect our ability to find adequate and cost-effective alternatives should the need arise. Any failure, termination or constraint of these intermediaries could adversely affect our ability to execute transactions, service our clients and manage our exposure to risk.
Our ability to engage in routine trading and funding transactions could be affected adversely by the actions and commercial soundness of other financial institutions. Financial services institutions are interrelated as a result of trading, clearing, funding, counterparty or other relationships. We have exposure to many different industries and counterparties, and we routinely execute transactions with counterparties in the financial industry, including brokers and dealers, commercial banks, investment banks, mutual and hedge funds and other institutional clients. Defaults by, or even rumors or questions about the financial condition of, one or more financial services institutions, or the financial services industry generally, have historically led to market-wide liquidity problems and could lead to losses or defaults by us or by other institutions. Many of these transactions expose us to credit risk in the event of default of our counterparty or client. In addition, our credit risk may be exacerbated when the collateral held by us cannot be realized or is liquidated at prices not sufficient to recover the full amount of the loan or derivative exposure due us. Losses arising in connection with counterparty defaults may have a material adverse effect on our results of operations.
Our risk management and conflicts of interest policies and procedures may leave us exposed to unidentified or unanticipated risk.
We seek to manage, monitor and control our market, credit, operational, legal and regulatory risk through operational and compliance reporting systems, internal controls, management review processes and other mechanisms; however, there can be no assurance that our procedures will be effective. Our banking and trading processes seek to balance our ability to profit from banking and trading positions with our exposure to potential losses. While we use limits and other risk mitigation techniques, those techniques and the judgments that accompany their application cannot anticipate unforeseen economic and financial outcomes or the specifics and timing of such outcomes. Our risk management methods may not predict future risk exposures effectively. In addition, some of our risk management methods are based on an evaluation of information regarding markets, clients and other matters that are based on assumptions that may no longer be accurate or may have limited predictive value. A failure to manage our growth adequately, including growth in the products or services we offer, or to manage our risk effectively, could materially and adversely affect our business and financial condition.
Financial services firms are subject to numerous actual or perceived conflicts of interest, which are under growing scrutiny by U.S. federal and state regulators and SROs such as FINRA. Our risk management processes include addressing potential conflicts of interest that arise in our business. Management of potential conflicts of interest has become increasingly complex as we expand our business activities. A perceived or actual failure to address conflicts of interest adequately could affect our reputation, the willingness of clients to transact business with us or give rise to litigation or regulatory actions. Therefore, there can be no assurance that conflicts of interest will not arise in the future that could cause result in material harm to our business and financial condition.
For more information on how we monitor and manage market and certain other risks, see Item 7, “Management’s Discussion and Analysis of Financial Condition and Results of Operations - Risk Management,” in this report.
We continue to experience pricing pressures in areas of our business which may impair our future revenue and profitability.
We continue to experience pricing pressures on trading margins and commissions in fixed income and equity trading. In the fixed income market, regulatory requirements have resulted in greater price transparency, leading to price competition and decreased trading margins. In the equity market, we experience pricing pressure from institutional clients to reduce commissions, and this pressure has been augmented by the use of electronic and direct market access trading, which has created additional competitive downward pressure on trading margins. We believe that price competition and pricing pressures in these and other areas will continue as institutional investors continue to reduce the amounts they are willing to pay, including by reducing the number of brokerage firms they use, and some of our competitors seek to obtain market share by reducing fees, commissions or margins.
20
RAYMOND JAMES FINANCIAL, INC. AND SUBSIDIARIES
We face intense competition.
We are engaged in intensely competitive businesses. We compete on the basis of a number of factors, including the quality of our financial advisors and associates, our products and services, pricing (such as execution pricing and fee levels), and location and reputation in relevant markets. Over time there has been substantial consolidation and convergence among companies in the financial services industry, which has significantly increased the capital base and geographic reach of our competitors. See the section entitled “Competition” of Item 1 of this report for additional information about our competitors.
We compete directly with national full service broker-dealers, investment banking firms, and commercial banks, and to a lesser extent, with discount brokers and dealers and investment advisors. In addition, we face competition from more recent entrants into the market and increased use of alternative sales channels by other firms. We also compete indirectly for investment assets with insurance companies, real estate firms and hedge funds, among others. This competition could cause our business to suffer.
To remain competitive, our future success also depends in part on our ability to develop and enhance our products and services. The inability to develop new products and services, or enhance existing offerings, could have a material adverse effect on our profitability. In addition, we may incur substantial expenditures to keep pace with the constant changes and enhancements being made in technology.
Our ability to attract and retain senior professionals, qualified financial advisors and other associates is critical to the continued success of our business.
Our ability to develop and retain our clients depends on the reputation, judgment, business generation capabilities and skills of our senior professionals, and the members of our executive committees, as well as employees and financial advisors. To compete effectively we must attract, retain and motivate qualified professionals, including successful financial advisors, investment bankers, trading professionals, portfolio managers and other revenue producing or specialized personnel. Competitive pressures we experience could have an adverse effect on our business, results of operations, financial condition and liquidity.
Turnover in the financial services industry is high. The cost of recruiting and retaining skilled professionals in the financial services industry has escalated considerably. Financial industry employers are increasingly offering guaranteed contracts, upfront payments, and increased compensation. These can be important factors in a current employee’s decision to leave us as well as in a prospective employee’s decision to join us. As competition for skilled professionals in the industry remains intense, we may have to devote significant resources to attracting and retaining qualified personnel. To the extent we have compensation targets, we may not be able to retain our employees, which could result in increased recruiting expense or result in our recruiting additional employees at compensation levels that are not within our target range. In particular, our financial results may be adversely affected by the costs we incur in connection with any upfront loans or other incentives we may offer to newly recruited financial advisors and other key personnel. If we were to lose the services of any of our investment bankers, senior equity research, sales and trading professionals, asset managers, or executive officers to a competitor or otherwise, we may not be able to retain valuable relationships and some of our clients could choose to use the services of a competitor instead of our services. If we are unable to retain our senior professionals or recruit additional professionals, our reputation, business, results of operations and financial condition will be adversely affected. Further, new business initiatives and efforts to expand existing businesses generally require that we incur compensation and benefits expense before generating additional revenues.
Moreover, companies in our industry whose employees accept positions with competitors frequently claim that those competitors have engaged in unfair hiring practices. We have been subject to several such claims and may be subject to additional claims in the future as we seek to hire qualified personnel, some of whom may work for our competitors. Some of these claims may result in material litigation. We could incur substantial costs in defending against these claims, regardless of their merits. Such claims could also discourage potential employees who work for our competitors from joining us. Recently, a large broker-dealer competitor announced its withdrawal from the Protocol for Broker Recruiting (“Protocol”), a voluntary agreement among over 1,700 firms that governs, among other things, the client information that financial advisors may take with them when they affiliate with a new firm. The ability to bring such customer data to a new broker-dealer generally means that the financial advisor is better able to move client account balances to his or her new firm. It is possible that other competitors will similarly withdraw from the Protocol. If the broker-dealers from whom we recruit new financial advisors prevent, or significantly limit, the transfer of client data, our recruiting efforts may be adversely affected and we could experience a higher number of claims against us relating to our recruiting efforts.
A downgrade in our credit ratings could have a material adverse effect on our operations, earnings and financial condition.
If our credit ratings were downgraded, or if rating agencies indicate that a downgrade may occur, our business, financial position, and results of operations could be adversely affected, perceptions of our financial strength could be damaged, and as a result, adversely affect our client relationships. Such a change in our credit ratings could also adversely affect our liquidity and competitive position, increase our borrowing costs, limit our access to the capital markets, trigger obligations under certain financial agreements, or decrease
21
RAYMOND JAMES FINANCIAL, INC. AND SUBSIDIARIES
the number of investors, clients and counterparties willing or permitted to do business with or lend to us, thereby curtailing our business operations and reducing profitability.
We may not be able to obtain additional outside financing to fund our operations on favorable terms, or at all. The impact of a credit rating downgrade to a level below investment grade would result in our breaching provisions in certain of our derivative instruments, and may result in a request for immediate payment and/or ongoing overnight collateralization on our derivative instruments in liability positions. A credit rating downgrade would also result in RJF incurring a higher commitment fee on any unused balance on its $300 million revolving credit facility, in addition to triggering a higher interest rate applicable to any borrowings outstanding on the line as of and subsequent to such downgrade (see
Note 14
of the Notes to Consolidated Financial Statements in this Form 10-K for information on this revolving credit facility).
Business growth could increase costs and regulatory and integration risks.
We continue to grow through acquisitions. Integrating acquired businesses, providing a platform for new businesses and partnering with other firms involve risks and present financial, managerial and operational challenges. We may incur significant expense in connection with expanding our existing businesses, recruiting financial advisors, or making strategic acquisitions or investments. Our overall profitability would be negatively affected if investments and expenses associated with such growth are not matched or exceeded by the revenues derived from such investments or growth.
Expansion may also create a need for additional compliance, documentation, risk management and internal control procedures, and often involves hiring additional personnel to address these procedures. To the extent such procedures are not adequate or not adhered to with respect to our expanded business or any new business, we could be exposed to a material loss or regulatory sanction.
Moreover, to the extent we pursue acquisitions we may be unable to complete such acquisitions on acceptable terms. We may be unable to integrate any acquired business into our existing business successfully. Difficulties we may encounter in integrating an acquired business could have an adverse effect on our business, financial condition, and results of operations. In addition, we may need to raise capital or borrow in order to finance an acquisition, which could result in dilution or increased leverage. We may not be able to obtain financing on favorable terms or perhaps at all.
A continued interruption to our telecommunications or data processing systems, or the failure to effectively update the technology we utilize, could be materially adverse to our business.
Our businesses rely extensively on data processing and communications systems. In addition to better serving clients, the effective use of technology increases efficiency and enables us to reduce costs. Adapting or developing our technology systems to meet new regulatory requirements, client needs, and competitive demands is critical for our business. Introduction of new technology presents challenges on a regular basis. There are significant technical and financial costs and risks in the development of new or enhanced applications, including the risk that we might be unable to effectively use new technologies or adapt our applications to emerging industry standards.
Our continued success depends, in part, upon our ability to: (i) successfully maintain and upgrade the capability of our technology systems; (ii) address the needs of our clients by using technology to provide products and services that satisfy their demands; and (iii) retain skilled information technology employees. Failure of our technology systems, which could result from events beyond our control, or an inability to effectively upgrade those systems or implement new technology-driven products or services, could result in financial losses, liability to clients, violations of applicable privacy and other applicable laws and regulatory sanctions. See Item 7, “Management’s Discussion and Analysis of Financial Condition and Results of Operations - Risk Management,” in this report for additional information regarding our exposure to and approaches for managing these types of operational risks.
Associate misconduct, which is difficult to detect and deter, could harm us by impairing our ability to attract and retain clients and subject us to significant legal liability and reputational harm.
There have been a number of highly-publicized cases involving fraud or other misconduct by associates in the financial services industry. There is a risk that our associates could engage in misconduct that adversely affects our business. For example, our banking business often requires that we deal with confidential matters of great significance to our clients. If our associates were to improperly use or disclose confidential information provided by our clients, we could be subject to regulatory sanctions and suffer serious harm to our reputation, financial position, current client relationships and ability to attract future clients. We are also subject to a number of obligations and standards arising from our asset management business and our authority over the assets managed by our asset management business. In addition, our financial advisors may act in a fiduciary capacity, providing financial planning, investment advice and discretionary asset management. The violation of these obligations and standards by any of our associates would adversely
22
RAYMOND JAMES FINANCIAL, INC. AND SUBSIDIARIES
affect our clients and us. It is not always possible to deter associate misconduct, and the precautions we take to detect and prevent this activity may not be effective. If our associates engage in misconduct, our business would be adversely affected.
We are exposed to litigation risks, which could materially and adversely impact our business operations and prospects.
Many aspects of our business involve substantial risks of liability. We have been named as a defendant or co-defendant in lawsuits and arbitrations involving primarily claims for damages. The risks associated with potential litigation often may be difficult to assess or quantify and the existence and magnitude of potential claims often remain unknown for substantial periods of time. Unauthorized or illegal acts of our associates could result in substantial liability. Our Private Client Group business segment has historically been more susceptible to litigation than our institutional businesses.
In challenging market conditions, the volume of claims and amount of damages sought in litigation and regulatory proceedings against financial institutions has historically increased. These risks include potential liability under securities laws or other laws for: alleged materially false or misleading statements made in connection with securities offerings and other transactions; issues related to the suitability of our investment recommendations; the inability to sell or redeem securities in a timely manner during adverse market conditions; contractual issues; employment claims; and potential liability for other advice we provide to participants in strategic transactions. Substantial legal liability could have a material adverse financial impact or cause us significant reputational harm, which in turn could seriously harm our business and future business prospects. In addition to the foregoing financial costs and risks associated with potential liability, the costs of defending individual litigation and claims continue to increase over time. The amount of outside attorneys’ fees incurred in connection with the defense of litigation and claims could be substantial and might materially and adversely affect our results of operations.
See Item 3, “Legal Proceedings” in this report for a discussion of our legal matters and see Item 7, “Management’s Discussion and Analysis of Financial Condition and Results of Operations - Risk Management,” in this report for a discussion regarding our approach to managing legal risk.
The preparation of the consolidated financial statements requires the use of estimates that may vary from actual results and new accounting standards could adversely affect future reported results.
The preparation of the consolidated financial statements in conformity with U.S. generally accepted accounting principles (“GAAP”) requires management to make estimates and assumptions that affect the reported amounts of assets and liabilities, disclosure of contingent assets and liabilities at the date of the consolidated financial statements and the reported amounts of revenues and expenses during the reporting period. Such estimates and assumptions may require management to make difficult, subjective and complex judgments about matters that are inherently uncertain. One of our most critical estimates is RJ Bank’s allowance for loan losses. At any given point in time, conditions in real estate and credit markets may increase the complexity and uncertainty involved in estimating the losses inherent in RJ Bank’s loan portfolio. If management’s underlying assumptions and judgments prove to be inaccurate, the allowance for loan losses could be insufficient to cover actual losses. Our financial condition, including our liquidity and capital, and results of operations could be materially and adversely impacted. See Item 7, “Management’s Discussion and Analysis of Financial Condition and Results of Operations - Critical Accounting Estimates,” in this report for additional information on the nature of these estimates.
Our financial instruments, including certain trading assets and liabilities, available-for-sale securities including Auction Rate Securities (“ARS”), certain loans, intangible assets and private equity investments, among other items, require management to make a determination of their fair value in order to prepare our consolidated financial statements. Where quoted market prices are not available, we may make fair value determinations based on internally developed models or other means, which ultimately rely to some degree on our subjective judgment. Some of these instruments and other assets and liabilities may have no direct observable inputs, making their valuation particularly subjective and, consequently, based on significant estimation and judgment. In addition, sudden illiquidity in markets or declines in prices of certain securities may make it more difficult to value certain items, which may lead to the possibility that such valuations will be subject to further change or adjustment, as well as declines in our earnings in subsequent periods.
Our accounting policies and methods are fundamental to how we record and report our financial condition and results of operations. The Financial Accounting Standards Board (the “FASB”) and the SEC have at times revised the financial accounting and reporting standards that govern the preparation of our financial statements. In addition, accounting standard setters and those who interpret the accounting standards may change or even reverse their previous interpretations or positions on how these standards should be applied. These changes can be hard to predict and can materially impact how we record and report our financial condition and results of operations. In some cases, we could be required to apply a new or revised standard retroactively, resulting in our restating prior period financial statements. For further discussion of some of our significant accounting policies and standards, see the “Critical Accounting Estimates” discussion within Item 7 in this report, and
Note 2
of the Notes to Consolidated Financial Statements in this Form 10-K.
The FASB has issued several new accounting standards, including on the topics of credit losses, revenue recognition and leases.
23
RAYMOND JAMES FINANCIAL, INC. AND SUBSIDIARIES
Specifically, the new credit losses standard will replace multiple existing impairment models, including the replacement of the “incurred loss” model for loans with an “expected loss” model. We are evaluating the potential impact that the adoption of these standards will have on our financial position and results of operations. See
Note 2
of the Notes to Consolidated Financial Statements in this Form 10-K for further information.
Regions may fail to honor its indemnification obligations associated with Morgan Keegan matters.
Under the definitive stock purchase agreement entered into in connection with our acquisition of Morgan Keegan & Company, Inc., and MK Holding, Inc. and certain of its affiliates (collectively referred to as “Morgan Keegan”) from Regions Financial Corporation (“Regions”), Regions has obligations to continue to indemnify RJF with respect to certain litigation as well as other matters. Specifically, the terms of the agreement provide that Regions will indemnify RJF for losses incurred in connection with legal proceedings pending as of the closing date of that acquisition (April 2, 2012), or commenced thereafter and related to pre-closing matters that were received prior to the closing date, as well as any cost of defense pertaining thereto. RJF is relying on Regions to continue to fulfill its indemnification obligations under the agreement with respect to such matters. Our inability to enforce these indemnification provisions in the future, or our failure to recover future losses for which we are entitled to be indemnified, could result in our incurring significant costs for defense, settlement, and any adverse judgments, and resultantly have an adverse effect on our results of operations, financial condition, and our regulatory capital levels.
See
Note 17
of the Notes to Consolidated Financial Statements in this Form 10-K for further information regarding the indemnification from Regions.
Our operations could be adversely affected by serious weather conditions.
Certain of our principal operations are located in St. Petersburg, Florida. While we have a business continuity plan that permits significant operations to be conducted out of our Southfield, Michigan and Memphis, Tennessee locations and our information systems processing to be conducted out of our information technology data center in the Denver, Colorado area, our operations could be adversely affected by hurricanes or other serious weather conditions that could affect the processing of transactions, communications, and the ability of our associates to get to our offices, or work from home. As discussed above, weather events could also adversely impact certain loans within RJ Bank’s portfolio. Refer to Item 7, “Management’s Discussion and Analysis of Financial Condition and Results of Operations - Risk Management” in this Form 10-K for a discussion of our operational risk management.
We are exposed to risk from international markets.
We do business in other parts of the world and as a result, are exposed to risks, including economic, market, litigation and regulatory risks. Our businesses and revenues derived from non-U.S. operations are subject to risk of loss from currency fluctuations, social or political instability, less established regulatory regimes, changes in governmental or central bank policies, downgrades in the credit ratings of sovereign countries, expropriation, nationalization, confiscation of assets and unfavorable legislative, economic and political developments. Action or inaction in any of these operations, including failure to follow proper practices with respect to regulatory compliance and/or corporate governance, could harm our operations and our reputation. We also invest or trade in the securities of corporations located in non-U.S. jurisdictions. Revenues from trading non-U.S. securities also may be subject to negative fluctuations as a result of the above mentioned factors.
We are exposed to risks related to our insurance programs.
Our operations and financial results are subject to risks and uncertainties related to our use of a combination of insurance, self-insured retention and self-insurance for a number of risks. We have elected to self-insure our workers compensation, errors and omissions liability and our employee-related health care benefit plans. We have self-insured retention risk related to our property and casualty, and general liability benefit plans.
While we endeavor to purchase insurance coverage appropriate to our risk assessment, we are unable to predict with certainty the frequency, nature or magnitude of claims for direct or consequential damages. Our business may be negatively affected if our insurance proves to be inadequate or unavailable. In addition, claims associated with risks we have retained either through our self-insurance retention or by self-insuring, may exceed our recorded reserves which could negatively impact future earnings. Insurance claims may divert management resources away from operating our business.
24
RAYMOND JAMES FINANCIAL, INC. AND SUBSIDIARIES
RISKS RELATED TO OUR REGULATORY ENVIRONMENT
Financial services firms have been subject to regulatory changes resulting from the Dodd-Frank Act and increased regulatory scrutiny over the last several years, increasing the risk of financial liability and reputational harm resulting from adverse regulatory actions.
Financial services firms over the last several years have been operating in an onerous regulatory environment, which could become more stringent in light of recent well-publicized failures of regulators to detect and prevent fraud. The industry has experienced increased scrutiny from various regulators, including the SEC, the Fed, the OCC and the CFPB, in addition to stock exchanges, FINRA and state attorneys general. Penalties and fines imposed by regulatory authorities have increased substantially in recent years. We may be adversely affected by changes in the interpretation or enforcement of existing laws, rules and regulations.
As a result of the demand by the public for changes in the way the financial services industry is regulated, including a call for more stringent legislation and regulation in the United States and abroad. The Dodd-Frank Act enacted sweeping changes and an unprecedented increase in the supervision and regulation of the financial services industry (see Item 1, “Regulation,” in this report for a discussion of such changes). The ultimate impact that the Dodd-Frank Act and implementing regulations will have on us, the financial industry and the economy at large cannot be quantified until all of the implementing regulations called for under the legislation have been finalized and fully implemented. Nevertheless, it is apparent that these legislative and regulatory changes could affect our revenue, limit our ability to pursue business opportunities, impact the value of our assets, require us to alter at least some of our business practices, impose additional compliance costs, and otherwise adversely affect our businesses.
The Dodd-Frank Act impacts the manner in which we market our products and services, manage our business and operations, and interact with regulators, all of which could materially impact our results of operations, financial condition and liquidity. Certain provisions of the Dodd-Frank Act that have or may impact our businesses include: the establishment of a fiduciary standard for broker-dealers; regulatory oversight of incentive compensation; the imposition of capital requirements on financial holding companies; prohibition of proprietary trading; restrictions on investments in covered funds; and, to a lesser extent, greater oversight over derivatives trading. There is also increased regulatory scrutiny (and related compliance costs) as we continue to grow and surpass certain consolidated asset thresholds established under the Dodd-Frank Act, which have the effect of imposing enhanced standards and requirements on larger institutions. These include, but are not limited to, RJ Bank’s oversight by the CFPB. The CFPB has had an active enforcement agenda and any action taken by the CFPB could result in requirements to alter or cease offering affected products and services, make such products and services less attractive, impose additional compliance measures, or result in fines, penalties or required remediation. To the extent the Dodd-Frank Act impacts the operations, financial condition, liquidity and capital requirements of unaffiliated financial institutions with whom we transact business, those institutions may seek to pass on increased costs, reduce their capacity to transact, or otherwise present inefficiencies in their interactions with us. We are also required to comply with the Volcker Rule’s provisions. Although we have not historically engaged in significant levels of proprietary trading, due to our underwriting and market-making activities and our investments in covered funds, we have experienced and expect to continue to experience increased operational and compliance costs and changes to our private equity investments. Any changes to regulations or changes to the supervisory approach may also result in increased compliance costs to the extent we are required to modify our existing compliance policies, procedures and practices.
Broker-dealers and investment advisors are subject to regulations covering all aspects of the securities business, including, but not limited to: sales and trading methods; trade practices among broker-dealers; use and safekeeping of clients’ funds and securities; capital structure of securities firms; anti-money laundering efforts; recordkeeping; and the conduct of directors, officers and employees. Any violation of these laws or regulations could subject us to the following events, any of which could have a material adverse effect on our business, financial condition and prospects: civil and criminal liability; sanctions, which could include the revocation of our subsidiaries’ registrations as investment advisors or broker-dealers; the revocation of the licenses of our financial advisors; censures; fines; or a temporary suspension or permanent bar from conducting business.
The majority of our affiliated financial advisors are independent contractors. Legislative or regulatory action that redefines the criteria for determining whether a person is an employee or an independent contractor could materially impact our relationships with our advisors and our business, resulting in an adverse effect on our results of operations.
Regulatory actions brought against us may result in judgments, settlements, fines, penalties or other results, any of which could have a material adverse effect on our business, financial condition or results of operations. There is no assurance that regulators will be satisfied with the policies and procedures implemented by RJF and its subsidiaries. In addition, from time to time, RJF and its affiliates may become subject to additional findings with respect to supervisory, compliance or other regulatory deficiencies, which could subject us to additional liability, including penalties, and restrictions on our business activities. Among other things, these restrictions could limit our ability to make investments, complete acquisitions, expand into new business lines, pay dividends and/or engage in share
25
RAYMOND JAMES FINANCIAL, INC. AND SUBSIDIARIES
repurchases. See Item 1, “Regulation,” in this report for additional information regarding our regulatory environment and Item 7, “Management’s Discussion and Analysis of Financial Condition and Results of Operations - Risk Management,” in this report regarding our approaches to managing regulatory risk.
Changes in regulations resulting from the DOL Rule, including the DOL fiduciary standard, may adversely affect our businesses.
The DOL Rule became effective earlier in the year, subject to a transition period until January 2018 applying to both the BIC Exemption and Principal Transactions Exemption. Although we have undertaken a comprehensive plan to comply with the DOL Rule given that qualified accounts, particularly IRA accounts, comprise a significant portion of our business, we expect that compliance with the DOL Rule and reliance on the BIC Exemption and the Principal Transactions Exemption will require us to continue to incur increased legal, compliance and information technology costs. We anticipate that if the DOL Rule is amended, a rule imposing heightened standards on broker-dealers is adopted by the SEC, or fiduciary rules are adopted at the state level, we will be required to incur additional costs in order to review and possibly modify our compliance plan and approach. Implementation of the DOL Rule, any amendments to the rule, and any rules addressing similar matters will negatively impact our results including the impact of increased costs related to compliance, legal and information technology. In addition, we expect that our legal risks will increase, in part, as a result of the new contractual rights required to be given to IRA and non-ERISA plan clients under the BIC Exemption and Principal Transactions Exemption.
Numerous regulatory changes, and enhanced regulatory and enforcement activity, relating to the asset management business may increase our compliance and legal costs and otherwise adversely affect our business.
The SEC has proposed certain measures that would establish a new framework to replace the requirements of Rule 12b-1 under the 1940 Act with respect to how mutual funds pay fees to cover the costs of selling and marketing their share
s
. The staff of the SEC’s Office of Compliance, Inspections and Examinations has indicated that it is reviewing the use of fund assets to pay for fees to sub-transfer agents and sub-administrators for services that may be deemed to be distribution-related. Any adoption of such measures would be phased in over a number of years. As these measures are neither final nor undergoing implementation throughout the financial services industry, their impact cannot be fully ascertained at this time. As this regulatory trend continues, it could adversely affect our operations and, in turn, our financial results.
Asset management businesses have experienced a number of highly publicized regulatory inquiries, which have resulted in increased scrutiny within the industry and new rules and regulations for mutual funds, investment advisors and broker-dealers. As some of our wholly owned subsidiaries are registered as investment advisors with the SEC, increased regulatory scrutiny and rulemaking initiatives may result in augmented operational and compliance costs or the assessment of significant fines or penalties against our asset management business, and may otherwise limit our ability to engage in certain activities. It is not possible to determine the extent of the impact of any new laws, regulations or initiatives that may be proposed, or whether any of the proposals will become law. Conformance with any new laws or regulations could make compliance more difficult and expensive and affect the manner in which we conduct business. For example, pursuant to the Dodd-Frank Act, the SEC was charged with considering whether broker-dealers should be subject to a standard of care similar to the fiduciary standard applicable to registered investment advisors. It is not clear whether the SEC will determine that a heightened standard of conduct is appropriate for broker-dealers; however, any such standard, if mandated, would likely require us to review our product and service offerings and implement certain changes, as well as require that we incur additional regulatory costs in order to ensure compliance.
In addition, U.S. and foreign governments have recently taken regulatory actions impacting the investment management industry, and may continue to take further actions, including expanding current (or enacting new) standards, requirements and rules that may be applicable to us and our subsidiaries. For example, several states and municipalities in the United States have adopted “pay-to-play” rules, which could limit our ability to charge advisory fees. Such “pay-to-play” rules could affect the profitability of that portion of our business. Additionally, the use of “soft dollars,” where a portion of commissions paid to broker-dealers in connection with the execution of trades also pays for research and other services provided to advisors, is periodically reexamined and may be limited or modified in the future. A substantial portion of the research relied on by our investment management business in the investment decision making process is generated internally by our investment analysts and external research, including external research paid for with soft dollars. This external research generally is used for information gathering or verification purposes, and includes broker-provided research, as well as third-party provided databases and research services. If the use of soft dollars is limited, we may have to bear some of these additional costs. Furthermore, new regulations regarding the management of hedge funds and the use of certain investment products may impact our asset management business and result in increased costs. For example, many regulators around the world adopted disclosure and reporting requirements relating to the hedge fund business or other businesses, and changes to the laws, rules and regulations in the U.S. related to the over-the-counter swaps and derivatives markets require additional registration, record keeping and reporting obligations.
26
RAYMOND JAMES FINANCIAL, INC. AND SUBSIDIARIES
Failure to comply with regulatory capital requirements primarily applicable to RJF, RJ Bank or our broker-dealer subsidiaries would significantly harm our business.
RJF and RJ Bank are subject to various regulatory and capital requirements administered by various federal regulators in the United States and, accordingly, must meet specific capital guidelines that involve quantitative measures of RJF and RJ Bank’s assets, liabilities and certain off-balance sheet items, as calculated under regulatory accounting practices. The capital amounts and classification for both RJF and RJ Bank are also subject to qualitative judgments by U. S. federal regulators based on components of our capital, risk-weightings of assets, off-balance sheet transactions, and other factors. Quantitative measures established by regulation to ensure capital adequacy require RJF and RJ Bank to maintain minimum amounts and ratios of Common Equity Tier 1, Tier 1 and Total capital to risk-weighted assets, Tier 1 capital to average assets and capital conservation buffers (as defined in the regulations). Failure to meet minimum capital requirements can trigger certain mandatory (and potentially additional discretionary) actions by regulators that, if undertaken, could harm either RJF or RJ Bank’s operations and financial condition. As more fully discussed in Item 1, “Regulation,” in this report, RJF and RJ Bank are required to perform annual stress tests using certain scenarios provided by the Fed. While we believe that both the quality and size of our capital base is sufficient to support our current operations given our risk profile, the results of the stress testing process may affect our approach to managing and deploying capital.
We are subject to the SEC’s uniform net capital rule (Rule 15c3-1) and FINRA’s net capital rule, which may limit our ability to make withdrawals of capital from our broker-dealer subsidiaries. The uniform net capital rule sets the minimum level of net capital that a broker-dealer must maintain and also requires that a portion of its assets be relatively liquid. FINRA may prohibit a member firm from expanding its business or paying cash dividends if resulting net capital falls below certain thresholds. In addition, our Canada-based broker-dealer subsidiary is subject to similar limitations under applicable regulation in that jurisdiction by IIROC. Regulatory capital requirements applicable to some of our significant subsidiaries may impede access to funds that RJF needs to make payments on any such obligations.
See
Note 21
of the Notes to Consolidated Financial Statements in this Form 10-K for further information on regulations and capital requirements.
The Basel III regulatory capital standards impose additional capital and other requirements on us that could decrease our profitability.
In July 2013, the Fed, the OCC and the FDIC released final U.S. Basel III Rules, which implemented the global regulatory capital reforms of Basel III and certain changes required by the Dodd-Frank Act. The U.S. Basel III Rules increase the quantity and quality of regulatory capital, establish a capital conservation buffer and make selected changes to the calculation of risk-weighted assets. We became subject to the requirements under the final U.S. Basel III Rules as of January 1, 2015, subject to a phase-in period for several of its provisions, including the new minimum capital ratio requirements, the capital conservation buffer and the regulatory capital adjustments and deductions. The increased capital requirements stipulated under the U.S. Basel III Rules could restrict our ability to grow during favorable market conditions or require us to raise additional capital. As a result, our business, results of operations, financial condition and prospects could be adversely affected.
As a financial holding company, RJF’s liquidity depends on payments from its subsidiaries, which may be subject to regulatory restrictions.
RJF is a financial holding company and therefore depends on dividends, distributions and other payments from its subsidiaries in order to meet its obligations, including its debt service obligations. RJF’s subsidiaries are subject to laws and regulations that restrict dividend payments or authorize regulatory bodies to prevent or reduce the flow of funds from those subsidiaries to RJF. RJF’s broker-dealers and bank subsidiary are limited in their ability to lend or transact with affiliates and are subject to minimum regulatory capital and other requirements, as well as limitations on their ability to use funds deposited with them in broker or bank accounts to fund their businesses. These requirements may hinder RJF’s ability to access funds from its subsidiaries. RJF may also become subject to a prohibition or limitations on its ability to pay dividends or repurchase its common stock. The federal banking regulators, including the OCC, the Fed and the FDIC, as well as the SEC (through FINRA) have the authority and under certain circumstances, the obligation, to limit or prohibit dividend payments and stock repurchases by the banking organizations they supervise, including RJF and its bank subsidiaries. See Item 7, “Management’s Discussion and Analysis of Financial Condition and Results of Operations - Liquidity and Capital Resources” in this report for additional information on liquidity and how we manage our liquidity risk.
27
RAYMOND JAMES FINANCIAL, INC. AND SUBSIDIARIES
RJ Bank is subject to the Community Reinvestment Act and fair lending laws, and failure to comply with these laws could lead to penalties.
The CRA, the Equal Credit Opportunity Act, the Fair Housing Act and other U.S. federal fair lending laws and regulations impose nondiscriminatory lending requirements on financial institutions. The U.S. Department of Justice and other federal agencies, including the CFPB, are responsible for enforcing these laws and regulations. A successful challenge to an institution’s performance under the CRA or fair lending laws and regulations could result in a wide variety of sanctions, including the required payment of damages and civil monetary penalties, injunctive relief, and the imposition of restrictions on mergers, acquisitions and expansion activity. Private parties may also have the ability to challenge a financial institution’s performance under fair lending laws by bringing private class action litigation.
Item 1B.
UNRESOLVED STAFF COMMENTS
Not applicable.
Item 2.
PROPERTIES
The RJF and RJ Bank corporate headquarters are located on land we own that is located within the Carillon Office Park in St. Petersburg, Florida. This office complex currently includes buildings which provide approximately 1.25 million square feet of office space. Our current office space provides us the capacity we need to support our expected growth for several years, however, we also have the necessary rights to add approximately 440,000 square feet of new office space on our existing land within the Carillon Office Park. Additionally, we own approximately 65 acres of land located in Pasco County, Florida for future development and occupancy as needed. To facilitate certain storage needs, we lease warehouse space near our headquarters complex.
We conduct employee-based branch office operations in various locations throughout the U.S. and in certain foreign countries. RJ&A branches are leased from third parties under leases that contain various expiration dates through fiscal year 2028, with the exception of one company-owned RJ&A branch located in Crystal River, Florida. Leases for branch offices of RJFS, the independent contractors of RJ Ltd. and Raymond James Investment Services Limited (“RJIS”) are the responsibility of the respective independent contractor financial advisors.
We conduct certain operations from our office building located on land we own in Southfield, Michigan (approximately 88,000 square feet) and operate an information technology data center on land we own in the Denver, Colorado area (approximately 40,000 square feet). We also conduct certain operations in leased office space (approximately 186,000 square feet) in the Raymond James Tower located in downtown Memphis, Tennessee.
RJ Ltd. leases its main office premises in Vancouver, Calgary, Toronto, and Montreal, as well as certain branch offices located throughout Canada. These leases have various expiration dates through fiscal year 2031. RJ Ltd. does not own any land or buildings.
See
Note 17
of the Notes to Consolidated Financial Statements in this Form 10-K for further information on our lease commitments.
|
Item 3.
|
LEGAL PROCEEDINGS
|
In addition to the matters specifically described below, in the normal course of our business, we have been named, from time to time, as a defendant in various legal actions, including arbitrations, class actions and other litigation, arising in connection with our activities as a diversified financial services institution.
We are also subject, from time to time, to other reviews, investigations and proceedings (both formal and informal) by governmental and self-regulatory agencies regarding our business. Such proceedings may involve, among other things, our sales and trading activities, financial products or offerings we sponsored, underwrote or sold, and operational matters. Some of these proceedings have resulted, and may in the future result, in adverse judgments, settlements, fines, penalties, injunctions or other relief and/or require us to undertake remedial actions.
We cannot predict if, how or when such proceedings or investigations will be resolved or what the eventual settlement, fine, penalty or other relief, if any, may be. A large number of factors may contribute to this inherent unpredictability: the proceeding is in its early stages; the damages sought are unspecified, unsupported or uncertain; it is unclear whether a case brought as a class action will be allowed to proceed on that basis; the other party is seeking relief other than or in addition to compensatory damages (including, in the case of regulatory and governmental proceedings, potential fines and penalties); the matters present significant legal uncertainties; we
28
RAYMOND JAMES FINANCIAL, INC. AND SUBSIDIARIES
have not engaged in settlement discussions; discovery is not complete; there are significant facts in dispute; and numerous parties are named as defendants (including where it is uncertain how liability might be shared among defendants).
We contest liability and/or the amount of damages, as appropriate, in each pending matter. Over the last several years, the level of litigation and investigatory activity (both formal and informal) by government and self-regulatory agencies has increased significantly in the financial services industry. While we have identified below certain proceedings that we believe could be material, individually or collectively, there can be no assurance that material losses will not be incurred from claims that have not yet been asserted or are not yet determined to be material.
We include in some of the descriptions of individual matters below certain quantitative information about the plaintiff’s claim against us as alleged in the plaintiff’s pleadings or other public filings. Although this information may provide insight into the potential magnitude of a matter, it does not represent our estimate of reasonably possible loss or our judgment as to any currently appropriate accrual related thereto.
Subject to the foregoing, we believe, after consultation with counsel and consideration of the accrued liability amounts included in the accompanying consolidated financial statements, that the outcome of such litigation and regulatory proceedings will not have a material adverse effect on our consolidated financial condition. However, the outcome of such litigation and proceedings could be material to our operating results and cash flows for a particular future period, depending on, among other things, our revenues or income for such period.
See
Note 17
of the Notes to Consolidated Financial Statements in this Form 10-K for additional information regarding legal and regulatory matter contingencies, and refer to the “loss provisions arising from legal and regulatory matters” section of Critical Accounting Estimates in Part II - Item 7 of this report, and
Note 2
of the Notes to Consolidated Financial Statements in this Form 10-K, for information on our criteria for establishing accruals.
Jay Peak Litigation
We were named defendants in various lawsuits related to an alleged fraudulent scheme conducted by Ariel Quiros (“Quiros”) and William Stenger involving the misuse of EB-5 visa program investor funds in connection with the Jay Peak ski resort in Vermont and associated limited partnerships (“Jay Peak”). Plaintiffs alleged that Quiros misused $200 million from the limited partnerships and misappropriated $50 million for his personal benefit. There were six civil court actions in which the plaintiffs variously demanded, among other things, compensatory damages, treble damages under the Racketeer Influenced and Corrupt Organizations Act (“RICO”) and punitive damages.
On April 13, 2017, RJA entered into an agreement regarding a proposed final, comprehensive settlement of all past, present and future investor claims against us relating to the Jay Peak matters. Under the agreement, we paid to the SEC-appointed receiver for the Jay Peak entities an aggregate of $150 million, which included $4.5 million previously paid in our settlement with the State of Vermont. On June 30, 2017, the court issued a final order approving the proposed settlement agreement and barring all existing or potential future claims against us (other than by governmental bodies or agencies) for any actions or damages associated with the Jay Peak matters. The time period for appealing this final order expired on August 29, 2017, and the final order was not appealed.
Morgan Keegan Litigation
Indemnification from Regions
Under the agreement with Regions governing our 2012 acquisition of Morgan Keegan, Regions is obligated to indemnify us for losses we may incur in connection with any Morgan Keegan legal proceedings pending as of the closing date for that transaction (which was April 2, 2012), or commenced after the closing date but related to pre-closing matters that were received prior to April 2, 2015.
Pending Morgan Keegan matter (subject to indemnification)
In July 2006, Morgan Keegan & Company, Inc., a Morgan Keegan affiliate, and one of its former analysts were named as defendants in a lawsuit filed by Fairfax Financial Holdings Limited and an affiliate in the Superior Court of New Jersey, Law Division, in Morris County, New Jersey. Plaintiffs made claims under a civil RICO statute, for commercial disparagement, tortious interference with contractual relationships, tortious interference with prospective economic advantage and common law conspiracy. Plaintiffs alleged that defendants engaged in a multi-year conspiracy to publish and disseminate false and defamatory information about plaintiffs in order to improperly drive down the stock price of Fairfax, so that others could profit from short positions. Plaintiffs alleged that the defendants’ actions disparaged them and harmed their business relationships. Plaintiffs further alleged various categories of damages, including lost insurance business, losses on stock and bond offerings, reputational loss, increased audit fees and directors’ and officers’
29
RAYMOND JAMES FINANCIAL, INC. AND SUBSIDIARIES
insurance premiums, and lost acquisitions. They requested actual and punitive damages and treble damages under their RICO claims. On May 11, 2012, the trial court dismissed the plaintiffs’ RICO claims. On June 27, 2012, the trial court dismissed plaintiffs’ tortious interference with prospective relations claim, but allowed the other claims to go forward. Prior to commencement of a jury trial, the court dismissed the remaining claims with prejudice, and the plaintiffs appealed. On April 27, 2017, the Superior Court of New Jersey, Appellate Division, affirmed the trial court's dismissal of certain claims against Morgan Keegan, including the RICO allegations, while remanding to the trial court the claims of disparagement, tortious interference with prospective business relations, and civil conspiracy, and limiting the actual damages to certain lost insurance business. Plaintiffs petitioned the Supreme Court of New Jersey for review of the Appellate Division’s opinion, but on October 17, 2017, the Supreme Court of New Jersey denied the petition.
Item 4.
MINE SAFETY DISCLOSURES
Not applicable.
|
Item 5.
|
MARKET FOR REGISTRANT’S COMMON EQUITY, RELATED SHAREHOLDER MATTERS AND ISSUER PURCHASES OF EQUITY SECURITIES
|
Our common stock is traded on the NYSE under the symbol “RJF.” As of
November 16, 2017
, we had 361 holders of record of our common stock. Shares of our common stock are held by a substantially greater number of beneficial owners, whose shares are held of record by banks, brokers, and other financial institutions.
The following table sets forth for the periods indicated the high and low trades for our common stock:
|
Fiscal year
|
|||||||||||||||
|
2017
|
2016
|
||||||||||||||
|
High
|
Low
|
High
|
Low
|
||||||||||||
|
First quarter
|
$
|
74.70
|
|
$
|
56.61
|
|
$
|
59.81
|
|
$
|
45.86
|
|
|||
|
Second quarter
|
$
|
81.92
|
|
$
|
69.09
|
|
$
|
56.68
|
|
$
|
39.84
|
|
|||
|
Third quarter
|
$
|
82.59
|
|
$
|
71.35
|
|
$
|
56.69
|
|
$
|
44.22
|
|
|||
|
Fourth quarter
|
$
|
85.97
|
|
$
|
74.81
|
|
$
|
58.97
|
|
$
|
46.30
|
|
|||
Cash dividends per share of common stock paid during the quarter are reflected below. The dividends were declared during the quarter preceding their payment.
|
Fiscal year
|
|||||||
|
2017
|
2016
|
||||||
|
First quarter
|
$
|
0.20
|
|
$
|
0.18
|
|
|
|
Second quarter
|
$
|
0.22
|
|
$
|
0.20
|
|
|
|
Third quarter
|
$
|
0.22
|
|
$
|
0.20
|
|
|
|
Fourth quarter
|
$
|
0.22
|
|
$
|
0.20
|
|
|
On August 23, 2017, our Board of Directors declared a quarterly cash dividend of $0.22 per share of common stock which was paid on October 16, 2017.
See
Note 21
of the Notes to Consolidated Financial Statements in this Form 10-K for information regarding our intentions for paying cash dividends and the related capital restrictions.
30
RAYMOND JAMES FINANCIAL, INC. AND SUBSIDIARIES
We purchase our own stock from time to time in conjunction with a number of activities, each of which is described below. The following table presents information on our purchases of our own stock, on a monthly basis, for the twelve month period ended
September 30, 2017
:
|
|
Total number of shares
purchased
|
Average price
per share
|
Number of shares purchased as part of publicly announced plans or programs
|
Approximate dollar value (in thousands) at each month-end, of securities that may yet be purchased under the plans or programs
|
|||||||||
|
October 1, 2016 – October 31, 2016
|
13,245
|
|
$
|
60.46
|
|
—
|
|
$
|
135,671
|
|
|||
|
November 1, 2016 – November 30, 2016
|
157,010
|
|
$
|
73.12
|
|
—
|
|
$
|
135,671
|
|
|||
|
December 1, 2016 – December 31, 2016
|
189,500
|
|
$
|
72.70
|
|
—
|
|
$
|
135,671
|
|
|||
|
First quarter
|
359,755
|
|
$
|
72.43
|
|
—
|
|
||||||
|
January 1, 2017 – January 31, 2017
|
15,096
|
|
$
|
71.28
|
|
—
|
|
$
|
135,671
|
|
|||
|
February 1, 2017 – February 28, 2017
|
15,251
|
|
$
|
79.33
|
|
—
|
|
$
|
135,671
|
|
|||
|
March 1, 2017 – March 31, 2017
|
9,077
|
|
$
|
79.13
|
|
—
|
|
$
|
135,671
|
|
|||
|
Second quarter
|
39,424
|
|
$
|
76.20
|
|
—
|
|
||||||
|
April 1, 2017 – April 30, 2017
|
29,329
|
|
$
|
74.14
|
|
—
|
|
$
|
135,671
|
|
|||
|
May 1, 2017 – May 31, 2017
|
5,408
|
|
$
|
73.94
|
|
—
|
|
$
|
135,671
|
|
|||
|
June 1, 2017 – June 30, 2017
|
7,128
|
|
$
|
76.16
|
|
—
|
|
$
|
135,671
|
|
|||
|
Third quarter
|
41,865
|
|
$
|
74.46
|
|
—
|
|
||||||
|
July 1, 2017 – July 31, 2017
|
142
|
|
$
|
80.95
|
|
—
|
|
$
|
135,671
|
|
|||
|
August 1, 2017 – August 31, 2017
|
22,464
|
|
$
|
78.91
|
|
—
|
|
$
|
135,671
|
|
|||
|
September 1, 2017 – September 30, 2017
|
1,203
|
|
$
|
76.08
|
|
—
|
|
$
|
135,671
|
|
|||
|
Fourth quarter
|
23,809
|
|
$
|
78.78
|
|
—
|
|
||||||
|
Fiscal year total
|
464,853
|
|
$
|
73.26
|
|
—
|
|
||||||
Of the total for the
year ended September 30, 2017
, share purchases for the trust fund established to acquire our common stock in the open market and used to settle restricted stock units granted as a retention vehicle for certain employees of our wholly owned Canadian subsidiaries approximated 77 thousand shares, for a total consideration of $6 million (for more information on this trust fund, see
Note 2
and
Note 10
of the Notes to Consolidated Financial Statements in this Form 10-K). These activities do not utilize the repurchase authority presented in the table above.
We also repurchase shares when employees surrender shares as payment for option exercises or withholding taxes. Of the total for the
year ended September 30, 2017
, shares surrendered to us by employees for such purposes approximated 388 thousand shares, for a total consideration of $28 million. These activities do not utilize the repurchase authority presented in the table above.
31
RAYMOND JAMES FINANCIAL, INC. AND SUBSIDIARIES
|
Item 6.
|
SELECTED FINANCIAL DATA
|
|
Year ended September 30,
|
||||||||||||||||||||
|
$ in thousands, except per share amounts
|
2017
|
2016
|
2015
|
2014
|
2013
|
|||||||||||||||
|
Operating results:
|
||||||||||||||||||||
|
Total revenues
|
$
|
6,524,875
|
|
$
|
5,521,120
|
|
$
|
5,309,680
|
|
$
|
4,964,128
|
|
$
|
4,594,305
|
|
|||||
|
Net revenues
|
$
|
6,371,097
|
|
$
|
5,405,064
|
|
$
|
5,203,606
|
|
$
|
4,861,924
|
|
$
|
4,487,893
|
|
|||||
|
Net income attributable to Raymond James Financial, Inc.
|
$
|
636,235
|
|
$
|
529,350
|
|
$
|
502,140
|
|
$
|
480,248
|
|
$
|
367,154
|
|
|||||
|
Earnings per common share - basic
|
$
|
4.43
|
|
$
|
3.72
|
|
$
|
3.51
|
|
$
|
3.41
|
|
$
|
2.64
|
|
|||||
|
Earnings per common share - diluted
|
$
|
4.33
|
|
$
|
3.65
|
|
$
|
3.43
|
|
$
|
3.32
|
|
$
|
2.58
|
|
|||||
|
Weighted-average common shares outstanding - basic
|
143,275
|
|
141,773
|
|
142,548
|
|
139,935
|
|
137,732
|
|
||||||||||
|
Weighted-average common and common equivalent shares outstanding - diluted
|
146,647
|
|
144,513
|
|
145,939
|
|
143,589
|
|
140,541
|
|
||||||||||
|
Cash dividends per common share - declared
|
$
|
0.88
|
|
$
|
0.80
|
|
$
|
0.72
|
|
$
|
0.64
|
|
$
|
0.56
|
|
|||||
|
Financial condition:
|
||||||||||||||||||||
|
Total assets
|
$
|
34,883,456
|
|
$
|
31,486,976
|
|
$
|
26,325,850
|
|
$
|
23,135,343
|
|
$
|
22,965,444
|
|
|||||
|
Senior notes payable maturing within twelve months
|
$
|
—
|
|
$
|
—
|
|
$
|
250,000
|
|
$
|
—
|
|
$
|
—
|
|
|||||
|
Long-term obligations:
|
||||||||||||||||||||
|
Non-current portion of other borrowings
|
$
|
898,967
|
|
$
|
604,080
|
|
$
|
583,740
|
|
$
|
537,932
|
|
$
|
47,132
|
|
|||||
|
Non-current portion of senior notes payable
|
$
|
1,550,000
|
|
$
|
1,700,000
|
|
$
|
900,000
|
|
$
|
1,150,000
|
|
$
|
1,150,000
|
|
|||||
|
Total long-term debt
|
$
|
2,448,967
|
|
$
|
2,304,080
|
|
$
|
1,483,740
|
|
|
$
|
1,687,932
|
|
$
|
1,197,132
|
|
||||
|
Total equity attributable to Raymond James Financial, Inc.
|
$
|
5,581,713
|
|
$
|
4,916,545
|
|
$
|
4,524,481
|
|
$
|
4,143,686
|
|
$
|
3,665,373
|
|
|||||
|
Shares outstanding
|
144,097
|
|
141,545
|
|
142,751
|
|
140,836
|
|
138,750
|
|
||||||||||
|
Book value per share
|
$
|
38.74
|
|
$
|
34.73
|
|
$
|
31.69
|
|
$
|
29.42
|
|
$
|
26.42
|
|
|||||
As a result of our October 1, 2016 adoption of the new consolidation guidance, we deconsolidated a number of tax credit fund variable interest entities (“VIEs”) that had been previously consolidated. We determined that under the new guidance, we are no longer deemed to be the primary beneficiary of these VIEs. We applied the new consolidation guidance on the full retrospective basis, meaning that we have reflected the adjustments arising from this adoption as of the beginning of our earliest comparative period presented. There was no net income impact on our Consolidated Statements of Income and Comprehensive Income for the prior year periods as the net changes in revenues, interest and other expenses were offset by the impact of the deconsolidation on the net income/(loss) attributable to noncontrolling interests. See Note
2
in the Notes to the Consolidated Financial Statements for additional information.
Senior notes maturing within twelve months and the non-current portion of senior notes payable excludes the impact of debt issuance costs.
32
RAYMOND JAMES FINANCIAL, INC. AND SUBSIDIARIES
|
Item 7.
|
MANAGEMENT’S DISCUSSION AND ANALYSIS OF FINANCIAL CONDITION AND RESULTS OF OPERATIONS
|
|
INDEX
|
|
|
|
PAGE
|
|
Introduction
|
|
|
Executive overview
|
|
|
Segments
|
|
|
Reconciliation of GAAP measures to non-GAAP measures
|
|
|
Net interest analysis
|
|
|
Results of Operations
|
|
|
Private Client Group
|
|
|
Capital Markets
|
|
|
Asset Management
|
|
|
Raymond James Bank
|
|
|
Other
|
|
|
Certain statistical disclosures by bank holding companies
|
|
|
Liquidity and Capital Resources
|
|
|
Sources of Liquidity
|
|
|
Statement of financial condition analysis
|
|
|
Contractual obligations
|
|
|
Regulatory
|
|
|
Critical accounting estimates
|
|
|
Recent accounting developments
|
|
|
Off-Balance sheet arrangements
|
|
|
Effects of inflation
|
|
|
Risk Management
|
|
33
Introduction
The following Management’s Discussion and Analysis (“MD&A”) is intended to help the reader understand the results of our operations and financial condition. This MD&A is provided as a supplement to, and should be read in conjunction with, our consolidated financial statements and accompanying notes to consolidated financial statements. Where “NM” is used in various percentage change computations, the computed percentage change has been determined not to be meaningful.
Executive overview
We operate as a financial holding company and bank holding company. Results in the businesses in which we operate are highly correlated to the general overall strength of economic conditions and, more specifically, to the direction of the U.S. equity and fixed income markets, market volatility, the corporate and mortgage lending markets and commercial and residential credit trends. Overall market conditions, interest rates, economic, political and regulatory trends, and industry competition are among the factors which could affect us and which are unpredictable and beyond our control. These factors affect the financial decisions made by market participants which include investors, borrowers, and competitors, impacting their level of participation in the financial markets. These factors also impact the level of investment banking activity, including public offerings, as well as trading profits, and asset valuations, or a combination thereof. In turn, these decisions and factors affect our business results.
Year ended
September 30, 2017
compared with the year ended
September 30, 2016
We achieved net revenues of
$6.37 billion
, a
$966 million
, or
18%
increase. Our pre-tax income amounted to
$925 million
, an
increase
of
$125 million
, or
16%
. Our net income of
$636 million
increased
$107 million
, or
20%
, and our earnings per diluted share were
$4.33
, a
19%
increase.
During the year ended
September 30, 2017
, earnings were impacted negatively by the Jay Peak settlement, losses on the early extinguishment of certain of our senior notes and acquisition-related expenses. After excluding the impact of these expenses, which totaled
$194 million
in the current year on a pre-tax basis, our adjusted pre-tax income was
$1.12 billion
,
(1)
an increase of 30% compared with adjusted pre-tax income in the prior year, and adjusted net income was
$768 million
,
(1)
an increase of 35% compared with adjusted net income in the prior year. Adjusted earnings per diluted share were
$5.23
,
(1)
a 33% increase compared with adjusted earnings per diluted share in the prior year.
Net revenues increased in each of our four operating segments, including significant growth in the Private Client Group (“PCG”) and Asset Management segments, which benefited from growth in client assets in fee-based accounts, and significant growth in RJ Bank due to an increase in average interest-earning assets and an increase in net interest margin. Investment banking revenues in our Capital Markets segment were strong and were significantly higher than fiscal year 2016; however institutional sales commissions declined reflecting the low levels of market volatility. Total client assets under administration reached $692.9 billion at September 30, 2017, a 15% increase, primarily attributable to strong financial advisor recruiting and retention results and equity market appreciation.
Non-interest expenses increased
$850 million
, or
19%
. The increase primarily resulted from increased compensation, commissions and benefits expenses, primarily associated with increased revenues and income, as well as increased staffing levels required to support our continued growth, and increased regulatory and compliance requirements. We also had losses on the early extinguishment of certain senior notes and increased legal expenses during the year for the Jay Peak settlement.
Our effective tax rate was 31.2% in the current year, down from the 33.9% for the prior year. The decrease in our effective tax rate compared to the prior year was primarily due to the favorable impact of the adoption of new stock compensation accounting guidance which had a favorable impact on our effective tax rate of 2.7% and our provision for taxes of $25 million (see
Note 2
and
Note 20
of the Notes to Consolidated Financial Statements in this Form 10-K for additional information). Also contributing to the decrease was a favorable impact of 1.7% due to the increase in the amount of nontaxable gains arising from the value of our company-owned life insurance portfolio as a result of an increase in equity market values, compared to a 1.1% favorable impact in the prior year.
Both the U.S. Senate and the U.S. House of Representatives have recently introduced versions of income tax reform, which would have significant impacts on the federal tax code. These proposals contain several corporate income tax provisions, including a corporate tax rate reduction from 35 percent to 20 percent which would prospectively benefit our effective tax rate following enactment. Depending on the scope of any enacted legislation, there could also be a significant negative impact on our results in the period of enactment, primarily due to the potential remeasurement of U.S. deferred tax balances at lower corporate enacted tax rates and a repatriation tax, if any, on deemed repatriated earnings from foreign subsidiaries.
|
(1)
|
“Adjusted pre-tax income,” “adjusted net income,” and “adjusted earnings per diluted share” are each non-GAAP financial measures. Please see the “reconciliation of GAAP measures to non-GAAP measures” in this Item 2, for a reconciliation of our non-GAAP measures to the most directly comparable GAAP measures, and for other important disclosures.
|
34
A summary of our financial results by segment as compared to the prior year are as follows:
|
•
|
Our Private Client Group segment generated net revenues of
$4.42 billion
, a
22%
increase, while pre-tax income
increased
10%
to
$373 million
. The increase in net revenues was primarily attributable to an increase in securities commissions and fees, driven by strong recruiting results, the acquisitions of Alex. Brown and 3Macs in late fiscal 2016 and a stronger market environment compared to the prior year. The segment also benefited from the impact of higher short-term interest rates, resulting in increases in fees related to our RJ Bank Deposit Program (“RJBDP”) and interest income. Non-interest expenses
increased
$773 million
, or
24%
, primarily resulting from an increase in sales commission expense, increased legal expenses related to the Jay Peak settlement and increased administrative & incentive compensation and benefits expense.
|
|
•
|
The Capital Markets segment generated net revenues of
$1.01 billion
, a
1%
increase, while pre-tax income also
increased
1%
to
$141 million
. The increase in net revenues was primarily due to an increase in merger & acquisition and advisory fee revenues and equity underwriting fees, partially offset by a decline in institutional sales commissions and trading profits, reflecting lower levels of volatility, and a decline in tax credit funds syndication revenues resulting from uncertainty over corporate tax reform. Non-interest expenses
increased
$16 million
, or
2%
, primarily resulting from an increase in incentive compensation and benefits expense largely related to improved investment banking results.
|
|
•
|
Our Asset Management segment benefited from increased fee-based client assets, generating a
21%
increase in net revenues to
$488 million
, while pre-tax income
increased
30%
to
$172 million
. The increase in net revenues primarily reflected increases in advisory fee revenues from managed programs and in non-discretionary asset-based administration fee revenues as financial assets under management in managed programs and assets held in non-discretionary asset-based programs increased 25% and 32%, respectively over the prior year level. Non-interest expenses
increased
$42 million
, or
16%
, primarily resulting from increased investment sub-advisory fees and growth-related increases in administrative & incentive compensation and benefits expense.
|
|
•
|
RJ Bank generated a
20%
increase in net revenues to
$593 million
, while pre-tax income
increased
21%
to
$409 million
. The increase in pre-tax income resulted primarily from an increase in net interest income and a decrease in the provision for loan losses, partially offset by higher affiliate deposit fees paid to the Private Client Group due to an increase in client account balances. Net interest income
increased
due to both growth in average interest-earning assets and an increase in the net interest margin which benefited from the impact of higher short-term interest rates.
|
|
•
|
Activities in our Other segment generated a pre-tax loss that is
$21 million
, or
14%
more than the prior year, primarily due to the losses on the early extinguishment of certain senior notes payable, combined with higher interest expense related to a higher average balance of our senior notes payable for the fiscal year. Total revenues in the segment
increased
$19 million
, or
41%
, primarily due to higher net valuation gains from our private equity portfolio and an increase in interest income due to increased short-term interest rates and higher corporate cash balances.
|
Consistent with our growth strategies, in April 2017 we announced we had entered into a definitive agreement to acquire
100%
of the outstanding shares of Scout Investments, Inc. (the “Scout Group”), an asset management and distribution entity, from UMB Financial Corporation. The Scout Group includes Scout Investments (“Scout”) and its Reams Asset Management division (“Reams”), as well as Scout Distributors. The addition of Scout, an equity asset manager, and Reams, an institutional-focused fixed income specialist, broadens the investment solutions available to our clients. The Scout Group was included in our Asset Management segment upon completion of this acquisition, which occurred November 17, 2017.
Year ended
September 30, 2016
compared with the year ended
September 30, 2015
We achieved net revenues in fiscal year 2016 of $5.41 billion, a $201 million, or 4% increase over fiscal year 2015. Our fiscal year 2016 net income of $529 million reflected an increase of $27 million, or 5%, and our diluted earnings per share amounted to $3.65, a 6% increase. The fiscal year 2016 diluted earnings per share benefited from our repurchase of common stock in open market transactions. Total client assets under administration increased to $604.4 billion at September 30, 2016, a 26% increase over the fiscal year 2015 level. The increase in assets under administration was attributable to our acquisitions of Alex. Brown and 3Macs, strong financial advisor recruiting results, high levels of retention of our existing financial advisors, and an increase in U.S. equity markets over the year.
After excluding the fiscal year 2016 impact of acquisition-related expenses and legal reserves for the Jay Peak matter, our adjusted net income amounted to $569 million
(1)
and adjusted diluted earnings per share amounted to $3.93
(1)
.
(1) “Adjusted net income,” and “adjusted diluted earnings per share” are each non-GAAP financial measures. Please see the “reconciliation of GAAP measures to non-GAAP measures” in this Item 7, for a reconciliation of our non-GAAP measures to the most directly comparable GAAP measures, and for other important disclosures.
35
Fiscal year 2016 net revenues increased in each of our four operating segments as compared to fiscal year 2015. Our non-operating Other segment reflected a decline in net revenues as fiscal year 2015 experienced higher valuation gains from our private equity investments than fiscal year 2016, as well as realized gains on sales of our auction rate securities (“ARS”). Non-interest expenses increased $204 million, or 5%. The increase primarily resulted from: increases in compensation, commissions and benefits due to annual raises, growth in related securities commissions and fee revenues, and increases in benefits expenses; increases in communications and information processing expenses resulting from our continued investment in our PCG platform and in improving our compliance and regulatory systems; an increase in the bank loan loss provision resulting from loan growth and an increase associated with the credit deterioration of certain loans in the energy sector; and increases in other expenses predominately due to increases in certain legal and regulatory expenses during fiscal year 2016.
A summary of the most significant items impacting our fiscal year 2016 financial results as compared to the prior year are as follows:
|
•
|
Our Private Client Group segment generated fiscal year 2016 net revenues of $3.62 billion, a 3% increase, while pre-tax income decreased by $2 million to $341 million. The increase in net revenues was primarily attributable to an increase in account and service fee income, most notably an increase in fees associated with our RJBDP program resulting from both an increase in short-term interest rates, and an increase in client cash balances resulting from clients’ reaction to market volatility and uncertainty during fiscal year 2016.
|
Securities commission and fee revenues increased 1% overall. Fees arising from fee-based accounts as well as commissions on fixed income products increased substantially, more than offsetting declines in commissions on mutual funds, equity securities and new issue sales credits. Non-interest expenses increased compared to the fiscal year 2015 levels, most significantly due to higher administrative expenses to support our continued growth, higher communications and information technology expenses resulting from our continued investments in our platform and in improving our compliance and regulatory systems, and expenses related to the Jay Peak matter.
|
•
|
The Capital Markets segment generated fiscal year 2016 net revenues of $1.00 billion, a 4% increase, while pre-tax income increased by 30% to $139 million. The fiscal year 2016 increase in net revenues was driven by an increase in trading profits, sales commissions on fixed income products and an increase in tax credit fund syndication fee revenues, offset by declines in equity underwriting fees and merger & acquisition and advisory fee revenues. Non-interest expenses increased a modest 1% over the fiscal year 2015 level.
|
|
•
|
Our Asset Management segment generated net revenues of $404 million, a 3% increase, while pre-tax income decreased by 2% to $132 million in fiscal year 2016. Non-discretionary asset-based administration fee revenues increased, driven by an increase in assets held in these programs. Investment advisory fee revenues from managed programs approximated the fiscal year 2015 level despite the increase in balances of financial assets under management as of September 30, 2016 due to the volatility of markets during fiscal year 2016 and the timing of our fee computations. Expenses increased 6% in fiscal year 2016 due, in large part, to the fiscal year 2015 reversal of certain incentive compensation expense accruals for associates who left the firm.
|
|
•
|
RJ Bank generated fiscal year 2016 net revenues of $494 million, a 19% increase, while pre-tax income increased by 21% to $337 million. The loan loss provision increased nearly $5 million, or 20% over the fiscal year 2015 level due to higher corporate loan growth, charges resulting from loans outstanding within the energy sector, and additional provision for corporate loan downgrades during fiscal year 2016. Non-interest expenses (excluding provision for loan losses) increased $16 million, or 15%, primarily due to an increase in the affiliate deposit account servicing fees paid to the Private Client Group resulting from an increase in client account balances, as well as an increase in FDIC insurance premiums.
|
|
•
|
Activities in our Other segment during fiscal year 2016 reflect a pre-tax loss that was $84 million, or 129%, more than the prior year. Total revenues in the segment decreased $21 million, or 31%, primarily resulting from a decrease in private equity valuation gains, and a decrease of $11 million in gains on the sale of certain ARS resulting from fiscal year 2015 sales that did not recur in fiscal year 2016, offset by increased interest revenue and foreign exchange gains. Acquisition-related expenses of $41 million for fiscal year 2016 did not occur in fiscal year 2015, and resulted from incremental expenses related to our acquisitions of Alex. Brown, 3Macs, and Mummert during fiscal year 2016.
|
|
•
|
Our effective tax rate was 33.9% in fiscal year 2016, down from the 37.1% in the prior year. The fiscal year 2016 reduction in our effective tax rate compared to the prior year was due to the following factors: (1) as a result of the fiscal year 2016 increase in equity market values compared to fiscal year 2015, the change in the amount of our non-taxable gains/losses arising from the value of our company-owned life insurance portfolio had the effect of decreasing our effective tax rate by 1.5% compared to fiscal year 2015; (2) adjustments associated with our divestitures of our businesses in South America accounted for an effective rate decrease of 1.1%; (3) we settled significant state tax audits during the year which reduced our effective rate by 0.4%; and (4) we were able
|
36
to generate and utilize additional low-income housing tax credits to apply against our tax liability which had a favorable 0.5% impact on our effective tax rate.
|
•
|
We repurchased approximately 3.2 million shares of our common stock in open market transactions during fiscal year 2016 for a total purchase price of approximately $144.5 million, reflecting an average per share repurchase price of $45.69. The fiscal year 2016 diluted earnings per share benefited by $0.05 as a result of these repurchases.
|
Segments
The following table presents our consolidated and segment net revenues and pre-tax income/(loss), the latter excluding noncontrolling interests, for the years indicated:
|
|
Year ended September 30,
|
|||||||||||||||||
|
$ in thousands
|
2017
|
% change
|
2016
|
% change
|
2015
|
|||||||||||||
|
Total company
|
|
|
|
|||||||||||||||
|
Net revenues
|
$
|
6,371,097
|
|
18
|
%
|
$
|
5,405,064
|
|
4
|
%
|
$
|
5,203,606
|
|
|||||
|
Pre-tax income excluding noncontrolling interests
|
925,346
|
|
16
|
%
|
800,643
|
|
—
|
|
798,174
|
|
||||||||
|
Private Client Group
|
|
|
|
|
|
|
||||||||||||
|
Net revenues
|
4,421,633
|
|
22
|
%
|
3,616,479
|
|
3
|
%
|
3,507,806
|
|
||||||||
|
Pre-tax income
|
372,950
|
|
10
|
%
|
340,564
|
|
—
|
|
342,243
|
|
||||||||
|
Capital Markets
|
|
|
|
|
|
|
|
|||||||||||
|
Net revenues
|
1,013,683
|
|
1
|
%
|
1,001,716
|
|
4
|
%
|
963,431
|
|
||||||||
|
Pre-tax income
|
141,236
|
|
1
|
%
|
139,173
|
|
30
|
%
|
107,009
|
|
||||||||
|
Asset Management
|
|
|
|
|
|
|
||||||||||||
|
Net revenues
|
487,658
|
|
21
|
%
|
404,349
|
|
3
|
%
|
392,301
|
|
||||||||
|
Pre-tax income
|
171,736
|
|
30
|
%
|
132,158
|
|
(2
|
)%
|
135,050
|
|
||||||||
|
RJ Bank
|
|
|
|
|
|
|
||||||||||||
|
Net revenues
|
592,670
|
|
20
|
%
|
493,966
|
|
19
|
%
|
414,295
|
|
||||||||
|
Pre-tax income
|
409,303
|
|
21
|
%
|
337,296
|
|
21
|
%
|
278,721
|
|
||||||||
|
Other
|
|
|
|
|
|
|
||||||||||||
|
Net revenues
|
(29,870
|
)
|
6
|
%
|
(31,692
|
)
|
(211
|
)%
|
(10,198
|
)
|
||||||||
|
Pre-tax loss
|
(169,879
|
)
|
(14
|
)%
|
(148,548
|
)
|
(129
|
)%
|
(64,849
|
)
|
||||||||
|
Intersegment eliminations
|
|
|
|
|
|
|
||||||||||||
|
Net revenues
|
(114,677
|
)
|
|
|
(79,754
|
)
|
|
(64,029
|
)
|
|||||||||
37
Reconciliation of GAAP measures to non-GAAP measures
We utilize certain non-GAAP calculations as additional measures to aid in, and enhance, the understanding of our financial results and related measures. We believe that the non-GAAP measures provide useful information by excluding certain material items that may not be indicative of our core operating results. We believe that these non-GAAP measures will allow for better evaluation of the operating performance of the business and facilitate a meaningful comparison of our results in the current year to those in prior and future years. The non-GAAP financial information should be considered in addition to, not as a substitute for, measures of financial performance prepared in accordance with GAAP. In addition, our non-GAAP measures may not be comparable to similarly titled non-GAAP measures of other companies.
The following table provides a reconciliation of GAAP measures to non-GAAP measures for the periods which include non-GAAP adjustments. Non-GAAP measures for the year ended
September 30, 2016
have been revised from those previously reported to conform to our current presentation, which includes amounts related to the Jay Peak settlement.
|
Year ended September 30,
|
||||||||
|
$ in thousands, except per share amounts
|
2017
|
2016
|
||||||
|
Net Income
(1)
|
$
|
636,235
|
|
$
|
529,350
|
|
||
|
Non-GAAP adjustments:
(2)
|
||||||||
|
Acquisition-related expenses
|
17,995
|
|
40,706
|
|
||||
|
Losses on extinguishment of debt
|
45,746
|
|
—
|
|
||||
|
Jay Peak matter
|
130,000
|
|
20,000
|
|
||||
|
Sub-total pre-tax non-GAAP adjustments
|
193,741
|
|
60,706
|
|
||||
|
Tax effect of non-GAAP adjustments
|
(61,869
|
)
|
(20,570
|
)
|
||||
|
Non-GAAP adjustments, net of tax
|
131,872
|
|
40,136
|
|
||||
|
Adjusted net income
|
$
|
768,107
|
|
$
|
569,486
|
|
||
|
Pre-tax income
(1)
|
$
|
925,346
|
|
$
|
800,643
|
|
||
|
Total pre-tax non-GAAP adjustments (as detailed above)
|
193,741
|
|
60,706
|
|
||||
|
Adjusted pre-tax income
|
$
|
1,119,087
|
|
$
|
861,349
|
|
||
|
Pre-tax margin on net revenues
(3)
|
14.5
|
%
|
14.8
|
%
|
||||
|
Adjusted pre-tax margin on net revenues
(3)
|
17.6
|
%
|
15.9
|
%
|
||||
|
Earnings per common share
:
|
||||||||
|
Basic
|
$
|
4.43
|
|
$
|
3.72
|
|
||
|
Diluted
|
$
|
4.33
|
|
$
|
3.65
|
|
||
|
Adjusted earnings per common share
:
|
||||||||
|
Adjusted basic
|
$
|
5.35
|
|
$
|
4.01
|
|
||
|
Adjusted diluted
|
$
|
5.23
|
|
$
|
3.93
|
|
||
|
Average equity
(4)
|
$
|
5,235,231
|
|
$
|
4,695,588
|
|
||
|
Adjusted average equity
(4)
|
$
|
5,310,489
|
|
$
|
4,707,959
|
|
||
|
Return on equity
(5)
|
12.2
|
%
|
11.3
|
%
|
||||
|
Adjusted return on equity
(5)
|
14.5
|
%
|
12.1
|
%
|
||||
|
(1)
|
Excludes noncontrolling interests.
|
|
(2)
|
See
Note 3
for information on our acquisition-related expenses,
Note 15
for information on our extinguishment of debt and Item 3 in this Form 10-K for more information on the Jay Peak matter.
|
|
(3)
|
Computed by dividing the pre-tax income attributable to RJF by net revenues for each respective period or, in the case of adjusted pre-tax margin on net revenues, computed by dividing adjusted pre-tax income attributable to RJF by net revenues for each respective period.
|
|
(4)
|
Computed by adding the total equity attributable to RJF as of each quarter-end date during the indicated period to the beginning of the year total and dividing by five. Adjusted average equity is computed by adjusting for the impact on average equity of the non-GAAP adjustments, as applicable for each respective period.
|
|
(5)
|
Computed by dividing net income attributable to RJF by average equity for each respective period or, in the case of adjusted return on equity, computed by dividing adjusted net income attributable to RJF by adjusted average equity for each respective period.
|
38
Net interest analysis
The Federal Reserve Bank announced increases in its benchmark short-term interest rate of 25 basis points in each of June 2017, March 2017 and December 2016, as well as in December 2015. Increases in short-term interest rates such as these have a significant impact on our overall financial performance, as we have certain assets and liabilities, primarily held in our PCG and RJ Bank segments, which are sensitive to changes in interest rates. Given the relationship of our interest sensitive assets to liabilities held in each of these segments, increases in short-term interest rates result in an overall increase in our net earnings, although the impact to our net interest margin depends on the yields on interest-earning assets relative to interest-bearing liabilities.
In PCG, we also earn fees in lieu of interest income from our RJBDP, a multi-bank a sweep program in which clients’ cash deposits in their brokerage accounts are swept into interest-bearing deposit accounts at RJ Bank and various third-party banks. Such fees are recorded in “Account and service fees” in our Consolidated Statements of Income and Comprehensive Income and fluctuate based on changes in short-term interest rates relative to deposit rates paid on client cash balances. Of the total client domestic cash balances of
$43.0 billion
at
September 30, 2017
, approximately $38.1 billion was included in the RJBDP, compared with $37.7 billion of the
$43.9 billion
of total client domestic cash balances at
September 30, 2016
. While the short-term interest rate increases in 2017 had a significant impact on fees earned from our RJBDP, they have not yet had a significant impact on market deposit rates paid on client cash balances. As such, any future increases in short-term interest rates may have less of an impact or could actually reduce our fees earned in this program, depending on the level of deposit rates paid on client cash balances.
If the Federal Reserve Bank was to reverse its previous actions and decrease the benchmark short-term interest rate or if deposit rates that we pay on client cash balances increased and resulted in a decline in spreads earned on our RJBDP program, the impact on our net interest income and account and service fees would be an unfavorable reversal of the positive impact described above.
39
The following table presents our consolidated average balance, interest income and expense balances and the related yield and rates. Average balances are calculated on a daily basis unless otherwise noted.
|
|
Year ended September 30,
|
||||||||||||||||||||||||||||||||
|
|
2017
|
2016
|
2015
|
||||||||||||||||||||||||||||||
|
$ in thousands
|
Average
balance
|
Interest
inc./exp.
|
Average
yield/cost
|
Average
balance
|
Interest
inc./exp.
|
Average
yield/cost
|
Average
balance
|
Interest
inc./exp.
|
Average
yield/cost
|
||||||||||||||||||||||||
|
Interest-earning assets:
|
|
|
|
|
|
||||||||||||||||||||||||||||
|
Assets segregated pursuant to regulations and other segregated assets
|
$
|
3,250,854
|
|
$
|
37,270
|
|
1.15
|
%
|
$
|
3,565,252
|
|
$
|
22,287
|
|
0.63
|
%
|
$
|
2,498,357
|
|
$
|
13,792
|
|
0.55
|
%
|
|||||||||
|
Securities loaned
|
456,573
|
|
14,049
|
|
3.08
|
%
|
577,002
|
|
8,777
|
|
1.52
|
%
|
433,642
|
|
12,036
|
|
2.78
|
%
|
|||||||||||||||
|
Trading instruments
(1)
|
655,302
|
|
21,068
|
|
3.22
|
%
|
707,321
|
|
19,362
|
|
2.74
|
%
|
678,715
|
|
19,450
|
|
2.87
|
%
|
|||||||||||||||
|
Available-for-sale securities
|
1,588,484
|
|
27,946
|
|
1.76
|
%
|
561,925
|
|
7,596
|
|
1.35
|
%
|
508,223
|
|
5,100
|
|
1.00
|
%
|
|||||||||||||||
|
Margin loans
|
2,403,451
|
|
85,699
|
|
3.57
|
%
|
1,811,845
|
|
68,712
|
|
3.79
|
%
|
1,805,312
|
|
67,573
|
|
3.74
|
%
|
|||||||||||||||
|
Bank loans, net of unearned income
(2)
|
|
|
|
|
|
|
|||||||||||||||||||||||||||
|
Loans held for sale
|
159,384
|
|
5,156
|
|
3.34
|
%
|
150,305
|
|
4,551
|
|
3.07
|
%
|
107,255
|
|
2,686
|
|
2.64
|
%
|
|||||||||||||||
|
Loans held for investment:
|
|||||||||||||||||||||||||||||||||
|
C&I loans
|
7,340,052
|
|
281,274
|
|
3.78
|
%
|
7,171,402
|
|
271,476
|
|
3.73
|
%
|
6,677,117
|
|
244,986
|
|
3.62
|
%
|
|||||||||||||||
|
CRE construction loans
|
129,073
|
|
6,184
|
|
4.73
|
%
|
169,101
|
|
8,462
|
|
4.92
|
%
|
118,626
|
|
5,042
|
|
4.19
|
%
|
|||||||||||||||
|
CRE loans
|
2,831,870
|
|
100,563
|
|
3.50
|
%
|
2,297,224
|
|
70,048
|
|
3.00
|
%
|
1,728,324
|
|
53,369
|
|
3.05
|
%
|
|||||||||||||||
|
Tax-exempt loans
(3)
|
891,922
|
|
23,057
|
|
3.98
|
%
|
617,701
|
|
16,707
|
|
4.16
|
%
|
301,767
|
|
8,812
|
|
4.49
|
%
|
|||||||||||||||
|
Residential mortgage loans
|
2,803,464
|
|
83,537
|
|
2.94
|
%
|
2,217,789
|
|
64,607
|
|
2.87
|
%
|
1,927,105
|
|
55,370
|
|
2.83
|
%
|
|||||||||||||||
|
SBL
|
2,123,189
|
|
72,400
|
|
3.36
|
%
|
1,713,243
|
|
51,515
|
|
2.96
|
%
|
1,269,337
|
|
35,313
|
|
2.74
|
%
|
|||||||||||||||
|
Total bank loans, net
|
16,278,954
|
|
572,171
|
|
3.55
|
%
|
14,336,765
|
|
487,366
|
|
3.42
|
%
|
12,129,531
|
|
405,578
|
|
3.34
|
%
|
|||||||||||||||
|
Loans to financial advisors
(1)
|
848,677
|
|
13,333
|
|
1.57
|
%
|
563,548
|
|
8,207
|
|
1.46
|
%
|
457,797
|
|
7,056
|
|
1.54
|
%
|
|||||||||||||||
|
Corporate cash and all other
(1)
|
3,450,514
|
|
30,590
|
|
0.89
|
%
|
2,750,688
|
|
18,090
|
|
0.66
|
%
|
2,957,309
|
|
12,697
|
|
0.43
|
%
|
|||||||||||||||
|
Total interest-earning assets
|
$
|
28,932,809
|
|
$
|
802,126
|
|
2.77
|
%
|
$
|
24,874,346
|
|
$
|
640,397
|
|
2.57
|
%
|
$
|
21,468,886
|
|
$
|
543,282
|
|
2.53
|
%
|
|||||||||
|
Interest-bearing liabilities:
|
|
|
|
|
|
|
|
|
|
|
|
|
|
|
|
|
|||||||||||||||||
|
Bank deposits
|
|
|
|||||||||||||||||||||||||||||||
|
Certificates of deposit
|
$
|
293,589
|
|
$
|
4,325
|
|
1.47
|
%
|
$
|
345,628
|
|
$
|
5,402
|
|
1.56
|
%
|
$
|
347,748
|
|
$
|
5,839
|
|
1.68
|
%
|
|||||||||
|
Money market, savings and Negotiable Order of Withdrawal (“NOW”) accounts
|
15,566,621
|
|
12,859
|
|
0.08
|
%
|
12,640,068
|
|
4,816
|
|
0.05
|
%
|
10,851,494
|
|
2,543
|
|
0.02
|
%
|
|||||||||||||||
|
Securities borrowed
|
110,416
|
|
6,690
|
|
6.06
|
%
|
79,613
|
|
3,174
|
|
3.99
|
%
|
135,027
|
|
5,237
|
|
3.88
|
%
|
|||||||||||||||
|
Trading instruments sold but not yet purchased
(1)
|
289,218
|
|
6,138
|
|
2.12
|
%
|
281,501
|
|
5,035
|
|
1.79
|
%
|
274,364
|
|
4,503
|
|
1.64
|
%
|
|||||||||||||||
|
Brokerage client liabilities
|
4,678,445
|
|
4,884
|
|
0.10
|
%
|
4,291,632
|
|
2,084
|
|
0.05
|
%
|
3,693,928
|
|
940
|
|
0.03
|
%
|
|||||||||||||||
|
Other borrowings
|
855,638
|
|
16,559
|
|
1.94
|
%
|
723,904
|
|
12,957
|
|
1.79
|
%
|
721,296
|
|
6,079
|
|
0.84
|
%
|
|||||||||||||||
|
Senior notes
|
1,689,172
|
|
94,665
|
|
5.60
|
%
|
1,210,148
|
|
78,533
|
|
6.49
|
%
|
1,149,136
|
|
76,088
|
|
6.62
|
%
|
|||||||||||||||
|
Other
(1)
|
267,794
|
|
7,658
|
|
2.86
|
%
|
241,454
|
|
4,055
|
|
1.68
|
%
|
293,615
|
|
4,845
|
|
1.65
|
%
|
|||||||||||||||
|
Total interest-bearing liabilities
|
$
|
23,750,893
|
|
$
|
153,778
|
|
0.65
|
%
|
$
|
19,813,948
|
|
$
|
116,056
|
|
0.59
|
%
|
$
|
17,466,608
|
|
$
|
106,074
|
|
0.61
|
%
|
|||||||||
|
Net interest income
|
|
|
$
|
648,348
|
|
|
|
$
|
524,341
|
|
|
|
$
|
437,208
|
|
||||||||||||||||||
|
(1)
|
Average balance is calculated based on the average of the end of the month balances for each month within the period.
|
|
(2)
|
Nonaccrual loans are included in the average loan balances. Payment or income received on corporate nonaccrual loans are applied to principal. Income on other nonaccrual loans is recognized on a cash basis. Fee income on all loans included in interest income for the twelve months ended September 30, 2017, 2016 and 2015, was $38 million, $36 million and $30 million respectively.
|
|
(3)
|
The yield is presented on a tax equivalent basis utilizing the federal statutory rate of 35%.
|
40
Year ended
September 30, 2017
compared with the year ended
September 30, 2016
Net interest income increased
$124 million
, or
24%
, primarily reflecting an increase in interest income in our PCG and RJ Bank segments, partially offset by the impact of an increase in interest expense related to our senior notes payable.
Net interest income in the PCG segment increased
$40 million
, or
41%
. Interest income in the PCG segment increased as a result of: 1) the impact of the increase in average segregated assets compared with prior year levels, largely driven by our September 2016 acquisition of Alex. Brown, as well as the impact of an increase in short-term interest rates on these balances; and 2) increased client margin balances, largely driven by our September 2016 acquisition of Alex. Brown. The favorable impact of the growth was partially offset by a decrease in average client margin rates on the portfolio. Interest expense for the segment increased, albeit to a much lesser extent, primarily due to an increase in client cash balances and an increase in the interest rate paid to clients on such balances.
The RJ Bank segment’s net interest income increased
$96 million
, or
20%
, resulting from an increase in average loans outstanding and an increase in available-for-sale securities, as well as an increase in net interest margin as compared to the prior year. Refer to the discussion of the specific components of RJ Bank’s net interest income in the RJ Bank section of this MD&A.
Interest expense incurred on our senior notes increased by
$16 million
, or
21%
, as the average outstanding balance of senior notes increased compared to the prior year. The net increase in the balance outstanding was due to our May 2017 and July 2016 issuances of a combined $1.30 billion in senior notes, offset by the April 2016 maturity and repayment of $250 million of senior notes and the March 2017 extinguishment of $350 million of senior notes. The early extinguishment of $300 million of senior notes in September 2017 did not meaningfully reduce our interest expense in fiscal year 2017.
Year ended
September 30, 2016
compared with the year ended
September 30, 2015
Net interest income increased
$87 million
, or
20%
, primarily due to an increase in net interest income in RJ Bank and, to a lesser extent in PCG.
Net interest income in the PCG segment increased
$8 million
, or
9%
. Average customer cash balances and the related segregated asset balances increased compared to the prior year as many clients reacted to uncertainties in the equity markets during portions of fiscal 2016 by increasing the cash balances in their brokerage accounts. The December 2015 Federal Reserve Bank short-term interest rate increase further increased the net interest earned on these segregated asset balances. In addition, both the interest rates and the average balances associated with margin loans provided to brokerage clients increased.
The RJ Bank segment’s net interest income increased
$75 million
, or
19%
, resulting from an increase in average interest-earning banking assets, partially offset by a small decline in the net interest margin. Interest expense incurred on other borrowings increased, primarily related to RJ Bank’s borrowings from the FHLB and the related interest hedges. Refer to the discussion of the specific components of RJ Bank’s net interest income in the RJ Bank section of this MD&A.
Interest expense incurred on our senior notes increased by
$2 million
, or
3%
. The incremental interest expense arising from our July 2016 $800 million senior note issuances exceeded the interest savings resulting from our April 2016 repayment of the $250 million 4.25% issuance which matured.
Results of Operations – Private Client Group
The success of the PCG segment is dependent upon the quality of our products, services, financial advisors and support personnel. Revenues of this segment are correlated with the level of PCG client assets under administration, including fee-based accounts, as well as the overall U.S. equity markets. In periods where equity markets improve, assets under administration and client activity generally increase, thereby having a favorable impact on net revenues.
Through our PCG segment, we provide investment services for which we charge sales commissions or asset-based fees. In addition, we also offer investment advisory services for which we earn a fee calculated as a percentage of assets in the client account or a flat periodic fee charged to the client for investment advice. Such revenues are included in “Securities commissions and fees.” We also earn certain servicing fees, such as omnibus and education and marketing support (“EMS”) fees, from mutual fund and annuity companies whose products we distribute, which are included in “Account and service fees.”
Net interest revenue in the PCG segment is generated by interest earnings on margin loans provided to clients and on cash segregated pursuant to regulations, less interest paid on client cash balances in our client interest program. We also earn fees in lieu of interest revenue from our RJBDP program, which are included in “Account and service fees.” Higher client cash balances generally lead to
41
increased interest income and account and service fee revenues, depending upon spreads realized in our client interest program and RJBDP. For more information on client cash balances, see our previous discussion of interest-earning and interest-bearing assets and liabilities in the Net Interest section of this MD&A.
For an overview of our PCG segment operations, refer to the information presented in Item I, Business in this Form 10-K.
Operating results
|
|
Year ended September 30,
|
|||||||||||||||||
|
$ in thousands
|
2017
|
% change
|
2016
|
% change
|
2015
|
|||||||||||||
|
Revenues:
|
|
|
|
|
||||||||||||||
|
Securities commissions and fees:
|
|
|
||||||||||||||||
|
Fee-based accounts
|
$
|
2,040,839
|
|
28
|
%
|
$
|
1,589,124
|
|
8
|
%
|
$
|
1,472,877
|
|
|||||
|
Mutual funds
|
646,614
|
|
2
|
%
|
631,102
|
|
(7
|
)%
|
680,375
|
|
||||||||
|
Insurance and annuity products
|
385,493
|
|
2
|
%
|
377,329
|
|
4
|
%
|
363,352
|
|
||||||||
|
Equity products
|
303,015
|
|
26
|
%
|
240,855
|
|
(11
|
)%
|
270,435
|
|
||||||||
|
Fixed income products
|
118,062
|
|
23
|
%
|
95,908
|
|
29
|
%
|
74,448
|
|
||||||||
|
New issue sales credits
|
72,281
|
|
64
|
%
|
44,088
|
|
(41
|
)%
|
75,015
|
|
||||||||
|
Sub-total securities commissions and fees
|
3,566,304
|
|
20
|
%
|
2,978,406
|
|
1
|
%
|
2,936,502
|
|
||||||||
|
Interest
|
152,711
|
|
42
|
%
|
107,281
|
|
7
|
%
|
100,594
|
|
||||||||
|
Account and service fees:
|
|
|
|
|
||||||||||||||
|
Mutual fund and annuity service fees
|
290,661
|
|
14
|
%
|
255,405
|
|
2
|
%
|
249,232
|
|
||||||||
|
RJBDP fees
|
270,030
|
|
99
|
%
|
135,460
|
|
63
|
%
|
83,059
|
|
||||||||
|
Client account and service fees
|
98,500
|
|
4
|
%
|
95,010
|
|
2
|
%
|
93,117
|
|
||||||||
|
Client transaction fees
|
22,205
|
|
10
|
%
|
20,258
|
|
7
|
%
|
18,971
|
|
||||||||
|
Account and service fees – all other
|
2,898
|
|
—
|
|
2,898
|
|
8
|
%
|
2,685
|
|
||||||||
|
Sub-total account and service fees
|
684,294
|
|
34
|
%
|
509,031
|
|
14
|
%
|
447,064
|
|
||||||||
|
Other
|
34,279
|
|
7
|
%
|
32,000
|
|
(10
|
)%
|
35,398
|
|
||||||||
|
Total revenues
|
4,437,588
|
|
22
|
%
|
3,626,718
|
|
3
|
%
|
3,519,558
|
|
||||||||
|
Interest expense
|
(15,955
|
)
|
56
|
%
|
(10,239
|
)
|
(13
|
)%
|
(11,752
|
)
|
||||||||
|
Net revenues
|
4,421,633
|
|
22
|
%
|
3,616,479
|
|
3
|
%
|
3,507,806
|
|
||||||||
|
Non-interest expenses:
|
|
|
|
|
|
|
|
|
|
|
||||||||
|
Sales commissions
|
2,653,287
|
|
21
|
%
|
2,193,099
|
|
1
|
%
|
2,169,823
|
|
||||||||
|
Admin & incentive compensation and benefit costs
|
713,043
|
|
20
|
%
|
595,541
|
|
8
|
%
|
552,762
|
|
||||||||
|
Communications and information processing
|
193,902
|
|
16
|
%
|
166,507
|
|
6
|
%
|
157,729
|
|
||||||||
|
Occupancy and equipment costs
|
146,394
|
|
17
|
%
|
125,555
|
|
4
|
%
|
121,115
|
|
||||||||
|
Business development
|
98,138
|
|
11
|
%
|
88,535
|
|
(4
|
)%
|
92,473
|
|
||||||||
|
Jay Peak matter
|
130,000
|
|
550
|
%
|
20,000
|
|
NM
|
|
—
|
|
||||||||
|
Brokerage, clearing, exchange and other
|
113,919
|
|
31
|
%
|
86,678
|
|
21
|
%
|
71,661
|
|
||||||||
|
Total non-interest expenses
|
4,048,683
|
|
24
|
%
|
3,275,915
|
|
3
|
%
|
3,165,563
|
|
||||||||
|
Pre-tax income
|
$
|
372,950
|
|
10
|
%
|
$
|
340,564
|
|
—
|
|
$
|
342,243
|
|
|||||
42
Selected key metrics
|
Client Asset Balances:
|
As of September 30,
|
|||||||||||||||||
|
$ in billions
|
2017
|
% change
|
2016
|
% change
|
2015
|
|||||||||||||
|
PCG assets under administration
|
$
|
659.5
|
|
15
|
%
|
$
|
574.1
|
|
27
|
%
|
$
|
453.3
|
|
|||||
|
PCG assets in fee-based accounts
|
$
|
294.5
|
|
27
|
%
|
$
|
231.0
|
|
29
|
%
|
$
|
179.4
|
|
|||||
|
Financial advisors and Branch locations:
|
September 30,
|
||||||||
|
2017
(1)
|
2016
|
2015
|
|||||||
|
Employees
|
3,041
|
|
3,098
|
|
2,738
|
|
|||
|
Independent Contractors
|
4,305
|
|
4,048
|
|
3,858
|
|
|||
|
Total financial advisors
|
7,346
|
|
7,146
|
|
6,596
|
|
|||
|
Branch locations
|
2,994
|
|
2,890
|
|
2,702
|
|
|||
|
(1)
|
During the year ended
September 30, 2017
, we refined the criteria to determine our financial advisor population, which resulted in a decrease in our previously reported counts of approximately 100 advisors as of our date of adoption. The impact of the change in our methodology did not have a significant impact on the prior periods, and thus we have not revised the number of financial advisors reported in prior periods.
|
PCG assets under administration increased
15%
over
September 30, 2016
, resulting from net client inflows and equity market appreciation. Our net client inflows were primarily attributable to strong financial advisor recruiting results. PCG assets in fee-based accounts as a percentage of overall PCG assets under administration increased compared to
September 30, 2016
due, in part, to clients moving to fee-based alternatives versus traditional transaction-based accounts in response to the recently implemented DOL regulatory changes. PCG assets under administration increased as of September 30, 2016 compared with September 30, 2015 due to strong financial advisor recruiting results as well as our fiscal year 2016 acquisitions of Alex. Brown and 3Macs.
The net increase in financial advisors as of
September 30, 2017
compared to September 30, 2016 resulted from strong financial advisor recruiting and high levels of retention throughout fiscal year 2017. The client asset levels and productivity measures associated with those financial advisors recruited during the fiscal year exceed our historical benchmark averages. Notwithstanding the future impact of changes in the overall economy, and more specifically their impact on the markets, we believe that this increase in financial advisors is a positive indication of potential future revenue growth in this segment.
Year ended
September 30, 2017
compared with the year ended
September 30, 2016
Net revenues
increased
$805 million
, or
22%
to
$4.42 billion
. Pre-tax income, which was negatively impacted by the Jay Peak settlement,
increased
$32 million
, or
10%
to
$373 million
.
Securities commissions and fees
increased
$588 million
, or
20%
, primarily due to strong recruiting results, the acquisitions of Alex. Brown and 3Macs in late fiscal 2016 and a stronger market environment compared to the prior year.
Account and service fees
increased
$175 million
, or
34%
, primarily due to higher RJBDP fees resulting from an increase in short-term interest rates during fiscal year 2017. Mutual fund and annuity service fees also increased, reflecting higher EMS fees and mutual fund omnibus fees. The increase in EMS fees is primarily due to increased assets in the program. The increase in omnibus fees is a result of an increase in the number of positions invested in fund families on the omnibus platform.
The portion of total segment revenues that we consider to be recurring was 79% for fiscal 2017, an increase from 77% for fiscal 2016. Recurring revenues include asset-based fees, trailing commissions from mutual funds and variable annuities/insurance products, mutual fund and annuity service fees, fees earned on funds in our RJBDP program, and interest, all of which contributed to the increase.
As previously discussed, net interest income in the PCG segment
increased
$40 million
, or
41%
.
Non-interest expenses
increased
$773 million, or 24%. Sales commissions
increased
$460 million
, or
21%
, relatively in line with the increase in securities commissions and fees. Expenses related to the Jay Peak matter increased by $110 million to reflect the amount of the settlement in fiscal 2017. Administrative and incentive compensation and benefits expense
increased
$118 million
, or
20%
, primarily resulting from additional staffing levels, primarily in operations and information technology functions, to support our continued growth and increased regulatory and compliance requirements.
43
Year ended
September 30, 2016
compared with the year ended
September 30, 2015
Net revenues in fiscal 2016 increased $109 million, or 3%, to $3.62 billion. Pre-tax income decreased $2 million, to $341 million. PCG’s pre-tax margin on net revenues decreased to 9.4% as compared to 9.8% in fiscal 2015. The 3Macs and Alex. Brown acquisitions were completed toward the end of fiscal year 2016 and therefore the impact of these acquisitions on this segment’s operations were not significant to our fiscal year 2016 results.
Securities commissions and fees in fiscal 2016 increased $42 million, or 1%. Revenues earned in fiscal year 2016 on fee-based accounts increased $116 million, or 8%, commissions earned on fixed income products increased $21 million, or 29%, and commission revenues on insurance and annuity products increased $14 million, or 4%. Offsetting these increases, commissions on mutual funds decreased $49 million, or 7%, new issue sales credits declined $31 million, or 41%, and commissions on equity products decreased $30 million, or 11%, all of which reflect the challenging equity market conditions during significant portions of fiscal year 2016.
Total account and service fees in fiscal year 2016 increased $62 million, or 14%. RJBDP fees increased $52 million, or 63%, primarily resulting from increased average balances in the program as well as the December 2015 increase in interest rates. Mutual fund and annuity service fees increased $6 million, or 2%, primarily as a result of an increase in money market processing fees and omnibus fees arising from increased client assets and positions which are paid to us by companies whose products we distribute.
The portion of total segment revenues that we consider to be recurring was approximately 77% for fiscal 2016, an increase from 75% from fiscal 2015. Recurring commission and fee revenues include asset-based fees, trailing commissions from mutual funds and variable annuities/insurance products, mutual fund and annuity service fees, fees earned on funds in our RJBDP program, and interest.
As previously discussed, net interest income in the PCG segment increased $8 million, or 9%.
Non-interest expenses in fiscal year 2016 increased $110 million, or 3%. Administrative & incentive compensation and benefit costs increased $43 million, or 8%, resulting in part from annual increases in salaries, increases in employee benefit plan costs and additional staffing levels, primarily in PCG operations and information technology functions, to support our continuing growth during fiscal year 2016. Sales commission expense in fiscal year 2016 increased $23 million, or 1%, which is consistent with the 1% increase in securities commissions and fees revenues. Expenses related to the Jay Peak matter were $20 million in fiscal 2016 and there were no expenses related to this matter in fiscal 2015. Communications and information processing expense increased $9 million, or 6%, due to increases in software consulting and other information technology expenses associated with our continued investment in our platform and improving our compliance and regulatory systems.
Results of Operations – Capital Markets
Our Capital Markets segment conducts fixed income institutional sales and equity securities trading, equity research, investment banking and the syndication and related management of investments that qualify for tax credits. We primarily conduct these activities in the U.S., Canada and Europe.
We earn institutional sales commissions for the sale of both equity and fixed income products, which are driven primarily through trade volume, resulting from a combination of participation in public offerings, general market activity, and by the Capital Markets group’s ability to find attractive investment opportunities and promote those opportunities to clients.
This segment also includes trading which involves the purchase of securities from, and the sale of securities to, our clients as well as other dealers who may be purchasing or selling securities for their own account or acting as agent for their clients. Profits and losses related to this trading activity are primarily derived from the spreads between bid and ask prices, as well as market trends for the individual securities during the period we hold them. In our fixed income businesses, we also enter into interest rate swaps and futures contracts to facilitate client transactions or to actively manage risk exposures.
We provide various investment banking services, including public and private equity and debt financing activities, including our public finance activities, merger and acquisition advisory, and other advisory services. Revenues from investment banking activities are driven principally by our role in the transaction and the number and dollar value of the transactions with which we are involved. For an overview of our Capital Markets segment operations, refer to the information presented in Item I, Business in this Form 10-K.
44
Operating results
|
|
Year ended September 30,
|
|||||||||||||||||
|
$ in thousands
|
2017
|
% change
|
2016
|
% change
|
2015
|
|||||||||||||
|
Revenues:
|
|
|
|
|
|
|||||||||||||
|
Securities commissions and fees:
|
|
|
|
|
|
|||||||||||||
|
Equity
|
$
|
222,942
|
|
(2
|
)%
|
$
|
228,346
|
|
(8
|
)%
|
$
|
247,414
|
|
|||||
|
Fixed income
|
267,749
|
|
(15
|
)%
|
316,144
|
|
11
|
%
|
283,828
|
|
||||||||
|
Sub-total securities commissions and fees
|
490,691
|
|
(10
|
)%
|
544,490
|
|
2
|
%
|
531,242
|
|
||||||||
|
Equity underwriting fees
|
72,845
|
|
34
|
%
|
54,492
|
|
(27
|
)%
|
74,229
|
|
||||||||
|
Merger & acquisition and advisory fees
|
228,422
|
|
54
|
%
|
148,503
|
|
(8
|
)%
|
162,270
|
|
||||||||
|
Fixed income investment banking
|
43,234
|
|
5
|
%
|
41,024
|
|
(3
|
)%
|
42,149
|
|
||||||||
|
Tax credit funds syndication fees
|
54,098
|
|
(9
|
)%
|
59,424
|
|
33
|
%
|
44,601
|
|
||||||||
|
Sub-total investment banking
|
398,599
|
|
31
|
%
|
303,443
|
|
(6
|
)%
|
323,249
|
|
||||||||
|
Investment advisory fees
|
21,623
|
|
(27
|
)%
|
29,684
|
|
6
|
%
|
27,905
|
|
||||||||
|
Net trading profit
|
78,155
|
|
(11
|
)%
|
87,966
|
|
60
|
%
|
55,021
|
|
||||||||
|
Interest
|
27,095
|
|
9
|
%
|
24,867
|
|
9
|
%
|
22,738
|
|
||||||||
|
Other
|
18,072
|
|
(32
|
)%
|
26,701
|
|
63
|
%
|
16,425
|
|
||||||||
|
Total revenues
|
1,034,235
|
|
2
|
%
|
1,017,151
|
|
4
|
%
|
976,580
|
|
||||||||
|
Interest expense
|
(20,552
|
)
|
33
|
%
|
(15,435
|
)
|
17
|
%
|
(13,149
|
)
|
||||||||
|
Net revenues
|
1,013,683
|
|
1
|
%
|
1,001,716
|
|
4
|
%
|
963,431
|
|
||||||||
|
Non-interest expenses:
|
|
|
|
|
|
|
|
|
|
|
||||||||
|
Sales commissions
|
176,197
|
|
(14
|
)%
|
204,965
|
|
3
|
%
|
198,691
|
|
||||||||
|
Admin & incentive compensation and benefit costs
|
469,468
|
|
8
|
%
|
433,136
|
|
1
|
%
|
428,501
|
|
||||||||
|
Communications and information processing
|
70,140
|
|
(3
|
)%
|
72,305
|
|
1
|
%
|
71,630
|
|
||||||||
|
Occupancy and equipment costs
|
33,920
|
|
(1
|
)%
|
34,250
|
|
1
|
%
|
34,006
|
|
||||||||
|
Business development
|
38,389
|
|
(4
|
)%
|
39,892
|
|
(9
|
)%
|
44,058
|
|
||||||||
|
Losses and non-interest expenses of real estate partnerships held by consolidated VIEs
|
13,663
|
|
40
|
%
|
9,788
|
|
142
|
%
|
4,050
|
|
||||||||
|
Brokerage, clearing, exchange and other
|
84,702
|
|
11
|
%
|
76,189
|
|
(2
|
)%
|
77,801
|
|
||||||||
|
Total non-interest expenses
|
886,479
|
|
2
|
%
|
870,525
|
|
1
|
%
|
858,737
|
|
||||||||
|
Income before taxes and including noncontrolling interests
|
127,204
|
|
(3
|
)%
|
131,191
|
|
25
|
%
|
104,694
|
|
||||||||
|
Noncontrolling interests
|
(14,032
|
)
|
|
|
(7,982
|
)
|
|
|
(2,315
|
)
|
||||||||
|
Pre-tax income excluding noncontrolling interests
|
$
|
141,236
|
|
1
|
%
|
$
|
139,173
|
|
30
|
%
|
$
|
107,009
|
|
|||||
Noncontrolling interests is primarily comprised of the net pre-tax impact (which are net losses) from the consolidation of certain low-income housing tax credit funds, with noncontrolling interests reflecting the portion of such losses that we do not own.
Year ended September 30, 2017
compared with the year ended
September 30, 2016
Net revenues
increased
$12 million
, or
1%
, to
$1.01 billion
, led by higher merger & acquisition and advisory fees and equity underwriting revenues, partially offset by lower institutional sales commissions. Pre-tax income
increased
$2 million
, or
1%
to
$141 million
.
Total commission revenues decreased $54 million, or 10%. Institutional fixed income commissions decreased $48 million, or 15%, driven by lower client trading volumes, as fixed income was faced with a challenging operating environment characterized by low levels of volatility and a flattening yield curve. Institutional equity sales commissions decreased $5 million, or 2%, primarily reflecting the impact of low levels of volatility.
Merger & acquisition and advisory fees
increased
$80 million
, or
54%
, primarily due to a stronger volume of both domestic and foreign merger & acquisition activity in the current year compared to low levels in the prior year, as well as higher average fees per transaction. Fiscal year 2017 also benefited from the impact of a full year of revenues related to our June 2016 acquisition of Mummert & Company Corporate Finance GmbH (“Mummert”).
Equity underwriting fees
increased
$18 million
, or
34%
, primarily due to the improved equity market conditions compared with a difficult fiscal 2016. The total number of both lead-managed and co-managed underwritings increased significantly over the prior year levels.
Net revenues related to our public finance underwriting and advisory activities remained solid during our 2017 fiscal year and increased slightly compared with fiscal 2016.
45
Despite the uncertainty related to the outcome of any corporate tax reform initiatives, our tax credit funds reflected good performance during the fiscal year. This uncertainty did depress new investment activity amongst syndicators of Low-Income Housing Tax Credit Fund (“LIHTC”) investments during the year and, as a result, our tax credit fund syndication fees decreased
$5 million
, or
9%
, from prior year levels. Depending on the scope of any enacted tax reform legislation, there could also be a significant negative impact on the future results of our tax credit fund business.
Net trading profit decreased $10 million, or 11%, compared with a strong fiscal 2016, primarily due to lower market volatility.
Non-interest expenses
increased
$16 million
, or
2%
. Administrative & incentive compensation and benefit expenses
increased
$36 million
, or
8%
, primarily resulting from the increase in incentive compensation as a result of the increase in investment banking net revenues. Offsetting the increase, sales commission expenses
decreased
$29 million
, or
14%
, primarily as a result of lower institutional fixed income commission revenues during the year.
Year ended
September 30, 2016
compared with the year ended
September 30, 2015
Net revenues in fiscal year 2016 increased $38 million, or 4%, to $1.00 billion. Fiscal year 2016 pre-tax income increased $32 million, or 30%, to $139 million.
Commission revenues in fiscal year 2016 increased $13 million, or 2%. Institutional fixed income commissions increased $32 million, or 11%, benefiting from increased activity both in the anticipation of, and the aftermath resulting from the December 2015 Federal Reserve Bank action to increase short-term interest rates, as well as the interest rate volatility in the markets during much of fiscal year 2016. Offsetting the increase, institutional equity sales commissions decreased $19 million, or 8%, resulting primarily from decreased equity underwriting activities throughout most of fiscal year 2016.
Equity underwriting fees decreased in fiscal year 2016 by $20 million, or 27%, while merger & acquisition and advisory fees decreased $14 million, or 8%. The late September 2015 decline in the equity markets, coupled with market uncertainty in advance of the December 2015 Federal Reserve Bank announcement and their related commentary on interest rates, combined to result in an unfavorable market environment for equity activities during much of fiscal year 2016. As a result, we experienced lower volumes in both our merger & acquisition advisory and equity underwriting activities throughout most of fiscal year 2016. While merger & acquisition and advisory fees are a volatile revenue source in general, the number of merger & acquisition transactions in fiscal year 2016 was low. Most of the decrease in our equity underwriting revenues resulted from our domestic operations. Revenues from our Canadian activities were relatively unchanged from the low amount generated in fiscal year 2015. The number of both lead-managed and co-managed equity underwritings in both our domestic and Canadian operations decreased during fiscal year 2016 compared to fiscal year 2015.
We experienced solid performance in our public finance underwritings in fiscal year 2016, which positively impacted both our securities commissions and fee revenues and our investment banking revenues. The combined revenues resulting from these public finance business activities increased 1% over the fiscal year 2015 level.
Tax credit fund syndication fee revenues increased $15 million, or 33%, due to an increase in the volume of tax credit fund partnership interests sold during fiscal year 2016. As a market leader amongst syndicators of LIHTC investments, we achieved a new milestone in fiscal year 2016 by selling over $1 billion of such investments to institutional investors. Additionally, we recognized nearly $7 million in revenues that were associated with partnership interests sold in prior years which had been deferred in those years. Fiscal year 2016 recognition of these previously deferred revenues resulted from the favorable resolution of certain conditions associated with the partnership interests. As of September 30, 2016, approximately $11 million of previously deferred revenues remained to be recognized in future revenues, whenever such conditions for revenue recognition are fully satisfied.
Our net trading profit in fiscal year 2016 increased $33 million, or 60%. Trading profits generated in our fixed income operations increased approximately $27 million, reflecting solid results in most product categories. Our fiscal year 2015 equity capital markets operations included $5 million of realized trading losses attributable to an equity underwriting position held in our Canadian subsidiary that did not recur in fiscal year 2016.
Other revenues increased $10 million, or 63%. These revenues include $5 million in fiscal year 2016 arising from revenues associated with our annual analyst best picks. Foreign exchange gains associated with certain of our international operations increased $4 million during fiscal year 2016.
46
Non-interest expenses in fiscal year 2016 increased $12 million, or 1%. Sales commission expense increased $6 million, or 3%, consistent with the 2% increase in institutional sales commission revenues. Administrative & incentive compensation and benefit expenses increased $5 million, or 1%, consistent with annual increases in salaries and increases in employee benefit plan costs. Our business development expenses decreased $4 million, or 9%, reflecting the outcome of heightened expense management in fiscal year 2016.
Results of Operations – Asset Management
Our Asset Management segment provides investment advisory and asset management services to individual and institutional investors, and also sponsors a family of mutual funds. Investment advisory fee revenues are earned on the assets held in either managed or non-discretionary asset-based programs. In managed programs, decisions are made by in-house or third-party portfolio managers or investment committees about how to invest the assets in accordance with such programs’ objectives. In non-discretionary asset-based programs, we provide administrative support, which may include trade execution, record-keeping and periodic investor reporting. We generally earn higher fees for managed programs than for non-discretionary asset-based programs, as we provide additional services, such as portfolio management, to managed programs. These fees are computed based on balances either at the beginning of the quarter, the end of the quarter, or average daily assets. Asset balances are impacted by both the performance of the market and the new sales (inflows) and redemptions (outflows) of client accounts/funds. Rising equity markets have historically had a positive impact on investment advisory fee revenues as existing accounts increase in value, and individuals and institutions may commit incremental funds in rising markets. For an overview of our Asset Management segment operations, refer to the information presented in Item I, Business in this Form 10-K.
Operating results
|
|
Year ended September 30,
|
|||||||||||||||||
|
$ in thousands
|
2017
|
% change
|
2016
|
% change
|
2015
|
|||||||||||||
|
Revenues:
|
|
|
|
|
|
|||||||||||||
|
Investment advisory and related administrative fees:
|
||||||||||||||||||
|
Managed programs
|
$
|
326,405
|
|
21
|
%
|
$
|
270,623
|
|
—
|
|
$
|
271,609
|
|
|||||
|
Non-discretionary asset-based administration
|
91,087
|
|
23
|
%
|
74,130
|
|
10
|
%
|
67,286
|
|
||||||||
|
Sub-total investment advisory and related administrative fees
|
417,492
|
|
21
|
%
|
344,753
|
|
2
|
%
|
338,895
|
|
||||||||
|
Account and service fees and Other
|
70,243
|
|
18
|
%
|
59,668
|
|
12
|
%
|
53,483
|
|
||||||||
|
Total revenues
|
487,735
|
|
21
|
%
|
404,421
|
|
3
|
%
|
392,378
|
|
||||||||
|
Interest expense
|
(77
|
)
|
7
|
%
|
(72
|
)
|
(6
|
)%
|
(77
|
)
|
||||||||
|
Net revenues
|
487,658
|
|
21
|
%
|
404,349
|
|
3
|
%
|
392,301
|
|
||||||||
|
Non-interest expenses:
|
|
|
|
|
|
|
|
|
|
|
||||||||
|
Compensation and benefits
|
123,119
|
|
9
|
%
|
112,998
|
|
11
|
%
|
101,723
|
|
||||||||
|
Communications and information processing
|
30,109
|
|
11
|
%
|
27,027
|
|
7
|
%
|
25,286
|
|
||||||||
|
Occupancy and equipment costs
|
5,046
|
|
14
|
%
|
4,423
|
|
(3
|
)%
|
4,564
|
|
||||||||
|
Business development
|
9,673
|
|
2
|
%
|
9,500
|
|
(4
|
)%
|
9,911
|
|
||||||||
|
Investment sub-advisory fees
|
75,497
|
|
33
|
%
|
56,751
|
|
3
|
%
|
54,938
|
|
||||||||
|
Other
|
67,509
|
|
17
|
%
|
57,911
|
|
3
|
%
|
56,177
|
|
||||||||
|
Total non-interest expenses
|
310,953
|
|
16
|
%
|
268,610
|
|
6
|
%
|
252,599
|
|
||||||||
|
Income before taxes and including noncontrolling interests
|
176,705
|
|
30
|
%
|
135,739
|
|
(3
|
)%
|
139,702
|
|
||||||||
|
Noncontrolling interests
|
4,969
|
|
|
|
3,581
|
|
|
|
4,652
|
|
||||||||
|
Pre-tax income excluding noncontrolling interests
|
$
|
171,736
|
|
30
|
%
|
$
|
132,158
|
|
(2
|
)%
|
$
|
135,050
|
|
|||||
Noncontrolling interests is primarily comprised of the net pre-tax impact (which are net gains) from the consolidation of certain subsidiaries with noncontrolling interests reflecting the portion of such gains we do not own.
47
Selected key metrics
Managed Programs
-
For the fiscal years ended
September 30, 2017
and 2016, approximately
80%
of investment advisory fees recorded in this segment were earned from assets held in managed programs. Of these revenues, approximately
70%
of such fees recorded in each quarter were determined based on balances at the beginning of the quarter, approximately
15%
were based on balances at the end of the quarter and the remaining
15%
were computed based on average assets throughout the quarter.
Financial assets under management:
|
September 30,
|
||||||||||||
|
$ in millions
|
2017
|
2016
|
2015
|
|||||||||
|
Eagle Asset Management, Inc. (“Eagle”)
(1)
|
$
|
31,670
|
|
$
|
27,235
|
|
$
|
25,692
|
|
|||
|
Freedom accounts
(2)
|
32,714
|
|
24,136
|
|
20,188
|
|
||||||
|
Raymond James Consulting Services
(3)
|
23,612
|
|
18,883
|
|
13,484
|
|
||||||
|
Unified Managed Accounts (“UMA”)
(4)
|
12,577
|
|
10,389
|
|
8,613
|
|
||||||
|
All other
|
1,220
|
|
1,086
|
|
1,116
|
|
||||||
|
Sub-total financial assets under management
|
101,793
|
|
81,729
|
|
69,093
|
|
||||||
|
Less: Assets managed for affiliated entities
|
(5,397
|
)
|
(4,744
|
)
|
(3,916
|
)
|
||||||
|
Total financial assets under management
|
$
|
96,396
|
|
$
|
76,985
|
|
$
|
65,177
|
|
|||
|
(1)
|
Accounts for which Eagle portfolio managers are engaged to manage clients’ assets with investment decisions made by the Eagle portfolio manager.
|
|
(2)
|
Accounts that provide the client a choice between a portfolio of mutual funds, exchange traded funds or a combination of both with investment decisions made by an in-house investment committee.
|
|
(3)
|
Accounts for which in-house or third-party portfolio managers are engaged to manage clients’ assets with investment decisions made by such portfolio manager.
|
|
(4)
|
Accounts that provide the client with the ability to combine separately managed accounts, mutual funds and exchange traded funds all in one aggregate account with investment decisions made by an in-house investment committee.
|
Activity (including activity in assets managed for affiliated entities):
|
Year ended September 30,
|
||||||||||||
|
$ in millions
|
2017
|
2016
|
2015
|
|||||||||
|
Financial assets under management at beginning of year
|
$
|
81,729
|
|
$
|
69,093
|
|
$
|
69,368
|
|
|||
|
Net inflows
|
9,912
|
|
6,327
|
|
2,797
|
|
||||||
|
Net market appreciation/(depreciation) in asset values
|
10,152
|
|
6,309
|
|
(2,170
|
)
|
||||||
|
Other
|
—
|
|
—
|
|
(902
|
)
|
||||||
|
Financial assets under management at end of year
|
$
|
101,793
|
|
$
|
81,729
|
|
$
|
69,093
|
|
|||
The fiscal year 2016 net inflows in the table above include approximately $2.0 billion of client assets resulting from our acquisition of Alex. Brown. The “Other” category in fiscal year 2015 includes assets that were previously included in Eagle programs which were transferred into non-discretionary asset-based programs.
Non-discretionary asset-based programs
- For the fiscal years ended
September 30, 2017
and 2016, approximately
20%
of investment advisory and related administrative fee revenues recorded in this segment were earned for administrative services on assets held in certain non-discretionary asset-based programs. These assets (including those managed for affiliated entities) totaled
$157.0 billion
, $119.3 billion, and $91.0 billion as of
September 30, 2017
,
2016
and
2015
, respectively. The increase in assets in fiscal year 2017 over the prior year level was due, in part, to clients moving to fee-based alternatives in response to the recently implemented DOL regulatory changes. The majority of the administrative fees associated with these programs are determined based on balances at the beginning of the quarter.
Year ended September 30, 2017
compared with the year ended
September 30, 2016
Net revenues
increased
$83 million
, or
21%
, to
$488 million
. Pre-tax income
increased
$40 million
, or
30%
, to
$172 million
.
Total investment advisory and related administrative fee revenues
increased
$73 million
, or
21%
. Investment advisory fee revenues arising from managed programs
increased
$56 million
, or
21%
, and fee revenues on non-discretionary asset-based administration activities
increased
$17 million
, or
23%
, both resulting from the increases in assets held by such programs, including the impact of the
48
Alex. Brown acquisition at the end of our 2016 fiscal year. Financial assets under management and non-discretionary assets were positively impacted by net financial advisor growth, the move to fee based accounts as a result of the implementation of the DOL regulatory changes and market appreciation.
Account and service fees and Other
increased
$11 million
, or
18%
, primarily resulting from RJ Trust which generated increased trust fee revenue arising from the increase in trust assets to $5.5 billion as of September 30, 2017, as well as increased shareholder servicing fees.
Non-interest expenses
increased
$42 million
, or
16%
, primarily resulting from a
$19 million
, or
33%
,
increase
in investment sub-advisory fees and a
$10 million
, or
9%
,
increase
in compensation and benefit expenses. The increase in investment sub-advisory fees resulted from the increase in assets in sub-advised managed programs. The increase in compensation and benefit expenses resulted primarily from annual salary increases as well as increases in personnel to support the growth of the business. Other expenses
increased
$10 million
, or
17%
, as a result of additional regulatory and compliance costs.
The results presented above do not include any acquisition-related expenses associated with our recently announced acquisition of Scout Investments, Inc. (the “Scout Group”) and its Reams Asset Management division (“Reams”), as well as Scout Distributors, which closed in November 2017. The acquisition-related expenses incurred in fiscal year 2017 related to this acquisition are reflected in the Other segment. See
Note 3
of the Notes to Consolidated Financial Statements in this Form 10-K for further information about this acquisition.
Year ended
September 30, 2016
compared to the year ended
September 30, 2015
Net revenues increased $12 million, or 3%, to $404 million. Pre-tax income decreased $3 million, or 2%, to $132 million.
Total investment advisory and related administrative fee revenues increased by $6 million, or 2%. Revenues from non-discretionary asset-based administration activities increased $7 million, or 10%, primarily resulting from the 31% increase in assets held in such programs. Assets arising from our Alex. Brown and 3Macs acquisitions had little impact on revenues as the acquisitions occurred late in the fiscal year. Offsetting this increase, advisory fee revenues from managed programs decreased by approximately $1 million. Although financial assets under management increased $11.8 billion, or nearly 18% (net of assets managed for affiliated entities) compared to the prior year level, such balances were lower on fee billing dates during the 2016 fiscal year. Also, a portion of the increase in assets arose from our acquisition of Alex. Brown which occurred late in the 2016 fiscal year.
Other income increased $6 million, or 12%, resulting in part from RJ Trust which generated an increase in trust fee income arising from their 30% increase in trust assets from the prior year level. In addition, Eagle received increased shareholder servicing fees and money market fee sharing related to the increase in interest rates.
Non-interest expenses increased by approximately $16 million, or 6%, primarily resulting from an $11 million, or 11%, increase in compensation and benefit expenses, a $2 million, or 3%, increase in investment sub-advisory fee expense, a $2 million, or 7%, increase in communications and information processing expense, and a $2 million, or 3%, increase in other expense. The increase in compensation and benefit expenses resulted primarily from annual salary increases, increases in personnel to support the growth of the business and increases in certain employee benefit plan costs. In addition, the prior year incentive compensation expense included a reversal of certain incentive compensation expense accruals for associates who left the firm during the prior year; such a reversal did not recur in the current year. The increase in sub-advisory fee expense results from increased assets under management in applicable programs. The increase in communication and information processing expense results from increased costs in support of growth in the business. The increase in other expense is in part the result of an increase in revenue sharing with PCG, certain regulatory compliance and legal expenses, and certain incremental costs associated with Cougar including amortization of intangible assets arising from the acquisition.
49
Results of Operations – RJ Bank
RJ Bank provides corporate loans (C&I, CRE and CRE construction), SBL, tax-exempt and residential loans. RJ Bank is active in corporate loan syndications and participations. RJ Bank also provides Federal Deposit Insurance Corporation (“FDIC”)-insured deposit accounts to clients of our broker-dealer subsidiaries and to the general public. RJ Bank generates net interest revenue principally through the interest income earned on loans and investments, which is offset by the interest expense it pays on client deposits and on its borrowings. Higher interest-earning asset balances generally lead to increased net interest earnings, depending upon spreads realized on our net interest-bearing liabilities. For more information on average interest earning asset and liability balances, see our discussion below in this MD&A.
For an overview of our RJ Bank segment operations, refer to the information presented in Item I, Business in this Form 10-K.
Operating results
|
|
Year ended September 30,
|
|||||||||||||||||
|
$ in thousands
|
2017
|
% change
|
2016
|
% change
|
2015
|
|||||||||||||
|
Revenues:
|
|
|
|
|
|
|||||||||||||
|
Interest income
|
$
|
609,971
|
|
22
|
%
|
$
|
501,967
|
|
21
|
%
|
$
|
415,271
|
|
|||||
|
Interest expense
|
(35,175
|
)
|
51
|
%
|
(23,277
|
)
|
99
|
%
|
(11,693
|
)
|
||||||||
|
Net interest income
|
574,796
|
|
20
|
%
|
478,690
|
|
19
|
%
|
403,578
|
|
||||||||
|
Other income
|
17,874
|
|
17
|
%
|
15,276
|
|
43
|
%
|
10,717
|
|
||||||||
|
Net revenues
|
592,670
|
|
20
|
%
|
493,966
|
|
19
|
%
|
414,295
|
|
||||||||
|
Non-interest expenses:
|
|
|
|
|
|
|
|
|
|
|
||||||||
|
Compensation and benefits
|
33,991
|
|
14
|
%
|
29,742
|
|
7
|
%
|
27,843
|
|
||||||||
|
Communications and information processing
|
7,946
|
|
12
|
%
|
7,090
|
|
37
|
%
|
5,186
|
|
||||||||
|
Occupancy and equipment costs
|
1,432
|
|
18
|
%
|
1,216
|
|
(3
|
)%
|
1,256
|
|
||||||||
|
Loan loss provision
|
12,987
|
|
(54
|
)%
|
28,167
|
|
20
|
%
|
23,570
|
|
||||||||
|
FDIC insurance premiums
|
16,832
|
|
9
|
%
|
15,478
|
|
32
|
%
|
11,746
|
|
||||||||
|
Affiliate deposit account servicing fees
|
67,981
|
|
58
|
%
|
43,145
|
|
22
|
%
|
35,429
|
|
||||||||
|
Other
|
42,198
|
|
33
|
%
|
31,832
|
|
4
|
%
|
30,544
|
|
||||||||
|
Total non-interest expenses
|
183,367
|
|
17
|
%
|
156,670
|
|
16
|
%
|
135,574
|
|
||||||||
|
Pre-tax income
|
$
|
409,303
|
|
21
|
%
|
$
|
337,296
|
|
21
|
%
|
$
|
278,721
|
|
|||||
50
The following table presents average balances, interest income and expense, the related interest yields and rates, and interest spreads and margins for RJ Bank for the years indicated:
|
|
Year ended September 30,
|
||||||||||||||||||||||||||||||||
|
|
2017
|
2016
|
2015
|
||||||||||||||||||||||||||||||
|
$ in thousands
|
Average
balance
|
Interest
inc./exp.
|
Average
yield/
cost
|
Average
balance
|
Interest
inc./exp.
|
Average
yield/
cost
|
Average
balance
|
Interest
inc./exp.
|
Average
yield/
cost
|
||||||||||||||||||||||||
|
Interest-earning banking assets:
|
|
|
|
|
|
||||||||||||||||||||||||||||
|
Loans, net of unearned income
(1)
|
|
|
|
|
|
||||||||||||||||||||||||||||
|
Loans held for sale
|
$
|
159,384
|
|
$
|
5,156
|
|
3.34
|
%
|
$
|
150,305
|
|
$
|
4,551
|
|
3.07
|
%
|
$
|
107,255
|
|
$
|
2,686
|
|
2.64
|
%
|
|||||||||
|
Loans held for investment:
|
|||||||||||||||||||||||||||||||||
|
C&I loans
|
7,340,052
|
|
281,274
|
|
3.78
|
%
|
7,171,402
|
|
271,476
|
|
3.73
|
%
|
6,677,117
|
|
244,986
|
|
3.62
|
%
|
|||||||||||||||
|
CRE construction loans
|
129,073
|
|
6,184
|
|
4.73
|
%
|
169,101
|
|
8,462
|
|
4.92
|
%
|
118,626
|
|
5,042
|
|
4.19
|
%
|
|||||||||||||||
|
CRE loans
|
2,831,870
|
|
100,563
|
|
3.50
|
%
|
2,297,224
|
|
70,048
|
|
3.00
|
%
|
1,728,324
|
|
53,369
|
|
3.05
|
%
|
|||||||||||||||
|
Tax-exempt loans
(2)
|
891,922
|
|
23,057
|
|
3.98
|
%
|
617,701
|
|
16,707
|
|
4.16
|
%
|
301,767
|
|
8,812
|
|
4.49
|
%
|
|||||||||||||||
|
Residential mortgage loans
|
2,803,464
|
|
83,537
|
|
2.94
|
%
|
2,217,789
|
|
64,607
|
|
2.87
|
%
|
1,927,105
|
|
55,370
|
|
2.83
|
%
|
|||||||||||||||
|
SBL
|
2,123,189
|
|
72,400
|
|
3.36
|
%
|
1,713,243
|
|
51,515
|
|
2.96
|
%
|
1,269,337
|
|
35,313
|
|
2.74
|
%
|
|||||||||||||||
|
Total loans, net
|
16,278,954
|
|
572,171
|
|
3.55
|
%
|
14,336,765
|
|
487,366
|
|
3.42
|
%
|
12,129,531
|
|
405,578
|
|
3.34
|
%
|
|||||||||||||||
|
Agency MBS and CMOs
|
1,432,804
|
|
25,101
|
|
1.75
|
%
|
363,722
|
|
4,993
|
|
1.37
|
%
|
248,408
|
|
2,446
|
|
0.98
|
%
|
|||||||||||||||
|
Non-agency CMOs
|
30,134
|
|
869
|
|
2.88
|
%
|
68,904
|
|
1,764
|
|
2.56
|
%
|
89,336
|
|
2,178
|
|
2.44
|
%
|
|||||||||||||||
|
Cash
|
859,020
|
|
7,696
|
|
0.90
|
%
|
884,556
|
|
4,140
|
|
0.47
|
%
|
611,375
|
|
1,344
|
|
0.22
|
%
|
|||||||||||||||
|
FHLB stock, Federal Reserve Bank of Atlanta (“FRB”) stock, and other
|
157,395
|
|
4,134
|
|
2.63
|
%
|
186,589
|
|
3,704
|
|
1.98
|
%
|
111,891
|
|
3,725
|
|
3.33
|
%
|
|||||||||||||||
|
Total interest-earning banking assets
|
18,758,307
|
|
$
|
609,971
|
|
3.28
|
%
|
15,840,536
|
|
$
|
501,967
|
|
3.18
|
%
|
13,190,541
|
|
$
|
415,271
|
|
3.15
|
%
|
||||||||||||
|
Non-interest-earning banking assets:
|
|
|
|
|
|
|
|
|
|
|
|
|
|
|
|
|
|
|
|||||||||||||||
|
Allowance for loan losses
|
(194,029
|
)
|
|
|
|
|
(188,429
|
)
|
|
|
|
|
(158,373
|
)
|
|
|
|
|
|||||||||||||||
|
Unrealized loss on available-for-sale securities
|
(6,663
|
)
|
|
|
|
|
(3,172
|
)
|
|
|
|
|
(4,666
|
)
|
|
|
|
|
|||||||||||||||
|
Other assets
|
374,769
|
|
|
|
|
|
281,961
|
|
|
|
|
|
321,919
|
|
|
|
|
|
|||||||||||||||
|
Total non-interest-earning banking assets
|
174,077
|
|
|
|
|
|
90,360
|
|
|
|
|
|
158,880
|
|
|
|
|
|
|||||||||||||||
|
Total banking assets
|
$
|
18,932,384
|
|
|
|
|
|
$
|
15,930,896
|
|
|
|
|
|
$
|
13,349,421
|
|
|
|
|
|
||||||||||||
|
Interest-bearing banking liabilities:
|
|
|
|
|
|
|
|
|
|
|
|
|
|
|
|
|
|||||||||||||||||
|
Deposits:
|
|
|
|
|
|
|
|
|
|
|
|
|
|
|
|
|
|
|
|||||||||||||||
|
Certificates of deposit
|
$
|
293,589
|
|
$
|
4,325
|
|
1.47
|
%
|
$
|
345,628
|
|
$
|
5,402
|
|
1.56
|
%
|
$
|
347,748
|
|
$
|
5,839
|
|
1.68
|
%
|
|||||||||
|
Money market, savings, and NOW accounts
|
15,975,308
|
|
16,230
|
|
0.10
|
%
|
13,238,007
|
|
7,087
|
|
0.05
|
%
|
10,851,494
|
|
2,543
|
|
0.02
|
%
|
|||||||||||||||
|
FHLB advances and other
|
820,594
|
|
14,620
|
|
1.76
|
%
|
680,778
|
|
10,788
|
|
1.56
|
%
|
664,387
|
|
3,311
|
|
0.49
|
%
|
|||||||||||||||
|
Total interest-bearing banking liabilities
|
17,089,491
|
|
$
|
35,175
|
|
0.20
|
%
|
14,264,413
|
|
$
|
23,277
|
|
0.16
|
%
|
11,863,629
|
|
$
|
11,693
|
|
0.10
|
%
|
||||||||||||
|
Non-interest-bearing banking liabilities
|
92,762
|
|
|
|
|
|
71,278
|
|
|
|
|
|
52,933
|
|
|
|
|
|
|||||||||||||||
|
Total banking liabilities
|
17,182,253
|
|
|
|
|
|
14,335,691
|
|
|
|
|
|
11,916,562
|
|
|
|
|
|
|||||||||||||||
|
Total banking shareholder’s equity
|
1,750,131
|
|
|
|
|
|
1,595,205
|
|
|
|
|
|
1,432,859
|
|
|
|
|
|
|||||||||||||||
|
Total banking liabilities and shareholders’ equity
|
$
|
18,932,384
|
|
|
|
|
|
$
|
15,930,896
|
|
|
|
|
|
$
|
13,349,421
|
|
|
|
|
|
||||||||||||
|
Excess of interest-earning banking assets over interest-bearing banking liabilities/net interest income
|
$
|
1,668,816
|
|
$
|
574,796
|
|
|
$
|
1,576,123
|
|
$
|
478,690
|
|
|
$
|
1,326,912
|
|
$
|
403,578
|
|
|
||||||||||||
|
Bank net interest:
|
|
|
|
|
|
|
|
|
|
|
|
|
|
|
|
||||||||||||||||||
|
Spread
|
|
|
|
|
3.08
|
%
|
|
|
|
|
3.02
|
%
|
|
|
|
|
3.05
|
%
|
|||||||||||||||
|
Margin (net yield on interest-earning banking assets)
|
|
|
|
|
3.10
|
%
|
|
|
|
|
3.04
|
%
|
|
|
|
|
3.07
|
%
|
|||||||||||||||
|
Ratio of interest-earning banking assets to interest-bearing banking liabilities
|
|
|
|
|
109.77
|
%
|
|
|
|
|
111.05
|
%
|
|
|
|
|
111.18
|
%
|
|||||||||||||||
|
(1)
|
Nonaccrual loans are included in the average loan balances. Payment or income received on corporate nonaccrual loans are applied to principal. Income on other nonaccrual loans is recognized on a cash basis. Fee income on all loans included in interest income for the years ended
September 30, 2017
,
2016
and
2015
was
$38 million
, $36 million, and $30 million, respectively.
|
|
(2)
|
The yield is presented on a tax-equivalent basis utilizing the federal statutory tax rate of 35%.
|
51
Increases and decreases in interest income and interest expense result from changes in average balances (volume) of interest-earning banking assets and liabilities, as well as changes in average interest rates. The following table shows the effect that these factors had on the interest earned on our interest-earning assets and the interest incurred on its interest-bearing liabilities. The effect of changes in volume is determined by multiplying the change in volume by the previous period’s average yield/cost. Similarly, the effect of rate changes is calculated by multiplying the change in average yield/cost by the previous year’s volume. Changes applicable to both volume and rate have been allocated proportionately.
|
Year ended September 30,
|
||||||||||||||||||||||||
|
2017 compared to 2016
|
2016 compared to 2015
|
|||||||||||||||||||||||
|
|
Increase/(decrease) due to
|
Increase/(decrease) due to
|
||||||||||||||||||||||
|
$ in thousands
|
Volume
|
Rate
|
Total
|
Volume
|
Rate
|
Total
|
||||||||||||||||||
|
Interest revenue:
|
|
|
|
|||||||||||||||||||||
|
Interest-earning banking assets:
|
|
|
|
|||||||||||||||||||||
|
Bank loans, net of unearned income
|
||||||||||||||||||||||||
|
Loans held for sale
|
$
|
275
|
|
$
|
330
|
|
$
|
605
|
|
$
|
1,078
|
|
$
|
787
|
|
$
|
1,865
|
|
||||||
|
Loans held for investment:
|
||||||||||||||||||||||||
|
C&I loans
|
6,384
|
|
3,414
|
|
9,798
|
|
18,135
|
|
8,355
|
|
26,490
|
|
||||||||||||
|
CRE construction loans
|
(2,003
|
)
|
(275
|
)
|
(2,278
|
)
|
2,145
|
|
1,275
|
|
3,420
|
|
||||||||||||
|
CRE loans
|
16,303
|
|
14,212
|
|
30,515
|
|
17,567
|
|
(888
|
)
|
16,679
|
|
||||||||||||
|
Tax-exempt loans
|
7,416
|
|
(1,066
|
)
|
6,350
|
|
9,227
|
|
(1,332
|
)
|
7,895
|
|
||||||||||||
|
Residential mortgage loans
|
17,062
|
|
1,868
|
|
18,930
|
|
8,352
|
|
885
|
|
9,237
|
|
||||||||||||
|
SBL
|
12,327
|
|
8,558
|
|
20,885
|
|
12,349
|
|
3,853
|
|
16,202
|
|
||||||||||||
|
Total bank loans, net
|
57,764
|
|
27,041
|
|
84,805
|
|
68,853
|
|
12,935
|
|
81,788
|
|
||||||||||||
|
Available-for-sale securities
|
||||||||||||||||||||||||
|
Agency MBS and CMOs
|
14,675
|
|
5,433
|
|
20,108
|
|
1,135
|
|
1,412
|
|
2,547
|
|
||||||||||||
|
Non-agency CMOs
|
(993
|
)
|
98
|
|
(895
|
)
|
(498
|
)
|
84
|
|
(414
|
)
|
||||||||||||
|
Cash
|
(120
|
)
|
3,676
|
|
3,556
|
|
601
|
|
2,195
|
|
2,796
|
|
||||||||||||
|
FHLB stock, FRB stock and other
|
(579
|
)
|
1,009
|
|
430
|
|
2,486
|
|
(2,507
|
)
|
(21
|
)
|
||||||||||||
|
Total interest-earning assets
|
70,747
|
|
37,257
|
|
108,004
|
|
72,577
|
|
14,119
|
|
86,696
|
|
||||||||||||
|
Interest expense:
|
|
|
|
|
|
|
|
|
|
|
|
|
||||||||||||
|
Interest-bearing liabilities:
|
|
|
|
|
|
|
|
|
|
|
|
|
||||||||||||
|
Bank deposits
|
||||||||||||||||||||||||
|
Certificates of deposit
|
$
|
(814
|
)
|
$
|
(263
|
)
|
$
|
(1,077
|
)
|
$
|
(36
|
)
|
$
|
(401
|
)
|
$
|
(437
|
)
|
||||||
|
Money market, savings and NOW accounts
|
1,466
|
|
7,677
|
|
9,143
|
|
559
|
|
3,985
|
|
4,544
|
|
||||||||||||
|
FHLB advances and other
|
2,216
|
|
1,616
|
|
3,832
|
|
82
|
|
7,395
|
|
7,477
|
|
||||||||||||
|
Total interest-bearing liabilities
|
2,868
|
|
9,030
|
|
11,898
|
|
605
|
|
10,979
|
|
11,584
|
|
||||||||||||
|
Change in net interest income
|
$
|
67,879
|
|
$
|
28,227
|
|
$
|
96,106
|
|
$
|
71,972
|
|
$
|
3,140
|
|
$
|
75,112
|
|
||||||
The following tables present certain credit quality trends for loans held by RJ Bank:
|
|
Year ended September 30,
|
|||||||||||
|
$ in thousands
|
2017
|
2016
|
2015
|
|||||||||
|
Net loan (charge-offs)/recoveries:
|
|
|
|
|||||||||
|
C&I loans
|
$
|
(25,748
|
)
|
$
|
(2,956
|
)
|
$
|
(580
|
)
|
|||
|
CRE loans
|
5,013
|
|
—
|
|
3,773
|
|
||||||
|
Residential mortgage loans
|
83
|
|
(53
|
)
|
(436
|
)
|
||||||
|
Total
|
$
|
(20,652
|
)
|
$
|
(3,009
|
)
|
$
|
2,757
|
|
|||
52
|
As of September 30,
|
||||||||||||
|
$ in thousands
|
2017
|
2016
|
2015
|
|||||||||
|
Nonperforming assets:
|
|
|
|
|
|
|
||||||
|
Nonperforming loans:
|
|
|
|
|
|
|
||||||
|
C&I loans
|
$
|
5,221
|
|
$
|
35,194
|
|
$
|
—
|
|
|||
|
CRE loans
|
—
|
|
4,230
|
|
4,796
|
|
||||||
|
Residential mortgage loans:
|
||||||||||||
|
Residential first mortgage
|
33,718
|
|
41,746
|
|
47,504
|
|
||||||
|
Home equity loans/lines
|
31
|
|
37
|
|
319
|
|
||||||
|
Total nonperforming loans
|
38,970
|
|
81,207
|
|
52,619
|
|
||||||
|
Other real estate owned:
|
|
|
|
|
|
|
||||||
|
Residential first mortgage
|
4,729
|
|
4,497
|
|
4,631
|
|
||||||
|
Total other real estate owned
|
4,729
|
|
4,497
|
|
4,631
|
|
||||||
|
Total nonperforming assets
|
$
|
43,699
|
|
$
|
85,704
|
|
$
|
57,250
|
|
|||
|
Total nonperforming assets as a % of RJ Bank total assets
|
0.21
|
%
|
0.50
|
%
|
0.39
|
%
|
||||||
|
Total loans:
|
|
|
||||||||||
|
Loans held for sale, net
|
$
|
70,316
|
|
$
|
214,286
|
|
$
|
119,519
|
|
|||
|
Loans held for investment:
|
|
|
|
|
||||||||
|
C&I loans
|
7,385,910
|
|
7,470,373
|
|
6,928,018
|
|
||||||
|
CRE construction loans
|
112,681
|
|
122,718
|
|
162,356
|
|
||||||
|
CRE loans
|
3,106,290
|
|
2,554,071
|
|
2,054,154
|
|
||||||
|
Tax-exempt loans
|
1,017,791
|
|
740,944
|
|
484,537
|
|
||||||
|
Residential mortgage loans
|
3,148,730
|
|
2,441,569
|
|
1,962,614
|
|
||||||
|
SBL
|
2,386,697
|
|
1,904,827
|
|
1,481,504
|
|
||||||
|
Net unearned income and deferred expenses
|
(31,178
|
)
|
(40,675
|
)
|
(32,424
|
)
|
||||||
|
Total loans held for investment
|
17,126,921
|
|
15,193,827
|
|
13,040,759
|
|
||||||
|
Total loans
|
$
|
17,197,237
|
|
$
|
15,408,113
|
|
$
|
13,160,278
|
|
|||
Total loans in the above table are net of unearned income and deferred expenses. Total loans held for investment include $1.61 billion, $1.25 billion and $1.15 billion of loans to borrowers domiciled in Canada at September 30, 2017, 2016 and 2015, respectively. At September 30, 2017, there was $1.00 billion in Canadian dollar-denominated loans held for investment.
The following table presents RJ Bank’s allowance for loan losses by loan category:
|
As of September 30,
|
|||||||||||||||||||||
|
|
2017
|
2016
|
2015
|
||||||||||||||||||
|
$ in thousands
|
Allowance
|
Loan category as a % of total loans receivable
|
Allowance
|
Loan category as a % of total loans receivable
|
Allowance
|
Loan category as a % of total loans receivable
|
|||||||||||||||
|
Loans held for sale
|
$
|
—
|
|
—
|
|
$
|
—
|
|
1
|
%
|
$
|
—
|
|
1
|
%
|
||||||
|
C&I loans
|
119,901
|
|
43
|
%
|
137,701
|
|
48
|
%
|
117,623
|
|
52
|
%
|
|||||||||
|
CRE construction loans
|
1,421
|
|
1
|
%
|
1,614
|
|
1
|
%
|
2,707
|
|
1
|
%
|
|||||||||
|
CRE loans
|
41,749
|
|
18
|
%
|
36,533
|
|
17
|
%
|
30,486
|
|
16
|
%
|
|||||||||
|
Tax-exempt loans
|
6,381
|
|
6
|
%
|
4,100
|
|
5
|
%
|
5,949
|
|
4
|
%
|
|||||||||
|
Residential mortgage loans
|
16,691
|
|
18
|
%
|
12,664
|
|
16
|
%
|
12,526
|
|
15
|
%
|
|||||||||
|
SBL
|
4,299
|
|
14
|
%
|
4,766
|
|
12
|
%
|
2,966
|
|
11
|
%
|
|||||||||
|
Total
|
$
|
190,442
|
|
100
|
%
|
$
|
197,378
|
|
100
|
%
|
$
|
172,257
|
|
100
|
%
|
||||||
(continued on the next page)
53
(continued from the previous page)
|
As of September 30,
|
||||||||||||||
|
|
2014
|
2013
|
||||||||||||
|
$ in thousands
|
Allowance
|
Loan category as a % of total loans receivable
|
Allowance
|
Loan category as a % of total loans receivable
|
||||||||||
|
Loans held for sale
|
$
|
—
|
|
—
|
|
$
|
—
|
|
1
|
%
|
||||
|
C&I loans
|
103,179
|
|
58
|
%
|
95,994
|
|
59
|
%
|
||||||
|
CRE construction loans
|
1,594
|
|
1
|
%
|
1,000
|
|
1
|
%
|
||||||
|
CRE loans
|
25,022
|
|
15
|
%
|
19,266
|
|
14
|
%
|
||||||
|
Tax-exempt loans
|
1,380
|
|
1
|
%
|
—
|
|
—
|
%
|
||||||
|
Residential mortgage loans
|
14,350
|
|
16
|
%
|
19,126
|
|
19
|
%
|
||||||
|
SBL
|
2,049
|
|
9
|
%
|
1,115
|
|
6
|
%
|
||||||
|
Total
|
$
|
147,574
|
|
100
|
%
|
$
|
136,501
|
|
100
|
%
|
||||
Year ended
September 30, 2017
compared with the year ended
September 30, 2016
Net revenues increased $99 million, or 20%, to $593 million, primarily reflecting an increase in net interest income. Pre-tax income increased $72 million, or 21%, to $409 million.
Net interest income in the RJ Bank segment increased $96 million, or 20%, primarily due to a $2.92 billion increase in average interest-earning banking assets to $18.76 billion and an increase in net interest margin. The increase in average interest-earning banking assets was driven by a $1.94 billion increase in average loans and a $1.03 billion increase in our average available-for-sale securities portfolio. The net interest margin increased to 3.10% from 3.04% due to an increase in the total banking assets yield, partially offset by an increase in RJ Bank’s total cost of funds. The increase in the total banking assets yield was primarily due to an increase in the loan portfolio yield resulting from an overall rise in market interest rates. The increase in the total cost of funds primarily resulted from the rise in market interest rates as well as an increase in average FHLB advances. Corresponding to the increase in average interest-earning banking assets, average interest-bearing banking liabilities increased $2.83 billion to $17.09 billion.
The loan loss provision decreased $15 million, or 54%, due to the change in mix of loan growth during fiscal 2017. Growth was significantly lower in the C&I loan portfolio during the current year, which has higher allowance percentages, and was higher in the residential mortgage, securities-based and tax-exempt loan portfolios, which have lower allowance percentages. This positive impact was partially offset by additional provision during the current year for C&I and CRE loans in specific industry sectors.
During August and September 2017, Texas and Florida suffered severe damage from Hurricanes Harvey and Irma. We performed an assessment of the impact to our loan portfolio associated with these weather related events and determined that only our residential mortgage loan portfolio could be impacted. A qualitative adjustment was made to the allowance for loan losses during the 2017 fiscal year with respect to the residential mortgage loan portfolio.
Non-interest expenses (excluding provision for loan losses) increased $42 million, or 33%, primarily reflecting a $25 million increase in affiliate deposit account servicing fees due to an increase in client account balances and a $4 million increase in compensation and benefits expense resulting from compensation increases and staff additions to support the growth of the business.
Year ended
September 30, 2016
compared to the year ended
September 30, 2015
Net revenues in fiscal year 2016 increased $80 million, or 19%, to $494 million, primarily reflecting an increase in interest income. Pre-tax income increased $59 million, or 21%, to $337 million.
The $75 million, or 19%, increase in fiscal year 2016 net interest income was the result of a $2.65 billion increase in average interest-earning banking assets partially offset by a small decline in net interest margin. The increase in average interest-earning banking assets was driven by a $2.21 billion increase in average loans and a $443 million increase in average cash and available-for-sale securities portfolio. The net interest margin at September 30, 2016 decreased to 3.04% from 3.07% due to an increase in average, lower-yielding cash balances in addition to an increase in total cost of funds. The average interest-earning banking assets yield increased primarily from the Federal Reserve Bank’s December 2015 increase in short-term interest rates. The increase in total cost of funds primarily resulted from an increase in deposit and borrowing costs, which includes additional expense from our interest rate hedging activities.
54
Borrowing costs increased in fiscal year 2016. Corresponding to the increase in average interest-earning banking assets, average interest-bearing banking liabilities increased during fiscal year 2016.
The $5 million, or 20%, increase in the provision for loan losses as compared to fiscal year 2015 was primarily due to higher corporate loan growth, the charges during fiscal year 2016 related to loans outstanding within the energy sector, as well as additional provision for corporate loan downgrades resulting in higher criticized loans as compared to the prior year. The provision for loan losses also reflected the offsetting impact of improved credit characteristics from the continued decline in residential mortgage loan delinquencies and nonperforming loans.
Other income in fiscal year 2016 increased $5 million, or 43%, primarily due to increases in affiliate income related to the fiscal year 2016 growth in securities-based lending, gains realized from the sale of available-for-sale securities, trading gains as a result of higher sales of Small Business Administration 7(a) (“SBA”) loan securitizations, and lower foreign exchange losses.
Non-interest expenses (excluding provision for loan losses) increased $16 million, or 15%, as compared to fiscal year 2015. The expense in fiscal year 2016 included an $8 million increase in affiliate deposit account servicing fees and a $4 million increase in FDIC insurance premiums both resulting from the increase in client account balances. Other increases in non-interest expenses included a $2 million increase in SBL affiliate fees due to increased SBL balances, a $2 million increase in communications and information processing expense, a $2 million increase in compensation and benefit expenses resulting from salary increases and staff additions, and a $1 million increase in equity losses related to RJ Bank’s investment in low income housing tax credit projects (these losses are by design of the investment structure, income tax credits not reflected in the pre-tax operating results of the segment are received by RJF which net an overall positive return on such investments). These increases in non-interest expenses were partially offset by a $3 million decrease in expense related to the reserve for unfunded lending commitments.
Results of Operations – Other
This segment’s results include our private equity activities, certain corporate overhead costs of RJF including the interest cost on our public debt, losses on extinguishment of debt and the acquisition and integration costs associated with certain acquisitions. For an overview of our Other segment operations, refer to the information presented in Item I, Business in this Form 10-K.
Operating results
|
|
Year ended September 30,
|
||||||||||||||||
|
$ in thousands
|
2017
|
% change
|
2016
|
% change
|
2015
|
||||||||||||
|
Revenues:
|
|
|
|
|
|
||||||||||||
|
Interest income
|
$
|
24,998
|
|
47
|
%
|
$
|
16,977
|
|
39
|
%
|
$
|
12,237
|
|
||||
|
Investment advisory fees
|
1,478
|
|
(19
|
)%
|
1,825
|
|
11
|
%
|
1,644
|
|
|||||||
|
Other
|
39,022
|
|
42
|
%
|
27,489
|
|
(48
|
)%
|
53,086
|
|
|||||||
|
Total revenues
|
65,498
|
|
41
|
%
|
46,291
|
|
(31
|
)%
|
66,967
|
|
|||||||
|
Interest expense
|
(95,368
|
)
|
22
|
%
|
(77,983
|
)
|
1
|
%
|
(77,165
|
)
|
|||||||
|
Net revenues
|
(29,870
|
)
|
6
|
%
|
(31,692
|
)
|
(211
|
)%
|
(10,198
|
)
|
|||||||
|
Non-interest expenses:
|
|||||||||||||||||
|
Compensation and other
|
64,573
|
|
7
|
%
|
60,448
|
|
49
|
%
|
40,551
|
|
|||||||
|
Acquisition-related expenses
|
17,995
|
|
(56
|
)%
|
40,706
|
|
NM
|
|
—
|
|
|||||||
|
Losses on extinguishment of debt
|
45,746
|
|
NM
|
|
—
|
|
NM
|
|
—
|
|
|||||||
|
Total non-interest expenses
|
128,314
|
|
27
|
%
|
101,154
|
|
149
|
%
|
40,551
|
|
|||||||
|
Loss before taxes and including noncontrolling interests:
|
(158,184
|
)
|
(19
|
)%
|
(132,846
|
)
|
(162
|
)%
|
(50,749
|
)
|
|||||||
|
Noncontrolling interests
|
11,695
|
|
15,702
|
|
14,100
|
|
|||||||||||
|
Pre-tax loss excluding noncontrolling interests
|
$
|
(169,879
|
)
|
(14
|
)%
|
$
|
(148,548
|
)
|
(129
|
)%
|
$
|
(64,849
|
)
|
||||
Noncontrolling interests is primarily comprised of the net pre-tax impact (which are net gains) from the consolidation of certain private equity investments with noncontrolling interests reflecting the portion of such gains that we do not own.
55
Year ended
September 30, 2017
compared to the year ended
September 30, 2016
The pre-tax loss generated by this segment
increased
by
$21 million
, or
14%
.
Total revenues in this segment
increased
$19 million
, or
41%
, most of which is comprised of an
increase
in our other revenues of
$12 million
, or
42%
, due to higher net gains (both realized and unrealized) arising from our private equity portfolio, which increased $8 million compared to the prior year, a portion of which relates to noncontrolling interests. Interest income
increased
$8 million
, or
47%
, resulting from the increase in interest rates and higher corporate cash balances.
Interest expense
increased
$17 million
, or
22%
, as the average outstanding balance of our senior notes increased due to the May 2017 and July 2016 issuances of an aggregate $1.30 billion in senior notes, partially offset by the April 2016 maturity and repayment of $250 million of senior notes and, the March 2017 extinguishment of $350 million of senior notes. The early extinguishment of $300 million of senior notes in September 2017 did not meaningfully reduce our interest expense in fiscal year 2017. See
Note 15
of the Notes to Consolidated Financial Statements in this Form 10-K for further information.
Non-interest expenses increased
$27 million
, or
27%
. Fiscal year 2017 included a
$46 million
loss on extinguishment of debt comprised of a make-whole premium and the acceleration of unamortized debt issuance costs related to the early extinguishment of our senior notes during the year. Acquisition-related expenses in fiscal year 2017, which were
$23 million
, or
56%
, lower than the prior year, pertained to certain incremental expenses incurred in connection with our announced acquisition of the Scout Group as well as our fiscal year 2016 acquisitions of Alex. Brown and 3Macs. See
Note 3
of the Notes to Consolidated Financial Statements in this Form 10-K for information regarding the components of these expenses.
Year ended
September 30, 2016
compared to the year ended
September 30, 2015
The fiscal year 2016 pre-tax loss generated by this segment increased by approximately $84 million, or 129%.
Total revenues in this segment decreased $21 million, or 31%. Private equity gains included in other revenues in fiscal year 2016 decreased by $24 million, or 50%. Realized gains on the sale of ARS securities decreased by $11 million due to the nonrecurring prior year gain on the sale of all of our Jefferson County, Alabama Limited Obligation School Warrants ARS. Offsetting these decreases, prior year foreign exchange losses of $5 million arising from certain Canadian denominated liabilities did not recur, and interest income increased $5 million resulting from the increase in interest rates and higher corporate cash balances throughout most of fiscal year 2016.
Interest expense increased $1 million, or 1%. The most significant component of the increase was the interest expense incurred on our senior notes, which increased by $2 million, or 3% as the average outstanding balance increased due to our July 2016 issuance of $800 million of senior notes payable. The fiscal year 2016 issuances more than offset the impact of the April 2016 repayment of $250 million in maturing senior notes.
Compensation and other expense increased $20 million, or 49%. Of the increase, $6 million was due to increases in fiscal year 2016 expenses associated with certain corporate benefit plans provided to associates, $5 million was the result of an increase in corporate charitable donations, and $4 million was the result of additional executive compensation expense resulting from the favorable results of operations and new personnel.
The acquisition-related expenses pertain to incremental expenses incurred in fiscal year 2016 in connection with our acquisitions of Alex. Brown, 3Macs and Mummert. See
Note 3
of the Notes to Consolidated Financial Statements in this Form 10-K for information regarding the components of these expenses.
56
Certain statistical disclosures by bank holding companies
As a financial holding company, we are required to provide certain statistical disclosures by bank holding companies pursuant to the SEC’s Industry Guide 3. The following table provides certain of those disclosures for the periods indicated below. The disclosures for years ended September 30, 2016 and 2015 have been revised from those previously reported to conform to our current presentation which includes the impact of the deconsolidation of certain VIEs (see
Note 2
of the Notes to Consolidated Financial Statements in this Form 10-K for additional information regarding the deconsolidation).
|
Year ended September 30,
|
||||||
|
|
2017
|
2016
|
2015
|
|||
|
RJF return on average assets
|
1.9%
|
1.9%
|
2.0%
|
|||
|
RJF return on average equity
|
12.2%
|
11.3%
|
11.5%
|
|||
|
Average equity to average assets
|
15.9%
|
16.6%
|
17.7%
|
|||
|
Dividend payout ratio
|
20.3%
|
21.9%
|
21.0%
|
|||
RJF return on average assets is computed as net income attributable to RJF for the year indicated, divided by average assets for each respective fiscal year. Average assets is computed by adding the total assets as of each quarter-end date during the indicated fiscal year, plus the beginning of the year total, divided by five.
RJF return on average equity is computed by utilizing the net income attributable to RJF for the year indicated, divided by the average equity attributable to RJF for each respective fiscal year. Average equity is computed by adding the total equity attributable to RJF as of each quarter-end date during the indicated fiscal year, plus the beginning of the year total, divided by five.
Average equity to average assets is computed as average equity divided by average assets as calculated in the above explanations.
Dividend payout ratio is computed as dividends declared per common share during the fiscal year as a percentage of diluted earnings per common share.
Refer to the RJ Bank and Risk Management sections of this MD&A and the Notes to Consolidated Financial Statements in this Form 10-K for the other required disclosures.
Liquidity and Capital Resources
Liquidity is essential to our business. The primary goal of our liquidity management activities is to ensure adequate funding to conduct our business over a range of market environments.
Senior management establishes our liquidity and capital management framework. This framework includes senior management’s review of short- and long-term cash flow forecasts, review of monthly capital expenditures, monitoring of the availability of alternative sources of financing, and daily monitoring of liquidity in our significant subsidiaries. Our decisions on the allocation of capital to our business units consider, among other factors, projected profitability and cash flow, risk and impact on future liquidity needs. Our treasury department assists in evaluating, monitoring and controlling the impact that our business activities have on our financial condition, liquidity and capital structure and maintains our relationships with various lenders. The objective of this framework is to support the successful execution of our business strategies while ensuring ongoing and sufficient liquidity.
Liquidity is provided primarily through our business operations and financing activities. Financing activities could include bank borrowings, repurchase agreement transactions or additional capital raising activities under our universal shelf registration statement.
Cash provided by operating activities during the
year ended September 30, 2017
was
$1.31 billion
. In addition to operating cash flows related to net income, other increases in cash from operations included:
|
•
|
A
$1.43 billion
decrease in assets segregated pursuant to regulations and other segregated assets, primarily resulting from the decrease in client cash balances in part due to a significant number of client accounts from the September 2016 Alex. Brown acquisition electing into our RJBDP program during the current fiscal year.
|
|
•
|
$189 million
of proceeds from sales of securitizations and loans held for sale, net of purchases and originations of loans and securitizations.
|
|
•
|
Accrued compensation, commissions and benefits increased
$160 million
as a result of the increased financial results we achieved in fiscal year 2017.
|
57
Offsetting these, decreases in cash used in operations resulted from:
|
•
|
A decrease of
$1.13 billion
in brokerage client payables and other accounts payable, primarily reflecting a decrease in client cash balances in our client interest program.
|
|
•
|
Securities loaned, net of securities borrowed decreased
$262 million
, primarily as a result of a decline in securities lending activity.
|
|
•
|
$146 million
in Jay Peak settlement payments.
|
Investing activities resulted in the use of
$3.38 billion
of cash during the
year ended September 30, 2017
.
The primary investing activities were:
|
•
|
A net increase in RJ Bank loans used
$1.92 billion
.
|
|
•
|
Purchases of available-for-sale securities held at RJ Bank, net of proceeds from maturations, repayments and sales within the portfolio, used
$1.34 billion
.
|
|
•
|
We used
$190 million
to fund property investments. Of this total, $52 million was used for our December 2016 purchase of three office buildings which are located adjacent to our existing corporate headquarters in St. Petersburg, Florida. The remainder was invested, in large part, in software and computer equipment.
|
Financing activities provided
$4.06 billion
of cash during the
year ended September 30, 2017
.
Increases in cash from financing activities resulted from:
|
•
|
An increase in RJ Bank deposit balances of
$3.47 billion
.
|
|
•
|
Net proceeds of
$508 million
from the issuance of 4.95% senior notes due 2046.
|
|
•
|
Net proceeds of
$905 million
arising from FHLB borrowings and other borrowed funds.
|
Offsetting these, decreases in cash from financing activities resulted from:
|
•
|
Repayment of $350 million of 6.90% senior notes due 2042, $300 million of 8.60% senior notes due 2019 and an associated
$37 million
debt extinguishment premium payment.
|
|
•
|
Payment of dividends to our shareholders of
$127 million
.
|
We believe our existing assets, most of which are liquid in nature, together with funds generated from operations and committed and uncommitted financing facilities provide adequate funds for continuing operations at current levels of activity.
Sources of Liquidity
Approximately
$1.29 billion
of our total
September 30, 2017
cash and cash equivalents (a portion of which resides in depository accounts at RJ Bank) was available to us without restrictions. The cash and cash equivalents held were as follows:
|
$ in thousands
|
September 30, 2017
|
|||
|
RJF
|
$
|
528,397
|
|
|
|
RJ&A
|
1,178,683
|
|
||
|
RJ Bank
|
1,175,722
|
|
||
|
RJ Ltd.
|
439,012
|
|
||
|
RJFS
|
128,903
|
|
||
|
RJFSA
|
56,089
|
|
||
|
Other subsidiaries
|
162,866
|
|
||
|
Total cash and cash equivalents
|
$
|
3,669,672
|
|
|
RJF maintains depository accounts at RJ Bank with a balance of
$192 million
as of
September 30, 2017
. The portion of this total that is available on demand without restrictions, which amounted to $152 million at
September 30, 2017
, is reflected in the RJF total and is excluded from the RJ Bank total.
RJF had loaned
$783 million
to RJ&A as of
September 30, 2017
(such amount is included in the RJ&A cash balance presented in the table above), which RJ&A has invested on behalf of RJF in cash and cash equivalents or otherwise deployed in its normal business activities.
In addition to the cash balances described above, we have other various potential sources of cash available to the parent from subsidiaries which are described in the following section.
58
Liquidity Available from Subsidiaries
Liquidity is principally available to the parent company from RJ&A and RJ Bank.
RJ&A is required to maintain net capital equal to the greater of $1 million or 2% of aggregate debit balances arising from client transactions. Covenants in RJ&A’s committed secured financing facilities require its net capital to be a minimum of 10% of aggregate debit items. At
September 30, 2017
, RJ&A significantly exceeded both the minimum regulatory requirements and the covenants in its financing arrangements pertaining to net capital. At that date, RJ&A had excess net capital of approximately
$534 million
, of which $176 million was available for dividend while still maintaining the internally targeted net capital ratio of 15% of aggregate debit items. There are also limitations on the amount of dividends that may be declared by a broker-dealer without FINRA approval.
RJ Bank may pay dividends to the parent company without the prior approval of its regulator as long as the dividend does not exceed the sum of RJ Bank’s current calendar year and the previous two calendar years’ retained net income, and RJ Bank maintains its targeted regulatory capital ratios. At
September 30, 2017
, RJ Bank had $184 million of capital in excess of the amount it would need at
September 30, 2017
to maintain its targeted total capital to risk-weighted assets ratio of
12.5%
, and could pay a dividend of such amount without requiring prior approval of its regulator.
Although we have liquidity available to us from our other subsidiaries, the available amounts are not as significant as the amounts described above and, in certain instances, may be subject to regulatory requirements.
Borrowings and Financing Arrangements
Committed financing arrangements
Our ability to borrow is dependent upon compliance with the conditions in the various loan agreements and, in the case of secured borrowings, collateral eligibility requirements. Our committed financing arrangements are in the form of either tri-party repurchase agreements or, in the case of the RJF Credit Facility, an unsecured line of credit. The required market value of the collateral associated with the committed secured facilities ranges from 102% to 125% of the amount financed.
The following table presents our committed financing arrangements with third party lenders, which we generally utilize to finance a portion of our fixed income securities trading instruments held, and the outstanding balances related thereto:
|
|
As of September 30, 2017
|
||||||||||||||||||
|
$ in thousands
|
RJ&A
|
RJ Ltd.
|
RJF
|
Total
|
Total number of arrangements
|
||||||||||||||
|
Financing arrangement:
|
|||||||||||||||||||
|
Committed secured
|
$
|
200,000
|
|
$
|
—
|
|
$
|
—
|
|
$
|
200,000
|
|
2
|
|
|||||
|
Committed unsecured
|
—
|
|
—
|
|
300,000
|
|
300,000
|
|
1
|
|
|||||||||
|
Total committed financing arrangements
|
$
|
200,000
|
|
$
|
—
|
|
$
|
300,000
|
|
$
|
500,000
|
|
3
|
|
|||||
|
Outstanding borrowing amount:
|
|||||||||||||||||||
|
Committed secured
|
$
|
—
|
|
$
|
—
|
|
$
|
—
|
|
$
|
—
|
|
|||||||
|
Committed unsecured
|
—
|
|
—
|
|
—
|
|
—
|
|
|||||||||||
|
Total outstanding borrowing amount
|
$
|
—
|
|
$
|
—
|
|
$
|
—
|
|
$
|
—
|
|
|||||||
Uncommitted financing arrangements
Our uncommitted financing arrangements are in the form of secured lines of credit, secured bilateral or tri-party repurchase agreements, or unsecured lines of credit. Our arrangements with third party lenders are generally utilized to finance a portion of our fixed income securities or for cash management purposes. Our uncommitted secured financing arrangements generally require us to post collateral in excess of the amount borrowed. As of
September 30, 2017
, we had outstanding borrowings under
five
uncommitted secured borrowing arrangements with lenders out of a total of 15 uncommitted financing arrangements (nine uncommitted secured and six uncommitted unsecured). However, lenders are under no contractual obligation to lend to us under uncommitted credit facilities.
59
The following table presents our borrowings on uncommitted financing arrangements.
|
|
As of September 30, 2017
|
|||||||||||||||
|
$ in thousands
|
RJ&A
|
RJ Ltd.
|
RJF
|
Total
|
||||||||||||
|
Outstanding borrowing amount:
|
||||||||||||||||
|
Uncommitted secured
|
$
|
480,942
|
|
$
|
—
|
|
$
|
—
|
|
$
|
480,942
|
|
||||
|
Uncommitted unsecured
|
350,000
|
|
—
|
|
—
|
|
350,000
|
|
||||||||
|
Total outstanding borrowing amount
|
$
|
830,942
|
|
$
|
—
|
|
$
|
—
|
|
$
|
830,942
|
|
||||
Other financings
RJ Bank had
$875 million
in FHLB borrowings outstanding at
September 30, 2017
, comprised of floating-rate advances totaling $850 million and a $25 million fixed-rate advance, all of which are secured by a blanket lien on RJ Bank’s residential loan portfolio (see
Note 14
of the Notes to Consolidated Financial Statements in this Form 10-K for additional information regarding these borrowings). RJ Bank had an additional $916 million in immediate credit available from the FHLB as of
September 30, 2017
and, with the pledge of additional collateral to the FHLB, total available credit of 30% of total assets.
RJ Bank is eligible to participate in the Fed’s discount-window program; however, we do not view borrowings from the Fed as a primary source of funding. The credit available in this program is subject to periodic review, may be terminated or reduced at the discretion of the Fed, and would be secured by pledged C&I loans.
From time to time we purchase securities under agreements to resell (“reverse repurchase agreements”) and sell securities under agreements to repurchase (“repurchase agreements”). We account for each of these types of transactions as collateralized agreements and financings, with the outstanding balances on the repurchase agreements included in “Securities sold under agreements to repurchase” on our Consolidated Statements of Financial Condition, included in this Form 10-K, in the amount
$221 million
as of
September 30, 2017
(which are reflected in the table of financing arrangements above). Such financings are generally collateralized by non-customer, RJ&A owned securities or by securities that we have received as collateral under reverse repurchase agreements.
The average daily balance outstanding during the five most recent successive quarters, the maximum month-end balance outstanding during the quarter and the period-end balances for repurchase agreements and reverse repurchase agreements were as follows:
|
|
Repurchase transactions
|
Reverse repurchase transactions
|
||||||||||||||||||||||
|
For the quarter ended
($ in thousands)
|
Average daily
balance
outstanding
|
Maximum month-end
balance outstanding
during the quarter
|
End of period
balance
outstanding
|
Average daily
balance
outstanding
|
Maximum month-end
balance outstanding
during the quarter
|
End of period
balance
outstanding
|
||||||||||||||||||
|
September 30, 2017
|
$
|
241,365
|
|
$
|
247,048
|
|
$
|
220,942
|
|
$
|
463,618
|
|
$
|
503,462
|
|
$
|
404,462
|
|
||||||
|
June 30, 2017
|
$
|
231,378
|
|
$
|
226,972
|
|
$
|
226,972
|
|
$
|
479,653
|
|
$
|
540,823
|
|
$
|
483,820
|
|
||||||
|
March 31, 2017
|
$
|
204,623
|
|
$
|
222,476
|
|
$
|
222,476
|
|
$
|
410,678
|
|
$
|
535,224
|
|
$
|
535,224
|
|
||||||
|
December 31, 2016
|
$
|
219,095
|
|
$
|
241,773
|
|
$
|
203,378
|
|
$
|
424,548
|
|
$
|
445,646
|
|
$
|
358,493
|
|
||||||
|
September 30, 2016
|
$
|
202,687
|
|
$
|
195,551
|
|
$
|
193,229
|
|
$
|
412,513
|
|
$
|
470,222
|
|
$
|
470,222
|
|
||||||
At
September 30, 2017
, in addition to the financing arrangements described above, we had
$29 million
outstanding on a mortgage loan for our St. Petersburg, Florida home-office complex, that is included in “Other borrowings” in our Consolidated Statements of Financial Condition included in this Form 10-K.
At
September 30, 2017
we had senior notes payable of
$1.55 billion
. Our senior notes payable, exclusive of any unaccreted premiums or discounts and debt issuance costs, is comprised of
$250 million
par 5.625% senior notes due 2024,
$500 million
par 3.625% senior notes due 2026, and
$800 million
par 4.95% senior notes due 2046. See
Note 15
in the Notes to the Consolidated Financial Statements in this Form 10-K for additional information.
60
Our senior long-term debt ratings as of the most current report are:
|
Rating Agency
|
Rating
|
Outlook
|
|
Standard & Poor’s Ratings Services (“S&P”)
|
BBB+
|
Stable
|
|
Moody’s Investors Services (“Moody’s”)
|
Baa1
|
Stable
|
Our current long-term debt ratings depend upon a number of factors including industry dynamics, operating and economic environment, operating results, operating margins, earnings trends and volatility, balance sheet composition, liquidity and liquidity management, our capital structure, our overall risk management, business diversification and market share, and competitive position in the markets in which we operate. Deteriorations in any of these factors could impact our credit ratings. Any rating downgrades could increase our costs in the event we were to obtain additional financing.
Should our credit rating be downgraded prior to a public debt offering it is probable that we would have to offer a higher rate of interest to bond holders. A downgrade to below investment grade may make a public debt offering difficult to execute on terms we would consider to be favorable. A downgrade below investment grade could result in the termination of certain derivative contracts and the counterparties to the derivative instruments could request immediate payment or demand immediate and ongoing overnight collateralization on our derivative instruments in liability positions (see
Note 6
of the Notes to Consolidated Financial Statements in this Form 10-K for additional information). A credit downgrade could create a reputational issue and could also result in certain counterparties limiting their business with us, result in negative comments by analysts and potentially impact investor perception of us, and resultantly impact our stock price and/or our clients’ perception of us. A credit downgrade would result in RJF incurring a higher commitment fee on any unused balance on one of its borrowing arrangements, the $300 million revolving credit facility, in addition to triggering a higher interest rate applicable to any borrowings outstanding on that line as of and subsequent to such downgrade. Conversely, an improvement in RJF’s current credit rating could have a favorable impact on the commitment fee as well as the interest rate applicable to any borrowings on such line. None of our credit agreements contain a condition or event of default related to our credit ratings.
Other sources and uses of liquidity
We have company-owned life insurance (“COLI”) policies which are utilized to fund certain non-qualified deferred compensation plans and other employee benefit plans. Certain of our non-qualified deferred compensation plans and other employee benefit plans are self-directed while others are company-directed. The COLI policies which we could readily borrow against have a cash surrender value of approximately $405 million as of
September 30, 2017
and we are able to borrow up to 90%, or $365 million, of the
September 30, 2017
total without restriction. To effect any such borrowing, the underlying investments would be converted to money market investments, therefore requiring us to take market risk related to the self-directed plans. There are no borrowings outstanding against any of these policies as of
September 30, 2017
.
On May 22, 2015 we filed a “universal” shelf registration statement with the SEC to be in a position to access the capital markets if and when necessary or perceived by us to be opportune.
On November 17, 2017 we acquired
100%
of the outstanding shares of the Scout Group (see
Note 3
of the Notes to Consolidated Financial Statements in this Form 10-K for more information) for a purchase price consideration of $173 million. We utilized our cash on-hand to fund the purchase.
See the “Contractual obligations” section below for information regarding our contractual obligations.
The assets on our consolidated statements of financial condition consist primarily of cash and cash equivalents (a large portion of which is segregated for the benefit of clients), receivables including bank loans, financial instruments held for either trading purposes or as investments, and other assets. A significant portion of our assets were liquid in nature, providing us with flexibility in financing our business.
Total assets of
$34.88 billion
at September 30, 2017 were
$3.40 billion
, or
11%
, greater than our total assets as of September 30, 2016. Our cash and cash equivalents balances increased
$2.02 billion
; refer to the discussion of the components of this increase in the “Liquidity and Capital Resources” section within this Item 7. Net bank loans receivable increased
$1.80 billion
primarily due to the growth of RJ Bank’s CRE, tax-exempt, residential and securities-based loan portfolios. Our available-for-sale securities portfolio increased by
$1.33 billion
, as RJ Bank increased their investments in such securities in line with our growth plan for this portfolio.
61
Offsetting these increases, assets segregated pursuant to federal regulations (for the benefit of our clients) decreased
$1.41 billion
, in part due to a significant number of client accounts from the September 2016 Alex. Brown acquisition electing into our RJBDP program during the first quarter of fiscal 2017.
As of September 30, 2017, our total liabilities of
$29.19 billion
were
$2.77 billion
, or
10%
, greater than our total liabilities as of September 30, 2016. Bank deposit liabilities increased
$3.47 billion
as RJ Bank received a higher allocation of RJBDP balances which was utilized to fund a portion of their increased securities portfolio and net loan growth. Other borrowings increased by
$905 million
due to the increased utilization of short-term financings for cash management purposes, the financing of our fixed income securities trading inventory, as well as increased borrowings by RJ Bank from the FHLB. Offsetting these increases, brokerage client payable balances decreased
$1.03 billion
, reflecting a decrease in client cash balances in our client interest program (refer to the discussion of the decrease in assets segregated pursuant to federal regulations above). Securities loaned balances decreased
$294 million
as a result of decreased activity. Our outstanding balance of senior notes payable decreased
$132 million
due to the extinguishment of $350 million of 6.90% senior notes due 2042 and $300 million of 8.60% senior notes due 2019, offset by the issuance of $500 million of 4.95% senior notes due 2046.
Contractual obligations
The following table sets forth our contractual obligations and payments due thereunder by fiscal year:
|
Year ended September 30,
|
||||||||||||||||||||||||||||
|
$ in thousands
|
Total
|
2018
|
2019
|
2020
|
2021
|
2022
|
Thereafter
|
|||||||||||||||||||||
|
Long-term debt obligations:
|
||||||||||||||||||||||||||||
|
Senior notes payable
|
$
|
1,550,000
|
|
$
|
—
|
|
$
|
—
|
|
$
|
—
|
|
$
|
—
|
|
$
|
—
|
|
$
|
1,550,000
|
|
|||||||
|
Long-term portion of other borrowings
|
898,967
|
|
—
|
|
855,130
|
|
5,430
|
|
30,748
|
|
6,084
|
|
1,575
|
|
||||||||||||||
|
Sub-total long-term debt obligations
|
2,448,967
|
|
—
|
|
855,130
|
|
5,430
|
|
30,748
|
|
6,084
|
|
1,551,575
|
|
||||||||||||||
|
Estimated interest on long-term debt
|
1,449,995
|
|
92,059
|
|
87,230
|
|
74,194
|
|
73,043
|
|
72,430
|
|
1,051,039
|
|
||||||||||||||
|
Operating lease obligations
|
448,927
|
|
96,756
|
|
89,711
|
|
78,164
|
|
61,959
|
|
42,846
|
|
79,491
|
|
||||||||||||||
|
Purchase obligations
|
317,877
|
|
152,082
|
|
73,794
|
|
31,715
|
|
14,835
|
|
9,308
|
|
36,143
|
|
||||||||||||||
|
Other long-term liabilities:
|
||||||||||||||||||||||||||||
|
Certificates of deposit (including interest)
|
328,503
|
|
72,055
|
|
62,423
|
|
78,659
|
|
36,250
|
|
79,116
|
|
—
|
|
||||||||||||||
|
Deferred compensation programs
|
484,609
|
|
72,348
|
|
74,028
|
|
74,961
|
|
61,009
|
|
61,643
|
|
140,620
|
|
||||||||||||||
|
Guaranteed LIHTC fund obligation
|
15,786
|
|
5,247
|
|
5,388
|
|
2,373
|
|
1,682
|
|
1,096
|
|
—
|
|
||||||||||||||
|
Sub-total long-term liabilities
|
828,898
|
|
149,650
|
|
141,839
|
|
155,993
|
|
98,941
|
|
141,855
|
|
140,620
|
|
||||||||||||||
|
Total contractual obligations
|
$
|
5,494,664
|
|
$
|
490,547
|
|
$
|
1,247,704
|
|
$
|
345,496
|
|
$
|
279,526
|
|
$
|
272,523
|
|
$
|
2,858,868
|
|
|||||||
Estimated interest on long-term debt includes scheduled interest on our senior notes, our mortgage note payable and our FHLB advances (assuming no change in the variable interest rate from that as of
September 30, 2017
, but factoring into the computation the effect of the related interest rate hedges that swap variable interest rate payments to fixed interest payments). See Notes
14
and
15
of the Notes to Consolidated Financial Statements in this Form 10-K for information regarding our senior notes payable and other borrowings.
In the normal course of our business, we enter into contractual arrangements whereby we commit to future purchases of products or services from unaffiliated parties. Purchase obligations for purposes of this table include amounts associated with agreements to purchase goods or services that are enforceable and legally binding and that specify all significant terms including: minimum quantities to be purchased, fixed, minimum or variable price provisions, and the approximate timing of the transaction. Our most significant purchase obligations are vendor contracts for data services, communication services, processing services, computer software contracts and our stadium naming rights contract which goes through 2027. Most of our contracts have provisions for early termination. For purposes of this table we have assumed we would not pursue early termination of such contracts.
See Note
20
of the Notes to Consolidated Financial Statements in this Form 10-K for additional information regarding our deferred compensation plans. Investments utilized to fund certain of these obligations are not presented in the table above.
Raymond James Tax Credit Funds, Inc. has provided a guaranteed return on investment to a third party investor in the Guaranteed LIHTC Fund. Amounts presented in the table above represent the gross liability associated with this guarantee obligation and do not reflect the related and offsetting financing asset. See Notes
9
and
17
of the Notes to Consolidated Financial Statements in this Form 10-K for further information.
62
The table above does not include any amounts for uncertain tax positions because we are unable to reasonably predict the timing of future payments, if any, to respective taxing authorities. See
Note 16
of the Notes to Consolidated Financial Statements in this Form 10-K for additional information.
We have entered into investment commitments, lending commitments and other commitments to extend credit for which we are unable to reasonably predict the timing of future payments. See Notes
17
and
22
of the Notes to Consolidated Financial Statements in this Form 10-K for further information.
Regulatory
Refer to the discussion of the regulatory environment in which RJF and its subsidiaries operate, and the impact on our operations of certain rules and regulations resulting from the DOL Rule and the Dodd-Frank Act, including the Volcker Rule, in Item 1 Business, Regulation in this Form 10-K.
RJF and many of its subsidiaries are each subject to various regulatory capital requirements. As of September 30, 2017, all of our active regulated domestic and international subsidiaries had net capital in excess of minimum requirements. In addition, RJF and RJ Bank were categorized as “well capitalized” as of
September 30, 2017
.
The maintenance of certain risk-based regulatory capital levels could impact various capital allocation decisions impacting one or more of our businesses. However, due to the strong capital position of RJF and its regulated subsidiaries, we do not anticipate these capital requirements will have any negative impact on our future business activities.
See
Note 21
of the Notes to Consolidated Financial Statements in this Form 10-K for information on regulatory and capital requirements.
Critical accounting estimates
The consolidated financial statements are prepared in accordance with GAAP, which require us to make estimates and assumptions that affect the reported amounts of assets and liabilities and the reported amounts of revenues and expenses during any reporting period in our consolidated financial statements. Management has established detailed policies and control procedures intended to ensure the appropriateness of such estimates and assumptions and their consistent application from period to period. For a description of our significant accounting policies, see
Note 2
of the Notes to Consolidated Financial Statements in this Form 10-K.
We believe that of our accounting estimates and assumptions, those described below involve a high degree of judgment and complexity. Due to their nature, estimates involve judgment based upon available information. Actual results or amounts could differ from estimates and the difference could have a material impact on the consolidated financial statements. Therefore, understanding these critical accounting estimates is important in understanding the reported results of our operations and our financial position.
Valuation of financial instruments
The use of fair value to measure financial instruments, with related gains or losses recognized in our Consolidated Statements of Income and Comprehensive Income, is fundamental to our financial statements and our risk management processes.
“Financial instruments” and “Financial instruments sold but not yet purchased” are reflected in the Consolidated Statements of Financial Condition at fair value. Unrealized gains and losses related to these financial instruments are reflected in our net income or our other comprehensive income/(loss), depending on the underlying purpose of the instrument.
We measure the fair value of our financial instruments in accordance with GAAP, which defines fair value, establishes a framework that we use to measure fair value and provides for certain disclosures we provide about our fair value measurements included in our financial statements. Fair value is defined by GAAP as the price that would be received for an asset or paid to transfer a liability (an exit price) in an orderly transaction between market participants at the measurement date in the principal or most advantageous market for the asset or liability. These fair value determination processes also apply to any of our impairment tests or assessments performed for nonfinancial instruments such as goodwill, identifiable intangible assets, certain real estate owned and other long-lived assets.
63
In determining the fair value of our financial instruments in accordance with GAAP, we use various valuation approaches, including market and/or income approaches. Fair value is a market-based measure considered from the perspective of a market participant. As such, our fair value measurements reflect assumptions that we believe market participants would use in pricing the asset or liability at the measurement date. In determining fair value, GAAP provides for the following three levels to be used to classify our fair value measurements:
Level 1-Inputs are unadjusted quoted prices in active markets for identical assets or liabilities.
Level 2-Inputs that are other than quoted prices in active markets, but which are either directly or indirectly observable as of the reporting date (i.e., prices for similar instruments).
Level 3-Inputs that cannot be observed in market activity.
GAAP requires that we maximize the use of observable inputs and minimize the use of unobservable inputs when performing our fair value measurements. The availability of observable inputs can vary from instrument to instrument and in certain cases, the inputs used to measure fair value may fall into different levels of the fair value hierarchy. In such cases, an instrument’s level within the fair value hierarchy is based on the lowest level of input that is significant to the fair value measurement. Our assessment of the significance of a particular input to the fair value measurement of an instrument requires judgment and consideration of factors specific to the instrument.
See Notes 2,
4
,
5
and
6
of the Notes to Consolidated Financial Statements in this Form 10-K for additional information on our financial instruments.
Investments in private equity measured at net asset value per share
As a practical expedient, we utilize net asset value (“NAV”) or its equivalent to determine the recorded value of a portion of our private equity portfolio. We utilize NAV when the fund investment does not have a readily determinable fair value and the NAV of the fund is calculated in a manner consistent with the measurement principles of investment company accounting, including measurement of the investments at fair value. Our investments in private equity measured at NAV amounted to
$110 million
and $111 million at
September 30, 2017
and 2016, respectively. See Note
4
of the Notes to Consolidated Financial Statements in this Form 10-K for additional information on our private equity investments measured at NAV.
Level 3 assets and liabilities
As of
September 30, 2017
,
10%
of our total assets and
2%
of our total liabilities are financial instruments measured at fair value on a recurring basis. In comparison as of
September 30, 2016
, financial instruments measured at fair value on a recurring basis represented
8%
of our total assets and
3%
of our total liabilities.
Financial instruments measured at fair value on a recurring basis categorized as Level 3 amounted to
$201 million
as of
September 30, 2017
and represent
6%
of our assets measured at fair value. Of the Level 3 assets as of
September 30, 2017
, our ARS positions comprise
$106 million
, or
53%
, and our private equity investments not measured at NAV comprise
$89 million
, or
44%
, of the total. Our Level 3 assets decreased
$14 million
, or
6%
, as compared to the
September 30, 2016
level. Our ARS portfolio decreased approximately $19 million compared to
September 30, 2016
, due to sales within the portfolio (see Notes
4
and
5
of the Notes to Consolidated Financial Statements in this Form 10-K for additional information). Offsetting this decrease, our private equity investments not measured at NAV increased $6 million, as valuation increases more than offset the net impact of capital contributed/distributions received. Level 3 assets represent
4%
of total equity as of
September 30, 2017
.
Valuation techniques
The fair value for certain of our financial instruments is derived using pricing models and other valuation techniques that involve significant management judgment. The price transparency of financial instruments is a key determinant of the degree of judgment involved in determining the fair value of our financial instruments. Financial instruments for which actively quoted prices or pricing parameters are available will generally have a higher degree of price transparency than financial instruments that are thinly traded or not quoted. In accordance with GAAP, the criteria used to determine whether the market for a financial instrument is active or inactive is based on the particular asset or liability. We have determined the market for certain other types of financial instruments, including certain private equity investments, ARS, CMOs, ABS and certain collateralized debt obligations to be volatile, uncertain or inactive as of both
September 30, 2017
and
2016
. As a result, the valuation of these financial instruments included significant management judgment in determining the relevance and reliability of market information available. We considered the inactivity of the market to
64
be evidenced by several factors, including a continued decreased price transparency caused by decreased volume of trades relative to historical levels, stale transaction prices and transaction prices that varied significantly either over time or among market makers.
See Notes
2
and
4
of the Notes to Consolidated Financial Statements in this Form 10-K for further information about the level within the fair value hierarchy, specific valuation techniques and inputs, and other significant accounting policies pertaining to financial instruments at fair value.
Loss provisions
Loss provisions arising from legal and regulatory matters
The recorded amount of liabilities related to legal and regulatory matters is subject to significant management judgment. For a description of the significant estimates and judgments associated with establishing such accruals, see the “Contingent liabilities” section of
Note 2
of the Notes to Consolidated Financial Statements in this Form 10-K. In addition, refer to
Note 17
of the Notes to the Consolidated Financial Statements in this Form 10-K for information regarding legal and regulatory matter contingencies as of
September 30, 2017
.
Loss provisions arising from operations of our Broker-Dealers
The recorded amounts of loss provisions associated with brokerage client receivables and loans to financial advisors and certain key revenue producers are subject to significant management judgment. For a description of the significant estimates and judgments associated with establishing these broker-dealer related loss provisions and the related allowances for doubtful accounts, see the “Brokerage client receivables, net” and “Loans to financial advisors, net” sections of
Note 2
of the Notes to Consolidated Financial Statements in this Form 10-K.
Loan loss provisions arising from operations of RJ Bank
RJ Bank provides an allowance for loan losses which reflects our continuing evaluation of the probable losses inherent in the loan portfolio. Refer to
Note 2
of the Notes to Consolidated Financial Statements in this Form 10-K for discussion of RJ Bank’s policies regarding the allowance for loan losses, and refer to
Note 8
of the Notes to Consolidated Financial Statements in this Form 10-K for quantitative information regarding the allowance balances as of
September 30, 2017
.
At
September 30, 2017
, the amortized cost of all RJ Bank loans was
$17.2 billion
and an allowance for loan losses of
$190 million
was recorded against that balance. The total allowance for loan losses is equal to
1.11%
of the amortized cost of the loan portfolio.
RJ Bank’s process of evaluating its probable loan losses includes a complex analysis of several quantitative and qualitative factors, requiring a substantial amount of judgment. As a result, the allowance for loan losses could be insufficient to cover actual losses. In such an event, any losses in excess of our allowance would result in a decrease in our net income as well as a decrease in the level of regulatory capital at RJ Bank.
Recent accounting developments
For information regarding our recent accounting developments, see
Note 2
of the Notes to Consolidated Financial Statements in this Form 10-K.
Off-Balance sheet arrangements
For information regarding our off-balance sheet arrangements, see
Note 22
of the Notes to Consolidated Financial Statements in this Form 10-K.
Effects of inflation
Our assets are primarily liquid in nature and are not significantly affected by inflation. However, the rate of inflation affects our expenses, including employee compensation, communications and occupancy, which may not be readily recoverable through charges for services we provide to our clients.
65
Risk Management
Risks are an inherent part of our business and activities. Management of these risks is critical to our fiscal soundness and profitability. Our risk management processes are multi-faceted and require communication, judgment and knowledge of financial products and markets. We have a formal Enterprise Risk Management (“ERM”) program to assess and review aggregate risks across the firm. Our management takes an active role in the ERM process, which requires specific administrative and business functions to participate in the identification, assessment, monitoring and control of various risks. The results of this process are extensively documented and reported to executive management and the RJF Audit and Risk Committee of the Board of Directors.
The principal risks related to our business activities are market, credit, liquidity, operational, model and regulatory and legal.
Market risk
Market risk is our risk of loss resulting from the impact of changes in market prices on our inventory, derivative and investment positions. We have exposure to market risk primarily through our broker-dealer trading operations and, to a lesser extent, through our banking operations. Our broker-dealer subsidiaries, primarily RJ&A, trade taxable and tax-exempt debt obligations and act as an active market maker in over-the-counter equity securities. In connection with these activities, we maintain inventories in order to ensure availability of securities and to facilitate client transactions. We also hold investments in MBS, residential mortgage-backed securities, CMOs and equity securities within RJ Bank’s available-for-sale securities portfolio, and also from time-to-time may hold SBA loan securitizations not yet transferred. Additionally, we hold certain ARS in a non-broker-dealer subsidiary of RJF.
See Notes
2
,
4
,
5
and 6 of the Notes to Consolidated Financial Statements in this Form 10-K for fair value and other information regarding our trading inventories, derivatives and available-for-sale securities.
Changes in value of our trading inventory may result from fluctuations in interest rates, credit spreads, equity prices, macroeconomic factors, asset liquidity and dynamic relationships among these factors. We manage our trading inventory by product type and have established trading divisions with responsibility for particular product types. Our primary method of controlling risk in our trading inventory is through the establishment and monitoring of risk-based limits and limits on the dollar amount of securities positions held overnight in inventory. A hierarchy of limits exists at multiple levels including firm, division, asset type (organized as trading desks, e.g., for OTC equities, corporate bonds, municipal bonds), asset sub-type (e.g., below-investment-grade positions) and individual trader. Position limits in trading inventory accounts are monitored on a daily basis. Consolidated position and exposure reports are prepared and distributed daily to senior management. Trading positions are carefully monitored for potential limit violations. Management likewise monitors inventory levels and trading results, as well as inventory aging, pricing, concentration and securities ratings. For our derivatives positions, which are composed primarily of interest rate swaps but include futures contracts and forward foreign exchange contracts, we monitor daily their exposure against established limits with respect to a number of factors, including interest rate, foreign exchange spot and forward rates, spread, ratio, basis and volatility risk. These derivative exposures are monitored both on a total portfolio basis and separately for each agreement for selected maturity periods.
In the normal course of business, we enter into underwriting commitments. RJ&A and RJ Ltd., as a lead or co-lead manager or syndicate member in the underwriting deal, may be subject to market risk on any unsold shares issued in the offering to which we are committed. Risk exposure is controlled by limiting participation, the deal size or through the syndication process.
Interest rate risk
Trading activities
We are exposed to interest rate risk as a result of our trading inventories (primarily comprised of fixed income instruments) in our Capital Markets segment. We actively manage the interest rate risk arising from our fixed income trading securities through the use of hedging strategies that involve U.S. Treasury securities and futures contracts, liquid spread products and derivatives.
We monitor daily, the Value-at-Risk (“VaR”) for all of our trading portfolios. VaR is an appropriate statistical technique for estimating potential losses in trading portfolios due to typical adverse market movements over a specified time horizon with a suitable confidence level. We apply the Fed’s Market Risk Rule (“MRR”) for the purpose of calculating our capital ratios. The MRR, also known as the “Risk-Based Capital Guidelines: Market Risk” rule released by the Fed, OCC and FDIC, requires us to calculate VaR numbers for all of our trading portfolios, including fixed income, equity, foreign exchange and derivative instruments.
To calculate VaR, we use historical simulation. This approach assumes that historical changes in market conditions, such as in interest rates and equity prices, are representative of future changes. The simulation is based on daily market data for the previous twelve
66
months. VaR is reported at a 99% confidence level for a one-day time horizon. Assuming that future market conditions change as they have in the past twelve months, we would expect to incur losses greater than those predicted by our one-day VaR estimates about once every 100 trading days, or about three times per year on average. For regulatory capital calculation purposes, we also report VaR numbers for a ten-day time horizon.
The Fed’s MRR requires us to perform daily back testing procedures of our VaR model, whereby we compare each day’s projected VaR to its regulatory-defined daily trading losses, which exclude fees, commissions, reserves, net interest income and intraday trading. Based on these daily “ex ante” versus “ex post” comparisons, we determine whether the number of times that regulatory-defined daily trading losses exceed VaR is consistent with our expectations at a 99% confidence level. During the twelve months ended
September 30, 2017
, our regulatory-defined daily loss in our trading portfolios exceeded our predicted VaR once.
The following table sets forth the high, low, and daily average VaR for all of our trading portfolios, including fixed income, equity, and derivative instruments, for the period and dates indicated:
|
|
Year ended September 30, 2017
|
Period end VaR
|
Daily average VaR
|
|||||||||||||||||||||
|
$ in thousands
|
High
|
Low
|
September 30,
2017 |
September 30,
2016 |
September 30,
2017 |
September 30,
2016 |
||||||||||||||||||
|
Daily VaR
|
$
|
2,952
|
|
$
|
938
|
|
$
|
1,427
|
|
$
|
1,804
|
|
$
|
1,827
|
|
$
|
1,584
|
|
||||||
The modeling of the risk characteristics of trading positions involves a number of assumptions and approximations. While management believes that its assumptions and approximations are reasonable, there is no uniform industry methodology for estimating VaR, and different assumptions or approximations could produce materially different VaR estimates. As a result, VaR statistics are more reliable when used as indicators of risk levels and trends within a firm than as a basis for inferring differences in risk-taking across firms.
Separately, RJF provides additional market risk disclosures to comply with the MRR. The results of the application of this market risk capital rule are available on our website under
www.raymondjames.com/investor-relations/financial-report
under “Market Risk Rule Disclosure.”
Should markets suddenly become more volatile, actual trading losses may exceed VaR results presented on a single day and might accumulate over a longer time horizon, such as a number of consecutive trading days. Accordingly, management applies additional controls including position limits, a daily review of trading results, review of the status of aged inventory, independent controls on pricing, monitoring of concentration risk, review of issuer ratings and stress testing. We utilize stress testing to complement our VaR analysis so as to measure risk under historical and hypothetical adverse scenarios. During volatile markets we may choose to pare our trading inventories to reduce risk.
As a part of our fixed income public finance operations, we enter into forward commitments to purchase GNMA or FNMA MBS which are issued on behalf of various state and local housing finance agencies. These activities result in exposure to interest rate risk. In order to hedge the interest rate risk to which we would otherwise be exposed between the date of the commitment and the date of sale of the MBS, we enter into to be announced (“TBA”) security contracts with investors for generic MBS securities at specific rates and prices to be delivered on settlement dates in the future. See Notes
2
and
17
of the Notes to Consolidated Financial Statements in this Form 10-K for additional information regarding these activities.
Banking operations
RJ Bank maintains an earning asset portfolio that is comprised of cash, C&I loans, tax-exempt loans, SBL, and commercial and residential real estate loans, as well as MBS and CMOs (both of which are held in the available-for-sale securities portfolio), SBA loan securitizations and a trading portfolio of corporate loans. Those earning assets are primarily funded by client deposits. Based on its current earning asset portfolio, RJ Bank is subject to interest rate risk. During the year, RJ Bank has focused its interest rate risk analysis on the risk of market interest rates rising given the Federal Reserve Bank’s increases in short-term interest rates since December 2015. RJ Bank analyzes interest rate risk based on forecasted net interest income, which is the net amount of interest received and interest paid, and the net portfolio valuation, both in a range of interest rate scenarios.
One of the objectives of RJ Bank’s Asset Liability Management Committee is to manage the sensitivity of net interest income to changes in market interest rates. This committee uses several measures to monitor and limit RJ Bank’s interest rate risk, including scenario analysis and economic value of equity.
RJ Bank uses simulation models and estimation techniques to assess the sensitivity of the net interest income stream to movements in interest rates. To ensure that RJ Bank remains within its tolerances established for net interest income, a sensitivity analysis of net interest income to interest rate conditions is estimated under a variety of scenarios. The model estimates the sensitivity by calculating
67
interest income and interest expense in a dynamic balance sheet environment using current repricing, prepayment, and reinvestment of cash flow assumptions over a twelve month time horizon. Various interest rate scenarios are modeled in order to determine the effect those scenarios may have on net interest income. Scenarios presented include instantaneous interest rate shocks of up 100 and 200 basis points and down 100 basis points. While not presented, additional rate scenarios are performed including interest rate ramps and yield curve shifts that may more realistically mimic the speed of potential interest rate movements. RJ Bank also performs simulations on time horizons up to five years to assess longer term impacts to various interest rate scenarios. On a quarterly basis, RJ Bank tests expected model results to actual performance. Additionally, any changes made to key assumptions in the model are documented and approved by RJ Bank’s Asset Liability Management Committee.
We utilize a hedging strategy using interest rate swaps as a result of RJ Bank’s asset and liability management process described above. For further information regarding this risk management objective, see the discussion of this hedging strategy in
Note 2
and
Note 6
of the Notes to Consolidated Financial Statements in this Form 10-K.
The following table is an analysis of RJ Bank’s estimated net interest income over a 12 month period based on instantaneous shifts in interest rates (expressed in basis points) using RJ Bank’s own asset/liability model:
|
Instantaneous changes in rate
|
Net interest income
($ in thousands)
|
Projected change in
net interest income
|
||
|
+200
|
$655,668
|
(4.16)%
|
||
|
+100
|
$671,707
|
(1.81)%
|
||
|
0
|
$684,104
|
—
|
||
|
-100
|
$553,977
|
(19.02)%
|
||
Refer to “Management’s Discussion and Analysis - Net Interest Analysis” within this Form 10-K, for a discussion of the impact that an increase in short-term interest rates could have on RJF’s operations.
The following table shows the contractual maturities of RJ Bank’s loan portfolio at
September 30, 2017
, including contractual principal repayments. This table does not, however, include any estimates of prepayments. These prepayments could shorten the average loan lives and cause the actual timing of the loan repayments to differ significantly from those shown in the following table. Loan amounts in the table below exclude unearned income and deferred expenses.
|
|
Due in
|
|||||||||||||||
|
$ in thousands
|
One year or less
|
> One year – five
years
|
> 5 years
|
Total
|
||||||||||||
|
Loans held for sale
|
$
|
—
|
|
$
|
36,030
|
|
$
|
31,861
|
|
$
|
67,891
|
|
||||
|
Loans held for investment:
|
|
|
|
|
|
|
|
|
||||||||
|
C&I loans
|
114,443
|
|
4,098,767
|
|
3,172,700
|
|
7,385,910
|
|
||||||||
|
CRE construction loans
|
—
|
|
112,681
|
|
—
|
|
112,681
|
|
||||||||
|
CRE loans
|
546,414
|
|
2,001,057
|
|
558,819
|
|
3,106,290
|
|
||||||||
|
Tax-exempt loans
|
—
|
|
4,295
|
|
1,013,496
|
|
1,017,791
|
|
||||||||
|
Residential mortgage loans
|
1,662
|
|
2,668
|
|
3,144,400
|
|
3,148,730
|
|
||||||||
|
SBL
|
2,383,183
|
|
3,514
|
|
—
|
|
2,386,697
|
|
||||||||
|
Total loans held for investment
|
3,045,702
|
|
6,222,982
|
|
7,889,415
|
|
17,158,099
|
|
||||||||
|
Total loans
|
$
|
3,045,702
|
|
$
|
6,259,012
|
|
$
|
7,921,276
|
|
$
|
17,225,990
|
|
||||
68
The following table shows the distribution of the recorded investment of those RJ Bank loans that mature in more than one year between fixed and adjustable interest rate loans at
September 30, 2017
. Loan amounts in the table below exclude unearned income and deferred expenses.
|
|
Interest rate type
|
|||||||||||
|
$ in thousands
|
Fixed
|
Adjustable
|
|
Total
|
||||||||
|
Loans held for sale
|
$
|
3,593
|
|
$
|
64,298
|
|
|
$
|
67,891
|
|
||
|
Loans held for investment:
|
|
|
|
|
|
|
|
|||||
|
C&I loans
|
1,700
|
|
7,269,767
|
|
7,271,467
|
|
||||||
|
CRE construction loans
|
—
|
|
112,681
|
|
112,681
|
|
||||||
|
CRE loans
|
44,181
|
|
2,515,695
|
|
2,559,876
|
|
||||||
|
Tax-exempt loans
|
1,017,791
|
|
—
|
|
1,017,791
|
|
||||||
|
Residential mortgage loans
|
230,816
|
|
2,916,252
|
|
3,147,068
|
|
||||||
|
SBL
|
3,514
|
|
—
|
|
|
3,514
|
|
|||||
|
Total loans held for investment
|
1,298,002
|
|
12,814,395
|
|
|
14,112,397
|
|
|||||
|
Total loans
|
$
|
1,301,595
|
|
$
|
12,878,693
|
|
|
$
|
14,180,288
|
|
||
Contractual loan terms for C&I, CRE, CRE construction and residential mortgage loans may include an interest rate floor and/or fixed interest rates for a certain period of time, which would impact the timing of the interest rate reset for the respective loan.
See the discussion within the “Management’s Discussion and Analysis - Credit Risk - Risk Monitoring process” section of this Form 10-K for additional information regarding RJ Bank’s interest-only residential mortgage loan portfolio.
In our available-for-sale portfolio, we hold primarily fixed-rate agency MBS and CMOs which were carried at fair value in our Consolidated Statements of Financial Condition at
September 30, 2017
with changes in the fair value of the portfolio recorded through “Other comprehensive income” in our Consolidated Statements of Income and Comprehensive Income. At
September 30, 2017
, our portfolio had a fair value of
$2.08 billion
with a weighted-average yield of
1.94%
and average expected duration of 3 years. See
Note 5
in the Notes to Consolidated Financial Statements for additional information.
Other
We hold ARS, which are long-term variable rate securities tied to short-term interest rates, that are accounted for as available-for-sale and are carried at fair value on our Consolidated Statements of Financial Condition. As short-term interest rates rise, due to the variable nature of the penalty interest rate provisions embedded in most of these securities in the event auctions fail to set the security’s interest rate, then a penalty rate that is specified in the security increases. These penalty rates are based upon a stated interest rate spread over what is typically a short-term base interest rate index. Changes in interest rates impact the fair value as we estimate that at some level of increase in short-term interest rates, issuers of the securities will have the economic incentive to refinance (and thus prepay) the securities. The faster and steeper short-term interest rates rise, the earlier prepayments will likely occur and the higher the fair value of the security. See Notes
2
and
4
of the Notes to Consolidated Financial Statements in this Form 10-K for additional information on the fair value of these securities.
Equity price risk
We are exposed to equity price risk as a consequence of making markets in equity securities. Our broker-dealer activities are primarily client-driven, with the objective of meeting clients’ needs while earning a trading profit to compensate for the risk associated with carrying inventory. We attempt to reduce the risk of loss inherent in our inventory of equity securities by monitoring those security positions throughout each day and establishing position limits.
In addition, our private equity investments may be impacted by equity prices.
Foreign exchange risk
We are subject to foreign exchange risk due to our investments in foreign subsidiaries as well as transactions and resulting balances denominated in a currency other than the U.S. dollar.
69
Investments in foreign subsidiaries
RJ Bank has an investment in a Canadian subsidiary, resulting in foreign exchange risk. To mitigate this risk, RJ Bank utilizes short-term, forward foreign exchange contracts. These derivative agreements are primarily accounted for as net investment hedges in the consolidated financial statements. See Notes
2
and
6
of the Notes to Consolidated Financial Statements in this Form 10-K for further information regarding these derivative contracts.
We have foreign exchange risk in our investment in RJ Ltd. of
CDN
$340 million at
September 30, 2017
, which is not hedged. Foreign exchange gains/losses related to this investment are primarily reflected in other comprehensive income/(loss) (“OCI”) on our Consolidated Statements of Income and Comprehensive Income. See
Note 18
of the Notes to Consolidated Financial Statements in this Form 10-K for further information regarding all of our components of OCI.
We also have foreign exchange risk associated with our investments in subsidiaries located in the United Kingdom, France and Germany. These investments are not hedged and we do not believe we have material foreign exchange risk either individually, or in the aggregate, pertaining to these subsidiaries.
Transactions and resulting balances denominated in a currency other than the U.S. dollar
We are subject to foreign exchange risk due to our holdings of cash and certain other assets and liabilities resulting from transactions denominated in a currency other than the U.S. dollar. Any currency related gains/losses arising from these foreign currency denominated balances are reflected in “Other revenues” in our Consolidated Statements of Income and Comprehensive Income. The foreign exchange risk associated with a portion of such transactions and balances denominated in foreign currency are mitigated utilizing short-term, forward foreign exchange contracts. Such derivatives are not designated hedges and therefore the related gains/losses associated with these contracts are included in “Other revenues” in our Consolidated Statements of Income and Comprehensive Income. See
Note 6
of the Notes to Consolidated Financial Statements in this Form 10-K for information regarding our derivative contracts.
Credit risk
Credit risk is the risk of loss due to adverse changes in a borrower’s, issuer’s or counterparty’s ability to meet its financial obligations under contractual or agreed upon terms. The nature and amount of credit risk depends on the type of transaction, the structure and duration of that transaction, and the parties involved. Credit risk is an integral component of the profit assessment of lending and other financing activities.
We are engaged in various trading and brokerage activities in which our counterparties primarily include broker-dealers, banks and other financial institutions. We are exposed to risk that these counterparties may not fulfill their obligations. The risk of default depends on the creditworthiness of the counterparty and/or the issuer of the instrument. We manage this risk by imposing and monitoring individual and aggregate position limits within each business segment for each counterparty, conducting regular credit reviews of financial counterparties, reviewing security and loan concentrations, holding and calculating the fair value of collateral on certain transactions and conducting business through clearing organizations, which may guarantee performance.
Our client activities involve the execution, settlement, and financing of various transactions on behalf of our clients. Client activities are transacted on either a cash or margin basis. Credit exposure results from client margin accounts, which are monitored daily and are collateralized. We monitor exposure to industry sectors and individual securities and perform analysis on a regular basis in connection with our margin lending activities. We adjust our margin requirements if we believe our risk exposure is not appropriate based on market conditions. In addition, when clients execute a purchase, we are at some risk that the client will renege on the trade. If this occurs, we may have to liquidate the position at a loss. However, most private clients have available funds in the account before the trade is executed.
We offer loans to financial advisors and certain other key revenue producers, primarily for recruiting, transitional cost assistance and retention purposes. We have credit risk and may incur a loss in the event that such borrower declares bankruptcy or is no longer affiliated with us. Historically, such losses have not been significant due to our strong advisor retention and successful collection efforts.
We are subject to concentration risk if we hold large positions, extend large loans to, or have large commitments with a single counterparty, borrower, or group of similar counterparties or borrowers (e.g., in the same industry). Securities purchased under agreements to resell consist primarily of securities issued by the U.S. government or its agencies. Receivables from and payables to clients and securities borrow and lending activities are conducted with a large number of clients and counterparties and potential concentration is carefully monitored. Inventory and investment positions taken and commitments made, including underwritings, may involve exposure to individual issuers and businesses. We seek to limit this risk through careful review of the underlying business and the use of limits
70
established by senior management, taking into consideration factors including the financial strength of the counterparty, the size of the position or commitment, the expected duration of the position or commitment and other positions or commitments outstanding.
ARS held by a non-broker-dealer subsidiary of RJF is impacted by the credit worthiness of the ARS issuer. See Note 5 of the Notes to Consolidated Financial Statements in this Form 10-K for more information.
The Bank has substantial C&I, CRE, tax-exempt, SBL and residential mortgage loan portfolios. A significant downturn in the overall economy, deterioration in real estate values or a significant issue within any sector or sectors where RJ Bank has a concentration could result in large provisions for loan losses and/or charge-offs.
RJ Bank’s strategy for credit risk management includes well-defined credit policies, uniform underwriting criteria, and ongoing risk monitoring and review processes for all corporate, tax-exempt, residential and SBL credit exposures. The strategy also includes diversification on a geographic, industry and customer level, regular credit examinations and management reviews of all corporate and tax-exempt loans as well as individual delinquent residential loans. The credit risk management process also includes an annual independent review of the credit risk monitoring process that performs assessments of compliance with credit policies, risk ratings, and other critical credit information. RJ Bank seeks to identify potential problem loans early, record any necessary risk rating changes and charge-offs promptly and maintain appropriate reserve levels for probable inherent losses. RJ Bank utilizes a comprehensive credit risk rating system to measure the credit quality of individual corporate and tax-exempt loans and related unfunded lending commitments, including the probability of default and/or loss given default of each corporate and tax-exempt loan, and commitment outstanding. For its SBL and residential mortgage loans, RJ Bank utilizes the credit risk rating system used by bank regulators in measuring the credit quality of each homogeneous class of loans.
RJ Bank’s allowance for loan losses methodology is described in Note 2 of the Notes to Consolidated Financial Statements in this Form 10-K. As RJ Bank’s loan portfolio is segregated into six portfolio segments, likewise, the allowance for loan losses is segregated by these same segments. The risk characteristics relevant to each portfolio segment are as follows:
C&I: Loans in this segment are made to businesses and are generally secured by all assets of the business. Repayment is expected from the cash flows of the respective business. Unfavorable economic and political conditions, including the resultant decrease in consumer or business spending, may have an adverse effect on the credit quality of loans in this segment.
CRE: Loans in this segment are primarily secured by income-producing properties. For owner-occupied properties, the cash flows are derived from the operations of the business, and the underlying cash flows may be adversely affected by the deterioration in the financial condition of the operating business. The underlying cash flows generated by non-owner-occupied properties may be adversely affected by increased vacancy and rental rates, which are monitored on a quarterly basis. Adverse developments in either of these areas may have a negative effect on the credit quality of loans in this segment.
CRE construction: Loans in this segment have similar risk characteristics of loans in the CRE segment as described above. In addition, project budget overruns and performance variables related to the contractor and subcontractors may affect the credit quality of loans in this segment. With respect to commercial construction of residential developments, there is also the risk that the builder has a geographical concentration of developments. Adverse developments in all of these areas may significantly affect the credit quality of the loans in this segment.
Tax-exempt: Loans in this segment are made to governmental and nonprofit entities and are generally secured by a pledge of revenue and, in some cases, by a security interest in or a mortgage on the asset being financed. For loans to governmental entities, repayment is expected from a pledge of certain revenues or taxes. For nonprofit entities, repayment is expected from revenues which may include fundraising proceeds. These loans are subject to demographic risk, therefore much of the credit assessment of tax-exempt loans is driven by the entity’s revenue base and general economic environment. Adverse developments in either of these areas may have a negative effect on the credit quality of loans in this segment.
Residential mortgage (includes home equity loans/lines): All of RJ Bank’s residential mortgage loans adhere to stringent underwriting parameters pertaining to credit score and credit history, debt-to-income ratio of borrower, loan-to-value (“LTV”), and combined LTV (including second mortgage/home equity loans). RJ Bank does not originate or purchase option adjustable rate mortgage (“ARM”) loans with negative amortization, reverse mortgages, or other types of non-traditional loan products. Loans with deeply discounted teaser rates are not originated or purchased. All loans in this segment are collateralized by residential real estate and repayment is primarily dependent on the credit quality of the individual borrower. A decline in the strength of the economy, particularly unemployment rates and housing prices, among other factors, could have a significant effect on the credit quality of loans in this segment.
71
SBL: Loans in this segment are secured by marketable securities at advance rates consistent with industry standards. These loans are monitored daily for adherence to LTV guidelines and when a loan exceeds the required LTV, a collateral call is issued. Past due loans are minimal as any past due amounts result in a notice to the client for payment or the potential sale of securities which will bring the loan current and may bring the loan within the prescribed LTV guidelines.
In evaluating credit risk, RJ Bank considers trends in loan performance, the level of allowance coverage relative to similar banking institutions, industry or customer concentrations, the loan portfolio composition and macroeconomic factors. Retail sales continue to be sluggish and credit quality trends, while improved in some sectors, remain somewhat tenuous. There also continue to be concerns over the energy sector as well as ongoing uncertainty in the healthcare sector in regard to the status of the Patient Protection and Affordable Care Act. These factors have a potentially negative impact on loan performance and net charge-offs. However, during fiscal year
2017
, corporate borrowers have continued to access the markets for new equity and debt.
Several factors were taken into consideration in evaluating the allowance for loan losses at
September 30, 2017
, including the risk profile of the portfolios, net charge-offs during the period, the level of nonperforming loans, and delinquency ratios. RJ Bank also considered the uncertainty related to certain industry sectors and the extent of credit exposure to specific borrowers within the portfolio. Finally, RJ Bank considered current economic conditions that might impact the portfolio. RJ Bank determined the allowance that was required for specific loan grades based on relative risk characteristics of the loan portfolio. On an ongoing basis, RJ Bank evaluates its methods for determining the allowance for each class of loans and makes enhancements it considers appropriate. There was no material change in RJ Bank’s methodology for determining the allowance for loan losses during the twelve months ended
September 30, 2017
.
Changes in the allowance for loan losses of RJ Bank were as follows:
|
|
For the year ended September 30,
|
|||||||||||||||||||
|
$ in thousands
|
2017
|
2016
|
2015
|
2014
|
2013
|
|||||||||||||||
|
Allowance for loan losses, beginning of year
|
$
|
197,378
|
|
$
|
172,257
|
|
$
|
147,574
|
|
$
|
136,501
|
|
$
|
147,541
|
|
|||||
|
Provision for loan losses
|
12,987
|
|
28,167
|
|
23,570
|
|
13,565
|
|
2,565
|
|
||||||||||
|
Charge-offs:
|
|
|
|
|
|
|
|
|
|
|
||||||||||
|
C&I loans
|
(26,088
|
)
|
(2,956
|
)
|
(1,191
|
)
|
(1,845
|
)
|
(813
|
)
|
||||||||||
|
CRE loans
|
—
|
|
—
|
|
—
|
|
(16
|
)
|
(9,599
|
)
|
||||||||||
|
Residential mortgage loans
|
(918
|
)
|
(1,470
|
)
|
(1,667
|
)
|
(2,015
|
)
|
(7,025
|
)
|
||||||||||
|
Total charge-offs
|
(27,006
|
)
|
(4,426
|
)
|
(2,858
|
)
|
(3,876
|
)
|
(17,437
|
)
|
||||||||||
|
Recoveries:
|
|
|
|
|
|
|
||||||||||||||
|
C&I loans
|
340
|
|
—
|
|
611
|
|
16
|
|
117
|
|
||||||||||
|
CRE loans
|
5,013
|
|
—
|
|
3,773
|
|
80
|
|
1,680
|
|
||||||||||
|
Residential mortgage loans
|
1,001
|
|
1,417
|
|
1,231
|
|
2,033
|
|
2,331
|
|
||||||||||
|
Total recoveries
|
6,354
|
|
1,417
|
|
5,615
|
|
2,129
|
|
4,128
|
|
||||||||||
|
Net (charge-offs)/recoveries
|
(20,652
|
)
|
(3,009
|
)
|
2,757
|
|
(1,747
|
)
|
(13,309
|
)
|
||||||||||
|
Foreign exchange translation adjustment
|
729
|
|
(37
|
)
|
(1,644
|
)
|
(745
|
)
|
(296
|
)
|
||||||||||
|
Allowance for loan losses, end of year
|
$
|
190,442
|
|
$
|
197,378
|
|
$
|
172,257
|
|
$
|
147,574
|
|
$
|
136,501
|
|
|||||
|
Allowance for loan losses to total bank loans outstanding
|
1.11
|
%
|
1.30
|
%
|
1.32
|
%
|
1.33
|
%
|
1.52
|
%
|
||||||||||
The primary factor resulting in the decreased provision as compared to fiscal 2016 was significantly lower C&I loan growth during fiscal 2017, which has higher allowance percentages, and the impact of higher growth in the residential mortgage, securities-based and tax-exempt loan portfolios, which have lower allowance percentages. This positive impact was partially offset by additional provision during the current year for C&I and CRE loans in specific industry sectors. Reflecting this change in loan portfolio mix and an overall improvement in credit quality, the total allowance for loan losses to total bank loans outstanding declined to
1.11%
at
September 30, 2017
from
1.30%
at
September 30, 2016
.
72
The following table presents net loan (charge-offs)/recoveries and the percentage of net loan (charge-offs)/recoveries to the average outstanding loan balances by loan portfolio segment:
|
|
For the year ended September 30,
|
||||||||||||||||||||
|
|
2017
|
2016
|
2015
|
||||||||||||||||||
|
$ in thousands
|
Net loan
(charge-off)/recovery
amount
|
% of avg.
outstanding
loans
|
Net loan
(charge-off)/recovery
amount
|
% of avg.
outstanding
loans
|
Net loan
(charge-off)/recovery
amount
|
% of avg.
outstanding
loans
|
|||||||||||||||
|
C&I loans
|
$
|
(25,748
|
)
|
0.35
|
%
|
$
|
(2,956
|
)
|
0.04
|
%
|
$
|
(580
|
)
|
0.01
|
%
|
||||||
|
CRE loans
|
5,013
|
|
0.18
|
%
|
—
|
|
—
|
|
3,773
|
|
0.22
|
%
|
|||||||||
|
Residential mortgage loans
|
83
|
|
—
|
|
(53
|
)
|
—
|
|
(436
|
)
|
0.02
|
%
|
|||||||||
|
Total
|
$
|
(20,652
|
)
|
0.13
|
%
|
$
|
(3,009
|
)
|
0.02
|
%
|
$
|
2,757
|
|
0.02
|
%
|
||||||
|
For the year ended September 30,
|
||||||||||||||
|
|
2014
|
2013
|
||||||||||||
|
$ in thousands
|
Net loan
(charge-off)/recovery amount
|
% of avg.
outstanding
loans
|
Net loan
(charge-off)/recovery amount
|
% of avg.
outstanding
loans
|
||||||||||
|
C&I loans
|
$
|
(1,829
|
)
|
0.03
|
%
|
$
|
(696
|
)
|
0.01
|
%
|
||||
|
CRE loans
|
64
|
|
—
|
|
(7,919
|
)
|
0.73
|
%
|
||||||
|
Residential mortgage loans
|
18
|
|
—
|
|
(4,694
|
)
|
0.27
|
%
|
||||||
|
Total
|
$
|
(1,747
|
)
|
0.02
|
%
|
$
|
(13,309
|
)
|
0.15
|
%
|
||||
The level of charge-off activity is a factor that is considered in evaluating the potential for severity of future credit losses. Net charge-offs during fiscal 2017 increased $18 million as compared to the prior year, driven by the resolution of one C&I loan which resulted in a significant charge-off during fiscal 2017.
The tables below presents the nonperforming loans balance and total allowance for loan losses balance as of the period presented:
|
September 30,
|
||||||||||||||||||||||||
|
|
2017
|
2016
|
2015
|
|||||||||||||||||||||
|
$ in thousands
|
Nonperforming
loans
|
Allowance for
loan losses
|
Nonperforming
loans
|
Allowance for
loan losses
|
Nonperforming
loans
|
Allowance for
loan losses
|
||||||||||||||||||
|
Loans held for investment:
|
|
|
|
|
|
|
|
|
|
|
|
|
||||||||||||
|
C&I loans
|
$
|
5,221
|
|
$
|
(119,901
|
)
|
$
|
35,194
|
|
$
|
(137,701
|
)
|
$
|
—
|
|
$
|
(117,623
|
)
|
||||||
|
CRE construction loans
|
—
|
|
(1,421
|
)
|
—
|
|
(1,614
|
)
|
—
|
|
(2,707
|
)
|
||||||||||||
|
CRE loans
|
—
|
|
(41,749
|
)
|
4,230
|
|
(36,533
|
)
|
4,796
|
|
(30,486
|
)
|
||||||||||||
|
Tax-exempt loans
|
—
|
|
(6,381
|
)
|
—
|
|
(4,100
|
)
|
—
|
|
(5,949
|
)
|
||||||||||||
|
Residential mortgage loans
|
33,749
|
|
(16,691
|
)
|
41,783
|
|
(12,664
|
)
|
47,823
|
|
(12,526
|
)
|
||||||||||||
|
SBL
|
—
|
|
(4,299
|
)
|
—
|
|
(4,766
|
)
|
—
|
|
(2,966
|
)
|
||||||||||||
|
Total
|
$
|
38,970
|
|
$
|
(190,442
|
)
|
$
|
81,207
|
|
$
|
(197,378
|
)
|
$
|
52,619
|
|
$
|
(172,257
|
)
|
||||||
|
Total nonperforming loans as a % of RJ Bank total loans
|
0.23
|
%
|
0.53
|
%
|
0.40
|
%
|
||||||||||||||||||
|
September 30,
|
||||||||||||||||
|
|
2014
|
2013
|
||||||||||||||
|
$ in thousands
|
Nonperforming
loans
|
Allowance for
loan losses
|
Nonperforming
loans
|
Allowance for
loan losses
|
||||||||||||
|
Loans held for investment:
|
|
|
|
|
|
|
|
|
||||||||
|
C&I loans
|
$
|
—
|
|
$
|
(103,179
|
)
|
$
|
89
|
|
$
|
(95,994
|
)
|
||||
|
CRE construction loans
|
—
|
|
(1,594
|
)
|
—
|
|
(1,000
|
)
|
||||||||
|
CRE loans
|
18,876
|
|
(25,022
|
)
|
25,512
|
|
(19,266
|
)
|
||||||||
|
Tax-exempt loans
|
—
|
|
(1,380
|
)
|
—
|
|
—
|
|
||||||||
|
Residential mortgage loans
|
61,789
|
|
(14,350
|
)
|
76,357
|
|
(19,126
|
)
|
||||||||
|
SBL
|
—
|
|
(2,049
|
)
|
—
|
|
(1,115
|
)
|
||||||||
|
Total
|
$
|
80,665
|
|
$
|
(147,574
|
)
|
$
|
101,958
|
|
$
|
(136,501
|
)
|
||||
|
Total nonperforming loans as a % of RJ Bank total loans
|
0.73
|
%
|
1.14
|
%
|
||||||||||||
73
The level of nonperforming loans is another indicator of potential future credit losses. The amount of nonperforming loans decreased $42 million during the year ended
September 30, 2017
, due to a $30 million decrease in nonperforming C&I loans, an $8 million decrease in nonperforming residential mortgage loans and a $4 million decrease in nonperforming CRE loans. Included in nonperforming residential mortgage loans are $31 million of loans for which $15 million in charge-offs were previously recorded, resulting in less exposure within the remaining balance.
The nonperforming loan balances above exclude $14 million, $14 million, $15 million, $14 million and $10 million as of September 30, 2017, 2016, 2015, 2014 and 2013 respectively, of residential troubled debt restructurings (“TDR”) which were returned to accrual status in accordance with our policy.
Loan underwriting policies
A component of RJ Bank’s credit risk management strategy is conservative, well-defined policies and procedures. RJ Bank’s underwriting policies for the major types of loans are described below.
SBL and residential mortgage loan portfolios
RJ Bank’s residential mortgage loan portfolio consists of first mortgage loans originated by RJ Bank via referrals from our PCG financial advisors and the general public as well as first mortgage loans purchased by RJ Bank. All of RJ Bank’s residential mortgage loans adhere to strict underwriting parameters pertaining to credit score and credit history, debt-to-income ratio of the borrower, LTV, and combined LTV (including second mortgage/home equity loans). As of
September 30, 2017
, approximately 80% of the residential loans were fully documented loans to industry standards and 96% of the residential mortgage loan portfolio consisted of owner-occupant borrowers (80% for their primary residences and 20% for second home residences). Approximately 20% of the first lien residential mortgage loans were ARMs with interest-only payments based on a fixed rate for an initial period of the loan, typically five to seven years, then become fully amortizing, subject to annual and lifetime interest rate caps. A significant portion of our originated 15 or 30-year fixed-rate mortgage loans are sold in the secondary market. RJ Bank’s SBL portfolio is comprised of loans fully collateralized by client’s marketable securities and represented 14% of RJ Bank’s total loan portfolio as of
September 30, 2017
. The underwriting policy for RJ Bank’s SBL primarily includes a review of collateral, including LTV, with a limited review of repayment history.
While RJ Bank has chosen not to participate in any government-sponsored loan modification programs, its loan modification policy does take into consideration some of the programs’ parameters and supports every effort to assist borrowers within the guidelines of safety and soundness. In general, RJ Bank considers the qualification terms outlined in the government-sponsored programs as well as the affordability test and other factors. RJ Bank retains flexibility to determine the appropriate modification structure and required documentation to support the borrower’s current financial situation before approving a modification. Short sales are also used by RJ Bank to mitigate credit losses.
Corporate and tax-exempt loan portfolios
RJ Bank’s corporate and tax-exempt loan portfolios were comprised of approximately 500 borrowers, the majority of which are underwritten, managed and reviewed at our corporate headquarters location, which facilitates close monitoring of the portfolio by credit risk personnel, relationship officers and senior RJ Bank executives. RJ Bank’s corporate loan portfolio is diversified among a number of industries in both the U.S. and Canada and comprised of project finance real estate loans, commercial lines of credit and term loans, the majority of which are participations in Shared National Credit (“SNC”) or other large syndicated loans, and tax-exempt loans. RJ Bank is sometimes involved in the syndication of the loan at inception and some of these loans have been purchased in the secondary trading markets. The remainder of the corporate loan portfolio is comprised of smaller participations and direct loans. There are no subordinated loans or mezzanine financings in the corporate loan portfolio. RJ Bank’s tax-exempt loans are long-term loans to governmental and nonprofit entities. These loans generally have lower overall credit risk, but are subject to other risks that are not usually present with corporate clients, including the risk associated with the constituency served by a local government and the risk in ensuring an obligation has appropriate tax treatment.
Regardless of the source, all corporate and tax-exempt loans are independently underwritten to RJ Bank credit policies and are subject to approval by a loan committee, and credit quality is monitored on an on-going basis by RJ Bank’s lending staff. RJ Bank credit policies include criteria related to LTV limits based upon property type, single borrower loan limits, loan term and structure parameters (including guidance on leverage, debt service coverage ratios and debt repayment ability), industry concentration limits, secondary sources of repayment, municipality demographics, and other criteria. A large portion of RJ Bank’s corporate loans are to borrowers in industries in which we have expertise, through coverage provided by our Capital Markets research analysts. More than half of RJ Bank’s corporate borrowers are public companies. RJ Bank’s corporate loans are generally secured by all assets of the borrower, in
74
some instances are secured by mortgages on specific real estate, and with respect to tax-exempt loans, are generally secured by a pledge of revenue. In a limited number of transactions, loans in the portfolio are extended on an unsecured basis. In addition, all corporate and tax-exempt loans are subject to RJ Bank’s regulatory review.
Risk monitoring process
Another component of the credit risk strategy at RJ Bank is the ongoing risk monitoring and review processes for all residential, SBL, corporate and tax-exempt credit exposures, as well as our rigorous processes to manage and limit credit losses arising from loan delinquencies. There are various other factors included in these processes, depending on the loan portfolio.
SBL and residential mortgage loans
The marketable collateral securing RJ Bank’s SBL is monitored on a daily basis. Collateral adjustments are made by the borrower as necessary to ensure RJ Bank’s loans are adequately secured, resulting in minimizing its credit risk. Collateral calls have been minimal relative to our SBL portfolio with no losses incurred to date.
We track and review many factors to monitor credit risk in RJ Bank’s residential mortgage loan portfolio. The qualitative factors include, but are not limited to: loan performance trends, loan product parameters and qualification requirements, borrower credit scores, occupancy (i.e., owner-occupied, second home or investment property), level of documentation, loan purpose, geographic concentrations, average loan size, loan policy exceptions and updated LTV ratios. These qualitative measures, while considered and reviewed in establishing the allowance for loan losses, have not resulted in any material quantitative adjustments to RJ Bank’s historical loss rates.
RJ Bank obtains the most recently available information (generally updated every six months) to estimate current LTV ratios on the individual loans in the performing residential mortgage loan portfolio. Current LTV ratios are estimated based on the initial appraisal obtained at the time of origination, adjusted using relevant market indices for housing price changes that have occurred since origination. The value of the homes could vary from actual market values due to change in the condition of the underlying property, variations in housing price changes within current valuation indices and other factors.
At
September 30, 2017
, the average estimated LTV was 53% for the total residential mortgage loan portfolio. Residential mortgage loans with estimated LTVs in excess of 100% represent much less than 1% of the residential mortgage loan portfolio as of
September 30, 2017
. Credit risk management considers this data in conjunction with delinquency statistics, loss experience and economic circumstances to establish appropriate allowance for loan losses for the residential mortgage loan portfolio.
At
September 30, 2017
, loans over 30 days delinquent (including nonperforming loans) decreased to 0.73% of residential mortgage loans outstanding, compared to 1.20% over 30 days delinquent at
September 30, 2016
. Additionally, our
September 30, 2017
percentage compares favorably to the national average for over 30 day delinquencies of 4.05% as most recently reported by the Fed. RJ Bank’s significantly lower delinquency rate as compared to its peers is the result of our uniform underwriting policies, the lack of subprime loans and the limited amount of non-traditional loan products.
The following table presents a summary of delinquent residential mortgage loans, which is comprised of loans which are two or more payments past due as well as loans in the process of foreclosure.
|
|
Amount of delinquent residential loans
|
Delinquent residential loans as a percentage of outstanding loan balances
|
|||||||||||||||||||
|
$ in thousands
|
30-89 days
|
90 days or more
|
Total
|
30-89 days
|
90 days or more
|
Total
|
|||||||||||||||
|
September 30, 2017
|
|
|
|
|
|
|
|||||||||||||||
|
Residential mortgage loans:
|
|
|
|||||||||||||||||||
|
First mortgage loans
|
$
|
3,061
|
|
$
|
19,823
|
|
$
|
22,884
|
|
0.10
|
%
|
0.63
|
%
|
0.73
|
%
|
||||||
|
Home equity loans/lines
|
248
|
|
18
|
|
266
|
|
0.91
|
%
|
0.07
|
%
|
0.98
|
%
|
|||||||||
|
Total residential mortgage loans
|
$
|
3,309
|
|
$
|
19,841
|
|
$
|
23,150
|
|
0.10
|
%
|
0.63
|
%
|
0.73
|
%
|
||||||
|
September 30, 2016
|
|||||||||||||||||||||
|
Residential mortgage loans:
|
|||||||||||||||||||||
|
First mortgage loans
|
$
|
3,950
|
|
$
|
25,429
|
|
$
|
29,379
|
|
0.16
|
%
|
1.05
|
%
|
1.21
|
%
|
||||||
|
Home equity loans/lines
|
—
|
|
20
|
|
20
|
|
—
|
|
0.10
|
%
|
0.10
|
%
|
|||||||||
|
Total residential mortgage loans
|
$
|
3,950
|
|
$
|
25,449
|
|
$
|
29,399
|
|
0.16
|
%
|
1.04
|
%
|
1.20
|
%
|
||||||
75
To manage and limit credit losses, we maintain a rigorous process to manage our loan delinquencies. With all residential first mortgages serviced by a third party, the primary collection effort resides with the servicer. RJ Bank personnel direct and actively monitor the servicers’ efforts through extensive communications regarding individual loan status changes and requirements of timely and appropriate collection or property management actions and reporting, including management of third parties used in the collection process (appraisers, attorneys, etc.). Additionally, every residential mortgage loan over 60 days past due is reviewed by RJ Bank personnel monthly and documented in a written report detailing delinquency information, balances, collection status, appraised value, and other data points. RJ Bank senior management meets monthly to discuss the status, collection strategy and charge-off/write-down recommendations on every residential mortgage loan over 60 days past due. Updated collateral valuations are obtained for loans over 90 days past due and charge-offs are taken on individual loans based on these valuations.
Credit risk is also managed by diversifying the residential mortgage portfolio. The geographic concentrations (top five states) of RJ Bank’s one-to-four family residential mortgage loans are as follows:
|
September 30, 2017
|
September 30, 2016
|
|||||||
|
Loans outstanding as a % of RJ Bank total residential mortgage loans
|
Loans outstanding as a % of RJ Bank total loans
|
Loans outstanding as a % of RJ Bank total residential mortgage loans
|
Loans outstanding as a % of RJ Bank total loans
|
|||||
|
CA
|
23.8%
|
4.4%
|
CA
|
24.3%
|
3.9%
|
|||
|
FL
|
18.9%
|
3.5%
|
FL
|
18.1%
|
2.9%
|
|||
|
TX
|
7.8%
|
1.4%
|
TX
|
6.8%
|
1.1%
|
|||
|
NY
|
6.8%
|
1.3%
|
NY
|
5.3%
|
0.8%
|
|||
|
CO
|
3.4%
|
0.6%
|
IL
|
3.5%
|
0.6%
|
|||
Loans where borrowers may be subject to payment increases include adjustable rate mortgage loans with terms that initially require payment of interest only. Payments may increase significantly when the interest-only period ends and the loan principal begins to amortize. At
September 30, 2017
and
2016
, these loans totaled $683 million and $308 million, respectively, or approximately 20% and 10% of the residential mortgage portfolio, respectively. At
September 30, 2017
, the balance of amortizing, former interest-only, loans totaled $426 million. The weighted average number of years before the remainder of the loans, which were still in their interest-only period at
September 30, 2017
, begins amortizing is 6.9 years.
A component of credit risk management for the residential portfolio is the LTV and borrower credit score at origination or purchase. The most recent weighted-average LTV/FICO scores at origination of RJ Bank’s residential first mortgage loan portfolio are as follows:
|
|
September 30, 2017
|
September 30, 2016
|
|
|
Residential first mortgage loan weighted-average LTV/FICO
|
65%/758
|
65%/760
|
|
Corporate and tax-exempt loans
Credit risk in RJ Bank’s corporate and tax-exempt loan portfolios are monitored on an individual loan basis for trends in borrower operating performance, payment history, credit ratings, collateral performance, loan covenant compliance, semi-annual SNC exam results, municipality demographics and other factors including industry performance and concentrations. As part of the credit review process the loan grade is reviewed at least quarterly to confirm the appropriate risk rating for each credit. The individual loan ratings resulting from the SNC exams are incorporated in RJ Bank’s internal loan ratings when the ratings are received and if the SNC rating is lower on an individual loan than RJ Bank’s internal rating, the loan is downgraded. While RJ Bank considers historical SNC exam results in its loan ratings methodology, differences between the SNC exam and internal ratings on individual loans typically arise due to subjectivity of the loan classification process. These differences may result in additional provision for loan losses in periods when SNC exam results are received. See
Note 2
of the Notes to Consolidated Financial Statements in this Form 10-K, specifically the “Bank loans, net” section, for additional information on RJ Bank’s allowance for loan loss policies.
Other than loans classified as nonperforming, the amount of loans that were delinquent greater than 30 days was not significant at
September 30, 2017
.
76
Credit risk is also managed by diversifying the corporate loan portfolio. RJ Bank’s corporate loan portfolio does not contain a significant concentration in any single industry. The industry concentrations (top five categories) of RJ Bank’s corporate loans are as follows:
|
September 30, 2017
|
September 30, 2016
|
|||||||
|
Loans outstanding as a % of RJ Bank total corporate loans
|
Loans outstanding as a % of RJ Bank total loans
|
Loans outstanding as a % of RJ Bank total corporate loans
|
Loans outstanding as a % of RJ Bank total loans
|
|||||
|
Office (real estate)
|
5.9%
|
4.0%
|
Office (real estate)
|
5.6%
|
4.0%
|
|||
|
Retail real estate
|
5.3%
|
3.6%
|
Hospitality
|
5.2%
|
3.7%
|
|||
|
Power & infrastructure
|
5.3%
|
3.6%
|
Consumer products and services
|
5.0%
|
3.6%
|
|||
|
Consumer products and services
|
5.2%
|
3.5%
|
Retail real estate
|
4.6%
|
3.3%
|
|||
|
Hospitality
|
4.7%
|
3.2%
|
Power & infrastructure
|
4.6%
|
3.3%
|
|||
Liquidity risk
See the section entitled “Liquidity and capital resources” in Item 7, Management’s Discussion and Analysis of Financial Condition and Results of Operations, in this Form 10-K for more information regarding our liquidity and how we manage liquidity risk.
Operational risk
Operational risk generally refers to the risk of loss resulting from our operations, including, but not limited to, business disruptions, improper or unauthorized execution and processing of transactions, deficiencies in our technology or financial operating systems and inadequacies or breaches in our control processes including cyber security incidents (see Item 1A, Risk Factors in this report for a discussion of certain cyber security risks). We operate different businesses in diverse markets and are reliant on the ability of our employees and systems to process a large number of transactions. These risks are less direct than credit and market risk, but managing them is critical, particularly in a rapidly changing environment with increasing transaction volumes and complexity. In the event of a breakdown or improper operation of systems or improper action by employees, we could suffer financial loss, regulatory sanctions and damage to our reputation. In order to mitigate and control operational risk, we have developed and continue to enhance specific policies and procedures that are designed to identify and manage operational risk at appropriate levels throughout the organization and within such departments as Accounting, Operations, Information Technology, Legal, Compliance, Risk Management and Internal Audit. These control mechanisms attempt to ensure that operational policies and procedures are being followed and that our various businesses are operating within established corporate policies and limits. Business continuity plans exist for critical systems, and redundancies are built into the systems as deemed appropriate.
We have an Operational Risk Management Committee (comprised of members of senior management), which reviews and addresses operational risks across our businesses. The committee establishes, and from time-to-time will reassess, risk appetite levels for major operational risks, monitors operating unit performance for adherence to defined risk tolerances, and establishes policies for risk management at the enterprise level.
As more fully described in the discussion of our business technology risks included in various risk factors presented in Item 1A: Risk Factors in this report, despite our implementation of protective measures and endeavoring to modify them as circumstances warrant, our computer systems, software and networks may be vulnerable to human error, natural disasters, power loss, spam attacks, unauthorized access, distributed denial of service attacks, computer viruses and other malicious code and other events that could have an impact on the security and stability of our operations. Notwithstanding the precautions we take, if one or more of these events were to occur, this could jeopardize the information we confidentially maintain, including that of our clients and counterparties, which is processed, stored in and transmitted through our computer systems and networks, or otherwise cause interruptions or malfunctions in our operations or the operations of our clients or counterparties. To-date, we have not experienced any material losses relating to cyberattacks or other information security breaches; however, there can be no assurances that we will not suffer such losses in the future.
Model Risk
Model risk refers to the possibility of unintended business outcomes arising from the design, implementation or use of models. Models are used throughout the firm for a variety of purposes such as the valuation of financial instruments, assessing risk, stress testing, and to assist in the making of business decisions. Model risk includes the potential risk that management makes incorrect decisions based upon either incorrect model results or incorrect understanding and use of model results. Model risk may also occur when model output
77
experiences a deviation from the expected result. Model risk can result in significant financial loss, inaccurate financial or regulatory reporting, misaligned business strategies or damage to our reputation.
Model Risk Management (MRM) is a separate department within our Risk Management department and is independent of model owners, users, and developers. Our model risk management framework consists primarily of model governance, maintaining the firm-wide model inventory, validating and approving all models across the firm, and on-going monitoring. Results of validations and issues identified are reported to the ERM Committee and RJF Audit and Risk Committee of the Board of Directors. MRM assumes responsibility for the independent and effective challenge of model completeness, integrity and design based on intended use.
Regulatory and legal risk
We have comprehensive procedures addressing regulatory capital requirements, sales and trading practices, use of and safekeeping of client funds, extension of credit, collection activities, money laundering and record keeping. We have designated Anti-Money Laundering (“AML”) Officers in each of our subsidiaries who monitor compliance with regulations adopted under the Patriot Act.
Compliance with the DOL Rule, reliance on the BIC Exemption and the Principal Transactions Exemption, and addressing any amendments to the DOL Rule or other new regulations establishing a fiduciary duty or heightened standard of care will require us to incur increased legal, compliance and information technology costs. In addition, we may face enhanced legal risks. Refer to the “Regulation” section of Item 1 in this Form 10-K for a discussion of the DOL Rule.
We act as an underwriter or selling group member in both equity and fixed income product offerings. Particularly when acting as lead or co-lead manager, we have financial and legal exposure. To manage this exposure, a committee of senior executives review proposed underwriting commitments to assess the quality of the offering and the adequacy of our due diligence investigation.
A Compliance and Standards Committee comprised of senior executives meets monthly to consider policy issues. The committee reviews material client or customer complaints and litigation, as well as issues in operating departments, for the purpose of identifying issues that present risk exposure to either us or our customers. The committee adopts policies to address these issues and disseminates such policies throughout our operations.
A Quality of Markets Committee meets regularly to monitor the best execution activities of our trading departments as they relate to customer orders. This committee is comprised of representatives from the OTC Trading, Listed Trading, Options, Municipal Trading, Taxable Trading, Compliance and Legal Departments and is under the direction of one of our senior officers. This committee reviews reports from the departments listed above and recommends action when necessary.
Our major business units have compliance departments that are responsible for regularly reviewing and revising compliance and supervisory procedures to conform to changes in applicable regulations.
Our banking activities are highly regulated and are subject to changes in banking laws and regulations, including unanticipated rulings. Over the past several years we have experienced the rapid introduction of significant new regulatory programs or changes affecting consumer protection and disclosure requirements, financial reporting and regulatory restructuring. We closely monitor these regulatory developments and strive to ensure that our compliance is timely. See the further discussion of our risks associated with regulations, including the Dodd-Frank Act, in Item 1A, “Risk Factors” within this report.
The periodic examination of our banking and broker-dealer operations by various regulators has expanded in scope and reflects a heightened level of scrutiny of financial services entities. We continue to incur costs to support these reviews, and we continuously evaluate and implement changes to our processes and procedures to maintain compliance with the regulations applicable to our businesses. Given this environment, we cannot predict the impact that periodic examinations by one or more of our regulators could have on our future costs or results of operations.
Legal risk includes the risk of PCG client claims, the possibility of sizable adverse legal judgments, exposure to pre-closing date litigation matters of Morgan Keegan in the event that Regions fails to honor its indemnification obligations (see Item 3 Legal Proceedings and
Note 17
of the Notes to Consolidated Financial Statements in this Form 10-K for further discussion of the Regions indemnification for such matters) and non-compliance with applicable legal and regulatory requirements. We are generally subject to extensive regulation in the different jurisdictions in which we conduct business. Regulatory oversight of the financial services industry has become increasingly demanding in recent years and we, as well as other financial services firms, have been directly affected by this increased regulatory scrutiny.
78
We have and will continue to devote significant resources to the expansion and support of our risk management, legal and compliance frameworks, including our AML program. We have significantly increased the number of associates dedicated to risk and compliance, expanded training for our associates and continue to invest in technology to support these functions, including implementation of a leading AML software solution. All of these activities allow us to increase our monitoring and detection of suspicious and reportable activities.
We maintain a number of private equity investments, some of which meet the definition of covered funds under the Volcker Rule. The conformance period for compliance with the rule with respect to investments in covered funds was July 2017; however, banking entities were able to apply for an extension to provide up to an additional five years to conform investments in certain illiquid funds. The majority of our covered fund investments meet the criteria to be considered an illiquid fund under the Volcker Rule and we received approval from the Fed to continue to hold such investments until July 2022. The extension of the conformance deadline provides us with additional time to realize the value of these investments in due course and to execute appropriate strategies to comply with the Volcker Rule at such time. Our current focus is on the divestiture of our existing portfolio.
We have a number of outstanding claims resulting from, among other reasons, market conditions. While these claims may not be the result of any wrongdoing, we do, at a minimum, incur costs associated with investigating and defending against such claims. See the further discussion of our accounting policy regarding such matters in the loss provisions arising from legal proceedings section of “Critical Accounting Estimates” contained in Item 7, “Management’s Discussion of Analysis of Financial Condition and Results of Operations” and in
Note 2
of our Notes to Consolidated Financial Statements within this Form 10-K.
Item 7A.
QUANTITATIVE AND QUALITATIVE DISCLOSURES ABOUT MARKET RISK
See Item 7 “Management’s Discussion and Analysis of Financial Condition and Results of Operations - Risk Management” in this Form 10-K for our quantitative and qualitative disclosures about market risk.
79
RAYMOND JAMES FINANCIAL, INC. AND SUBSIDIARIES
|
Item 8.
|
FINANCIAL STATEMENTS AND SUPPLEMENTARY DATA
|
Table of Contents
|
PAGE
|
|
|
Report of Independent Registered Public Accounting Firm
|
|
|
Consolidated Statements of Financial Condition
|
|
|
Consolidated Statements of Income and Comprehensive Income
|
|
|
Consolidated Statements of Changes in Shareholders’ Equity
|
|
|
Consolidated Statements of Cash Flows
|
|
|
Notes to Consolidated Financial Statements
|
|
|
Note 1 - Organization and basis of presentation
|
|
|
Note 2 - Summary of significant accounting policies
|
|
|
Note 3 - Acquisitions
|
|
|
Note 4 - Fair value
|
|
|
Note 5 - Available-for-sale securities
|
|
|
Note 6 - Derivative financial instruments
|
|
|
Note 7 - Collateralized agreements and financings
|
|
|
Note 8 - Bank loans, net
|
|
|
Note 9 - Other assets
|
|
|
Note 10 - Variable interest entities
|
|
|
Note 11 - Property and equipment
|
|
|
Note 12 - Goodwill and identifiable intangible assets, net
|
|
|
Note 13 - Bank deposits
|
|
|
Note 14 - Other borrowings
|
|
|
Note 15 - Senior notes payable
|
|
|
Note 16 - Income taxes
|
|
|
Note 17 - Commitments, contingencies and guarantees
|
|
|
Note 18 - Accumulated other comprehensive income/(loss)
|
|
|
Note 19 - Interest income and interest expense
|
|
|
Note 20 - Share-based and other compensation
|
|
|
Note 21 - Regulatory capital requirements
|
|
|
Note 22 - Financial instruments with off-balance sheet risk
|
|
|
Note 23 - Earnings per share
|
|
|
Note 24 - Segment information
|
|
|
Note 25 - Condensed financial information (parent company only)
|
|
|
Supplementary data
|
|
80
Report of Independent Registered Public Accounting Firm
The Board of Directors and Shareholders
Raymond James Financial, Inc.:
We have audited the accompanying consolidated statements of financial condition of Raymond James Financial, Inc. and subsidiaries (the “Company” or “Raymond James”) as of September 30, 2017 and 2016, and the related consolidated statements of income and comprehensive income, changes in shareholders’ equity, and cash flows for each of the years in the three-year period ended September 30, 2017. These consolidated financial statements are the responsibility of the Company’s management. Our responsibility is to express an opinion on these consolidated financial statements based on our audits.
We conducted our audits in accordance with the standards of the Public Company Accounting Oversight Board (United States). Those standards require that we plan and perform the audit to obtain reasonable assurance about whether the financial statements are free of material misstatement. An audit includes examining, on a test basis, evidence supporting the amounts and disclosures in the financial statements. An audit also includes assessing the accounting principles used and significant estimates made by management, as well as evaluating the overall financial statement presentation. We believe that our audits provide a reasonable basis for our opinion.
In our opinion, the consolidated financial statements referred to above present fairly, in all material respects, the financial position of Raymond James as of September 30, 2017 and 2016, and the results of its operations and its cash flows for each of the years in the three-year period ended September 30, 2017, in conformity with U.S. generally accepted accounting principles.
We also have audited, in accordance with the standards of the Public Company Accounting Oversight Board (United States), Raymond James’ internal control over financial reporting as of September 30, 2017, based on criteria established in
Internal Control - Integrated Framework
(2013)
issued by the Committee of Sponsoring Organizations of the Treadway Commission, and our report dated
November 21, 2017
expressed an unqualified opinion on the effectiveness of the Company’s internal control over financial reporting.
/s/ KPMG LLP
Tampa, Florida
November 21, 2017
Certified Public Accountants
81
|
RAYMOND JAMES FINANCIAL, INC. AND SUBSIDIARIES
CONSOLIDATED STATEMENTS OF FINANCIAL CONDITION
|
||||||||
|
September 30,
|
||||||||
|
$ in thousands, except per share amounts
|
2017
|
2016
|
||||||
|
Assets:
|
|
|
||||||
|
Cash and cash equivalents
|
$
|
3,669,672
|
|
$
|
1,650,452
|
|
||
|
Assets segregated pursuant to regulations and other segregated assets
|
3,476,085
|
|
4,884,487
|
|
||||
|
Securities purchased under agreements to resell and other collateralized financings
|
404,462
|
|
470,222
|
|
||||
|
Securities borrowed
|
138,319
|
|
170,860
|
|
||||
|
Financial instruments, at fair value:
|
|
|
|
|
||||
|
Trading instruments (includes
$357,099
and $418,141 pledged as collateral)
|
564,263
|
|
713,550
|
|
||||
|
Available-for-sale securities
|
2,188,282
|
|
859,398
|
|
||||
|
Derivative assets
|
318,775
|
|
480,106
|
|
||||
|
Private equity investments
|
198,779
|
|
194,634
|
|
||||
|
Other investments (includes
$6,640
and $22,501 pledged as collateral)
|
220,980
|
|
326,353
|
|
||||
|
Brokerage client receivables, net
|
2,766,771
|
|
2,714,782
|
|
||||
|
Receivables from brokers, dealers and clearing organizations
|
268,021
|
|
380,764
|
|
||||
|
Other receivables
|
652,769
|
|
610,417
|
|
||||
|
Bank loans, net
|
17,006,795
|
|
15,210,735
|
|
||||
|
Loans to financial advisors, net
|
873,272
|
|
838,721
|
|
||||
|
Investments in real estate partnerships held by consolidated variable interest entities
|
111,743
|
|
116,133
|
|
||||
|
Property and equipment, net
|
437,374
|
|
321,457
|
|
||||
|
Deferred income taxes, net
|
313,486
|
|
322,024
|
|
||||
|
Goodwill and identifiable intangible assets, net
|
493,183
|
|
503,046
|
|
||||
|
Other assets
|
780,425
|
|
718,835
|
|
||||
|
Total assets
|
$
|
34,883,456
|
|
$
|
31,486,976
|
|
||
|
Liabilities and equity:
|
|
|
|
|
||||
|
Bank deposits
|
$
|
17,732,362
|
|
$
|
14,262,547
|
|
||
|
Securities sold under agreements to repurchase
|
220,942
|
|
193,229
|
|
||||
|
Securities loaned
|
383,953
|
|
677,761
|
|
||||
|
Financial instruments sold but not yet purchased, at fair value
|
||||||||
|
Trading instruments
|
221,449
|
|
320,103
|
|
||||
|
Derivative liabilities
|
356,964
|
|
475,608
|
|
||||
|
Brokerage client payables
|
5,411,829
|
|
6,444,671
|
|
||||
|
Payables to brokers, dealers and clearing organizations
|
172,714
|
|
306,119
|
|
||||
|
Accrued compensation, commissions and benefits
|
1,059,996
|
|
898,185
|
|
||||
|
Other payables
|
567,045
|
|
556,532
|
|
||||
|
Other borrowings
|
1,514,012
|
|
608,658
|
|
||||
|
Senior notes payable
|
1,548,839
|
|
1,680,587
|
|
||||
|
Total liabilities
|
29,190,105
|
|
26,424,000
|
|
||||
|
Commitments and contingencies (see Note 17)
|
|
|
|
|
||||
|
Equity
|
|
|
|
|
||||
|
Preferred stock; $.10 par value; 10,000,000 shares authorized; -0- shares issued and outstanding
|
—
|
|
—
|
|
||||
|
Common stock; $.01 par value; 350,000,000 shares authorized;
154,228,235
and 151,424,947 shares issued as of September 30, 2017 and 2016, respectively. Shares outstanding of
144,096,521
and 141,544,511 as of September 30, 2017 and 2016, respectively
|
1,542
|
|
1,513
|
|
||||
|
Additional paid-in capital
|
1,645,397
|
|
1,498,921
|
|
||||
|
Retained earnings
|
4,340,054
|
|
3,834,781
|
|
||||
|
Treasury stock, at cost;
10,084,038
and 9,766,846 common shares as of September 30, 2017 and 2016, respectively
|
(390,081
|
)
|
(362,937
|
)
|
||||
|
Accumulated other comprehensive loss
|
(15,199
|
)
|
(55,733
|
)
|
||||
|
Total equity attributable to Raymond James Financial, Inc.
|
5,581,713
|
|
4,916,545
|
|
||||
|
Noncontrolling interests
|
111,638
|
|
146,431
|
|
||||
|
Total equity
|
5,693,351
|
|
5,062,976
|
|
||||
|
Total liabilities and equity
|
$
|
34,883,456
|
|
$
|
31,486,976
|
|
||
See accompanying Notes to Consolidated Financial Statements
82
RAYMOND JAMES FINANCIAL, INC. AND SUBSIDIARIES
|
|
Year ended September 30,
|
|||||||||||
|
$ in thousands, except per share amounts
|
2017
|
2016
|
2015
|
|||||||||
|
Revenues:
|
|
|
|
|||||||||
|
Securities commissions and fees
|
$
|
4,020,910
|
|
$
|
3,498,615
|
|
$
|
3,443,038
|
|
|||
|
Investment banking
|
398,675
|
|
304,155
|
|
323,654
|
|
||||||
|
Investment advisory and related administrative fees
|
462,989
|
|
393,346
|
|
386,376
|
|
||||||
|
Interest
|
802,126
|
|
640,397
|
|
543,282
|
|
||||||
|
Account and service fees
|
667,274
|
|
511,326
|
|
457,913
|
|
||||||
|
Net trading profit
|
81,880
|
|
91,591
|
|
58,512
|
|
||||||
|
Other
|
91,021
|
|
81,690
|
|
96,905
|
|
||||||
|
Total revenues
|
6,524,875
|
|
5,521,120
|
|
5,309,680
|
|
||||||
|
Interest expense
|
(153,778
|
)
|
(116,056
|
)
|
(106,074
|
)
|
||||||
|
Net revenues
|
6,371,097
|
|
5,405,064
|
|
5,203,606
|
|
||||||
|
Non-interest expenses:
|
|
|
|
|
|
|
||||||
|
Compensation, commissions and benefits
|
4,228,387
|
|
3,624,607
|
|
3,525,250
|
|
||||||
|
Communications and information processing
|
310,961
|
|
279,746
|
|
266,396
|
|
||||||
|
Occupancy and equipment costs
|
190,737
|
|
167,455
|
|
163,229
|
|
||||||
|
Brokerage, clearing and exchange
|
48,586
|
|
42,732
|
|
42,748
|
|
||||||
|
Business development
|
154,926
|
|
148,413
|
|
158,966
|
|
||||||
|
Investment sub-advisory fees
|
78,656
|
|
59,930
|
|
59,569
|
|
||||||
|
Bank loan loss provision
|
12,987
|
|
28,167
|
|
23,570
|
|
||||||
|
Acquisition-related expenses
|
17,995
|
|
40,706
|
|
—
|
|
||||||
|
Losses on extinguishment of debt
|
45,746
|
|
—
|
|
—
|
|
||||||
|
Other
|
354,138
|
|
201,364
|
|
149,266
|
|
||||||
|
Total non-interest expenses
|
5,443,119
|
|
4,593,120
|
|
4,388,994
|
|
||||||
|
Income including noncontrolling interests and before provision for income taxes
|
927,978
|
|
811,944
|
|
814,612
|
|
||||||
|
Provision for income taxes
|
289,111
|
|
271,293
|
|
296,034
|
|
||||||
|
Net income including noncontrolling interests
|
638,867
|
|
540,651
|
|
518,578
|
|
||||||
|
Net income attributable to noncontrolling interests
|
2,632
|
|
11,301
|
|
16,438
|
|
||||||
|
Net income attributable to Raymond James Financial, Inc.
|
$
|
636,235
|
|
$
|
529,350
|
|
$
|
502,140
|
|
|||
|
Earnings per common share – basic
|
$
|
4.43
|
|
$
|
3.72
|
|
$
|
3.51
|
|
|||
|
Earnings per common share – diluted
|
$
|
4.33
|
|
$
|
3.65
|
|
$
|
3.43
|
|
|||
|
Weighted-average common shares outstanding – basic
|
143,275
|
|
141,773
|
|
142,548
|
|
||||||
|
Weighted-average common and common equivalent shares outstanding – diluted
|
146,647
|
|
144,513
|
|
145,939
|
|
||||||
|
Net income attributable to Raymond James Financial, Inc.
|
$
|
636,235
|
|
$
|
529,350
|
|
$
|
502,140
|
|
|||
|
Other comprehensive income/(loss), net of tax:
(1)
|
|
|
|
|
|
|
||||||
|
Unrealized gain/(loss) on available-for-sale securities and non-credit portion of other-than-temporary impairment losses
|
1,684
|
|
(5,576
|
)
|
(3,325
|
)
|
||||||
|
Unrealized gain/(loss) on currency translations, net of the impact of net investment hedges
|
15,618
|
|
2,179
|
|
(30,640
|
)
|
||||||
|
Unrealized gain/(loss) on cash flow hedges
|
23,232
|
|
(11,833
|
)
|
(4,650
|
)
|
||||||
|
Total comprehensive income
|
$
|
676,769
|
|
$
|
514,120
|
|
$
|
463,525
|
|
|||
|
Other-than-temporary impairment:
|
|
|
|
|
|
|
||||||
|
Total other-than-temporary impairment, net
|
$
|
2,279
|
|
$
|
1,305
|
|
$
|
2,489
|
|
|||
|
Portion of recoveries recognized in other comprehensive income
|
(2,279
|
)
|
(1,305
|
)
|
(2,489
|
)
|
||||||
|
Net impairment losses recognized in other revenue
|
$
|
—
|
|
$
|
—
|
|
$
|
—
|
|
|||
|
(1)
|
All components of other comprehensive income/(loss), net of tax, are attributable to Raymond James Financial, Inc.
|
See accompanying Notes to Consolidated Financial Statements.
83
|
RAYMOND JAMES FINANCIAL, INC. AND SUBSIDIARIES
CONSOLIDATED STATEMENTS OF CHANGES IN SHAREHOLDERS’ EQUITY
|
||||||||||||
|
|
Year ended September 30,
|
|||||||||||
|
$ in thousands, except per share amounts
|
2017
|
|
2016
|
|
2015
|
|||||||
|
Common stock, par value $.01 per share:
|
|
|
|
|
||||||||
|
Balance, beginning of year
|
$
|
1,513
|
|
|
$
|
1,491
|
|
|
$
|
1,444
|
|
|
|
Share issuances
|
29
|
|
|
22
|
|
|
47
|
|
||||
|
Balance, end of year
|
1,542
|
|
|
1,513
|
|
|
1,491
|
|
||||
|
Additional paid-in capital:
|
|
|
|
|
|
|
||||||
|
Balance, beginning of year
|
1,498,921
|
|
|
1,344,779
|
|
|
1,239,046
|
|
||||
|
Employee stock purchases
|
26,277
|
|
|
28,025
|
|
|
23,847
|
|
||||
|
Exercise of stock options and vesting of restricted stock units, net of forfeitures
|
28,258
|
|
|
16,470
|
|
|
21,351
|
|
||||
|
Restricted stock, stock option and restricted stock unit expense
|
90,748
|
|
73,871
|
|
|
68,196
|
|
|||||
|
Excess tax benefit/(reduction of prior tax benefit) from share-based payments
|
—
|
|
(1)
|
35,121
|
|
|
(8,115
|
)
|
||||
|
Other
|
1,193
|
|
|
655
|
|
|
454
|
|
||||
|
Balance, end of year
|
1,645,397
|
|
|
1,498,921
|
|
|
1,344,779
|
|
||||
|
Retained earnings:
(2)
|
|
|
|
|
|
|
||||||
|
Balance, beginning of year
|
3,834,781
|
|
|
3,422,169
|
|
|
3,026,295
|
|
||||
|
Net income attributable to Raymond James Financial, Inc.
|
636,235
|
|
|
529,350
|
|
|
502,140
|
|
||||
|
Cash dividends declared
|
(130,643
|
)
|
(116,738
|
)
|
(106,271
|
)
|
||||||
|
Other
|
(319
|
)
|
—
|
|
5
|
|
||||||
|
Balance, end of year
|
4,340,054
|
|
3,834,781
|
|
3,422,169
|
|
||||||
|
Treasury stock:
|
|
|
|
|
||||||||
|
Balance, beginning of year
|
(362,937
|
)
|
(203,455
|
)
|
(121,211
|
)
|
||||||
|
Purchases/surrenders
|
(9,404
|
)
|
(153,137
|
)
|
(64,780
|
)
|
||||||
|
Exercise of stock options and vesting of restricted stock units, net of forfeitures
|
(17,740
|
)
|
(6,345
|
)
|
(17,464
|
)
|
||||||
|
Balance, end of year
|
(390,081
|
)
|
(362,937
|
)
|
(203,455
|
)
|
||||||
|
Accumulated other comprehensive loss:
(3)
|
|
|
|
|
||||||||
|
Balance, beginning of year
|
(55,733
|
)
|
(40,503
|
)
|
(1,888
|
)
|
||||||
|
Net change in unrealized gain/(loss) on available-for-sale securities and non-credit portion of other-than-temporary impairment losses, net of tax
|
1,684
|
|
(5,576
|
)
|
(3,325
|
)
|
||||||
|
Net change in currency translations and net investment hedges, net of tax
|
15,618
|
|
2,179
|
|
(30,640
|
)
|
||||||
|
Net change in cash flow hedges, net of tax
|
23,232
|
|
(11,833
|
)
|
(4,650
|
)
|
||||||
|
Balance, end of year
|
(15,199
|
)
|
(55,733
|
)
|
(40,503
|
)
|
||||||
|
Total equity attributable to Raymond James Financial, Inc.
|
$
|
5,581,713
|
|
$
|
4,916,545
|
|
$
|
4,524,481
|
|
|||
|
Noncontrolling interests:
(2)
|
|
|
|
|
||||||||
|
Balance, beginning of year
|
$
|
146,431
|
|
$
|
154,454
|
|
$
|
162,634
|
|
|||
|
Net income attributable to noncontrolling interests
|
2,632
|
|
11,301
|
|
16,438
|
|
||||||
|
Capital contributions
|
9,775
|
|
|
917
|
|
|
—
|
|
||||
|
Distributions
|
(43,568
|
)
|
(18,312
|
)
|
(23,540
|
)
|
||||||
|
Derecognition resulting from sales
|
(4,649
|
)
|
—
|
|
—
|
|
||||||
|
Other
|
1,017
|
|
(1,929
|
)
|
(1,078
|
)
|
||||||
|
Balance, end of year
|
111,638
|
|
146,431
|
|
154,454
|
|
||||||
|
Total equity
|
$
|
5,693,351
|
|
|
$
|
5,062,976
|
|
|
$
|
4,678,935
|
|
|
(1) During the
twelve months ended September 30, 2017
, we adopted new stock compensation simplification guidance. See Notes
1
,
16
and
20
for additional information.
(2) Each respective prior period balance has been restated to reflect the impact of the deconsolidation of certain VIEs. See
Note 1
for additional information.
(3) All components of other comprehensive loss, net of tax, are attributable to Raymond James Financial, Inc.
See accompanying Notes to Consolidated Financial Statements.
84
|
RAYMOND JAMES FINANCIAL, INC. AND SUBSIDIARIES
|
||||||||||||
|
|
Year ended September 30,
|
|||||||||||
|
$ in thousands
|
2017
|
2016
|
2015
|
|||||||||
|
Cash flows from operating activities:
|
|
|
||||||||||
|
Net income attributable to Raymond James Financial, Inc.
|
$
|
636,235
|
|
$
|
529,350
|
|
$
|
502,140
|
|
|||
|
Net income attributable to noncontrolling interests
|
2,632
|
|
11,301
|
|
16,438
|
|
||||||
|
Net income including noncontrolling interests
|
638,867
|
|
540,651
|
|
518,578
|
|
||||||
|
Adjustments to reconcile net income including noncontrolling interests to net cash provided by/(used in) operating activities:
|
|
|
|
|
|
|
||||||
|
Depreciation and amortization
|
84,132
|
|
72,383
|
|
68,315
|
|
||||||
|
Deferred income taxes
|
(11,617
|
)
|
(58,798
|
)
|
(23,462
|
)
|
||||||
|
Premium and discount amortization on available-for-sale securities and unrealized gain on other investments
|
(27,572
|
)
|
(25,010
|
)
|
(42,544
|
)
|
||||||
|
Provisions for loan losses, legal and regulatory proceedings (excluding the Jay Peak matter) and bad debts
|
36,357
|
|
42,394
|
|
34,277
|
|
||||||
|
Share-based compensation expense
|
96,164
|
|
78,528
|
|
71,488
|
|
||||||
|
Compensation expense/(benefit) which is payable in common stock of an acquiree
|
13,301
|
|
(2,102
|
)
|
—
|
|
||||||
|
Unrealized (gain)/loss on company owned life insurance, net of expenses
|
(43,385
|
)
|
(24,586
|
)
|
10,724
|
|
||||||
|
Loss on extinguishment of senior notes payable
|
45,746
|
|
—
|
|
—
|
|
||||||
|
Other
|
29,532
|
|
16,940
|
|
5,681
|
|
||||||
|
Net change in:
|
|
|
|
|
|
|
||||||
|
Assets segregated pursuant to regulations and other segregated assets
|
1,430,898
|
|
(1,942,429
|
)
|
(476,909
|
)
|
||||||
|
Securities purchased under agreements to resell and other collateralized financings, net of securities sold under agreements to repurchase
|
97,001
|
|
(134,085
|
)
|
41,101
|
|
||||||
|
Securities loaned, net of securities borrowed
|
(261,659
|
)
|
152,380
|
|
98,896
|
|
||||||
|
Loans provided to financial advisors, net of repayments
|
(53,785
|
)
|
(344,164
|
)
|
(85,895
|
)
|
||||||
|
Brokerage client receivables and other accounts receivable, net
|
(50,917
|
)
|
(609,952
|
)
|
(115,841
|
)
|
||||||
|
Trading instruments, net
|
57,106
|
|
7,048
|
|
32,408
|
|
||||||
|
Derivative instruments, net
|
57,889
|
|
(18,590
|
)
|
(1,922
|
)
|
||||||
|
Other assets
|
97,391
|
|
(47,094
|
)
|
(3,922
|
)
|
||||||
|
Brokerage client payables and other accounts payable
|
(1,133,283
|
)
|
1,782,456
|
|
792,657
|
|
||||||
|
Accrued compensation, commissions and benefits
|
160,038
|
|
46,367
|
|
34,702
|
|
||||||
|
Proceeds from sales of securitizations and loans held for sale, net of purchases and originations of loans held for sale
|
189,232
|
|
(101,155
|
)
|
(59,638
|
)
|
||||||
|
Jay Peak matter payments
|
(145,500
|
)
|
(4,500
|
)
|
—
|
|
||||||
|
Net cash provided by/(used in) operating activities
|
1,305,936
|
|
(573,318
|
)
|
898,694
|
|
||||||
|
Cash flows from investing activities:
|
|
|
|
|
|
|
||||||
|
Additions to property, buildings and equipment, including software
|
(189,994
|
)
|
(121,733
|
)
|
(74,111
|
)
|
||||||
|
Increase in bank loans, net
|
(2,253,574
|
)
|
(2,400,247
|
)
|
(2,176,698
|
)
|
||||||
|
Purchases of Federal Home Loan Bank/Federal Reserve Bank stock, net
|
(13,375
|
)
|
(3,231
|
)
|
(4,446
|
)
|
||||||
|
Proceeds from sales of loans held for investment
|
333,130
|
|
197,557
|
|
111,731
|
|
||||||
|
Proceeds from sales of or distributions received from private equity and other investments, net of purchases or contributions to private equity or other investments
|
90,458
|
|
(39,617
|
)
|
(62,416
|
)
|
||||||
|
Purchases of available-for-sale securities
|
(1,732,790
|
)
|
(463,202
|
)
|
(92,485
|
)
|
||||||
|
Available-for-sale securities maturations, repayments and redemptions
|
299,343
|
|
95,961
|
|
69,757
|
|
||||||
|
Proceeds from sales of available-for-sale securities
|
93,774
|
|
11,062
|
|
84,785
|
|
||||||
|
Business acquisitions, net of cash acquired
|
—
|
|
(175,283
|
)
|
(15,823
|
)
|
||||||
|
Other investing activities, net
|
(3,042
|
)
|
(19,170
|
)
|
(16,904
|
)
|
||||||
|
Net cash used in investing activities
|
$
|
(3,376,070
|
)
|
$
|
(2,917,903
|
)
|
$
|
(2,176,610
|
)
|
|||
|
(continued on next page)
|
||||||||||||
|
See accompanying Notes to Consolidated Financial Statements.
|
||||||||||||
85
|
RAYMOND JAMES FINANCIAL, INC. AND SUBSIDIARIES
CONSOLIDATED STATEMENTS OF CASH FLOWS
(continued from previous page)
|
||||||||||||
|
|
Year ended September 30,
|
|||||||||||
|
$ in thousands
|
2017
|
2016
|
2015
|
|||||||||
|
Cash flows from financing activities:
|
|
|
||||||||||
|
Proceeds from/(repayments of) short-term borrowings, net
|
$
|
610,000
|
|
$
|
(115,000
|
)
|
$
|
(34,700
|
)
|
|||
|
Proceeds from Federal Home Loan Bank advances
|
950,000
|
|
25,000
|
|
550,299
|
|
||||||
|
Repayments of Federal Home Loan Bank advances and other borrowed funds
|
(654,647
|
)
|
(4,407
|
)
|
(509,252
|
)
|
||||||
|
Proceeds from senior note issuances, net of debt issuance costs paid
|
508,473
|
|
792,221
|
|
—
|
|
||||||
|
Extinguishment of senior notes payable
|
(650,000
|
)
|
(250,000
|
)
|
—
|
|
||||||
|
Premium paid on extinguishment of senior notes payable
|
(36,892
|
)
|
—
|
|
—
|
|
||||||
|
Acquisition-related contingent consideration received, net of payments
|
2,992
|
|
—
|
|
—
|
|
||||||
|
Exercise of stock options and employee stock purchases
|
57,462
|
|
43,331
|
|
47,964
|
|
||||||
|
Increase in bank deposits
|
3,469,815
|
|
2,342,666
|
|
1,890,957
|
|
||||||
|
Purchases of treasury stock
|
(34,055
|
)
|
(162,502
|
)
|
(88,542
|
)
|
||||||
|
Dividends on common stock
|
(127,202
|
)
|
(113,435
|
)
|
(103,143
|
)
|
||||||
|
Distributions to noncontrolling interests, net
|
(31,383
|
)
|
(17,395
|
)
|
(23,540
|
)
|
||||||
|
Net cash provided by financing activities
|
4,064,563
|
|
2,540,479
|
|
1,730,043
|
|
||||||
|
Currency adjustment:
|
|
|
|
|||||||||
|
Effect of exchange rate changes on cash
|
24,791
|
|
188
|
|
(50,184
|
)
|
||||||
|
Net increase/(decrease) in cash and cash equivalents
|
2,019,220
|
|
(950,554
|
)
|
401,943
|
|
||||||
|
Cash and cash equivalents at beginning of year
|
1,650,452
|
|
2,601,006
|
|
2,199,063
|
|
||||||
|
Cash and cash equivalents at end of year
|
$
|
3,669,672
|
|
$
|
1,650,452
|
|
$
|
2,601,006
|
|
|||
|
Supplemental disclosures of cash flow information:
|
|
|
|
|||||||||
|
Cash paid for interest
|
$
|
155,984
|
|
$
|
113,517
|
|
$
|
106,190
|
|
|||
|
Cash paid for income taxes
|
$
|
349,009
|
|
$
|
303,793
|
|
$
|
378,928
|
|
|||
See accompanying Notes to Consolidated Financial Statements.
86
RAYMOND JAMES FINANCIAL, INC. AND SUBSIDIARIES
NOTES TO CONSOLIDATED FINANCIAL STATEMENTS
September 30, 2017
Organization
Raymond James Financial, Inc. (“RJF” or the “Company”) is a financial holding company whose broker-dealer subsidiaries are engaged in various financial services businesses, including the underwriting, distribution, trading and brokerage of equity and debt securities and the sale of mutual funds and other investment products. In addition, other subsidiaries of RJF provide investment management services for retail and institutional clients, corporate and retail banking services, and trust services. As used herein, the terms “we,” “our” or “us” refer to RJF and/or one or more of its subsidiaries.
Principal subsidiaries
As of September 30, 2017, our principal subsidiaries, all wholly owned, include: Raymond James & Associates, Inc. (“RJ&A”), a domestic broker-dealer carrying client accounts; Raymond James Financial Services, Inc. (“RJFS”), an introducing domestic broker-dealer; Raymond James Financial Services Advisors, Inc. (“RJFSA”), a registered investment advisor (“RIA”); Raymond James Ltd. (“RJ Ltd.”), a broker-dealer headquartered in Canada; Eagle Asset Management, Inc. (“Eagle”), a registered investment advisor; and Raymond James Bank, N.A. (“RJ Bank”), a national bank.
Basis of presentation
The accompanying consolidated financial statements include the accounts of RJF and its consolidated subsidiaries that are generally controlled through a majority voting interest. We consolidate all of our
100%
owned subsidiaries. In addition we consolidate any variable interest entity (“VIE”) in which we are the primary beneficiary. Additional information on these VIEs is provided in Note 2 and in Note 11. When we do not have a controlling interest in an entity, but we exert significant influence over the entity, we apply the equity method of accounting. All material intercompany balances and transactions have been eliminated in consolidation.
Accounting estimates and assumptions
The preparation of consolidated financial statements in conformity with United States of America (“U.S.”) generally accepted accounting principles ("GAAP") requires us to make certain estimates and assumptions that affect the reported amounts of assets and liabilities, disclosure of contingent assets and liabilities at the date of the consolidated financial statements, and the reported amounts of revenues and expenses for the reporting period. Actual results could differ from those estimates and could have a material impact on the consolidated financial statements.
Adoption of new accounting guidance
We adopted accounting guidance related to the consolidation model as of October 1, 2016. As a result of this adoption we deconsolidated a number of low-income housing tax credit (“LIHTC”) fund VIEs that had previously been consolidated. We applied the new consolidation guidance on the full retrospective basis, meaning that we have reflected the adjustments arising from this adoption as of the beginning of our earliest comparative period presented. In addition, effective October 1, 2016 we also adopted amended guidance related to share-based compensation, which was applied on a prospective basis. The amended guidance involves several aspects of the accounting for share-based payment transactions, including the income tax consequences and classification on the statement of cash flows. See
Note 2
for additional information.
Reclassifications
During the period, we made a number changes to the current and previously reported amounts in the Consolidated Statements of Cash Flows. These included cash flow reclassifications to conform with changes made in the Consolidated Statements of Financial Condition (including derivative balances and the Jay Peak legal settlement), required adjustments associated with the adoption of accounting principles (including the deconsolidation of certain VIEs and treatment of excess tax benefits related to share-based compensation), and immaterial adjustments between line items (including foreign exchange impact on cash adjustments and payments with noncontrolling interest holders).
87
RAYMOND JAMES FINANCIAL, INC AND SUBSIDIARIES
Notes to Consolidated Financial Statements
In addition to the reclassification discussed above, certain other prior period amounts have also been reclassified to conform to the current year’s presentation.
Recognition of revenues
Securities commissions and fees -
The significant components of our securities commissions and fees revenue include the following:
|
a.
|
Commission revenues and related expenses from securities transactions are recorded on a trade date basis. Commission revenues are recorded at the amount charged to clients which, in certain cases, may include discounts.
|
|
b.
|
Fees earned by financial advisors who provide investment advisory services under various manners of affiliation with us. These fee revenues are computed as either a percentage of the assets in the client account, or a flat periodic fee charged to the client for investment advice and are recognized over the period in which the service is provided. Such fees are earned from the services provided by the financial advisors who affiliate with us.
|
Financial advisors may choose to affiliate with us as either an employee, and thus operate under our registered investment advisor (“RIA”) license, or as an independent contractor. If affiliated as an independent contractor, the financial advisor may choose to provide such advisory services either under their own RIA license, or under the RIA license of one of our subsidiaries.
The revenue recognition and related expense policies associated with the generation of advisory fees from each of these affiliation alternatives are as follows:
|
i.
|
Investment advisory service fee revenues earned by employee financial advisors and independent contractors who offer such services under one of our subsidiary RIA licenses are presented in “Securities commissions and fees” revenue on a gross basis. These advisors’ compensation is calculated as a percentage of the revenues generated and is recorded as a component of “Compensation, commissions and benefits expense”.
|
|
ii.
|
Independent RIA firms owned and operated by a financial advisor who is an independent contractor, may receive administrative and custodial services from us. These firms operate under their own RIA license and pay a fee for services provided to the RIA and its clients. These fees are recorded in “Securities commissions and fees” revenue, net of the portion of the fees that are remitted to the independent RIA firm.
|
|
iii.
|
We may earn fees as a result of providing a custodial platform for unaffiliated independent RIA firms. These independent RIA firms operate under their own RIA license and pay for administrative and other services that we provide. These fees are recorded in “Securities commissions and fees” revenue, net of the portion of the fees that are remitted to the independent RIA firm.
|
|
c.
|
Certain asset-based fees, which are recorded over the period earned.
|
|
d.
|
Trailing commissions from mutual funds and variable annuities/insurance products, which are recorded over the period earned.
|
|
e.
|
Insurance commission revenues and related expenses are recognized when the delivery of the insurance policy is confirmed by the carrier, the premium is remitted to the insurance company and the policy requirements are met.
|
|
f.
|
Annuity commission revenues and related expenses are recognized when the signed annuity application and premium is submitted to the annuity carrier.
|
Investment banking -
Investment banking revenues are generally recorded at the time the services related to the transaction are completed under the terms of the engagement and the related income is reasonably determinable. Such investment banking revenues include merger & acquisition and advisory fees, management fees and underwriting fees earned in connection with the distribution of public offerings, private placement fees, and syndication fees on the sale of low-income housing tax credit fund interests. Expenses associated with such transactions, net of client reimbursements, are deferred until the related revenue is recognized or the assignment is otherwise concluded and are presented net with the related revenues.
88
RAYMOND JAMES FINANCIAL, INC AND SUBSIDIARIES
Notes to Consolidated Financial Statements
Investment advisory and related administrative fees
-
We provide advice, research and administrative services for clients participating in both our managed and non-discretionary asset-based investment programs. These revenues are generated by our asset management businesses for administering and managing portfolios, funds and separately managed accounts for our clients, including individuals, mutual funds and managed programs. We earn investment advisory and related administrative fees based on the value of clients’ portfolios which are held in either managed or non-discretionary asset-based programs. Fees are computed based on balances either at the beginning of the quarter, the end of the quarter, or average assets. These fees are recorded over the period earned.
We may earn performance fees from various funds and separately managed accounts we manage when their performance exceeds certain specified rates of return. We record performance fee revenues in the period they are specifically quantifiable and are earned and are not subject to clawback or reversal.
In our low-income housing tax credit fund syndication activities, we provide oversight and management of the funds during the fifteen year tax credit compliance period of the funds’ underlying investments. We recognize these fees over the period the services are provided.
Account and service fees -
Account and service fees primarily include transaction fees, annual account fees, service charges, exit fees, servicing fees, fees generated in lieu of interest income from a multi-bank sweep program with unaffiliated banks, money market processing and distribution fees and correspondent clearing fees. The annual account fees such as IRA fees and distribution fees are recognized as earned over the term of the contract. The transaction fees are earned and collected from clients as trades are executed. Servicing fees such as omnibus, education and marketing support fees, and no-transaction fee program revenues are paid to us for marketing and administrative services provided to mutual fund and insurance/annuity companies and are recognized as earned. Under clearing agreements, we clear trades for unaffiliated correspondent brokers and retain a portion of commissions as a fee for our services. Correspondent clearing revenues are recorded net of commissions remitted.
Cash and cash equivalents
Our cash equivalents include money market funds or highly liquid investments with original maturities of 90 days or less, other than those used for trading purposes.
Assets segregated pursuant to regulations and other segregated assets
In accordance with Rule 15c3-3 of the Securities Exchange Act of 1934, RJ&A, as a broker-dealer carrying client accounts, is subject to requirements to maintain cash or qualified securities in a segregated reserve account for the exclusive benefit of its clients. In addition, RJ Ltd. is required to hold client Registered Retirement Savings Plan funds in trust. Segregated assets consist of cash and cash equivalents or qualified securities, which are recorded at fair value.
RJ Bank maintains cash in an interest-bearing pass-through account at the Federal Reserve Bank in accordance with Regulation D of the Federal Reserve Act, which requires depository institutions to maintain minimum average reserve balances against its deposits.
Repurchase agreements and other collateralized financings
We purchase securities under short-term agreements to resell (“reverse repurchase agreements”). Additionally, we sell securities under agreements to repurchase (“repurchase agreements”). Both reverse repurchase agreements and repurchase agreements are accounted for as collateralized financings and are carried at contractual amounts plus accrued interest. To mitigate credit exposure, we receive collateral with a fair value equal to or in excess of the principal amount loaned under the reverse repurchase agreements. To ensure that the market value of the underlying collateral remains sufficient, the securities are valued daily, and collateral is obtained from or returned to the counterparty when contractually required.
Securities borrowed and securities loaned
Securities borrowed and securities loaned transactions are reported as collateralized financings and recorded at the amount of collateral advanced or received. In securities borrowed transactions, we are required to deposit cash with the lender. With respect to securities loaned, we generally receive collateral in the form of cash in an amount in excess of the market value of securities loaned. We monitor the market value of securities borrowed and loaned on a daily basis, with additional collateral obtained or refunded as necessary (see
Note 7
for additional information regarding this collateral).
89
RAYMOND JAMES FINANCIAL, INC AND SUBSIDIARIES
Notes to Consolidated Financial Statements
Financial instruments, financial instruments sold but not yet purchased at fair value
“Financial instruments owned” and “Financial instruments sold, but not yet purchased” are recorded at fair value. Fair value is defined by GAAP as the price that would be received to sell an asset or paid to transfer a liability (an exit price) in an orderly transaction between market participants at the measurement date in the principal or most advantageous market for the asset or liability.
In determining the fair value of our financial instruments in accordance with GAAP, we use various valuation approaches, including market and/or income approaches. Fair value is a market-based measurement considered from the perspective of a market participant. As such, our fair value measurements reflect assumptions that we believe market participants would use in pricing the asset or liability at the measurement date. GAAP provides for the following three levels to be used to classify our fair value measurements:
Level 1-Financial instruments included in Level 1 are highly liquid instruments valued using unadjusted quoted prices in active markets for identical assets or liabilities. These include equity and corporate debt securities traded in active markets and certain U.S. Treasury securities and other governmental obligations.
Level 2-Financial instruments reported in Level 2 include those that have pricing inputs that are other than quoted prices in active markets, but which are either directly or indirectly observable as of the reporting date (i.e., prices for similar instruments). Instruments that are generally included in this category are equity securities and corporate debt obligations that are not actively traded, certain government and municipal obligations, interest rate swaps, asset-backed securities (“ABS”), collateralized mortgage obligations (“CMOs”), most mortgage-backed securities (“MBS”), certain other derivative instruments, brokered certificates of deposit, corporate loans and nonrecurring fair value measurements for certain loans held for sale, impaired loans and other real estate owned (“OREO”).
Level 3-Financial instruments reported in Level 3 have little, if any, market activity and are measured using one or more inputs that are significant to the fair value measurement and unobservable. These valuations require significant judgment or estimation. Instruments in this category generally include: equity securities with unobservable inputs such as our private equity investments, pools of interest-only Small Business Administration 7(a) (“SBA”) loan strips (“I/O Strips”), certain municipal and corporate obligations which include auction rate securities (“ARS”), and nonrecurring fair value measurements for certain impaired loans.
GAAP requires that we maximize the use of observable inputs and minimize the use of unobservable inputs when performing our fair value measurements. The availability of observable inputs can vary from instrument to instrument and in certain cases, the inputs used to measure fair value may fall into different levels of the fair value hierarchy. In such cases, an instrument’s level within the fair value hierarchy is based on the lowest level of input that is significant to the fair value measurement. Our assessment of the significance of a particular input to the fair value measurement of an instrument requires judgment and consideration of factors specific to the instrument.
We offset our long and short positions for identical securities recorded at fair value as part of our trading instruments (long positions) and trading instruments sold but not yet purchased (short positions).
Valuation techniques and inputs -
The fair value for certain of our financial instruments is derived using pricing models and other valuation techniques that involve significant management judgment. The price transparency of financial instruments is a key determinant of the degree of judgment involved in determining the fair value of our financial instruments. Financial instruments which are actively traded will generally have a higher degree of price transparency than financial instruments that are thinly traded. In accordance with GAAP, the criteria used to determine whether the market for a financial instrument is active or inactive is based on the particular asset or liability. For equity securities, our definition of actively traded is based on average daily volume and other market trading statistics. We have determined the market for certain other types of financial instruments, including private equity investments, ARS, certain CMOs, ABS and certain collateralized debt obligations, to be uncertain or inactive as of both September 30, 2017 and 2016. As a result, the valuation of these financial instruments included significant management judgment in determining the relevance and reliability of market information available. We considered the inactivity of the market to be evidenced by several factors, including low levels of price transparency caused by decreased volume of trades relative to historical levels, stale transaction prices and transaction prices that varied significantly either over time or among market makers.
The level within the fair value hierarchy, specific valuation techniques, and other significant accounting policies pertaining to financial instruments presented in our Consolidated Statements of Financial Condition are described as follows:
Level 1: Trading instruments and trading instruments sold but not yet purchased are comprised primarily of the financial instruments held by our broker-dealer subsidiaries. These instruments are recorded at fair value with realized and unrealized gains and losses reflected in current period net income.
90
RAYMOND JAMES FINANCIAL, INC AND SUBSIDIARIES
Notes to Consolidated Financial Statements
When available, we use quoted prices in active markets to determine the fair value of our trading instruments. Such instruments are classified within Level 1 of the fair value hierarchy.
Level 2: When trading instruments are traded in secondary markets and quoted market prices for identical instruments do not exist, we utilize valuation techniques including matrix pricing to estimate fair value. Matrix pricing generally utilizes spread-based models periodically re-calibrated to observable inputs such as market trades or to dealer price bids in similar securities in order to derive the fair value of the instruments. Valuation techniques may also rely on other observable inputs such as yield curves, interest rates and expected principal repayments and default probabilities. We utilize prices from independent services to corroborate our estimate of fair value. Depending upon the type of security, the pricing service may provide a listed price, a matrix price or use other methods including broker-dealer price quotations.
A portion of our financial instruments classified on our Consolidated Statements of Financial Condition as a component of our available-for-sale securities are classified as Level 2 within the fair value hierarchy. The valuation methodologies of such financial instruments are discussed in the available-for-sale securities section that follows.
We are a party to various derivative contracts that are classified as Level 2 within the fair value hierarchy. The valuation methodologies of such financial instruments are discussed in the derivatives section that follows.
We also maintain certain loans held for sale, which are classified within Level 2 of the fair value hierarchy. The valuation methodologies of such financial instruments are discussed in the loans held for sale and allowances for losses section that follows.
Level 3: Positions in illiquid securities that do not have readily determinable fair values require significant judgment or estimation. For these securities we use pricing models, discounted cash flow methodologies or similar techniques. Assumptions utilized by these techniques include estimates of future delinquencies, loss severities, defaults and prepayments or redemptions. Securities valued using these techniques are classified within Level 3 of the fair value hierarchy.
A portion of our financial instruments classified on our Consolidated Statements of Financial Condition as a component of our available-for-sale securities are classified as Level 3 within the fair value hierarchy. The valuation methodologies of such financial instruments are discussed in the available-for-sale securities section that follows.
We hold private equity investments that are classified as Level 3 within the fair value hierarchy. The valuation methodologies of such financial instruments are discussed in the private equity investments section that follows.
I/O Strips do not trade in an active market with readily observable prices. Accordingly, we use valuation techniques that consider a number of factors including: (a) the original cost of the pooled underlying SBA loans from which the I/O Strip securities were created, and any changes from the original to the hypothetical cost of buying similar loans under current market conditions; (b) seasoning of the underlying SBA loans in the pool that back the I/O Strip securities; (c) the type and nature of the pooled SBA loans backing the I/O Strip securities; (d) actual and assumed prepayment rates on the underlying pools of SBA loans; and (e) market data for past trades in comparable I/O Strip securities. Prices from independent sources are used to corroborate our estimates of fair value. Our I/O Strip securities are recorded in other securities within our “Trading instruments” on our Consolidated Statements of Financial Condition. These fair value measurements use significant unobservable inputs and accordingly, we classify them as Level 3 of the fair value hierarchy.
Included within trading instruments are to be announced (“TBA”) security contracts with investors for generic MBS at specific rates and prices to be delivered on settlement dates in the future. We enter into these TBAs to hedge interest rate risk that arises as part of a program our fixed income public finance operations offers to certain state and local housing finance agencies (“HFA”). Under this program, we enter into forward commitments to purchase Government National Mortgage Association (“GNMA”) or Federal National Home Mortgage Association (“FNMA”) MBS. The MBS are issued on behalf of various HFA clients and consist of the mortgages originated through their lending programs. Our forward GNMA or FNMA MBS purchase commitments arise at the time of the loan reservation for a borrower in the HFA lending program. The underlying terms of the GNMA or FNMA MBS purchase, including the price for the MBS (which is dependent upon the interest rates associated with the underlying mortgages) are also fixed at loan reservation. We typically sell such MBS upon acquisition as part of our fixed income operations. The TBA securities used to hedge these transactions are accounted for at fair value and are classified within Level 1 of the fair value hierarchy. The TBA securities may aggregate to either a net asset or net liability at any reporting date, depending upon market conditions. The offsetting purchase commitment is accounted for at fair value and is included in “Trading instruments” or “Trading instruments sold but not yet purchased,” depending upon whether the TBA securities aggregate to a net asset or net liability. The fair value of the purchase commitment is classified within Level 3 of the fair value hierarchy.
91
RAYMOND JAMES FINANCIAL, INC AND SUBSIDIARIES
Notes to Consolidated Financial Statements
Available-for-sale securities -
Available-for-sale securities are generally classified at the date of purchase and are comprised primarily of agency MBS and CMOs and equity securities held predominately by RJ Bank and ARS. Available-for-sale securities held at RJ Bank are used as part of its interest rate risk and liquidity management strategies and may be sold in response to changes in interest rates, changes in prepayment risks, or other factors.
Interest on available-for-sale securities is recognized in interest income on an accrual basis. For the RJ Bank available-for-sale securities, discounts are accreted and premiums are amortized as an adjustment to yield over the estimated average life of the security. Realized gains and losses on sales of available-for-sale securities are recognized using the specific identification method and reflected in other revenue in the period sold. Unrealized gains or losses on available-for-sale securities, except for those that are deemed to be other-than-temporary, are recorded through other comprehensive income/(loss) and are thereafter presented in equity as a component of accumulated other comprehensive income (“AOCI”) on our Consolidated Statements of Financial Condition.
For any available-for-sale securities in an unrealized loss position at a reporting period end, we make an assessment whether such securities are impaired on an other-than-temporary basis. In order to evaluate our risk exposure and any potential impairment of these securities, on at least a quarterly basis, we review the characteristics of each security owned such as, where applicable, collateral type, delinquency and foreclosure levels, credit enhancement, projected loan losses, collateral coverage, the presence of U.S. government or government agency guarantees, and issuer credit rating. The following factors are considered in order to determine whether an impairment is other-than-temporary: our intention to sell the security, our assessment of whether it is more likely than not that we will be required to sell the security before the recovery of its amortized cost basis, and whether the evidence indicating that we will recover the amortized cost basis of a security in full outweighs evidence to the contrary. Evidence considered in this assessment includes the reasons for the impairment, the severity and duration of the impairment, changes in value subsequent to period end, recent events specific to the issuer or industry and forecasted performance of the security.
We intend and have the ability to hold our available-for-sale securities. We have concluded that it is not more likely than not that we will be required to sell these available-for-sale securities before the recovery of their amortized cost basis. Those securities whose amortized cost basis we do not expect to recover in full are deemed to be other-than-temporarily impaired and are written down to fair value with the credit loss portion of the write-down recorded as a realized loss in other revenue and the non-credit portion of the write-down recorded, net of deferred taxes, in shareholders’ equity as a component of AOCI. The credit loss portion of the write-down is the difference between the present value of the cash flows expected to be collected and the amortized cost basis of the security. We estimate the portion of loss attributable to credit using a discounted cash flow model. For the non-agency CMOs within the RJ Bank available-for-sale portfolio, which were classified as level 2 of the fair value hierarchy and were sold during the year ended September 30, 2017, our discounted cash flow model utilized relevant assumptions such as prepayment rate, default rate, and loss severity on a loan level basis.
The fair value of agency securities included within the RJ Bank available-for-sale securities is determined by obtaining third party pricing service bid quotations from
two
independent pricing services. Third party pricing service bid quotations are based on either current market data or the most recently available market data. The third party pricing services provide comparable price evaluations utilizing available market data for similar securities. The market data the third party pricing services utilize for these price evaluations includes observable data comprised of benchmark yields, reported trades, broker-dealer quotes, issuer spreads, two-sided markets, benchmark securities, bids, offers, reference data including market research publications, and loan performance experience. On a quarterly basis, we utilize bid quotations from other third party pricing services to corroborate the pricing information obtained from the primary pricing service. Securities valued using these valuation techniques are classified within Level 2 of the fair value hierarchy.
ARS are long-term variable rate securities tied to short-term interest rates that were intended to be reset through a “Dutch auction” process, which generally occurs every
seven
to
35
days. Holders of ARS were, at one time, able to liquidate their holdings to prospective buyers by participating in the auctions. During 2008, the Dutch auction process failed and holders were no longer able to liquidate their holdings through the auction process. The fair value of the ARS holdings is estimated based on internal pricing models. The pricing models take into consideration the characteristics of the underlying securities, as well as multiple inputs including the issuer and its credit quality, data from recent trades, if any, the expected timing of redemptions and an estimated yield premium that a market participant would require over otherwise comparable securities to compensate for the illiquidity of the ARS. These inputs require significant management judgment and accordingly are classified within Level 3 of the fair value hierarchy.
Derivative assets and derivative liabilities -
Our derivative assets and derivative liabilities are recorded at fair value and are included in “Derivative assets” and “Derivative liabilities” in our Consolidated Statements of Financial Condition. To reduce credit exposure on certain of our derivative transactions, we may enter into a master netting arrangement that allows for net settlement of all derivative transactions with each counterparty. In addition, the credit support annex allows parties to the master netting agreement to mitigate their credit risk by requiring the party which is out of the money to post collateral. We accept collateral in the form of cash or other marketable securities. Where permitted, we elect to net-by-counterparty certain derivative contracts entered into under a legally
92
RAYMOND JAMES FINANCIAL, INC AND SUBSIDIARIES
Notes to Consolidated Financial Statements
enforceable master netting agreement and, therefore, the fair value of those derivative contracts are netted by counterparty in the Consolidated Statements of Financial Condition. As we elect to net-by-counterparty the fair value of such derivative contracts, we also net-by-counterparty any cash collateral exchanged as part of those derivative agreements.
Trading:
We enter into interest rate contracts either as part of our fixed income business to facilitate client transactions, or to actively manage risk exposures that arise from our client activity, including a portion of our trading inventory. Any realized or unrealized gains or losses, including interest, are recorded in “Net trading profit” within the Consolidated Statements of Income and Comprehensive Income. The fair value of these interest rate derivative contracts is obtained from internal pricing models that consider current market trading levels and the contractual prices for the underlying financial instruments, as well as time value, yield curve and other volatility factors underlying the positions. Since our model inputs can be observed in a liquid market and the models do not require significant judgment, such derivative contracts are classified within Level 2 of the fair value hierarchy. We utilize values obtained from third party derivatives dealers to corroborate the output of our internal pricing models.
Matched Book
: We also facilitate matched book derivative transactions through Raymond James Financial Products, LLC (“RJFP”) a non-broker-dealer subsidiary. RJFP enters into derivative transactions (primarily interest rate swaps) with clients. For every derivative transaction RJFP enters into with a client, it enters into an offsetting transaction with terms that mirror the client transaction, with a credit support provider who is a third party financial institution. Any collateral required to be exchanged under these derivative contracts is administered directly between the client and the third party financial institution. We record the value of each derivative position held at fair value, as either an asset or an offsetting liability, presented within “Derivative assets” or “Derivative liabilities,” as applicable, on our Consolidated Statements of Financial Condition. Fair value is determined using an internal pricing model which includes inputs from independent pricing sources to project future cash flows under each underlying derivative contract. Since any changes in fair value are completely offset by a change in fair value of the offsetting transaction position, there is no net impact on our Consolidated Statements of Income and Comprehensive Income from changes in the fair value of these derivative instruments. We recognize revenue on derivative transactions on the transaction date, computed as the present value of the expected cash flows we expect to receive from the third party financial institution over the life of the derivative contract. The difference between the present value of these cash flows at the date of inception and the gross amount potentially received is accreted to revenue over the term of the contract. The revenue from these transactions is included within “Other revenues” on our Consolidated Statements of Income and Comprehensive Income.
RJ Bank Derivatives:
We enter into three-month forward foreign exchange contracts primarily to hedge the risks related to RJ Bank’s investment in their Canadian subsidiary, as well as their risk resulting from transactions denominated in currencies other that the U.S. dollar. The majority of these derivatives are designated as net investment hedges. The effective portion of the gain or loss related to the designated derivative instruments is recorded, net of tax, in shareholders’ equity as part of the cumulative translation adjustment component of AOCI with such balance impacting “Other revenues” in the event the net investment is sold or substantially liquidated. Gains and losses on the undesignated derivative instruments, as well as amounts representing hedge ineffectiveness, are recorded in earnings in the Consolidated Statements of Income and Comprehensive Income. Hedge effectiveness is assessed at each reporting period using a method that is based on changes in forward rates. The measurement of hedge ineffectiveness is based on the balance of the foreign net investment at the inception of the hedging relationship and performed using the hypothetical derivative method. However, as the terms of the hedging instrument and hypothetical derivative generally match at inception, there is no expected ineffectiveness to be recorded in earnings.
The fair value of our forward foreign exchange contracts is determined by obtaining valuations from a third party pricing service or model. These valuations are based on observable inputs such as spot rates, foreign exchange rates and both U.S. and foreign interest rate curves. We validate the observable inputs utilized in the third party valuation model by preparing an independent calculation using a secondary, third party valuation model. These forward foreign exchange contracts are classified within Level 2 of the fair value hierarchy.
The cash flows associated with certain assets held by RJ Bank provide interest income at fixed interest rates. Therefore, the value of these assets, absent any risk mitigation, is subject to fluctuation based upon changes in market rates of interest over time. We enter into floating-rate advances from the FHLB to, in part, fund these assets and then enter into interest rate swaps which swap variable interest payments on this debt for fixed interest payments. These interest rate swaps are designated as cash flow hedges and effectively fix our cost of funds associated with these assets to mitigate a portion of the market risk.
The effective portion of the gain or loss on these interest rate derivatives is recorded, net of tax, in shareholders’ equity as part of the cash flow hedge component of AOCI and subsequently reclassified to earnings when the hedged transaction affects earnings, specifically upon the incurrence of interest expense on certain borrowings. The ineffective portions of the related gain and loss are immediately recognized into “Interest expense” in the Consolidated Statements of Income and Comprehensive Income. Hedge effectiveness is assessed at inception and at each reporting period utilizing regression analysis and performed using the hypothetical derivative method. However, as the key terms of the hedging instrument and hedged transaction match at inception, management expects there
93
RAYMOND JAMES FINANCIAL, INC AND SUBSIDIARIES
Notes to Consolidated Financial Statements
to be no ineffectiveness impacting earnings from this hedge while it is outstanding. The fair value of these interest rate hedges is obtained from internal pricing models that consider current market trading levels and the contractual prices for the underlying financial instruments, as well as time value, yield curve and other volatility factors underlying the positions. Since our model inputs can be observed in a liquid market and the models do not require significant judgment, such derivative contracts are classified within Level 2 of the fair value hierarchy. We utilize values obtained from a third party to corroborate the output of our internal pricing models.
Other:
As part of our acquisition of Alex. Brown, we assumed certain Deutsche Bank restricted stock unit (“DBRSU”) awards, including the associated plan terms and conditions. Refer to the “share-based compensation” section of this footnote for a description of the assumed obligation. The DBRSU awards contain performance conditions based on Deutsche Bank and subsidiaries attaining certain financial results and will ultimately be settled in Deutsche Bank AG (“DB”) common shares, as traded on the New York Stock Exchange (“NYSE”), provided the performance metrics are achieved. The DBRSU obligation results in a derivative that is measured by applying the reporting period-end DB common share price to the DBRSU awards outstanding as of the end of such period. This computation is a Level 2 measurement under the fair value hierarchy and the liability is included in “Derivative liabilities” in our Consolidated Statements of Financial Condition.
Private equity investments -
Private equity investments consist of direct investments and investments in third-party private equity funds and various Company-sponsored private equity funds.
The private funds in which we invest are primarily closed-end funds in which the Company’s investments are generally not eligible for redemption. Distributions will be received from these funds as the underlying assets are liquidated or distributed. These investments are measured at fair value with any changes recognized in “Other” revenues on our Consolidated Statements of Income and Comprehensive Income. The fair value of private equity fund investments are determined utilizing either the net asset value (“NAV”) of the fund as a practical expedient or Level 3 valuation techniques.
We utilize NAV or its equivalent as a practical expedient to determine the fair value of our private equity investments when: (1) the fund does not have a readily determinable fair value; (2) the NAV of the fund is calculated in a manner consistent with the measurement principles of investment-company accounting, including measurement of the underlying investments at fair value; and (3) it is not probable that we will sell the investment at an amount other than NAV. The NAV is calculated based on our proportionate share of the net assets of the fund as provided by the fund manager.
The portion of our private equity investment portfolio that is not valued at NAV is valued initially at the transaction price until significant transactions or developments indicate that a change in the carrying values of these investments is appropriate. The carrying values of these investments are adjusted based on financial performance, investment-specific events, financing and sales transactions with third parties and/or discounted cash flow models incorporating changes in market outlook. Investments valued using these valuation techniques are classified within Level 3 of the fair value hierarchy. The valuation of such investments requires significant judgment due to the absence of quoted market prices, inherent lack of liquidity and long-term nature of these assets. As a result, these values cannot be determined with precision and the calculated fair value estimates may not be realizable in a current sale or immediate settlement of the instrument.
Other investments -
Other investments consist primarily of marketable securities we hold that are associated with certain of our deferred compensation programs, term deposits with Canadian financial institutions, securities pledged as collateral with clearing organizations and certain investments in funds for which, in a number of instances, one of our affiliates serves as the managing member or general partner (see
Note 10
for information regarding such funds).
The non-qualified deferred compensation plans or arrangements are for the benefit of certain employees, and provide a return to the participating employees based upon the performance of various referenced investments. The balances associated with these plans are invested in certain marketable securities that we hold until the vesting date, typically
five
years from the date of the deferral. A liability associated with these deferrals is reflected as a component of “Accrued compensation, commissions and benefits” on our Consolidated Statements of Financial Condition. We use quoted prices in active markets to determine the fair value of these investments. Such instruments are classified within Level 1 of the fair value hierarchy.
Canadian financial institution term deposits are recorded at cost which approximates fair value. These investments are classified within Level 1 of the fair value hierarchy.
Brokerage client receivables, net
Brokerage client receivables include receivables from the clients of our broker-dealer and asset management subsidiaries. The receivables from broker-dealer clients are principally for amounts due on cash and margin transactions and are generally collateralized by securities owned by the clients. The receivables from asset management clients are primarily for accrued investment advisory fees. Brokerage client receivables are reported at their outstanding principal balance, adjusted for any allowance for doubtful accounts.
94
RAYMOND JAMES FINANCIAL, INC AND SUBSIDIARIES
Notes to Consolidated Financial Statements
When the receivable held is considered to be impaired, the amount of the impairment is generally measured based on the fair value of the securities acting as collateral, which is measured based on current prices from independent sources such as listed market prices or broker-dealer price quotations. Securities beneficially owned by customers, including those that collateralize margin or other similar transactions, are not reflected in our Consolidated Statements of Financial Condition (see
Note 7
for additional information regarding this collateral). We present “Brokerage client receivables, net” on our Consolidated Statements of Financial Condition, net of the allowance for doubtful accounts. Our allowance for doubtful accounts was approximately
$1 million
at both September 30, 2017 and 2016.
Receivables from brokers, dealers and clearing organizations
Receivables from brokers, dealers and clearing organizations include amounts receivable for securities failed to deliver and cash on deposit with clearing organizations. We present “Receivables from brokers, dealers and clearing organizations” on our Consolidated Statements of Financial Condition, net of the allowance for doubtful accounts. Our allowance for doubtful accounts was insignificant at September 30, 2017 and 2016.
Bank loans, net
Loans held for investment -
Bank loans are comprised of loans originated or purchased by RJ Bank and include commercial and industrial (“C&I”) loans, commercial and residential real estate loans, tax-exempt loans, as well as securities-based loans (“SBL”) which are fully collateralized by the borrower’s marketable securities. The loans which we have the intent and the ability to hold until maturity or payoff are recorded at their unpaid principal balance plus any premium paid in connection with the purchase of the loan, less the allowance for loan losses and any discounts received in connection with the purchase of the loan and net of deferred fees and costs on originated loans. Syndicated loans purchased in the secondary market are recognized as of the trade date. Interest income is recognized on an accrual basis. Loan origination fees and direct costs, as well as premiums and discounts on loans that are not revolving, are capitalized and recognized in interest income using the interest method. For revolving loans, the straight-line method is used based on the contractual term.
We segregate our loan portfolio into
six
portfolio segments, C&I, commercial real estate (“CRE”), CRE construction, tax-exempt, residential mortgage, and SBL. These portfolio segments also serve as the portfolio loan classes for purposes of credit analysis, except for residential mortgage loans which are further disaggregated into residential first mortgage and residential home equity classes.
Loans held for sale -
Certain residential mortgage loans originated and intended for sale in the secondary market due to their fixed interest rate terms, as well as SBA loans purchased and intended for sale in the secondary market but not yet aggregated for securitization into pools, are each carried at the lower of cost or estimated fair value. The fair value of the residential mortgage loans held for sale are estimated using observable prices obtained from counterparties for similar loans. These nonrecurring fair value measurements are classified within Level 2 of the fair value hierarchy.
We purchase the guaranteed portions of SBA loans and accounts for these loans in accordance with the policy for loans held for sale. We then aggregate SBA loans with similar characteristics into pools for securitization and sells these pools in the secondary market. Individual loans may be sold prior to securitization.
The determination of the fair value of the SBA loans depends upon their intended disposition. The fair value of the SBA loans to be individually sold are determined based upon their committed sales price. The fair value of the loans to be aggregated into pools for securitization which are committed to be sold, are determined based upon third party price quotes. The fair value of all other SBA loans are determined using a third party pricing service. The prices for the SBA loans, other than those committed to be individually sold, are validated by comparing the third party price quote or the third party pricing service prices, as applicable, for a sample of loans to observable market trades obtained from external sources.
Once the SBA loans are securitized into a pool, the respective securities are classified as trading instruments and are carried at fair value based on our intention to sell the securitizations within the near term. Any changes in the fair value of the securitized pools as well as any realized gains or losses earned thereon are reflected in net trading profit. Sales of the securitizations are accounted for as of settlement date, which is the date we have surrendered control over the transferred assets. We do not retain any interest in the securitizations once they are sold. The fair value for SBA loan securitizations is determined by utilizing observable prices obtained from a third party pricing service. The third party pricing service provides comparable price evaluations utilizing observable market data for similar securities. We substantiate the prices obtained from the third party pricing service by comparing such prices for a sample of securities to observable market trades obtained from external sources. The instruments valued using these observable inputs are typically classified within Level 2 of the fair value hierarchy.
95
RAYMOND JAMES FINANCIAL, INC AND SUBSIDIARIES
Notes to Consolidated Financial Statements
Corporate loans, which include C&I, CRE, and CRE construction, as well as tax-exempt loans are designated as held for investment upon inception and recognized in loans receivable. If we subsequently designate a corporate or tax-exempt loan as held for sale, which generally occurs as part of a loan workout situation, we then write down the carrying value of the loan with a partial charge-off, if necessary, to carry it at the lower of cost or estimated fair value.
Gains and losses on sales of residential mortgage loans held for sale, SBA loans that are not part of a securitized pool, and corporate loans transferred from the held for investment portfolio, are included as a component of “Other revenues” in the Consolidated Statements of Income and Comprehensive Income, while interest collected on these assets is included in “Interest income.” Net unrealized losses are recognized through a valuation allowance by charges to income as a component of “Other revenues” in the Consolidated Statements of Income and Comprehensive Income.
Off-balance sheet loan commitments -
We have outstanding at any time a significant number of commitments to extend credit and other credit-related off-balance sheet financial instruments such as standby letters of credit and loan purchases. Our policy is generally to require customers to provide collateral at the time of closing. The amount of collateral obtained, if it is deemed necessary upon extension of credit, is based on our credit evaluation of the borrower. Collateral held varies but may include assets such as: marketable securities, accounts receivable, inventory, real estate, and income-producing commercial properties. The potential credit loss associated with these off-balance sheet loan commitments is accrued and reflected in “Other payables” within the Consolidated Statements of Financial Condition. Refer to the allowance for loan losses and reserve for unfunded lending commitments section that follows for a discussion of the reserve calculation methodology.
We recognize the revenue associated with corporate syndicated standby letters of credit, which is generally received quarterly, on a cash basis, the effect of which does not differ materially from recognizing the revenue in the period the fee is earned. Unused corporate line fees are accounted for on an accrual basis.
Nonperforming assets -
Nonperforming assets are comprised of both nonperforming loans and OREO. Nonperforming loans represent those loans which have been placed on nonaccrual status and loans which have been restructured in a manner that grant a concession to a borrower experiencing financial difficulties we would not otherwise consider. Loans structured as described above are deemed to be a trouble debt restructuring (“TDR”). Additionally, any accruing loans which are
90
days or more past due and in the process of collection are considered nonperforming loans.
Loans of all classes are placed on nonaccrual status when we determine that full payment of all contractual principal and interest is in doubt, or the loan is past due
90
days or more as to contractual interest or principal unless the loan, in our opinion, is well-secured and in the process of collection. When a loan is placed on nonaccrual status, the accrued and unpaid interest receivable is written off against interest income and accretion of the net deferred loan origination fees cease. Interest is recognized using the cash method for SBL and residential (first mortgage and home equity) loans and the cost recovery method for corporate and tax-exempt loans thereafter until the loan qualifies for return to accrual status. Loans (including first mortgage and home equity residential mortgage TDRs) are returned to an accrual status when the loans have been brought contractually current with the original or amended terms and have been maintained on a current basis for a reasonable period, generally
six
months. Corporate loan TDRs have generally been partially charged off and therefore, remain on nonaccrual status until the loan is fully resolved.
Other real estate acquired in the settlement of loans, including through, or in lieu of, loan foreclosure, is initially recorded at the lower of cost or fair value less estimated selling costs through a charge to the allowance for loan losses, thus establishing a new cost basis. Subsequent to foreclosure, valuations are periodically performed and the assets are carried at the lower of the carrying amount or fair value, as determined by a current appraisal or valuation less estimated costs to sell, and are classified as “Other assets” on the Consolidated Statements of Financial Condition. These nonrecurring fair value measurements are classified within Level 2 of the fair value hierarchy. Costs relating to development and improvement of the property are capitalized, whereas those relating to holding the property are charged to operations. Sales of OREO are recorded as of the settlement date and any associated gains or losses are included in “Other revenues” on our Consolidated Statements of Income and Comprehensive Income.
Impaired loans -
Loans in all classes are considered to be impaired when, based on current information and events, it is probable that we will be unable to collect the scheduled payments of principal and interest on a loan when due according to the contractual terms of the loan agreement. Loans that experience insignificant payment delays and payment shortfalls generally are not classified as impaired. We determine the significance of payment delays and payment shortfalls on a case-by-case basis, taking into consideration reasons for the delay, the borrower’s prior payment record and the amount of the shortfall in relation to the principal and interest owed. For individual loans identified as impaired, impairment is measured based on the present value of expected future cash flows discounted at the loan’s effective interest rate and taking into consideration the factors described below in relation to the evaluation of the allowance for loan losses, except that as a practical expedient, we measure impairment based on the loan’s observable market price, or the fair value of the collateral if the loan is collateral dependent. Impaired loans include all corporate nonaccrual loans, all residential mortgage
96
RAYMOND JAMES FINANCIAL, INC AND SUBSIDIARIES
Notes to Consolidated Financial Statements
nonaccrual loans for which a charge-off had previously been recorded, and all loans which have been modified in TDRs. Interest income on impaired loans is recognized consistently with the recognition policy of nonaccrual loans.
Allowance for loan losses and reserve for unfunded lending commitments -
We maintain an allowance for loan losses to provide for probable losses inherent in our loan portfolio based on ongoing evaluations of the portfolio, the related risk characteristics, and the overall economic and environmental conditions affecting the loan portfolio. Loan losses are charged against the allowance when we believe the uncollectibility of a loan balance is confirmed. Subsequent recoveries, if any, are credited to the allowance.
We have developed policies and procedures for assessing the adequacy of the allowance for loan losses that reflect the assessment of risk considering all available information. In developing this assessment, we rely on estimates and exercise judgment in evaluating credit risk. The evaluation is inherently subjective as it requires estimates that are susceptible to significant revision as more information becomes available. Depending on changes in circumstances, future assessments of credit risk may yield materially different results from the prior estimates, which may require an increase or a decrease in the allowance for loan losses. Estimates that are particularly susceptible to change that may have an impact on the amount of the allowance include:
|
•
|
the selection of proxy data used to calculate loss factors;
|
|
•
|
the evaluation of loss emergence and historical loss experience periods;
|
|
•
|
our evaluation of the risk profile of loan portfolio segments, including internal risk ratings;
|
|
•
|
the value of underlying collateral, which impacts loss severity and certain cash flow assumptions;
|
|
•
|
our selection and evaluation of qualitative factors, which reflect the imprecision that is inherent in the estimation of probable loan losses.
|
The allowance for loan losses is comprised of
two
components: allowances calculated based on formulas for homogeneous classes of loans collectively evaluated for impairment, which are re-evaluated quarterly and adjusted based on our analysis of certain qualitative factors, and specific allowances assigned to certain classified loans individually evaluated for impairment. The homogeneous classes are a result of management’s disaggregation of the loan portfolio and are comprised of the previously mentioned classes: C&I, CRE, CRE construction, tax-exempt, residential first mortgage, residential home equity, and SBL.
An annual analysis of the loss emergence period estimate, which is the average length of time between the event that triggers a loss and the confirmation and/or charge-off of that loss, is performed for all loan classes. This analysis is utilized in establishing the allowance for each of the classes of loans through the application of an adjustment to the calculated allowance percentage for the respective loan grade.
The loans within the corporate and tax-exempt loan classes are assigned to an internal loan grade based upon the respective loan’s credit characteristics. The loans within the residential first mortgage, residential home equity, and SBL classes are assigned loan grades equivalent to the loan classifications utilized by bank regulators, dependent on their respective likelihood of loss. We assign each loan grade for all loan classes an allowance percentage based on the estimated incurred loss associated with that grade. The allowance for loan losses for all non-impaired loans is then calculated based on the allowance percentage assigned to the respective loan’s class and grade factoring in the respective loss emergence period. The allowance for loan losses for all impaired loans and those nonaccrual residential mortgage loans that have been evaluated for a charge-off are based on an individual evaluation of impairment as previously described in the “Impaired loans” section.
The quantitative factors taken into consideration when assigning the loan grades and allowance percentages to the loans within the corporate and tax-exempt loan classes include: estimates of borrower default probabilities and collateral type; past loss history, Shared National Credit (“SNC”) reviews and examination results from bank regulators. Loan grades for individual C&I and tax-exempt loans are derived from analyzing
two
aspects of the risk profile in a particular loan: the obligor rating and the facility (collateral) rating. The obligor rating relates to a borrower’s probability of default and the facility rating is utilized to estimate the anticipated loss given default. These
two
ratings, which are based on historical long-term industry loss rates (proxy data) as we have limited loss history, are considered in combination with certain adjustments for the loss emergence period to derive the final C&I and tax-exempt loan grades and allowance percentages. The allowance for loans within the CRE and CRE construction loan portfolios is based on loan-level probability of default and loss given default estimates in combination with certain adjustments for loss emergence period.
The quantitative loss rates for corporate and tax-exempt loans are supplemented by considering qualitative factors that may cause estimated losses to differ from quantitatively calculated amounts. These qualitative factors are intended to address developing trends, and include, but are not limited to: trends in delinquencies, loan growth; loan terms; changes in geographic distribution; changes in the value of the underlying collateral for collateral-dependent loans; lending policies; loan review process; experience, ability and depth of lending management and other relevant staff; local, regional, national and international economic conditions; competition; legal and regulatory requirements; and concentrations of credit risk.
97
RAYMOND JAMES FINANCIAL, INC AND SUBSIDIARIES
Notes to Consolidated Financial Statements
Historical loan loss rates, a quantitative factor, are utilized when assigning the allowance percentages for residential first mortgage loans and residential home equity loans. These estimated loss rates are based on our historical loss data over a period of time. We currently utilize a look back period for residential first mortgage and home equity loans reflecting the current housing cycle that includes the last downturn.
The SBL portfolio is not yet seasoned enough to exhibit a loss trend; therefore, the allowance is based primarily on peer group allowance information and the qualitative factors noted below.
For residential first mortgage loan, residential home equity loan and SBL classes, the qualitative factors considered to supplement the quantitative analysis include, but are not limited to, loan performance trends, loan product parameters and qualification requirements, borrower credit scores at origination, occupancy (i.e., owner occupied, second home or investment property), documentation level, loan purpose, geographic concentrations, average loan size, loan policy exceptions, updated loan-to-value (“LTV”) ratios, and the factors noted above that are utilized for corporate loans. The allowance for loan losses for SBL is determined judgmentally by management, which utilizes peer benchmarking data as we have historically not experienced losses on this portfolio.
We reserve for losses inherent in its unfunded lending commitments using a methodology similar to that used for loans in the respective portfolio segment, based upon loan grade and expected funding probabilities for fully binding commitments. This will result in some reserve variability over different periods depending upon the mix of the loan portfolio at the time and future funding expectations. All classes of impaired loans which have unfunded lending commitments are analyzed in conjunction with the impaired reserve process previously described.
Loan charge-off policies -
Corporate and tax-exempt loans are monitored on an individual basis, and loan grades are reviewed at least quarterly to ensure they reflect the loan’s current credit risk. When we determine that it is likely a corporate or tax-exempt loan will not be collected in full, the loan is evaluated for potential impairment. After consideration of the borrower’s ability to restructure the loan, alternative sources of repayment, and other factors affecting the borrower’s ability to repay the debt, the portion of the loan deemed to be a confirmed loss, if any, is charged-off. For collateral-dependent loans secured by real estate, the amount of the loan considered a confirmed loss and charged-off is generally equal to the difference between the recorded investment in the loan and the collateral’s appraised value less estimated costs to sell. For C&I and tax-exempt loans, we evaluate all sources of repayment to arrive at the amount considered to be a loss and charged-off. Corporate banking and credit risk managers also hold a monthly meeting to review criticized loans (loans that are rated special mention or worse as defined by bank regulators, see
Note 8
for further discussion). Additional charge-offs are taken when the value of the collateral changes or there is an adverse change in the expected cash flows.
The majority of our corporate loan portfolio is comprised of participations in either SNCs or other large syndicated loans in the U.S. or Canada. The SNCs are U.S. loan syndications totaling over
$20 million
that are shared between
three
or more regulated institutions. The agent bank’s regulator reviews a portion of SNC loans on a semi-annual basis, a process in which other participating banks have no involvement. Once the SNC regulatory review process is complete, we receive a summary of the review of these SNC credits from the Office of the Comptroller of the Currency (“OCC”). This summary includes a synopsis of each loan’s regulatory classification, loans that are designated for nonaccrual status and directed charge-offs. We must be at least as critical with nonaccrual designations, directed charge-offs, and classifications as the OCC. This ensures that each bank participating in a SNC loan rates the loan at least as critical. Any classification changes as a result of the review may impact our reserves and charge-offs during the quarter that the SNC information is received from the OCC, however, these differences in classifications are generally insignificant. The amount of such adjustments depend upon the classification and whether we had the loan classified differently (either more or less critically) than the SNC review findings and, therefore, could result in higher, lower, or no change in loan loss provisions than previously recorded. We incorporate into our ratings process any observed regulatory trends in the semi-annual SNC exam process, but there will inherently be differences of opinion on individual credits due to the high degree of judgment involved. Corporate loans are subject to our internal review procedures and regulatory review by the OCC as part of our regulatory examination.
Every residential mortgage loan over
60
days past due is reviewed monthly and documented in a written report detailing delinquency information, balances, collection status, current valuation estimate and other data points. RJ Bank senior management meets monthly to discuss the status, collection strategy and charge-off recommendations on every residential mortgage loan over
60
days past due with charge-offs considered on residential mortgage loans once the loans are delinquent
90
days or more and then generally taken before the loan is
120
days past due. A charge-off is taken against the allowance for loan losses for the difference between the loan amount and the amount that we estimate will ultimately be collected, based on the value of the underlying collateral less estimated costs to sell. We predominantly use broker price opinions (“BPO”) for these valuations as access to the property is restricted during the collection and foreclosure process and there is insufficient data available for a full appraisal to be performed. BPOs contain relevant and timely sale comparisons and listings in the marketplace and, therefore, we have found these BPOs to be reasonable determinants of market value in lieu of appraisals and more reliable than an automated valuation tool or the use of tax assessed values. A full appraisal is obtained post-foreclosure. We take further charge-offs against the owned asset if an appraisal has a lower valuation than the original
98
RAYMOND JAMES FINANCIAL, INC AND SUBSIDIARIES
Notes to Consolidated Financial Statements
BPO, but do not reverse previously charged-off amounts if the appraisal is higher than the original BPO. If a loan remains in pre-foreclosure status for more than
nine
months, an updated valuation is obtained and further charge-offs are taken against the allowance for loan losses, if necessary.
Loans to financial advisors, net
We offer loans to financial advisors and certain other key revenue producers, primarily for recruiting, transitional cost assistance, and retention purposes. These loans are generally repaid over a
five
to
eight
year period with interest recognized as earned. There is no fee income associated with these loans. We assess future recoverability of these loans through analysis of individual financial advisor production or other performance standards. In the event that the financial advisor is no longer affiliated with us, any unpaid balance of such loan becomes immediately due and payable to us. In determining the allowance for doubtful accounts related to former employees or independent contractors, management primarily considers our historical collection experience as well as other factors including amounts due at termination, the reasons for the terminated relationship, and the former financial advisor’s overall financial position. When the review of these factors indicates that further collection activity is highly unlikely, the outstanding balance of such loan is written-off and the corresponding allowance is reduced. Based upon the nature of these financing receivables, we do not analyze this asset on a portfolio segment or class basis. Further, the aging of this receivable balance is not a determinative factor in computing our allowance for doubtful accounts, as concerns regarding the recoverability of these loans primarily arise in the event that the financial advisor is no longer affiliated with us. We present the outstanding balance of loans to financial advisors on our Consolidated Statements of Financial Condition, net of the allowance for doubtful accounts. Of the gross balance outstanding, the portion associated with financial advisors who are no longer affiliated with us was approximately
$22 million
and
$13 million
at September 30, 2017 and 2016, respectively. Our allowance for doubtful accounts was approximately
$8 million
and
$5 million
at September 30, 2017 and 2016, respectively.
Other assets
We carry investments in stock of the Federal Home Loan Bank of Atlanta (“FHLB”) and the Federal Reserve Bank of Atlanta (the “FRB”) at cost. These investments are held in accordance with certain membership requirements, are restricted, and lack a market. FHLB and FRB stock can only be sold to the issuer or another member institution at its par value. We annually evaluate our holdings in FHLB and FRB stock for potential impairment based upon its assessment of the ultimate recoverability of the par value of the stock. This annual evaluation is comprised of a review of the capital adequacy, liquidity position and the overall financial condition of the FHLB and FRB to determine the impact these factors have on the ultimate recoverability of the par value of the respective stock. Impairment evaluations are performed more frequently if events or circumstances indicate there may be impairment. Any cash dividends received from these investments are recognized as “Interest income” in the Consolidated Statements of Income and Comprehensive Income.
We also maintain investments in a significant number of company-owned life insurance policies utilized to fund certain non-qualified deferred compensation plans and other employee benefit plans (see
Note 20
for information on the non-qualified deferred compensation plans). The life insurance policies are carried at cash surrender value as determined by the insurer. See
Note 9
for additional information.
Investments in real estate partnerships held by consolidated variable interest entities
Raymond James Tax Credit Funds, Inc. (“RJTCF”), a wholly owned subsidiary of RJF, or
one
of its affiliates, is the managing member or general partner in LIHTC funds, some of which require consolidation (refer to the separate discussion that follows of our policies regarding the evaluation of VIEs to determine if consolidation is required ). These funds invest in housing project limited partnerships or limited liability companies (“LLCs”) which purchase and develop affordable housing properties qualifying for federal and state low-income housing tax credits. The balance presented is the investment in project partnership balance of all of the LIHTC fund VIEs which require consolidation. Additional information is presented in
Note 10
.
Property and equipment
Property, equipment and leasehold improvements are stated at cost less accumulated depreciation and amortization. Depreciation of assets is primarily provided for using the straight-line method over the estimated useful lives of the assets, which range from
two
to
10
years for software,
three
to
five
years for furniture, fixtures and equipment and
10
to
31
years for buildings, building components, building improvements and land improvements. Leasehold improvements are amortized using the straight-line method over the shorter of the remaining lease term or the estimated useful lives of the assets. Depreciation expense associated with property, equipment and leasehold improvements is included in “Occupancy and equipment costs” in the Consolidated Statements of Income and Comprehensive Income. Amortization expense associated with computer software is included in “Communications and information processing” expense in the Consolidated Statements of Income and Comprehensive Income.
99
RAYMOND JAMES FINANCIAL, INC AND SUBSIDIARIES
Notes to Consolidated Financial Statements
Additions, improvements and expenditures that extend the useful life of an asset are capitalized. Expenditures for repairs and maintenance are charged to operations in the period incurred. Gains and losses on disposals of property and equipment are reflected in the Consolidated Statements of Income and Comprehensive Income in the period realized.
Intangible assets
Certain identifiable intangible assets we acquire such as customer relationships, trade names, developed technology, intellectual property, and non-compete agreements, are amortized over their estimated useful lives on a straight-line method, and are evaluated for potential impairment whenever events or changes in circumstances suggest that the carrying value of an asset or asset group may not be fully recoverable. Amortization expense associated with such intangible assets is included in “Other expenses” in the Consolidated Statements of Income and Comprehensive Income.
Goodwill
Goodwill represents the cost of acquired businesses in excess of the fair value of the related net assets acquired. GAAP does not provide for the amortization of indefinite-life intangible assets such as goodwill. Rather, these assets are subject to an evaluation of potential impairment on an annual basis, or more often if events or circumstances indicate there may be impairment. Goodwill impairment is determined by comparing the estimated fair value of a reporting unit with its respective carrying value. If the estimated fair value exceeds the carrying value, goodwill at the reporting unit level is not deemed to be impaired. However, if the estimated fair value is below carrying value, further analysis is required to determine the amount of the impairment. This further analysis involves assigning tangible assets and liabilities, identified intangible assets and goodwill to reporting units and comparing the fair value of each reporting unit to its carrying amount.
In the course of our evaluation of the potential impairment of goodwill, we may perform either a qualitative or a quantitative assessment. Our qualitative assessment of potential impairment may result in the determination that a quantitative impairment analysis is not necessary. Under this elective process, we assess qualitative factors to determine whether the existence of events or circumstances leads us to determine that it is more likely than not that the fair value of a reporting unit is less than its carrying amount. If after assessing the totality of events or circumstances, we determine it is more likely than not that the fair value of a reporting unit is greater than its carrying amount, then performing a quantitative analysis is not required. However, if we conclude otherwise, then we perform a quantitative impairment analysis.
If we either choose not to perform a qualitative assessment, or we choose to perform a qualitative assessment but are unable to qualitatively conclude that no impairment has occurred, then we perform a quantitative evaluation. In the case of a quantitative assessment, we estimate the fair value of the reporting unit which the goodwill that is subject to the quantitative analysis is associated (generally defined as the businesses for which financial information is available and reviewed regularly by management) and compare it to the carrying value. If the estimated fair value of a reporting unit is less than its carrying value, we estimate the fair value of all assets and liabilities of the reporting unit, including goodwill. If the carrying value of the reporting unit’s goodwill is greater than the estimated fair value, an impairment charge is recognized for the excess.
We have elected January 1 as our annual goodwill impairment evaluation date, evaluating balances as of December 31 (see
Note 12
for additional information regarding the outcome of our goodwill impairment assessments).
Contingent liabilities
We recognize liabilities for contingencies when there is an exposure that, when fully analyzed, indicates it is both probable that a liability has been incurred and the amount of loss can be reasonably estimated. Whether a loss is probable, and if so, the estimated range of possible loss, is based upon currently available information and is subject to significant judgment, a variety of assumptions, and uncertainties. When a range of possible loss can be estimated, we accrue the most likely amount within that range; if the most likely amount of possible loss within that range is not determinable, we accrue a minimum based on the range of possible loss. No liability is recognized for those matters which, in management’s judgment, the determination of a reasonable estimate of loss is not possible.
We record liabilities related to legal and regulatory proceedings in “Other payables” on our Consolidated Statements of Financial Condition. The determination of these liability amounts requires significant judgment on the part of management. Management considers many factors including, but not limited to: the amount of the claim; the amount of the loss in the client’s account; the basis and validity of the claim; the possibility of wrongdoing on the part of one of our employees or financial advisors; previous results in similar cases; and legal precedents and case law. Each legal proceeding or significant regulatory matter is reviewed with counsel in
100
RAYMOND JAMES FINANCIAL, INC AND SUBSIDIARIES
Notes to Consolidated Financial Statements
each accounting period and the liability balance is adjusted as deemed appropriate by management. Any change in the liability amount is recorded in the consolidated financial statements and is recognized as either a charge, or a credit, to net income in that period. The actual costs of resolving legal matters or regulatory proceedings may be substantially higher or lower than the recorded liability amounts for such matters. We expense our cost of defense related to such matters in the period they are incurred.
Share-based compensation
We account for share-based awards through the measurement and recognition of compensation expense for all share-based payment awards made to employees and directors based on estimated fair values. The compensation cost is recognized over the requisite service period of the awards and is calculated as the market value of the awards on the date of the grant. In addition, we account for share-based awards to our independent contractor financial advisors in accordance with guidance applicable to accounting for equity instruments that are issued to other than employees for acquiring, or in conjunction with selling, goods or services and guidance applicable to accounting for derivative financial instruments indexed to, and potentially settled in, a company’s own stock. Share-based awards granted to our independent contractor financial advisors are measured at their vesting date fair value and their fair value estimated at reporting dates prior to that time. The compensation expense recognized each period is based on the most recent estimated value. Further, we classify certain of these non-employee awards as liabilities at fair value upon vesting, with changes in fair value reported in earnings until these awards are exercised or forfeited. Compensation expense is recognized for all share-based compensation with future service requirements over the requisite service period using the straight-line method, and in certain instances, the graded attribution method. As discussed above, we assumed certain DBRSU awards as part of our acquisition of Alex. Brown that will ultimately be settled in DB common shares provided that certain performance metrics are achieved. The portion of these awards that related to services performed by the award recipients before the acquisition of Alex. Brown represented consideration transferred in the business combination. The portion of these awards which related to compensation for future services were treated as a prepaid compensation asset which had a corresponding derivative liability. The prepaid compensation asset is amortized over the remaining requisite service period of the recipient using the straight-line method while the derivative liability is recorded at fair value at the end of each reporting period until it is settled. Refer to the “Derivative assets and derivative liabilities” sub-section of the “Financial instruments owned, financial instruments sold but not yet purchased and fair value” section of this footnote for information regarding the determination of the fair value of this derivative. The amortization of the prepaid asset and the change in fair value of the derivative liability is recorded in “Compensation, commissions and benefits” expense in our Consolidated Statements of Income and Comprehensive Income. See
Note 20
for additional information on this share-based compensation plan.
Deferred compensation plans
We maintain various deferred compensation plans for the benefit of certain employees and independent contractors that provide a return to the participant based upon the performance of various referenced investments. For certain of these plans, we directly hold investments related to our obligations to perform under the deferred compensation plans (see the “Other Investments
”
discussion within the “Financial instruments owned, financial instruments sold but not yet purchased and fair value” section of this
Note 2
for further discussion of these assets). For other such plans, including our Long Term Incentive Plan (“LTIP”) and our Wealth Accumulation Plan, we purchase and hold life insurance on the lives of certain current and former participants to earn a competitive rate of return for participants and to provide a source of funds available to satisfy our obligations under the plan (see
Note 9
for information regarding the carrying value of such policies). Compensation expense is recognized for all awards made under such plans with future service requirements over the requisite service period using the straight-line method. Changes in the value of the company-owned life insurance and other investments, as well as the expenses associated with the related deferred compensation plans, are recorded in “Compensation, commissions and benefits” expense on our Consolidated Statements of Income and Comprehensive Income. See
Note 20
for additional information.
Leases
We lease office space and equipment under operating leases. We recognize rent expense related to these operating leases on a straight-line basis over the lease term. The lease term commences on the earlier of the date when we become legally obligated for the rent payments or the date on which we take possession of the property. For tenant improvement allowances and rent holidays, we record a deferred rent liability in “Other payables” on our Consolidated Statements of Financial Condition and amortize the deferred rent over the lease term as a reduction to rent expense in the Consolidated Statements of Income and Comprehensive Income. In instances where the office space or equipment under an operating lease will be abandoned prior to the expiration of the lease term (these instances primarily result from the effects of acquisitions), we accrue an estimate of any projected loss in the Consolidated Statements of Income and Comprehensive Income at the time such abandonment is known and any loss is estimable.
101
RAYMOND JAMES FINANCIAL, INC AND SUBSIDIARIES
Notes to Consolidated Financial Statements
Foreign currency translation
The statements of financial condition of the foreign subsidiaries we consolidate are translated at exchange rates as of the period end. The statements of income are translated either at an average exchange rate for the period or, in the case of the foreign subsidiary of RJ Bank, at the exchange rate in effect on the date which transactions occur. The gains or losses resulting from translating foreign currency financial statements into U.S. dollars are included in other comprehensive income/(loss) and are thereafter presented in equity as a component of AOCI.
Income taxes
The objectives of accounting for income taxes are to recognize the amount of taxes payable or refundable for the current year. We utilize the asset and liability method to provide income taxes on all transactions recorded in the consolidated financial statements. This method requires that income taxes reflect the expected future tax consequences of temporary differences between the carrying amounts of assets or liabilities for book and tax purposes. Accordingly, a deferred tax asset or liability for each temporary difference is determined based on the tax rates that we expect to be in effect when the underlying items of income and expense are realized. Judgment is required in assessing the future tax consequences of events that have been recognized in our financial statements or tax returns, including the repatriation of undistributed earnings of foreign subsidiaries. Variations in the actual outcome of these future tax consequences could materially impact our financial position, results of operations, or liquidity. See
Note 16
for further information on our income taxes.
Earnings per share (“EPS”)
Basic EPS is calculated by dividing earnings available to common shareholders by the weighted-average number of common shares outstanding. Earnings available to common shareholders’ represents Net Income Attributable to Raymond James Financial, Inc. reduced by the allocation of earnings and dividends to participating securities. Diluted EPS is similar to basic EPS, but adjusts for the dilutive effect of outstanding stock options and restricted stock units by application of the treasury stock method.
Evaluation of VIEs to determine whether consolidation is required
A VIE requires consolidation by the entity’s primary beneficiary. Examples of entities that may be VIEs include certain legal entities structured as corporations, partnerships or limited liability companies.
We evaluate all of the entities in which we are involved to determine if the entity is a VIE and if so, whether we hold a variable interest and are the primary beneficiary. We hold variable interests in the following VIEs: certain private equity investments, a trust fund established for employee retention purposes (“Restricted Stock Trust Fund”), certain LIHTC funds and certain new market tax credit funds (“NMTC Funds”).
Determination of the primary beneficiary of a VIE -
We consolidate VIEs that are subject to assessment when we are deemed to be the primary beneficiary of the VIE. The process for determining whether we are the primary beneficiary of the VIE is to conclude whether we are a party to the VIE holding a variable interest that meets both of the following criteria: (1) has the power to make decisions that most significantly affect the economic performance of the VIE, and (2) has the obligations to absorb losses or the right to receive benefits that in either case could potentially be significant to the VIE.
Private Equity Interests -
As part of our private equity investments, we hold interests in a number of limited partnerships (our “Private Equity Interests”). We have concluded that the Private Equity Interests are VIEs, primarily as a result of the treatment of limited partner kick-out and participation rights as a simple majority of the limited partners cannot initiate an action to kick-out the general partner without cause and the limited partners with equity at-risk lack substantive participating rights.
In our analysis of the criteria to determine whether we are the primary beneficiary of the Private Equity Interests VIEs, we analyze the power and benefits criteria. In a number of these entities, we are a passive limited partner investor, and thus we do not have the power to make decisions that most significantly affect the economic performance of such VIEs. Accordingly, in such circumstances we have determined we are not the primary beneficiary and therefore we do not consolidate the VIE. However, in certain of these entities, we have concluded that we are the primary beneficiary as we meet the power and benefits criteria. In such instances, we consolidate the Private Equity Interests VIE.
Restricted Stock Trust Fund -
We utilize a trust in connection with certain of our restricted stock unit awards. This trust fund was established and funded for the purpose of acquiring our common stock in the open market to be used to settle restricted stock units granted as a retention vehicle for certain employees of one of our Canadian subsidiaries. We are deemed to be the primary beneficiary and, accordingly, consolidate this trust fund.
102
RAYMOND JAMES FINANCIAL, INC AND SUBSIDIARIES
Notes to Consolidated Financial Statements
LIHTC Funds -
RJTCF is the managing member or general partner in a number of LIHTC Funds having
one
or more investor members or limited partners. These low-income housing tax credit funds are organized as LLCs or limited partnerships for the purpose of investing in a number of project partnerships, which are limited partnerships or LLCs that in turn purchase and develop low-income housing properties qualifying for tax credits.
Our determination of the primary beneficiary of each tax credit fund in which RJTCF has a variable interest requires judgment and is based on an analysis of all relevant facts and circumstances, including: (1) an assessment of the characteristics of RJTCF’s variable interest and other involvement it has with the tax credit fund, including involvement of related parties and any de facto agents, as well as the involvement of other variable interest holders, namely, limited partners or investor members, and (2) the tax credit funds’ purpose and design, including the risks that the tax credit fund was designed to create and pass through to its variable interest holders. In the design of tax credit fund VIEs, the overriding premise is that the investor members invest solely for tax attributes associated with the portfolio of low-income housing properties held by the fund, while RJTCF, as the managing member or general partner of the fund, is responsible for overseeing the fund’s operations.
Non-guaranteed LIHTC funds -
Except for
one
guaranteed fund discussed below, RJTCF does not provide guarantees related to the delivery or funding of tax credits or other tax attributes to the investor members or limited partners of tax credit funds. The investor member(s) or limited partner(s) of the VIEs bear the risk of loss on their investment. Additionally, under the tax credit funds’ designed structure, the investor member(s) or limited partner(s) receive nearly all of the tax credits and tax-deductible loss benefits designed to be delivered by the fund entity, as well as a majority of any proceeds upon a sale of a project partnership held by a tax credit fund (fund level residuals). RJTCF earns fees from the fund for its services in organizing the fund, identifying and acquiring the project partnership investments, ongoing asset management fees, and a share of any residuals arising from sale of project partnerships upon the termination of the fund.
RJTCF sponsors
two
general types of non-guaranteed tax credit funds: either non-guaranteed single investor funds, or non-guaranteed multi-investor funds. In single investor funds, RJTCF has concluded that the
one
single investor member or limited partner in such funds, in nearly all instances, has significant participating rights over the activities that most significantly impact the economics of the fund. Therefore RJTCF, as managing member or general partner of such funds, is not the
one
party with power over such activities and resultantly is not deemed to be the primary beneficiary of such single investor funds and, in nearly all, these funds are not consolidated.
In non-guaranteed multi-investor funds, RJTCF has concluded that since the participating rights over the activities that most significantly impact the economics of the fund are not held by one single investor member or limited partner, RJTCF is deemed to have the power over such activities. RJTCF then assesses whether its projected benefits to be received from the multi-investor funds, primarily its share of any residuals upon the termination of the fund, are potentially significant to the fund. As such residuals received upon termination are not expected to be significant to the funds, RJTCF does not consolidate non-guaranteed multi-investor funds.
Guaranteed LIHTC fund -
In conjunction with
one
of the multi-investor tax credit funds in which RJTCF is the managing member, RJTCF has provided
one
investor member with a guaranteed return on their investment in the fund (the “Guaranteed LIHTC Fund”). As a result of this guarantee obligation, RJTCF has determined that it is the primary beneficiary of, and accordingly consolidates, this guaranteed multi-investor fund.
Direct investments in LIHTC project partnerships -
RJ Bank is also the investor member of a LIHTC fund which we have determined to be a VIE, and in which a subsidiary of RJTCF is the managing member. We have determined that RJ Bank is the primary beneficiary of this VIE and therefore we consolidate the fund. All LIHTC funds which we consolidated are investor members in certain LIHTC project partnerships. Since unrelated third parties are the managing members of the investee project partnerships, we have determined that consolidation of these project partnerships is not required and the funds account for their project partnership investments under the equity method. The carrying value of the funds’ project partnership investments are included in “Investments in real estate partnerships held by consolidated variable interest entities” on our Consolidated Statements of Financial Condition (see
Note 10
for additional information).
New market tax credit funds -
An entity which was at one time an affiliate of Morgan Keegan (as hereinafter defined) is the managing member of a number of NMTC Funds. NMTC Funds are organized as LLCs for the purpose of investing in eligible projects in qualified low-income areas or that serve qualified targeted populations. In return for making a qualified equity investment into the NMTC Funds, the Fund’s investor member receives tax credits eligible to apply against their federal tax liability. These new market tax credits are taken by the investor member over a
seven
year period.
Each of these NMTC Funds have
one
investor member. We have concluded that in each of the NMTC Funds, the investor member of such funds has significant participating rights over the activities that most significantly impact the economics of the NMTC Fund and,
103
RAYMOND JAMES FINANCIAL, INC AND SUBSIDIARIES
Notes to Consolidated Financial Statements
therefore, our affiliate as the managing member of the NMTC Fund does not have the power over such activities. Accordingly, we are not deemed to be the primary beneficiary of these NMTC Funds and, therefore, they are not consolidated.
Recent Accounting Developments
Adoption of new accounting guidance
Consolidation -
In February 2015, the FASB issued amended guidance to the consolidation model (ASU 2015-02), with additional amendments issued in October 2016 (ASU 2016-17). The impact of these amendments on the consolidation model were to:
|
•
|
Eliminate the deferral of the application of the new consolidation model, which had resulted in the application of prior accounting guidance to consolidation determinations of certain investment funds.
|
|
•
|
Make certain changes to the variable interest consolidation model.
|
|
•
|
Make certain changes to the voting interest consolidation model.
|
As a result of our October 1, 2016 adoption of this guidance, we deconsolidated a number of tax credit fund VIEs that had been previously consolidated. We determined that under the new guidance, we are no longer deemed to be the primary beneficiary of these VIEs. We applied the new consolidation guidance on the full retrospective basis, meaning that we have reflected the adjustments arising from this adoption as of the beginning of our earliest comparative period presented. Accordingly, we deconsolidated
$107 million
in assets,
$20 million
in liabilities,
$89 million
in noncontrolling equity interests, and increased retained earnings by
$2 million
, each computed as of September 30, 2016. There was
no
net income impact on our Consolidated Statements of Income and Comprehensive Income for the prior year periods as the net change in revenues, interest and other expenses were offset by the impact of the deconsolidation on the net income/(loss) attributable to noncontrolling interests. In addition, the new consolidation guidance did not change our consolidation conclusions for certain entities but did change the determination of whether an entity was considered a VIE and therefore impacts certain of our disclosures related to VIEs.
Goodwill -
In September 2015, the FASB issued guidance governing adjustments to the provisional amounts recognized at the acquisition date with a corresponding adjustment to goodwill (ASU 2015-16). Such adjustments are required when new information is obtained about facts and circumstances that existed as of the acquisition date that, if known, would have affected the measurement amounts initially recognized or would have resulted in the recognition of additional assets and liabilities. This new guidance eliminates the requirement to retrospectively account for such adjustments. This new guidance was effective for this fiscal year beginning on October 1, 2016. The adoption of this new guidance has not had a material impact on our consolidated financial statements.
Share-based compensation -
In March 2016, the FASB issued amended guidance related to share-based compensation (ASU 2016-09). The amended guidance involves several aspects of the accounting for share-based payment transactions, including the income tax consequences, classification of awards as either equity or liabilities, and classification on the statement of cash flows. We early adopted this guidance as of October 1, 2016. Our adoption of the new stock compensation simplification guidance impacts our determination of income tax expense. Generally, the amount of compensation cost recognized for financial reporting purposes varies from the amount that can ultimately be deducted on the tax return for share-based payment awards. Under the prior guidance, the tax effects of deductions in excess of compensation expense (“windfalls”), as well as the tax effect of any deficiencies (“shortfalls”) were recorded in equity to the extent of previously recognized windfalls, with any remaining shortfall recorded in income tax expense. Under the new guidance, all tax effects related to share-based payments are recorded through tax expense in the periods during which the awards are exercised or vest, as applicable. Under the transition provisions of the new guidance, we have applied this new guidance prospectively to excess tax benefits arising from vesting after the October 1, 2016 adoption date and are no longer presented within financing activities in the Consolidated Statements of Cash Flows. Under the new guidance, excess tax benefits are included along with other income tax cash flows as an operating activity in the Consolidated Statements of Cash Flows. See Notes
16
and
20
for additional information.
Accounting guidance not yet adopted
Revenue recognition -
In May 2014, the FASB issued new guidance regarding revenue recognition (ASU 2014-09). The new guidance is a comprehensive new revenue recognition model that requires a company to recognize revenue to depict the transfer of goods or services to a customer at an amount that reflects the consideration it expects to receive in exchange for those goods or services. It also provides guidance on accounting for certain contract costs and requires additional disclosures. This new revenue recognition guidance, including subsequent amendments, is first effective for us for our fiscal year beginning on October 1, 2018 and allows for full retrospective adoption or modified retrospective adoption. Although, early adoption is permitted for fiscal years beginning after December 15, 2016, we do not plan to early adopt. Upon adoption, we plan to use a modified retrospective approach, with a cumulative effect adjustment to opening retained earnings. Our implementation efforts include identifying revenues and costs within the scope of the standard, analyzing contracts and reviewing potential changes to our existing revenue recognition accounting policies. Based on our
104
RAYMOND JAMES FINANCIAL, INC AND SUBSIDIARIES
Notes to Consolidated Financial Statements
implementation efforts to date, we expect that we will be required to change our current presentation of certain costs from a net presentation within revenues to a gross presentation, particularly with respect to merger & acquisitions advisory transactions and underwriting transactions. We are still evaluating the impact the adoption of this new guidance will have on our financial position and results of operations. We are also still evaluating the impact to our disclosures as a result of adopting this new guidance.
Financial instruments -
In January 2016, the FASB issued guidance related to the accounting for financial instruments (ASU 2016-01). Among its provisions, this new guidance:
Requires equity investments (other than those accounted for under the equity method or those that result from the consolidation of the investee) to be measured at fair value with changes in fair value recognized in net income. However, an entity may choose to measure equity investments that do not have readily determinable fair values at cost minus impairment, if any.
|
•
|
Simplifies the impairment assessment of equity investments without readily determinable fair values by requiring a qualitative assessment to identify impairment.
|
|
•
|
Eliminates the requirement to disclose the method(s) and significant assumptions used to estimate the fair value that is required to be disclosed for financial instruments measured at amortized cost on the balance sheet.
|
|
•
|
Requires the use of the exit price notion when measuring the fair value of financial instruments for disclosure purposes.
|
|
•
|
Requires an entity to present separately in other comprehensive income the portion of the total change in the fair value of a liability resulting from a change in the instrument-specific credit risk when the entity has elected to measure the liability at fair value in accordance with the fair value option.
|
|
•
|
Requires separate presentation of financial assets and financial liabilities by measurement category and form of financial asset (that is, securities or loans and receivables) on the balance sheet or the accompanying notes to the financial statements.
|
|
•
|
Clarifies that an entity should evaluate the need for a valuation allowance on a deferred tax asset related to available-for-sale securities in combination with the entity’s other deferred tax assets.
|
This new guidance is effective for us for our fiscal year beginning on October 1, 2018, generally under a modified retrospective approach, with the exception of the amendments related to equity investments without a readily determinable fair value and the use of an exit price notion to measure financial instruments for disclosure purposes, which will be applied prospectively as of the date of adoption. Early adoption is generally not permitted. We are evaluating the impact, if any, the adoption of this new guidance will have on our financial position and results of operations.
Lease accounting -
In February 2016, the FASB issued new guidance related to the accounting for leases (ASU 2016-02). The new guidance requires the recognition of assets and liabilities on the balance sheet related to the rights and obligations created by lease agreements, regardless of whether they are classified as finance or operating leases. Consistent with current guidance, the recognition, measurement and presentation of expenses and cash flows arising from a lease will primarily depend upon its classification as a finance or operating lease. The new guidance requires new disclosures to help financial statement users better understand the amount, timing and cash flows arising from leases. The new guidance is first effective for our fiscal year beginning on October 1, 2019 and will be adopted under a modified retrospective approach. Early adoption is permitted. This new guidance will impact our financial position and results of operations. We are evaluating the magnitude of such impact.
Derivatives and hedging (contract novations) -
In March 2016, the FASB issued new guidance related to derivatives and hedging, specifically the effect of derivative contract novations on existing hedge accounting relationships (ASU 2016-05). The new guidance clarifies that a change in counterparty to a derivative instrument that has been designated as a hedging instrument under the current guidance does not, in and of itself, require re-designation of that hedging relationship provided that all other hedge accounting criteria continue to be met. The new guidance is first effective for our fiscal year beginning October 1, 2017 and will be adopted under either a prospective or modified retrospective basis. We plan to adopt this guidance on a prospective basis and do not expect this new guidance to have a material effect on our financial position and results of operations.
Derivatives and hedging (contingent put and call options in debt instruments) -
In March 2016, the FASB issued new guidance related to derivatives and hedging, specifically contingent put and call options in debt instruments (ASU 2016-06). The new guidance clarifies the requirements for assessing whether contingent call/(put) options that can accelerate the payment of principal on debt instruments are clearly and closely related to their debt hosts. An entity performing the assessment is required to assess the embedded call/(put) options solely in accordance with the following four-step decision sequence; an entity must consider: 1) whether the payoff is adjusted based on changes in an index; 2) whether the payoff is indexed to an underlying other than interest rates or credit risk; 3) whether the debt involves a substantial premium or discount; and 4) whether the call/(put) option is contingently exercisable. The new guidance is first effective for our fiscal year beginning October 1, 2017 and will be adopted under a modified retrospective approach. We are evaluating the impact the adoption of this new guidance will have on our financial position and results of operations.
105
RAYMOND JAMES FINANCIAL, INC AND SUBSIDIARIES
Notes to Consolidated Financial Statements
Equity method investments and joint ventures -
In March 2016, the FASB issued new guidance related to equity method investments and joint ventures (ASU 2016-07). The new guidance eliminates the requirement that when an investment qualifies for use of the equity method as a result of an increase in the level of ownership interest or degree of influence, an investor must adjust the investment, results of operations, and retained earnings retroactively on a step-by-step basis as if the equity method had been in effect during all previous periods that the investment had been held. Additionally, the new guidance requires that the equity method investor add the cost of acquiring the additional interest in the investee to the current basis of the investor’s previously held interest and adopt the equity method of accounting as of the date the investment becomes qualified for equity method accounting and therefore upon qualifying for the equity method of accounting. No retroactive adjustment of the investment is required. The new guidance is first effective for our fiscal year beginning October 1, 2017 on a prospective basis. Given that this guidance applies to entity specific transactions and would only become relevant in certain circumstances, we are unable to estimate the impact, if any, this new guidance may have on our financial position.
Credit losses -
In June 2016, the FASB issued new guidance related to the measurement of credit losses on financial instruments (ASU 2016-13). The amended guidance involves several aspects of the accounting for credit losses related to certain financial instruments including assets measured at amortized cost, available-for-sale debt securities and certain off-balance sheet commitments. The new guidance broadens the information that an entity must consider in developing its estimated credit losses expected to occur over the remaining life of assets measured either collectively or individually to include historical experience, current conditions and reasonable and supportable forecasts, replacing the existing incurred credit loss model and other models with the Current Expected Credit Losses (“CECL”) model. The new guidance expands the disclosure requirements regarding an entity’s assumptions, models, and methods for estimating credit losses and requires new disclosures of the amortized cost balance for each class of financial asset by credit quality indicator, disaggregated by the year of origination. The new guidance is first effective for our fiscal year beginning October 1, 2020 and will be adopted under a modified retrospective approach. Early adoption is permitted although not prior to our fiscal year beginning October 1, 2019. We have begun our implementation and evaluation efforts by establishing a cross-functional team to assess the required changes to our credit loss estimation methodologies and systems, as well as determine additional data and resources required to comply with the new guidance. We are evaluating the impact the adoption of this new guidance will have on our financial position and results of operations, which will depend on, among other things, the current and expected macroeconomic conditions and the nature and characteristics of financial assets held by us on the date of adoption.
Statement of Cash Flows (classification of certain cash receipts and cash payments) -
In August 2016, the FASB issued amended guidance related to the Statement of Cash Flows (ASU 2016-15). The amended guidance involves several aspects of the classification of certain cash receipts and cash payments including debt prepayment or debt extinguishment costs, settlement of zero-coupon debt instruments or other debt instruments with coupon interest rates that are insignificant in relation to the effective interest rate of the borrowing, contingent consideration payments made after a business combination, proceeds from the settlement of insurance claims, proceeds from the settlement of corporate-owned life insurance policies (including bank-owned life insurance policies), distributions received from equity method investees, beneficial interests in securitization transactions and separately identifiable cash flows and application of the predominance principle. The amended guidance is first effective for our financial report covering the quarter ended December 31, 2018 and will be adopted under a retrospective approach. Early adoption is permitted. The adoption of this new guidance will impact our Statement of Cash Flows and will not have an impact on our financial position and results of operations.
Income tax impact of intra-entity transfers of assets -
In October 2016, the FASB issued guidance related to the accounting for income tax consequences of intra-entity transfers of assets (ASU 2016-16). Current GAAP prohibits the recognition of current and deferred income taxes for intra-entity asset transfers until the asset has been sold to an outside party. Under the new guidance, an entity should recognize the income tax consequences of an inter-entity transfer of an asset when the transfer occurs. The guidance is first effective for our fiscal year beginning October 1, 2018 and will be adopted under a retrospective approach. Early adoption is permitted. We are evaluating the impact the adoption of this new guidance will have on our financial position and results of operations.
Statement of Cash Flows (restricted cash) -
In November 2016, the FASB issued guidance related to the classification and presentation of changes in restricted cash on the Statement of Cash Flows (ASU 2016-18). Current GAAP does not provide guidance to address how to classify and present changes in restricted cash or restricted cash equivalents that occur when there are transfers between cash, cash equivalents and restricted cash or restricted cash equivalents and when there are direct cash receipts into restricted cash or restricted cash equivalents or direct cash payments made from restricted cash or restricted cash equivalents. Under the new guidance, an entity should present in their Statement of Cash Flows the changes during the period in the total of cash and cash equivalents and amounts described as restricted cash or restricted cash equivalents when reconciling the beginning-of-period and ending-of-period total amounts shown on the statement of cash flows. The guidance is first effective for our financial report covering the quarter ended December 31, 2018 and will be adopted under a retrospective approach. Early adoption is permitted. We are evaluating the impact the adoption of this new guidance will have on our Consolidated Statements of Cash Flows.
106
RAYMOND JAMES FINANCIAL, INC AND SUBSIDIARIES
Notes to Consolidated Financial Statements
Definition of a business -
In January 2017, the FASB issued amended guidance related to the definition of a business (ASU 2017-01). This amended guidance clarifies the definition of a business with the objective of adding guidance to assist entities with evaluating whether transactions should be accounted for as acquisitions (or disposals) of assets or businesses. The guidance is first effective for our fiscal year beginning October 1, 2018 and will be adopted on a prospective basis. Early adoption is permitted. Given the adoption of this amended guidance is dependent upon the nature of future events and circumstances, we are unable to estimate the impact, if any, the adoption of this new guidance will have on our financial position and results of operations.
Goodwill -
In January 2017, the FASB issued amended guidance to simplify the subsequent measurement of goodwill, eliminating “Step 2” from the goodwill impairment test (ASU 2017-04). In computing the implied fair value of goodwill under Step 2, an entity had to perform procedures to determine the fair value at the impairment testing date of its assets and liabilities following the procedure that would be required in determining the fair value of assets acquired and liabilities assumed in a business combination. Under the amended guidance, an entity should perform its annual, or interim, goodwill impairment test by comparing the fair value of a reporting unit with its carrying amount and subsequently recognize an impairment charge for the amount by which the carrying amount exceeds the reporting unit’s fair value; however, the loss recognized should not exceed the total amount of goodwill allocated to that reporting unit. The guidance is first effective for our financial report covering the quarter ended December 31, 2019 and will be adopted on a prospective basis. Early adoption is permitted for interim or annual goodwill impairment tests performed on testing dates after January 1, 2017. We will adopt this simplification guidance in the earliest period it applies to our facts and circumstances.
Share-based payment awards -
In May 2017, the FASB issued amended guidance that clarifies when changes to the terms or conditions of share-based payment awards require an entity to apply modification accounting (ASU 2017-09). The amended guidance states an entity should account for the effects of a modification unless certain criteria are met which include that the modified award has the same fair value, vesting conditions and classification as the original award. The guidance is first effective for our fiscal year beginning October 1, 2019 on a prospective basis; however, early adoption is permitted. Given that this guidance applies to specific transactions and would only become relevant in certain circumstances, we are unable to estimate the impact, if any, this new guidance may have on our financial position.
Derivatives and hedging (accounting for hedging activities) -
In August 2017, the FASB issued new guidance amending its hedge accounting model (ASU 2017-12). Among other things, the new guidance:
|
•
|
Expands the ability to hedge nonfinancial and financial risk components.
|
|
•
|
Reduces complexity in fair value hedges of interest rate risk.
|
|
•
|
Eliminates the requirement to separately measure and report hedge ineffectiveness.
|
|
•
|
Generally requires the entire change in the fair value of a hedging instrument to be presenting in the same income statement line as the hedged item.
|
|
•
|
Modifies accounting for components excluded from the assessment of hedge effectiveness.
|
|
•
|
Eases certain documentation and hedge effectiveness assessment requirements.
|
The new guidance is first effective for our fiscal year beginning October 1, 2019; however, early adoption is permitted. The amendments are required to be applied to cash flow and net investment hedges that exist on the date of adoption on a modified retrospective basis. Changes to presentation and disclosure requirements are only required on a prospective basis. We are evaluating whether we will early adopt this new guidance and the impact it will have on our financial position and results of operations.
Acquisition announcements during fiscal year 2017
In April 2017, we announced we had entered into a definitive agreement to acquire
100%
of the outstanding shares of Scout Investments, Inc. (the “Scout Group”), an asset management and distribution entity, from UMB Financial Corporation. The Scout Group includes Scout Investments (“Scout”) and its Reams Asset Management division (“Reams”), as well as Scout Distributors. The addition of Scout, an equity asset manager, and Reams, an institutional-focused fixed income specialist, broadens the investment solutions available to our clients. As of December 31, 2016, Scout and its Reams division had combined assets under management and advisement of
107
RAYMOND JAMES FINANCIAL, INC AND SUBSIDIARIES
Notes to Consolidated Financial Statements
approximately
$27 billion
. The Scout Group was included in our Asset Management segment upon completion of this acquisition, which occurred on November 17, 2017.
Acquisitions completed during fiscal year 2016
Mummert & Company Corporate Finance GmbH (“Mummert”)
In
June 2016
, we completed our acquisition of all of the outstanding shares of Mummert, a middle market M&A advisory firm, headquartered in Munich, Germany, that was focused primarily on the technology, industrial, healthcare, consumer and business services sectors. Mummert expanded our investment banking capabilities in Europe, and has been integrated into our Capital Markets segment. For purposes of certain acquisition-related financial reporting requirements, the Mummert acquisition was not considered a material acquisition. We accounted for this acquisition under the acquisition method of accounting with the assets and liabilities of Mummert recorded as of the acquisition date at their respective fair values in our consolidated financial statements. Mummert’s results of operations have been included in our results prospectively from June 1, 2016. See Note 17 for information regarding the contingent consideration associated with the Mummert transaction.
MacDougall, MacDougall & MacTier Inc. (“3Macs”)
In
August 2016
, we completed our acquisition of all of the outstanding shares of 3Macs, an independent investment firm founded in 1849 and headquartered in Montreal, Quebec, Canada. As of the acquisition date, 3Macs had approximately
70
financial advisors with approximately
$6 billion
(Canadian) of client assets under administration. The 3Macs financial advisors operate within
RJ Ltd.
in our Private Client Group segment. For purposes of certain acquisition-related financial reporting requirements, the 3Macs acquisition was not considered a material acquisition. We accounted for this acquisition under the acquisition method of accounting with the assets and liabilities of 3Macs recorded as of the acquisition date at their respective fair values in our consolidated financial statements. 3Macs results of operations have been included in our results prospectively from
August 31, 2016
.
U.S. Private Client Services unit of Deutsche Bank Wealth Management
In
September 2016
, we completed an acquisition of certain specified assets and the assumption of certain specified liabilities of the U.S. Private Client Services unit of Deutsche Bank Wealth Management (“Alex. Brown”) from Deutsche Bank Securities, Inc. As of the acquisition date, approximately
190
financial advisors with approximately
$46 billion
of client assets under administration joined the firm. Alex. Brown is included in our Private Client Group segment. For purposes of certain acquisition-related financial reporting requirements, the Alex. Brown acquisition was not considered a material acquisition. We accounted for this acquisition under the acquisition method of accounting with the specific assets acquired and liabilities of Alex. Brown we assumed recorded as of the acquisition date at their respective fair values in our consolidated financial statements. Alex. Brown’s results of operations have been included in our results of operations prospectively from
September 6, 2016
.
As part of the acquisition of Alex. Brown, we assumed the liability for certain DBRSU awards, including the associated plan terms and conditions, which will ultimately be settled in DB common shares if the conditions outlined in the plan are met. At various dates throughout fiscal year 2016, we purchased DB common shares to serve as an economic hedge to the DBRSU liability. See
Note 2
and
Note 20
for further information on this liability.
108
RAYMOND JAMES FINANCIAL, INC AND SUBSIDIARIES
Notes to Consolidated Financial Statements
Acquisition-related expenses
The “Acquisition-related expenses” presented in our Consolidated Statements of Income and Comprehensive Income for the
year ended September 30, 2017
and
2016
pertain to certain incremental expenses incurred in connection with the acquisitions described above.
The table below presents a summary of acquisition-related expenses incurred in each respective period. Our acquisition-related expenses associated with our fiscal year 2015 acquisitions were not significant.
|
Year ended September 30,
|
||||||||
|
$ in thousands
|
2017
|
2016
|
||||||
|
Severance
|
$
|
5,859
|
|
$
|
866
|
|
||
|
Acquisition and integration-related incentive compensation costs
|
5,474
|
|
—
|
|
||||
|
Early termination costs of assumed contracts
|
1,329
|
|
—
|
|
||||
|
Information systems integration costs
|
1,380
|
|
21,752
|
|
||||
|
Legal and regulatory
|
3,192
|
|
8,334
|
|
||||
|
Post-closing purchase price contingency
|
(3,345
|
)
|
—
|
|
||||
|
DBRSU obligation and related hedge
|
770
|
|
4,837
|
|
||||
|
All other
|
3,336
|
|
4,917
|
|
||||
|
Total acquisition-related expenses
|
$
|
17,995
|
|
$
|
40,706
|
|
||
In the table above:
|
•
|
Severance expenses primarily arose from the 3Macs acquisition. Such costs included severance costs as well as any forgiven employee loan balances and any unamortized balance of the prepaid compensation asset associated with terminated associates, which was not collected. See
Note 9
for more information.
|
|
•
|
Acquisition and integration-related incentive compensation costs are primarily comprised of non-recurring RSU grants made to certain employees and consultants for acquisition-related purposes.
|
|
•
|
DBRSU obligation and related hedge expenses for the
year ended September 30, 2017
included a loss on the
DBRSU
awards related to a
DB
rights offering during the year. This loss was partially offset by a related gain on the
DB
shares that act as an economic hedge to this obligation. Expenses for the
year ended September 30, 2016
represented the pre-Alex. Brown closing date unrealized loss on the DB shares. See Note
20
for more information.
|
109
RAYMOND JAMES FINANCIAL, INC AND SUBSIDIARIES
Notes to Consolidated Financial Statements
Our “Financial instruments owned” and “Financial instruments sold, but not yet purchased” on our Consolidated Statements of Financial Condition are recorded at fair value under GAAP. See Note 2 for further information about such instruments and our significant accounting policies related to fair value.
The tables below presents assets and liabilities measured at fair value on a recurring and nonrecurring basis. Netting adjustments represent the impact of counterparty and collateral netting on our derivative balances included in our Consolidated Statements of Financial Condition. See
Note 6
for additional information.
|
$ in thousands
|
Quoted prices
in active markets for identical instruments (Level 1) |
Significant
other
observable
inputs
(Level 2)
|
Significant
unobservable
inputs
(Level 3)
|
|
Netting
adjustments
|
Balance as of
September 30, 2017 |
||||||||||||||
|
Assets at fair value on a recurring basis
|
|
|
|
|
|
|
||||||||||||||
|
Trading instruments
|
|
|
|
|
|
|
||||||||||||||
|
Municipal and provincial obligations
|
$
|
83
|
|
$
|
221,884
|
|
$
|
—
|
|
$
|
—
|
|
$
|
221,967
|
|
|||||
|
Corporate obligations
|
9,361
|
|
81,577
|
|
—
|
|
—
|
|
90,938
|
|
||||||||||
|
Government and agency obligations
|
6,354
|
|
28,977
|
|
—
|
|
—
|
|
35,331
|
|
||||||||||
|
Agency MBS and CMOs
|
913
|
|
133,070
|
|
—
|
|
—
|
|
133,983
|
|
||||||||||
|
Non-agency CMOs and ABS
|
—
|
|
28,442
|
|
5
|
|
—
|
|
28,447
|
|
||||||||||
|
Total debt securities
|
16,711
|
|
493,950
|
|
5
|
|
—
|
|
510,666
|
|
||||||||||
|
Equity securities
|
16,090
|
|
389
|
|
—
|
|
—
|
|
16,479
|
|
||||||||||
|
Brokered certificates of deposit
|
—
|
|
31,492
|
|
—
|
|
—
|
|
31,492
|
|
||||||||||
|
Other
|
32
|
|
—
|
|
5,594
|
|
(1)
|
—
|
|
5,626
|
|
|||||||||
|
Total trading instruments
|
32,833
|
|
525,831
|
|
5,599
|
|
—
|
|
564,263
|
|
||||||||||
|
Available-for-sale securities
|
||||||||||||||||||||
|
Agency MBS and CMOs
|
—
|
|
2,081,079
|
|
—
|
|
—
|
|
2,081,079
|
|
||||||||||
|
Other securities
|
1,032
|
|
—
|
|
—
|
|
—
|
|
1,032
|
|
||||||||||
|
ARS preferred securities
|
—
|
|
—
|
|
106,171
|
|
—
|
|
106,171
|
|
||||||||||
|
Total available-for-sale securities
|
1,032
|
|
2,081,079
|
|
106,171
|
|
—
|
|
2,188,282
|
|
||||||||||
|
Derivative assets
|
||||||||||||||||||||
|
Interest rate contracts
|
||||||||||||||||||||
|
Matched book
|
—
|
|
288,035
|
|
—
|
|
—
|
|
288,035
|
|
||||||||||
|
Other
|
—
|
|
86,436
|
|
—
|
|
(55,728
|
)
|
30,708
|
|
||||||||||
|
Foreign exchange contracts
|
—
|
|
32
|
|
—
|
|
—
|
|
32
|
|
||||||||||
|
Total derivative assets
|
—
|
|
374,503
|
|
—
|
|
(55,728
|
)
|
318,775
|
|
||||||||||
|
Private equity investments
|
|
|
||||||||||||||||||
|
Measured at fair value
|
—
|
|
—
|
|
88,885
|
|
—
|
|
88,885
|
|
||||||||||
|
Measured at NAV
|
109,894
|
|
||||||||||||||||||
|
Total private equity investments
|
—
|
|
—
|
|
88,885
|
|
—
|
|
198,779
|
|
||||||||||
|
Other investments
(2)
|
220,312
|
|
332
|
|
336
|
|
—
|
|
220,980
|
|
||||||||||
|
Total assets at fair value on a recurring basis
|
$
|
254,177
|
|
|
$
|
2,981,745
|
|
|
$
|
200,991
|
|
|
$
|
(55,728
|
)
|
|
$
|
3,491,079
|
|
|
|
Assets at fair value on a nonrecurring basis
|
|
|
|
|
|
|
|
|
|
|
|
|||||||||
|
Bank loans, net
|
|
|
|
|
|
|
|
|
|
|
|
|||||||||
|
Impaired loans
|
$
|
—
|
|
$
|
17,474
|
|
$
|
23,994
|
|
|
$
|
—
|
|
$
|
41,468
|
|
||||
|
Loans held for sale
(3)
|
—
|
|
11,285
|
|
—
|
|
|
—
|
|
11,285
|
|
|||||||||
|
Total bank loans, net
|
—
|
|
28,759
|
|
23,994
|
|
|
—
|
|
52,753
|
|
|||||||||
|
Other Assets: OREO
|
—
|
|
880
|
|
—
|
|
—
|
|
880
|
|
||||||||||
|
Total assets at fair value on a nonrecurring basis
|
$
|
—
|
|
$
|
29,639
|
|
$
|
23,994
|
|
|
$
|
—
|
|
$
|
53,633
|
|
||||
|
(continued on next page)
|
||||||||||||||||||||
110
RAYMOND JAMES FINANCIAL, INC AND SUBSIDIARIES
Notes to Consolidated Financial Statements
|
$ in thousands
|
Quoted prices
in active
markets for
identical
instruments
(Level 1)
|
Significant
other
observable
inputs
(Level 2)
|
Significant
unobservable
inputs
(Level 3)
|
|
Netting
adjustments
|
Balance as of
September 30, 2017 |
||||||||||||||
|
Liabilities at fair value on a recurring basis
|
|
|
|
|
|
|||||||||||||||
|
Trading instruments sold but not yet purchased
|
|
|
|
|
|
|||||||||||||||
|
Municipal and provincial obligations
|
$
|
304
|
|
$
|
—
|
|
$
|
—
|
|
$
|
—
|
|
$
|
304
|
|
|||||
|
Corporate obligations
|
1,286
|
|
35,272
|
|
—
|
|
—
|
|
36,558
|
|
||||||||||
|
Government obligations
|
167,622
|
|
—
|
|
—
|
|
—
|
|
167,622
|
|
||||||||||
|
Agency MBS and CMOs
|
2,477
|
|
—
|
|
—
|
|
—
|
|
2,477
|
|
||||||||||
|
Non-agency MBS and CMOs
|
—
|
|
5,028
|
|
—
|
|
—
|
|
5,028
|
|
||||||||||
|
Total debt securities
|
171,689
|
|
40,300
|
|
—
|
|
—
|
|
211,989
|
|
||||||||||
|
Equity securities
|
8,118
|
|
1,342
|
|
—
|
|
—
|
|
9,460
|
|
||||||||||
|
Total trading instruments sold but not yet purchased
|
179,807
|
|
41,642
|
|
—
|
|
—
|
|
221,449
|
|
||||||||||
|
Derivative liabilities
|
||||||||||||||||||||
|
Interest rate contracts
|
||||||||||||||||||||
|
Matched book
|
—
|
|
288,035
|
|
—
|
|
—
|
|
288,035
|
|
||||||||||
|
Other
|
—
|
|
101,893
|
|
—
|
|
(59,410
|
)
|
42,483
|
|
||||||||||
|
Foreign exchange contracts
|
—
|
|
646
|
|
—
|
|
—
|
|
646
|
|
||||||||||
|
DBRSU obligation (equity)
|
—
|
|
25,800
|
|
—
|
|
—
|
|
25,800
|
|
||||||||||
|
Total derivative liabilities
|
—
|
|
416,374
|
|
—
|
|
(59,410
|
)
|
356,964
|
|
||||||||||
|
Total liabilities at fair value on a recurring basis
|
$
|
179,807
|
|
$
|
458,016
|
|
$
|
—
|
|
$
|
(59,410
|
)
|
$
|
578,413
|
|
|||||
|
(1)
|
Includes the fair value of forward commitments to purchase
GNMA
or
FNMA
MBS
arising from our fixed income public finance operations. See Notes
2
and
17
for additional information.
|
|
(2)
|
Includes
$44 million
of financial instruments that are related to obligations to perform under certain deferred compensation plans and
DB
shares with a fair value of
$19 million
as of
September 30, 2017
which we hold as an economic hedge against the
DBRSU
obligation. See Notes
2
and
20
for additional information.
|
|
(3)
|
Loans classified as held for sale recorded at a fair value lower than cost.
|
111
RAYMOND JAMES FINANCIAL, INC AND SUBSIDIARIES
Notes to Consolidated Financial Statements
|
$ in thousands
|
Quoted prices
in active
markets for
identical
instruments
(Level 1)
|
Significant
other
observable
inputs
(Level 2)
|
Significant
unobservable
inputs
(Level 3)
|
|
Netting
adjustments
|
Balance as of
September 30, 2016 |
||||||||||||||
|
Assets at fair value on a recurring basis:
|
|
|
|
|
|
|
||||||||||||||
|
Trading instruments
|
|
|
|
|
|
|
||||||||||||||
|
Municipal and provincial obligations
|
$
|
480
|
|
|
$
|
273,683
|
|
$
|
—
|
|
|
$
|
—
|
|
$
|
274,163
|
|
|||
|
Corporate obligations
|
10,000
|
|
|
122,885
|
|
—
|
|
|
—
|
|
132,885
|
|
||||||||
|
Government and agency obligations
|
6,412
|
|
|
43,186
|
|
—
|
|
|
—
|
|
49,598
|
|
||||||||
|
Agency MBS and CMOs
|
413
|
|
164,250
|
|
—
|
|
|
—
|
|
164,663
|
|
|||||||||
|
Non-agency CMOs and ABS
|
—
|
|
34,421
|
|
7
|
|
|
—
|
|
34,428
|
|
|||||||||
|
Total debt securities
|
17,305
|
|
638,425
|
|
7
|
|
|
—
|
|
655,737
|
|
|||||||||
|
Equity securities
|
14,529
|
|
1,500
|
|
—
|
|
|
—
|
|
16,029
|
|
|||||||||
|
Brokered certificates of deposit
|
—
|
|
35,206
|
|
—
|
|
—
|
|
35,206
|
|
||||||||||
|
Other
|
555
|
|
3
|
|
6,020
|
|
(1)
|
—
|
|
6,578
|
|
|||||||||
|
Total trading instruments
|
32,389
|
|
675,134
|
|
6,027
|
|
|
—
|
|
713,550
|
|
|||||||||
|
Available-for-sale securities
|
|
|
|
|
|
|
|
|
|
|
|
|||||||||
|
Agency MBS and CMOs
|
—
|
|
682,297
|
|
—
|
|
|
—
|
|
682,297
|
|
|||||||||
|
Non-agency CMOs
|
—
|
|
50,519
|
|
—
|
|
|
—
|
|
50,519
|
|
|||||||||
|
Other securities
|
1,417
|
|
—
|
|
—
|
|
|
—
|
|
1,417
|
|
|||||||||
|
ARS
|
|
|
|
|
|
|
|
|
|
|
|
|||||||||
|
Municipal obligations
|
—
|
|
—
|
|
25,147
|
|
|
—
|
|
25,147
|
|
|||||||||
|
Preferred securities
|
—
|
|
—
|
|
100,018
|
|
|
—
|
|
100,018
|
|
|||||||||
|
Total available-for-sale securities
|
1,417
|
|
732,816
|
|
125,165
|
|
|
—
|
|
859,398
|
|
|||||||||
|
Derivative assets
|
||||||||||||||||||||
|
Interest rate contracts
|
||||||||||||||||||||
|
Matched-book
|
—
|
|
422,196
|
|
—
|
|
|
—
|
|
422,196
|
|
|||||||||
|
Other
|
—
|
|
163,433
|
|
—
|
|
(107,539
|
)
|
55,894
|
|
||||||||||
|
Foreign exchange contracts
|
—
|
|
2,016
|
|
—
|
|
—
|
|
2,016
|
|
||||||||||
|
Total derivative assets
|
—
|
|
587,645
|
|
—
|
|
(107,539
|
)
|
480,106
|
|
||||||||||
|
Private equity investments
|
|
|
|
|||||||||||||||||
|
Measured at fair value
|
—
|
|
—
|
|
83,165
|
|
—
|
|
83,165
|
|
||||||||||
|
Measured at NAV
|
111,469
|
|
||||||||||||||||||
|
Total private equity investments
|
—
|
|
—
|
|
83,165
|
|
—
|
|
194,634
|
|
||||||||||
|
Other investments
(2)
|
325,655
|
|
257
|
|
441
|
|
|
—
|
|
326,353
|
|
|||||||||
|
Total assets at fair value on a recurring basis
|
$
|
359,461
|
|
|
$
|
1,995,852
|
|
|
$
|
214,798
|
|
|
$
|
(107,539
|
)
|
|
$
|
2,574,041
|
|
|
|
Assets at fair value on a nonrecurring basis
|
|
|
|
|
|
|
|
|
|
|
|
|||||||||
|
Bank loans, net
|
||||||||||||||||||||
|
Impaired loans
|
$
|
—
|
|
$
|
23,146
|
|
$
|
47,982
|
|
$
|
—
|
|
$
|
71,128
|
|
|||||
|
Loans held for sale
(3)
|
—
|
|
18,177
|
|
—
|
|
—
|
|
18,177
|
|
||||||||||
|
Total bank loans, net
|
—
|
|
41,323
|
|
47,982
|
|
—
|
|
89,305
|
|
||||||||||
|
Other assets: OREO
|
—
|
|
679
|
|
—
|
|
|
—
|
|
679
|
|
|||||||||
|
Total assets at fair value on a nonrecurring basis
|
$
|
—
|
|
$
|
42,002
|
|
$
|
47,982
|
|
|
$
|
—
|
|
$
|
89,984
|
|
||||
|
(continued on next page)
|
||||||||||||||||||||
112
RAYMOND JAMES FINANCIAL, INC AND SUBSIDIARIES
Notes to Consolidated Financial Statements
|
$ in thousands
|
Quoted prices
in active
markets for
identical
instruments
(Level 1)
|
Significant
other
observable
inputs
(Level 2)
|
Significant
unobservable
inputs
(Level 3)
|
|
Netting
adjustments
|
Balance as of
September 30, 2016 |
||||||||||||||
|
Liabilities at fair value on a recurring basis
|
|
|
|
|
|
|
|
|
|
|
|
|||||||||
|
Trading instruments sold but not yet purchased
|
|
|
|
|
|
|
|
|
|
|
|
|||||||||
|
Municipal and provincial obligations
|
$
|
1,161
|
|
$
|
—
|
|
$
|
—
|
|
|
$
|
—
|
|
$
|
1,161
|
|
||||
|
Corporate obligations
|
1,283
|
|
29,791
|
|
—
|
|
|
—
|
|
31,074
|
|
|||||||||
|
Government obligations
|
266,682
|
|
—
|
|
—
|
|
|
—
|
|
266,682
|
|
|||||||||
|
Agency MBS and CMOs
|
2,804
|
|
—
|
|
—
|
|
|
—
|
|
2,804
|
|
|||||||||
|
Total debt securities
|
271,930
|
|
29,791
|
|
—
|
|
|
—
|
|
301,721
|
|
|||||||||
|
Equity securities
|
18,382
|
|
—
|
|
—
|
|
|
—
|
|
18,382
|
|
|||||||||
|
Total trading instruments sold but not yet purchased
|
290,312
|
|
29,791
|
|
—
|
|
|
—
|
|
320,103
|
|
|||||||||
|
Derivative liabilities
|
||||||||||||||||||||
|
Interest rate contracts
|
||||||||||||||||||||
|
Matched book
|
—
|
|
422,196
|
|
—
|
|
—
|
|
422,196
|
|
||||||||||
|
Other
|
—
|
|
178,502
|
|
—
|
|
(142,859
|
)
|
35,643
|
|
||||||||||
|
DBRSU obligation (equity)
|
—
|
|
17,769
|
|
—
|
|
—
|
|
17,769
|
|
||||||||||
|
Total derivative liabilities
|
—
|
|
618,467
|
|
—
|
|
(142,859
|
)
|
475,608
|
|
||||||||||
|
Total liabilities at fair value on a recurring basis
|
$
|
290,312
|
|
|
$
|
648,258
|
|
|
$
|
—
|
|
|
$
|
(142,859
|
)
|
|
$
|
795,711
|
|
|
|
(1)
|
Includes the fair value of forward commitments to purchase
GNMA
or
FNMA
MBS
arising from our fixed income public finance operations. See Notes
2
and
17
for additional information.
|
|
(2)
|
Includes
$77 million
of financial instruments that are related to obligations to perform under certain deferred compensation plans and
DB
shares with a fair value of
$12 million
as of September 30, 2016 which we hold as an economic hedge against the
DBRSU
obligation. See Notes
2
and
20
for additional information.
|
|
(3)
|
Loans classified as held for sale recorded at a fair value lower than cost.
|
Transfers between levels
We had
$4 million
and
$3 million
in transfers of financial instruments from Level 1 to Level 2 during the
year ended September 30, 2017
and
2016
, respectively. These transfers were a result of decreased market activity in these instruments. Our transfers from Level 2 to Level 1 were
$1 million
in each of the years ended
September 30, 2017
and
2016
, respectively. These transfers were a result of increased market activity in these instruments. Our policy is to treat transfers between levels of the fair value hierarchy as having occurred at the end of the reporting period.
Changes in Level 3 recurring fair value measurements
The tables below presents the changes in fair value for Level 3 assets and liabilities measured at fair value on a recurring basis. The realized and unrealized gains and losses in the tables below may include changes in fair value that were attributable to both observable and unobservable inputs. Our policy is to treat transfers between levels of the fair value hierarchy as having occurred at the end of the reporting period.
113
RAYMOND JAMES FINANCIAL, INC AND SUBSIDIARIES
Notes to Consolidated Financial Statements
|
Year ended September 30, 2017
Level 3 assets at fair value
|
||||||||||||||||||||||||
|
|
Trading instruments
|
Available-for-sale securities
|
Private equity and other investments
|
|||||||||||||||||||||
|
$ in thousands
|
Non-agency
CMOs and
ABS
|
Other
|
ARS –
municipal obligations |
ARS -
preferred securities |
Private equity
investments
|
|
Other
investments
|
|||||||||||||||||
|
Fair value beginning of year
|
$
|
7
|
|
$
|
6,020
|
|
$
|
25,147
|
|
$
|
100,018
|
|
$
|
83,165
|
|
|
$
|
441
|
|
|||||
|
Total gains/(losses) for the year:
|
|
|
|
|
|
|
|
|
|
|
|
|||||||||||||
|
Included in earnings
|
1
|
|
(2,568
|
)
|
641
|
|
(84
|
)
|
8,343
|
|
118
|
|
||||||||||||
|
Included in other comprehensive income
|
—
|
|
—
|
|
2,344
|
|
7,705
|
|
—
|
|
|
—
|
|
|||||||||||
|
Purchases and contributions
|
—
|
|
67,316
|
|
—
|
|
—
|
|
5,245
|
|
217
|
|
||||||||||||
|
Sales
|
—
|
|
(65,174
|
)
|
(28,132
|
)
|
(1,468
|
)
|
(168
|
)
|
(245
|
)
|
||||||||||||
|
Distributions
|
(3
|
)
|
—
|
|
—
|
|
—
|
|
(7,700
|
)
|
—
|
|
||||||||||||
|
Transfers:
|
|
|
|
|
|
|
|
|
|
|
|
|
|
|||||||||||
|
Into Level 3
|
—
|
|
—
|
|
—
|
|
—
|
|
—
|
|
—
|
|
||||||||||||
|
Out of Level 3
|
—
|
|
—
|
|
—
|
|
—
|
|
—
|
|
(195
|
)
|
||||||||||||
|
Fair value end of year
|
$
|
5
|
|
$
|
5,594
|
|
$
|
—
|
|
$
|
106,171
|
|
$
|
88,885
|
|
|
$
|
336
|
|
|||||
|
Change in unrealized gains/(losses) for the year included in earnings (or changes in net assets) for assets held at the end of the year
|
$
|
1
|
|
$
|
(1,626
|
)
|
$
|
—
|
|
$
|
7,705
|
|
$
|
8,331
|
|
$
|
118
|
|
||||||
|
Year ended September 30, 2016
Level 3 assets at fair value |
||||||||||||||||||||||||||||
|
|
Trading instruments
|
Available-for-sale securities
|
Private equity and other investments
|
|||||||||||||||||||||||||
|
$ in thousands
|
Corporate obligations
|
Non-agency
CMOs and
ABS
|
Other
|
ARS –
municipal obligations |
ARS -
preferred securities |
Private equity
investments
|
|
Other
investments
|
||||||||||||||||||||
|
Fair value beginning of year
|
$
|
156
|
|
$
|
9
|
|
$
|
6,961
|
|
$
|
28,015
|
|
$
|
110,749
|
|
$
|
77,435
|
|
$
|
565
|
|
|||||||
|
Total gains/(losses) for the year:
|
|
|
|
|
|
|
|
|
||||||||||||||||||||
|
Included in earnings
|
(137
|
)
|
—
|
|
(3,048
|
)
|
133
|
|
136
|
|
11,517
|
|
|
9
|
|
|||||||||||||
|
Included in other comprehensive income
|
—
|
|
—
|
|
—
|
|
(1,393
|
)
|
(9,656
|
)
|
—
|
|
—
|
|
||||||||||||||
|
Purchases and contributions
|
75
|
|
—
|
|
61,887
|
|
—
|
|
—
|
|
11,271
|
|
8
|
|
||||||||||||||
|
Sales
|
(94
|
)
|
—
|
|
|
(59,780
|
)
|
(1,583
|
)
|
(1,211
|
)
|
(18
|
)
|
|
—
|
|
||||||||||||
|
Redemptions by issuer
|
—
|
|
—
|
|
—
|
|
(25
|
)
|
—
|
|
—
|
|
—
|
|
||||||||||||||
|
Distributions
|
—
|
|
(2
|
)
|
—
|
|
—
|
|
—
|
|
(17,040
|
)
|
(141
|
)
|
||||||||||||||
|
Transfers:
|
|
|||||||||||||||||||||||||||
|
Into Level 3
|
—
|
|
—
|
|
—
|
|
—
|
|
—
|
|
—
|
|
—
|
|
||||||||||||||
|
Out of Level 3
|
—
|
|
—
|
|
—
|
|
—
|
|
—
|
|
—
|
|
—
|
|
||||||||||||||
|
Fair value end of year
|
$
|
—
|
|
$
|
7
|
|
$
|
6,020
|
|
$
|
25,147
|
|
$
|
100,018
|
|
$
|
83,165
|
|
$
|
441
|
|
|||||||
|
Change in unrealized gains/(losses) for the year included in earnings (or changes in net assets) for assets held at the end of the year
|
$
|
—
|
|
$
|
2
|
|
$
|
(2,752
|
)
|
$
|
(1,348
|
)
|
$
|
(9,574
|
)
|
$
|
11,517
|
|
$
|
2
|
|
|||||||
The gains included in our Consolidated Statements of Income and Comprehensive Income for certain private equity investments for the years ended
September 30, 2017
and
2016
were primarily attributable to the noncontrolling interests’ share of the net valuation adjustments.
As of
September 30, 2017
,
10%
of our assets and
2%
of our liabilities are instruments measured at fair value on a recurring basis. Instruments measured at fair value on a recurring basis categorized as Level 3 as of
September 30, 2017
represent
6%
of our assets measured at fair value. In comparison as of
September 30, 2016
,
8%
and
3%
of our assets and liabilities, respectively, represented instruments measured at fair value on a recurring basis. Instruments measured at fair value on a recurring basis categorized as Level 3 as of
September 30, 2016
represented
8%
of our assets measured at fair value. Level 3 instruments as a percentage of
114
RAYMOND JAMES FINANCIAL, INC AND SUBSIDIARIES
Notes to Consolidated Financial Statements
total financial instruments decreased compared to
September 30, 2016
, primarily as a result of the increase in total assets measured at fair value since
September 30, 2016
.
The following table presents the gains/(losses) related to Level 3 recurring fair value measurements included in our Consolidated Statements of Income and Comprehensive Income.
|
$ in thousands
|
Net trading
profits
|
Other
revenues
|
Other comprehensive income
|
|||||||||
|
For the year ended September 30, 2017
|
||||||||||||
|
Total gains/(losses) included in earnings
|
$
|
(2,567
|
)
|
$
|
9,018
|
|
$
|
10,049
|
|
|||
|
Change in unrealized gains/(losses) for assets held at the end of the year
|
$
|
(1,625
|
)
|
$
|
8,449
|
|
$
|
7,705
|
|
|||
|
For the year ended September 30, 2016
|
||||||||||||
|
Total gains/(losses) included in earnings
|
$
|
(3,185
|
)
|
$
|
11,795
|
|
$
|
(11,049
|
)
|
|||
|
Change in unrealized gains/(losses) for assets held at the end of the year
|
$
|
(2,750
|
)
|
$
|
11,519
|
|
$
|
(10,922
|
)
|
|||
Quantitative information about level 3 fair value measurements
The table below presents the valuation techniques and significant unobservable inputs used in the valuation of a significant majority of our financial instruments classified as level 3. These inputs represent those that a market participant would take into account when pricing these instruments.
|
Level 3 financial instrument
$ in thousands |
Fair value at
September 30,
2017
|
Valuation technique(s)
|
Unobservable input
|
Range
(weighted-average)
|
||||||
|
Recurring measurements:
|
|
|
|
|||||||
|
ARS preferred securities
|
$
|
106,171
|
|
Discounted cash flow
|
Average discount rate
|
5.46% - 6.81% (6.03%)
|
||||
|
|
|
|
|
Average interest rates applicable to future interest income on the securities
(1)
|
2.58% - 3.44% (2.72%)
|
|||||
|
|
|
|
|
Prepayment year
(2)
|
2017 - 2021 (2021)
|
|||||
|
Private equity investments (not measured at NAV):
|
$
|
68,454
|
|
Income or market approach:
|
||||||
|
Scenario 1 - income approach - discounted cash flow
|
Discount rate
|
13% - 25% (22.4%)
|
||||||||
|
|
Terminal growth rate of cash flows
|
3% - 3% (3%)
|
||||||||
|
|
Terminal year
|
2020 - 2042 (2021)
|
||||||||
|
Scenario 2 - market approach - market multiple method
|
EBITDA Multiple
|
5.25 - 7.0 (5.8)
|
||||||||
|
Weighting assigned to outcome of scenario 1/scenario 2
|
87%/13%
|
|||||||||
|
|
$
|
20,431
|
|
Transaction price or other investment-specific events
(3)
|
Not meaningful
(3)
|
Not meaningful
(3)
|
||||
|
Nonrecurring measurements:
|
|
|
|
|
|
|||||
|
Bank loans: impaired loans - residential
|
$
|
20,736
|
|
Discounted cash flow
|
Prepayment rate
|
7 yrs. - 12 yrs. (10.4 yrs.)
|
||||
|
Bank loans: impaired loans: corporate
|
$
|
3,258
|
|
Appraisal or discounted cash flow value
(4)
|
Not meaningful
(4)
|
Not meaningful
(4)
|
||||
|
(1)
|
Future interest rates are projected based upon a forward interest rate path, plus a spread over such projected base rate that is applicable to each future period for each security within this portfolio segment. The interest rates presented represent the average interest rate over all projected periods for securities within the portfolio segment.
|
|
(2)
|
Assumed calendar year of at least a partial redemption of the outstanding security by the issuer.
|
|
(3)
|
Certain private equity investments are valued initially at the transaction price until either our periodic review, significant transactions occur, new developments become known, or we receive information from the fund manager that allows us to update our proportionate share of net assets, when any of which indicate that a change in the carrying values of these investments is appropriate.
|
|
(4)
|
The valuation techniques used for the impaired corporate loan portfolio are appraisals less selling costs for the collateral dependent loans and discounted cash flows for impaired loans that are not collateral dependent.
|
(continued on next page)
115
RAYMOND JAMES FINANCIAL, INC AND SUBSIDIARIES
Notes to Consolidated Financial Statements
(continued from previous page)
|
Level 3 financial instrument
$ in thousands |
Fair value at
September 30,
2016
|
Valuation technique(s)
|
Unobservable input
|
Range (weighted-average)
|
||||||
|
Recurring measurements:
|
|
|
|
|||||||
|
Available-for-sale securities
ARS Municipals - issuer
is a municipality
|
$
|
10,413
|
|
Discounted cash flow
|
Average discount rate
|
5.17% - 6.36% (5.77%)
|
||||
|
Average interest rates applicable to future interest income on the securities
(1)
|
1.23% - 1.83% (1.53%)
|
|||||||||
|
Prepayment year
(2)
|
2019 - 2026 (2022)
|
|||||||||
|
Available-for-sale securities
ARS Municipals - tax-
exempt preferred
securities
|
$
|
14,734
|
|
Discounted cash flow
|
Average discount rate
|
4.62% - 5.62% (5.12%)
|
||||
|
|
|
|
|
Average interest rates applicable to future interest income on the securities
(1)
|
0.91% - 0.91% (0.91%)
|
|||||
|
|
|
|
Prepayment year
(2)
|
2016 - 2021 (2021)
|
||||||
|
Available-for-sale securities
ARS Preferred securities
|
$
|
100,018
|
|
Discounted cash flow
|
Average discount rate
|
4.87% - 6.34% (5.56%)
|
||||
|
|
|
|
|
Average interest rates applicable to future interest income on the securities
(1)
|
1.24% - 2.51% (1.34%)
|
|||||
|
|
|
|
|
Prepayment year
(2)
|
2016 - 2021 (2021)
|
|||||
|
Private equity investments (not measured at NAV):
|
$
|
56,746
|
|
Income or market approach:
|
||||||
|
Scenario 1 - income approach - discounted cash flow
|
Discount rate
|
13% - 20% (17.9%)
|
||||||||
|
|
Terminal growth rate of cash flows
|
3% - 3% (3%)
|
||||||||
|
|
Terminal year
|
2019 - 2021 (2020)
|
||||||||
|
Scenario 2 - market approach - market multiple method
|
EBITDA Multiple
|
5.25 - 7.5 (6.3)
|
||||||||
|
Weighting assigned to outcome of scenario 1/scenario 2
|
81%/19%
|
|||||||||
|
|
$
|
26,419
|
|
Transaction price or other investment-specific events
(3)
|
Not meaningful
(3)
|
Not meaningful
(3)
|
||||
|
Nonrecurring measurements:
|
|
|
|
|
|
|||||
|
Bank loans - impaired residential
|
$
|
21,909
|
|
Discounted cash flow
|
Prepayment rate
|
7 yrs. - 12 yrs. (10.2 yrs.)
|
||||
|
Bank loans - impaired corporate
|
$
|
26,073
|
|
Appraisal or discounted cash flow value
(4)
|
Not meaningful
(4)
|
Not meaningful
(4)
|
||||
|
(1)
|
Future interest rates are projected based upon a forward interest rate path, plus a spread over such projected base rate that is applicable to each future period for each security within this portfolio segment. The interest rates presented represent the average interest rate over all projected periods for securities within the portfolio segment.
|
|
(2)
|
Assumed calendar year of at least a partial redemption of the outstanding security by the issuer.
|
|
(3)
|
Certain private equity investments are valued initially at the transaction price until either our periodic review, significant transactions occur, new developments become known, or we receive information from the fund manager that allows us to update our proportionate share of net assets, when any of which indicate that a change in the carrying values of these investments is appropriate.
|
|
(4)
|
The valuation techniques used for the impaired corporate loan portfolio are appraisals less selling costs for the collateral dependent loans and discounted cash flows for impaired loans that are not collateral dependent.
|
116
RAYMOND JAMES FINANCIAL, INC AND SUBSIDIARIES
Notes to Consolidated Financial Statements
Qualitative disclosure about unobservable inputs
For our recurring fair value measurements categorized within Level 3 of the fair value hierarchy, the sensitivity of the fair value measurement to changes in significant unobservable inputs and interrelationships between those unobservable inputs are described below:
Auction rate securities:
One of the significant unobservable inputs used in the fair value measurement of auction rate securities presented within our available-for-sale securities portfolio relates to judgments regarding whether the level of observable trading activity is sufficient to conclude markets are active. Where insufficient levels of trading activity are determined to exist as of the reporting date, then management’s assessment of how much weight, if any, to apply to trading prices in inactive markets versus management’s own valuation models could significantly impact the valuation conclusion. The valuation of the securities impacted by changes in management’s assessment of market activity levels could be either higher or lower, depending upon the relationship of the inactive trading prices compared to the outcome of management’s internal valuation models.
The future interest rate and maturity assumptions impacting the valuation of the auction rate securities are directly related. As short-term interest rates rise, due to the variable nature of the penalty interest rate provisions embedded in most of these securities in the event auctions fail to set the security’s interest rate, then a penalty rate that is specified in the security increases. These penalty rates are based upon a stated interest rate spread over what is typically a short-term base interest rate index. Management estimates that at some level of increase in short-term interest rates, issuers of the securities will have the economic incentive to refinance (and thus prepay) the securities. Therefore, the short-term interest rate assumption directly impacts the input related to the timing of any projected prepayment. The faster and steeper short-term interest rates rise, the earlier prepayments will likely occur and the higher the fair value of the security.
Private equity investments:
The significant unobservable inputs used in the fair value measurement of private equity investments relate to the financial performance of the investment entity and the market’s required return on investments from entities in industries in which we hold investments. Significant increases/(decreases) in our investment entities’ future economic performance will have a corresponding increase/(decrease) on the valuation results. The value of our investment moves inversely with the market’s expectation of returns from such investments. Should the market require higher returns from industries in which we are invested, all other factors held constant, our investments will decrease in value. Should the market accept lower returns from industries in which we are invested, all other factors held constant, our investments will increase in value.
Investments in private equity measured at net asset value per share
As a practical expedient, we utilize
NAV
or its equivalent to determine the recorded value of a portion of our private equity portfolio. We utilize
NAV
when the fund investment does not have a readily determinable fair value and the
NAV
of the fund is calculated in a manner consistent with the measurement principles of investment company accounting, including measurement of the investments at fair value.
Our private equity portfolio as of
September 30, 2017
includes various direct and third party private equity investments and various private equity funds which we sponsor. The portfolio is primarily invested in a broad range of industries including leveraged buyouts, growth capital, distressed capital, venture capital and mezzanine capital.
Due to the closed-end nature of certain of our fund investments, such investments cannot be redeemed directly with the funds. Our investment is monetized through distributions received through the liquidation of the underlying assets of those funds. We anticipate
90%
of these underlying assets will be liquidated over a period of
five years
or less, with the remaining
10%
to be liquidated over a period of
nine years
.
117
RAYMOND JAMES FINANCIAL, INC AND SUBSIDIARIES
Notes to Consolidated Financial Statements
The table below presents the recorded value and unfunded commitments related to our private equity portfolio.
|
Unfunded commitment
|
||||||||||||||||
|
$ in thousands
|
Recorded Value
|
RJF
|
Noncontrolling Interest
|
Total
|
||||||||||||
|
September 30, 2017
|
||||||||||||||||
|
Private equity investments measured at NAV
|
$
|
109,894
|
|
$
|
20,973
|
|
$
|
2,273
|
|
$
|
23,246
|
|
||||
|
Private equity investments measured at fair value
|
88,885
|
|
||||||||||||||
|
Total private equity investments
|
$
|
198,779
|
|
|||||||||||||
|
September 30, 2016
|
||||||||||||||||
|
Private equity investments measured at NAV
|
$
|
111,469
|
|
$
|
27,542
|
|
$
|
3,001
|
|
$
|
30,543
|
|
||||
|
Private equity investments measured at fair value
|
83,165
|
|
||||||||||||||
|
Total private equity investments
|
$
|
194,634
|
|
|||||||||||||
The portions of the private equity investments we do not own were
$54 million
and
$51 million
as of
September 30, 2017
and
September 30, 2016
, respectively, and as such are included as a component of noncontrolling interest in our Consolidated Statements of Financial Condition. Of the total private equity investments, the weighted average portion we own is
$145 million
or
73%
and
$144 million
or
74%
as of
September 30, 2017
and
September 30, 2016
, respectively.
Many of these fund investments meet the definition of prohibited “covered funds” as defined by the Volcker Rule of the Dodd-Frank Wall Street Reform and Consumer Protection Act (“Volcker Rule”). We have received approval from the Board of Governors of the Federal Reserve System
(the “Fed”)
to continue to hold the majority of our covered fund investments for up to an additional
five
-year conformance period, thereby extending our applicable holding period until July 2022 for such investments.
Fair value option
The fair value option is an accounting election that allows the reporting entity to apply fair value accounting for certain financial assets and liabilities on an instrument by instrument basis. As of
September 30, 2017
and
2016
, we had not elected the fair value option for any of our financial assets or liabilities not already recorded at fair value.
Additional disclosures about the fair value of financial instruments that are not carried on the Consolidated Statements of Financial Condition at fair value
Many, but not all, of the financial instruments we hold are recorded at fair value in the Consolidated Statements of Financial Condition.
The following represents financial instruments in which the ending balance at
September 30, 2017
and
2016
was not carried at fair value in accordance with the
GAAP
on our Consolidated Statements of Financial Condition:
Short-term financial instruments:
The carrying value of short-term financial instruments, including cash and cash equivalents, assets segregated pursuant to federal regulations and other segregated assets, repurchase agreements and reverse repurchase agreements and other collateralized financings are recorded at amounts that approximate the fair value of these instruments. These financial instruments generally expose us to limited credit risk and have no stated maturities or have short-term maturities and carry interest rates that approximate market rates. Under the fair value hierarchy, cash and cash equivalents and assets segregated pursuant to federal regulations and other segregated assets are classified as Level 1. Repurchase agreements and reverse repurchase agreements and other collateralized financings are classified as Level 2 under the fair value hierarchy as they are generally overnight and are collateralized by
U.S.
government or agency securities.
Bank loans, net:
These financial instruments are primarily comprised of loans originated or purchased by
RJ Bank
and include
C&I
loans, commercial and residential real estate loans, tax-exempt loans, as well as
SBL
intended to be held until maturity or payoff and are recorded at amounts that result from the application of the loans held for investment methodologies summarized in
Note 2
. In addition, these financial instruments consist of loans held for sale, which are carried at the lower of cost or market value. A portion of these loans held for sale, which are carried at lower of cost or market value, as well as any impaired loans held for investment are recorded at fair value as nonrecurring fair value measurements, and therefore are excluded from the table below.
Fair values for both variable and fixed-rate loans held for investment are estimated using discounted cash flow analysis, based on interest rates currently being offered for loans with similar terms to borrowers of similar credit quality. This methodology for estimating the fair value of loans does not consider other market variables and, therefore, is not based on an exit price concept. The
118
RAYMOND JAMES FINANCIAL, INC AND SUBSIDIARIES
Notes to Consolidated Financial Statements
majority of fair value determinations for these loans are classified as Level 3 under the fair value hierarchy. Refer to
Note 2
for information regarding the fair value policies specific to loans held for sale.
Receivables and other assets:
Brokerage client receivables, receivables from brokers, dealers and clearing organizations, other receivables, and certain other assets are recorded at amounts that approximate fair value and are classified as Level 2 and 3 under the fair value hierarchy. As specified under
GAAP
, the
FHLB
and
FRB
stock are recorded at cost, which we have determined to approximate their estimated fair value, and are classified as Level 2 under the fair value hierarchy.
Loans to financial advisors, net:
These financial instruments are primarily comprised of loans provided to financial advisors or key revenue producers, primarily for recruiting, transitional cost assistance, and retention purposes. Such loans are generally repaid over a
five
to
eight
year period, and are recorded at cost less an allowance for doubtful accounts. The fair value of loans to financial advisors, net, is determined through application of a discounted cash flow analysis, based on contractual maturities of the underlying loans discounted at the current market interest rates associated with such loans. This methodology for estimating the fair value of these loans does not consider other market variables and, therefore, is not based on an exit price concept. Loans to financial advisors, net are classified as Level 3 under the fair value hierarchy.
Securities borrowed and securities loaned:
Securities borrowed and securities loaned are recorded at amounts which approximate fair value and are primarily classified as Level 2 under the fair value hierarchy.
Bank deposits:
The fair values for demand deposits are equal to the amount payable on demand at the reporting date (i.e., carrying amounts). The carrying amounts of variable-rate money market and savings accounts approximate their fair values at the reporting date as these are short-term in nature. Due to their demand or short-term nature, the demand deposits and variable rate money market and savings accounts are classified as Level 2 under the fair value hierarchy. Fair values for fixed-rate certificates of deposit are estimated using a discounted cash flow calculation that applies interest rates currently being offered on certificates to a schedule of expected monthly maturities on time deposits. These fixed rate certificates of deposit are classified as Level 3 under the fair value hierarchy.
Payables:
Brokerage client payables, payables to brokers, dealers and clearing organizations, and other payables are recorded at amounts that approximate fair value and are classified as Level 2 under the fair value hierarchy.
Other borrowings:
The fair value of the mortgage note payable associated with the financing of our Saint Petersburg, Florida corporate offices is based upon an estimate of the current market rates for similar loans. The carrying amount of the remaining components of our other borrowings approximate their fair value due to the relative short-term nature of such borrowings, some of which are day-to-day. In addition to the mortgage note payable, the portion of other borrowings which are not “day-to-day” are primarily comprised of
RJ Bank
’s borrowings from the
FHLB
which, by their nature, reflect terms that approximate current market rates for similar loans. Under the fair value hierarchy, our other borrowings are classified as Level 2.
Senior notes payable:
The fair value of our senior notes payable is based upon recent trades of those or other similar debt securities in the market.
Off-balance sheet financial instruments:
The fair value of unfunded commitments to extend credit is based on a methodology similar to that described above for bank loans and further adjusted for the probability of funding. The fair value of these unfunded lending commitments, in addition to the fair value of other off-balance sheet financial instruments, are classified as Level 3 under the fair value hierarchy. See
Note 22
for further discussion of off-balance sheet financial instruments.
119
RAYMOND JAMES FINANCIAL, INC AND SUBSIDIARIES
Notes to Consolidated Financial Statements
The table below presents the estimated fair values by level within the fair value hierarchy and the carrying amounts of certain of our financial instruments not carried at fair value. The carrying amounts below exclude financial instruments which have been recorded at fair value and those recorded at amounts which approximate fair value in the Consolidated Statements of Financial Condition.
|
$ in thousands
|
Quoted prices
in active
markets for
identical
instruments
(Level 1)
|
Significant
other
observable
inputs
(Level 2)
|
Significant
unobservable
inputs
(Level 3)
|
Total estimated fair value
|
Carrying amount
|
|||||||||||||||
|
September 30, 2017
|
||||||||||||||||||||
|
Financial assets:
|
|
|
|
|
|
|||||||||||||||
|
Bank loans, net
|
$
|
—
|
|
$
|
23,001
|
|
$
|
16,836,745
|
|
$
|
16,859,746
|
|
$
|
16,954,042
|
|
|||||
|
Loans to financial advisors, net
|
$
|
—
|
|
$
|
—
|
|
$
|
698,862
|
|
$
|
698,862
|
|
$
|
863,647
|
|
|||||
|
Financial liabilities:
|
|
|
||||||||||||||||||
|
Bank deposits
|
$
|
—
|
|
$
|
17,417,678
|
|
$
|
313,359
|
|
$
|
17,731,037
|
|
$
|
17,732,362
|
|
|||||
|
Other borrowings
|
$
|
—
|
|
$
|
29,278
|
|
$
|
—
|
|
$
|
29,278
|
|
$
|
28,813
|
|
|||||
|
Senior notes payable
|
$
|
—
|
|
$
|
1,647,696
|
|
$
|
—
|
|
$
|
1,647,696
|
|
$
|
1,548,839
|
|
|||||
|
September 30, 2016
|
||||||||||||||||||||
|
Financial assets:
|
|
|
|
|
|
|||||||||||||||
|
Bank loans, net
|
$
|
—
|
|
$
|
196,109
|
|
$
|
14,925,802
|
|
$
|
15,121,911
|
|
$
|
15,121,430
|
|
|||||
|
Loans to financial advisors, net
|
$
|
—
|
|
$
|
—
|
|
$
|
699,733
|
|
$
|
699,733
|
|
$
|
826,776
|
|
|||||
|
Financial liabilities:
|
|
|
||||||||||||||||||
|
Bank deposits
|
$
|
—
|
|
$
|
13,947,310
|
|
$
|
318,228
|
|
$
|
14,265,538
|
|
$
|
14,262,547
|
|
|||||
|
Other borrowings
|
$
|
—
|
|
$
|
34,520
|
|
$
|
—
|
|
$
|
34,520
|
|
$
|
33,391
|
|
|||||
|
Senior notes payable
|
$
|
362,180
|
|
$
|
1,452,071
|
|
$
|
—
|
|
$
|
1,814,251
|
|
$
|
1,680,587
|
|
|||||
Available-for-sale securities are comprised of
MBS
and
CMOs
owned by
RJ Bank
and
ARS
owned by one of our non-broker-dealer subsidiaries. See Note 2 for a discussion of our available-for-sale securities accounting policies, including the fair value determination process.
The amortized cost and fair values of available-for sale-securities are as follows:
|
$ in thousands
|
Cost basis
|
Gross
unrealized gains
|
Gross
unrealized losses
|
Fair value
|
||||||||||||
|
September 30, 2017
|
|
|
|
|
||||||||||||
|
Agency MBS and CMOs
|
$
|
2,089,153
|
|
$
|
1,925
|
|
$
|
(9,999
|
)
|
$
|
2,081,079
|
|
||||
|
Other securities
|
1,575
|
|
—
|
|
(543
|
)
|
1,032
|
|
||||||||
|
Total RJ Bank available-for-sale securities
|
2,090,728
|
|
1,925
|
|
(10,542
|
)
|
2,082,111
|
|
||||||||
|
ARS preferred securities
|
101,674
|
|
4,497
|
|
—
|
|
106,171
|
|
||||||||
|
Total available-for-sale securities
|
$
|
2,192,402
|
|
$
|
6,422
|
|
$
|
(10,542
|
)
|
$
|
2,188,282
|
|
||||
|
September 30, 2016
|
|
|
|
|
|
|
|
|
||||||||
|
Agency MBS and CMOs
|
$
|
680,341
|
|
$
|
2,512
|
|
$
|
(556
|
)
|
$
|
682,297
|
|
||||
|
Non-agency CMOs
(1)
|
53,427
|
|
9
|
|
(2,917
|
)
|
50,519
|
|
||||||||
|
Other securities
|
1,575
|
|
—
|
|
(158
|
)
|
1,417
|
|
||||||||
|
Total RJ Bank available-for-sale securities
|
735,343
|
|
2,521
|
|
(3,631
|
)
|
734,233
|
|
||||||||
|
ARS municipal obligations
|
27,491
|
|
14
|
|
(2,358
|
)
|
25,147
|
|
||||||||
|
ARS preferred securities
|
103,226
|
|
—
|
|
(3,208
|
)
|
100,018
|
|
||||||||
|
Total auction rate securities
|
130,717
|
|
14
|
|
(5,566
|
)
|
125,165
|
|
||||||||
|
Total available-for-sale securities
|
$
|
866,060
|
|
$
|
2,535
|
|
$
|
(9,197
|
)
|
$
|
859,398
|
|
||||
|
(1)
|
As of
September 30, 2016
, the non-credit portion of unrealized losses related to non-agency
CMOs
with previously recorded
OTTI
before taxes was
$2 million
, recorded in
AOCI
. See
Note 18
for additional information. During the
year ended September 30, 2017
, we sold the remainder of our non-agency
CMOs
.
|
See
Note 4
for additional information regarding the fair value of available-for-sale securities.
120
RAYMOND JAMES FINANCIAL, INC AND SUBSIDIARIES
Notes to Consolidated Financial Statements
The contractual maturities, amortized cost, carrying values and current yields for our available-for-sale securities are as presented below. Since
RJ Bank
’s available-for-sale securities (
MBS
and
CMOs
) are backed by mortgages, actual maturities will differ from contractual maturities because borrowers may have the right to prepay obligations without prepayment penalties. Expected maturities of
ARS
may differ significantly from contractual maturities, as issuers may have the right to call or prepay obligations with or without call or prepayment penalties.
|
|
September 30, 2017
|
|||||||||||||||||||
|
$ in thousands
|
Within one year
|
After one but within five years
|
After five but within ten years
|
After ten years
|
Total
|
|||||||||||||||
|
Agency MBS and CMOs:
|
|
|
|
|
|
|||||||||||||||
|
Amortized cost
|
$
|
—
|
|
$
|
110,510
|
|
$
|
675,502
|
|
$
|
1,303,141
|
|
$
|
2,089,153
|
|
|||||
|
Carrying value
|
—
|
|
110,019
|
|
673,454
|
|
1,297,606
|
|
2,081,079
|
|
||||||||||
|
Weighted-average yield
|
—
|
|
1.96
|
%
|
1.87
|
%
|
1.97
|
%
|
1.94
|
%
|
||||||||||
|
Other securities:
|
||||||||||||||||||||
|
Amortized cost
|
$
|
—
|
|
$
|
—
|
|
$
|
—
|
|
$
|
1,575
|
|
$
|
1,575
|
|
|||||
|
Carrying value
|
—
|
|
—
|
|
—
|
|
1,032
|
|
1,032
|
|
||||||||||
|
Weighted-average yield
|
—
|
|
—
|
|
—
|
|
—
|
|
—
|
|
||||||||||
|
Sub-total agency MBS and CMOs and other securities:
|
|
|
|
|
||||||||||||||||
|
Amortized cost
|
$
|
—
|
|
$
|
110,510
|
|
$
|
675,502
|
|
$
|
1,304,716
|
|
$
|
2,090,728
|
|
|||||
|
Carrying value
|
—
|
|
110,019
|
|
673,454
|
|
1,298,638
|
|
2,082,111
|
|
||||||||||
|
Weighted-average yield
|
—
|
|
1.96
|
%
|
1.87
|
%
|
1.97
|
%
|
1.94
|
%
|
||||||||||
|
ARS preferred securities:
|
|
|
|
|
|
|
|
|
|
|
||||||||||
|
Amortized cost
|
$
|
—
|
|
$
|
—
|
|
$
|
—
|
|
$
|
101,674
|
|
$
|
101,674
|
|
|||||
|
Carrying value
|
—
|
|
—
|
|
—
|
|
106,171
|
|
106,171
|
|
||||||||||
|
Weighted-average yield
|
—
|
|
—
|
|
—
|
|
2.10
|
%
|
2.10
|
%
|
||||||||||
|
Total available-for-sale securities:
|
|
|
|
|
|
|
|
|
|
|
||||||||||
|
Amortized cost
|
$
|
—
|
|
$
|
110,510
|
|
$
|
675,502
|
|
$
|
1,406,390
|
|
$
|
2,192,402
|
|
|||||
|
Carrying value
|
—
|
|
110,019
|
|
673,454
|
|
1,404,809
|
|
2,188,282
|
|
||||||||||
|
Weighted-average yield
|
—
|
|
1.96
|
%
|
1.87
|
%
|
1.98
|
%
|
1.95
|
%
|
||||||||||
The gross unrealized losses and fair value, aggregated by investment category and length of time the individual securities have been in a continuous unrealized loss position, are as follows:
|
|
September 30, 2017
|
|||||||||||||||||||||||
|
|
Less than 12 months
|
12 months or more
|
Total
|
|||||||||||||||||||||
|
$ in thousands
|
Estimated
fair value
|
Unrealized
losses
|
Estimated
fair value
|
Unrealized
losses
|
Estimated
fair value
|
Unrealized
losses
|
||||||||||||||||||
|
Agency MBS and CMOs
|
$
|
1,119,715
|
|
$
|
(5,621
|
)
|
$
|
295,528
|
|
$
|
(4,378
|
)
|
$
|
1,415,243
|
|
$
|
(9,999
|
)
|
||||||
|
Other securities
|
—
|
|
—
|
|
1,032
|
|
(543
|
)
|
1,032
|
|
(543
|
)
|
||||||||||||
|
Total
|
$
|
1,119,715
|
|
$
|
(5,621
|
)
|
$
|
296,560
|
|
$
|
(4,921
|
)
|
$
|
1,416,275
|
|
$
|
(10,542
|
)
|
||||||
|
|
September 30, 2016
|
|||||||||||||||||||||||
|
|
Less than 12 months
|
12 months or more
|
Total
|
|||||||||||||||||||||
|
$ in thousands
|
Estimated
fair value
|
Unrealized
losses
|
Estimated
fair value
|
Unrealized
losses
|
Estimated
fair value
|
Unrealized
losses
|
||||||||||||||||||
|
Agency MBS and CMOs
|
$
|
208,880
|
|
$
|
(361
|
)
|
$
|
28,893
|
|
$
|
(195
|
)
|
$
|
237,773
|
|
$
|
(556
|
)
|
||||||
|
Non-agency CMOs
|
4,256
|
|
(21
|
)
|
44,137
|
|
(2,896
|
)
|
48,393
|
|
(2,917
|
)
|
||||||||||||
|
Other securities
|
1,417
|
|
(158
|
)
|
—
|
|
—
|
|
1,417
|
|
(158
|
)
|
||||||||||||
|
ARS municipal obligations
|
13,204
|
|
(697
|
)
|
11,695
|
|
(1,661
|
)
|
24,899
|
|
(2,358
|
)
|
||||||||||||
|
ARS preferred securities
|
98,489
|
|
(3,208
|
)
|
—
|
|
—
|
|
98,489
|
|
(3,208
|
)
|
||||||||||||
|
Total
|
$
|
326,246
|
|
$
|
(4,445
|
)
|
|
$
|
84,725
|
|
|
$
|
(4,752
|
)
|
|
$
|
410,971
|
|
|
$
|
(9,197
|
)
|
||
The reference point for determining when securities are in a loss position is the reporting period end. As such, it is possible that a security had a fair value that exceeded its amortized cost on other days during the period.
121
RAYMOND JAMES FINANCIAL, INC AND SUBSIDIARIES
Notes to Consolidated Financial Statements
Agency MBS and CMOs and Non-agency CMOs
The Federal Home Loan Mortgage Corporation
(“FHLMC”)
,
FNMA
, as well the
GNMA
, guarantee the contractual cash flows of the agency
MBS
and
CMOs
. At
September 30, 2017
, of the
133
U.S.
government-sponsored enterprise
MBS
and
CMOs
in an unrealized loss position,
100
were in a continuous unrealized loss position for less than 12 months and
33
were for 12 months or more. We do not consider these securities other-than-temporarily impaired due to the guarantee provided by
FNMA
,
FHLMC
, and
GNMA
as to the full payment of principal and interest, and the fact that we have the ability and intent to hold these securities. At
September 30, 2017
, debt securities we held from
FNMA
and
FHLMC
had an amortized cost of
$1.43 billion
and
$586 million
, respectively, and a fair value of
$1.42 billion
and
$582 million
, respectively.
During the
year ended September 30, 2017
, we sold the remainder of our non-agency
CMOs
. In periods in which we held such securities, all individual non-agency securities were evaluated for
OTTI
on a quarterly basis. Only those non-agency
CMOs
whose amortized cost basis we did not expect to recover in full were considered to be other than temporarily impaired, as we had the ability and intent to hold such securities.
There were
$66 million
in proceeds and a gain of
$1 million
, which is included in “Other revenues” on our Consolidated Statements of Income and Comprehensive Income, from the sale of agency MBS and CMOs and non-agency CMO available-for-sale securities during the
year ended September 30, 2017
. During the
year ended September 30, 2016
, there were
$8 million
in proceeds, resulting in an insignificant gain, from sales of non-agency CMO available-for-sale securities. During the
year ended September 30, 2015
, there were
$12 million
in proceeds and a loss of
$1 million
from the sale of non-agency CMO available-for-sale securities.
ARS
Our cost basis in the ARS we hold is the fair value of the securities in the period in which we acquired them. The par value of the
ARS
we held as of
September 30, 2017
was
$120 million
. Only those
ARS
whose amortized cost basis we do not expect to recover in full are considered to be other-than-temporarily impaired, as we have the ability and intent to hold these securities. All of our
ARS
securities are evaluated for
OTTI
on a quarterly basis.
As of
September 30, 2017
, there were
no
ARS
with a fair value less than cost basis. During the
year ended September 30, 2017
, we sold the remainder of our ARS municipal obligations. In periods in which we held such securities, certain ARS had a fair value less than their cost basis, indicating potential impairment. We analyzed the credit ratings associated with these securities as an indicator of potential credit impairment and, including subsequent ratings changes, determined that all of these securities maintained investment-grade ratings by at least one rating agency. We had the ability and intent to hold these ARS and expected to recover the entire cost basis and therefore concluded that none of the potential impairment was related to potential credit loss.
Sales or redemptions of
ARS
for the year-ended September 30, 2017 primarily related to ARS municipal obligations and resulted in aggregate proceeds of
$30 million
and a gain of
$1 million
, which is included in “Other revenues” on our Consolidated Statements of Income and Comprehensive Income. During the
year ended September 30, 2016
, sales or redemptions of
ARS
resulted in proceeds of
$3 million
and an insignificant gain. During the
year ended September 30, 2015
, sales or redemptions of
ARS
resulted in proceeds of
$64 million
and a gain of
$11 million
primarily related to ARS municipal obligations.
Other-than-temporarily impaired securities
There is no intent to sell our
ARS
and it was not more likely than not that we would be required to sell these securities as of
September 30, 2017
.
Changes in the amount of
OTTI
related to credit losses recognized in “Other revenues” on available-for-sale securities are as follows:
|
|
Year ended September 30,
|
|||||||||||
|
$ in thousands
|
2017
|
2016
|
2015
|
|||||||||
|
Amount related to credit losses on securities we held at the beginning of the year
|
$
|
8,107
|
|
$
|
11,847
|
|
$
|
18,703
|
|
|||
|
Decreases to the amount related to credit losses for securities sold during the year
|
(8,107
|
)
|
(3,740
|
)
|
(6,856
|
)
|
||||||
|
Amount related to credit losses on securities we held at the end of the year
|
$
|
—
|
|
$
|
8,107
|
|
$
|
11,847
|
|
|||
122
RAYMOND JAMES FINANCIAL, INC AND SUBSIDIARIES
Notes to Consolidated Financial Statements
Our derivative assets and derivative liabilities are recorded at fair value and are included in “Derivative assets” and “Derivative liabilities” in our Consolidated Statements of Financial Condition. Cash flows related to our derivative contracts are included within operating activities in the Consolidated Statements of Cash Flows. The significant accounting policies governing our derivative financial instruments, including our methodologies for determining fair value, are described in
Note 2
.
Derivatives arising from our fixed income business operations
We enter into interest rate contracts as part of our fixed income business to facilitate client transactions or to actively manage risk exposures that arise from our client activity, including a portion of our trading inventory. The majority of these derivatives are traded in the over-the-counter market and are executed directly with another counterparty or are cleared and settled through a clearing organization.
We also facilitate matched book derivative transactions in which RJFP enters into interest rate derivative transactions with clients. For every derivative transaction RJFP enters into with a client, RJFP enters into an offsetting derivative on terms that mirror the client transaction with a credit support provider, which is a third party financial institution. Any collateral required to be exchanged under these derivative contracts is administered directly between the client and the third-party financial institution. Due to this pass-through transaction structure, RJFP has completely mitigated the market and credit risk on these derivative contracts. As a result, derivatives for which the fair value is in an asset position have an equal and offsetting derivative liability. RJFP only has credit risk on its uncollected derivative transaction fee revenues. The receivable for uncollected derivative transaction fee revenues of RJFP was
$5 million
and
$7 million
at
September 30, 2017
and
2016
, respectively, and is included in “Other receivables” on our Consolidated Statements of Financial Condition.
Derivatives arising from RJ Bank’s business operations
We enter into forward foreign exchange contracts and interest rate swaps to hedge certain exposures arising out of RJ Bank’s business operations. Each of these activities is described in the “Derivative assets and derivative liabilities” section of
Note 2
and below.
We enter into three-month forward foreign exchange contracts primarily to hedge the risks related to RJ Bank’s investment in their Canadian subsidiary as well as their risk resulting from transactions denominated in currencies other than the U.S. dollar. The majority of these derivatives are designated as net investment hedges.
The cash flows associated with certain assets held by RJ Bank provide interest income at fixed interest rates. Therefore, the value of these assets, absent any risk mitigation, is subject to fluctuation based upon changes in market rates of interest over time. RJ Bank enters into floating-rate advances from the FHLB to, in part, fund these assets and then enters into interest rate swaps which swap variable interest payments on this debt for fixed interest payments. These interest rate swaps are designated as cash flow hedges and effectively fix RJ Bank’s cost of funds associated with these assets to mitigate a portion of the market risk.
Derivative arising from our acquisition of Alex. Brown
As part of our acquisition of Alex. Brown, we assumed certain DBRSU awards, including the associated plan terms and conditions. The DBRSU awards contain performance conditions based on Deutsche Bank and subsidiaries attaining certain financial results and will ultimately be settled in DB common shares, provided the performance metrics are achieved. The DBRSU obligation results in a derivative, the fair value and notional of which is measured by multiplying the number of outstanding DBRSU awards to be settled in DB common shares as of the end of the reporting period by the end of reporting period DB share price, as traded on the NYSE.
Counterparty netting and collateral related to derivative contracts
To reduce credit exposure on certain of our derivative transactions, we may enter into a master netting arrangement that allows for net settlement of all derivative transactions with each counterparty. In addition, the credit support annex allows parties to the master netting agreement to mitigate their credit risk by requiring the party which is out of the money to post collateral. We accept collateral in the form of cash or other marketable securities. Where permitted, we elect to net-by-counterparty certain derivative contracts entered into under a legally enforceable master netting agreement and, therefore, the fair value of those derivative contracts are netted by counterparty in the Consolidated Statements of Financial Condition. As we elect to net-by-counterparty the fair value of such derivative contracts, we also net-by-counterparty cash collateral exchanged as part of those derivative agreements. We may also require certain counterparties to make a deposit at the inception of a derivative agreement, referred to as “initial margin.” This initial margin is included in “Other payables” on our Consolidated Statements of Financial Condition.
123
RAYMOND JAMES FINANCIAL, INC AND SUBSIDIARIES
Notes to Consolidated Financial Statements
We are also required to maintain cash or marketable security deposits with the clearing organizations we utilize to clear certain of our interest rate derivative transactions. This initial margin is included as a component of “Receivables from brokers, dealers and clearing organizations” in our Consolidated Statements of Financial Condition. On a daily basis we also pay cash to or receive cash from these clearing organizations due to changes in the fair value of the derivatives which they clear. Such payments are referred to as “variation margin.” During the quarter ended March 31, 2017, the Chicago Mercantile Exchange, a clearing organization we utilize to clear certain of our interest rate derivatives, adopted a rule change which requires variation margin to be considered settlement of the related derivatives instead of collateral. The impact of this change on our Consolidated Statements of Financial Condition was to reduce the gross fair value of these derivative assets and/or liabilities by the amount of variation margin received or paid on the related derivatives. Prior to the quarter ending March 31, 2017, such balances were included as a component of “Receivables from brokers, dealers and clearing organizations” when such balances were in an asset position, or “Other payables” when such balances were in a liability position, on our Consolidated Statements of Financial Condition.
RJ Bank provides to counterparties for the benefit of its U.S. subsidiaries, a guarantee of payment in the event of the subsidiary’s default under forward foreign exchange contracts. Due to this RJ Bank guarantee and the short-term nature of these derivatives, RJ Bank’s U.S. subsidiaries are generally not required to post collateral with and do not generally receive collateral from the respective counterparties.
Derivative balances included in our financial statements
The table below presents the gross fair value and notional amount of derivative contracts by product type, the amounts of counterparty and cash collateral netting in our Consolidated Statements of Financial Condition, as well as cash and securities collateral posted and received under enforceable credit support agreements that do not meet the criteria for netting under GAAP.
|
September 30, 2017
|
September 30, 2016
|
|||||||||||||||||||||||
|
$ in thousands
|
Derivative assets
|
Derivative liabilities
|
Notional amount
|
Derivative assets
|
Derivative liabilities
|
Notional amount
|
||||||||||||||||||
|
Derivatives not designated as hedging instruments
|
||||||||||||||||||||||||
|
Interest rate contracts:
|
||||||||||||||||||||||||
|
Matched book
|
$
|
288,035
|
|
$
|
288,035
|
|
$
|
2,766,488
|
|
$
|
422,196
|
|
$
|
422,196
|
|
$
|
2,938,590
|
|
||||||
|
Other
|
86,436
|
|
100,503
|
|
4,931,809
|
|
163,433
|
|
151,831
|
|
4,285,033
|
|
||||||||||||
|
Foreign exchange contracts
|
3
|
|
530
|
|
437,783
|
|
620
|
|
—
|
|
313,562
|
|
||||||||||||
|
DBRSU obligation (equity)
(1)
|
—
|
|
25,800
|
|
25,800
|
|
—
|
|
17,769
|
|
17,769
|
|
||||||||||||
|
Subtotal
|
374,474
|
|
414,868
|
|
8,161,880
|
|
586,249
|
|
591,796
|
|
7,554,954
|
|
||||||||||||
|
Derivatives designated as hedging instruments
|
||||||||||||||||||||||||
|
Interest rate contracts
|
—
|
|
1,390
|
|
850,000
|
|
—
|
|
26,671
|
|
550,000
|
|
||||||||||||
|
Foreign exchange contracts
|
29
|
|
116
|
|
1,048,646
|
|
1,396
|
|
—
|
|
753,373
|
|
||||||||||||
|
Subtotal
|
29
|
|
1,506
|
|
1,898,646
|
|
1,396
|
|
26,671
|
|
1,303,373
|
|
||||||||||||
|
Total gross fair value/notional amount
|
374,503
|
|
416,374
|
|
$
|
10,060,526
|
|
587,645
|
|
618,467
|
|
$
|
8,858,327
|
|
||||||||||
|
Offset in the Statements of Financial Condition
|
||||||||||||||||||||||||
|
Counterparty netting
|
(6,045
|
)
|
(6,045
|
)
|
(55,498
|
)
|
(55,498
|
)
|
||||||||||||||||
|
Cash collateral netting
|
(49,683
|
)
|
(53,365
|
)
|
(52,041
|
)
|
(87,361
|
)
|
||||||||||||||||
|
Total amounts offset
|
(55,728
|
)
|
(59,410
|
)
|
|
(107,539
|
)
|
(142,859
|
)
|
|
||||||||||||||
|
Net amounts presented in the Statements of Financial Condition
|
318,775
|
|
356,964
|
|
480,106
|
|
475,608
|
|
||||||||||||||||
|
Gross amounts not offset in the Statements of Financial Condition
|
||||||||||||||||||||||||
|
Financial instruments
(2)
|
(293,340
|
)
|
(288,035
|
)
|
(451,224
|
)
|
(424,633
|
)
|
||||||||||||||||
|
Cash received/(paid)
|
—
|
|
—
|
|
—
|
|
(26,671
|
)
|
||||||||||||||||
|
Subtotal
|
(293,340
|
)
|
(288,035
|
)
|
|
(451,224
|
)
|
(451,304
|
)
|
|
||||||||||||||
|
Total
|
$
|
25,435
|
|
$
|
68,929
|
|
|
$
|
28,882
|
|
$
|
24,304
|
|
|
||||||||||
(1) The DBRSU obligation is not subject to an enforceable master netting arrangement or other similar arrangement. However, we hold shares of DB as an economic hedge against this obligation with a fair value of
$19 million
and
$12 million
as of
September 30, 2017
and
2016
, respectively, which are a component of “Other investments” on our Consolidated Statements of Financial Condition. See additional discussion of the DBRSUs in
Note 20
.
(2) Although the matched book derivative arrangements do not meet the definition of a master netting arrangement as specified by GAAP, the nature of the agreement with the third party intermediary include terms that are similar to a master netting agreement. As a result, we present the matched book amounts net in the table above.
124
RAYMOND JAMES FINANCIAL, INC AND SUBSIDIARIES
Notes to Consolidated Financial Statements
Gains/(losses) recognized in AOCI, net of income taxes, on derivatives designated as hedging instruments are as follows (see
Note 18
for additional information):
|
|
Year ended September 30,
|
|||||||||||
|
$ in thousands
|
2017
|
2016
|
2015
|
|||||||||
|
Interest rate contracts (cash flow hedges)
|
$
|
23,232
|
|
$
|
(11,833
|
)
|
$
|
(4,650
|
)
|
|||
|
Foreign exchange contracts (net investment hedges)
|
(26,281
|
)
|
(6,721
|
)
|
60,331
|
|
||||||
|
Total gains/(losses) recognized in AOCI, net of taxes
|
$
|
(3,049
|
)
|
$
|
(18,554
|
)
|
$
|
55,681
|
|
|||
There was
no
significant hedge ineffectiveness and
no
components of derivative gains or losses were excluded from the assessment of hedge effectiveness for any of the years ended
September 30, 2017
,
2016
or
2015
. We expect to reclassify an estimated
$4 million
as additional interest expense out of AOCI and into earnings within the next
12
months. The maximum length of time over which forecasted transactions are or will be hedged is
10
years.
Gains/(losses) on derivatives not designated as hedging instruments recognized on the Consolidated Statements of Income and Comprehensive Income are as follows:
|
|
Location of the impact
recognized on derivatives included in the
Consolidated Statements of
Income and Comprehensive Income
|
Gain/(loss) recognized during the
|
||||||||||||
|
|
year ended September 30,
|
|||||||||||||
|
$ in thousands
|
2017
|
2016
|
2015
|
|||||||||||
|
Interest rate contracts:
|
||||||||||||||
|
Matched book
|
Other revenues
|
$
|
36
|
|
$
|
92
|
|
$
|
901
|
|
||||
|
Other
|
Net trading profit
|
$
|
7,895
|
|
$
|
2,819
|
|
$
|
3,107
|
|
||||
|
Foreign exchange contracts
|
Other revenues
|
$
|
(19,961
|
)
|
$
|
(2,662
|
)
|
$
|
20,459
|
|
||||
|
DBRSUs
|
Compensation, commissions and benefits expense
|
$
|
(5,648
|
)
|
$
|
2,457
|
|
$
|
—
|
|
||||
|
DBRSUs
|
Acquisition-related expenses
|
$
|
(2,383
|
)
|
$
|
—
|
|
$
|
—
|
|
||||
Acquisition-related expenses in the table above include the impact on the DBRSU obligation of the DB rights offering during fiscal year 2017 and from forfeitures which occurred during the periods presented. The impact of the DB rights offering on the DBRSU obligation was partially offset by a gain on the rights offering related to the shares of DB we hold as an economic hedge, which was also reported in acquisition-related expenses.
Risks associated with, and our risk mitigation related to, our derivative contracts
Credit risk
We are exposed to credit losses in the event of nonperformance by the counterparties to forward foreign exchange derivative agreements and interest rate contracts that are not cleared through a clearing organization. Where we are subject to credit exposure, we perform a credit evaluation of counterparties prior to entering into derivative transactions and we monitor their credit standings. Currently, we anticipate that all of the counterparties will be able to fully satisfy their obligations under those agreements. We may require initial margin or collateral from counterparties in the form of cash deposits or other marketable securities to support certain of these obligations as established by the credit threshold specified by the agreement and/or as a result of monitoring the credit standing of the counterparties.
Our only exposure to credit risk in the matched book derivatives operations is related to our uncollected derivative transaction fee revenues. We are not exposed to market risk as it relates to these derivative contracts due to the pass-through transaction structure previously described.
Interest rate and foreign exchange risk
We are exposed to interest rate risk related to certain of our interest rate derivative agreements. We are also exposed to foreign exchange risk related to our forward foreign exchange derivative agreements. On a daily basis, we monitor our risk exposure in our derivative agreements based on established limits with respect to a number of factors, including interest rate, foreign exchange spot and forward rates, spread, ratio, basis and volatility risks. These exposures are monitored both on a total portfolio basis and separately for each agreement for selected maturity periods.
125
RAYMOND JAMES FINANCIAL, INC AND SUBSIDIARIES
Notes to Consolidated Financial Statements
Derivatives with credit-risk-related contingent features
Certain of the derivative instruments arising from our interest rate contracts and forward foreign exchange contracts contain provisions that require our debt to maintain an investment grade rating from
one
or more of the major credit rating agencies. If our debt were to fall below investment grade, the counterparties to the derivative instruments could terminate and request immediate payment or demand immediate and ongoing overnight collateralization on our derivative instruments in liability positions. The aggregate fair value of all derivative instruments with such credit-risk-related contingent features that are in a liability position at both
September 30, 2017
and
2016
was not material.
Collateralized agreements are reverse repurchase agreements and securities borrowed. Collateralized financings are repurchase agreements and securities loaned. We enter into these transactions in order to facilitate client activities, invest excess cash, acquire securities to cover short positions and finance certain firm activities. The significant accounting policies governing our collateralized agreements and financings are described in
Note 2
.
For financial statement purposes, we do not offset our reverse repurchase agreements, repurchase agreements, securities borrowing and securities lending transactions because the conditions for netting as specified by GAAP are not met. Our reverse repurchase agreements, repurchase agreements, securities borrowing and securities lending transactions are governed by master agreements that are widely used by counterparties and that may allow for net settlements of payments in the normal course as well as offsetting of all contracts with a given counterparty in the event of bankruptcy or default of one of the parties to the transaction. Although not offset on the Consolidated Statements of Financial Condition, these transactions are included in the following table.
|
Assets
|
Liabilities
|
|||||||||||||||
|
$ in thousands
|
Reverse repurchase agreements
|
Securities borrowed
|
Repurchase agreements
|
Securities loaned
|
||||||||||||
|
September 30, 2017
|
||||||||||||||||
|
Gross amounts of recognized assets/liabilities
|
$
|
404,462
|
|
$
|
138,319
|
|
$
|
220,942
|
|
$
|
383,953
|
|
||||
|
Gross amounts offset in the Statements of Financial Condition
|
—
|
|
—
|
|
—
|
|
—
|
|
||||||||
|
Net amounts presented in the Statements of Financial Condition
|
404,462
|
|
138,319
|
|
220,942
|
|
383,953
|
|
||||||||
|
Gross amounts not offset in the Statements of Financial Condition
|
(404,462
|
)
|
(134,304
|
)
|
(220,942
|
)
|
(373,132
|
)
|
||||||||
|
Net amount
|
$
|
—
|
|
$
|
4,015
|
|
$
|
—
|
|
$
|
10,821
|
|
||||
|
September 30, 2016
|
||||||||||||||||
|
Gross amounts of recognized assets/liabilities
|
$
|
470,222
|
|
$
|
170,860
|
|
$
|
193,229
|
|
$
|
677,761
|
|
||||
|
Gross amounts offset in the Statements of Financial Condition
|
—
|
|
—
|
|
—
|
|
—
|
|
||||||||
|
Net amounts presented in the Statements of Financial Condition
|
470,222
|
|
170,860
|
|
193,229
|
|
677,761
|
|
||||||||
|
Gross amounts not offset in the Statements of Financial Condition
|
(470,222
|
)
|
(167,169
|
)
|
(193,229
|
)
|
(664,870
|
)
|
||||||||
|
Net amount
|
$
|
—
|
|
$
|
3,691
|
|
$
|
—
|
|
$
|
12,891
|
|
||||
The required market value of the collateral associated with collateralized agreements and financings generally exceeds the amount financed. Accordingly, the total collateral received under reverse repurchase agreements and the total amount of collateral posted under repurchase agreements exceeds the carrying value of these agreements in our Consolidated Statements of Financial Condition. In the event the market value of the securities we pledge as collateral in these activities declines, we may have to post additional collateral or reduce the borrowing amounts. We monitor such levels daily.
Collateral received and pledged
We receive cash and securities as collateral, primarily in connection with reverse repurchase agreements and other collateralized financings, securities borrowed, derivative transactions not transacted through a clearing organization, and client margin loans. The collateral we receive reduces our credit exposure to individual counterparties.
In many cases, we are permitted to deliver or repledge financial instruments we have received as collateral, for our own use in our repurchase agreements, securities lending agreements, other secured borrowings, satisfaction of deposit requirements with clearing organizations, or otherwise meeting either our, or our clients’, settlement requirements.
126
RAYMOND JAMES FINANCIAL, INC AND SUBSIDIARIES
Notes to Consolidated Financial Statements
The table below presents financial instruments at fair value that we received as collateral, are not included on our Consolidated Statements of Financial Condition, and that were available to be delivered or repledged, along with the balances of such instruments that were delivered or repledged, to satisfy one of our purposes described above:
|
September 30,
|
||||||||
|
$ in thousands
|
2017
|
2016
|
||||||
|
Collateral we received that is available to be delivered or repledged
|
$
|
3,030,736
|
|
$
|
2,925,335
|
|
||
|
Collateral that we delivered or repledged
|
$
|
1,068,912
|
|
$
|
1,536,393
|
|
||
Encumbered assets
We pledge certain of our financial instruments to collateralize either repurchase agreements or other secured borrowings, or to satisfy our settlement requirements with counterparties or clearing organizations who may or may not have the right to deliver or repledge such securities. The table below presents information about the fair value of our assets that have been pledged for one of the purposes described above:
|
September 30,
|
||||||||
|
$ in thousands
|
2017
|
2016
|
||||||
|
Financial instruments owned, at fair value, pledged to counterparties that:
|
||||||||
|
Had the right to deliver or repledge
|
$
|
363,739
|
|
$
|
440,642
|
|
||
|
Did not have the right to deliver or repledge
|
$
|
44,930
|
|
$
|
18,788
|
|
||
Repurchase agreements, repurchase-to-maturity transactions and securities lending transactions accounted for as secured borrowings
The following table presents the remaining contractual maturity of repurchase agreements and securities lending transactions accounted for as secured borrowings:
|
$ in thousands
|
Overnight and continuous
|
Up to 30 days
|
30-90 days
|
Greater than 90 days
|
Total
|
|||||||||||||||
|
As of September 30, 2017:
|
||||||||||||||||||||
|
Repurchase agreements
|
||||||||||||||||||||
|
Government and agency obligations
|
$
|
107,284
|
|
$
|
—
|
|
$
|
—
|
|
$
|
—
|
|
$
|
107,284
|
|
|||||
|
Agency MBS and CMOs
|
113,658
|
|
—
|
|
—
|
|
—
|
|
113,658
|
|
||||||||||
|
Total Repurchase Agreements
|
220,942
|
|
—
|
|
—
|
|
—
|
|
220,942
|
|
||||||||||
|
Securities lending
|
||||||||||||||||||||
|
Equity securities
|
383,953
|
|
—
|
|
—
|
|
—
|
|
383,953
|
|
||||||||||
|
Total
|
$
|
604,895
|
|
$
|
—
|
|
$
|
—
|
|
$
|
—
|
|
$
|
604,895
|
|
|||||
|
Gross amounts of recognized liabilities for repurchase agreements and securities lending transactions included in the table within this footnote
|
$
|
604,895
|
|
|||||||||||||||||
|
Amounts related to repurchase agreements and securities lending transactions not included in the table within this footnote
|
$
|
—
|
|
|||||||||||||||||
|
As of September 30, 2016:
|
||||||||||||||||||||
|
Repurchase agreements
|
||||||||||||||||||||
|
Government and agency obligations
|
$
|
92,804
|
|
$
|
6,252
|
|
$
|
—
|
|
$
|
—
|
|
$
|
99,056
|
|
|||||
|
Agency MBS and CMOs
|
92,422
|
|
1,751
|
|
—
|
|
—
|
|
94,173
|
|
||||||||||
|
Total Repurchase Agreements
|
185,226
|
|
8,003
|
|
—
|
|
—
|
|
193,229
|
|
||||||||||
|
Securities lending
|
||||||||||||||||||||
|
Equity securities
|
677,761
|
|
—
|
|
—
|
|
—
|
|
677,761
|
|
||||||||||
|
Total
|
$
|
862,987
|
|
$
|
8,003
|
|
$
|
—
|
|
$
|
—
|
|
$
|
870,990
|
|
|||||
|
Gross amounts of recognized liabilities for repurchase agreements and securities lending transactions included in the table within this footnote
|
$
|
870,990
|
|
|||||||||||||||||
|
Amounts related to repurchase agreements and securities lending transactions not included in the table within this footnote
|
$
|
—
|
|
|||||||||||||||||
Our repurchase agreements would include “repurchase-to-maturity” agreements, which are repurchase agreements where a security is transferred under an agreement to repurchase and the maturity date of the repurchase agreement matches the maturity date of the underlying security, if any, that we are a party to as of period-end. As of both
September 30, 2017
and
2016
, we did not have any “repurchase-to-maturity” agreements.
127
RAYMOND JAMES FINANCIAL, INC AND SUBSIDIARIES
Notes to Consolidated Financial Statements
Bank client receivables are comprised of loans originated or purchased by
RJ Bank
and include
C&I
loans, tax-exempt loans,
SBL
, and commercial and residential real estate loans. These receivables are collateralized by first or second mortgages on residential or other real property, other assets of the borrower, a pledge of revenue or are unsecured.
We segregate our loan portfolio into
six
loan portfolio segments:
C&I
,
CRE
,
CRE
construction, tax-exempt, residential mortgage and
SBL
. These portfolio segments also serve as the portfolio loan classes for purposes of credit analysis, except for residential mortgage loans which are further disaggregated into residential first mortgage and residential home equity classes.
See Note 2 for a discussion of accounting policies related to bank loans and allowances for losses.
The following tables present the balances for both the held for sale and held for investment loan portfolios, as well as the associated percentage of each portfolio segment in
RJ Bank
’s total loan portfolio. “Loans held for sale, net” and “Total loans held for investment, net” in the table below are presented net of unearned income and deferred expenses, which include purchase premiums, purchase discounts and net deferred origination fees and costs.
|
September 30,
|
|||||||||||||||||||||
|
|
2017
|
2016
|
2015
|
||||||||||||||||||
|
$ in thousands
|
Balance
|
%
|
Balance
|
%
|
Balance
|
%
|
|||||||||||||||
|
Loans held for sale, net
|
$
|
70,316
|
|
—
|
|
$
|
214,286
|
|
1
|
%
|
$
|
119,519
|
|
1
|
%
|
||||||
|
Loans held for investment:
|
|
|
|
|
|
|
|
|
|
|
|
|
|||||||||
|
C&I loans
|
7,385,910
|
|
43
|
%
|
7,470,373
|
|
48
|
%
|
6,928,018
|
|
52
|
%
|
|||||||||
|
CRE construction loans
|
112,681
|
|
1
|
%
|
122,718
|
|
1
|
%
|
162,356
|
|
1
|
%
|
|||||||||
|
CRE loans
|
3,106,290
|
|
18
|
%
|
2,554,071
|
|
17
|
%
|
2,054,154
|
|
16
|
%
|
|||||||||
|
Tax-exempt loans
|
1,017,791
|
|
6
|
%
|
740,944
|
|
5
|
%
|
484,537
|
|
4
|
%
|
|||||||||
|
Residential mortgage loans
|
3,148,730
|
|
18
|
%
|
2,441,569
|
|
16
|
%
|
1,962,614
|
|
15
|
%
|
|||||||||
|
SBL
|
2,386,697
|
|
14
|
%
|
1,904,827
|
|
12
|
%
|
1,481,504
|
|
11
|
%
|
|||||||||
|
Total loans held for investment
|
17,158,099
|
|
|
|
15,234,502
|
|
|
|
13,073,183
|
|
|
|
|||||||||
|
Net unearned income and deferred expenses
|
(31,178
|
)
|
|
|
(40,675
|
)
|
|
|
(32,424
|
)
|
|
|
|||||||||
|
Total loans held for investment, net
|
17,126,921
|
|
|
|
15,193,827
|
|
|
|
13,040,759
|
|
|
|
|||||||||
|
Total loans held for sale and investment
|
17,197,237
|
|
100
|
%
|
15,408,113
|
|
100
|
%
|
13,160,278
|
|
100
|
%
|
|||||||||
|
Allowance for loan losses
|
(190,442
|
)
|
|
|
(197,378
|
)
|
|
|
(172,257
|
)
|
|||||||||||
|
Bank loans, net
|
$
|
17,006,795
|
|
|
|
$
|
15,210,735
|
|
|
|
$
|
12,988,021
|
|
||||||||
|
September 30,
|
||||||||||||||
|
2014
|
2013
|
|||||||||||||
|
$ in thousands
|
Balance
|
%
|
Balance
|
%
|
||||||||||
|
Loans held for sale, net
|
$
|
45,988
|
|
—
|
|
$
|
110,292
|
|
1
|
%
|
||||
|
Loans held for investment:
|
|
|
|
|
|
|
|
|||||||
|
C&I loans
|
6,422,347
|
|
58
|
%
|
5,246,005
|
|
59
|
%
|
||||||
|
CRE construction loans
|
94,195
|
|
1
|
%
|
60,840
|
|
1
|
%
|
||||||
|
CRE loans
|
1,689,163
|
|
15
|
%
|
1,283,046
|
|
14
|
%
|
||||||
|
Tax-exempt loans
|
122,218
|
|
1
|
%
|
—
|
|
—
|
|
||||||
|
Residential mortgage loans
|
1,751,747
|
|
16
|
%
|
1,745,650
|
|
19
|
%
|
||||||
|
SBL
|
1,023,748
|
|
9
|
%
|
555,805
|
|
6
|
%
|
||||||
|
Total loans held for investment
|
11,103,418
|
|
|
|
8,891,346
|
|
|
|
||||||
|
Net unearned income and deferred expenses
|
(37,533
|
)
|
|
|
(43,936
|
)
|
|
|
||||||
|
Total loans held for investment, net
|
11,065,885
|
|
|
|
8,847,410
|
|
|
|
||||||
|
Total loans held for sale and investment
|
11,111,873
|
|
100
|
%
|
8,957,702
|
|
100
|
%
|
||||||
|
Allowance for loan losses
|
(147,574
|
)
|
|
|
(136,501
|
)
|
|
|
||||||
|
Bank loans, net
|
$
|
10,964,299
|
|
|
|
$
|
8,821,201
|
|
|
|
||||
At
September 30, 2017
, the
FHLB
had a blanket lien on
RJ Bank
’s residential mortgage loan portfolio as security for the repayment of certain borrowings. See
Note 14
for more information regarding borrowings from the
FHLB
.
128
RAYMOND JAMES FINANCIAL, INC AND SUBSIDIARIES
Notes to Consolidated Financial Statements
Loans held for sale
RJ Bank
originated or purchased
$1.67 billion
,
$1.80 billion
and
$1.24 billion
of loans held for sale during the years ended
September 30, 2017
,
2016
and
2015
, respectively. Proceeds from the sale of held for sale loans amounted to
$439 million
,
$383 million
and
$213 million
for the years ended
September 30, 2017
,
2016
and
2015
, respectively. Net gains resulting from such sales amounted to
$2 million
in each of the years ended
September 30, 2017
,
2016
and
2015
. Unrealized losses recorded in the Consolidated Statements of Income and Comprehensive Income to reflect the loans held for sale at the lower of cost or market value were insignificant in each of the years ended
September 30, 2017
,
2016
and
2015
.
Purchases and sales of loans held for investment
The following table presents purchases and sales of any loans held for investment by portfolio segment:
|
$ in thousands
|
C&I
|
CRE
|
Residential mortgage
|
Total
|
||||||||||||
|
Year ended September 30, 2017
|
||||||||||||||||
|
Purchases
|
$
|
536,627
|
|
$
|
63,542
|
|
$
|
264,340
|
|
|
$
|
864,509
|
|
|||
|
Sales
|
$
|
341,196
|
|
$
|
—
|
|
$
|
—
|
|
$
|
341,196
|
|
||||
|
Year ended September 30, 2016
|
||||||||||||||||
|
Purchases
|
$
|
457,503
|
|
$
|
24,869
|
|
$
|
371,710
|
|
$
|
854,082
|
|
||||
|
Sales
|
$
|
172,968
|
|
$
|
—
|
|
$
|
—
|
|
$
|
172,968
|
|
||||
|
Year ended September 30, 2015
|
||||||||||||||||
|
Purchases
|
$
|
792,921
|
|
$
|
—
|
|
$
|
220,311
|
|
$
|
1,013,232
|
|
||||
|
Sales
|
$
|
108,983
|
|
$
|
—
|
|
$
|
—
|
|
$
|
108,983
|
|
||||
Sales in the table above represent the recorded investment of loans held for investment that were transferred to loans held for sale and subsequently sold to a third party during the respective period. Corporate loan sales generally occur as part of a loan workout situation.
129
RAYMOND JAMES FINANCIAL, INC AND SUBSIDIARIES
Notes to Consolidated Financial Statements
Aging analysis of loans held for investment
The following table presents an analysis of the payment status of loans held for investment:
|
$ in thousands
|
30-89
days and accruing
|
90 days
or more and accruing
|
Total
past due and accruing
|
Nonaccrual
(1)
|
Current and accruing
|
Total loans held for
investment
(2)
|
||||||||||||||||||
|
As of September 30, 2017:
|
|
|
|
|
|
|||||||||||||||||||
|
C&I loans
|
$
|
—
|
|
$
|
—
|
|
$
|
—
|
|
$
|
5,221
|
|
$
|
7,380,689
|
|
$
|
7,385,910
|
|
||||||
|
CRE construction loans
|
—
|
|
—
|
|
—
|
|
—
|
|
112,681
|
|
112,681
|
|
||||||||||||
|
CRE loans
|
—
|
|
—
|
|
—
|
|
—
|
|
3,106,290
|
|
3,106,290
|
|
||||||||||||
|
Tax-exempt loans
|
—
|
|
—
|
|
—
|
|
—
|
|
1,017,791
|
|
1,017,791
|
|
||||||||||||
|
Residential mortgage loans:
|
|
|
|
|
|
|
|
|
|
|
||||||||||||||
|
First mortgage loans
|
1,853
|
|
—
|
|
1,853
|
|
33,718
|
|
3,086,701
|
|
3,122,272
|
|
||||||||||||
|
Home equity loans/lines
|
248
|
|
—
|
|
248
|
|
31
|
|
26,179
|
|
26,458
|
|
||||||||||||
|
SBL
|
—
|
|
—
|
|
—
|
|
—
|
|
2,386,697
|
|
2,386,697
|
|
||||||||||||
|
Total loans held for investment, net
|
$
|
2,101
|
|
$
|
—
|
|
$
|
2,101
|
|
$
|
38,970
|
|
$
|
17,117,028
|
|
$
|
17,158,099
|
|
||||||
|
As of September 30, 2016:
|
|
|
|
|
|
|||||||||||||||||||
|
C&I loans
|
$
|
—
|
|
$
|
—
|
|
$
|
—
|
|
$
|
35,194
|
|
$
|
7,435,179
|
|
$
|
7,470,373
|
|
||||||
|
CRE construction loans
|
—
|
|
—
|
|
—
|
|
—
|
|
122,718
|
|
122,718
|
|
||||||||||||
|
CRE loans
|
—
|
|
—
|
|
—
|
|
4,230
|
|
2,549,841
|
|
2,554,071
|
|
||||||||||||
|
Tax-exempt loans
|
—
|
|
—
|
|
—
|
|
—
|
|
740,944
|
|
740,944
|
|
||||||||||||
|
Residential mortgage loans:
|
|
|
|
|||||||||||||||||||||
|
First mortgage loans
|
1,766
|
|
—
|
|
1,766
|
|
41,746
|
|
2,377,357
|
|
2,420,869
|
|
||||||||||||
|
Home equity loans/lines
|
—
|
|
—
|
|
—
|
|
37
|
|
20,663
|
|
20,700
|
|
||||||||||||
|
SBL
|
—
|
|
—
|
|
—
|
|
—
|
|
1,904,827
|
|
1,904,827
|
|
||||||||||||
|
Total loans held for investment, net
|
$
|
1,766
|
|
$
|
—
|
|
$
|
1,766
|
|
$
|
81,207
|
|
$
|
15,151,529
|
|
$
|
15,234,502
|
|
||||||
|
(1)
|
Includes
$18 million
and
$54 million
of nonaccrual loans at
September 30, 2017
and
2016
, respectively, which are performing pursuant to their contractual terms.
|
|
(2)
|
Excludes any net unearned income and deferred expenses.
|
Other real estate owned, included in “Other assets” on our Consolidated Statements of Financial Condition was
$5 million
at both
September 30, 2017
and
September 30, 2016
. The recorded investment in mortgage loans secured by one-to-four family residential properties for which formal foreclosure proceedings were in process was
$18 million
and
$21 million
at
September 30, 2017
and
2016
, respectively.
130
RAYMOND JAMES FINANCIAL, INC AND SUBSIDIARIES
Notes to Consolidated Financial Statements
Impaired loans and troubled debt restructurings
The following table provides a summary of
RJ Bank
’s impaired loans:
|
September 30,
|
||||||||||||||||||||||||
|
|
2017
|
2016
|
||||||||||||||||||||||
|
$ in thousands
|
Gross
recorded
investment
|
Unpaid
principal
balance
|
Allowance
for losses
|
Gross
recorded
investment
|
Unpaid
principal
balance
|
Allowance
for losses
|
||||||||||||||||||
|
Impaired loans with allowance for loan losses:
(1)
|
|
|
|
|
|
|||||||||||||||||||
|
C&I loans
|
$
|
5,221
|
|
$
|
6,160
|
|
$
|
1,963
|
|
$
|
35,194
|
|
$
|
35,872
|
|
$
|
13,351
|
|
||||||
|
Residential - first mortgage loans
|
23,977
|
|
31,100
|
|
2,504
|
|
30,393
|
|
41,337
|
|
3,147
|
|
||||||||||||
|
Total
|
29,198
|
|
37,260
|
|
4,467
|
|
65,587
|
|
77,209
|
|
16,498
|
|
||||||||||||
|
Impaired loans without allowance for loan losses:
(2)
|
|
|
|
|
|
|
|
|
|
|
||||||||||||||
|
CRE loans
|
—
|
|
—
|
|
—
|
|
4,230
|
|
11,611
|
|
—
|
|
||||||||||||
|
Residential - first mortgage loans
|
16,737
|
|
24,899
|
|
—
|
|
17,809
|
|
26,486
|
|
—
|
|
||||||||||||
|
Total
|
16,737
|
|
24,899
|
|
—
|
|
22,039
|
|
38,097
|
|
—
|
|
||||||||||||
|
Total impaired loans
|
$
|
45,935
|
|
$
|
62,159
|
|
$
|
4,467
|
|
$
|
87,626
|
|
$
|
115,306
|
|
$
|
16,498
|
|
||||||
|
(1)
|
Impaired loan balances have had reserves established based upon management’s analysis.
|
|
(2)
|
When the discounted cash flow, collateral value or market value equals or exceeds the carrying value of the loan, then the loan does not require an allowance. These are generally loans in process of foreclosure that have already been adjusted to fair value.
|
The preceding table includes
$27 million
of residential first mortgage
TDR
’s at
September 30, 2017
, and
$4 million
CRE
and
$28 million
residential first mortgage
TDR
’s at
September 30, 2016
.
The average balance of the total impaired loans and the related interest income recognized in the Consolidated Statements of Income and Comprehensive Income are as follows:
|
|
Year ended September 30,
|
|||||||||||
|
$ in thousands
|
2017
|
2016
|
2015
|
|||||||||
|
Average impaired loan balance:
|
|
|
||||||||||
|
C&I loans
|
$
|
17,540
|
|
$
|
18,112
|
|
$
|
11,311
|
|
|||
|
CRE loans
|
694
|
|
4,474
|
|
14,694
|
|
||||||
|
Residential - first mortgage loans
|
43,845
|
|
51,554
|
|
59,049
|
|
||||||
|
Total
|
$
|
62,079
|
|
$
|
74,140
|
|
$
|
85,054
|
|
|||
|
Interest income recognized:
|
|
|
|
|
|
|
||||||
|
Residential - first mortgage loans
|
$
|
1,253
|
|
$
|
1,413
|
|
$
|
1,426
|
|
|||
|
Total
|
$
|
1,253
|
|
$
|
1,413
|
|
$
|
1,426
|
|
|||
Credit quality indicators
The credit quality of
RJ Bank
’s loan portfolio is summarized monthly by management using the standard asset classification system utilized by bank regulators for the
SBL
and residential mortgage loan portfolios and internal risk ratings, which correspond to the same standard asset classifications for the corporate loan portfolios. These classifications are divided into three groups: Not Classified (Pass), Special Mention, and Classified or Adverse Rating (Substandard, Doubtful and Loss). These terms are defined as follows:
Pass
– Loans which are well protected by the current net worth and paying capacity of the obligor (or guarantors, if any) or by the fair value, less costs to acquire and sell, of any underlying collateral in a timely manner.
Special Mention
– Loans which have potential weaknesses that deserve management’s close attention. These loans are not adversely classified and do not expose
RJ Bank
to sufficient risk to warrant an adverse classification.
Substandard
– Loans which are inadequately protected by the current sound worth and paying capacity of the obligor or by the collateral pledged, if any. Loans with this classification are characterized by the distinct possibility that
RJ Bank
will sustain some loss if the deficiencies are not corrected.
131
RAYMOND JAMES FINANCIAL, INC AND SUBSIDIARIES
Notes to Consolidated Financial Statements
Doubtful
– Loans which have all the weaknesses inherent in loans classified as substandard with the added characteristic that the weaknesses make collection or liquidation in full highly questionable and improbable on the basis of currently-known facts, conditions and values.
Loss
– Loans which are considered by management to be uncollectible and of such little value that their continuance on
RJ Bank
’s books as an asset, without establishment of a specific valuation allowance or charge-off, is not warranted.
RJ Bank
does not have any loan balances within this classification because, in accordance with its accounting policy, loans, or a portion thereof considered to be uncollectible, are charged-off prior to the assignment of this classification.
The credit quality of
RJ Bank
’s held for investment loan portfolio was as follows:
|
$ in thousands
|
Pass
|
Special mention
|
Substandard
|
Doubtful
|
Total
|
|||||||||||||||
|
September 30, 2017
|
||||||||||||||||||||
|
C&I
|
$
|
7,232,777
|
|
$
|
63,964
|
|
$
|
89,169
|
|
$
|
—
|
|
$
|
7,385,910
|
|
|||||
|
CRE construction
|
112,681
|
|
—
|
|
—
|
|
—
|
|
112,681
|
|
||||||||||
|
CRE
|
3,048,847
|
|
57,315
|
|
128
|
|
—
|
|
3,106,290
|
|
||||||||||
|
Tax-exempt
|
1,017,791
|
|
—
|
|
—
|
|
—
|
|
1,017,791
|
|
||||||||||
|
Residential mortgage:
|
|
|||||||||||||||||||
|
First mortgage
|
3,068,290
|
|
8,467
|
|
45,515
|
|
—
|
|
3,122,272
|
|
||||||||||
|
Home equity
|
26,352
|
|
75
|
|
31
|
|
—
|
|
26,458
|
|
||||||||||
|
SBL
|
2,386,697
|
|
—
|
|
—
|
|
—
|
|
2,386,697
|
|
||||||||||
|
Total
|
$
|
16,893,435
|
|
$
|
129,821
|
|
$
|
134,843
|
|
$
|
—
|
|
$
|
17,158,099
|
|
|||||
|
September 30, 2016
|
||||||||||||||||||||
|
C&I
|
$
|
7,241,055
|
|
$
|
117,046
|
|
$
|
112,272
|
|
$
|
—
|
|
$
|
7,470,373
|
|
|||||
|
CRE construction
|
122,718
|
|
—
|
|
—
|
|
—
|
|
122,718
|
|
||||||||||
|
CRE
|
2,549,672
|
|
—
|
|
4,399
|
|
—
|
|
2,554,071
|
|
||||||||||
|
Tax-exempt
|
740,944
|
|
—
|
|
—
|
|
—
|
|
740,944
|
|
||||||||||
|
Residential mortgage:
|
|
|||||||||||||||||||
|
First mortgage
|
2,355,393
|
|
11,349
|
|
54,127
|
|
—
|
|
2,420,869
|
|
||||||||||
|
Home equity
|
20,413
|
|
182
|
|
105
|
|
—
|
|
20,700
|
|
||||||||||
|
SBL
|
1,904,827
|
|
—
|
|
—
|
|
—
|
|
1,904,827
|
|
||||||||||
|
Total
|
$
|
14,935,022
|
|
$
|
128,577
|
|
$
|
170,903
|
|
$
|
—
|
|
$
|
15,234,502
|
|
|||||
Loans classified as special mention, substandard or doubtful are all considered to be “criticized” loans.
The credit quality of
RJ Bank
’s performing residential first mortgage loan portfolio is additionally assessed utilizing updated
LTV
ratios. Current
LTV
s are updated using the most recently available information (generally updated every six months) and are estimated based on the initial appraisal obtained at the time of origination, adjusted using relevant market indices for housing price changes that have occurred since origination. The value of the homes could vary from actual market values due to changes in the condition of the underlying property, variations in housing price changes within current valuation indices, and other factors. Residential mortgage loans with estimated
LTV
s in excess of 100% represent less than
1%
of the residential mortgage loan portfolio.
132
RAYMOND JAMES FINANCIAL, INC AND SUBSIDIARIES
Notes to Consolidated Financial Statements
Allowance for loan losses and reserve for unfunded lending commitments
Changes in the allowance for loan losses of
RJ Bank
by portfolio segment are as follows:
|
|
Loans held for investment
|
|||||||||||||||||||||||||||
|
$ in thousands
|
C&I
|
CRE
construction
|
CRE
|
Tax-exempt
|
Residential
mortgage
|
SBL
|
Total
|
|||||||||||||||||||||
|
Year ended September 30, 2017
|
|
|
|
|
|
|
|
|
|
|
|
|
||||||||||||||||
|
Balance at beginning of year
|
$
|
137,701
|
|
$
|
1,614
|
|
$
|
36,533
|
|
$
|
4,100
|
|
$
|
12,664
|
|
$
|
4,766
|
|
$
|
197,378
|
|
|||||||
|
Provision/(benefit) for loan losses
|
7,502
|
|
(101
|
)
|
(172
|
)
|
2,281
|
|
3,944
|
|
(467
|
)
|
12,987
|
|
||||||||||||||
|
Net (charge-offs)/recoveries:
|
|
|
|
|
|
|
|
|
|
|
|
|
||||||||||||||||
|
Charge-offs
|
(26,088
|
)
|
—
|
|
—
|
|
—
|
|
(918
|
)
|
—
|
|
(27,006
|
)
|
||||||||||||||
|
Recoveries
|
340
|
|
—
|
|
5,013
|
|
—
|
|
1,001
|
|
—
|
|
6,354
|
|
||||||||||||||
|
Net (charge-offs)/recoveries
|
(25,748
|
)
|
—
|
|
5,013
|
|
—
|
|
83
|
|
—
|
|
(20,652
|
)
|
||||||||||||||
|
Foreign exchange translation adjustment
|
446
|
|
(92
|
)
|
375
|
|
—
|
|
—
|
|
—
|
|
729
|
|
||||||||||||||
|
Balance at end of year
|
$
|
119,901
|
|
$
|
1,421
|
|
$
|
41,749
|
|
$
|
6,381
|
|
$
|
16,691
|
|
$
|
4,299
|
|
$
|
190,442
|
|
|||||||
|
Year ended September 30, 2016
|
|
|
|
|
|
|
|
|
|
|
|
|
||||||||||||||||
|
Balance at beginning of year
|
$
|
117,623
|
|
$
|
2,707
|
|
$
|
30,486
|
|
$
|
5,949
|
|
$
|
12,526
|
|
$
|
2,966
|
|
$
|
172,257
|
|
|||||||
|
Provision/(benefit) for loan losses
|
23,051
|
|
(1,023
|
)
|
5,997
|
|
(1,849
|
)
|
191
|
|
1,800
|
|
28,167
|
|
||||||||||||||
|
Net (charge-offs)/recoveries:
|
|
|
|
|
|
|
|
|
|
|
||||||||||||||||||
|
Charge-offs
|
(2,956
|
)
|
—
|
|
—
|
|
—
|
|
(1,470
|
)
|
—
|
|
(4,426
|
)
|
||||||||||||||
|
Recoveries
|
—
|
|
—
|
|
—
|
|
—
|
|
1,417
|
|
—
|
|
1,417
|
|
||||||||||||||
|
Net (charge-offs)/recoveries
|
(2,956
|
)
|
—
|
|
—
|
|
—
|
|
(53
|
)
|
—
|
|
(3,009
|
)
|
||||||||||||||
|
Foreign exchange translation adjustment
|
(17
|
)
|
(70
|
)
|
50
|
|
—
|
|
—
|
|
—
|
|
(37
|
)
|
||||||||||||||
|
Balance at end of year
|
$
|
137,701
|
|
$
|
1,614
|
|
$
|
36,533
|
|
$
|
4,100
|
|
$
|
12,664
|
|
$
|
4,766
|
|
$
|
197,378
|
|
|||||||
|
Year ended September 30, 2015
|
|
|
|
|
|
|
|
|
|
|
|
|
||||||||||||||||
|
Balance at beginning of year
|
$
|
103,179
|
|
$
|
1,594
|
|
$
|
25,022
|
|
$
|
1,380
|
|
$
|
14,350
|
|
$
|
2,049
|
|
$
|
147,574
|
|
|||||||
|
Provision/(benefit) for loan losses
|
16,091
|
|
1,176
|
|
2,205
|
|
4,569
|
|
(1,388
|
)
|
917
|
|
23,570
|
|
||||||||||||||
|
Net (charge-offs)/recoveries:
|
|
|
|
|
|
|
|
|
|
|
||||||||||||||||||
|
Charge-offs
|
(1,191
|
)
|
—
|
|
—
|
|
—
|
|
(1,667
|
)
|
—
|
|
(2,858
|
)
|
||||||||||||||
|
Recoveries
|
611
|
|
—
|
|
3,773
|
|
—
|
|
1,231
|
|
—
|
|
5,615
|
|
||||||||||||||
|
Net (charge-offs)/recoveries
|
(580
|
)
|
—
|
|
3,773
|
|
—
|
|
(436
|
)
|
—
|
|
2,757
|
|
||||||||||||||
|
Foreign exchange translation adjustment
|
(1,067
|
)
|
|
(63
|
)
|
|
(514
|
)
|
|
—
|
|
—
|
|
—
|
|
(1,644
|
)
|
|||||||||||
|
Balance at end of year
|
$
|
117,623
|
|
$
|
2,707
|
|
$
|
30,486
|
|
$
|
5,949
|
|
$
|
12,526
|
|
$
|
2,966
|
|
$
|
172,257
|
|
|||||||
133
RAYMOND JAMES FINANCIAL, INC AND SUBSIDIARIES
Notes to Consolidated Financial Statements
The following table presents, by loan portfolio segment,
RJ Bank
’s recorded investment (excluding any net unearned income and deferred expenses) and the related allowance for loan losses.
|
Loans held for investment
|
||||||||||||||||||||||||
|
Allowance for loan losses
|
Recorded investment
|
|||||||||||||||||||||||
|
$ in thousands
|
Individually evaluated for impairment
|
Collectively evaluated for impairment
|
Total
|
Individually evaluated for impairment
|
Collectively evaluated for impairment
|
Total
|
||||||||||||||||||
|
September 30, 2017
|
||||||||||||||||||||||||
|
C&I
|
$
|
1,963
|
|
$
|
117,938
|
|
$
|
119,901
|
|
$
|
5,221
|
|
$
|
7,380,689
|
|
$
|
7,385,910
|
|
||||||
|
CRE construction
|
—
|
|
1,421
|
|
1,421
|
|
—
|
|
112,681
|
|
112,681
|
|
||||||||||||
|
CRE
|
—
|
|
41,749
|
|
41,749
|
|
—
|
|
3,106,290
|
|
3,106,290
|
|
||||||||||||
|
Tax-exempt
|
—
|
|
6,381
|
|
6,381
|
|
—
|
|
1,017,791
|
|
1,017,791
|
|
||||||||||||
|
Residential mortgage
|
2,506
|
|
14,185
|
|
16,691
|
|
47,368
|
|
3,101,362
|
|
3,148,730
|
|
||||||||||||
|
SBL
|
—
|
|
4,299
|
|
4,299
|
|
—
|
|
2,386,697
|
|
2,386,697
|
|
||||||||||||
|
Total
|
$
|
4,469
|
|
$
|
185,973
|
|
$
|
190,442
|
|
$
|
52,589
|
|
$
|
17,105,510
|
|
$
|
17,158,099
|
|
||||||
|
September 30, 2016
|
||||||||||||||||||||||||
|
C&I
|
$
|
13,351
|
|
$
|
124,350
|
|
$
|
137,701
|
|
$
|
35,194
|
|
$
|
7,435,179
|
|
$
|
7,470,373
|
|
||||||
|
CRE construction
|
—
|
|
1,614
|
|
1,614
|
|
—
|
|
122,718
|
|
122,718
|
|
||||||||||||
|
CRE
|
—
|
|
36,533
|
|
36,533
|
|
4,230
|
|
2,549,841
|
|
2,554,071
|
|
||||||||||||
|
Tax-exempt
|
—
|
|
4,100
|
|
4,100
|
|
—
|
|
740,944
|
|
740,944
|
|
||||||||||||
|
Residential mortgage
|
3,156
|
|
9,508
|
|
12,664
|
|
56,735
|
|
2,384,834
|
|
2,441,569
|
|
||||||||||||
|
SBL
|
—
|
|
4,766
|
|
4,766
|
|
—
|
|
1,904,827
|
|
1,904,827
|
|
||||||||||||
|
Total
|
$
|
16,507
|
|
$
|
180,871
|
|
$
|
197,378
|
|
$
|
96,159
|
|
$
|
15,138,343
|
|
$
|
15,234,502
|
|
||||||
The reserve for unfunded lending commitments, included in “Other payables” on our Consolidated Statements of Financial Condition, was
$11 million
at both
September 30, 2017
and
2016
.
The following table details the components of Other assets:
|
September 30,
|
||||||||
|
$ in thousands
|
2017
|
2016
|
||||||
|
Investments in company-owned life insurance
|
$
|
504,108
|
|
$
|
417,137
|
|
||
|
Prepaid expenses
|
96,059
|
|
91,129
|
|
||||
|
Investment in FHLB stock
|
52,187
|
|
38,813
|
|
||||
|
Indemnification asset
|
26,160
|
|
35,325
|
|
||||
|
Investment in FRB stock
|
24,706
|
|
24,706
|
|
||||
|
Prepaid compensation arising from 3Macs acquisition
|
17,276
|
|
24,285
|
|
||||
|
Guaranteed LIHTC Fund financing asset
|
15,786
|
|
20,543
|
|
||||
|
Prepaid compensation associated with DBRSU awards
|
9,899
|
|
15,170
|
|
||||
|
All other
|
34,244
|
|
51,727
|
|
||||
|
Total other assets
|
$
|
780,425
|
|
$
|
718,835
|
|
||
As of
September 30, 2017
, the cumulative face value of our company-owned life insurance
(“COLI”)
policies was
$1.87 billion
.
Our indemnification asset pertains to legal matters for which Regions (as hereinafter defined) has indemnified
RJF
in connection with our acquisition of Morgan Keegan. The liabilities related to such matters were included in “Other payables” on our Consolidated Statements of Financial Condition. See Note
17
for additional information.
As part of our 2016 acquisition of 3Macs, a portion of the amount paid to selling shareholders who became continuing employees as of the closing date was treated as a prepaid compensation asset as the shareholders may be required to repay such amounts if they leave 3Macs during the
five
year period after the closing date, depending on the circumstances of their departure. This prepaid asset is being amortized as compensation expense over the
five
-year post-combination period.
134
RAYMOND JAMES FINANCIAL, INC AND SUBSIDIARIES
Notes to Consolidated Financial Statements
In fiscal year 2010, we sold an investment in a low-income housing tax credit fund and we guaranteed the return on investment to one of the purchasers. As a result of selling this investment and providing a guaranteed return to its buyer, we are the primary beneficiary of the fund that was sold (see
Note 10
for further information) and we accounted for this sale as a financing transaction. We continue to account for the asset transferred to the purchaser and maintain a related liability corresponding to our obligations under the guarantee. As the benefits are delivered to the purchaser of the investment, this financing asset and the related liability decrease. A related financing liability in the amount of
$16 million
and
$21 million
was included in “Other payables” on our Consolidated Statements of Financial Condition as of
September 30, 2017
and
2016
, respectively. See
Note 17
for additional information.
See
Note 20
for further information about prepaid compensation associated with the DBRSU awards that were assumed as part of our 2016 acquisition of Alex. Brown.
A
VIE
requires consolidation by the entity’s primary beneficiary. We evaluate all of the entities in which we are involved to determine if the entity is a
VIE
and if so, whether we hold a variable interest and are the primary beneficiary. See the “Evaluation of
VIE
s to determine whether consolidation is required” section of
Note 2
for a discussion of our principal involvement with the
VIE
s and the accounting policies regarding determination of whether we are deemed to be the primary beneficiary of
VIE
s.
VIEs where we are the primary beneficiary
Of the
VIE
s in which we hold an interest, we have determined that certain Private Equity Interests, a
LIHTC
Fund in which
RJ Bank
is an investor and an affiliate of
RJTCF
is the managing member, any
LIHTC
Funds where
RJTCF
provides an investor member with a guaranteed return on their investment, certain other
LIHTC
funds and the Restricted Stock Trust Fund require consolidation in our financial statements, as we are deemed the primary beneficiary of such
VIE
s. The aggregate assets and liabilities of the
VIE
s we consolidate are provided in the table below. Aggregate assets and aggregate liabilities may differ from the consolidated carrying value of assets and liabilities due to the elimination of intercompany assets and liabilities held by the consolidated
VIE
.
|
$ in thousands
|
Aggregate
assets
|
Aggregate
liabilities
|
||||||
|
September 30, 2017
|
|
|
||||||
|
Private Equity Interests
|
$
|
104,414
|
|
$
|
3,851
|
|
||
|
LIHTC Fund in which RJ Bank is an investor member
|
57,719
|
|
1,055
|
|
||||
|
Guaranteed LIHTC Fund
|
51,400
|
|
2,872
|
|
||||
|
Other LIHTC Funds
|
7,418
|
|
2,544
|
|
||||
|
Restricted Stock Trust Fund
|
12,122
|
|
12,122
|
|
||||
|
Total
|
$
|
233,073
|
|
$
|
22,444
|
|
||
|
September 30, 2016
|
|
|
|
|
||||
|
Private Equity Interests
|
$
|
140,870
|
|
$
|
4,888
|
|
||
|
LIHTC Fund in which RJ Bank is an investor member
|
55,550
|
|
240
|
|
||||
|
Guaranteed LIHTC Fund
|
63,415
|
|
2,556
|
|
||||
|
Restricted Stock Trust Fund
|
9,949
|
|
9,949
|
|
||||
|
Total
|
$
|
269,784
|
|
$
|
17,633
|
|
||
In connection with the Guaranteed
LIHTC
Fund,
RJTCF
has provided
one
investor member with a guaranteed return on their investment in the fund. See
Note 9
for information regarding the financing asset associated with this fund and
Note 17
for additional information regarding this commitment.
135
RAYMOND JAMES FINANCIAL, INC AND SUBSIDIARIES
Notes to Consolidated Financial Statements
The following table presents information about the carrying value of the assets, liabilities and equity of the
VIE
s which we consolidate and which are included within our Consolidated Statements of Financial Condition. The noncontrolling interests presented in this table represent the portion of these net assets which are not ours.
|
September 30,
|
||||||||
|
$ in thousands
|
2017
|
2016
|
||||||
|
Assets:
|
|
|
||||||
|
Cash and cash equivalents
|
$
|
2,052
|
|
$
|
8,302
|
|
||
|
Assets segregated pursuant to regulations and other segregated assets
|
4,590
|
|
2,833
|
|
||||
|
Other receivables
|
168
|
|
28,463
|
|
||||
|
Intercompany receivables
|
454
|
|
475
|
|
||||
|
Other investments
|
101,905
|
|
103,630
|
|
||||
|
Investments in real estate partnerships held by consolidated variable interest entities
|
111,743
|
|
116,133
|
|
||||
|
Trust fund investment in RJF common stock
|
12,120
|
|
9,948
|
|
||||
|
Other assets
|
41
|
|
—
|
|
||||
|
Total assets
|
$
|
233,073
|
|
$
|
269,784
|
|
||
|
Liabilities and equity:
|
|
|
|
|
||||
|
Other payables
|
$
|
9,667
|
|
$
|
3,617
|
|
||
|
Intercompany payables
|
16,520
|
|
16,416
|
|
||||
|
Total liabilities
|
26,187
|
|
20,033
|
|
||||
|
RJF equity
|
101,445
|
|
117,023
|
|
||||
|
Noncontrolling interests
|
105,441
|
|
132,728
|
|
||||
|
Total equity
|
206,886
|
|
249,751
|
|
||||
|
Total liabilities and equity
|
$
|
233,073
|
|
$
|
269,784
|
|
||
The trust fund investment in
RJF
common stock in the table above is the Restricted Stock Trust Fund, which is included in “Treasury stock” in our Consolidated Statements of Financial Condition.
VIE
s where we hold a variable interest but are not the primary beneficiary
As discussed in
Note 2
, we have concluded that for certain
VIE
s we are not the primary beneficiary and therefore do not consolidate these
VIE
s. Such
VIE
s include certain Private Equity Interests, certain
LIHTC
funds,
NMTC Funds
and other limited partnerships. Our risk of loss for these
VIE
s is limited to our investments in, advances to, and/or receivables due from these
VIE
s.
Aggregate assets, liabilities and risk of loss
The aggregate assets, liabilities, and our exposure to loss from those
VIE
s in which we hold a variable interest, but as to which we have concluded we are not the primary beneficiary, are provided in the table below.
|
September 30,
|
||||||||||||||||||||||||
|
$ in thousands
|
2017
|
2016
|
||||||||||||||||||||||
|
|
Aggregate
assets
|
Aggregate
liabilities
|
Our risk
of loss
|
Aggregate
assets
|
Aggregate
liabilities
|
Our risk
of loss
|
||||||||||||||||||
|
LIHTC Funds
|
$
|
5,372,367
|
|
$
|
2,134,600
|
|
$
|
60,959
|
|
$
|
4,217,812
|
|
$
|
1,429,085
|
|
$
|
83,562
|
|
||||||
|
NMTC Funds
|
30,297
|
|
105
|
|
9
|
|
65,338
|
|
68
|
|
12
|
|
||||||||||||
|
Private Equity Interests
|
10,485,611
|
|
174,354
|
|
73,457
|
|
14,286,950
|
|
132,334
|
|
70,336
|
|
||||||||||||
|
Other
|
169,462
|
|
88,615
|
|
3,163
|
|
144,579
|
|
83,174
|
|
2,240
|
|
||||||||||||
|
Total
|
$
|
16,057,737
|
|
$
|
2,397,674
|
|
$
|
137,588
|
|
$
|
18,714,679
|
|
$
|
1,644,661
|
|
$
|
156,150
|
|
||||||
136
RAYMOND JAMES FINANCIAL, INC AND SUBSIDIARIES
Notes to Consolidated Financial Statements
|
September 30,
|
||||||||
|
$ in thousands
|
2017
|
2016
|
||||||
|
Land
|
$
|
29,079
|
|
$
|
24,150
|
|
||
|
Software, including development in progress
|
345,734
|
|
271,864
|
|
||||
|
Buildings, leasehold and land improvements
|
324,452
|
|
260,800
|
|
||||
|
Furniture, fixtures and equipment
|
224,418
|
|
200,947
|
|
||||
|
Construction in process
|
12,056
|
|
3,711
|
|
||||
|
Total property and equipment
|
935,739
|
|
761,472
|
|
||||
|
Less: Accumulated depreciation
|
(498,365
|
)
|
(440,015
|
)
|
||||
|
Total property and equipment, net
|
$
|
437,374
|
|
$
|
321,457
|
|
||
The following are our goodwill and identifiable intangible asset balances as of the dates indicated:
|
September 30,
|
||||||||
|
$ in thousands
|
2017
|
2016
|
||||||
|
Goodwill
|
$
|
410,723
|
|
$
|
408,072
|
|
||
|
Identifiable intangible assets, net
|
82,460
|
|
94,974
|
|
||||
|
Total goodwill and identifiable intangible assets, net
|
$
|
493,183
|
|
$
|
503,046
|
|
||
Goodwill
The following summarizes our goodwill by segment, along with the balance and activity for the years indicated:
|
Segment
|
||||||||||||
|
$ in thousands
|
Private Client Group
|
Capital Markets
|
Total
|
|||||||||
|
Fiscal Year 2017
|
||||||||||||
|
Goodwill beginning of year
|
$
|
275,521
|
|
$
|
132,551
|
|
$
|
408,072
|
|
|||
|
Additions
|
—
|
|
—
|
|
—
|
|
||||||
|
Foreign currency translation
|
1,192
|
|
1,459
|
|
2,651
|
|
||||||
|
Goodwill end of year
|
$
|
276,713
|
|
$
|
134,010
|
|
$
|
410,723
|
|
|||
|
Fiscal Year 2016
|
||||||||||||
|
Goodwill beginning of year
|
$
|
186,733
|
|
$
|
120,902
|
|
$
|
307,635
|
|
|||
|
Additions
|
86,351
|
|
9,012
|
|
95,363
|
|
||||||
|
Foreign currency translation
|
2,437
|
|
2,637
|
|
5,074
|
|
||||||
|
Goodwill end of year
|
$
|
275,521
|
|
$
|
132,551
|
|
$
|
408,072
|
|
|||
During fiscal year 2017, there were
no
additions to goodwill. The Private Client Group segment goodwill additions in fiscal year 2016 were attributable to our acquisitions of Alex. Brown in the amount of
$82 million
and 3Macs in the amount of
$5 million
. The addition to goodwill associated with Alex. Brown is deductible for tax purposes over
15
years. The addition to goodwill attributable to 3Macs is not deductible for tax purposes. The Capital Markets segment goodwill addition in fiscal year 2016 was attributable to our acquisition of Mummert. This goodwill is not deductible for tax purposes. See Note
3
for additional information regarding our acquisitions.
As described in
Note 2
, we perform goodwill testing on an annual basis or when an event occurs or circumstances change that would more likely than not reduce the fair value of a reporting unit below its carrying value. During the
year ended September 30, 2017
, we changed our annual goodwill impairment test date for all reporting units from December 31 to January 1; however, the results of our test did not change as we continue to evaluate balances as of December 31. We performed our latest annual goodwill impairment testing during the quarter ended March 31, 2017, evaluating balances as of December 31, 2016, and
no
impairment was identified. In that testing, we performed both a qualitative impairment assessment for certain of our reporting units and a quantitative impairment assessment for our
two
RJ Ltd.
reporting units operating in Canada.
137
RAYMOND JAMES FINANCIAL, INC AND SUBSIDIARIES
Notes to Consolidated Financial Statements
We assign goodwill to reporting units. Our reporting units include: a domestic Private Client Group (
RJ&A
domestic retail brokerage operations and our subsidiary The Producers Choice LLC (“TPC”)) and a Canadian Private Client Group (
RJ Ltd.
Private Client Group), each included in our Private Client Group segment; and
RJ&A
Fixed Income, U.S. Managed Equity Capital Markets, and
RJ Ltd.
Capital Markets, each included in our Capital Markets segment.
Qualitative Assessments
For each reporting unit on which we performed a qualitative assessment, we determined whether it was more likely than not that the carrying value of the reporting unit, including the recorded goodwill, was in excess of the fair value of the reporting unit. In any instance in which we are unable to qualitatively conclude that it is more likely than not that the fair value of the reporting unit exceeds the reporting unit carrying value including goodwill, a quantitative analysis of the fair value of the reporting unit would be performed. Based upon the outcome of our qualitative assessments, we determined that no quantitative analysis of the fair value of any of the reporting units we elected to qualitatively analyze was required, and we concluded that none of the goodwill allocated to any of those reporting units was impaired. No events have occurred since our assessment that would cause us to update this impairment testing.
Quantitative Assessments
For our
two
RJ Ltd.
reporting units, we elected not to perform a qualitative assessment and instead performed quantitative assessments of the equity value of each
RJ Ltd.
reporting unit that had an allocation of goodwill. In our determination of the reporting unit fair value of equity, we used a combination of the income approach and the market approach. Under the income approach, we used discounted cash flow models applied to each respective reporting unit. Under the market approach, we calculated an estimated fair value based on a combination of multiples of earnings of guideline companies in the brokerage and capital markets industry that are publicly traded on organized exchanges, and the book value of comparable transactions. The estimated fair value of the equity of the reporting unit resulting from each of these valuation approaches was dependent upon the estimates of future business unit revenues and costs. Such estimates were subject to critical assumptions regarding the nature and health of financial markets in future years as well as the discount rate to apply to the projected future cash flows. In estimating future cash flows, a balance sheet as of December 31, 2016 and a statement of operations for the last twelve months of activity for each reporting unit were compiled. Future balance sheets and statements of operations were then projected, and estimated future cash flows were determined by the combination of these projections. The cash flows were discounted at the reporting unit’s estimated cost of equity, which was derived through application of the capital asset pricing model. The valuation result from the market approach was dependent upon the selection of the comparable guideline companies and transactions and the earnings multiple applied to each respective reporting unit’s projected earnings. Finally, significant management judgment was applied in determining the weight assigned to the outcome of the market approach and the income approach, which resulted in one single estimate of the fair value of the equity of the reporting unit.
The following summarizes certain key assumptions utilized in our quantitative analysis:
|
Key assumptions
|
|||||||||||||||||
|
Weight assigned to the outcome of:
|
|||||||||||||||||
|
Segment
|
Reporting unit
|
Goodwill as of December 31, 2016
(in thousands)
|
Discount rate used in the income approach
|
Multiple applied to revenue/EPS in the market approach
|
Income approach
|
Market approach
|
|||||||||||
|
Private Client Group:
|
RJ Ltd. Private Client Group
|
$
|
22,735
|
|
14.5
|
%
|
1.2x/12.9x
|
75
|
%
|
25
|
%
|
||||||
|
Capital Markets:
|
RJ Ltd. Capital Markets
|
$
|
18,997
|
|
14.5
|
%
|
1.2x/13.3x
|
75
|
%
|
25
|
%
|
||||||
The assumptions and estimates utilized in determining the fair value of reporting unit equity are sensitive to changes, including, but not limited to, a decline in overall market conditions, adverse business trends and changes in the regulations.
Based upon the outcome of our quantitative assessments, we concluded that none of the goodwill associated with our
two
RJ Ltd. reporting units was impaired.
No events have occurred since our quantitative assessments during the quarter ended March 31, 2017 that would cause us to update this impairment testing.
138
RAYMOND JAMES FINANCIAL, INC AND SUBSIDIARIES
Notes to Consolidated Financial Statements
Identifiable intangible assets, net
The following table sets forth our identifiable intangible asset balances by segment, net of accumulated amortization, and activity for the years indicated:
|
Segment
|
||||||||||||||||
|
$ in thousands
|
Private Client Group
|
Capital Markets
|
Asset Management
|
Total
|
||||||||||||
|
Fiscal Year 2017
|
||||||||||||||||
|
Net identifiable intangible assets beginning of year
|
$
|
52,936
|
|
$
|
27,937
|
|
$
|
14,101
|
|
$
|
94,974
|
|
||||
|
Amortization expense
|
(6,001
|
)
|
(4,845
|
)
|
(2,004
|
)
|
(12,850
|
)
|
||||||||
|
Foreign currency translation
|
91
|
|
(15
|
)
|
260
|
|
336
|
|
||||||||
|
Net identifiable intangible assets end of year
|
$
|
47,026
|
|
$
|
23,077
|
|
$
|
12,357
|
|
$
|
82,460
|
|
||||
|
Fiscal Year 2016
|
||||||||||||||||
|
Net identifiable intangible assets beginning of year
|
$
|
18,182
|
|
$
|
32,532
|
|
$
|
17,137
|
|
$
|
67,851
|
|
||||
|
Additions
|
36,624
|
|
1,013
|
|
—
|
|
|
37,637
|
|
|||||||
|
Amortization expense
|
(1,870
|
)
|
(5,619
|
)
|
(2,226
|
)
|
(9,715
|
)
|
||||||||
|
Foreign currency translation
|
—
|
|
11
|
|
(810
|
)
|
(799
|
)
|
||||||||
|
Net identifiable intangible assets end of year
|
$
|
52,936
|
|
$
|
27,937
|
|
$
|
14,101
|
|
$
|
94,974
|
|
||||
The identifiable intangible asset additions in fiscal year 2016 were primarily attributable to the acquisition of Alex. Brown and 3Macs and included customer relationships, trade names, seller relationship agreements and non-compete agreements. See
Note 3
for additional information regarding our acquisitions.
The following summarizes our identifiable intangible assets by type:
|
September 30,
|
||||||||||||||||
|
2017
|
2016
|
|||||||||||||||
|
$ in thousands
|
Gross carrying value
|
Accumulated amortization
|
Gross carrying value
|
Accumulated amortization
|
||||||||||||
|
Customer relationships
|
$
|
99,749
|
|
$
|
(31,098
|
)
|
$
|
99,470
|
|
$
|
(22,895
|
)
|
||||
|
Trade name
|
8,366
|
|
(2,076
|
)
|
8,172
|
|
(499
|
)
|
||||||||
|
Developed technology
|
1,630
|
|
(706
|
)
|
12,630
|
|
(10,280
|
)
|
||||||||
|
Intellectual property
|
542
|
|
(131
|
)
|
516
|
|
(73
|
)
|
||||||||
|
Non-compete agreements
|
3,336
|
|
(1,551
|
)
|
3,314
|
|
(612
|
)
|
||||||||
|
Seller relationship agreements
|
5,300
|
|
(901
|
)
|
5,300
|
|
(69
|
)
|
||||||||
|
Total
|
$
|
118,923
|
|
$
|
(36,463
|
)
|
$
|
129,402
|
|
$
|
(34,428
|
)
|
||||
The following table sets forth the projected amortization expense by fiscal year associated with our identifiable intangible assets:
|
Fiscal year ended September 30,
|
$ in thousands
|
|||
|
2018
|
$
|
11,056
|
|
|
|
2019
|
10,591
|
|
||
|
2020
|
9,812
|
|
||
|
2021
|
9,056
|
|
||
|
2022
|
8,436
|
|
||
|
Thereafter
|
33,509
|
|
||
|
$
|
82,460
|
|
||
139
RAYMOND JAMES FINANCIAL, INC AND SUBSIDIARIES
Notes to Consolidated Financial Statements
Bank deposits include Negotiable Order of Withdrawal (“NOW”) accounts, demand deposits, savings and money market accounts and certificates of deposit of
RJ Bank
. The following table presents a summary of bank deposits including the weighted-average rate, the calculation of which was based on the actual deposit balances at
September 30, 2017
and
2016
, respectively.
|
September 30,
|
||||||||||||||
|
|
2017
|
2016
|
||||||||||||
|
$ in thousands
|
Balance
|
Weighted-average rate
|
Balance
|
Weighted-average rate
|
||||||||||
|
Savings and money market accounts
|
$
|
17,391,091
|
|
0.14
|
%
|
$
|
13,935,089
|
|
0.05
|
%
|
||||
|
Certificates of deposit
|
314,685
|
|
1.60
|
%
|
315,236
|
|
1.55
|
%
|
||||||
|
NOW accounts
|
5,197
|
|
0.01
|
%
|
4,958
|
|
0.01
|
%
|
||||||
|
Demand deposits (non-interest-bearing)
|
21,389
|
|
—
|
|
7,264
|
|
—
|
|
||||||
|
Total bank deposits
|
$
|
17,732,362
|
|
0.17
|
%
|
$
|
14,262,547
|
|
0.08
|
%
|
||||
Total bank deposits in the table above excludes affiliate deposits of
$243 million
and
$353 million
at
September 30, 2017
and
2016
, respectively. These affiliate deposits include
$192 million
and
$350 million
as of
September 30, 2017
and
2016
, respectively, held in a deposit account at
RJ Bank
on behalf of
RJF
(see
Note 25
for additional information).
Savings and money market accounts in the table above consist primarily of deposits that are cash balances swept from the client investment accounts maintained at
RJ&A
to
RJ Bank
. These balances are held in Federal Deposit Insurance Corporation (“FDIC”) insured bank accounts through the Raymond James Bank Deposit Program (“RJBDP”). The aggregate amount of time deposit account balances that exceeded the
FDIC
insurance limit at
September 30, 2017
was
$23 million
.
Scheduled maturities of certificates of deposit are as follows:
|
September 30,
|
||||||||||||||||
|
|
2017
|
2016
|
||||||||||||||
|
$ in thousands
|
Denominations
greater than or
equal to $100,000
|
Denominations
less than $100,000
|
Denominations
greater than or
equal to $100,000
|
Denominations
less than $100,000
|
||||||||||||
|
Three months or less
|
$
|
8,704
|
|
$
|
4,132
|
|
$
|
14,252
|
|
$
|
12,663
|
|
||||
|
Over three through six months
|
4,692
|
|
3,894
|
|
14,191
|
|
9,750
|
|
||||||||
|
Over six through twelve months
|
34,005
|
|
11,865
|
|
15,452
|
|
12,321
|
|
||||||||
|
Over one through two years
|
38,713
|
|
20,019
|
|
32,816
|
|
11,060
|
|
||||||||
|
Over two through three years
|
48,082
|
|
27,847
|
|
43,730
|
|
22,148
|
|
||||||||
|
Over three through four years
|
21,819
|
|
12,761
|
|
58,425
|
|
28,863
|
|
||||||||
|
Over four through five years
|
50,805
|
|
27,347
|
|
26,173
|
|
13,392
|
|
||||||||
|
Total
|
$
|
206,820
|
|
$
|
107,865
|
|
$
|
205,039
|
|
$
|
110,197
|
|
||||
Interest expense on deposits, excluding interest expense related to affiliate deposits, is summarized as follows:
|
|
Year ended September 30,
|
|||||||||||
|
$ in thousands
|
2017
|
2016
|
2015
|
|||||||||
|
Certificates of deposit
|
$
|
4,325
|
|
$
|
5,402
|
|
$
|
5,839
|
|
|||
|
Money market, savings and NOW accounts
|
12,859
|
|
4,816
|
|
2,543
|
|
||||||
|
Total interest expense on deposits
|
$
|
17,184
|
|
$
|
10,218
|
|
$
|
8,382
|
|
|||
140
RAYMOND JAMES FINANCIAL, INC AND SUBSIDIARIES
Notes to Consolidated Financial Statements
The following table details the components of other borrowings:
|
September 30,
|
||||||||
|
$ in thousands
|
2017
|
2016
|
||||||
|
FHLB advances
|
$
|
875,000
|
|
$
|
575,000
|
|
||
|
Unsecured lines of credit
|
350,000
|
|
—
|
|
||||
|
Secured lines of credit
|
260,000
|
|
—
|
|
||||
|
Mortgage notes payable
|
28,813
|
|
33,391
|
|
||||
|
ClariVest revolving credit facility
|
199
|
|
267
|
|
||||
|
Total other borrowings
|
$
|
1,514,012
|
|
$
|
608,658
|
|
||
Borrowings from the
FHLB
as of
September 30, 2017
were comprised of both floating and fixed-rate advances. As of
September 30, 2017
the floating-rate advances, which mature in
June 2019
and have interest rates which reset quarterly, totaled
$850 million
. We use interest rate swaps to manage the risk of increases in interest rates associated with these floating-rate advances by converting the balances subject to variable interest rates to a fixed interest rate. Refer to
Note 6
for information regarding these interest rate swaps, which are accounted for as hedging instruments. The fixed-rate advance, in the amount of
$25 million
, matures in
October 2020
and bears interest at a fixed rate of
3.4%
. All of the advances were secured by a blanket lien granted to the
FHLB
on our residential mortgage loan portfolio. The weighted average interest rate on these advances as of
September 30, 2017
was
1.41%
.
Borrowings from the
FHLB
as of
September 30, 2016
were comprised of floating-rate advances that have interest rates which reset quarterly, totaling
$550 million
, and a fixed-rate advance in the amount of
$25 million
and bears interest at a rate of
3.4%
. The weighted average interest rate on these advances as of
September 30, 2016
was
1.01%
.
RJF
is a party to a revolving credit facility agreement (the “RJF Credit Facility”) with a maturity date of May 2022 in which the lenders are a number of financial institutions. This committed unsecured borrowing facility provides for maximum borrowings of up to
$300 million
at variable rates of interest. There were
no
borrowings outstanding on the RJF Credit Facility as of either
September 30, 2017
or
2016
. The interest rate associated with the RJF Credit Facility is a variable rate that, among other factors, varies depending upon
RJF
’s credit rating. Based upon
RJF
’s credit rating as of
September 30, 2017
, the variable borrowing rate was
1.50%
per annum over LIBOR. There is a variable rate commitment fee associated with the RJF Credit Facility, which varies depending upon
RJF
’s credit rating. Based upon
RJF
’s credit rating as of
September 30, 2017
, the variable rate commitment fee which applied to any difference between the daily borrowed amount and the committed amount, was
0.20%
per annum. Any borrowings on unsecured lines of credit, with the exception of the RJF Credit Facility, were day-to-day and were generally utilized for cash management purposes.
Any borrowings on secured lines of credit were day-to-day and were generally utilized to finance certain fixed income securities. In addition we have other collateralized financings included in “Securities sold under agreements to repurchase” on our Consolidated Statements of Financial Condition. See
Note 7
for information regarding our collateralized financing arrangements.
The interest rates for all of our
U.S.
and Canadian secured and unsecured financing facilities are variable and are based on the Fed Funds rate, LIBOR, a lenders prime rate, or the Canadian prime rate, as applicable. For the fiscal year ended
September 30, 2017
, interest rates on the
U.S.
facilities that were utilized during the year, other than the ClariVest Facility and the RJF Credit Facility which are each previously described, ranged from
0.35%
to
3.41%
. The interest rate on our Canadian facility which was utilized from time-to-time during the fiscal year
September 30, 2017
was
1.75%
.
Mortgage notes payable pertain to mortgage loans on certain of our corporate headquarters offices located in St. Petersburg, Florida. These mortgage loans are secured by land, buildings, and improvements. These mortgage loans bear interest at
5.7%
with repayment terms of monthly interest and principal debt service and have a
January 2023
maturity.
ClariVest Asset Management, LLC (“ClariVest”), a subsidiary of
Eagle
, is a party to a revolving line of credit provided by a third party lender (the “ClariVest Facility”). The maximum amount available to borrow under the ClariVest Facility is
$500 thousand
, bearing interest at a variable rate which is
1%
over the lender’s prime rate. The weighted average interest rate on the ClariVest Facility during the fiscal year ended
September 30, 2017
was
4.91%
. The ClariVest Facility expires in
September 2018
.
141
RAYMOND JAMES FINANCIAL, INC AND SUBSIDIARIES
Notes to Consolidated Financial Statements
Our other borrowings as of
September 30, 2017
, mature as follows based on their contractual terms:
|
Fiscal year ended September 30,
|
$ in thousands
|
|||
|
2018
|
$
|
615,045
|
|
|
|
2019
|
855,130
|
|
||
|
2020
|
5,430
|
|
||
|
2021
|
30,748
|
|
||
|
2022
|
6,084
|
|
||
|
Thereafter
|
1,575
|
|
||
|
Total
|
$
|
1,514,012
|
|
|
The following summarizes our senior notes payable:
|
September 30,
|
||||||||
|
$ in thousands
|
2017
|
2016
|
||||||
|
5.625% senior notes, due 2024
|
$
|
250,000
|
|
$
|
250,000
|
|
||
|
3.625% senior notes, due 2026
|
500,000
|
|
500,000
|
|
||||
|
4.95% senior notes, due 2046
|
800,000
|
|
300,000
|
|
||||
|
6.90% senior notes, due 2042
|
—
|
|
350,000
|
|
||||
|
8.60% senior notes, due 2019
|
—
|
|
300,000
|
|
||||
|
1,550,000
|
|
1,700,000
|
|
|||||
|
Unaccreted premium/(discount)
|
11,905
|
|
(1,601
|
)
|
||||
|
Unamortized debt issuance costs
|
(13,066
|
)
|
(17,812
|
)
|
||||
|
Total senior notes payable
|
$
|
1,548,839
|
|
$
|
1,680,587
|
|
||
In
March 2012
, we sold in a registered underwritten public offering
$250 million
in aggregate principal amount of
5.625%
senior notes due
April 2024
. Interest on these senior notes is payable
semi-annually
. We may redeem some or all of these senior notes at any time prior to their maturity, at a redemption price equal to the greater of (i)
100%
of the principal amount of the notes redeemed, or (ii) the sum of the present values of the remaining scheduled payments of principal and interest thereon, discounted to the redemption date at a discount rate equal to a designated U.S. Treasury rate, plus
50
basis points, plus accrued and unpaid interest thereon to the redemption date.
In
July 2016
, we sold in a registered underwritten public offering
$500 million
in aggregate principal amount of
3.625%
senior notes due
September 2026
. Interest on these senior notes is payable
semi-annually
. We may redeem some or all of these senior notes at any time prior to their maturity, at a redemption price equal to the greater of (i)
100%
of the principal amount of the notes redeemed, or (ii) the sum of the present values of the remaining scheduled payments of principal and interest thereon, discounted to the redemption date at a discount rate equal to a designated U.S. Treasury rate, plus
35
basis points, plus accrued and unpaid interest thereon to the redemption date.
In
July 2016
, we sold in a registered underwritten public offering
$300 million
in aggregate principal amount of
4.95%
senior notes due
July 2046
. In
May 2017
, we reopened the offering and sold, in a registered underwritten public offering, an additional
$500 million
in aggregate principal amount of
4.95%
senior notes due
July 2046
. These additional senior notes were consolidated, formed into a single series, and are fully fungible with the
$300 million
in aggregate principal amount
4.95%
senior notes issued in
July 2016
. Interest on these senior notes is payable
semi-annually
. We may redeem some or all of these senior notes at any time prior to their maturity, at a redemption price equal to the greater of (i)
100%
of the principal amount of the notes redeemed, or (ii) the sum of the present values of the remaining scheduled payments of principal and interest thereon, discounted to the redemption date at a discount rate equal to a designated U.S. Treasury rate, plus
45
basis points, plus accrued and unpaid interest thereon to the redemption date.
Redemption at par of certain senior notes
On
March 15, 2017
(the “March Redemption Date”), we redeemed all of our outstanding
6.90%
senior notes due
March 2042
, which were originally sold in a registered underwritten public offering in 2012. The aggregate principal amount outstanding of the
6.90%
Senior Notes was
$350 million
. The redemption price on the March Redemption Date was equal to the principal, plus accrued and unpaid interest thereon to the March Redemption Date. Unamortized debt issuance costs as of the March Redemption Date of
$8 million
were accelerated and were included in “Losses on extinguishment of debt” in our Consolidated Statements of Income and Comprehensive Income for the
year ended September 30, 2017
.
142
RAYMOND JAMES FINANCIAL, INC AND SUBSIDIARIES
Notes to Consolidated Financial Statements
On
September 25, 2017
(the “September Redemption Date”), we redeemed all of our outstanding
8.60%
senior notes due
August 2019
, which were originally sold in a registered underwritten public offering in 2009. The aggregate principal amount outstanding of the
8.60%
senior notes was
$300 million
. The redemption price on the September Redemption Date was equal to accrued and unpaid interest as of the September Redemption Date plus the sum of the present value of the remaining scheduled payments, which consist of principal and interest, discounted to the September Redemption Date on a semi-annual basis at a discount rate equal to a designated U.S. Treasury Rate, plus 50 basis points. A make-whole premium related to the redemption of
$37 million
was included in “Losses on extinguishment of debt” in our Consolidated Statements of Income and Comprehensive Income for the
year ended September 30, 2017
.
Our senior notes payable outstanding as of
September 30, 2017
, mature at varying dates between 2024 and 2046.
For a discussion of our income tax accounting policies and other income tax-related information see Note 2.
Total income tax provision/(benefit) was allocated as follows:
|
Year ended September 30,
|
||||||||||||
|
$ in thousands
|
2017
|
2016
|
2015
|
|||||||||
|
Recorded in:
|
||||||||||||
|
Net income including noncontrolling interests
|
$
|
289,111
|
|
$
|
271,293
|
|
$
|
296,034
|
|
|||
|
Equity, arising from cash flow hedges recorded through OCI
|
14,239
|
|
(7,252
|
)
|
(2,850
|
)
|
||||||
|
Equity, arising from cumulative currency translation adjustments and net investment hedges recorded through OCI
|
(7,427
|
)
|
(3,525
|
)
|
31,078
|
|
||||||
|
Equity, arising from available-for-sale securities recorded through OCI
|
856
|
|
(3,295
|
)
|
(2,246
|
)
|
||||||
|
Equity, arising from compensation expense for tax purposes which was (in excess of)/less than amounts recognized for financial reporting purposes
|
—
|
|
(35,121
|
)
|
8,115
|
|
||||||
|
Total
|
$
|
296,779
|
|
$
|
222,100
|
|
$
|
330,131
|
|
|||
Effective October 1, 2016, we adopted the new accounting guidance related to stock compensation. The amended guidance involves several aspects of the accounting for share-based payment transactions, including the income tax consequences. Under the new guidance, all tax effects related to share-based payments are recorded through tax expense in the periods during which the awards are exercised or vest, as applicable. See Note 2 and Note 20 for additional information on our adoption of this new accounting guidance during the period.
Our provision/(benefit) for income taxes consisted of the following:
|
Year ended September 30,
|
||||||||||||
|
$ in thousands
|
2017
|
2016
|
2015
|
|||||||||
|
Current:
|
||||||||||||
|
Federal
|
$
|
255,555
|
|
$
|
287,350
|
|
$
|
266,359
|
|
|||
|
State and local
|
37,553
|
|
32,101
|
|
48,130
|
|
||||||
|
Foreign
|
7,620
|
|
10,640
|
|
5,007
|
|
||||||
|
300,728
|
|
330,091
|
|
319,496
|
|
|||||||
|
Deferred:
|
||||||||||||
|
Federal
|
(11,316
|
)
|
(51,383
|
)
|
(20,567
|
)
|
||||||
|
State and local
|
(959
|
)
|
(6,267
|
)
|
(5,127
|
)
|
||||||
|
Foreign
|
658
|
|
(1,148
|
)
|
2,232
|
|
||||||
|
(11,617
|
)
|
(58,798
|
)
|
(23,462
|
)
|
|||||||
|
Total provision for income tax
|
$
|
289,111
|
|
$
|
271,293
|
|
$
|
296,034
|
|
|||
143
RAYMOND JAMES FINANCIAL, INC AND SUBSIDIARIES
Notes to Consolidated Financial Statements
A reconciliation of the U.S. federal statutory income tax rate to our effective income tax rate is as follows:
|
Year ended September 30,
|
|||||||||
|
2017
|
2016
|
2015
|
|||||||
|
Provision calculated at statutory rate
|
35.0
|
%
|
35.0
|
%
|
35.0
|
%
|
|||
|
State income tax, net of federal benefit
|
2.7
|
%
|
1.7
|
%
|
3.6
|
%
|
|||
|
Tax-exempt interest income
|
(1.0
|
)%
|
(0.9
|
)%
|
(0.5
|
)%
|
|||
|
Excess tax benefits related to share-based compensation
(1)
|
(2.5
|
)%
|
—
|
|
—
|
|
|||
|
(Income)/losses associated with COLI which are not (subject to tax)/tax deductible
|
(1.7
|
)%
|
(1.1
|
)%
|
0.4
|
%
|
|||
|
Federal tax credits
|
(1.6
|
)%
|
(1.0
|
)%
|
(0.9
|
)%
|
|||
|
Other, net
|
0.3
|
%
|
0.2
|
%
|
(0.5
|
)%
|
|||
|
Total provision for income tax
|
31.2
|
%
|
33.9
|
%
|
|
37.1
|
%
|
||
(1) Does not include excess state tax benefits related to share-based compensation, which had an impact of reducing our effective tax rate by
(0.2)%
for 2017. See
Note 2
and Note 20 for more information regarding the adoption of new accounting guidance related to stock compensation.
U.S. and foreign components of income excluding noncontrolling interests and before provision for income taxes were as follows:
|
Year ended September 30,
|
||||||||||||
|
$ in thousands
|
2017
|
2016
|
2015
|
|||||||||
|
U.S.
|
$
|
915,711
|
|
$
|
765,421
|
|
$
|
782,146
|
|
|||
|
Foreign
|
9,635
|
|
35,222
|
|
16,028
|
|
||||||
|
Income excluding noncontrolling interests and before provision for income taxes
|
$
|
925,346
|
|
$
|
800,643
|
|
$
|
798,174
|
|
|||
The cumulative effects of temporary differences that give rise to significant portions of the deferred tax asset/(liability) items are as follows:
|
September 30,
|
||||||||
|
$ in thousands
|
2017
|
2016
|
||||||
|
Deferred tax assets:
|
||||||||
|
Deferred compensation
|
$
|
235,171
|
|
$
|
192,397
|
|
||
|
Allowances for loan losses and reserves for unfunded commitments
|
74,909
|
|
78,552
|
|
||||
|
Unrealized loss associated with foreign currency translations
|
1,928
|
|
22,184
|
|
||||
|
Unrealized loss associated with available-for-sale securities
|
3,342
|
|
4,314
|
|
||||
|
Accrued expenses
|
41,545
|
|
44,419
|
|
||||
|
Other
|
13,665
|
|
24,897
|
|
||||
|
Total gross deferred tax assets
|
370,560
|
|
366,763
|
|
||||
|
Less: valuation allowance
|
(9
|
)
|
(9
|
)
|
||||
|
Total deferred tax assets
|
370,551
|
|
366,754
|
|
||||
|
Deferred tax liabilities:
|
||||||||
|
Partnership investments
|
(6,326
|
)
|
(8,518
|
)
|
||||
|
Goodwill and other intangibles
|
(38,364
|
)
|
(26,384
|
)
|
||||
|
Undistributed earnings of foreign subsidiaries
|
—
|
|
(9,636
|
)
|
||||
|
Other
|
(12,375
|
)
|
(192
|
)
|
||||
|
Total deferred tax liabilities
|
(57,065
|
)
|
(44,730
|
)
|
||||
|
Net deferred tax assets
|
$
|
313,486
|
|
$
|
322,024
|
|
||
We had a net deferred tax asset at
September 30, 2017
and
2016
. This asset includes net operating losses that will expire between
2018
and
2030
. A valuation allowance for the fiscal year ended
September 30, 2017
has been established for certain state net operating losses due to management’s belief that, based on our historical operating income, projection of future taxable income, scheduled reversal of taxable temporary differences, and implemented tax planning strategies, it is more likely than not that the tax carryforwards will expire unutilized. We believe that the realization of the remaining net deferred tax asset of
$313 million
is more likely than not based on the ability to carry back losses against prior year taxable income and expectations of future taxable income.
As of
September 30, 2017
, we consider all undistributed earnings of non-U.S. subsidiaries to be permanently reinvested and, therefore, we have not provided for any U.S. deferred income taxes. As of
September 30, 2017
, we had approximately
$219 million
of cumulative undistributed earnings attributable to foreign subsidiaries for which no provisions have been recorded for income taxes that could arise
144
RAYMOND JAMES FINANCIAL, INC AND SUBSIDIARIES
Notes to Consolidated Financial Statements
upon repatriation. Because the time or manner of repatriation is uncertain, we cannot determine the impact of local taxes, withholding taxes and foreign tax credits associated with the future repatriation of such earnings, and therefore cannot quantify the tax liability that would be payable in the event all such foreign earnings are repatriated.
As of
September 30, 2017
, the current tax receivable, which is included in “Other receivables” in our Consolidated Statements of Financial Condition, was
$102 million
, and the current tax payable, which is included in “Other payables,” was
$23 million
. As of
September 30, 2016
, the current tax receivable was
$48 million
and the current tax payable was
$29 million
.
Balances associated with unrecognized tax benefits
We recognize the accrual of interest and penalties related to income tax matters in interest expense and other expense, respectively. As of
September 30, 2017
and
2016
, accrued interest and penalties were approximately
$3 million
and
$4 million
, respectively.
The aggregate changes in the balances for uncertain tax positions were as follows:
|
Year ended September 30,
|
||||||||||||
|
$ in thousands
|
2017
|
2016
|
2015
|
|||||||||
|
Balance for uncertain tax positions at beginning of year
|
$
|
22,173
|
|
$
|
22,454
|
|
$
|
15,804
|
|
|||
|
Increases for tax positions related to the current year
|
3,238
|
|
6,496
|
|
4,954
|
|
||||||
|
Increases for tax positions related to prior years
(1)
|
438
|
|
1,284
|
|
3,466
|
|
||||||
|
Decreases for tax positions related to prior years
|
(717
|
)
|
(1,592
|
)
|
(204
|
)
|
||||||
|
Decreases due to lapsed statute of limitations
|
(2,497
|
)
|
(1,447
|
)
|
(1,566
|
)
|
||||||
|
Decreases related to settlements
|
(2,629
|
)
|
(5,022
|
)
|
—
|
|
||||||
|
Balance for uncertain tax positions at end of year
|
$
|
20,006
|
|
$
|
22,173
|
|
$
|
22,454
|
|
|||
|
(1)
|
The increases are primarily due to tax positions taken in previously filed tax returns with certain states. We continue to evaluate these positions and intend to contest any proposed adjustments made by taxing authorities.
|
The total amount of uncertain tax positions that, if recognized, would impact the effective tax rate (the items included in the table above after considering the federal tax benefit associated with any state tax provisions) was
$15 million
,
$16 million
, and
$15 million
at
September 30, 2017
,
2016
,
2015
, respectively. We anticipate that the uncertain tax position balance will not change significantly over the next
12
months.
We file
U.S.
federal income tax returns as well as returns with various state, local and foreign jurisdictions. With few exceptions, we are generally no longer subject to
U.S.
federal, state and local, or foreign income tax examination by tax authorities for years prior to
fiscal year 2014
for federal tax returns,
fiscal year 2013
for state and local tax returns and
fiscal year 2013
for foreign tax returns. Various foreign and state audits in process are expected to be completed in
fiscal year 2018
.
Commitments and contingencies
Loan and Underwriting Commitments
In the normal course of business we enter into commitments for either fixed income or equity underwritings. As of
September 30, 2017
, we had
two
such open underwriting commitments, both of which were subsequently settled in open market transactions and none of which resulted in significant loss.
As part of our recruiting efforts, we offer loans to prospective financial advisors and certain key revenue producers primarily for recruiting, transitional cost assistance, and retention purposes (see
Note 2
for a discussion of our accounting policies governing these transactions). These commitments are contingent upon certain events occurring, including, but not limited to, the individual joining us. As of
September 30, 2017
, we had made commitments through the extension of formal offers totaling approximately
$139 million
that had not yet been funded; however, it is possible that not all of our offers will be accepted and therefore, we would not fund the total amount of the offers extended. As of
September 30, 2017
,
$59 million
of the total amount extended consisted of unfunded commitments to prospective financial advisors that had accepted our offers, or recently hired producers.
145
RAYMOND JAMES FINANCIAL, INC AND SUBSIDIARIES
Notes to Consolidated Financial Statements
As of
September 30, 2017
, we had not settled purchases of
$162 million
in syndicated loans. These loan purchases are expected to be settled within
90 days
.
See
Note 22
for additional information regarding our commitments to extend credit and other credit-related off-balance sheet financial instruments such as standby letters of credit and loan purchases.
Investment Commitments
A subsidiary of
RJ Bank
has committed
$80 million
as an investor member in a LIHTC fund in which a subsidiary of
RJTCF
is the managing member (see
Note 2
for information regarding the accounting policies governing these investments). As of
September 30, 2017
, the RJ Bank subsidiary had invested
$61 million
of the committed amount.
We have unfunded commitments to various private equity partnerships, which aggregate to
$36 million
as of
September 30, 2017
. Of the total, we have unfunded commitments of
$18 million
to internally-sponsored private equity limited partnerships in which we control the general partner.
Acquisition-Related Commitments and Contingencies
On April 20, 2017, we announced we had entered into a definitive agreement to acquire the Scout Group. This acquisition closed on November 17, 2017. See
Note 3
for more information.
As part of the terms governing our fiscal year 2015 acquisition of
TPC
, on certain dates specified in the
TPC
purchase agreement there are a number of earn-out computations to be performed. The result of these computations could result in additional cash paid to the sellers of
TPC
over a measurement period of up to three years after the
TPC
closing date, which was July 31, 2015. During the year ended
September 30, 2017
certain earn-out payments were measured and applicable amounts paid to the sellers of
TPC
. The remaining elements of contingent consideration will be determined in the future based upon the outcome of either specific performance of defined tasks, or the achievement of specified revenue growth hurdles. Our initial estimate of the fair value of the elements of contingent consideration as of the
TPC
closing date was included in our determination of the goodwill arising from this acquisition. As of
September 30, 2017
, we computed an estimate of the fair value of the contingent consideration based upon the latest information available to us, and the excess of this fair value determination over the initial estimate was included in “Other expenses” on our Consolidated Statements of Income and Comprehensive Income.
As a part of the terms governing the fiscal year 2016 Mummert acquisition (see
Note 3
for additional information regarding this acquisition), on certain dates specified in the Mummert purchase agreement, there are earn-out computations to be performed or contingent consideration provisions that may apply. These elements of contingent consideration will be finally determined in the future based upon the achievement of specified revenue amounts and the continued employment of specified associates. Since the ultimate payment of these elements of contingent consideration are conditioned upon continued employment as of the measurement dates which are
three
and
five
years from the Mummert acquisition date of June 1, 2016, these obligations, including any adjustments to the estimated fair value, are being recognized as a component of our compensation expense over such periods.
Lease Commitments
Long-term lease agreements expire at various times through fiscal year
2031
. Minimum annual rental payments under such agreements for the succeeding five fiscal years are presented below:
|
Fiscal year ended September 30,
|
$ in thousands
|
|||
|
2018
|
$
|
96,756
|
|
|
|
2019
|
89,711
|
|
||
|
2020
|
78,164
|
|
||
|
2021
|
61,959
|
|
||
|
2022
|
42,846
|
|
||
|
Thereafter
|
79,491
|
|
||
|
Total
|
$
|
448,927
|
|
|
Certain leases contain rent holidays, leasehold improvement incentives, renewal options and/or escalation clauses. Rental expense incurred under all leases, including equipment under short-term agreements, aggregated to
$115 million
,
$97 million
and
$89 million
for fiscal years
2017
,
2016
and
2015
, respectively.
146
RAYMOND JAMES FINANCIAL, INC AND SUBSIDIARIES
Notes to Consolidated Financial Statements
Other Commitments
RJF
has committed an amount of up to
$225 million
, subject to certain limitations and to annual review and renewal by the
RJF
Board of Directors, to either lend to
RJTCF
or to guarantee
RJTCF
’s obligations, in connection with
RJTCF
’s low-income housing development/rehabilitation and syndication activities. As of
September 30, 2017
,
RJTCF
had
$42 million
outstanding against this commitment.
RJTCF
may borrow from
RJF
in order to make investments in, or fund loans or advances to, either project partnerships that purchase and develop properties qualifying for tax credits or
LIHTC
Funds. Investments in project partnerships are sold to various
LIHTC
Funds, which have third party investors, and for which
RJTCF
serves as the managing member or general partner.
RJTCF
typically sells investments in project partnerships to
LIHTC
Funds within
90
days of their acquisition, and the proceeds from the sales are used to repay
RJTCF
’s borrowings from RJF.
RJTCF
may also make short-term loans or advances to project partnerships and
LIHTC
Funds.
As a part of our fixed income public finance operations, we enter into forward commitments to purchase
GNMA
or
FNMA
MBS
(see the discussion of these activities within “financial instruments, financial instruments sold but not yet purchased at fair value” in
Note 2
). At
September 30, 2017
, we had approximately
$793 million
principal amount of outstanding forward
MBS
purchase commitments which are expected to be purchased over the following
90 days
. In order to hedge the market interest rate risk to which we would otherwise be exposed between the date of the commitment and the date of sale of the
MBS
, we enter into
TBA
security contracts with investors for generic
MBS
at specific rates and prices to be delivered on settlement dates in the future. These
TBA
securities and related purchase commitment are accounted for at fair value. As of
September 30, 2017
, the fair value of the TBA securities and the estimated fair value of the purchase commitments were not significant.
Contingencies
As a result of extensive regulation of financial holding companies, banks, broker-dealers and investment advisory entities,
RJF
and certain of its subsidiaries are subject to regular reviews and inspections by regulatory authorities and self-regulatory organizations. The reviews can result in the imposition of sanctions for regulatory violations, ranging from non-monetary censures to fines and, in serious cases, temporary or permanent suspension from conducting business, or limitations on certain business activities. In addition, regulatory agencies and self-regulatory organizations institute investigations from time to time into industry practices, which can also result in the imposition of such sanctions. Refer to the “Legal and regulatory matter contingencies” discussion within this footnote for information about related loss contingency reserves.
Guarantees
RJF
guarantees interest rate swap obligations of RJ Cap Services. See
Note 6
for additional information regarding interest rate swaps.
RJF
guarantees the existing mortgage debt of
RJ&A
of
$29 million
. See Note
14
for information regarding this borrowing.
Our U.S. broker-dealer subsidiaries are required by federal law to be members of the Securities Investors Protection Corporation (“SIPC”). The
SIPC
fund provides protection for securities held in client accounts up to
$500 thousand
per client, with a limitation of
$250 thousand
on claims for cash balances. We have purchased excess
SIPC
coverage through various syndicates of Lloyd’s of London. For
RJ&A
, our clearing broker-dealer, the additional protection currently provided has an aggregate firm limit of
$750 million
for cash and securities, including a sub-limit of
$1.9 million
per client for cash above basic
SIPC
. Account protection applies when a
SIPC
member fails financially and is unable to meet obligations to clients. This coverage does not protect against market fluctuations.
RJF
has provided an indemnity to Lloyd’s of London against any and all losses they may incur associated with the excess
SIPC
policies.
RJTCF
issues certain guarantees to various third parties related to project partnerships whose interests have been sold to one or more of the funds in which
RJTCF
is the managing member or general partner. In some instances,
RJTCF
is not the primary guarantor of these obligations, which aggregate to
$3 million
as of
September 30, 2017
.
RJTCF
has provided a guaranteed return on investment to a third party investor in the Guaranteed
LIHTC
Fund and
RJF
has guaranteed
RJTCF
’s performance under the arrangement. Under the terms of the performance guarantee, should the underlying
LIHTC
project partnerships held by the Guaranteed
LIHTC
Fund fail to deliver a certain amount of tax credits and other tax benefits to this investor over the next
five years
,
RJTCF
is obligated to pay the investor an amount that results in the investor achieving a minimum specified return on their investment. A
$16 million
financing asset is included in “Other assets” (see
Note 9
for additional information), and a related
$16 million
liability is included in “Other payables” on our Consolidated Statements of Financial Condition as of
September 30, 2017
related to this obligation. The maximum exposure to loss under this guarantee was
$17 million
as of
September 30, 2017
, which represents the undiscounted future payments due the investor.
147
RAYMOND JAMES FINANCIAL, INC AND SUBSIDIARIES
Notes to Consolidated Financial Statements
Legal and regulatory matter contingencies
In addition to the matters specifically described below, in the normal course of our business, we have been named, from time to time, as a defendant in various legal actions, including arbitrations, class actions and other litigation, arising in connection with our activities as a diversified financial services institution.
We are also subject, from time to time, to other reviews, investigations and proceedings (both formal and informal) by governmental and self-regulatory agencies regarding our business. Such proceedings may involve, among other things, our sales and trading activities, financial products or offerings we sponsored, underwrote or sold, and operational matters. Some of these proceedings have resulted, and may in the future result, in adverse judgments, settlements, fines, penalties, injunctions or other relief and/or require us to undertake remedial actions.
We cannot predict if, how or when such proceedings or investigations will be resolved or what the eventual settlement, fine, penalty or other relief, if any, may be. A large number of factors may contribute to this inherent unpredictability: the proceeding is in its early stages; the damages sought are unspecified, unsupported or uncertain; it is unclear whether a case brought as a class action will be allowed to proceed on that basis; the other party is seeking relief other than or in addition to compensatory damages (including, in the case of regulatory and governmental proceedings, potential fines and penalties); the matters present significant legal uncertainties; we have not engaged in settlement discussions; discovery is not complete; there are significant facts in dispute; and numerous parties are named as defendants (including where it is uncertain how liability might be shared among defendants).
We contest liability and/or the amount of damages, as appropriate, in each pending matter. Over the last several years, the level of litigation and investigatory activity (both formal and informal) by government and self-regulatory agencies has increased significantly in the financial services industry. While we have identified below certain proceedings that we believe could be material, individually or collectively, there can be no assurance that material losses will not be incurred from claims that have not yet been asserted or are not yet determined to be material.
We include in some of the descriptions of individual matters below certain quantitative information about the plaintiff’s claim against us as alleged in the plaintiff’s pleadings or other public filings. Although this information may provide insight into the potential magnitude of a matter, it does not represent our estimate of reasonably possible loss or our judgment as to any currently appropriate accrual related thereto.
Subject to the foregoing, we believe, after consultation with counsel and consideration of the accrued liability amounts included in the accompanying consolidated financial statements, that the outcome of such litigation and regulatory proceedings will not have a material adverse effect on our consolidated financial condition. However, the outcome of such litigation and proceedings could be material to our operating results and cash flows for a particular future period, depending on, among other things, our revenues or income for such period.
With respect to legal and regulatory matters for which management has been able to estimate a range of reasonably possible loss (and excluding amounts subject to the below-described indemnification from Regions), as of
September 30, 2017
, we estimated the upper end of the range of reasonably possible aggregate loss to be approximately
$65 million
in excess of the aggregate reserves for such matters. Refer to
Note 2
for a discussion of our criteria for recognizing liabilities for contingencies.
Morgan Keegan Litigation
Indemnification from Regions
Under the agreement with Regions governing our 2012 acquisition of Morgan Keegan, Regions is obligated to indemnify us for losses we may incur in connection with any Morgan Keegan legal proceedings pending as of the closing date for that transaction, which was April 2, 2012, or commenced after the closing date but related to pre-closing matters that were received prior to April 2, 2015.
The Morgan Keegan matter described below is subject to such indemnification provisions. As of
September 30, 2017
, management estimated the range of potential liability of all Morgan Keegan matters subject to indemnification, including the cost of defense, to be from
$12 million
to
$44 million
. Any loss arising from such matters, after application of any contractual thresholds and other reductions, as set forth in the agreement, will be borne by Regions. As of
September 30, 2017
, our Consolidated Statements of Financial Condition include an indemnification asset of
$26 million
which is included in “Other assets” (see
Note 9
for additional information), and a liability for potential losses of
$26 million
which is included within “Other payables,” pertaining to the Morgan Keegan matters subject to indemnification. The amount included within “Other payables” is the amount within the range of potential liability related to such matters which management estimates is more likely than any other amount within such range.
148
RAYMOND JAMES FINANCIAL, INC AND SUBSIDIARIES
Notes to Consolidated Financial Statements
Morgan Keegan matter (subject to indemnification)
In July 2006, Morgan Keegan & Company, Inc., a Morgan Keegan affiliate, and one of its former analysts were named as defendants in a lawsuit filed by Fairfax Financial Holdings Limited and an affiliate in the Superior Court of New Jersey, Law Division, in Morris County, New Jersey. Plaintiffs made claims under a civil
RICO
statute, for commercial disparagement, tortious interference with contractual relationships, tortious interference with prospective economic advantage and common law conspiracy. Plaintiffs alleged that defendants engaged in a multi-year conspiracy to publish and disseminate false and defamatory information about plaintiffs in order to improperly drive down the stock price of Fairfax, so that others could profit from short positions. Plaintiffs alleged that the defendants’ actions disparaged them and harmed their business relationships. Plaintiffs alleged various categories of damages, including lost insurance business, losses on stock and bond offerings, reputational loss, increased audit fees and directors’ and officers’ insurance premiums, and lost acquisitions. They requested actual and punitive damages and treble damages under their
RICO
claims. On May 11, 2012, the trial court dismissed the plaintiffs’
RICO
claims. On June 27, 2012, the trial court dismissed plaintiffs’ tortious interference with prospective relations claim, but allowed the other claims to go forward. Prior to commencement of a jury trial, the court dismissed the remaining claims with prejudice, and the plaintiffs appealed. On April 27, 2017, the Superior Court of New Jersey, Appellate Division, affirmed the trial court's dismissal of certain claims against Morgan Keegan, including the
RICO
allegations, while remanding to the trial court the claims of disparagement, tortious interference with prospective business relations, and civil conspiracy, and limiting the actual damages to certain lost insurance business. Plaintiffs petitioned the Supreme Court of New Jersey for review of the Appellate Division’s opinion, but on October 17, 2017, the Supreme Court of New Jersey denied the petition.
Other comprehensive income/(loss)
The activity in other comprehensive income/(loss), net of the respective tax effect, was as follows:
|
Year ended September 30,
|
||||||||||||
|
$ in thousands
|
2017
|
2016
|
2015
|
|||||||||
|
Unrealized gain/(loss) on available-for-sale securities and non-credit portion of other-than-temporary impairment losses
|
$
|
1,684
|
|
$
|
(5,576
|
)
|
$
|
(3,325
|
)
|
|||
|
Unrealized gain/(loss) on currency translations, net of the impact of net investment hedges
|
15,618
|
|
2,179
|
|
(30,640
|
)
|
||||||
|
Unrealized gain/(loss) on cash flow hedges
|
23,232
|
|
(11,833
|
)
|
(4,650
|
)
|
||||||
|
Net other comprehensive income/(loss)
|
$
|
40,534
|
|
$
|
(15,230
|
)
|
$
|
(38,615
|
)
|
|||
149
RAYMOND JAMES FINANCIAL, INC AND SUBSIDIARIES
Notes to Consolidated Financial Statements
Accumulated other comprehensive income/(loss)
All of the components of other comprehensive income/(loss) described below, net of tax, are attributable to
RJF
. The following table presents the changes, and the related tax effects, of each component of accumulated other comprehensive income/(loss):
|
$ in thousands
|
Net investment hedges
|
Currency translations
|
Sub-total: net investment hedges and currency translations
|
Available-for-sale securities
|
Cash flow hedges
|
Total
|
||||||||||||||||||
|
Year ended September 30, 2017
|
||||||||||||||||||||||||
|
Accumulated other comprehensive income/(loss) as of the beginning of the year
|
$
|
86,482
|
|
$
|
(121,576
|
)
|
$
|
(35,094
|
)
|
$
|
(4,156
|
)
|
$
|
(16,483
|
)
|
$
|
(55,733
|
)
|
||||||
|
Other comprehensive income/(loss) before reclassifications and taxes
|
(41,997
|
)
|
43,541
|
|
1,544
|
|
443
|
|
31,843
|
|
33,830
|
|
||||||||||||
|
Amounts reclassified from accumulated other comprehensive income/(loss), before tax
|
—
|
|
6,647
|
|
6,647
|
|
2,097
|
|
5,628
|
|
14,372
|
|
||||||||||||
|
Pre-tax net other comprehensive income/(loss)
|
(41,997
|
)
|
50,188
|
|
8,191
|
|
2,540
|
|
37,471
|
|
48,202
|
|
||||||||||||
|
Income tax effect
|
15,716
|
|
(8,289
|
)
|
7,427
|
|
(856
|
)
|
(14,239
|
)
|
(7,668
|
)
|
||||||||||||
|
Net other comprehensive income/(loss) for the year, net of tax
|
(26,281
|
)
|
41,899
|
|
15,618
|
|
1,684
|
|
23,232
|
|
40,534
|
|
||||||||||||
|
Accumulated other comprehensive income/(loss) as of the end of the year
|
$
|
60,201
|
|
$
|
(79,677
|
)
|
$
|
(19,476
|
)
|
$
|
(2,472
|
)
|
$
|
6,749
|
|
$
|
(15,199
|
)
|
||||||
|
Year ended September 30, 2016
|
||||||||||||||||||||||||
|
Accumulated other comprehensive income/(loss) as of the beginning of the year
|
$
|
93,203
|
|
$
|
(130,476
|
)
|
$
|
(37,273
|
)
|
$
|
1,420
|
|
$
|
(4,650
|
)
|
$
|
(40,503
|
)
|
||||||
|
Other comprehensive income/(loss) before reclassifications and taxes
|
(10,743
|
)
|
9,397
|
|
(1,346
|
)
|
(9,231
|
)
|
(25,535
|
)
|
(36,112
|
)
|
||||||||||||
|
Amounts reclassified from accumulated other comprehensive income/(loss), before tax
|
—
|
|
—
|
|
—
|
|
360
|
|
6,450
|
|
6,810
|
|
||||||||||||
|
Pre-tax net other comprehensive income/(loss)
|
(10,743
|
)
|
9,397
|
|
(1,346
|
)
|
(8,871
|
)
|
(19,085
|
)
|
(29,302
|
)
|
||||||||||||
|
Income tax effect
|
4,022
|
|
(497
|
)
|
3,525
|
|
3,295
|
|
7,252
|
|
14,072
|
|
||||||||||||
|
Net other comprehensive income/(loss) for the year, net of tax
|
(6,721
|
)
|
8,900
|
|
2,179
|
|
(5,576
|
)
|
(11,833
|
)
|
(15,230
|
)
|
||||||||||||
|
Accumulated other comprehensive income/(loss) as of the end of the year
|
$
|
86,482
|
|
$
|
(121,576
|
)
|
$
|
(35,094
|
)
|
$
|
(4,156
|
)
|
$
|
(16,483
|
)
|
$
|
(55,733
|
)
|
||||||
Our net investment hedges and cash flow hedges relate to our derivatives associated with RJ Bank’s business operations (see
Note 6
for additional information on these derivatives).
150
RAYMOND JAMES FINANCIAL, INC AND SUBSIDIARIES
Notes to Consolidated Financial Statements
Reclassifications out of
AOCI
The following table presents the income statement line items impacted by reclassifications out of accumulated other comprehensive income/(loss), and the related tax effects, for the years ended
September 30, 2017
and
2016
:
|
Accumulated other comprehensive income/(loss) components
$ in thousands
|
Increase/(decrease) in amounts reclassified from accumulated other comprehensive income/(loss)
|
Affected line items in income statement
|
||||
|
Year ended September 30, 2017
|
||||||
|
Available-for-sale securities:
|
||||||
|
Auction rate securities
|
$
|
1,458
|
|
Other revenue
|
||
|
RJ Bank available-for-sale securities
|
639
|
|
Other revenue
|
|||
|
RJ Bank cash flow hedges
|
5,628
|
|
Interest expense
|
|||
|
Currency translations
|
6,647
|
|
Other expense
|
|||
|
14,372
|
|
Total before tax
|
||||
|
Income tax effect
|
(5,460
|
)
|
Provision for income taxes
|
|||
|
Total reclassifications for the year
|
$
|
8,912
|
|
Net of tax
|
||
|
Year ended September 30, 2016
|
||||||
|
Available-for-sale securities:
|
|
|||||
|
Auction rate securities
|
$
|
87
|
|
Other revenue
|
||
|
RJ Bank available-for-sale securities
|
273
|
|
Other revenue
|
|||
|
RJ Bank cash flow hedges
|
6,450
|
|
Interest expense
|
|||
|
6,810
|
|
Total before tax
|
||||
|
Income tax effect
|
(2,590
|
)
|
Provision for income taxes
|
|||
|
Total reclassifications for the year
|
$
|
4,220
|
|
Net of tax
|
||
See
Note 6
for additional information regarding the
RJ Bank
cash flow hedges, and
Note 4
for additional fair value information regarding these derivatives.
During the
year ended September 30, 2017
, we sold our interests in a number of Latin American joint ventures which had operations in Uruguay and Argentina. As a component of our computation of the gain or loss resulting from such sales, we recognized the sold entities’ cumulative currency translation balances which, prior to such reclassification, had been a component of the accumulated other comprehensive loss.
151
RAYMOND JAMES FINANCIAL, INC AND SUBSIDIARIES
Notes to Consolidated Financial Statements
The components of interest income and interest expense are as follows:
|
|
Year ended September 30,
|
|||||||||||
|
$ in thousands
|
2017
|
2016
|
2015
|
|||||||||
|
Interest income:
|
|
|
||||||||||
|
Margin balances
|
$
|
85,699
|
|
$
|
68,712
|
|
$
|
67,573
|
|
|||
|
Assets segregated pursuant to regulations and other segregated assets
|
37,270
|
|
22,287
|
|
13,792
|
|
||||||
|
Bank loans, net of unearned income
|
572,171
|
|
487,366
|
|
405,578
|
|
||||||
|
Available-for-sale securities
|
27,946
|
|
7,596
|
|
5,100
|
|
||||||
|
Trading instruments
|
21,068
|
|
19,362
|
|
19,450
|
|
||||||
|
Securities loaned
|
14,049
|
|
8,777
|
|
12,036
|
|
||||||
|
Loans to financial advisors
|
13,333
|
|
8,207
|
|
7,056
|
|
||||||
|
Corporate cash and all other
|
30,590
|
|
18,090
|
|
12,697
|
|
||||||
|
Total interest income
|
$
|
802,126
|
|
$
|
640,397
|
|
$
|
543,282
|
|
|||
|
Interest expense:
|
|
|
|
|
|
|
||||||
|
Brokerage client liabilities
|
$
|
4,884
|
|
$
|
2,084
|
|
$
|
940
|
|
|||
|
Retail bank deposits
|
17,184
|
|
10,218
|
|
8,382
|
|
||||||
|
Trading instruments sold but not yet purchased
|
6,138
|
|
5,035
|
|
4,503
|
|
||||||
|
Securities borrowed
|
6,690
|
|
3,174
|
|
5,237
|
|
||||||
|
Borrowed funds
|
16,559
|
|
12,957
|
|
6,079
|
|
||||||
|
Senior notes
|
94,665
|
|
78,533
|
|
76,088
|
|
||||||
|
Other
|
7,658
|
|
4,055
|
|
4,845
|
|
||||||
|
Total interest expense
|
153,778
|
|
116,056
|
|
106,074
|
|
||||||
|
Net interest income
|
648,348
|
|
524,341
|
|
437,208
|
|
||||||
|
Bank loan loss provision
|
(12,987
|
)
|
(28,167
|
)
|
(23,570
|
)
|
||||||
|
Net interest income after bank loan loss provision
|
$
|
635,361
|
|
$
|
496,174
|
|
$
|
413,638
|
|
|||
Interest expense related to retail bank deposits in the above table for the years ended September 30,
2017
and
2016
is presented net of interest expense associated with affiliate deposits, which have been eliminated in consolidation. The impact of such expense in the year ended September 30,
2015
was not significant.
Our profit sharing plan and employee stock ownership plan (“ESOP”) provide certain death, disability or retirement benefits for all employees who meet certain service requirements. The plans are noncontributory. Our contributions, if any, are determined annually by our Board of Directors on a discretionary basis and are recognized as compensation cost throughout the year. Benefits become fully vested after
six
years of qualified service, at 65, or if a participant separates from service due to death or disability.
All shares owned by the
ESOP
are included in earnings per share calculations. Cash dividends paid to the
ESOP
are reflected as a reduction of retained earnings. The number of shares of our common stock held by the
ESOP
at
September 30, 2017
and
2016
was approximately
4,690,000
and
4,873,000
, respectively. The market value of our common stock held by the
ESOP
at
September 30, 2017
was approximately
$396 million
, of which approximately
$4 million
was unearned (not yet vested) by
ESOP
plan participants.
We also offer a plan pursuant to section 401(k) of the Internal Revenue Code, which is a qualified plan that may provide for a discretionary contribution or a matching contribution each year. Matching contributions are
75%
of the first
$1,000
and
25%
of the next
$1,000
of eligible compensation deferred by each participant annually.
Our
LTIP
is a non-qualified deferred compensation plan that provides benefits to employees who meet certain compensation or production requirements. We have purchased and hold life insurance on the lives of certain current and former employee participants (
COLI
- see
Note 9
for information regarding the carrying value of these insurance policies) to earn a competitive rate of return for participants and to provide the primary source of funds available to satisfy our obligations under this plan.
Contributions to the qualified plans and the
LTIP
, are approved annually by the Board of Directors or a committee thereof.
152
RAYMOND JAMES FINANCIAL, INC AND SUBSIDIARIES
Notes to Consolidated Financial Statements
We have a Voluntary Deferred Compensation Plan
(the “VDCP”)
, a non-qualified and voluntary opportunity for certain highly compensated employees to defer compensation. Eligible participants may elect to defer a percentage or specific dollar amount of their compensation into the
VDCP
.
COLI
is the primary source of funding for this plan.
We also maintain non-qualified deferred compensation plans or arrangements for the benefit of certain employees that provide a return to the participating employees based upon the performance of various referenced investments. Under the terms of each applicable plan or arrangement, we invest directly as a principal in such investments, which are directly related to our obligations under the respective deferred compensation plan and are included in “Other investments” in our Consolidated Statements of Financial Condition (see
Note 4
for the fair value of these investments as of
September 30, 2017
, and
2016
).
Compensation expense associated with all of the qualified and non-qualified plans described above totaled
$131 million
,
$117 million
and
$117 million
for the fiscal years ended
September 30, 2017
,
2016
and
2015
, respectively.
Share-based compensation plans
We have
one
share-based compensation plan for our employees, Board of Directors and non-employees (comprised of independent contractor financial advisors). The Amended and Restated 2012 Stock Incentive Plan (the “2012 Plan”) authorizes us to grant
40,244,000
new shares, including the shares available for grant under
six
predecessor plans. We generally issue new shares under the 2012 Plan, however we are also permitted to reissue our treasury shares.
Share-based awards granted to our independent contractor financial advisors are measured at fair value on a quarterly basis until vesting, with changes in the fair value included in compensation expense. In addition, we classify non-employee option awards as liabilities at fair value upon vesting, with changes in fair value reported in earnings until these awards are exercised or forfeited. The outstanding stock options and restricted stock units granted to our independent contractors were not material as of
September 30, 2017
.
Stock option awards
Options may be granted to key employees and employee financial advisors who achieve certain gross commission levels. Options are exercisable in the
36
th
to
84
th
months following the date of grant and only in the event that the grantee is an employee of ours or has terminated within
45 days
, disabled, deceased or, in some instances, retired. Options are granted with an exercise price equal to the market price of our stock on the grant date.
Expense and income tax benefit related to our stock options awards granted to employees and independent contractor financial advisors is presented below:
|
Year ended September 30,
|
||||||||||||
|
$ in thousands
|
2017
|
2016
|
2015
|
|||||||||
|
Total share-based expense
|
$
|
13,597
|
|
$
|
11,648
|
|
$
|
10,196
|
|
|||
|
Income tax benefit related to share-based expense
|
$
|
1,783
|
|
$
|
1,181
|
|
$
|
821
|
|
|||
For the year ended
September 30, 2017
, we realized
$3 million
of excess tax benefits related to our stock option awards which favorably impacted income tax expense in our Consolidated Statements of Income and Comprehensive Income as a result of our adoption of stock compensation simplification guidance (see
Note 2
and Note
16
for additional information on our adoption of this new accounting guidance during the period).
These amounts may not be representative of future share-based compensation expense since the estimated fair value of stock options is amortized over the requisite service period using the straight-line method and, in certain instances, the graded vesting attribution method, and additional options may be granted in future years. The fair value of each fixed employee option grant is estimated on the date of grant using the Black-Scholes option pricing model with the following weighted-average assumptions used for stock option grants in the fiscal years ended
September 30, 2017
,
2016
and
2015
:
|
Year ended September 30,
|
|||||||||
|
2017
|
2016
|
2015
|
|||||||
|
Dividend yield
|
1.03
|
%
|
1.41
|
%
|
1.30
|
%
|
|||
|
Expected volatility
|
30.91
|
%
|
28.85
|
%
|
29.55
|
%
|
|||
|
Risk-free interest rate
|
1.81
|
%
|
1.65
|
%
|
1.66
|
%
|
|||
|
Expected lives (in years)
|
5.36
|
|
5.37
|
|
5.48
|
|
|||
153
RAYMOND JAMES FINANCIAL, INC AND SUBSIDIARIES
Notes to Consolidated Financial Statements
The dividend yield assumption is based on our declared dividend as a percentage of the stock price at the date of the grant. The expected volatility assumption is based on our historical stock price and is a weighted average combining recent and historical volatility of
RJF
stock. The risk-free interest rate assumption is based on the
U.S.
Treasury yield curve in effect at the time of grant of the options. The expected lives assumption is based on the average of (1) the assumption that all outstanding options will be exercised at the midpoint between their vesting date and full contractual term and (2) the assumption that all outstanding options will be exercised at their full contractual term.
A summary of option activity for grants to employees for the fiscal year ended
September 30, 2017
is presented below:
|
Options for shares
(in thousands)
|
Weighted- average exercise price
(per share)
|
Weighted- average remaining contractual
term
(in years)
|
Aggregate intrinsic
value
($ in thousands)
|
||||||||||
|
Outstanding at October 1, 2016
|
3,710
|
|
$
|
44.88
|
|
||||||||
|
Granted
|
224
|
|
$
|
72.09
|
|
||||||||
|
Exercised
|
(1,051
|
)
|
$
|
32.22
|
|
||||||||
|
Forfeited
|
(47
|
)
|
$
|
51.62
|
|
||||||||
|
Outstanding at September 30, 2017
|
2,836
|
|
$
|
51.63
|
|
3.58
|
$
|
92,762
|
|
||||
|
Exercisable at September 30, 2017
|
451
|
|
$
|
41.62
|
|
2.37
|
$
|
19,246
|
|
||||
The following stock option activity occurred under the 2012 Plan for grants to employees:
|
Year ended September 30,
|
||||||||||||
|
$ in thousands, except per option amounts
|
2017
|
2016
|
2015
|
|||||||||
|
Weighted-average grant date fair value per option
|
$
|
19.96
|
|
$
|
13.96
|
|
$
|
14.36
|
|
|||
|
Total intrinsic value of stock options exercised
|
$
|
42,178
|
|
$
|
16,273
|
|
$
|
29,574
|
|
|||
|
Total grant date fair value of stock options vested
|
$
|
10,768
|
|
$
|
7,690
|
|
$
|
10,483
|
|
|||
Pre-tax expense not yet recognized for stock option awards granted to employees and independent contractor financial advisors, net of estimated forfeitures, and the remaining period over which the expense will be recognized as of
September 30, 2017
, are presented below:
|
|
Pre-tax expense not yet recognized
(in thousands)
|
Remaining weighted-average amortization period
(in years)
|
||||
|
Employees
|
$
|
14,655
|
|
2.5
|
||
|
Independent contractor financial advisors
|
$
|
2,904
|
|
3.0
|
||
Cash received from stock option exercises during the fiscal year ended
September 30, 2017
was
$31 million
.
Restricted stock and restricted stock unit awards
We may grant awards under the 2012 Plan in connection with initial employment or under various retention programs for individuals who are responsible for a contribution to our management, growth, and/or profitability. Through our Canadian subsidiary, we established a trust fund, which we funded to enable the trust fund to acquire our common stock in the open market to be used to settle RSUs granted as a retention vehicle for certain employees of the Canadian subsidiary (see
Note 10
for discussion of our consolidation of this trust fund, which is a
VIE
). We may also grant awards to officers and certain other employees in lieu of cash for
10%
to
50%
of annual bonus amounts in excess of
$250,000
. Under the plan, the awards are generally restricted for a
three
to
five
year period, during which time the awards are forfeitable in the event of termination other than for death, disability or retirement.
Prior to February 2011, non-employee members of our Board of Directors had been granted stock option awards annually. Commencing in February 2011, RSUs are issued annually to such members of our Board of Directors, in lieu of stock option awards. The RSUs granted to these Directors vest over a
one year
period from their grant date, provided that the director is still serving on our Board of Directors at the end of such period.
154
RAYMOND JAMES FINANCIAL, INC AND SUBSIDIARIES
Notes to Consolidated Financial Statements
The following restricted equity award activity which includes restricted stock and RSUs for grants to employees and members of our Board of Directors occurred during the fiscal year ended
September 30, 2017
:
|
Shares/Units
(in thousands)
|
Weighted- average grant date fair value
(per share)
|
||||||
|
Non-vested at October 1, 2016
|
4,807
|
|
$
|
47.71
|
|
||
|
Granted
|
1,637
|
|
$
|
72.39
|
|
||
|
Vested
|
(1,587
|
)
|
$
|
38.68
|
|
||
|
Forfeited
|
(113
|
)
|
$
|
60.11
|
|
||
|
Non-vested at September 30, 2017
|
4,744
|
|
$
|
58.94
|
|
||
Expense and income tax benefits related to our restricted equity awards granted to our employees and members of our Board of Directors are presented below:
|
Year ended September 30,
|
||||||||||||
|
$ in thousands
|
2017
|
2016
|
2015
|
|||||||||
|
Total share-based expense
|
$
|
78,624
|
|
$
|
62,674
|
|
$
|
57,716
|
|
|||
|
Income tax benefits related to share-based expense
|
$
|
27,658
|
|
$
|
21,979
|
|
$
|
20,516
|
|
|||
Total share-based expense for the year ended
September 30, 2017
includes
$5 million
which is included as a component of “Acquisition-related expenses” on our Consolidated Statements of Income and Comprehensive Income. See Note 3 for additional information regarding such expense.
For the year ended
September 30, 2017
, we realized
$22 million
of excess tax benefits related to our restricted equity awards which favorably impacted income tax expense in our Consolidated Statements of Income and Comprehensive Income as a result of our adoption of stock compensation simplification guidance (see
Note 2
for additional information on our adoption of this new accounting guidance).
As of
September 30, 2017
, there was
$125 million
of total pre-tax compensation cost not yet recognized, net of estimated forfeitures, related to restricted equity awards granted to employees and members of our Board of Directors. These costs are expected to be recognized over a weighted-average period of approximately
3.1
years. The total fair value of shares and unit awards vested under this plan during the year ended
September 30, 2017
was
$59 million
.
There are
no
outstanding RSUs related to our independent contractor financial advisors as of
September 30, 2017
.
Restricted stock awards associated with Alex. Brown
As part of our acquisition of Alex. Brown, we assumed certain
DBRSU
awards, including the associated plan terms and conditions. The
DBRSU
awards contain performance conditions based on Deutsche Bank and subsidiaries attaining certain financial results and will ultimately be settled in
DB
common stock, as traded on the
NYSE
, provided the performance metrics are achieved. These awards are generally restricted for a
three
to
six
year period from their grant date, during which time the awards are subject to forfeiture in the event of termination other than for death, disability or retirement. The
DBRSU
s are accounted for as a derivative. See
Note 6
for additional information regarding these derivatives.
The following table details the
DBRSU
activity for the year ended
September 30, 2017
:
|
Units
(in thousands)
|
|||
|
Non-vested DBRSUs at October 1, 2016
|
1,358
|
|
|
|
DB rights offering
|
163
|
|
|
|
Forfeited
|
(28
|
)
|
|
|
Non-vested DBRSUs at September 30, 2017
|
1,493
|
|
|
The per unit fair value of the
DBRSU
s at the AB Closing Date was
$14.90
, and the
DBRSU
s per unit fair value as of
September 30, 2017
was
$17.28
.
As of
September 30, 2017
, there was a
$10 million
prepaid compensation asset included in “Other assets” in our Consolidated Statements of Financial Condition related to these
DBRSU
s (see
Note 9
). This asset is expected to be amortized over a weighted-average period
155
RAYMOND JAMES FINANCIAL, INC AND SUBSIDIARIES
Notes to Consolidated Financial Statements
of approximately
two years
. As of
September 30, 2017
, there was a
$26 million
derivative liability included in “Derivative liabilities” in our Consolidated Statements of Financial Condition based on the
September 30, 2017
per share price of
DB
shares of
$17.28
.
The net impact of the
DBRSU
s in our Consolidated Statements of Income and Comprehensive Income, including the related income tax effects, is presented below:
|
Year ended September 30,
|
||||||||
|
$ in thousands
|
2017
|
2016
|
||||||
|
Amortization of DBRSU prepaid compensation asset
|
$
|
5,270
|
|
$
|
355
|
|
||
|
Increase/(decrease) in fair value of derivative liability
|
8,031
|
|
(2,457
|
)
|
||||
|
Net expense/(gain) before tax
|
$
|
13,301
|
|
$
|
(2,102
|
)
|
||
|
Income tax expense
|
$
|
4,963
|
|
$
|
799
|
|
||
Included in the table above is the impact of a DB right offering during the year ended
September 30, 2017
, which increased the fair value of the derivative liability due to the DBRSU plan terms and conditions, and was reported in “Acquisition-related expenses” on the Consolidated Statements of Income and Comprehensive Income. Also includes the impact of DBRSUs forfeited during the year ended
September 30, 2017
.
We hold shares of
DB
as of
September 30, 2017
as an economic hedge against this obligation. Such shares are included in “Other investments” on our Consolidated Statements of Financial Condition. The gains/losses on this hedge are included as a component of “Compensation, commissions and benefits expense” or “Acquisition-related expenses” as applicable, and offsets a portion of the gain/losses on the
DBRSU
s incurred during the periods discussed above.
Employee stock purchase plan
Under the 2003 Employee Stock Purchase Plan, we are authorized to issue up to
7,375,000
shares of common stock to our full-time employees, nearly all of whom are eligible to participate. Under the terms of the plan, share purchases in any calendar year are limited to the lesser of
1,000
shares or shares with a fair value of
$25,000
. The purchase price of the stock is
85%
of the average high and low market price on the day prior to the purchase date. Under the plan we sold approximately
343,000
,
557,000
and
430,000
shares to employees during the years ended
September 30, 2017
,
2016
and
2015
, respectively. The compensation cost is calculated as the value of the
15%
discount from market value and was
$4 million
for each of the fiscal years ended
September 30, 2017
,
2016
and
2015
.
Non-employee other compensation
We offer non-qualified deferred compensation plans that provide benefits to our independent contractor financial advisors who meet certain production requirements. COLI is the primary source of funding for this plan. The contributions are made in amounts approved annually by management.
Certain independent contractor financial advisors are also eligible to participate in our
VDCP
. Eligible participants may elect to defer a percentage or specific dollar amount of their compensation into the
VDCP
.
COLI
is the primary source of funding for this plan.
RJF
, as a bank holding company and financial holding company,
RJ Bank
, and our broker-dealer subsidiaries are subject to capital requirements by various regulatory authorities. Capital levels of each entity are monitored to ensure compliance with our various regulatory capital requirements. Failure to meet minimum capital requirements can initiate certain mandatory, and possibly additional discretionary, actions by regulators that, if undertaken, could have a direct material effect on our financial results.
As a bank holding company,
RJF
is subject to the risk-based capital requirements of the Federal Reserve Board. These risk-based capital requirements are expressed as capital ratios that compare measures of regulatory capital to risk-weighted assets, which involve quantitative measures of our assets, liabilities, and certain off-balance-sheet items as calculated under regulatory accounting guidelines.
RJF
’s and
RJ Bank
’s capital amounts and classification are also subject to qualitative judgments by the regulators about components, risk-weightings, and other factors.
In July 2013, the
OCC
,
the Fed
and the
FDIC
released final
U.S.
rules implementing the Basel III capital framework developed by the Basel Committee on Banking Supervision and certain Dodd-Frank Act and other capital provisions and updated the prompt corrective action framework to reflect the new regulatory capital minimums (the “U.S. Basel III Rules”).
RJF
and
RJ Bank
report regulatory
156
RAYMOND JAMES FINANCIAL, INC AND SUBSIDIARIES
Notes to Consolidated Financial Statements
capital under the Basel III standardized approach. Various aspects of the Basel III rules are subject to multi-year transition periods through December 31, 2018.
RJF
and
RJ Bank
are required to maintain minimum amounts and ratios of Total and Tier 1 capital (as defined in the regulations) to risk-weighted assets (as defined), Tier 1 capital to average assets (as defined), and under rules defined in Basel III, Common equity Tier 1 capital (“CET1”) to risk-weighted assets.
RJF
and
RJ Bank
each calculate these ratios in order to assess compliance with both regulatory requirements and their internal capital policies. Effective January 1, 2016, the minimum
CET1
, Tier 1 Capital, and Total Capital ratios of
RJF
and
RJ Bank
are supplemented by an incremental capital conservation buffer, consisting entirely of capital that qualifies as
CET1
, that phases in beginning on January 1, 2016 in increments of
0.625%
per year until it reaches
2.5%
of risk weighted assets on January 1, 2019. Failure to maintain the capital conservation buffer could limit our ability to take certain capital actions, including dividends and common equity repurchases, and to make discretionary bonus payments. As of
September 30, 2017
, both
RJF
’s and
RJ Bank
’s capital levels exceeded the fully-phased in capital conservation buffer requirement, and are each categorized as “well capitalized.”
To meet requirements for capital adequacy purposes or to be categorized as “well capitalized,”
RJF
must maintain minimum
CET1
, Tier 1 capital, Total capital, and Tier 1 leverage amounts and ratios as set forth in the table below.
|
|
Actual
|
Requirement for capital
adequacy purposes
|
To be well capitalized under regulatory provisions
|
||||||||||||||||||
|
$ in thousands
|
Amount
|
Ratio
|
Amount
|
Ratio
|
Amount
|
Ratio
|
|||||||||||||||
|
RJF as of September 30, 2017:
|
|||||||||||||||||||||
|
CET1
|
$
|
5,081,335
|
|
23.0
|
%
|
$
|
994,950
|
|
4.5
|
%
|
$
|
1,437,150
|
|
6.5
|
%
|
||||||
|
Tier 1 capital
|
$
|
5,081,335
|
|
23.0
|
%
|
$
|
1,326,600
|
|
6.0
|
%
|
$
|
1,768,800
|
|
8.0
|
%
|
||||||
|
Total capital
|
$
|
5,293,331
|
|
23.9
|
%
|
$
|
1,768,800
|
|
8.0
|
%
|
$
|
2,211,000
|
|
10.0
|
%
|
||||||
|
Tier 1 leverage
|
$
|
5,081,335
|
|
15.0
|
%
|
$
|
1,359,168
|
|
4.0
|
%
|
$
|
1,698,960
|
|
5.0
|
%
|
||||||
|
RJF as of September 30, 2016:
|
|
|
|
|
|
|
|||||||||||||||
|
CET1
|
$
|
4,421,956
|
|
20.6
|
%
|
$
|
966,341
|
|
4.5
|
%
|
$
|
1,395,825
|
|
6.5
|
%
|
||||||
|
Tier 1 capital
|
$
|
4,421,956
|
|
20.6
|
%
|
$
|
1,288,454
|
|
6.0
|
%
|
$
|
1,717,939
|
|
8.0
|
%
|
||||||
|
Total capital
|
$
|
4,636,009
|
|
21.6
|
%
|
$
|
1,717,939
|
|
8.0
|
%
|
$
|
2,147,424
|
|
10.0
|
%
|
||||||
|
Tier 1 leverage
|
$
|
4,421,956
|
|
15.0
|
%
|
$
|
1,177,840
|
|
4.0
|
%
|
$
|
1,472,300
|
|
5.0
|
%
|
||||||
The increase in
RJF
’s Total capital and Tier 1 capital ratios at
September 30, 2017
compared to
September 30, 2016
was primarily the result of positive earnings during the year ended
September 30, 2017
, partially offset by the growth of
RJ Bank
’s assets, primarily bank loans.
To meet the requirements for capital adequacy or to be categorized as “well capitalized,”
RJ Bank
must maintain
CET1
, Tier 1 capital, Total capital, and Tier 1 leverage amounts and ratios as set forth in the table below.
|
|
Actual
|
Requirement for capital
adequacy purposes
|
To be well capitalized under regulatory provisions
|
||||||||||||||||||
|
$ in thousands
|
Amount
|
Ratio
|
Amount
|
Ratio
|
Amount
|
Ratio
|
|||||||||||||||
|
RJ Bank as of September 30, 2017:
|
|
|
|
|
|
|
|||||||||||||||
|
CET1
|
$
|
1,821,306
|
|
12.5
|
%
|
$
|
654,901
|
|
4.5
|
%
|
$
|
945,968
|
|
6.5
|
%
|
||||||
|
Tier 1 capital
|
$
|
1,821,306
|
|
12.5
|
%
|
$
|
873,201
|
|
6.0
|
%
|
$
|
1,164,268
|
|
8.0
|
%
|
||||||
|
Total capital
|
$
|
2,003,461
|
|
13.8
|
%
|
$
|
1,164,268
|
|
8.0
|
%
|
$
|
1,455,335
|
|
10.0
|
%
|
||||||
|
Tier 1 leverage
|
$
|
1,821,306
|
|
8.9
|
%
|
$
|
816,304
|
|
4.0
|
%
|
$
|
1,020,379
|
|
5.0
|
%
|
||||||
|
RJ Bank as of September 30, 2016:
|
|
|
|
|
|
|
|
|
|
|
|
|
|||||||||
|
CET1
|
$
|
1,675,890
|
|
12.7
|
%
|
$
|
592,864
|
|
4.5
|
%
|
$
|
856,360
|
|
6.5
|
%
|
||||||
|
Tier 1 capital
|
$
|
1,675,890
|
|
12.7
|
%
|
$
|
790,486
|
|
6.0
|
%
|
$
|
1,053,981
|
|
8.0
|
%
|
||||||
|
Total capital
|
$
|
1,841,112
|
|
14.0
|
%
|
$
|
1,053,981
|
|
8.0
|
%
|
$
|
1,317,476
|
|
10.0
|
%
|
||||||
|
Tier 1 leverage
|
$
|
1,675,890
|
|
9.9
|
%
|
$
|
675,939
|
|
4.0
|
%
|
$
|
844,924
|
|
5.0
|
%
|
||||||
The decrease in
RJ Bank
’s Total and Tier 1 capital ratios at
September 30, 2017
compared to
September 30, 2016
was primarily due to growth in assets, primarily bank loans.
157
RAYMOND JAMES FINANCIAL, INC AND SUBSIDIARIES
Notes to Consolidated Financial Statements
Our intention is to maintain
RJ Bank
’s “well capitalized” status. In the unlikely event that
RJ Bank
failed to maintain its “well capitalized” status, the consequences could include a requirement to obtain a waiver from the
FDIC
prior to acceptance, renewal, or rollover of brokered deposits and higher
FDIC
premiums, but would not have a significant impact on our operations.
RJ Bank
may pay dividends to the parent company without prior approval of its regulator as long as the dividend does not exceed the sum of
RJ Bank
’s current calendar year and the previous two calendar years’ retained net income, and
RJ Bank
maintains its targeted regulatory capital ratios.
Certain of our broker-dealer subsidiaries are subject to the requirements of the Uniform Net Capital Rule (Rule 15c3-1) under the Securities Exchange Act of 1934.
RJ&A
and
RJFS
, each being member firms of the Financial Industry Regulatory Authority
(“FINRA”)
, are subject to the rules of
FINRA
, whose capital requirements are substantially the same as Rule 15c3-1. Rule 15c3-1 requires that aggregate indebtedness, as defined, not exceed
15
times net capital, as defined. Rule 15c3-1 also provides for an “alternative net capital requirement,” which
RJ&A
and
RJFS
have each elected. Regulations require that minimum net capital, as defined, be equal to the greater of
$1 million
, (
$250 thousand
for
RJFS
as of
September 30, 2017
) or
two
percent of aggregate debit items arising from client balances.
FINRA
may require a member firm to reduce its business if its net capital is less than
four
percent of aggregate debit items and may prohibit a member firm from expanding its business and declaring cash dividends if its net capital is less than
five
percent of aggregate debit items.
The following table presents the net capital position of
RJ&A
:
|
September 30,
|
||||||||
|
$ in thousands
|
2017
|
2016
|
||||||
|
Raymond James & Associates, Inc.:
|
|
|
||||||
|
(Alternative Method elected)
|
|
|
||||||
|
Net capital as a percent of aggregate debit items
|
21.37
|
%
|
19.61
|
%
|
||||
|
Net capital
|
$
|
589,420
|
|
$
|
512,594
|
|
||
|
Less: required net capital
|
(55,164
|
)
|
(52,287
|
)
|
||||
|
Excess net capital
|
$
|
534,256
|
|
$
|
460,307
|
|
||
The following table presents the net capital position of
RJFS
:
|
September 30,
|
||||||||
|
$ in thousands
|
2017
|
2016
|
||||||
|
Raymond James Financial Services, Inc.:
|
|
|
||||||
|
(Alternative Method elected)
|
|
|
||||||
|
Net capital
|
$
|
34,488
|
|
$
|
27,013
|
|
||
|
Less: required net capital
|
(250
|
)
|
(250
|
)
|
||||
|
Excess net capital
|
$
|
34,238
|
|
$
|
26,763
|
|
||
RJ Ltd.
is subject to the Minimum Capital Rule (Dealer Member Rule No. 17 of the Investment Industry Regulatory Organization of Canada (“IIROC”)) and the Early Warning System (Dealer Member Rule No. 30 of the
IIROC
). The Minimum Capital Rule requires that every member shall have and maintain at all times risk-adjusted capital greater than zero calculated in accordance with Form 1 (Joint Regulatory Financial Questionnaire and Report) and with such requirements as the Board of Directors of the
IIROC
may from time to time prescribe. Insufficient risk-adjusted capital may result in suspension from membership in the stock exchanges or the
IIROC
.
The Early Warning System is designed to provide advance warning that a member firm is encountering financial difficulties. This system imposes certain sanctions on members who are designated in Early Warning Level 1 or Level 2 according to their capital, profitability, liquidity position, frequency of designation or at the discretion of the
IIROC
. Restrictions on business activities and capital transactions, early filing requirements, and mandated corrective measures are sanctions that may be imposed as part of the Early Warning System.
RJ Ltd.
was not in Early Warning Level 1 or Level 2 at either
September 30, 2017
or
2016
.
158
RAYMOND JAMES FINANCIAL, INC AND SUBSIDIARIES
Notes to Consolidated Financial Statements
The following table presents the risk adjusted capital of
RJ Ltd.
(in Canadian dollars):
|
September 30,
|
||||||||
|
$ in thousands
|
2017
|
2016
|
||||||
|
Raymond James Ltd.:
|
|
|
||||||
|
Risk adjusted capital before minimum
|
$
|
108,985
|
|
$
|
77,110
|
|
||
|
Less: required minimum capital
|
(250
|
)
|
(250
|
)
|
||||
|
Risk adjusted capital
|
$
|
108,735
|
|
$
|
76,860
|
|
||
Raymond James Trust, N.A., (“RJ Trust”) is regulated by the
OCC
and is required to maintain sufficient capital. As of
September 30, 2017
and
2016
,
RJ Trust
met the requirements.
As of
September 30, 2017
, all of our other active regulated domestic and international subsidiaries were in compliance with and met all applicable capital requirements.
RJF
expects to continue paying cash dividends. However, the payment and rate of dividends on our common stock is subject to several factors including our operating results, financial and regulatory requirements or restrictions, and the availability of funds from our subsidiaries, including our broker-dealer and bank subsidiaries, which may also be subject to restrictions under regulatory capital rules. The availability of funds from subsidiaries may also be subject to restrictions contained in loan covenants of certain broker-dealer loan agreements and restrictions by bank regulators on dividends to the parent from
RJ Bank
.
In the normal course of business, we purchase and sell securities as either principal or agent on behalf of our clients. If either the client or counterparty fails to perform, we may be required to discharge the obligations of the nonperforming party. In such circumstances, we may sustain a loss if the market value of the security or futures contract is different from the contract value of the transaction.
The majority of our transactions and, consequently, the concentration of our credit exposure, is with clients, broker-dealers and other financial institutions in the
U.S.
These activities primarily involve collateralized financings and may result in credit exposure in the event that the counterparty fails to meet its contractual obligations. Our exposure to credit risk can be directly impacted by volatile securities markets, which may impair the ability of counterparties to satisfy their contractual obligations. We seek to control our credit risk through a variety of reporting and control procedures, including establishing credit limits based upon a review of the counterparties’ financial condition and credit ratings. We monitor collateral levels on a daily basis for compliance with regulatory and internal guidelines and request changes in collateral levels as appropriate.
Commitments to extend credit and other credit-related financial instruments
RJ Bank has outstanding at any time a significant number of commitments to extend credit and other credit-related off-balance sheet financial instruments such as standby letters of credit and loan purchases, which then extend over varying periods of time. These arrangements are subject to strict underwriting assessments and each customer’s credit worthiness is evaluated on a case-by-case basis. Fixed-rate commitments are also subject to market risk resulting from fluctuations in interest rates and our exposure is limited to the replacement value of those commitments.
The following table presents RJ Bank’s commitments to extend credit and other credit-related off-balance sheet financial instruments outstanding:
|
September 30,
|
||||||||
|
$ in thousands
|
2017
|
2016
|
||||||
|
Standby letters of credit
|
$
|
39,670
|
|
$
|
29,686
|
|
||
|
Open-end consumer lines of credit (primarily SBL)
|
$
|
5,323,003
|
|
$
|
3,616,933
|
|
||
|
Commercial lines of credit
|
$
|
1,673,272
|
|
$
|
1,430,630
|
|
||
|
Unfunded loan commitments
|
$
|
386,950
|
|
$
|
354,556
|
|
||
In the normal course of business, RJ Bank issues or participates in the issuance of standby letters of credit whereby it provides an irrevocable guarantee of payment in the event the letter of credit is drawn down by the beneficiary. These standby letters of credit generally expire in
one year
or less. As of
September 30, 2017
,
$40 million
of such letters of credit were outstanding. In the event that a letter of credit is drawn down, RJ Bank would pursue repayment from the party under the existing borrowing relationship or
159
RAYMOND JAMES FINANCIAL, INC AND SUBSIDIARIES
Notes to Consolidated Financial Statements
would liquidate collateral, or both. The proceeds from repayment or liquidation of collateral are expected to satisfy the amounts drawn down under the existing letters of credit. The credit risk involved in issuing letters of credit is essentially the same as that involved with extending loan commitments to clients and, accordingly, we use a credit evaluation process and collateral requirements similar to those for loan commitments.
Open end consumer lines of credit primarily represent the unfunded amounts of RJ Bank loans to customers that are secured by marketable securities at advance rates consistent with industry standards. The proceeds from repayment or, if necessary, the liquidation of collateral, which is monitored daily, are expected to satisfy the amounts drawn against these existing lines of credit.
Because many of our lending commitments expire without being funded in whole or part, the contract amounts are not estimates of our actual future credit exposure or future liquidity requirements. We maintain a reserve to provide for potential losses related to the unfunded lending commitments. See
Note 8
for further discussion of this reserve for unfunded lending commitments. Credit risk represents the accounting loss that would be recognized at the reporting date if counterparties failed completely to perform as contracted. The credit risk amounts are equal to the contractual amounts, assuming that the amounts are fully advanced and that the collateral or other security is of no value. We use the same credit approval and monitoring process in extending loan commitments and other credit-related off-balance sheet instruments as we do in making loans.
Securities loaned and Securities borrowed
We act as an intermediary between broker-dealers and other financial institutions whereby we borrow securities from one broker-dealer and then lend them to another. Where permitted, we have also loaned, to broker-dealers and other financial institutions, securities owned by clients and others for which we have received cash or other collateral. We measure the market value of the securities borrowed and loaned against the amount of cash posted or received on a daily basis. Additional cash is obtained as necessary to ensure such transactions are adequately collateralized. If another party to the transaction fails to perform as agreed we may incur a loss if the market value of the security is different from the contract amount of the transaction. For example, if a borrowing institution or broker-dealer does not return a security, we may be obligated to purchase the security in order to return it to the owner. In such circumstances, we may incur a loss equal to the amount by which the market value of the security on the date of nonperformance exceeds the value of the collateral received from the financial institution or the broker-dealer. See
Note 7
for more information on our securities borrowed and securities loaned.
Financial instruments sold, but not yet purchased
We have sold securities that we do not currently own and will, therefore, be obligated to borrow, purchase or enter into a reverse repurchase agreement for such securities at a future date. These securities are recorded at fair value and are included in “Trading instruments sold, but not yet purchased” in our Consolidated Statements of Financial Condition (see Notes
2
and
4
for further information). In certain cases, we utilize short positions to economically hedge long inventory positions. We may be subject to loss if the market value of a short position increases by more than the market value of the hedged long position or if the short position is not covered by a long hedged position.
We also enter into security transactions on behalf of our clients and other financial institutions involving forward settlement. Forward contracts provide for the delayed delivery of the underlying instrument. The contractual amounts related to these financial instruments reflect the volume and activity and do not reflect the amounts at risk. The gain or loss on these transactions is recognized on a trade date basis. Transactions involving future settlement give rise to market risk, which represents the potential loss that could be caused by a change in the market value of a particular financial instrument. Our exposure to market risk is determined by a number of factors, including the duration, size, composition and diversification of positions held, the absolute and relative levels of interest rates, and market volatility. The credit risk for these transactions is limited to the unrealized market valuation gains recorded in the Consolidated Statements of Financial Condition.
As a part of our fixed income public finance operations, we enter into forward commitments to purchase
GNMA
or
FNMA
MBS
. See
Note 2
and
Note 17
for information on these commitments. We utilize
TBA
security contracts to hedge our interest rate risk associated with these commitments. We are subject to loss if the timing of, or the actual amount of, the
MBS
differs significantly from the term and notional amount of the
TBA
security contracts we enter into.
Forward foreign exchange contracts
RJ Ltd.
is subject to foreign exchange risk primarily due to financial instruments denominated in
U.S.
dollars that may be impacted by fluctuation in foreign exchange rates. In order to mitigate this risk,
RJ Ltd.
enters into forward foreign exchange contracts. The fair value of these contracts is not significant. As of
September 30, 2017
, forward contracts outstanding to buy and sell
U.S.
dollars totaled
160
RAYMOND JAMES FINANCIAL, INC AND SUBSIDIARIES
Notes to Consolidated Financial Statements
CDN
$3 million
and
CDN
$5 million
, respectively.
RJ Bank
is also subject to foreign exchange risk related to its net investment in a Canadian subsidiary. See
Note 6
for information regarding how
RJ Bank
utilizes derivatives to mitigate a significant portion of this risk.
The following table presents the computation of basic and diluted earnings per share:
|
|
Year ended September 30,
|
|||||||||||
|
$ in thousands, except per share amounts
|
2017
|
2016
|
2015
|
|||||||||
|
Income for basic earnings per common share:
|
||||||||||||
|
Net income attributable to RJF
|
$
|
636,235
|
|
$
|
529,350
|
|
$
|
502,140
|
|
|||
|
Less allocation of earnings and dividends to participating securities
|
(1,376
|
)
|
(1,256
|
)
|
(1,610
|
)
|
||||||
|
Net income attributable to RJF common shareholders
|
$
|
634,859
|
|
$
|
528,094
|
|
$
|
500,530
|
|
|||
|
Income for diluted earnings per common share:
|
|
|
|
|
|
|
||||||
|
Net income attributable to RJF
|
$
|
636,235
|
|
$
|
529,350
|
|
$
|
502,140
|
|
|||
|
Less allocation of earnings and dividends to participating securities
|
(1,350
|
)
|
(1,236
|
)
|
(1,580
|
)
|
||||||
|
Net income attributable to RJF common shareholders
|
$
|
634,885
|
|
$
|
528,114
|
|
$
|
500,560
|
|
|||
|
Common shares:
|
|
|
|
|
|
|
||||||
|
Average common shares in basic computation
|
143,275
|
|
141,773
|
|
142,548
|
|
||||||
|
Dilutive effect of outstanding stock options and certain restricted stock units
|
3,372
|
|
2,740
|
|
3,391
|
|
||||||
|
Average common shares used in diluted computation
|
146,647
|
|
144,513
|
|
145,939
|
|
||||||
|
Earnings per common share:
|
|
|
|
|
|
|
||||||
|
Basic
|
$
|
4.43
|
|
$
|
3.72
|
|
$
|
3.51
|
|
|||
|
Diluted
|
$
|
4.33
|
|
$
|
3.65
|
|
$
|
3.43
|
|
|||
|
Stock options and certain restricted stock units excluded from weighted-average diluted common shares because their effect would be antidilutive
|
1,657
|
|
3,255
|
|
2,849
|
|
||||||
The allocation of earnings and dividends to participating securities in the above table represents dividends paid during the year to participating securities plus an allocation of undistributed earnings to participating securities. Participating securities represent unvested restricted stock and certain restricted stock units and amounted to weighted-average shares of
317 thousand
,
346 thousand
and
464 thousand
for the years ended
September 30, 2017
,
2016
and
2015
, respectively. Dividends paid to participating securities were insignificant for the years ended
September 30, 2017
,
2016
, and
2015
. Undistributed earnings are allocated to participating securities based upon their right to share in earnings if all earnings for the period had been distributed.
Dividends per common share declared and paid are as follows:
|
|
Year ended September 30,
|
|||||||||||
|
|
2017
|
2016
|
2015
|
|||||||||
|
Dividends per common share - declared
|
$
|
0.88
|
|
$
|
0.80
|
|
$
|
0.72
|
|
|||
|
Dividends per common share - paid
|
$
|
0.86
|
|
$
|
0.78
|
|
$
|
0.70
|
|
|||
We currently operate through the following
five
business segments: “Private Client Group;” “Capital Markets;” “Asset Management;” RJ Bank; and “Other.”
The business segments are determined based upon factors such as the services provided and the distribution channels served and are consistent with how we assess performance and determine how to allocate our resources throughout our subsidiaries. The financial results of our segments are presented using the same policies as those described in
Note 2
, “Summary of Significant Accounting Policies.” Segment results include charges allocating most corporate overhead and benefits to each segment. Refer to the discussion of the Other segment below for a description of the corporate expenses that are not allocated to segments. Intersegment revenues, expenses, receivables and payables are eliminated upon consolidation.
161
RAYMOND JAMES FINANCIAL, INC AND SUBSIDIARIES
Notes to Consolidated Financial Statements
The Private Client Group segment includes the retail branches of our broker-dealer subsidiaries located throughout the
U.S.
, Canada and the United Kingdom. These branches provide securities brokerage services including the sale of equities, mutual funds, fixed income products and insurance products to their individual clients. The segment includes net interest earnings on client margin loans and cash balances and certain fee revenues generated by the multi-bank aspect of the
RJBDP
. Additionally, this segment includes the activities associated with the borrowing and lending of securities to and from other broker-dealers, financial institutions and other counterparties, generally as an intermediary or to facilitate
RJ&A
’s clearance and settlement obligations, and the correspondent clearing services that we provide to other broker-dealer firms.
The Capital Markets segment includes institutional sales and trading in the
U.S.
, Canada and Europe. We provide securities brokerage, trading, and research services to institutions with an emphasis on the sale of
U.S.
and Canadian equities and fixed income products. This segment also includes our management of and participation in debt and equity underwritings, merger & acquisition services, public finance activities, and the operations of
RJTCF
.
The Asset Management segment includes the operations of
Eagle
, the Eagle Family of Funds, the asset management services division of
RJ&A
, trust services of RJ Trust, and other fee-based asset management programs.
RJ Bank
provides corporate loans (C&I, CRE and CRE construction), SBL, tax-exempt and residential loans.
RJ Bank
is active in corporate loan syndications and participations.
RJ Bank
also provides
FDIC
insured deposit accounts to clients of our broker-dealer subsidiaries and to the general public.
RJ Bank
generates net interest revenue principally through the interest income earned on loans and investments, which is offset by the interest expense it pays on client deposits and on its borrowings.
The Other segment includes the results of our private equity activities as well as certain corporate overhead costs of
RJF
that are not allocated to operating segments including the interest costs on our public debt, losses on extinguishment of debt and the acquisition and integration costs associated with certain acquisitions (see
Note 3
for additional information).
The following table presents information concerning operations in these segments of business:
|
Year ended September 30,
|
||||||||||||
|
$ in thousands
|
2017
|
2016
|
2015
|
|||||||||
|
Revenues:
|
||||||||||||
|
Private Client Group
|
$
|
4,437,588
|
|
$
|
3,626,718
|
|
$
|
3,519,558
|
|
|||
|
Capital Markets
|
1,034,235
|
|
1,017,151
|
|
976,580
|
|
||||||
|
Asset Management
|
487,735
|
|
404,421
|
|
392,378
|
|
||||||
|
RJ Bank
|
627,845
|
|
517,243
|
|
425,988
|
|
||||||
|
Other
|
65,498
|
|
46,291
|
|
66,967
|
|
||||||
|
Intersegment eliminations
|
(128,026
|
)
|
(90,704
|
)
|
(71,791
|
)
|
||||||
|
Total revenues
|
$
|
6,524,875
|
|
$
|
5,521,120
|
|
$
|
5,309,680
|
|
|||
|
Income/(loss) excluding noncontrolling interests and before provision for income taxes:
|
||||||||||||
|
Private Client Group
|
$
|
372,950
|
|
$
|
340,564
|
|
$
|
342,243
|
|
|||
|
Capital Markets
|
141,236
|
|
139,173
|
|
107,009
|
|
||||||
|
Asset Management
|
171,736
|
|
132,158
|
|
135,050
|
|
||||||
|
RJ Bank
|
409,303
|
|
337,296
|
|
278,721
|
|
||||||
|
Other
|
(169,879
|
)
|
(148,548
|
)
|
(64,849
|
)
|
||||||
|
Pre-tax income excluding noncontrolling interests
|
925,346
|
|
800,643
|
|
798,174
|
|
||||||
|
Net income attributable to noncontrolling interests
|
2,632
|
|
11,301
|
|
16,438
|
|
||||||
|
Income including noncontrolling interests and before provision for income taxes
|
$
|
927,978
|
|
$
|
811,944
|
|
$
|
814,612
|
|
|||
No individual client accounted for more than
ten
percent of total revenues in any of the years presented.
162
RAYMOND JAMES FINANCIAL, INC AND SUBSIDIARIES
Notes to Consolidated Financial Statements
|
Year ended September 30,
|
||||||||||||
|
$ in thousands
|
2017
|
2016
|
2015
|
|||||||||
|
Net interest income/(expense):
|
||||||||||||
|
Private Client Group
|
$
|
136,756
|
|
$
|
97,042
|
|
$
|
88,842
|
|
|||
|
Capital Markets
|
6,543
|
|
9,432
|
|
9,589
|
|
||||||
|
Asset Management
|
623
|
|
183
|
|
127
|
|
||||||
|
RJ Bank
|
574,796
|
|
478,690
|
|
403,578
|
|
||||||
|
Other
|
(70,370
|
)
|
(61,006
|
)
|
(64,928
|
)
|
||||||
|
Net interest income
|
$
|
648,348
|
|
$
|
524,341
|
|
$
|
437,208
|
|
|||
The following table presents our total assets on a segment basis:
|
September 30,
|
||||||||
|
$ in thousands
|
2017
|
2016
|
||||||
|
Total assets:
|
||||||||
|
Private Client Group
|
$
|
9,967,320
|
|
$
|
10,317,681
|
|
||
|
Capital Markets
|
2,396,033
|
|
2,957,319
|
|
||||
|
Asset Management
|
151,111
|
|
133,190
|
|
||||
|
RJ Bank
|
20,611,898
|
|
16,613,391
|
|
||||
|
Other
|
1,757,094
|
|
1,465,395
|
|
||||
|
Total
|
$
|
34,883,456
|
|
$
|
31,486,976
|
|
||
Total assets in the PCG segment included
$277 million
and
$276 million
of goodwill at
September 30, 2017
and
2016
, respectively. Total assets in the Capital Markets segment included
$134 million
and
$133 million
of goodwill at
September 30, 2017
and
2016
, respectively.
We have operations in the
U.S.
, Canada and Europe. Substantially all long-lived assets are located in the
U.S.
Revenues and income before provision for income taxes and excluding noncontrolling interests, classified by major geographic areas in which they are earned, are as follows:
|
|
Year ended September 30,
|
|||||||||||
|
$ in thousands
|
2017
|
2016
|
2015
|
|||||||||
|
Revenues:
|
|
|
||||||||||
|
United States
|
$
|
6,057,971
|
|
$
|
5,119,536
|
|
$
|
4,912,820
|
|
|||
|
Canada
|
354,685
|
|
278,652
|
|
279,200
|
|
||||||
|
Europe
|
107,831
|
|
85,718
|
|
85,289
|
|
||||||
|
Other
|
4,388
|
|
37,214
|
|
32,371
|
|
||||||
|
Total
|
$
|
6,524,875
|
|
$
|
5,521,120
|
|
$
|
5,309,680
|
|
|||
|
Pre-tax income/(loss) excluding noncontrolling interests:
|
|
|
|
|
||||||||
|
United States
|
$
|
919,324
|
|
$
|
778,351
|
|
$
|
784,517
|
|
|||
|
Canada
|
14,138
|
|
20,243
|
|
17,770
|
|
||||||
|
Europe
|
(3,577
|
)
|
(3,791
|
)
|
(6,852
|
)
|
||||||
|
Other
|
(4,539
|
)
|
5,840
|
|
2,739
|
|
||||||
|
Total
|
$
|
925,346
|
|
$
|
800,643
|
|
$
|
798,174
|
|
|||
Our total assets, classified by major geographic area in which they are held, are presented below:
|
September 30,
|
||||||||
|
$ in thousands
|
2017
|
2016
|
||||||
|
Total assets:
|
|
|||||||
|
United States
|
$
|
32,200,852
|
|
$
|
29,112,182
|
|
||
|
Canada
|
2,592,480
|
|
2,275,056
|
|
||||
|
Europe
|
81,090
|
|
61,067
|
|
||||
|
Other
|
9,034
|
|
38,671
|
|
||||
|
Total
|
$
|
34,883,456
|
|
$
|
31,486,976
|
|
||
163
RAYMOND JAMES FINANCIAL, INC AND SUBSIDIARIES
Notes to Consolidated Financial Statements
Total assets in the United States included
$356 million
of goodwill at
September 30, 2017
and
2016
, respectively. Total assets in Canada included
$45 million
and
$43 million
of goodwill at
September 30, 2017
and
2016
, respectively. Total assets in Europe included
$10 million
and
$9 million
of goodwill at
September 30, 2017
and
2016
, respectively.
As more fully described in
Note 1
,
RJF
(or the “Parent”), is a financial holding company whose subsidiaries are engaged in various financial services businesses. The Parent’s primary activities include investments in subsidiaries and corporate investments, including cash management, company-owned life insurance and private equity investments. The primary source of operating cash available to the Parent is provided by dividends from its subsidiaries.
Our principal domestic broker-dealer subsidiaries of the Parent,
RJ&A
and
RJFS
, are required by regulations to maintain a minimum amount of net capital (other non-bank subsidiaries of the Parent are also required by regulations to maintain a minimum amount of net capital, but the net capital requirements of those other subsidiaries are much less significant).
RJ&A
is further required by certain covenants in its borrowing agreements to maintain net capital equal to
10%
of aggregate debit balances. At
September 30, 2017
, each of these brokerage subsidiaries far exceeded their minimum net capital requirements (see
Note 21
for further information).
Subsidiary net assets of approximately
$2.33 billion
as of
September 30, 2017
are restricted under regulatory or other restrictions from being transferred from certain subsidiaries to the Parent without prior approval of the respective entities’ regulator.
Liquidity available to the Parent from its subsidiaries other than its broker-dealer subsidiaries and
RJ Bank
is not limited by regulatory or other restrictions; however, the available amounts are not as significant as those amounts described above. The Parent regularly receives a portion of the profits of subsidiaries, other than
RJ Bank
, as dividends.
Cash and cash equivalents of
$1.29 billion
and
$810 million
as of
September 30, 2017
and
2016
, respectively, were available to the Parent without restriction and were held directly by
RJF
in depository accounts at third party financial institutions, held in depository accounts at
RJ Bank
, or were otherwise invested by one of our subsidiaries on behalf of
RJF
. The amount held in depository accounts at
RJ Bank
was
$192 million
as of
September 30, 2017
, of which
$152 million
was available on demand and without restriction. As of
September 30, 2016
,
$350 million
was held in depository accounts at
RJ Bank
, all of which was available on demand and without restriction.
See Notes
14
,
15
,
17
and
21
for more information regarding borrowings, commitments, contingencies and guarantees, and capital and regulatory requirements of the Parent and its subsidiaries.
164
RAYMOND JAMES FINANCIAL, INC AND SUBSIDIARIES
Notes to Consolidated Financial Statements
The following table presents the Parent’s statements of financial condition:
|
September 30,
|
||||||||
|
$ in thousands
|
2017
|
2016
|
||||||
|
Assets:
|
||||||||
|
Cash and cash equivalents
|
$
|
528,397
|
|
$
|
371,978
|
|
||
|
Assets segregated pursuant to regulations
|
40,145
|
|
—
|
|
||||
|
Intercompany receivables from subsidiaries:
|
||||||||
|
Bank subsidiary
|
319
|
|
—
|
|
||||
|
Non-bank subsidiaries
(1)
|
1,166,765
|
|
1,228,046
|
|
||||
|
Investments in consolidated subsidiaries:
|
||||||||
|
Bank subsidiary
|
1,823,342
|
|
1,658,663
|
|
||||
|
Non-bank subsidiaries
|
3,448,191
|
|
3,121,410
|
|
||||
|
Property and equipment, net
|
14,457
|
|
14,891
|
|
||||
|
Goodwill and identifiable intangible assets, net
|
31,954
|
|
31,954
|
|
||||
|
Other assets
|
624,452
|
|
611,667
|
|
||||
|
Total assets
|
$
|
7,678,022
|
|
$
|
7,038,609
|
|
||
|
Liabilities and equity:
|
||||||||
|
Other payables
|
$
|
80,576
|
|
$
|
81,340
|
|
||
|
Intercompany payables to subsidiaries:
|
||||||||
|
Bank subsidiary
|
—
|
|
230
|
|
||||
|
Non-bank subsidiaries
|
52,699
|
|
13,892
|
|
||||
|
Accrued compensation and benefits
|
414,195
|
|
346,015
|
|
||||
|
Senior notes payable
|
1,548,839
|
|
1,680,587
|
|
||||
|
Total liabilities
|
2,096,309
|
|
2,122,064
|
|
||||
|
Equity
|
5,581,713
|
|
4,916,545
|
|
||||
|
Total liabilities and equity
|
$
|
7,678,022
|
|
$
|
7,038,609
|
|
||
|
(1)
|
Of the total receivable from non-bank subsidiaries,
$783 million
and
$457 million
at
September 30, 2017
and
2016
, respectively, was invested in cash and cash equivalents by the subsidiary on behalf of the Parent.
|
165
RAYMOND JAMES FINANCIAL, INC AND SUBSIDIARIES
Notes to Consolidated Financial Statements
The following table presents the Parent’s statements of income:
|
Year ended September 30,
|
||||||||||||
|
$ in thousands
|
2017
|
2016
|
2015
|
|||||||||
|
Revenues:
|
||||||||||||
|
Dividends from non-bank subsidiaries
|
$
|
183,347
|
|
$
|
248,020
|
|
$
|
230,853
|
|
|||
|
Dividends from bank subsidiary
|
125,000
|
|
75,000
|
|
—
|
|
||||||
|
Interest from subsidiaries
|
16,404
|
|
8,999
|
|
6,886
|
|
||||||
|
Interest
|
1,838
|
|
807
|
|
843
|
|
||||||
|
Other
|
25,323
|
|
4,654
|
|
3,823
|
|
||||||
|
Total revenues
|
351,912
|
|
337,480
|
|
242,405
|
|
||||||
|
Interest expense
|
(94,921
|
)
|
(78,089
|
)
|
(76,233
|
)
|
||||||
|
Net revenues
|
256,991
|
|
259,391
|
|
166,172
|
|
||||||
|
Non-interest expenses:
|
||||||||||||
|
Compensation and benefits
|
61,765
|
|
54,664
|
|
46,758
|
|
||||||
|
Communications and information processing
|
8,741
|
|
6,330
|
|
5,999
|
|
||||||
|
Occupancy and equipment costs
|
677
|
|
636
|
|
800
|
|
||||||
|
Business development
|
18,773
|
|
18,364
|
|
17,581
|
|
||||||
|
Losses on extinguishment of debt
|
45,746
|
|
—
|
|
|
—
|
|
|||||
|
Other
|
14,707
|
|
9,792
|
|
10,365
|
|
||||||
|
Intercompany allocations and charges
|
(30,643
|
)
|
(40,424
|
)
|
(46,898
|
)
|
||||||
|
Total non-interest expenses
|
119,766
|
|
49,362
|
|
34,605
|
|
||||||
|
Income before income tax benefit and equity in undistributed net income of subsidiaries
|
137,225
|
|
210,029
|
|
131,567
|
|
||||||
|
Income tax benefit
|
(85,529
|
)
|
(64,658
|
)
|
(42,688
|
)
|
||||||
|
Income before equity in undistributed net income of subsidiaries
|
222,754
|
|
274,687
|
|
174,255
|
|
||||||
|
Equity in undistributed net income of subsidiaries
|
413,481
|
|
254,663
|
|
327,885
|
|
||||||
|
Net income
|
$
|
636,235
|
|
$
|
529,350
|
|
$
|
502,140
|
|
|||
166
RAYMOND JAMES FINANCIAL, INC AND SUBSIDIARIES
Notes to Consolidated Financial Statements
The following table presents the Parent’s statements of cash flows:
|
Year ended September 30,
|
||||||||||||
|
$ in thousands
|
2017
|
2016
|
2015
|
|||||||||
|
Cash flows from operating activities:
|
||||||||||||
|
Net income
|
$
|
636,235
|
|
$
|
529,350
|
|
$
|
502,140
|
|
|||
|
Adjustments to reconcile net income to net cash provided by operating activities:
|
||||||||||||
|
Gain on investments
|
(14,588
|
)
|
(11,538
|
)
|
(5,586
|
)
|
||||||
|
(Gain)/loss on company-owned life insurance
|
(47,920
|
)
|
(25,642
|
)
|
8,960
|
|
||||||
|
Equity in undistributed net income of subsidiaries
|
(413,481
|
)
|
(254,663
|
)
|
(327,885
|
)
|
||||||
|
Loss on extinguishment of senior notes payable
|
45,746
|
|
—
|
|
—
|
|
||||||
|
Other
|
97,616
|
|
73,798
|
|
60,634
|
|
||||||
|
Net change in:
|
||||||||||||
|
Assets segregated pursuant to regulations
|
(40,145
|
)
|
—
|
|
—
|
|
||||||
|
Intercompany receivables
|
178,631
|
|
19,641
|
|
(102,866
|
)
|
||||||
|
Other
|
80,561
|
|
97,067
|
|
51,442
|
|
||||||
|
Intercompany payables
|
38,577
|
|
(115,657
|
)
|
20,338
|
|
||||||
|
Other payables
|
(764
|
)
|
2,396
|
|
(49
|
)
|
||||||
|
Accrued compensation and benefits
|
68,180
|
|
58,520
|
|
2,911
|
|
||||||
|
Net cash provided by operating activities
|
628,648
|
|
373,272
|
|
210,039
|
|
||||||
|
Cash flows from investing activities:
|
||||||||||||
|
(Investments in)/distributions from subsidiaries, net
|
(36,520
|
)
|
(637,689
|
)
|
(9,493
|
)
|
||||||
|
Advances to subsidiaries, net
|
(117,670
|
)
|
(394,383
|
)
|
(40,120
|
)
|
||||||
|
Proceeds from sales/(purchases) of investments, net
|
4,836
|
|
24,609
|
|
(4,601
|
)
|
||||||
|
Purchase of investments in company-owned life insurance, net
|
(40,661
|
)
|
(49,488
|
)
|
(44,917
|
)
|
||||||
|
Net cash used in investing activities
|
(190,015
|
)
|
(1,056,951
|
)
|
(99,131
|
)
|
||||||
|
Cash flows from financing activities:
|
||||||||||||
|
Proceeds from senior note issuances, net of debt issuance costs paid
|
508,473
|
|
792,221
|
|
—
|
|
||||||
|
Extinguishment of senior notes payable
|
(650,000
|
)
|
(250,000
|
)
|
—
|
|
||||||
|
Premium paid on extinguishment of senior notes payable
|
(36,892
|
)
|
—
|
|
—
|
|
||||||
|
Exercise of stock options and employee stock purchases
|
57,462
|
|
43,331
|
|
47,964
|
|
||||||
|
Purchase of treasury stock
|
(34,055
|
)
|
(162,502
|
)
|
(88,542
|
)
|
||||||
|
Dividends on common stock
|
(127,202
|
)
|
(113,435
|
)
|
(103,143
|
)
|
||||||
|
Net cash provided by/(used in) financing activities
|
(282,214
|
)
|
309,615
|
|
(143,721
|
)
|
||||||
|
Net increase/(decrease) in cash and cash equivalents
|
156,419
|
|
(374,064
|
)
|
(32,813
|
)
|
||||||
|
Cash and cash equivalents at beginning of year
|
371,978
|
|
746,042
|
|
778,855
|
|
||||||
|
Cash and cash equivalents at end of year
|
$
|
528,397
|
|
$
|
371,978
|
|
$
|
746,042
|
|
|||
|
Supplemental disclosures of cash flow information:
|
||||||||||||
|
Cash paid for interest
|
$
|
98,554
|
|
$
|
74,568
|
|
$
|
76,297
|
|
|||
|
Cash paid for income taxes, net
|
$
|
92,568
|
|
$
|
27,397
|
|
$
|
32,383
|
|
|||
|
Supplemental disclosures of noncash activity:
|
||||||||||||
|
Investments in subsidiaries, net
|
$
|
24,352
|
|
$
|
781
|
|
$
|
507
|
|
|||
|
Losses on extinguishment of debt
|
$
|
8,854
|
|
$
|
—
|
|
$
|
—
|
|
|||
167
RAYMOND JAMES FINANCIAL, INC. AND SUBSIDIARIES
SUPPLEMENTARY DATA:
SELECTED QUARTERLY FINANCIAL DATA
(unaudited)
|
Fiscal Year 2017
|
|||||||||||||
|
$ in thousands, except per share amounts
|
1st Qtr.
|
2nd Qtr.
|
3rd Qtr.
|
4th Qtr.
|
|||||||||
|
Total revenues
|
$
|
1,528,768
|
|
$
|
1,600,314
|
|
$
|
1,663,107
|
|
$
|
1,732,686
|
|
|
|
Net revenues
|
$
|
1,492,802
|
|
$
|
1,563,637
|
|
$
|
1,624,547
|
|
$
|
1,690,111
|
|
|
|
Non-interest expenses
|
$
|
1,285,287
|
|
$
|
1,402,334
|
|
$
|
1,347,606
|
|
$
|
1,407,892
|
|
|
|
Income including noncontrolling interests and before provision for income taxes
|
$
|
207,515
|
|
$
|
161,303
|
|
$
|
276,941
|
|
$
|
282,219
|
|
|
|
Net income attributable to Raymond James Financial, Inc.
|
$
|
146,567
|
|
$
|
112,755
|
|
$
|
183,424
|
|
$
|
193,489
|
|
|
|
Earnings per common share - basic
|
$
|
1.03
|
|
$
|
0.78
|
|
$
|
1.27
|
|
$
|
1.34
|
|
|
|
Earnings per common share - diluted
|
$
|
1.00
|
|
$
|
0.77
|
|
$
|
1.24
|
|
$
|
1.31
|
|
|
|
Cash dividends per common share - declared
|
$
|
0.22
|
|
$
|
0.22
|
|
$
|
0.22
|
|
$
|
0.22
|
|
|
|
Fiscal Year 2016
|
|||||||||||||
|
$ in thousands, except per share amounts
|
1st Qtr.
|
2nd Qtr.
|
3rd Qtr.
|
4th Qtr.
|
|||||||||
|
Total revenues
|
$
|
1,300,857
|
|
$
|
1,341,110
|
|
$
|
1,386,997
|
|
$
|
1,492,156
|
|
|
|
Net revenues
|
$
|
1,274,158
|
|
$
|
1,312,001
|
|
$
|
1,358,964
|
|
$
|
1,459,941
|
|
|
|
Non-interest expenses
|
$
|
1,104,085
|
|
$
|
1,117,893
|
|
$
|
1,154,110
|
|
$
|
1,217,032
|
|
|
|
Income including noncontrolling interests and before provision for income taxes
|
$
|
170,073
|
|
$
|
194,108
|
|
$
|
204,854
|
|
$
|
242,909
|
|
|
|
Net income attributable to Raymond James Financial, Inc.
|
$
|
106,329
|
|
$
|
125,847
|
|
$
|
125,504
|
|
$
|
171,670
|
|
|
|
Earnings per common share - basic
|
$
|
0.74
|
|
$
|
0.89
|
|
$
|
0.89
|
|
$
|
1.21
|
|
|
|
Earnings per common share - diluted
|
$
|
0.73
|
|
$
|
0.87
|
|
$
|
0.87
|
|
$
|
1.19
|
|
|
|
Cash dividends per common share - declared
|
$
|
0.20
|
|
$
|
0.20
|
|
$
|
0.20
|
|
$
|
0.20
|
|
|
As a result of our October 1, 2016 adoption of the new consolidation guidance, we deconsolidated a number of tax credit fund variable interest entities (“VIEs”) that had been previously consolidated. We applied the new consolidation guidance on the full retrospective basis, meaning that we have reflected the adjustments arising from this adoption for fiscal year 2016 presented above. See Note
2
in the Notes to the Consolidated Financial Statements for additional information.
|
Item 9.
|
CHANGES IN AND DISAGREEMENTS WITH ACCOUNTANTS ON ACCOUNTING AND FINANCIAL DISCLOSURE
|
None.
Item 9A.
CONTROLS AND PROCEDURES
Disclosure Controls and Procedures
Disclosure controls are procedures designed to ensure that information required to be disclosed in our reports filed under the Exchange Act, such as this report, are recorded, processed, summarized, and reported within the time periods specified in the SEC’s rules and forms. Disclosure controls are also designed to ensure that such information is accumulated and communicated to management, including our Chief Executive Officer and Chief Financial Officer, as appropriate, to allow timely decisions regarding required disclosure. In designing and evaluating the disclosure controls and procedures, management recognized that any controls and procedures, no matter how well designed and operated, can provide only reasonable, not absolute, assurance of achieving the desired control objectives, as ours are designed to do, and management necessarily was required to apply its judgment in evaluating the cost-benefit relationship of possible controls and procedures.
Under the supervision and with the participation of our management, including our Chief Executive Officer and Chief Financial Officer, we have evaluated the effectiveness of our disclosure controls and procedures pursuant to Exchange Act Rule 13a-15(b) as of the end of the period covered by this report. Based on that evaluation, our Chief Executive Officer and Chief Financial Officer have concluded that these disclosure controls and procedures are effective.
168
Changes in Internal Control over Financial Reporting
There were no changes in our internal control over financial reporting during the year ended
September 30, 2017
that have materially affected, or are reasonably likely to materially affect, our internal control over financial reporting.
REPORT OF MANAGEMENT ON INTERNAL CONTROL OVER FINANCIAL REPORTING
Our management is responsible for establishing and maintaining adequate internal control over our financial reporting. Internal control over financial reporting is a process to provide reasonable assurance regarding the reliability of our financial reporting for external purposes in accordance with accounting principles generally accepted in the United States. Internal control over financial reporting includes maintaining records that, in reasonable detail, accurately and fairly reflect our transactions; providing reasonable assurance that transactions are recorded as necessary for preparation of our financial statements; providing reasonable assurance that receipts and expenditures of our assets are made in accordance with management authorization; and providing reasonable assurance that unauthorized acquisition, use or disposition of our assets that could have a material effect on our financial statements would be prevented or detected on a timely basis. Because of its inherent limitations, internal control over financial reporting is not intended to provide absolute assurance that a misstatement of our financial statements would be prevented or detected.
Management conducted an evaluation of the effectiveness of our internal control over financial reporting based on the framework in
Internal Control - Integrated Framework (2013)
issued by COSO. Based on this evaluation, management concluded that our internal control over financial reporting was effective as of
September 30, 2017
. KPMG LLP, who audited and reported on our consolidated financial statements included in this report, has issued an attestation report on our internal control over financial reporting as of
September 30, 2017
(included as follows).
169
Report of Independent Registered Public Accounting Firm
The Board of Directors and Shareholders
Raymond James Financial, Inc.:
We have audited Raymond James Financial Inc.’s (the “Company” or “Raymond James”) internal control over financial reporting as of
September 30, 2017
, based on criteria established in
Internal Control - Integrated Framework
(2013)
issued by the Committee of Sponsoring Organizations of the Treadway Commission. The Company’s management is responsible for maintaining effective internal control over financial reporting and for its assessment of the effectiveness of internal control over financial reporting, included in the accompanying report of management on internal control over financial reporting. Our responsibility is to express an opinion on the Company’s internal control over financial reporting based on our audit.
We conducted our audit in accordance with the standards of the Public Company Accounting Oversight Board (United States). Those standards require that we plan and perform the audit to obtain reasonable assurance about whether effective internal control over financial reporting was maintained in all material respects. Our audit included obtaining an understanding of internal control over financial reporting, assessing the risk that a material weakness exists, and testing and evaluating the design and operating effectiveness of internal control based on the assessed risk. Our audit also included performing such other procedures as we considered necessary in the circumstances. We believe that our audit provides a reasonable basis for our opinion.
A company’s internal control over financial reporting is a process designed to provide reasonable assurance regarding the reliability of financial reporting and the preparation of financial statements for external purposes in accordance with generally accepted accounting principles. A company’s internal control over financial reporting includes those policies and procedures that (1) pertain to the maintenance of records that, in reasonable detail, accurately and fairly reflect the transactions and dispositions of the assets of the company; (2) provide reasonable assurance that transactions are recorded as necessary to permit preparation of financial statements in accordance with generally accepted accounting principles, and that receipts and expenditures of the company are being made only in accordance with authorizations of management and directors of the company; and (3) provide reasonable assurance regarding prevention or timely detection of unauthorized acquisition, use, or disposition of the company’s assets that could have a material effect on the financial statements.
Because of its inherent limitations, internal control over financial reporting may not prevent or detect misstatements. Also, projections of any evaluation of effectiveness to future periods are subject to the risk that controls may become inadequate because of changes in conditions, or that the degree of compliance with the policies or procedures may deteriorate.
In our opinion, Raymond James maintained, in all material respects, effective internal control over financial reporting as of
September 30, 2017
, based on criteria established in
Internal Control - Integrated Framework (2013)
issued by the Committee of Sponsoring Organizations of the Treadway Commission.
We have also audited, in accordance with the standards of the Public Company Accounting Oversight Board (United States), the consolidated statements of financial condition of Raymond James as of
September 30, 2017
and
2016
, and the related consolidated statements of income and comprehensive income, changes in shareholders’ equity, and cash flows for each of the years in the three-year period ended
September 30, 2017
, and our report dated
November 21, 2017
expressed an unqualified opinion on those consolidated financial statements.
/s/ KPMG LLP
Tampa, Florida
November 21, 2017
Certified Public Accountants
170
RAYMOND JAMES FINANCIAL, INC. AND SUBSIDIARIES
Item 9B.
OTHER INFORMATION
None.
|
Item 10.
|
DIRECTORS, EXECUTIVE OFFICERS AND CORPORATE GOVERNANCE
|
A list of our executive officers appears in Part I, Item 1 of this report. The balance of the information required by Item 10 is incorporated herein by reference to the registrant’s definitive proxy statement for the 2018 Annual Meeting of Shareholders which will be filed with the SEC no later than 120 days after the close of the fiscal year ended
September 30, 2017
.
The information required by Items 11, 12, 13 and 14 is incorporated herein by reference to the registrant’s definitive proxy statement for the 2018 Annual Meeting of Shareholders which will be filed with the SEC no later than 120 days after the close of the fiscal year ended
September 30, 2017
.
|
Item 15.
|
EXHIBITS AND FINANCIAL STATEMENT SCHEDULES
|
|
(a)
|
Financial Statements and Schedules
|
The financial statements are set forth under Item 8 of this Annual Report on Form 10-K. Financial statement schedules have been omitted since they are either not required, not applicable, or the information is otherwise included.
|
(b)
|
Exhibit listing
|
See below and continued on the following pages.
|
Exhibit Number
|
Description
|
|
|
3.1
|
||
|
3.2
|
||
|
4.1
|
||
|
4.2.1
|
||
|
4.2.2
|
||
|
4.2.3
|
||
|
4.2.4
|
||
|
4.2.5
|
||
171
RAYMOND JAMES FINANCIAL, INC. AND SUBSIDIARIES
|
Exhibit Number
|
Description
|
|
|
10.1
|
*
|
|
|
10.2
|
||
|
10.3
|
*
|
|
|
10.4
|
*
|
|
|
10.5
|
*
|
|
|
10.6
|
*
|
|
|
10.7.1
|
*
|
|
|
10.7.2
|
*
|
|
|
10.7.3
|
*
|
|
|
10.8
|
||
|
10.9
|
*
|
|
|
10.10
|
*
|
|
|
10.11.1
|
||
|
10.11.2
|
||
|
10.11.3
|
||
|
10.12.1
|
*
|
|
|
10.12.2
|
*
|
|
|
10.12.3
|
*
|
|
|
10.12.4
|
*
|
|
|
10.12.5
|
*
|
|
|
10.12.6
|
*
|
|
|
10.12.7
|
*
|
|
172
RAYMOND JAMES FINANCIAL, INC. AND SUBSIDIARIES
|
Exhibit Number
|
Description
|
|
|
10.12.8
|
*
|
|
|
10.12.9
|
*
|
|
|
10.12.10
|
*
|
|
|
10.12.11
|
*
|
|
|
10.12.12
|
*
|
|
|
10.12.13
|
*
|
|
|
10.12.14
|
||
|
10.13
|
*
|
|
|
10.14
|
||
|
11
|
Statement re Computation of per Share Earnings (the calculation of per share earnings is included in Part II, Item 8, Note 23 in the Notes to Consolidated Financial Statements (Earnings Per Share) and is omitted here in accordance with Section (b)(11) of Item 601 of Regulation S-K).
|
|
|
12
|
||
|
21
|
||
|
23
|
||
|
31.1
|
||
|
31.2
|
||
|
32
|
||
|
101.INS
|
XBRL Instance Document.
|
|
|
101.SCH
|
XBRL Taxonomy Extension Schema Document.
|
|
|
101.CAL
|
XBRL Taxonomy Extension Calculation Linkbase Document.
|
|
|
101.DEF
|
XBRL Taxonomy Extension Definition Linkbase Document.
|
|
|
101.LAB
|
XBRL Taxonomy Extension Label Linkbase Document.
|
|
|
101.PRE
|
XBRL Taxonomy Extension Presentation Linkbase Document.
|
|
* Indicates a management contract or compensatory plan or arrangement in which a director or executive officer participates.
173
RAYMOND JAMES FINANCIAL, INC. AND SUBSIDIARIES
SIGNATURES
Pursuant to the requirements of Section 13 or 15(d) of the Securities Exchange Act of 1934, the Registrant has duly caused this report to be signed on its behalf by the undersigned, thereunto duly authorized, in the City of St. Petersburg, State of Florida, on the 21
st
day of November, 2017.
|
RAYMOND JAMES FINANCIAL, INC.
|
|
By: /s/ PAUL C. REILLY
|
|
Paul C. Reilly, Chairman and Chief Executive Officer
|
Pursuant to the requirements of the Securities Exchange Act of 1934, this report has been signed below by the following persons on behalf of the Registrant and in the capacities and on the dates indicated.
|
Signature
|
Title
|
Date
|
|
/s/ PAUL C. REILLY
|
Chairman and Chief Executive Officer (Principal Executive Officer) and Director
|
November 21, 2017
|
|
Paul C. Reilly
|
||
|
/s/ JEFFREY P. JULIEN
|
Executive Vice President - Finance, Chief Financial Officer (Principal Financial Officer) and Treasurer
|
November 21, 2017
|
|
Jeffrey P. Julien
|
||
|
/s/ JENNIFER C. ACKART
|
Senior Vice President and Controller (Principal Accounting Officer)
|
November 21, 2017
|
|
Jennifer C. Ackart
|
||
|
/s/ THOMAS A. JAMES
|
Chairman Emeritus and Director
|
November 21, 2017
|
|
Thomas A. James
|
||
|
/s/ CHARLES G. VON ARENTSCHILDT
|
Director
|
November 21, 2017
|
|
Charles G. von Arentschildt
|
||
|
/s/ SHELLEY G. BROADER
|
Director
|
November 21, 2017
|
|
Shelley G. Broader
|
||
|
/s/ JEFFREY N. EDWARDS
|
Director
|
November 21, 2017
|
|
Jeffrey N. Edwards
|
||
|
/s/ BENJAMIN C. ESTY
|
Director
|
November 21, 2017
|
|
Benjamin C. Esty
|
||
|
/s/ FRANCIS S. GODBOLD
|
Vice Chairman and Director
|
November 21, 2017
|
|
Francis S. Godbold
|
||
|
/s/ GORDON L. JOHNSON
|
Director
|
November 21, 2017
|
|
Gordon L. Johnson
|
||
|
/s/ RODERICK C. MCGEARY
|
Director
|
November 21, 2017
|
|
Roderick C. McGeary
|
||
|
/s/ ROBERT P. SALTZMAN
|
Director
|
November 21, 2017
|
|
Robert P. Saltzman
|
||
|
/s/ SUSAN N. STORY
|
Director
|
November 21, 2017
|
|
Susan N. Story
|
||
174
TABLE OF CONTENTS
Part IItem 1. BusinessItem 1A. Risk FactorsItem 1B. Unresolved Staff CommentsItem 2. PropertiesItem 3. Legal ProceedingsItem 4. Mine Safety DisclosuresPart IIItem 5. Market For Registrant S Common Equity, Related Shareholder Matters and Issuer Purchases Of Equity SecuritiesItem 6. Selected Financial DataItem 7. Management S Discussion and Analysis Of Financial Condition and Results Of OperationsItem 7A. Quantitative and Qualitative Disclosures About Market RiskItem 8. Financial Statements and Supplementary DataNote 1 Organization and Basis Of PresentationNote 2 Summary Of Significant Accounting PoliciesNote 3 AcquisitionsNote 4 Fair ValueNote 5 Available-for-sale SecuritiesNote 6 Derivative Financial InstrumentsNote 7 Collateralized Agreements and FinancingsNote 8 Bank Loans, NetNote 9 - Other AssetsNote 10 Variable Interest EntitiesNote 11 - Property and EquipmentNote 12 - Goodwill and Identifiable Intangible Assets, NetNote 13 Bank DepositsNote 14 Other BorrowingsNote 15 Senior Notes PayableNote 16 Income TaxesNote 17 Commitments, Contingencies and GuaranteesNote 18 - Accumulated Other Comprehensive Income/(loss)Note 19 Interest Income and Interest ExpenseNote 20 - Share-based and Other CompensationNote 21 Regulatory Capital RequirementsNote 22 Financial Instruments with Off-balance Sheet RiskNote 23 Earnings Per ShareNote 24 Segment InformationNote 25 - Condensed Financial Information (parent Company Only)Item 9. Changes in and Disagreements with Accountants on Accounting and Financial DisclosureItem 9A. Controls and ProceduresItem 9B. Other InformationPart IIIItem 10. Directors, Executive Officers and Corporate GovernanceItem 11, 12, 13 and 14Part IVItem 15. Exhibits and Financial Statement Schedules