RALPH LAUREN CORP
10-Ks and 10-Qs
|
|
|
|
|
|
|
|
|
|
|
|
|
|
|
|
|
|
|
|
|
|
|
|
|
|
|
|
|
|
|
|
|
|
|
|
|
|
|
|
|
|
|
|
|
|
|
|
|
|
|
|
|
|
|
|
|
|
|
UNITED STATES
SECURITIES AND EXCHANGE COMMISSION
Washington, D.C. 20549
Form 10-K
(Mark One)
|
þ
|
ANNUAL REPORT PURSUANT TO SECTION 13 OR 15(d) OF THE SECURITIES EXCHANGE ACT OF 1934
|
|
For the fiscal year ended March 30, 2013
|
|
or
|
o
|
TRANSITION REPORT PURSUANT TO SECTION 13 OR 15(d) OF THE SECURITIES EXCHANGE ACT OF 1934
|
Commission File Number: 001-13057
RALPH LAUREN CORPORATION
(Exact name of registrant as specified in its charter)
|
Delaware
|
|
13-2622036
|
|
(State or other jurisdiction of incorporation or organization)
|
|
(I.R.S. Employer Identification No.)
|
|
650 Madison Avenue, New York, New York
|
|
10022
|
|
(Address of principal executive offices)
|
|
(Zip Code)
|
(212) 318-7000
(Registrant’s telephone number, including area code)
Securities registered pursuant to Section 12(b) of the Act:
|
Title of Each Class
|
|
Name of Each Exchange on Which Registered
|
|
Class A Common Stock, $.01 par value
|
|
New York Stock Exchange
|
Securities registered pursuant to Section 12(g) of the Act: None
|
Indicate by check mark if the registrant is a well-known seasoned issuer, as defined in Rule 405 of the Securities Act.
|
Yes
þ
No
o
|
|
|
Indicate by check mark if the registrant is not required to file reports pursuant to Section 13 or 15(d) of the Act.
|
Yes
o
No
þ
|
|
|
Indicate by check mark whether the registrant (1) has filed all reports required to be filed by Section 13 or 15(d) of the Securities Exchange Act of 1934 during the preceding 12 months (or for such shorter period that the registrant was required to file such reports), and (2) has been subject to such filing requirements for the past 90 days.
|
Yes
þ
No
o
|
|
|
Indicate by check mark whether the registrant has submitted electronically and posted on its corporate Web site, if any, every Interactive Data File required to be submitted and posted pursuant to Rule 405 of Regulation S-T (§232.405 of this chapter) during the preceding 12 months (or for such shorter period that the registrant was required to submit and post such files).
|
Yes
þ
No
o
|
|
|
Indicate by check mark if disclosure of delinquent filers pursuant to Item 405 of Regulation S-K (§229.405 of this chapter) is not contained herein, and will not be contained, to the best of registrant's knowledge, in definitive proxy or information statements incorporated by reference in Part III of this Form 10-K or any amendment to this Form 10-K.
|
o
|
|
|
Indicate by check mark whether the registrant is a large accelerated filer, an accelerated filer, a non-accelerated filer, or a smaller reporting company. See the definitions of “large accelerated filer,” “accelerated filer” and “smaller reporting company” in Rule 12b-2 of the Exchange Act.
|
||
|
Large accelerated filer
þ
|
Accelerated filer
o
|
|
|
Non-accelerated filer
o
(Do not check if a smaller reporting company)
|
Smaller reporting company
o
|
|
|
Indicate by check mark whether the registrant is a shell company (as defined in Rule 12b-2 of the Act).
|
Yes
o
No
þ
|
|
|
The aggregate market value of the registrant's voting common stock held by non-affiliates of the registrant was approximately $9,138,882,586 as of September 28, 2012, the last business day of the registrant's most recently completed second fiscal quarter based on the closing price of the common stock on the New York Stock Exchange.
|
||
|
At May 17, 2013, 61,016,733 shares of the registrant's Class A common stock, $.01 par value and 29,881,276 shares of the registrant's Class B common stock, $.01 par value were outstanding.
|
||
|
Part III incorporates information from certain portions of the registrant's definitive proxy statement to be filed with the Securities and Exchange Commission within 120 days after the fiscal year end of March 30, 2013.
|
||
SPECIAL NOTE REGARDING FORWARD-LOOKING STATEMENTS
Various statements in this Form 10-K or incorporated by reference into this Form 10-K, in future filings by us with the Securities and Exchange Commission (the “SEC”), in our press releases, and in oral statements made from time to time by us or on our behalf constitute “forward-looking statements” within the meaning of the Private Securities Litigation Reform Act of 1995. Forward-looking statements are based on current expectations and are indicated by words or phrases such as “anticipate,” “estimate,” “expect,” “project,” “we believe,” “is or remains optimistic,” “currently envisions,” and similar words or phrases and involve known and unknown risks, uncertainties, and other factors which may cause actual results, performance, or achievements to be materially different from the future results, performance, or achievements expressed in or implied by such forward-looking statements. These risks, uncertainties, and other factors include, among others:
|
•
|
the loss of key personnel, including Mr. Ralph Lauren;
|
|
•
|
our ability to successfully implement our anticipated growth strategies and to capitalize on our repositioning initiatives in certain merchandise categories;
|
|
•
|
the impact of global economic conditions, including the ongoing sovereign debt crisis and credit downgrades, on us, our customers, our suppliers, and our vendors and on our ability and their ability to access sources of liquidity;
|
|
•
|
our ability to secure our facilities and systems and those of our third-party service providers from, among other things, cybersecurity breaches, acts of vandalism, computer viruses, or similar Internet or email events;
|
|
•
|
our ability to continue to maintain our brand image and reputation and protect our trademarks;
|
|
•
|
the impact of the challenging state of the global economy on consumer purchases of premium lifestyle products that we offer for sale and our ability to forecast consumer demand;
|
|
•
|
changes in the competitive marketplace, including the introduction of new products or pricing changes by our competitors, and consolidations, liquidations, restructurings, and other ownership changes in the retail industry;
|
|
•
|
our exposure to domestic and foreign currency fluctuations and risks associated with raw materials, transportation, and labor costs;
|
|
•
|
changes to our anticipated effective tax rates in future years;
|
|
•
|
our ability to continue to expand or grow our business internationally, and the impact of related changes in our customer, channel, and geographic sales mix as a result;
|
|
•
|
changes in our relationships with department store customers and licensing partners;
|
|
•
|
a variety of legal, regulatory, tax, political, and economic risks, including risks related to the importation and exportation of products, tariffs, and other trade barriers, to which our international operations are subject and other risks associated with our international operations, such as compliance with the Foreign Corrupt Practices Act or violations of other anti-bribery and corruption laws prohibiting improper payments, and the burdens of complying with a variety of foreign laws and regulations, including tax laws, trade and labor restrictions, and related laws that may reduce the flexibility of our business;
|
|
•
|
our intention to introduce new products or enter into or renew alliances and exclusive relationships;
|
|
•
|
our ability to access sources of liquidity to provide for our cash needs, including our debt obligations, payment of dividends, capital expenditures, and potential repurchase of our Class A common stock;
|
|
•
|
our efforts to improve the efficiency of our distribution system and to continue to enhance and upgrade our global information technology systems;
|
|
•
|
our ability to make certain strategic acquisitions of selected licenses held by our licensees and successfully integrate the acquired businesses, including our operations in Asia and Latin America, our recently acquired North American Chaps-branded men's sportswear business, and our transition of the licensed business in Australia and New Zealand to a wholly-owned operation in June 2013;
|
|
•
|
our ability to open new retail stores, concession shops, and e-commerce sites in an effort to expand our direct-to-consumer presence;
|
|
|
2
|
|
|
•
|
our ability to maintain our credit profile and ratings with the financial community;
|
|
•
|
the potential impact on our operations and customers resulting from natural or man-made disasters; and
|
|
•
|
the impact to our business of events of unrest and instability that are currently taking place in certain parts of the world, as well as from any terrorist action, retaliation, and the threat of further action or retaliation.
|
These forward-looking statements are based largely on our expectations and judgments and are subject to a number of risks and uncertainties, many of which are unforeseeable and beyond our control. A detailed discussion of significant risk factors that have the potential to cause our actual results to differ materially from our expectations is described in Part I of this Form 10-K under the heading of “Risk Factors.” We undertake no obligation to publicly update or revise any forward-looking statements, whether as a result of new information, future events, or otherwise.
WEBSITE ACCESS TO COMPANY REPORTS AND OTHER INFORMATION
Our investor website is http://investor.ralphlauren.com. We were incorporated in June 1997 under the laws of the State of Delaware. Our Annual Reports on Form 10-K, Quarterly Reports on Form 10-Q, Current Reports on Form 8-K, and amendments to those reports filed with or furnished to the SEC pursuant to Section 13(a) or Section 15(d) of the Securities Exchange Act of 1934 are available at our investor website under the caption “SEC Filings” promptly after we electronically file such materials with or furnish such materials to the SEC. Information relating to corporate governance at Ralph Lauren Corporation, including our Corporate Governance Policies, our Code of Business Conduct and Ethics for all directors, officers, and employees, our Code of Ethics for Principal Executive Officers and Senior Financial Officers, and information concerning our directors, Committees of the Board, including Committee charters, and transactions in Ralph Lauren Corporation securities by directors and executive officers is available at our website under the captions “Corporate Governance” and “SEC Filings.” Paper copies of these filings and corporate governance documents are available to stockholders without charge by written request to Investor Relations, Ralph Lauren Corporation, 625 Madison Avenue, New York, New York 10022.
In this Form 10-K, references to “Ralph Lauren,” “ourselves,” “we,” “our,” “us,” and the “Company” refer to Ralph Lauren Corporation and its subsidiaries (“RLC”), unless the context indicates otherwise. Due to the collaborative and ongoing nature of our relationships with our licensees, such licensees are sometimes referred to in this Form 10-K as “licensing alliances.” Our fiscal year ends on the Saturday closest to March 31. All references to “Fiscal 2013” represent the 52-week fiscal year ended March 30, 2013. All references to “Fiscal 2012” represent the 52-week fiscal year ended March 31, 2012. All references to “Fiscal 2011” represent the 52-week fiscal year ended April 2, 2011.
|
Item 1.
|
Business.
|
General
Founded in 1967 by Mr. Ralph Lauren, we are a global leader in the design, marketing, and distribution of premium lifestyle products, including men’s, women’s, and children’s apparel, accessories, fragrances, and home furnishings. Our long-standing reputation and distinctive image have been consistently developed across an expanding number of products, brands, sales channels, and international markets. We believe that our global reach, breadth of product offerings, and multi-channel distribution are unique among luxury and apparel companies.
We operate in three distinct but integrated segments: Wholesale, Retail, and Licensing. Our Wholesale business, representing approximately
45%
of our
Fiscal 2013
net revenues, consists of sales made principally to major department stores and specialty stores located throughout North America, Europe, Asia, and Latin America. Our Retail business, representing approximately
52%
of our
Fiscal 2013
net revenues, consists of sales made directly to consumers through our retail stores located throughout North America, Europe, Asia, and Latin America; through concession-based shop-within-shops located primarily in Asia and Europe; and through our retail e-commerce channel in North America, Europe, and Asia. Our Licensing business, representing approximately
3%
of our
Fiscal 2013
net revenues, consists of royalty-based arrangements under which we license the right to third parties to use our various trademarks in connection with the manufacture and sale of designated products, such as apparel, eyewear, and fragrances, in specified geographical areas for specified periods. Approximately
37%
of our
Fiscal 2013
net revenues were earned in international regions outside of the U.S. See
Note 22
to the accompanying audited consolidated financial statements for a summary of net revenues by reportable segment and by geographic location.
|
|
3
|
|
Over the past five fiscal years, our sales have grown over 38% to
$6.945 billion
in
Fiscal 2013
from $5.019 billion in the fiscal year ended March 28, 2009. This growth has been attributable to both our acquisitions and organic growth. We have diversified our business by channels of distribution, price point, and target consumer, as well as by geography. Our global reach is extensive, with Ralph Lauren-branded merchandise available through our wholesale distribution channels at approximately 11,000 different retail locations worldwide. In addition to our wholesale distribution, we sell directly to customers throughout the world via our
388
retail stores, our
494
concession-based shop-within-shops, and our
seven
e-commerce sites. In addition to our directly-operated stores and shops, our international licensing partners operate 62 Ralph Lauren Stores, 32 Ralph Lauren concession shops, and 64 Club Monaco stores and shops.
We continue to invest in our business. In the past five fiscal years, we have invested approximately $1.371 billion for acquisitions and capital improvements, primarily funded through strong operating cash flow. We intend to continue to execute our long-term strategy, which includes expanding our presence internationally, extending our direct-to-consumer reach, expanding our accessories and other product and brand offerings, and investing in our operational infrastructure. See “
Objectives and Opportunities”
for further discussion of our long-term strategy.
We have been controlled by the Lauren family since the founding of our Company. As of
March 30, 2013
, Mr. Ralph Lauren, or entities controlled by the Lauren family, owned approximately 83% of the voting power of the outstanding common stock of the Company.
Seasonality of
Business
Our business is typically affected by seasonal trends, with higher levels of wholesale sales in our second and fourth quarters and higher retail sales in our second and third quarters. These trends result primarily from the timing of seasonal wholesale shipments and key vacation travel, back-to-school, and holiday shopping periods in our Retail segment. As a result of the growth and other changes in our business, along with changes in consumer spending patterns and the macroeconomic environment, historical quarterly operating trends and working capital requirements may not be indicative of our future performance. In addition, fluctuations in sales, operating income, and cash flows in any fiscal quarter may be affected by, among other things, the timing of seasonal wholesale shipments and other events affecting retail sales, such as changes in weather patterns.
Working capital requirements vary throughout the year. Working capital requirements typically increase during the first half of the fiscal year as inventory builds to support peak shipping/selling periods and, accordingly, typically decrease during the second half of the fiscal year as inventory is shipped/sold. Cash provided by operating activities is typically higher in the second half of the fiscal year due to reduced working capital requirements during that period.
Objectives and Opportunities
Our core strengths include a portfolio of global premium lifestyle brands, a strong and experienced management team, a proven ability to develop and extend our brands distributed through multiple channels in global markets, and a disciplined investment philosophy, which is supported by a strong balance sheet. Despite the various risks and uncertainties associated with the current global economic environment, as discussed further in Item 7 – “
Management’s Discussion and Analysis of Financial Condition and Results of Operations — Global Economic Developments,
” we believe our core strengths will allow us to continue to execute our strategy for long-term sustainable growth in revenue, net income, and operating cash flow.
As our business has grown, our portfolio mix and brand control has evolved from primarily that of a mono-brand U.S.-centric menswear wholesaler with a broad array of product and geographic licenses, to that of a portfolio of lifestyle brands with a “direct control” model over most of our brands, products, and international territories. We believe that this broader and better-diversified portfolio mix positions us for ongoing growth, offering our customers a range of products, price points, and channels of distribution. In addition, we believe that our size and global operations favorably position us to take advantage of synergies in design, sourcing, and distribution.
While balancing our key long-term strategic objectives with our near-term priorities to manage through the various risks associated with the current global economic environment, we intend to continue to pursue select opportunities for growth during the course of Fiscal 2014 and beyond. These opportunities and continued investment initiatives include:
|
|
4
|
|
|
•
|
International Growth Opportunities
|
|
◦
|
Continued development and growth of our businesses in Asia, including the continued execution of our plans to reposition our existing distribution network by securing brand-appropriate retail locations and maximizing our distribution opportunities in conjunction with the implementation of new merchandising, marketing, and advertising strategies to elevate brand perception and positioning in the region;
|
|
◦
|
The transition of our Ralph Lauren business in Australia and New Zealand from a licensed business to a wholly-owned operation in the second quarter of Fiscal 2014;
|
|
◦
|
The evaluation and development of our strategies related to the expansion of our operations into Latin America; and
|
|
◦
|
Continued growth of our European operations.
|
|
•
|
Direct-to-Consumer Growth Opportunities
|
|
◦
|
Continued global growth and expansion of our freestanding stores and concession shops, with a particular emphasis on our growth in Asia; and
|
|
◦
|
Further expansion of our e-commerce presence in Asia, as well as the implementation of new and refined merchandising and marketing strategies to grow our existing e-commerce operations, including our recently launched Ralph Lauren site in Japan and Club Monaco site in Canada, as well as expanded European distribution.
|
|
•
|
Product Innovation and
Brand
Extension Growth Opportunities
|
|
◦
|
Seasonal innovation in our core merchandise categories;
|
|
◦
|
Further growth and broadening of our accessories product offerings, including handbags, footwear, small leathergoods, belts, eyewear, and watches/jewelry, and continued expansion of our related distribution into new channels and geographies;
|
|
◦
|
The ongoing development and growth of our recently acquired licensed businesses and the continued transition of our licensed businesses to wholly-owned arrangements, including the Chaps men's sportswear license acquired from PVH Corp. in April 2013; and
|
|
◦
|
Continued expansion of our emerging brands, including Club Monaco, Chaps, and Denim & Supply Ralph Lauren product assortments across various categories on a global basis.
|
|
•
|
Investment in
Operational
Infrastructure
|
|
◦
|
Further system enhancements and implementations to standardize our operating platforms and meet the expanding needs of our global organization. Such enhancements include the continued implementation of a global operating and financial reporting information technology system as part of a multi-year global initiative, the next phase of which involves the migration of certain core areas of our business to the new system, including global merchandise procurement, customer order management, and record-to-report for our North American wholesale operations; and
|
|
◦
|
Continued supply chain enhancements to achieve efficiencies through the global coordination of our manufacturing and logistics operations, including product lifecycle management, merchandise alignment, and planning.
|
|
•
|
Global Talent
Development
and Management
|
|
◦
|
Continue to enhance our organizational development and talent management to support our global growth initiatives, including the refinement of succession plans for our key leadership positions.
|
|
•
|
Strong Financial
Management
and Cash Flow Reinvestment
|
|
◦
|
Continue to make disciplined reinvestments of our cash flows from operations to support our global growth, including through capital improvements and investments in new distribution channel and product opportunities, with an increased focus on our international initiatives; and
|
|
◦
|
Continue to focus on our capital structure to provide for our cash needs, including debt obligations, and return value to our shareholders through dividend payments and repurchases of our common stock.
|
|
|
5
|
|
Recent Developments
Chaps
In April 2013, in connection with the transition of the North American Chaps-branded men's sportswear business from a licensed to a wholly-owned operation, we entered into an agreement with The Warnaco Group, Inc. (“Warnaco”), a subsidiary of PVH Corp. (“PVH”), to acquire certain net assets (including inventory, a finite-lived intangible asset, and certain customer liabilities), in exchange for an aggregate payment of approximately $18 million (the "Chaps Menswear License Acquisition"). We funded the Chaps Menswear License Acquisition with available cash on-hand. Warnaco was our licensee for Chaps-branded men's sportswear apparel in North America. In connection with the Chaps Menswear License Acquisition, we entered into a transition services agreement with PVH for the provision of certain support services related to sourcing, distribution, customer service, finance, and information systems through June 30, 2013. The operating results of the Chaps men's sportswear business will be consolidated in our operating results commencing on April 10, 2013. We are currently in the process of assessing the fair values of the assets acquired and liabilities assumed.
Wind-down of Rugby
In October 2012, we approved a plan to wind-down our Rugby brand retail operations (the “Rugby Closure Plan”). This decision was primarily based on the results of an analysis of the brand concept, as well as an opportunity to reallocate our resources related to these operations to support other high-growth business opportunities and initiatives. In connection with the Rugby Closure Plan, 13 of our 14 global freestanding Rugby stores and our related domestic e-commerce site located at Rugby.com were closed during Fiscal 2013. The one remaining Rugby store is expected to be closed during Fiscal 2014. The Rugby Closure Plan resulted in a reduction in our workforce of approximately
160
employees. See Notes 11 and 12 to our consolidated financial statements for detailed discussions of impairment and restructuring charges recorded during Fiscal 2013 in connection with the Rugby Closure Plan.
E-Commerce Expansion
During
Fiscal 2013
, we continued to execute on our strategic objective of growing and expanding our global e-commerce operations as follows:
|
•
|
We broadened our e-commerce presence in Europe by expanding our existing retail site in France to service customers in Italy, Greece, Spain, and Portugal;
|
|
•
|
We expanded our global e-commerce presence into Asia by launching a new retail site for our Ralph Lauren business in Japan located at www.RalphLauren.co.jp; and
|
|
•
|
We broadened our e-commerce presence in North America by launching a new retail site for our Club Monaco business in Canada located at www.ClubMonaco.ca.
|
Suspension of Argentina Operations
During the second quarter of Fiscal 2013, we suspended our business operations in Argentina. The suspension of these operations did not have a material impact on the Company’s consolidated or segment results.
Discontinuance of American Living
During the fourth quarter of Fiscal 2012, we decided, along with our wholesale partner J.C. Penney Company, Inc. (“JCPenney”), to discontinue the majority of the products sold under the American Living brand created for and exclusively sold to JCPenney, effective for the Fall 2012 wholesale selling season. The discontinuance of these American Living product lines did not have a material impact on the Company’s consolidated or segment results.
Asia-Pacific Restructuring Plan
In May 2011, we initiated a restructuring plan to reposition and upgrade our existing distribution network and merchandising operations in the Asia-Pacific region, which includes mainland China, Macau, Hong Kong, Taiwan, Malaysia, Singapore, Japan, and South Korea (the “Asia-Pacific Restructuring Plan”). This plan included a reduction in workforce and the closure of certain stores and concession shops that did not support our new merchandising strategy.
|
|
6
|
|
Our Brands and Products
Since 1967, our distinctive brand image has been consistently developed across an expanding number of products, price tiers, and markets. Our products, which include apparel, accessories, and fragrance collections for men and women, as well as childrenswear and home furnishings, comprise one of the world’s most widely recognized families of consumer brands. Reflecting a distinctive American perspective, we have been an innovator in aspirational lifestyle branding and believe that, under the direction of internationally renowned designer Mr. Ralph Lauren, we have had a considerable influence on the way people dress and the way that fashion is advertised throughout the world. We combine consumer insight with our design, marketing, and imaging skills to offer, along with our licensing alliances, broad lifestyle product collections with a unified vision:
|
•
|
Apparel
— Products include extensive collections of men’s, women’s, and children’s clothing;
|
|
•
|
Accessories
— Products encompass a broad range, including footwear, eyewear, watches, fine jewelry, hats, belts, and leathergoods, including handbags and luggage;
|
|
•
|
Home
— Coordinated home products include bedding and bath products, furniture, fabric and wallpaper, lighting, paint, tabletop, and giftware; and
|
|
•
|
Fragrance
— Fragrance products are sold under our Big Pony, Romance, Love, Polo, Lauren, Safari, Ralph, and Black Label brands, among others.
|
Our lifestyle brand image is reinforced by our stores and concession shop-within-shops, our wholesale channels of distribution, and our e-commerce sites, including our North American Ralph Lauren and Club Monaco Internet sites; our Ralph Lauren e-commerce sites in Europe; and our Ralph Lauren e-commerce site in Japan.
Ralph Lauren Women’s Collection
Each runway season, Ralph Lauren’s most dramatic vision of women’s fashion is presented to the world. Timeless and sophisticated, Women’s Collection reflects Ralph Lauren’s definitive design philosophy in its groundbreaking juxtapositions of feminine glamour with impeccable tailoring once found only in menswear. From exquisite hand-embroidered evening gowns worn on the red carpet to luxurious hand-finished cashmere tweed suitings to chic vintage denim inspired by rustic Americana, Women’s Collection is the epitome of modern, rarefied fashion. Ralph Lauren Women’s Collection is available in Ralph Lauren stores around the world, in an exclusive selection of fine specialty stores, and online at our Ralph Lauren e-commerce sites, including RalphLauren.com.
Ralph Lauren Purple Label
In the time-honored tradition of bespoke clothing and haberdashery, Ralph Lauren Purple Label presents a level of sartorial craftsmanship unparalleled today. Refined suitings are hand-tailored from a selection of fine fabrics. Custom-tailored Made-to-Measure suits are hand-constructed by artisans trained in the art of handmade clothing. Sophisticated sportswear and dandy-inspired dress furnishings are designed with meticulous attention to every detail. Dedicated to the highest level of quality and elegance, Ralph Lauren Purple Label is the ultimate expression of luxury for the modern gentleman. Ralph Lauren Purple Label also offers benchmade footwear and Made-to-Order dress furnishings, accessories, and luggage, as well as hand monogramming and custom engraving services. Ralph Lauren Purple Label is available in Ralph Lauren stores around the world, in an exclusive selection of fine specialty stores, and online at our Ralph Lauren e-commerce sites, including at RalphLauren.com.
Accessories
Ralph Lauren accessories for men and women reflect the distinctive design philosophies known throughout the world of Ralph Lauren and represent a continuous dedication to impeccable craftsmanship and iconic beauty. Ralph Lauren accessories for women capture a wide array of timeless styles, from a glamorous handmade alligator Ricky Bag that takes up to 12 hours to craft to weathered canvas saddle bags with authentic equestrian hardware to vintage luggage-inspired handbags that recall the golden age of travel. Ralph Lauren’s signature motifs can be found throughout — from jockey-print scarves, riding boots with equestrian hardware, and vintage aviator sunglasses to striking diamante evening shoes, romantic ruffled scarves, and antique, one-of-a-kind belts and jewelry. Ralph Lauren accessories and dress furnishings are a man’s most refined finishing touch. Iconic and innovative neckties, which launched the Polo brand in 1967, are woven from the finest silks. Footwear ranges from velvet monogrammed slippers and benchmade dress shoes to hand-sewn penny loafers and rugged suede and shearling duck boots. Handcrafted luggage and leathergoods combine handsome sophistication with functionality. Each accessory is meticulously designed to complement Ralph Lauren’s menswear collections — from vintage-inspired eyewear and Savile Row-inspired haberdashery to sleek silver
|
|
7
|
|
engraved cuff links and engine-turned belt buckles to luxe cashmere scarves and hand-sewn shearling gloves. Ralph Lauren accessories are available in Ralph Lauren stores around the world, select specialty stores, and online at our Ralph Lauren e-commerce sites, including RalphLauren.com.
Ralph Lauren Watches
In 2008, Ralph Lauren launched his premier collection of timepieces in partnership with internationally renowned luxury group Compagnie Financiere Richemont SA (“Richemont”). The three pillar collections — the iconic Ralph Lauren Stirrup, the refined Ralph Lauren Slim Classique, and the Ralph Lauren Sporting, which features classic sport, automotive, and safari inspirations — embody Ralph Lauren’s passion for impeccable quality and exquisite design. Ralph Lauren timepieces feature the finest in Swiss Made manufacture movements and some of the world’s most luxurious materials — from pure platinum and polished 18-carat gold cases
to
enamel dials, traditional guilloché patterns, and full-cut diamonds. Each year, Ralph Lauren Watches debuts new designs that continue this legacy of authentic, high-end watchmaking. Ralph Lauren Watches are available at select Ralph Lauren stores around the world and the finest watch retailers.
Ralph
Lauren
Fine Jewelry
In 2010, Ralph Lauren Watch & Jewelry Co. introduced the premier collections of Ralph Lauren Fine Jewelry in celebration of Ralph Lauren’s new women’s flagship store in New York City. Inspired by brilliance, movement, and the alluring tradition of fine jewelry, this debut unveiled several collections, including the Ralph Lauren Diamond Link Collection, the Ralph Lauren Equestrian Collection, and the Ralph Lauren Chunky Chains Collection — all capturing the glamour and craftsmanship of Ralph Lauren’s most
luxurious
designs. The fine jewelry collections include elegantly set
pavé
diamond links, classic equestrian motifs stylized in shimmering diamonds, chic chunky chains, and romantic chandelier earrings. Each piece is handcrafted using precious materials and intricate finishing techniques, highlighting a unique beauty and graceful silhouette that is signature Ralph Lauren. Ralph Lauren Fine Jewelry is available in select Ralph Lauren stores and flagships locations around the world.
Ralph Lauren Women’s Black Label
Black Label is the essence of sleek, modern sophistication for women. Proportions are chic and dramatic, ranging from menswear-inspired silhouettes to shimmering and feminine eveningwear. Fabrics are ultra-luxe and textural, color statements are rich and striking, and racy technical references infuse this glamorous collection with a bold edge. The women's Black Label Denim collection possesses the same ultramodern appeal with sexy fashion-forward fits, cool innovative treatments, and an elevated mix of rugged and luxury fabrics. Black Label is offered in select Ralph Lauren stores around the world, designer boutiques, fine specialty stores, better department stores, and online at our Ralph Lauren e-commerce sites, including RalphLauren.com.
Ralph Lauren Men’s Black Label
With a sharp, modern attitude, Ralph Lauren Black Label is the essence of sophisticated dressing for men. Classic suitings feature razor-sharp tailoring and dramatically lean silhouettes. Luxe, racy sportswear is crafted from fine fabrics and designed with subtle references to technical performance wear. Ultra-stylish yet timeless, the Black Label collection is sleek, bold, and masculine. Ralph Lauren Black Label is available in Ralph Lauren stores around the world, a limited selection of specialty stores and better department stores, and online at our Ralph Lauren e-commerce sites, including at RalphLauren.com.
Ralph Lauren Men’s Black Label Denim
Introduced in 2011, Ralph Lauren Men’s Black Label Denim represents the next evolution of luxe, ultramodern denim for men, with fashion-forward fits, chic signature details, and a focus on authentic, innovative treatments. With a renegade edge and international appeal, Black Label Denim redefines iconic pieces in luxury and rugged fabrics, with accents that capture Ralph Lauren’s unique sensibility, from utility and leather to western and automotive. Confident and masculine, Ralph Lauren combines state-of-the-art denim and superfine sportswear to create the ultimate in cool sophistication. Black Label Denim is available in Ralph Lauren stores around the world, a limited selection of specialty stores and better department stores, and online at our Ralph Lauren e-commerce sites, including at RalphLauren.com.
Ralph Lauren Women’s Black Label Denim
The Ralph Lauren Women's Black Label Denim collection possesses the ultramodern appeal with sexy fashion-forward fits, cool innovative treatments and an elevated mix of rugged and luxury fabrics. Black Label Denim is offered at select Ralph Lauren stores around the world, designer boutiques, fine specialty stores, better department stores, and online at our Ralph Lauren e-commerce sites, including RalphLauren.com.
|
|
8
|
|
Ralph Lauren Blue Label
Modern and eclectic with a sexy, youthful spirit, Blue Label embodies the iconic Ralph Lauren sensibility in its mix of vintage Ivy League prep, equestrian heritage, romantic bohemian, and rugged Western inspirations. Unmistakably Ralph Lauren in its elegance and sophistication, Blue Label defines a fresh, free-spirited femininity. Blue Label is offered in Ralph Lauren stores around the world, better department stores, and online at our Ralph Lauren e-commerce sites, including RalphLauren.com.
Polo Ralph Lauren
Authentic and iconic, Polo is the original symbol of the modern, preppy lifestyle. Combining Ivy League classics and time-honored English haberdashery with downtown styles and All-American sporting looks, Polo sportswear and tailored clothing present a one-of-a-kind vision of menswear that is stylish and timeless, and appeals to all generations of men. Polo’s signature aesthetic — along with our renowned polo player logo — is recognized worldwide as a mark of contemporary heritage excellence. Polo is available in Ralph Lauren stores around the world, better department stores, select specialty stores, and online at our Ralph Lauren e-commerce sites, including RalphLauren.com.
RRL
RRL captures an authentic American spirit with a focus on integrity, character, and timeworn charm. Founded in 1993 and named after Ralph and Ricky Lauren’s “Double RL” ranch in Colorado, RRL for men and women offers a mix of selvage denim, vintage apparel and accessories, and cool, rugged sportswear with roots in workwear and military gear. With denim at the heart of the brand, RRL is dedicated to time-honored details and the highest quality workmanship — from ring-spun long-staple cotton yarns to traditional dyeing techniques and hand-applied artisanal finishes that result in one-of-a-kind, exceptionally durable pieces. RRL is available at RRL stores, at select Ralph Lauren stores, and an exclusive selection of the finest specialty stores around the world, as well as online at our Ralph Lauren e-commerce sites, including RalphLauren.com.
Ralph Lauren Childrenswear
Ralph Lauren Childrenswear is designed to reflect the timeless heritage and modern spirit of Ralph Lauren’s collections for men and women. Signature classics, including iconic polo knit shirts and luxurious cashmere cable sweaters, are interpreted in the most sophisticated and vibrant colors. Fashionable styles are inspired by Ralph Lauren’s unique vision each season — from All-American sportswear with preppy and equestrian inspirations to tailored and elegant ensembles for special occasions. Ralph Lauren Childrenswear is available in a full range of sizes for children, from baby, infant, and toddler to girls size 16 and boys size 20. Ralph Lauren Childrenswear can be found in select Ralph Lauren stores around the world, better department stores, and online at our Ralph Lauren e-commerce sites, including RalphLauren.com.
Lauren Ralph Lauren
Lauren translates the sophisticated luxury of Ralph Lauren womenswear into an affordable wardrobe for every occasion. From timeless essentials with special finishing touches to polished silhouettes with a chic, modern spirit, Lauren maintains an elegant, feminine heritage while making strong seasonal fashion statements. Lauren Active infuses a fashion sensibility into practical sports apparel for golf, tennis, yoga, and weekend wear. Lauren Jeans Co. presents a fresh perspective on denim with a breadth of styles and a complementary collection of sportswear items. Lauren Handbags, first introduced for the Fall 2010 season, add to a wide range of accessories offerings from Lauren, including belts, scarves, gloves, footwear, and jewelry. Lauren offers a range of fits from Petites to Women’s sizes. Lauren is sold in select department stores in the U.S., Europe, Canada, and Mexico, and is also available online at our Ralph Lauren e-commerce sites, including RalphLauren.com.
Pink Pony
Established in 2000, Pink Pony is Ralph Lauren’s worldwide initiative in the fight against cancer. Pink Pony supports programs for early diagnosis, education, treatment, and research, and is dedicated to bringing patient navigation and quality cancer care to medically underserved communities. A percentage of sales from all Pink Pony products benefits the Pink Pony Fund of the Polo Ralph Lauren Foundation and other major cancer charities around the world. Pink Pony consists of feminine, slim-fitting women’s sportswear and accessories crafted in luxurious fabrics. From hooded sweatshirts and cotton mesh polos to canvas tote bags and cashmere yoga pants, all Pink Pony items feature our iconic pink Polo Player — a symbol of our commitment to the fight against cancer. Pink Pony is available at select Ralph Lauren stores and online at our Ralph Lauren e-commerce sites, including RalphLauren.com. During the month of October, Pink Pony is also available at select Macy's stores and Macys.com. To learn more about Pink Pony and our Company’s other philanthropic efforts, please visit RalphLauren.com/Philanthropy.
|
|
9
|
|
RLX Ralph Lauren
Created to answer the demand for superior, high-performance outfitting, RLX Ralph Lauren for men and women unites the highest standards of luxury, technology, and style. From cutting-edge functional gear for professional athletes to exceptionally luxe lifestyle apparel for modern living, RLX Ralph Lauren defines the next evolution of design with a philosophy focused on purity of form, unique construction techniques, and innovative fabrications. The RLX Ralph Lauren line is available at select Ralph Lauren stores around the world, top specialty and department stores, and online at our Ralph Lauren e-commerce sites, including RalphLauren.com.
Denim & Supply Ralph Lauren
Introduced in Fall 2011 with a young bohemian attitude, Denim & Supply Ralph Lauren captures the unique, effortless style of clothes that live and breathe individuality. Eclectic and carefree — from destructed premium denim to sexy, romantic free-spirited clothes to rugged, weathered American utility — Denim & Supply is the next generation of down-to-earth dressing. Denim & Supply Ralph Lauren is available in North America at Macy’s and Hudson Bay, in Europe at our inaugural Denim & Supply store in Amsterdam and select specialty stores, in Canada at select specialty stores, and in Asia at Denim & Supply stores, select specialty stores and concession-based shop-within-shops. In addition, Denim & Supply Ralph Lauren is available online at our Ralph Lauren e-commerce sites, including RalphLauren.com. Denim & Supply will open its first freestanding stores in the U.S. located in New York and Boston in the Summer of 2013.
Golf
Tested and worn by top-ranked professional golfers, Polo Golf for men and Ralph Lauren Golf for women define heritage excellence in the world of golf. With a sharpened focus on the needs of the modern player but always rooted in the rich design tradition of Ralph Lauren, the Golf collections combine state-of-the-art performance wear with luxurious finishing touches for collections that travel effortlessly between the course and the clubhouse. The RLX Golf collection is ultramodern, graphic, and dedicated to performance-driven design. From progressive fits and sophisticated styles to the technologically advanced fabrics, RLX golf is the ultimate in functional luxury. Ralph Lauren is proud to sponsor professional golfers, including Tom Watson, Davis Love III, Jonathan Byrd, Luke Donald, Matteo Manassero, Billy Horschel,
and Morgan Hoffman
. The Polo, Ralph Lauren, and RLX Golf collections are available in select Ralph Lauren stores around the world, exclusive private clubs and resorts, and online at our Ralph Lauren e-commerce sites, including RalphLauren.com.
Lauren for Men
Classic and polished, Lauren for Men conveys a spirit of tradition with a contemporary attitude. A complete collection of men’s tailored clothing, including suits, sport coats, dress shirts, dress pants, tuxedos, topcoats, and ties, the Lauren men’s line offers the sophisticated spirit and preppy heritage of Ralph Lauren menswear at a more accessible price point. A soft, natural shoulder and modern construction details ensure elegant styling with superior comfort and the integrity of a well-made garment. Lauren for Men is available at select department stores in North America and Europe.
Ralph by Ralph Lauren
Superior fabrics and a precise, impeccable construction define the distinguished aesthetic of the Ralph by Ralph Lauren collection for men. Suit separates, sport coats, vests, and topcoats are all fashioned with the hallmarks of better men’s suitings, from half-canvas jacket constructions and high-quality Bemberg linings to hand-finished seams, felled cuffs, and hems and reinforcements at natural points of wear. Timeless and unmistakably Ralph Lauren, the Ralph by Ralph Lauren collection offers refined luxury at an excellent value. Ralph by Ralph Lauren is available exclusively at Dillard’s stores and Dillards.com.
Fragrance
In 1978, Mr. Ralph Lauren expanded his lifestyle brand to encompass the world of fragrance, launching Lauren for women and Polo for men. Since then, Ralph Lauren Fragrance has captured the essence of Ralph Lauren’s men’s and women’s brands, from the timeless heritage of Lauren and Polo to the sophisticated beauty of Polo Black for men and Romance for women to the modern, fresh Ralph fragrances for her, designed to appeal to a younger audience. Women’s fragrances include Safari, Ralph Lauren Blue, Lauren, Romance, the Ralph Collection, Notorious, Love, and the Big Pony collection. Men’s fragrances include Safari, Polo Sport, Polo Blue, Romance, Romance Silver, Purple Label, Explorer, Polo Black, Double Black, Red, White and Blue, and the Big Pony collection. During Fiscal 2013, Ralph Lauren introduced the new Polo Red fragrance for men. Ralph Lauren fragrances are available in department stores, specialty and duty free stores, perfumeries, select Ralph Lauren stores around the world, and online at our Ralph Lauren e-commerce sites, including RalphLauren.com.
|
|
10
|
|
Ralph Lauren Home
As the first American fashion designer to create an all-encompassing collection for the home, Ralph Lauren presents home furnishings and accessories that reflect the enduring style and exquisite craftsmanship synonymous with the name Ralph Lauren. Whether inspired by time-honored tradition, the utmost in modern sophistication, or the beauty of rare objects collected around the world, Ralph Lauren Home is dedicated to fine materials and great attention to detail for the ultimate in artisanal luxury. The collections include furniture, bed and bath linens, china, crystal, silver, decorative accessories and gifts, as well as lighting, fabric, wallcovering, and floorcovering. Ralph Lauren Home offers exclusive luxury goods at select Ralph Lauren stores, home specialty stores, trade showrooms, and online at our Ralph Lauren e-commerce sites, including RalphLauren.com. The complete world of Ralph Lauren Home can be explored online at RalphLaurenHome.com.
Lauren Home
Lauren Home presents a signature design sensibility that combines heritage elegance with a fresh, modern flair. Finely crafted and highly accessible for any well-appointed home, Lauren Home offers a wide array of collections that range from classic to modern, including bedding, bath, furniture, tabletop, gifts, decorative accessories, floorcovering, and lighting. Lauren Home is available at select department stores, home specialty stores around the world, and online at our Ralph Lauren e-commerce sites, including RalphLauren.com.
Ralph Lauren Paint
Introduced in 1995, Ralph Lauren Paint offers exceptional quality and beauty in the Ralph Lauren tradition. Drawing on over four decades of iconic design, Ralph Lauren paint is meticulously crafted from the finest materials in the industry to perform best in class, from impeccable coverage to long-lasting brilliance. In addition to a signature palette of over 400 one-of-a-kind colors, Ralph Lauren Paint brings the texture and appearance of some of Ralph Lauren's most celebrated lifestyles to the home with a distinctive collection of faux techniques and unique specialty finishes. Ralph Lauren Paint is offered at select specialty stores in the U.S. The complete color palette, paint how-to’s, and a guide to professional painters are online at RalphLaurenPaint.com.
Chaps
Chaps translates the classic heritage and timeless aesthetic of Ralph Lauren into an accessible line for men, women, children, and the home. From casual basics designed for versatility and ease of wear to smart, finely tailored silhouettes perfect for business and more formal occasions, Chaps creates interchangeable classics that are both enduring and affordable. The Chaps men’s collection is available at select department and specialty stores, primarily in the U.S. The Chaps collections for women, children, and the home are offered exclusively by Kohl's Corporation ("Kohl’s") at their stores and Kohls.com.
Club Monaco
Founded in 1985, Club Monaco is an international destination for affordable, stylish luxury. Each season, Club Monaco designs, manufactures, and markets its own clothing and accessories for men and women, offering key fashion pieces with modern, urban sophistication and a selection of updated classics — from the perfect white shirt and black pencil skirt to refined suiting and Italian cashmere. The brand’s signature aesthetic is defined by clean, contemporary design and a palette of versatile neutrals infused with pops of vibrant colors. Club Monaco apparel and accessories are available at Club Monaco stores around the world, as well as online at our Club Monaco domestic e-commerce site at ClubMonaco.com. In April 2012, Club Monaco further expanded its e-commerce presence in North America by launching ClubMonaco.ca in Canada. Club Monaco is currently also available in Europe at select department stores and specialty shops, and in Asia through our licensing arrangements.
Our Wholesale Segment
Our Wholesale segment sells our products to leading upscale and certain mid-tier department stores, specialty stores, and golf and pro shops, both domestically and internationally. We have continued to focus on elevating our brand by improving in-store product assortment and presentation, as well as full-price sell-throughs to consumers. As of the end of
Fiscal 2013
, our Ralph Lauren-branded products were sold through approximately 11,000 doors worldwide and during
Fiscal 2013
, we invested approximately $40 million of capital in related shop-within-shops primarily in domestic and international department and specialty stores. Our products are also sold through the e-commerce sites of certain of our wholesale customers.
|
|
11
|
|
The primary product offerings sold through our wholesale channels of distribution include menswear, womenswear, childrenswear, accessories, and home furnishings. Our collection brands — Women’s Ralph Lauren Collection and Black Label and Men’s Purple Label and Black Label — are distributed worldwide through a limited number of premier fashion retailers. Department stores are our major wholesale customers in North America. In Latin America, our wholesale products are sold in department stores and specialty stores. In Europe, our wholesale sales are a varying mix of sales to both department stores and specialty stores, depending on the country. We also distribute product to certain licensed stores operated by franchisees in Europe and Asia. In addition, our Club Monaco products are distributed through select department stores and specialty stores in Europe. In Japan, our wholesale products are distributed primarily through shop-within-shops at premier and top-tier department stores, and the mix of business is weighted to Women’s and Men's Blue Label. In the Greater China and Southeast Asia region, our wholesale products are sold at mid and top-tier department stores in China, Thailand, and the Philippines, and the mix of business is primarily weighted to Men’s and Women’s Blue Label.
We sell the majority of our excess and out-of-season products through secondary distribution channels worldwide, including our retail factory stores.
Worldwide Distribution Channels
The following table presents the number of doors by geographic location in which Ralph Lauren-branded products distributed by our Wholesale segment were sold to consumers in our primary channels of distribution as of
March 30, 2013
:
|
Location
|
Number of
Doors
|
||
|
The Americas
|
6,043
|
|
|
|
Europe
|
4,504
|
|
|
|
Asia
|
78
|
|
|
|
Total
|
10,625
|
|
|
In addition, Chaps-branded products distributed by our Wholesale segment were sold domestically through approximately 1,200 doors as of
March 30, 2013
.
We have three key wholesale customers that generate significant sales volume. For
Fiscal 2013
, these customers in the aggregate accounted for approximately
45%
of our total Wholesale revenues, with Macy’s, Inc. ("Macy's") representing approximately 25% of our total Wholesale revenues.
Our products are sold primarily through our own sales forces. Our Wholesale segment maintains its primary showrooms in New York City. In addition, we maintain regional showrooms in Boston, Milan, Paris, London, Munich, Madrid, and Stockholm.
Shop-within-Shops.
As a critical element of our distribution to department stores, we and our licensing partners utilize shop-within-shops to enhance brand recognition, to permit more complete merchandising of our lines by the department stores, and to differentiate the presentation of our products. Shop-within-shop fixed assets primarily include items such as customized freestanding fixtures, wall cases and components, decorative items, and flooring.
As of
March 30, 2013
, we had approximately 20,000 shop-within-shops dedicated to our Ralph Lauren-branded wholesale products worldwide. The size of our shop-within-shops ranges from approximately 100 to 7,400 square feet. We normally share in the cost of building-out these shop-within-shops with our wholesale customers.
Basic Stock Replenishment Program.
Basic products such as knit shirts, chino pants, oxford cloth shirts, selected accessories, and Home products can be ordered by our wholesale customers at any time through our basic stock replenishment programs. We generally ship these products within two-to-five days of order receipt.
Our Retail Segment
As of
March 30, 2013
, our Retail segment consisted of 388 directly-operated freestanding stores worldwide, totaling approximately 3 million square feet, 494 concession-based shop-within-shops, and seven e-commerce websites. The extension of our direct-to-consumer reach is one of our primary long-term strategic goals.
|
|
12
|
|
Ralph Lauren Stores
Our Ralph Lauren stores reinforce the luxury image and distinct sensibility of our brands and feature exclusive lines that are not sold in department stores. We opened 20 new Ralph Lauren stores, acquired 2 previously licensed stores, and closed 10 Ralph Lauren stores in
Fiscal 2013
. Our retail stores are primarily situated in major upscale street locations and upscale regional malls, generally in large urban markets.
We operated the following Ralph Lauren stores as of
March 30, 2013
:
|
Location
|
Ralph Lauren Stores
|
||
|
The Americas
|
56
|
|
|
|
Europe
|
27
|
|
|
|
Asia
|
32
|
|
|
|
Total
|
115
|
|
|
Ralph Lauren stores feature a broad range of Ralph Lauren apparel, accessories, and Home product assortments in an atmosphere reflecting the distinctive attitude and luxury positioning of the Ralph Lauren brand. Our seven flagship Ralph Lauren store locations showcase our upper-end luxury styles and products and demonstrate our most refined merchandising techniques. In addition to generating sales of our products, our worldwide Ralph Lauren stores set, reinforce, and capitalize on the image of our brands. Our Ralph Lauren stores range in size from approximately 700 to 38,000 square feet.
Club Monaco Stores
Our Club Monaco stores feature fashion apparel and accessories for both men and women. The brand’s clean and contemporary signature style forms the foundation of a modern wardrobe. As of
March 30, 2013
, we operated 59 Club Monaco retail stores in North America. Our Club Monaco stores range in size from approximately 1,700 to 17,400 square feet.
Rugby Stores
In October 2012, we approved a plan to wind-down our retail Rugby brand operations, resulting in the closure of 13 of our 14 global freestanding Rugby stores and the related domestic e-commerce site during Fiscal 2013. As of
March 30, 2013
, we continued to operate one Rugby store in Japan, which we plan to close in Fiscal 2014.
Factory Stores
We extend our reach to additional consumer groups through our 213 factory stores worldwide. Our factory stores are generally located in outlet centers. During
Fiscal 2013
, we added 14 new factory stores and closed 2 factory stores.
We operated the following factory stores as of
March 30, 2013
:
|
Location
|
Factory Stores
|
||
|
The Americas
|
148
|
|
|
|
Europe
|
40
|
|
|
|
Asia
|
25
|
|
|
|
Total
|
213
|
|
|
|
•
|
Our factory stores in the
Americas offer selections of our menswear, womenswear, childrenswear, accessories, home furnishings, and fragrances. Ranging in size from approximately 2,700 to 20,000 square feet, with an average of approximately 9,900 square feet, these stores are principally located in major outlet centers in 42 states in the U.S. and in Puerto Rico.
|
|
•
|
Our factory stores in Europe offer selections of our menswear, womenswear, childrenswear, accessories, home furnishings, and fragrances. Ranging in size from approximately 1,400 to 19,700 square feet, with an average of approximately 6,500 square feet, these stores are located in 12 countries, principally in major outlet centers.
|
|
•
|
Our factory stores in Asia offer selections of our menswear, womenswear, childrenswear, accessories, and fragrances. Ranging in size from approximately 2,800 to 11,800 square feet, with an average of approximately 6,600 square feet,
|
|
|
13
|
|
these stores are primarily located throughout Japan, in Hong Kong and in or near other major cities in Asia, principally in major outlet centers.
Factory stores obtain products from our suppliers, our product licensing partners, and our retail stores and e-commerce operations, and serve as a secondary distribution channel for our excess and out-of-season products.
Concession-based Shop-within-Shops
In Asia, the terms of trade for shop-within-shops are largely conducted on a concession basis, whereby inventory continues to be owned by us (not the department store) until ultimate sale to the end consumer. The salespeople involved in the sales transaction are generally our employees and not those of the department store.
As of
March 30, 2013
, we had 494 concession-based shop-within-shops at 225 retail locations dedicated to our products, primarily in Asia. The size of our concession-based shop-within-shops ranges from approximately 140 to 4,300 square feet. We may share in the cost of building-out certain of these shop-within-shops with our department store partners.
E-commerce Websites
In addition to our stores, our Retail segment sells products online through our e-commerce channel, which includes:
|
•
|
Our North American sites located at www.RalphLauren.com and www.ClubMonaco.com, including our Club Monaco site in Canada located at www.ClubMonaco.ca;
|
|
•
|
Our Ralph Lauren
sites in Europe servicing Austria, Belgium, France, Germany, Greece, Italy, Luxembourg, the Netherlands, Portugal, Spain, and the United Kingdom; and
|
|
•
|
Our recently launched Ralph Lauren
site in Japan located at www.RalphLauren.co.jp.
|
Our Ralph Lauren e-commerce sites in the U.S., Europe, and Japan offer our customers access to a broad array of Ralph Lauren apparel, accessories, and Home products, allow us to reach retail customers on a multi-channel basis, and reinforce the luxury image of our brands.
Our Club Monaco e-commerce sites in the U.S. and Canada offer our domestic and Canadian customers access to our Club Monaco global assortment of womenswear, menswear, and accessories product lines, as well as select online exclusives.
Our Licensing Segment
Through licensing alliances, we combine our consumer insight, design, and marketing skills with the specific product or geographic competencies of our licensing partners to create and build new businesses. We generally seek out licensing partners who are leaders in their respective markets, contribute the majority of the product development costs, provide the operational infrastructure required to support the business, and own the inventory.
We grant our product licensees the right to manufacture and sell at wholesale specified categories of products under one or more of our trademarks. We grant our international geographic area licensing partners exclusive rights to distribute certain brands or classes of our products and operate retail stores in specific international territories. These geographic area licensees source products from us, our product licensing partners, and independent sources. Each product licensing partner pays us royalties based upon its sales of our products, generally subject to a minimum royalty requirement for the right to use our trademarks and design services. In addition, licensing partners may be required to allocate a portion of their revenues to advertising our products and sharing in the creative costs associated with these products. Larger allocations are required in connection with launches of new products or in new territories. Our licenses generally have one to five-year terms and may grant the licensees conditional renewal options.
We work closely with all of our licensing partners to ensure that their products are developed, marketed, and distributed to reach the intended market opportunity and are presented consistently to consumers across product categories and international markets to convey the distinctive identity and lifestyle associated with our brands. Virtually all aspects of the design, production quality, packaging, merchandising, distribution, advertising, and promotion of Ralph Lauren products are subject to our prior approval and continuing oversight. We perform a broader range of services for our Ralph Lauren Home licensing partners than
|
|
14
|
|
we do for our other licensing partners, including design, operating showrooms, marketing, advertising, and, in some cases, sales. In general, our Home licensing partners manufacture and own the inventory, and ship the products.
Approximately 44% of our licensing revenue for
Fiscal 2013
was earned from four of our largest licensing partners: PVH Corp. (successor to The Warnaco Group, Inc.), Luxottica Group, S.p.A., Peerless, Inc., and L’Oreal S.A. The following table lists our largest product and Home licensing agreements as of
March 30, 2013
. Except as noted in the table, these product licenses cover the U.S. or North America only.
|
Category
|
Licensed Products
|
Licensing Partners
|
||
|
Men's Apparel
|
Underwear and Sleepwear
|
Hanes Brands
|
||
|
Chaps, Lauren, and Ralph Tailored Clothing
|
Peerless, Inc.
|
|||
|
Chaps Sportswear
(1)
|
PVH Corp. (successor to The Warnaco Group, Inc.
)
(1)
|
|||
|
Beauty Products
|
Fragrances, Cosmetics, Color, and Skin Care
|
L’Oreal S.A. (global)
|
||
|
Accessories
|
Eyewear
|
Luxottica Group, S.p.A. (global)
|
||
|
Home
(2)
|
Bedding and Bath
|
|
Ichida (Japan) and Kohl’s Department Stores, Inc.
|
|
|
Home Décor
|
|
Folia and EJ Victor, Inc.
|
||
|
(1)
|
In connection with the acquisition of The Warnaco Group, Inc. by PVH Corp., we exercised our right under the existing licensing agreement to reacquire our North American Chaps men's sportswear license, and assumed control over this wholesale business effective April 10, 2013.
|
|
(2)
|
Our Home products are sold under our Ralph Lauren Home, Lauren by Ralph Lauren, and Chaps brands. As of March 30, 2013, we had agreements with 11 domestic and three international Home product licensing partners, and one international Home product sublicensing partner.
|
International Licensing
We believe that international markets offer additional opportunities for our quintessential American designs and lifestyle image. Our international licensing partners acquire the right to sell, promote, market, and/or distribute various categories of our products in a given geographic area. These rights may include the right to own and operate retail stores. As of
March 30, 2013
, our international licensing partners operated 62 Ralph Lauren stores, 32 Ralph Lauren concession shops, and 64 Club Monaco stores and concession shops.
In June 2012, our international licensing agreement with P.R.L. Enterprises, S.A. expired and we assumed control over the related product distribution in Latin America. As of March 30, 2013, our principal international licensing partners (excluding Ralph Lauren Home and Club Monaco Licensees) included Oroton Group/PRL Australia in Australia and New Zealand, and Commercial Madison, S.A. in Chile. Our license agreements with each of these licensing partners will terminate in June 2013, at which point we will assume control over the related product distribution.
Product Design
Our products reflect a timeless and innovative interpretation of American style with a strong international appeal. Our consistent emphasis on new and distinctive design has been an important contributor to the prominence, strength, and reputation of the Ralph Lauren brands.
Our Ralph Lauren products are designed by, or under the direction of, Mr. Ralph Lauren and our design staff. We form design teams around our brands and product categories to develop concepts, themes, and products for each brand and category. Through close collaboration with merchandising, sales, and production staff, these teams support all three segments of our business — Wholesale, Retail, and Licensing — in order to gain market and other valuable input.
|
|
15
|
|
Marketing and Advertising
Our marketing and advertising programs communicate the themes and images of our brands and are integral to our product offering. The majority of our advertising program is created and executed on a centralized basis through our in-house creative and advertising organization to ensure consistency of presentation, which is complemented by our marketing experts in each region who help to execute our international strategies.
We create distinctive image advertising for our brands, conveying the particular message of each one within the context of the overall Ralph Lauren aesthetic. Advertisements generally portray a lifestyle rather than a specific item and include a variety of products offered by ourselves and, in some cases, our licensing partners. Our primary advertising medium is print, with multiple page advertisements appearing regularly in a range of fashion, lifestyle, and general interest magazines. Major print advertising campaigns are conducted during the fall and spring retail seasons, with additions throughout the year to coincide with product deliveries. In addition to print, we utilize television and outdoor media in certain of our marketing programs. We also market our brand through direct-to-consumer marketing, special events, and interactive digital activities. We use our consumer database and consumer knowledge to guide these activities.
Our digital advertising programs focus on high impact and innovative digital media outlets, which allow us to convey our key brand messages and lifestyle positioning. We also develop digital editorial initiatives that allow for deeper education and engagement around the Ralph Lauren lifestyle, including the Ralph Lauren magazine, style guides, and brand videos. We deploy these marketing and advertising initiatives through the Internet, mobile platforms, and social media. Our e-commerce sites present the Ralph Lauren lifestyle on the Internet while offering a broad array of our apparel, accessories, and Home product lines.
We advertise in consumer and trade print and digital media, and participate in cooperative advertising on a shared cost basis with some of our retail and licensing partners. We also provide point-of-sale fixtures and signage to our wholesale customers to enhance the presentation of our products at their retail locations. In addition, when our licensing partners are required to spend an amount equal to a percent of their licensed product sales on advertising, we coordinate the advertising placement on their behalf. We believe our investments in shop-within-shop environments and retail stores, including our flagship locations worldwide, contribute to and enhance the themes of our brands to consumers. We expensed approximately
$217 million
related to the advertising, marketing, and promotion of our products in
Fiscal 2013
.
We also conduct a variety of public relations activities. Each of our spring and fall womenswear collections are presented at major fashion shows in New York City, which typically generate extensive domestic and international media coverage. We introduce each of the spring and fall menswear collections at press presentations in major cities such as New York and Milan. In addition, we organize in-store appearances by our models and certain professional athletes.
We continue to be the exclusive outfitter for all on-court officials at the Wimbledon tennis tournament and the official outfitter of all on-court officials at the U.S. Open tennis tournament. Both tournaments provide worldwide exposure for our brand in a relevant lifestyle environment. We also continue to be the exclusive Official Parade Outfitter for the U.S. Olympic and Paralympic Teams with the right to manufacture, distribute, advertise, promote, and sell products in the U.S. which replicate the Parade Outfits and associated leisure wear. As part of our involvement with Team U.S.A., we have established a partnership with athletes serving as brand ambassadors and as the faces of our advertising, marketing, and public relations campaigns.
In January 2011, we entered into a five-year agreement with the United States Golf Association (“USGA”) to be the official apparel outfitter for the USGA and the U.S. Open Championships and serve as the championship’s largest on-site apparel supplier. Additionally, in 2011, we entered into a five-year agreement with The Royal & Ancient to become an Official Patron of The Open Championship that is played annually on British links golf courses. As part of this agreement, we are outfitting all officials and staff members at The Open Championship and are serving as the championship’s largest on-site apparel retailer. We believe our partnerships with prestigious global tournaments reinforce our brand’s sporting heritage.
Sourcing, Production and Quality
We contract for the manufacture of our products and do not own or operate any production facilities. Over 700 different manufacturers worldwide produce our apparel, footwear, accessories, and home products, with no one manufacturer providing more than approximately 4% of our total production during
Fiscal 2013
. We source both finished products and raw materials. Raw materials include fabric, buttons, and other trim. Finished products consist of manufactured and fully assembled products ready for shipment to our customers. In
Fiscal 2013
, less than 2% of our products (by dollar value) were produced in the U.S., and over 98% of our products (by dollar value) were produced outside the U.S., primarily in Asia, Europe, and Latin America. See “Import Restrictions and other Government Regulations” and Item 1A — “
Risk Factors
—
Risks Related to Our Business — Our business
|
|
16
|
|
is subject to risks associated with importing products and could suffer as a result of increases in the price of raw materials, freight, or labor or a manufacturer’s inability to produce our goods on time and to our specifications
.”
Most of our businesses must commit to manufacture our garments before we sell finished goods, whether to wholly-owned retail stores or to wholesale customers. We also must commit to purchase fabric from mills well in advance of our sales. If we overestimate our primary customers’ demand for a particular product or the need for a particular fabric or yarn, we may sell the excess products or garments made from such fabric or yarn in our factory stores or through secondary distribution channels.
Suppliers operate under the close supervision of our global manufacturing division and buying agents headquartered in Asia, the Americas, the Middle East, and Europe. All products are produced according to our specifications. Production and quality control staff in Asia, the Americas, the Middle East, and Europe monitor manufacturing at supplier facilities in order to correct problems prior to shipment of the final product. Procedures have been implemented under our vendor certification and compliance programs so that quality assurance is reviewed early in the production process, allowing merchandise to be received at the distribution facilities and shipped to customers with minimal interruption.
Competition
Competition is very strong in the segments of the fashion and consumer product industries in which we operate. We compete with numerous designers and manufacturers of apparel and accessories, fragrances, and home furnishing products, both domestic and international. Some of our competitors may be significantly larger and have substantially greater resources than us. We compete primarily on the basis of fashion, quality, value, and service, which depend on our ability to:
|
•
|
anticipate and respond to changing consumer demands in a timely manner;
|
|
•
|
maintain favorable brand recognition, loyalty, and reputation for quality;
|
|
•
|
develop and produce high quality products that appeal to consumers;
|
|
•
|
appropriately source raw materials at cost-effective prices;
|
|
•
|
appropriately price our products;
|
|
•
|
provide strong and effective marketing support;
|
|
•
|
ensure product availability; and
|
|
•
|
obtain additional points of distribution and sufficient retail floor space, and effectively present our products at retail.
|
See Item 1A — “
Risk Factors — Risks Relating to the Industry in Which We Compete — We face intense competition worldwide in the markets in which we operate
.”
|
|
17
|
|
Distribution
To facilitate global distribution, our products are shipped from manufacturers to a network of distribution centers around the world for inspection, sorting, packing, and delivery to retail and wholesale customers. This network includes the following primary distribution facilities:
|
Geographic Region
|
|
Facility Type
|
|
Facility Location
|
|
Facility
Ownership
|
|
U.S.
|
|
Wholesale and Retail distribution center
|
|
Greensboro, North Carolina
|
|
Owned
|
|
|
Wholesale distribution center
|
|
High Point, North Carolina
|
|
Leased
|
|
|
|
E-commerce distribution center
|
|
High Point, North Carolina
(1)
|
|
Leased
|
|
|
|
Distribution center
|
|
Chino Hills, California
|
|
Third-party
|
|
|
|
Distribution center
|
|
Miami, Florida
|
|
Third-party
|
|
|
Canada
|
|
Distribution center
|
|
Toronto, Ontario
|
|
Third-party
|
|
Europe
|
|
Distribution center
|
|
Parma, Italy
(2)
|
|
Third-party
|
|
Japan
|
|
Distribution center
|
|
Yokohama, Japan
(3)
|
|
Third-party
|
|
South Korea
|
|
Distribution center
|
|
Bugok, South Korea
|
|
Leased
|
|
Greater China and Southeast Asia
(4)
|
|
Distribution centers
|
|
Hong Kong, China, Singapore,
Malaysia, and Taiwan
|
|
Third-party
|
|
Latin America
|
|
Distribution centers
|
|
Uruguay and Panama
|
|
Third-party
|
|
|
|
(1)
|
This distribution center performs customer order fulfillment for RalphLauren.com and ClubMonaco.com. In October 2012, we entered into an agreement to purchase and expand this distribution center, which is expected to be completed in September 2013.
|
|
(2)
|
This distribution center performs customer order fulfillment for our European businesses, including our e-commerce operations in Europe.
|
|
(3)
|
This distribution center performs customer order fulfillment for our Japanese businesses, including our e-commerce operations in Japan.
|
|
(4)
|
Includes China, Hong Kong, Macau, Malaysia, the Philippines, Singapore, Taiwan, and Thailand.
|
All facilities are designed to allow for high-density cube storage and value-added services, and utilize unit and carton tracking technology to facilitate process control and inventory management. The distribution network is managed through globally integrated information technology systems.
Management Information Systems
Our management information systems make the design, marketing, manufacturing, importing, and distribution of our products more efficient by providing, among other things:
|
•
|
comprehensive order processing;
|
|
•
|
production and design information;
|
|
•
|
accounting information; and
|
|
•
|
an enterprise view of information for our design, marketing, manufacturing, importing, and distribution functions.
|
The point-of-sale registers in conjunction with other systems in our stores enable us to track inventory from store receipt to final sale on a real-time basis. We believe our merchandising and financial systems, coupled with our point-of-sale registers and software programs, allow for stock replenishment, effective merchandise planning, and real-time inventory and sales accounting.
In the U.S. and Europe, we utilize an automated replenishment system to facilitate the processing of basic replenishment orders from our Retail segment and wholesale customers, the movement of goods through distribution channels, and the collection of information for planning and forecasting.
|
|
18
|
|
In the U.S. and Europe, we also utilize an automated allocation system to facilitate the flow of inventory for our Retail segment.
We are in the process of implementing a new global operating and financial reporting information technology system as part of a multi-year plan to integrate and upgrade our systems and processes. The implementation of this global system, scheduled to occur in phases over the next several years, began with the migration of certain of our domestic human resource systems during Fiscal 2011 and continued with the transition of certain of our domestic operational and financial systems to the new global operating and financial reporting system during Fiscal 2012. During Fiscal 2013, we continued to develop and enhance those operational and financial systems previously transitioned to the new global operating and financial reporting system. The next phase of this implementation effort involves the migration of certain core areas of our business to the new system, including global merchandise procurement, and customer order management and record-to-report for our North American wholesale operations, beginning in Fiscal 2014.
See Item 1A — “
Risk Factors
—
Risks Related to Our Business
—
Implementation of management information systems may negatively impact our business”
and
“Risk Factors
—
Risks Related to Our Business
—
Our business could suffer if our computer systems and websites are disrupted or cease to operate effectively
.”
Wholesale
Credit Control
We manage our own credit function. We sell our merchandise principally to major department stores and extend credit based on an evaluation of the wholesale customer’s financial capacity and condition, usually without requiring collateral. We monitor credit levels and the financial condition of our wholesale customers on a continuing basis to minimize credit risk. We do not factor or underwrite our accounts receivables, or maintain credit insurance to manage the risk of bad debts. In North America, collection and deduction transactional activities are provided through a third-party service provider. See Item 1A — “
Risk Factors — Risks Related to Our Business
—
Our business could be negatively impacted by any financial instability of our customers
.”
Wholesale Backlog
We generally receive wholesale orders for apparel products approximately three to five months prior to the time the products are delivered to customers. Such orders are generally subject to broad cancellation rights. Our total backlog was approximately $1.4 billion as of
March 30, 2013
and
March 31, 2012
. We expect that substantially all of our backlog orders as of
March 30, 2013
will be filled within the next fiscal year.
The size of our order backlog depends upon a number of factors, including the timing of the market weeks for our particular lines during which a significant percentage of our orders are received and the timing of shipments, which varies from year to year with consideration for holidays, consumer trends, concept plans, and the basic stock replenishment programs usage. As a consequence, a comparison of the size of our order backlog from period to period may not be meaningful, nor may it be indicative of eventual shipments.
Trademarks
We own the RALPH LAUREN, POLO, POLO BY RALPH LAUREN DESIGN, and the famous polo player astride a horse trademarks in the U.S. and approximately 100 countries worldwide. Other trademarks that we similarly own include:
|
•
|
PURPLE LABEL;
|
|
•
|
BLACK LABEL;
|
|
•
|
BLUE LABEL;
|
|
•
|
RRL;
|
|
•
|
LAUREN RALPH LAUREN;
|
|
•
|
PINK PONY;
|
|
|
19
|
|
|
•
|
RLX;
|
|
•
|
DENIM & SUPPLY RALPH LAUREN;
|
|
•
|
LAUREN;
|
|
•
|
RALPH;
|
|
•
|
CHAPS;
|
|
•
|
CLUB MONACO;
|
|
•
|
RUGBY;
|
|
•
|
AMERICAN LIVING; and
|
|
•
|
Various trademarks pertaining to fragrances and cosmetics.
|
Mr. Ralph Lauren has the royalty-free right to use as trademarks RALPH LAUREN, DOUBLE RL, and RRL in perpetuity in connection with, among other things, beef and living animals. The trademarks DOUBLE RL and RRL are currently used by the Double RL Company, an entity wholly-owned by Mr. Lauren. In addition, Mr. Lauren has the right to engage in personal projects involving film or theatrical productions (not including or relating to our business) through RRL Productions, Inc., a company wholly-owned by Mr. Lauren. Any activity by these companies has no impact on us.
Our trademarks are the subject of registrations and pending applications throughout the world for use on a variety of items of apparel, apparel-related products, home furnishings, restaurant and café services, online services and online publications, and beauty products, as well as in connection with retail services, and we continue to expand our worldwide usage and registration of related trademarks. In general, trademarks remain valid and enforceable as long as the marks are used in connection with the related products and services and the required registration renewals are filed. We regard the license to use the trademarks and our other proprietary rights in and to the trademarks as extremely valuable assets in marketing our products and, on a worldwide basis, vigorously seek to protect them against infringement. As a result of the appeal of our trademarks, our products have been the object of counterfeiting. While we have a broad enforcement program which has been generally effective in protecting our intellectual property rights and limiting the sale of counterfeit products in the U.S. and in most major markets abroad, we face greater challenges with respect to enforcing our rights against trademark infringement in certain parts of Asia.
In markets outside of the U.S., our rights to some or all of our trademarks may not be clearly established. In the course of our international expansion, we have experienced conflicts with various third parties who have acquired ownership rights in certain trademarks, including POLO and/or a representation of a Polo Player Design, which impede our use and registration of our principal trademarks. While such conflicts are common and may arise again from time to time as we continue our international expansion, we have, in general, successfully resolved such conflicts in the past through both legal action and negotiated settlements with third-party owners of the conflicting marks (see Item 1A —
“Risk Factors
—
Risks Related to Our Business
—
Our trademarks and other intellectual property rights may not be adequately protected outside the U.S.”
and Item 3 —
“Legal Proceedings”
for further discussion). Although we have not in the past suffered any material restraints or restrictions on doing business in desirable markets, we cannot assure that significant impediments will not arise in the future as we expand product offerings and introduce trademarks to new markets.
Import Restrictions and Other Government Regulations
Virtually all of our merchandise imported into the Americas, Europe, and Asia is subject to duties. In addition, most of the countries to which we ship could impose safeguard quotas and duties to protect their local industries from import surges that threaten to create market disruption. The U.S. and other countries may also unilaterally impose additional duties in response to a particular product being imported (from China or other countries) at unfairly traded prices in such increased quantities that would cause (or threaten) injury to the relevant domestic industry (generally known as “anti-dumping” actions). If dumping is suspected in the U.S., the U.S. Government may self-initiate a dumping case on behalf of the U.S. textile industry which could significantly affect our costs. Furthermore, additional duties, generally known as countervailing duties, can also be imposed by the U.S. Government to offset subsidies provided by a foreign government to foreign manufacturers if the importation of such subsidized merchandise injures or threatens to injure a U.S. industry. Legislative proposals have been introduced which, if adopted, would treat a manipulation by China of the value of its currency as actionable under the anti-dumping or countervailing duty laws.
|
|
20
|
|
We are also subject to other international trade agreements and regulations, such as the North American Free Trade Agreement, the Central American Free Trade Agreement, the Caribbean Basin Initiative, and other special trade programs. A portion of our imported products are eligible for certain of these duty-advantaged programs. In addition, each of the countries in which our products are sold has laws and regulations covering imports. Because the U.S. and the other countries in which our products are manufactured and sold may, from time to time, impose new duties, tariffs, surcharges, or other import controls or restrictions, including the imposition of a “safeguard quota,” or adjust presently prevailing duty or tariff rates or levels, we maintain a program of intensive monitoring of import restrictions and opportunities. We seek to minimize our potential exposure to import related risks through, among other measures, adjustments in product design and fabrication, shifts of production among countries and manufacturers, and through geographical diversification of our sources of supply.
As almost all our products are manufactured by foreign suppliers, the enactment of new legislation or the administration of current international trade regulations, executive action affecting textile agreements, or changes in sourcing patterns resulting from the elimination of quotas could adversely affect our operations. On January 1, 2005, the World Trade Organization's 148 member nations lifted all quotas on apparel and textiles. As a result, all textiles and apparel manufactured in each member nation and exported after January 1, 2005 are no longer subject to quota restrictions. Although we generally expect that the 2005 elimination of quotas will result, over the long term, in an overall reduction in the cost of apparel produced abroad, the implementation of any “safeguard quota provisions,” any “anti-dumping” or “countervailing duty” actions, or any other actions impacting international trade may result, in the near term, in cost increases and in disruption of the supply chain for certain product categories. See Item 1A —
“Risk Factors
—
Risks Related to Our Business
—
Our business is subject to risks associated with importing products and could suffer as a result of increases in the price of raw materials, freight, or labor, or a manufacturer's inability to produce our goods on time and to our specifications”
and
“Risk Factors
—
Risks Related to Our Business
—
Our ability to conduct business in international markets may be affected by legal, regulatory, political and economic risks.”
Apparel and other products sold by us are also subject to regulation in the U.S. and other countries by other governmental agencies, including, in the U.S., the Federal Trade Commission, U.S. Fish and Wildlife Service, and the Consumer Products Safety Commission, including the Consumer Product Safety Improvement Act, which imposes limitations on the permissible amounts of lead and phthalates allowed in children's products. These regulations relate principally to product labeling, licensing requirements, flammability testing, and product safety particularly with respect to products used by children. We believe that we are in substantial compliance with these regulations, as well as applicable federal, state, local, and foreign rules and regulations governing the discharge of materials hazardous to the environment. We do not estimate any significant capital expenditures for environmental control matters either in the next fiscal year or in the near future. Our licensed products, licensing partners, buying/sourcing agents, and the vendors and factories with which we contract for the manufacture and distribution of our products are also subject to regulation. Our agreements require our licensing partners, buying/sourcing agents, vendors, and factories to operate in compliance with all laws and regulations, and we are not aware of any violations which could reasonably be expected to have a material adverse effect on our business or operating results.
We are also subject to new disclosure and reporting requirements, established under existing or new federal or state laws, such as the requirements to identify the origin and existence of certain “conflict minerals” under the Dodd-Frank Wall Street Reform and Consumer Protection Act, and disclosures of abusive labor practices in portions of our supply chain under the California Transparency in Supply Chains Act, which could increase the cost of doing business, adversely affecting our results of operations.
Although we have not suffered any material restriction from doing business in desirable markets in the past, we cannot assure that significant impediments will not arise in the future as we expand product offerings and introduce additional trademarks to new markets.
Employees
As of
March 30, 2013
, we had approximately 23,000 employees, including approximately 14,000 full-time and approximately 9,000 part-time employees. Approximately 14,000 of our employees are located in the U.S. and approximately 9,000 are located in foreign countries. Approximately 30 of our U.S. production and distribution employees in the womenswear business are members of Amalgamated Ladies Garment Cutters Union, Local 10 UNITE (which was previously known as UNITE HERE) under an industry association collective bargaining agreement, which our womenswear subsidiary has adopted. We consider our relations with both our union and non-union employees to be good.
|
|
21
|
|
Executive Officers
The following are our current executive officers and their principal recent business experience:
|
Ralph Lauren
|
|
Age 73
|
|
Mr. Lauren has been Chairman, Chief Executive Officer, and a director of the Company since prior to the Company’s initial public offering in 1997, and was a member of the Advisory Board of the board of directors of the Company’s predecessors since their organization. He founded the Company in 1967 and has provided leadership in the design, marketing, advertising, and operational areas since such time.
|
|
Roger N. Farah
|
|
Age 60
|
|
Mr. Farah has been President, Chief Operating Officer, and a director of the Company since April 2000. He was Chairman of the board of directors of Venator Group, Inc. from December 1994 to April 2000, and was Chief Executive Officer of Venator Group, Inc. from December 1994 to August 1999. He is a Chairman of the Finance Committee and a member of the Executive Committee of the National Retail Federation. Mr. Farah is also a member of the board of directors of Aetna, Inc. and The Progressive Corporation.
|
|
Jackwyn L. Nemerov
|
|
Age 61
|
|
Ms. Nemerov has been Executive Vice President of the Company since September 2004 and a director of the Company since February 2007. From 1998 to 2002, she was President and Chief Operating Officer of Jones Apparel Group, Inc. She is a member of the Board of Governors of Parsons The New School for Design.
|
|
Christopher H. Peterson
|
|
Age 46
|
|
Mr. Peterson has been Senior Vice President and Chief Financial Officer of the Company since September 2012. From 1992 to 2012, Mr. Peterson held various positions with The Procter & Gamble Company, most recently serving as Vice President and Chief Financial Officer of its Global Household Care division.
|
|
Mitchell A. Kosh
|
|
Age 63
|
|
Mr. Kosh has served as Senior Vice President of Human Resources of the Company since July 2000. He was Senior Vice President of Human Resources of Conseco, Inc. from February 2000 to July 2000. Prior to that time, Mr. Kosh held executive human resource positions with the Venator Group, Inc. starting in 1996.
|
|
|
22
|
|
|
Item 1A.
|
Risk Factors
|
There are risks associated with an investment in our securities. The following risk factors should be read carefully in connection with evaluating our business and the forward-looking statements contained in this Annual Report on Form 10-K. Any of the following risk factors could materially adversely affect our business, our prospects, our results of operations, our financial condition, our liquidity, the trading prices of our securities, and/or the actual outcome of matters as to which forward-looking statements are made in this report. Additional risks and uncertainties not currently known to us or that we currently view as immaterial may also materially adversely affect our business, financial condition, and results of operations in future periods or if circumstances change.
Risks Related to Our Business
The loss of the services of Mr. Ralph Lauren, members of our executive management, or other key personnel could have a material adverse effect on our business.
Mr. Ralph Lauren’s leadership in the design, marketing, and operational areas of our business has been a critical element of our success since the inception of our Company. Mr. Lauren is instrumental to, and closely identified with, our brand that bears his name. Our ability to maintain our brand image and leverage the goodwill associated with Mr. Lauren’s name may be damaged if we were to lose his services. We depend on the service and management experience of Mr. Lauren and other key executive officers, who have substantial experience and expertise in our industry and our business. The death or disability of Mr. Lauren or other extended or permanent loss of his services, or any negative market or industry perception with respect to him or arising from his loss, could have a material adverse effect on our business, financial condition, and results of operations. Our other executive officers and other members of senior management have substantial experience and expertise in our business and have made significant contributions to our growth and success. The loss of the services of Mr. Roger Farah, our President and Chief Operating Officer, or one or more of our other key personnel, or the concurrent loss of several of these individuals, could also have a material adverse effect on our business, financial condition, and results of operations. We are not protected by a material amount of key-man or similar life insurance covering Mr. Lauren, our other executive officers, and certain other members of senior management. We have entered into employment agreements with Mr. Lauren and other executive officers, but competition for experienced executives in our industry is intense and the non-compete period with respect to Mr. Lauren and certain other executive officers could, in some circumstances in the event of their termination of employment with our Company, end prior to the employment term set forth in their employment agreements.
We cannot assure the successful implementation of our growth strategy.
As part of our growth strategy, we seek to extend our brands and merchandise categories, expand our geographic coverage, and increase direct management of our brands by opening more of our own stores, strategically acquiring or integrating select businesses previously held by our licensees, and enhancing our operations. Implementation of our strategy involves the continued expansion of our business in North America, Asia, Europe, Latin America, and other international areas. For example, as discussed in Item 1 —
“Business
—
Recent Developments,”
in April 2013, we completed the Chaps men's sportswear license acquisition, and we are in the process of repositioning and upgrading our existing distribution network in the Asia-Pacific region.
We may have difficulty integrating acquired businesses into our operations, hiring and retaining qualified key employees, or otherwise successfully managing such expansion. Furthermore, we may not be able to successfully integrate the business of any licensee that we acquire into our own business, incur additional costs, and/or fail to achieve any expected cost savings or synergies from such integration.
Implementation of our growth strategy involves the continuation and expansion of our retail distribution network on a global basis, including our e-commerce operations, which is subject to many factors beyond our control. We may not be able to procure, purchase, or lease desirable freestanding or department store locations, renew, and maintain existing freestanding store leases and department store locations on acceptable terms, or secure suitable replacement locations. The lease negotiation, as well as the number and timing of new stores and shop-within-shop locations actually opened during any given period and their associated contribution to net income for the period, depends on a number of factors including, but not limited to: (i) the availability of suitable financing to us and our landlords; (ii) the timing of the delivery of the leased premises to us from our landlords in order to commence build-out construction activities; (iii) our ability and our landlords’ ability to obtain all necessary governmental licenses and permits to construct and operate our stores on a timely basis; (iv) our ability to manage the construction and development costs of new stores; (v) the rectification of any unforeseen engineering or environmental problems with the leased premises; (vi) adverse weather conditions during the construction period; and (vii) the hiring and training of qualified operating personnel in the local market. While we continue to explore new markets and are always evaluating new potential locations, any of the above
|
|
23
|
|
factors could have an adverse impact on our business, financial condition, and results of operations. Further, as we continue to expand and increase the global presence of our e-commerce business, sales from our brick and mortar stores and wholesale channels of distribution in areas where e-commerce sites are introduced may decline due to cannibalization.
In Europe, we lack the large wholesale distribution channels we have in the U.S., and we may have difficulty developing and maintaining successful distribution strategies and alliances in certain of the major European countries. In Asia, our primary mode of distribution is via a network of shops located within leading department stores. As we have limited experience operating a direct-to-consumer business in this region and face established competitors, we may have difficulty in successfully retaining this network and expanding into alternate distribution channels. In addition, certain of the international countries in which we operate, particularly in Asia, have unique operational characteristics that vary from the U.S., including but not limited to employment and labor, transportation, logistics, acquiring store locations, and legal requirements, which may pose challenges to the execution and success of our related growth strategies. Further, macroeconomic trends may not be favorable and could limit our ability to implement our growth strategies in select geographies where we have foreign operations, such as Europe, Asia, and Latin America.
Achievement of our growth strategy requires investment in new capabilities, distribution channels, and technologies worldwide. These investments may result in short-term costs without accompanying current revenues and, therefore, may be dilutive to our earnings in the short term. In addition, we may continue to incur costs in connection with repositioning our business in certain geographic areas, including in the Asia-Pacific region. Although we believe that our strategy will lead to long-term growth in revenue and profitability, the anticipated benefits may not be fully realized.
Our ability to conduct business in international markets may be affected by legal, regulatory, political, and economic risks.
Our ability to capitalize on growth in new international markets and to maintain our current level of operations in our existing international markets is subject to certain risks associated with operating in various international locations. These include:
|
•
|
the burdens of complying with a variety of foreign laws and regulations, including trade and labor restrictions;
|
|
•
|
compliance with U.S. and other country laws relating to foreign operations, including the Foreign Corrupt Practices Act, which prohibits U.S. companies from making improper payments to foreign officials for the purpose of obtaining or retaining business, and the U.K. Bribery Act, which prohibits U.K. and related companies from any form of bribery;
|
|
•
|
unexpected changes in laws, judicial process, or regulatory requirements; and
|
|
•
|
new tariffs or other barriers in certain international markets.
|
We are also subject to general political and economic risks in connection with our international operations, including:
|
•
|
political instability and terrorist attacks;
|
|
•
|
changes in diplomatic and trade relationships; and
|
|
•
|
general economic fluctuations in specific countries or markets.
|
We cannot predict whether quotas, duties, taxes, or other similar restrictions will be imposed by the U.S., the European Union, Asia, or other countries upon the import or export of our products in the future, or what effect any of these actions would have, if any, on our business, financial condition, and results of operations. Changes in regulatory, geopolitical, social, or economic policies and other factors may have a material adverse effect on our business in the future, or may require us to exit a particular market or significantly modify our current business practices.
A data security or privacy breach could damage our reputation and our relationships with our customers, expose us to litigation risk, and adversely affect our business.
We are dependent on information technology systems and networks, including the Internet, for a significant portion of our direct-to-consumer sales, including our e-commerce operations and retail business credit card transaction authorization and processing. We are also responsible for storing data relating to our customers and employees and rely on third parties for the operation of our e-commerce websites and for the various social media tools and websites we use as part of our marketing strategy. In our normal course of business, we often collect, retain, and transmit certain sensitive and confidential customer information, including credit card information, over public networks. There is significant concern by consumers and employees over the security of personal information transmitted over the Internet, consumer identity theft, and user privacy. Despite the security measures we currently have in place, our facilities and systems and those of our third-party service providers may be vulnerable to security
|
|
24
|
|
breaches, acts of vandalism, computer viruses, misplaced or lost data, programming and/or human errors, or other Internet or email events. Any electronic or physical security breach involving the misappropriation, loss, or other unauthorized disclosure of confidential or personally identifiable information, including penetration of our network security, whether by us or by a third party, could disrupt our business, severely damage our reputation and our relationships with our customers, expose us to risks of litigation and liability, and adversely affect our business, financial condition, and results of operations. Since we do not control third-party service providers and cannot guarantee that no electronic or physical computer break-ins and security breaches will occur in the future, any perceived or actual unauthorized disclosure of personally identifiable information regarding our customers or website visitors could harm our reputation and credibility, reduce our e-commerce net sales, impair our ability to attract website visitors, and reduce our ability to attract and retain customers. In addition, as the regulatory environment relating to information security and privacy is becoming increasingly demanding, we may also incur significant costs in complying with the various applicable state, federal, and foreign laws regarding protection of, and unauthorized disclosure of, personal information.
Our business could suffer if our computer systems and websites are disrupted or cease to operate effectively.
We are dependent on our computer systems to record and process transactions and manage and operate our business, including in designing, marketing, manufacturing, importing, tracking, and distributing our products, processing payments, and accounting for, and reporting, results. We also utilize an automated replenishment system to facilitate the processing of basic replenishment orders from our Retail segment and our wholesale customers, the movement of goods through distribution channels, and the collection of information for planning and forecasting. In addition, we have e-commerce and other Internet websites in North America, Europe, and Japan and have plans for additional e-commerce sites in Asia and other parts of the world. Given the complexity of our business and the significant number of transactions that we engage in on an annual basis, it is imperative that we maintain uninterrupted operation of our computer hardware and software systems. Despite our preventative efforts, our systems are vulnerable from time to time to damage or interruption from, among other things, security breaches, computer viruses, or power outages. Any material disruptions in our information technology systems could have a material adverse effect on our business, financial condition, and results of operations.
Implementation of management information systems may negatively impact our business.
We are continually improving and upgrading our computer systems and software. For example, we are in the process of implementing a new global operating and financial reporting information technology system as part of a multi-year plan to integrate and upgrade our operational and financial systems and processes. The implementation of this global system, scheduled to occur in phases over the next several years, began with the migration of certain of our domestic human resource systems during Fiscal 2011 and continued with the transition of certain of our domestic operational and financial systems to the new global operating and financial reporting system during Fiscal 2012. During Fiscal 2013, we continued to develop and enhance those operational and financial systems previously transitioned to the new global operating and financial reporting system. The next phase of this implementation effort involves the migration of certain core areas of our business to the new system, including global merchandise procurement, and customer order management and record-to-report for our North American wholesale operations, beginning in Fiscal 2014. We have an orderly plan to transition a number of our existing legacy systems to the new system over the next few years.
Implementation of a new management information system involves risks and uncertainties. Any disruptions, delays, or deficiencies in the design or implementation of a new system, such as the new global operating and financial reporting system currently being implemented, could result in increased costs, disruptions in the sourcing and shipment of our product, and delays in the collection of cash from our customers, as well as have an adverse effect on our ability to timely report our financial results, all of which could materially adversely affect our business, financial condition, and results of operations.
The success of our business depends on our ability to retain the value of our Ralph Lauren brands and to continue to develop products that resonate with our existing customers and attract new customers.
Our success depends on the value of our brands and our ability to consistently anticipate and respond to customers' demands, preferences, and fashion trends in the design, pricing, and production of our products. Any failure on our part to anticipate, identify, and respond effectively to these consumer demands, preferences, and trends could adversely affect acceptance of our products. The Ralph Lauren name is integral to our business and our business could be adversely affected if Mr. Lauren's public image or reputation were to be tarnished. Merchandise missteps or unfavorable publicity could negatively impact the image of our brands with our customers and could result in diminished loyalty to our brands, which could adversely impact our business, financial condition, and results of operations.
|
|
25
|
|
Our business could be negatively impacted by any financial instability of our customers.
We sell our wholesale merchandise primarily to major department stores across North America, Europe, Asia, and Latin America and extend credit based on an evaluation of each wholesale customer’s financial condition, usually without requiring collateral. However, the financial difficulties of a wholesale customer could cause us to limit or eliminate our business with that customer. We may also assume more credit risk relating to that customer’s receivables. During Fiscal 2013, sales to our largest wholesale customer, Macy's, Inc. ("Macy's"), accounted for approximately 12% of total net revenues. Further, sales to our three largest wholesale customers, including Macy's, comprised approximately
45%
of all Wholesale revenues and approximately 20% of total net revenues for Fiscal 2013, and constituted approximately
30%
of our gross trade accounts receivable outstanding as of March 30, 2013. Our inability to collect on our trade accounts receivable from any one of these customers could have a material adverse effect on our business, financial condition, and results of operations. See Item 1 —
“Business — Wholesale Credit Control.”
Uncertain economic conditions could have a negative impact on our major customers, suppliers, and lenders, which in turn could materially adversely affect our business, financial condition, and results of operations.
The uncertain state of the global economy continues to impact businesses around the world. The current global political and economic environments have resulted in continued economic unpredictability in the U.S., Europe, and Asia. In Europe, there are continuing concerns regarding the increased debt levels of certain countries and their ability to meet future financial obligations, as well as the overall stability of the Euro currency. Although we believe that our cash provided by operations and available borrowing capacity under our credit facilities will provide us with sufficient liquidity through the current global economic uncertainty, the impact of economic conditions on our major customers, suppliers, and lenders and their ability to access global capital markets cannot be predicted. The inability of major manufacturers to ship our products could impair our ability to meet the delivery date requirements of our customers. Deterioration in global financial markets could affect our ability to access sources of liquidity to provide for our future cash needs, increase the cost of any future financing, or cause our lenders to be unable to meet their funding commitments under our credit facilities. A disruption in the ability of our significant customers to access liquidity could cause serious disruptions or an overall deterioration of their businesses which could lead to a significant reduction in their future orders of our products and the inability or failure on their part to meet their payment obligations to us, any of which could have a material adverse effect on our business, financial condition, and results of operations.
Our business is subject to risks associated with importing products and could suffer as a result of increases in the price of raw materials, freight, or labor or a manufacturer’s inability to produce our goods on time and to our specifications.
We do not own or operate any manufacturing facilities and depend exclusively on independent third parties for the manufacture of our products. Our products are manufactured to our specifications through arrangements with over 700 foreign manufacturers in various countries. In Fiscal 2013, over 98% of our products (by dollar value) were produced outside the U.S., primarily in Asia, Europe, and Latin America. Risks inherent in importing our products include:
|
•
|
changes in social, political, and economic conditions or terrorist acts that could result in the disruption of trade from the countries in which our manufacturers or suppliers are located;
|
|
•
|
the imposition of additional regulations relating to imports or exports;
|
|
•
|
the imposition of additional duties, taxes, and other charges on imports or exports;
|
|
•
|
significant fluctuations in the cost of raw materials;
|
|
•
|
increases in the cost of labor, fuel, travel, and transportation;
|
|
•
|
disruptions of shipping and international trade caused by natural and man-made disasters;
|
|
•
|
significant delays in the delivery of cargo due to security considerations;
|
|
•
|
the imposition of anti-dumping or countervailing duty proceedings resulting in the potential assessment of special anti-dumping or countervailing duties; and
|
|
•
|
the imposition of sanctions in the form of additional duties either by the U.S. or its trading partners to remedy perceived illegal actions by national governments.
|
Any one of these factors could have a material adverse effect on our business, financial condition, and results of operations.
|
|
26
|
|
In addition, the inability of a manufacturer to ship orders of our products in a timely manner or to meet our strict quality standards could cause us to miss the delivery date requirements of our customers for those items, which could result in cancellation of orders, refusal to accept deliveries, or a substantial reduction in purchase prices, any of which could have a material adverse effect on our business, financial condition, and results of operations. Prices of raw materials used to manufacture our products may also fluctuate, and increases in prices of such raw materials could have a material adverse effect on our cost of sales. Furthermore, the cost of labor at many of our third-party manufacturers has been increasing significantly and, as the middle class in developing countries such as China continues to grow, it is unlikely that such cost pressure will abate. The cost of transportation has been increasing as well, and it is unlikely that such cost pressure will abate if oil prices continue to rise and there is continued significant unrest in the Middle East. We may not be able to offset such increases in raw materials, freight, or labor costs through pricing actions or other means.
Our profitability may decline as a result of increasing pressure on margins.
Our industry is subject to significant pricing pressure caused by many factors, including intense competition, consolidation in the retail industry, pressure from retailers to reduce the costs of products, and changes in consumer spending patterns. These factors may cause us to reduce our sales prices to retailers and consumers, which could cause our gross margin to decline if we are unable to appropriately manage inventory levels and/or otherwise offset price reductions with comparable reductions in our operating costs. If our sales prices decline and we fail to sufficiently reduce our product costs or operating expenses, our profitability will decline. This could have a material adverse effect on our business, financial condition, and results of operations. In addition, changes in our customer, channel, and geographic sales mix could have a negative impact on our profitability.
Our business is exposed to domestic and foreign currency fluctuations.
We generally purchase our products in U.S. Dollars. However, we source most of our products overseas. As a result, the cost of these products may be affected by changes in the value of the relevant currencies. Changes in currency exchange rates may also affect the U.S. Dollar value of the foreign currency denominated prices at which our international businesses sell products. Furthermore, our international sales are primarily derived from sales in foreign currencies, as is a portion of our licensing revenues, which could be materially affected by currency fluctuations. These foreign currencies primarily include the Euro, the Japanese Yen, the Hong Kong Dollar, the South Korean Won, the Canadian Dollar, the Swiss Franc, and the British Pound Sterling. Our international expansion will increase our exposure to foreign currency fluctuations. Although we hedge certain exposures to changes in foreign currency exchange rates arising in the ordinary course of business, we cannot fully anticipate all of our currency exposures and therefore foreign currency fluctuations may have a material adverse impact on our business, financial condition, and results of operations. In addition, factors that could impact the effectiveness of our hedging activities include the volatility of currency markets, the accuracy of forecasted transactions, and the availability of hedging instruments. As such, our hedging activities may not completely mitigate the impact of foreign currency fluctuations on our results of operations. See Item 7 — “
Management’s Discussion and Analysis of Financial Condition and Results of Operations
—
Market Risk Managemen
t.”
Fluctuations in our tax obligations and effective tax rate may result in volatility of our operating results.
We are subject to income taxes in many U.S. and certain foreign jurisdictions. We record tax expense based on our estimates of future payments, which include reserves for uncertain tax positions in multiple tax jurisdictions. At any one time, multiple tax years are subject to audit by various taxing authorities. The results of these audits and negotiations with taxing authorities may affect the ultimate settlement of these issues. In addition, the tax laws and regulations in the countries where we operate may change or there may be changes in interpretation and enforcement of existing tax laws, which could materially affect our income tax expense in our consolidated financial statements. As a result, we expect that throughout the year there could be ongoing variability in our quarterly tax rates as events occur and exposures are evaluated. In addition, our effective tax rate in a given financial statement period may be materially impacted by changes in the mix and level of earnings by jurisdiction or by changes to existing accounting rules or regulations.
We have significant undistributed earnings held by our subsidiaries outside the U.S. Most of our cash and cash equivalents and short-term investments are held outside of the U.S. and are considered to be permanently reinvested. We currently intend to reinvest these funds in order to fund strategic initiatives, working capital requirements, and debt repayments (both third-party and intercompany) of such foreign subsidiaries. Any future repatriation of such amounts to the U.S. could result in a significant incremental tax liability in the period in which the decision to repatriate is made.
|
|
27
|
|
Our Company has an exclusive relationship with certain customers for some of our products. The loss or significant decline in business of these customers could negatively impact our business.
We have exclusive relationships with certain customers for distribution of some of our products, including with Kohl’s for most of our Chaps products. Our arrangement with companies such as Kohl’s makes us dependent on those companies' financial and operational health for such products. The loss of these relationships could have an adverse effect on our Wholesale business.
Our business could suffer as a result of consolidations, liquidations, restructurings, and other ownership changes in the retail industry.
Several of our department store customers, including some under common ownership, account for a significant portion of our wholesale net sales. A substantial portion of sales of our licensed products by our domestic licensing partners are also made to our largest department store customers. During Fiscal 2013, sales to our largest wholesale customer, Macy's, accounted for approximately 12% of total net revenues. Further, sales to our three largest wholesale customers, including Macy's, comprised approximately
45%
of all Wholesale revenues and approximately 20% of total net revenues for Fiscal 2013, and constituted approximately
30%
of our gross trade accounts receivable outstanding as of March 30, 2013. There can be no assurance that consolidations, restructurings, reorganizations, or other ownership changes in the department store sector will not have a material adverse effect on our wholesale business.
We typically do not enter into long-term agreements with our customers. Instead, we enter into a number of purchase order commitments with our customers for each of our lines every season. A decision by the controlling owner of a group of stores or any other significant customer, whether motivated by competitive conditions, financial difficulties, or otherwise, to decrease or eliminate the amount of merchandise purchased from us or our licensing partners or to change their manner of doing business with us or our licensing partners or their new strategic and operational initiatives, including their continued focus on further development of their “private label” initiatives, could have a material adverse effect on our business, financial condition, and results of operations.
Certain legal proceedings, regulatory matters, and accounting changes could adversely impact our results of operations.
We are involved in certain legal proceedings and regulatory matters and are subject from time to time to various claims involving alleged breach of contract claims, intellectual property and other related claims, escheatment and unclaimed property, credit card fraud, security breaches in certain of our retail store information systems, employment issues, consumer matters, and other litigation. Certain of these lawsuits and claims, if decided adversely to us or settled by us, could result in material liability to our Company or have a negative impact on our reputation or relations with our employees, customers, licensees, or other third parties. In addition, regardless of the outcome of any litigation or regulatory proceedings, such proceedings could result in substantial costs and may require our Company to devote substantial time and resources to defend itself. Further, changes in governmental regulations both in the U.S. and in other countries where we conduct business operations, could have an adverse impact on our business, financial condition, and results of operations. See Item 3 — “
Legal Proceedings
” for further discussion of our Company’s legal matters.
In addition, we are subject to changes in accounting rules and interpretations. The Financial Accounting Standards Board is currently in the process of amending a number of existing accounting standards governing a variety of areas. Certain of these proposed standards, particularly the proposed standard governing accounting for leases, if and when effective, would likely have a material impact on our consolidated financial statements. See Note 4 to the accompanying audited consolidated financial statements for further discussion of proposed amendments to current accounting standards.
Our results of operations could be affected by natural events in the locations in which we or our customers or suppliers operate.
We have operations, including retail, distribution, and warehousing operations, in locations subject to natural disasters, such as severe weather and geological events, that could disrupt our operations. In addition, our suppliers and customers also have operations in these locations and could experience similar disruptions. The occurrence of natural events may result in sudden disruptions in the business operations of the local economies affected, as well as of the regional and global economies. In addition, our business is affected by unseasonable weather conditions, such as extended periods of unseasonably warm temperatures in the winter or unseasonably cold temperatures in the summer. Such natural events, including unseasonable weather conditions, could result in decreased demand for our products and disruptions in our sales channels and manufacturing and distribution networks, which could have a material adverse effect on our business, financial condition, and results of operations.
|
|
28
|
|
Our trademarks and other intellectual property rights may not be adequately protected outside the U.S.
We believe that our trademarks, intellectual property, and other proprietary rights are extremely important to our success and our competitive position. We devote substantial resources to the establishment and protection of our trademarks and anti-counterfeiting activities worldwide. Significant counterfeiting of our products continues, however, and in the course of our international expansion we have experienced conflicts with various third parties that have acquired or claimed ownership rights to some trademarks that include Polo and/or a representation of a polo player astride a horse, or otherwise have contested our rights to our trademarks. We have in the past resolved certain of these conflicts through both legal action and negotiated settlements, none of which, we believe, has had a material impact on our financial condition and results of operations. We cannot guarantee that the actions we have taken to establish and protect our trademarks and other proprietary rights will be adequate to prevent counterfeiting or a material adverse effect on our business or brands arising from imitation of our products by others or to prevent others from seeking to block sales of our products as a violation of the trademarks and proprietary rights of others. Also, there can be no assurance that others will not assert rights in, or ownership of, trademarks and other proprietary rights of ours or that we will be able to successfully resolve these types of conflicts to our satisfaction or at all. In addition, the laws of certain foreign countries do not protect trademarks or other proprietary rights to the same extent as do the laws of the U.S. and, as a result, our intellectual property may be more vulnerable and difficult to protect in such countries. See Item 1 —
“Business
—
Trademarks,”
and Item 3 —
“Legal Proceedings.”
Our business could suffer if one of our manufacturers fails to use acceptable labor or environmental practices.
We require our licensing partners and independent manufacturers to operate in compliance with applicable laws and regulations. While our internal and vendor operating guidelines promote ethical business practices and our employees periodically visit and monitor the operations of our independent manufacturers, we do not control these manufacturers or their labor practices. The violation of labor, environmental, or other laws by an independent manufacturer used by us or one of our licensing partners, or the divergence of an independent manufacturer’s or licensing partner’s labor or environmental practices from those generally accepted as ethical or appropriate in the U.S., could interrupt, or otherwise disrupt the shipment of finished products to us or damage our reputation. Any of these events, in turn, could have a material adverse effect on our business, financial condition, and results of operations.
Our business could suffer if we need to replace manufacturers or distribution centers.
We compete with other companies for the production capacity of our manufacturers. Some of these competitors have greater financial and other resources than we have, and thus may have an advantage in securing production capacity. If we experience a significant increase in demand, or if an existing manufacturer of ours must be replaced, we may have to expand our third-party manufacturing capacity. We cannot guarantee that this additional capacity will be available when required on terms that are acceptable to us. See Item 1 —
“Business
—
Sourcing, Production and Quality.”
We enter into a number of purchase order commitments each season specifying a time for delivery, method of payment, design and quality specifications, and other standard industry provisions, but do not have long-term contracts with any manufacturer. None of the manufacturers we use produce our products exclusively.
In addition, we rely on a number of owned and independently-operated distribution facilities around the world to warehouse and ship products to our customers and perform other related logistic services. As such, our ability to meet the needs of our customers depends on the proper operation of our distribution centers. If any of our distribution centers were closed or were to become inoperable for any reason, we could experience a substantial loss of inventory, disruption of deliveries to our customers and our retail stores, increased costs, and longer lead times associated with the distribution of products during the period that would be required to reopen or replace the facility. These disruptions could have a material adverse effect on our business, financial condition, and results of operations.
We rely on our licensing partners to preserve the value of our licenses.
The risks associated with our own products also apply to our licensed products in addition to any number of possible risks specific to a licensing partner’s business, including risks associated with a particular licensing partner’s ability to:
|
•
|
obtain capital;
|
|
•
|
manage its labor relations;
|
|
•
|
maintain relationships with its suppliers;
|
|
|
29
|
|
|
•
|
manage its credit and bankruptcy risks effectively; and
|
|
•
|
maintain relationships with its customers.
|
Although a number of our license agreements prohibit our licensing partners from entering into licensing arrangements with our competitors, our licensing partners generally are not precluded from offering, under other non-competitor brands, the types of products covered by their license agreements with us. A substantial portion of sales of our products by our domestic licensing partners are also made to our largest customers. While we have significant control over our licensing partners’ products and advertising, we rely on our licensing partners for, among other things, operational and financial control over their businesses. Changes in management, reduced sales of licensed products, poor execution, or financial difficulties with respect to any of our licensing partners could adversely affect our revenues, both directly from reduced licensing revenue received and indirectly from reduced sales of our other products. See Item 1 —
“Business
—
Our Licensing Segment.”
Failure to maintain licensing partners could harm our business.
Although we believe that we could replace our existing licensing partners in most circumstances, if necessary, our inability to do so for any period of time could adversely affect our revenues, both directly from reduced licensing revenue received and indirectly from reduced sales of our other products. See Item 1 —
“Business
—
Our Licensing Segment.”
The voting shares of our Company’s stock are concentrated in one majority stockholder.
As of March 30, 2013, Mr. Ralph Lauren, or entities controlled by the Lauren family, owned approximately 83% of the voting power of the outstanding common stock of our Company. Mr. Lauren also serves as our Chairman of the Board and Chief Executive Officer, and we employ other members of the Lauren family. From time to time, and as approved or authorized by our Board of Directors, we may have other business dealings with Mr. Lauren, members of the Lauren family, or entities affiliated with Mr. Lauren or the Lauren family. As a result of his stock ownership and position in our Company, Mr. Lauren has the ability to exercise significant control over our business, including, without limitation, (i) the election of our Class B common stock directors, voting separately as a class, and (ii) any action requiring the approval of our stockholders, including the adoption of amendments to our certificate of incorporation and the approval of mergers or sales of all or substantially all of our assets.
The trading prices of our securities periodically may rise or fall based on the accuracy of predictions of our earnings or other financial performance.
Our business planning process is designed to maximize our long-term strength, growth, and profitability, and not to achieve an earnings target in any particular fiscal quarter. We believe that this longer-term focus is in the best interests of our Company and our stockholders. At the same time, however, we recognize that, from time to time, it may be helpful to provide investors with guidance as to our quarterly and annual forecast of net sales and earnings. While we generally expect to provide updates to our guidance when we report our results each fiscal quarter, we assume no responsibility to update any of our forward-looking statements at such times or otherwise. If, and when, we announce actual results that differ from those that have been predicted by us, outside analysts, or others, the market price of our securities could be adversely affected. Investors who rely on these predictions when making investment decisions with respect to our securities do so at their own risk. We take no responsibility for any losses suffered as a result of such changes in the prices of our securities.
Risks Relating to the Industry in Which We Compete
The downturn in the global economy may continue to affect consumer purchases of discretionary items and luxury retail products, which could adversely affect our business, financial condition, and results of operations.
The industries in which we operate are cyclical. Many economic factors outside of our control affect the level of consumer spending in the apparel, cosmetic, fragrance, accessory, jewelry, watch, and home product industries, including, among others:
|
•
|
general business conditions;
|
|
•
|
economic downturns;
|
|
•
|
employment levels;
|
|
•
|
downturns in the stock market;
|
|
•
|
interest rates;
|
|
|
30
|
|
|
•
|
the housing market;
|
|
•
|
consumer debt levels;
|
|
•
|
the availability of consumer credit;
|
|
•
|
increases in fuel prices;
|
|
•
|
taxation; and
|
|
•
|
consumer confidence in future economic conditions.
|
Consumer purchases of discretionary items and luxury retail products, including our products, tend to decline during recessionary periods and at other times when disposable income is lower. A downturn or an uncertain outlook in the economies in which we, or our licensing partners, sell our products may materially adversely affect our businesses, financial condition, and results of operations. See Item 7 — “
Management’s Discussion and Analysis of Financial Condition and Results of Operations — Global Economic Developments”
for further discussion.
The domestic and international political situation also affects consumer confidence. The threat, outbreak, or escalation of terrorism, military conflicts or other hostilities could lead to a decrease in consumer spending and may materially adversely affect our business, financial condition, and results of operations.
We face intense competition worldwide in the markets in which we operate.
We face intense competition from other domestic and foreign fashion-oriented apparel, footwear, accessory, and casual apparel producers, some of which may be significantly larger and more diversified and may have greater financial and marketing resources than us. We compete with these companies primarily on the basis of:
|
•
|
anticipating and responding to changing consumer demands in a timely manner;
|
|
•
|
creating and maintaining favorable brand recognition, loyalty, and a reputation for quality;
|
|
•
|
developing and maintaining innovative, high-quality products in sizes, colors, and styles that appeal to consumers;
|
|
•
|
appropriately sourcing raw materials at cost-effective prices;
|
|
•
|
appropriately pricing products;
|
|
•
|
anticipating and maintaining proper inventory levels;
|
|
•
|
providing strong and effective marketing support;
|
|
•
|
retaining and recruiting key employees;
|
|
•
|
creating an acceptable value proposition for retail customers;
|
|
•
|
ensuring product availability and optimizing supply chain and distribution efficiencies with manufacturers and retailers;
|
|
•
|
obtaining sufficient retail floor space and effective presentation of our products at retail stores;
|
|
•
|
maintaining and growing market share; and
|
|
•
|
protecting our intellectual property.
|
We also face increasing competition from companies selling apparel, accessories, home, and other of our product categories through the Internet. Although we sell our products through the Internet, increased competition in the worldwide apparel, accessory, and home product industries from Internet-based competitors could reduce our sales, prices, and margins and adversely affect our business, financial condition, and results of operations.
Any increased competition, or our failure to adequately address any of these competitive factors, could result in reduced market share or sales, which could adversely affect our business, financial condition, and results of operations.
|
|
31
|
|
The success of our business depends on our ability to respond to constantly changing fashion and retail trends and consumer demands in a timely manner.
The industries in which we operate have historically been subject to rapidly changing fashion trends and consumer preferences. Our success depends in large part on our ability to originate and define fashion product and home product trends, as well as to anticipate, gauge, and react to changing consumer demands in a timely manner. Our products must appeal to a broad range of consumers worldwide whose preferences cannot be predicted with certainty and are subject to rapid change, influenced by fashion trends, current economic conditions, and weather conditions, among other factors. We cannot assure that we will be able to continue to develop appealing styles or successfully meet constantly changing consumer demands in the future. In addition, we cannot assure that any new products or brands that we introduce will be successfully received by consumers. Any failure on our part to anticipate, identify, and respond effectively to changing consumer demands and fashion trends could adversely affect retail and consumer acceptance of our products and leave us with a substantial amount of unsold inventory or missed opportunities. If that occurs, we may be forced to rely on markdowns or promotional sales to dispose of excess, slow-moving inventory, which may harm our business and impair the image of our brands. Conversely, if we underestimate consumer demand for our products or if manufacturers fail to supply quality products in a timely manner, we may experience inventory shortages, which may result in unfilled orders, negatively impact customer relationships, diminish brand loyalty, and result in lost revenues. Any of these outcomes could have a material adverse effect on our business, financial condition, and results of operations. See Item 1 —
“Business — Sourcing, Production and Quality.”
|
Item 1B.
|
Unresolved Staff Comments.
|
Not applicable.
|
Item 2.
|
Properties.
|
We lease space for our retail stores and showrooms, and warehouse and office space in various domestic and international locations. We do not own any real property except for a distribution facility in Greensboro, North Carolina and a parcel of land adjacent to the facility, and retail stores in Southampton, New York, and Nantucket, Massachusetts.
We believe that our existing facilities are well maintained, in good operating condition, and are adequate for our present level of operations.
|
|
32
|
|
The following table sets forth information with respect to our key properties:
|
Location
|
Use
|
Approximate
Sq. Ft.
|
Current Lease Term
Expiration
|
|||
|
Greensboro, NC
|
Wholesale and retail distribution facility
|
1,500,000
|
Owned
|
|||
|
High Point, NC
|
Retail e-commerce call center and distribution facility
(1)
|
363,000
|
January 31, 2023
|
|||
|
High Point, NC
|
Wholesale distribution facility
|
343,000
|
December 31, 2022
|
|||
|
625 Madison Avenue, NYC
|
Corporate offices and Home showroom
|
356,000
|
December 31, 2019
|
|||
|
650 Madison Avenue, NYC
|
Executive, corporate offices, design studio, and Men’s showrooms
|
276,000
|
December 31, 2024
|
|||
|
Lyndhurst, NJ
|
Corporate and retail administrative offices
|
178,000
|
December 31, 2019
|
|||
|
550 7th Avenue, NYC
|
Corporate offices, design studio, and Women’s showrooms
|
84,000
|
December 31, 2018
|
|||
|
Geneva, Switzerland
|
European corporate offices
|
107,000
|
June 22, 2027
|
|||
|
Hong Kong, China
|
Asia-Pacific corporate offices
|
47,000
|
October 31, 2015
|
|||
|
London, UK
|
Retail flagship store
|
40,000
|
July 4, 2021
|
|||
|
888 Madison Avenue, NYC
|
Retail flagship store
|
37,900
|
August 31, 2027
|
|||
|
750 North Michigan Avenue, Chicago
|
Retail flagship store
|
37,500
|
November 14, 2017
|
|||
|
867 Madison Avenue, NYC
|
Retail flagship store
|
27,700
|
December 31, 2023
|
|||
|
Paris, France
|
Retail flagship store
|
25,700
|
May 31, 2018
|
|||
|
Tokyo, Japan
|
Retail flagship store
|
21,000
|
December 31, 2020
|
|||
|
444 N. Rodeo Drive, Beverly Hills
|
Retail flagship store
|
19,420
|
September 9, 2033
|
|||
|
(1)
|
In October 2012, we entered into an agreement to purchase and expand our retail e-commerce call center and distribution facility in High Point, North Carolina, which is expected to be completed in September 2013. The expanded facility will more than double the existing space to approximately 800,000 square feet.
|
As of
March 30, 2013
, we operated
388
retail stores, totaling approximately 3 million square feet. We anticipate that we will be able to extend our retail store leases, as well as those leases for our non-retail facilities, which expire in the near future on satisfactory terms or relocate to desirable alternate locations. We generally lease our freestanding retail stores for initial periods ranging from 5 to 10 years, with renewal options.
|
Item 3.
|
Legal Proceedings.
|
Derivative Action
On November 22, 2011, a shareholder derivative action was filed by City Pension Fund for Firefighters and Police Officers in the City of Pembroke Pines (the “Plaintiff”), an alleged shareholder purportedly acting on behalf of the Company, in the Supreme Court of the State of New York, County of New York, naming the Company, as a nominal defendant, and naming members of the Board of Directors and certain members of Company management as defendants. The complaint alleged, among other claims, breaches of fiduciary duty and waste of corporate assets by the Company's directors for permitting excessive compensation to, and alleged related party transactions with, the Company's Chairman and Chief Executive Officer and certain other executives, and unjust enrichment by these executives. The Plaintiff sought damages on behalf of the Company in an unspecified amount sustained from the alleged breaches of fiduciary duty and waste of corporate assets and sought disgorgement of excessive compensation and benefits of related party transactions. The Plaintiff also demanded it be awarded the costs and disbursements of the derivative action, including reasonable attorneys' fees. On January 12, 2012, the Company and all defendants moved to dismiss the complaint, and on June 19, 2012, the Court entered an order dismissing the action due to the Plaintiff's failure to make a pre-suit demand on the Company's Board of Directors. On July 5, 2012, the Plaintiff made a demand on the Company's Board of Directors to investigate and take action to remedy the alleged wrongdoing detailed in the complaint. On February 15, 2013, the Board of Directors unanimously agreed to refuse the demand.
|
|
33
|
|
Wathne Imports Litigation
On August 19, 2005, Wathne Imports, Ltd. (“Wathne”), our then domestic licensee for luggage and handbags, filed a complaint in the U.S. District Court in the Southern District of New York against the Company and Mr. Ralph Lauren, our Chairman and Chief Executive Officer, asserting, among other things, federal trademark law violations, breach of contract, breach of obligations of good faith and fair dealing, fraud and negligent misrepresentation. The complaint originally sought, among other relief, injunctive relief, compensatory damages in excess of $250 million and punitive damages of not less than $750 million. On September 13, 2005, Wathne withdrew this complaint from the U.S. District Court and filed a complaint in the Supreme Court of the State of New York, New York County, making substantially the same allegations and claims (excluding the federal trademark claims), and seeking similar relief. On February 1, 2006, the Court granted our motion to dismiss all of the causes of action, including the cause of action against Mr. Lauren, except for breach of contract related claims, and denied Wathne's motion for a preliminary injunction. Following some discovery, we moved for summary judgment on the remaining claims and Wathne cross-moved for partial summary judgment. In an April 11, 2008 Decision and Order, the Court granted our summary judgment motion to dismiss most of the claims against our Company, and denied Wathne's cross-motion for summary judgment. Wathne appealed the dismissal of its claims to the Appellate Division of the Supreme Court. Following a hearing on May 19, 2009, the Appellate Division issued a Decision and Order on June 9, 2009 which, in large part, affirmed the lower Court's ruling.
We subsequently made a motion to exclude Wathne's proposed expert's damages report and, on January 23, 2012, the Court granted our motion.
Wathne
then appealed the ruling to the Appellate Division and, on October 18, 2012, the Appellate Division reversed the order of the lower Court. At this time, the trial date has not yet been scheduled and we intend to continue to contest the remaining claims and dispute any alleged damages in this lawsuit vigorously. Management does not expect that the ultimate resolution of this matter will have a material adverse effect on our consolidated financial statements.
Other Matters
From time to time, we are involved in litigation, other legal claims, and proceedings involving matters associated with or incidental to our business, including, among other things, matters involving credit card fraud, trademark and other intellectual property, licensing, and
employee
relations. We believe that the resolution of currently pending matters will not individually or in the aggregate have a material adverse effect on our consolidated financial statements. However, our assessment of the current litigation or other legal claims could change in light of the discovery of facts not presently known or determinations by judges, juries, or other finders of fact which are not in accord with management’s evaluation of the possible liability or outcome of such litigation or claims.
|
Item 4.
|
Mine Safety Disclosures.
|
Not applicable.
|
|
34
|
|
|
Item 5.
|
Market for Registrant’s Common Equity, Related Stockholder Matters and Issuer Purchases of Equity Securities.
|
Our Class A common stock is traded on the New York Stock Exchange (“NYSE”) under the symbol “RL.” The following table sets forth the high and low sales prices per share of our Class A common stock, as reported on the NYSE Composite Tape, and the cash dividends per common share declared for each quarterly period in our two most recent fiscal years:
|
|
Market Price of
Class A
Common Stock
|
Dividends
Declared per
Common Share
|
||||||||||
|
|
High
|
Low
|
||||||||||
|
Fiscal 2013:
|
||||||||||||
|
First Quarter
|
$
|
179.00
|
|
$
|
134.48
|
|
$
|
0.40
|
|
|||
|
Second Quarter
|
164.28
|
|
134.29
|
|
0.40
|
|
||||||
|
Third Quarter
|
165.41
|
|
144.14
|
|
0.40
|
|
||||||
|
Fourth Quarter
|
179.90
|
|
146.58
|
|
0.40
|
|
||||||
|
Fiscal 2012:
|
||||||||||||
|
First Quarter
|
$
|
136.50
|
|
$
|
114.60
|
|
$
|
0.20
|
|
|||
|
Second Quarter
|
154.62
|
|
105.11
|
|
0.20
|
|
||||||
|
Third Quarter
|
164.55
|
|
121.30
|
|
0.20
|
|
||||||
|
Fourth Quarter
|
182.48
|
|
136.92
|
|
0.20
|
|
||||||
Since 2003, we have maintained a regular quarterly cash dividend program on our common stock. On May 21, 2012, our Board of Directors approved an increase to our quarterly cash dividend on our common stock from
$0.20
per share to
$0.40
per share. Approximately
$146 million
was recorded as a reduction to retained earnings during
Fiscal 2013
in connection with our dividends.
As of
May 17, 2013
, there were 883 holders of record of our Class A common stock and 7 holders of record of our Class B common stock. All of our outstanding shares of Class B common stock are owned by Mr. Ralph Lauren, Chairman of the Board of Directors and Chief Executive Officer, and entities controlled by the Lauren family, and are convertible at any time into shares of Class A common stock on a one-for-one basis. During Fiscal 2013, the Lauren Family, L.L.C., a limited liability company managed by the children of Mr. Lauren, converted
950,000
shares of Class B common stock into an equal number of shares of Class A common stock pursuant to the terms of the security, which were subsequently sold on the open market as part of a predetermined, systematic trading plan.
The following
table
sets forth repurchases of shares of our Class A common stock during the fiscal quarter ended
March 30, 2013
:
|
Total Number of Shares Purchased
|
Average
Price
Paid per
Share
|
Total Number of
Shares Purchased as
Part of Publicly
Announced Plans or
Programs
|
Approximate Dollar
Value of Shares
That May Yet be
Purchased Under the
Plans or Programs
(1)
|
||||||||||||
|
|
|
|
(millions)
|
||||||||||||
|
December 30, 2012 to January 26, 2013
|
—
|
|
$
|
—
|
|
—
|
|
$
|
627
|
|
|||||
|
January 27, 2013 to February 23, 2013
|
—
|
|
—
|
|
—
|
|
627
|
|
|||||||
|
February 24, 2013 to March 30, 2013
|
3,230
|
|
(2)
|
167.18
|
|
—
|
|
577
|
|
(3)
|
|||||
|
3,230
|
|
—
|
|
||||||||||||
|
(1)
|
On August 9, 2012, the Company's Board of Directors approved an expansion of the Company's existing common stock repurchase program that will allow it to repurchase up to an additional $500 million of Class A common stock.
|
|
(2)
|
Represents shares surrendered to, or withheld by, the Company in satisfaction of withholding taxes in connection with the vesting of awards issued under the 2010 Long-Term Stock Incentive Plan and the 1997 Long-Term Stock Incentive Plan.
|
|
|
35
|
|
|
(3)
|
The remaining value of shares authorized for repurchase was reduced by a
$50 million
prepayment made under a share repurchase program entered into with a third-party financial institution in March 2013, in exchange for the right to receive shares of Class A common stock at the conclusion of a
93
-day repurchase term (the "Prepaid Repurchase Program"). The number of shares to be received at the end of the term is based on the volume-weighted average market price of the Company's Class A common stock over the related
93
-day period, less a discount. As of March 30, 2013,
no
shares have been delivered to us pursuant to the Prepaid Repurchase Program, as discussed in
Note 18
to the accompanying audited consolidated financial statements.
|
The following graph compares the cumulative total stockholder return (stock price appreciation plus dividends) on our Class A common stock to the cumulative total return of the Standard & Poor’s 500 Index and a peer group index of companies that we believe are closest to ours (the “Peer Group”) for the period from March 28, 2008, the last trading day of our 2008 fiscal year, through March 28, 2013, the last trading day of our
2013
fiscal year. Our Peer Group consists of Burberry Group PLC, Coach, Inc., Compagnie Financière Richemont SA, The Estée Lauder Companies Inc., Hermes International, The Jones Group Inc., The Warnaco Group, Inc., Luxottica Group, LVMH, PVH Corp., PPR SA, Tiffany & Co., Tod’s S.p.A., and V.F. Corporation. All calculations for foreign companies in our Peer Group are performed using the local foreign issue of such companies. The returns are calculated by assuming an investment in the Class A common stock and each index of $100 on March 29, 2008, with all dividends reinvested.
COMPARISON OF 5 YEAR CUMULATIVE TOTAL RETURN*
Among Ralph Lauren Corporation, the S&P 500 Index, and a Peer Group
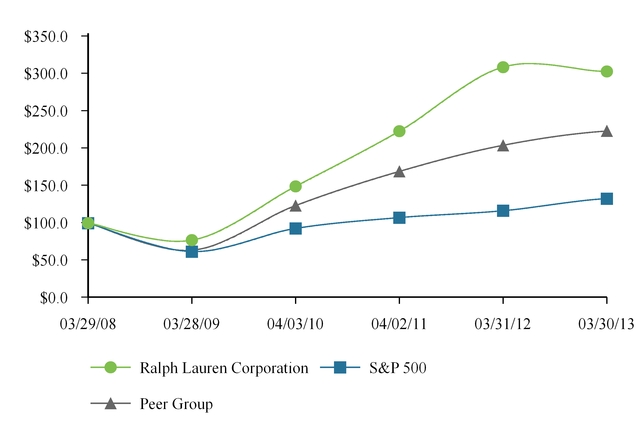
*$100 invested on 3/29/08 in stock or 3/31/08 in index, including reinvestment of dividends.
Copyright© 2013 S&P, a division of The McGraw-Hill Companies Inc. All rights reserved.
|
|
36
|
|
|
Item 6.
|
Selected Financial Data
|
See the “
Index to Consolidated Financial Statements and Supplementary Information
,” and specifically “
Selected Financial Information
” appearing at the end of this Annual Report on Form 10-K. This selected financial data should be read in conjunction with Item 7 — “
Management’s Discussion and Analysis of Financial Condition and Results of Operations
” and Item 8 — “
Financial Statements and Supplementary Data
” included in this Annual Report on Form 10-K. Historical results may not be indicative of future results.
|
Item 7.
|
Management’s Discussion and Analysis of Financial Condition and Results of Operations.
|
The following management’s discussion and analysis of financial condition and results of operations (“MD&A”) should be read together with our audited consolidated financial statements and footnotes, which are included elsewhere in this Annual Report on Form 10-K. We utilize a 52-53 week fiscal year ending on the Saturday closest to March 31. As such,
Fiscal 2013
ended on
March 30, 2013
and was a 52-week period;
Fiscal 2012
ended on
March 31, 2012
and was a 52-week period; and
Fiscal 2011
ended on
April 2, 2011
and was a 52-week period.
INTRODUCTION
MD&A is provided as a supplement to the accompanying audited consolidated financial statements and footnotes to help provide an understanding of our results of operations, financial condition, and liquidity. MD&A is organized as follows:
|
•
|
Overview.
This section provides a general description of our business, global economic developments, and a summary of our financial performance for
Fiscal 2013
. In addition, this section includes a discussion of recent developments and transactions affecting comparability that we believe are important in understanding our results of operations and financial condition, and in anticipating future trends.
|
|
•
|
Results of operations.
This section provides an analysis of our results of operations for
Fiscal 2013
,
Fiscal 2012
, and
Fiscal 2011
.
|
|
•
|
Financial condition and liquidity.
This section provides a discussion of our financial condition and liquidity as of
March 30, 2013
, which includes (i) an analysis of our financial condition compared to the prior fiscal year-end; (ii) an analysis of our cash flows for Fiscal 2013, Fiscal 2012, and Fiscal 2011; (iii) an analysis of our liquidity, including common stock repurchases, payments of dividends, our outstanding debt and covenant compliance, and the availability under our credit facilities; and (iv) a summary of our contractual and other obligations as of
March 30, 2013
.
|
|
•
|
Market risk management.
This section discusses how we manage our risk exposures related to foreign currency exchange rates, interest rates, and our investments, as well as to the underlying market conditions as of
March 30, 2013
.
|
|
•
|
Critical accounting policies.
This section discusses accounting policies considered to be important to our financial condition and results of operations, which require significant judgment and estimation on the part of management in their application. In addition, all of our significant accounting policies, including our critical accounting policies, are summarized in Note 3 to our accompanying audited consolidated financial statements.
|
|
•
|
Recently issued accounting standards.
This section discusses the potential impact on our reported financial condition and results of operations of certain accounting standards that have been recently issued or proposed.
|
OVERVIEW
Our Business
Our Company is a global leader in the design, marketing, and distribution of premium lifestyle products, including men’s, women’s, and children’s apparel, accessories, fragrances, and home furnishings. Our long-standing reputation and distinctive image have been consistently developed across an expanding number of products, brands, and international markets. Our brand names include Ralph Lauren Women’s Collection, Purple Label, Black Label, Blue Label, Polo Ralph Lauren, RRL, Ralph Lauren Childrenswear, Lauren by Ralph Lauren, RLX Ralph Lauren, Denim & Supply Ralph Lauren, Ralph Lauren, Rugby, Chaps, and Club Monaco, among others.
|
|
37
|
|
In October 2012, we approved a plan to wind-down our Rugby brand retail operations (the “Rugby Closure Plan”), as discussed further in the "Recent Developments" section below.
We classify our businesses into three segments: Wholesale, Retail, and Licensing. Our Wholesale business, representing approximately
45%
of our
Fiscal 2013
net revenues, consists of sales made principally to major department stores and specialty stores located throughout North America, Europe, Asia, and Latin America. Our Retail business, representing approximately
52%
of our
Fiscal 2013
net revenues, consists of sales made directly to consumers through our retail stores located throughout North America, Europe, Asia, and Latin America; through concession-based shop-within-shops located primarily in Asia and Europe; and through our retail e-commerce channel in North America, Europe, and Asia. Our Licensing business, representing approximately
3%
of our
Fiscal 2013
net revenues, consists of royalty-based arrangements under which we license the right to third parties to use our various trademarks in connection with the manufacture and sale of designated products, such as apparel, eyewear, and fragrances, in specified geographical areas for specified periods. Approximately
37%
of our
Fiscal 2013
net revenues were earned in international regions outside of the U.S. See
Note 22
to the accompanying audited consolidated financial statements for a summary of net revenues by reportable segment and geographic location.
Our business is typically seasonal, with higher levels of wholesale sales in our second and fourth quarters and higher retail sales in our second and third quarters. These trends result primarily from the timing of seasonal wholesale shipments and key vacation travel, back-to-school, and holiday shopping periods in the Retail segment.
Global Economic Developments
The challenging state of the global economy continues to influence the level of consumer spending for discretionary items. This directly impacts our business, as it is highly dependent on consumer demand for our products. The current political and economic environments in the U.S., Europe, and Asia have resulted in significant macroeconomic risks, including high rates of unemployment, currency and commodity price volatility, and continued global economic uncertainty, driven in part by the European debt crisis, as well as the slowdown of economic growth in the U.S. and Asia, among other factors. These risks, combined with continued expectations of slow global economic growth, reduced government spending, and increased austerity measures, have adversely affected consumer and business sentiment. As a result, consumer retail traffic has been inconsistent, and the global retail environment remains highly promotional.
The current global economic environment and fluctuations in consumer confidence have resulted in continued softness in our European wholesale businesses. In addition, during Fiscal 2013, while our overall business performed well, certain of our retail operations exhibited declining comparable store sales trends, particularly our businesses in Japan and Korea. If the global macroeconomic environment remains weak or worsens, the constrained level of worldwide consumer spending and modified consumption behavior will continue to have a negative effect on our sales and operating margin for Fiscal 2014. We will continue to monitor these risks and evaluate and adjust our operating strategies and cost management opportunities to mitigate the related impact on our results of operations.
For a detailed discussion of significant risk factors that have the potential to cause our actual results to differ materially from our expectations, see Part I, Item 1A — “
Risk Factors
” included in this Annual Report on Form 10-K.
Summary of Financial Performance
Results of Operations
In
Fiscal 2013
, we reported net revenues of
$6.945 billion
, net income of
$750.0 million
, and net income per diluted share of
$8.00
. This compares to net revenues of
$6.860 billion
, net income of
$681.0 million
, and net income per diluted share of
$7.13
in
Fiscal 2012
. The comparability of our operating results has been affected by $18.5 million of pretax charges related to asset impairments and restructurings recognized in
Fiscal 2013
in connection with the Rugby Closure Plan, and other items effecting comparability, as discussed further below.
Our operating performance for
Fiscal 2013
reflected revenue growth of
1.2%
, primarily due to increased revenues from our retail businesses, partially offset by lower revenues from our wholesale businesses and net unfavorable foreign currency effects. Excluding the effect of foreign currency, net revenues increased by 2.7%. Our gross margin percentage increased by
150 basis points
to
59.8%
during
Fiscal 2013
, reflecting lower sourcing costs compared to higher cost benchmarks in the prior year period across most of our global businesses, a favorable product mix in most of our wholesale businesses, and the growth of our retail businesses, which generally carry a higher gross margin. The improvement in gross margin was partially offset by a less favorable geographic mix, as well as elevated promotional activity across certain of our North American retail businesses. Selling, general,
|
|
38
|
|
and administrative ("SG&A") expenses increased largely due to higher compensation-related costs, selling costs, depreciation, and distribution costs, as well as additional expenses incurred to support our growth and new business initiatives.
Net income increased in
Fiscal 2013
as compared to
Fiscal 2012
, primarily due to an
$87.3 million
increase in operating income, partially offset by an increase in foreign currency losses of
$10.0 million
, and a
$5.2 million
increase in our provision for income taxes. The increase in our provision for income taxes was driven by an overall increase in our pretax income, largely offset by a
180 basis point
decline in our effective tax rate. Net income per diluted share also increased due to higher net income coupled with lower weighted-average diluted shares outstanding during
Fiscal 2013
. As noted above, Fiscal 2013 results were negatively impacted by $18.5 million of pretax charges related to asset impairments and restructurings in connection with the Rugby Closure Plan, which had an after-tax effect of reducing net income by $12.0 million, or $0.13 per diluted share.
Financial Condition and Liquidity
Our financial position reflects the overall strength of our business results. We ended
Fiscal 2013
in a net cash and investments position (cash and cash equivalents plus short-term and non-current investments, less total debt) of
$1.113 billion
, compared to
$1.013 billion
as of the end of
Fiscal 2012
. The increase in our net cash and investments position was primarily due to our operating cash flows and proceeds from stock option exercises, partially offset by our use of cash to support our common stock repurchases, capital expenditures, and dividend payments during
Fiscal 2013
.
Our equity increased to
$3.785 billion
as of
March 30, 2013
, compared to
$3.653 billion
as of
March 31, 2012
, primarily due to our net income and equity issuances made pursuant to stock-based compensation arrangements, partially offset by our share repurchase activity, dividends declared, and other comprehensive loss in Fiscal 2013.
We generated
$1.019 billion
of cash from operations during
Fiscal 2013
, compared to
$885.3 million
during
Fiscal 2012
. The increase in operating cash flows primarily relates to the increase in our net income before non-cash expenses, coupled with a net favorable change in working capital during
Fiscal 2013
, compared to the prior fiscal year. We used some of our available cash to support our common stock repurchase program, to reinvest in our business through capital spending, and to pay dividends on our common stock. In particular, we used
$547.3 million
to repurchase Class A common stock, including shares surrendered for tax withholdings, and to make a payment under a prepaid share repurchase program (see Note 18 to the accompanying audited consolidated financial statements). We also used
$276.5 million
for capital expenditures, primarily associated with our global retail store expansion and construction, our renovation of department store shop-within-shops, investments in our facilities, and enhancements to our global information technology systems. Furthermore, we made cash dividend payments of
$127.8 million
.
Transactions Affecting Comparability of Results of Operations and Financial Condition
The comparability of our operating results for the three fiscal years presented herein has been affected by certain items, including:
|
•
|
certain pretax charges related to asset impairments and restructurings during the fiscal periods presented, including $18.5 million in pretax charges associated with the Rugby Closure Plan during Fiscal 2013, and $5.5 million in pretax charges in connection with the Asia-Pacific Restructuring Plan in Fiscal 2012, which included the closure of approximately 95 owned and licensed stores and concession shops in the Greater China and Southeast Asia region, primarily during the fourth quarter of Fiscal 2012, that did not support our new merchandising strategy, both as discussed below;
|
|
•
|
the discontinuance of the majority of products sold under the American Living brand effective for the Fall 2012 selling season; and
|
|
•
|
our recent acquisitions, including the transition of our previously licensed business in South Korea to a wholly-owned operation on January 1, 2011, and our assumption of control over the distribution of our previously licensed bedding and bath business on May 1, 2011.
|
|
|
39
|
|
A summary of the effect of certain of these items on pretax income for each applicable fiscal period presented is shown below (references to "Notes" are to the notes to the accompanying audited consolidated financial statements):
|
|
Fiscal Years Ended
|
|||||||||||
|
|
March 30,
2013
|
March 31,
2012
|
April 2,
2011
|
|||||||||
|
|
(millions)
|
|||||||||||
|
Impairments of assets (see Note 11)
|
$
|
(19.0
|
)
|
$
|
(2.2
|
)
|
$
|
(2.5
|
)
|
|||
|
Restructuring charges (see Note 12)
|
(11.7
|
)
|
(12.4
|
)
|
(2.6
|
)
|
||||||
|
$
|
(30.7
|
)
|
$
|
(14.6
|
)
|
$
|
(5.1
|
)
|
||||
Our "Results of Operations" discussion that follows includes the significant changes in operating results arising from these items affecting comparability. However, unusual items or transactions may occur in any period. Accordingly, investors and other financial statement users individually should consider the types of events and transactions that have affected operating trends.
Recent Developments
Chaps
In April 2013, in connection with the transition of the North American Chaps-branded men's sportswear business from a licensed to a wholly-owned operation, we entered into an agreement with The Warnaco Group, Inc. (“Warnaco”), a subsidiary of PVH Corp. (“PVH”), to acquire certain net assets in exchange for an aggregate payment of approximately $18 million (the "Chaps Menswear License Acquisition"). We funded the Chaps Menswear License Acquisition with available cash on-hand. Warnaco was our licensee for Chaps-branded men's sportswear apparel in North America. In connection with the Chaps Menswear License Acquisition, we entered into a transition services agreement with PVH for the provision of certain support services related to sourcing, distribution, customer service, finance, and information systems through June 30, 2013. The operating results of the Chaps men's sportswear business will be consolidated in our operating results commencing on April 10, 2013. We are currently in the process of assessing the fair values of the assets acquired and liabilities assumed.
Wind-down of Rugby
In October 2012, we approved the Rugby Closure Plan to wind-down our Rugby brand retail operations. This decision was primarily based on the results of an analysis of the brand concept, as well as an opportunity to reallocate our resources related to these operations to support other high-growth business opportunities and initiatives. In connection with the Rugby Closure Plan, 13 of our
14
global freestanding Rugby stores and our related domestic e-commerce site located at Rugby.com were closed during Fiscal 2013. The one remaining Rugby store is expected to be closed during Fiscal 2014. The Rugby Closure Plan resulted in a reduction in our workforce of approximately
160
employees. Refer to Notes 11 and 12 to our accompanying audited consolidated financial statements for detailed discussions of impairment and restructuring charges recorded during Fiscal 2013 in connection with the Rugby Closure Plan.
E-Commerce Expansion
During
Fiscal 2013
, we continued to execute on our strategic objective of growing and expanding our global e-commerce operations as follows:
|
•
|
We broadened our e-commerce presence in Europe by expanding our existing retail site in France to service customers in Italy, Greece, Spain, and Portugal;
|
|
•
|
We expanded our global e-commerce presence into Asia by launching a new retail site for our Ralph Lauren business in Japan located at www.RalphLauren.co.jp; and
|
|
•
|
We broadened our e-commerce presence in North America by launching a new retail site for our Club Monaco business in Canada located at www.ClubMonaco.ca.
|
Suspension of Argentina Operations
During the second quarter of Fiscal 2013, we suspended our business operations in Argentina. The suspension of these operations did not have a material impact on the Company’s consolidated or segment results.
|
|
40
|
|
Discontinuance of American Living
During the fourth quarter of Fiscal 2012, we decided, along with our wholesale partner J.C. Penney Company, Inc. (“JCPenney”), to discontinue the majority of the products sold under the American Living brand created for and exclusively sold to JCPenney, effective for the Fall 2012 wholesale selling season. The discontinuance of these American Living product lines did not have a material impact on the Company’s consolidated or segment results.
Asia-Pacific Restructuring Plan
In May 2011, we initiated a restructuring plan to reposition and upgrade our existing distribution network and merchandising operations in the Asia-Pacific region, which includes mainland China, Macau, Hong Kong, Taiwan, Malaysia, Singapore, Japan, and South Korea (the "Asia-Pacific Restructuring Plan"). This plan included a reduction in workforce and the closure of certain stores and concession shops that did not support our new merchandising strategy. See Note 12 to our accompanying audited consolidated financial statements for additional information relating to restructuring charges recorded during Fiscal 2012 in connection with the Asia-Pacific Restructuring Plan.
Assumption of Bedding and Bath Operations
In May 2011, the license for our Lauren by Ralph Lauren bedding and bath products previously held by WestPoint Home, Inc. expired in accordance with the underlying agreement, and we assumed control over this wholesale business. No significant payment or other consideration was provided related to this license expiration. WestPoint Home, Inc. remained the exclusive licensee for our Lauren basic bedding program, which includes utility and blanket products, through December 2012.
|
|
41
|
|
RESULTS OF OPERATIONS
Fiscal 2013
Compared to
Fiscal 2012
The following table summarizes our results of operations and expresses the percentage relationship to net revenues of certain financial statement captions:
|
|
Fiscal Years Ended
|
|
|
||||||||||||
|
|
March 30,
2013 |
March 31,
2012 |
$
Change
|
% / bps
Change
|
|||||||||||
|
|
(millions, except per share data)
|
|
|||||||||||||
|
Net revenues
|
$
|
6,944.8
|
|
$
|
6,859.5
|
|
$
|
85.3
|
|
1.2
|
%
|
||||
|
Cost of goods sold
(a)
|
(2,789.0
|
)
|
(2,861.4
|
)
|
72.4
|
|
(2.5
|
%)
|
|||||||
|
Gross profit
|
4,155.8
|
|
3,998.1
|
|
157.7
|
|
3.9
|
%
|
|||||||
|
Gross profit as % of net revenues
|
59.8
|
%
|
58.3
|
%
|
150 bps
|
|
|||||||||
|
Selling, general, and administrative expenses
(a)
|
(2,971.6
|
)
|
(2,915.2
|
)
|
(56.4
|
)
|
1.9
|
%
|
|||||||
|
SG&A expenses as % of net revenues
|
42.8
|
%
|
42.5
|
%
|
30 bps
|
|
|||||||||
|
Amortization of intangible assets
|
(26.8
|
)
|
(28.9
|
)
|
2.1
|
|
(7.3
|
%)
|
|||||||
|
Impairment of assets
|
(19.0
|
)
|
(2.2
|
)
|
(16.8
|
)
|
NM
|
|
|||||||
|
Restructuring charges
|
(11.7
|
)
|
(12.4
|
)
|
0.7
|
|
(5.6
|
%)
|
|||||||
|
Operating income
|
1,126.7
|
|
1,039.4
|
|
87.3
|
|
8.4
|
%
|
|||||||
|
Operating income as % of net revenues
|
16.2
|
%
|
15.2
|
%
|
100 bps
|
|
|||||||||
|
Foreign currency losses
|
(11.5
|
)
|
(1.5
|
)
|
(10.0
|
)
|
NM
|
|
|||||||
|
Interest expense
|
(22.1
|
)
|
(24.5
|
)
|
2.4
|
|
(9.8
|
%)
|
|||||||
|
Interest and other income, net
|
5.7
|
|
11.0
|
|
(5.3
|
)
|
(48.2
|
%)
|
|||||||
|
Equity in losses of equity-method investees
|
(9.5
|
)
|
(9.3
|
)
|
(0.2
|
)
|
2.2
|
%
|
|||||||
|
Income before provision for income taxes
|
1,089.3
|
|
1,015.1
|
|
74.2
|
|
7.3
|
%
|
|||||||
|
Provision for income taxes
|
(339.3
|
)
|
(334.1
|
)
|
(5.2
|
)
|
1.6
|
%
|
|||||||
|
Effective tax rate
(b)
|
31.1
|
%
|
32.9
|
%
|
(180 bps)
|
|
|||||||||
|
Net income
|
$
|
750.0
|
|
$
|
681.0
|
|
$
|
69.0
|
|
10.1
|
%
|
||||
|
Net income per common share:
|
|||||||||||||||
|
Basic
|
$
|
8.21
|
|
$
|
7.35
|
|
$
|
0.86
|
|
11.7
|
%
|
||||
|
Diluted
|
$
|
8.00
|
|
$
|
7.13
|
|
$
|
0.87
|
|
12.2
|
%
|
||||
|
(a)
|
Includes total depreciation expense of
$205.5 million
and
$196.3 million
for
Fiscal 2013
and
Fiscal 2012
, respectively.
|
|
(b)
|
Effective tax rate is calculated by dividing the provision for income taxes by income before provision for income taxes.
|
NM Not meaningful.
Net Revenues.
Net revenues increased by
$85.3 million
, or
1.2%
, to
$6.945 billion
in
Fiscal 2013
from
$6.860 billion
in
Fiscal 2012
. The increase was primarily due to higher revenues from our retail businesses, which were partially offset by lower revenues from our wholesale businesses and net unfavorable foreign currency effects. Excluding the effect of foreign currency, net revenues increased by $183.4 million, or 2.7%.
|
|
42
|
|
Net revenues for our three reportable business segments are as follows:
|
|
Fiscal Years Ended
|
|
|
||||||||||||
|
|
March 30,
2013 |
March 31,
2012 |
$
Change
|
%
Change
|
|||||||||||
|
|
(millions)
|
|
|||||||||||||
|
Net Revenues:
|
|||||||||||||||
|
Wholesale
|
$
|
3,138.3
|
|
$
|
3,246.5
|
|
$
|
(108.2
|
)
|
(3.3
|
%)
|
||||
|
Retail
|
3,624.6
|
|
3,432.3
|
|
192.3
|
|
5.6
|
%
|
|||||||
|
Licensing
|
181.9
|
|
180.7
|
|
1.2
|
|
0.7
|
%
|
|||||||
|
Total net revenues
|
$
|
6,944.8
|
|
$
|
6,859.5
|
|
$
|
85.3
|
|
1.2
|
%
|
||||
Wholesale net revenues
— The net decrease primarily reflects:
|
•
|
a $78 million net decrease related to our European businesses on a constant currency basis driven by reduced shipments across our core menswear, womenswear, and childrenswear product lines, reflecting the challenging European retail environment and softness in the specialty store business, particularly in Southern Europe. These decreases were partially offset by increased sales from our accessories product lines, driven by new product offerings and an increased department store presence;
|
|
•
|
a $15 million net decrease related to our Japanese businesses on a constant currency basis, primarily due to the impact of our business model shift to the retail concession-based channel and the softness in the department store business; and
|
|
•
|
a $50 million net decrease in revenues due to net unfavorable foreign currency effects, primarily related to the weakening of the Euro against the U.S. Dollar during Fiscal 2013.
|
These decreases were partially offset by:
|
•
|
a $33 million net increase related to our businesses in the Americas, reflecting higher menswear and womenswear revenues due in part to additional product line offerings, partially offset by declines due to the discontinuance of the majority of product categories under the American Living brand sold to JCPenney. The increase in net revenues was also due to incremental Home product revenues related to our assumption of control over the distribution of the previously licensed bedding and bath business on May 1, 2011, which was partially offset by lower revenues from our childrenswear product line.
|
Retail net revenues
— For purposes of the discussion of Retail operating performance below, we refer to the measure of “comparable store sales.” Comparable store sales refer to the growth of sales in stores that are open for at least one full fiscal year. Sales for stores that are closing during a fiscal year are excluded from the calculation of comparable store sales. Sales for stores that are either relocated, enlarged (as defined by gross square footage expansion of 25% or greater), or generally closed for 30 or more consecutive days for renovation are also excluded from the calculation of comparable store sales until such stores have been in their new location or in their newly renovated state for at least one full fiscal year. Consolidated comparable store sales information includes our Ralph Lauren stores (including concession-based shop-within-shops, as well as RRL stores), factory stores, Club Monaco stores, and Ralph Lauren e-commerce sites, which include RalphLauren.com and RalphLauren.co.uk. Sales from our Rugby stores and related e-commerce site, Rugby.com, are no longer included in comparable store sales due to the wind-down of our
Rugby
brand retail operations in Fiscal 2013.
Beginning in Fiscal 2013, we have presented our comparable store sales growth as a single, consolidated metric. We believe this combined measure is better aligned with the integrated, multi-channel approach that we employ in managing our retail business on a global basis. This change has no effect on our total reported comparable store sales, which increased by 3% during Fiscal 2013, or on our constant currency comparable store sales, which increased by 4% during Fiscal 2013, as detailed below.
|
|
43
|
|
The net increase in Retail net revenues primarily reflects:
|
•
|
a $119 million, or a 4%, net increase in consolidated comparable store sales on a constant currency basis, primarily driven by increases from our North American and European factory stores and our Ralph Lauren e-commerce operations, partially offset by decreases in comparable store sales from certain of our Ralph Lauren stores and our concession shops in Asia; and
|
|
•
|
a $120 million, or a 22%, net increase in non-comparable store sales on a constant currency basis, driven by new store openings over the past twelve months, and the growth of our e-commerce operations through our recently launched Ralph Lauren e-commerce sites in Germany and Japan and Club Monaco e-commerce sites in North America. The effect of these new openings and launches more than offset the impact of store closings in the Asia-Pacific region due to our network repositioning initiative.
|
These increases were partially offset by:
|
•
|
a $47 million net decrease in revenues due to unfavorable foreign currency effects, comprised of unfavorable effects of $37 million and $10 million related to our comparable and non-comparable store sales, respectively, primarily related to the weakening of the Euro and the Yen against the U.S. Dollar during Fiscal 2013.
|
Our global average store count declined by three stores and concession shops during
Fiscal 2013
, as store closures associated with the Asia-Pacific Restructuring Plan at the end of Fiscal 2012 and the Rugby Closure Plan in Fiscal 2013 were largely offset by new store openings, primarily in Asia and Europe, during the current fiscal year. The following table details our retail store and e-commerce presence as of
March 30, 2013
:
|
|
March 30,
2013 |
||
|
Stores:
|
|||
|
Freestanding stores
|
388
|
|
|
|
Concession shops
|
494
|
|
|
|
Total stores
|
882
|
|
|
|
E-commerce Sites:
|
|||
|
North American sites
(a)
|
3
|
|
|
|
European sites
(b)
|
3
|
|
|
|
Asian site
(c)
|
1
|
|
|
|
Total e-commerce sites
|
7
|
|
|
|
(a)
|
Servicing the U.S. and Canada.
|
|
(b)
|
Servicing Austria, Belgium, France, Germany, Greece, Italy, Luxembourg, the Netherlands, Portugal, Spain, and the United Kingdom.
|
|
(c)
|
Servicing Japan.
|
Licensing revenues
— The
$1.2 million
net increase in licensing revenues primarily reflects an approximate $5 million increase in product licensing royalties, primarily driven by higher apparel and fragrance-related royalties, largely offset by an approximate $4 million decline in Home licensing revenues due to the discontinuance of certain licensing arrangements.
Gross Profit.
Cost of goods sold includes expenses incurred to acquire and produce inventory for sale, including product costs, freight-in, and import costs, as well as changes in reserves for shrinkage and inventory realizability. The costs of selling merchandise, including those associated with preparing the merchandise for sale, such as picking, packing, warehousing, and order charges, are included in SG&A expenses.
|
|
44
|
|
Gross profit increased by
$157.7 million
, or
3.9%
, to
$4.156 billion
in
Fiscal 2013
from
$3.998 billion
in
Fiscal 2012
. Gross profit as a percentage of net revenues increased by
150 basis points
to
59.8%
in
Fiscal 2013
from
58.3%
in
Fiscal 2012
, primarily reflecting lower sourcing costs compared to higher cost benchmarks in the prior year period across most of our global businesses, favorable product mix across most of our wholesale businesses, and the growth of our retail businesses, which generally carry higher gross margins. The improvement in our gross profit margin was partially offset by a less favorable geographic mix and elevated promotional activity across certain of our North American retail businesses.
Gross profit as a percentage of net revenues is dependent upon a variety of factors, including changes in the relative sales mix among distribution channels, changes in the mix of products sold, the timing and level of promotional activities, foreign currency exchange rates, and fluctuations in material costs. These factors, among others, may cause gross profit as a percentage of net revenues to fluctuate from year to year.
Selling, General, and Administrative Expenses.
SG&A expenses primarily include compensation and benefits, marketing, distribution, bad debts, information technology, facilities, legal, and other costs associated with finance and administration. SG&A expenses increased by
$56.4 million
, or
1.9%
, to
$2.972 billion
in
Fiscal 2013
from
$2.915 billion
in
Fiscal 2012
. This increase included a net favorable foreign currency effect of approximately $43 million, primarily related to the weakening of the Euro and the Japanese Yen against the U.S. Dollar during
Fiscal 2013
. Excluding the effect of foreign currency, SG&A expenses increased by $99.3 million, or 3.4%. SG&A expenses as a percentage of net revenues increased to
42.8%
in
Fiscal 2013
from
42.5%
in
Fiscal 2012
. The 30 basis point increase was primarily due to an increase in operating expenses attributable to the growth in our retail businesses (which typically carry higher operating expense margins), our new business initiatives, and our repositioning efforts in the Asia-Pacific region, partially offset by our operating leverage on higher net revenues.
The
$56 million
increase in SG&A expenses by functional category is as follows:
|
Fiscal 2013
Compared to
Fiscal 2012
|
||||
|
(millions)
|
||||
|
SG&A expense category:
|
||||
|
Compensation-related expenses
(a)
|
$
|
26
|
|
|
|
Selling expenses
|
7
|
|
||
|
Depreciation expense
|
7
|
|
||
|
Shipping, warehousing, and distribution expenses
|
6
|
|
||
|
Rent and occupancy-related expenses
|
5
|
|
||
|
Marketing, advertising, and promotional expenses
|
4
|
|
||
|
Other
|
1
|
|
||
|
Total change in SG&A expenses
|
$
|
56
|
|
|
|
(a)
|
Primarily related to increased salaries to support retail growth, and higher stock-based compensation expenses.
|
Amortization of Intangible Assets.
Amortization of intangible assets decreased by
$2.1 million
, or
7.3%
, to
$26.8 million
in
Fiscal 2013
from
$28.9 million
in
Fiscal 2012
. This decrease reflects the absence of expense in Fiscal 2013 related to certain customer relationship intangible assets that were fully amortized as of the end of Fiscal 2012.
Impairments of Assets.
Asset impairment charges increased by
$16.8 million
to
$19.0 million
in
Fiscal 2013
from
$2.2 million
in
Fiscal 2012
. The non-cash impairment charges of
$19.0 million
recognized in
Fiscal 2013
included charges of
$11.4 million
to write-off certain Rugby brand-related long-lived assets in connection with the Rugby Closure Plan, and aggregate charges of
$7.6 million
to reduce the carrying values of long-lived assets of certain underperforming European stores to their estimated fair values and write-off fixed assets of certain European wholesale shops that are expected to close. During
Fiscal 2012
, we recorded non-cash impairment charges of
$2.2 million
, primarily to reduce the carrying value of the long-lived assets of certain underperforming European retail stores to their estimated fair values. See Note 11 to the accompanying audited consolidated financial statements for further discussion.
Restructuring Charges.
Restructuring charges declined by
$0.7 million
, or
5.6%
, to
$11.7 million
in
Fiscal 2013
from
$12.4 million
in
Fiscal 2012
. Net restructuring charges of
$11.7 million
recorded in
Fiscal 2013
included $7.1 million of severance and
|
|
45
|
|
lease termination costs associated with the Rugby Closure Plan and
$4.6 million
of other net restructuring charges, which primarily related to the suspension of the Company's operations in Argentina, severance and lease termination costs associated with our European operations, and other severance-related costs primarily within our corporate operations, partially offset by reversals of reserves deemed no longer necessary in connection with our Fiscal 2012 restructuring plan in the Asia-Pacific region. Net restructuring charges of
$12.4 million
recorded during
Fiscal 2012
primarily related to employee termination costs and costs associated with the closure of certain retail stores and concession shops in connection with our restructuring plan in the Asia-Pacific region, as well as severance related to the planned discontinuance of the majority of the products sold under the American Living brand at JCPenney. See Note 12 to the accompanying audited consolidated financial statements for further discussion.
Operating Income.
Operating income increased by
$87.3 million
, or
8.4%
, to
$1.127 billion
in
Fiscal 2013
from
$1.039 billion
in
Fiscal 2012
. Operating income as a percentage of net revenues increased
100 basis points
, to
16.2%
in
Fiscal 2013
from
15.2%
in
Fiscal 2012
. The increase in operating income as a percentage of net revenues primarily reflects the improvement in gross profit margin, partially offset by higher SG&A expenses and impairment charges as a percentage of revenue, as previously discussed.
Operating income and margin for our three business segments is as follows:
|
|
Fiscal Years Ended
|
|
|
|||||||||||||||
|
March 30, 2013
|
March 31, 2012
|
|
|
|||||||||||||||
|
Operating
Income
|
Operating
Margin
|
Operating
Income
|
Operating
Margin
|
$
Change
|
Margin
Change
|
|||||||||||||
|
(millions)
|
|
(millions)
|
|
(millions)
|
|
|||||||||||||
|
Segment:
|
||||||||||||||||||
|
Wholesale
|
$
|
706.1
|
|
22.5%
|
$
|
654.3
|
|
20.2%
|
$
|
51.8
|
|
230 bps
|
||||||
|
Retail
|
611.3
|
|
16.9%
|
553.1
|
|
16.1%
|
58.2
|
|
80 bps
|
|||||||||
|
Licensing
|
130.1
|
|
71.5%
|
129.0
|
|
71.4%
|
1.1
|
|
10 bps
|
|||||||||
|
1,447.5
|
|
1,336.4
|
|
111.1
|
|
|||||||||||||
|
Unallocated corporate expenses
|
(309.1
|
)
|
(284.6
|
)
|
(24.5
|
)
|
||||||||||||
|
Unallocated restructuring charges, net
|
(11.7
|
)
|
(12.4
|
)
|
0.7
|
|
||||||||||||
|
Total operating income
|
$
|
1,126.7
|
|
16.2%
|
$
|
1,039.4
|
|
15.2%
|
$
|
87.3
|
|
100 bps
|
||||||
Wholesale operating margin
increased by
230
basis points, primarily due to increased global gross profit margins, reflecting lower sourcing costs compared to higher cost benchmarks in the prior year period and a favorable product mix across most of our global wholesale businesses. This increase in Wholesale operating margin was partially offset by an increase in SG&A expenses as a percentage of net revenues, primarily resulting from reduced operating leverage of fixed costs, including depreciation, amortization, and rent and occupancy expenses, on lower global Wholesale revenues.
Retail operating margin
increased by
80
basis points, including an unfavorable impact of 20 basis points related to asset impairment charges associated with the Rugby Closure Plan. The increase in the Retail operating margin was primarily due to improved operating leverage of SG&A expenses, including rent and occupancy and compensation-related costs, on higher retail revenues. This increase was partially offset by the lower gross profit margin, primarily reflecting elevated promotional activity across certain of our North American retail businesses.
Licensing operating margin
increased by
10
basis points, primarily due to reduced operating expenses reflecting the discontinuance of certain licensing arrangements, as well as slightly higher licensing revenues.
Unallocated corporate expenses
increased by
$24.5 million
, primarily due to increased compensation-related costs, including stock-based compensation, higher advertising, marketing, and promotional costs, and higher rent and occupancy related expenses.
Unallocated restructuring charges, net
decreased by
$0.7 million
to
$11.7 million
in
Fiscal 2013
, from
$12.4 million
in
Fiscal 2012
. See Notes 12 and 22 to the accompanying audited consolidated financial statements for further discussion of the related charges.
Foreign Currency Losses.
The effect of foreign currency exchange rate fluctuations resulted in losses of
$11.5 million
in
Fiscal 2013
, compared to losses of
$1.5 million
in
Fiscal 2012
. The higher foreign currency losses were primarily attributable to
|
|
46
|
|
the weakening of the Euro during Fiscal 2013, and were primarily related to the settlement of foreign currency-denominated third-party and intercompany receivables and payables. Foreign currency gains and losses do not result from the translation of the operating results of our foreign subsidiaries to U.S. Dollars.
Interest Expense.
Interest expense includes the borrowing costs on our outstanding debt, including amortization of debt issuance costs, and interest related to our capital lease obligations. Interest expense decreased by
$2.4 million
, or
9.8%
, to
$22.1 million
in
Fiscal 2013
from
$24.5 million
in
Fiscal 2012
. The decrease in interest expense was primarily due to favorable foreign currency effects related to the weakening of the Euro during
Fiscal 2013
, which reduced interest expense related to our Euro Debt. The decline in interest expense was also attributable to the absence of interest incurred on Fiscal 2012 borrowings under our Global Credit Facility (as defined in
Note 14
to the accompanying audited consolidated financial statements).
Interest and Other Income, net.
Interest and other income, net decreased by
$5.3 million
, or
48.2%
, to
$5.7 million
in
Fiscal 2013
from
$11.0 million
in
Fiscal 2012
. The decline was principally due to lower rates of interest and lower investment balances within our European investment portfolio, as well as the absence of pretax income of approximately $1.0 million recorded in Fiscal 2012 in connection with the change in fiscal year of our Japanese subsidiary to conform to our consolidated fiscal-year basis.
Equity in Losses of Equity-Method Investees.
The equity in losses of equity-method investees of
$9.5 million
and
$9.3 million
in
Fiscal 2013
and
Fiscal 2012
, respectively, is related to our share of losses from our joint venture, the Ralph Lauren Watch and Jewelry Company, S.A.R.L. (the "RL Watch Company"), which is accounted for under the equity method of accounting.
Provision for Income Taxes.
The provision for income taxes represents federal, foreign, state, and local income taxes. The provision for income taxes increased by
$5.2 million
, or
1.6%
, to
$339.3 million
in
Fiscal 2013
from
$334.1 million
in
Fiscal 2012
. The increase in our provision for income taxes was primarily due to an increase in the overall level of our pretax income, largely offset by a decrease in our effective tax rate of
180 basis points
, to
31.1%
in
Fiscal 2013
from
32.9%
in
Fiscal 2012
. Our lower effective tax rate was primarily due to a greater proportion of earnings generated in lower-taxed jurisdictions, as well as tax reserve reductions associated with the conclusion of a tax examination and other net favorable discrete tax items, partially offset by the inclusion of a reserve for an interest assessment on a prior year withholding tax. The effective tax rate differs from statutory rates due to the effect of state and local taxes, tax rates in foreign jurisdictions, and certain nondeductible expenses. Our effective tax rate will change from period to period based on various factors including, but not limited to, the geographic mix of earnings, the timing and amount of foreign dividends, enacted tax legislation, state and local taxes, tax audit findings and settlements, and the interaction of various global tax strategies.
Net Income.
Net income increased by
$69.0 million
, or
10.1%
, to
$750.0 million
in
Fiscal 2013
from
$681.0 million
in
Fiscal 2012
. The higher net income was primarily driven by the
$87.3 million
increase in operating income, partially offset by higher foreign currency losses of
$10.0 million
and the increase in our provision for income taxes of
$5.2 million
, as previously discussed. Fiscal 2013 results were negatively impacted by $18.5 million of pretax charges related to asset impairments and restructuring in connection with the Rugby Closure Plan, which had an after-tax effect of reducing net income by $12.0 million.
Net Income per Diluted Share.
Net income per diluted share increased by
$0.87
, or
12.2%
, to
$8.00
per share in
Fiscal 2013
from
$7.13
per share in
Fiscal 2012
. The increase was due to the higher level of net income, as previously discussed, and lower weighted-average diluted shares outstanding during
Fiscal 2013
, primarily driven by our share repurchases over the last twelve months. Fiscal 2013 results were negatively impacted by $18.5 million of pretax charges related to asset impairments and restructurings in connection with the Rugby Closure Plan, which had an after-tax effect of reducing net income per diluted share by $0.13.
|
|
47
|
|
Fiscal 2012 Compared to Fiscal 2011
The following table summarizes our results of operations and expresses the percentage relationship to net revenues of certain financial statement captions:
|
|
Fiscal Years Ended
|
|
|
||||||||||||
|
|
March 31,
2012
|
April 2,
2011
|
$
Change
|
% / bps
Change
|
|||||||||||
|
|
(millions, except per share data)
|
|
|||||||||||||
|
Net revenues
|
$
|
6,859.5
|
|
$
|
5,660.3
|
|
$
|
1,199.2
|
|
21.2
|
%
|
||||
|
Cost of goods sold
(a)
|
(2,861.4
|
)
|
(2,342.0
|
)
|
(519.4
|
)
|
22.2
|
%
|
|||||||
|
Gross profit
|
3,998.1
|
|
3,318.3
|
|
679.8
|
|
20.5
|
%
|
|||||||
|
Gross profit as % of net revenues
|
58.3
|
%
|
58.6
|
%
|
(30) bps
|
|
|||||||||
|
Selling, general, and administrative expenses
(a)
|
(2,915.2
|
)
|
(2,442.7
|
)
|
(472.5
|
)
|
19.3
|
%
|
|||||||
|
SG&A expenses as % of net revenues
|
42.5
|
%
|
43.2
|
%
|
(70) bps
|
|
|||||||||
|
Amortization of intangible assets
|
(28.9
|
)
|
(25.4
|
)
|
(3.5
|
)
|
13.8
|
%
|
|||||||
|
Impairments of assets
|
(2.2
|
)
|
(2.5
|
)
|
0.3
|
|
(12.0
|
)%
|
|||||||
|
Restructuring charges
|
(12.4
|
)
|
(2.6
|
)
|
(9.8
|
)
|
NM
|
|
|||||||
|
Operating income
|
1,039.4
|
|
845.1
|
|
194.3
|
|
23.0
|
%
|
|||||||
|
Operating income as % of net revenues
|
15.2
|
%
|
14.9
|
%
|
30 bps
|
|
|||||||||
|
Foreign currency losses
|
(1.5
|
)
|
(1.4
|
)
|
(0.1
|
)
|
7.1
|
%
|
|||||||
|
Interest expense
|
(24.5
|
)
|
(18.3
|
)
|
(6.2
|
)
|
33.9
|
%
|
|||||||
|
Interest and other income, net
|
11.0
|
|
7.7
|
|
3.3
|
|
42.9
|
%
|
|||||||
|
Equity in losses of equity-method investees
|
(9.3
|
)
|
(7.7
|
)
|
(1.6
|
)
|
20.8
|
%
|
|||||||
|
Income before provision for income taxes
|
1,015.1
|
|
825.4
|
|
189.7
|
|
23.0
|
%
|
|||||||
|
Provision for income taxes
|
(334.1
|
)
|
(257.8
|
)
|
(76.3
|
)
|
29.6
|
%
|
|||||||
|
Effective tax rate
(b)
|
32.9
|
%
|
31.2
|
%
|
170 bps
|
|
|||||||||
|
Net income
|
$
|
681.0
|
|
$
|
567.6
|
|
$
|
113.4
|
|
20.0
|
%
|
||||
|
Net income per common share:
|
|||||||||||||||
|
Basic
|
$
|
7.35
|
|
$
|
5.91
|
|
$
|
1.44
|
|
24.4
|
%
|
||||
|
Diluted
|
$
|
7.13
|
|
$
|
5.75
|
|
$
|
1.38
|
|
24.0
|
%
|
||||
|
(a)
|
Includes total depreciation expense of $196.3 million and $168.7 million for Fiscal 2012 and Fiscal 2011, respectively.
|
|
(b)
|
Effective tax rate is calculated by dividing the provision for income taxes by income before provision for income taxes.
|
|
NM
|
Not meaningful.
|
Net Revenues.
Net revenues increased by $1.199 billion, or 21.2%, to $6.860 billion in Fiscal 2012 from $5.660 billion in Fiscal 2011. The increase was primarily due to higher revenues from our global retail and wholesale businesses, which included favorable foreign currency effects. Excluding the effect of foreign currency, net revenues increased by $1.095 billion, or 19.3%.
Net revenues for our three reportable business segments are provided below:
|
|
Fiscal Years Ended
|
$
Change
|
%
Change
|
||||||||||||
|
|
March 31,
2012
|
April 2,
2011
|
|||||||||||||
|
|
(millions)
|
|
|||||||||||||
|
Net Revenues:
|
|||||||||||||||
|
Wholesale
|
$
|
3,246.5
|
|
$
|
2,777.6
|
|
$
|
468.9
|
|
16.9
|
%
|
||||
|
Retail
|
3,432.3
|
|
2,704.2
|
|
728.1
|
|
26.9
|
%
|
|||||||
|
Licensing
|
180.7
|
|
178.5
|
|
2.2
|
|
1.2
|
%
|
|||||||
|
Total net revenues
|
$
|
6,859.5
|
|
$
|
5,660.3
|
|
$
|
1,199.2
|
|
21.2
|
%
|
||||
|
|
48
|
|
Wholesale net revenues
— The net increase primarily reflects:
|
•
|
a $350 million net increase in our domestic businesses primarily due to increased menswear revenues, including sales from our newly launched Denim & Supply Ralph Lauren product line, higher childrenswear revenues, and incremental Home product revenues related to the assumption of control over the distribution of our previously licensed bedding and bath business;
|
|
•
|
a $128 million net increase in our European businesses on a constant currency basis primarily driven by increased revenues from our menswear, womenswear, and accessories product lines, reflecting new product offerings and an increased presence at department stores. This sales growth was achieved despite a continued softening in the specialty store business, particularly in Southern Europe; and
|
|
•
|
a $41 million net increase in revenues due to favorable foreign currency effects primarily related to the strengthening of the Euro and the Yen, both in comparison to the U.S. Dollar during Fiscal 2012.
|
These increases were partially offset by:
|
•
|
a $42 million net decrease related to our Japanese businesses on a constant currency basis, including the effect of a business model shift to the Retail concession-based channel; and
|
|
•
|
an $8 million net decrease related to our businesses in the Greater China and Southeast Asia region, which is comprised of China, Hong Kong, Macau, Malaysia, the Philippines, Singapore, Taiwan, and Thailand, on a constant currency basis. This net decrease was primarily due to the elimination of certain third-party distribution in connection with our repositioning efforts in this region.
|
Retail net revenues
— The net increase primarily reflects:
|
•
|
a $429 million aggregate net increase in non-comparable store sales primarily driven by:
|
|
◦
|
a net increase of approximately $257 million related to a number of new store openings within the past twelve months, as well as our recently launched European retail e-commerce sites in the United Kingdom, France, and Germany. This increase includes an aggregate favorable foreign currency effect of approximately $23 million, primarily related to the strengthening of the Yen and the Euro, both in comparison to the U.S. Dollar during Fiscal 2012. Excluding those stores and shops assumed in connection with the South Korea Licensed Operations Acquisition, there was a net increase in our global average store count of 18 stores and concession shops as compared to Fiscal 2011. Our total store count as of March 31, 2012 included 379 freestanding stores and 474 concession shops, including 6 stores and 172 concession shops in South Korea; and
|
|
◦
|
an increase of approximately $172 million related to the inclusion of a full year of revenues from stores and concession-based shop-within-shops assumed in connection with the South Korea Licensed Operations Acquisition, which occurred on January 1, 2011.
|
|
•
|
a $227 million aggregate net increase in comparable store sales primarily driven by our global factory stores. This increase includes an aggregate favorable foreign currency effect of approximately $39 million primarily related to the strengthening of the Yen and the Euro, both in comparison to the U.S. Dollar during Fiscal 2012. The increase in Retail net revenues was also due to a $72 million increase in RalphLauren.com sales. Comparable store sales are presented below:
|
|
|
49
|
|
|
|
Fiscal Year Ended
|
|
|
|
March 31,
2012
|
|
|
Increases in comparable store sales as reported:
|
||
|
Ralph Lauren store sales
|
8%
|
|
|
Club Monaco store sales
|
18%
|
|
|
Factory store sales
|
13%
|
|
|
RalphLauren.com sales
|
29%
|
|
|
Total increase in comparable store sales as reported
|
14%
|
|
|
Increases in comparable store sales excluding the effect of foreign currency:
|
||
|
Ralph Lauren store sales
|
4%
|
|
|
Club Monaco store sales
|
18%
|
|
|
Factory store sales
|
12%
|
|
|
RalphLauren.com sales
|
29%
|
|
|
Total increase in comparable store sales excluding the effect of foreign currency
|
12%
|
|
Licensing revenue
— The net increase primarily reflects:
|
•
|
a $10 million increase in domestic product licensing royalties, primarily related to higher apparel and accessories-related royalties.
|
The above net increase was partially offset by:
|
•
|
a $5 million decrease in international licensing royalties, primarily due to the South Korea Licensed Operations Acquisition; and
|
|
•
|
a $3 million decrease in Home licensing revenues, primarily due to the transition of our previously licensed bedding and bath business to directly controlled operations as of May 1, 2011.
|
Gross Profit.
Gross profit increased by $679.8 million, or 20.5%, to $3.998 billion in Fiscal 2012 from $3.318 billion in Fiscal 2011. Gross profit as a percentage of net revenues decreased by 30 basis points to 58.3% in Fiscal 2012 from 58.6% in Fiscal 2011. This decrease was primarily due to substantial sourcing cost increases experienced across our global businesses, particularly in our Wholesale segment, partially mitigated by Company-wide targeted pricing actions. The decline in gross profit as a percentage of net revenues was also offset in part by a more favorable geographic and channel mix and stronger levels of full-price sell-throughs driven by our retail business in Asia.
Selling, General, and Administrative Expenses.
SG&A expenses increased by $472.5 million, or 19.3%, to $2.915 billion in Fiscal 2012 from $2.443 billion Fiscal 2011. This increase included an unfavorable foreign currency effect of approximately $52 million, primarily related to the performance of the Euro and the Yen, both in comparison to the U.S. Dollar during Fiscal 2012. SG&A expenses as a percentage of net revenues decreased to 42.5% in Fiscal 2012 from 43.2% in Fiscal 2011. The 70 basis point improvement was primarily due to operating leverage related to the increase in net revenues, which more than offset the increase in operating expenses attributable to our recent acquisitions and new business initiatives, and the shift in channel mix to a greater Retail concentration. The $472.5 million increase in SG&A expenses was primarily driven by:
|
•
|
higher compensation-related costs of approximately $145 million, primarily due to higher incentive and stock-based compensation expenses in accordance with our shareholder-approved compensation plans;
|
|
•
|
additional SG&A expenses of approximately $101 million related to the inclusion of a full year of costs associated with our business in South Korea which was acquired on January 1, 2011;
|
|
•
|
an approximate $60 million increase in rent and occupancy costs primarily to support the ongoing growth of our international businesses, including an increase in concession-based rent expense largely due to a business model change in Japan;
|
|
•
|
increased shipping, warehousing, and distribution expenses of approximately $34 million to support increased sales;
|
|
|
50
|
|
|
•
|
an approximate $24 million increase in depreciation expense primarily associated with global retail store expansion;
|
|
•
|
increased consulting costs of approximately $24 million, including costs relating to the new global information technology systems;
|
|
•
|
increased brand-related marketing and advertising costs of approximately $17 million; and
|
|
•
|
increased SG&A expenses of approximately $12 million related to the assumption of control over our previously licensed bedding and bath business in May 2011.
|
Amortization of Intangible Assets.
Amortization of intangible assets increased by $3.5 million, or 13.8%, to $28.9 million in Fiscal 2012 from $25.4 million in Fiscal 2011. This increase was primarily due to the amortization of the intangible assets acquired in connection with the South Korea Licensed Operations Acquisition at the end of the third quarter of Fiscal 2011.
Impairments of Assets.
During Fiscal 2012, we recognized a non-cash impairment charge of $2.2 million, primarily to reduce the net carrying value of the long-lived assets of certain underperforming European retail stores to their estimated fair values. In Fiscal 2011, we recognized a non-cash impairment charge of $2.5 million to reduce the net carrying values of certain retail store and concession shop long-lived assets in the Asia-Pacific region that were determined to no longer be used over the intended service period to their estimated fair value. See Note 11 to the accompanying audited consolidated financial statements for further discussion of these charges.
Restructuring Charges.
During Fiscal 2012, we recorded restructuring charges of $12.4 million, principally related to employee termination costs and costs associated with the closure of certain retail stores and concession shops in connection with the Asia-Pacific Restructuring Plan, as well as severance actions related to the planned discontinuance of the majority of the products sold under the American Living brand at JCPenney. Restructuring charges of $2.6 million for Fiscal 2011 primarily related to employee termination costs associated with our wholesale operations and the closing of a warehouse facility, partially offset by reversals of reserves deemed no longer necessary largely associated with previously closed retail stores. See Note 12 to the accompanying audited consolidated financial statements for further discussion.
Operating Income.
Operating income increased by $194.3 million, or 23.0%, to $1.039 billion in Fiscal 2012 from $845.1 million in Fiscal 2011. Operating income as a percentage of net revenues increased 30 basis points, to 15.2% in Fiscal 2012 from 14.9% in Fiscal 2011, as the decrease in SG&A expenses as a percentage of net revenues more than offset the decline in gross profit margin, as previously discussed.
Operating income and margin for our three business segments is provided below:
|
|
Fiscal Years Ended
|
$
Change
|
Margin
Change
|
|||||||||||||||||
|
|
March 31, 2012
|
April 2, 2011
|
||||||||||||||||||
|
|
Operating
Income
|
Operating
Margin
|
Operating
Income
|
Operating
Margin
|
||||||||||||||||
|
|
(millions)
|
|
(millions)
|
|
(millions)
|
|
||||||||||||||
|
Segment:
|
||||||||||||||||||||
|
Wholesale
|
$
|
654.3
|
|
20.2
|
%
|
$
|
600.6
|
|
21.6
|
%
|
$
|
53.7
|
|
(140 bps)
|
||||||
|
Retail
|
553.1
|
|
16.1
|
%
|
383.8
|
|
14.2
|
%
|
169.3
|
|
190 bps
|
|||||||||
|
Licensing
|
129.0
|
|
71.4
|
%
|
124.0
|
|
69.5
|
%
|
5.0
|
|
190 bps
|
|||||||||
|
1,336.4
|
|
1,108.4
|
|
228.0
|
|
|||||||||||||||
|
Unallocated corporate expenses
|
(284.6
|
)
|
(260.7
|
)
|
(23.9
|
)
|
||||||||||||||
|
Unallocated restructuring charges, net
|
(12.4
|
)
|
(2.6
|
)
|
(9.8
|
)
|
||||||||||||||
|
Total operating income
|
$
|
1,039.4
|
|
15.2
|
%
|
$
|
845.1
|
|
14.9
|
%
|
$
|
194.3
|
|
30 bps
|
||||||
Wholesale operating margin
decreased by
140
basis points, primarily due to lower gross profit margins in the U.S. and Europe, reflecting significant cost of goods increases driven primarily by raw material increases, which more than offset targeted pricing actions. While SG&A expenses as a percentage of net revenues was negatively affected by additional costs incurred to support our new Wholesale business initiatives (including the recent assumption of our previously licensed bedding and bath
|
|
51
|
|
business and the worldwide launch of our new Denim & Supply Ralph Lauren product line), this impact was offset by improved operating leverage on global Wholesale revenues.
Retail operating margin
increased by
190
basis points, primarily as a result of higher gross profit margins due to a more favorable geographic mix and stronger full-price sell-throughs from our retail businesses in Asia, as well as the effect of targeted global pricing actions, which more than offset cost of goods increases and elevated domestic promotional activity during Fiscal 2012. The improvement in operating margin also reflected a decline in SG&A expenses as a percentage of net revenues as increased operating expenses to support the ongoing growth of our international retail business (largely in South Korea) were more than offset by improved operating leverage.
Licensing operating margin
increased by
190
basis points, primarily as a result of higher revenues, as well as lower net costs associated with the transition of our licensed businesses to wholly-owned operations driven by our recently acquired business in South Korea and our previously licensed Home bedding and bath business.
Unallocated corporate expenses
increased by $23.9 million, primarily as a result of an increase in compensation related expenses (including stock-based compensation), rent and occupancy costs, and information technology related costs.
Unallocated restructuring charges, net
increased by $9.8 million to $12.4 million in Fiscal 2012 from $2.6 million in Fiscal 2011. See Notes 12 and 22 to the accompanying audited consolidated financial statements for further discussion of the related charges.
Foreign Currency Losses.
The effect of foreign currency exchange rate fluctuations resulted in a loss of $1.5 million in Fiscal 2012, compared to a loss of $1.4 million in Fiscal 2011. The slightly higher foreign currency losses were primarily due to the timing of the settlement of foreign currency-denominated third-party and intercompany receivables and payables (that were not of a long-term investment nature), partially offset by $3.6 million of lower losses relating to foreign currency hedge contracts. Foreign currency gains and losses are unrelated to the impact of changes in the value of the U.S. Dollar when operating results of our foreign subsidiaries are translated to U.S. Dollars.
Interest Expense.
Interest expense increased by $6.2 million, or 33.9%, to $24.5 million in Fiscal 2012 from $18.3 million in Fiscal 2011. The increase in interest expense was primarily due to amortization of the loss associated with the termination of an interest rate swap during the first quarter of Fiscal 2012 (see Note 16 to the accompanying audited consolidated financial statements) and unfavorable foreign currency effects due to the performance of the Euro during Fiscal 2012 compared to Fiscal 2011.
Interest and Other Income, net.
Interest and other income, net, increased by $3.3 million, or 42.9%, to $11.0 million in Fiscal 2012 from $7.7 million in Fiscal 2011. This increase was primarily due to higher yields related to our European investment portfolio during Fiscal 2012, as well as the inclusion of pretax income of approximately $1.0 million related to the change in fiscal year of our Japanese subsidiary, Ralph Lauren Corporation Japan (formerly “Polo Ralph Lauren Kabushiki Kaisha”), to conform to our consolidated fiscal-year basis during the first quarter of Fiscal 2012 (see Note 2 to the accompanying audited consolidated financial statements).
Equity in Losses of Equity-Method Investees.
The equity in loss of equity-method investees of $9.3 million and $7.7 million recognized in Fiscal 2012 and Fiscal 2011, respectively, related to our share of losses from our joint venture, the RL Watch Company, which is accounted for under the equity method of accounting.
Provision for Income Taxes.
The provision for income taxes increased by $76.3 million, or 29.6%, to $334.1 million in Fiscal 2012 from $257.8 million in Fiscal 2011. The increase in provision for income taxes was primarily due to a higher overall level of pretax income, as well as an increase in our reported effective tax rate of 170 basis points to 32.9% in Fiscal 2012 from 31.2% in Fiscal 2011. The higher effective tax rate was primarily due to the absence in the current year of tax reserve reductions associated with the conclusion of tax examinations and certain other discrete items that impacted us in Fiscal 2011, as well as a greater proportion of earnings generated in higher-taxed jurisdictions during Fiscal 2012. The effective tax rate differs from statutory rates due to the effect of state and local taxes, tax rates in foreign jurisdictions, and certain nondeductible expenses. Our effective tax rate will change from year to year based on various factors including, but not limited to, the geographic mix of earnings, the timing and amount of foreign dividends, enacted tax legislation, state and local taxes, tax audit findings and settlements, and the interaction of various global tax strategies.
Net Income.
Net income increased by $113.4 million, or 20.0%, to $681.0 million in Fiscal 2012 from $567.6 million in Fiscal 2011. The increase in net income primarily related to the $194.3 million increase in operating income, partially offset by the $76.3 million increase in the provision for income taxes, both as previously discussed.
|
|
52
|
|
Net Income Per Diluted Share.
Net income per diluted share increased by $1.38, or 24.0%, to $7.13 per share in Fiscal 2012 from $5.75 per share in Fiscal 2011. The increase in diluted per share results was due to the higher level of net income, as previously discussed, and the lower weighted-average diluted shares outstanding driven by our share repurchases during Fiscal 2012.
FINANCIAL CONDITION AND LIQUIDITY
Financial Condition
A summary of our financial condition is presented below:
|
March 30,
2013 |
March 31,
2012 |
$
Change |
||||||||||
|
|
(millions)
|
|||||||||||
|
Cash and cash equivalents
|
$
|
973.7
|
|
$
|
671.6
|
|
$
|
302.1
|
|
|||
|
Short-term investments
|
324.7
|
|
515.7
|
|
(191.0
|
)
|
||||||
|
Non-current investments
|
81.0
|
|
99.9
|
|
(18.9
|
)
|
||||||
|
Current portion of long-term debt
|
(266.6
|
)
|
—
|
|
(266.6
|
)
|
||||||
|
Long-term debt
|
—
|
|
(274.4
|
)
|
274.4
|
|
||||||
|
Net cash and investments
(a)
|
$
|
1,112.8
|
|
$
|
1,012.8
|
|
$
|
100.0
|
|
|||
|
Equity
|
$
|
3,784.6
|
|
$
|
3,652.5
|
|
$
|
132.1
|
|
|||
|
(a)
|
“Net cash and investments” is defined as cash and cash equivalents, plus short-term and non-current investments, less total debt.
|
The increase in our net cash and investments position at
March 30, 2013
as compared to
March 31, 2012
was primarily due to our operating cash flows and proceeds from stock option exercises, partially offset by our use of cash to support our common stock repurchases, capital expenditures, and dividend payments during
Fiscal 2013
. In particular, during
Fiscal 2013
, we used
$547.3 million
to repurchase Class A common stock, including shares surrendered for tax withholdings and to make a payment under a prepaid share repurchase program, spent
$276.5 million
for capital expenditures, and made cash dividend payments of
$127.8 million
.
The increase in our equity balance was primarily attributable to our net income and equity issuances made pursuant to stock-based compensation arrangements, partially offset by our share repurchase activity, dividends declared, and other comprehensive loss in
Fiscal 2013
.
Cash Flows
Fiscal 2013
Compared to
Fiscal 2012
|
|
Fiscal Years Ended
|
|
||||||||||
|
|
March 30,
2013 |
March 31,
2012 |
$
Change |
|||||||||
|
|
(millions)
|
|||||||||||
|
Net cash provided by operating activities
|
$
|
1,018.9
|
|
$
|
885.3
|
|
$
|
133.6
|
|
|||
|
Net cash used in investing activities
|
(113.1
|
)
|
(249.6
|
)
|
136.5
|
|
||||||
|
Net cash used in financing activities
|
(594.8
|
)
|
(407.7
|
)
|
(187.1
|
)
|
||||||
|
Effect of exchange rate changes on cash and cash equivalents
|
(8.9
|
)
|
(9.4
|
)
|
0.5
|
|
||||||
|
Net increase in cash and cash equivalents
|
$
|
302.1
|
|
$
|
218.6
|
|
$
|
83.5
|
|
|||
|
|
53
|
|
Net Cash Provided by Operating Activities.
Net cash provided by operating activities increased to
$1.019 billion
during
Fiscal 2013
, as compared to
$885.3 million
during
Fiscal 2012
. This net increase in cash provided by operating activities was primarily driven by:
|
•
|
an increase in net income before depreciation, amortization, stock-based compensation, impairment charges, and other non-cash items; and
|
|
•
|
a net improvement in our working capital, primarily reflecting a smaller increase in inventories than in the prior fiscal year, as increased inventory levels to support our new product offerings, store openings, and new e-commerce sites were partially offset by the timing of inventory receipts, inventory management initiatives, and lower sourcing costs in Fiscal 2013. In addition, accounts receivable declined due to lower wholesale revenues and higher cash collections in Fiscal 2013, resulting in an improvement in days sales outstanding of approximately three days. These increases in cash were largely offset by declines related to income taxes and accounts payable and accrued expenses, primarily related to the timing of payments.
|
Net Cash Used in Investing Activities.
Net cash used in investing activities decreased to
$113.1 million
during
Fiscal 2013
, as compared to
$249.6 million
during
Fiscal 2012
. The net decrease in cash used in investing activities was primarily driven by:
|
•
|
an increase in proceeds from sales and maturities of investments, less cash used to purchase investments. During
Fiscal 2013
, we received net proceeds of
$182.3 million
on our investments, as compared to net proceeds of
$33.0 million
in
Fiscal 2012
.
|
The above increase in cash was partially offset by:
|
•
|
a $10.0 million increase in net cash used to fund our acquisitions and ventures. In Fiscal 2013, we used
$21.7 million
of cash to fund the acquisitions of certain previously licensed businesses and to provide continued funding to our joint venture, the RL Watch Company. In Fiscal 2012, we used
$11.7 million
, primarily to fund the RL Watch Company's operations; and
|
|
•
|
an increase in cash used for capital expenditures. In
Fiscal 2013
, we spent
$276.5 million
for capital expenditures, as compared to
$272.2 million
in
Fiscal 2012
. Our capital expenditures were primarily associated with global retail store expansion and construction, our renovation of department store shop-within-shops, investments in our facilities, and enhancements to our global information technology systems. In Fiscal 2014, we expect to spend between $350 million and $450 million for capital expenditures to support our global retail store expansion, particularly in Asia, the purchase and expansion of our retail e-commerce call center and distribution facility in High Point, North Carolina, continued implementation of a new global operating and financial reporting information technology system and other systems and infrastructure, and department store renovations.
|
Net Cash Used in Financing Activities.
Net cash used in financing activities was
$594.8 million
during
Fiscal 2013
, as compared to
$407.7 million
during
Fiscal 2012
. The net increase in cash used in financing activities was primarily driven by:
|
•
|
an increase in cash used in connection with repurchases of our Class A common stock. During
Fiscal 2013
, we repurchased
3.0 million
shares of Class A common stock at a cost of
$450.0 million
pursuant to our common stock repurchase program, and
0.4 million
shares of Class A common stock at a cost of
$47.3 million
were surrendered or withheld in satisfaction of withholding taxes in connection with the vesting of awards under our 1997 Long-Term Stock Incentive Plan, as amended (the “1997 Incentive Plan”) and our 2010 Long-Term Stock Incentive Plan (the “2010 Incentive Plan”). In addition, during
Fiscal 2013
, we made a
$50.0 million
payment in connection with our Prepaid Share Repurchase Program, as defined within our "
Liquidity"
discussion below. On a comparative basis, during
Fiscal 2012
,
3.2 million
shares of Class A common stock at a cost of
$395.1 million
were repurchased pursuant to our common stock repurchase program, and
0.2 million
shares of Class A common stock at a cost of
$24.3 million
were withheld in satisfaction of withholding taxes in connection with the vesting of awards under our 1997 Incentive Plan and our 2010 Incentive Plan;
|
|
•
|
an increase in cash used to pay dividends. During
Fiscal 2013
, we used
$127.8 million
to pay dividends, as compared to
$74.3 million
during
Fiscal 2012
; and
|
|
•
|
a decrease in cash received from stock option exercises. In Fiscal 2013, we received
$49.6 million
from the exercise of employee stock options, as compared to
$61.5 million
in Fiscal 2012.
|
|
|
54
|
|
Fiscal 2012 Compared to Fiscal 2011
|
|
Fiscal Years Ended
|
$
Change
|
||||||||||
|
|
March 31,
2012
|
April 2,
2011
|
||||||||||
|
|
|
(millions)
|
|
|||||||||
|
Net cash provided by operating activities
|
$
|
885.3
|
|
$
|
688.7
|
|
$
|
196.6
|
|
|||
|
Net cash used in investing activities
|
(249.6
|
)
|
(299.4
|
)
|
49.8
|
|
||||||
|
Net cash used in financing activities
|
(407.7
|
)
|
(512.6
|
)
|
104.9
|
|
||||||
|
Effect of exchange rate changes on cash and cash equivalents
|
(9.4
|
)
|
13.2
|
|
(22.6
|
)
|
||||||
|
Net increase (decrease) in cash and cash equivalents
|
$
|
218.6
|
|
$
|
(110.1
|
)
|
$
|
328.7
|
|
|||
Net Cash Provided by Operating Activities.
Net cash provided by operating activities increased to $885.3 million in Fiscal 2012, as compared to $688.7 million in Fiscal 2011. This net increase in operating cash flow was primarily driven by:
|
•
|
an increase related to income taxes due to the timing of income tax payments;
|
|
•
|
an increase in net income before depreciation, amortization, stock-based compensation, and other non-cash expenses; and
|
|
•
|
an increase related to inventories primarily attributable to the timing of inventory receipts.
|
The above increases in operating cash flow were partially offset by:
|
•
|
a decrease related to accounts payable and accrued liabilities primarily due to the timing of payments; and
|
|
•
|
a decrease related to accounts receivable primarily due to lower cash collections in Fiscal 2012, which resulted in an increase in days sales outstanding compared to Fiscal 2011.
|
Other than the items described above, the changes in operating assets and liabilities were attributable to normal operating fluctuations.
Net Cash Used in Investing Activities.
Net cash used in investing activities was $249.6 million in Fiscal 2012, as compared to $299.4 million of net cash used in investing activities in Fiscal 2011. The net decrease in cash used in investing activities was primarily driven by:
|
•
|
a decrease in net cash used to fund our acquisitions and ventures from $70.9 million in Fiscal 2011 to $11.7 million in Fiscal 2012. In Fiscal 2011, we used $47.0 million to fund the South Korea Licensed Operations Acquisition and $17.0 million to fund the acquisition of certain finite-lived intellectual property rights. Fiscal 2012 activity primarily related to the continued funding of the RL Watch Company; and
|
|
•
|
an increase in proceeds from sales and maturities of investments, less cash used to purchase investments. In Fiscal 2012, we received $1.394 billion of proceeds from sales and maturities of investments and used $1.361 billion to purchase investments. On a comparative basis, in Fiscal 2011, we used $1.244 billion to purchase investments, and received $1.242 billion of proceeds from sales and maturities of investments.
|
The above decrease in cash used in investing activities was partially offset by:
|
•
|
an increase in cash used for capital expenditures. In Fiscal 2012, we spent $272.2 million for capital expenditures, as compared to $255.0 million in Fiscal 2011. Our capital expenditures were primarily associated with global retail store expansion, construction and renovation of department store shop-within-shops, investments in our facilities and enhancements to our global information technology systems.
|
|
|
55
|
|
Net Cash Used in Financing Activities.
Net cash used in financing activities was $407.7 million in Fiscal 2012, as compared to $512.6 million in Fiscal 2011. The net decrease in cash used in financing activities was primarily driven by:
|
•
|
a decrease in cash used in connection with repurchases of our Class A common stock. In Fiscal 2012, 3.2 million shares of Class A common stock at a cost of $395.1 million were repurchased pursuant to our common stock repurchase program, and 0.2 million shares of Class A common stock at a cost of $24.3 million were surrendered or withheld in satisfaction of withholding taxes in connection with the vesting of awards under our 1997 Incentive Plan and our 2010 Incentive Plan. On a comparative basis, in Fiscal 2011, 6.0 million shares of Class A common stock at a cost of $577.8 million were repurchased pursuant to our common stock repurchase program, and 0.2 million shares of Class A common stock at a cost of $16.8 million were surrendered or withheld for taxes.
|
The above decrease in cash used in financing activities was partially offset by:
|
•
|
an increase in cash used to pay dividends. In Fiscal 2012, we used $74.3 million to pay dividends, as compared to $38.5 million in Fiscal 2011, largely due to an increase in the quarterly cash dividend on our common stock from $0.10 per share to $0.20 per share in February 2011; and
|
|
•
|
a decrease in cash received from exercise of stock options. In Fiscal 2012, we received $61.5 million from the exercise of employee stock options, as compared to $88.3 million in Fiscal 2011.
|
Liquidity
Our primary sources of liquidity are the cash flows generated from our operations, the $500 million available under our Global Credit Facility and the availability under our Pan-Asia Credit Facilities (both as defined below), our available cash and cash equivalents and short-term investments, our other investments, and our other available financing options. More than half of our cash and short-term investments held outside the U.S. are in jurisdictions where we intend to permanently reinvest any undistributed earnings to support our continued growth. However, we are not dependent on foreign cash to fund our domestic operations and do not expect to repatriate it to meet our domestic cash needs. Our sources of liquidity are used to fund our ongoing cash requirements, including working capital requirements, global retail store expansion and renovation, construction and renovation of shop-within-shops, investment in technological infrastructure, acquisitions, joint ventures, dividends, debt repayment/repurchase, common stock repurchases, settlement of contingent liabilities (including uncertain tax positions), and other corporate activities. We believe that our existing sources of cash, as well as our ability to access capital markets, will be sufficient to support our operating, capital, and debt service requirements for the foreseeable future, including the ongoing development of our recently acquired businesses and our plans for further business expansion.
As discussed in the
“Debt and Covenant Compliance”
section below, we had no revolving credit borrowings outstanding under our Global Credit Facility or our Pan-Asia Credit Facilities as of
March 30, 2013
. We may elect to draw on our credit facilities or other potential sources of financing for, among other things, a material acquisition, settlement of a material contingency (including uncertain tax positions), or a material adverse business or macroeconomic development, as well as for other general corporate business purposes.
We believe that our Global Credit Facility is adequately diversified with no undue concentrations in any one financial institution. In particular, as of
March 30, 2013
, there were nine financial institutions participating in our Global Credit Facility, with no one participant maintaining a maximum commitment percentage in excess of 16%. We have no reason at this time to believe that the participating institutions will be unable to fulfill their obligations to provide financing in accordance with the terms of the Global Credit Facility and the Pan-Asia Credit Facilities in the event we elect to draw funds in the foreseeable future.
Common Stock Repurchase Program
On August 9, 2012, our Board of Directors approved an expansion of our existing common stock repurchase program that will allow us to repurchase up to an additional
$500 million
of Class A common stock. Repurchases of shares of Class A common stock are subject to overall business and market conditions.
During
Fiscal 2013
, we repurchased
3.0 million
shares of Class A common stock at a cost of
$450.0 million
under our common stock repurchase program. In addition, in March 2013, we prepaid
$50.0 million
under a share repurchase program entered into with a third-party financial institution, in exchange for the right to receive shares of our Class A common stock at the conclusion of a
93
-day repurchase term (the "Prepaid Repurchase Program"). The number of shares to be received at the end of the term is based on the volume-weighted average market price of our Class A common stock over the related
93
-day period, less a discount of
$2.22
per share. The
$50.0 million
payment under the Prepaid Repurchase Program was recorded as a reduction to additional
|
|
56
|
|
paid-in capital in our consolidated balance sheet as of March 30, 2013.
No
shares have been delivered to us pursuant to the Prepaid Repurchase Program as of March 30, 2013. The remaining availability under our common stock repurchase program, including the expansion approved on August 9, 2012 and the
$50.0 million
payment made under the Prepaid Repurchase Program, was approximately
$577 million
as of
March 30, 2013
.
In addition, during
Fiscal 2013
,
0.4 million
shares of Class A common stock at a cost of
$47.3 million
were surrendered or withheld in satisfaction of withholding taxes in connection with the vesting of awards under the 1997 Incentive Plan and the 2010 Incentive Plan.
In Fiscal 2012, we repurchased 3.2 million shares of Class A common stock at a cost of $395.1 million under our common stock repurchase program. In addition, 0.2 million shares of Class A common stock at a cost of $24.3 million were surrendered or withheld in satisfaction of withholding taxes in connection with the vesting of awards issued under the 1997 Incentive Plan and the 2010 Incentive Plan.
In Fiscal 2011, we repurchased 6.0 million shares of Class A common stock at a cost of $577.8 million under our common stock repurchase program, including the repurchase of 1.0 million shares of Class A common stock at a cost of $81.0 million in connection with a secondary stock offering (as discussed in Note 18 to the accompanying audited consolidated financial statements). In addition, in Fiscal 2011, 0.2 million shares of Class A common stock at a cost of $16.8 million were surrendered or withheld in satisfaction of withholding taxes in connection with the vesting of awards issued under the 1997 Incentive Plan.
Dividends
Since 2003, we have maintained a regular quarterly cash dividend program on our common stock. On February 8, 2011, our Board of Directors approved an increase to the quarterly cash dividend on our common stock from $0.10 per share to $0.20 per share. On May 21, 2012, our Board of Directors approved an additional increase to the quarterly cash dividend on our common stock from $0.20 per share to $0.40 per share. Dividends paid amounted to
$127.8 million
,
$74.3 million
, and
$38.5 million
in
Fiscal 2013
,
Fiscal 2012
, and
Fiscal 2011
, respectively.
We intend to continue to pay regular quarterly dividends on our outstanding common stock. However, any decision to declare and pay dividends in the future will be made at the discretion of our Board of Directors and will depend on, among other things, our results of operations, cash requirements, financial condition, and other factors that the Board of Directors may deem relevant, including investment and acquisition opportunities.
Euro Debt
As of
March 30, 2013
, we had €209.2 million principal outstanding of 4.5% notes due October 4, 2013 (the “Euro Debt”). We have the option to redeem all of the outstanding Euro Debt at any time at a price equal to the principal amount plus a premium. We also have the option to redeem all of the outstanding Euro Debt at any time at par plus accrued interest in the event of certain developments involving U.S. tax law. Partial redemption of the Euro Debt is not permitted in either instance. In the event of a change of control, each holder of the Euro Debt has the option to require us to redeem the debt at its principal amount plus accrued interest. The indenture governing the Euro Debt (the “Indenture”) contains certain limited covenants that restrict our ability, subject to specified exceptions, to incur liens or enter into a sale and leaseback transaction for any principal property. The Indenture does not contain any financial covenants.
As of
March 30, 2013
, the carrying value of our Euro Debt was
$266.6 million
, and was classified as short-term debt in our consolidated balance sheet, compared to
$274.4 million
as of
March 31, 2012
, which was classified as long-term debt.
Revolving Credit Facilities
Global Credit Facility
We have a credit facility that provides for a
$500 million
senior unsecured revolving line of credit through March 2016, which is also used to support the issuance of letters of credit (the “Global Credit Facility”). Borrowings under the Global Credit Facility may be denominated in U.S. Dollars and other currencies, including Euros, Hong Kong Dollars, and Japanese Yen. We have the ability to expand the borrowing availability to
$750 million
, subject to the agreement of one or more new or existing lenders under the facility to increase their commitments. There are no mandatory reductions in borrowing ability throughout the
|
|
57
|
|
term of the Global Credit Facility. As of
March 30, 2013
, there were no borrowings outstanding under the Global Credit Facility, and we were contingently liable for
$14.0 million
of outstanding letters of credit.
U.S. Dollar-denominated borrowings under the Global Credit Facility bear interest, at our option, either at (a) a base rate, by reference to the greatest of: (i) the annual prime commercial lending rate of JPMorgan Chase Bank, N.A. in effect from time to time, (ii) the weighted-average overnight Federal funds rate plus 50 basis points, or (iii) the one-month London Interbank Offered Rate (“LIBOR”) plus 100 basis points; or (b) LIBOR, adjusted for the Federal Reserve Board’s Eurocurrency liabilities maximum reserve percentage, plus a spread of 112.5 basis points, subject to adjustment based on our credit ratings (“Adjusted LIBOR”). Foreign currency-denominated borrowings bear interest at Adjusted LIBOR.
In addition to paying interest on any outstanding borrowings under the Global Credit Facility, we are required to pay a commitment fee to the lenders under the Global Credit Facility with respect to the unutilized commitments. The commitment fee rate of 15 basis points under the terms of the Global Credit Facility is subject to adjustment based on our credit ratings.
The Global Credit Facility contains a number of covenants that, among other things, restrict the Company’s ability, subject to specified exceptions, to incur additional debt, incur liens, sell or dispose of assets, merge with or acquire other companies, liquidate or dissolve itself, engage in businesses that are not in a related line of business, make loans, advances, or guarantees, engage in transactions with affiliates, and make investments. The Global Credit Facility also requires the Company to maintain a maximum ratio of Adjusted Debt to Consolidated EBITDAR (the “leverage ratio”) of no greater than 3.75 as of the date of measurement for the four most recent consecutive fiscal quarters. Adjusted Debt is defined generally as consolidated debt outstanding plus eight times consolidated rent expense for the last four consecutive fiscal quarters. Consolidated EBITDAR is defined generally as consolidated net income plus (i) income tax expense, (ii) net interest expense, (iii) depreciation and amortization expense, and (iv) consolidated rent expense.
As of
March 30, 2013
, no Event of Default (as such term is defined pursuant to the Global Credit Facility) has occurred under our Global Credit Facility.
Upon the occurrence of an Event of Default under our Global Credit Facility, the lenders may cease making loans, terminate the Global Credit Facility, and declare all amounts outstanding to be immediately due and payable. The Global Credit Facility specifies a number of events of default (many of which are subject to applicable grace periods), including, among others, the failure to make timely principal, interest, and fee payments or to satisfy the covenants, including the financial covenant described above. Additionally, the Global Credit Facility provides that an Event of Default will occur if Mr. Ralph Lauren, Chairman of the Board and Chief Executive Officer, and entities controlled by the Lauren family fail to maintain a specified minimum percentage of the voting power of our common stock.
Pan-Asia Credit Facilities
During Fiscal 2013, certain of our subsidiaries in Asia entered into uncommitted credit facilities with regional branches of JPMorgan Chase (the “Banks”) that may be used to fund general working capital and corporate needs of our operations in China, Malaysia, South Korea, and Taiwan (the “Pan-Asia Credit Facilities”). Borrowings under the Pan-Asia Credit Facilities are guaranteed by our Company and are granted at the sole discretion of the Banks, subject to availability of the Banks' funds and satisfaction of certain regulatory requirements. The Pan-Asia Credit Facilities do not contain any financial covenants.
The key terms of the Pan-Asia Credit Facilities by country are as follows:
|
•
|
Chinese Credit Facility
- During the first quarter of Fiscal 2013, Ralph Lauren Trading (Shanghai) Co., Ltd. entered into a facility that provides for a revolving line of credit of up to
100 million
Chinese Renminbi (approximately
$16 million
) through
April 10, 2013
. The Chinese Credit Facility may also be used to support bank guarantees. Borrowings bear interest at either (i) at least
95%
of the short-term interest rate published by the People's Bank of China or (ii) a rate based on the Bank's cost of funds, as determined by JPMorgan Chase Bank (China) Company Limited, Shanghai Branch at its discretion based on prevailing market conditions. On April 10, 2013, we renewed our existing Chinese Credit Facility through April 9, 2014, with the same terms and borrowing capacity as the prior facility.
|
|
•
|
Malaysia Credit Facility
- During the third quarter of Fiscal 2013, Ralph Lauren (Malaysia) Sdn Bhd entered into a revolving line of credit of up to
15.9 million
Malaysian Ringgit (approximately
$5 million
) through
September 13, 2013
. Borrowings bear interest at an annual rate based on JPMorgan Chase Bank Berhad's cost of funds, as determined at its discretion based on prevailing market conditions, plus
1.125%
.
|
|
|
58
|
|
|
•
|
South Korea Credit Facility
- During the third quarter of Fiscal 2013, Ralph Lauren (Korea) Ltd. entered into a revolving line of credit of up to
11.3 billion
South Korean Won (approximately
$10 million
) through
October 31, 2013
. Borrowings bear interest at an annual rate based on (i) at least the 91-day South Korea Certificate of Deposit rate plus
1.125%
or (ii) a rate determined by JPMorgan Chase Bank, N.A., Seoul Branch based on its cost of funds, as determined at its discretion based on prevailing market conditions.
|
|
•
|
Taiwan Credit Facility
-
During the third quarter of Fiscal 2013, Ralph Lauren (Hong Kong) Retail Company Limited, Taiwan Branch entered into a revolving line of credit of up to
59.0 million
New Taiwan Dollars (approximately
$2 million
) through
October 23, 2013
. Borrowings bear interest at an annual rate based on JPMorgan Chase Bank, N.A., Taipei Branch's cost of funds, as determined at its discretion based on prevailing market conditions, plus
1.125%
.
|
As of
March 30, 2013
, there were
no
borrowings outstanding under any of our Pan-Asia Credit Facilities.
Contractual and Other Obligations
Firm Commitments
The following table summarizes certain of our aggregate contractual obligations as of
March 30, 2013
, and the estimated timing and effect that such obligations are expected to have on our liquidity and cash flow in future periods. We expect to fund these firm commitments with operating cash flows generated in the normal course of business and, if necessary, availability under our credit facilities or other potential sources of financing.
|
Fiscal
2014
|
Fiscal
2015-2016
|
Fiscal
2017-2018
|
Fiscal
2019 and
Thereafter
|
Total
|
||||||||||||||||
|
|
(millions)
|
|||||||||||||||||||
|
Euro Debt
|
$
|
267.4
|
|
$
|
—
|
|
$
|
—
|
|
$
|
—
|
|
$
|
267.4
|
|
|||||
|
Interest payments on Euro Debt
|
12.0
|
|
—
|
|
—
|
|
—
|
|
12.0
|
|
||||||||||
|
Capital leases
|
8.1
|
|
15.8
|
|
13.9
|
|
26.6
|
|
64.4
|
|
||||||||||
|
Operating leases
|
279.9
|
|
546.1
|
|
465.7
|
|
887.8
|
|
2,179.5
|
|
||||||||||
|
Inventory purchase commitments
|
837.3
|
|
—
|
|
—
|
|
—
|
|
837.3
|
|
||||||||||
|
Other commitments
|
90.4
|
|
8.5
|
|
2.2
|
|
1.1
|
|
102.2
|
|
||||||||||
|
Total
|
$
|
1,495.1
|
|
$
|
570.4
|
|
$
|
481.8
|
|
$
|
915.5
|
|
$
|
3,462.8
|
|
|||||
The following is a description of our material, firmly committed obligations as of
March 30, 2013
:
|
•
|
Euro Debt
represents the principal amount due at maturity of our outstanding Euro Debt on a U.S. Dollar-equivalent basis. Amounts do not include any fair value adjustments, call premiums, or interest payments (see below);
|
|
•
|
Interest payments on Euro Debt
represent the annual contractual interest payments due on our Euro Debt;
|
|
•
|
Lease obligations
represent the minimum lease rental payments due under noncancelable leases for our real estate and operating equipment in various locations around the world. Approximately 60% of these lease obligations relates to our retail operations. Information has been presented separately for operating and capital leases. In addition to such amounts, we are normally required to pay taxes, insurance, and occupancy costs relating to our leased real estate properties, which are not included in the table above;
|
|
•
|
Inventory purchase
commitments represent our legally-binding agreements to purchase fixed or minimum quantities of goods at determinable prices; and
|
|
•
|
Other commitments
primarily represent our legally-binding obligations under sponsorship, licensing, and other marketing and advertising agreements; information technology-related service agreements; capital projects; and pension-related obligations.
|
Excluded from the above contractual obligations table is the non-current liability for unrecognized tax benefits of
$150.2 million
as of
March 30, 2013
, as we cannot make a reliable estimate of the period in which the liability will be settled, if ever. The above table also excludes the following: (i) amounts recorded in current liabilities in our consolidated balance sheet as of
March 30, 2013
, which will be paid within one year; and (ii) non-current liabilities that have no cash outflows associated with them (e.g.,
|
|
59
|
|
deferred revenue), or the cash outflows associated with them are uncertain or do not represent a “purchase obligation” as the term is used herein (e.g., deferred taxes and other miscellaneous items).
We also have certain contractual arrangements that would require us to make payments if certain events or circumstances occur. See Note 17 to the accompanying audited consolidated financial statements for a description of our contingent commitments not included in the above table.
Off-Balance Sheet Arrangements
In addition to the commitments included in the above table, our other off-balance sheet firm commitments, which include outstanding letters of credit and minimum funding commitments to investees, amounted to approximately $15 million as of
March 30, 2013
. We do not maintain any other off-balance sheet arrangements, transactions, obligations, or other relationships with unconsolidated entities that would be expected to have a material current or future effect on our consolidated financial statements.
MARKET RISK MANAGEMENT
We are exposed to a variety of risks, including changes in foreign currency exchange rates relating to certain anticipated cash flows from our international operations and possible declines in the value of reported net assets of certain of our foreign operations, as well as changes in the fair value of our fixed-rate debt relating to changes in interest rates. Consequently, in the normal course of business, we employ established policies and procedures, including the use of derivative financial instruments, to manage such risks. We do not enter into derivative transactions for speculative or trading purposes.
As a result of the use of derivative instruments, we are exposed to the risk that counterparties to our derivative contracts will fail to meet their contractual obligations. To mitigate such counterparty credit risk, we have a policy of only entering into contracts with carefully selected financial institutions based upon evaluation of their credit ratings and other financial factors. Our established policies and procedures for mitigating credit risk on derivative transactions include reviewing and assessing the creditworthiness of our counterparties. We also enter into master netting arrangements with counterparties when possible to mitigate credit risk associated with our derivative instruments. As a result of the above considerations, we do not believe that we are exposed to any undue concentration of counterparty risk with respect to our derivative contracts as of
March 30, 2013
. However, we do have in aggregate approximately $12 million of derivative instruments in net asset positions with seven creditworthy financial institutions.
Foreign Currency Risk Management
We manage our exposure to changes in foreign currency exchange rates through the use of foreign currency exchange derivative contracts. Refer to Note 16 to the accompanying audited consolidated financial statements for a summary of the notional amounts and fair values of our foreign currency exchange contracts outstanding as of
March 30, 2013
.
Forward Foreign Currency Exchange Contracts
From time to time, we may enter into forward foreign currency exchange contracts as hedges to reduce our risk related to exchange rate fluctuations on inventory purchases, intercompany royalty payments made by certain of our international operations, intercompany contributions made to fund certain marketing efforts of our international operations, interest payments made in connection with outstanding debt, and other foreign currency-denominated operational cash flows. As part of our overall strategy to manage the level of exposure to the risk of foreign currency exchange rate fluctuations, primarily to changes in the value of the Euro, the Japanese Yen, the Hong Kong Dollar, the South Korean Won, and the British Pound Sterling, we hedge a portion of our foreign currency exposures anticipated over a two-year period. In doing so, we use forward foreign currency exchange contracts that generally have maturities of three months to two years to provide continuing coverage throughout the hedging period.
Our foreign exchange risk management activities are governed by policies and procedures approved by our Audit Committee. These policies and procedures provide a framework that allows for the management of currency exposures while ensuring the activities are conducted within our established guidelines. Our policies include guidelines for the organizational structure of our risk management function and for internal controls over foreign exchange risk management activities, including but not limited to, authorization levels, transactional limits, and credit quality controls, as well as various measurements for monitoring compliance. We monitor foreign exchange risk using different techniques, including a periodic review of market values and sensitivity analyses.
|
|
60
|
|
We record our forward foreign currency exchange contracts at fair value in our consolidated balance sheets. To the extent forward foreign currency exchange contracts designated as cash flow hedges at hedge inception are highly effective in offsetting changes in the value of the hedged item, the related gains or losses are initially deferred in equity as a component of accumulated other comprehensive income (“AOCI”) and are subsequently recognized in our consolidated statements of income as follows:
|
•
|
Forecasted Inventory Purchases
— Recognized as part of the cost of the inventory being hedged within cost of goods sold when the related inventory is sold to a third party.
|
|
•
|
Intercompany Royalty Payments and Marketing Contributions
— Recognized within foreign currency gains (losses) in the period in which the related royalties or marketing contributions being hedged are received or paid.
|
|
•
|
Interest Payments on Euro Debt
— Recognized within foreign currency gains (losses) in the period in which the recorded liability impacts earnings
due to foreign currency exchange remeasurement.
|
We recognized net gains on forward foreign currency exchange contracts in earnings of approximately
$32 million
and
$10 million
during
Fiscal 2013
and
Fiscal 2011
, respectively, and net losses of approximately
$4 million
during
Fiscal 2012
.
Sensitivity
We perform a sensitivity analysis to determine the effects that market risk exposures may have on the fair values of our derivative financial instruments. To perform the sensitivity analysis, we assess the risk of loss in fair values from the effect of hypothetical changes in foreign currency exchange rates. This analysis assumes a like movement by the foreign currencies in our hedge portfolio against the U.S. Dollar. As of
March 30, 2013
, a 10% devaluation of the U.S. Dollar against the exchange rates for foreign currencies under contract would result in a net decline of approximately $18 million in the fair value of our derivative portfolio. As our outstanding foreign currency exchange contracts are primarily designated as cash flow hedges of forecasted transactions, this hypothetical change in fair value would be largely offset by changes in the fair value of the underlying hedged items.
Hedge of Net Investment in Certain European Subsidiaries
As of
March 30, 2013
, €109.2 million of our Euro Debt's principal amount of €209.2 million was designated as a hedge of our net investment in certain of our European subsidiaries. Changes in the fair value of a derivative instrument or foreign currency-related changes in the carrying value of a non-derivative financial instrument (such as debt) that is designated as a hedge of a net investment in a foreign operation are reported in the same manner as a translation adjustment, to the extent it is effective as a hedge. As such, changes in the designated portion of the Euro Debt's carrying value resulting from changes in the Euro exchange rate have been, and continue to be, reported in equity as a component of AOCI, as the debt has been a highly effective hedge. We recorded the translation of the designated portion of the Euro Debt to U.S. Dollars within other comprehensive income (loss), resulting in gains of approximately
$11 million
and
$16 million
in
Fiscal 2013
and
Fiscal 2012
, respectively, and a loss of
$13 million
in
Fiscal 2011
. Refer to Note 16 to the accompanying audited consolidated financial statements for further information.
Interest Rate Risk Management
During the first quarter of Fiscal 2011, we entered into a fixed-to-floating interest rate swap with an aggregate notional amount of €209.2 million, which was designated as a fair value hedge to mitigate our exposure to changes in the fair value of our Euro Debt due to changes in the benchmark interest rate. The interest rate swap was executed to swap the 4.5% fixed interest rate on our Euro Debt for a variable interest rate. On April 11, 2011, we terminated the interest rate swap agreement at a loss of $7.6 million. The related fair value adjustment to the carrying value of our Euro Debt is being recognized within interest expense over the remaining term of the debt, through October 4, 2013. During both
Fiscal 2013
and
Fiscal 2012
,
$3.0 million
of this fair value adjustment was recognized as interest expense within our consolidated statements of income.
Sensitivity
As of
March 30, 2013
, we had no variable-rate debt outstanding. As such, our exposure to changes in interest rates primarily related to our fixed-rate Euro Debt. As of
March 30, 2013
, the carrying value of our Euro Debt was
$266.6 million
and the fair value was
$271.6 million
. A 25 basis point increase or decrease in the level of interest rates would decrease or increase, respectively, the fair value of our Euro Debt by less than $1 million. Such potential increases or decreases are based on certain simplifying assumptions, including no changes in Euro currency exchange rates and an immediate across-the-board increase or decrease in the level of interest rates with no other subsequent changes for the remainder of the period.
|
|
61
|
|
Investment Risk Management
As of
March 30, 2013
, we had cash and cash equivalents on-hand of
$973.7 million
, primarily invested in money market funds, time deposits, and treasury bills with original maturities of 90 days or less. Our other significant investments included
$324.7 million
of short-term investments, primarily in time deposits, government bonds, corporate bonds, and variable rate municipal securities with original maturities greater than 90 days; $41.9 million of restricted cash placed in escrow with certain banks as collateral primarily to secure guarantees in connection with certain international tax matters;
$78.7 million
of investments with maturities greater than one year; and
$2.3 million
of auction rate securities issued through a municipality.
We actively monitor our exposure to changes in the fair value of our global investment portfolio in accordance with our established policies and procedures, which include monitoring both general and issuer-specific economic conditions, as discussed further below. As of
March 30, 2013
, we do not hold any investments in sovereign debt securities issued by Greece, Ireland, Portugal, Spain, or Italy. See Note 16 to the accompanying audited consolidated financial statements for further detail of the composition of our investment portfolio as of
March 30, 2013
.
We evaluate investments held in unrealized loss positions for other-than-temporary impairment on a quarterly basis. Such evaluation involves a variety of considerations, including assessments of risks and uncertainties associated with general economic conditions and distinct conditions affecting specific issuers. We consider the following factors: (i) the length of time and the extent to which the fair value has been below cost, (ii) the financial condition, credit worthiness, and near-term prospects of the issuer, (iii) the length of time to maturity, (iv) future economic conditions and market forecasts, (v) our intent and ability to retain our investment for a period of time sufficient to allow for recovery of market value, and (vi) an assessment of whether it is more likely than not that we will be required to sell our investment before recovery of market value.
CRITICAL ACCOUNTING POLICIES
An accounting policy is considered to be critical if it is important to our financial condition and results of operations and requires significant judgment and estimates on the part of management in its application. Our estimates are often based on complex judgments, probabilities, and assumptions that management believes to be reasonable, but that are inherently uncertain and unpredictable. It is also possible that other professionals, applying reasonable judgment to the same facts and circumstances, could develop and support a range of alternative estimated amounts. We believe that the following list represents our critical accounting policies. For a discussion of all of our significant accounting policies, see
Note 3
to the accompanying audited consolidated financial statements.
Sales Reserves and Uncollectible Accounts
A significant area of judgment affecting reported revenue and net income involves estimating sales reserves, which represent the portion of gross revenues not expected to be realized. In particular, wholesale revenue is reduced by estimates of returns, discounts, end-of-season markdowns, and operational chargebacks. Retail revenue, including e-commerce sales, also is reduced by estimates of returns.
In determining estimates of returns, discounts, end-of-season markdowns, and operational chargebacks, we analyze historical trends, seasonal
results
, current economic and market conditions, and retailer performance. We review and refine these estimates on a quarterly basis. Our historical estimates of these costs have not differed materially from actual results. A hypothetical 1% increase in our reserves for returns, discounts, end-of-season markdowns, and operational chargebacks as of March 30, 2013 would have decreased our Fiscal 2013 net revenues by approximately $2 million.
Similarly, we evaluate accounts receivable to determine if they will ultimately be collected. Significant judgments and estimates are involved in this
evaluation
, including an analysis of specific risks on a customer-by-customer basis for larger accounts and customers, and a receivables aging analysis that determines the percentage of receivables that has historically been uncollected by aged category. Based on this information, we provide a reserve for the estimated amounts believed to be uncollectible. Although we believe that we have adequately provided for those risks as part of our bad debt reserve, a severe and prolonged adverse impact on our major customers’ business operations could have a corresponding material adverse effect on our net sales, cash flows, and/or financial condition.
See “Accounts Receivable” in
Note 3
to the accompanying audited consolidated financial statements for an analysis of the activity in our sales reserves and allowance for doubtful accounts for each of the three fiscal years presented.
|
|
62
|
|
Inventories
We hold inventory that is sold through wholesale distribution channels to major department stores and specialty retail stores, including our own retail stores. We also hold retail inventory that is sold in our own stores and e-commerce sites directly to consumers. Wholesale and retail inventories are stated at the lower of cost or estimated realizable value, with cost primarily determined on a weighted-average cost basis.
We continuously evaluate the composition of our inventories, assessing slow-turning product and fashion product. Estimated realizable value of
inventory
is determined based on an analysis of historical sales trends of our individual product lines, the impact of market trends and economic conditions, and a forecast of future demand, giving consideration to the value of current orders in-house relating to the future sales of inventory. Estimates may differ from actual results due to quantity, quality, and mix of products in inventory, consumer and retailer preferences, and market conditions. Our historical estimates of these costs and the provisions have not differed materially from actual results.
Reserves for inventory
shrinkage
, representing the risk over physical loss of inventory, are estimated based on historical experience and are adjusted based upon physical inventory counts.
A hypothetical 1%
increase
in our inventory reserves as of March 30, 2013 would have decreased our Fiscal 2013 gross profit by less than $1 million.
Business Combinations
In connection with our business combinations (whether partial, full, or step acquisitions), we are required to record all of the assets and liabilities of the acquired business at fair value; recognize contingent consideration at fair value on the acquisition date; and, for certain arrangements, recognize changes in fair value in earnings until settlement. These fair value determinations require our judgment and may involve the use of significant estimates and assumptions, including assumptions with respect to future cash inflows and outflows, discount rates, asset lives, and market multiples, among other items. We may utilize independent valuation firms to assist in these determinations of fair value.
In addition, in connection with our business acquisitions, we evaluate the terms of any pre-existing relationships to determine if a settlement of the pre-existing relationship exists. These pre-existing relationships primarily relate to licensing agreements. If the terms of the pre-existing
relationships
were determined to not be reflective of market, a settlement gain or loss would be recognized in earnings, measured by the amount by which the contract is favorable or unfavorable to us when compared with pricing for current market transactions for the same or similar items. We allocate the aggregate consideration exchanged in these transactions between the value of the business acquired and the value of the settlement of any pre-existing relationships in proportion to estimates of their respective fair values. Accordingly, significant judgment is required to determine the respective fair values of the business acquired and the value of the settlement of the pre-existing relationship. We may utilize independent valuation firms to assist in the determination of fair value.
Fair Value Measurements
We use judgment when evaluating the inputs used to determine the fair value of a particular asset or liability as of the measurement date, notably the extent to which the inputs are market-based (observable) or internally-derived (unobservable). See
Note 15
to the accompanying audited consolidated financial statements for further discussion of our fair value measurements.
The fair value of derivative assets and liabilities is determined using a pricing model, which is primarily based on market observable external inputs,
including
forward and spot exchange rates for foreign currencies, and considers the impact of our credit risk, if any. Changes in counterparty credit risk are also considered in the valuation of derivative financial instruments. Refer to "
Market Risk Management
" for a discussion of the sensitivity of our derivative financial instruments to changes in foreign currency exchange rates.
Our Euro Debt is recorded at carrying value in our consolidated balance sheets, adjusted for foreign currency fluctuations, any unamortized discount, and changes in fair value hedged by a related interest rate swap (including any unamortized fair value adjustment associated with the early termination of such swap), as applicable, which may differ from its fair value (see
Note 16
to the accompanying audited consolidated financial statements). The fair value of our Euro Debt is estimated based on external pricing data, including available quoted market prices
of
the Euro Debt and of comparable European debt instruments with similar interest rates, credit ratings, and trading frequency, among other factors. Refer to "
Market Risk Management
" for a discussion of the sensitivity of our Euro Debt's fair value to changes in interest rates.
|
|
63
|
|
Impairment of Goodwill and Other Intangible Assets
Goodwill, including any goodwill included in the carrying value of investments accounted for using the equity method of accounting, and certain other intangible assets deemed to have indefinite useful lives, are not amortized. Rather, goodwill and such indefinite-lived intangible assets are assessed for impairment at least annually. Finite-lived intangible assets are amortized over their respective estimated useful lives and, along with other long-lived assets, are evaluated for impairment periodically whenever events or changes in circumstances indicate that their related carrying amounts may not be recoverable.
We perform our annual goodwill impairment assessment using a qualitative approach to determine whether it is more likely than not that the fair value of a reporting unit is less than its carrying value. In performing the qualitative assessment, we identify and consider the significance of relevant key factors, events, and circumstances that affect the fair value of our reporting units. These factors include external factors
such
as macroeconomic, industry, and market conditions, as well as entity-specific factors, such as our actual and planned financial performance. We also give consideration to the difference between each reporting unit's fair value and carrying value as of the most recent date a fair value measurement was performed. If the results of the qualitative assessment conclude that it is not more likely than not that the fair value of a reporting unit exceeds its carrying value, additional quantitative impairment testing is performed.
The quantitative goodwill impairment test, if necessary, is a two-step process. The first step of the quantitative goodwill impairment test is to identify the existence of potential impairment by comparing the fair value of a reporting unit with its net book value (or carrying value), including goodwill. If the fair value of a reporting unit exceeds its carrying value, the reporting unit's goodwill is considered not to be impaired and performance of the second step of the quantitative goodwill impairment test is unnecessary. If the carrying
value
of a reporting unit exceeds its fair value, the second step of the goodwill impairment test is performed to measure the amount of impairment loss, if any. The second step of the goodwill impairment test compares the implied fair value of the reporting unit’s goodwill with the carrying value of that goodwill. If the carrying value of the reporting unit’s goodwill exceeds the implied fair value of that goodwill, an impairment loss is recognized in an amount equal to that excess. The implied fair value of goodwill is determined in the same manner as the amount of goodwill recognized in a business combination. That is, the fair value of the reporting unit is allocated to all of the assets and liabilities of that unit (including any unrecognized intangible assets) as if the reporting unit had been acquired in a business combination and the fair value was the purchase price paid to acquire the reporting unit.
Determining the fair value of a reporting unit under the first step of the quantitative goodwill impairment test and determining the fair value of individual assets and liabilities of a reporting unit (including unrecognized intangible assets) under the second step of the quantitative goodwill impairment test is judgmental in nature and often involves the use of significant estimates and assumptions. Similarly, estimates and
assumptions
are used in determining the fair value of other intangible assets. These estimates and assumptions could have a significant impact on whether or not an impairment charge is recognized and the magnitude of any such charge. To assist management in the process of determining goodwill impairment, we may review and consider appraisals from independent valuation firms. Estimates of fair value are primarily determined using discounted cash flows, market comparisons, and recent transactions. These approaches use significant estimates and assumptions, including projected future cash flows (including timing), discount rates reflecting the risks inherent in future cash flows, perpetual growth rates, and determination of appropriate market comparables.
We performed our annual impairment assessment of goodwill during the second quarter of
Fiscal 2013
using the qualitative approach discussed above. Based on the results of the
impairment
assessment performed as of July 1, 2013, we concluded that it is more likely than not that the fair values of our reporting units significantly exceeded their respective carrying values and there were no reporting units at risk of impairment. Additionally, there have been no impairment charges recorded in connection with the assessment of the recoverability of goodwill during any of the three fiscal years presented.
In evaluating finite-lived intangible assets for
recoverability
, we use our best estimate of future cash flows expected to result from the use of the asset and eventual disposition. To the extent that estimated future undiscounted net cash flows attributable to the asset are less than the carrying value, an impairment loss is recognized equal to the difference between the carrying value of such asset and its fair value.
In Fiscal 2013, we recorded
aggregate
impairment charges of $1.7 million related to the write-off of certain finite-lived and indefinite-lived intangible assets in connection with the Rugby Closure Plan. There were no other intangible asset impairment charges recorded during any of the three fiscal years presented.
|
|
64
|
|
Impairment of Other Long-Lived Assets
Property and equipment, along with other long-lived assets, are evaluated for impairment periodically whenever events or changes in circumstances indicate that their related carrying amounts may not be recoverable. In evaluating long-lived assets for recoverability, we use our best
estimate
of future cash flows expected to result from the use of the asset and its eventual disposition. To the extent that estimated future undiscounted net cash flows attributable to the asset are less than the carrying amount, an impairment loss is recognized equal to the difference between the carrying value of such asset and its fair value, considering external market participant assumptions. Assets to be disposed of and for which there is a committed plan of disposal are reported at the lower of carrying value or fair value, less costs to sell.
In determining future cash flows, we take various factors into account, including changes in merchandising strategy, the emphasis on retail store cost controls, the
effects
of macroeconomic trends such as consumer spending, and the impacts of more experienced retail store managers and increased local advertising. Since the determination of future cash flows is an estimate of future performance, there may be future impairments in the event that future cash flows do not meet expectations.
During
Fiscal 2013
,
Fiscal 2012
, and
Fiscal 2011
, we recorded non-cash impairment charges of
$19.0 million
(including the $1.7 million of previously discussed charges related to the write-off
of
certain intangible assets in connection with the Rugby Closure Plan),
$2.2 million
, and
$2.5 million
, respectively, to reduce the net carrying value of certain long-lived assets, primarily in our Retail segment, to their estimated fair values. See
Note 11
to the accompanying audited consolidated financial statements for further discussion.
Income Taxes
In determining our income tax provision for financial reporting purposes, we establish a reserve for uncertain tax positions. If we consider that a tax position is “more likely than not” of being sustained upon audit, based solely on the technical merits of the position, we recognize the tax benefit. We measure the tax benefit by determining the largest amount that is greater than 50% likely of being realized upon settlement,
presuming
that the tax position is examined by the appropriate taxing authority that has full knowledge of all relevant information. These assessments can be complex and require significant judgment, and we often obtain assistance from external advisors. To the extent that our estimates may change or the final tax outcome of these matters is different than the amounts recorded, such differences will impact the income tax provision in the period in which such determinations are made. If the initial assessment fails to result in the recognition of a tax benefit, we regularly monitor our position and subsequently recognize the tax benefit if (i) there are changes in tax law or analogous case law that sufficiently raise the likelihood of prevailing on the technical merits of the position to more likely than not; (ii) the statute of limitations expires; or (iii) there is a completion of an audit resulting in a settlement of that tax year with the appropriate agency.
Deferred income taxes reflect the tax effect of certain net operating loss, capital loss, general business credit carryforwards, and the net tax effects of temporary differences between the carrying amount of assets and liabilities for financial statement and income tax purposes, as determined under
enacted
tax laws and rates. Valuation allowances are established when management determines that it is “more likely than not” that some portion or all of a deferred tax asset will not be realized. Tax valuation allowances are analyzed periodically by assessing the adequacy of future expected taxable income, which typically involves the significant use of estimates. Such allowances are adjusted as events occur, or circumstances change, that warrant adjustments to those balances.
See
Note 13
to the accompanying audited
consolidated
financial statements for further discussion of income taxes.
Contingencies
We are periodically exposed to various contingencies in the ordinary course of conducting our business, including certain litigation, alleged information system security
breach
matters, contractual disputes, employee relation matters, various tax or other governmental audits, and trademark and intellectual property matters and disputes. We record a liability for such contingencies to the extent that we conclude their occurrence is probable and the related losses are estimable. In addition, if it is reasonably possible that an unfavorable settlement of a contingency could exceed the established liability, we disclose the estimated impact on our liquidity, financial condition, and results of operations, if practicable. Management considers many factors in making these assessments. As the ultimate resolution of contingencies is inherently unpredictable, these assessments can involve a series of complex judgments about future events including, but not limited to, court rulings, negotiations between affected parties, and governmental actions. As a result, the accounting for loss contingencies relies heavily on estimates and assumptions.
|
|
65
|
|
Stock-Based Compensation
We expense all stock-based payments to
employees
and non-employee directors based on the grant date fair value of the awards over the requisite service period, adjusted for estimated forfeitures.
Stock Options
Stock options are granted to employees and non-employee directors with exercise prices equal to the fair market value of our common stock on the date of grant. We use the Black-Scholes option-pricing model to estimate the fair value of stock options granted, which requires the use of subjective assumptions. Certain key assumptions involve estimating future uncertain events. The key factors influencing the estimation process include the expected term of the option, expected volatility of our stock price, our expected dividend yield, and the risk-free interest rate, among others. Generally, once stock option values are determined, accounting practices do not permit them to be changed, even if the estimates used are different from actual results.
Restricted Stock and Restricted Stock Units (“RSUs”)
We grant restricted shares of Class A common stock and service-based RSUs to certain of our senior executives and non-employee directors. In addition, we grant performance-based RSUs to such senior executives and other key executives, and certain of our other employees. The fair values
of
restricted stock shares and RSUs are based on the fair value of our unrestricted Class A common stock, adjusted to reflect the absence of dividends for those restricted securities that are not entitled to dividend equivalents. Compensation expense for performance-based RSUs is recognized over the related service period when attainment of the performance goals is deemed probable, which involves judgment as to achievement of certain performance metrics.
Our performance-based RSU awards with a market condition in the form of a total shareholder return ("TSR") modifier are valued based on the expected
attainment
of performance at the end of a three-year performance period and TSR achieved relative to the S&P 500 index over the performance period. The fair value of these awards is estimated using a Monte Carlo simulation valuation model prepared by an independent third party. The model utilizes multiple input variables that determine the probability of satisfying each market condition stipulated in the terms of the grant to calculate the fair value of these awards. Compensation expense, net of forfeitures, is updated for the expected net income performance against the related goal at the end of each reporting period.
Sensitivity
The assumptions used in calculating the fair value of stock-based compensation awards represent our best estimates. In addition, judgment is required in estimating the number of stock-based awards that are expected to be forfeited. If actual results differ significantly from our estimates and assumptions, if we change the assumptions used to estimate the grant date fair value for future stock-based award grants, or if there are changes in market conditions, stock-based compensation expense and therefore our results of operations could be materially impacted. A hypothetical 10% change in our stock-based compensation expense would have affected our Fiscal 2013 net income by approximately $6 million.
RECENTLY ISSUED ACCOUNTING STANDARDS
See
Note 4
to the accompanying audited consolidated financial statements for a description of certain recently issued or proposed accounting standards which may impact our financial statements in future reporting periods.
|
Item 7A.
|
Quantitative and Qualitative Disclosures about Market Risk.
|
For a discussion of our exposure to market risk, see “Market Risk Management” in Item 7 included elsewhere in this Annual Report on Form 10-K.
|
Item 8.
|
Financial Statements and Supplementary Data.
|
See the “Index to Consolidated Financial Statements” appearing at the end of this Annual Report on Form 10-K.
|
|
66
|
|
|
Item 9.
|
Changes in and Disagreements with Accountants on Accounting and Financial Disclosure.
|
Not applicable.
|
Item 9A.
|
Controls and Procedures.
|
(a) Evaluation of Disclosure Controls and Procedures
Disclosure controls and procedures are the controls and other procedures of an issuer that are designed to provide reasonable assurance that information required to be disclosed by the issuer in the reports that it files or submits under the Securities Exchange Act of 1934 is recorded, processed, summarized, and reported within the time period specified in the Securities and Exchange Commission’s rules and forms. Disclosure controls and procedures include, without limitation, controls and procedures designed to ensure that material information required to be disclosed by an issuer in the reports that it files or submits under the Securities Exchange Act of 1934 is accumulated and communicated to the issuer’s management, including its principal executive and principal financial officers, or persons performing similar functions, as appropriate to allow timely decisions regarding required disclosure.
We have evaluated, under the supervision and with the participation of management, including our Chief Executive Officer and Chief Financial Officer, the effectiveness of our disclosure controls and procedures, as defined in Rules 13a-15(e) and 15d-15(e) of the Securities Exchange Act of 1934, as of the end of the fiscal year covered by this annual report. Based on that evaluation, our Chief Executive Officer and Chief Financial Officer have concluded that the Company’s disclosure controls and procedures were effective at the reasonable assurance level, as of the fiscal year-end covered by this Annual Report on Form 10-K.
(b)
Management’s
Report of Internal Control Over Financial Reporting
Management is responsible for establishing and maintaining adequate internal control over financial reporting, as defined in Securities Exchange Act Rule 13a-15(f). Internal control over financial reporting is designed to provide reasonable assurance regarding the reliability of financial reporting and preparation of financial statements for external purposes in accordance with U.S. Generally Accepted Accounting Principles. Internal control over financial reporting includes maintaining records that in reasonable detail accurately and fairly reflect our transactions; providing reasonable assurance that transactions are recorded as necessary for preparation of our financial statements; providing reasonable assurance that receipts and expenditures of the Company’s assets are made in accordance with management authorization; and providing reasonable assurance that unauthorized acquisition, use or disposition of the Company’s assets that could have a material effect on our financial statements would be prevented or detected on a timely basis. Because of its inherent limitations, internal control over financial reporting is not intended to provide absolute assurance that a misstatement of our financial statements would be prevented or detected. Further, the evaluation of the effectiveness of internal control over financial reporting was made as of a specific date, and continued effectiveness in future periods is subject to the risks that controls may become inadequate because of changes in conditions or that the degree of compliance with the policies and procedures may decline.
Under the supervision and with the participation of management, including our Chief Executive Officer and Chief Financial Officer, we conducted an evaluation of the effectiveness of our internal control over financial reporting as of the end of the fiscal year covered by this report based on the framework issued by the Committee of Sponsoring Organizations of the Treadway Commission in Internal Control-Integrated Framework. Based on this evaluation, management concluded that the Company’s internal controls over financial reporting were effective at the reasonable assurance level as of the fiscal year-end covered by this Annual Report on Form 10-K.
Ernst & Young LLP, the Company’s independent registered public accounting firm, has issued an attestation report on the Company’s internal control over financial reporting as included elsewhere herein.
(c) Changes in
Internal
Controls over Financial Reporting
Except as discussed below, there has been no change in our internal control over financial reporting during the fourth quarter of
Fiscal 2013
that has materially affected, or is reasonably likely to materially affect, the Company’s internal control over financial reporting.
|
|
67
|
|
Global Operating and Financial Reporting System Implementation
We are in the process of implementing a new global operating and financial reporting information technology system as part of a multi-year plan to integrate and upgrade our systems and processes. The implementation of this global system is scheduled to occur in phases over the next several years. During the fourth quarter of
Fiscal 2013
, we continued to develop and enhance those operational and financial systems previously transitioned to the new global operating and financial reporting system. The next phase of this implementation effort involves the migration of certain core areas of our business to the new system, including global merchandise procurement, and customer order management and record-to-report for our North American wholesale operations, beginning in fiscal year 2014.
As the phased implementation of this new system occurs, we are experiencing certain changes to our processes and procedures which, in turn, result in changes in internal control over financial reporting. While we expect this new system to strengthen our internal financial controls by automating manual processes and standardizing business processes across our organization, management will continue to evaluate and monitor our internal controls as processes and procedures in each of the affected areas evolve. For a discussion of risks related to the implementation of new systems, see Item 1A —
“Risk Factors
—
Risks Related to Our Business — Implementation of management information systems may negatively impact our business.”
|
Item 9B.
|
Other Information.
|
Not applicable.
|
|
68
|
|
|
Item 10.
|
Directors, Executive Officers and Corporate Governance.
|
Information relating to our directors and corporate governance will be set forth in the Company’s proxy statement for its
2013
annual meeting of stockholders to be filed within 120 days after
March 30, 2013
(the “Proxy Statement”) and is incorporated by reference herein. Information relating to our executive officers is set forth in Item 1 of this Annual Report on Form 10-K under the caption
“Executive Officers
.”
The Company has a Code of Ethics for Principal Executive Officers and Senior Financial Officers that applies to our principal executive officer, our principal operating officer, our principal financial officer, our principal accounting officer and our controller. You can find our Code of Ethics for Principal Executive Officers and Senior Financial Officers on our Internet site, http://investor.ralphlauren.com. We will post any amendments to the Code of Ethics for Principal Executive Officers and Senior Financial Officers and any waivers that are required to be disclosed by the rules of either the Securities and Exchange Commission or the NYSE on our Internet site.
|
Item 11.
|
Executive Compensation.
|
Information relating to executive and director compensation will be set forth in the Proxy Statement and such information is incorporated by reference herein.
|
Item 12.
|
Security Ownership of Certain Beneficial Owners and Management and Related Stockholder Matters.
|
Equity Compensation Plan Information as of
March 30, 2013
The following table sets forth information as of
March 30, 2013
regarding compensation plans under which the Company’s equity securities are authorized for issuance:
|
(a)
|
(b)
|
(c)
|
|||||||||
|
Plan Category
|
Numbers of
Securities to be
Issued upon
Exercise of
Outstanding
Options, Warrants
and Rights
|
|
Weighted-Average
Exercise Price of
Outstanding Options ($)
|
|
Number of Securities
Remaining Available for
Future Issuance Under
Equity Compensation
Plans (Excluding
Securities Reflected in
Column (a))
|
|
|||||
|
Equity compensation plans approved by security holders
|
4,741,163
|
|
(1)
|
$
|
91.26
|
|
(2)
|
2,943,250
|
|
(3)
|
|
|
Equity compensation plans not approved by security holders
|
—
|
|
|
—
|
|
|
—
|
|
|
||
|
Total
|
4,741,163
|
|
|
$
|
91.26
|
|
|
2,943,250
|
|
|
|
|
(1)
|
Consists of 2,953,428 options to purchase shares of our Class A common stock and 1,787,735 restricted stock units that are payable solely in shares of Class A common stock (including 600,185 of service-based restricted stock units that have fully vested but for which the underlying shares have not yet been delivered as of
March 30, 2013
). Does not include 5,720 outstanding restricted shares that are subject to forfeiture.
|
|
(2)
|
Represents the weighted average exercise price of the outstanding stock options. No exercise price is payable with respect to the outstanding restricted stock units.
|
|
(3)
|
All of the securities remaining available for future issuance set forth in column (c) may be in the form of options, stock appreciation rights, restricted stock, restricted stock units, performance awards, or other stock-based awards under the Company’s Amended and Restated 1997 Long-Term Stock Incentive Plan and the Company’s 2010 Long-Term Stock Incentive Plan (the “Plans”). An additional 5,720 outstanding shares of restricted stock granted under the Company’s Plans that remain subject to forfeiture are not reflected in column (c).
|
Other information relating to security ownership of certain beneficial owners and management will be set forth in the Proxy Statement and such information is incorporated by reference herein.
|
|
69
|
|
|
Item 13.
|
Certain Relationships and Related Transactions, and Director Independence.
|
The information required to be included by Item 13 of Form 10-K will be included in the Proxy Statement and such information is incorporated by reference herein.
|
Item 14.
|
Principal Accounting Fees and Services.
|
The information required to be included by Item 14 of Form 10-K will be included in the Proxy Statement and such information is incorporated by reference herein.
|
|
70
|
|
|
Item 15.
|
Exhibits, Financial Statement Schedules.
|
(a) 1., 2. Financial Statements and Financial Statement Schedules. See index on Page F-1.
3. Exhibits
|
Exhibit
Number
|
|
Description
|
|
3.1
|
|
Amended and Restated Certificate of Incorporation of the Company (filed as Exhibit 3.1 to the Company’s Registration Statement on Form S-1 (File No. 333-24733) (the “S-1”))
|
|
3.2
|
|
Certificate of Amendment to the Amended and Restated Certificate of Incorporation of the Company (filed as Exhibit 3.1 to the Form 8-K dated August 16, 2011)
|
|
3.3
|
|
Restated Second Amended and Restated By-laws of the Company (filed as Exhibit 3.1 to the Form 8-K dated August 16, 2011)
|
|
10.1
|
|
Registration Rights Agreement dated as of June 9, 1997 by and among Ralph Lauren, GS Capital Partners, L.P., GS Capital Partner PRL Holding I, L.P., GS Capital Partners PRL Holding II, L.P., Stone Street Fund 1994, L.P., Stone Street 1994 Subsidiary Corp., Bridge Street Fund 1994, L.P., and the Company (filed as Exhibit 10.3 to the S-1)
|
|
10.2
|
|
Agency Agreement dated October 5, 2006, between the Company and Deutsche Bank AG, London Branch and Deutsche Bank Luxemburg S.A., as fiscal and principal paying agent (filed as Exhibit 10.2 to the Form 10-Q for the quarterly period ended December 30, 2006)
|
|
10.3
|
|
Form of Indemnification Agreement between the Company and its Directors and Executive Officers (filed as Exhibit 10.26 to the S-1)
|
|
10.4
|
|
Amended and Restated Employment Agreement, effective as of October 14, 2009, between the Company and Roger N. Farah (filed as Exhibit 10.1 to the Form 8-K dated October 14, 2009)†
|
|
10.5
|
|
Amended and Restated Employment Agreement, made effective as of June 26, 2012, between the Company and Ralph Lauren (filed as Exhibit 10.1 to the Form 8-K filed July 2, 2012)†
|
|
10.6
|
|
Non-Qualified Stock Option Agreement, dated as of June 8, 2004, between the Company and Ralph Lauren (filed as Exhibit 10.14 to the Company's Annual Report on Form 10-K for the fiscal year ended April 2, 2005 (the “Fiscal 2006 10-K”))†
|
|
10.7
|
|
Restricted Stock Unit Award Agreement, dated as of June 8, 2004, between the Company and Ralph Lauren (filed as Exhibit 10.15 to the Fiscal 2006 10-K)†
|
|
10.8
|
|
Executive Officer Annual Incentive Plan, as amended as of August 9, 2007 (filed as Exhibit 10.1 to the Form 10-Q for the quarterly period ended December 29, 2007)†
|
|
10.9
|
|
Amendment No. 1, dated March 29, 2010, to the Amended and Restated Employment Agreement between the Company and Roger N. Farah (filed as Exhibit 10.14 to the Fiscal 2010 10-K)†
|
|
10.10
|
|
Restricted Stock Unit Award Agreement, dated as of July 1, 2004, between the Company and Roger N. Farah (filed as Exhibit 10.18 to the Fiscal 2006 10-K)†
|
|
10.11
|
|
Amendment No. 1, dated as of December 23, 2008, to the Restricted Stock Unit Award Agreement between the Company and Roger N. Farah (filed as Exhibit 10.2 to the Form 10-Q for the quarterly period ended December 27, 2008)†
|
|
10.12
|
|
Restricted Stock Award Agreement, dated as of July 23, 2002, between the Company and Roger N. Farah (filed as Exhibit 10.19 to the Fiscal 2006 10-K)†
|
|
10.13
|
|
Non-Qualified Stock Option Agreement, dated as of July 23, 2002, between the Company and Roger N. Farah (filed as Exhibit 10.20 to the Fiscal 2006 10-K)†
|
|
10.14
|
|
Deferred Compensation Agreement, dated as of September 19, 2002, between the Company and Roger N. Farah (filed as Exhibit 10.21 to the Fiscal 2006 10-K)†
|
|
10.15
|
|
1997 Long-Term Stock Incentive Plan, as Amended and Restated as of August 12, 2004 (filed as Exhibit 99.1 to the Form 8-K dated August 12, 2004)†
|
|
10.16
|
|
Amendment, dated as of June 30, 2006, to the 1997 Long-Term Stock Incentive Plan, as Amended and Restated as of August 12, 2004 (filed as Exhibit 10.4 to the Form 10-Q for the quarterly period ended July 1, 2006)†
|
|
10.17
|
|
Amendment No. 2, dated as of May 21, 2009, to the 1997 Long-Term Stock Incentive Plan, as Amended and Restated as of August 12, 2004 (filed as Exhibit 10.26 to the Fiscal 2009 10-K)†
|
|
10.18
|
|
2010 Long-Term Stock Incentive Plan adopted on August 5, 2010 (filed as Exhibit 10.4 to the Form 10-Q for the quarterly period ended July 3, 2010)†
|
|
|
71
|
|
|
Exhibit
Number
|
|
Description
|
|
10.19
|
|
Cliff Restricted Performance Share Unit Award Overview containing the standard terms of restricted performance share awards under the 1997 Long-Term Stock Incentive Plan (filed as Exhibit 10.1 to the Form 10-Q for the quarterly period ended July 1, 2006)†
|
|
10.20
|
|
Pro-Rata Restricted Performance Share Unit Award Overview containing the standard terms of restricted performance share awards under the 1997 Long-Term Stock Incentive Plan (filed as Exhibit 10.3 to the Form 10-Q for the quarterly period ended July 1, 2006)†
|
|
10.21
|
|
Stock Option Award Overview - U.S. containing the standard terms of stock option awards under the 1997 Long-Term Stock Incentive Plan (filed as Exhibit 10.2 to the Form 10-Q for the quarterly period ended July 1, 2006)†
|
|
10.22
|
|
Cliff Restricted Performance Share Unit Award Overview containing the standard terms of restricted performance share awards under the 2010 Long-Term Stock Incentive Plan (filed as Exhibit 10.1 to the Form 10-Q for the quarterly period ended July 3, 2010)†
|
|
10.23
|
|
Pro-Rata Restricted Performance Share Unit Award Overview containing the standard terms of restricted performance share awards under the 2010 Long-Term Stock Incentive Plan (filed as Exhibit 10.2 to the Form 10-Q for the quarterly period ended July 3, 2010)†
|
|
10.24
|
|
Stock Option Award Overview - U.S. containing the standard terms of stock option awards under the 2010 Long-Term Stock Incentive Plan (filed as Exhibit 10.3 to the Form 10-Q for the quarterly period ended July 3, 2010)†
|
|
10.25
|
|
Credit Agreement, dated March 10, 2011, among the Company, Polo JP Acqui C.V., Polo Ralph Lauren Kabushiki Kaisha and Polo Ralph Lauren Asia Pacific Limited, as the borrowers, the lenders party thereto, and JPMorgan Chase Bank, N.A., as administrative agent (filed as Exhibit 10.1 to the Form 10-Q for the quarterly period ended October 1, 2011)
|
|
10.26
|
|
Employment Agreement, effective as of October 14, 2009, between the Company and Jackwyn Nemerov (filed as Exhibit 10.2 to the Form 10-Q for the quarterly period ended October 1, 2011)†^
|
|
10.27
|
|
Employment Agreement, effective as of September 28, 2009, between the Company and Tracey T. Travis (filed as Exhibit 10.3 to the Form 10-Q for the quarterly period ended October 1, 2011)†^
|
|
10.28
|
|
Employment Agreement, effective as of February 24, 2013, between the Company and Mitchell A. Kosh (filed as Exhibit 10.1 to the Form 8-K filed on February 28, 2013)†
|
|
10.29
|
|
Amended and Restated Polo Ralph Lauren Supplemental Executive Retirement Plan (filed as Exhibit 10.1 to the Company's Form 10-Q for the quarterly period ended December 31, 2005)†
|
|
10.30
|
|
Employment Agreement, effective as of September 24, 2012, between the Company and Christopher H. Peterson (filed as Exhibit 10.1 to the Form 10-Q for the quarterly period ended September 29, 2012)†
|
|
10.31
|
|
Cliff Restricted Performance Share Unit with TSR Modifier Award Overview containing the standard terms of cliff restricted performance share unit awards under the 2010 Long-Term Stock Incentive Plan (filed as Exhibit 10.1 to the Form 8-K filed on July 13, 2012)†
|
|
10.32
|
Employment Separation Agreement and Release, entered into as of July 17, 2012, between the Company and Tracey T. Travis (filed as Exhibit 10.2 to the Form 10-Q for the quarterly period ended September 29, 2012)†
|
|
|
14.1
|
|
Code of Ethics for Principal Executive Officers and Senior Financial Officers (filed as Exhibit 14.1 to the Fiscal 2003 Form 10-K)
|
|
21.1
|
|
List of Significant Subsidiaries of the Company*
|
|
23.1
|
|
Consent of Ernst & Young LLP*
|
|
31.1
|
|
Certification of Ralph Lauren required by 17 CFR 240.13a-14(a)*
|
|
31.2
|
|
Certification of Christopher H. Peterson required by 17 CFR 240.13a-14(a)*
|
|
32.1
|
|
Certification of Ralph Lauren Pursuant to 18 U.S.C. Section 1350, as adopted Pursuant to Section 906 of the Sarbanes-Oxley Act of 2002*
|
|
32.2
|
|
Certification of Christopher H. Peterson Pursuant to 18 U.S.C. Section 1350, as adopted pursuant to Section 906 of the Sarbanes-Oxley Act of 2002*
|
|
101
|
|
Interactive data files pursuant to Rule 405 of Regulation S-T: (i) the Consolidated Balance Sheets at March 30, 2013 and March 31, 2012, (ii) the Consolidated Statements of Income for the fiscal years ended March 30, 2013, March 31, 2012 and April 2, 2011, (iii) the Consolidated Statements of Comprehensive Income for the fiscal years ended March 30, 2013, March 31, 2012 and April 2, 2011, (iv) the Consolidated Statements of Cash Flows for the fiscal years ended March 30, 2013, March 31, 2012 and April 2, 2011, (v) the Consolidated Statements of Equity for the fiscal years ended March 30, 2013, March 31, 2012 and April 2, 2011, and (vi) the Notes to the Consolidated Financial Statements.*
|
|
|
72
|
|
Exhibits 32.1 and 32.2 shall not be deemed “filed” for purposes of Section 18 of the Securities Exchange Act of 1934, or otherwise subject to the liability of that Section. Such exhibits shall not be deemed incorporated by reference into any filing under the Securities Act of 1933 or Securities Exchange Act of 1934.
|
*
|
Filed herewith.
|
|
†
|
Management contract or compensatory plan or arrangement.
|
|
^
|
Portions of this exhibit have been omitted and are the subject of a confidential treatment order by the SEC.
|
|
|
73
|
|
SIGNATURES
Pursuant to the requirements of the Securities Exchange Act of 1934, the registrant has duly caused this report to be signed on its behalf by the undersigned thereunto duly authorized.
|
|
RALPH LAUREN CORPORATION
|
|
|
By:
|
/
S
/ CHRISTOPHER H. PETERSON
|
|
|
Christopher H. Peterson
|
||
|
Senior Vice President and Chief Financial Officer
|
||
|
(Principal Financial and Accounting Officer)
|
||
|
Date: May 23, 2013
|
||
Pursuant to the requirements of the Securities Exchange Act of 1934, this report has been signed below by the following persons on behalf of the registrant and in the capacities and on the dates indicated:
|
Signature
|
Title
|
Date
|
||
|
/
S
/ RALPH LAUREN
|
Chairman of the Board, Chief Executive Officer and Director (Principal Executive Officer)
|
May 23, 2013
|
||
|
Ralph Lauren
|
||||
|
/
S
/ ROGER N. FARAH
|
President, Chief Operating Officer and Director
|
May 23, 2013
|
||
|
Roger N. Farah
|
||||
|
/
S
/ JACKWYN L. NEMEROV
|
Executive Vice President and Director
|
May 23, 2013
|
||
|
Jackwyn L. Nemerov
|
||||
|
/
S
/ CHRISTOPHER H. PETERSON
|
Senior Vice President and Chief Financial Officer
(Principal Financial and Accounting Officer)
|
May 23, 2013
|
||
|
Christopher H. Peterson
|
||||
|
/
S
/ JOHN R. ALCHIN
|
Director
|
May 23, 2013
|
||
|
John R. Alchin
|
||||
|
/
S
/ ARNOLD H. ARONSON
|
Director
|
May 23, 2013
|
||
|
Arnold H. Aronson
|
||||
|
/
S
/ FRANK A. BENNACK, JR.
|
Director
|
May 23, 2013
|
||
|
Frank A. Bennack, Jr.
|
||||
|
/
S
/ DR. JOYCE F. BROWN
|
Director
|
May 23, 2013
|
||
|
Dr. Joyce F. Brown
|
||||
|
/
S
/ JOEL L. FLEISHMAN
|
Director
|
May 23, 2013
|
||
|
Joel L. Fleishman
|
||||
|
/
S
/ HUBERT JOLY
|
Director
|
May 23, 2013
|
||
|
Hubert Joly
|
||||
|
|
74
|
|
|
Signature
|
Title
|
Date
|
||
|
/
S
/ JUDITH A. MCHALE
|
Director
|
May 23, 2013
|
||
|
Judith A. McHale
|
||||
|
/
S
/ STEVEN P. MURPHY
|
Director
|
May 23, 2013
|
||
|
Steven P. Murphy
|
||||
|
/
S
/ ROBERT C. WRIGHT
|
Director
|
May 23, 2013
|
||
|
Robert C. Wright
|
||||
|
|
75
|
|
RALPH LAUREN CORPORATION
INDEX TO CONSOLIDATED FINANCIAL STATEMENTS AND SUPPLEMENTARY INFORMATION
|
|
Page
|
|
|
Consolidated Financial Statements:
|
||
|
Supplementary Information:
|
||
|
EX-21.1
|
||
|
EX-23.1
|
||
|
EX-31.1
|
||
|
EX-31.2
|
||
|
EX-32.1
|
||
|
EX-32.2
|
||
|
EX-101
|
INSTANCE DOCUMENT
|
|
|
EX-101
|
SCHEMA DOCUMENT
|
|
|
EX-101
|
CALCULATION LINKBASE DOCUMENT
|
|
|
EX-101
|
LABELS LINKBASE DOCUMENT
|
|
|
EX-101
|
PRESENTATION LINKBASE DOCUMENT
|
|
|
EX-101
|
DEFINITION LINKBASE DOCUMENT
|
|
|
|
F-1
|
|
RALPH LAUREN CORPORATION
|
March 30,
2013 |
March 31,
2012 |
|||||||
|
(millions)
|
||||||||
|
ASSETS
|
||||||||
|
Current assets:
|
||||||||
|
Cash and cash equivalents
|
$
|
973.7
|
|
$
|
671.6
|
|
||
|
Short-term investments
|
324.7
|
|
515.7
|
|
||||
|
Accounts receivable, net of allowances of $245.2 million and $262.7 million
|
458.1
|
|
547.2
|
|
||||
|
Inventories
|
896.1
|
|
841.6
|
|
||||
|
Income tax receivable
|
28.6
|
|
17.2
|
|
||||
|
Deferred tax assets
|
119.7
|
|
125.6
|
|
||||
|
Prepaid expenses and other current assets
|
161.9
|
|
181.0
|
|
||||
|
Total current assets
|
2,962.8
|
|
2,899.9
|
|
||||
|
Non-current investments
|
81.0
|
|
99.9
|
|
||||
|
Property and equipment, net
|
932.2
|
|
884.1
|
|
||||
|
Deferred tax assets
|
21.6
|
|
39.8
|
|
||||
|
Goodwill
|
968.0
|
|
1,004.0
|
|
||||
|
Intangible assets, net
|
327.9
|
|
359.0
|
|
||||
|
Other non-current assets
|
124.7
|
|
129.7
|
|
||||
|
Total assets
|
$
|
5,418.2
|
|
$
|
5,416.4
|
|
||
|
LIABILITIES AND EQUITY
|
||||||||
|
Current liabilities:
|
||||||||
|
Current portion of long-term debt
|
$
|
266.6
|
|
$
|
—
|
|
||
|
Accounts payable
|
146.9
|
|
180.6
|
|
||||
|
Income tax payable
|
43.2
|
|
71.9
|
|
||||
|
Accrued expenses and other current liabilities
|
664.6
|
|
693.7
|
|
||||
|
Total current liabilities
|
1,121.3
|
|
946.2
|
|
||||
|
Long-term debt
|
—
|
|
274.4
|
|
||||
|
Non-current liability for unrecognized tax benefits
|
150.2
|
|
168.0
|
|
||||
|
Other non-current liabilities
|
362.1
|
|
375.3
|
|
||||
|
Commitments and contingencies (Note 17)
|
|
|
||||||
|
Total liabilities
|
1,633.6
|
|
1,763.9
|
|
||||
|
Equity:
|
||||||||
|
Class A common stock, par value $.01 per share; 93.6 million and 91.1 million shares issued; 61.0 million and 61.9 million shares outstanding
|
0.9
|
|
0.9
|
|
||||
|
Class B common stock, par value $.01 per share; 29.9 million and 30.8 million shares issued and outstanding
|
0.3
|
|
0.3
|
|
||||
|
Additional paid-in-capital
|
1,752.0
|
|
1,624.0
|
|
||||
|
Retained earnings
|
4,646.8
|
|
4,042.4
|
|
||||
|
Treasury stock, Class A, at cost (32.6 million and 29.2 million shares)
|
(2,709.0
|
)
|
(2,211.7
|
)
|
||||
|
Accumulated other comprehensive income
|
93.6
|
|
196.6
|
|
||||
|
Total equity
|
3,784.6
|
|
3,652.5
|
|
||||
|
Total liabilities and equity
|
$
|
5,418.2
|
|
$
|
5,416.4
|
|
||
See accompanying notes.
|
|
F-2
|
|
RALPH LAUREN CORPORATION
|
|
Fiscal Years Ended
|
|||||||||||
|
|
March 30,
2013 |
March 31,
2012 |
April 2,
2011 |
|||||||||
|
(millions, except per share data)
|
||||||||||||
|
Net sales
|
$
|
6,762.9
|
|
$
|
6,678.8
|
|
$
|
5,481.8
|
|
|||
|
Licensing revenue
|
181.9
|
|
180.7
|
|
178.5
|
|
||||||
|
Net revenues
|
6,944.8
|
|
6,859.5
|
|
5,660.3
|
|
||||||
|
Cost of goods sold
(a)
|
(2,789.0
|
)
|
(2,861.4
|
)
|
(2,342.0
|
)
|
||||||
|
Gross profit
|
4,155.8
|
|
3,998.1
|
|
3,318.3
|
|
||||||
|
Other costs and expenses:
|
||||||||||||
|
Selling, general, and administrative expenses
(a)
|
(2,971.6
|
)
|
(2,915.2
|
)
|
(2,442.7
|
)
|
||||||
|
Amortization of intangible assets
|
(26.8
|
)
|
(28.9
|
)
|
(25.4
|
)
|
||||||
|
Impairments of assets
|
(19.0
|
)
|
(2.2
|
)
|
(2.5
|
)
|
||||||
|
Restructuring charges
|
(11.7
|
)
|
(12.4
|
)
|
(2.6
|
)
|
||||||
|
Total other costs and expenses
|
(3,029.1
|
)
|
(2,958.7
|
)
|
(2,473.2
|
)
|
||||||
|
Operating income
|
1,126.7
|
|
1,039.4
|
|
845.1
|
|
||||||
|
Foreign currency losses
|
(11.5
|
)
|
(1.5
|
)
|
(1.4
|
)
|
||||||
|
Interest expense
|
(22.1
|
)
|
(24.5
|
)
|
(18.3
|
)
|
||||||
|
Interest and other income, net
|
5.7
|
|
11.0
|
|
7.7
|
|
||||||
|
Equity in losses of equity-method investees
|
(9.5
|
)
|
(9.3
|
)
|
(7.7
|
)
|
||||||
|
Income before provision for income taxes
|
1,089.3
|
|
1,015.1
|
|
825.4
|
|
||||||
|
Provision for income taxes
|
(339.3
|
)
|
(334.1
|
)
|
(257.8
|
)
|
||||||
|
Net income
|
$
|
750.0
|
|
$
|
681.0
|
|
$
|
567.6
|
|
|||
|
Net income per common share:
|
||||||||||||
|
Basic
|
$
|
8.21
|
|
$
|
7.35
|
|
$
|
5.91
|
|
|||
|
Diluted
|
$
|
8.00
|
|
$
|
7.13
|
|
$
|
5.75
|
|
|||
|
Weighted average common shares outstanding:
|
||||||||||||
|
Basic
|
91.3
|
|
92.7
|
|
96.0
|
|
||||||
|
Diluted
|
93.7
|
|
95.5
|
|
98.7
|
|
||||||
|
Dividends declared per share
|
$
|
1.60
|
|
$
|
0.80
|
|
$
|
0.50
|
|
|||
|
(a)
Includes total depreciation expense of:
|
$
|
(205.5
|
)
|
$
|
(196.3
|
)
|
$
|
(168.7
|
)
|
|||
See accompanying notes.
|
|
F-3
|
|
RALPH LAUREN CORPORATION
CONSOLIDATED STATEMENTS OF COMPREHENSIVE INCOME
|
|
Fiscal Years Ended
|
|||||||||||
|
|
March 30,
2013 |
March 31,
2012 |
April 2,
2011 |
|||||||||
|
(millions)
|
||||||||||||
|
Net income
|
$
|
750.0
|
|
$
|
681.0
|
|
$
|
567.6
|
|
|||
|
Other comprehensive income (loss), net of tax:
|
||||||||||||
|
Foreign currency translation adjustments
|
(93.2
|
)
|
(49.6
|
)
|
83.6
|
|
||||||
|
Net realized and unrealized gains (losses) on derivatives
|
(12.4
|
)
|
31.3
|
|
(17.2
|
)
|
||||||
|
Net realized and unrealized gains on available-for-sale investments
|
3.9
|
|
0.7
|
|
—
|
|
||||||
|
Net realized and unrealized losses on defined benefit plans
|
(1.3
|
)
|
(1.6
|
)
|
(4.6
|
)
|
||||||
|
Other comprehensive income (loss), net of tax
|
(103.0
|
)
|
(19.2
|
)
|
61.8
|
|
||||||
|
Total comprehensive income
|
$
|
647.0
|
|
$
|
661.8
|
|
$
|
629.4
|
|
|||
See accompanying notes.
|
|
F-4
|
|
RALPH LAUREN CORPORATION
|
|
Fiscal Years Ended
|
|||||||||||
|
|
March 30,
2013 |
March 31,
2012 |
April 2,
2011 |
|||||||||
|
(millions)
|
||||||||||||
|
Cash flows from operating activities:
|
||||||||||||
|
Net income
|
$
|
750.0
|
|
$
|
681.0
|
|
$
|
567.6
|
|
|||
|
Adjustments to reconcile net income to net cash provided by operating activities:
|
||||||||||||
|
Depreciation and amortization expense
|
232.3
|
|
225.2
|
|
194.1
|
|
||||||
|
Deferred income tax expense (benefit)
|
14.4
|
|
(15.1
|
)
|
47.3
|
|
||||||
|
Equity in loss of equity-method investees, net of dividends received
|
9.5
|
|
9.3
|
|
7.7
|
|
||||||
|
Non-cash stock-based compensation expense
|
87.5
|
|
77.9
|
|
70.4
|
|
||||||
|
Non-cash impairment of assets
|
19.0
|
|
2.2
|
|
2.5
|
|
||||||
|
Other non-cash charges (benefits), net
|
3.5
|
|
3.1
|
|
(5.8
|
)
|
||||||
|
Excess tax benefits from stock-based compensation arrangements
|
(40.9
|
)
|
(39.9
|
)
|
(42.6
|
)
|
||||||
|
Changes in operating assets and liabilities:
|
||||||||||||
|
Accounts receivable
|
82.1
|
|
(114.0
|
)
|
(50.7
|
)
|
||||||
|
Inventories
|
(67.5
|
)
|
(148.3
|
)
|
(173.5
|
)
|
||||||
|
Accounts payable and accrued expenses
|
(57.1
|
)
|
33.1
|
|
109.2
|
|
||||||
|
Income tax receivables and payables
|
(12.8
|
)
|
121.7
|
|
(68.7
|
)
|
||||||
|
Deferred income
|
(30.3
|
)
|
(18.5
|
)
|
(27.2
|
)
|
||||||
|
Other balance sheet changes, net
|
29.2
|
|
67.6
|
|
58.4
|
|
||||||
|
Net cash provided by operating activities
|
1,018.9
|
|
885.3
|
|
688.7
|
|
||||||
|
Cash flows from investing activities:
|
||||||||||||
|
Acquisitions and ventures, net of cash acquired and purchase price settlements
|
(21.7
|
)
|
(11.7
|
)
|
(70.9
|
)
|
||||||
|
Purchases of investments
|
(875.8
|
)
|
(1,360.5
|
)
|
(1,244.3
|
)
|
||||||
|
Proceeds from sales and maturities of investments
|
1,058.1
|
|
1,393.5
|
|
1,242.3
|
|
||||||
|
Capital expenditures
|
(276.5
|
)
|
(272.2
|
)
|
(255.0
|
)
|
||||||
|
Change in restricted cash deposits
|
2.8
|
|
1.3
|
|
28.5
|
|
||||||
|
Net cash used in investing activities
|
(113.1
|
)
|
(249.6
|
)
|
(299.4
|
)
|
||||||
|
Cash flows from financing activities:
|
||||||||||||
|
Proceeds from credit facilities
|
—
|
|
107.7
|
|
—
|
|
||||||
|
Repayments of borrowings on credit facilities
|
—
|
|
(107.7
|
)
|
—
|
|
||||||
|
Payments of capital lease obligations
|
(8.7
|
)
|
(8.0
|
)
|
(7.9
|
)
|
||||||
|
Payments of dividends
|
(127.8
|
)
|
(74.3
|
)
|
(38.5
|
)
|
||||||
|
Repurchases of common stock, including shares surrendered for tax withholdings
|
(497.3
|
)
|
(419.4
|
)
|
(594.6
|
)
|
||||||
|
Prepayments of common stock repurchases
|
(50.0
|
)
|
—
|
|
—
|
|
||||||
|
Proceeds from exercise of stock options
|
49.6
|
|
61.5
|
|
88.3
|
|
||||||
|
Excess tax benefits from stock-based compensation arrangements
|
40.9
|
|
39.9
|
|
42.6
|
|
||||||
|
Payment on interest rate swap termination
|
—
|
|
(7.6
|
)
|
—
|
|
||||||
|
Other financing activities
|
(1.5
|
)
|
0.2
|
|
(2.5
|
)
|
||||||
|
Net cash used in financing activities
|
(594.8
|
)
|
(407.7
|
)
|
(512.6
|
)
|
||||||
|
Net effect of exchange rate changes on cash and cash equivalents
|
(8.9
|
)
|
(9.4
|
)
|
13.2
|
|
||||||
|
Net increase (decrease) in cash and cash equivalents
|
302.1
|
|
218.6
|
|
(110.1
|
)
|
||||||
|
Cash and cash equivalents at beginning of period
|
671.6
|
|
453.0
|
|
563.1
|
|
||||||
|
Cash and cash equivalents at end of period
|
$
|
973.7
|
|
$
|
671.6
|
|
$
|
453.0
|
|
|||
See accompanying notes.
|
|
F-5
|
|
|
RALPH LAUREN CORPORATION
|
||||||||||||||||||||||||||||||
|
CONSOLIDATED STATEMENTS OF EQUITY
|
||||||||||||||||||||||||||||||
|
Additional
|
Treasury Stock
|
|||||||||||||||||||||||||||||
|
Common Stock
(a)
|
Paid-in
|
Retained
|
at Cost
|
Total
|
||||||||||||||||||||||||||
|
Shares
|
Amount
|
Capital
|
Earnings
|
Shares
|
Amount
|
AOCI
(b)
|
Equity
|
|||||||||||||||||||||||
|
(millions)
|
||||||||||||||||||||||||||||||
|
Balance at April 3, 2010
|
117.8
|
|
$
|
1.2
|
|
$
|
1,243.8
|
|
$
|
2,915.3
|
|
19.6
|
|
$
|
(1,197.7
|
)
|
$
|
154.0
|
|
$
|
3,116.6
|
|
||||||||
|
Comprehensive income:
|
||||||||||||||||||||||||||||||
|
Net income
|
567.6
|
|
||||||||||||||||||||||||||||
|
Other comprehensive income
|
61.8
|
|
||||||||||||||||||||||||||||
|
Total comprehensive income
|
629.4
|
|
||||||||||||||||||||||||||||
|
Cash dividends declared
|
(47.6
|
)
|
(47.6
|
)
|
||||||||||||||||||||||||||
|
Repurchases of common stock
|
6.2
|
|
(594.6
|
)
|
(594.6
|
)
|
||||||||||||||||||||||||
|
Stock-based compensation
|
70.4
|
|
70.4
|
|
||||||||||||||||||||||||||
|
Shares issued and tax benefits recognized
|
||||||||||||||||||||||||||||||
|
pursuant to stock-based compensation plans
(c)
|
2.5
|
|
—
|
|
130.5
|
|
130.5
|
|
||||||||||||||||||||||
|
Balance at April 2, 2011
|
120.3
|
|
$
|
1.2
|
|
$
|
1,444.7
|
|
$
|
3,435.3
|
|
25.8
|
|
$
|
(1,792.3
|
)
|
$
|
215.8
|
|
$
|
3,304.7
|
|
||||||||
|
Comprehensive income:
|
||||||||||||||||||||||||||||||
|
Net income
|
681.0
|
|
||||||||||||||||||||||||||||
|
Other comprehensive loss
|
(19.2
|
)
|
||||||||||||||||||||||||||||
|
Total comprehensive income
|
661.8
|
|
||||||||||||||||||||||||||||
|
Cash dividends declared
|
(73.9
|
)
|
(73.9
|
)
|
||||||||||||||||||||||||||
|
Repurchases of common stock
|
3.4
|
|
(419.4
|
)
|
(419.4
|
)
|
||||||||||||||||||||||||
|
Stock-based compensation
|
77.9
|
|
77.9
|
|
||||||||||||||||||||||||||
|
Shares issued and tax benefits recognized
|
||||||||||||||||||||||||||||||
|
pursuant to stock-based compensation plans
(c)
|
1.6
|
|
—
|
|
101.4
|
|
101.4
|
|
||||||||||||||||||||||
|
Balance at March 31, 2012
|
121.9
|
|
$
|
1.2
|
|
$
|
1,624.0
|
|
$
|
4,042.4
|
|
29.2
|
|
$
|
(2,211.7
|
)
|
$
|
196.6
|
|
$
|
3,652.5
|
|
||||||||
|
Comprehensive income:
|
||||||||||||||||||||||||||||||
|
Net income
|
750.0
|
|
||||||||||||||||||||||||||||
|
Other comprehensive loss
|
(103.0
|
)
|
||||||||||||||||||||||||||||
|
Total comprehensive income
|
647.0
|
|
||||||||||||||||||||||||||||
|
Cash dividends declared
|
(145.6
|
)
|
(145.6
|
)
|
||||||||||||||||||||||||||
|
Repurchases of common stock
|
(50.0
|
)
|
3.4
|
|
(497.3
|
)
|
(547.3
|
)
|
||||||||||||||||||||||
|
Stock-based compensation
|
87.5
|
|
87.5
|
|
||||||||||||||||||||||||||
|
Shares issued and tax benefits recognized
|
||||||||||||||||||||||||||||||
|
pursuant to stock-based compensation plans
(c)
|
1.6
|
|
—
|
|
90.5
|
|
90.5
|
|
||||||||||||||||||||||
|
Balance at March 30, 2013
|
123.5
|
|
$
|
1.2
|
|
$
|
1,752.0
|
|
$
|
4,646.8
|
|
32.6
|
|
$
|
(2,709.0
|
)
|
$
|
93.6
|
|
$
|
3,784.6
|
|
||||||||
|
(a)
|
Includes Class A and Class B common stock. In Fiscal 2013 and 2011,
1.0 million
and
11.3 million
shares, respectively, of Class B common stock were converted into an equal number of shares of Class A common stock pursuant to the terms of the Class B common stock (see
Note 18
).
|
|
(b)
|
Accumulated other comprehensive income (loss).
|
|
(c)
|
Includes excess tax benefits relating to stock-based compensation arrangements of approximately
$41 million
,
$40 million
, and
$43 million
in
Fiscal 2013
,
Fiscal 2012
, and
Fiscal 2011
, respectively.
|
See accompanying notes.
|
|
F-6
|
|
RALPH LAUREN CORPORATION
NOTES TO CONSOLIDATED FINANCIAL STATEMENTS
|
1.
|
Description of Business
|
Ralph Lauren Corporation (“RLC”) is a global leader in the design, marketing, and distribution of premium lifestyle products, including men’s, women’s, and children’s apparel, accessories, fragrances, and home furnishings. RLC’s long-standing reputation and distinctive image have been consistently developed across an expanding number of products, brands, and international markets. RLC’s brand names include Ralph Lauren Women’s Collection, Purple Label, Black Label, Blue Label, Polo Ralph Lauren, RRL, Ralph Lauren Childrenswear, Lauren by Ralph Lauren, RLX Ralph Lauren, Denim & Supply Ralph Lauren, Ralph Lauren, Rugby, Chaps, and Club Monaco, among others. RLC and its subsidiaries are collectively referred to herein as the “Company,” “we,” “us,” “our,” and “ourselves,” unless the context indicates otherwise.
The Company classifies its businesses into
three
segments: Wholesale, Retail, and Licensing. The Company’s wholesale sales are made principally to major department stores and specialty stores located throughout North America, Europe, Asia, and Latin America. The Company also
sells
directly to consumers through retail stores located throughout North America, Europe, Asia, and Latin America; through concession-based shop-within-shops located primarily in Asia and Europe; and through its retail e-commerce channel in North America, Europe, and Asia. The Company also licenses the right to unrelated third parties to operate retail stores and to use its various trademarks in connection with the manufacture and sale of designated products, such as apparel, eyewear, and fragrances in specified geographical areas for specified periods.
On
October 30, 2012
, the Company approved a plan to wind-down its Rugby brand retail operations (the “Rugby Closure Plan”). This decision was primarily based on the results of an analysis of the brand concept, as well as an opportunity for the Company to reallocate its resources related to these operations to support other high-growth business opportunities and initiatives. In connection with the Rugby Closure Plan,
13
of the Company’s
14
global freestanding Rugby stores, and its related domestic e-commerce site located at Rugby.com, were closed during Fiscal 2013. The
one
remaining Rugby store is expected to be closed during Fiscal 2014. The Rugby Closure Plan also resulted in a reduction in the Company's workforce. See Notes 11 and 12 for detailed discussions of impairment and restructuring charges recorded during Fiscal 2013 in connection with the Rugby Closure Plan.
|
2.
|
Basis of Presentation
|
Basis of Consolidation
The consolidated financial statements are prepared in accordance with accounting principles generally accepted in the U.S. (“U.S. GAAP”) and present the financial position, income, comprehensive income, and cash flows of the Company, including all entities in which the Company has a controlling financial interest and is determined to be the primary beneficiary. All significant intercompany balances and transactions have been eliminated in consolidation.
Fiscal
Year
The Company utilizes a
52-53
week fiscal year ending on the Saturday closest to March 31. As such,
Fiscal 2013
ended on
March 30, 2013
and was a
52
-week period;
Fiscal 2012
ended on
March 31, 2012
and was a
52
-week period; and
Fiscal 2011
ended on
April 2, 2011
and was also a
52
-week period.
During Fiscal 2012, the Company's Japanese subsidiary, Ralph Lauren Corporation Japan (formerly “Polo Ralph Lauren Kabushiki Kaisha”), eliminated its previously existing one-month reporting lag to conform to the Company's fiscal year basis. The cumulative effect of this change in accounting principle was not material to the Company's audited consolidated financial statements in Fiscal 2012, or to its previously reported annual and interim consolidated financial statements.
Use of
Estimates
The preparation of financial statements in conformity with U.S. GAAP requires management to make estimates and assumptions that affect the amounts reported in the financial statements and footnotes thereto. Actual results could differ materially from those
estimates
.
|
|
F-7
|
|
RALPH LAUREN CORPORATION
NOTES TO CONSOLIDATED FINANCIAL STATEMENTS (Continued)
Significant estimates inherent in the preparation of the consolidated financial statements include reserves for bad debt, customer returns, discounts, end-of-season markdowns, and operational chargebacks; the realizability of inventory; reserves for litigation and other contingencies; useful lives and impairments of long-lived tangible and intangible assets; accounting for income taxes and related uncertain tax positions; the valuation of stock-based compensation and related expected forfeiture rates; reserves for restructuring; and accounting for business combinations, among others.
Reclassifications
Certain reclassifications have been made to the prior periods’ financial information in order to conform to the current period’s presentation.
|
3.
|
Summary of Significant Accounting Policies
|
Revenue Recognition
Revenue is recognized across all segments of the business when there is persuasive evidence of an arrangement, delivery has occurred, price has been fixed or is determinable, and collectability is reasonably assured.
Revenue within the Company’s Wholesale segment is recognized at the time title passes and risk of loss is transferred to customers. Wholesale revenue is recorded net of estimates of returns, discounts, end-of-season markdown allowances, operational chargebacks, and certain cooperative advertising allowances. Returns and allowances require pre-approval from management and discounts are based on trade terms. Estimates for end-of-season markdown reserves are based on historical trends, actual and forecasted seasonal results, an evaluation of current economic and market conditions, retailer performance, and, in certain cases, contractual terms. Estimates for operational chargebacks are based on actual notifications of order fulfillment discrepancies and historical trends. The Company reviews and refines these estimates on at least a quarterly basis. The Company’s historical estimates of these costs have not differed materially from actual results.
Retail store and concession-based shop-within-shop revenue is recognized net of estimated returns at the time of sale to consumers. E-commerce revenue from sales of products ordered through the Company’s retail Internet sites is recognized upon delivery and receipt of the shipment by its customers. Such revenue is also reduced by an estimate of returns.
Gift cards issued by the Company are recorded as a liability until they are redeemed, at which point revenue is recognized. The Company recognizes income for unredeemed gift cards when the likelihood of a gift card being redeemed by a customer is remote and the Company determines that it does not have a legal obligation to remit the value of the unredeemed gift card to the relevant jurisdiction as unclaimed or abandoned property.
Revenue from licensing arrangements is recognized when earned in accordance with the terms of the underlying agreements, generally based upon the higher of (i) contractually guaranteed minimum royalty levels or (ii) actual sales and royalty data, or estimates thereof, received from the Company’s licensees.
The Company accounts for sales taxes and other related taxes on a net basis, excluding such taxes from revenue.
Cost of Goods Sold and Selling Expenses
Cost of goods sold includes the expenses incurred to acquire and produce inventory for sale, including product costs, freight-in, and import costs, as well as changes in reserves for shrinkage and inventory realizability. Gains and losses associated with foreign currency exchange contracts related to the hedging of inventory purchases are also recognized within cost of goods sold when the inventory being hedged is sold. The costs of selling merchandise, including those associated with preparing the merchandise for sale, such as picking, packing, warehousing, and order charges (“handling costs”), are included in selling, general, and administrative (“SG&A”) expenses.
Shipping and Handling Costs
The costs associated with shipping goods to customers are reflected as a component of SG&A expenses in the consolidated statements of income. Shipping costs were approximately
$37 million
in each of Fiscal 2013 and Fiscal 2012, and
$30 million
in Fiscal 2011. Handling costs (described above), also included within SG&A expenses, were approximately
$150 million
,
$144
|
|
F-8
|
|
RALPH LAUREN CORPORATION
NOTES TO CONSOLIDATED FINANCIAL STATEMENTS (Continued)
million
, and
$108 million
in Fiscal 2013, Fiscal 2012, and Fiscal 2011, respectively. Shipping and handling costs billed to customers are included in revenue.
Advertising, Marketing, and Promotional Costs
Advertising costs, including the costs to produce advertising, are expensed when the advertisement is first exhibited. Costs of out-of-store advertising paid to wholesale customers under cooperative advertising programs are expensed as an advertising cost within SG&A expenses if both the identified advertising benefit is sufficiently separable from the purchase of the Company's products by customers and the fair value of such benefit is measurable. Otherwise, such costs are reflected as a reduction of revenue. Costs of in-store advertising paid to wholesale customers under cooperative advertising programs are not included in advertising costs, but are reflected as a reduction of revenues since the benefits are not sufficiently separable from the purchases of the Company's products by customers. Costs associated with the marketing and promotion of the Company's products are included within SG&A expenses.
Advertising, marketing, and promotional expenses amounted to approximately
$217 million
,
$213 million
, and
$192 million
in Fiscal 2013, Fiscal 2012 and Fiscal 2011, respectively. Deferred advertising, marketing, and promotional costs, which principally relate to advertisements that have not yet been exhibited or services that have not yet been received, were approximately
$8 million
and
$5 million
at the end of Fiscal 2013 and Fiscal 2012, respectively, and were recorded within prepaid expenses and other current assets in the Company's consolidated balance sheets.
Foreign Currency Translation and Transactions
The financial position and operating results of foreign operations are primarily consolidated using the local currency as the functional currency. Local currency assets and liabilities are translated at the rates of exchange in effect on the balance sheet date, and local currency revenues and expenses are translated at average rates of exchange effective during the period. The resulting translation gains or losses are included in the consolidated statements of comprehensive income as a component of other comprehensive income (loss) ("OCI") and in the consolidated statements of equity within accumulated other comprehensive income (loss) (“AOCI”). Gains and losses on the translation of intercompany loans made to foreign subsidiaries that are of a long-term investment nature also are included within this component of equity.
The Company also recognizes gains and losses on transactions that are denominated in a currency other than the respective entity's functional currency. Foreign currency transaction gains and losses also include amounts realized on the settlement of certain intercompany loans with foreign subsidiaries. Foreign currency transaction gains and losses are recognized in earnings and separately disclosed in the consolidated statements of income.
Comprehensive Income (Loss)
Comprehensive income (loss), which is reported in the consolidated statements of comprehensive income and consolidated statements of equity, consists of net income and other gains and losses affecting equity that, under U.S. GAAP, are excluded from net income. The components of OCI for the Company primarily consist of foreign currency translation gains (losses), including foreign currency gains (losses) on the Company's Euro-denominated debt, to the extent it has been designated and effective as a hedge of the Company's net investment in certain of its European subsidiaries; net realized and unrealized gains (losses) on designated hedging instruments, such as forward foreign currency exchange contracts designated as cash flow hedges; net realized and unrealized gains (losses) on available-for-sale investments; and net realized and unrealized gains (losses) related to the Company's defined benefit plans.
Net Income per Common Share
Basic net income per common share is computed by dividing net income applicable to common shares by the weighted-average number of common shares outstanding during the period. Weighted-average common shares include shares of the Company’s Class A and Class B common stock. Diluted net income per common share adjusts basic net income per common share for the effects of outstanding stock options, restricted stock, restricted stock units, and any other potentially dilutive financial instruments, only in the periods in which such effects are dilutive under the treasury stock method.
|
|
F-9
|
|
RALPH LAUREN CORPORATION
NOTES TO CONSOLIDATED FINANCIAL STATEMENTS (Continued)
The weighted-average number of common shares outstanding used to calculate basic net income per common share is reconciled to shares used to calculate diluted net income per common share as follows:
|
|
Fiscal Years Ended
|
||||||||
|
|
March 30,
2013 |
March 31,
2012 |
April 2,
2011 |
||||||
|
|
|||||||||
|
Basic shares
|
91.3
|
|
92.7
|
|
96.0
|
|
|||
|
Dilutive effect of stock options, restricted stock, and restricted stock units
|
2.4
|
|
2.8
|
|
2.7
|
|
|||
|
Diluted shares
|
93.7
|
|
95.5
|
|
98.7
|
|
|||
Options to purchase shares of the Company's common stock at an exercise price greater than the average market price of the common stock during the reporting period are anti-dilutive and therefore not included in the computation of diluted net income per common share. In addition, the Company has outstanding restricted stock units that are issuable only upon the achievement of certain service and/or performance goals. Performance-based restricted stock units ("RSUs") are included in the computation of diluted shares only to the extent that the underlying performance conditions (and any applicable market condition modifiers) (i) are satisfied as of the end of the reporting period, or (ii) would be satisfied if the end of the reporting period were the end of the related contingency period and the result would be dilutive under the treasury stock method. As of the end of Fiscal 2013, Fiscal 2012, and Fiscal 2011, there were approximately
0.5 million
,
0.4 million
, and
0.4 million
, respectively, additional shares issuable as of the end of each period upon exercise of anti-dilutive options and contingent vesting of performance-based restricted stock units, which were excluded from the diluted share calculations.
Stock-Based Compensation
The Company expenses all stock-based compensation awards granted to employees and non-employee directors based on the grant date fair value of the awards over the requisite service period, adjusted for estimated forfeitures. The Company uses the Black-Scholes valuation model to determine the grant date fair value of its stock option awards. For performance-based RSUs awards that include a market condition in the form of a total shareholder return ("TSR") modifier, the Company uses a Monte Carlo simulation valuation model to determine the fair value on the date of grant. The fair values of restricted stock awards, service-based RSUs, and performance-based RSUs that are not subject to a TSR modifier are determined based on the fair value of the Company's Class A common stock on the date of grant, adjusted to reflect the absence of dividends for those awards that are not entitled to dividend equivalents. Compensation expense for all performance-based RSUs is recognized over the related service period when attainment of performance goals is deemed probable. See
Note 20
for further discussion of the Company's stock-based compensation plans.
Cash and Cash Equivalents
Cash and cash equivalents include all highly liquid investments with original maturities of
90 days
or less, including investments in debt securities. Investments in debt securities are diversified among high-credit quality securities in accordance with the Company's risk-management policies, and primarily include commercial paper and money market funds.
Restricted Cash
From time to time, the Company is required to place cash in escrow with various banks as collateral, primarily to secure guarantees of corresponding amounts made by the banks to international tax authorities on behalf of the Company, such as to secure refunds of value-added tax payments in certain international tax jurisdictions or in the case of certain international tax audits. Such cash has been classified as restricted cash and reported as a component of either prepaid expenses and other current assets or other non-current assets in the Company's consolidated balance sheets.
Investments
The Company's investment objectives include capital preservation, maintaining adequate liquidity, diversification to minimize liquidity and credit risk, and achieving maximum returns within the guidelines set forth in the Company's investment policy.
|
|
F-10
|
|
RALPH LAUREN CORPORATION
NOTES TO CONSOLIDATED FINANCIAL STATEMENTS (Continued)
Short-term investments consist of investments which the Company expects to convert into cash within
one year
, including time deposits, which have original maturities greater than
90 days
. Non-current investments consist of those investments which the Company does not expect to convert into cash within
one year
.
The Company classifies its investments in securities at the time of purchase as held-to-maturity or available-for-sale, and re-evaluates such classifications on a quarterly basis. Held-to-maturity investments consist of securities that the Company has the intent and ability to retain until maturity. These securities are recorded at cost, adjusted for the amortization of premiums and discounts, which approximates fair value. Available-for-sale investments are recorded at fair value with unrealized gains or losses classified as a component of AOCI in the consolidated balance sheets, and related realized gains or losses classified as a component of interest and other income, net, in the consolidated statements of income.
Cash inflows and outflows related to the sale and purchase of investments are classified as investing activities in the Company's consolidated statements of cash flows.
Equity-method Investments
Investments in companies in which the Company has significant influence, but less than a controlling financial interest, are accounted for using the equity method. Significant influence is generally presumed to exist when the Company owns between
20%
and
50%
of the investee. However, if the Company had a
greater than 50%
ownership interest in an investee and the noncontrolling shareholders held certain rights that allowed them to participate in the day-to-day operations of the business, the Company would also generally use the equity method of accounting.
Under the equity method, the following amounts are recorded in the Company's consolidated financial statements: the Company's investment in and amounts due to and from the investee are included in the consolidated balance sheets; the Company's share of the investee's earnings (losses) is included in the consolidated statements of income; and dividends, cash distributions, loans, or other cash received from the investee and additional cash investments, loan repayments, or other cash paid to the investee are included in the consolidated statements of cash flows.
The Company's investments include a joint venture named the Ralph Lauren Watch and Jewelry Company, S.A.R.L. (the “RL Watch Company”), formed with Compagnie Financiere Richemont SA (“Richemont”), the Swiss Luxury Goods Group, in March 2007. This joint venture is a Swiss corporation whose purpose is to design, develop, manufacture, sell, and distribute luxury watches and fine jewelry through Ralph Lauren stores, as well as through fine independent jewelry and luxury watch retailers around the world. The Company accounts for its
50%
interest in the RL Watch Company under the equity method of accounting, and such investment is recorded at carrying value within other non-current assets in the consolidated balance sheets. Royalty payments due to the Company under the related license agreement for use of certain of its trademarks are reflected as licensing revenue within the consolidated statements of income.
Impairment Assessment
The Company evaluates investments held in unrealized loss positions for other-than-temporary impairment on a quarterly basis. Such evaluation involves a variety of considerations, including assessments of the risks and uncertainties associated with general economic conditions and distinct conditions affecting specific issuers. Factors considered by the Company include (i) the length of time and the extent to which the fair value has been below cost; (ii) the financial condition, credit worthiness, and near-term prospects of the issuer; (iii) the length of time to maturity; (iv) future economic conditions and market forecasts; (v) the Company's intent and ability to retain its investment for a period of time sufficient to allow for recovery of market value; and (vi) an assessment of whether it is more likely than not that the Company will be required to sell its investment before recovery of market value. See
Note 16
for further information relating to the Company's investments.
Accounts Receivable
In the normal course of business, the Company extends credit to wholesale customers that satisfy defined credit criteria. Accounts receivable, net is recorded at carrying value, which approximates fair value, and is presented in the Company's consolidated balance sheets net of certain reserves and allowances. These reserves and allowances, which are discussed further below, consist of (i) reserves for returns, discounts, end-of-season markdowns, and operational chargebacks, and (ii) allowances for doubtful accounts.
|
|
F-11
|
|
RALPH LAUREN CORPORATION
NOTES TO CONSOLIDATED FINANCIAL STATEMENTS (Continued)
A reserve for sales returns is determined based on an evaluation of current market conditions, historical returns experience, and, in certain cases, contractual terms. Charges to increase the reserve are treated as reductions of revenue.
A reserve for trade discounts is determined based on open invoices where trade discounts have been extended to customers. Charges to increase the reserve are treated as reductions of revenue.
Estimated end-of-season markdown charges are also included as reductions of revenue. The related markdown provisions are based on retail sales performance, seasonal negotiations with customers, historical and forecasted deduction trends, an evaluation of current economic and market conditions, and, in certain cases, contractual terms.
A reserve for operational chargebacks represents various deductions by customers relating to individual shipments. Charges to increase this reserve, net of expected recoveries, are included as reductions of revenue. The reserve is based on actual notifications of order fulfillment discrepancies and past experience.
A rollforward of the activity in the Company's reserves for returns, discounts, end-of-season markdowns, and operational chargebacks is presented below:
|
|
Fiscal Years Ended
|
|||||||||||
|
|
March 30,
2013 |
March 31,
2012 |
April 2,
2011 |
|||||||||
|
|
(millions)
|
|||||||||||
|
Beginning reserve balance
|
$
|
246.7
|
|
$
|
213.2
|
|
$
|
186.0
|
|
|||
|
Amount charged against revenue to increase reserve
|
706.9
|
|
650.4
|
|
502.5
|
|
||||||
|
Amount credited against customer accounts to decrease reserve
|
(718.0
|
)
|
(611.3
|
)
|
(479.5
|
)
|
||||||
|
Foreign currency translation
|
(5.7
|
)
|
(5.6
|
)
|
4.2
|
|
||||||
|
Ending reserve balance
|
$
|
229.9
|
|
$
|
246.7
|
|
$
|
213.2
|
|
|||
An allowance for doubtful accounts is determined through analysis of periodic aging of accounts receivable, assessments of collectability based on an evaluation of historical and anticipated trends, the financial condition of the Company’s customers, and an evaluation of the impact of economic conditions, among other factors.
A rollforward of the activity in the Company’s allowance for doubtful accounts is presented below:
|
|
Fiscal Years Ended
|
|||||||||||
|
|
March 30,
2013 |
March 31,
2012 |
April 2,
2011 |
|||||||||
|
|
(millions)
|
|||||||||||
|
Beginning reserve balance
|
$
|
16.0
|
|
$
|
17.7
|
|
$
|
20.1
|
|
|||
|
Amount recorded to expense to increase (decrease) reserve
(a)
|
3.4
|
|
2.3
|
|
(0.2
|
)
|
||||||
|
Amount written-off against customer accounts to decrease reserve
|
(3.6
|
)
|
(3.4
|
)
|
(2.8
|
)
|
||||||
|
Foreign currency translation
|
(0.5
|
)
|
(0.6
|
)
|
0.6
|
|
||||||
|
Ending reserve balance
|
$
|
15.3
|
|
$
|
16.0
|
|
$
|
17.7
|
|
|||
|
(a)
|
Amounts recorded to bad debt expense are included within SG&A expenses in the consolidated statements of income.
|
Concentration of Credit Risk
The Company sells its wholesale merchandise primarily to major department and specialty stores located throughout North America, Europe, Asia, and Latin America, and extends credit based on an evaluation of each customer’s financial capacity and condition, usually without requiring collateral. In the Company’s wholesale business, concentration of credit risk is relatively limited due to the large number of customers and their dispersion across many geographic areas. However, the Company has
three
key wholesale customers that generate significant sales volume. During Fiscal 2013, the Company's sales to its largest wholesale customer, Macy's, Inc. ("Macy's"), accounted for approximately
12%
of its total net revenues. Further, the Company's sales to its
|
|
F-12
|
|
RALPH LAUREN CORPORATION
NOTES TO CONSOLIDATED FINANCIAL STATEMENTS (Continued)
three
key wholesale customers, including Macy's, in the aggregate comprised approximately
45%
of all Wholesale revenues and approximately
20%
of total net revenues. As of
March 30, 2013
, these
three
key wholesale customers represented approximately
30%
of gross accounts receivable.
Inventories
The Company holds inventory that is sold through wholesale distribution channels to major department stores and specialty retail stores, including the Company's own retail stores. The Company also holds retail inventory that is sold in its own stores and e-commerce sites directly to consumers. Wholesale and retail inventories are stated at the lower of cost or estimated realizable value, with cost primarily determined on a weighted-average cost basis.
The Company continuously evaluates the composition of its inventories, assessing slow-turning product and all fashion product. Estimated realizable value of inventory is determined based on an analysis of historical sales trends of the Company's individual product lines, the impact of market trends and economic conditions, and a forecast of future demand, giving consideration to the value of current orders in-house relating to the future sales of inventory. Estimates may differ from actual results due to quantity, quality, and mix of products in inventory, consumer and retailer preferences, and market conditions. Reserves for inventory shrinkage, representing the risk of physical loss of inventory, are estimated based on historical experience and are adjusted based upon physical inventory counts. The Company's historical estimates of these costs and its related provisions have not differed materially from actual results.
Property and Equipment, Net
Property and equipment, net is stated at cost less accumulated depreciation. Depreciation is calculated using the straight-line method based upon the estimated useful lives of depreciable assets, which range from
three
to
seven years
for furniture, fixtures, machinery and equipment, and computer software and equipment; and from
ten
to
forty years
for buildings and improvements. Leasehold improvements are depreciated over the shorter of the estimated useful lives of the respective assets or the term of the related lease.
Property and equipment, along with other long-lived assets, are evaluated for impairment periodically whenever events or changes in circumstances indicate that their related carrying values may not be recoverable. In evaluating long-lived assets for recoverability, including finite-lived intangibles as described below, the Company uses its best estimate of future cash flows expected to result from the use of the asset and its eventual disposition. To the extent that estimated future undiscounted net cash flows attributable to the asset are less than the carrying value, an impairment loss is recognized equal to the difference between the carrying value of such asset and its fair value, considering external market participant assumptions. Assets to be disposed of and for which there is a committed plan of disposal are reported at the lower of carrying value or fair value less costs to sell.
Goodwill and Other Intangible Assets
At acquisition, the Company estimates and records the fair value of purchased intangible assets, which typically consist of license agreements, customer relationships, non-compete agreements, and/or order backlog. The fair values of these intangible assets are estimated based on management's assessment, considering independent third-party appraisals when necessary. The excess of the purchase consideration over the fair value of net assets acquired, both tangible and intangible, is recorded as goodwill. Goodwill, including any goodwill included in the carrying value of investments accounted for using the equity method of accounting, and certain other intangible assets deemed to have indefinite useful lives, are not amortized. Rather, goodwill and such indefinite-lived intangible assets are assessed for impairment, at least annually, initially using a qualitative approach to determine whether it is more likely than not that the fair value of the assets is less than their respective carrying value. If, based on the results of the qualitative assessment, it is concluded that it is not more likely than not that the fair value of the intangible asset is greater than its carrying value, a quantitative test is performed. Under the quantitative test, if the carrying value of the asset exceeds its fair value, an impairment loss is recognized in the amount of the excess. Finite-lived intangible assets are amortized over their respective estimated useful lives and, along with other long-lived assets as noted above, are evaluated for impairment periodically whenever events or changes in circumstances indicate that their related carrying values may not be recoverable. See discussion of the Company's accounting policy for long-lived asset impairment as previously described under the caption
“Property and Equipment, Net.”
|
|
F-13
|
|
RALPH LAUREN CORPORATION
NOTES TO CONSOLIDATED FINANCIAL STATEMENTS (Continued)
Officers' Life Insurance Policies
The Company maintains certain split-dollar life insurance policies for select senior executives. These policies are recorded at the lesser of their cash-surrender value or aggregate premiums paid to date in the consolidated balance sheets. As of the end of
Fiscal 2013
and
Fiscal 2012
, approximately
$23 million
and
$33 million
, respectively, were classified within other non-current assets in the consolidated balance sheets, primarily relating to officers' split-dollar life insurance policies held by the Company.
Income Taxes
Income taxes are provided using the asset and liability method. Under this method, income taxes (i.e., deferred tax assets and liabilities, current taxes payable/refunds receivable, and tax expense) are recorded based on amounts refundable or payable in the current year and include the results of any difference between U.S. GAAP and tax reporting. Deferred income taxes reflect the tax effect of certain net operating loss, capital loss, and general business credit carryforwards and the net tax effects of temporary differences between the carrying amount of assets and liabilities for financial statement and income tax purposes, as determined under enacted tax laws and rates. The Company accounts for the financial effect of changes in tax laws or rates in the period of enactment.
In addition, valuation allowances are established when management determines that it is more likely than not that some portion or all of a deferred tax asset will not be realized. Tax valuation allowances are analyzed periodically and adjusted as events occur or circumstances change that warrant adjustments to those balances.
In determining the income tax provision for financial reporting purposes, the Company establishes a reserve for uncertain tax positions. If the Company considers that a tax position is more likely than not of being sustained upon audit, based solely on the technical merits of the position, it recognizes the tax benefit. The Company measures the tax benefit by determining the largest amount that is greater than
50%
likely of being realized upon settlement, presuming that the tax position is examined by the appropriate taxing authority that has full knowledge of all relevant information. These assessments can be complex and the Company often obtains assistance from external advisors. To the extent that the Company's estimates change or the final tax outcome of these matters is different than the amounts recorded, such differences will impact the income tax provision in the period in which such determinations are made. If the initial assessment fails to result in the recognition of a tax benefit, the Company regularly monitors its position and subsequently recognizes the tax benefit if (i) there are changes in tax law or analogous case law that sufficiently raise the likelihood of prevailing on the technical merits of the position to “more likely than not”; (ii) the statute of limitations expires; or (iii) there is a completion of an audit resulting in a settlement of that tax year with the appropriate agency. Uncertain tax positions are classified as current only when the Company expects to pay cash within the next twelve months. Interest and penalties, if any, are recorded within the provision for income taxes in the Company's consolidated statements of income and are classified on the consolidated balance sheets together with the related liability for unrecognized tax benefits.
See Note 13 for further discussion of the Company's income taxes.
Leases
The Company leases certain facilities and equipment, including the vast majority of its retail stores. Certain of the Company's leases contain renewal options, rent escalation clauses, and/or landlord incentives. Renewal terms generally reflect market rates at the time of renewal. Rent expense for noncancelable operating leases with scheduled rent increases and/or landlord incentives is recognized on a straight-line basis over the lease term, including any applicable rent holidays, beginning with the lease commencement date, or the date the Company takes control of the leased space, whichever is sooner. The excess of straight-line rent expense over scheduled payment amounts and landlord incentives is recorded as a deferred rent liability. As of the end of
Fiscal 2013
and
Fiscal 2012
, deferred rent obligations of approximately
$208 million
and
$193 million
, respectively, were classified primarily within other non-current liabilities in the Company's consolidated balance sheets.
In certain lease arrangements, the Company is involved with the construction of the building (generally on land owned by the landlord). If the Company concludes that it has substantively all of the risks of ownership during construction of a leased property and therefore is deemed the owner of the project for accounting purposes, it records an asset and related financing obligation for the amount of the total project costs related to construction-in-progress and the pre-existing building. Once construction is complete, the Company considers the requirements for sale-leaseback treatment, including the transfer back of all risks of ownership and whether the Company has any continuing involvement in the leased property. If the arrangement does not qualify for sale-leaseback treatment, the Company continues to amortize the financing obligation and depreciate the building over the lease term.
|
|
F-14
|
|
RALPH LAUREN CORPORATION
NOTES TO CONSOLIDATED FINANCIAL STATEMENTS (Continued)
Derivative Financial Instruments
The Company records all derivative financial instruments on its consolidated balance sheets at fair value. For derivative instruments that qualify for hedge accounting, the effective portion of changes in their fair value is either (i) offset against the changes in fair value of the hedged assets, liabilities, or firm commitments through earnings or (ii) recognized in equity as a component of AOCI until the hedged item is recognized in earnings, depending on whether the derivative is being used to hedge changes in fair value or cash flows, respectively.
Each derivative instrument entered into by the Company which qualifies for hedge accounting is expected to be highly effective at reducing the risk associated with the exposure being hedged. For each derivative instrument that is designated as a hedge, the Company formally documents the related risk management objective and strategy, including the identification of the hedging instrument, the hedged item, and the risk exposure, as well as how hedge effectiveness will be assessed prospectively and retrospectively. To assess the effectiveness of derivative instruments that are designated as hedges, the Company uses non-statistical methods, including the dollar-offset method, to compare the change in the fair value of the derivative instrument to the change in the fair value or cash flows of the related hedged item. The extent to which a hedging instrument has been and is expected to continue to be effective in achieving offsetting changes in fair value or cash flows is assessed and documented by the Company on at least a quarterly basis.
To the extent that a derivative instrument designated as a cash flow hedge is not considered to be effective, any change in its fair value relating to such ineffectiveness is immediately recognized in earnings within foreign currency gains (losses). If it is determined that a derivative instrument has not been highly effective, and will continue not to be highly effective in hedging the designated exposure, hedge accounting is discontinued and further gains (losses) are recognized in earnings within foreign currency gains (losses). If hedge accounting is discontinued, the cumulative change in fair value of the derivative instrument previously recorded in AOCI is recognized in earnings when the related hedged item affects earnings consistent with the original hedging strategy, unless the forecasted transaction is no longer probable of occurring in which case the accumulated amount is immediately recognized in earnings within foreign currency gains (losses).
As a result of the use of derivative instruments, the Company is exposed to the risk that the counterparties to such contracts will fail to meet their contractual obligations. To mitigate this counterparty credit risk, the Company has a policy of only entering into contracts with carefully selected financial institutions based upon an evaluation of their credit ratings and certain other financial factors, adhering to established limits for credit exposure. The Company’s established policies and procedures for mitigating credit risk from derivative transactions include continually reviewing and assessing the creditworthiness of counterparties. The Company also enters into master netting arrangements with counterparties when possible to mitigate credit risk associated with its derivative instruments, which allow, in certain instances, the Company to net settle amounts owed under multiple derivative transactions with the same counterparty. However, the fair values of the Company’s derivative instruments are recorded on its consolidated balance sheets on a gross basis.
For cash flow reporting purposes, the Company classifies proceeds received or amounts paid upon the settlement of a derivative instrument in the same manner as the related item being hedged.
Forward Foreign Currency Exchange Contracts
The Company primarily enters into forward foreign currency exchange contracts as hedges to reduce its risk related to exchange rate fluctuations on inventory purchases, intercompany royalty payments made by certain of its international operations, intercompany contributions made
to fund certain marketing efforts of its international operations, interest payments made in connection with outstanding debt, and other foreign currency-denominated operational cash flows. To the extent foreign currency exchange contracts designated as cash flow hedges are highly effective in offsetting the change in the value of the hedged item, the related gains (losses) are initially deferred in equity as a component of AOCI and subsequently recognized in the consolidated statements of income as follows:
|
•
|
Forecasted Inventory Purchases
— Recognized as part of the cost of the inventory purchases being hedged within cost of goods sold when the related inventory is sold.
|
|
•
|
Intercompany Royalty Payments and Marketing Contributions
— Recognized within foreign currency gains (losses) generally in the period in which the related royalties or marketing contributions being hedged are received or paid.
|
|
|
F-15
|
|
RALPH LAUREN CORPORATION
NOTES TO CONSOLIDATED FINANCIAL STATEMENTS (Continued)
|
•
|
Interest Payments on Euro Debt
— Recognized within foreign currency gains (losses) in the period in which the recorded liability impacts earnings due to foreign currency exchange remeasurement.
|
Hedge of a Net Investment in a Foreign Operation
Changes in the fair value of a derivative instrument or a non-derivative financial instrument (such as debt) that is designated as a hedge of a net investment in a foreign operation are reported in the same manner as a translation adjustment, to the extent it is effective as a hedge. In assessing the effectiveness of a non-derivative financial instrument that has been designated as a hedge of a net investment, the Company uses the spot rate method of accounting to remeasure foreign currency exchange rate changes in both its foreign subsidiaries and the financial instrument. If the notional amount of the financial instrument designated as a hedge of a net investment is greater than the portion of the net investment being hedged, hedge ineffectiveness is recognized immediately in earnings within foreign currency gains (losses). To the extent the financial instrument remains effective, changes in its value are recorded in equity as foreign currency translation gains (losses), a component of AOCI, until the sale or liquidation of the hedged net investment.
Fair Value Hedges
Changes in the fair value of a derivative instrument that has been designated as a fair value hedge, along with offsetting changes in the fair value of the hedged item attributable to the hedged risk, are recorded in earnings. Hedge ineffectiveness is recorded in earnings to the extent that the change in the fair value of the hedged item does not offset the change in the fair value of the hedging instrument.
Undesignated Hedges
All of the Company’s undesignated hedges are entered into to hedge specific economic risks, such as foreign currency exchange rate risk. Changes in the fair value of undesignated derivative instruments are immediately recognized in earnings within foreign currency gains (losses).
See Note 16 for further discussion of the Company's derivative financial instruments.
|
4.
|
Recently Issued Accounting Standards
|
Indefinite-Lived Intangible Assets Impairment Testing
In July 2012, the Financial Accounting Standards Board (“FASB”) issued revised guidance surrounding testing indefinite-lived intangible assets for impairment as Accounting Standards Update (“ASU”) No. 2012-02, “Testing Indefinite-Lived Intangible Assets for Impairment” (“ASU 2012-02”). ASU 2012-02 simplifies the testing of indefinite-lived intangible assets for impairment by providing entities with the option of performing a qualitative assessment to determine whether it is more likely than not that the fair value of an indefinite-lived intangible asset is less than its carrying value. The results of such assessment may be used as a basis for determining whether it is necessary to perform the quantitative impairment test required under Accounting Standards Codification (“ASC”) topic 350, “Intangibles — Goodwill and Other” (“ASC 350”). The Company early-adopted the provisions of ASU 2012-02 for its Fiscal 2013 annual indefinite-lived intangible assets impairment assessment. The application of ASU 2012-02 did not have an impact on the Company's consolidated financial statements.
Disclosure of Offsetting Assets and Liabilities
In December 2011, the FASB issued new, expanded disclosure requirements for financial instruments surrounding an entity’s rights of offset and related counterparty arrangements as ASU No. 2011-11, “Disclosures about Offsetting Assets and Liabilities” (“ASU 2011-11”). ASU 2011-11 requires disclosure of both “gross” and “net” information for recognized financial instruments (including derivatives) that are (i) eligible for offset and presented “net” in the balance sheet or (ii) subject to enforceable master netting agreements, irrespective of whether an entity actually offsets and “net presents” such instruments in the balance sheet. ASU 2011-11 also requires disclosure of any collateral received or posted in connection with master netting agreements or similar arrangements. In January 2013, the FASB issued ASU No. 2013-01, “Clarifying the Scope of Disclosures about Offsetting Assets and Liabilities,” which limited the scope of ASU 2011-11 to derivatives accounted for in accordance with ASC topic 815, “Derivatives and Hedging,” and securities borrowing and lending transactions. ASU 2011-11 requires retrospective application, and is effective for the Company as of the beginning of Fiscal 2014. The application of ASU 2011-11 is expected to expand the
|
|
F-16
|
|
RALPH LAUREN CORPORATION
NOTES TO CONSOLIDATED FINANCIAL STATEMENTS (Continued)
Company’s quarterly and annual financial instrument disclosures, but will not have an impact on its consolidated financial statements.
Goodwill Impairment Testing
In September 2011, the FASB issued revised guidance for goodwill impairment testing as ASU No. 2011-08, “Testing Goodwill for Impairment” (“ASU 2011-08”). ASU 2011-08 simplifies goodwill impairment testing by providing entities with the option of performing a qualitative assessment to determine whether it is more likely than not that the fair value of a reporting unit is less than its carrying value. The results of such assessment may be used as a basis for determining whether it is necessary to perform the two-step quantitative impairment test required under ASC 350. ASU 2011-08 became effective for the Company’s Fiscal 2013 annual goodwill impairment testing, which was performed during the second fiscal quarter using the qualitative assessment approach prescribed by the standard. The application of ASU 2011-08 did not have an impact on the Company’s consolidated financial statements.
Presentation of Comprehensive Income
In June 2011, the FASB issued revised guidance on the presentation of comprehensive income as ASU No. 2011-05, “Comprehensive Income: Presentation of Comprehensive Income” (“ASU 2011-05”). ASU 2011-05 eliminates the option to present the components of OCI as part of the consolidated statement of equity and provides two alternatives for presenting the components of net income and OCI, either: (i) in a single continuous statement of comprehensive income or (ii) in two separate but consecutive financial statements, consisting of an income statement followed by a separate statement of comprehensive income. Additionally, the original provision within ASU 2011-05, which required that items reclassified from AOCI to net income be presented on the face of the financial statements, was subsequently deferred by ASU No. 2011-12, “Deferral of the Effective Date for Amendments to the Presentation of Reclassifications of Items Out of Accumulated Other Comprehensive Income in Accounting Standards Update No. 2011-05,” issued in December 2011. The Company adopted the provisions of ASU 2011-05 in the first quarter of Fiscal 2013, which resulted in the inclusion of separate statements of comprehensive income for all periods presented within its consolidated financial statements.
In February 2013, the FASB issued ASU No. 2013-02, “Reporting of Amounts Reclassified Out of Accumulated Other Comprehensive Income” (“ASU 2013-02”). ASU 2013-02 requires disclosure of significant amounts reclassified out of AOCI by component. If the amounts are required to be reclassified from AOCI to net income in their entirety in the same reporting period, the effect of such reclassifications on the relevant line items of net income must be presented either on the face of the financial statements or in the notes. For amounts that are not required to be reclassified to net income in their entirety in the same reporting period, cross-references to other disclosures that provide additional details about such reclassifications are required. ASU 2013-02 does not change the current requirements for determining or reporting net income or OCI. ASU 2013-02 requires prospective application, and is effective for the Company as of the beginning of Fiscal 2014. The application of ASU 2013-02 is expected to expand the Company's quarterly and annual OCI-related disclosures, but will not have an impact on its consolidated financial statements.
Proposed Amendments to Current Accounting Standards
The FASB is currently working on amendments to existing accounting standards governing a number of areas including, but not limited to, accounting for leases. In May 2013, the FASB issued a new exposure draft, “Leases” (the “Exposure Draft”), which would replace the existing guidance in ASC topic 840, “Leases.” Under the Exposure Draft, among other changes in practice, a lessee's rights and obligations under most leases, including existing and new arrangements, would be recognized as assets and liabilities, respectively, on the balance sheet. Other significant provisions of the Exposure Draft include (i) defining the “lease term” to include the noncancellable period together with periods for which there is a significant economic incentive for the lessee to extend or not terminate the lease; (ii) defining the initial lease liability to be recorded on the balance sheet to contemplate only those variable lease payments that depend on an index or that are in substance “fixed”; and (iii) a dual approach for determining whether lease expense is recognized on a straight-line or accelerated basis, depending on whether the lessee is expected to consume more than an insignificant portion of the leased asset's economic benefits. The comment period for the Exposure Draft ends on September 13, 2013. If and when effective, this proposed standard will likely have a significant impact on the Company's consolidated financial statements. However, as the standard-setting process is still ongoing, the Company is unable at this time to determine the impact this proposed change in accounting will have on its consolidated financial statements.
|
|
F-17
|
|
RALPH LAUREN CORPORATION
NOTES TO CONSOLIDATED FINANCIAL STATEMENTS (Continued)
|
5.
|
Acquisitions
|
South Korea Licensed Operations Acquisition
On January 1, 2011, in connection with the transition of the Ralph Lauren-branded apparel and accessories business in South Korea (the “Ralph Lauren South Korea business”) from a licensed to a wholly-owned operation, the Company acquired certain net assets (including inventory) and employees from Doosan Corporation (“Doosan”) in exchange for an initial payment of approximately
$25 million
plus an additional aggregate payment of approximately
$22 million
(the “South Korea Licensed Operations Acquisition”). Doosan was the Company's licensee for the Ralph Lauren South Korea business. The Company funded the South Korea Licensed Operations Acquisition with available cash on-hand.
The Company accounted for the South Korea Licensed Operations Acquisition as a business combination during the third quarter of Fiscal 2011. The acquisition cost of
$47 million
(excluding transaction costs) was allocated to the net assets acquired based on their respective fair values as follows: inventory of
$8 million
; property and equipment of
$7 million
; customer relationship intangible asset of
$26 million
; other net assets of
$3 million
; and non tax-deductible goodwill of
$3 million
. Goodwill represents the excess of the purchase price over the fair value of net tangible and identifiable intangible assets acquired. Transaction costs of
$3 million
were expensed as incurred and classified within SG&A expenses in the consolidated statement of income during Fiscal 2011.
The customer relationship intangible asset was valued using the excess earnings method. This approach discounts the estimated after tax cash flows associated with the existing base of customers as of the acquisition date, factoring in expected attrition of the existing customer base. The customer relationship intangible asset is being amortized over its estimated useful life of
ten years
.
The operating results for the Ralph Lauren South Korea business have been consolidated in the Company's operating results beginning on January 1, 2011.
See Note 25 for disclosures related to the Company's Fiscal 2014 acquisition of the North American Chaps-branded men's sportswear license in April 2013.
|
6.
|
Inventories
|
Inventories consist of the following:
|
March 30,
2013 |
March 31,
2012 |
|||||||
|
|
(millions)
|
|||||||
|
Raw materials
|
$
|
5.1
|
|
$
|
5.1
|
|
||
|
Work-in-process
|
1.3
|
|
1.1
|
|
||||
|
Finished goods
|
889.7
|
|
835.4
|
|
||||
|
Total inventories
|
$
|
896.1
|
|
$
|
841.6
|
|
||
|
|
F-18
|
|
RALPH LAUREN CORPORATION
NOTES TO CONSOLIDATED FINANCIAL STATEMENTS (Continued)
|
7.
|
Property and Equipment
|
Property and equipment, net consists of the following:
|
March 30,
2013 |
March 31,
2012 |
|||||||
|
|
(millions)
|
|||||||
|
Land and improvements
|
$
|
9.9
|
|
$
|
9.9
|
|
||
|
Buildings and improvements
|
130.4
|
|
132.7
|
|
||||
|
Furniture and fixtures
|
601.2
|
|
561.8
|
|
||||
|
Machinery and equipment
|
188.8
|
|
157.4
|
|
||||
|
Capitalized software
|
252.1
|
|
213.6
|
|
||||
|
Leasehold improvements
|
934.2
|
|
898.2
|
|
||||
|
Construction in progress
|
136.9
|
|
84.9
|
|
||||
|
2,253.5
|
|
2,058.5
|
|
|||||
|
Less: accumulated depreciation
|
(1,321.3
|
)
|
(1,174.4
|
)
|
||||
|
Property and equipment, net
|
$
|
932.2
|
|
$
|
884.1
|
|
||
|
8.
|
Goodwill and Other Intangible Assets
|
As discussed in Note 3, goodwill and certain other intangible assets deemed to have indefinite useful lives are not amortized, but rather are subject to annual impairment testing. Finite-lived intangible assets continue to be amortized over their respective estimated useful lives.
Goodwill
The following table details the changes in goodwill for each of the Company's reportable segments during
Fiscal 2013
and
Fiscal 2012
:
|
Wholesale
|
Retail
|
Licensing
|
Total
|
|||||||||||||
|
(millions)
|
||||||||||||||||
|
Balance at April 2, 2011
|
$
|
645.1
|
|
$
|
225.4
|
|
$
|
145.8
|
|
$
|
1,016.3
|
|
||||
|
Adjustments related to foreign currency
|
(9.8
|
)
|
(2.2
|
)
|
(0.3
|
)
|
(12.3
|
)
|
||||||||
|
Balance at March 31, 2012
|
635.3
|
|
223.2
|
|
145.5
|
|
1,004.0
|
|
||||||||
|
Adjustments related to foreign currency
|
(21.0
|
)
|
(9.3
|
)
|
(5.7
|
)
|
(36.0
|
)
|
||||||||
|
Balance at March 30, 2013
|
$
|
614.3
|
|
$
|
213.9
|
|
$
|
139.8
|
|
$
|
968.0
|
|
||||
Based on the results of the Company's annual goodwill impairment testing in
Fiscal 2013
,
Fiscal 2012
, and
Fiscal 2011
, no impairment charges were required.
|
|
F-19
|
|
RALPH LAUREN CORPORATION
NOTES TO CONSOLIDATED FINANCIAL STATEMENTS (Continued)
Other Intangible Assets
Other intangible assets consist of the following:
|
March 30, 2013
|
March 31, 2012
|
|||||||||||||||||||||||
|
Gross Carrying Amount
|
Accum. Amort.
|
Net
|
Gross Carrying Amount
|
Accum. Amort.
|
Net
|
|||||||||||||||||||
|
(millions)
|
||||||||||||||||||||||||
|
Intangible assets subject to amortization:
|
||||||||||||||||||||||||
|
Re-acquired licensed trademarks
|
$
|
227.7
|
|
$
|
(93.8
|
)
|
$
|
133.9
|
|
$
|
232.7
|
|
$
|
(90.6
|
)
|
$
|
142.1
|
|
||||||
|
Customer relationships
|
265.1
|
|
(98.5
|
)
|
166.6
|
|
278.9
|
|
(86.8
|
)
|
192.1
|
|
||||||||||||
|
Other
|
29.5
|
|
(9.4
|
)
|
20.1
|
|
(a)
|
24.4
|
|
(8.4
|
)
|
16.0
|
|
|||||||||||
|
Total intangible assets subject to amortization
|
522.3
|
|
(201.7
|
)
|
320.6
|
|
536.0
|
|
(185.8
|
)
|
350.2
|
|
||||||||||||
|
Intangible assets not subject to amortization:
|
||||||||||||||||||||||||
|
Trademarks and brands
|
7.3
|
|
N/A
|
|
7.3
|
|
(a)
|
8.8
|
|
N/A
|
|
8.8
|
|
|||||||||||
|
Total intangible assets
|
$
|
529.6
|
|
$
|
(201.7
|
)
|
$
|
327.9
|
|
$
|
544.8
|
|
$
|
(185.8
|
)
|
$
|
359.0
|
|
||||||
|
(a)
|
Includes the impact of impairment charges totaling
$1.7 million
related to the write-off of certain intangible assets in connection with the Rugby Closure Plan.
|
Amortization
Based on the amount of intangible assets subject to amortization as of
March 30, 2013
, the expected amortization for each of the next five fiscal years and thereafter is as follows:
|
Amortization Expense
|
||||
|
(millions)
|
||||
|
Fiscal 2014
|
$
|
26.5
|
|
|
|
Fiscal 2015
|
26.4
|
|
||
|
Fiscal 2016
|
26.4
|
|
||
|
Fiscal 2017
|
26.0
|
|
||
|
Fiscal 2018
|
24.5
|
|
||
|
Fiscal 2019 and thereafter
|
190.8
|
|
||
|
Total
|
$
|
320.6
|
|
|
The expected future amortization expense above reflects weighted-average estimated useful lives of
16.5 years
for re-acquired licensed trademarks,
11.4 years
for customer relationships, and
13.8 years
for the Company's finite-lived intangible assets in total.
|
|
F-20
|
|
RALPH LAUREN CORPORATION
NOTES TO CONSOLIDATED FINANCIAL STATEMENTS (Continued)
|
9.
|
Other Current and Non-Current Assets
|
Prepaid expenses and other current assets consist of the following:
|
March 30,
2013 |
March 31,
2012 |
|||||||
|
|
(millions)
|
|||||||
|
Prepaid rent expense
|
$
|
27.7
|
|
$
|
26.3
|
|
||
|
Restricted cash
|
1.4
|
|
14.0
|
|
||||
|
Derivative financial instruments
|
14.9
|
|
32.1
|
|
||||
|
Other taxes receivable
|
30.6
|
|
26.0
|
|
||||
|
Prepaid samples
|
13.8
|
|
18.6
|
|
||||
|
Other prepaid expenses and current assets
|
73.5
|
|
64.0
|
|
||||
|
Total prepaid expenses and other current assets
|
$
|
161.9
|
|
$
|
181.0
|
|
||
Other non-current assets consist of the following:
|
March 30,
2013 |
March 31,
2012 |
|||||||
|
|
(millions)
|
|||||||
|
Equity-method investments
|
$
|
—
|
|
(a)
|
$
|
2.5
|
|
|
|
Officers' life insurance policies
|
23.3
|
|
33.4
|
|
||||
|
Restricted cash
|
40.5
|
|
33.7
|
|
||||
|
Security Deposits
|
22.8
|
|
13.8
|
|
||||
|
Other non-current assets
|
38.1
|
|
46.3
|
|
||||
|
Total other non-current assets
|
$
|
124.7
|
|
$
|
129.7
|
|
||
|
(a)
|
As of March 30, 2013, the equity-method investments balance was
zero
, as the Company's historical cash contributions invested in the RL Watch Company have been offset by its
50%
share of cumulative losses recognized by the RL Watch Company.
|
|
10.
|
Other Current Liabilities and Non-Current Liabilities
|
Accrued expenses and other current liabilities consist of the following:
|
March 30,
2013 |
March 31,
2012 |
|||||||
|
|
(millions)
|
|||||||
|
Accrued operating expenses
|
$
|
172.3
|
|
$
|
175.7
|
|
||
|
Accrued payroll and benefits
|
199.3
|
|
227.7
|
|
||||
|
Accrued inventory
|
93.3
|
|
108.0
|
|
||||
|
Accrued capital expenditures
|
52.6
|
|
45.4
|
|
||||
|
Deferred income
|
40.3
|
|
50.3
|
|
||||
|
Other taxes payable
|
50.9
|
|
47.1
|
|
||||
|
Dividends payable
|
36.4
|
|
18.5
|
|
||||
|
Other accrued expenses and current liabilities
|
19.5
|
|
21.0
|
|
||||
|
Total accrued expenses and other current liabilities
|
$
|
664.6
|
|
$
|
693.7
|
|
||
|
|
F-21
|
|
RALPH LAUREN CORPORATION
NOTES TO CONSOLIDATED FINANCIAL STATEMENTS (Continued)
Other non-current liabilities consist of the following:
|
March 30,
2013 |
March 31,
2012 |
|||||||
|
|
(millions)
|
|||||||
|
Capital lease obligations
|
$
|
38.4
|
|
$
|
38.3
|
|
||
|
Deferred rent obligations
|
189.2
|
|
176.9
|
|
||||
|
Deferred income
|
57.6
|
|
78.2
|
|
||||
|
Deferred tax liabilities
|
29.7
|
|
35.2
|
|
||||
|
Other non-current liabilities
|
47.2
|
|
46.7
|
|
||||
|
Total other non-current liabilities
|
$
|
362.1
|
|
$
|
375.3
|
|
||
|
11.
|
Impairments of Assets
|
During
Fiscal 2013
, the Company recorded non-cash impairment charges of
$19.0 million
, which included
$11.4 million
of impairment charges to reduce the carrying values of certain long-lived assets related to its
14
global freestanding retail Rugby stores to their estimated fair values in connection with the closure of
13
Rugby
stores in Fiscal 2013 and the expected closure of the
one
remaining store in Fiscal 2014. In addition, during Fiscal 2013, the Company recorded non-cash impairment charges of
$7.6 million
to reduce the carrying values of long-lived assets of certain underperforming European stores to their fair values, as well as to write-off the fixed assets of certain wholesale locations in Europe that are expected to close.
During
Fiscal 2012
, the Company recorded non-cash impairment charges of
$2.2 million
, primarily to reduce the carrying values of the long-lived assets of certain underperforming European retail stores to their estimated fair values.
During
Fiscal 2011
, the Company recorded non-cash impairment charges of
$2.5 million
to reduce the net carrying values of certain retail store and concession shop long-lived assets in the Asia-Pacific region to their estimated fair values, which were calculated based on discounted expected cash flows, as it was determined that they would no longer be used over their intended service period.
|
12.
|
Restructuring
|
The Company has recorded restructuring liabilities relating to various business growth and cost-savings initiatives. A description of significant restructuring activities and associated costs is included below.
Fiscal 2013 Restructuring
Rugby Closure Plan
On October 30, 2012, the Company approved a plan to wind-down its Rugby brand retail operations (the "Rugby Closure Plan"). This decision was primarily based on the results of an analysis of the brand concept, as well as an opportunity for the Company to reallocate its resources related to these operations to support other high-growth business opportunities and initiatives. In connection with the Rugby Closure Plan,
13
of the Company’s
14
global freestanding Rugby stores (certain of which will be converted to other Ralph Lauren brand concepts) and its related domestic e-commerce site located at Rugby.com were closed during Fiscal 2013. The
one
remaining Rugby store is expected to be closed during Fiscal 2014. The Rugby Closure Plan resulted in a reduction in workforce of approximately
160
employees.
|
|
F-22
|
|
RALPH LAUREN CORPORATION
NOTES TO CONSOLIDATED FINANCIAL STATEMENTS (Continued)
In connection with the Rugby Closure Plan, the Company recorded
$7.1 million
in restructuring charges during Fiscal 2013. A summary of these charges and activity in the related liability is as follows:
|
Severance
and Benefits Costs
|
Lease Termination Costs
|
Other
Costs
|
Total
|
|||||||||||||
|
(millions)
|
||||||||||||||||
|
Balance at March 31, 2012
|
$
|
—
|
|
$
|
—
|
|
$
|
—
|
|
$
|
—
|
|
||||
|
Additions charged to expense
|
2.1
|
|
3.6
|
|
1.4
|
|
7.1
|
|
||||||||
|
Cash payments charged against reserve
|
(1.0
|
)
|
(2.2
|
)
|
(0.6
|
)
|
(3.8
|
)
|
||||||||
|
Non-cash adjustments
|
—
|
|
0.4
|
|
—
|
|
0.4
|
|
||||||||
|
Balance at March 30, 2013
|
$
|
1.1
|
|
$
|
1.8
|
|
$
|
0.8
|
|
$
|
3.7
|
|
||||
Other Restructuring Charges
In addition to the restructuring charges incurred in connection with the Rugby Closure Plan, the Company recorded
$4.6 million
of other net restructuring charges during
Fiscal 2013
, including
$3.0 million
of severance and lease termination costs associated with the suspension of the Company's operations in Argentina,
$2.7 million
of severance and lease termination costs associated with the Company's European operations, and
$1.5 million
of severance costs primarily associated with the Company's corporate operations, partially offset by
$2.6 million
of reversals of reserves deemed no longer necessary in connection with the Company's Fiscal 2012 Asia-Pacific Restructuring Plan, as defined below. As of March 30, 2013, the aggregate remaining liability related to these actions was
$3.6 million
.
The remaining balances of the above restructuring activities are expected to be paid in Fiscal 2014.
Fiscal 2012 Restructuring
During
Fiscal 2012
, the Company initiated a plan to reposition and upgrade its existing distribution network and merchandising operations in the Asia-Pacific region, which includes mainland China, Macau, Hong Kong, Taiwan, Malaysia, Singapore, Japan, and South Korea (the “Asia-Pacific Restructuring Plan”). The Asia-Pacific Restructuring Plan included a reduction in workforce of approximately
280
employees and the closure of approximately
95
stores and concession shops that did not support the new merchandising strategy. In connection with the Asia-Pacific Restructuring Plan, the Company recorded
$5.5 million
in restructuring charges during
Fiscal 2012
.
In addition to the restructuring charges incurred in connection with the Asia-Pacific Restructuring Plan, the Company recognized
$6.9 million
of other restructuring charges during Fiscal 2012, including
$3.1 million
of costs associated with the discontinuance of the majority of the products sold under the American Living brand at J.C. Penney Company, Inc., primarily related to severance.
Fiscal 2011 Restructuring
During Fiscal 2011, the Company recognized net restructuring charges of
$2.6 million
, primarily related to employee termination costs associated with its wholesale operations and the closing of a warehouse facility, partially offset by reversals of reserves deemed no longer necessary, largely associated with previously closed retail stores.
|
|
F-23
|
|
RALPH LAUREN CORPORATION
NOTES TO CONSOLIDATED FINANCIAL STATEMENTS (Continued)
|
13.
|
Income Taxes
|
Taxes on Income
Domestic and foreign pretax income are as follows:
|
|
Fiscal Years Ended
|
|||||||||||
|
|
March 30,
2013 |
March 31,
2012 |
April 2,
2011 |
|||||||||
|
|
(millions)
|
|||||||||||
|
Domestic
|
$
|
671.8
|
|
$
|
618.4
|
|
$
|
578.4
|
|
|||
|
Foreign
|
417.5
|
|
396.7
|
|
247.0
|
|
||||||
|
Total income before provision for income taxes
|
$
|
1,089.3
|
|
$
|
1,015.1
|
|
$
|
825.4
|
|
|||
Provisions (benefits) for current and deferred income taxes are as follows:
|
|
Fiscal Years Ended
|
|||||||||||
|
|
March 30,
2013 |
March 31,
2012 |
April 2,
2011 |
|||||||||
|
|
(millions)
|
|||||||||||
|
Current:
|
||||||||||||
|
Federal
(a)
|
$
|
188.8
|
|
$
|
203.2
|
|
$
|
126.1
|
|
|||
|
State and local
(a)
|
41.7
|
|
50.9
|
|
44.4
|
|
||||||
|
Foreign
|
94.4
|
|
95.1
|
|
40.0
|
|
||||||
|
324.9
|
|
349.2
|
|
210.5
|
|
|||||||
|
Deferred:
|
||||||||||||
|
Federal
|
9.6
|
|
3.9
|
|
55.3
|
|
||||||
|
State and local
|
4.7
|
|
(1.8
|
)
|
0.2
|
|
||||||
|
Foreign
|
0.1
|
|
(17.2
|
)
|
(8.2
|
)
|
||||||
|
14.4
|
|
(15.1
|
)
|
47.3
|
|
|||||||
|
Total provision for income taxes
|
$
|
339.3
|
|
$
|
334.1
|
|
$
|
257.8
|
|
|||
|
(a)
|
Excludes federal, state, and local tax benefits of approximately
$41 million
,
$40 million
, and
$43 million
in
Fiscal 2013
,
Fiscal 2012
, and
Fiscal 2011
, respectively, resulting from stock-based compensation arrangements. Such amounts were recorded within equity.
|
|
|
F-24
|
|
RALPH LAUREN CORPORATION
NOTES TO CONSOLIDATED FINANCIAL STATEMENTS (Continued)
Tax Rate Reconciliation
The differences between income taxes expected at the U.S. federal statutory income tax rate of
35%
and income taxes provided are as set forth below:
|
|
Fiscal Years Ended
|
|||||||||||
|
|
March 30,
2013 |
March 31,
2012 |
April 2,
2011 |
|||||||||
|
|
(millions)
|
|||||||||||
|
Provision for income taxes at the U.S. federal statutory rate
|
$
|
381.3
|
|
$
|
355.3
|
|
$
|
288.9
|
|
|||
|
Increase (decrease) due to:
|
||||||||||||
|
State and local income taxes, net of federal benefit
|
28.1
|
|
27.9
|
|
26.9
|
|
||||||
|
Foreign income taxed at different rates, net of U.S. foreign tax credits
|
(75.3
|
)
|
(55.5
|
)
|
(69.5
|
)
|
||||||
|
Unrecognized tax benefits and settlements of tax examinations
|
6.5
|
|
11.7
|
|
11.2
|
|
||||||
|
Other
|
(1.3
|
)
|
(5.3
|
)
|
0.3
|
|
||||||
|
Total provision for income taxes
|
$
|
339.3
|
|
$
|
334.1
|
|
$
|
257.8
|
|
|||
The Company's effective tax rate is lower than the statutory rate principally as a result of the proportion of earnings generated in lower taxed foreign jurisdictions versus the U.S.
Deferred Taxes
Significant components of the Company's net deferred tax assets (liabilities) are as follows:
|
|
March 30,
2013 |
March 31,
2012 |
||||||
|
|
(millions)
|
|||||||
|
Current deferred tax assets:
|
||||||||
|
Receivable allowances and reserves
|
$
|
68.8
|
|
$
|
57.5
|
|
||
|
Inventory basis difference
|
18.5
|
|
21.9
|
|
||||
|
Other
|
11.1
|
|
19.0
|
|
||||
|
Deferred compensation
|
20.9
|
|
12.6
|
|
||||
|
Deferred income
|
—
|
|
8.0
|
|
||||
|
Net operating loss and other tax attributed carryforwards
|
0.2
|
|
3.9
|
|
||||
|
Valuation allowance
|
(0.5
|
)
|
(0.7
|
)
|
||||
|
Net current deferred tax assets
(a)
|
119.0
|
|
122.2
|
|
||||
|
Non-current deferred tax assets (liabilities):
|
||||||||
|
Property and equipment
|
26.8
|
|
26.6
|
|
||||
|
Goodwill and other intangible assets
|
(211.3
|
)
|
(207.8
|
)
|
||||
|
Net operating loss carryforwards
|
15.7
|
|
16.7
|
|
||||
|
Cumulative translation adjustment and hedges
|
(3.9
|
)
|
(4.2
|
)
|
||||
|
Deferred compensation
|
68.4
|
|
64.2
|
|
||||
|
Deferred income
|
33.2
|
|
31.4
|
|
||||
|
Unrecognized tax benefits
|
35.0
|
|
48.1
|
|
||||
|
Transfer pricing
|
19.9
|
|
20.8
|
|
||||
|
Deferred rent
|
19.9
|
|
19.6
|
|
||||
|
Other
|
0.5
|
|
3.6
|
|
||||
|
Valuation allowance
|
(12.3
|
)
|
(14.4
|
)
|
||||
|
Net non-current deferred tax assets (liabilities)
(b)
|
(8.1
|
)
|
4.6
|
|
||||
|
Net deferred tax assets
|
$
|
110.9
|
|
$
|
126.8
|
|
||
|
|
F-25
|
|
RALPH LAUREN CORPORATION
NOTES TO CONSOLIDATED FINANCIAL STATEMENTS (Continued)
|
(a)
|
Net current deferred tax balances as of
March 30, 2013
and
March 31, 2012
included current deferred tax liabilities of
$0.7 million
and
$3.4 million
, respectively, recorded within accrued expenses and other current liabilities in the consolidated balance sheets.
|
|
(b)
|
Net non-current deferred tax balances as of
March 30, 2013
and
March 31, 2012
were comprised of non-current deferred tax assets of
$21.6 million
and
$39.8 million
, respectively, included within deferred tax assets, and non-current deferred tax liabilities of
$29.7 million
and
$35.2 million
, respectively, recorded within other non-current liabilities in the consolidated balance sheets.
|
The Company has available state and foreign net operating loss carryforwards of
$3.8 million
and
$21.7 million
, respectively, for tax purposes to offset future taxable income. The net operating loss carryforwards expire beginning in Fiscal 2014.
Also, the Company has available state and foreign net operating loss carryforwards of
$11.1 million
and
$53.2 million
, respectively, for which no net deferred tax asset has been recognized. A full valuation allowance has been recorded since management does not believe that the Company will more likely than not be able to utilize these carryforwards to offset future taxable income. Subsequent recognition of these deferred tax assets would result in an income tax benefit in the year of such recognition. The valuation allowance relating to state net operating loss carryforwards decreased
$0.2 million
primarily due to the Company's ability to utilize certain state net operating loss carryforwards. The valuation allowance relating to foreign net operating loss carryforwards increased
$7.0 million
as a result of the Company's inability to utilize certain foreign net operating loss carryforwards.
Provision has not been made for U.S. or additional foreign taxes on
$1.899 billion
of undistributed earnings of foreign subsidiaries. Those historical earnings have been and are expected to continue to be permanently reinvested. These earnings could become subject to tax if they were remitted as dividends, if foreign earnings were lent to RLC, a subsidiary or a U.S. affiliate of RLC, or if the stock of the subsidiaries were sold. Determination of the amount of unrecognized deferred tax liability with respect to such earnings is not practical. Management believes that the amount of the additional taxes that might be payable on the earnings of foreign subsidiaries, if remitted, would be partially offset by U.S. foreign tax credits.
Uncertain Income Tax Benefits
Fiscal 2013
,
Fiscal 2012
, and
Fiscal 2011
Activity
A reconciliation of the beginning and ending amounts of unrecognized tax benefits, excluding interest and penalties, for
Fiscal 2013
,
Fiscal 2012
, and
Fiscal 2011
is presented below:
|
|
Fiscal Years Ended
|
|||||||||||
|
|
March 30,
2013 |
March 31,
2012 |
April 2,
2011 |
|||||||||
|
|
(millions)
|
|||||||||||
|
Unrecognized tax benefits beginning balance
|
$
|
129.0
|
|
$
|
125.0
|
|
$
|
96.2
|
|
|||
|
Additions related to current period tax positions
|
4.1
|
|
3.5
|
|
2.2
|
|
||||||
|
Additions related to prior period tax positions
|
11.6
|
|
7.8
|
|
45.6
|
|
||||||
|
Reductions related to prior period tax positions
|
(31.9
|
)
|
(3.5
|
)
|
(18.0
|
)
|
||||||
|
Reductions related to expiration of statutes of limitations
|
(0.9
|
)
|
(1.5
|
)
|
(1.4
|
)
|
||||||
|
Reductions related to settlements with taxing authorities
|
(10.4
|
)
|
—
|
|
(2.4
|
)
|
||||||
|
Additions (reductions) related to foreign currency translation
|
(1.6
|
)
|
(2.3
|
)
|
2.8
|
|
||||||
|
Unrecognized tax benefits ending balance
|
$
|
99.9
|
|
$
|
129.0
|
|
$
|
125.0
|
|
|||
|
|
F-26
|
|
RALPH LAUREN CORPORATION
NOTES TO CONSOLIDATED FINANCIAL STATEMENTS (Continued)
The Company classifies interest and penalties related to unrecognized tax benefits as part of its provision for income taxes. A reconciliation of the beginning and ending amounts of accrued interest and penalties related to unrecognized tax benefits for
Fiscal 2013
,
Fiscal 2012
, and
Fiscal 2011
is presented below:
|
|
Fiscal Years Ended
|
|||||||||||
|
|
March 30,
2013 |
|
March 31,
2012 |
April 2,
2011 |
||||||||
|
|
(millions)
|
|||||||||||
|
Accrued interest and penalties beginning balance
|
$
|
39.0
|
|
|
$
|
31.4
|
|
$
|
29.8
|
|
||
|
Net additions charged to expense
|
22.6
|
|
(a)
|
8.3
|
|
1.2
|
|
|||||
|
Reductions related to prior period tax positions
|
(9.9
|
)
|
(0.3
|
)
|
—
|
|
||||||
|
Reductions related to settlements with taxing authorities
|
(1.2
|
)
|
—
|
|
—
|
|
||||||
|
Additions (reductions) related to foreign currency translation
|
(0.2
|
)
|
|
(0.4
|
)
|
0.4
|
|
|||||
|
Accrued interest and penalties ending balance
|
$
|
50.3
|
|
|
$
|
39.0
|
|
$
|
31.4
|
|
||
|
(a)
|
Includes a reserve of
$16.8 million
for an interest assessment on a prior year withholding tax. No underlying tax exposure exists. The interest assessed was not material to the Company’s consolidated financial statements in any prior fiscal period and is not material for Fiscal
2013
.
|
The total amount of unrecognized tax benefits, including interest and penalties, was
$150.2 million
and
$168.0 million
as of as of
March 30, 2013
and
March 31, 2012
, respectively, and is included within the non-current liability for unrecognized tax benefits in the consolidated balance sheets. The total amount of unrecognized tax benefits that, if recognized, would affect the Company’s effective tax rate was
$115.1 million
and
$119.8 million
as of
March 30, 2013
and
March 31, 2012
, respectively.
Future Changes in Unrecognized Tax Benefits
The total amount of unrecognized tax benefits relating to the Company’s tax positions is subject to change based on future events including, but not limited to, the settlements of ongoing tax audits and assessments and the expiration of applicable statutes of limitations. Although the outcomes and timing of such events are highly uncertain, the Company does not anticipate that the balance of gross unrecognized tax benefits, excluding interest and penalties, will change significantly during the next twelve months. However, changes in the occurrence, expected outcomes, and timing of those events could cause the Company’s current estimate to change materially in the future.
During the third quarter of Fiscal 2013, the Company reached a settlement agreement with respect to a tax examination for the taxable years ended March 29, 2008 through April 3, 2010. In connection with this agreement, the Company recognized a tax benefit of
$15.4 million
. The Company's unrecognized tax benefits declined by approximately
$33.7 million
, excluding interest and penalties, as a result of this settlement.
The Company files tax returns in the U.S. federal and various state, local, and foreign jurisdictions. With few exceptions for those tax returns, the Company is no longer subject to examinations by the relevant tax authorities for years prior to Fiscal 2004.
|
14.
|
Debt
|
Debt consists of the following:
|
March 30,
2013 |
March 31,
2012 |
|||||||
|
(millions)
|
||||||||
|
4.5% Euro-denominated notes due October 4, 2013
|
$
|
266.6
|
|
$
|
274.4
|
|
||
|
Total debt
|
266.6
|
|
274.4
|
|
||||
|
Less: current portion of long-term debt
|
266.6
|
|
—
|
|
||||
|
Long-term debt
|
$
|
—
|
|
$
|
274.4
|
|
||
|
|
F-27
|
|
RALPH LAUREN CORPORATION
NOTES TO CONSOLIDATED FINANCIAL STATEMENTS (Continued)
Euro Debt
As of
March 30, 2013
, the Company had
€209.2 million
principal outstanding of
4.5%
notes due
October 4, 2013
(the “Euro Debt”). The Company has the option to redeem all of the outstanding Euro Debt at any time at a price equal to the principal amount plus a premium. The Company also has the option to redeem all of the outstanding Euro Debt at any time at par plus accrued interest in the event of certain developments involving U.S. tax law. Partial redemption of the Euro Debt is not permitted in either instance. In the event of a change of control of the Company, each holder of the Euro Debt has the option to require the Company to redeem the debt at its principal amount plus accrued interest.
The indenture governing the Euro Debt (the “Indenture”) contains certain limited covenants that restrict the Company’s ability, subject to specified exceptions, to incur liens or enter into a sale and leaseback transaction for any principal property. The Indenture does not contain any financial covenants.
Refer to Note 16 for discussion of the designation of the Company's Euro Debt as a hedge of its net investment in certain of its European subsidiaries.
Revolving Credit Facilities
Global Credit Facility
The Company has a credit facility that provides for a
$500 million
senior unsecured revolving line of credit through
March 2016
, which is also used to support the issuance of letters of credit (the “Global Credit Facility”). Borrowings under the Global Credit Facility may be denominated in U.S. Dollars and other currencies, including Euros, Hong Kong Dollars, and Japanese Yen. The Company has the ability to expand its borrowing availability to
$750 million
, subject to the agreement of one or more new or existing lenders under the facility to increase their commitments. There are no mandatory reductions in borrowing ability throughout the term of the Global Credit Facility. As of
March 30, 2013
, there were
no
borrowings outstanding under the Global Credit Facility and the Company was contingently liable for
$14.0 million
of outstanding letters of credit.
U.S. Dollar-denominated borrowings under the Global Credit Facility bear interest, at the Company's option, either at (a) a base rate, by reference to the greatest of: (i) the annual prime commercial lending rate of JPMorgan Chase Bank, N.A. in effect from time to time, (ii) the weighted-average overnight Federal funds rate plus
50 basis points
, or (iii) the one-month London Interbank Offered Rate (“LIBOR”) plus
100 basis points
; or (b) LIBOR, adjusted for the Federal Reserve Board's Eurocurrency liabilities maximum reserve percentage, plus a spread of
112.5 basis points
, subject to adjustment based on the Company's credit ratings (“Adjusted LIBOR”). Foreign currency-denominated borrowings bear interest at Adjusted LIBOR.
In addition to paying interest on any outstanding borrowings under the Global Credit Facility, the Company is required to pay a commitment fee to the lenders under the Global Credit Facility with respect to the unutilized commitments. The commitment fee rate of
15
basis points under the terms of the Global Credit Facility is subject to adjustment based on the Company's credit ratings.
The Global Credit Facility contains a number of covenants that, among other things, restrict the Company’s ability, subject to specified exceptions, to incur additional debt, incur liens, sell or dispose of assets, merge with or acquire other companies, liquidate or dissolve itself, engage in businesses that are not in a related line of business, make loans, advances, or guarantees, engage in transactions with affiliates, and make investments. The Global Credit Facility also requires the Company to maintain a maximum ratio of Adjusted Debt to Consolidated EBITDAR (the “leverage ratio”) of no greater than 3.75 as of the date of measurement for the four most recent consecutive fiscal quarters. Adjusted Debt is defined generally as consolidated debt outstanding plus eight times consolidated rent expense for the last four consecutive fiscal quarters. Consolidated EBITDAR is defined generally as consolidated net income plus (i) income tax expense, (ii) net interest expense, (iii) depreciation and amortization expense, and (iv) consolidated rent expense.
As of
March 30, 2013
,
no Event of Default (as such term is defined pursuant to the Global Credit Facility) has occurred under the Company’s Global Credit Facility
.
Upon the occurrence of an Event of Default under the Global Credit Facility, the lenders may cease making loans, terminate the Global Credit Facility, and declare all amounts outstanding to be immediately due and payable. The Global Credit Facility specifies a number of events of default (many of which are subject to applicable grace periods), including, among others, the failure to make timely principal, interest, and fee payments or to satisfy the covenants, including the financial covenant described above. Additionally, the Global Credit Facility provides that an Event of Default will occur if Mr. Ralph Lauren, the Company's Chairman of the Board and Chief Executive Officer, and entities controlled by the Lauren family fail to maintain a specified minimum percentage of the voting power of the Company's common stock.
|
|
F-28
|
|
RALPH LAUREN CORPORATION
NOTES TO CONSOLIDATED FINANCIAL STATEMENTS (Continued)
Pan-Asia Credit Facilities
During Fiscal 2013, certain of the Company's subsidiaries in Asia entered into uncommitted credit facilities with regional branches of JPMorgan Chase (the “Banks”) in China, Malaysia, South Korea, and Taiwan (the “Pan-Asia Credit Facilities”). These credit facilities may be used to fund general working capital and corporate needs of the Company's operations in the respective regions. Borrowings under the Pan-Asia Credit Facilities are guaranteed by the Company and are granted at the sole discretion of the Banks, subject to availability of the Banks' funds and satisfaction of certain regulatory requirements. The Pan-Asia Credit Facilities do not contain any financial covenants.
The key terms of the Pan-Asia Credit Facilities by country are as follows:
|
•
|
Chinese Credit Facility
- During the first quarter of Fiscal 2013, Ralph Lauren Trading (Shanghai) Co., Ltd. entered into a facility that provides for a revolving line of credit of up to
100 million
Chinese Renminbi (approximately
$16 million
) through
April 10, 2013
. The Chinese Credit Facility may also be used to support bank guarantees. Borrowings bear interest at either (i) at least
95%
of the short-term interest rate published by the People's Bank of China or (ii) a rate based on the Bank's cost of funds, as determined by JPMorgan Chase Bank (China) Company Limited, Shanghai Branch at its discretion based on prevailing market conditions. On April 10, 2013, the Company renewed its existing Chinese Credit Facility through April 9, 2014, with the same terms and borrowing capacity as the prior facility.
|
|
•
|
Malaysia Credit Facility
- During the third quarter of Fiscal 2013, Ralph Lauren (Malaysia) Sdn Bhd entered into a revolving line of credit of up to
15.9 million
Malaysian Ringgit (approximately
$5 million
) through
September 13, 2013
. Borrowings bear interest at an annual rate based on JPMorgan Chase Bank Berhad's cost of funds, as determined at its discretion based on prevailing market conditions, plus
1.125%
.
|
|
•
|
South Korea Credit Facility
- During the third quarter of Fiscal 2013, Ralph Lauren (Korea) Ltd. entered into a revolving line of credit of up to
11.3 billion
South Korean Won (approximately
$10 million
) through
October 31, 2013
. Borrowings bear interest at an annual rate based on (i) at least the
91
-day South Korea Certificate of Deposit rate plus
1.125%
or (ii) a rate determined by JPMorgan Chase Bank, N.A., Seoul Branch based on its cost of funds, as determined at its discretion based on prevailing market conditions.
|
|
•
|
Taiwan Credit Facility
-
During the third quarter of Fiscal 2013, Ralph Lauren (Hong Kong) Retail Company Limited, Taiwan Branch entered into a revolving line of credit of up to
59.0 million
New Taiwan Dollars (approximately
$2 million
) through
October 23, 2013
. Borrowings bear interest at an annual rate based on JPMorgan Chase Bank, N.A., Taipei Branch's cost of funds, as determined at its discretion based on prevailing market conditions, plus
1.125%
.
|
As of
March 30, 2013
, there were
no
borrowings outstanding under any of the Pan-Asia Credit Facilities.
|
15.
|
Fair Value Measurements
|
U.S. GAAP establishes a three-level valuation hierarchy for disclosure of fair value measurements. The determination of the applicable level within the hierarchy of a particular asset or liability depends on the inputs used in its valuation as of the measurement date, notably the extent to which the inputs are market-based (observable) or internally-derived (unobservable). A financial instrument’s categorization within the valuation hierarchy is based upon the lowest level of input that is significant to the fair value measurement. The three levels are defined as follows:
|
•
|
Level 1
— inputs to the valuation methodology based on quoted prices (unadjusted) for identical assets or liabilities in active markets.
|
|
•
|
Level 2
— inputs to the valuation methodology based on quoted prices for similar assets and liabilities in active markets for substantially the full term of the financial instrument; quoted prices for identical or similar instruments in markets that are not active for substantially the full term of the financial instrument; and model-derived valuations whose inputs or significant value drivers are observable.
|
|
•
|
Level 3
— inputs to the valuation methodology based on unobservable prices or valuation techniques that are significant to the fair value measurement.
|
|
|
F-29
|
|
RALPH LAUREN CORPORATION
NOTES TO CONSOLIDATED FINANCIAL STATEMENTS (Continued)
The following table summarizes the Company’s financial assets and liabilities that are measured and recorded at fair value on a recurring basis:
|
March 30,
2013 |
March 31,
2012 |
|||||||
|
|
(millions)
|
|||||||
|
Financial assets recorded at fair value
(a)
:
|
||||||||
|
Government bonds — U.S.
|
$
|
28.8
|
|
$
|
59.4
|
|
||
|
Government bonds — non-U.S.
|
92.4
|
|
96.0
|
|
||||
|
Corporate bonds — non-U.S.
|
81.6
|
|
99.0
|
|
||||
|
Variable rate municipal securities — U.S.
|
16.6
|
|
69.2
|
|
||||
|
Auction rate securities
|
2.3
|
|
2.3
|
|
||||
|
Other securities
|
—
|
|
0.5
|
|
||||
|
Derivative financial instruments
|
15.0
|
|
32.5
|
|
||||
|
Total
|
$
|
236.7
|
|
$
|
358.9
|
|
||
|
Financial liabilities recorded at fair value
(b)
:
|
||||||||
|
Derivative financial instruments
|
$
|
4.6
|
|
$
|
2.6
|
|
||
|
Total
|
$
|
4.6
|
|
$
|
2.6
|
|
||
|
(a)
|
Based on Level 1 measurements, except for auction rate securities and derivative financial instruments, which are based on Level 2 measurements.
|
|
(b)
|
Based on Level 2 measurements.
|
Certain of the Company’s government bonds, and all of its corporate bonds and variable rate municipal securities (“VRMS”), are classified as available-for-sale securities and are recorded at fair value in the Company’s consolidated balance sheets based upon quoted prices in active markets.
The Company’s auction rate securities are classified as available-for-sale securities and are recorded at fair value in the Company’s consolidated balance sheets. Third-party pricing institutions may value auction rate securities at par, which may not necessarily reflect prices that would be obtained if sold in the current market. When quoted market prices are unobservable, fair value is estimated based on a number of known factors and external pricing data, including known maturity dates, the coupon rate based upon the most recent reset market clearing rate, the price/yield representing the average rate of recent successfully traded securities, and the total principal balance of each security.
The Company’s derivative financial instruments are recorded at fair value in the Company’s consolidated balance sheets and are valued using a pricing model, which is primarily based on market observable external inputs, including forward and spot exchange rates for foreign currencies, and considers the impact of the Company’s own credit risk, if any. Changes in counterparty credit risk are also considered in the valuation of derivative financial instruments.
The Company’s cash and cash equivalents, restricted cash, and held-to-maturity investments are recorded at carrying value, which approximates fair value based on Level 1 measurements.
|
|
F-30
|
|
RALPH LAUREN CORPORATION
NOTES TO CONSOLIDATED FINANCIAL STATEMENTS (Continued)
The Company’s Euro Debt is recorded at carrying value in its consolidated balance sheets, adjusted for foreign currency fluctuations, any unamortized discount, and the unamortized fair value adjustment associated with the early termination of an interest rate swap that was designated as a fair value hedge, which may differ from its fair value (see
Note 16
). The fair value of the Euro Debt is estimated based on external pricing data, including available quoted market prices of the Euro Debt, and of comparable European debt instruments with similar interest rates, credit ratings, and trading frequency, among other factors. The following table summarizes the carrying value and the estimated fair value of the Company’s Euro Debt:
|
|
March 30, 2013
|
March 31, 2012
|
||||||||||||||
|
|
Carrying
Value
|
Fair
Value
(a)
|
Carrying
Value
|
Fair
Value
(a)
|
||||||||||||
|
|
(millions)
|
|||||||||||||||
|
Euro Debt
|
$
|
266.6
|
|
$
|
271.6
|
|
$
|
274.4
|
|
$
|
289.4
|
|
||||
|
(a)
|
Based on Level 2 measurements.
|
Unrealized gains or losses on the Company’s Euro Debt do not result in the realization or expenditure of cash, unless the debt is retired prior to its maturity.
Non-financial Assets and Liabilities
The Company’s non-financial instruments, which primarily consist of goodwill, other intangible assets, and property and equipment, are not required to be measured at fair value on a recurring basis and are reported at carrying value. However, on a periodic basis whenever events or changes in circumstances indicate that their carrying value may not be fully recoverable (and at least annually for goodwill and indefinite-lived intangible assets), non-financial instruments are assessed for impairment and, if applicable, written-down to and recorded at fair value, considering external market participant assumptions.
During
Fiscal 2013
,
Fiscal 2012
, and
Fiscal 2011
, the Company recorded non-cash impairment charges to reduce the carrying value of certain long-lived assets to their fair value. These charges related to assets of certain underperforming retail stores that were planned for closure, as well as certain stores closed in connection with the Rugby Closure Plan in Fiscal 2013. The fair values of these assets were determined based on Level 3 measurements. Inputs to these fair value measurements included estimates of the amount and the timing of the stores' net future discounted cash flows based on historical experience, current trends, and market conditions. The following table summarizes the impairment charges recorded during
Fiscal 2013
,
Fiscal 2012
, and
Fiscal 2011
:
|
|
Fiscal Years Ended
|
|||||||||||
|
|
March 30,
2013 |
March 31,
2012 |
April 2,
2011 |
|||||||||
|
|
(millions)
|
|||||||||||
|
Aggregate carrying value of long-lived assets written down to fair value
|
$
|
19.0
|
|
$
|
3.2
|
|
$
|
5.2
|
|
|||
|
Impairment charges
(a)
|
(19.0
|
)
|
(2.2
|
)
|
(2.5
|
)
|
||||||
|
(a)
|
See
Note 11
for details of impairment charges recorded in Fiscal 2013, Fiscal 2012, and Fiscal 2011.
|
|
|
F-31
|
|
RALPH LAUREN CORPORATION
NOTES TO CONSOLIDATED FINANCIAL STATEMENTS (Continued)
|
16.
|
Financial Instruments
|
Derivative Financial Instruments
The Company is exposed to changes in foreign currency exchange rates relating to certain anticipated cash flows from its international operations and potential declines in the value of reported net assets of certain of its foreign operations, as well as changes in the fair value of its fixed-rate debt relating to changes in interest rates. Consequently, the Company periodically uses derivative financial instruments to manage such risks. The Company does not enter into derivative transactions for speculative or trading purposes.
The following table summarizes the Company’s outstanding derivative instruments on a gross basis as recorded in the consolidated balance sheets as of
March 30, 2013
and
March 31, 2012
:
|
|
Notional Amounts
|
Derivative Assets
|
Derivative Liabilities
|
|
|||||||||||||||||||||||||||||
|
Derivative Instrument
(a)
|
March 30, 2013
|
March 31, 2012
|
March 30, 2013
|
March 31, 2012
|
March 30, 2013
|
March 31, 2012
|
|
||||||||||||||||||||||||||
|
|
|
|
Balance
Sheet
Line
(b)
|
Fair
Value
|
Balance
Sheet
Line
(b)
|
Fair
Value
|
Balance
Sheet
Line
(b)
|
Fair
Value
|
Balance
Sheet
Line
(b)
|
Fair
Value
|
|
||||||||||||||||||||||
|
|
(millions)
|
|
|||||||||||||||||||||||||||||||
|
Designated Hedges:
|
|||||||||||||||||||||||||||||||||
|
FC — Inventory purchases
|
$
|
366.4
|
|
$
|
482.2
|
|
PP
|
$
|
14.0
|
|
PP
|
$
|
26.6
|
|
AE
|
$
|
(2.5
|
)
|
AE
|
$
|
(1.4
|
)
|
|||||||||||
|
FC — I/C royalty payments
|
20.0
|
|
70.0
|
|
—
|
—
|
|
PP
|
4.8
|
|
AE
|
(0.5
|
)
|
—
|
—
|
|
|
||||||||||||||||
|
FC — Interest payments
|
—
|
|
12.6
|
|
—
|
—
|
|
—
|
—
|
|
—
|
—
|
|
AE
|
—
|
|
(c)
|
||||||||||||||||
|
FC — Other
|
5.1
|
|
8.3
|
|
PP
|
0.1
|
|
—
|
—
|
|
—
|
—
|
|
AE
|
(0.3
|
)
|
|||||||||||||||||
|
NI — Euro Debt
|
139.6
|
|
274.4
|
|
—
|
—
|
|
—
|
—
|
|
STD
|
(271.6
|
)
|
(d)
|
LTD
|
(289.4
|
)
|
(d)
|
|||||||||||||||
|
Total Designated Hedges
|
$
|
531.1
|
|
$
|
847.5
|
|
$
|
14.1
|
|
$
|
31.4
|
|
$
|
(274.6
|
)
|
$
|
(291.1
|
)
|
|||||||||||||||
|
Undesignated Hedges:
|
|||||||||||||||||||||||||||||||||
|
FC — Other
(e)
|
$
|
269.8
|
|
$
|
158.1
|
|
(f)
|
$
|
0.9
|
|
(g)
|
$
|
1.1
|
|
AE
|
$
|
(1.6
|
)
|
(h)
|
$
|
(0.9
|
)
|
|||||||||||
|
Total Hedges
|
$
|
800.9
|
|
$
|
1,005.6
|
|
$
|
15.0
|
|
$
|
32.5
|
|
$
|
(276.2
|
)
|
$
|
(292.0
|
)
|
|||||||||||||||
|
(a)
|
FC = Forward foreign currency exchange contracts; NI = Net Investment Hedge; Euro Debt = Euro-denominated
4.5%
notes due
October 4, 2013
.
|
|
(b)
|
PP = Prepaid expenses and other current assets; ONCA = Other non-current assets; AE = Accrued expenses and other current liabilities; ONCL = Other non-current liabilities; STD = Current portion of long-term debt; LTD = Long-term debt.
|
|
(c)
|
The fair value of the interest payment-related derivative instrument was
less than $0.1 million
as of
March 31, 2012
.
|
|
(d)
|
The Company’s Euro Debt is reported at carrying value in the consolidated balance sheets. The carrying value of the Euro Debt was
$266.6 million
and
$274.4 million
as of
March 30, 2013
and
March 31, 2012
, respectively. The fair value of the Euro Debt is associated with the entire principal amount of the debt, whereas only a portion of such principal amount was designated as a net investment hedge as of March 30, 2013.
|
|
(e)
|
Primarily related to undesignated hedges of foreign currency-denominated revenues, intercompany loans, third-party debt obligations, and other net operational exposures.
|
|
(f)
|
$0.8 million
included within PP and
$0.1 million
included within ONCA.
|
|
(g)
|
$0.7 million
included within PP and
$0.4 million
included within ONCA.
|
|
(h)
|
$0.8 million
included within AE and
$0.1 million
included within ONCL.
|
|
|
F-32
|
|
RALPH LAUREN CORPORATION
NOTES TO CONSOLIDATED FINANCIAL STATEMENTS (Continued)
The following tables summarize the impact of gains and losses from the Company’s derivative instruments on its consolidated financial statements for the fiscal years presented:
|
|
Gains (Losses)
Recognized in OCI
(b)
|
Gains (Losses) Reclassified
from AOCI
(b)
to Earnings
|
Location of Gains (Losses) Reclassified from
AOCI
(b)
to Earnings
|
|||||||||||||||||||||||
|
|
Fiscal Years Ended
|
Fiscal Years Ended
|
||||||||||||||||||||||||
|
Derivative Instrument
(a)
|
March 30,
2013 |
March 31,
2012 |
April 2,
2011 |
March 30,
2013 |
March 31,
2012 |
April 2,
2011 |
||||||||||||||||||||
|
|
(millions)
|
|||||||||||||||||||||||||
|
Designated Cash Flow Hedges:
|
||||||||||||||||||||||||||
|
FC — Inventory purchases
|
$
|
(10.9
|
)
|
$
|
31.3
|
|
$
|
(15.7
|
)
|
$
|
31.8
|
|
$
|
(2.0
|
)
|
$
|
15.2
|
|
Cost of goods sold
|
|||||||
|
FC — I/C royalty payments
|
(5.3
|
)
|
7.7
|
|
(4.4
|
)
|
4.2
|
|
(2.6
|
)
|
(4.4
|
)
|
Foreign currency gains (losses)
|
|||||||||||||
|
FC — Interest payments
|
—
|
|
(0.4
|
)
|
1.2
|
|
(0.3
|
)
|
(0.5
|
)
|
(0.7
|
)
|
Foreign currency gains (losses)
|
|||||||||||||
|
FC — Other
|
0.7
|
|
0.1
|
|
0.4
|
|
—
|
|
0.2
|
|
—
|
|
Foreign currency gains (losses)
|
|||||||||||||
|
$
|
(15.5
|
)
|
$
|
38.7
|
|
$
|
(18.5
|
)
|
$
|
35.7
|
|
$
|
(4.9
|
)
|
$
|
10.1
|
|
|||||||||
|
Designated Hedge of Net Investment:
|
||||||||||||||||||||||||||
|
Euro Debt
|
$
|
10.7
|
|
$
|
16.2
|
|
$
|
(13.1
|
)
|
$
|
—
|
|
$
|
—
|
|
$
|
—
|
|
(c)
|
|||||||
|
Total Designated Hedges
|
$
|
(4.8
|
)
|
$
|
54.9
|
|
$
|
(31.6
|
)
|
$
|
35.7
|
|
$
|
(4.9
|
)
|
$
|
10.1
|
|
||||||||
|
|
Gains (Losses)
Recognized in Earnings
|
Location of Gains (Losses)
Recognized in Earnings
|
||||||||||||
|
|
Fiscal Years Ended
|
|||||||||||||
|
Derivative Instrument
(a)
|
March 30,
2013 |
March 31,
2012 |
April 2,
2011 |
|||||||||||
|
|
(millions)
|
|
||||||||||||
|
Undesignated Hedges:
|
||||||||||||||
|
FC — Other
(d)
|
$
|
(4.2
|
)
|
$
|
1.1
|
|
$
|
(0.3
|
)
|
Foreign currency gains (losses)
|
||||
|
Total Undesignated Hedges
|
$
|
(4.2
|
)
|
$
|
1.1
|
|
$
|
(0.3
|
)
|
|||||
|
(a)
|
FC = Forward foreign currency exchange contracts; Euro Debt = Euro-denominated
4.5%
notes due
October 4, 2013
.
|
|
(b)
|
AOCI, including the respective fiscal year’s OCI, is classified as a component of total equity.
|
|
(c)
|
Amounts are to be recognized as a gain (loss) on the sale or liquidation of the hedged net investment.
|
|
(d)
|
Primarily related to undesignated hedges of foreign currency-denominated revenues, intercompany loans, third-party debt obligations, and other net operational exposures.
|
Over the next twelve months, it is expected that approximately
$16 million
of net gains deferred in AOCI related to derivative financial instruments as of
March 30, 2013
will be recognized in earnings.
No
material gains or losses relating to ineffective hedges were recognized during any of the fiscal years presented.
The following is a summary of the Company’s risk management strategies and the effect of those strategies on the consolidated financial statements.
Foreign Currency Risk Management
Forward Foreign Currency Exchange Contracts
The Company primarily enters into forward foreign currency exchange contracts as hedges to reduce its risk from exchange rate fluctuations on inventory purchases made in an entity's non-functional currency, intercompany royalty payments made by certain of its international operations, intercompany contributions to fund certain marketing efforts of its international operations, interest payments made in connection with outstanding debt, and other foreign currency-denominated operational cash flows. As part of its overall strategy to manage the level of exposure to the risk of foreign currency exchange rate fluctuations, primarily to changes in the value of the Euro, the Japanese Yen, the Hong Kong Dollar, the South Korean Won, and the British Pound Sterling,
|
|
F-33
|
|
RALPH LAUREN CORPORATION
NOTES TO CONSOLIDATED FINANCIAL STATEMENTS (Continued)
the Company hedges a portion of its foreign currency exposures anticipated over a
two
-year period. In doing so, the Company uses foreign currency exchange forward contracts that generally have maturities of
three months
to
two years
to provide continuing coverage throughout the hedging period.
Hedge of Net Investment in Certain European Subsidiaries
Historically, the Company designated the entire
€209.2 million
principal amount of its outstanding Euro Debt as a hedge of its net investment in certain of its European subsidiaries. Accordingly, changes in the carrying value of the Euro Debt resulting from fluctuations in the Euro exchange rate have been reported in equity as a component of AOCI, as the debt has been a highly effective hedge. In March 2013, the Company de-designated
€100.0 million
principal amount of this net investment hedge, in connection with the execution of undesignated forward foreign currency exchange contracts to partially hedge the repayment of the Euro Debt upon its maturity. As a result, changes in the de-designated portion of the Euro Debt's carrying value resulting from fluctuations in the Euro exchange rate are recorded in earnings within foreign currency gains (losses), and are largely offset by changes in the fair value of the related undesignated forward foreign currency exchange contracts.
Interest Rate Risk Management
Interest Rate Swap Contracts
During the first quarter of Fiscal 2011, the Company entered into a fixed-to-floating interest rate swap with an aggregate notional amount of
€209.2 million
, which was designated as a fair value hedge to mitigate its exposure to changes in the fair value of its Euro Debt due to changes in the benchmark interest rate. The interest rate swap was executed to swap the
4.5%
fixed interest rate on the Company’s Euro Debt for a variable interest rate. On April 11, 2011, the interest rate swap agreement was terminated by the Company at a loss of
$7.6 million
. The related offsetting change in the Euro Debt's fair value was recorded as an adjustment to its carrying value, and is being recognized within interest expense over the remaining term of the debt, through
October 4, 2013
. During both
Fiscal 2013
and
Fiscal 2012
,
$3.0 million
of this fair value adjustment was recognized as interest expense within the Company’s consolidated statements of income.
See Note 3 for further discussion of the Company’s accounting policies relating to its derivative financial instruments.
Investments
The following table summarizes the Company’s short-term and non-current investments recorded in the consolidated balance sheets as of
March 30, 2013
and
March 31, 2012
:
|
|
March 30, 2013
|
March 31, 2012
|
||||||||||||||||||||||
|
Type of Investment
|
Short-term
< 1 year
|
Non-current
1 - 3 years
|
Total
|
Short-term
< 1 year
|
Non-current
1 - 3 years
|
Total
|
||||||||||||||||||
|
|
|
|
(millions)
|
|
|
|||||||||||||||||||
|
Held-to-maturity:
|
||||||||||||||||||||||||
|
Government bonds — U.S.
|
$
|
—
|
|
$
|
—
|
|
$
|
—
|
|
$
|
3.2
|
|
$
|
—
|
|
$
|
3.2
|
|
||||||
|
Total held-to-maturity investments
|
$
|
—
|
|
$
|
—
|
|
$
|
—
|
|
$
|
3.2
|
|
$
|
—
|
|
$
|
3.2
|
|
||||||
|
Available-for-sale:
|
||||||||||||||||||||||||
|
Government bonds — U.S.
|
$
|
21.1
|
|
$
|
7.7
|
|
$
|
28.8
|
|
$
|
52.1
|
|
$
|
7.3
|
|
$
|
59.4
|
|
||||||
|
Government bonds — non-U.S.
|
67.0
|
|
25.4
|
|
92.4
|
|
40.4
|
|
55.6
|
|
96.0
|
|
||||||||||||
|
Corporate bonds — non-U.S.
|
36.0
|
|
45.6
|
|
81.6
|
|
64.8
|
|
34.2
|
|
99.0
|
|
||||||||||||
|
Variable rate municipal securities — U.S.
|
16.6
|
|
—
|
|
16.6
|
|
69.2
|
|
—
|
|
69.2
|
|
||||||||||||
|
Auction rate securities
|
—
|
|
2.3
|
|
2.3
|
|
—
|
|
2.3
|
|
2.3
|
|
||||||||||||
|
Other securities
|
—
|
|
—
|
|
—
|
|
—
|
|
0.5
|
|
0.5
|
|
||||||||||||
|
Total available-for-sale investments
|
$
|
140.7
|
|
$
|
81.0
|
|
$
|
221.7
|
|
$
|
226.5
|
|
$
|
99.9
|
|
$
|
326.4
|
|
||||||
|
Other:
|
||||||||||||||||||||||||
|
Time deposits
|
$
|
184.0
|
|
$
|
—
|
|
$
|
184.0
|
|
$
|
286.0
|
|
$
|
—
|
|
$
|
286.0
|
|
||||||
|
Total investments
|
$
|
324.7
|
|
$
|
81.0
|
|
$
|
405.7
|
|
$
|
515.7
|
|
$
|
99.9
|
|
$
|
615.6
|
|
||||||
|
|
F-34
|
|
RALPH LAUREN CORPORATION
NOTES TO CONSOLIDATED FINANCIAL STATEMENTS (Continued)
Held-to-maturity investments consisted of debt securities that the Company has the intent and ability to retain until maturity. These securities are recorded at cost, adjusted for the amortization of premiums and discounts, which approximates fair value.
Available-for-sale investments primarily consist of government and corporate bonds, VRMS, and auction rate securities. The Company’s government and corporate bonds are diversified across a wide range of high-credit quality U.S. and non-U.S. issuers. The Company does not hold any investments in sovereign debt securities issued by Greece, Ireland, Portugal, Spain, or Italy. VRMS investments represent long-term municipal bonds with interest rates that reset at pre-determined short-term intervals, and can typically be put to the issuer and redeemed for cash upon demand, or shortly thereafter. Auction rate securities also have characteristics similar to short-term investments. However, the Company has classified these securities as non-current investments in its consolidated balance sheets as current market conditions call into question its ability to redeem these investments for cash within the next twelve months.
No material realized or unrealized gains or losses on available-for-sale investments or other-than-temporary impairment charges were recorded in any of the fiscal periods presented.
See Note 3 for further discussion of the Company’s accounting policies relating to its investments.
|
17.
|
Commitments and Contingencies
|
Leases
The Company operates its retail stores under various leasing arrangements. The Company also occupies various office and warehouse facilities and uses certain equipment under numerous lease agreements. Such leasing arrangements are accounted for as either operating leases or capital leases. In this context, capital leases include leases whereby the Company is considered to have the substantive risks of ownership during construction of a leased property. Information on the Company's operating and capital leasing activities is set forth below.
Operating Leases
The Company is typically required to make minimum rental payments, and often contingent rental payments, under its operating leases. Many of the Company's retail store leases provide for contingent rentals based upon sales, and certain rental agreements require payment based solely on a percentage of sales. Terms of the Company's leases generally contain renewal options, rent escalation clauses, and landlord incentives. Rent expense, net of sublease income which was not significant in any period, was approximately
$430 million
,
$427 million
, and
$317 million
in
Fiscal 2013
,
Fiscal 2012
, and
Fiscal 2011
, respectively. Such amounts include contingent rental charges of approximately
$174 million
,
$182 million
, and
$109 million
in
Fiscal 2013
,
Fiscal 2012
, and
Fiscal 2011
, respectively. In addition to such amounts, the Company is normally required to pay taxes, insurance, and occupancy costs relating to the leased real estate properties.
As of
March 30, 2013
, future minimum rental payments under noncancelable operating leases with lease terms in excess of one year were as follows:
|
Minimum
Operating Lease
Payments
(a)
|
||||
|
(millions)
|
||||
|
Fiscal 2014
|
$
|
279.9
|
|
|
|
Fiscal 2015
|
281.6
|
|
||
|
Fiscal 2016
|
264.5
|
|
||
|
Fiscal 2017
|
241.8
|
|
||
|
Fiscal 2018
|
223.9
|
|
||
|
Fiscal 2019 and thereafter
|
887.8
|
|
||
|
Total minimum rental payments
|
$
|
2,179.5
|
|
|
|
(a)
|
Net of sublease income, which is not significant in any period.
|
|
|
F-35
|
|
RALPH LAUREN CORPORATION
NOTES TO CONSOLIDATED FINANCIAL STATEMENTS (Continued)
Capital Leases
Assets under capital leases amounted to approximately
$33 million
and
$31 million
at the end of
Fiscal 2013
and
Fiscal 2012
, respectively, net of accumulated amortization of approximately
$16 million
and
$14 million
, respectively. Such assets are classified within property and equipment, net in the consolidated balance sheets based on their nature. As of
March 30, 2013
, future minimum rental payments under noncancelable capital leases with lease terms in excess of one year were as follows:
|
Minimum
Capital Lease
Payments
(a)
|
||||
|
(millions)
|
||||
|
Fiscal 2014
|
$
|
8.1
|
|
|
|
Fiscal 2015
|
7.9
|
|
||
|
Fiscal 2016
|
7.9
|
|
||
|
Fiscal 2017
|
7.3
|
|
||
|
Fiscal 2018
|
6.6
|
|
||
|
Fiscal 2019 and thereafter
|
26.6
|
|
||
|
Total
|
64.4
|
|
||
|
Less: amount representing interest
|
(29.8
|
)
|
||
|
Present value of net minimum rental payments
|
$
|
34.6
|
|
|
|
(a)
|
Net of sublease income, which is not significant in any period.
|
Employee Agreements
The Company has employment agreements with certain executives in the normal course of business which provide for compensation and certain other benefits. These agreements also provide for severance payments under certain circumstances.
Other Commitments
Other off-balance sheet firm commitments amounted to approximately
$966 million
as of
March 30, 2013
, including inventory purchase commitments of approximately
$837 million
, outstanding letters of credit of approximately
$15 million
, interest payments related to the Company's Euro Debt of approximately
$12 million
, and other commitments of approximately
$102 million
, comprised of our legally-binding obligations under sponsorship, licensing, and other marketing and advertising agreements, information technology-related service agreements, capital projects, and pension-related obligations.
Litigation
Wathne Imports Litigation
On August 19, 2005, Wathne Imports, Ltd. (“Wathne”), the Company's then domestic licensee for luggage and handbags, filed a complaint in the U.S. District Court in the Southern District of New York against the Company and Mr. Ralph Lauren, its Chairman and Chief Executive Officer, asserting, among other things, federal trademark law violations, breach of contract, breach of obligations of good faith and fair dealing, fraud and negligent misrepresentation. The complaint originally sought, among other relief, injunctive relief, compensatory damages in excess of
$250 million
and punitive damages of not less than
$750 million
. On September 13, 2005, Wathne withdrew this complaint from the U.S. District Court and filed a complaint in the Supreme Court of the State of New York, New York County, making substantially the same allegations and claims (excluding the federal trademark claims), and seeking similar relief. On February 1, 2006, the Court granted the Company's motion to dismiss all of the causes of action, including the cause of action against Mr. Lauren, except for breach of contract related claims, and denied Wathne's motion for a preliminary injunction. Following some discovery, the Company moved for summary judgment on the remaining claims and Wathne cross-moved for partial summary judgment. In an April 11, 2008 Decision and Order, the Court granted the Company's summary judgment motion to dismiss most of the claims against our Company, and denied Wathne's cross-motion for summary judgment. Wathne appealed the dismissal of its claims to the Appellate Division of the Supreme Court. Following a hearing on
|
|
F-36
|
|
RALPH LAUREN CORPORATION
NOTES TO CONSOLIDATED FINANCIAL STATEMENTS (Continued)
May 19, 2009, the Appellate Division issued a Decision and Order on June 9, 2009 which, in large part, affirmed the lower Court's ruling.
The Company subsequently made a motion to exclude Wathne's proposed expert's damages report and, on January 23, 2012, the Court granted its motion. Wathne then appealed the ruling to the Appellate Division and, on October 18, 2012, the Appellate Division reversed the order of the lower Court. At this time, the trial date has not yet been scheduled and the Company intends to continue to contest the remaining claims and dispute any alleged damages in this lawsuit vigorously. Management does not expect that the ultimate resolution of this matter will have a material adverse effect on the Company's consolidated financial statements.
Other Matters
The Company is otherwise involved, from time to time, in litigation, other legal claims, and proceedings involving matters associated with or incidental to its business, including, among other things, matters involving credit card fraud, trademark and other intellectual property, licensing, and employee relations. The Company believes that the resolution of currently pending matters will not individually or in the aggregate have a material adverse effect on its financial statements. However, the Company’s assessment of the current litigation or other legal claims could change in light of the discovery of facts not presently known or determinations by judges, juries, or other finders of fact which are not in accord with management’s evaluation of the possible liability or outcome of such litigation or claims.
|
18.
|
Equity
|
Capital Stock
The Company's capital stock consists of
two
classes of common stock. There are
500 million
shares of Class A common stock and
100 million
shares of Class B common stock authorized to be issued. Shares of Class A and Class B common stock have substantially identical rights, except with respect to voting rights. Holders of Class A common stock are entitled to
one
vote per share and holders of Class B common stock are entitled to
ten
votes per share. Holders of both classes of stock vote together as a single class on all matters presented to the stockholders for their approval, except with respect to the election and removal of directors or as otherwise required by applicable law. All outstanding shares of Class B common stock are owned by Mr. Ralph Lauren, the Company's Chairman of the Board and Chief Executive Officer, and entities controlled by the Lauren family, and are convertible at any time into shares of Class A common stock on a
one-for-one
basis.
Secondary Stock Offering
On June 14, 2010, the Company commenced a secondary public offering under which approximately
10 million
shares of Class A common stock were sold on behalf of its principal stockholder, Mr. Lauren (the “Offering”). The Offering was made pursuant to a shelf registration statement on Form S-3 filed on the same day, and closed on June 24, 2010. Concurrent with the Offering, the Company also purchased an additional
1.0 million
shares of Class A common stock under its common stock repurchase program from Mr. Lauren at a cost of
$81 million
, representing the same per share price of the secondary public offering discussed above.
Class B Common Stock Conversions
During the third quarter of Fiscal 2013, the Lauren Family, L.L.C., a limited liability company managed by the children of Mr. Lauren, converted
950,000
shares of Class B common stock into an equal number of shares of Class A common stock pursuant to the terms of the Class B common stock, which were subsequently sold on the open market as part of a predetermined, systematic trading plan.
During the first quarter of Fiscal 2011, in connection with the Offering and share repurchase discussed above, Mr. Lauren converted approximately
11 million
shares of Class B common stock into an equal number of shares of Class A common stock pursuant to the terms of the Class B common stock. During Fiscal 2011, Mr. Lauren also converted an additional
0.3 million
shares of Class B common stock into an equal number of shares of Class A common stock pursuant to the terms of the Class B common stock.
These transactions resulted in reclassifications within equity, and had no other effect on the Company's consolidated balance sheets.
|
|
F-37
|
|
RALPH LAUREN CORPORATION
NOTES TO CONSOLIDATED FINANCIAL STATEMENTS (Continued)
Common Stock Repurchase Program
On May 24, 2011, the Company's Board of Directors approved an expansion of the Company's existing common stock repurchase program that allows it to repurchase an additional
$500 million
of Class A common stock. On August 9, 2012, the Company’s Board of Directors approved a further expansion of the common stock repurchase program that allows it to repurchase up to an additional
$500 million
of Class A common stock. Repurchases of shares of Class A common stock are subject to overall business and market conditions.
During
Fiscal 2013
,
3.0 million
shares of Class A common stock were repurchased by the Company at a cost of
$450.0 million
under its common stock repurchase program. In addition, in March 2013, the Company prepaid
$50.0 million
under a share repurchase program entered into with a third-party financial institution, in exchange for the right to receive shares of its Class A common stock at the conclusion of a
93
-day repurchase term (the "Prepaid Repurchase Program"). The number of shares to be received at the end of the term is based on the volume-weighted average market price of the Company's Class A common stock over the related
93
-day period, less a discount of
$2.22
per share. The
$50.0 million
payment under the Prepaid Repurchase Program was recorded as a reduction to additional paid-in capital in the Company's consolidated balance sheet as of March 30, 2013.
No
shares have been delivered to the Company pursuant to the Prepaid Repurchase Program as of March 30, 2013. The remaining availability under the Company's common stock repurchase program, including the expansion approved on August 9, 2012 and the
$50.0 million
payment made under the Prepaid Repurchase Program, was approximately
$577 million
as of
March 30, 2013
.
In addition, during Fiscal 2013,
0.4 million
shares of Class A common stock at a cost of
$47.3 million
were surrendered to, or withheld by, the Company in satisfaction of withholding taxes in connection with the vesting of awards under the Company’s 1997 Long-Term Stock Incentive Plan, as amended (the “1997 Incentive Plan”), and its 2010 Long-Term Stock Incentive Plan (the “2010 Incentive Plan”).
In
Fiscal 2012
,
3.2 million
shares of Class A common stock were repurchased by the Company at a cost of
$395.1 million
under its common stock repurchase program. In addition,
0.2 million
shares of Class A common stock at a cost of
$24.3 million
were surrendered to, or withheld by, the Company in satisfaction of withholding taxes in connection with the vesting of awards under the 1997 Incentive Plan and the 2010 Incentive Plan.
In Fiscal 2011,
6.0 million
shares of Class A common stock were repurchased by the Company at a cost of
$577.8 million
under its common stock repurchase program, including the repurchase of
1.0 million
shares of Class A common stock at a cost of
$81.0 million
in connection with the secondary stock offering discussed above. In addition, during Fiscal 2011,
0.2 million
shares of Class A common stock at a cost of
$16.8 million
were surrendered to, or withheld by, the Company in satisfaction of withholding taxes in connection with the vesting of awards issued under the 1997 Incentive Plan.
Repurchased and surrendered shares are accounted for as treasury stock at cost and held in treasury for future use.
Dividends
Since 2003, the Company has maintained a regular quarterly cash dividend program on its common stock. On February 8, 2011, the Company's Board of Directors approved an increase in the Company's quarterly cash dividend on its common stock from
$0.10
per share to
$0.20
per share. On May 21, 2012, the Company’s Board of Directors approved a further increase in the Company’s quarterly cash dividend on its common stock from
$0.20
per share to
$0.40
per share. Dividends paid amounted to
$127.8 million
,
$74.3 million
, and
$38.5 million
in
Fiscal 2013
,
Fiscal 2012
, and
Fiscal 2011
, respectively.
|
|
F-38
|
|
RALPH LAUREN CORPORATION
NOTES TO CONSOLIDATED FINANCIAL STATEMENTS (Continued)
|
19.
|
Accumulated Other Comprehensive Income
|
The following table presents the components of other comprehensive income (loss), net of tax, accumulated in equity:
|
|
Foreign Currency Translation Gains (Losses)
(a)
|
Net Realized
and Unrealized
Gains (Losses)
on Derivative
Financial
Instruments
(b)
|
Net Realized
and Unrealized
Gains (Losses)
on Available-
for-Sale
Investments
|
Net Realized
and Unrealized
Gains
(Losses) on
Defined
Benefit Plans
|
Total
Accumulated
Other
Comprehensive
Income (Loss)
|
|||||||||||||||
|
|
|
|
(millions)
|
|
|
|||||||||||||||
|
Balance at April 3, 2010
|
$
|
132.5
|
|
$
|
21.4
|
|
$
|
0.1
|
|
$
|
—
|
|
$
|
154.0
|
|
|||||
|
Fiscal 2011 pretax activity
(c)
|
80.4
|
|
(18.1
|
)
|
—
|
|
(4.7
|
)
|
57.6
|
|
||||||||||
|
Fiscal 2011 tax benefit (provision)
(c)
|
3.2
|
|
0.9
|
|
—
|
|
0.1
|
|
4.2
|
|
||||||||||
|
Balance at April 2, 2011
|
216.1
|
|
4.2
|
|
0.1
|
|
(4.6
|
)
|
215.8
|
|
||||||||||
|
Fiscal 2012 pretax activity
(d)
|
(45.5
|
)
|
38.6
|
|
0.7
|
|
(1.7
|
)
|
(7.9
|
)
|
||||||||||
|
Fiscal 2012 tax benefit (provision)
(d)
|
(4.1
|
)
|
(7.3
|
)
|
—
|
|
0.1
|
|
(11.3
|
)
|
||||||||||
|
Balance at March 31, 2012
|
166.5
|
|
35.5
|
|
0.8
|
|
(6.2
|
)
|
196.6
|
|
||||||||||
|
Fiscal 2013 pretax activity
(e)
|
(89.9
|
)
|
(15.5
|
)
|
4.0
|
|
(1.5
|
)
|
(102.9
|
)
|
||||||||||
|
Fiscal 2013 tax benefit (provision)
(e)
|
(3.3
|
)
|
3.1
|
|
(0.1
|
)
|
0.2
|
|
(0.1
|
)
|
||||||||||
|
Balance at March 30, 2013
|
$
|
73.3
|
|
$
|
23.1
|
|
$
|
4.7
|
|
$
|
(7.5
|
)
|
$
|
93.6
|
|
|||||
|
(a)
|
Includes net gains of
$10.7 million
and
$16.2 million
during Fiscal 2013 and Fiscal 2012, respectively, and a net loss of
$13.1 million
during Fiscal 2011 related to changes in the carrying value of the Euro Debt designated as a hedge of the Company's net investment in certain of its European subsidiaries.
|
|
(b)
|
Includes deferred gains and losses on hedging instruments, such as forward foreign currency exchange contracts designated as cash flow hedges (see Note 16).
|
|
(c)
|
Includes a reclassification adjustment of
$12.7 million
(including
$2.6 million
of tax benefits) for net realized derivative financial instrument gains during the fiscal year.
|
|
(d)
|
Includes a reclassification adjustment of
$3.0 million
(net of
$1.9 million
of tax benefits) for net realized derivative financial instrument losses during the fiscal year.
|
|
(e)
|
Includes a reclassification adjustment of
$32.0 million
(net of
$3.7 million
of tax provision) for net realized derivative financial instrument gains during the fiscal year.
|
|
20.
|
Stock-based Compensation
|
Long-term Stock Incentive Plans
On August 5, 2010, the Company’s stockholders approved the 2010 Incentive Plan, which replaced the Company’s 1997 Incentive Plan. The 2010 Incentive Plan provides for up to
3.0 million
of new shares authorized for issuance to participants, in addition to the shares that remained available for issuance under the 1997 Incentive Plan as of August 5, 2010 that are not subject to outstanding awards under the 1997 Incentive Plan. In addition, any outstanding awards under the 1997 Incentive Plan that expire, are forfeited, or are surrendered to the Company in satisfaction of taxes will be transferred to the 2010 Incentive Plan and be available for issuance. Any new grants are being issued under the 2010 Incentive Plan. However, awards that were outstanding as of August 5, 2010 continue to remain subject to the terms of the 1997 Incentive Plan.
Under both the 2010 Incentive Plan and the 1997 Incentive Plan (the “Plans”), there are limits as to the number of shares available for certain awards and to any one participant. Equity awards that may be made under the Plans include, but are not limited to (i) stock options, (ii) restricted stock, and (iii) restricted stock units (“RSUs”). As of March 30, 2013,
2.9 million
shares remained available for future issuance under the Company's Plans.
|
|
F-39
|
|
RALPH LAUREN CORPORATION
NOTES TO CONSOLIDATED FINANCIAL STATEMENTS (Continued)
Impact on Results
A summary of the total compensation expense recorded within SG&A expenses and the associated income tax benefits recognized related to stock-based compensation arrangements is as follows:
|
|
Fiscal Years Ended
|
|||||||||||
|
|
March 30,
2013 |
March 31,
2012 |
April 2,
2011 |
|||||||||
|
|
(millions)
|
|||||||||||
|
Compensation expense
|
$
|
87.5
|
|
$
|
77.9
|
|
$
|
70.4
|
|
|||
|
Income tax benefit
|
$
|
(29.4
|
)
|
$
|
(26.2
|
)
|
$
|
(25.7
|
)
|
|||
Stock Options
Stock options are granted to employees and non-employee directors with exercise prices equal to the fair market value of the Company’s Class A common stock on the date of grant. Generally, options become exercisable ratably (graded-vesting schedule) over a
three
-year vesting period, subject to continuing employment. Stock options generally expire
seven years
from the date of grant. The Company recognizes compensation expense for share-based awards that have graded vesting and no performance conditions on an accelerated basis. The Company uses the Black-Scholes option pricing model to estimate the fair value of stock options granted, which requires the input of both subjective and objective assumptions including the following:
Expected Term
—
The estimate of expected term is based on the historical exercise behavior of employees and non-employee directors, as well as the contractual life of the option grants.
Expected Volatility
—
The expected volatility factor is based on the historical volatility of the Company's common stock for a period equal to the stock option's expected term.
Expected Dividend Yield
—
The expected dividend yield is based on the Company's quarterly cash dividend of (i)
$0.10
per share for grants made during and after the third quarter of Fiscal 2010, but prior to the fourth quarter of Fiscal 2011, (ii)
$0.20
per share for grants made during and after the fourth quarter of Fiscal 2011, but prior to the first quarter of Fiscal 2013, and (iii)
$0.40
per share for grants made during and after the first quarter of Fiscal 2013.
Risk-free Interest Rate
—
The risk-free interest rate is determined using the implied yield for a traded zero-coupon U.S. Treasury bond with a term equal to the option's expected term.
The Company’s weighted average assumptions used to estimate the fair value of stock options granted during the fiscal years presented were as follows:
|
|
Fiscal Years Ended
|
||||||||
|
|
March 30,
2013 |
March 31,
2012 |
April 2,
2011 |
||||||
|
Expected term (years)
|
4.5
|
|
4.7
|
|
4.6
|
|
|||
|
Expected volatility
|
44.3
|
%
|
44.7
|
%
|
44.3
|
%
|
|||
|
Expected dividend yield
|
1.05
|
%
|
0.72
|
%
|
0.52
|
%
|
|||
|
Risk-free interest rate
|
0.6
|
%
|
1.3
|
%
|
1.6
|
%
|
|||
|
Weighted-average option grant date fair value
|
$47.89
|
|
$49.13
|
|
$28.84
|
|
|||
|
|
F-40
|
|
RALPH LAUREN CORPORATION
NOTES TO CONSOLIDATED FINANCIAL STATEMENTS (Continued)
A summary of stock option activity under all plans during
Fiscal 2013
is as follows:
|
|
Number of
Shares
|
Weighted-Average Exercise Price
|
Weighted-Average Remaining Contractual Term
|
Aggregate Intrinsic Value
(a)
|
|||||||||
|
|
(thousands)
|
(years)
|
(millions)
|
||||||||||
|
Options outstanding at March 31, 2012
|
3,178
|
|
$
|
74.75
|
|
4.3
|
$
|
316.4
|
|
||||
|
Granted
|
627
|
|
141.81
|
|
|||||||||
|
Exercised
|
(789
|
)
|
62.89
|
|
|||||||||
|
Cancelled/Forfeited
|
(62
|
)
|
117.43
|
|
|||||||||
|
Options outstanding at March 30, 2013
|
2,954
|
|
$
|
91.26
|
|
4.1
|
$
|
230.5
|
|
||||
|
Options vested and expected to vest at March 30, 2013
(b)
|
2,909
|
|
$
|
90.53
|
|
4.1
|
$
|
229.2
|
|
||||
|
Options exercisable at March 30, 2013
|
1,823
|
|
$
|
68.63
|
|
3.1
|
$
|
183.5
|
|
||||
|
(a)
|
Aggregate intrinsic value is the amount by which the market price at the end of the period of the underlying share of common stock exceeds the exercise price of the stock option, multiplied by the number of options.
|
|
(b)
|
The number of options expected to vest takes into consideration estimated expected forfeitures.
|
Additional information pertaining to the Company's stock option plans is as follows:
|
|
Fiscal Years Ended
|
|||||||||||
|
|
March 30,
2013 |
March 31,
2012 |
April 2,
2011 |
|||||||||
|
(millions)
|
||||||||||||
|
Aggregate intrinsic value of stock options exercised
(a)
|
$
|
75.7
|
|
$
|
101.3
|
|
$
|
129.4
|
|
|||
|
Cash received from the exercise of stock options
|
49.6
|
|
61.5
|
|
88.3
|
|
||||||
|
Tax benefits realized on exercise
|
29.3
|
|
36.2
|
|
50.0
|
|
||||||
|
(a)
|
Aggregate intrinsic value is the amount by which the average market price during the period of the underlying common stock exceeded the exercise price of the stock options exercised, multiplied by the number of options.
|
As of
March 30, 2013
, there was
$20.5 million
of total unrecognized compensation expense related to nonvested stock options granted, expected to be recognized over a weighted-average period of
1.4 years
.
Service-based RSUs and Restricted Stock Awards
The Company grants service-based RSUs and restricted shares of Class A common stock to certain of its senior executives and non-employee directors.
Service-based RSUs granted to executives generally vest over a
three
to
five
-year period, subject to the executive’s continuing employment. Holders of certain RSUs are entitled to receive dividend equivalents in the form of additional RSUs in connection with the payment of dividends on the Company's Class A common stock. The fair values of service-based RSUs are based on the fair value of the Company’s Class A common stock on the date of grant, adjusted to reflect the absence of dividends for those restricted securities that are not entitled to dividend equivalents.
Restricted stock shares granted to non-employee directors vest over a
three
-year period, and are accounted for at fair value at the date of grant. Holders of restricted shares are entitled to receive cash dividends in connection with the payments of dividends on the Company's Class A common stock.
|
|
F-41
|
|
RALPH LAUREN CORPORATION
NOTES TO CONSOLIDATED FINANCIAL STATEMENTS (Continued)
A summary of restricted stock and service-based RSU activity during
Fiscal 2013
is as follows:
|
Restricted
Stock
|
Service-
based RSUs
|
|||||||||||||
|
|
Number of
Shares
|
Weighted-Average Grant Date Fair Value
|
Number of
Shares
|
Weighted-Average Grant Date Fair Value
|
||||||||||
|
|
(thousands)
|
(thousands)
|
||||||||||||
|
Nonvested at March 31, 2012
|
8
|
|
$
|
85.87
|
|
235
|
|
$
|
95.57
|
|
||||
|
Granted
|
2
|
|
173.33
|
|
9
|
|
150.17
|
|
||||||
|
Vested
|
(5
|
)
|
70.58
|
|
(146
|
)
|
107.46
|
|
||||||
|
Forfeited
|
—
|
|
—
|
|
—
|
|
—
|
|
||||||
|
Nonvested at March 30, 2013
|
5
|
|
$
|
134.28
|
|
98
|
|
$
|
79.52
|
|
||||
|
Restricted
Stock
|
Service-
based RSUs
|
|||||||
|
Total unrecognized compensation at March 30, 2013 (millions)
|
$
|
0.2
|
|
$
|
2.0
|
|
||
|
Weighted-average years expected to be recognized over (years)
|
1.5
|
|
1.7
|
|
||||
Additional information pertaining to the restricted stock and RSU activity is as follows:
|
|
Fiscal Years Ended
|
|||||||||||
|
|
March 30,
2013 |
March 31,
2012 |
April 2,
2011 |
|||||||||
|
Restricted Stock:
|
||||||||||||
|
Weighted-average grant date fair value of awards granted
|
$
|
173.33
|
|
$
|
—
|
|
$
|
125.26
|
|
|||
|
Total fair value of awards vested (millions)
|
0.9
|
|
—
|
|
0.7
|
|
||||||
|
Service-based RSUs:
|
||||||||||||
|
Weighted-average grant date fair value of awards granted
|
$
|
150.17
|
|
$
|
140.86
|
|
$
|
125.26
|
|
|||
|
Total fair value of awards vested (millions)
|
21.8
|
|
14.8
|
|
9.8
|
|
||||||
Performance-based RSUs
The Company grants performance-based RSUs to senior executives and other key executives, as well as certain of its other employees. Performance-based RSUs generally vest (i) upon the completion of a
three
-year period of time (cliff vesting), subject to the employee’s continuing employment and the Company’s achievement of certain performance goals established at the beginning of the
three
-year performance period or (ii) ratably, over a
three
-year period of time (graded vesting), subject to the employee’s continuing employment during the applicable vesting period and the achievement by the Company of certain performance goals in the initial year of the
three
-year vesting period. For performance-based RSUs subject to cliff vesting, the number of shares that may be earned ranges between
0%
(if the specified threshold performance level is not attained) and
150%
(if performance meets or exceeds the maximum achievement level) of the awards originally granted. If actual performance exceeds the pre-established threshold, the number of shares earned is calculated based on the relative performance between specified levels of achievement.
In July 2012, the Company granted a new type of cliff vesting performance-based RSU award which, in addition to being subject to continuing employment requirements and the Company’s performance goals noted above, is also subject to a market condition in the form of a total shareholder return (“TSR”) modifier. The actual number of shares that vest at the end of the respective
three
-year period is determined based on the Company’s achievement of the
three
-year performance goals described above, as well as its TSR relative to the S&P 500 over the related
three
-year performance period. At the end of the
three
-year performance period, if the performance condition is achieved at or above the pre-established threshold, the number of shares earned is further adjusted by a TSR modifier payout percentage, which ranges between
75%
and
125%
, based on the Company’s TSR performance relative to that of the S&P 500 index over the respective
three
-year period. Depending on the total level of achievement, the actual number of shares that vest for performance-based RSU awards with a TRS modifier may range from
0%
to
187.5%
of the awards originally granted.
|
|
F-42
|
|
RALPH LAUREN CORPORATION
NOTES TO CONSOLIDATED FINANCIAL STATEMENTS (Continued)
The Company estimates the fair value of its performance-based RSUs with a TSR modifier on the date of grant using a Monte Carlo simulation valuation model. This pricing model uses multiple simulations to evaluate the probability of the Company achieving various stock price levels to determine its expected TSR performance ranking. Expense is only recorded for awards that are expected to vest, net of estimated forfeitures. The assumptions used to estimate the fair value of performance-based RSUs with a TSR modifier granted during the year ended
March 30, 2013
were as follows:
|
|
Fiscal Year Ended
|
||
|
|
March 30,
2013 |
||
|
Expected term (years)
|
3.0
|
|
|
|
Expected volatility
|
34.0
|
%
|
|
|
Expected dividend yield
|
1.13
|
%
|
|
|
Risk-free interest rate
|
0.3
|
%
|
|
|
Weighted-average grant date fair value
|
$136.16
|
|
|
A summary of performance-based RSU without TSR Modifier and performance-based RSU with TSR Modifier activity during
Fiscal 2013
is as follows:
|
Performance-based
RSUs — without TSR Modifier
|
Performance-based
RSUs — with TSR Modifier
|
|||||||||||||
|
Number of
Shares
|
Weighted-Average Grant Date Fair Value
|
Number of
Shares
|
Weighted-Average Grant Date Fair Value
|
|||||||||||
|
|
(thousands)
|
(thousands)
|
||||||||||||
|
Nonvested at March 31, 2012
|
1,302
|
|
$
|
86.53
|
|
—
|
|
$
|
—
|
|
||||
|
Granted
|
351
|
|
137.45
|
|
73
|
|
136.16
|
|
||||||
|
Change due to performance/market condition achievement
|
164
|
|
60.63
|
|
—
|
|
—
|
|
||||||
|
Vested
|
(754
|
)
|
67.65
|
|
—
|
|
—
|
|
||||||
|
Forfeited
|
(48
|
)
|
110.59
|
|
—
|
|
—
|
|
||||||
|
Nonvested at March 30, 2013
|
1,015
|
|
$
|
112.80
|
|
73
|
|
$
|
136.16
|
|
||||
|
Performance-based
RSUs — without TSR Modifier
|
Performance-based
RSUs — with TSR Modifier
|
|||||||
|
Total unrecognized compensation at March 30, 2013 (millions)
|
$
|
49.1
|
|
$
|
7.4
|
|
||
|
Weighted-average years expected to be recognized over (years)
|
1.6
|
|
2.2
|
|
||||
Additional information pertaining to performance-based RSU without TSR Modifier and performance-based RSU with TSR Modifier activity is as follows:
|
|
Fiscal Years Ended
|
|||||||||||
|
|
March 30,
2013 |
March 31,
2012 |
April 2,
2011 |
|||||||||
|
Performance-based RSUs — without TSR Modifier:
|
||||||||||||
|
Weighted-average grant date fair value of awards granted
|
$
|
137.45
|
|
$
|
124.43
|
|
$
|
75.29
|
|
|||
|
Total fair value of awards vested (millions)
|
106.2
|
|
56.3
|
|
39.0
|
|
||||||
|
Performance-based RSUs — with TSR Modifier:
|
||||||||||||
|
Weighted-average grant date fair value of awards granted
|
$
|
136.16
|
|
N/A
|
|
N/A
|
|
|||||
|
Total fair value of awards vested (millions)
|
—
|
|
N/A
|
|
N/A
|
|
||||||
|
|
F-43
|
|
RALPH LAUREN CORPORATION
NOTES TO CONSOLIDATED FINANCIAL STATEMENTS (Continued)
|
21.
|
Employee Benefit Plans
|
Profit Sharing Retirement Savings Plans
The Company sponsors defined contribution benefit plans covering substantially all eligible employees in the U.S. and Puerto Rico who are not covered by a collective bargaining agreement. The plans include a savings plan feature under Section 401(k) of the Internal Revenue Code. The Company makes discretionary matching contributions to the plans, which historically were equal to
50%
of the first
6%
of salary contributed by an eligible employee. On November 7, 2011, the Company's Board of Directors approved a supplemental discretionary matching contribution for plan years beginning with Fiscal 2012, whereby if the Company achieves a “stretch” or a “maximum” performance target based on certain goals established at the beginning of each fiscal year, the matching contribution will be increased to
75%
or
100%
, respectively, of the first
6%
of salary contributed by eligible employees, not to exceed the maximum contribution permitted by the plan.
Under the terms of the plans, a participant becomes
100%
vested in the Company's matching contributions after
five
years of credited service. Contributions made by the Company under these plans were approximately
$10 million
in each of
Fiscal 2013
and
Fiscal 2012
, and
$8 million
in
Fiscal 2011
.
International Defined Benefit Plans
The Company sponsors certain single-employer defined benefit plans and cash balance plans at international locations which are not considered to be material individually or in the aggregate to the Company's financial statements. Pension benefits under these plans are based on formulas that reflect the employees' years of service and compensation levels during their employment period. The aggregate funded status of the single-employer defined benefit plans reflected net liabilities of
$1.7 million
and
$1.0 million
as of
March 30, 2013
and
March 31, 2012
, respectively, and were primarily recorded within other non-current liabilities in the Company's consolidated balance sheets. These single-employer defined benefit plans had aggregate projected benefit obligations of
$45.2 million
and aggregate fair values of plan assets of
$43.5 million
as of
March 30, 2013
, compared to aggregate projected benefit obligations of
$39.8 million
and aggregate fair values of plan assets of
$38.8 million
as of
March 31, 2012
. The asset portfolio of the single-employer defined benefit plans primarily consists of debt securities, which have been measured at fair value largely using Level 2 inputs, as described in Note 15. Pension expense for these plans, recorded within SG&A expenses in the Company's consolidated statements of income was
$4.4 million
,
$5.0 million
, and
$1.8 million
in
Fiscal 2013
,
Fiscal 2012
, and
Fiscal 2011
, respectively.
Union Pension Plan
The Company participates in a multi-employer pension plan and is required to make contributions to the Amalgamated Ladies Garment Cutters Union, Local 10 UNITE (which was previously known as UNITE HERE) (the “Union”) for dues based on wages paid to union employees. A portion of these dues is allocated by the Union to a retirement fund which provides defined benefits to substantially all unionized workers. The Company does not participate in the management of the plan and has not been furnished with information with respect to the type of benefits provided, vested and non-vested benefits, or assets.
Under the Employee Retirement Income Security Act of 1974, as amended, an employer, upon withdrawal from or termination of a multi-employer plan, is required to continue funding its proportionate share of the plan's unfunded vested benefits. Such liability was assumed in conjunction with the acquisition of certain assets from a non-affiliated licensee. The Company has no current intention of withdrawing from the plan.
Other Compensation Plans
The Company has a non-qualified supplemental retirement plan for certain highly compensated employees whose benefits under the 401(k) profit sharing retirement savings plans were expected to be constrained by the operation of certain Internal Revenue Code limitations. These supplemental benefits vest over time and the related compensation expense is recognized over the vesting period. Effective August 2008, the Company amended this plan, resulting in a suspension of the annual contributions for substantially all plan participants. Further, affected participants were provided with a one-time election to either withdraw all benefits vested in the plan in a lump sum amount or remain in the plan and receive future distributions of benefits vested over a
three
-year period. As of both
March 30, 2013
and
March 31, 2012
, amounts accrued under this plan totaled approximately
$9 million
and were classified within other non-current liabilities in the consolidated balance sheets. Total compensation expense recognized related to these benefits was
$0.2 million
in each of the three fiscal years presented.
|
|
F-44
|
|
RALPH LAUREN CORPORATION
NOTES TO CONSOLIDATED FINANCIAL STATEMENTS (Continued)
Additionally, the Company has deferred compensation arrangements for certain key executives which generally provide for payments upon retirement, death, or termination of employment. The amounts accrued under these plans were approximately
$3 million
and
$2 million
as of
March 30, 2013
and
March 31, 2012
, respectively, and were classified within other non-current liabilities in the consolidated balance sheets. Total compensation expense related to these compensation arrangements was
$0.2 million
in each of
Fiscal 2013
and
Fiscal 2012
, and
$0.3 million
in
Fiscal 2011
. The Company funds a portion of these obligations through the establishment of trust accounts on behalf of the executives participating in the plans. The trust accounts are classified within other non-current assets in the consolidated balance sheets.
|
22.
|
Segment Information
|
The Company has
three
reportable segments based on its business activities and organization: Wholesale, Retail, and Licensing. Such segments offer a variety of products through different channels of distribution. The Wholesale segment consists of women’s, men’s, and children’s apparel, accessories, home furnishings, and related products which are sold to major department stores, specialty stores, golf and pro shops, and the Company’s owned, licensed, and franchised retail stores in the U.S. and overseas. The Retail segment consists of the Company’s worldwide retail operations, which sell products through its retail stores, its concession-based shop-within-shops, and its e-commerce sites. The stores, concession-based shop-within-shops, and websites sell products purchased from the Company’s licensees, suppliers, and Wholesale segment. The Licensing segment generates revenues from royalties earned on the sale of the Company’s apparel, home, and other products internationally and domestically through licensing alliances. The licensing agreements grant the licensees rights to use the Company’s various trademarks in connection with the manufacture and sale of designated products in specified geographical areas for specified periods.
The accounting policies of the Company’s segments are consistent with those described in Notes 2 and 3. Sales and transfers between segments are generally recorded at cost and treated as transfers of inventory. All intercompany revenues, including such sales between segments, are eliminated in consolidation and are not reviewed when evaluating segment performance. Each segment’s performance is evaluated based upon operating income before restructuring charges and certain other one-time items, such as legal charges, if any. Corporate overhead expenses (exclusive of certain expenses for senior management, overall branding-related expenses, and certain other corporate-related expenses) are allocated to the segments based upon specific usage or other allocation methods, as appropriate.
Net revenues for each of the Company’s reportable segments are as follows:
|
|
Fiscal Years Ended
|
|||||||||||
|
|
March 30,
2013 |
March 31,
2012 |
April 2,
2011 |
|||||||||
|
|
(millions)
|
|||||||||||
|
Net revenues:
|
||||||||||||
|
Wholesale
|
$
|
3,138.3
|
|
$
|
3,246.5
|
|
$
|
2,777.6
|
|
|||
|
Retail
|
3,624.6
|
|
3,432.3
|
|
2,704.2
|
|
||||||
|
Licensing
|
181.9
|
|
180.7
|
|
178.5
|
|
||||||
|
Total net revenues
|
$
|
6,944.8
|
|
(a)
|
$
|
6,859.5
|
|
$
|
5,660.3
|
|
||
|
(a)
|
During Fiscal 2013, the Company's sales to its largest wholesale customer, Macy's, accounted for approximately
12%
of its total net revenues.
|
|
|
F-45
|
|
RALPH LAUREN CORPORATION
NOTES TO CONSOLIDATED FINANCIAL STATEMENTS (Continued)
Operating income for each of the Company’s reportable segments is as follows:
|
|
Fiscal Years Ended
|
|||||||||||
|
|
March 30,
2013 |
March 31,
2012 |
April 2,
2011 |
|||||||||
|
|
(millions)
|
|||||||||||
|
Operating income:
|
||||||||||||
|
Wholesale
(a)
|
$
|
706.1
|
|
$
|
654.3
|
|
$
|
600.6
|
|
|||
|
Retail
(b)
|
611.3
|
|
553.1
|
|
383.8
|
|
||||||
|
Licensing
(c)
|
130.1
|
|
129.0
|
|
124.0
|
|
||||||
|
1,447.5
|
|
1,336.4
|
|
1,108.4
|
|
|||||||
|
Unallocated corporate expenses
|
(309.1
|
)
|
(284.6
|
)
|
(260.7
|
)
|
||||||
|
Unallocated restructuring charges, net
(d)
|
(11.7
|
)
|
(12.4
|
)
|
(2.6
|
)
|
||||||
|
Total operating income
|
$
|
1,126.7
|
|
$
|
1,039.4
|
|
$
|
845.1
|
|
|||
|
|
|
(a)
|
During Fiscal 2013, the Company recorded non-cash impairment charges of
$2.5 million
associated with write-offs of fixed assets of certain wholesale locations in Europe that are expected to close. During Fiscal 2012, the Company recorded non-cash asset impairment charges of
$0.4 million
related to the write-off of long-lived assets due to the termination of a wholesale selling relationship. See
Note 11
for additional information.
|
|
(b)
|
During Fiscal 2013, the Company recorded non-cash asset impairment charges of
$14.8 million
to write down certain long-lived assets within its Retail segment, primarily in connection with the Rugby Closure Plan and certain underperforming retail stores in Europe. Fiscal 2012 and Fiscal 2011 included asset impairment charges of
$1.8 million
and
$2.5 million
, respectively, primarily to reduce the net carrying value of the long-lived assets of certain retail stores to their estimated fair values. See
Note 11
for additional information.
|
|
(c)
|
During Fiscal 2013, the Company recorded non-cash asset impairment charges of
$1.7 million
related to the write-off of certain intangible assets in connection with the Rugby Closure Plan. See
Note 11
for additional information.
|
|
(d)
|
The fiscal periods presented included certain unallocated restructuring charges (See
Note 12
), which are detailed below:
|
|
|
Fiscal Years Ended
|
|||||||||||
|
|
March 30,
2013 |
March 31,
2012 |
April 2,
2011 |
|||||||||
|
|
(millions)
|
|||||||||||
|
Restructuring charges, net:
|
||||||||||||
|
Wholesale-related
|
$
|
(1.1
|
)
|
$
|
(5.0
|
)
|
$
|
(3.2
|
)
|
|||
|
Retail-related
|
(9.4
|
)
|
(6.6
|
)
|
1.8
|
|
||||||
|
Licensing-related
|
(0.2
|
)
|
—
|
|
—
|
|
||||||
|
Corporate operations-related
|
(1.0
|
)
|
(0.8
|
)
|
(1.2
|
)
|
||||||
|
Restructuring charges, net
|
(11.7
|
)
|
(12.4
|
)
|
(2.6
|
)
|
||||||
|
|
F-46
|
|
RALPH LAUREN CORPORATION
NOTES TO CONSOLIDATED FINANCIAL STATEMENTS (Continued)
Depreciation and amortization expense and capital expenditures for each of the Company’s reportable segments are as follows:
|
|
Fiscal Years Ended
|
|||||||||||
|
|
March 30,
2013 |
March 31,
2012 |
April 2,
2011 |
|||||||||
|
|
(millions)
|
|||||||||||
|
Depreciation and amortization:
|
||||||||||||
|
Wholesale
|
$
|
68.8
|
|
$
|
65.6
|
|
$
|
56.1
|
|
|||
|
Retail
|
115.9
|
|
115.4
|
|
93.9
|
|
||||||
|
Licensing
|
1.5
|
|
1.1
|
|
1.3
|
|
||||||
|
Unallocated corporate
|
46.1
|
|
43.1
|
|
42.8
|
|
||||||
|
Total depreciation and amortization
|
$
|
232.3
|
|
$
|
225.2
|
|
$
|
194.1
|
|
|||
|
Fiscal Years Ended
|
||||||||||||
|
March 30,
2013 |
March 31,
2012 |
April 2,
2011 |
||||||||||
|
(millions)
|
||||||||||||
|
Capital expenditures:
|
||||||||||||
|
Wholesale
|
$
|
39.9
|
|
$
|
83.6
|
|
$
|
34.7
|
|
|||
|
Retail
|
158.2
|
|
135.3
|
|
157.6
|
|
||||||
|
Licensing
|
0.1
|
|
0.3
|
|
1.7
|
|
||||||
|
Unallocated corporate
|
78.3
|
|
53.0
|
|
61.0
|
|
||||||
|
Total capital expenditures
|
$
|
276.5
|
|
$
|
272.2
|
|
$
|
255.0
|
|
|||
Total assets for each of the Company's reportable segments are as follows:
|
March 30,
2013 |
March 31,
2012 |
|||||||
|
(millions)
|
||||||||
|
Total assets:
|
||||||||
|
Wholesale
|
$
|
2,321.6
|
|
$
|
2,487.2
|
|
||
|
Retail
|
1,893.9
|
|
1,691.5
|
|
||||
|
Licensing
|
229.5
|
|
228.8
|
|
||||
|
Corporate
|
973.2
|
|
1,008.9
|
|
||||
|
Total assets
|
$
|
5,418.2
|
|
$
|
5,416.4
|
|
||
Net revenues and
long-
lived assets by geographic location of the reporting subsidiary are as follows:
|
|
Fiscal Years Ended
|
|||||||||||
|
|
March 30,
2013 |
March 31,
2012 |
April 2,
2011 |
|||||||||
|
|
(millions)
|
|||||||||||
|
Net revenues:
|
||||||||||||
|
The Americas
(a),(b)
|
$
|
4,586.1
|
|
$
|
4,403.0
|
|
$
|
3,819.2
|
|
|||
|
Europe
(a)
|
1,447.0
|
|
1,486.5
|
|
1,178.6
|
|
||||||
|
Asia
(c)
|
911.7
|
|
970.0
|
|
662.5
|
|
||||||
|
Total net revenues
|
$
|
6,944.8
|
|
$
|
6,859.5
|
|
$
|
5,660.3
|
|
|||
|
|
F-47
|
|
RALPH LAUREN CORPORATION
NOTES TO CONSOLIDATED FINANCIAL STATEMENTS (Continued)
|
|
March 30,
2013 |
March 31,
2012 |
||||||
|
|
(millions)
|
|||||||
|
Long-lived assets:
|
||||||||
|
The Americas
(a),(b)
|
$
|
582.3
|
|
$
|
539.1
|
|
||
|
Europe
(a)
|
182.1
|
|
201.2
|
|
||||
|
Asia
(c)
|
167.8
|
|
143.8
|
|
||||
|
Total long-lived assets
|
$
|
932.2
|
|
$
|
884.1
|
|
||
|
(a)
|
Net revenues and long-lived assets for certain of the Company’s licensed operations are included within the geographic location of the reporting subsidiary which holds the respective license.
|
|
(b)
|
Net revenues earned in the U.S. during
Fiscal 2013
,
Fiscal 2012
, and
Fiscal 2011
were
$4.388 billion
,
$4.273 billion
, and
$3.730 billion
, respectively. Long-lived assets located in the U.S. were
$566.8 million
and
$528.4 million
as of
March 30, 2013
and
March 31, 2012
, respectively.
|
|
(c)
|
Includes South Korea, Japan, China, Hong Kong, Macau, Malaysia, the Philippines, Singapore, Taiwan, Thailand, and Australia.
|
|
23.
|
Related Party Transactions
|
In the ordinary course of conducting its business, the Company periodically enters into transactions with other entities or people that are considered related parties.
During Fiscal 2011, the Company commenced a secondary public offering under which approximately
10 million
shares of Class A common stock were sold on behalf of its principal stockholder, Mr. Ralph Lauren, Chairman of the Board and Chief Executive Officer. Concurrent with this offering, the Company also purchased an additional
1 million
shares of Class A common stock under its repurchase program from Mr. Lauren at the same per share price of the public offering. See Note 18 for further discussion of this secondary stock offering.
|
24.
|
Additional Financial Information
|
Cash Interest and Taxes
Cash paid for interest and income taxes are as follows:
|
|
Fiscal Years Ended
|
|||||||||||
|
|
March 30,
2013 |
March 31,
2012 |
April 2,
2011 |
|||||||||
|
|
(millions)
|
|||||||||||
|
Cash paid for interest
|
$
|
18.0
|
|
$
|
23.6
|
|
$
|
22.0
|
|
|||
|
Cash paid for income taxes
|
$
|
339.3
|
|
$
|
189.2
|
|
$
|
220.7
|
|
|||
Non-cash Transactions
Significant non-cash investing activities included the capitalization of fixed assets and recognition of related obligations in the net amount of
$52.6 million
,
$45.4 million
, and
$8.6 million
in
Fiscal 2013
,
Fiscal 2012
, and
Fiscal 2011
, respectively. Significant non-cash investing activities also included the non-cash allocation of the fair value of the net assets acquired in connection with the South Korea Licensed Operations Acquisition in Fiscal 2011 (see Note 5).
|
|
F-48
|
|
RALPH LAUREN CORPORATION
NOTES TO CONSOLIDATED FINANCIAL STATEMENTS (Continued)
Significant non-cash financing activities in
Fiscal 2013
and
Fiscal 2011
included the conversion of
950,000
shares and
11.3 million
shares, respectively, of Class B common stock into an equal number of shares of Class A common stock, as described further in Note 18.
There were no other significant non-cash investing or financing activities for the fiscal periods presented.
|
25.
|
Subsequent Event
|
On April 10, 2013, in connection with the transition of the North American Chaps-branded men's sportswear business from a licensed to a wholly-owned operation, the Company entered into an agreement with The Warnaco Group, Inc. (“Warnaco”), a subsidiary of PVH Corp. (“PVH”), to acquire certain net assets in exchange for an aggregate payment of approximately
$18 million
(the "Chaps Menswear License Acquisition"). The Company funded the Chaps Menswear License Acquisition with available cash on-hand. Warnaco was the Company's licensee for Chaps-branded men's sportswear apparel in North America. In connection with the Chaps Menswear License Acquisition, the Company entered into a transition services agreement with PVH for the provision of certain support services related to sourcing, distribution, customer service, finance, and information systems through June 30, 2013. The operating results of the Chaps men's sportswear business will be consolidated in the Company's operating results commencing on April 10, 2013. The Company is currently in the process of assessing the fair values of the assets acquired and liabilities assumed.
|
|
F-49
|
|
MANAGEMENT'S REPORT ON RESPONSIBILITY FOR FINANCIAL STATEMENTS
The management of Ralph Lauren Corporation is responsible for the preparation, objectivity, and integrity of the consolidated financial statements and other information contained in this Annual Report. The consolidated financial statements have been prepared in accordance with accounting principles generally accepted in the United States and include some amounts that are based on management's informed judgments and best estimates.
These consolidated financial statements have been audited by Ernst & Young LLP in
Fiscal 2013
,
Fiscal 2012
, and
Fiscal 2011
, which is an independent registered public accounting firm. They conducted their audits in accordance with the standards of the Public Company Accounting Oversight Board (United States) and have expressed herein their unqualified opinions on those financial statements.
The Audit Committee of the Board of Directors, which oversees all of the Company's financial reporting process on behalf of the Board of Directors, consists solely of independent directors, meets with the independent registered accountants, internal auditors, and management periodically to review their respective activities and the discharge of their respective responsibilities. Both the independent registered public accountants and the internal auditors have unrestricted access to the Audit Committee, with or without management, to discuss the scope and results of their audits and any recommendations regarding the system of internal controls.
May 23, 2013
|
/S/ RALPH LAUREN
|
/S/ CHRISTOPHER H. PETERSON
|
|
|
Ralph Lauren
|
Christopher H. Peterson
|
|
|
Chairman and Chief Executive Officer
|
Senior Vice President and Chief Financial Officer
|
|
|
(Principal Financial and Accounting Officer)
|
||
|
|
F-50
|
|
REPORT OF INDEPENDENT REGISTERED PUBLIC ACCOUNTING FIRM
To the Board of Directors and Stockholders of Ralph Lauren Corporation
We have audited the accompanying consolidated balance sheets of Ralph Lauren Corporation and subsidiaries (the "Company") as of March 30, 2013 and March 31, 2012, and the related consolidated statements of income, comprehensive income, equity, and cash flows for each of the three years in the period ended March 30, 2013. These financial statements are the responsibility of the Company's management. Our responsibility is to express an opinion on these financial statements based on our audits.
We conducted our audits in accordance with the standards of the Public Company Accounting Oversight Board (United States). Those standards require that we plan and perform the audit to obtain reasonable assurance about whether the financial statements are free of material misstatement. An audit includes examining, on a test basis, evidence supporting the amounts and disclosures in the financial statements. An audit also includes assessing the accounting principles used and significant estimates made by management, as well as evaluating the overall financial statement presentation. We believe that our audits provide a reasonable basis for our opinion.
In our opinion, the financial statements referred to above present fairly, in all material respects, the consolidated financial position of Ralph Lauren Corporation and subsidiaries at March 30, 2013 and March 31, 2012, and the consolidated results of its operations and its cash flows for each of the three years in the period ended March 30, 2013, in conformity with U.S. generally accepted accounting principles.
We also have audited, in accordance with the standards of the Public Company Accounting Oversight Board (United States), the Company's internal control over financial reporting as of March 30, 2013, based on criteria established in
Internal Control - Integrated Framework
issued by the Committee of Sponsoring Organizations of the Treadway Commission and our report dated May 23, 2013 expressed an unqualified opinion thereon.
/s/ ERNST & YOUNG LLP
New York, New York
May 23, 2013
|
|
F-51
|
|
REPORT OF INDEPENDENT REGISTERED PUBLIC ACCOUNTING FIRM
To the Board of Directors and Stockholders of Ralph Lauren Corporation
We have audited Ralph Lauren Corporation and its subsidiaries' (“the Company's”) internal control over financial reporting as of March 30, 2013, based on criteria established in
Internal Control - Integrated Framework
issued by the Committee of Sponsoring Organizations of the Treadway Commission (the COSO criteria). The Company's management is responsible for maintaining effective internal control over financial reporting, and for its assessment of the effectiveness of internal control over financial reporting included in the accompanying Management's Report of Internal Control Over Financial Reporting. Our responsibility is to express an opinion on the Company's internal control over financial reporting based on our audit.
We conducted our audit in accordance with the standards of the Public Company Accounting Oversight Board (United States). Those standards require that we plan and perform the audit to obtain reasonable assurance about whether effective internal control over financial reporting was maintained in all material respects. Our audit included obtaining an understanding of internal control over financial reporting, assessing the risk that a material weakness exists, testing and evaluating the design and operating effectiveness of internal control based on the assessed risk, and performing such other procedures as we considered necessary in the circumstances. We believe that our audit provides a reasonable basis for our opinion.
A company's internal control over financial reporting is a process designed to provide reasonable assurance regarding the reliability of financial reporting and the preparation of financial statements for external purposes in accordance with generally accepted accounting principles. A company's internal control over financial reporting includes those policies and procedures that (1) pertain to the maintenance of records that, in reasonable detail, accurately and fairly reflect the transactions and dispositions of the assets of the company; (2) provide reasonable assurance that transactions are recorded as necessary to permit preparation of financial statements in accordance with generally accepted accounting principles, and that receipts and expenditures of the company are being made only in accordance with authorizations of management and directors of the company; and (3) provide reasonable assurance regarding prevention or timely detection of unauthorized acquisition, use, or disposition of the company's assets that could have a material effect on the financial statements.
Because of its inherent limitations, internal control over financial reporting may not prevent or detect misstatements. Also, projections of any evaluation of effectiveness to future periods are subject to the risk that controls may become inadequate because of changes in conditions, or that the degree of compliance with the policies or procedures may deteriorate.
In our opinion, the Company maintained, in all material respects, effective internal control over financial reporting as of March 30, 2013, based on the COSO criteria.
We also have audited, in accordance with the standards of the Public Company Accounting Oversight Board (United States), the consolidated balance sheets of the Company as of March 30, 2013 and March 31, 2012 and the related consolidated statements of income, comprehensive income, equity and cash flows for each of the three fiscal years in the period ended March 30, 2013 and our report dated May 23, 2013 expressed an unqualified opinion thereon.
/s/ ERNST & YOUNG LLP
New York, New York
May 23, 2013
|
|
F-52
|
|
RALPH LAUREN CORPORATION
SELECTED FINANCIAL INFORMATION
The following table sets forth selected historical financial information as of the dates and for the periods indicated.
The consolidated statement of income data for each of the three fiscal years in the period ended
March 30, 2013
as well as the consolidated balance sheet data as of
March 30, 2013
and
March 31, 2012
have been derived from, and should be read in conjunction with, the audited financial statements and other financial information presented elsewhere herein. The consolidated statements of income data for the fiscal years ended
April 3, 2010
and
March 28, 2009
and the consolidated balance sheet data at
April 2, 2011
,
April 3, 2010
and
March 28, 2009
have been derived from audited financial statements not included herein. Capitalized terms are as defined and described in the consolidated financial statements or elsewhere herein. The historical results are not necessarily indicative of the results to be expected in any future period.
The selected financial information for the fiscal year ended April 2, 2011 reflects the South Korea Licensed Operations Acquisition effective in January 2011. The selected financial information for the fiscal year ended April 3, 2010 reflects the Asia-Pacific Licensed Operations Acquisition effective in January 2010. The selected financial information for the fiscal year ended March 28, 2009 reflects the Japanese Childrenswear and Golf Acquisition effective in August 2008.
|
Fiscal Years Ended
(a)
|
||||||||||||||||||||
|
March 30, 2013
|
March 31, 2012
|
April 2, 2011
|
April 3, 2010
|
March 28, 2009
|
||||||||||||||||
|
(millions, except per share data)
|
||||||||||||||||||||
|
Statement of Income Data:
|
||||||||||||||||||||
|
Net revenues:
|
||||||||||||||||||||
|
Net sales
|
$
|
6,762.9
|
|
$
|
6,678.8
|
|
$
|
5,481.8
|
|
$
|
4,795.5
|
|
$
|
4,823.7
|
|
|||||
|
Licensing revenues
|
181.9
|
|
180.7
|
|
178.5
|
|
183.4
|
|
195.2
|
|
||||||||||
|
Net revenues
|
6,944.8
|
|
6,859.5
|
|
5,660.3
|
|
4,978.9
|
|
5,018.9
|
|
||||||||||
|
Gross profit
|
4,155.8
|
|
3,998.1
|
|
3,318.3
|
|
2,899.1
|
|
2,730.7
|
|
||||||||||
|
Depreciation and amortization expense
|
(232.3
|
)
|
(225.2
|
)
|
(194.1
|
)
|
(181.2
|
)
|
(184.4
|
)
|
||||||||||
|
Impairments of assets
|
(19.0
|
)
|
(2.2
|
)
|
(2.5
|
)
|
(6.6
|
)
|
(55.4
|
)
|
||||||||||
|
Restructuring charges
|
(11.7
|
)
|
(12.4
|
)
|
(2.6
|
)
|
(6.9
|
)
|
(23.6
|
)
|
||||||||||
|
Operating income
|
1,126.7
|
|
1,039.4
|
|
845.1
|
|
706.9
|
|
595.5
|
|
||||||||||
|
Interest income/(expense), net
|
(16.4
|
)
|
(13.5
|
)
|
(10.6
|
)
|
(9.8
|
)
|
(4.6
|
)
|
||||||||||
|
Net income
|
$
|
750.0
|
|
$
|
681.0
|
|
$
|
567.6
|
|
$
|
479.5
|
|
$
|
406.0
|
|
|||||
|
Net income per common share:
|
||||||||||||||||||||
|
Basic
|
$
|
8.21
|
|
$
|
7.35
|
|
$
|
5.91
|
|
$
|
4.85
|
|
$
|
4.09
|
|
|||||
|
Diluted
|
$
|
8.00
|
|
$
|
7.13
|
|
$
|
5.75
|
|
$
|
4.73
|
|
$
|
4.01
|
|
|||||
|
Average common shares:
|
||||||||||||||||||||
|
Basic
|
91.3
|
|
92.7
|
|
96.0
|
|
98.9
|
|
99.2
|
|
||||||||||
|
Diluted
|
93.7
|
|
95.5
|
|
98.7
|
|
101.3
|
|
101.3
|
|
||||||||||
|
Dividends declared per common share
|
$
|
1.60
|
|
$
|
0.80
|
|
$
|
0.50
|
|
$
|
0.30
|
|
$
|
0.20
|
|
|||||
|
(a)
|
Fiscal 2010 consisted of 53 weeks. All other fiscal years presented consisted of 52 weeks.
|
|
|
F-53
|
|
RALPH LAUREN CORPORATION
SELECTED FINANCIAL INFORMATION (Continued)
|
March 30, 2013
|
March 31, 2012
|
April 2, 2011
|
April 3, 2010
|
March 28, 2009
|
||||||||||||||||
|
(millions)
|
||||||||||||||||||||
|
Balance Sheet Data:
|
||||||||||||||||||||
|
Cash and cash equivalents
|
$
|
973.7
|
|
$
|
671.6
|
|
$
|
453.0
|
|
$
|
563.1
|
|
$
|
481.2
|
|
|||||
|
Short-term investments
|
324.7
|
|
515.7
|
|
593.9
|
|
584.1
|
|
338.7
|
|
||||||||||
|
Non-current investments
|
81.0
|
|
99.9
|
|
83.6
|
|
75.5
|
|
29.7
|
|
||||||||||
|
Working capital
|
1,841.5
|
|
1,953.7
|
|
1,646.0
|
|
1,528.5
|
|
1,382.6
|
|
||||||||||
|
Total assets
|
5,418.2
|
|
5,416.4
|
|
4,981.1
|
|
4,648.9
|
|
4,356.5
|
|
||||||||||
|
Total debt (including current maturities of debt)
|
266.6
|
|
274.4
|
|
291.9
|
|
282.1
|
|
406.4
|
|
||||||||||
|
Equity
|
3,784.6
|
|
3,652.5
|
|
3,304.7
|
|
3,116.6
|
|
2,735.1
|
|
||||||||||
|
|
F-54
|
|
RALPH LAUREN CORPORATION
QUARTERLY FINANCIAL INFORMATION (UNAUDITED)
The following table sets forth the quarterly financial information of the Company:
|
Quarterly Periods Ended
(a)
|
||||||||||||||||
|
June 30,
2012 |
September 29,
2012 |
December 29,
2012 |
March 30,
2013 |
|||||||||||||
|
(millions, except per share data)
|
||||||||||||||||
|
Net revenues
|
$
|
1,593.4
|
|
$
|
1,862.0
|
|
$
|
1,846.1
|
|
$
|
1,643.3
|
|
||||
|
Gross profit
|
992.1
|
|
1,095.3
|
|
1,094.1
|
|
974.3
|
|
||||||||
|
Net income
|
193.4
|
|
213.7
|
|
215.7
|
|
127.2
|
|
||||||||
|
Net income per common share:
(b)
|
||||||||||||||||
|
Basic
|
$
|
2.10
|
|
$
|
2.34
|
|
$
|
2.37
|
|
$
|
1.40
|
|
||||
|
Diluted
|
$
|
2.03
|
|
$
|
2.29
|
|
$
|
2.31
|
|
$
|
1.37
|
|
||||
|
Dividends declared per common share
|
$
|
0.40
|
|
$
|
0.40
|
|
$
|
0.40
|
|
$
|
0.40
|
|
||||
|
Quarterly Periods Ended
(a)
|
||||||||||||||||
|
July 2,
2011 |
October 1,
2011 |
December 31,
2011 |
March 31,
2012 |
|||||||||||||
|
(millions, except per share data)
|
||||||||||||||||
|
Net revenues
|
$
|
1,526.4
|
|
$
|
1,904.6
|
|
$
|
1,805.6
|
|
$
|
1,622.9
|
|
||||
|
Gross profit
|
961.5
|
|
1,078.6
|
|
1,031.6
|
|
926.4
|
|
||||||||
|
Net income
|
184.1
|
|
233.5
|
|
169.0
|
|
94.4
|
|
||||||||
|
Net income per common share:
(b)
|
||||||||||||||||
|
Basic
|
$
|
1.96
|
|
$
|
2.53
|
|
$
|
1.83
|
|
$
|
1.02
|
|
||||
|
Diluted
|
$
|
1.90
|
|
$
|
2.46
|
|
$
|
1.78
|
|
$
|
0.99
|
|
||||
|
Dividends declared per common share
|
$
|
0.20
|
|
$
|
0.20
|
|
$
|
0.20
|
|
$
|
0.20
|
|
||||
|
(a)
|
All fiscal quarters presented consisted of 13 weeks.
|
|
(b)
|
Per common share amounts for the quarters and full years have been calculated separately. Accordingly, quarterly amounts may not add to the annual amount because of differences in the average number of common shares outstanding during each period.
|
|
|
F-55
|
|
TABLE OF CONTENTS
Part IItem 1. BusinessItem 1A. Risk FactorsItem 1B. Unresolved Staff CommentsItem 2. PropertiesItem 3. Legal ProceedingsItem 4. Mine Safety DisclosuresPart IIItem 5. Market For Registrant S Common Equity, Related Stockholder Matters and Issuer Purchases Of Equity SecuritiesItem 6. Selected Financial DataItem 7. Management S Discussion and Analysis Of Financial Condition and Results Of OperationsItem 7A. Quantitative and Qualitative Disclosures About Market RiskItem 8. Financial Statements and Supplementary DataItem 9. Changes in and Disagreements with Accountants on Accounting and Financial DisclosureItem 9A. Controls and ProceduresItem 9B. Other InformationPart IIIItem 10. Directors, Executive Officers and Corporate GovernanceItem 11. Executive CompensationItem 12. Security Ownership Of Certain Beneficial Owners and Management and Related Stockholder MattersItem 13. Certain Relationships and Related Transactions, and Director IndependenceItem 14. Principal Accounting Fees and ServicesPart IVItem 15. Exhibits, Financial Statement Schedules