RLJ LODGING TRUST
10-Ks and 10-Qs
|
|
|
|
|
|
|
|
|
|
|
|
|
|
|
|
|
|
|
|
|
|
|
|
|
|
|
|
|
|
|
|
|
|
|
|
|
|
|
|
|
|
|
|
|
|
|
|
|
|
UNITED STATES
SECURITIES AND EXCHANGE COMMISSION
Washington, D.C. 20549
FORM 10-K
|
x
|
|
ANNUAL REPORT PURSUANT TO SECTION 13 OR 15(d) OF THE SECURITIES EXCHANGE ACT OF 1934
|
|
For the fiscal year ended December 31, 2016
|
||
|
OR
|
||
|
o
|
|
TRANSITION REPORT PURSUANT TO SECTION 13 OR 15(d) OF THE SECURITIES EXCHANGE ACT OF 1934
|
|
For the transition period from to
|
||
Commission File Number 001-35169
RLJ LODGING TRUST
(Exact Name of Registrant as Specified in Its Charter)
|
Maryland
|
27-4706509
|
|
(State or Other Jurisdiction of Incorporation or Organization)
|
(I.R.S. Employer Identification No.)
|
|
3 Bethesda Metro Center, Suite 1000
|
|
|
Bethesda, Maryland
|
20814
|
|
(Address of Principal Executive Offices)
|
(Zip Code)
|
(301) 280-7777
(Registrant's Telephone Number, Including Area Code)
Securities registered pursuant to Section 12(b) of the Act:
|
Title of Each Class
|
|
Name of Each Exchange on Which Registered
|
|
Common Shares, $0.01 par value
|
|
New York Stock Exchange
|
Securities registered pursuant to Section 12(g) of the Act:
None
Indicate by check mark if the registrant is a well-known seasoned issuer, as defined in Rule 405 of the Securities Act. Yes
x
No
o
Indicate by check mark if the registrant is not required to file reports pursuant to Section 13 or 15(d) of the Act. Yes
o
No
x
Indicate by check mark whether the registrant (1) has filed all reports required to be filed by Section 13 or 15(d) of the Securities Exchange Act of 1934 during the preceding 12 months (or for such shorter period that the registrant was required to file such reports), and (2) has been subject to such filing requirements for the past 90 days.
x
Yes
o
No
Indicate by check mark whether the registrant has submitted electronically and posted on its corporate Web site, if any, every Interactive Data File required to be submitted and posted pursuant to Rule 405 of Regulation S-T (§232.405 of this chapter) during the preceding 12 months (or for such shorter period that the registrant was required to submit and post such files).
x
Yes
o
No
Indicate by check mark if disclosure of delinquent filers pursuant to Item 405 of Regulation S-K (§ 229.405 of this chapter) is not contained herein, and will not be contained, to the best of registrant's knowledge, in definitive proxy or information statements incorporated by reference in Part III of this Form 10-K or any amendment to this Form 10-K.
o
Indicate by check mark whether the registrant is a large accelerated filer, an accelerated filer, a non-accelerated filer, or a smaller reporting company. See the definitions of "large accelerated filer," "accelerated filer" and "smaller reporting company" in Rule 12b-2 of the Exchange Act.
|
Large accelerated filer
x
|
Accelerated filer
o
|
Non-accelerated filer
o
(do not check if a
smaller reporting company)
|
Smaller reporting company
o
|
|||
Indicate by check mark whether the registrant is a shell company (as defined in Rule 12b-2 of the Exchange Act).
o
Yes
x
No
The aggregate market value of the
121,664,760
common shares of beneficial interest held by non-affiliates of the Registrant was approximately
$2,609,709,102
based on the closing price of
$21.45
as reported on the New York Stock Exchange for such common shares of beneficial interest on
June 30, 2016
.
As of
February 15, 2017
,
124,621,611
common shares of beneficial interest of the Registrant, $0.01 par value per share, were outstanding.
Documents Incorporated by Reference
Portions of the Definitive Proxy Statement for our
2017
Annual Meeting of Shareholders are incorporated by reference into Part III of this report. We expect to file our proxy statement within 120 days after
December 31, 2016
.
TABLE OF CONTENTS
|
Item No.
|
Form 10-K
Report Page
|
|
|
PART I
|
||
|
PART II
|
||
|
PART III
|
||
|
PART IV
|
||
1
SPECIAL NOTE ABOUT FORWARD-LOOKING STATEMENTS
Certain statements in this Annual Report on Form 10-K, other than purely historical information, including estimates, projections, statements relating to our business plans, objectives and expected operating results, and the assumptions upon which those statements are based, are "forward-looking statements" within the meaning of the Private Securities Litigation Reform Act of 1995, Section 27A of the Securities Act of 1933, as amended, and Section 21E of the Securities Exchange Act of 1934, as amended. These forward-looking statements generally are identified by the use of the words "believe," "project," "expect," "anticipate," "estimate," "plan," "may," "will," "will continue," "intend," "should," "may" or similar expressions. Although we believe that the expectations reflected in such forward-looking statements are based upon reasonable assumptions, beliefs and expectations, such forward-looking statements are not predictions of future events or guarantees of future performance and our actual results could differ materially from those set forth in the forward-looking statements. Some factors that might cause such a difference include the following: the current global economic uncertainty, increased direct competition, changes in government regulations or accounting rules, changes in local, national and global real estate conditions, declines in the lodging industry, seasonality of the lodging industry, risks related to natural disasters, such as earthquakes and hurricanes, hostilities, including future terrorist attacks or fear of hostilities that affect travel, our ability to obtain lines of credit or permanent financing on satisfactory terms, changes in interest rates, access to capital through offerings of our common and preferred shares of beneficial interest, or debt, our ability to identify suitable acquisitions, our ability to close on identified acquisitions and integrate those businesses and inaccuracies of our accounting estimates. A discussion of these and other risks and uncertainties that could cause actual results and events to differ materially from such forward-looking statements is included in "Risk Factors" and "Management's Discussion and Analysis of Financial Condition and Results of Operations" within this Annual Report on Form 10-K. Given these uncertainties, undue reliance should not be placed on such statements. Except as required by law, we undertake no obligation to update or revise publicly any forward-looking statements, whether as a result of new information, future events or otherwise. Except where the context suggests otherwise, we define certain terms in this Annual Report on Form 10-K as follows:
|
•
|
"our company," "we," "us" and "our" refer to RLJ Lodging Trust, a Maryland real estate investment trust, together with its consolidated subsidiaries, including RLJ Lodging Trust, L.P., a Delaware limited partnership, which we refer to as the "Operating Partnership";
|
|
•
|
"our hotels" refers to the
122
hotels owned by us as of
December 31, 2016
;
|
|
•
|
a "compact full-service hotel" typically refers to any hotel with (1) less than 300 guestrooms and less than 12,000 square feet of meeting space or (2) more than 300 guestrooms where, unlike traditional full-service hotels, the operations focus primarily on the rental of guestrooms such that a significant majority of its total revenue is generated from room rentals rather than other sources, such as food and beverage;
|
|
•
|
a "focused-service hotel" typically refers to any hotel where the operations focus primarily on the rental of guestrooms and that offers services and amenities to a lesser extent than a traditional full-service or compact full-service hotel. For example, a focused-service hotel may have a restaurant, but, unlike a restaurant in a traditional full-service or compact full-service hotel, it may not offer three meals per day and may not offer room service. In addition, a focused-service hotel differs from a compact full-service hotel in that it typically has less than 2,000 square feet of meeting space, if any at all;
|
|
•
|
"TRS" refers to each of our taxable REIT subsidiaries that are wholly-owned, directly or indirectly, by the Operating Partnership and any disregarded subsidiaries of our TRSs;
|
|
•
|
"Average Daily Rate" ("ADR") represents the total hotel room revenues divided by the total number of rooms sold in a given period;
|
|
•
|
"Occupancy" represents the total number of hotel rooms sold in a given period divided by the total number of rooms available;
|
|
•
|
"Revenue Per Available Room" ("RevPAR") is the product of ADR and Occupancy; and
|
|
•
|
"RevPAR penetration index" of our hotels is the measure of each hotel's RevPAR in relation to the average RevPAR of that hotel's competitive set. Each hotel's competitive set consists of a small group of hotels in the relevant market that we and the third-party hotel management company that manages the hotel believe are comparable for purposes of benchmarking the performance of such hotel.
|
For a more in depth discussion of ADR, Occupancy, RevPAR, and the RevPAR penetration index, please refer to the "Key Indicators of Operating Performance" section.
2
Our Company
We are a self-advised and self-administered Maryland real estate investment trust ("REIT") that acquires primarily premium-branded, focused-service and compact full-service hotels. We are one of the largest U.S. publicly-traded lodging REITs in terms of both number of hotels and number of rooms. Our hotels are concentrated in markets that we believe exhibit multiple demand generators and high barriers to entry. We believe premium-branded, focused-service and compact full-service hotels with these characteristics generate high levels of RevPAR, strong operating margins and attractive returns.
As of
December 31, 2016
, we owned
122
hotels with approximately
20,100
rooms, located in
21
states and the District of Columbia, and an interest in one mortgage loan secured by a hotel. We own, through wholly-owned subsidiaries, 100% of the interests in all hotel properties, with the exception of one hotel property in which we own a
98.3%
controlling interest in a joint venture.
For U.S. federal income tax purposes, we elected to be taxed as a REIT commencing with our taxable year ended December 31, 2011. Substantially all of our assets are held by, and all of our operations are conducted through, the Operating Partnership. We are the sole general partner of the Operating Partnership. As of
December 31, 2016
, we owned, through a combination of direct and indirect interests,
99.6%
of the units of limited partnership in the Operating Partnership ("OP units").
The Lodging Industry
The lodging industry in the United States consists of public and private entities that operate in an extremely diversified market under a variety of brand names. The key participants in the lodging industry are as follows:
|
•
|
Owners
—
own the hotel and typically enter into a management agreement for an independent third party to manage the hotel. The hotel properties may be branded and operated under the manager’s brand or branded under a separate franchise agreement.
|
|
•
|
Franchisors
—
own a brand or brands and provide the franchised hotels with brand recognition, marketing support and worldwide reservation systems.
|
|
•
|
Managers
—
responsible for the day-to-day operation of the hotel, including the employment of the hotel staff, the determination of room rates, the development of sales and marketing plans, the preparation of operating and capital expenditure budgets and the preparation of financial reports for the owner.
|
Our Investment and Growth Strategies
Our objective is to generate strong returns for our shareholders by acquiring primarily premium-branded, focused-service and compact full-service hotels at prices where we believe we can generate attractive returns on investment and long-term value appreciation through proactive asset management. We also intend to selectively dispose of hotels when we believe the returns have been maximized in order to redeploy capital into more accretive acquisitions and other opportunities. We intend to pursue this objective through the following investment and growth strategies:
Investment Strategies
|
•
|
Targeted ownership of premium-branded, focused-service and compact full-service hotels.
We believe that premium-branded, focused-service and compact full-service hotels have the potential to generate attractive returns relative to other types of hotels due to their ability to achieve RevPAR levels at or close to those generated by traditional full-service hotels, while achieving higher profit margins due to their more efficient operating model and less volatile cash flows.
|
|
•
|
Use of premium hotel brands.
We believe in affiliating our hotels with premium brands owned by leading international franchisors such as Marriott, Hilton and Hyatt. We target hotels affiliated with premium brands such as Courtyard by Marriott, Residence Inn by Marriott, Hilton Garden Inn and Hyatt House. We believe that utilizing premium brands provides significant advantages because of their guest loyalty programs, worldwide reservation systems, effective product segmentation, global distribution and strong customer awareness.
|
|
•
|
Focus on high-growth markets.
We focus on owning and acquiring hotels in markets that we believe have multiple demand generators and high barriers to entry. As a result, we believe that these hotels generate higher returns on investment.
|
3
Growth Strategies
|
•
|
Maximize returns from our hotels.
We believe that our hotels have the potential to generate improvements in RevPAR and earnings before interest, taxes, depreciation and amortization ("EBITDA") as a result of our proactive asset management and the anticipated economic growth in the United States. We actively monitor and advise our third-party hotel management companies on most aspects of our hotels' operations, including property positioning, physical design, capital planning and investment, guest experience and overall strategic direction. We regularly review opportunities to further invest in our hotels in an effort to enhance the quality and attractiveness of our hotels, increase their long-term value and generate attractive returns on investment.
|
|
•
|
Pursue a disciplined hotel acquisition strategy.
We seek to acquire additional hotels at prices below replacement cost where we believe we can generate attractive returns on investment. We intend to target acquisition opportunities where we can enhance value by pursuing proactive investment strategies such as renovation, repositioning or rebranding.
|
|
•
|
Pursue a disciplined capital recycling program.
We intend to continue to pursue a disciplined capital allocation strategy designed to maximize the return on our investments by selectively selling hotels that are no longer consistent with our investment strategy or whose returns appear to have been maximized. To the extent that we sell hotels, we intend to redeploy the capital into higher yielding investments including acquisitions and investment opportunities that we believe will achieve higher returns.
|
Our Hotels
Overview
As of
December 31, 2016
, we owned a high-quality portfolio of
122
hotels with approximately
20,100
rooms, located in
21
states and the District of Columbia. No single hotel accounted for more than 5.9% of our total revenue for the year ended
December 31, 2016
. We believe that the quality of our hotel portfolio is evidenced by the RevPAR penetration index of
113.9
for the year ended
December 31, 2016
.
4
Brand Affiliations
Our hotels operate under strong, premium brands, with nearly
98%
of our hotels operating under existing relationships with Marriott, Hilton or Hyatt. The following table sets forth the brand affiliations of our hotels as of
December 31, 2016
:
|
Brand Affiliations
|
Number of hotels
|
Percentage of total hotels
|
Number of rooms
|
Percentage of total rooms
|
||||||||
|
Marriott
|
|
|
|
|
||||||||
|
Residence Inn
|
29
|
|
23.8
|
%
|
3,376
|
|
16.8
|
%
|
||||
|
Courtyard
|
24
|
|
19.7
|
%
|
4,038
|
|
20.0
|
%
|
||||
|
SpringHill Suites
|
8
|
|
6.5
|
%
|
1,040
|
|
5.2
|
%
|
||||
|
Fairfield Inn & Suites
|
7
|
|
5.7
|
%
|
819
|
|
4.1
|
%
|
||||
|
Marriott
|
5
|
|
4.1
|
%
|
1,544
|
|
7.7
|
%
|
||||
|
Renaissance
|
3
|
|
2.5
|
%
|
782
|
|
3.9
|
%
|
||||
|
Subtotal
|
76
|
|
62.3
|
%
|
11,599
|
|
57.7
|
%
|
||||
|
Hilton
|
|
|
|
|
||||||||
|
Hilton Garden Inn
|
8
|
|
6.6
|
%
|
1,545
|
|
7.7
|
%
|
||||
|
Hampton Inn/Hampton Inn & Suites
|
7
|
|
5.7
|
%
|
945
|
|
4.7
|
%
|
||||
|
Embassy Suites
|
6
|
|
4.9
|
%
|
1,492
|
|
7.4
|
%
|
||||
|
DoubleTree
|
3
|
|
2.5
|
%
|
1,132
|
|
5.6
|
%
|
||||
|
Homewood Suites
|
2
|
|
1.6
|
%
|
345
|
|
1.7
|
%
|
||||
|
Hilton
|
1
|
|
0.8
|
%
|
231
|
|
1.1
|
%
|
||||
|
Subtotal
|
27
|
|
22.1
|
%
|
5,690
|
|
28.2
|
%
|
||||
|
Hyatt
|
|
|
|
|
||||||||
|
Hyatt House
|
11
|
|
9.0
|
%
|
1,762
|
|
8.7
|
%
|
||||
|
Hyatt Place
|
3
|
|
2.5
|
%
|
466
|
|
2.3
|
%
|
||||
|
Hyatt/Hyatt Centric
|
2
|
|
1.6
|
%
|
264
|
|
1.3
|
%
|
||||
|
Subtotal
|
16
|
|
13.1
|
%
|
2,492
|
|
12.3
|
%
|
||||
|
Other Brand Affiliation
|
3
|
|
2.5
|
%
|
357
|
|
1.8
|
%
|
||||
|
Total
|
122
|
|
100.0
|
%
|
20,138
|
|
100.0
|
%
|
||||
Asset Management
We have a dedicated team of asset management professionals that proactively work with our third-party hotel management companies to maximize profitability at each of our hotels. Our asset management team monitors the performance of our hotels on a daily basis and holds frequent ownership meetings with corporate operations executives and key personnel at the hotels. Our asset management team works closely with our third-party hotel management companies on key aspects of each hotel's operation, including, among others, revenue management, market positioning, cost structure, capital and operational budgeting, as well as the identification of return on investment initiatives and overall business strategy. In addition, we retain approval rights on key staffing positions at many of our hotels, such as the hotel's general manager and director of sales. We believe that our strong asset management process helps to ensure that each hotel is being operated to our and our franchisors' standards, that our hotels are being adequately maintained in order to preserve the value of the asset and the safety of the hotel to customers, and that our hotel management companies are maximizing revenue and enhancing operating margins.
Competition
The U.S. lodging industry is highly competitive. Our hotels compete with other participants in the lodging industry for guests in each of their markets on the basis of several factors, including, among others, location, quality of accommodations, convenience, brand affiliation, room rates, service levels and amenities and level of customer service. Competition is often specific to the individual markets in which our hotels are located and includes competition from existing and new hotels in the focused-service and compact full-service hotel segments and non-traditional accommodations for travelers, such as online room sharing services. We believe that hotels, such as our hotels, that are affiliated with leading national brands, such as the Marriott, Hilton and Hyatt brands, will enjoy competitive advantages associated with operating under such brands.
5
We face competition for the acquisition of hotels from institutional pension funds, private equity funds, REITs, hotel companies and other parties who are engaged in the acquisition of hotels. Some of these competitors may have substantially greater financial and operational resources and access to capital than we have and may have greater knowledge of the markets in which we seek to invest. This competition may reduce the number of suitable investment opportunities offered to us and decrease the attractiveness of the terms on which we may acquire our targeted hotel investments, including the cost thereof.
Seasonality
The lodging industry is seasonal in nature, which can be expected to cause quarterly fluctuations in our revenues. For example, our hotels in the Chicago, Illinois metropolitan area experience lower revenues and profits during the winter months of December through March, while our hotels in Florida generally have higher revenues in the months of January through April. This seasonality can be expected to cause periodic fluctuations in a hotel's room revenues, occupancy levels, room rates, operating expenses and cash flows.
Our Financing Strategy
We expect to continue to maintain a prudent capital structure by limiting our net debt-to-EBITDA ratio to 5.0x or below. We define net debt as total indebtedness minus cash and cash equivalents. Over time, we intend to finance our long-term growth with equity issuances and debt financing with staggered maturities. We will seek to primarily utilize unsecured debt (with the ultimate goal of achieving an investment grade rating) and a greater percentage of fixed rate and hedged floating rate debt relative to unhedged floating rate debt. Our debt is currently comprised of both unsecured debt and mortgage debt secured by our hotels. We have a mix of fixed and floating rate debt; however, the majority of our debt either bears interest at fixed rates or effectively bears interest at fixed rates due to interest rate derivative hedges on the debt.
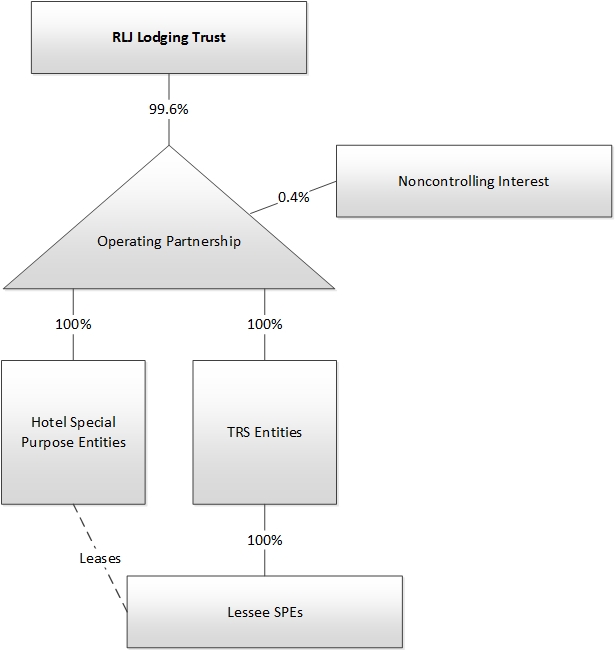
Organizational Structure
We were formed as a Maryland REIT in January 2011. We conduct our business through a traditional umbrella partnership real estate investment trust ("UPREIT") in which our hotel properties are indirectly owned by the Operating Partnership, through limited partnerships, limited liability companies or other subsidiaries. We are the sole general partner of the Operating Partnership and, as of
December 31, 2016
, we owned
99.6%
of the OP units in the Operating Partnership. In the future, we may issue OP units from time to time in connection with acquiring hotel properties, financing, compensation or other reasons.
In order for the income from our hotel operations to constitute "rents from real property" for purposes of the gross income tests required for REIT qualification, we cannot directly or indirectly operate any of our hotels. Accordingly, we lease each of our hotels, and intend to lease any hotels we acquire in the future, to subsidiaries of our TRSs ("TRS lessees"), which are wholly-owned by us, and our TRS lessees have engaged, or will engage, third-party hotel management companies to manage our hotels, and any hotels we acquire in the future, on market terms. Our TRS lessees pay rent to us that we intend to treat as "rents from real property," provided that the third-party hotel management companies engaged by our TRS lessees to manage our hotels are deemed to be "eligible independent contractors" and certain other requirements are met. Our TRSs are subject to U.S. federal, state and local income taxes applicable to corporations.
6
The following chart generally depicts our corporate structure as of
December 31, 2016
:
Regulation
General
Our hotels are subject to various U.S. federal, state and local laws, ordinances and regulations, including regulations relating to common areas and fire and safety requirements. We believe that each of our hotels has the necessary permits and approvals to operate its business.
Americans with Disabilities Act
Our hotels must comply with the applicable provisions of the Americans with Disabilities Act of 1990 and the Accessibility Guidelines promulgated thereunder (the "ADA"), to the extent that such hotels are "public accommodations" as defined by the ADA. The ADA may require the removal of structural barriers to access by persons with disabilities in certain public areas of our hotels where such removal is readily achievable. We believe that our hotels are in substantial compliance with the ADA and that we will not be required to make substantial capital expenditures to address the requirements of the ADA. However, non-compliance with the ADA could result in imposition of fines or an award of damages to private litigants. The obligation to make readily achievable accommodations is an ongoing one, and we will continue to assess our hotels and to make alterations as appropriate in this respect.
7
Environmental Matters
Under various laws relating to the protection of the environment, a current or previous owner or operator (including tenants) of real estate may be subject to liability related to contamination resulting from the presence or discharge of hazardous or toxic substances at that property and may be required to investigate and clean up such contamination at that property or emanating from that property. These costs could be substantial and liability under these laws may attach without regard to whether the owner or operator knew of, or was responsible for, the presence of the contaminants, and the liability may be joint and several. The presence of contamination or the failure to remediate contamination at our hotels may expose us to third-party liability for cleanup costs, property damage or bodily injury, natural resource damages and costs or expenses related to liens or property use restrictions and materially and adversely affect our ability to sell, lease or develop the real estate or to incur debt using the real estate as collateral. Furthermore, persons who sent waste to a waste disposal facility, such as a landfill or an incinerator, may be liable for costs associated with cleanup of that facility.
Our hotels are subject to various federal, state, and local environmental, health and safety laws and regulations that address a wide variety of issues, including, but not limited to, storage tanks, air emissions from emergency generators, storm water and wastewater discharges, lead-based paint, mold and mildew and waste management. Our hotels incur costs to comply with these laws and regulations and could be subject to fines and penalties for non-compliance. The costs of complying with environmental, health and safety laws could increase as new laws are enacted and existing laws are modified.
Some of our hotels contain asbestos-containing building materials. We believe that the asbestos is appropriately contained in accordance with current environmental regulations and that we have no need for any immediate remediation or current plans to remove the asbestos. Environmental laws require that owners or operators of buildings with asbestos-containing building materials properly manage and maintain these materials, adequately inform or train those who may come into contact with asbestos and undertake special precautions, including removal or other abatement, in the event that asbestos is disturbed during building renovation or demolition. These laws may impose fines and penalties on building owners or operators for failure to comply with these requirements. In addition, third parties may seek recovery from owners or operators for personal injury associated with exposure to asbestos-containing building materials.
Some of our hotels may contain or develop harmful mold or suffer from other adverse conditions, which could lead to liability for adverse health effects and costs of remediation. The presence of significant mold or other airborne contaminants at any of our hotels could require us to undertake a costly remediation program to contain or remove the mold or other airborne contaminants from the affected hotel or increase indoor ventilation. In addition, the presence of significant mold or other airborne contaminants could expose us to liability from guests or employees at our hotels and others if property damage or health concerns arise.
Insurance
We carry comprehensive general liability, fire, extended coverage, business interruption, rental loss coverage and umbrella liability coverage on all of our hotels, and earthquake, wind, flood and hurricane coverage on hotels in areas where we believe such coverage is warranted, in each case with limits of liability that we deem adequate. Similarly, we are insured against the risk of direct physical damage in amounts we believe to be adequate to reimburse us, on a replacement cost basis, for the costs incurred to repair or rebuild each hotel, including loss of income during the reconstruction period. We have selected policy specifications and insured limits which we believe to be appropriate given the relative risk of loss, the cost of the coverage and industry practice. We do not carry insurance for generally uninsured losses, including, but not limited to losses caused by riots, war or acts of God. In the opinion of our management, our hotels are adequately insured.
Employees
As of
December 31, 2016
, we had
58
employees.
Corporate Information
Our principal executive offices are located at 3 Bethesda Metro Center, Suite 1000, Bethesda, Maryland 20814. Our telephone number is (301) 280-7777. Our website is located at www.rljlodgingtrust.com. The information that is found on or accessible through our website is not incorporated into, and does not form a part of, this Annual Report on Form 10-K or any other report or document that we file with or furnish to the SEC. We have included our website address in this Annual Report on Form 10-K as an inactive textual reference and do not intend it to be an active link to our website.
We make available on our website, free of charge, our Annual Report on Form 10-K, Quarterly Reports on Form 10-Q, Current Reports on Form 8-K and amendments to those reports filed or furnished pursuant to Section 13(a) or 15(d) of the Exchange Act as soon as reasonably practicable after we electronically file such material with, or furnish it to, the SEC. We also make available on our website on the Corporate Governance page under the Investor Relations section various documents
8
related to our corporate governance including our: Board Committee Charters; Corporate Governance Guidelines; Code of Business Conduct and Ethics; Complaint Procedures for Financial and Auditing Matters; Declaration of Trust; and Bylaws.
This Annual Report on Form 10-K and other reports filed with the SEC can be read or copied at the SEC's Public Reference Room at 100 F Street NE, Washington, D.C. 20549. Information on the operation of the Public Reference Room can be obtained by calling the SEC at 1-800-SEC-0330. The SEC maintains a website that contains reports, proxy and information statements, and other information regarding issuers that file electronically with the SEC; the website address is www.sec.gov.
9
Set forth below are the risks that we believe are material to our shareholders. You should carefully consider the following risks in evaluating our Company and our business. The occurrence of any of the following risks could materially and adversely impact our financial condition, results of operations, cash flows, the market price of our common shares and our ability to, among other things, satisfy our debt service obligations and to make distributions to our shareholders, which in turn could cause our shareholders to lose all or a part of their investment. Some statements in this report including statements in the following risk factors constitute forward-looking statements. Please refer to the section entitled "Special Note About Forward-Looking Statements" at the beginning of our Annual Report on Form 10-K.
Risks Related to Our Business and Hotel Properties
We will continue to be significantly influenced by the economies and other conditions in the specific markets in which we operate, particularly in the metropolitan areas where we have high concentrations of hotels.
Our hotels located in the New York, New York, South Florida, Austin, Texas, Northern California, Chicago, Illinois, and Denver-Boulder, Colorado metropolitan areas accounted for approximately 12.2%, 8.4%, 8.0%, 7.9%, 7.7%, and 7.5%, respectively, of our total revenue for the fiscal year ended
December 31, 2016
. As a result, we are particularly susceptible to adverse market conditions in these areas, including industry downturns, relocation of businesses, any oversupply of hotel rooms, political unrest or a reduction in lodging demand. Adverse economic developments in the markets in which we have a concentration of hotels, or in any of the other markets in which we operate, or any increase in hotel supply or decrease in lodging demand resulting from the local, regional or national business or political climate, could materially and adversely affect us.
We are dependent on the performance of the third-party hotel management companies that manage the operations of each of our hotels and we could be materially and adversely affected if such third-party managers do not manage our hotels in our best interests.
Because federal income tax laws restrict REITs and their subsidiaries from operating or managing hotels, we do not operate or manage our hotels. Instead, we retain third-party hotel managers to operate our hotels pursuant to hotel management agreements. We have entered into individual hotel management agreements for
122
of our hotels,
71
of which are with White Lodging Services ("WLS").
Under the terms of the hotel management agreements, the hotel managers are responsible for all aspects of the operations of our hotels, including ensuring those operations are conducted in accordance with applicable laws and regulations and in our best interests, and our ability to participate in operating decisions regarding our hotels is limited to certain matters, including approval of the annual operating budget. While we closely monitor the performance and operations of our third-party hotel managers, we cannot assure you that the hotel managers will manage our hotels in a manner that is consistent with their respective obligations under the applicable hotel management agreement or our obligations under our hotel franchise agreements. We also cannot assure you that our hotel managers will not be negligent in their performance, will not engage in criminal or fraudulent activity, or will not otherwise default on their respective management obligations to us. We do not have the authority to require any hotel to be operated in a particular manner (for instance, with respect to setting room rates), even if we believe that our hotels are not being operated efficiently or in our best interests, and our general recourse under the hotel management agreements is limited to termination upon sixty days' notice if we believe our third-party managers are not performing adequately or if we believe our third-party managers are not operating our hotels in our best interests. From time to time, disputes may arise between us and our third-party managers regarding their performance or compliance with the terms of the hotel management agreements, which in turn could adversely affect our results of operations. We generally will attempt to resolve any such disputes through discussions and negotiations; however, if we are unable to reach satisfactory results through discussions and negotiations, we may choose to terminate our management agreement, litigate the dispute or submit the matter to third-party dispute resolution, the outcome of which may be unfavorable to us.
In the event that any of our management agreements are terminated, we can provide no assurances that we could find a replacement manager or that our franchisors will consent to a replacement manager in a timely manner, or at all, or that any replacement manager will be successful in operating our hotels. Furthermore, if WLS, as our largest provider of management services, is financially unable or unwilling to perform its obligations pursuant to our management agreements, our ability to find a replacement manager or managers for our WLS-managed hotels could be challenging and time consuming, depending on the number of WLS-managed hotels affected, and could cause us to incur significant costs to obtain new management agreements for the affected hotels, which in turn could materially and adversely affect us.
10
We are subject to the risks associated with the employment of hotel personnel, particularly with hotels that employ unionized labor.
Our third-party hotel management companies are responsible for hiring and maintaining the labor force at each of our hotels. Although we do not directly employ or manage the employees at our hotels, we still are subject to many of the costs and risks generally associated with the hotel labor force, particularly those hotels with unionized labor. From time to time, the hotel operations may be disrupted as a result of strikes, lockouts, public demonstrations or other negative actions and publicity. We also may incur increased legal costs and indirect labor costs as a result of contract disputes or other events. The resolution of labor disputes or re-negotiated labor contracts could lead to higher labor costs, either by increases in wages or benefits or by changes in work rules that raise hotel operating costs. We do not have the ability to affect the outcome of these negotiations.
Restrictive covenants in certain of our hotel management and franchise agreements contain provisions limiting or restricting the sale or financing of our hotels, which could have a material and adverse effect on us.
Hotel management and franchise agreements typically contain restrictive covenants that limit or restrict our ability to sell or refinance a hotel without the consent of the hotel management company or franchisor. Many of our franchise agreements provide the franchisor with a right of first offer in the event of certain sales or transfers of a hotel and provide that the franchisor has the right to approve any change in the hotel management company engaged to manage the hotel. Generally, we may not agree to sell, lease or otherwise transfer particular hotels unless the transferee is not a competitor of the hotel management company or franchisor and the transferee assumes the related hotel management and franchise agreements. If the hotel management company or franchisor does not consent to the sale or financing of our hotels, we may be prohibited from taking actions that would otherwise be in our and our shareholders' best interests.
Substantially all of our hotels operate under either Marriott, Hilton or Hyatt brands; therefore, we are subject to the risks associated with concentrating our portfolio in just three brand families.
119
of the
122
hotels that we owned as of
December 31, 2016
utilize brands owned by Marriott, Hilton or Hyatt. As a result, our success is dependent in part on the continued success of Marriott, Hilton and Hyatt and their respective brands. We believe that building brand value is critical to increasing demand and building customer loyalty. Consequently, if market recognition or the positive perception of Marriott and/or Hilton and/or Hyatt is reduced or compromised, the goodwill associated with the Marriott-, Hilton- or Hyatt-branded hotels in our portfolio may be adversely affected. Furthermore, if our relationship with Marriott, Hilton or Hyatt were to deteriorate or terminate as a result of disputes regarding the management of our hotels or for other reasons, Marriott and/or Hilton and/or Hyatt could, under certain circumstances, terminate our current franchise licenses with them or decline to provide franchise licenses for hotels that we may acquire in the future. If any of the foregoing were to occur, it could have a material adverse effect on us.
Our long-term growth depends in part on successfully identifying and consummating acquisitions of additional hotels and the failure to make such acquisitions could materially and adversely impede our growth.
We can provide no assurances that we will be successful in identifying attractive hotels or that, once identified, we will be successful in consummating an acquisition. We face significant competition for attractive investment opportunities from other well-capitalized investors, some of which have greater financial resources and a greater access to debt and equity capital to acquire hotels than we do. This competition increases as investments in real estate become increasingly attractive relative to other forms of investment. As a result of such competition, we may be unable to acquire certain hotels that we deem attractive or the purchase price may be significantly elevated or other terms may be substantially more onerous. In addition, we expect to finance future acquisitions through a combination of borrowings under our unsecured revolving credit facility, the use of retained cash flows, and offerings of equity and debt securities, which may not be available on advantageous terms, or at all. Any delay or failure on our part to identify, negotiate, finance on favorable terms, consummate and integrate such acquisitions could materially and adversely impede our growth.
We are dependent upon our ability to attract and retain key personnel.
We depend on the experience and relationships of our senior management team and other highly qualified personnel to manage our day-to-day operations and execute our business strategy and growth. These individuals are important to our business and to the extent that any of them departs and is not replaced with a qualified substitute, such person's departure could harm our business operations. We can provide no assurances that any of our senior management team members and other personnel will continue their employment with us, or that we will continue to be successful in attracting and retaining qualified personnel. The loss of key personnel could materially and adversely affect our ability to source potential investment opportunities, our relationships with global and national hotel brands and other industry participants, the execution of our business strategy, and it could reduce the market value of our common shares.
11
Our business strategy depends on achieving revenue and net income growth from anticipated increases in demand for hotel rooms. Accordingly, any delay in demand growth due to weaker than anticipated economic growth could materially and adversely affect us and our growth prospects.
The operating performance of our hotels in various U.S. markets declined during the most recent economic recession. Our business strategy depends on achieving revenue and net income growth from anticipated improvement in demand for hotel rooms as part of the growth of the U.S. economy as well as the global economy. Accordingly, any delay or weaker than anticipated economic growth could materially and adversely affect us and our growth prospects. Furthermore, even if the U.S. economy, and the global economy, continues to grow, we cannot provide any assurances that demand for hotel rooms will increase from current levels. If demand does not increase in the near future, or if demand weakens, our future results of operations and our growth prospects could be materially and adversely affected.
Any difficulties in obtaining the capital necessary to make required periodic capital expenditures and to renovate our hotels could materially and adversely affect our financial condition and results of operations.
Our hotels have an ongoing need for renovations and other capital improvements, including replacements of furniture, fixtures and equipment ("FF&E"). The franchisors of our hotels also require periodic capital improvements as a condition of maintaining the franchise licenses. Our lenders will also likely require that we set aside annual amounts for capital improvements to our hotels. The costs of these capital improvements could materially and adversely affect us. In addition, acquisitions or redevelopment of additional hotels will require significant capital expenditures.
We may not be able to fund the capital improvements to our hotels or acquisitions solely from the cash provided from our operating activities because we must distribute annually at least 90% of our REIT taxable income to shareholders in order to maintain our qualification as a REIT. As a result, our ability to fund capital expenditures, acquisitions or hotel redevelopment through retained earnings is very limited. Consequently, we expect to rely upon the availability of debt or equity capital to fund capital improvements and acquisitions. If we are unable to obtain the capital necessary to make required periodic capital expenditures and renovate our hotels on favorable terms, or at all, our financial condition, liquidity and results of operations could be materially and adversely affected.
Adverse global market and economic conditions and dislocations in the markets could cause us to recognize impairment charges, which could materially and adversely affect our business, financial condition and results of operations.
We continually monitor events and changes in circumstances that could indicate that the carrying value of the real estate and related intangible assets in which we have an ownership interest may not be recoverable. When circumstances indicate that the carrying value of the real estate and related intangible assets may not be recoverable, we assess the recoverability of these assets by determining whether the carrying value will be recovered through the undiscounted future operating cash flows expected from the use of the asset and its eventual disposition. If the expected undiscounted future cash flows do not exceed the carrying value, we adjust the real estate and related intangible assets to fair value and we recognize an impairment loss, which could materially and adversely affect our business, financial condition and results of operations.
Competition from other lodging industry participants in the markets in which we operate could adversely affect occupancy levels and/or ADRs, which could have a material and adverse effect on us.
We face significant competition from owners and operators of other hotels and other lodging industry participants. In addition, we face competition from non-traditional accommodations for travelers, such as online room sharing services. These competitors may have an operating model that enables them to offer accomodations at lower rates than we can, which could result in those competitors increasing their occupancy at our expense and adversely affecting our ADRs. Given the importance of occupancy and ADR at focused-service and compact full-service hotels, this competition could adversely affect our ability to attract prospective guests, which could materially and adversely affect our business, financial condition and results of operations.
At
December 31, 2016
, we had approximately
$1.6 billion
of debt outstanding, which may materially and adversely affect our operating performance and put us at a competitive disadvantage.
Required repayments of debt and related interest may materially and adversely affect our operating performance. At
December 31, 2016
, we had approximately
$1.6 billion
of outstanding debt, of which approximately
$1.6 billion
bears interest at variable rates. After taking into consideration the effect of interest rate swaps,
$142.0 million
of our borrowings are subject to variable rates. Increases in interest rates on our existing or future variable rate debt would increase our interest expense, which could adversely affect our cash flows and our ability to pay distributions to shareholders.
12
Our organizational documents contain no limitations on the amount of debt that we may incur, and our board of trustees may change our financing policy at any time without shareholder notice or approval. As a result, we may be able to incur substantial additional debt, including secured debt, in the future.
Because we anticipate that our operating cash will be adequate to repay only a portion of our debt at maturity, we expect that we will be required to repay debt through debt refinancings and/or offerings of our securities. The amount of our outstanding debt may adversely affect our ability to refinance our debt.
If we are unable to refinance our debt on acceptable terms, or at all, we may be forced to dispose of one or more of our hotels on disadvantageous terms, which may result in losses to us and may adversely affect the cash available for distributions to our shareholders. In addition, if then-prevailing interest rates or other factors at the time of refinancing result in higher interest rates upon refinancing, our interest expense would increase, which would adversely affect our future operating results and liquidity.
Our outstanding debt, and any additional debt borrowed in the future, may subject us to many risks, including the risks that:
|
•
|
our cash flows from operations may be insufficient to make required payments of principal and interest;
|
|
•
|
we may be required to use a substantial portion of our cash flows to pay principal and interest, which would reduce the cash available for distributions to our shareholders;
|
|
•
|
we may be at a competitive disadvantage compared to our competitors that have less debt;
|
|
•
|
we may be vulnerable to economic volatility, particularly if growth were to slow or stall and reduce our flexibility to respond to difficult economic conditions;
|
|
•
|
the terms of any refinancing may not be in the same amount or on terms as favorable as the terms of the debt being refinanced; and
|
|
•
|
the use of leverage could adversely affect our ability to borrow more money for operations, capital improvements, to finance future acquisitions, to make distributions to our shareholders and it could adversely affect the market price of our common shares.
|
Disruptions in the financial markets could adversely affect our ability to obtain sufficient third-party financing for our capital needs on favorable terms or at all, which could materially and adversely affect us.
In recent years, the U.S. financial markets experienced significant price volatility, dislocations and liquidity disruptions, which caused stock market prices to fluctuate substantially and the spreads on prospective debt financings to widen considerably. Renewed volatility and uncertainty in the financial markets may negatively impact our ability to access additional financing for our capital needs, including growth, acquisition activities and other business initiatives, on favorable terms or at all, which may negatively affect our business. Additionally, due to this potential uncertainty, in the future we may be unable to refinance or extend our debt, or the terms of any refinancing may not be as favorable as the terms of our existing debt. If we are not successful in refinancing our debt when it becomes due, we may be forced to dispose of hotels on disadvantageous terms, which may adversely affect our ability to service other debt and to meet our other liquidity and business obligations. A prolonged downturn in the financial markets may cause us to seek alternative capital sources of potentially less attractive financing and may require us to further adjust our business plan accordingly. These events also may make it more difficult or costly for us to raise capital through the issuance of new equity or the incurrence of additional secured or unsecured debt, which could materially and adversely affect us.
Hedging against interest rate exposure may adversely affect us.
We may manage our exposure to interest rate volatility by using interest rate hedging arrangements, such as cap agreements and swap agreements. These agreements involve the risks that these arrangements may fail to protect or adversely affect us because, among other things:
|
•
|
interest rate hedging can be expensive, particularly during periods of rising and volatile interest rates;
|
|
•
|
available interest rate hedges may not correspond directly with the interest rate risk for which protection is sought;
|
|
•
|
the duration of the interest rate hedge may not match the duration of the related liability;
|
|
•
|
the credit quality of the hedging counterparty owing money on the hedge may be downgraded to such an extent that it impairs our ability to sell or assign our side of the hedging transaction; and
|
13
|
•
|
the hedging counterparty owing money in the hedging transaction may default on its obligation to pay.
|
As a result of any of the foregoing, our hedging transactions could have a material and adverse effect on us.
Our failure to comply with all covenants in our existing or future debt agreements could materially and adversely affect us.
Our existing indebtedness, whether secured by our hotels or unsecured, contains, and indebtedness that we may enter into in the future likely will contain, customary covenants such as those that limit our ability to enter into future indebtedness, whether secured by our hotels or unsecured, or to discontinue insurance coverage, as well as financial covenants. In addition, our continued ability to borrow under our unsecured revolving credit facility is subject to compliance with our financial and other covenants, including covenants relating to debt service coverage ratios and leverage ratios, and our ability to meet these covenants may be adversely affected if U.S. lodging fundamentals deteriorate dramatically. Our failure to comply with covenants in our existing or future indebtedness, as well as our inability to make required principal and interest payments, could cause a default under the applicable debt agreement, which could result in the acceleration of the debt and require us to repay such debt with capital obtained from other sources, which may not be available to us or may be available only on unattractive terms. Furthermore, if we default on secured debt, lenders can take possession of the hotel(s) securing such debt. In addition, debt agreements may contain specific cross-default provisions with respect to specified other indebtedness, giving the lenders the right to declare a default on its debt and to enforce remedies, including accelerating the maturity of such debt upon the occurrence of a default under such other indebtedness. If we default on several of our debt agreements or any significant debt agreement, we could be materially and adversely affected.
Costs associated with, or failure to maintain, franchisor operating standards may materially and adversely affect us.
Under the terms of our franchise license agreements, we are required to meet specified operating standards and other terms and conditions. We expect that our franchisors will periodically inspect our hotels to ensure that we and the hotel management companies follow brand standards. Failure by us, or any hotel management company that we engage, to maintain these standards or other terms and conditions could result in a franchise license being canceled or the franchisor requiring us to undertake a costly property improvement program. If a franchise license is terminated due to our failure to make required improvements or to otherwise comply with its terms, we also may be liable to the franchisor for a termination payment, which will vary by franchisor and by hotel. If the funds required to maintain franchisor operating standards are significant, we could be materially and adversely affected.
In addition, if we were to lose a franchise license, we would be required to re-brand the affected hotel(s). As a result, the underlying value of a particular hotel could decline significantly from the loss of the associated name recognition, marketing support, participation in guest loyalty programs and the centralized reservation system provided by the franchisor, which could require us to recognize an impairment charge on the hotel. Furthermore, the loss of a franchise license at a particular hotel could harm our relationship with the franchisor, which could impede our ability to operate other hotels under the same brand, limit our ability to obtain new franchise licenses from the franchisor in the future on favorable terms, or at all, and cause us to incur significant costs to obtain a new franchise license for the particular hotel.
Applicable REIT laws may restrict certain business activities.
As a REIT, we are subject to various restrictions on our income, assets and business activities. Due to these restrictions, we anticipate that we will continue to conduct certain business activities in one or more of our TRSs. Our TRSs are taxable as C corporations and are subject to federal, state, local and, if applicable, foreign taxation on their taxable income. In addition, neither we, nor our TRSs can directly manage or operate hotels, making us dependent on third-party operators/managers.
Federal income tax provisions applicable to REITs may restrict our business decisions regarding the potential sale of a hotel.
The Internal Revenue Code of 1986, as amended (the "Code"), imposes restrictions on a REIT's ability to dispose of properties that are not applicable to other types of real estate companies. In particular, the tax laws applicable to REITs require that we hold our hotels for investment, rather than primarily for sale in the ordinary course of business, which may cause us to forego or defer sales of hotels that otherwise would be in our best interests. Therefore, we may not be able to vary our portfolio promptly in response to economic or other conditions or on favorable terms, which may materially and adversely affect our cash flows, our ability to make distributions to shareholders and the market price of our common shares.
The federal income tax provisions applicable to REITs provide that any gain realized by a REIT on the sale of property held as inventory or other property held primarily for sale to customers in the ordinary course of business is treated as income from a "prohibited transaction" that is subject to a 100% excise tax. Under existing law, whether property, including hotels, is held as inventory or primarily for sale to customers in the ordinary course of business is a question of fact that depends upon all of the facts and circumstances with respect to the particular transaction. We intend to hold our hotels for investment with a view
14
of long-term appreciation, to engage in the business of acquiring and owning hotels, and to make occasional sales of hotels consistent with our investment objectives. There can be no assurance, however, that the Internal Revenue Service (the "IRS") might not contend that one or more of these sales are subject to the 100% excise tax. Moreover, the potential to incur this penalty tax could deter us from selling one or more hotels even though it would be in the best interests of us and our shareholders for us to do so. There is a statutory safe harbor available for a limited number of sales in a single taxable year of properties that have been owned by a REIT for at least two years, but that safe harbor likely would not apply to all sale transactions that we might otherwise consider. As a result, we may not be able to diversify our portfolio in a timely manner in response to economic or other conditions or on favorable terms, which may adversely affect us.
For tax purposes, a foreclosure of any of our hotels would be treated as a sale of the hotel. If the outstanding balance of the debt secured by the mortgage exceeds our tax basis in the hotel, we would recognize taxable income on the foreclosure, but we would not receive any cash proceeds, which could hinder our ability to meet the REIT distribution requirements imposed by the Code. If any of our hotels are foreclosed on due to a default, our ability to pay cash distributions to our shareholders will be limited.
Joint venture investments that we make could be adversely affected by our lack of sole decision-making authority, our reliance on joint venture partners' financial condition and liquidity and disputes between us and our joint venture partners.
We own the DoubleTree Metropolitan Hotel New York City through a joint venture with an affiliate of the hotel's property manager. In addition, we may enter into joint ventures in the future to acquire, develop, improve or partially dispose of hotels, thereby reducing the amount of capital required by us to make investments and diversifying our capital sources for growth. Such joint venture investments involve risks not otherwise present in a wholly-owned hotel or a redevelopment project, including the following:
|
•
|
we may not have exclusive control over the development, financing, leasing, management and other aspects of the hotel or joint venture, which may prevent us from taking actions that are in our best interest but opposed by our partners;
|
|
•
|
joint venture agreements often restrict the transfer of a partner's interest or may otherwise restrict our ability to sell the interest when we desire, or on advantageous terms;
|
|
•
|
joint venture agreements may contain buy-sell provisions pursuant to which one partner may initiate procedures requiring the other partner to choose between buying the other partner's interest or selling its interest to that partner;
|
|
•
|
a partner may, at any time, have economic or business interests or goals that are, or that may become, inconsistent with our business interests or goals;
|
|
•
|
a partner may fail to fund its share of required capital contributions or may become bankrupt, which would mean that we and any other remaining partners generally would remain liable for the joint venture's liabilities; or
|
|
•
|
we may, in certain circumstances, be liable for the actions of a partner, and the activities of a partner could adversely affect our ability to qualify as a REIT, even though we do not control the joint venture.
|
Any of the above might subject a hotel to liabilities in excess of those contemplated and adversely affect the value of our current and future joint venture investments.
Risks Related to the Lodging Industry
Our ability to make distributions to our shareholders may be adversely affected by various operating risks common to the lodging industry, including competition, over-building and dependence on business travel and tourism.
Our hotels have different economic characteristics than many other real estate assets. Unlike other real estate assets, hotels generate revenue from guests that typically stay at the hotel for only a few nights, which causes the room rate and occupancy levels at each of our hotels to change every day, and results in earnings that can be highly volatile.
In addition, our hotels are subject to various operating risks common to the lodging industry, many of which are beyond our control, including, among others, the following:
|
•
|
competition from other lodging industry participants in the markets in which we operate;
|
|
•
|
over-building of hotels in the markets in which we operate, which results in an increased supply of hotels that will adversely affect occupancy and revenues at our hotels;
|
15
|
•
|
consolidation among companies in the lodging industry may increase the resulting companies' negotiating power relative to ours, and decrease competition among those companies for management and franchise agreements, which could result in higher management or franchise fees;
|
|
•
|
dependence on business and leisure travelers;
|
|
•
|
labor strikes, disruptions or lockouts that may impact operating and financial performance;
|
|
•
|
increases in energy costs and other expenses affecting travel, which may affect travel patterns and reduce the number of business and leisure travelers;
|
|
•
|
requirements for periodic capital reinvestment to repair and upgrade hotels;
|
|
•
|
increases in operating costs due to inflation and other factors that may not be offset by increased room rates;
|
|
•
|
changes in interest rates;
|
|
•
|
changes in the availability, cost and terms of financing;
|
|
•
|
changes in governmental laws and regulations, fiscal policies and zoning ordinances and the related costs of compliance with laws and regulations, fiscal policies and ordinances;
|
|
•
|
adverse effects of international, national, regional and local economic and market conditions;
|
|
•
|
unforeseen events beyond our control, such as terrorist attacks, travel-related health concerns, such as pandemics and epidemics, imposition of taxes or surcharges by regulatory authorities, travel-related accidents and unusual weather conditions, including natural disasters such as hurricanes, tsunamis or earthquakes;
|
|
•
|
adverse effects of worsening conditions in the lodging industry; and
|
|
•
|
risks generally associated with the ownership of hotels and real estate, as we discuss in detail below.
|
The occurrence of any of the foregoing could materially and adversely affect us.
The seasonality of the lodging industry could have a material and adverse effect on us.
The lodging industry is seasonal in nature, which causes quarterly fluctuations in our revenues. Our quarterly earnings may be adversely affected by factors outside our control, including weather conditions and poor economic factors in certain markets in which we operate. The seasonality causes periodic fluctuations in room revenues, occupancy levels, room rates and operating expenses in particular hotels. We can provide no assurances that our cash flows will be sufficient to offset any shortfalls that occur as a result of these fluctuations. As a result, we may have to enter into short-term borrowings in certain quarters in order to make distributions to our shareholders, and we can provide no assurances that such borrowings will be available on favorable terms, if at all. Consequently, volatility in our financial performance resulting from the seasonality of the lodging industry could have a material and adverse effect on us.
The cyclical nature of the lodging industry may cause fluctuations in our operating performance, which could have a material and adverse effect on us.
The lodging industry historically has been highly cyclical in nature. Fluctuations in lodging demand and, therefore, operating performance, are caused largely by general economic and local market conditions, which subsequently affect levels of business and leisure travel. In addition to general economic conditions, new hotel room supply is an important factor that can affect the lodging industry's performance, and overbuilding has the potential to further exacerbate the negative impact of an economic recession. Room rates and occupancy, and thus RevPAR, tend to increase when demand growth exceeds supply growth. We can provide no assurances regarding whether, or the extent to which, lodging demand will rebound or whether any such rebound will be sustained. An adverse change in lodging fundamentals could result in returns that are substantially below our expectations or result in losses, which could have a material and adverse effect on us.
Our acquisition, redevelopment, repositioning, renovation and re-branding activities are subject to various risks, any of which could, among other things, result in disruptions to our hotel operations, strain management resources and materially and adversely affect our business.
We intend to continue to acquire, redevelop, reposition, renovate and re-brand hotels, subject to the availability of attractive hotels or projects and our ability to undertake such activities on satisfactory terms. In deciding whether to undertake such activities, we will make certain assumptions regarding the expected future performance of the hotel or project. However, newly acquired, redeveloped, repositioned, renovated or re-branded hotels may fail to perform as expected and the costs
16
necessary to bring such hotels up to franchise standards may exceed our expectations, which may result in the hotels' failure to achieve the projected returns.
In particular, to the extent that we engage in the activities described above, they could pose the following risks to our ongoing operations:
|
•
|
we may abandon such activities and we may be unable to recover the expenses already incurred in connection with exploring such opportunities;
|
|
•
|
acquired, redeveloped, repositioned, renovated or re-branded hotels may not initially be accretive to our results of operations, and we and the hotel management companies may not successfully manage newly acquired, redeveloped, repositioned, renovated, or re-branded hotels to meet our expectations;
|
|
•
|
we may be unable to quickly, effectively and efficiently integrate new acquisitions, particularly an acquisition of a portfolio of hotels, into our existing operations;
|
|
•
|
our redevelopment, repositioning, renovation or re-branding activities may not be completed on schedule, which could result in increased debt service and other costs and lower revenues; and
|
|
•
|
management attention may be diverted by our acquisition, redevelopment, repositioning, renovation or rebranding activities, which in some cases may turn out to be less compatible with our growth strategy than originally anticipated.
|
The occurrence of any of the foregoing events, among others, could materially and adversely affect our business.
Our ownership of hotels with ground leases exposes us to the risks that we may be forced to sell such hotels for a lower price, we may be unable to renew a ground lease or we may lose such hotels upon breach of a ground lease.
As of
December 31, 2016
,
eight
of our hotels were on land subject to ground leases. Accordingly, we only own a long-term leasehold or similar interest in those
eight
hotels. Our ground lease agreements require the consent of the lessor or sub-lessor prior to transferring our interest in the ground lease. These provisions may impact our ability to sell our hotels which, in turn, could adversely impact the price realized from any such sale. In addition, at any given time, investors may be disinterested in buying properties subject to a ground lease and may pay a lower price for such properties than for a comparable property with a fee simple interest or they may not purchase such properties at any price. If we are found to be in breach of a ground lease, we could lose the right to use the hotel. In addition, unless we can purchase a fee simple interest in the underlying land and improvements or extend the terms of these leases before their expiration, as to which no assurance can be given, we will lose our right to operate these properties and our interest in the improvements upon expiration of the leases. If we were to lose the right to use a hotel due to a breach or non-renewal of the ground lease, we would be unable to derive income from such hotel and would be required to purchase an interest in another hotel in an attempt to replace that income, which could materially and adversely affect us.
The increasing use of Internet travel intermediaries by consumers may materially and adversely affect our profitability.
Although a majority of rooms sold on the Internet are sold through websites maintained by the hotel franchisors and managers, including Marriott, Hilton and Hyatt, some of our hotel rooms are booked through Internet travel intermediaries. Typically, these Internet travel intermediaries have access to the room inventory from participating hotels. These intermediaries charge higher commissions, which reduces the hotel's profitability. Moreover, some of these Internet travel intermediaries are attempting to offer hotel rooms as a commodity, by increasing the importance of price and general indicators of quality, such as "three-star downtown hotel," at the expense of brand identification or quality of product or service normally associated with these brands. If consumers develop brand loyalties to Internet reservations systems rather than to the brands under which our hotels are franchised, the value of our hotels could deteriorate and our business could be materially and adversely affected. Although most of the business for our hotels is expected to be derived from traditional channels, if the amount of sales made through Internet travel intermediaries increases significantly, commissions paid to these intermediaries may increase and our profitability may be materially and adversely affected.
Technology is used in our operations, and any material failure, inadequacy, interruption or security failure of that technology could harm the business.
We, and our hotel managers and franchisors, rely on information technology networks and systems to process, transmit and store electronic information, and to manage or support a variety of business processes, including financial transactions and records, personal identifiable information, reservations, billing and operating data. Although we believe we and our hotel managers and franchisors have taken commercially reasonable steps to protect the security of our systems, there can be no assurance that such security measures will prevent failures, inadequacies or interruptions in system services, or that system security will not be breached. Any failure to maintain proper function, security and availability of information systems could
17
interrupt our operations, damage our reputation, subject us to liability claims or regulatory penalties and it could have a material and adverse effect on our business, financial condition and results of operations.
Future terrorist attacks or changes in terror alert levels could materially and adversely affect us.
Historically, terrorist attacks and subsequent terrorist alerts have adversely affected the U.S. travel and hospitality industries, often disproportionately to the effect on the overall economy. The extent of the impact that actual or threatened terrorist attacks in the U.S. or elsewhere could have on domestic and international travel and our business in particular cannot be determined, but any such attacks or the threat of such attacks could have a material and adverse effect on travel and hotel demand and our ability to insure our hotels, which could materially and adversely affect us.
The outbreak of influenza or other widespread contagious disease could reduce travel and adversely affect hotel demand, which would have a material and adverse effect on us.
A widespread outbreak of an infectious or contagious disease in the U.S. could reduce travel and hotel demand within the lodging industry. If demand at our hotels decreases significantly or for a prolonged period of time as a result of an outbreak of an infectious or contagious disease, our revenue would be adversely affected, which could have a material and adverse effect on us.
Risks Related to Our Organization and Structure
The share ownership limits imposed by the Code for REITs and our declaration of trust may restrict share transfers and/or business combination opportunities, particularly if our management and board of trustees do not favor a combination proposal.
In order for us to maintain our qualification as a REIT under the Code, not more than 50% in value of our outstanding shares may be owned, directly or indirectly, by five or fewer individuals (as defined in the Code to include certain entities) at any time during the last half of each taxable year following our first year of taxation as a REIT. Our declaration of trust, with certain exceptions, authorizes our board of trustees to take the necessary actions to preserve our qualification as a REIT. Unless exempted by our board of trustees, no person or entity (other than a person or entity who has been granted an exception) may directly or indirectly, beneficially or constructively, own more than 9.8% of the aggregate of our outstanding common shares, by value or by number of shares, whichever is more restrictive, or 9.8% of the aggregate of the outstanding preferred shares of any class or series, by value or by number of shares, whichever is more restrictive.
Our board may, in its sole discretion, grant an exemption to the share ownership limits, subject to certain conditions and the receipt by our board of certain representations and undertakings. Our board of trustees has previously granted exemptions from our ownership limits to certain shareholders. During the time that such waiver is effective, the excepted holders will be subject to an increased ownership limit. As a condition to granting such excepted holder limit, the excepted holders were required to make representations and warranties to us, which are intended to ensure that we will continue to meet the REIT ownership requirements. The excepted holders must inform us if any of these representations becomes untrue or is violated, in which case such excepted holder will lose its exemption from the ownership limit.
Our authorized but unissued common shares and preferred shares may prevent a change in our control that might involve a premium price for our common shares or otherwise be in the best interests of our shareholders.
Our declaration of trust authorizes us to issue additional authorized but unissued common or preferred shares. In addition, our board of trustees may, without shareholder approval, amend our declaration of trust to increase the aggregate number of our common shares or the number of shares of any class or series of preferred shares that we have the authority to issue, classify or reclassify any unissued common shares or preferred shares, and to set the preferences, rights and other terms of the classified or reclassified shares. As a result, our board of trustees may establish a series of common shares or preferred shares that could delay or prevent a transaction or a change in our control that might involve a premium price for our common shares or otherwise be in the best interests of our shareholders.
Certain provisions of Maryland law could inhibit a change in control.
Certain provisions of the Maryland General Corporation Law ("MGCL") that are applicable to Maryland real estate investment trusts may have the effect of deterring a third party from making a proposal to acquire us or of impeding a change in our control under circumstances that otherwise could provide the holders of our common shares with the opportunity to realize a premium over the then-prevailing market price of our common shares, including:
|
•
|
"business combination" provisions that, subject to limitations, prohibit certain business combinations between us and an "interested shareholder" (defined generally as any person who beneficially owns, directly or indirectly, 10% or more of the voting power of our voting shares or an affiliate or associate of ours who was the beneficial owner,
|
18
directly or indirectly, of 10% or more of the voting power of our then outstanding voting shares at any time within the two-year period immediately prior to the date in question) for five years after the most recent date on which the shareholder becomes an interested shareholder, and thereafter impose fair price and/or supermajority and shareholder voting requirements on these combinations; and
|
•
|
"control share" provisions that provide that "control shares" of our company (defined as voting shares that, when aggregated with other shares controlled by the shareholder, entitle the shareholder to exercise one of three increasing ranges of voting power in electing trustees) acquired in a "control share acquisition" (defined as the direct or indirect acquisition of ownership or control of issued and outstanding "control shares") have no voting rights except to the extent approved by our shareholders by the affirmative vote of at least two-thirds of all the votes entitled to be cast on the matter, excluding all interested shares.
|
As permitted by Maryland law, we have elected, by resolution of our board of trustees, to opt out of the business combination provisions of the MGCL and that resolution may not be repealed absent the approval by our shareholders, however, there can be no assurance that the resolution adopted by the board will not be amended or eliminated at some time in the future. Pursuant to a provision in our bylaws, we have elected to exempt any acquisition of our shares from the control share provisions of the MGCL and our bylaws prohibit the repeal, amendment or alteration of this provision without the approval by our shareholders; however, there can be no assurance that this provision will not be amended or eliminated at some time in the future.
Certain advance notice provisions of our bylaws may inhibit a change in control.
Our bylaws provide that (a) with respect to an annual meeting of shareholders, nominations of individuals for election to our board of trustees and the proposal of other business to be considered by shareholders may be made only (i) pursuant to our notice of the meeting, (ii) by the board of trustees or (iii) by a shareholder who was a shareholder of record at the time of the notice of the meeting and at the time of the annual meeting, who is entitled to vote at the meeting and has complied with the advance notice procedures set forth in the bylaws, and (b) with respect to special meetings of shareholders, only the business specified in our notice of meeting may be brought before the meeting of shareholders and nominations of individuals for election to the board of trustees may be made only (A) pursuant to our notice of the meeting, (B) by the board of trustees, or (C) provided that the board of trustees has determined that directors shall be elected at such meeting, by a shareholder who was a shareholder of record at the time of the notice of the meeting and at the time of the special meeting, who is entitled to vote at the meeting and has complied with the advance notice provisions set forth in the bylaws. These advance notice provisions may have the effect of delaying, deferring or preventing a transaction or a change in control of our company that might involve a premium to the market price of our common stock or otherwise be in our shareholders' best interests.
Termination of the employment agreements with our executive officers could be costly and prevent a change in control.
The employment agreements that we entered into with each of our executive officers provide that, if their employment with us terminates under certain circumstances (including upon a change in our control), we are required to pay them severance compensation, including accelerating the vesting of their respective equity awards, thereby making it costly to terminate their employment. Furthermore, these provisions could delay or prevent a transaction or a change in control that might involve a premium paid for our common shares or otherwise be in the best interests of our shareholders.
Our declaration of trust contains provisions that make the removal of our trustees difficult, which could make it difficult for our shareholders to effect changes to our management.
Our declaration of trust provides that, subject to the rights of the holders of one or more classes or series of preferred shares to elect or remove one or more trustees, a trustee may be removed only for cause and only by the affirmative vote of the holders of at least two-thirds of the votes entitled to be cast in the election of trustees and that our board of trustees has the exclusive power to fill vacant trusteeships, even if the remaining trustees do not constitute a quorum. These provisions make it more difficult to change our management by removing and replacing trustees and it may delay or prevent a change in control that is in the best interests of our shareholders.
We may change our operational policies, investment guidelines and our investment and growth strategies without shareholder consent, which may subject us to different and more significant risks in the future, which could materially and adversely affect us.
Our board of trustees determines our operational policies, investment guidelines and our investment and growth strategies. Our board of trustees may make changes to, or approve transactions that deviate from, those policies, guidelines and strategies without a vote of, or notice to, our shareholders. This could result in us conducting operational matters, making investments or pursuing different investment or growth strategies than those contemplated in this Annual Report on Form 10-K.
19
Under any of these circumstances, we may expose ourselves to different and more significant risks in the future, which could materially and adversely affect us.
Our rights and the rights of our shareholders to take action against our trustees and officers are limited, which could limit our shareholders' recourse in the event of actions not in our shareholders' best interests.
Under Maryland law, generally, a trustee is required to perform his or her duties in good faith, in a manner he or she reasonably believes to be in our best interest and with the care that an ordinarily prudent person in a like position would use under similar circumstances. Under Maryland law, trustees are presumed to have acted with this standard of care. In addition, our declaration of trust limits the liability of our trustees and officers to us and our shareholders for monetary damages, except for liability resulting from the:
|
•
|
actual receipt of an improper benefit or profit in money, property or services; or
|
|
•
|
active and deliberate dishonesty by the trustee or officer that was established by a final judgment as being material to the cause of action adjudicated.
|
Our declaration of trust and bylaws obligate us, to the fullest extent permitted by Maryland law in effect from time to time, to indemnify and to pay or reimburse reasonable expenses in advance of the final disposition of a proceeding to any present or former trustee or officer who is made or threatened to be made a party to the proceeding by reason of his or her service to us in that capacity. In addition, we may be obligated to advance the defense costs incurred by our trustees and officers. As a result, we and our shareholders may have more limited rights against our trustees and officers than might otherwise exist absent the current provisions in our declaration of trust and bylaws or that might exist with other companies.
If we fail to maintain an effective system of internal control over financial reporting, we may not be able to accurately report our financial results.
In connection with operating as a public company, we are required to provide reliable financial statements and reports to our shareholders. To monitor the accuracy and reliability of our financial reporting, we have established an internal audit function that oversees our internal controls. In addition, we have developed policies and procedures with respect to company-wide business processes and cycles in order to implement an effective system of internal control over financial reporting. We have established, or caused our third-party hotel management companies to establish, controls and procedures designed to ensure that hotel revenues and expenses are properly recorded at our hotels. While we have undertaken substantial work to comply with Section 404 of the Sarbanes-Oxley Act of 2002, we cannot be certain that we will be successful in maintaining effective internal control over financial reporting and we may determine in the future that our existing internal controls need improvement. If we fail to maintain an effective system of internal control, we could be materially harmed or we could fail to meet our reporting obligations. In addition, the existence of a material weakness or significant deficiency in our internal controls could result in errors to our financial statements that could require a restatement, cause us to fail to meet our reporting obligations, result in increased costs to remediate any deficiencies, attract regulatory scrutiny or lawsuits and cause investors to lose confidence in our reported financial information, any of which could lead to a substantial decline in the market price of our common shares.
Risks Related to the Real Estate Industry
The illiquid nature of real estate investments could significantly impede our ability to respond to changing economic, financial, and investment conditions or changes in the operating performance of our hotel properties, which could materially and adversely affect our cash flows and results of operations.
Real estate investments, including the focused-service and compact full-service hotels in our portfolio, are relatively illiquid. As a result, we may not be able to sell a hotel or hotels quickly or on favorable terms in response to the changing economic, financial and investment conditions or changes in the hotel's operating performance when it otherwise may be prudent to do so. We cannot predict whether we will be able to sell any hotel we desire to sell for the price or on the terms set by us or whether any price or other terms offered by a prospective purchaser would be acceptable to us. We also cannot predict the length of time needed to find a willing purchaser and to close the sale of a hotel. We may be required to expend funds to correct defects or to make improvements before a hotel can be sold, and we cannot provide any assurances that we will have the funds available to correct such defects or to make such improvements. Our inability to dispose of assets at opportune times or on favorable terms could materially and adversely affect our cash flows and results of operations.
In addition, our ability to dispose of some of our hotels could be constrained by their tax attributes. Hotels that we own for a significant period of time, or that we may acquire in the future through tax deferred contribution transactions in exchange for OP units in the Operating Partnership, may have low tax bases. If we dispose of these hotels outright in taxable transactions, we may be required to distribute the taxable gain to our shareholders under the requirements of the Code applicable to REITs or
20
to pay tax on that gain, either of which, in turn, would impact our cash flow and increase our leverage. In some cases, we may be restricted from disposing of properties contributed to us in the future in exchange for our OP units under tax protection agreements with contributors unless we incur additional costs related to indemnifying those contributors. To dispose of low basis or tax-protected hotels efficiently, we may from time to time use like-kind exchanges, which qualify for non-recognition of the taxable gain, but can be difficult to consummate and result in the hotel for which the disposed assets are exchanged inheriting their low tax bases and other tax attributes.
Uninsured and underinsured losses at our hotels could materially and adversely affect us.
We maintain comprehensive insurance on each of our hotels and we intend to maintain comprehensive insurance on any hotels that we acquire in the future, including liability, fire and extended coverage. There can be no assurances that insurance coverage will be available at reasonable rates. Certain types of catastrophic losses, such as windstorms, earthquakes, floods and losses from foreign and domestic terrorist activities may not be insurable or may not be economically insurable. Even when insurable, these policies may have high deductibles and/or high premiums. Our lenders may require such insurance and our failure to obtain such insurance could constitute a default under the loan agreements, which could have a material and adverse effect on us.
In the event of a substantial loss, our insurance coverage may not be sufficient to cover the full current market value or replacement cost of our lost investment. Should an uninsured loss or a loss in excess of insured limits occur, we could lose all or a portion of the capital we have invested in a hotel, as well as the anticipated future revenue from the hotel. In that event, we might nevertheless remain obligated for any mortgage debt or other financial obligations related to the hotel. Inflation, changes in building codes and ordinances, environmental considerations and other factors might also keep us from using insurance proceeds to replace or renovate a hotel after it has been damaged or destroyed. Under those circumstances, the insurance proceeds we receive might be inadequate to restore our economic position on the damaged or destroyed hotel, which could have a material and adverse effect on us.
In addition, the insurance risks associated with potential acts of terrorism could sharply increase the premiums we pay for coverage against property and casualty claims. In many cases, mortgage lenders have begun to insist that commercial property owners purchase coverage against terrorism as a condition of providing the mortgage loan. Such insurance policies may not be available at a reasonable cost, which could inhibit our ability to finance or refinance our hotels. In such instances, we may be required to provide other financial support, either through financial assurances or self-insurance, to cover the potential losses. We may not have adequate coverage for such losses, which could have a material and adverse effect on us.
Compliance or failure to comply with the ADA and other safety regulations and requirements could result in substantial costs.
Under the ADA, all public accommodations must meet various federal requirements related to access and use by disabled persons. Compliance with the ADA's requirements could require removal of access barriers, and non-compliance could result in the U.S. government imposing fines or private damage awards. If we are required to make substantial modifications to the hotels that we own or the hotels that we acquire, whether to comply with the ADA or other changes in governmental rules and regulations, we could be materially and adversely affected.
Our hotels are also subject to various federal, state and local regulatory requirements, such as state and local fire and life safety requirements. If we fail to comply with these requirements, we could incur fines or private damage awards. If we incur substantial costs to comply with the ADA or other safety regulations and requirements, our financial condition, results of operations, the market price of our common shares, cash flows and our ability to satisfy our debt obligations and to make distributions to our shareholders could be materially and adversely affected.
We could incur significant costs related to government regulation and litigation with respect to environmental matters, which could have a material and adverse effect on us.
Our hotels are subject to various U.S. federal, state and local environmental laws that impose liability for contamination. Under these laws, governmental entities have the authority to require us, as the current owner of a hotel, to perform or pay for the clean-up of contamination (including hazardous substances, asbestos and asbestos-containing materials ("ACM"), waste or petroleum products) at, on, under or emanating from the hotel and to pay for natural resource damages arising from such contamination. Such laws often impose liability without regard to whether the owner or operator or other responsible party knew of, or caused such contamination, and the liability may be joint and several. Because these laws also impose liability on persons who owned or operated a property at the time it became contaminated, it is possible we could incur cleanup costs or other environmental liabilities even after we sell or no longer operate the hotels. Contamination at, on, under or emanating from our hotels also may expose us to liability to private parties for the costs of remediation and/or personal injury or property damage. In addition, environmental laws may create liens on contaminated sites in favor of the government for damages and costs it incurs to address such contamination. If contamination is discovered on our hotel properties, the environmental laws
21
may also impose restrictions on the manner in which the properties may be used or how the businesses may be operated, and these restrictions may require substantial expenditures. Moreover, environmental contamination can affect the value of a property and, therefore, an owner's ability to borrow funds using the property as collateral or to sell the property on favorable terms or at all. Furthermore, any persons who send waste to a waste disposal facility, such as a landfill or an incinerator, may be liable for costs associated with cleanup of that facility.
In addition, our hotels are subject to various U.S. federal, state, and local environmental, health and safety laws and regulations that address a wide variety of issues, including, but not limited to, storage tanks, air emissions from emergency generators, storm water and wastewater discharges, lead-based paint, mold and mildew, and waste management. Some of our hotels routinely handle and use hazardous or regulated substances and waste as part of their operations (
e.g.
, swimming pool chemicals). Our hotels incur costs to comply with these environmental, health and safety laws and regulations and could be subject to fines and penalties for non-compliance with the applicable requirements.
Certain of our hotels contain, and the hotels that we acquire in the future may contain, or may have contained ACM. Federal, state and local environmental, health and safety laws require that ACM be properly managed and maintained, and include requirements to undertake special precautions, such as removal or abatement, if ACM would be disturbed during maintenance, renovation or demolition of a building. Such laws regarding ACM may impose fines and penalties on building owners, employers and operators for failure to comply with these requirements. In addition, third parties may seek recovery from owners or operators for personal injury associated with exposure to asbestos-containing building materials.
When excessive moisture accumulates in buildings or on building materials, mold growth may occur, particularly if the moisture problem remains undiscovered or is not addressed over a period of time. Some molds may produce airborne toxins or irritants. Indoor air quality issues can also stem from inadequate ventilation, chemical contamination from indoor or outdoor sources, and other biological contaminants such as pollen, viruses and bacteria. Indoor exposure to airborne toxins or irritants above certain levels is alleged to cause a variety of adverse health effects and symptoms, including allergic or other reactions. As a result, the presence of significant mold or other airborne contaminants at any of our hotels could require us to undertake a costly remediation program to contain or remove the mold or other airborne contaminants from the affected property or increase indoor ventilation. In addition, the presence of significant mold or other airborne contaminants could expose us to third party liability if property damage or personal injury occurs.
The liabilities and the costs associated with environmental contamination at, on, under or emanating from our properties, defending against the claims related to alleged or actual environmental issues, or complying with environmental, health and safety laws could be material and could materially and adversely affect us. We can make no assurances that changes in current laws or regulations or future laws or regulations will not impose additional, new, or material environmental liabilities or that the current environmental condition of our hotels will not be affected by our operations, the condition of the properties in the vicinity of our hotels, or by third parties unrelated to us. The discovery of material environmental liabilities at our hotel properties could subject us to unanticipated costs, which could significantly reduce or eliminate our profitability and the cash available for distribution to our shareholders.
We may from time to time be subject to litigation that could expose us to uncertain or uninsured costs.
As owners of hotel properties, we may from time to time face potential claims, litigation and threatened litigation from guests, visitors to our hotel properties, contractors, sub-contractors and others. These claims and proceedings are inherently uncertain and their costs and outcomes cannot be predicted with certainty. Some of these claims may result in defense costs, settlements, fines or judgments against us, and some of which are not, or cannot be, covered by insurance. Payment of any such costs, settlements, fines or judgments that are not insured could have a material and adverse impact on our financial position and results of operations. In addition, certain litigation or the resolution of certain litigation may affect the availability or cost of some of our insurance coverage, which could materially and adversely impact our results of operations and cash flows, expose us to increased risks that would be uninsured, and/or adversely impact our ability to attract officers and trustees.
Risks Related to Our Status as a REIT
Legislative or regulatory tax changes related to REITs could materially and adversely affect us.
There are a number of issues associated with an investment in a REIT that are related to the federal income tax laws, including, but not limited to, the consequences of a company's failing to qualify or to continue to qualify as a REIT and the tax rates applicable to REITs and their shareholders. At any time, the federal income tax laws governing REITs or the administrative interpretations of those laws may be amended or modified. Legislative and regulatory changes, including comprehensive tax reform, may be more likely in the 115th Congress, which convened in January 2017, because the Presidency and both Houses of Congress will be controlled by the same political party. We cannot predict when or if any new federal income tax law, regulation or administrative interpretation, or any amendment to any existing federal income tax law,
22
regulation or administrative interpretation, will be adopted, promulgated or become effective. Any such new law, regulation or interpretation may take effect retroactively and could materially and adversely affect us.
If we do not qualify as a REIT or if we fail to remain qualified as a REIT, we will be subject to U.S. federal income tax and potentially state and local taxes, which would reduce our earnings and the amount of cash available for distribution to our shareholders.
If we were to fail to qualify as a REIT in any taxable year and any available relief provisions do not apply, we would be subject to federal and state corporate income tax, including any applicable alternative minimum tax, on our taxable income, and dividends paid to our shareholders would not be deductible by us in computing our taxable income. Unless we were entitled to statutory relief under certain Code provisions, we also would be disqualified from taxation as a REIT for the four taxable years following the year in which we failed to qualify as a REIT.
Any determination that we do not qualify as a REIT would have a material adverse effect on our results of operations and could materially reduce the value of our common shares. Our additional tax liability could be substantial and would reduce our net earnings available for investment, debt service or distributions to shareholders.
REIT distribution requirements could adversely affect our ability to execute our business plan.
We intend to make distributions to our shareholders to comply with the REIT requirements of the Code. We generally must distribute annually at least 90% of our REIT taxable income, subject to certain adjustments and excluding any net capital gain, in order for corporate income tax not to apply to earnings that we distribute. To the extent that we satisfy this distribution requirement but distribute less than 100% of our taxable income, we will be subject to corporate income tax on our undistributed taxable income. In addition, we will be subject to a 4% nondeductible excise tax if the actual amount that we pay out to our shareholders in a calendar year is less than a minimum amount specified under U.S. federal tax laws.
Since the REIT distribution requirement prevents us from retaining earnings, we generally will be required to refinance debt at its maturity with additional debt or equity. Thus, compliance with the REIT requirements may hinder our ability to grow our business, which could adversely affect the market price of our common shares.
Dividends payable by REITs do not qualify for the reduced tax rates available for some dividends.
For taxable years beginning on or after January 1, 2013, the maximum tax rate applicable to "qualified dividends" paid to U.S. shareholders that are individuals, trusts and estates is 23.8% (taking into account the 3.8% Medicare tax applicable to net investment income). Dividends payable by REITs, however, generally are not eligible for the reduced rates and will continue to be subject to tax at rates applicable to ordinary income, which will be as high as 43.4% (taking into account the 3.8% Medicare tax applicable to net investment income). The more favorable tax rates applicable to regular corporate qualified dividends could cause investors who are individuals, trusts and estates to perceive investments in REITs to be relatively less attractive than investments in the shares of non-REIT corporations that pay dividends, which could adversely affect the value of the shares of REITs, including our common shares.
If our leases are not respected as true leases for federal income tax purposes, we would likely fail to qualify as a REIT.
To qualify as a REIT, we must satisfy two gross income tests, pursuant to which specified percentages of our gross income must be passive income, such as rent. For the rent paid pursuant to the hotel leases with our TRSs, which we currently expect will continue to constitute substantially all of our gross income, to qualify for purposes of the gross income tests, the leases must be respected as true leases for federal income tax purposes and must not be treated as service contracts, joint ventures or some other type of arrangement. We believe that the leases will be respected as true leases for federal income tax purposes. There can be no assurance, however, that the IRS will agree with this characterization. If the leases were not respected as true leases for federal income tax purposes, we would not be able to satisfy either of the two gross income tests applicable to REITs and would likely lose our REIT status. Additionally, we could be subject to a 100% excise tax for any adjustment to our leases.
If our TRSs fail to qualify as "taxable REIT subsidiaries" under the Code, we would likely fail to qualify as a REIT.
Rent paid by a lessee that is a "related party tenant" will not be qualifying income for purposes of the income tests applicable to REITs. We currently lease and expect to continue to lease substantially all of our hotels to our TRSs, which will not be treated as "related party tenants" so long as they qualify as "taxable REIT subsidiaries" under the Code. To qualify as such, most significantly, a taxable REIT subsidiary cannot engage in the operation or management of hotels. We believe that our TRSs will qualify to be treated as taxable REIT subsidiaries for federal income tax purposes. There can be no assurance, however, that the IRS will not challenge the status of a TRS for federal income tax purposes or that a court would not sustain such a challenge. If the IRS were successful in disqualifying any of our TRSs from treatment as a taxable REIT subsidiary, it is
23
likely that we would fail to meet the asset tests applicable to REITs and substantially all of our income would fail to qualify for the gross income tests. If we failed to meet either the asset tests or the gross income tests, we would likely lose our REIT status.
If any hotel management companies that we engage do not qualify as "eligible independent contractors," or if our hotels are not "qualified lodging facilities," we would likely fail to qualify as a REIT.
Rent paid by a lessee that is a "related party tenant" of ours generally will not be qualifying income for purposes of the two gross income tests applicable to REITs. An exception is provided, however, for leases of "qualified lodging facilities" to a TRS so long as the hotels are managed by an "eligible independent contractor" and certain other requirements are satisfied. We lease and expect to lease all or substantially all of our hotels to TRS lessees and to engage hotel management companies that are intended to qualify as "eligible independent contractors." In addition, for a hotel management company to qualify as an eligible independent contractor, (i) the hotel management company must not own, directly or through its shareholders, more than 35% of our outstanding shares, and no person or group of persons can own more than 35% of our outstanding shares and the shares (or ownership interest) of the hotel management company and (ii) such company or a related person must be actively engaged in the trade or business of operating "qualified lodging facilities" (as defined below) for one or more persons not related to the REIT or its TRSs at each time that such company enters into a hotel management contract with a TRS or its TRS lessee. Finally, each hotel with respect to which our TRS lessees pay rent must be a "qualified lodging facility." A "qualified lodging facility" is a hotel, motel, or other establishment in which more than one-half of the dwelling units are used on a transient basis, including customary amenities and facilities, provided that no wagering activities are conducted at or in connection with such facility by any person who is engaged in the business of accepting wagers and who is legally authorized to engage in such business at or in connection with such facility. As of the date hereof, we believe the hotel management companies operate qualified lodging facilities for certain persons who are not related to us or our TRS. As of the date hereof, we believe that all of the hotels leased to our TRS lessees will be qualified lodging facilities. Although we intend to monitor future acquisitions and improvements of hotels, the REIT provisions of the Code provide only limited guidance for making determinations under the requirements for qualified lodging facilities, and there can be no assurance that these requirements will be satisfied in all cases.
Our ownership of taxable REIT subsidiaries is limited, and our transactions with our TRSs will cause us to be subject to a 100% penalty tax on certain income or deductions if those transactions are not conducted on arm's length terms.
A REIT may own up to 100% of the equity interests of one or more taxable REIT subsidiaries. A taxable REIT subsidiary may hold assets and earn income that would not be qualifying assets or income if held or earned directly by a REIT. Both the subsidiary and the REIT must jointly elect to treat the subsidiary as a taxable REIT subsidiary. A corporation of which a taxable REIT subsidiary directly or indirectly owns more than 35% of the voting power or value of the stock will automatically be treated as a taxable REIT subsidiary. Overall, no more than 25% (20% for taxable years beginning after December 31, 2017) of the value of a REIT's assets may consist of stock or securities of one or more taxable REIT subsidiaries. In addition, the rules applicable to a taxable REIT subsidiary limit the deductibility of interest paid or accrued by a taxable REIT subsidiary to its parent REIT in order to assure that the taxable REIT subsidiary is subject to an appropriate level of corporate taxation.
Our TRSs will pay federal, state and local income taxes on their net taxable income, and their after-tax net income will be available for distribution to us but is not required to be distributed. We anticipate that the aggregate value of the stock and securities of our TRSs will be less than 25% (20% for taxable years beginning after December 31, 2017) of the value of our total assets (including the stock and securities of our TRSs). Furthermore, we will monitor the value of our respective investments in our TRSs for the purpose of ensuring compliance with the ownership limitations applicable to a taxable REIT subsidiary. We believe that our rents and other transactions with our TRSs have each been entered into on an arm's-length basis and reflect normal business practices, but there can be no assurance that the IRS will agree with our belief.
Complying with REIT requirements may force us to forgo and/or liquidate otherwise attractive investment opportunities.
To qualify as a REIT, we must ensure that we meet the REIT gross income tests annually and that at the end of each calendar quarter, at least 75% of the value of our assets consists of cash, cash items, government securities and qualified real estate assets. The remainder of our investment in securities (other than government securities and qualified real estate assets) generally cannot include more than 10% of the outstanding voting securities of any one issuer or more than 10% of the total value of the outstanding securities of any one issuer. In addition, in general, no more than 5% of the value of our assets (other than government securities and qualified real estate assets) can consist of the securities of any one issuer, no more than 25% (20% for taxable years beginning after December 31, 2017) of the value of our total assets can be represented by securities of one or more TRSs, and no more than 25% of the value of our total assets may be represented by debt instruments issued by publicly offered REITs that are "nonqualified" (i.e., not secured by real property or interests in real property). If we fail to comply with these requirements at the end of any calendar quarter, we must correct the failure within 30 days after the end of the calendar quarter or qualify for certain statutory relief provisions to avoid losing our REIT qualification and suffering adverse tax consequences. As a result, we may be required to liquidate from our portfolio, or contribute to a TRS, otherwise
24
attractive investments in order to maintain our qualification as a REIT. These actions could have the effect of reducing our income and amounts available for distribution to our shareholders. In addition, we may be required to make distributions to shareholders at disadvantageous times or when we do not have funds readily available for distribution, and may be unable to pursue investments that would otherwise be advantageous to us. Thus, compliance with the REIT requirements may hinder our ability to make, and, in certain cases, maintain ownership of, certain attractive investments.
Our TRS may be limited in using certain tax benefits.
If a corporation undergoes an "ownership change" within the meaning of Section 382 of the Code and the Treasury Regulations thereunder, such corporation's ability to use net operating losses ("NOLs"), generated prior to the time of that ownership change may be limited. To the extent the affected corporation's ability to use NOLs is limited, such corporation's taxable income may increase. As of
December 31, 2016
, we had approximately $123.4 million of NOLs (all of which are attributable to our TRS) which will begin to expire in 2028 for federal tax purposes and during the period from 2018 to 2028 for state tax purposes if not utilized. An ownership change within the meaning of Section 382 of the Code with respect to the REIT's TRS occurred during the 2012 and 2013 tax years. Accordingly, to the extent our TRS has taxable income in future years, its ability to use NOLs incurred prior to these ownership changes in such future years will be limited, and it may have greater taxable income as a result of such limitation.
Complying with REIT requirements may limit our ability to hedge effectively and may cause us to incur tax liabilities.
The REIT provisions of the Code may limit our ability to hedge our assets and operations. Under these provisions, any income that we generate from transactions intended to hedge our interest rate risk will be excluded from gross income for purposes of the REIT 75% and 95% gross income tests if the instrument hedges interest rate risk on liabilities used to carry or acquire real estate assets (each such hedge, a "Borrowings Hedge") or manages the risk of certain currency fluctuations (each such hedge, a "Currency Hedge"), and such instrument is properly identified under applicable Treasury Regulations. Income from hedging transactions that do not meet these requirements will generally constitute non-qualifying income for purposes of both the REIT 75% and 95% gross income tests. Exclusion from the REIT 75% and 95% gross income tests also applies if we previously entered into a Borrowings Hedge or a Currency Hedge, a portion of the hedged indebtedness or property is disposed of, and in connection with such extinguishment or disposition we enter into a new properly identified hedging transaction to offset the prior hedging position. As a result of these rules, we may have to limit our use of hedging techniques that might otherwise be advantageous or implement those hedges through a TRS. This could increase the cost of our hedging activities because our TRS would be subject to tax on gains or expose us to greater risks associated with changes in interest rates than we would otherwise want to bear. In addition, losses in our TRS will generally not provide any tax benefit, except for being carried back or forward against past or future taxable income in the TRS.
Risks Related to Our Common Shares
Our cash available for distribution to shareholders may not be sufficient to pay distributions at expected or required levels, and we may need to borrow funds or rely on other external sources in order to make such distributions, or we may not be able to make such distributions at all, which could cause the market price of our common shares to decline significantly.
We intend to continue to pay regular quarterly distributions to holders of our common shares. All distributions will be made at the discretion of our board of trustees and will depend on our historical and projected results of operations, EBITDA, FFO, liquidity and financial condition, REIT qualification, debt service requirements, capital expenditures and operating expenses, prohibitions and other restrictions under financing arrangements and applicable law and other factors as our board of trustees may deem relevant from time to time. No assurance can be given that our projections will prove to be accurate or that any level of distributions or particular yield will be made or sustained. We may not be able to make distributions in the future or we may need to fund such distributions through borrowings or other external financing sources, which may be available only at unattractive terms, if at all. Any of the foregoing could cause the market price of our common shares to decline significantly.
25
Future issuances of debt securities, which would rank senior to our common shares upon our liquidation, and future issuances of equity securities (including OP units), which would dilute the holdings of our existing common shareholders and may be senior to our common shares for the purposes of making distributions, periodically or upon liquidation, may negatively affect the market price of our common shares.
In the future, we may issue debt or equity securities or incur additional borrowings. Upon our liquidation, holders of our debt securities and other loans and preferred shares will receive a distribution of our available assets before common shareholders. If we incur debt in the future, our future interest costs could increase, and adversely affect our liquidity, FFO and results of operations. We are not required to offer any additional equity securities to existing common shareholders on a preemptive basis. Therefore, additional common share issuances, directly or through convertible or exchangeable securities (including OP units), warrants or options, will dilute the holdings of our existing common shareholders, and such issuances or the perception of such issuances may reduce the market price of our common shares. Our preferred shares, if issued, would likely have a preference on distribution payments, periodically or upon liquidation, which could eliminate or otherwise limit our ability to make distributions to common shareholders. Because our decision to issue debt or equity securities or incur additional borrowings in the future will depend on market conditions and other factors beyond our control, we cannot predict or estimate the amount, timing, nature or success of any future capital raising efforts. Thus, the common shareholders bear the risk that our future issuances of debt or equity securities or our incurrence of additional borrowings will negatively affect the market price of our common shares.
The number of common shares available for future issuance or sale could adversely affect the per share trading price of our common shares.
As of
February 15, 2017
, we had
124,621,611
common shares outstanding. In addition, as of such date,
558,750
OP units in the Operating Partnership were outstanding, which are redeemable for cash or, at our option, for a like number of our common shares. We cannot predict the effect, if any, of future resales of our common shares or OP units, or the perception of such resales, on the market price of our common shares. Any such future resales, or the perception that such resales might occur, could adversely affect the market price of our common shares and may also make it more difficult for us to sell equity or equity-related securities in the future and at terms that we deem appropriate.
In addition, subject to applicable law, our board of trustees has the authority, without further shareholder approval, to issue additional common shares and preferred shares on the terms and for the consideration it deems appropriate. We may issue additional common shares or OP units from time to time in connection with hotel acquisitions and we may grant registration rights in connection with such issuances, pursuant to which we would agree to register the resale of such securities under the Securities Act. Furthermore, in the future we may issue common shares and securities convertible into, or exchangeable or exercisable for, our common shares under our equity incentive plan. The market price of our common shares may decline significantly upon future issuances of equity under our equity incentive plan or in connection with hotel acquisitions.
The market price and trading volume of our common shares may be volatile and could decline substantially in the future.
The market price of our common shares may be volatile in the future. In addition, the trading volume of our common shares may fluctuate and cause significant price variations to occur. We cannot assure shareholders that the market price and the trading volume of our common shares will not decline or fluctuate significantly in the future, including as a result of factors unrelated to our operating performance. In particular, the market price and the trading volume of our common shares could be subject to wide fluctuations in response to a number of factors, including, among others, the following:
|
•
|
actual or anticipated differences in our operating results, liquidity, or financial condition;
|
|
•
|
changes in our revenues, expenses, EBITDA, FFO or earnings estimates;
|
|
•
|
publication of research reports about us, our hotels, the lodging industry, or the overall real estate industry;
|
|
•
|
additions and departures of key personnel;
|
|
•
|
the performance and market valuations of other similar companies;
|
|
•
|
the passage of legislation or other regulatory developments that adversely affect us or our industry;
|
|
•
|
the realization of any of the other risk factors presented in this Annual Report on Form 10-K;
|
|
•
|
speculation in the press or investment community;
|
|
•
|
changes in accounting principles;
|
|
•
|
terrorist acts; and
|
26
|
•
|
general market and economic conditions, including factors unrelated to our operating performance.
|
In the past, securities class action litigation has often been instituted against companies following periods of volatility in the market price of their common shares. If the market price of our common shares is volatile and this type of litigation is brought against us, it could result in substantial costs and divert our management's attention and resources, which could have a material and adverse effect on us.
Increases in market interest rates may reduce demand for our common shares and result in a decline in the market price of our common shares.
The market price of our common shares may be influenced by the distribution yield on our common shares (i.e., the amount of our annual distributions as a percentage of the market price of our common shares) relative to market interest rates. An increase in market interest rates, which are currently low compared to historical levels, may lead prospective purchasers of our common shares to expect a higher distribution yield, which we may not be able, or may choose not, to provide. Higher interest rates would also likely increase our borrowing costs and decrease our operating results and the cash available for distribution. Thus, higher market interest rates could cause the market price of our common shares to decline.
27
None.
Our Hotel Properties
The following table provides a comprehensive list of our hotel properties as of
December 31, 2016
:
|
Location
|
Hotel Property Name
|
Rooms
|
Location
|
Hotel Property Name
|
Rooms
|
|
|
California
|
Kentucky
|
|||||
|
Courtyard San Francisco
|
166
|
Courtyard Louisville Northeast
|
114
|
|||
|
Embassy Suites Irvine Orange County
|
293
|
Marriott Louisville Downtown
|
616
|
|||
|
Embassy Suites Los Angeles Downey
|
220
|
Residence Inn Louisville Downtown
|
140
|
|||
|
Hilton Garden Inn Los Angeles Hollywood
|
160
|
Residence Inn Louisville Northeast
|
102
|
|||
|
Hilton Garden Inn San Francisco Oakland Bay Brg
|
278
|
SpringHill Suites Louisville Hurstbourne North
|
142
|
|||
|
Hyatt House Cypress Anaheim
|
142
|
Louisiana
|
||||
|
Hyatt House Emeryville San Francisco Bay Area
|
234
|
Hilton Garden Inn New Orleans Convention Center
|
286
|
|||
|
Hyatt House San Diego Sorrento Mesa
|
193
|
Hotel Indigo New Orleans Garden District
|
132
|
|||
|
Hyatt House San Jose Silicon Valley
|
164
|
Massachusetts
|
||||
|
Hyatt House San Ramon
|
142
|
Embassy Suites Boston Waltham
|
275
|
|||
|
Hyatt House Santa Clara
|
150
|
Maryland
|
||||
|
Hyatt Place Fremont Silicon Valley
|
151
|
DoubleTree Hotel Columbia
|
152
|
|||
|
Residence Inn Palo Alto Los Altos
|
156
|
Residence Inn Bethesda Downtown
|
188
|
|||
|
Colorado
|
Residence Inn Columbia
|
108
|
||||
|
Courtyard Boulder Longmont
|
78
|
Residence Inn National Harbor Washington DC
|
162
|
|||
|
Courtyard Boulder Louisville
|
154
|
Residence Inn Silver Spring
|
130
|
|||
|
Courtyard Denver West Golden
|
110
|
Michigan
|
||||
|
Fairfield Inn & Suites Denver Cherry Creek
|
134
|
Residence Inn Detroit Novi
|
107
|
|||
|
Hampton Inn & Suites Denver Tech Center
|
123
|
North Carolina
|
||||
|
Marriott Denver Airport @ Gateway Park
|
238
|
Hilton Garden Inn Durham Raleigh Research Triangle Park
|
177
|
|||
|
Marriott Denver South @ Park Meadows
|
279
|
Hyatt House Charlotte Center City
|
163
|
|||
|
Renaissance Boulder Flatiron Hotel
|
232
|
New York
|
||||
|
Residence Inn Boulder Louisville
|
88
|
Courtyard New York Manhattan Upper East Side
|
226
|
|||
|
Residence Inn Denver West Golden
|
88
|
DoubleTree Metropolitan Hotel New York City (1)
|
764
|
|||
|
Residence Inn Longmont Boulder
|
84
|
Hampton Inn Garden City
|
143
|
|||
|
SpringHill Suites Boulder Longmont
|
90
|
Oregon
|
||||
|
SpringHill Suites Denver North Westminster
|
164
|
Courtyard Portland City Center
|
256
|
|||
|
District of Columbia
|
SpringHill Suites Portland Hillsboro
|
106
|
||||
|
Fairfield Inn & Suites Washington DC Downtown
|
198
|
Pennsylvania
|
||||
|
Homewood Suites Washington DC Downtown
|
175
|
Hilton Garden Inn Pittsburgh University Place
|
202
|
|||
|
Hyatt Place Washington DC Downtown K Street
|
164
|
Renaissance Pittsburgh Hotel
|
300
|
|||
|
Florida
|
South Carolina
|
|||||
|
Courtyard Fort Lauderdale SW Miramar
|
128
|
Courtyard Charleston Historic District
|
176
|
|||
|
DoubleTree Grand Key Resort
|
216
|
Texas
|
||||
|
Embassy Suites Fort Myers Estero
|
150
|
Courtyard Austin Airport
|
150
|
|||
|
Embassy Suites Tampa Downtown Convention Center
|
360
|
Courtyard Austin Downtown Convention Center
|
270
|
|||
|
Embassy Suites West Palm Beach Central
|
194
|
Courtyard Austin Northwest Arboretum
|
102
|
|||
|
Fairfield Inn & Suites Key West
|
106
|
Courtyard Austin South
|
110
|
|||
|
Hampton Inn Fort Walton Beach
|
100
|
Courtyard Houston By The Galleria
|
190
|
|||
|
Hampton Inn & Suites Clearwater St Petersburg Ulmerton Road
|
128
|
Courtyard Houston Downtown Convention Center
|
191
|
|||
|
Hampton Inn West Palm Beach Airport Central
|
105
|
Courtyard Houston Sugarland
|
112
|
|||
|
Hilton Cabana Miami Beach
|
231
|
Fairfield Inn & Suites Austin South Airport
|
63
|
|||
28
|
Location
|
Hotel Property Name
|
Rooms
|
Location
|
Hotel Property Name
|
Rooms
|
|
|
Hilton Garden Inn West Palm Beach Airport
|
100
|
Fairfield Inn & Suites San Antonio Downtown Market
|
110
|
|||
|
Renaissance Fort Lauderdale Plantation Hotel
|
250
|
Hampton Inn Houston Near The Galleria
|
176
|
|||
|
Residence Inn Fort Lauderdale Plantation
|
138
|
Hyatt House Austin Arboretum
|
131
|
|||
|
Residence Inn Fort Lauderdale SW Miramar
|
130
|
Hyatt House Dallas Lincoln Park
|
155
|
|||
|
Georgia
|
Hyatt House Dallas Uptown
|
141
|
||||
|
Courtyard Atlanta Buckhead
|
181
|
Hyatt House Houston Galleria
|
147
|
|||
|
Hyatt Atlanta Midtown
|
194
|
Hyatt Centric The Woodlands
|
70
|
|||
|
Residence Inn Atlanta Midtown Historic
|
90
|
Marriott Austin South
|
211
|
|||
|
Hawaii
|
Residence Inn Austin Downtown Convention Center
|
179
|
||||
|
Courtyard Waikiki Beach
|
403
|
Residence Inn Austin North Parmer Lane
|
88
|
|||
|
Illinois
|
Residence Inn Austin Northwest Arboretum
|
84
|
||||
|
Courtyard Chicago Downtown Magnificent Mile
|
306
|
Residence Inn Austin South
|
66
|
|||
|
Courtyard Midway Airport
|
174
|
Residence Inn Houston By The Galleria
|
146
|
|||
|
Fairfield Inn & Suites Chicago Midway Airport
|
114
|
Residence Inn Houston Downtown Convention Center
|
171
|
|||
|
Hampton Inn Chicago Midway Airport
|
170
|
Residence Inn Houston Sugarland
|
78
|
|||
|
Hilton Garden Inn Chicago Midway Airport
|
174
|
Residence Inn San Antonio Downtown Market Square
|
95
|
|||
|
Holiday Inn Express & Suites Midway Airport
|
104
|
SpringHill Suites Austin North Parmer Lane
|
132
|
|||
|
Marriott Chicago Midway
|
200
|
SpringHill Suites Austin South
|
152
|
|||
|
Residence Inn Chicago Oak Brook
|
156
|
SpringHill Suites Houston Downtown Convention Center
|
167
|
|||
|
Residence Inn Chicago Naperville
|
130
|
Utah
|
||||
|
Sleep Inn Midway Airport
|
121
|
Courtyard Salt Lake City Airport
|
154
|
|||
|
Indiana
|
Residence Inn Salt Lake City Airport
|
104
|
||||
|
Courtyard Chicago Southeast Hammond
|
85
|
Washington
|
||||
|
Courtyard Indianapolis @ The Capitol
|
124
|
Homewood Suites Seattle Lynnwood
|
170
|
|||
|
Courtyard South Bend Mishawaka
|
78
|
Wisconsin
|
||||
|
Fairfield Inn & Suites Chicago SE Hammond
|
94
|
Hyatt Place Madison Downtown
|
151
|
|||
|
Hilton Garden Inn Bloomington
|
168
|
|||||
|
Residence Inn Chicago Southeast Hammond
|
78
|
|||||
|
Residence Inn Indianapolis Downtown On The Canal
|
134
|
|||||
|
Residence Inn Indianapolis Fishers
|
78
|
|||||
|
Residence Inn Merrillville
|
78
|
|||||
|
SpringHill Suites South Bend Mishawaka
|
87
|
|||||
_______________________________________________________________________________
|
(1)
|
This hotel is owned through a joint venture in which we own a
98.3%
controlling interest. We are the managing member of the joint venture and we control all the material decisions related to this hotel. Our joint venture partner is affiliated with the hotel's property manager.
|
Our Hotel Management Agreements
In order to qualify as a REIT, we cannot directly or indirectly operate any of our hotels. We lease each of our hotels to TRS lessees, which in turn engage property management companies to manage our hotels. Each of our hotels is operated pursuant to a hotel management agreement with one of
15
independent hotel management companies. Each hotel management company receives a base management fee and is also eligible to receive an incentive management fee upon the achievement of certain financial thresholds as set forth in each applicable hotel management agreement. The incentive management fee is generally calculated as a percentage of hotel operating profit after we have received a priority return on our investment in the hotel. WLS is the hotel management company for
71
of our hotels. Our remaining hotels are managed by
14
other hotel management companies located in the United States. Below is a summary of the principal terms of the hotel management agreements with WLS and a general overview of our non-WLS hotel management agreements.
WLS Hotel Management Agreements
WLS is a fully-integrated owner, developer, and manager of premium-brand hotels. Our TRS lessees, as lessees of the respective hotels, have entered into hotel management agreements with WLS. This summary is qualified in its entirety by reference to the form of the WLS hotel management agreement included as an exhibit to this Annual Report on Form 10-K.
29
Our WLS hotel management agreements contain initial terms of 10 to 20 years and are generally subject to two automatic renewal terms of five to 10 years each. The WLS hotel management agreements have an average remaining initial term of approximately 10 years.
Under the WLS hotel management agreements, WLS receives a base management fee and, if certain financial thresholds are met or exceeded, an incentive management fee. The base management fee is generally
3.5%
of gross hotel revenues for the applicable hotel. Gross hotel revenue is calculated as all hotel revenue before subtracting expenses. The incentive management fee, which is calculated on a per hotel basis, is 15% of the operating profit (as defined in the applicable hotel management agreement) remaining after we receive an annual return equal to 11% of our total capital investment, including debt, in the applicable hotel. We also pay certain computer support and accounting service fees to WLS, as reflected in each hotel management agreement.
We have structured our WLS hotel management agreements to align our interests with those of WLS by providing us with a right to terminate a WLS hotel management agreement if WLS fails to achieve certain criteria relating to the performance of a hotel under WLS management, as measured with respect to any two consecutive fiscal years.
Subject to certain qualifications and applicable cure periods, the hotel management agreements are generally terminable by either party upon material casualty or condemnation of the hotel or the occurrence of certain customary events of default. If an event of default occurs and continues beyond the grace period set forth in the WLS hotel management agreement, the non-defaulting party generally has, among other remedies, the option of terminating the applicable hotel management agreement, upon at least 30 days written notice to the other party.
In the event that WLS elects to terminate a WLS hotel management agreement due to an event of default by us, WLS may elect to recover a termination fee, as liquidated damages, equal to 2.5 times the actual base management fee and incentive management fee earned by WLS under that hotel management agreement in the fiscal year immediately preceding the fiscal year in which such termination occurred.
Generally, the WLS hotel management agreements state that we cannot sell the applicable hotel to any unrelated third party or engage in certain change of control actions (1) if we are in default under the hotel management agreement, or (2) with or to a person or entity that is known in the community as being of bad moral character or has been convicted of a felony or is in control of or controlled by persons convicted of a felony or would be in violation of any franchise agreement requirements applicable to us. Generally, the WLS hotel management agreements further require that any future owner of the applicable hotel, at the option of WLS, assume the WLS hotel management agreement or enter into a new WLS hotel management agreement for such hotel.
Other Hotel Management Agreements
As of
December 31, 2016
,
51
of our hotels were managed by
14
hotel management companies other than WLS. This number includes four and ten hotels that receive the benefits of a franchise agreement pursuant to hotel management agreements with Marriott and Hyatt, respectively. Each of these hotels is subject to a hotel management agreement that contains customary terms and conditions that generally are similar to the provisions found in the WLS hotel management agreements described above. The hotel management agreements generally have initial terms that range from three to 25 years, and some provide for one or two automatic extension periods ranging from one to ten years. In addition, each hotel management company receives a base management fee generally equal to
3.0%
of gross hotel revenues. Hotel management agreements that include the benefits of a franchise agreement incur a base management fee generally equal to
7.0%
of gross hotel revenues. Management companies may also earn an incentive management fee ranging from
10%
to
25%
of available cash flow (or other similar metric) as set forth in the applicable hotel management agreement, calculated on a per hotel basis, generally equal to the operating profit of the hotel after deducting a priority return to us based upon a percentage of our total capital investment in the hotel.
Each of the hotel management agreements provides us with a right to terminate such hotel management agreement if the hotel management company fails to reach certain performance targets (as provided in the applicable hotel management agreement) or provides us with a right to terminate the hotel management agreement in our sole and absolute discretion. In addition, certain hotel management agreements give us the right to terminate the hotel management agreement upon the sale of the hotel or for any reason upon payment of a stipulated termination fee. The hotel management agreements are also generally terminable by either party upon material casualty or condemnation of the hotel or the occurrence of certain customary events of default.
Franchise Agreements
As of
December 31, 2016
,
72
,
27
and
6
of our hotels operated under franchise agreements with Marriott, Hilton and Hyatt, respectively. These numbers exclude four and ten hotels that receive the benefits of a franchise agreement pursuant to
30
hotel management agreements with Marriott and Hyatt, respectively. The remaining
three
hotels that we own as of
December 31, 2016
operate under existing franchise agreements with brands other than Marriott, Hilton or Hyatt.
The franchisors provide a variety of benefits to the franchisees, including centralized reservation systems, national advertising, marketing programs and publicity designed to increase brand awareness, training of personnel and maintenance of operational quality at the hotels across the brand system. The franchise agreements generally specify management, operational, record-keeping, accounting, reporting and marketing standards and procedures, all of which our TRS lessees, as the franchisees, must follow. The franchise agreements require our TRS lessees to comply with the franchisors' standards and requirements, including the training of operational personnel, safety, maintaining specified insurance, the types of services and products ancillary to guest room services that may be provided by the TRS lessee, the display of signage and the type, quality and age of furniture, fixtures and equipment included in the guest rooms and the nature of the lobbies and other common areas. The franchise agreements have initial terms ranging from 10 to 30 years. Each of our existing franchise agreements require that we pay a royalty fee generally between
4.0%
and
6.0%
of room revenue, plus additional fees for marketing, central reservation systems and other franchisor costs generally between
1.0%
and
4.3%
of room revenue. Certain hotels are also charged a royalty fee of between
1.5%
and
3.0%
of food and beverage revenues.
The franchise agreements also provide for termination at the applicable franchisor's option upon the occurrence of certain events, including the failure to pay royalties and fees, the failure to perform our obligations under the franchise license, bankruptcy and the abandonment of the franchise, or a change in control. The TRS lessee is responsible for making all payments under the applicable franchise agreement to the franchisor; however, we are required to guarantee the obligations under each of the franchise agreements. In addition, many of our existing franchise agreements provide the franchisor with a right of first offer in the event of certain sales or transfers of a hotel and provide the franchisor the right to approve any change in the hotel management company who manages the hotel.
TRS Leases
In order for us to qualify as a REIT, neither our company nor any of our subsidiaries may directly or indirectly operate any of our hotels. The subsidiaries of the Operating Partnership, as the lessors, lease our hotels to our TRS lessees, which, in turn, are the parties to the existing hotel management agreements with the third-party hotel management companies at each of our hotels. The TRS leases contain the provisions that are described below. For the hotels that are acquired in the future, we intend for the leases to contain substantially similar provisions as to those described below; however, we may, in our discretion, alter any of these provisions with respect to any particular lease.
Lease Terms
Our TRS leases have initial terms that range from three to five years and a majority of the leases can be renewed by our TRS lessees for three successive five-year renewal terms unless the lessee is in default at the expiration of the then-current term. In addition, our TRS leases are subject to early termination by us in the event that we sell the hotel to an unaffiliated party, a change in control occurs or the applicable provisions of the Code are amended to permit us to operate our hotels. Our TRS leases are also subject to early termination upon the occurrence of certain events of default and/or other contingencies described in the lease.
Amounts Payable under the Leases
During the term of each TRS lease, our TRS lessees are obligated to pay us a fixed annual base rent plus a percentage rent and certain other additional charges that our TRS lessees agree to pay under the terms of the respective TRS lease. The percentage rent is calculated based on the revenues generated from the rental of guest rooms, food and beverage sales, and certain other sources, including meeting room and movie rentals.
The TRS leases require our TRS lessees to pay rent, all costs and expenses, management fees, franchise fees, personal property taxes, certain insurance policies and all utility and other charges incurred in the operation of the hotels. The leases also provide for rent reductions and abatements in the event of damage to, destruction, or a partial taking of, any hotel.
All of the above mentioned intercompany transactions eliminate in consolidation.
Maintenance and Modifications
Under each TRS lease, the TRS lessee may, at its expense, make additions, modifications or improvements to the hotel that it deems desirable, and that we approve. In addition, our TRS lessees are required, at their expense, to maintain the hotels in good order and repair, except for ordinary wear and tear, and to make repairs that may be necessary and appropriate to keep the hotel in good order and repair. Under the TRS lease, we are responsible for maintaining, at our cost, any underground utilities or structural elements, including the exterior walls and the roof of the hotel (excluding, among other things, windows and mechanical, electrical and plumbing systems). Each TRS lessee, when and as required to meet the standards of the
31
applicable hotel management agreement, any applicable hotel franchise agreement, or to satisfy the requirements of any lender, must establish an FF&E reserve in an amount equal to up to 5% of gross revenue for the purpose of periodically repairing, replacing or refurbishing the furnishings and equipment.
Events of Default
The events of default under each of the leases include, among others: the failure by a TRS lessee to pay rent when due; the breach by a TRS lessee of a covenant, condition or term under the lease, subject to the applicable cure period; the bankruptcy or insolvency of a TRS lessee; cessation of operations by a TRS lessee of the leased hotel for more than 30 days, except as a result of damage, destruction, or a partial or complete condemnation; or the default by a TRS lessee under a franchise agreement subject to any applicable cure period.
Termination of Leases on Disposition of the Hotels or Change of Control
In the event that we sell a hotel to a non-affiliate or a change of control occurs, we generally have the right to terminate the lease by paying the applicable TRS lessee a termination fee to be governed by the terms and conditions of the lease.
Ground Leases
As of
December 31, 2016
,
eight
of our hotels were subject to ground lease agreements that cover the land underlying the respective hotels. Additional information on the ground leases can be found in Note 9 to our accompanying consolidated financial statements.
The nature of the operations of our hotels exposes our hotels, the Company and the Operating Partnership to the risk of claims and litigation in the normal course of business. Other than routine litigation arising out of the ordinary course of business, the Company is not presently subject to any material litigation nor, to the Company's knowledge, is any material litigation threatened against the Company.
Not applicable.
32
Our common shares are traded on the New York Stock Exchange ("NYSE") under the symbol "RLJ." Below is a summary of the high and low prices of our common shares for each quarterly period for the years ended December 31,
2016
and
2015
, as reported on the NYSE and the distributions paid by us with respect to each quarterly period.
|
2016
|
High
|
Low
|
Distribution
|
||||||||
|
January 1, 2016 through March 31, 2016
|
$
|
23.33
|
|
$
|
16.15
|
|
$
|
0.33
|
|
||
|
April 1, 2016 through June 30, 2016
|
$
|
22.81
|
|
$
|
18.86
|
|
$
|
0.33
|
|
||
|
July 1, 2016 through September 30, 2016
|
$
|
24.60
|
|
$
|
20.58
|
|
$
|
0.33
|
|
||
|
October 1, 2016 through December 31, 2016
|
$
|
25.10
|
|
$
|
18.92
|
|
$
|
0.33
|
|
||
|
2015
|
High
|
Low
|
Distribution
|
||||||||
|
January 1, 2015 through March 31, 2015
|
$
|
36.25
|
|
$
|
29.90
|
|
$
|
0.33
|
|
||
|
April 1, 2015 through June 30, 2015
|
$
|
32.09
|
|
$
|
28.73
|
|
$
|
0.33
|
|
||
|
July 1, 2015 through September 30, 2015
|
$
|
32.14
|
|
$
|
25.00
|
|
$
|
0.33
|
|
||
|
October 1, 2015 through December 31, 2015
|
$
|
27.52
|
|
$
|
21.48
|
|
$
|
0.33
|
|
||
On December 30, 2016 and
February 15, 2017
, the closing price of our common shares as reported on the NYSE was
$24.49
and
$23.75
, respectively.
33
Share Return Performance
The graph and the table set forth below assume $100 was invested on December 31, 2011 in RLJ Lodging Trust's common shares. The graph and the table compare the total shareholder return of our common shares against the cumulative total returns of the Standard & Poor's 500 Index ("S&P 500 Index") and the Morgan Stanley Capital International United States REIT Index ("MSCI US REIT Index") between December 31, 2011 and
December 31, 2016
. The graph assumes an initial investment of $100 in our common shares and in each of the indices, and it also assumes the reinvestment of dividends.
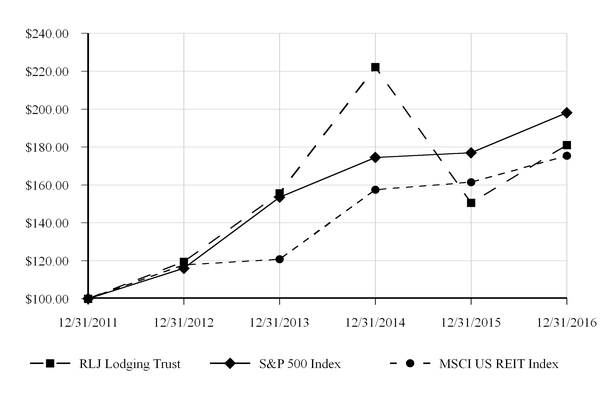
|
Name
|
Initial Investment at Dec 31, 2011
|
Value of Initial
Investment at Dec 31, 2012 |
Value of Initial
Investment at Dec 31, 2013 |
Value of Initial
Investment at Dec 31, 2014 |
Value of Initial
Investment at Dec 31, 2015 |
Value of Initial
Investment at Dec 31, 2016 |
||||||||||||||||||
|
RLJ Lodging Trust
|
$
|
100.00
|
|
$
|
119.49
|
|
$
|
155.62
|
|
$
|
222.20
|
|
$
|
150.59
|
|
$
|
181.05
|
|
||||||
|
S&P 500 Index
|
$
|
100.00
|
|
$
|
115.99
|
|
$
|
153.54
|
|
$
|
174.54
|
|
$
|
176.94
|
|
$
|
198.09
|
|
||||||
|
MSCI US REIT Index
|
$
|
100.00
|
|
$
|
117.83
|
|
$
|
120.77
|
|
$
|
157.49
|
|
$
|
161.46
|
|
$
|
175.37
|
|
||||||
This performance graph shall not be deemed "filed" for the purposes of Section 18 of the Securities Exchange Act of 1934, as amended, or incorporated by reference into any filing by us under the Securities Act of 1933, as amended, or the Securities Exchange Act, except as shall be expressly set forth by specific reference in such filing.
Shareholder Information
At
February 15, 2017
, we had
111
holders of record of our common shares. However, because many of our common shares are held by brokers and other institutions on behalf of shareholders, we believe there are substantially more beneficial holders of our common shares than record holders. At
February 15, 2017
, there were three holders (other than our company) of our OP units. Our OP units are redeemable for cash or, at our election, for our common shares.
In order to comply with certain requirements related to our qualification as a REIT, our declaration of trust provides that, subject to certain exceptions, no person or entity (other than a person or entity who has been granted an exception) may directly or indirectly, beneficially or constructively, own more than 9.8% of the aggregate of our outstanding common shares, by value or by number of shares, whichever is more restrictive, or 9.8% of the aggregate of the outstanding preferred shares of any class or series, by value or by number of shares, whichever is more restrictive.
34
Distribution Information
We intend, over time, to make quarterly distributions to our common shareholders. In order to qualify and maintain our qualification for taxation as a REIT, we intend to make annual distributions to our shareholders of at least 90% of our REIT taxable income, determined without regard to the deduction for dividends paid and excluding any net capital gain.
The credit agreements governing our $400 million unsecured revolving credit facility (the "Revolver") and our unsecured term loans (the "Term Loans") limit our ability to pay cash dividends. However, so long as no default or event of default exists, the credit agreements allow us to pay cash dividends with respect to any period of four fiscal quarters in an amount not to exceed (i) 95% of adjusted funds from operations (as defined in the credit agreements), (ii) the amount required for us to maintain our status as a REIT (including the right to distribute 100% of net capital gain) under Sections 856 through 860 of the Code, and (iii) the amount necessary for us to avoid income or excise tax under the Code. If certain defaults or events of default exist, we may pay cash dividends with respect to any fiscal year in an aggregate amount not to exceed the greater of (a) the minimum amount required for us to maintain our status as a REIT under Sections 856 through 860 of the Code, or (b) the amount necessary to avoid income or excise tax under the Code.
Any future distributions will be at the sole discretion of our board of trustees, and their form, timing and amount, if any, will depend upon a number of factors, including our actual and projected financial condition, liquidity, EBITDA, FFO and results of operations, the revenue we actually receive from our properties, our operating expenses, our debt service requirements, our capital expenditures, prohibitions and other limitations under our financing arrangements, as described above, our REIT taxable income, the annual REIT distribution requirements, applicable law and such other factors as our board of trustees deems relevant. To the extent that our cash available for distribution is less than 90% of our REIT taxable income, we may consider various means to cover any such shortfall, including borrowing under the Revolver or other loans, selling certain of our assets, or using a portion of the net proceeds we receive from offerings of equity, equity-related or debt securities or declaring taxable share dividends.
Unregistered Sales of Equity Securities
Except as set forth below, the Company did not sell any securities during the fiscal year ended
December 31, 2016
that were not registered under the Securities Act of 1933, as amended (the "Securities Act").
On February 22, 2016, a total of 335,250 common shares of beneficial interest were issued to a limited partner of our operating partnership in a private placement exempt from registration under the Securities Act pursuant to Section 4(a)(2) of the Securities Act. The shares of common stock were issued in connection with the limited partner's redemption of a total of 335,250 OP units.
Issuer Purchases of Equity Securities
On May 1, 2015, the Company's board of trustees authorized a share repurchase program to acquire up to $200.0 million of the Company's common shares through April 30, 2016. On October 30, 2015, the Company's board of trustees extended the duration of the share repurchase program to December 31, 2016 and increased the authorized amount that may be repurchased by $200.0 million to a total of $400.0 million.
During the year ended December 31, 2016, the Company repurchased and retired 610,607 of its common shares for approximately $13.3 million in connection with its share repurchase program. On February 17, 2017, the Company's board of trustees extended the duration of the share repurchase program to February 28, 2018 and increased the authorized amount that may be repurchased by $40.0 million to a total of $440.0 million.
Additionally, during the year ended
December 31, 2016
, certain of our employees surrendered common shares owned by them to satisfy their statutory minimum federal and state tax obligations associated with the vesting of restricted common shares of beneficial interest issued under the RLJ Lodging Trust 2015 Equity Incentive Plan (the "2015 Plan").
35
The following table summarizes all of the share repurchases during the year ended
December 31, 2016
:
|
Period
|
Total number
of shares
purchased
|
Average price
paid per share
|
Total number of
shares purchased
as part of publicly
announced plans
or programs
|
Maximum number
of shares that may
yet be purchased
under the plans or
programs (1)
|
|||||||||
|
January 1, 2016 through January 31, 2016
|
396
|
|
$
|
18.18
|
|
—
|
|
9,557,899
|
|
||||
|
February 1, 2016 through February 29, 2016
|
22,340
|
|
$
|
19.52
|
|
—
|
|
8,336,384
|
|
||||
|
March 1, 2016 through March 31, 2016
|
520,160
|
|
$
|
22.11
|
|
510,498
|
|
7,147,056
|
|
||||
|
April 1, 2016 through April 30, 2016
|
389
|
|
$
|
21.58
|
|
—
|
|
7,761,018
|
|
||||
|
May 1, 2016 through May 31, 2016
|
74,494
|
|
$
|
19.53
|
|
52,715
|
|
7,931,901
|
|
||||
|
June 1, 2016 through June 30, 2016
|
47,394
|
|
$
|
20.72
|
|
47,394
|
|
7,531,127
|
|
||||
|
July 1, 2016 through July 31, 2016
|
139,904
|
|
$
|
23.45
|
|
—
|
|
6,804,662
|
|
||||
|
August 1, 2016 through August 31, 2016
|
23,973
|
|
$
|
23.47
|
|
—
|
|
6,921,280
|
|
||||
|
September 1, 2016 through September 30, 2016
|
—
|
|
$
|
—
|
|
—
|
|
7,681,534
|
|
||||
|
October 1, 2016 through October 31, 2016
|
1,198
|
|
$
|
20.03
|
|
—
|
|
8,191,819
|
|
||||
|
November 1, 2016 through November 30, 2016
|
24,374
|
|
$
|
21.28
|
|
—
|
|
7,088,314
|
|
||||
|
December 1, 2016 through December 31, 2016
|
—
|
|
$
|
—
|
|
—
|
|
6,596,271
|
|
||||
|
Total for the year ended December 31, 2016
|
854,622
|
|
610,607
|
|
|||||||||
_______________________________________________________________________________
|
(1)
|
The maximum number of shares that may yet be repurchased under the share repurchase program is calculated by dividing the total dollar amount available to repurchase shares by the closing price of our common shares on the last business day of the respective month.
|
The following selected financial information should be read in conjunction with "Management's Discussion and Analysis of Financial Condition and Results of Operations" and the consolidated financial statements as of
December 31, 2016
and
2015
and for the three years ended
December 31, 2016
,
2015
and
2014
, and the related notes included elsewhere in this Annual Report on Form 10-K.
The selected financial information as of and for the years ended
December 31, 2016
,
2015
,
2014
,
2013
and
2012
has been derived from our audited historical financial statements.
36
|
For the year ended December 31,
|
|||||||||||||||||||
|
2016
|
2015
|
2014
|
2013
|
2012
|
|||||||||||||||
|
(In thousands, except share and per share data)
|
|||||||||||||||||||
|
Statement of Operations Data:
|
|||||||||||||||||||
|
Revenue
|
|||||||||||||||||||
|
Room revenue
|
$
|
1,010,637
|
|
$
|
985,361
|
|
$
|
969,402
|
|
$
|
844,741
|
|
$
|
738,207
|
|
||||
|
Other property revenue
|
149,358
|
|
150,979
|
|
139,795
|
|
125,639
|
|
111,478
|
|
|||||||||
|
Total revenue
|
1,159,995
|
|
1,136,340
|
|
1,109,197
|
|
970,380
|
|
849,685
|
|
|||||||||
|
Expense
|
|||||||||||||||||||
|
Room expense
|
228,656
|
|
220,101
|
|
213,071
|
|
186,667
|
|
162,039
|
|
|||||||||
|
Other property expense
|
439,453
|
|
437,545
|
|
433,274
|
|
388,440
|
|
346,898
|
|
|||||||||
|
Total property operating expense
|
668,109
|
|
657,646
|
|
646,345
|
|
575,107
|
|
508,937
|
|
|||||||||
|
Depreciation and amortization
|
162,500
|
|
156,226
|
|
144,294
|
|
127,231
|
|
126,340
|
|
|||||||||
|
Impairment loss
|
—
|
|
1,003
|
|
9,200
|
|
—
|
|
—
|
|
|||||||||
|
Property tax, insurance and other
|
77,281
|
|
76,682
|
|
71,443
|
|
63,627
|
|
52,745
|
|
|||||||||
|
General and administrative
|
31,516
|
|
37,810
|
|
41,671
|
|
35,466
|
|
31,086
|
|
|||||||||
|
Transaction and pursuit costs
|
192
|
|
3,058
|
|
4,850
|
|
4,410
|
|
3,520
|
|
|||||||||
|
Total operating expense
|
939,598
|
|
932,425
|
|
917,803
|
|
805,841
|
|
722,628
|
|
|||||||||
|
Operating income
|
220,397
|
|
203,915
|
|
191,394
|
|
164,539
|
|
127,057
|
|
|||||||||
|
Interest and other income
|
1,998
|
|
3,161
|
|
2,688
|
|
7,431
|
|
1,463
|
|
|||||||||
|
Interest expense
|
(58,820
|
)
|
(54,788
|
)
|
(56,810
|
)
|
(64,348
|
)
|
(83,689
|
)
|
|||||||||
|
Income from continuing operations before income tax (expense) benefit
|
163,575
|
|
152,288
|
|
137,272
|
|
107,622
|
|
44,831
|
|
|||||||||
|
Income tax (expense) benefit
|
(8,190
|
)
|
39,126
|
|
(1,145
|
)
|
(879
|
)
|
(1,369
|
)
|
|||||||||
|
Gain on sale of hotel properties
|
45,929
|
|
28,398
|
|
353
|
|
—
|
|
—
|
|
|||||||||
|
Net income from continuing operations, including gain on sale
|
201,314
|
|
219,812
|
|
136,480
|
|
106,743
|
|
43,462
|
|
|||||||||
|
Net income attributable to noncontrolling interests
|
(962
|
)
|
(1,591
|
)
|
(1,039
|
)
|
(1,258
|
)
|
(39
|
)
|
|||||||||
|
Net income from continuing operations available to common shareholders
|
$
|
200,352
|
|
$
|
218,221
|
|
$
|
135,441
|
|
$
|
105,485
|
|
$
|
43,423
|
|
||||
37
|
As of December 31,
|
|||||||||||||||||||
|
2016
|
2015
|
2014
|
2013
|
2012
|
|||||||||||||||
|
(In thousands, except share and per share data)
|
|||||||||||||||||||
|
Balance Sheet Data:
|
|||||||||||||||||||
|
Investment in hotel properties, net
|
$
|
3,368,674
|
|
$
|
3,674,999
|
|
$
|
3,518,803
|
|
$
|
3,241,163
|
|
$
|
3,073,483
|
|
||||
|
Cash and cash equivalents
|
$
|
456,672
|
|
$
|
134,192
|
|
$
|
262,458
|
|
$
|
332,248
|
|
$
|
115,861
|
|
||||
|
Total assets (1)
|
$
|
4,023,393
|
|
$
|
3,972,942
|
|
$
|
4,118,727
|
|
$
|
3,709,074
|
|
$
|
3,338,872
|
|
||||
|
Total debt (1)
|
$
|
1,582,715
|
|
$
|
1,575,486
|
|
$
|
1,548,095
|
|
$
|
1,400,765
|
|
$
|
1,406,138
|
|
||||
|
Total liabilities (1)
|
$
|
1,788,116
|
|
$
|
1,772,418
|
|
$
|
1,740,243
|
|
$
|
1,562,740
|
|
$
|
1,530,961
|
|
||||
|
Total equity
|
$
|
2,235,277
|
|
$
|
2,200,524
|
|
$
|
2,378,484
|
|
$
|
2,146,334
|
|
$
|
1,807,911
|
|
||||
|
Per Share Data:
|
|||||||||||||||||||
|
Basic income from continuing operations per share
|
$
|
1.61
|
|
$
|
1.69
|
|
$
|
1.06
|
|
$
|
0.89
|
|
$
|
0.40
|
|
||||
|
Diluted income from continuing operations per share (2)
|
$
|
1.61
|
|
$
|
1.68
|
|
$
|
1.05
|
|
$
|
0.88
|
|
$
|
0.40
|
|
||||
|
Weighted-average shares outstanding — basic
|
123,651,003
|
|
128,444,469
|
|
127,360,669
|
|
117,950,066
|
|
105,423,604
|
|
|||||||||
|
Weighted-average shares outstanding — diluted (2)
|
123,879,007
|
|
128,967,754
|
|
128,293,843
|
|
118,738,626
|
|
105,748,686
|
|
|||||||||
|
Dividends declared per share
|
$
|
1.32
|
|
$
|
1.32
|
|
$
|
1.04
|
|
$
|
0.86
|
|
$
|
0.70
|
|
||||
_______________________________________________________________________________
|
(1)
|
The Company adopted both Accounting Standards Update ("ASU") 2015-03 and ASU 2015-15 on January 1, 2016. The adoption of this guidance changed the balance sheet classification of the Company's deferred financing costs. Upon adoption of the new guidance, the Company retrospectively reclassified deferred financing costs of $7.3 million, $9.7 million, $8.9 million, and $7.5 million in the consolidated balance sheets as of December 31, 2015, 2014, 2013, and 2012, respectively. The carrying amount of debt is presented net of those deferred financing cost amounts for each of the respective periods.
|
|
(2)
|
Income allocated to the noncontrolling interest in the Operating Partnership has been excluded from the numerator, and the OP units of the Operating Partnership have been omitted from the denominator, since the effect of including these amounts in the numerator and denominator would have no impact.
|
The following discussion and analysis should be read in conjunction with the accompanying consolidated financial statements, the related notes included thereto, and Item 1A., "Risk Factors", all of which appear elsewhere in this Annual Report on Form 10-K.
Overview
We are a self-advised and self-administered Maryland REIT that acquires primarily premium-branded, focused-service and compact full-service hotels. We are one of the largest U.S. publicly-traded lodging REITs in terms of both number of hotels and number of rooms. Our hotels are concentrated in markets that we believe exhibit multiple demand generators and high barriers to entry. We believe premium-branded, focused-service and compact full-service hotels with these characteristics generate high levels of RevPAR, strong operating margins and attractive returns.
Our strategy is to acquire primarily premium-branded, focused-service and compact full-service hotels. Focused-service and compact full-service hotels typically generate most of their revenue from room rentals, have limited food and beverage outlets and meeting space, and require fewer employees than traditional full-service hotels. We believe these types of hotels have the potential to generate attractive returns relative to other types of hotels due to their ability to achieve RevPAR levels at or close to those achieved by traditional full-service hotels while achieving higher profit margins due to their more efficient operating model and less volatile cash flows.
As we look at factors that could impact our business, we find that the consumer is generally in good health, job creation remains positive, and wages are increasing at a moderate pace. While geopolitical and global economic uncertainty still exists, we remain hopeful that positive employment trends and an improving consumer balance sheet will continue to drive economic expansion in the U.S.
38
We are cautiously optimistic that continued expansion of the U.S. economy will generate positive lodging demand growth for the industry and another year of RevPAR growth. However, in light of accelerating supply, RevPAR growth is likely to be moderate.
We continue to follow a prudent and disciplined capital allocation strategy. To date, we have seen fewer acquisition opportunities that meet our investment profile. We will continue to look for and weigh all possible investment decisions against the highest and best returns for our shareholders over the long term. We believe that our cash on hand and expected access to capital (including availability under our Revolver) along with our senior management team's experience, extensive industry relationships and asset management expertise, will enable us to pursue investment opportunities that generate additional internal and external growth.
As of
December 31, 2016
, we owned
122
hotels with approximately
20,100
rooms, located in
21
states and the District of Columbia, and an interest in a mortgage loan secured by a hotel. We own, through wholly-owned subsidiaries, 100% of the interests in all hotel properties, with the exception of one hotel property in which we own a
98.3%
controlling interest in a joint venture.
Our Customers
Substantially all of our hotels consist of premium-branded, focused-service and compact full-service hotels. As a result of this property profile, the majority of our customers are transient in nature. Transient business typically represents individual business or leisure travelers. The majority of our hotels are located in business districts within major metropolitan areas. Accordingly, business travelers represent the majority of the transient demand at our hotels. As a result, macroeconomic factors impacting business travel have a greater effect on our business than factors impacting leisure travel.
Group business is typically defined as a minimum of 10 guestrooms booked together as part of the same piece of business. Group business may or may not use the meeting space at any given hotel. Given the limited meeting space at the majority of our hotels, group business that utilizes meeting space represents a small component of our customer base.
A number of our hotels are affiliated with brands marketed toward extended-stay customers. Extended-stay customers are generally defined as those staying five nights or longer.
Our Revenues and Expenses
Our revenue is primarily derived from the operation of hotels, including the sale of rooms, food and beverage revenue and other operating department revenue, which consists of parking fees, gift shop sales and other guest service fees.
Our operating costs and expenses consist of the costs to provide hotel services, including room expense, food and beverage expense, management and franchise fees and other operating expenses. Room expense includes housekeeping and front office wages and payroll taxes, reservation systems, room supplies, laundry services and other costs. Food and beverage expense primarily includes the cost of food, the cost of beverages and associated labor costs. Other operating expenses include labor and other costs associated with the other operating department revenue, as well as labor and other costs associated with administrative departments, sales and marketing, repairs and maintenance and utility costs. Our hotels that are subject to franchise agreements are charged a royalty fee, plus additional fees for marketing, central reservation systems and other franchisor costs, in order for the properties to operate under the respective brands. Franchise fees are based on a percentage of room revenue and for certain hotels additional franchise fees are charged for food and beverage revenue. Our hotels are managed by independent, third-party management companies under long-term agreements pursuant to which the management companies typically earn base and incentive management fees based on the levels of revenues and profitability of each individual hotel. We generally receive a cash distribution from the hotel management companies on a monthly basis, which reflects hotel-level sales less hotel-level operating expenses.
Key Indicators of Operating Performance
We use a variety of operating, financial and other information to evaluate the operating performance of our business. These key indicators include financial information that is prepared in accordance with accounting principles generally accepted in the United States of America ("GAAP") as well as other financial measures that are non-GAAP measures. In addition, we use other information that may not be financial in nature, including industry standard statistical information and comparative data. We use this information to measure the operating performance of our individual hotels, groups of hotels and/or business as
39
a whole. We also use these metrics to evaluate the hotels in our portfolio and potential acquisition opportunities to determine each hotel's contribution to cash flow and its potential to provide attractive long-term total returns. The key indicators include:
|
•
|
Average Daily Rate
— ADR represents the total hotel room revenues divided by the total number of rooms sold in a given period. ADR measures the average room price attained by a hotel and ADR trends provide useful information concerning the pricing environment and the nature of the customer base at a hotel or group of hotels. We use ADR to assess the pricing levels that we are able to generate, as changes in rates have a greater impact on operating margins and profitability than changes in occupancy.
|
|
•
|
Occupancy
— Occupancy represents the total number of hotel rooms sold in a given period divided by the total number of rooms available. Occupancy measures the utilization of our hotels' available capacity. We use occupancy to measure demand at a specific hotel or group of hotels in a given period. Additionally, occupancy levels help us determine the achievable ADR levels.
|
|
•
|
Revenue Per Available Room
— RevPAR is the product of ADR and occupancy. RevPAR does not include non-room revenues, such as food and beverage revenue or other operating department revenue. We use RevPAR to identify trend information with respect to room revenues from comparable properties and to evaluate hotel performance on a regional basis.
|
RevPAR changes that are primarily driven by changes in occupancy have different implications for overall revenues and profitability than the changes that are driven primarily by changes in ADR. For example, an increase in occupancy at a hotel would lead to additional variable operating costs (including housekeeping services, utilities and room supplies) and could also result in an increase in other operating department revenue and expense. Changes in ADR typically have a greater impact on operating margins and profitability as they only have a limited effect on variable operating costs.
ADR, Occupancy and RevPAR are commonly used measures within the lodging industry to evaluate operating performance. RevPAR is an important statistic for monitoring operating performance at the individual hotel level and across our entire business. We evaluate individual hotel RevPAR performance on an absolute basis with comparisons to budget and prior periods, as well as on a regional and company-wide basis. ADR and RevPAR include only room revenue. Room revenue comprised approximately
87.1%
of our total revenue for the year ended
December 31, 2016
, and is dictated by demand (as measured by occupancy), pricing (as measured by ADR) and our available supply of hotel rooms.
Another commonly used measure in the lodging industry is the RevPAR penetration index, which measures a hotel's RevPAR in relation to the average RevPAR of that hotel's competitive set. Like other lodging companies, we use the RevPAR penetration index as an indicator of a hotel's market share in relation to its competitive set. However, the RevPAR penetration index for a particular hotel is not necessarily reflective of that hotel's relative share of any particular lodging market. The RevPAR penetration index for a particular hotel is calculated as the quotient of (1) the subject hotel's RevPAR divided by (2) the average RevPAR of the hotels in the subject hotel's competitive set, multiplied by 100. For example, if a hotel's RevPAR is $90 and the average RevPAR of the hotels in its competitive set is $90, the RevPAR penetration index would be 100, which would indicate that the subject hotel is capturing its fair market share in relation to its competitive set (i.e., the hotel's RevPAR is, on average, the same as its competitors). If, however, a hotel's RevPAR is $110 and the average RevPAR of the hotels in its competitive set is $90, the RevPAR penetration index of the subject hotel would be 122.2, which would indicate that the subject hotel has a RevPAR premium of approximately 22.2% (and, therefore, a market share premium) in relation to its competitive set.
One critical component in the RevPAR penetration index calculation is the determination of a hotel's competitive set, which consists of a small group of hotels in the relevant market that we and the third-party hotel management company that manages the hotel believe are comparable for purposes of benchmarking the performance of such hotel. A hotel's competitive set is mutually agreed upon by us and the hotel's management company. Factors that we consider when establishing a competitive set include geographic proximity, brand affiliations, rate structure, and the level of service provided at the hotel. The determination of the competitive set is highly subjective, however, our methodology for determining a hotel's competitive set may differ materially from those used by other hotel owners and/or management companies.
For the year ended
December 31, 2016
, the portfolio wide RevPAR penetration index of our hotels was
113.9
, which indicates that, on average, our hotels maintained a market share premium of approximately
13.9%
in relation to their competitive set.
We also use non-GAAP measures such as FFO, Adjusted FFO, EBITDA and Adjusted EBITDA to evaluate the operating performance of our business. For a more in depth discussion of the non-GAAP measures, please refer to the "Non-GAAP Financial Measures" section.
40
Principal Factors Affecting Our Results of Operations
The principal factors affecting our operating results include the overall demand for lodging compared to the supply of available hotel rooms and other lodging options, and the ability of our third-party hotel management companies to increase or maintain revenues while controlling expenses.
|
•
|
Demand
— The demand for lodging, especially business travel, generally fluctuates with the overall economy. Historically, periods of declining demand are followed by extended periods of relatively strong demand, which typically occurs during the growth phase of the lodging cycle.
|
|
•
|
Supply
— The development of new hotels is driven largely by construction costs, the availability of financing and the expected performance of existing hotels and other lodging options.
|
We expect that our ADR, Occupancy and RevPAR performance will be impacted by macroeconomic factors such as regional and local employment growth, government spending, personal income and corporate earnings, office vacancy rates, business relocation decisions, airport activity, business and leisure travel demand, new hotel construction and the pricing strategies of our competitors. In addition, our ADR, Occupancy and RevPAR performance are dependent on the continued success of the Marriott, Hilton and Hyatt brands.
|
•
|
Revenue
—
Substantially all of our revenue is derived from the operation of hotels. Specifically, our revenue is comprised of:
|
|
◦
|
Room revenue —
Occupancy and ADR are the major drivers of room revenue. Room revenue accounts for the majority of our total revenue.
|
|
◦
|
Food and beverage revenue —
Occupancy, the nature of the hotel property and the type of customer staying at the hotel are the major drivers of food and beverage revenue (i.e., group business typically generates more food and beverage revenue through catering functions as compared to transient business, which may or may not utilize the hotel's food and beverage outlets).
|
|
◦
|
Other operating department revenue —
Occupancy and the nature of the hotel property are the main drivers of other ancillary revenue, such as parking fees, gift shop sales and other guest service fees. Some hotels, due to the limited focus of the services offered and size or space limitations at the hotel, may not have the type of facilities that generate other operating department revenue.
|
|
•
|
Property Operating Expense
—
The components of our property operating expense are as follows:
|
|
◦
|
Room expense —
These expenses include housekeeping and front office wages and payroll taxes, reservation systems, room supplies, laundry services and other room-related costs. Like room revenue, occupancy is the major driver of room expense. These costs can increase based on an increase in salaries and wages, as well as the level of service and amenities that are provided at the hotel.
|
|
◦
|
Food and beverage expense —
These expenses primarily include food, beverage and labor costs. Occupancy and the type of customer staying at the hotel (i.e., catered functions are generally more profitable than restaurant, bar, and other food and beverage outlets that are located on the hotel property) are the major drivers of food and beverage expense, which correlates closely with food and beverage revenue.
|
|
◦
|
Management and franchise fee expense —
A base management fee is computed as a percentage of gross hotel revenues. An incentive management fee is typically paid when the hotel's operating income exceeds certain thresholds, and it is generally calculated as a percentage of hotel operating income after we have received a priority return on our investment in the hotel. A franchise fee is computed as a percentage of room revenue, plus an additional percentage of room revenue for marketing, central reservation systems and other franchisor costs. Certain hotels will also pay an additional franchise fee which is computed as a percentage of food and beverage revenue. For a more in depth discussion of the management and franchise fees, please refer to the "Our Hotel Properties — Our Hotel Management Agreements" and "Our Hotel Properties — Franchise Agreements" sections.
|
|
◦
|
Other operating expense —
These expenses include labor and other costs associated with the other operating department revenue, as well as the labor and other costs associated with the administrative departments, sales and marketing, repairs and maintenance, and utility costs.
|
Most categories of variable operating expenses, including labor costs, fluctuate with changes in occupancy. Increases in occupancy are accompanied by increases in most categories of variable operating expenses, while increases in ADR typically only result in increases in certain categories of operating costs and expenses, such as franchise fees, management fees, travel
41
agency commissions and credit card processing fee expenses, all of which are based on hotel revenues. Therefore, changes in the ADR have a more significant impact on operating margins than changes in occupancy.
2016 Significant Activities
Our significant activities reflect our commitment to creating long-term shareholder value through enhancing our portfolio's quality, recycling capital and maintaining a prudent capital structure. During the
year ended December 31, 2016
, the following significant activities took place:
|
•
|
We sold four hotel properties for an aggregate sale price of $301.5 million as follows:
|
|
◦
|
In February 2016, we sold the Holiday Inn Express Merrillville in Merrillville, Indiana for $2.9 million;
|
|
◦
|
In November 2016, we sold the SpringHill Suites Bakersfield in Bakersfield, California for $12.9 million; and
|
|
◦
|
In December 2016, we sold the Hilton Garden Inn New York/West 35th Street and the Hilton New York Fashion District, both in New York, New York, for $285.8 million.
|
|
•
|
We refinanced over $1.0 billion of debt as follows:
|
|
◦
|
In March 2016, we refinanced our $74.0 million secured loan from PNC Bank maturing in 2017. We took advantage of the improved performance of the underlying assets and upsized this loan to $85.0 million. We also extended the maturity of this loan by six years and improved the overall pricing;
|
|
◦
|
In March 2016, we refinanced three Wells Fargo secured loans for a total of $148.5 million. We extended the final maturities on these loans from 2020 to 2022 and improved the overall pricing; and
|
|
◦
|
In April 2016, we modified our $400.0 million term loan initially due in 2018 and our Revolver. We improved the financial covenants, extended the final maturities to 2021, and improved the overall pricing. We also lowered the unused commitment fee and we increased the borrowing capacity on the Revolver by $100.0 million to $400.0 million.
|
|
•
|
We repurchased 0.6 million common shares for approximately $13.3 million at an average per share price of $21.73. Since we announced our share repurchase program in 2015, we have repurchased approximately 8.7 million shares for nearly $238.5 million. As of December 31, 2016, we had $161.5 million of remaining capacity under the share repurchase program.
|
|
•
|
We declared cash dividends of $1.32 per share for the year.
|
Results of Operations
At
December 31, 2016
,
2015
and
2014
we owned
122
,
126
and
146
hotel properties, respectively. Based on when a hotel property is acquired, sold, or closed for renovation, the operating results for certain hotel properties are not comparable for the years ended
December 31, 2016
,
2015
and
2014
.
For the comparison between the years ended December 31, 2016 and 2015, the non-comparable properties include three acquisitions that were completed between January 1, 2015 and December 31, 2016, 27 dispositions that were completed between January 1, 2015 and December 31, 2016, and two hotel properties that were closed for renovations during all or a portion of the period between January 1, 2015 and December 31, 2016.
For the comparison between the years ended December 31, 2015 and 2014, the non-comparable properties include 18 acquisitions that were completed between January 1, 2014 and December 31, 2015, 41 dispositions that were completed between January 1, 2014 and December 31, 2015, and three hotel properties that were closed for renovations during all or a portion of the period between January 1, 2014 and December 31, 2015.
42
Comparison of the
year ended December 31, 2016
to the
year ended December 31, 2015
|
|
For the year ended December 31,
|
|
|
|||||||||||
|
|
2016
|
2015
|
$ Change
|
% Change
|
||||||||||
|
|
(amounts in thousands)
|
|
|
|||||||||||
|
Revenue
|
|
|
|
|
|
|
|
|
||||||
|
Operating revenue
|
|
|
|
|
|
|
|
|
||||||
|
Room revenue
|
$
|
1,010,637
|
|
$
|
985,361
|
|
$
|
25,276
|
|
2.6
|
%
|
|||
|
Food and beverage revenue
|
111,691
|
|
114,818
|
|
(3,127
|
)
|
(2.7
|
)%
|
||||||
|
Other operating department revenue
|
37,667
|
|
36,161
|
|
1,506
|
|
4.2
|
%
|
||||||
|
Total revenue
|
$
|
1,159,995
|
|
$
|
1,136,340
|
|
$
|
23,655
|
|
2.1
|
%
|
|||
|
Expense
|
|
|
|
|
|
|
|
|
||||||
|
Operating expense
|
|
|
|
|
|
|
|
|
||||||
|
Room expense
|
$
|
228,656
|
|
$
|
220,101
|
|
$
|
8,555
|
|
3.9
|
%
|
|||
|
Food and beverage expense
|
79,589
|
|
81,117
|
|
(1,528
|
)
|
(1.9
|
)%
|
||||||
|
Management and franchise fee expense
|
118,210
|
|
116,462
|
|
1,748
|
|
1.5
|
%
|
||||||
|
Other operating expense
|
241,654
|
|
239,966
|
|
1,688
|
|
0.7
|
%
|
||||||
|
Total property operating expense
|
668,109
|
|
657,646
|
|
10,463
|
|
1.6
|
%
|
||||||
|
Depreciation and amortization
|
162,500
|
|
156,226
|
|
6,274
|
|
4.0
|
%
|
||||||
|
Impairment loss
|
—
|
|
1,003
|
|
(1,003
|
)
|
(100.0
|
)%
|
||||||
|
Property tax, insurance and other
|
77,281
|
|
76,682
|
|
599
|
|
0.8
|
%
|
||||||
|
General and administrative
|
31,516
|
|
37,810
|
|
(6,294
|
)
|
(16.6
|
)%
|
||||||
|
Transaction and pursuit costs
|
192
|
|
3,058
|
|
(2,866
|
)
|
(93.7
|
)%
|
||||||
|
Total operating expense
|
939,598
|
|
932,425
|
|
7,173
|
|
0.8
|
%
|
||||||
|
Operating income
|
220,397
|
|
203,915
|
|
16,482
|
|
8.1
|
%
|
||||||
|
Other income
|
303
|
|
1,598
|
|
(1,295
|
)
|
(81.0
|
)%
|
||||||
|
Interest income
|
1,695
|
|
1,563
|
|
132
|
|
8.4
|
%
|
||||||
|
Interest expense
|
(58,820
|
)
|
(54,788
|
)
|
(4,032
|
)
|
7.4
|
%
|
||||||
|
Income from continuing operations before income taxes
|
163,575
|
|
152,288
|
|
11,287
|
|
7.4
|
%
|
||||||
|
Income tax (expense) benefit
|
(8,190
|
)
|
39,126
|
|
(47,316
|
)
|
—
|
%
|
||||||
|
Income from continuing operations
|
155,385
|
|
191,414
|
|
(36,029
|
)
|
(18.8
|
)%
|
||||||
|
Gain on sale of hotel properties
|
45,929
|
|
28,398
|
|
17,531
|
|
61.7
|
%
|
||||||
|
Net income
|
201,314
|
|
219,812
|
|
(18,498
|
)
|
(8.4
|
)%
|
||||||
|
Net income attributable to noncontrolling interests
|
|
|
|
|
|
|
||||||||
|
Noncontrolling interest in consolidated joint venture
|
(55
|
)
|
(77
|
)
|
22
|
|
(28.6
|
)%
|
||||||
|
Noncontrolling interest in the Operating Partnership
|
(907
|
)
|
(1,514
|
)
|
607
|
|
(40.1
|
)%
|
||||||
|
Net income attributable to common shareholders
|
$
|
200,352
|
|
$
|
218,221
|
|
$
|
(17,869
|
)
|
(8.2
|
)%
|
|||
Revenue
Total revenue
increased
$23.7 million
, or
2.1%
, to
$1.160 billion
for the
year ended December 31, 2016
from
$1.136 billion
for the
year ended December 31, 2015
. The
increase
was a result of a
$25.3 million
increase in room revenue and a
$1.5 million
increase in other operating department revenue, partially offset by a
$3.1 million
decrease in food and beverage revenue.
Room Revenue
Room revenue
increased
$25.3 million
, or
2.6%
, to
$1.011 billion
for the
year ended December 31, 2016
from
$985.4 million
for the
year ended December 31, 2015
. The
increase
was a result of a
$13.6 million
increase in room revenue attributable to the comparable properties and an
$11.6 million
increase in room revenue attributable to the non-comparable properties. The increase in room revenue from the comparable properties was attributable to a
1.2%
increase
in RevPAR, led
43
by RevPAR increases in our
Northern California
,
Southern California
and
Washington, D.C.
markets of
9.6%
,
8.0%
and
4.4%
, respectively, which were partially offset by RevPAR decreases in our
Houston
,
Chicago
and
New York City
markets of
12.3%
,
3.3%
and
2.3%
, respectively.
The following are the key hotel operating statistics for the comparable properties owned at
December 31, 2016
and
2015
, respectively:
|
For the year ended December 31,
|
||||||||||
|
2016
|
2015
|
% Change
|
||||||||
|
Number of comparable properties (at end of period)
|
117
|
|
117
|
|
—
|
|
||||
|
Occupancy
|
78.2
|
%
|
78.1
|
%
|
0.1
|
%
|
||||
|
ADR
|
$
|
164.93
|
|
$
|
163.09
|
|
1.1
|
%
|
||
|
RevPAR
|
$
|
128.91
|
|
$
|
127.34
|
|
1.2
|
%
|
||
Food and Beverage Revenue
Food and beverage revenue
decreased
$3.1 million
, or
2.7%
, to
$111.7 million
for the
year ended December 31, 2016
from
$114.8 million
for the
year ended December 31, 2015
. The
decrease
was a result of a
$2.0 million
decrease
in food and beverage revenue attributable to the comparable properties and a
$1.1 million
decrease
in food and beverage revenue attributable to the non-comparable properties.
Other Operating Department Revenue
Other operating department revenue, which includes revenue derived from ancillary sources such as parking fees, gift shop sales and other guest service fees,
increased
$1.5 million
, or
4.2%
, to
$37.7 million
for the
year ended December 31, 2016
from
$36.2 million
for the
year ended December 31, 2015
. The
increase
was due to a
$0.8 million
increase in other operating department revenue attributable to the non-comparable properties and a
$0.7 million
increase in other operating department revenue attributable to the comparable properties.
Property Operating Expense
Property operating expense
increased
$10.5 million
, or
1.6%
, to
$668.1 million
for the
year ended December 31, 2016
from
$657.6 million
for the
year ended December 31, 2015
. The
increase
was due to an
$11.0 million
increase in property operating expense attributable to the comparable properties, partially offset by a
$0.5 million
decrease in property operating expense attributable to the non-comparable properties. The increase in property operating expense attributable to the comparable properties was related to higher room expense, other operating department costs and management and franchise fees. Room expense and other operating department costs fluctuate based on various factors, including changes in occupancy, labor costs, utilities and insurance costs. Management fees and franchise fees, which are computed as a percentage of gross revenue and room revenue, respectively, increased as a result of higher revenues.
Depreciation and Amortization
Depreciation and amortization expense
increased
$6.3 million
, or
4.0%
, to
$162.5 million
for the
year ended December 31, 2016
from
$156.2 million
for the
year ended December 31, 2015
. The increase was due to a
$4.8 million
increase in depreciation and amortization expense arising from the non-comparable properties and additional depreciation expense of
$1.5 million
as a result of capital expenditures to improve our comparable properties.
Impairment
For the year ended December 31, 2016
, we did not have an impairment loss on any of our hotel properties. For the
year ended December 31, 2015
, we incurred a
$1.0 million
impairment loss on one hotel. The impairment was the result of an evaluation of the recoverability of the hotel's carrying value given the expectation to sell the hotel before the end of its previously estimated useful life.
44
Property Tax, Insurance and Other
Property tax, insurance and other expense
increased
$0.6 million
, or
0.8%
, to
$77.3 million
for the
year ended December 31, 2016
from
$76.7 million
for the
year ended December 31, 2015
. The
increase
was due to a
$1.0 million
increase
in property tax, insurance and other expense attributable to the non-comparable properties, partially offset by a
$0.4 million
decrease
in property tax, insurance and other expense attributable to the comparable properties.
General and Administrative
General and administrative expense
decreased
$6.3 million
, or
16.6%
, to
$31.5 million
for the
year ended December 31, 2016
from
$37.8 million
for the
year ended December 31, 2015
. The
decrease
in general and administrative expense is primarily attributable to a
$7.0 million
decrease in compensation expense, partially offset by a net increase in other general and administrative costs, including legal fees and other professional fees and costs. The decrease in compensation expense was primarily due to the forfeiture of restricted shares and performance units upon the resignation of the Company's President and Chief Executive Officer in May 2016.
Interest Expense
The components of our interest expense for the
years ended December 31, 2016 and 2015
were as follows (in thousands):
|
For the year ended December 31,
|
||||||||||||||
|
2016
|
2015
|
$ Change
|
% Change
|
|||||||||||
|
Mortgage loans
|
$
|
16,006
|
|
$
|
16,500
|
|
$
|
(494
|
)
|
(3.0
|
)%
|
|||
|
Term Loans and Revolver
|
38,849
|
|
35,898
|
|
2,951
|
|
8.2
|
%
|
||||||
|
Amortization of deferred financing costs
|
3,965
|
|
4,164
|
|
(199
|
)
|
(4.8
|
)%
|
||||||
|
Capitalized interest
|
—
|
|
(1,774
|
)
|
1,774
|
|
(100.0
|
)%
|
||||||
|
Total interest expense
|
$
|
58,820
|
|
$
|
54,788
|
|
$
|
4,032
|
|
7.4
|
%
|
|||
Interest expense
increased
$4.0 million
, or
7.4%
, to
$58.8 million
for the
year ended December 31, 2016
from
$54.8 million
for the
year ended December 31, 2015
. The
decrease
in interest expense from the mortgage loans was due to a decrease in the balances outstanding as a result of principal payments, partially offset by additional borrowings. The
increase
in interest expense from the Term Loans and Revolver was due to the entry into new interest rate swaps and additional borrowings. The
decrease
in amortization of the deferred financing costs was insignificant due to the impact of extended loan maturities as a result of debt refinancing transactions during 2016 being offset by the accelerated amortization from the debt refinancing transactions and additional amortization from newly capitalized costs. The
decrease
in capitalized interest was due to two major redevelopment projects in 2015, both of which were completed in the third quarter of 2015. There were no major redevelopment projects during the
year ended December 31, 2016
.
Income Taxes
As part of our structure, we own TRSs that are subject to federal and state income taxes. We had an income tax expense of
$8.2 million
for the
year ended December 31, 2016
as compared to an income tax benefit of
$39.1 million
for the
year ended December 31, 2015
. The
$47.3 million
increase
in income taxes primarily resulted from the release of a deferred tax asset valuation allowance of $39.9 million during the year ended December 31, 2015 and deferred tax expense during the
year ended December 31, 2016
. The effective tax rates were
3.9%
and (21.7)% for the
years ended December 31,
2016
and
2015
, respectively. The effective tax rate increased in 2016 as a result of the release of the deferred tax asset valuation allowance in 2015.
45
Comparison of the
year ended December 31, 2015
to the
year ended December 31, 2014
|
|
For the year ended December 31,
|
|
|
|||||||||||
|
|
2015
|
2014
|
$ Change
|
% Change
|
||||||||||
|
|
(amounts in thousands)
|
|
|
|||||||||||
|
Revenue
|
|
|
|
|
|
|
|
|
||||||
|
Operating revenue
|
|
|
|
|
|
|
|
|
||||||
|
Room revenue
|
$
|
985,361
|
|
$
|
969,402
|
|
$
|
15,959
|
|
1.6
|
%
|
|||
|
Food and beverage revenue
|
114,818
|
|
107,538
|
|
7,280
|
|
6.8
|
%
|
||||||
|
Other operating department revenue
|
36,161
|
|
32,257
|
|
3,904
|
|
12.1
|
%
|
||||||
|
Total revenue
|
$
|
1,136,340
|
|
$
|
1,109,197
|
|
$
|
27,143
|
|
2.4
|
%
|
|||
|
Expense
|
|
|
|
|
|
|
|
|
||||||
|
Operating expense
|
|
|
|
|
|
|
|
|
||||||
|
Room expense
|
$
|
220,101
|
|
$
|
213,071
|
|
$
|
7,030
|
|
3.3
|
%
|
|||
|
Food and beverage expense
|
81,117
|
|
75,468
|
|
5,649
|
|
7.5
|
%
|
||||||
|
Management and franchise fee expense
|
116,462
|
|
114,802
|
|
1,660
|
|
1.4
|
%
|
||||||
|
Other operating expense
|
239,966
|
|
243,004
|
|
(3,038
|
)
|
(1.3
|
)%
|
||||||
|
Total property operating expense
|
657,646
|
|
646,345
|
|
11,301
|
|
1.7
|
%
|
||||||
|
Depreciation and amortization
|
156,226
|
|
144,294
|
|
11,932
|
|
8.3
|
%
|
||||||
|
Impairment loss
|
1,003
|
|
9,200
|
|
(8,197
|
)
|
(89.1
|
)%
|
||||||
|
Property tax, insurance and other
|
76,682
|
|
71,443
|
|
5,239
|
|
7.3
|
%
|
||||||
|
General and administrative
|
37,810
|
|
41,671
|
|
(3,861
|
)
|
(9.3
|
)%
|
||||||
|
Transaction and pursuit costs
|
3,058
|
|
4,850
|
|
(1,792
|
)
|
(36.9
|
)%
|
||||||
|
Total operating expense
|
932,425
|
|
917,803
|
|
14,622
|
|
1.6
|
%
|
||||||
|
Operating income
|
203,915
|
|
191,394
|
|
12,521
|
|
6.5
|
%
|
||||||
|
Other income
|
1,598
|
|
807
|
|
791
|
|
98.0
|
%
|
||||||
|
Interest income
|
1,563
|
|
1,881
|
|
(318
|
)
|
(16.9
|
)%
|
||||||
|
Interest expense
|
(54,788
|
)
|
(56,810
|
)
|
2,022
|
|
(3.6
|
)%
|
||||||
|
Income from continuing operations before income taxes
|
152,288
|
|
137,272
|
|
15,016
|
|
10.9
|
%
|
||||||
|
Income tax benefit (expense)
|
39,126
|
|
(1,145
|
)
|
40,271
|
|
—
|
|
||||||
|
Income from continuing operations
|
191,414
|
|
136,127
|
|
55,287
|
|
40.6
|
%
|
||||||
|
Gain on sale of hotel properties
|
28,398
|
|
353
|
|
28,045
|
|
—
|
|
||||||
|
Net income
|
219,812
|
|
136,480
|
|
83,332
|
|
61.1
|
%
|
||||||
|
Net income attributable to noncontrolling interests
|
|
|
|
|
|
|
||||||||
|
Noncontrolling interest in consolidated joint venture
|
(77
|
)
|
(171
|
)
|
94
|
|
(55.0
|
)%
|
||||||
|
Noncontrolling interest in the Operating Partnership
|
(1,514
|
)
|
(868
|
)
|
(646
|
)
|
74.4
|
%
|
||||||
|
Net income attributable to common shareholders
|
$
|
218,221
|
|
$
|
135,441
|
|
$
|
82,780
|
|
61.1
|
%
|
|||
Revenue
Total revenue
increased
$27.1 million
, or
2.4%
, to
$1.136 billion
for the
year ended December 31, 2015
from
$1.109 billion
for the
year ended December 31, 2014
. The
increase
was a result of a
$16.0 million
increase
in room revenue, a
$7.3 million
increase
in food and beverage revenue, and a
$3.9 million
increase
in other operating department revenue.
Room Revenue
Room revenue
increased
$16.0 million
, or
1.6%
, to
$985.4 million
for the
year ended December 31, 2015
from
$969.4 million
for the
year ended December 31, 2014
. The
increase
was a result of a
$19.5 million
increase in room revenue attributable to the comparable properties, partially offset by a
$3.5 million
decrease in room revenue attributable to the non-comparable properties. The increase in room revenue from the comparable properties was attributable to a
2.4%
increase
in RevPAR, led by RevPAR increases in our
Northern California
and
South Florida
markets of
13.7%
and
13.1%
, respectively, which were partially offset by RevPAR decreases in our
Houston
and
New York City
markets of
10.0%
and
2.5%
, respectively.
46
The following are the key hotel operating statistics for the comparable properties owned at
December 31, 2015
and
2014
, respectively:
|
For the year ended December 31,
|
||||||||||
|
2015
|
2014
|
% Change
|
||||||||
|
Number of comparable properties (at end of period)
|
105
|
|
105
|
|
—
|
|
||||
|
Occupancy
|
78.1
|
%
|
79.6
|
%
|
(1.9
|
)%
|
||||
|
ADR
|
$
|
163.01
|
|
$
|
156.16
|
|
4.4
|
%
|
||
|
RevPAR
|
$
|
127.33
|
|
$
|
124.31
|
|
2.4
|
%
|
||
Food and Beverage Revenue
Food and beverage revenue
increased
$7.3 million
, or
6.8%
, to
$114.8 million
for the
year ended December 31, 2015
from
$107.5 million
for the
year ended December 31, 2014
. The
increase
was a result of a
$7.5 million
increase in food and beverage revenue attributable to the comparable properties, partially offset by a
$0.2 million
decrease in food and beverage revenue attributable to the non-comparable properties.
Other Operating Department Revenue
Other operating department revenue, which includes revenue derived from ancillary sources such as parking fees, gift shop sales and other guest service fees,
increased
$3.9 million
, or
12.1%
, to
$36.2 million
for the
year ended December 31, 2015
from
$32.3 million
for the
year ended December 31, 2014
. The
increase
was due to a
$3.0 million
increase in other operating department revenue attributable to the non-comparable properties and a
$0.9 million
increase in other operating department revenue attributable to the comparable properties.
Property Operating Expense
Property operating expense
increased
$11.3 million
, or
1.7%
, to
$657.6 million
for the
year ended December 31, 2015
from
$646.3 million
for the
year ended December 31, 2014
. The
increase
includes a
$14.1 million
increase in property operating expense attributable to the comparable properties, partially offset by a
$2.8 million
decrease in property operating expense attributable to the non-comparable properties. The increase in property operating expense attributable to the comparable properties was related to higher room expense, food and beverage expense, other operating department costs, and management and franchise fees. Room expense, food and beverage expense, and other operating department costs fluctuate based on various factors, including changes in occupancy, labor costs, utilities and insurance costs. Management fees and franchise fees, which are computed as a percentage of gross revenue and room revenue, respectively, increased as a result of higher revenues.
Depreciation and Amortization
Depreciation and amortization expense
increased
$11.9 million
, or
8.3%
, to
$156.2 million
for the
year ended December 31, 2015
from
$144.3 million
for the
year ended December 31, 2014
. The increase includes an
$8.3 million
increase in depreciation expense as a result of capital expenditures to improve the comparable properties and a
$3.6 million
increase in depreciation and amortization expense attributable to the non-comparable properties.
Impairment
For the year ended December 31, 2015
, we incurred a
$1.0 million
impairment loss on one hotel, as compared to a
$9.2 million
impairment loss on three hotels for the
year ended December 31, 2014
. Each of these impairments was the result of an evaluation of the recoverability of the carrying values given the expectation to sell the hotels before the end of their previously estimated useful lives.
Property Tax, Insurance and Other
Property tax, insurance and other expense
increased
$5.2 million
, or
7.3%
, to
$76.7 million
for the
year ended December 31, 2015
from
$71.4 million
for the
year ended December 31, 2014
. The
increase
includes a
$6.9 million
increase in property tax, insurance and other expense attributable to the comparable properties, partially offset by a
$1.7 million
decrease in property tax, insurance and other expense attributable to the non-comparable properties.
47
General and Administrative
General and administrative expense
decreased
$3.9 million
, or
9.3%
, to
$37.8 million
for the
year ended December 31, 2015
from
$41.7 million
for the
year ended December 31, 2014
. The
decrease
in general and administrative expense is primarily attributable to a decrease in compensation-related expense, including a decrease in salary and bonus expense of
$2.5 million
and a decrease in the amortization of restricted share awards and performance units of
$2.1 million
, partially offset by an increase in other general and administrative costs.
Interest Expense
The components of our interest expense for the years ended December 31,
2015
and
2014
are as follows (in thousands):
|
For the year ended December 31,
|
||||||||||||||
|
2015
|
2014
|
$ Change
|
% Change
|
|||||||||||
|
Mortgage loans
|
$
|
16,500
|
|
$
|
23,282
|
|
$
|
(6,782
|
)
|
(29.1
|
)%
|
|||
|
Term Loans and Revolver
|
35,898
|
|
29,560
|
|
6,338
|
|
21.4
|
%
|
||||||
|
Loss on defeasance
|
—
|
|
804
|
|
(804
|
)
|
(100.0
|
)%
|
||||||
|
Amortization of deferred financing costs
|
4,164
|
|
4,298
|
|
(134
|
)
|
(3.1
|
)%
|
||||||
|
Capitalized interest
|
(1,774
|
)
|
(1,134
|
)
|
(640
|
)
|
56.4
|
%
|
||||||
|
Total interest expense
|
$
|
54,788
|
|
$
|
56,810
|
|
$
|
(2,022
|
)
|
(3.6
|
)%
|
|||
Interest expense
decreased
$2.0 million
, or
3.6%
, to
$54.8 million
for the
year ended December 31, 2015
from
$56.8 million
for the
year ended December 31, 2014
. The decrease in interest expense from the mortgage loans was due to a decrease in the balances outstanding as a result of normal recurring principal payments as well as mortgage loan principal balances that were paid off. The increase in interest expense from the Term Loans and Revolver was due to the new interest rate swaps and additional borrowings on the term loans. The loss on defeasance is related to the costs incurred to extinguish the mortgage loans in conjunction with the disposal of certain hotel properties in 2014. The increase in capitalized interest was due to two major redevelopment projects in 2015, and both projects were completed in the third quarter of 2015.
Income Taxes
We had an income tax benefit of
$39.1 million
for the
year ended December 31, 2015
as compared to an income tax expense of
$1.1 million
for the
year ended December 31, 2014
. The
$40.3 million
decrease
in income taxes primarily resulted from the release of a deferred tax asset valuation allowance of $39.9 million. The effective tax rates were (21.7)% and 0.8% for the
years ended December 31,
2015
and
2014
, respectively. The effective tax rate decreased as a result of the release of the valuation allowance.
Non-GAAP Financial Measures
We consider the following non-GAAP financial measures useful to investors as key supplemental measures of our performance: (1) FFO, (2) Adjusted FFO, (3) EBITDA, and (4) Adjusted EBITDA. These non-GAAP financial measures should be considered along with, but not as alternatives to, net income or loss as a measure of our operating performance. FFO, Adjusted FFO, EBITDA and Adjusted EBITDA, as calculated by us, may not be comparable to FFO, Adjusted FFO, EBITDA and Adjusted EBITDA as reported by other companies that do not define such terms exactly as we define such terms.
48
Funds From Operations
We calculate FFO in accordance with standards established by the National Association of Real Estate Investment Trusts ("NAREIT") which defines FFO as net income or loss (calculated in accordance with GAAP), excluding gains or losses from sales of real estate, impairment, the cumulative effect of changes in accounting principles, plus depreciation and amortization, and adjustments for unconsolidated partnerships and joint ventures. Historical cost accounting for real estate assets implicitly assumes that the value of real estate assets diminishes predictably over time. Since real estate values instead have historically risen or fallen with market conditions, most real estate industry investors consider FFO to be helpful in evaluating a real estate company’s operations. We believe that the presentation of FFO provides useful information to investors regarding our operating performance and can facilitate comparisons of operating performance between periods and between REITs, even though FFO does not represent an amount that accrues directly to common shareholders. Our calculation of FFO may not be comparable to measures calculated by other companies who do not use the NAREIT definition of FFO or do not calculate FFO per diluted share in accordance with NAREIT guidance. Additionally, FFO may not be helpful when comparing us to non-REITs. We present FFO attributable to common shareholders, which includes our OP units, because our OP units may be redeemed for common shares. We believe it is meaningful for the investor to understand FFO attributable to all common shares and OP units.
We further adjust FFO for certain additional items that are not in NAREIT’s definition of FFO, such as hotel transaction and pursuit costs, non-cash income tax expense or benefit, the amortization of share-based compensation, and certain other expenses that we consider outside the normal course of operations. We believe that Adjusted FFO provides useful supplemental information to investors regarding our ongoing operating performance that, when considered with net income and FFO, is beneficial to an investor’s understanding of our operating performance.
The following is a reconciliation of our GAAP net income to FFO attributable to common shareholders and unitholders and Adjusted FFO attributable to common shareholders and unitholders for the
years ended December 31,
2016
,
2015
and
2014
(in thousands):
|
|
For the year ended December 31,
|
||||||||||
|
|
2016
|
2015
|
2014
|
||||||||
|
Net income
|
$
|
201,314
|
|
$
|
219,812
|
|
$
|
136,480
|
|
||
|
Gain on sale of hotel properties
|
(45,929
|
)
|
(28,398
|
)
|
(353
|
)
|
|||||
|
Depreciation and amortization
|
162,500
|
|
156,226
|
|
144,294
|
|
|||||
|
Impairment loss
|
—
|
|
1,003
|
|
9,200
|
|
|||||
|
Noncontrolling interest in consolidated joint venture
|
(55
|
)
|
(77
|
)
|
(171
|
)
|
|||||
|
Adjustments related to consolidated joint venture (1)
|
(152
|
)
|
(170
|
)
|
(186
|
)
|
|||||
|
FFO
|
317,678
|
|
348,396
|
|
289,264
|
|
|||||
|
Non-cash income tax expense (benefit)
|
7,001
|
|
(39,845
|
)
|
—
|
|
|||||
|
Transaction and pursuit costs
|
192
|
|
3,058
|
|
4,850
|
|
|||||
|
Amortization of share-based compensation
|
5,990
|
|
13,002
|
|
15,088
|
|
|||||
|
Loan related costs (2)
|
1,247
|
|
97
|
|
1,073
|
|
|||||
|
Other expense (3)
|
604
|
|
—
|
|
432
|
|
|||||
|
Adjusted FFO
|
$
|
332,712
|
|
$
|
324,708
|
|
$
|
310,707
|
|
||
_______________________________________________________________
|
(1)
|
Includes depreciation and amortization expense allocated to the noncontrolling interest in the joint venture.
|
|
(2)
|
Represents debt modification costs, debt extinguishment costs, and the accelerated amortization of deferred financing costs.
|
|
(3)
|
Represents property-level severance costs and other income and expenses outside of the normal course of operations.
|
49
Earnings Before Interest, Taxes, Depreciation and Amortization
EBITDA is defined as net income or loss excluding: (1) interest expense; (2) provision for income taxes, including income taxes applicable to sales of assets; and (3) depreciation and amortization. We consider EBITDA useful to an investor in evaluating and facilitating comparisons of our operating performance between periods and between REITs by removing the impact of our capital structure (primarily interest expense) and asset base (primarily depreciation and amortization) from our operating results. In addition, EBITDA is used as one measure in determining the value of hotel acquisitions and disposals. We present EBITDA attributable to common shareholders, which includes our OP units, because our OP units may be redeemed for common shares. We believe it is meaningful for the investor to understand EBITDA attributable to all common shares and OP units.
We further adjust EBITDA for certain additional items such as gains or losses on dispositions, hotel transaction and pursuit costs, impairment losses, the amortization of share-based compensation and certain other expenses that we consider outside the normal course of operations. We believe that Adjusted EBITDA provides useful supplemental information to investors regarding our ongoing operating performance that, when considered with net income and EBITDA, is beneficial to an investor’s understanding of our operating performance.
The following is a reconciliation of our GAAP net income to EBITDA attributable to common shareholders and unitholders and Adjusted EBITDA attributable to common shareholders and unitholders for the
years ended December 31,
2016
,
2015
and
2014
(in thousands):
|
|
For the year ended December 31,
|
||||||||||
|
|
2016
|
2015
|
2014
|
||||||||
|
Net income
|
$
|
201,314
|
|
$
|
219,812
|
|
$
|
136,480
|
|
||
|
Depreciation and amortization
|
162,500
|
|
156,226
|
|
144,294
|
|
|||||
|
Interest expense, net (1)
|
58,793
|
|
54,758
|
|
56,144
|
|
|||||
|
Income tax expense (benefit)
|
8,190
|
|
(39,126
|
)
|
1,145
|
|
|||||
|
Noncontrolling interest in consolidated joint venture
|
(55
|
)
|
(77
|
)
|
(171
|
)
|
|||||
|
Adjustments related to consolidated joint venture (2)
|
(152
|
)
|
(170
|
)
|
(186
|
)
|
|||||
|
EBITDA
|
430,590
|
|
391,423
|
|
337,706
|
|
|||||
|
Transaction and pursuit costs
|
192
|
|
3,058
|
|
4,850
|
|
|||||
|
Gain on sale of hotel properties
|
(45,929
|
)
|
(28,398
|
)
|
(353
|
)
|
|||||
|
Impairment loss
|
—
|
|
1,003
|
|
9,200
|
|
|||||
|
Amortization of share-based compensation
|
5,990
|
|
13,002
|
|
15,088
|
|
|||||
|
Loan related costs (3)
|
924
|
|
—
|
|
—
|
|
|||||
|
Other expense (4)
|
604
|
|
—
|
|
432
|
|
|||||
|
Adjusted EBITDA
|
$
|
392,371
|
|
$
|
380,088
|
|
$
|
366,923
|
|
||
_______________________________________________________________________________
|
(1)
|
Excludes amounts attributable to investment in loans of
$1.7 million
,
$1.5 million
and
$1.2 million
for the years ended
December 31, 2016
,
2015
and
2014
, respectively.
|
|
(2)
|
Includes depreciation and amortization expense allocated to the noncontrolling interest in the joint venture.
|
|
(3)
|
Represents debt modification costs and debt extinguishment costs.
|
|
(4)
|
Represents property-level severance costs and other income and expenses outside of the normal course of operations.
|
Liquidity and Capital Resources
Our short-term liquidity requirements consist primarily of funds necessary to pay for operating expenses and other expenditures directly associated with our hotel properties, including:
|
•
|
recurring maintenance and capital expenditures necessary to maintain our hotel properties in accordance with brand standards;
|
|
•
|
interest expense and scheduled principal payments on outstanding indebtedness; and
|
|
•
|
distributions necessary to qualify for taxation as a REIT.
|
50
We expect to meet our short-term liquidity requirements generally through net cash provided by operations, existing cash balances and, if necessary, short-term borrowings under our Revolver, of which
$400.0 million
was available at
December 31, 2016
, or proceeds from public offerings of common shares.
Our long-term liquidity requirements consist primarily of funds necessary to pay for the costs of acquiring additional properties and redevelopments, renovations, expansions and other capital expenditures that need to be made periodically with respect to our hotel properties and scheduled debt payments, at maturity or otherwise. We expect to meet our long-term liquidity requirements through various sources of capital, including our Revolver and future equity (including OP units) or debt offerings, existing working capital, net cash provided by operations, long-term hotel mortgage loans and other secured and unsecured borrowings.
Sources and Uses of Cash
As of
December 31, 2016
, we had
$456.7 million
of cash and cash equivalents as compared to
$134.2 million
at
December 31, 2015
.
Cash flows from Operating Activities
Net cash flow
provided by
operating activities totaled
$331.4 million
,
$328.9 million
, and
$298.8 million
for the
years ended December 31,
2016
,
2015
and
2014
, respectively. Our cash flows provided by operating activities generally consist of the net cash generated by our hotel operations, partially offset by the cash paid for corporate expenses and other working capital changes. Refer to the "Results of Operations" section for further discussion of our operating results for the
years ended December 31,
2016
,
2015
and
2014
.
Cash flows from Investing Activities
Net cash flow
provided by
investing activities totaled
$173.4 million
for the
year ended December 31, 2016
primarily due to
$269.2 million
in proceeds resulting from the sale of four hotel properties. The net cash flow provided by investing activities was partially offset by
$83.8 million
in routine capital improvements and additions to the hotel properties and the net funding of the restricted cash reserves of
$11.8 million
.
Net cash flow used in investing activities totaled $38.1 million for the year ended December 31, 2015 primarily due to $143.8 million used for the purchase of three hotel properties, $124.8 million in routine capital improvements and additions to the hotel properties and $24.5 million related to two major redevelopment projects. The net cash flow used in investing activities was partially offset by $246.4 million of net proceeds from the sale of 23 hotel properties and a net decrease in the restricted cash reserves of $9.1 million.
Net cash flow used in investing activities totaled $611.2 million for the year ended December 31, 2014 primarily due to $631.6 million used for the purchase of 15 hotel properties, $92.3 million in routine capital improvements and additions to the hotel properties, $26.5 million related to three major redevelopment projects and the net funding of the restricted cash reserves of $0.6 million. The net cash flow used in investing activities was partially offset by $7.2 million in purchase deposits applied against hotel property acquisitions and $132.7 million in proceeds resulting from the sale of 18 hotel properties.
Cash flows from Financing Activities
Net cash flow
used in
financing activities totaled
$182.3 million
for the
year ended December 31, 2016
primarily due to
$165.2 million
in distributions to shareholders and unitholders,
$18.8 million
paid to repurchase common shares,
$5.4 million
in deferred financing cost payments and
$3.7 million
in mortgage loans principal payments. The net cash flow used in financing activities was partially offset by
$11.0 million
in additional mortgage loan debt.
Net cash flow used in financing activities totaled $419.1 million for the year ended December 31, 2015 primarily due to $166.6 million in payments of mortgage loans principal, $171.3 million in distributions to shareholders and unitholders, $225.2 million paid to repurchase common shares under a share repurchase program and $12.0 million paid to repurchase common shares. The net cash flow used in financing activities was partially offset by $150.0 million in borrowings on the Term Loans and $7.0 million in additional mortgage loan debt.
Net cash flow provided by financing activities totaled $242.6 million for the year ended December 31, 2014 primarily due to $175.0 million in proceeds from the Term Loans, $232.7 million from the issuance and sale of common shares, $143.0 million in proceeds from the mortgage loans and $292.5 million in borrowings on the Revolver. The net cash flow provided by
51
financing activities was partially offset by $170.7 million in payments of mortgage loans principal, $292.5 million of repayments on the Revolver, $126.0 million in distributions to shareholders and unitholders, $4.1 million in deferred financing cost payments, a $1.2 million distribution related to the joint venture noncontrolling interest and $6.1 million paid to repurchase common shares.
Capital Expenditures and Reserve Funds
We maintain each of our hotel properties in good repair and condition and in conformity with applicable laws and regulations, franchise agreements and management agreements. The cost of all such routine improvements and alterations are paid out of FF&E reserves, which are funded by a portion of each hotel property’s gross revenues. Routine capital expenditures are administered by the property management companies. However, we have approval rights over the capital expenditures as part of the annual budget process for each of our hotel properties.
From time to time, certain of our hotels may undergo renovations as a result of our decision to upgrade portions of the hotels, such as guestrooms, public space, meeting space, and/or restaurants, in order to better compete with other hotels and alternative lodging options in our markets. In addition, upon acquisition of a hotel we often are required to complete a property improvement plan in order to bring the hotel up to the respective franchisor’s standards. If permitted by the terms of the management agreement, funding for a renovation will first come from the FF&E reserves. To the extent that the FF&E reserves are not available or sufficient to cover the cost of the renovation, we will fund all or the remaining portion of the renovation with cash and cash equivalents on hand, our Revolver and/or other sources of available liquidity.
With respect to some of our hotels that are operated under franchise agreements with major national hotel brands and for some of our hotels subject to first mortgage liens, we are obligated to maintain FF&E reserve accounts for future capital expenditures at these hotels. The amount funded into each of these reserve accounts is generally determined pursuant to the management agreements, franchise agreements and/or mortgage loan documents for each of the respective hotels, and typically ranges between
3.0%
and
5.0%
of the respective hotel’s total gross revenue. As of
December 31, 2016
, approximately
$67.0 million
was held in FF&E reserve accounts for future capital expenditures.
Off-Balance Sheet Arrangements
As of
December 31, 2016
, we had no off-balance sheet arrangements.
Contractual Obligations
The following table sets forth our contractual obligations as of
December 31, 2016
(in thousands):
|
Obligations and Commitments
|
2017
|
2018
|
2019
|
2020
|
2021
|
Thereafter
|
Total
|
|||||||||||||||||||||
|
Mortgage loans and interest (1)
|
$
|
168,484
|
|
$
|
149,486
|
|
$
|
4,760
|
|
$
|
4,760
|
|
$
|
87,929
|
|
$
|
30,165
|
|
$
|
445,584
|
|
|||||||
|
Term Loans and Revolver and interest (1)
|
36,862
|
|
36,862
|
|
652,906
|
|
16,920
|
|
409,012
|
|
150,310
|
|
1,302,872
|
|
||||||||||||||
|
Ground rent
|
4,711
|
|
4,713
|
|
4,716
|
|
4,718
|
|
4,721
|
|
415,859
|
|
439,438
|
|
||||||||||||||
|
Operating lease obligations
|
1,055
|
|
1,084
|
|
1,113
|
|
1,144
|
|
1,698
|
|
—
|
|
6,094
|
|
||||||||||||||
|
$
|
211,112
|
|
$
|
192,145
|
|
$
|
663,495
|
|
$
|
27,542
|
|
$
|
503,360
|
|
$
|
596,334
|
|
$
|
2,193,988
|
|
||||||||
_______________________________________________________________________________
|
(1)
|
Amounts include principal and interest payments. The interest payments are based on the interest rate at
December 31, 2016
, giving consideration to the effect of interest rate swaps.
|
Critical Accounting Policies
The preparation of the financial statements in conformity with GAAP requires management to make estimates and assumptions that affect the reported amount of assets and liabilities at the date of our financial statements and the reported amounts of revenues and expenses during the reporting period. We have provided a summary of our significant accounting policies in the notes to the consolidated financial statements included elsewhere in this filing. We have set forth below those accounting policies that we believe require material subjective or complex judgments and have the most significant impact on our financial condition and results of operations. It is possible that the actual amounts may differ significantly from these estimates and assumptions. We evaluate our estimates, assumptions and judgments on an ongoing basis, based on information that is available to us, our business and industry experience, and various other matters that we believe are reasonable and appropriate for consideration under the circumstances.
52
Investment in Hotel Properties
Our acquisitions generally consist of land, land improvements, buildings, building improvements, FF&E and inventory. We may also acquire intangible assets or liabilities related to in-place leases, management agreements and franchise agreements. We allocate the purchase price among the assets acquired and the liabilities assumed based on their respective fair values at the date of acquisition. We determine the fair value by using market data and independent appraisals available to us and making numerous estimates and assumptions. Transaction costs are expensed for acquisitions that are considered business combinations and capitalized for asset acquisitions.
Our investments in hotel properties are carried at cost and are depreciated using the straight-line method over the estimated useful lives of 15 years for land improvements, 15 years for building improvements, 40 years for buildings and three to five years for FF&E. Intangible assets and liabilities arising from the acquisitions are amortized using the straight-line method over the non-cancelable portion of the term of the agreement. Maintenance and repairs are expensed and major renewals or improvements to the hotel properties are capitalized. Interest used to finance the real estate under development is capitalized as an additional cost of development. Upon the sale or disposition of a hotel property, the asset and related accumulated depreciation accounts are removed and the related gain or loss is included in the gain or loss on sale of hotel properties in the consolidated statements of operations. A sale or disposition of a hotel property that represents a strategic shift that has or will have a major effect on our operations and financial results is presented as discontinued operations in the consolidated statements of operations.
In accordance with the guidance on impairment or disposal of long-lived assets, we do not consider "held for sale" classification on the consolidated balance sheet until it is probable that the sale will be completed within one year and the other requisite criteria for such classification have been met. We do not depreciate hotel properties so long as they are classified as held for sale. Upon designation as held for sale and quarterly thereafter, we review the realizability of the carrying value, less costs to sell, in accordance with the guidance. Any such adjustment to the carrying value is recorded as an impairment loss.
We assess the carrying value whenever events or changes in circumstances indicate that the carrying amounts may not be recoverable. The recoverability is measured by comparing the carrying amount to the estimated future undiscounted cash flows which take into account current market conditions and our intent with respect to holding or disposing of the hotel properties. If our analysis indicates that the carrying value is not recoverable on an undiscounted cash flow basis, we will recognize an impairment loss for the amount by which the carrying value exceeds the fair value. The fair value is determined through various valuation techniques, including internally developed discounted cash flow models, comparable market transactions or third-party appraisals.
The use of projected future cash flows is based on assumptions that are consistent with a market participant’s future expectations for the travel industry and the economy in general and our expected use of the underlying hotel properties. The assumptions and estimates related to the future cash flows and the capitalization rates are complex and subjective in nature. Changes in economic and operating conditions that occur subsequent to a current impairment analysis and our ultimate use of the hotel property could impact the assumptions and result in future impairment losses to the hotel properties.
Revenue Recognition
Our revenue consists of room revenue, food and beverage revenue, and revenue from other hotel operating departments (such as parking fees, gift shop sales and other guest service fees). These revenues are recorded net of any sales and occupancy taxes collected from the hotel guests. All rebates or discounts are recorded as a reduction to revenue, and there are no material contingent obligations with respect to rebates and discounts offered by the hotels. All revenues are recorded on an accrual basis as they are earned. An allowance for doubtful accounts is our best estimate of the amount of probable credit losses in the existing accounts receivable portfolio and it is recorded as a bad debt expense. The allowance for doubtful accounts is calculated as a percentage of the aged accounts receivable. Any cash received prior to a guest's arrival is recorded as an advance deposit from the guest and recognized as revenue at the time of the guest's occupancy at the hotel property.
Income Taxes
We have elected to be taxed as a REIT under Sections 856 through 860 of the Internal Revenue Code, as amended, commencing with the taxable year ended December 31, 2011. To qualify as a REIT, we must meet a number of organizational and operational requirements, including a requirement that we distribute at least 90% of our REIT taxable income, subject to certain adjustments and excluding any net capital gain, to shareholders. It is our current intention to adhere to the REIT qualification requirements and to maintain our qualification for taxation as a REIT.
53
As a REIT, we generally are not subject to federal corporate income tax on the portion of taxable income that is distributed to shareholders. If we fail to qualify for taxation as a REIT in any taxable year, we will be subject to federal income taxes at regular corporate rates (including any applicable alternative minimum tax) and we may not be able to qualify as a REIT for four subsequent taxable years. Even if we qualify for taxation as a REIT, we may be subject to certain state and local taxes on our income and property, and to federal income and excise taxes on undistributed taxable income. Taxable income from non-REIT activities managed through our taxable REIT subsidiaries is subject to federal, state and local income taxes.
Income taxes are recorded using the asset and liability method. Under this method, deferred tax assets and liabilities are recognized for the estimated future tax consequences attributable to the differences between the financial statement carrying amounts of existing assets and liabilities and their respective income tax bases, and for net operating loss, capital loss and tax credit carryforwards. The deferred tax assets and liabilities are measured using the enacted income tax rates in effect for the year in which those temporary differences are expected to be realized or settled. The effect on the deferred tax assets and liabilities from a change in tax rates is recognized in earnings in the period when the new rate is enacted. However, deferred tax assets are recognized only to the extent that it is more likely than not that they will be realized based on consideration of all available evidence, including the future reversals of existing taxable temporary differences, future projected taxable income and tax planning strategies. Valuation allowances are provided if, based upon the weight of the available evidence, it is more likely than not that some or all of the deferred tax assets will not be realized.
We perform an annual review for any uncertain tax positions and, if necessary, we will record the expected future tax consequences of uncertain tax positions in the consolidated financial statements.
Share-Based Compensation
From time to time, we may issue share-based awards under the 2015 Plan as compensation to officers, employees and non-employee trustees. The vesting of the awards issued to the officers and employees is based on either the continued employment (time-based) or the relative total shareholder returns of the Company and continued employment (performance-based), as determined by the board of trustees at the date of grant. For time-based awards, we recognize compensation expense for the unvested restricted shares on a straight-line basis over the vesting period based upon the fair market value of the shares on the date of grant, adjusted for forfeitures. For performance-based awards, we recognize compensation expense over the requisite service period for each award, based on the fair market value of the shares on the date of grant, as determined using a Monte Carlo simulation, adjusted for forfeitures.
Market risk includes the risks that arise from changes in interest rates, equity prices and other market changes that affect market sensitive instruments. Our primary market risk exposure is to changes in interest rates on our variable rate debt. As of
December 31, 2016
, we had approximately
$1.6 billion
of total variable rate debt outstanding (or
97.9%
of total indebtedness) with a weighted-average interest rate of
3.29%
per annum. After taking into consideration the effect of interest rate swaps,
$142.0 million
(or
8.9%
of total indebtedness) was subject to variable rates. If market interest rates on our variable rate debt outstanding as of
December 31, 2016
were to increase by 1.00%, or 100 basis points, interest expense would decrease future earnings and cash flows by approximately
$1.4 million
annually, taking into account our existing contractual hedging arrangements.
Our interest rate risk objectives are to limit the impact of interest rate fluctuations on earnings and cash flows and to lower our overall borrowing costs. To achieve these objectives, we manage our exposure to fluctuations in market interest rates through the use of fixed rate debt instruments to the extent that reasonably favorable rates are obtainable. We have entered into derivative financial instruments such as interest rate swaps to mitigate our interest rate risk or to effectively lock the interest rate on a portion of our variable rate debt. We do not enter into derivative or interest rate transactions for speculative purposes.
54
The following table provides information about our financial instruments that are sensitive to changes in interest rates. For debt obligations outstanding as of
December 31, 2016
, the following table presents the principal repayments and related weighted-average interest rates by contractual maturity dates (in thousands):
|
|
2017
|
2018
|
2019
|
2020
|
2021
|
Thereafter
|
Total
|
||||||||||||||||||||
|
Fixed rate debt (1)(2)
|
$
|
548
|
|
$
|
626
|
|
$
|
660
|
|
$
|
691
|
|
$
|
734
|
|
$
|
29,389
|
|
$
|
32,648
|
|
||||||
|
Weighted-average interest rate
|
5.25
|
%
|
5.25
|
%
|
5.25
|
%
|
5.25
|
%
|
5.25
|
%
|
5.25
|
%
|
5.25
|
%
|
|||||||||||||
|
Variable rate debt (2)
|
153,000
|
|
143,250
|
|
625,000
|
|
—
|
|
485,000
|
|
150,000
|
|
1,556,250
|
|
|||||||||||||
|
Weighted-average interest rate (3)
|
4.01
|
%
|
4.04
|
%
|
3.19
|
%
|
—
|
%
|
2.93
|
%
|
3.43
|
%
|
3.29
|
%
|
|||||||||||||
|
Total
|
$
|
153,548
|
|
$
|
143,876
|
|
$
|
625,660
|
|
$
|
691
|
|
$
|
485,734
|
|
$
|
179,389
|
|
$
|
1,588,898
|
|
||||||
_______________________________________________________________________________
|
(1)
|
Excludes
$1.0 million
related to a fair value adjustment on mortgage debt assumed in conjunction with an acquisition.
|
|
(2)
|
Excludes
$5.7 million
and
$1.5 million
of net deferred financing costs on the Term Loans and mortgage loans, respectively.
|
|
(3)
|
The weighted-average interest rate gives effect to interest rate swaps, as applicable.
|
Our ultimate realized gain or loss with respect to interest rate fluctuations will depend on the exposures that arise during future periods, prevailing interest rates, and our hedging strategies at that time.
Changes in market interest rates on our fixed rate debt impact the fair value of our debt, but such changes have no impact to our consolidated financial statements. As of
December 31, 2016
, the estimated fair value of our fixed rate debt was
$32.7 million
, which is based on having the same debt service requirements that could have been borrowed at the date presented, at prevailing current market interest rates. If interest rates were to rise by 1.00%, or 100 basis points, and our fixed rate debt balance remains constant, we expect the fair value of our debt to decrease by approximately
$1.5 million
.
See Index to the Financial Statements on page F-1.
None.
55
Item 9A.
Controls and Procedures
Evaluation of Disclosure Controls and Procedures
The Company's management has evaluated, under the supervision and with the participation of the Company's Chief Executive Officer and Chief Financial Officer, the effectiveness of the disclosure controls and procedures (as defined in Rules 13a-15(e) and 15d-15(e) under the Securities Exchange Act of 1934, as amended, or the Exchange Act), as required by paragraph (b) of Rules 13a-15 and 15d-15 of the Exchange Act. Based on this evaluation, the Company's Chief Executive Officer and Chief Financial Officer have concluded that as of
December 31, 2016
, the Company's disclosure controls and procedures were effective to ensure that information we are required to disclose in reports filed or submitted with the Securities and Exchange Commission (i) is recorded, processed, summarized and reported within the time periods specified in the Securities and Exchange Commission's rules and forms, and (ii) is accumulated and communicated to our management, including our Chief Executive Officer and Chief Financial Officer, as appropriate to allow timely decisions regarding disclosure.
Management's Annual Report on Internal Control over Financial Reporting
The Company's management is responsible for establishing and maintaining adequate internal control over financial reporting (as defined in Rule 13a-15(f) and 15d-15(f) of the Exchange Act). The Company's internal control over financial reporting is a process designed to provide reasonable assurance regarding the reliability of financial reporting and the preparation of financial statements for external purposes in accordance with accounting principles generally accepted in the United States of America.
Because of its inherent limitations, internal control over financial reporting may not prevent or detect misstatements. Also, projections of any evaluations of effectiveness to future periods are subject to the risk that controls may become inadequate because of changes in conditions, or that the degree of compliance with the policies or procedures may deteriorate.
The Company's management assessed the effectiveness of its internal control over financial reporting as of
December 31, 2016
. In making this assessment, management used the criteria set forth by the Committee of Sponsoring Organizations of the Treadway Commission ("COSO") in
Internal Control - Integrated Framework (2013)
. Based on this assessment, management has concluded that, as of
December 31, 2016
, our internal control over financial reporting is effective based on those criteria.
The effectiveness of the Company's internal control over financial reporting as of
December 31, 2016
has been audited by PricewaterhouseCoopers LLP, an independent registered public accounting firm, as stated in their report which appears on page F-2 of this Annual Report on Form 10-K.
Changes in Internal Control over Financial Reporting
There have been no changes in the Company’s internal control over financial reporting (as defined in Rule 13a-15 and 15d-15 of the Exchange Act) during the period ended
December 31, 2016
that have materially affected, or are reasonably likely to materially affect, the Company’s internal control over financial reporting.
Item 9B.
Other information
None.
56
The information called for by this Item is contained in our definitive Proxy Statement for our
2017
Annual Meeting of Shareholders, and is incorporated herein by reference.
The information called for by this Item is contained in our definitive Proxy Statement for our
2017
Annual Meeting of Shareholders, and is incorporated herein by reference.
The information called for by this Item is contained in our definitive Proxy Statement for our
2017
Annual Meeting of Shareholders, or in Item 5 of this Annual Report on Form 10-K for the year ended
December 31, 2016
, and is incorporated herein by reference.
The information called for by this Item is contained in our definitive Proxy Statement for our
2017
Annual Meeting of Shareholders, and is incorporated herein by reference.
The information called for by this Item is contained in our definitive Proxy Statement for our
2017
Annual Meeting of Shareholders, and is incorporated herein by reference.
The following is a list of documents filed as a part of this report:
(1) Financial Statements — See Index to the Financial Statements on page F-1
(2) Financial Statement Schedules — The following financial statement schedule is included herein on pages F-35 through F-40:
Schedule III — Real Estate and Accumulated Depreciation for RLJ Lodging Trust
All other schedules for which a provision is made in Regulation S-X are either not required to be included herein under the related instructions, are inapplicable, or the related information is included in the footnotes to the applicable financial statement and, therefore, have been omitted.
(3) Exhibits — The exhibits required to be filed by Item 601 of Regulation S-K are listed in the Exhibit Index on pages 59 to 61 of this report, which is incorporated by reference herein.
Not applicable.
57
SIGNATURES
Pursuant to the requirements of Section 13 or 15(d) of the Securities Exchange Act of 1934, as amended, the registrant has duly caused this report to be signed on its behalf by the undersigned, thereunto duly authorized on
February 23, 2017
.
|
|
RLJ LODGING TRUST
|
||
|
|
By:
|
/s/ ROSS H. BIERKAN
|
|
|
Ross H. Bierkan
President, Chief Executive Officer, Chief Investment Officer and Trustee |
|||
Pursuant to the requirements of the Securities Exchange Act of 1934, this report has been signed below by the following persons on behalf of the registrant and in the capacities and on the dates indicated.
|
Signature
|
Title
|
Date
|
||
|
/s/ ROBERT L. JOHNSON
|
Executive Chairman and Trustee
|
February 23, 2017
|
||
|
Robert L. Johnson
|
||||
|
/s/ ROSS H. BIERKAN
|
President, Chief Executive Officer, Chief Investment Officer and Trustee (Principal Executive Officer)
|
February 23, 2017
|
||
|
Ross H. Bierkan
|
||||
|
/s/ LESLIE D. HALE
|
Chief Operating Officer, Chief Financial Officer and Executive Vice President (Principal Financial Officer)
|
February 23, 2017
|
||
|
Leslie D. Hale
|
||||
|
/s/ CHRISTOPHER A. GORMSEN
|
Chief Accounting Officer
(Principal Accounting Officer)
|
February 23, 2017
|
||
|
Christopher A. Gormsen
|
||||
|
/s/ EVAN BAYH
|
Trustee
|
February 23, 2017
|
||
|
Evan Bayh
|
||||
|
/s/ ARTHUR R. COLLINS
|
Trustee
|
February 23, 2017
|
||
|
Arthur R. Collins
|
||||
|
/s/ NATHANIEL A. DAVIS
|
Trustee
|
February 23, 2017
|
||
|
Nathaniel A. Davis
|
||||
|
/s/ ROBERT M. LA FORGIA
|
Trustee
|
February 23, 2017
|
||
|
Robert M. La Forgia
|
||||
|
/s/ GLENDA G. MCNEAL
|
Trustee
|
February 23, 2017
|
||
|
Glenda G. McNeal
|
||||
58
Exhibit Index
|
Exhibit
Number
|
Description of Exhibit
|
||
|
3.1
|
Articles of Amendment and Restatement of Declaration of Trust of RLJ Lodging Trust (incorporated by reference to Exhibit 3.1 to Amendment No. 4 to the Registrant’s Registration Statement on Form S-11 (File No. 333-172011) filed on May 5, 2011)
|
||
|
3.2
|
Articles of Amendment to Articles of Amendment and Restatement of Declaration of Trust of RLJ Lodging Trust (incorporated by reference to Exhibit 3.1 to the Registrant's Current Report on Form 8-K filed on May 7, 2015)
|
||
|
3.3
|
Articles of Amendment to Articles of Amendment and Restatement of Declaration of Trust of RLJ Lodging Trust (incorporated by reference to Exhibit 3.1 to the Registrant's Current Report on Form 8-K filed on May 5, 2016)
|
||
|
3.4
|
Articles Supplementary to Articles of Amendment and Restatement of Declaration of Trust (incorporated by reference to Exhibit 3.1 to the Registrant's Current Report on Form 8-K filed on February 26, 2015)
|
||
|
3.5
|
Third Amended and Restated Bylaws of RLJ Lodging Trust (incorporated by reference to Exhibit 3.2 to the Registrant's Current Report on Form 8-K filed on May 5, 2016)
|
||
|
4.1
|
Form of Specimen Common Share Certificate (incorporated by reference to Exhibit 4.1 to the Registrant’s Registration Statement on Form S-11/A (File. No. 333-172011) filed on April 29, 2011)
|
||
|
4.2
|
Registration Rights Agreement, dated May 16, 2011, by and among RLJ Lodging Trust and the persons listed on Schedule I thereto (incorporated by reference to Exhibit 10.2 to the Registrant’s Current Report on Form 8-K filed on May 19, 2011)
|
||
|
4.3
|
Registration Rights Agreement, dated May 16, 2011, by and among RLJ Lodging Trust and the persons listed on Schedule I thereto (incorporated by reference to Exhibit 10.3 to the Registrant’s Current Report on Form 8-K filed on May 19, 2011)
|
||
|
10.1
|
Amended and Restated Agreement of Limited Partnership, dated May 13, 2011 (incorporated by reference to Exhibit 10.1 to the Registrant’s Current Report on Form 8-K filed on May 19, 2011)
|
||
|
10.2
|
Indemnification Agreement, dated May 16, 2011, between RLJ Lodging Trust and Thomas J. Baltimore, Jr. (incorporated by reference to Exhibit 10.4 to the Registrant’s Current Report on Form 8-K filed on May 19, 2011)
|
||
|
10.3
|
Indemnification Agreement, dated May 16, 2011, between RLJ Lodging Trust and Evan Bayh (incorporated by reference to Exhibit 10.5 to the Registrant’s Current Report on Form 8-K filed on May 19, 2011)
|
||
|
10.4
|
Indemnification Agreement, dated May 16, 2011, between RLJ Lodging Trust and Ross H. Bierkan (incorporated by reference to Exhibit 10.6 to the Registrant’s Current Report on Form 8-K filed on May 19, 2011)
|
||
|
10.5
|
Indemnification Agreement, dated May 16, 2011, between RLJ Lodging Trust and Nathaniel Davis (incorporated by reference to Exhibit 10.7 to the Registrant’s Current Report on Form 8-K filed on May 19, 2011)
|
||
|
10.6
|
Indemnification Agreement, dated May 16, 2011, between RLJ Lodging Trust and Leslie D. Hale (incorporated by reference to Exhibit 10.8 to the Registrant’s Current Report on Form 8-K filed on May 19, 2011)
|
||
|
10.7
|
Indemnification Agreement, dated May 16, 2011, between RLJ Lodging Trust and Robert L. Johnson (incorporated by reference to Exhibit 10.9 to the Registrant’s Current Report on Form 8-K filed on May 19, 2011)
|
||
|
10.8
|
Indemnification Agreement, dated May 16, 2011, between RLJ Lodging Trust and Robert M. La Forgia (incorporated by reference to Exhibit 10.10 to the Registrant’s Current Report on Form 8-K filed on May 19, 2011)
|
||
|
10.9
|
Indemnification Agreement, dated May 16, 2011, between RLJ Lodging Trust and Glenda McNeal (incorporated by reference to Exhibit 10.11 to the Registrant’s Current Report on Form 8-K filed on May 19, 2011)
|
||
|
10.10
|
Indemnification Agreement, dated May 16, 2011, between RLJ Lodging Trust and Joseph Ryan (incorporated by reference to Exhibit 10.13 to the Registrant’s Current Report on Form 8-K filed on May 19, 2011)
|
||
|
10.11
|
RLJ Lodging Trust 2015 Equity Incentive Plan (incorporated by reference to Exhibit 10.1 to the Registrant's Registration Statement on Form S-8 (File No. 333-203947) filed on May 7, 2015)
|
||
|
10.12
|
Form of Restricted Share Agreement (incorporated by reference to Exhibit 10.3 to the Registrant’s Registration Statement on Form S-11/A (File. No. 333-172011) filed on May 5, 2011)
|
||
|
10.13
|
Form of Restricted Share Agreement for Trustees (incorporated by reference to Exhibit 10.4 to the Registrant’s Registration Statement on Form S-11/A (File. No. 333-172011) filed on May 5, 2011)
|
||
59
|
10.14
|
Form of Non-Qualified Option Agreement (incorporated by reference to Exhibit 10.5 to the Registrant’s Registration Statement on Form S-11/A (File. No. 333-172011) filed on April 13, 2011)
|
||
|
10.15
|
Form of Share Units Agreement (incorporated by reference to Exhibit 10.6 to the Registrant’s Registration Statement on Form S-11/A (File. No. 333-172011) filed on April 13, 2011)
|
||
|
10.16
|
Employment Agreement, dated as of May 14, 2015, by and among RLJ Lodging Trust, RLJ Lodging Trust, L.P. and Robert L. Johnson (incorporated by reference to Exhibit 10.3 to the Registrant's Current Report on Form 8-K filed on May 20, 2015)
|
||
|
10.17
|
Employment Agreement, dated as of August 22, 2016, by and among RLJ Lodging Trust, RLJ Lodging Trust, L.P. and Ross H. Bierkan (incorporated by reference to Exhibit 10.1 to the Registrant's Current Report on Form 8-K filed on August 26, 2016)
|
||
|
10.18
|
Employment Agreement, dated as of August 22, 2016, by and among RLJ Lodging Trust, RLJ Lodging Trust, L.P. and Leslie D. Hale (incorporated by reference to Exhibit 10.2 to the Registrant's Current Report on Form 8-K filed on August 26, 2016)
|
||
|
10.19
|
Letter Agreement, dated as of April 25, 2016, by and among RLJ Lodging Trust, RLJ Lodging Trust, L.P. and Thomas J. Baltimore, Jr. (incorporated by reference to Exhibit 10.1 to the Registrant's Current Report on Form 8-K filed on April 27, 2016)
|
||
|
10.20
|
Second Amended and Restated Credit Agreement, dated as of April 22, 2016, by and among RLJ Lodging Trust L.P., RLJ Lodging Trust, Wells Fargo Bank National Association, as Administrative Agent and a lender, and the other agents and lenders party thereto (incorporated by reference to Exhibit 10.1 to the Registrant's Current Report on Form 8-K filed on April 28, 2016)
|
||
|
10.21
|
Second Amended and Restated Guaranty, dated as of April 22, 2016, by and among RLJ Lodging Trust, certain subsidiaries of RLJ Lodging Trust party thereto and Wells Fargo Bank National Association, as Administrative Agent (incorporated by reference to Exhibit 10.2 to the Registrant's Current Report on Form 8-K filed on April 28, 2016)
|
||
|
10.22
|
Form of WLS Management Agreement (incorporated by reference to Exhibit 10.14 to the Registrant’s Registration Statement on Form S-11/A (File. No. 333-172011) filed on April 13, 2011)
|
||
|
10.23
|
Term Loan Agreement, dated as of November 20, 2012, by and among RLJ Lodging Trust, L.P., RLJ Lodging Trust, Wells Fargo Bank, National Association, as Administrative Agent, PNC Bank, National Association, as Syndication Agent, Capital One, N.A., as Documentation Agent, Raymond James, as Managing Agent, Wells Fargo Securities LLC and PNC Capital Markets LLC, as Joint Lead Arrangers and Joint Bookrunners and the lenders party thereto (incorporated by reference to Exhibit 10.1 to the Registrant’s Current Report on Form 8-K filed on September 3, 2013)
|
||
|
10.24
|
First Amendment to Term Loan Agreement, dated as of August 27, 2013, by and among RLJ Lodging Trust, L.P., RLJ Lodging Trust, Wells Fargo Bank, National Association, as Administrative Agent, PNC Bank, National Association, as Syndication Agent, and the lenders party thereto (incorporated by reference to Exhibit 10.2 to the Registrant’s Current Report on Form 8-K filed on September 3, 2013)
|
||
|
10.25
|
Second Amendment to Term Loan Agreement, dated as of June 1, 2015, by and between RLJ Lodging Trust, L.P., RLJ Lodging Trust and Wells Fargo Bank, National Association, as Administrative Agent, and the lenders party thereto (incorporated by reference to Exhibit 10.28 to the Registrant's Annual Report on Form 10-K filed on February 25, 2016)
|
||
|
10.26
|
Third Amendment to Term Loan Agreement, dated as of November 12, 2015, by and between RLJ Lodging Trust, L.P., RLJ Lodging Trust and Wells Fargo Bank, National Association, as Administrative Agent, and the lenders party thereto (incorporated by reference to Exhibit 10.29 to the Registrant's Annual Report on Form 10-K filed on February 25, 2016)
|
||
|
10.27
|
Fourth Amendment to Term Loan Agreement and First Amendment to Guaranty, dated as of April 22, 2016, by and among RLJ Lodging Trust, L.P., RLJ Lodging Trust, certain subsidiaries of RLJ Lodging Trust party thereto, Wells Fargo Bank National Association, as Administrative Agent and a lender, and the other lenders party thereto (incorporated by reference to Exhibit 10.3 to the Registrant's Current Report on Form 8-K filed on April 28, 2016)
|
||
|
10.28
|
Additional Lender Supplement, dated as of August 27, 2013, by and among RLJ Lodging Trust, L.P., RLJ Lodging Trust, Wells Fargo Bank, National Association, as Administrative Agent, and the lenders party thereto (incorporated by reference to Exhibit 10.3 to the Registrant’s Current Report on Form 8-K filed on September 3, 2013)
|
||
|
10.29
|
Guaranty, dated as of November 20, 2012, by RLJ Lodging Trust and certain subsidiaries of RLJ Lodging Trust party thereto (incorporated by reference to Exhibit 10.4 to the Registrant’s Current Report on Form 8-K filed on September 3, 2013)
|
||
60
|
10.30
|
Term Loan Agreement, dated as of August 27, 2013, by and among RLJ Lodging Trust, L.P., RLJ Lodging Trust, Wells Fargo Bank, National Association, as Administrative Agent, PNC Bank, National Association, as Syndication Agent, Bank of America, N.A., Barclays Bank PLC, Compass Bank, an Alabama Banking Corporation, and U.S. Bank National Association, as Documentation Agents, and Wells Fargo Securities LLC and PNC Capital Markets LLC, as Joint Lead Arrangers and Joint Bookrunners and the lenders party thereto (incorporated by reference to Exhibit 10.5 to the Registrant’s Current Report on Form 8-K filed on September 3, 2013)
|
||
|
10.31
|
Guaranty, dated as of August 27, 2013, by RLJ Lodging Trust and certain subsidiaries of RLJ Lodging Trust party thereto (incorporated by reference to Exhibit 10.6 to the Registrant’s Current Report on Form 8-K filed on September 3, 2013)
|
||
|
10.32
|
First Amendment to Term Loan Agreement, dated as of June 1, 2015, by and between RLJ Lodging Trust, L.P., RLJ Lodging Trust and Wells Fargo Bank, National Association, as Administrative Agent, and the lenders party thereto (incorporated by reference to Exhibit 10.34 to the Registrant's Annual Report on Form 10-K filed on February 25, 2016)
|
||
|
10.33
|
Second Amendment to Term Loan Agreement, dated as of November 12, 2015, by and between RLJ Lodging Trust, L.P., RLJ Lodging Trust and Wells Fargo Bank, National Association, as Administrative Agent, and the lenders party thereto (incorporated by reference to Exhibit 10.35 to the Registrant's Annual Report on Form 10-K filed on February 25, 2016)
|
||
|
10.34
|
Additional Term Loan Lender Supplement, dated as of March 20, 2014, by and among RLJ Lodging Trust, L.P., RLJ Lodging Trust, Wells Fargo Bank, National Association, as Administrative Agent, and the lenders party thereto (incorporated by reference to Exhibit 10.2 to the Registrant’s Current Report on Form 8-K filed on March 20, 2014)
|
||
|
10.35
|
Additional Lender Supplement, dated as of March 20, 2014, by and among RLJ Lodging Trust, L.P., RLJ Lodging Trust, Wells Fargo Bank, National Association, as Administrative Agent, and the lenders party thereto (incorporated by reference to Exhibit 10.3 to the Registrant’s Current Report on Form 8-K filed on March 20, 2014)
|
||
|
21.1*
|
List of subsidiaries of RLJ Lodging Trust
|
||
|
23.1*
|
Consent of PricewaterhouseCoopers LLP
|
||
|
31.1*
|
Certification of Chief Executive Officer pursuant to Rule 13a-14(a)/15d-14(a) of the Securities Exchange Act of 1934, as amended, as adopted pursuant to Section 302 of the Sarbanes-Oxley Act of 2002
|
||
|
31.2*
|
Certification of Chief Financial Officer pursuant to Rule 13a-14(a)/15d-14(a) of the Securities Exchange Act of 1934, as amended, as adopted pursuant to Section 302 of the Sarbanes-Oxley Act of 2002
|
||
|
32.1*
|
Certification of Chief Executive Officer and Chief Financial Officer pursuant to 18 U.S.C. 1350, as adopted pursuant to Section 906 of the Sarbanes-Oxley Act of 2002
|
||
|
101.INS
|
XBRL Instance Document
|
Submitted electronically with this report
|
|
|
101.SCH
|
XBRL Taxonomy Extension Schema Document
|
Submitted electronically with this report
|
|
|
101.CAL
|
XBRL Taxonomy Calculation Linkbase Document
|
Submitted electronically with this report
|
|
|
101.DEF
|
XBRL Taxonomy Extension Definition Linkbase Document
|
Submitted electronically with this report
|
|
|
101.LAB
|
XBRL Taxonomy Label Linkbase Document
|
Submitted electronically with this report
|
|
|
101.PRE
|
XBRL Taxonomy Presentation Linkbase Document
|
Submitted electronically with this report
|
|
_______________________________________________________________________________
*Filed herewith
61
Item 8.
Financial Statements.
INDEX TO FINANCIAL STATEMENTS
|
|
|
|
RLJ Lodging Trust:
|
|
|
Consolidated Financial Statements
|
|
F-1
REPORT OF INDEPENDENT REGISTERED PUBLIC ACCOUNTING FIRM
To the Board of Trustees and Shareholders of RLJ Lodging Trust:
In our opinion, the consolidated
financial statements listed in the accompanying index present fairly, in all material respects, the financial position of RLJ Lodging Trust
and its subsidiaries
at December 31, 2016 and 2015, and the results of their operations and their cash flows for each of the three years in the period ended December 31, 2016
in conformity with accounting principles generally accepted in the United States of America. In addition, in our opinion, the financial statement schedule listed in the accompanying index
presents fairly, in all material respects, the information set forth therein when read in conjunction with the related consolidated
financial statements. Also in our opinion, the Company maintained, in all material respects, effective internal control over financial reporting as of December 31, 2016, based on criteria established in
Internal Control - Integrated Framework (2013)
issued by the Committee of Sponsoring Organizations of the Treadway Commission (COSO). The Company's management is responsible for these financial statements and financial statement schedule, for maintaining effective internal control over financial reporting and for its assessment of the effectiveness of internal control over financial reporting, included in Management's Report on Internal Control over Financial Reporting. Our responsibility is to express opinions on these financial statements, on the financial statement schedule, and on the Company's internal control over financial reporting based on our integrated audits. We conducted our audits in accordance with the standards of the Public Company Accounting Oversight Board (United States). Those standards require that we plan and perform the audits to obtain reasonable assurance about whether the financial statements are free of material misstatement and whether effective internal control over financial reporting was maintained in all material respects. Our audits of the financial statements included examining, on a test basis, evidence supporting the amounts and disclosures in the financial statements, assessing the accounting principles used and significant estimates made by management, and evaluating the overall financial statement presentation. Our audit of internal control over financial reporting included obtaining an understanding of internal control over financial reporting, assessing the risk that a material weakness exists, and testing and evaluating the design and operating effectiveness of internal control based on the assessed risk. Our audits also included performing such other procedures as we considered necessary in the circumstances. We believe that our audits provide a reasonable basis for our opinions.
A company’s internal control over financial reporting is a process designed to provide reasonable assurance regarding the reliability of financial reporting and the preparation of financial statements for external purposes in accordance with generally accepted accounting principles. A company’s internal control over financial reporting includes those policies and procedures that (i) pertain to the maintenance of records that, in reasonable detail, accurately and fairly reflect the transactions and dispositions of the assets of the company; (ii) provide reasonable assurance that transactions are recorded as necessary to permit preparation of financial statements in accordance with generally accepted accounting principles, and that receipts and expenditures of the company are being made only in accordance with authorizations of management and directors of the company; and (iii) provide reasonable assurance regarding prevention or timely detection of unauthorized acquisition, use, or disposition of the company’s assets that could have a material effect on the financial statements.
Because of its inherent limitations, internal control over financial reporting may not prevent or detect misstatements. Also, projections of any evaluation of effectiveness to future periods are subject to the risk that controls may become inadequate because of changes in conditions, or that the degree of compliance with the policies or procedures may deteriorate.
/s/ PricewaterhouseCoopers LLP
McLean, Virginia
February 23, 2017
F-2
RLJ Lodging Trust
(Amounts in thousands, except share and per share data)
|
December 31,
|
|||||||
|
2016
|
2015
|
||||||
|
Assets
|
|
|
|
|
|||
|
Investment in hotel properties, net
|
$
|
3,368,674
|
|
$
|
3,674,999
|
|
|
|
Cash and cash equivalents
|
456,672
|
|
134,192
|
|
|||
|
Restricted cash reserves
|
67,206
|
|
55,455
|
|
|||
|
Hotel and other receivables, net of allowance of $182 and $117, respectively
|
26,018
|
|
25,755
|
|
|||
|
Deferred income tax asset
|
44,614
|
|
49,978
|
|
|||
|
Prepaid expense and other assets
|
60,209
|
|
32,563
|
|
|||
|
Total assets
|
$
|
4,023,393
|
|
$
|
3,972,942
|
|
|
|
Liabilities and Equity
|
|
|
|
|
|||
|
Mortgage loans, net
|
$
|
413,407
|
|
$
|
406,049
|
|
|
|
Term Loans and Revolver, net
|
1,169,308
|
|
1,169,437
|
|
|||
|
Accounts payable and other liabilities
|
137,066
|
|
129,192
|
|
|||
|
Deferred income tax liability
|
11,430
|
|
9,801
|
|
|||
|
Advance deposits and deferred revenue
|
11,975
|
|
11,647
|
|
|||
|
Accrued interest
|
3,444
|
|
4,883
|
|
|||
|
Distributions payable
|
41,486
|
|
41,409
|
|
|||
|
Total liabilities
|
1,788,116
|
|
1,772,418
|
|
|||
|
Commitments and Contingencies (Note 9)
|
|
|
|
|
|||
|
Equity
|
|
|
|
|
|||
|
Shareholders’ equity:
|
|
|
|
|
|||
|
Preferred shares of beneficial interest, $0.01 par value, 50,000,000 shares authorized; zero shares issued and outstanding at December 31, 2016 and 2015, respectively
|
—
|
|
—
|
|
|||
|
Common shares of beneficial interest, $0.01 par value, 450,000,000 shares authorized; 124,364,178 and 124,635,675 shares issued and outstanding at December 31, 2016 and 2015, respectively
|
1,244
|
|
1,246
|
|
|||
|
Additional paid-in capital
|
2,187,333
|
|
2,195,732
|
|
|||
|
Accumulated other comprehensive loss
|
(4,902
|
)
|
(16,602
|
)
|
|||
|
Retained earnings
|
38,249
|
|
2,439
|
|
|||
|
Total shareholders’ equity
|
2,221,924
|
|
2,182,815
|
|
|||
|
Noncontrolling interest:
|
|
|
|
|
|||
|
Noncontrolling interest in consolidated joint venture
|
5,973
|
|
6,177
|
|
|||
|
Noncontrolling interest in the Operating Partnership
|
7,380
|
|
11,532
|
|
|||
|
Total noncontrolling interest
|
13,353
|
|
17,709
|
|
|||
|
Total equity
|
2,235,277
|
|
2,200,524
|
|
|||
|
Total liabilities and equity
|
$
|
4,023,393
|
|
$
|
3,972,942
|
|
|
The accompanying notes are an integral part of these consolidated financial statements.
F-3
RLJ Lodging Trust
(Amounts in thousands, except share and per share data)
|
|
For the year ended December 31,
|
||||||||||
|
|
2016
|
2015
|
2014
|
||||||||
|
Revenue
|
|
|
|
|
|
|
|||||
|
Operating revenue
|
|
|
|
|
|
|
|||||
|
Room revenue
|
$
|
1,010,637
|
|
$
|
985,361
|
|
$
|
969,402
|
|
||
|
Food and beverage revenue
|
111,691
|
|
114,818
|
|
107,538
|
|
|||||
|
Other operating department revenue
|
37,667
|
|
36,161
|
|
32,257
|
|
|||||
|
Total revenue
|
$
|
1,159,995
|
|
$
|
1,136,340
|
|
$
|
1,109,197
|
|
||
|
Expense
|
|
|
|
|
|
|
|||||
|
Operating expense
|
|
|
|
|
|
|
|||||
|
Room expense
|
$
|
228,656
|
|
$
|
220,101
|
|
$
|
213,071
|
|
||
|
Food and beverage expense
|
79,589
|
|
81,117
|
|
75,468
|
|
|||||
|
Management and franchise fee expense
|
118,210
|
|
116,462
|
|
114,802
|
|
|||||
|
Other operating expense
|
241,654
|
|
239,966
|
|
243,004
|
|
|||||
|
Total property operating expense
|
668,109
|
|
657,646
|
|
646,345
|
|
|||||
|
Depreciation and amortization
|
162,500
|
|
156,226
|
|
144,294
|
|
|||||
|
Impairment loss
|
—
|
|
1,003
|
|
9,200
|
|
|||||
|
Property tax, insurance and other
|
77,281
|
|
76,682
|
|
71,443
|
|
|||||
|
General and administrative
|
31,516
|
|
37,810
|
|
41,671
|
|
|||||
|
Transaction and pursuit costs
|
192
|
|
3,058
|
|
4,850
|
|
|||||
|
Total operating expense
|
939,598
|
|
932,425
|
|
917,803
|
|
|||||
|
Operating income
|
220,397
|
|
203,915
|
|
191,394
|
|
|||||
|
Other income
|
303
|
|
1,598
|
|
807
|
|
|||||
|
Interest income
|
1,695
|
|
1,563
|
|
1,881
|
|
|||||
|
Interest expense
|
(58,820
|
)
|
(54,788
|
)
|
(56,810
|
)
|
|||||
|
Income from continuing operations before income tax (expense) benefit
|
163,575
|
|
152,288
|
|
137,272
|
|
|||||
|
Income tax (expense) benefit
|
(8,190
|
)
|
39,126
|
|
(1,145
|
)
|
|||||
|
Income from continuing operations
|
155,385
|
|
191,414
|
|
136,127
|
|
|||||
|
Gain on sale of hotel properties
|
45,929
|
|
28,398
|
|
353
|
|
|||||
|
Net income
|
201,314
|
|
219,812
|
|
136,480
|
|
|||||
|
Net income attributable to noncontrolling interests
|
|
|
|
|
|
|
|||||
|
Noncontrolling interest in consolidated joint venture
|
(55
|
)
|
(77
|
)
|
(171
|
)
|
|||||
|
Noncontrolling interest in the Operating Partnership
|
(907
|
)
|
(1,514
|
)
|
(868
|
)
|
|||||
|
Net income attributable to common shareholders
|
$
|
200,352
|
|
$
|
218,221
|
|
$
|
135,441
|
|
||
|
Basic per common share data:
|
|
|
|
|
|
|
|||||
|
Net income per share attributable to common shareholders
|
$
|
1.61
|
|
$
|
1.69
|
|
$
|
1.06
|
|
||
|
Weighted-average number of common shares
|
123,651,003
|
|
128,444,469
|
|
127,360,669
|
|
|||||
F-4
|
Diluted per common share data:
|
|
|
|
|
|
|
|||||
|
Net income per share attributable to common shareholders
|
$
|
1.61
|
|
$
|
1.68
|
|
$
|
1.05
|
|
||
|
Weighted-average number of common shares
|
123,879,007
|
|
128,967,754
|
|
128,293,843
|
|
|||||
|
Amounts attributable to the Company’s common shareholders:
|
|
|
|
|
|
|
|||||
|
Income from continuing operations
|
$
|
154,606
|
|
$
|
190,022
|
|
$
|
135,090
|
|
||
|
Gain on sale of hotel properties
|
45,746
|
|
28,199
|
|
351
|
|
|||||
|
Net income attributable to common shareholders
|
$
|
200,352
|
|
$
|
218,221
|
|
$
|
135,441
|
|
||
|
Comprehensive income:
|
|
|
|
|
|||||||
|
Net income
|
$
|
201,314
|
|
$
|
219,812
|
|
$
|
136,480
|
|
||
|
Unrealized gain (loss) on interest rate derivatives
|
11,700
|
|
(2,958
|
)
|
(7,703
|
)
|
|||||
|
Comprehensive income
|
213,014
|
|
216,854
|
|
128,777
|
|
|||||
|
Comprehensive income attributable to the noncontrolling interest in consolidated joint venture
|
(55
|
)
|
(77
|
)
|
(171
|
)
|
|||||
|
Comprehensive income attributable to the noncontrolling interest in the Operating Partnership
|
(907
|
)
|
(1,514
|
)
|
(868
|
)
|
|||||
|
Comprehensive income attributable to the Company
|
$
|
212,052
|
|
$
|
215,263
|
|
$
|
127,738
|
|
||
The accompanying notes are an integral part of these consolidated financial statements.
F-5
RLJ Lodging Trust
Consolidated Statements of Changes in Equity
(Amounts in thousands, except share data)
|
|
Shareholders’ Equity
|
Noncontrolling Interest
|
|
|||||||||||||||||||||||||||||||
|
|
Common Stock
|
|
|
|
||||||||||||||||||||||||||||||
|
|
Shares
|
Par Value
|
Additional Paid-in Capital
|
Distributions in excess of
net earnings |
Accumulated Other Comprehensive Loss
|
Operating
Partnership |
Consolidated
Joint Venture |
Total Non-controlling
Interest |
Total Equity
|
|||||||||||||||||||||||||
|
Balance at December 31, 2013
|
122,640,042
|
|
$
|
1,226
|
|
$
|
2,178,004
|
|
$
|
(45,522
|
)
|
$
|
(5,941
|
)
|
$
|
11,261
|
|
$
|
7,306
|
|
$
|
18,567
|
|
$
|
2,146,334
|
|
||||||||
|
Net income
|
—
|
|
—
|
|
—
|
|
135,441
|
|
—
|
|
868
|
|
171
|
|
1,039
|
|
136,480
|
|
||||||||||||||||
|
Unrealized loss on interest rate derivatives
|
—
|
|
—
|
|
—
|
|
—
|
|
(7,703
|
)
|
—
|
|
—
|
|
—
|
|
(7,703
|
)
|
||||||||||||||||
|
Proceeds from the sale of common stock, net
|
9,200,000
|
|
92
|
|
232,620
|
|
—
|
|
—
|
|
—
|
|
—
|
|
—
|
|
232,712
|
|
||||||||||||||||
|
Issuance of restricted stock
|
343,887
|
|
3
|
|
(3
|
)
|
—
|
|
—
|
|
—
|
|
—
|
|
—
|
|
—
|
|
||||||||||||||||
|
Amortization of share-based compensation
|
—
|
|
—
|
|
15,088
|
|
—
|
|
—
|
|
—
|
|
—
|
|
—
|
|
15,088
|
|
||||||||||||||||
|
Share grants to trustees
|
4,347
|
|
—
|
|
127
|
|
—
|
|
—
|
|
—
|
|
—
|
|
—
|
|
127
|
|
||||||||||||||||
|
Shares acquired to satisfy minimum required federal and state tax withholding on vesting restricted stock
|
(211,983
|
)
|
(2
|
)
|
(6,105
|
)
|
—
|
|
—
|
|
—
|
|
—
|
|
—
|
|
(6,107
|
)
|
||||||||||||||||
|
Forfeiture of restricted stock
|
(11,587
|
)
|
—
|
|
—
|
|
—
|
|
—
|
|
—
|
|
—
|
|
—
|
|
—
|
|
||||||||||||||||
|
Distribution to joint venture partner
|
—
|
|
—
|
|
—
|
|
—
|
|
—
|
|
—
|
|
(1,182
|
)
|
(1,182
|
)
|
(1,182
|
)
|
||||||||||||||||
|
Distributions on common shares and units
|
—
|
|
—
|
|
—
|
|
(136,334
|
)
|
—
|
|
(931
|
)
|
—
|
|
(931
|
)
|
(137,265
|
)
|
||||||||||||||||
|
Balance at December 31, 2014
|
131,964,706
|
|
|
$
|
1,319
|
|
|
$
|
2,419,731
|
|
|
$
|
(46,415
|
)
|
|
$
|
(13,644
|
)
|
|
$
|
11,198
|
|
|
$
|
6,295
|
|
|
$
|
17,493
|
|
|
$
|
2,378,484
|
|
The accompanying notes are an integral part of these consolidated financial statements.
F-6
RLJ Lodging Trust
Consolidated Statements of Changes in Equity
(Amounts in thousands, except share data)
|
|
Shareholders’ Equity
|
Noncontrolling Interest
|
|
|||||||||||||||||||||||||||||||
|
|
Common Stock
|
|
|
|
||||||||||||||||||||||||||||||
|
|
Shares
|
Par Value
|
Additional Paid-in Capital
|
Retained Earnings (Distributions in excess of
net earnings) |
Accumulated Other Comprehensive Loss
|
Operating
Partnership |
Consolidated
Joint Venture |
Total Non-controlling
Interests |
Total Equity
|
|||||||||||||||||||||||||
|
Balance at December 31, 2014
|
131,964,706
|
|
$
|
1,319
|
|
$
|
2,419,731
|
|
$
|
(46,415
|
)
|
$
|
(13,644
|
)
|
$
|
11,198
|
|
$
|
6,295
|
|
$
|
17,493
|
|
$
|
2,378,484
|
|
||||||||
|
Net income
|
—
|
|
—
|
|
—
|
|
218,221
|
|
—
|
|
1,514
|
|
77
|
|
1,591
|
|
219,812
|
|
||||||||||||||||
|
Unrealized loss on interest rate derivatives
|
—
|
|
—
|
|
—
|
|
—
|
|
(2,958
|
)
|
—
|
|
—
|
|
—
|
|
(2,958
|
)
|
||||||||||||||||
|
Shares acquired as part of a share repurchase program
|
(8,044,372
|
)
|
(80
|
)
|
(225,106
|
)
|
—
|
|
—
|
|
—
|
|
—
|
|
—
|
|
(225,186
|
)
|
||||||||||||||||
|
Issuance of restricted stock
|
1,126,431
|
|
11
|
|
(11
|
)
|
—
|
|
—
|
|
—
|
|
—
|
|
—
|
|
—
|
|
||||||||||||||||
|
Amortization of share-based compensation
|
—
|
|
—
|
|
13,002
|
|
—
|
|
—
|
|
—
|
|
—
|
|
—
|
|
13,002
|
|
||||||||||||||||
|
Share grants to trustees
|
5,008
|
|
—
|
|
132
|
|
—
|
|
—
|
|
—
|
|
—
|
|
—
|
|
132
|
|
||||||||||||||||
|
Shares acquired to satisfy minimum required federal and state tax withholding on vesting restricted stock
|
(403,722
|
)
|
(4
|
)
|
(12,016
|
)
|
—
|
|
—
|
|
—
|
|
—
|
|
—
|
|
(12,020
|
)
|
||||||||||||||||
|
Forfeiture of restricted stock
|
(12,376
|
)
|
—
|
|
—
|
|
—
|
|
—
|
|
—
|
|
—
|
|
—
|
|
—
|
|
||||||||||||||||
|
Distribution to joint venture partner
|
—
|
|
—
|
|
—
|
|
—
|
|
—
|
|
—
|
|
(195
|
)
|
(195
|
)
|
(195
|
)
|
||||||||||||||||
|
Distributions on common shares and units
|
—
|
|
—
|
|
—
|
|
(169,367
|
)
|
—
|
|
(1,180
|
)
|
—
|
|
(1,180
|
)
|
(170,547
|
)
|
||||||||||||||||
|
Balance at December 31, 2015
|
124,635,675
|
|
$
|
1,246
|
|
$
|
2,195,732
|
|
$
|
2,439
|
|
$
|
(16,602
|
)
|
$
|
11,532
|
|
$
|
6,177
|
|
$
|
17,709
|
|
$
|
2,200,524
|
|
||||||||
The accompanying notes are an integral part of these consolidated financial statements.
F-7
RLJ Lodging Trust
Consolidated Statements of Changes in Equity
(Amounts in thousands, except share data)
|
|
Shareholders’ Equity
|
Noncontrolling Interest
|
|
|||||||||||||||||||||||||||||||
|
|
Common Stock
|
|
|
|
||||||||||||||||||||||||||||||
|
|
Shares
|
Par Value
|
Additional Paid-in Capital
|
Retained Earnings
|
Accumulated Other Comprehensive
Loss |
Operating
Partnership |
Consolidated
Joint Venture |
Total Non-controlling
Interest |
Total Equity
|
|||||||||||||||||||||||||
|
Balance at December 31, 2015
|
124,635,675
|
|
$
|
1,246
|
|
$
|
2,195,732
|
|
$
|
2,439
|
|
$
|
(16,602
|
)
|
$
|
11,532
|
|
$
|
6,177
|
|
$
|
17,709
|
|
$
|
2,200,524
|
|
||||||||
|
Net income
|
—
|
|
—
|
|
—
|
|
200,352
|
|
—
|
|
907
|
|
55
|
|
962
|
|
201,314
|
|
||||||||||||||||
|
Unrealized gain on interest rate derivatives
|
—
|
|
—
|
|
—
|
|
—
|
|
11,700
|
|
—
|
|
—
|
|
—
|
|
11,700
|
|
||||||||||||||||
|
Redemption of Operating Partnership units
|
335,250
|
|
3
|
|
4,322
|
|
—
|
|
—
|
|
(4,325
|
)
|
—
|
|
(4,325
|
)
|
—
|
|
||||||||||||||||
|
Issuance of restricted stock
|
672,821
|
|
7
|
|
(7
|
)
|
—
|
|
—
|
|
—
|
|
—
|
|
—
|
|
—
|
|
||||||||||||||||
|
Amortization of share-based compensation
|
—
|
|
—
|
|
5,990
|
|
—
|
|
—
|
|
—
|
|
—
|
|
—
|
|
5,990
|
|
||||||||||||||||
|
Share grants to trustees
|
2,554
|
|
—
|
|
57
|
|
—
|
|
—
|
|
—
|
|
—
|
|
—
|
|
57
|
|
||||||||||||||||
|
Shares acquired to satisfy minimum required federal and state tax withholding on vesting restricted stock
|
(244,015
|
)
|
(2
|
)
|
(5,500
|
)
|
—
|
|
—
|
|
—
|
|
—
|
|
—
|
|
(5,502
|
)
|
||||||||||||||||
|
Shares acquired as part of a share repurchase program
|
(610,607
|
)
|
(6
|
)
|
(13,265
|
)
|
—
|
|
—
|
|
—
|
|
—
|
|
—
|
|
(13,271
|
)
|
||||||||||||||||
|
Forfeiture of restricted stock
|
(427,500
|
)
|
(4
|
)
|
4
|
|
—
|
|
—
|
|
—
|
|
—
|
|
—
|
|
—
|
|
||||||||||||||||
|
Distribution to joint venture partner
|
—
|
|
—
|
|
—
|
|
—
|
|
—
|
|
—
|
|
(259
|
)
|
(259
|
)
|
(259
|
)
|
||||||||||||||||
|
Distributions on common shares and units
|
—
|
|
—
|
|
—
|
|
(164,542
|
)
|
—
|
|
(734
|
)
|
—
|
|
(734
|
)
|
(165,276
|
)
|
||||||||||||||||
|
Balance at December 31, 2016
|
124,364,178
|
|
$
|
1,244
|
|
$
|
2,187,333
|
|
$
|
38,249
|
|
$
|
(4,902
|
)
|
$
|
7,380
|
|
$
|
5,973
|
|
$
|
13,353
|
|
$
|
2,235,277
|
|
||||||||
The accompanying notes are an integral part of these consolidated financial statements.
F-8
RLJ Lodging Trust
(Amounts in thousands)
|
|
For the year ended December 31,
|
||||||||||
|
|
2016
|
2015
|
2014
|
||||||||
|
Cash flows from operating activities
|
|
|
|
|
|
|
|||||
|
Net income
|
$
|
201,314
|
|
$
|
219,812
|
|
$
|
136,480
|
|
||
|
Adjustments to reconcile net income to cash flow provided by operating activities:
|
|
|
|
|
|
|
|||||
|
Gain on sale of hotel properties
|
(45,929
|
)
|
(28,398
|
)
|
(353
|
)
|
|||||
|
Loss on defeasance
|
—
|
|
—
|
|
804
|
|
|||||
|
Depreciation and amortization
|
162,500
|
|
156,226
|
|
144,294
|
|
|||||
|
Amortization of deferred financing costs
|
3,965
|
|
4,164
|
|
4,298
|
|
|||||
|
Amortization of deferred management fees
|
751
|
|
784
|
|
954
|
|
|||||
|
Accretion of interest income on investment in loan
|
(613
|
)
|
(389
|
)
|
(248
|
)
|
|||||
|
Impairment loss
|
—
|
|
1,003
|
|
9,200
|
|
|||||
|
Share grants to trustees
|
57
|
|
132
|
|
127
|
|
|||||
|
Amortization of share-based compensation
|
5,990
|
|
13,002
|
|
15,088
|
|
|||||
|
Deferred income taxes
|
6,994
|
|
(40,554
|
)
|
(642
|
)
|
|||||
|
Changes in assets and liabilities:
|
|
|
|
|
|
|
|||||
|
Hotel and other receivables, net
|
(263
|
)
|
115
|
|
(2,122
|
)
|
|||||
|
Prepaid expense and other assets
|
(5,162
|
)
|
4,802
|
|
(3,513
|
)
|
|||||
|
Accounts payable and other liabilities
|
2,870
|
|
(5,502
|
)
|
(5,096
|
)
|
|||||
|
Advance deposits and deferred revenue
|
328
|
|
1,617
|
|
(526
|
)
|
|||||
|
Accrued interest
|
(1,439
|
)
|
2,100
|
|
88
|
|
|||||
|
Net cash flow provided by operating activities
|
331,363
|
|
328,914
|
|
298,833
|
|
|||||
|
Cash flows from investing activities
|
|
|
|
|
|
|
|||||
|
Acquisition of hotel properties, net
|
—
|
|
(143,769
|
)
|
(631,640
|
)
|
|||||
|
Proceeds from the sale of hotel properties, net
|
269,185
|
|
246,405
|
|
132,669
|
|
|||||
|
Purchase deposits, net
|
—
|
|
—
|
|
7,246
|
|
|||||
|
Improvements and additions to hotel properties
|
(83,780
|
)
|
(149,225
|
)
|
(118,787
|
)
|
|||||
|
Additions to property and equipment
|
(283
|
)
|
(659
|
)
|
(47
|
)
|
|||||
|
(Increase) decrease in restricted cash reserves, net
|
(11,751
|
)
|
9,147
|
|
(624
|
)
|
|||||
|
Net cash flow provided by (used in) investing activities
|
173,371
|
|
(38,101
|
)
|
(611,183
|
)
|
|||||
|
Cash flows from financing activities
|
|
|
|
|
|
|
|||||
|
Borrowings under Revolver
|
51,000
|
|
—
|
|
292,500
|
|
|||||
|
Repayments under Revolver
|
(51,000
|
)
|
—
|
|
(292,500
|
)
|
|||||
|
Borrowings on term loans
|
—
|
|
150,000
|
|
175,000
|
|
|||||
|
Proceeds from mortgage loans
|
11,000
|
|
7,000
|
|
143,000
|
|
|||||
|
Payments of mortgage loans principal
|
(3,651
|
)
|
(166,587
|
)
|
(170,722
|
)
|
|||||
|
Repurchase of common shares under a share repurchase program
|
(13,271
|
)
|
(225,186
|
)
|
—
|
|
|||||
|
Repurchase of common shares to satisfy employee withholding requirements
|
(5,502
|
)
|
(12,020
|
)
|
(6,107
|
)
|
|||||
|
Distributions on common shares
|
(164,364
|
)
|
(170,092
|
)
|
(125,143
|
)
|
|||||
|
Distributions on Operating Partnership units
|
(838
|
)
|
(1,160
|
)
|
(878
|
)
|
|||||
|
Payments of deferred financing costs
|
(5,369
|
)
|
(839
|
)
|
(4,120
|
)
|
|||||
|
Distribution to joint venture partner
|
(259
|
)
|
(195
|
)
|
(1,182
|
)
|
|||||
|
Proceeds from the issuance of common shares
|
—
|
|
—
|
|
232,712
|
|
|||||
|
Net cash flow (used in) provided by financing activities
|
(182,254
|
)
|
(419,079
|
)
|
242,560
|
|
|||||
|
Net change in cash and cash equivalents
|
322,480
|
|
(128,266
|
)
|
(69,790
|
)
|
|||||
|
Cash and cash equivalents, beginning of year
|
134,192
|
|
262,458
|
|
332,248
|
|
|||||
|
Cash and cash equivalents, end of year
|
$
|
456,672
|
|
$
|
134,192
|
|
$
|
262,458
|
|
||
The accompanying notes are an integral part of these consolidated financial statements.
F-9
RLJ Lodging Trust
Notes to the Consolidated Financial Statements
1.
Organization
RLJ Lodging Trust (the "Company") was formed as a Maryland real estate investment trust ("REIT") on January 31, 2011. The Company is a self-advised and self-administered REIT that acquires primarily premium-branded, focused-service and compact full-service hotels. The Company elected to be taxed as a REIT, for U.S. federal income tax purposes, commencing with its taxable year ended December 31, 2011.
Substantially all of the Company’s assets and liabilities are held by, and all of its operations are conducted through RLJ Lodging Trust, L.P. (the "Operating Partnership"). The Company is the sole general partner of the Operating Partnership. As of
December 31, 2016
, there were
124,922,928
units of limited partnership interest in the Operating Partnership (“OP units”) outstanding and the Company owned, through a combination of direct and indirect interests,
99.6%
of the outstanding OP units.
As of
December 31, 2016
, the Company owned
122
hotel properties with approximately
20,100
rooms, located in
21
states and the District of Columbia, and an interest in
one
mortgage loan secured by a hotel. The Company, through wholly-owned subsidiaries, owned a
100%
interest in all of its hotel properties, with the exception of the DoubleTree Metropolitan Hotel New York City, in which the Company, through wholly-owned subsidiaries, owned a
98.3%
controlling interest in a joint venture, DBT Met Hotel Venture, LP, which was formed to engage in the hotel operations related to this hotel. An independent operator manages the operations of each hotel property.
2.
Summary of Significant Accounting Policies
Basis of Presentation and Principles of Consolidation
The consolidated financial statements and related notes have been prepared on the accrual basis of accounting in accordance with accounting principles generally accepted in the United States of America ("GAAP").
The consolidated financial statements include the accounts of the Company, the Operating Partnership and its wholly-owned subsidiaries, and a joint venture in which the Company has a majority voting interest and control. All intercompany balances and transactions have been eliminated in consolidation.
In February 2015, the Financial Accounting Standards Board ("FASB") issued Accounting Standards Update ("ASU") 2015-02,
Consolidation (Topic 810): Amendments to the Consolidation Analysis
. The new guidance modifies the analysis an entity must perform to determine whether it should consolidate certain legal entities. The Company adopted the new guidance on January 1, 2016 and the adoption did not have an impact on the presentation of the Company's consolidated financial statements as there were no changes to the subsidiaries consolidated by the Company. Upon adopting the new guidance, the Operating Partnership and certain subsidiaries of the Operating Partnership became variable interest entities. The Company continues to consolidate the Operating Partnership and the Operating Partnership continues to consolidate the other subsidiary variable interest entities.
Use of Estimates
The preparation of the Company’s financial statements in conformity with GAAP requires management to make estimates and assumptions that affect the reported amounts of certain assets and liabilities and the amounts of contingent assets and liabilities at the balance sheet date and the reported amounts of revenues and expenses during the reporting period. Actual results could differ from those estimates.
Reclassifications
Certain prior year amounts in these financial statements have been reclassified to conform to the current year presentation with no impact to net income, shareholders’ equity or cash flows.
F-10
Revenue Recognition
The Company’s revenue consists of room revenue, food and beverage revenue, and revenue from other hotel operating departments (such as parking fees, gift shop sales and other guest service fees). These revenues are recorded net of any sales and occupancy taxes collected from the hotel guests. All rebates or discounts are recorded as a reduction to revenue, and there are no material contingent obligations with respect to rebates and discounts offered by the hotels. All revenues are recorded on an accrual basis as they are earned. An allowance for doubtful accounts is the Company's best estimate of the amount of probable credit losses in the existing accounts receivable portfolio and it is recorded as a bad debt expense. The allowance for doubtful accounts is calculated as a percentage of the aged accounts receivable. Any cash received prior to a guests arrival is recorded as an advance deposit from the guest and recognized as revenue at the time of the guest's occupancy at the hotel property.
Investment in Hotel Properties
The Company’s acquisitions generally consist of land, land improvements, buildings, building improvements, furniture, fixtures and equipment ("FF&E"), and inventory. The Company may also acquire intangible assets or liabilities related to in-place leases, management agreements and franchise agreements. The Company allocates the purchase price among the assets acquired and the liabilities assumed based on their respective fair values at the date of acquisition. The Company determines the fair value by using market data and independent appraisals available to us and making numerous estimates and assumptions. Transaction costs are expensed for acquisitions that are considered business combinations and capitalized for asset acquisitions.
The Company’s investments in hotel properties are carried at cost and are depreciated using the straight-line method over the estimated useful lives of
15
years for land improvements,
15
years for building improvements,
40
years for buildings and
three
to
five
years for FF&E. Intangible assets and liabilities arising from the acquisitions are amortized using the straight-line method over the non-cancelable portion of the term of the agreement. Maintenance and repairs are expensed and major renewals or improvements to the hotel properties are capitalized. Interest used to finance the real estate under development is capitalized as an additional cost of development. Upon the sale or disposition of a hotel property, the asset and related accumulated depreciation accounts are removed and the related gain or loss is included in the gain or loss on sale of hotel properties in the consolidated statements of operations. A sale or disposition of a hotel property that represents a strategic shift that has or will have a major effect on the Company's operations and financial results is presented as discontinued operations in the consolidated statements of operations.
In accordance with the guidance on impairment or disposal of long-lived assets, the Company does not consider "held for sale" classification on the consolidated balance sheet until it is probable that the sale will be completed within one year and the other requisite criteria for such classification have been met. The Company does not depreciate hotel properties so long as they are classified as held for sale. Upon designation as held for sale and quarterly thereafter, the Company reviews the realizability of the carrying value, less costs to sell, in accordance with the guidance. Any such adjustment to the carrying value is recorded as an impairment loss.
The Company assesses the carrying value whenever events or changes in circumstances indicate that the carrying amounts may not be recoverable. The recoverability is measured by comparing the carrying amount to the estimated future undiscounted cash flows which take into account current market conditions and the Company’s intent with respect to holding or disposing of the hotel properties. If the Company’s analysis indicates that the carrying value is not recoverable on an undiscounted cash flow basis, the Company will recognize an impairment loss for the amount by which the carrying value exceeds the fair value. The fair value is determined through various valuation techniques, including internally developed discounted cash flow models, comparable market transactions or third-party appraisals.
The use of projected future cash flows is based on assumptions that are consistent with a market participant’s future expectations for the travel industry and the economy in general and the Company’s expected use of the underlying hotel properties. The assumptions and estimates related to the future cash flows and the capitalization rates are complex and subjective in nature. Changes in economic and operating conditions that occur subsequent to a current impairment analysis and the Company’s ultimate use of the hotel property could impact the assumptions and result in future impairment losses to the hotel properties.
In September 2015, the FASB issued ASU 2015-16,
Business Combinations (Topic 805): Simplifying the Accounting for Measurement-Period Adjustments.
ASU 2015-16 requires that the cumulative impact of a measurement period adjustment be recognized in the reporting period in which the adjustment is identified. The prior period impact of the adjustment should be either presented separately on the face of the statement of operations or disclosed in the notes. This guidance eliminates the
F-11
requirement to restate prior period financial statements for measurement period adjustments following a business combination. The guidance is effective for annual reporting periods beginning after December 15, 2015 and it is applied prospectively for measurement period adjustments that occur after the effective date. The Company adopted the new guidance on January 1, 2016 and there have been no measurement period adjustments subsequent to the adoption of this guidance.
Cash and Cash Equivalents
Cash and cash equivalents include all cash and highly liquid investments that mature three months or less when they are purchased. The Company maintains its cash at domestic banks, which, at times, may exceed the limits of the amounts insured by the Federal Deposit Insurance Corporation.
Restricted Cash Reserves
Restricted cash reserves consists of all cash that is required to be maintained in a reserve escrow account by a hotel management agreement, franchise agreement and/or a mortgage agreement for the replacement of furniture, fixtures and equipment and the funding of real estate taxes and insurance.
Hotel Receivables
Hotel receivables consist mainly of receivables due from hotel guests and meeting and banquet room rentals. The Company does not generally require collateral, as ongoing credit evaluations are performed, and an allowance for doubtful accounts is established against any receivable that is estimated to be uncollectible.
Deferred Financing Costs
Deferred financing costs are the costs incurred to obtain long-term financing. The deferred financing costs are recorded at cost and are amortized using the straight-line method, which approximates the effective interest method, over the respective term of the financing agreement and are included as a component of interest expense. The Company expenses unamortized deferred financing costs when the associated financing agreement is refinanced or repaid before maturity unless certain criteria are met that would allow for the carryover of such costs to the refinanced agreement.
In April 2015, the FASB issued ASU 2015-03,
Interest - Imputation of Interest (Subtopic 835-30): Simplifying the Presentation of Debt Issuance Costs
. This guidance requires an entity to present the debt issuance costs in the balance sheet as a direct deduction from the carrying amount of that debt liability, rather than as an asset. In August 2015, the FASB issued ASU 2015-15,
Interest - Imputation of Interest (Subtopic 835-30): Presentation and Subsequent Measurement of Debt Issuance Costs Associated with Line-of-Credit Arrangements
. This guidance allows the debt issuance costs on line-of-credit arrangements to be presented in the balance sheet as an asset and amortized ratably over the term of the line-of-credit arrangement, regardless of whether there are any outstanding borrowings on the line-of-credit arrangement. The Company adopted both ASU 2015-03 and ASU 2015-15 on January 1, 2016. The adoption of this guidance changed the balance sheet classification of the Company's deferred financing costs but it did not otherwise affect the consolidated financial statements. Upon adoption of the new guidance, the Company retrospectively reclassified deferred financing costs of
$8.1 million
in the consolidated balance sheet as of December 31, 2015. The carrying amount of debt as of December 31, 2015 is presented net of deferred financing costs of
$7.3 million
. The carrying amount of prepaid expense and other assets as of December 31, 2015 includes deferred financing costs of
$0.8 million
related to the Revolver (as defined below).
For the years ended
December 31, 2016
,
2015
and
2014
, approximately
$4.0 million
,
$4.2 million
and
$4.3 million
, respectively, of amortization expense was recorded as a component of interest expense in the consolidated statements of operations. Accumulated amortization at
December 31, 2016
and
2015
was approximately
$9.7 million
and
$10.6 million
, respectively.
F-12
Advertising Costs
The Company expenses advertising costs as incurred. Advertising expense was approximately
$4.2 million
,
$4.1 million
and
$3.7 million
for the years ended
December 31, 2016
,
2015
and
2014
, respectively, and is included in other operating expense in the consolidated statements of operations.
Transaction and Pursuit Costs
The Company incurs costs during the review of potential hotel property acquisitions and dispositions, including legal fees, architectural costs, environmental reviews and market studies. These costs are expensed as incurred.
Derivative Financial Instruments
In the normal course of business, the Company is exposed to the effects of interest rate changes. The Company utilizes a variety of borrowing vehicles including an unsecured revolving credit facility (the "Revolver") and medium and long-term financings. The Company reduces its risk to interest rate changes by following its established risk management policies and procedures, including the use of derivative financial instruments as part of its interest rate risk management strategy. The Company utilizes derivatives to manage, or hedge, interest rate risk. To mitigate the Company's exposure to interest rate changes, the Company uses interest rate derivative instruments, typically interest rate swaps, to convert a portion of its variable rate debt to fixed rate debt. The Company attempts to require the hedging derivative instruments to be effective in reducing the interest rate risk exposure that they are designated to hedge. This effectiveness is essential in order to qualify for hedge accounting. Derivative financial instruments that meet the hedging criteria are formally designated as cash flow hedges at the inception of the derivative contract. The Company does not use derivative instruments for trading or speculative purposes.
Interest rate swap agreements contain a credit risk that the counterparties may be unable to fulfill the terms of the agreement. The Company has minimized that risk by evaluating the creditworthiness of its counterparties, who are limited to major banks and financial institutions, and it does not anticipate nonperformance by these counterparties.
The estimated fair values of the derivatives have been determined by using available market information and appropriate valuation methods. Considerable judgment is required in interpreting market data to develop the estimates of fair value. Accordingly, the estimates presented herein are not necessarily indicative of the amounts that the Company could realize in a current market exchange.
The Company recognizes all derivatives as assets or liabilities on its consolidated balance sheet at fair value. The gains and losses on the derivatives that have been determined to be effective cash flow hedges are reported in other comprehensive income (loss) and are reclassified to interest expense in the period in which the interest expense is recognized on the underlying hedged item. The ineffective portion of the change in fair value of the interest rate derivatives is recognized in earnings immediately.
When the terms of an underlying transaction are modified, or when the underlying hedged item ceases to exist, and the interest rate derivative no longer qualifies for hedge accounting, all changes in the fair value of the derivative instrument are marked-to-market with the changes in fair value recognized in earnings each period until the derivative instrument matures.
Noncontrolling Interests
The consolidated financial statements include all subsidiaries controlled by the Company. For the controlled subsidiaries that are not wholly-owned, the third-party ownership interest represents a noncontrolling interest, which is presented separately in the consolidated financial statements.
As of
December 31, 2016
, the Company consolidated the Operating Partnership, which has a
0.4%
third-party ownership interest. The third-party ownership interest is included in the noncontrolling interest in the Operating Partnership in the equity section of the consolidated balance sheets. The portion of the income and losses associated with the third-party ownership interest are included in the noncontrolling interest in the Operating Partnership in the consolidated statements of operations.
As of
December 31, 2016
, the Company consolidated DBT Met Hotel Venture, LP, a majority-owned partnership that has a
1.7%
third-party ownership interest in the joint venture. The third-party ownership interest is included in the noncontrolling interest in consolidated joint venture in the equity section of the consolidated balance sheets. The income and losses associated with the third-party ownership interest are included in the noncontrolling interest in consolidated joint venture in the consolidated statements of operations.
F-13
Income Taxes
The Company has elected to be taxed as a REIT under Sections 856 through 860 of the Internal Revenue Code, as amended. To qualify as a REIT, the Company must meet a number of organizational and operational requirements, including a requirement that it distribute at least 90% of its REIT taxable income, determined without regard to the deduction for dividends paid and excluding any net capital gain, to shareholders. The Company's current intention is to adhere to these REIT qualification requirements and to maintain its qualification for taxation as a REIT.
As a REIT, the Company generally is not subject to U.S. federal corporate income tax on the portion of taxable income that is distributed to shareholders. If the Company fails to qualify for taxation as a REIT in any taxable year, it will be subject to U.S. federal income taxes at regular corporate rates (including any applicable alternative minimum tax) and it may not be able to qualify as a REIT for
four
subsequent taxable years. Even if the Company qualifies for taxation as a REIT, it may be subject to certain state and local taxes on its income and property, and to U.S. federal income and excise taxes on its undistributed taxable income. Taxable income from non-REIT activities managed through taxable REIT subsidiaries is subject to U.S. federal, state and local income taxes.
Income taxes are recorded using the asset and liability method. Under this method, deferred tax assets and liabilities are recognized for the estimated future tax consequences attributable to the differences between the financial statement carrying amounts of existing assets and liabilities and their respective income tax bases, and for net operating loss, capital loss and tax credit carryforwards. The deferred tax assets and liabilities are measured using the enacted income tax rates in effect for the year in which those temporary differences are expected to be realized or settled. The effect on the deferred tax assets and liabilities from a change in tax rates is recognized in earnings in the period when the new rate is enacted. However, deferred tax assets are recognized only to the extent that it is more likely than not that they will be realized based on consideration of all available evidence, including the future reversals of existing taxable temporary differences, future projected taxable income and tax planning strategies. Valuation allowances are provided if, based upon the weight of the available evidence, it is more likely than not that some or all of the deferred tax assets will not be realized.
The Company performs an annual review for any uncertain tax positions and, if necessary, will record the expected future tax consequences of uncertain tax positions in the consolidated financial statements.
Earnings Per Common Share
Basic earnings per common share is calculated by dividing net income attributable to common shareholders by the weighted-average number of common shares outstanding during the period excluding the weighted-average number of unvested restricted shares and performance units outstanding during the period. Diluted earnings per common share is calculated by dividing net income attributable to common shareholders by the weighted-average number of common shares outstanding during the period, plus any shares that could potentially be outstanding during the period. The potential shares consist of unvested share-based awards, calculated using the treasury stock method. Any anti-dilutive shares have been excluded from the diluted earnings per common share calculation.
Share-based Compensation
From time to time, the Company may issue share-based awards under the RLJ Lodging Trust 2015 Equity Incentive Plan (the "2015 Plan") as compensation to officers, employees and non-employee trustees. The vesting of the awards issued to the officers and employees is based on either the continued employment (time-based) or the relative total shareholder returns of the Company and continued employment (performance-based), as determined by the board of trustees at the date of grant. For time-based awards, the Company recognizes compensation expense for the unvested restricted shares on a straight-line basis over the vesting period based upon the fair market value of the shares on the date of grant, adjusted for forfeitures. For performance-based awards, the Company recognizes compensation expense over the requisite service period for each award, based on the fair market value of the shares on the date of grant, as determined using a Monte Carlo simulation, adjusted for forfeitures.
In March 2016, the FASB issued ASU 2016-09,
Improvements to Employee Share-Based Payment Accounting
, which amends ASC Topic 718,
Compensation - Stock Compensation.
The new guidance includes provisions that are intended to simplify various aspects related to how share-based payments are accounted for and presented in the financial statements. The guidance is effective for annual reporting periods beginning after December 15, 2016, and the interim periods within those annual periods. Early adoption is permitted in any interim or annual period, with any adjustments reflected as of the beginning
F-14
of the fiscal year of adoption. The Company early adopted this guidance on January 1, 2016, and there was no effect on the Company's consolidated financial statements.
Recently Issued Accounting Pronouncements
In August 2014, the FASB issued ASU 2014-15,
Presentation of Financial Statements - Going Concern (Subtopic 205-40): Disclosure of Uncertainties about an Entity's Ability to Continue as a Going Concern
. ASU 2014-15 requires management to evaluate whether there are conditions or events that raise substantial doubt about the entity's ability to continue as a going concern, and to provide certain disclosures when it is probable that the entity will be unable to meet its obligations as they become due within one year after the date that the financial statements are issued. ASU 2014-15 is effective for the annual period ended December 31, 2016 with early adoption permitted. The Company early adopted this guidance on January 1, 2016, and there was no effect on the Company's consolidated financial statements.
In May 2014, the FASB issued ASU 2014-09,
Revenue from Contracts with Customers
, which supersedes or replaces nearly all GAAP revenue recognition guidance. The new guidance establishes a new control-based revenue recognition model that changes the basis for deciding when revenue is recognized over time or at a point in time and expands the disclosures about revenue. The new guidance also applies to sales of real estate and the new principles-based approach is largely based on the transfer of control of the real estate to the buyer. The guidance is effective for annual reporting periods beginning after December 15, 2017, and the interim periods within those annual periods. Early adoption is permitted for annual reporting periods beginning after December 15, 2016. The Company expects to adopt this new standard on January 1, 2018 using the modified retrospective transition method. Based on the Company's assessment, the adoption of this standard will not have a material impact on the Company's consolidated financial statements.
In February 2016, the FASB issued ASU 2016-02,
Leases (Topic 842)
. The new guidance will require lessees to recognize a right-of-use asset and a lease liability for most of their leases on the balance sheet, and an entity will need to classify its leases as either an operating or finance lease in order to determine the income statement presentation. Leases with a term of 12 months or less will be accounted for similar to the existing guidance today for operating leases. Lessors will classify their leases using an approach that is substantially equivalent to the existing guidance today for operating, direct financing, or sales-type leases. The new guidance is effective for annual reporting periods beginning after December 15, 2018, and the interim periods within those annual periods, with early adoption permitted. The Company expects to adopt this new standard on January 1, 2019. The Company has not yet completed its analysis on this new standard, but it believes the application of the new standard will result in the recording of a right-of-use asset and a lease liability on the balance sheet for each of its ground leases and equipment leases, which represent the majority of the Company's current operating lease payments. The Company does not expect the adoption of this standard will materially affect its consolidated statements of operations.
In August 2016, the FASB issued ASU 2016-15,
Statement of Cash Flows (Topic 230), Classification of Certain Cash Receipts and Cash Payments
. This guidance is intended to reduce the diversity in practice in how certain transactions are classified in the statement of cash flows. In addition, in November 2016, the FASB issued ASU 2016-18,
Statement of Cash Flows (Topic 230), Restricted Cash
. This guidance provides additional guidance related to transfers between cash and restricted cash and how entities present, in their statement of cash flows, the cash receipts and cash payments that directly affect the restricted cash accounts. Both of these ASUs will be effective for the annual reporting periods beginning after December 15, 2017, and the interim periods within those annual periods. Early adoption is permitted, provided that all of the amendments are adopted in the same period, and the guidance requires application using a retrospective transition method. The Company expects to adopt the new guidance on January 1, 2018. The adoption of ASU 2016-15 and ASU 2016-18 will modify the Company's current disclosures and reclassifications within the consolidated statement of cash flows, but they are not expected to have a material impact on the Company's consolidated financial statements.
In January 2017, the FASB issued ASU 2017-01,
Business Combinations (Topic 805): Clarifying the Definition of a Business
. The new guidance clarifies the definition of a business with the objective of adding guidance to assist companies and other reporting organizations with evaluating whether transactions should be accounted for as acquisitions (or disposals) of assets or businesses. The changes to the definition of a business will likely result in more acquisitions being accounted for as asset acquisitions across all industries. The guidance is effective for annual reporting periods beginning after December 15, 2017, and the interim periods within those annual periods. The Company expects to adopt this new guidance on January 1, 2018. The Company is currently evaluating whether this ASU will have a material impact on the Company's consolidated financial statements.
F-15
3.
Investment in Hotel Properties
Investment in hotel properties consisted of the following (in thousands):
|
December 31, 2016
|
December 31, 2015
|
||||||
|
Land and improvements
|
$
|
675,889
|
|
$
|
736,709
|
|
|
|
Buildings and improvements
|
3,050,043
|
|
3,205,704
|
|
|||
|
Furniture, fixtures and equipment
|
595,816
|
|
571,118
|
|
|||
|
Intangible assets
|
2,309
|
|
2,507
|
|
|||
|
|
4,324,057
|
|
4,516,038
|
|
|||
|
Accumulated depreciation and amortization
|
(955,383
|
)
|
(841,039
|
)
|
|||
|
Investment in hotel properties, net
|
$
|
3,368,674
|
|
$
|
3,674,999
|
|
|
For the years ended
December 31, 2016
,
2015
and
2014
, the Company recognized depreciation and amortization expense related to its investment in hotel properties of approximately
$162.2 million
,
$155.8 million
and
$143.9 million
, respectively.
Impairment
During the
year ended December 31, 2016
, the Company determined that there was
no
impairment of any assets.
During the
year ended December 31, 2015
, the Company recorded an impairment loss of
$1.0 million
related to
one
hotel property. The Company evaluated the recoverability of the hotel property's carrying value given the expectation to sell the hotel before the end of its previously estimated useful life. Based on an analysis of the estimated undiscounted net cash flows, the Company concluded that the carrying value of the hotel property was not recoverable. The Company estimated the fair value of the hotel property using a discounted cash flow analysis. In the analysis, the Company estimated the future net cash flows from the hotel property using the expected useful life and the holding period, and the applicable capitalization and discount rates.
During the
year ended December 31, 2014
, the Company recorded an impairment loss of
$9.2 million
related to
three
hotel properties. The Company evaluated the recoverability of the carrying values of the hotel properties given the expectation to sell certain hotels before the end of their previously estimated useful lives. Based on an analysis of the estimated undiscounted net cash flows, the Company concluded that the carrying values of the three hotel properties were not recoverable. The Company estimated the fair value of the hotel properties using a widely accepted revenue multiple valuation approach with significant unobservable inputs, including revenue growth projections and prevailing market multiples, from third-party sources.
4.
Acquisition of Hotel Properties
During the year ended December 31, 2016, the Company did not acquire any hotel properties.
During the year ended December 31, 2015, the Company acquired a
100%
interest in the following hotel properties:
|
Property Name
|
Location
|
Acquisition Date
|
Management Company
|
Rooms
|
Purchase Price (in thousands)
|
||||||||
|
Hyatt Place Washington DC Downtown K Street
|
Washington, DC
|
July 15, 2015
|
Aimbridge Hospitality
|
164
|
|
$
|
68,000
|
|
|||||
|
Homewood Suites Seattle Lynnwood
|
Lynnwood, WA
|
July 20, 2015
|
InnVentures
|
170
|
|
37,900
|
|
||||||
|
Residence Inn Palo Alto Los Altos (1)
|
Los Altos, CA
|
September 25, 2015
|
InnVentures
|
156
|
|
70,000
|
|
||||||
|
490
|
|
$
|
175,900
|
|
|||||||||
_______________________________________________________________________________
(1) In connection with this acquisition, the Company assumed a
$33.4 million
mortgage loan with a fair value at assumption of
$34.7 million
.
F-16
During the year ended December 31, 2014, the Company acquired a
100%
interest in the following properties:
|
Property
|
Location
|
Acquisition
Date |
Management
Company |
Rooms
|
Purchase Price
(in thousands) |
||||||||
|
Hyatt House Charlotte Center City
|
Charlotte, NC
|
March 12, 2014
|
Hyatt Affiliate
|
163
|
|
$
|
32,496
|
|
|||||
|
Hyatt House Cypress Anaheim
|
Cypress, CA
|
March 12, 2014
|
Hyatt Affiliate
|
142
|
|
14,753
|
|
||||||
|
Hyatt House Emeryville San Francisco Bay Area
|
Emeryville, CA
|
March 12, 2014
|
Hyatt Affiliate
|
234
|
|
39,274
|
|
||||||
|
Hyatt House San Diego Sorrento Mesa
|
San Diego, CA
|
March 12, 2014
|
Hyatt Affiliate
|
193
|
|
35,985
|
|
||||||
|
Hyatt House San Jose Silicon Valley
|
San Jose, CA
|
March 12, 2014
|
Hyatt Affiliate
|
164
|
|
44,159
|
|
||||||
|
Hyatt House San Ramon
|
San Ramon, CA
|
March 12, 2014
|
Hyatt Affiliate
|
142
|
|
20,833
|
|
||||||
|
Hyatt House Santa Clara
|
Santa Clara, CA
|
March 12, 2014
|
Hyatt Affiliate
|
150
|
|
40,570
|
|
||||||
|
Hyatt Market Street The Woodlands
|
The Woodlands, TX
|
March 12, 2014
|
Hyatt Corporation
|
70
|
|
25,817
|
|
||||||
|
Hyatt Place Fremont Silicon Valley
|
Fremont, CA
|
March 12, 2014
|
Hyatt Affiliate
|
151
|
|
23,525
|
|
||||||
|
Hyatt Place Madison Downtown
|
Madison, WI
|
March 12, 2014
|
Hyatt Affiliate
|
151
|
|
35,088
|
|
||||||
|
Courtyard Portland City Center
|
Portland, OR
|
May 22, 2014
|
Sage Hospitality
|
256
|
|
67,000
|
|
||||||
|
Embassy Suites Irvine Orange County
|
Irvine, CA
|
May 22, 2014
|
Sage Hospitality
|
293
|
|
53,000
|
|
||||||
|
Hilton Cabana Miami Beach
|
Miami, FL
|
June 19, 2014
|
Highgate Hotels
|
231
|
|
71,700
|
|
||||||
|
Hyatt Atlanta Midtown
|
Atlanta, GA
|
July 14, 2014
|
Interstate Hotels
and Resorts |
194
|
|
49,500
|
|
||||||
|
DoubleTree Grand Key Resort (1)
|
Key West, FL
|
September 11, 2014
|
Interstate Hotels
and Resorts |
215
|
|
78,250
|
|
||||||
|
|
|
|
|
2,749
|
|
$
|
631,950
|
|
|||||
_______________________________________________________________________________
(1)
Purchase price includes
$1.3 million
paid for
five
condominium units.
The allocation of the purchase price for the hotel properties acquired was as follows (in thousands):
|
For the year ended December 31,
|
|||||||
|
2015
|
2014
|
||||||
|
Land and improvements
|
$
|
31,692
|
|
$
|
164,396
|
|
|
|
Buildings and improvements
|
131,960
|
|
409,540
|
|
|||
|
Furniture, fixtures and equipment
|
13,517
|
|
57,575
|
|
|||
|
Intangible and other assets
|
—
|
|
439
|
|
|||
|
Fair value adjustment on mortgage debt assumed
|
(1,269
|
)
|
—
|
|
|||
|
Total purchase price
|
$
|
175,900
|
|
$
|
631,950
|
|
|
See Note
15
for the detail of the other assets acquired and the liabilities assumed in conjunction with the Company’s acquisitions.
For the hotel properties acquired during the year ended December 31, 2015, the total revenues and net loss from the date of acquisition through December 31, 2015 are included in the accompanying consolidated statements of operations as follows (in thousands):
|
For the year ended December 31, 2015
|
|||
|
Revenue
|
$
|
10,053
|
|
|
Net loss
|
$
|
(1,477
|
)
|
F-17
For the hotel properties acquired during the year ended December 31, 2014, the total revenues and net income from the date of acquisition through December 31, 2014 are included in the accompanying consolidated statements of operations as follows (in thousands):
|
For the year ended December 31, 2014
|
|||
|
Revenue
|
$
|
106,306
|
|
|
Net income
|
$
|
18,773
|
|
The following unaudited condensed pro forma financial information presents the results of operations as if the 2015 acquisitions had taken place on January 1, 2014, and the 2014 acquisitions had taken place on January 1, 2013. The unaudited condensed pro forma financial information is not necessarily indicative of what the actual results of operations of the Company would have been assuming the 2015 and 2014 acquisitions had taken place on January 1, 2014 and 2013, respectively, nor is it indicative of the results of operations for future periods. The unaudited condensed pro forma financial information is as follows (in thousands, except share and per share data):
|
For the year ended December 31,
|
|||||||
|
|
2015
|
2014
|
|||||
|
(unaudited)
|
|||||||
|
Revenue
|
$
|
1,149,453
|
|
$
|
1,165,303
|
|
|
|
Net income attributable to common shareholders
|
$
|
222,498
|
|
$
|
146,755
|
|
|
|
Net income per share attributable to common shareholders - basic
|
$
|
1.72
|
|
$
|
1.14
|
|
|
|
Net income per share attributable to common shareholders - diluted
|
$
|
1.71
|
|
$
|
1.14
|
|
|
|
Weighted-average number of shares outstanding - basic
|
128,444,469
|
|
127,360,669
|
|
|||
|
Weighted-average number of shares outstanding - diluted
|
128,967,754
|
|
128,293,843
|
|
|||
5.
Sale of Hotel Properties
During the year ended December 31, 2016, the Company sold
four
hotel properties in three separate transactions for a total sale price of approximately
$301.5 million
. In conjunction with these transactions, the Company recorded a
$45.9 million
gain on sale, which is included in the accompanying consolidated statement of operations, and a deferred gain of
$15.0 million
related to the Company's maximum exposure to loss with respect to certain post-closing obligations, which is included in accounts payable and other liabilities in the accompanying consolidated balance sheet.
The following table provides a list of the hotel properties that were sold during the year ended December 31, 2016:
|
Property Name
|
Location
|
Sale Date
|
Rooms
|
||||
|
Holiday Inn Express Merrillville
|
Merrillville, IN
|
February 22, 2016
|
62
|
|
|||
|
SpringHill Suites Bakersfield
|
Bakersfield, CA
|
November 30, 2016
|
119
|
|
|||
|
Hilton Garden Inn New York 35th Street
|
New York, NY
|
December 5, 2016
|
298
|
|
|||
|
Hilton New York Fashion District
|
New York, NY
|
December 5, 2016
|
280
|
|
|||
|
Total
|
759
|
|
|||||
During the year ended December 31, 2015, the Company sold
23
hotel properties in four separate transactions for a total sale price of approximately
$252.5 million
. In conjunction with these transactions, the Company recorded a
$28.4 million
gain on sale, which is included in the accompanying consolidated statement of operations.
F-18
The following table provides a list of the hotel properties that were sold during the year ended December 31, 2015:
|
Property Name
|
Location
|
Sale Date
|
Rooms
|
||||
|
Courtyard Chicago Schaumburg
|
Schaumburg, IL
|
February 23, 2015
|
162
|
|
|||
|
Courtyard Detroit Pontiac Bloomfield
|
Pontiac, MI
|
February 23, 2015
|
110
|
|
|||
|
Courtyard Grand Junction
|
Grand Junction, CO
|
February 23, 2015
|
136
|
|
|||
|
Courtyard Mesquite
|
Mesquite, TX
|
February 23, 2015
|
101
|
|
|||
|
Courtyard San Antonio Airport Northstar
|
San Antonio, TX
|
February 23, 2015
|
78
|
|
|||
|
Courtyard Tampa Brandon
|
Tampa, FL
|
February 23, 2015
|
90
|
|
|||
|
Fairfield Inn & Suites Merrillville
|
Merrillville, IN
|
February 23, 2015
|
112
|
|
|||
|
Fairfield Inn & Suites San Antonio Airport
|
San Antonio, TX
|
February 23, 2015
|
120
|
|
|||
|
Fairfield Inn & Suites Tampa Brandon
|
Tampa, FL
|
February 23, 2015
|
107
|
|
|||
|
Hampton Inn Merrillville
|
Merrillville, IN
|
February 23, 2015
|
64
|
|
|||
|
Holiday Inn Grand Rapids Airport
|
Kentwood, MI
|
February 23, 2015
|
148
|
|
|||
|
Homewood Suites Tampa Brandon
|
Tampa, FL
|
February 23, 2015
|
126
|
|
|||
|
Marriott Auburn Hills Pontiac at Centerpoint
|
Pontiac, MI
|
February 23, 2015
|
290
|
|
|||
|
Residence Inn Austin Round Rock
|
Round Rock, TX
|
February 23, 2015
|
96
|
|
|||
|
Residence Inn Chicago Schaumburg
|
Schaumburg, IL
|
February 23, 2015
|
125
|
|
|||
|
Residence Inn Detroit Pontiac Auburn Hills
|
Pontiac, MI
|
February 23, 2015
|
114
|
|
|||
|
Residence Inn Grand Junction
|
Grand Junction, CO
|
February 23, 2015
|
104
|
|
|||
|
Residence Inn Indianapolis Carmel
|
Carmel, IN
|
February 23, 2015
|
120
|
|
|||
|
SpringHill Suites Chicago Schaumburg
|
Schaumburg, IL
|
February 23, 2015
|
132
|
|
|||
|
SpringHill Suites Indianapolis Carmel
|
Carmel, IN
|
February 23, 2015
|
126
|
|
|||
|
Fairfield Inn & Suites Valparaiso
|
Valparaiso, IN
|
May 22, 2015
|
63
|
|
|||
|
Residence Inn South Bend
|
South Bend, IN
|
July 7, 2015
|
80
|
|
|||
|
Embassy Suites Columbus
|
Columbus, OH
|
October 14, 2015
|
221
|
|
|||
|
Total
|
2,825
|
|
|||||
During the year ended December 31, 2014, the Company sold
18
hotel properties in eight separate transactions for a total sale price of approximately
$137.8 million
. In conjunction with these transactions, the Company recorded a
$0.4 million
gain on sale, which is included in the accompanying consolidated statement of operations. Additionally, the Company completed a legal defeasance of the mortgage indebtedness secured by three of the hotel properties that were sold. The cost of the defeasance was approximately
$0.8 million
, which is included in interest expense in the accompanying consolidated statement of operations.
F-19
The following table provides a list of the hotel properties that were sold during the year ended December 31, 2014:
|
Property Name
|
Location
|
Sale Date
|
Rooms
|
||||
|
Courtyard Denver Southwest Lakewood
|
Lakewood, CO
|
February 20, 2014
|
90
|
|
|||
|
Residence Inn Denver Southwest Lakewood
|
Lakewood, CO
|
February 20, 2014
|
102
|
|
|||
|
Hyatt House Colorado Springs
|
Colorado Springs, CO
|
February 20, 2014
|
125
|
|
|||
|
SpringHill Suites Gainesville
|
Gainesville, FL
|
February 20, 2014
|
126
|
|
|||
|
Residence Inn Indianapolis Airport
|
Indianapolis, IN
|
February 20, 2014
|
95
|
|
|||
|
Fairfield Inn & Suites Indianapolis Airport
|
Indianapolis, IN
|
February 20, 2014
|
86
|
|
|||
|
Courtyard Grand Rapids Airport
|
Kentwood, MI
|
February 20, 2014
|
84
|
|
|||
|
Hampton Inn & Suites Las Vegas Red Rock Summerlin
|
Las Vegas, NV
|
February 20, 2014
|
106
|
|
|||
|
Courtyard Austin University Area
|
Austin, TX
|
February 20, 2014
|
198
|
|
|||
|
Fairfield Inn & Suites Austin University Area
|
Austin, TX
|
February 20, 2014
|
63
|
|
|||
|
Hyatt House Dallas Richardson
|
Richardson, TX
|
February 20, 2014
|
130
|
|
|||
|
Hilton Garden Inn St. George
|
St. George, UT
|
February 25, 2014
|
150
|
|
|||
|
Hilton Mystic
|
Mystic, CT
|
March 26, 2014
|
182
|
|
|||
|
Holiday Inn Austin NW Arboretum Area
|
Austin, TX
|
June 18, 2014
|
194
|
|
|||
|
Courtyard Benton Harbor St. Joseph
|
Benton Harbor, MI
|
December 16, 2014
|
98
|
|
|||
|
Courtyard Valparaiso
|
Valparaiso, IN
|
December 17, 2014
|
111
|
|
|||
|
Courtyard Merrillville
|
Merrillville, IN
|
December 18, 2014
|
112
|
|
|||
|
Courtyard Fort Wayne
|
Fort Wayne, IN
|
December 19, 2014
|
142
|
|
|||
|
Total
|
2,194
|
|
|||||
6
.
Debt
Term Loans and Revolver
The Company has the following unsecured credit agreements in place:
|
•
|
$400.0 million
revolving credit facility with a scheduled maturity date of April 22, 2020 with a
one
-year extension option if certain conditions are satisfied (the "Revolver");
|
|
•
|
$400.0 million
term loan with a scheduled maturity date of March 20, 2019 (the "$400 Million Term Loan Maturing 2019"). This term loan was referred to as the 2012 Five-Year Term Loan in periodic filings prior to the Company's quarterly report on Form 10-Q for the quarterly period ended June 30, 2016;
|
|
•
|
$225.0 million
term loan with a scheduled maturity date of November 20, 2019 (the "$225 Million Term Loan Maturing 2019"). This term loan was referred to as the 2012 Seven-Year Term Loan in periodic filings prior to the Company's quarterly report on Form 10-Q for the quarterly period ended June 30, 2016;
|
|
•
|
$400.0 million
term loan with a scheduled maturity date of April 22, 2021 (the "$400 Million Term Loan Maturing 2021"). This term loan was referred to as the 2013 Five-Year Term Loan in periodic filings prior to the Company's quarterly report on Form 10-Q for the quarterly period ended June 30, 2016; and
|
|
•
|
$150.0 million
term loan with a scheduled maturity date of January 22, 2022 (the "$150 Million Term Loan Maturing 2022"). This term loan was referred to as the 2014 Seven-Year Term Loan in periodic filings prior to the Company's quarterly report on Form 10-Q for the quarterly period ended June 30, 2016.
|
The $400 Million Term Loan Maturing 2019, the $225 Million Term Loan Maturing 2019, the $400 Million Term Loan Maturing 2021, and the $150 Million Term Loan Maturing 2022 are collectively the "Term Loans". The credit agreements contain certain financial covenants relating to the Company’s maximum leverage ratio, minimum fixed charge coverage ratio, minimum tangible net worth and maximum secured indebtedness. If an event of default exists, the Company is not permitted to make distributions to shareholders, other than those required to qualify for and maintain REIT status. As of
December 31, 2016
and
2015
, the Company was in compliance with all financial covenants.
F-20
The borrowings under the Revolver and Term Loans bear interest at variable rates equal to the London InterBank Offered Rate (“LIBOR”) plus an applicable margin. The margin ranges from
1.45%
to
3.00%
, depending on the Company’s leverage ratio, as calculated under the terms of each facility. The Company incurs an unused facility fee on the Revolver of between
0.20%
and
0.30%
, based on the amount by which the maximum borrowing amount exceeds the total principal balance of the outstanding borrowings.
Under the terms of the credit agreement for the Revolver,
one
or more standby letters of credit, up to a maximum aggregate outstanding balance of
$30.0 million
, may be issued on behalf of the Company by the lenders under the Revolver. The Company will incur a fee that shall be agreed upon with the issuing bank. Any outstanding standby letters of credit reduce the available borrowings on the Revolver by a corresponding amount. No standby letters of credit were outstanding at
December 31, 2016
. The Company also may borrow up to a maximum aggregate outstanding balance of
$40.0 million
of swingline loans. Any outstanding swingline loans reduce the available borrowings under the Revolver by a corresponding amount. There were no swingline loans outstanding at
December 31, 2016
.
As of
December 31, 2016
and
2015
, the Company had the following unsecured credit agreements (in thousands):
|
Outstanding Borrowings at
|
||||||||||||
|
Interest Rate at December 31, 2016 (1)
|
Maturity Date
|
December 31, 2016
|
December 31, 2015
|
|||||||||
|
Revolver (2)
|
2.27%
|
April 2020
|
$
|
—
|
|
$
|
—
|
|
||||
|
$400 Million Term Loan Maturing 2019
|
2.72%
|
March 2019
|
400,000
|
|
400,000
|
|
||||||
|
$225 Million Term Loan Maturing 2019
|
4.04%
|
November 2019
|
225,000
|
|
225,000
|
|
||||||
|
$400 Million Term Loan Maturing 2021
|
2.95%
|
April 2021
|
400,000
|
|
400,000
|
|
||||||
|
$150 Million Term Loan Maturing 2022
|
3.43%
|
January 2022
|
150,000
|
|
150,000
|
|
||||||
|
1,175,000
|
|
1,175,000
|
|
|||||||||
|
Deferred financing costs, net (3)
|
(5,692
|
)
|
(5,563
|
)
|
||||||||
|
Total
|
$
|
1,169,308
|
|
$
|
1,169,437
|
|
||||||
_______________________________________________________________________________
|
(1)
|
Interest rate at
December 31, 2016
gives effect to interest rate hedges.
|
|
(2)
|
At
December 31, 2016
and
2015
, there was
$400.0 million
and
$300.0 million
of borrowing capacity on the Revolver, respectively.
|
|
(3)
|
Excludes
$2.3 million
and
$0.8 million
as of
December 31, 2016
and
2015
, respectively, related to deferred financing costs on the Revolver, which are included in prepaid expense and other assets in the accompanying consolidated balance sheets.
|
Mortgage Loans
As of
December 31, 2016
and
2015
, the Company had the following mortgage loans (in thousands):
|
|
Principal balance at
|
|||||||||||||||||
|
Lender
|
Number of Assets Encumbered
|
Interest Rate at December 31, 2016 (1)
|
|
Maturity Date
|
|
December 31, 2016
|
December 31, 2015
|
|||||||||||
|
Wells Fargo
|
4
|
4.01%
|
(2)
|
October 2017
|
(3)
|
$
|
150,000
|
|
$
|
150,000
|
|
|||||||
|
Wells Fargo (4)
|
4
|
4.04%
|
|
March 2018
|
(3)
|
146,250
|
|
149,250
|
|
|||||||||
|
PNC Bank (5)
|
5
|
2.87%
|
(2)
|
March 2021
|
(6)
|
85,000
|
|
74,000
|
|
|||||||||
|
Wells Fargo (7)
|
1
|
5.25%
|
June 2022
|
|
33,666
|
|
34,505
|
|
||||||||||
|
|
|
414,916
|
|
407,755
|
|
|||||||||||||
|
Deferred financing costs, net
|
(1,509
|
)
|
(1,706
|
)
|
||||||||||||||
|
14
|
$
|
413,407
|
|
$
|
406,049
|
|
||||||||||||
_______________________________________________________________________________
|
(1)
|
Interest rate at
December 31, 2016
gives effect to interest rate hedges.
|
|
(2)
|
Requires payments of interest only through maturity.
|
|
(3)
|
Maturity date may be extended for
four
one
-year terms at the Company’s option, subject to certain lender requirements.
|
|
(4)
|
Two
of the four hotels encumbered by the Wells Fargo loan are cross-collateralized.
|
|
(5)
|
The
five
hotels encumbered by the PNC Bank loan are cross-collateralized.
|
|
(6)
|
Maturity date may be extended for
two
one
-year terms at the Company’s option, subject to certain lender requirements.
|
|
(7)
|
Includes
$1.0 million
and
$1.2 million
at
December 31, 2016
and
2015
, respectively, related to a fair value adjustment on mortgage debt assumed in conjunction with an acquisition.
|
F-21
Certain mortgage agreements are subject to customary financial covenants. The Company was in compliance with all financial covenants at
December 31, 2016
and
2015
.
Interest Expense
For the years ended
December 31, 2016
,
2015
and
2014
, the components of interest expense were as follows (in thousands):
|
For the year ended December 31,
|
|||||||||||
|
2016
|
2015
|
2014
|
|||||||||
|
Mortgage loans
|
$
|
16,006
|
|
$
|
16,500
|
|
$
|
23,282
|
|
||
|
Term Loans and Revolver
|
38,849
|
|
35,898
|
|
29,560
|
|
|||||
|
Loss on defeasance
|
—
|
|
—
|
|
804
|
|
|||||
|
Amortization of deferred financing costs
|
3,965
|
|
4,164
|
|
4,298
|
|
|||||
|
Capitalized interest
|
—
|
|
(1,774
|
)
|
(1,134
|
)
|
|||||
|
Total interest expense
|
$
|
58,820
|
|
$
|
54,788
|
|
$
|
56,810
|
|
||
Future Minimum Principal Payments
As of
December 31, 2016
, the future minimum principal payments on the debt were as follows (in thousands):
|
2017
|
$
|
153,548
|
|
|
2018
|
143,876
|
|
|
|
2019
|
625,660
|
|
|
|
2020
|
691
|
|
|
|
2021
|
485,734
|
|
|
|
Thereafter
|
179,389
|
|
|
|
Total (1)
|
$
|
1,588,898
|
|
_______________________________________________________________________________
|
(1)
|
Excludes
$1.0 million
related to a fair value adjustment on mortgage debt assumed in conjunction with an acquisition.
|
F-22
7.
Derivatives and Hedging
As of
December 31, 2016
and
December 31, 2015
, the Company had entered into the following interest rate swaps (in thousands):
|
Notional value at
|
Fair value at
|
|||||||||||||||||||
|
Hedge type
|
December 31, 2016
|
December 31, 2015
|
Interest rate
|
Maturity
|
December 31, 2016
|
December 31, 2015
|
||||||||||||||
|
Swap-cash flow
|
$
|
275,000
|
|
$
|
275,000
|
|
1.12%
|
November 2017
|
$
|
(558
|
)
|
$
|
(1,014
|
)
|
||||||
|
Swap-cash flow
|
175,000
|
|
175,000
|
|
1.56%
|
March 2018
|
(1,251
|
)
|
(2,190
|
)
|
||||||||||
|
Swap-cash flow
|
175,000
|
|
175,000
|
|
1.64%
|
March 2018
|
(1,413
|
)
|
(2,478
|
)
|
||||||||||
|
Swap-cash flow
|
16,088
|
|
16,418
|
|
1.83%
|
September 2018
|
(193
|
)
|
(312
|
)
|
||||||||||
|
Swap-cash flow
|
16,088
|
|
16,418
|
|
1.75%
|
September 2018
|
(172
|
)
|
(279
|
)
|
||||||||||
|
Swap-cash flow
|
39,488
|
|
40,298
|
|
1.83%
|
September 2018
|
(474
|
)
|
(765
|
)
|
||||||||||
|
Swap-cash flow
|
40,462
|
|
41,292
|
|
1.75%
|
September 2018
|
(433
|
)
|
(701
|
)
|
||||||||||
|
Swap-cash flow
|
17,550
|
|
17,910
|
|
1.83%
|
September 2018
|
(211
|
)
|
(340
|
)
|
||||||||||
|
Swap-cash flow
|
16,575
|
|
16,915
|
|
1.75%
|
September 2018
|
(177
|
)
|
(287
|
)
|
||||||||||
|
Swap-cash flow
|
125,000
|
|
125,000
|
|
2.02%
|
March 2019
|
(2,090
|
)
|
(3,186
|
)
|
||||||||||
|
Swap-cash flow
|
100,000
|
|
100,000
|
|
1.94%
|
March 2019
|
(1,505
|
)
|
(2,308
|
)
|
||||||||||
|
Swap-cash flow
|
125,000
|
|
125,000
|
|
1.27%
|
March 2019
|
54
|
|
(115
|
)
|
||||||||||
|
Swap-cash flow (1)
|
100,000
|
|
100,000
|
|
1.96%
|
March 2019
|
(516
|
)
|
(321
|
)
|
||||||||||
|
Swap-cash flow (1)
|
50,000
|
|
50,000
|
|
1.85%
|
March 2019
|
(184
|
)
|
(87
|
)
|
||||||||||
|
Swap-cash flow (1)
|
50,000
|
|
50,000
|
|
1.81%
|
March 2019
|
(159
|
)
|
(62
|
)
|
||||||||||
|
Swap-cash flow (1)
|
25,000
|
|
25,000
|
|
1.74%
|
March 2019
|
(57
|
)
|
(9
|
)
|
||||||||||
|
Swap-cash flow (2)
|
33,000
|
|
33,000
|
|
1.80%
|
September 2020
|
111
|
|
98
|
|
||||||||||
|
Swap-cash flow (2)
|
82,000
|
|
82,000
|
|
1.80%
|
September 2020
|
277
|
|
245
|
|
||||||||||
|
Swap-cash flow (2)
|
35,000
|
|
35,000
|
|
1.80%
|
September 2020
|
118
|
|
104
|
|
||||||||||
|
Swap-cash flow
|
143,000
|
|
143,000
|
|
1.81%
|
October 2020
|
(1,113
|
)
|
(2,196
|
)
|
||||||||||
|
Swap-cash flow (3)
|
100,000
|
|
—
|
|
1.15%
|
April 2021
|
2,513
|
|
—
|
|
||||||||||
|
Swap-cash flow (3)
|
100,000
|
|
—
|
|
1.20%
|
April 2021
|
2,360
|
|
—
|
|
||||||||||
|
Swap-cash flow (3)
|
75,000
|
|
—
|
|
2.15%
|
April 2021
|
(410
|
)
|
—
|
|
||||||||||
|
Swap-cash flow
|
50,000
|
|
50,000
|
|
1.61%
|
June 2021
|
224
|
|
(97
|
)
|
||||||||||
|
Swap-cash flow
|
50,000
|
|
50,000
|
|
1.56%
|
June 2021
|
352
|
|
59
|
|
||||||||||
|
Swap-cash flow
|
50,000
|
|
50,000
|
|
1.71%
|
June 2021
|
5
|
|
(361
|
)
|
||||||||||
|
$
|
2,064,251
|
|
$
|
1,792,251
|
|
$
|
(4,902
|
)
|
$
|
(16,602
|
)
|
|||||||||
_______________________________________________________________________________
|
(1)
|
Effective between the maturity of the existing swap in November 2017 and the maturity of the debt in March 2019.
|
|
(2)
|
Effective between the maturity of the existing swaps in September 2018 and September 2020.
|
|
(3)
|
Effective between the maturity of the existing swaps in March 2018 and the maturity of the debt in April 2021.
|
As of
December 31, 2016
and
2015
, the aggregate fair value of the interest rate swap liabilities of
$10.9 million
and
$17.1 million
, respectively, was included in accounts payable and other liabilities in the accompanying consolidated balance sheets. At
December 31, 2016
and
2015
, the aggregate fair value of the interest rate swap assets of
$6.0 million
and
$0.5 million
was included in prepaid expense and other assets in the accompanying consolidated balance sheets.
As of
December 31, 2016
and
2015
, there was approximately
$4.9 million
and
$16.6 million
, respectively, in unrealized
losses
included in accumulated other comprehensive loss related to interest rate hedges that are effective in offsetting the variable cash flows. There was
no
ineffectiveness recorded on the designated hedges during the years ended
December 31, 2016
and
2015
. For the years ended
December 31, 2016
and
2015
, approximately
$15.9 million
and
$18.2 million
, respectively, of amounts included in accumulated other comprehensive loss were reclassified into interest expense. Approximately
$9.5 million
of the net unrealized losses included in accumulated other comprehensive loss at
December 31, 2016
is expected to be reclassified into interest expense within the next 12 months.
F-23
8.
Fair Value
Fair Value Measurement
Fair value is defined as the price that would be received upon the sale of an asset or paid to transfer a liability in an orderly transaction between market participants at the measurement date in the principal or most advantageous market. The fair value hierarchy has three levels of inputs, both observable and unobservable:
|
•
|
Level 1 — Inputs include quoted market prices in an active market for identical assets or liabilities.
|
|
•
|
Level 2 — Inputs are market data, other than Level 1, that are observable either directly or indirectly. Level 2 inputs include quoted market prices for similar assets or liabilities, quoted market prices in an inactive market, and other observable information that can be corroborated by market data.
|
|
•
|
Level 3 — Inputs are unobservable and corroborated by little or no market data.
|
Fair Value of Financial Instruments
The Company used the following market assumptions and/or estimation methods:
|
•
|
Cash and cash equivalents, restricted cash reserves, hotel and other receivables, accounts payable and other liabilities — The carrying amounts reported in the consolidated balance sheets for these financial instruments approximate fair value because of their short term maturities.
|
|
•
|
Mortgage loans, Term Loans and Revolver — The carrying amounts reported in the consolidated balance sheets for these financial instruments approximate fair value because the interest rates are at, or approximate, market interest rates. The Company determined that its mortgage loans, Term Loans and Revolver are classified in Level 3 of the fair value hierarchy.
|
Recurring Fair Value Measurements
The following table presents the Company’s fair value hierarchy for those financial assets and liabilities measured at fair value on a recurring basis as of
December 31, 2016
(in thousands):
|
Fair Value at December 31, 2016
|
|||||||||||||||
|
Level 1
|
Level 2
|
Level 3
|
Total
|
||||||||||||
|
Interest rate swap asset
|
$
|
—
|
|
$
|
6,014
|
|
$
|
—
|
|
$
|
6,014
|
|
|||
|
Interest rate swap liability
|
—
|
|
(10,916
|
)
|
—
|
|
(10,916
|
)
|
|||||||
|
Total
|
$
|
—
|
|
$
|
(4,902
|
)
|
$
|
—
|
|
$
|
(4,902
|
)
|
|||
The following table presents the Company’s fair value hierarchy for those financial assets and liabilities measured at fair value on a recurring basis as of
December 31, 2015
(in thousands):
|
Fair Value at December 31, 2015
|
|||||||||||||||
|
Level 1
|
Level 2
|
Level 3
|
Total
|
||||||||||||
|
Interest rate swap asset
|
$
|
—
|
|
$
|
506
|
|
$
|
—
|
|
$
|
506
|
|
|||
|
Interest rate swap liability
|
—
|
|
(17,108
|
)
|
—
|
|
(17,108
|
)
|
|||||||
|
Total
|
$
|
—
|
|
$
|
(16,602
|
)
|
$
|
—
|
|
$
|
(16,602
|
)
|
|||
F-24
The fair values of the derivative financial instruments are determined using widely accepted valuation techniques including a discounted cash flow analysis on the expected cash flows for each derivative. The Company determined that the significant inputs, such as interest yield curves and discount rates, used to value its derivatives fall within Level 2 of the fair value hierarchy and that the credit valuation adjustments associated with the Company’s counterparties and its own credit risk utilize Level 3 inputs, such as estimates of current credit spreads to evaluate the likelihood of default by itself and its counterparties. As of
December 31, 2016
, the Company assessed the significance of the impact of the credit valuation adjustments on the overall valuation of its derivative positions and determined that the credit valuation adjustments were not significant to the overall valuation of its derivatives. As a result, the Company determined that its derivative valuations in their entirety are classified in Level 2 of the fair value hierarchy.
9.
Commitments and Contingencies
Ground Leases
As of
December 31, 2016
,
eight
of our hotels were subject to ground lease agreements that cover the land underlying the respective hotels. The total ground rent expense was
$5.4 million
,
$5.5 million
and
$5.3 million
for the years ended
December 31, 2016
,
2015
and
2014
, respectively.
The Residence Inn Chicago Oak Brook is subject to a ground lease with an initial term that expires on March 6, 2100. After the initial term, we may extend the ground lease for an additional renewal term of
99
years. The ground rent expense was de minimis for each of the years ended
December 31, 2016
,
2015
and
2014
, respectively.
The Marriott Louisville Downtown is subject to a ground lease with an initial term extending out to 2053. The ground lease may be extended for up to
four
additional
twenty-five
year terms at the Company's option. The ground rent expense was de minimis for each of the years ended
December 31, 2016
,
2015
and
2014
, respectively.
The Courtyard Austin Downtown Convention Center and Residence Inn Austin Downtown Convention Center are subject to a ground lease with a term expiring in 2100. The ground rent expense was
$0.9 million
,
$1.0 million
and
$0.8 million
for the years ended
December 31, 2016
,
2015
and
2014
, respectively.
The Hilton Garden Inn Bloomington is subject to a ground lease with an initial term expiring in 2053. The ground lease automatically extends for up to
five
additional
ten
-year terms unless certain conditions are met. The ground rent expense was de minimis for each of the years ended
December 31, 2016
,
2015
and
2014
, respectively.
The Hilton Garden Inn Bloomington is also subject to an agreement to lease parking spaces with an initial term expiring in 2033. The agreement to lease parking spaces may be extended if certain events occur. The ground rent expense was de minimis for each of the years ended
December 31, 2016
,
2015
and
2014
, respectively.
A portion of the site of the Courtyard Charleston Historic District is subject to a ground lease with a term expiring in 2096. The ground rent expense was
$1.0 million
for each of the years ended
December 31, 2016
,
2015
and
2014
, respectively.
The Courtyard Waikiki Beach is subject to a ground lease with a term expiring in 2112. The ground rent expense was
$3.4 million
for each of the years ended
December 31, 2016
,
2015
and
2014
.
A portion of the site of the Residence Inn Palo Alto Los Altos is subject to a ground lease with a term expiring in 2033. The ground rent expense was
$0.1 million
and de minimis for the years ended
December 31, 2016
and
2015
, respectively. There was
no
ground rent expense in 2014 as this hotel property was acquired in September of 2015.
The Hampton Inn Garden City was subject to a ground lease that expired on December 31, 2016. The lease then reverted to a fee simple ownership interest. The ground rent expense was de minimis for each of the years ended
December 31, 2016
,
2015
and
2014
, respectively.
As of
December 31, 2016
, the future minimum ground lease payments were as follows (in thousands):
|
2017
|
2018
|
2019
|
2020
|
2021
|
Thereafter
|
Total
|
|||||||||||||||||||||
|
Future minimum ground lease payments
|
$
|
4,711
|
|
$
|
4,713
|
|
$
|
4,716
|
|
$
|
4,718
|
|
$
|
4,721
|
|
$
|
415,859
|
|
$
|
439,438
|
|
||||||
F-25
Restricted Cash Reserves
The Company is obligated to maintain cash reserve funds for future capital expenditures at the hotels (including the periodic replacement or refurbishment of FF&E) as determined pursuant to the management agreements, franchise agreements and/or mortgage loan documents. The management agreements, franchise agreements and/or mortgage loan documents require the Company to reserve cash ranging typically from
3.0%
to
5.0%
of the individual hotel’s revenues and maintain the reserves in restricted cash reserve escrows. Any unexpended amounts will remain the property of the Company upon termination of the management agreements, franchise agreements or mortgage loan documents. As of
December 31, 2016
and
2015
, approximately
$67.2 million
and
$55.5 million
, respectively, was available in the restricted cash reserves for future capital expenditures, real estate taxes and insurance.
Litigation
Neither the Company nor any of its subsidiaries is currently involved in any regulatory or legal proceedings that management believes will have a material and adverse effect on the Company's financial position, results of operations or cash flows.
Management Agreements
As of
December 31, 2016
,
122
of the Company's hotel properties were operated pursuant to long-term management agreements with initial terms ranging from
3
to
25
years, with
15
different hotel management companies as noted in the table below. This number includes four and ten hotels that receive the benefits of a franchise agreement pursuant to management agreements with Marriott and Hyatt, respectively.
|
Management Company
|
Number of
Hotels |
|
|
Aimbridge Hospitality
|
3
|
|
|
Concord Hospitality Enterprises Company
|
1
|
|
|
Crestline Hotels and Resorts
|
1
|
|
|
Davidson Hotels and Resorts
|
1
|
|
|
Embassy Suites Management
|
3
|
|
|
HEI Hotels and Resorts
|
1
|
|
|
Highgate Hotels
|
4
|
|
|
Hyatt Corporation and affiliates
|
10
|
|
|
Interstate Hotels and Resorts
|
11
|
|
|
InnVentures
|
3
|
|
|
K Partners Hospitality Group
|
1
|
|
|
Marriott Hotel Services
|
4
|
|
|
Sage Hospitality
|
4
|
|
|
Urgo Hotels
|
4
|
|
|
WLS
|
71
|
|
|
122
|
||
Each management company receives a base management fee generally between
3.0%
and
3.5%
of hotel revenues. Management agreements that include the benefits of a franchise agreement incur a base management fee generally equal to
7.0%
of hotel revenues. The management companies are also eligible to receive an incentive management fee if hotel operating income, as defined in the management agreements, exceeds certain thresholds. The incentive management fee is generally calculated as a percentage of hotel operating income after the Company has received a priority return on its investment in the hotel. Management fees are included in management and franchise fee expense in the accompanying consolidated statements of operations.
For the years ended
December 31, 2016
,
2015
and
2014
, the Company incurred management fee expense, including amortization of deferred management fees, of approximately
$44.3 million
,
$44.1 million
and
$43.2 million
, respectively.
F-26
Franchise Agreements
As of
December 31, 2016
,
108
of the Company's hotel properties are operated under franchise agreements with initial terms ranging from
10
to
30
years. This number excludes four and ten hotels that receive the benefits of a franchise agreement pursuant to management agreements with Marriott and Hyatt, respectively. Franchise agreements allow the hotel properties to operate under the respective brands. Pursuant to the franchise agreements, the Company pays a royalty fee, generally between
4.0%
and
6.0%
of room revenue, plus additional fees for marketing, central reservation systems and other franchisor costs generally between
1.0%
and
4.3%
of room revenue. Certain hotels are also charged a royalty fee generally between
1.5%
and
3.0%
of food and beverage revenues. Franchise fees are included in management and franchise fee expense in the accompanying consolidated statements of operations.
For the years ended
December 31, 2016
,
2015
and
2014
, the Company incurred franchise fee expense of approximately
$73.9 million
,
$72.3 million
and
$71.6 million
, respectively.
10. Equity
Common Shares of Beneficial Interest
Under the declaration of trust for the Company, there are
450,000,000
common shares authorized for issuance.
On May 22, 2014, the Company issued and sold
9,200,000
common shares of beneficial interest at a price per share of
$26.45
, for total gross proceeds of
$243.3
million. The Company received aggregate net proceeds of approximately
$232.7 million
.
On May 1, 2015, the Company's board of trustees authorized a share repurchase program to acquire up to
$200.0 million
of the Company's common shares through April 30, 2016. On October 30, 2015, the Company's board of trustees extended the duration of the share repurchase program to December 31, 2016 and increased the amount by
$200.0 million
to a total of
$400.0 million
. Between May 1, 2015 and December 31, 2015, the Company repurchased and retired
8,044,372
of its common shares for approximately
$225.2 million
. During the year ended December 31, 2016, the Company repurchased and retired
610,607
of its common shares for approximately
$13.3 million
. On February 17, 2017, the Company's board of trustees extended the duration of the share repurchase program to February 28, 2018 and increased the authorized amount that may be repurchased by
$40.0 million
to a total of
$440.0 million
.
Preferred Shares of Beneficial Interest
Under the declaration of trust for the Company, there are
50,000,000
preferred shares authorized for issuance. As of both
December 31, 2016
and
2015
, there were
no
preferred shares of beneficial interest outstanding.
Noncontrolling Interest in Consolidated Joint Venture
As of
December 31, 2016
, the Company consolidated DBT Met Hotel Venture, LP, a majority-owned limited partnership that has a third-party partner that owns a noncontrolling
1.7%
ownership interest in the joint venture. The third-party ownership interest is included in the noncontrolling interest in consolidated joint venture on the consolidated balance sheets.
Noncontrolling Interest in the Operating Partnership
The Company consolidates the Operating Partnership, which is a majority-owned limited partnership that has a noncontrolling interest. As of
December 31, 2016
, the Operating Partnership had
124,922,928
OP units outstanding, of which
99.6%
of the outstanding OP units were owned by the Company and its subsidiaries, and the noncontrolling
0.4%
ownership interest was owned by other limited partners. The outstanding OP units held by the limited partners are redeemable for cash, or at the option of the Company, for a like number of common shares of beneficial interest of the Company. During the year ended December 31, 2016, the Company issued
335,250
common shares of beneficial interest in exchange for redeemed units. After the redemption,
558,750
outstanding OP units are held by the limited partners. The noncontrolling interest is included in the noncontrolling interest in the Operating Partnership on the consolidated balance sheets.
F-27
11
.
Equity Incentive Plan
On May 1, 2015, the Company’s shareholders approved the RLJ Lodging Trust 2015 Equity Incentive Plan (the "2015 Plan"), which constitutes an amendment and restatement of the RLJ Lodging Trust 2011 Equity Incentive Plan (the "2011 Plan"), including an increase in the total number of available shares under the 2015 Plan by
2,500,000
shares and changes to certain other terms of the 2011 Plan. The Company may issue share-based awards to officers, employees, non-employee trustees and other eligible persons under the 2015 Plan. The 2015 Plan provides for a maximum of
7,500,000
common shares of beneficial interest to be issued in the form of share options, share appreciation rights, restricted share awards, unrestricted share awards, share units, dividend equivalent rights, long-term incentive units, other equity-based awards and cash bonus awards.
Share Awards
From time to time, the Company may award unvested restricted shares under the 2015 Plan as compensation to officers, employees and non-employee trustees. The issued shares vest over a period of time as determined by the board of trustees at the date of grant. The Company recognizes compensation expense for time-based unvested restricted shares on a straight-line basis over the vesting period based upon the fair market value of the shares on the date of issuance, adjusted for forfeitures.
Non-employee trustees may also elect to receive unrestricted shares under the 2015 Plan as compensation that would otherwise be paid in cash for their services. The shares issued to non-employee trustees in lieu of cash compensation are unrestricted and include no vesting conditions. The Company recognizes compensation expense for the unrestricted shares issued in lieu of cash compensation on the date of issuance based upon the fair market value of the shares on that date.
A summary of the unvested restricted shares is as follows:
|
|
2016
|
2015
|
2014
|
|||||||||||||||||
|
|
Number of
Shares |
Weighted-Average
Grant Date Fair Value |
Number of
Shares |
Weighted-Average
Grant Date Fair Value |
Number of
Shares |
Weighted-Average
Grant Date Fair Value |
||||||||||||||
|
Unvested at January 1,
|
540,885
|
|
$
|
26.73
|
|
731,459
|
|
$
|
21.21
|
|
932,800
|
|
$
|
18.99
|
|
|||||
|
Granted (1)
|
675,375
|
|
20.59
|
|
292,505
|
|
32.10
|
|
348,234
|
|
24.46
|
|
||||||||
|
Vested (1)
|
(272,780
|
)
|
23.66
|
|
(470,703
|
)
|
21.52
|
|
(537,988
|
)
|
19.44
|
|
||||||||
|
Forfeited (2)
|
(294,033
|
)
|
23.70
|
|
(12,376
|
)
|
25.65
|
|
(11,587
|
)
|
22.89
|
|
||||||||
|
Unvested at December 31,
|
649,447
|
|
$
|
23.00
|
|
540,885
|
|
$
|
26.73
|
|
731,459
|
|
$
|
21.21
|
|
|||||
_______________________________________________________________________________
|
(1)
|
For the years ended
December 31, 2016
,
2015
and
2014
, the Company issued
2,554
,
5,008
and
4,347
, respectively, unrestricted shares in lieu of cash compensation to non-employee trustees at a weighted-average grant date fair value of
$22.26
,
$26.43
and
$29.31
, respectively.
|
|
(2)
|
Includes the forfeiture of
285,926
unvested restricted shares upon the resignation of the Company's President and Chief Executive Officer in May 2016.
|
For the years ended
December 31, 2016
,
2015
and
2014
, the Company recognized approximately
$6.9 million
,
$9.6 million
and
$10.6 million
, respectively, of share-based compensation expense related to the restricted share awards, which includes a benefit of
$0.5 million
for the year ended December 31, 2016 as a result of the forfeiture of unvested restricted shares upon the resignation of the Company's President and Chief Executive Officer in May 2016. As of
December 31, 2016
, there was
$13.6 million
of total unrecognized compensation costs related to unvested restricted share awards and these costs are expected to be recognized over a weighted-average period of
2.4
years. The total fair value of the shares vested (calculated as the number of shares multiplied by the vesting date share price) during the years ended
December 31, 2016
,
2015
and
2014
was approximately
$5.8 million
,
$14.0 million
and
$15.5 million
, respectively.
F-28
Performance Units
In July 2012, the Company awarded performance units to certain employees. The performance units vested over a
four
-year period, including
three
years of performance-based vesting (the "2012 performance units measurement period") plus an additional
one
year of time-based vesting. In July 2015, following the end of the 2012 performance units measurement period, the Company issued
838,934
restricted shares upon conversion of the performance units. Half of the restricted shares vested immediately and the remaining half vested in July 2016. In May 2016,
133,467
unvested restricted shares related to the conversion of the performance units were forfeited upon the resignation of the Company's President and Chief Executive Officer.
In May 2016, the Company awarded
280,000
performance units with a grant date fair value of
$10.31
per unit to certain employees. The performance units vest over a
four
-year period, including
three years
of performance-based vesting (the “2016 performance units measurement period”) plus an additional
one year
of time-based vesting. These performance units may convert into restricted shares at a range of
25%
to
150%
of the number of performance units granted contingent upon the Company achieving an absolute total shareholder return and a relative total shareholder return over the measurement period at specified percentiles of the peer group, as defined by the award. If at the end of the 2016 performance units measurement period the target criterion is met, then
50%
of the restricted shares will vest immediately. The remaining
50%
will vest one year later. The award recipients will not be entitled to receive any dividends prior to the date of conversion. For any restricted shares issued upon conversion, the award recipient will be entitled to receive payment of an amount equal to all dividends that would have been paid if such restricted shares had been issued at the beginning of the 2016 performance units measurement period. The fair value of the performance units is determined using a Monte Carlo simulation with the following assumptions: a risk-free interest rate of
1.05%
, volatility of
23.82%
, and an expected term equal to the requisite service period for the awards. The Company estimated the compensation expense for the performance units on a straight line basis using a calculation that recognizes
50%
of the grant date fair value over
three years
and
50%
of the grant date fair value over
four years
.
For the year ended
December 31, 2016
, the Company recognized a share-based compensation benefit of
$0.9 million
related to the performance unit awards, which included a benefit of
$2.3 million
as a result of the forfeiture of unvested restricted shares related to the conversion of the performance units upon the resignation of the Company's President and Chief Executive Officer in May 2016. For the years ended
December 31, 2015
and
2014
, the Company recognized
$3.4 million
and
$4.5 million
, respectively, of share-based compensation expense related to the performance unit awards. As of
December 31, 2016
, there was
$2.3 million
of total unrecognized compensation cost related to the performance unit awards and these costs are expected to be recognized over a weighted-average period of
2.9
years. The total fair value of the vested restricted shares related to the conversion of the performance units (calculated as the number of restricted shares issued multiplied by the vesting date share price) during the year ended
December 31, 2016
was approximately
$6.7 million
.
As of
December 31, 2016
, there were
3,874,542
common shares available for future grant under the 2015 Plan.
12.
Earnings per Common Share
Basic earnings per common share is calculated by dividing net income attributable to common shareholders by the weighted-average number of common shares outstanding during the period excluding the weighted-average number of unvested restricted shares outstanding during the period. Diluted earnings per common share is calculated by dividing net income attributable to common shareholders by the weighted-average number of common shares outstanding during the period, plus any shares that could potentially be outstanding during the period. The potential shares consist of the unvested restricted share grants and unvested performance units, calculated using the treasury stock method. Any anti-dilutive shares have been excluded from the diluted earnings per share calculation.
Unvested share-based payment awards that contain non-forfeitable rights to dividends or dividend equivalents (whether paid or unpaid) are participating shares and are considered in the computation of earnings per share pursuant to the two-class method. If there were any undistributed earnings allocable to participating shares, they would be deducted from net income attributable to common shareholders used in the basic and diluted earnings per share calculations.
The limited partners’ outstanding limited partnership units in the Operating Partnership (which may be redeemed for common shares of beneficial interest under certain circumstances) have been excluded from the diluted earnings per share calculation as there was no effect on the amounts for the years ended
December 31, 2016
,
2015
and
2014
, since the limited partners’ share of income would also be added back to net income attributable to common shareholders.
F-29
The computation of basic and diluted earnings per common share is as follows (in thousands, except share and per share data):
|
|
For the year ended December 31,
|
||||||||||
|
|
2016
|
2015
|
2014
|
||||||||
|
Numerator:
|
|
|
|
|
|||||||
|
Net income attributable to common shareholders
|
$
|
200,352
|
|
$
|
218,221
|
|
$
|
135,441
|
|
||
|
Less: Dividends paid on unvested restricted shares
|
(1,105
|
)
|
(1,180
|
)
|
(951
|
)
|
|||||
|
Less: Undistributed earnings attributable to unvested restricted shares
|
(188
|
)
|
(378
|
)
|
—
|
|
|||||
|
Net income attributable to common shareholders excluding amounts attributable to unvested restricted shares
|
$
|
199,059
|
|
$
|
216,663
|
|
$
|
134,490
|
|
||
|
Denominator:
|
|
|
|
|
|||||||
|
Weighted-average number of common shares - basic
|
123,651,003
|
|
128,444,469
|
|
127,360,669
|
|
|||||
|
Unvested restricted shares
|
228,004
|
|
523,285
|
|
316,020
|
|
|||||
|
Unvested performance units
|
—
|
|
—
|
|
617,154
|
|
|||||
|
Weighted-average number of common shares - diluted
|
123,879,007
|
|
128,967,754
|
|
128,293,843
|
|
|||||
|
Net income per share attributable to common shareholders - basic
|
$
|
1.61
|
|
$
|
1.69
|
|
$
|
1.06
|
|
||
|
Net income per share attributable to common shareholders - diluted
|
$
|
1.61
|
|
$
|
1.68
|
|
$
|
1.05
|
|
||
F-30
13. Income Taxes
For federal income tax purposes, the cash distributions to shareholders are characterized as follows:
|
For the Years Ended December 31,
|
|||||
|
2016
|
2015
|
||||
|
Common distributions:
|
|||||
|
Ordinary income
|
87.0
|
%
|
100.0
|
%
|
|
|
Return of capital
|
—
|
|
—
|
|
|
|
Capital gains
|
13.0
|
%
|
—
|
|
|
|
100.0
|
%
|
100.0
|
%
|
||
The components of the income tax provision from continuing operations are as follows (in thousands):
|
For the Years Ended December 31,
|
|||||||||||
|
2016
|
2015
|
2014
|
|||||||||
|
Current:
|
|||||||||||
|
Federal
|
$
|
(76
|
)
|
$
|
(287
|
)
|
$
|
(244
|
)
|
||
|
State
|
(1,113
|
)
|
(1,145
|
)
|
(1,543
|
)
|
|||||
|
Deferred:
|
|||||||||||
|
Federal
|
(6,141
|
)
|
36,359
|
|
572
|
|
|||||
|
State
|
(860
|
)
|
4,199
|
|
70
|
|
|||||
|
Total net tax (expense) benefit
|
$
|
(8,190
|
)
|
$
|
39,126
|
|
$
|
(1,145
|
)
|
||
The provision for income taxes differs from the amount of income tax determined by applying the applicable U.S. statutory federal income tax rate to pretax income from continuing operations as a result of the following differences (in thousands):
|
For the Years Ended December 31,
|
|||||||||||
|
2016
|
2015
|
2014
|
|||||||||
|
Expected federal tax expense at statutory rate
|
$
|
(73,327
|
)
|
$
|
(63,240
|
)
|
$
|
(47,906
|
)
|
||
|
Tax impact of REIT election
|
68,477
|
|
62,391
|
|
45,842
|
|
|||||
|
Expected tax expense at TRS
|
(4,850
|
)
|
(849
|
)
|
(2,064
|
)
|
|||||
|
Change in valuation allowance
|
(1,254
|
)
|
41,147
|
|
2,203
|
|
|||||
|
State income tax expense, net of federal
|
(1,520
|
)
|
(1,111
|
)
|
(1,273
|
)
|
|||||
|
Impact of rate change
|
20
|
|
46
|
|
42
|
|
|||||
|
Other permanent items
|
(382
|
)
|
(416
|
)
|
(418
|
)
|
|||||
|
Impact of acquired tax attributes
|
—
|
|
—
|
|
(5
|
)
|
|||||
|
Impact of provision to return
|
(204
|
)
|
309
|
|
370
|
|
|||||
|
Income tax (expense) benefit
|
$
|
(8,190
|
)
|
$
|
39,126
|
|
$
|
(1,145
|
)
|
||
F-31
Deferred income taxes represent the tax effect from continuing operations of the differences between the book and tax basis of the assets and liabilities. The deferred tax assets (liabilities) include the following (in thousands):
|
December 31,
|
|||||||
|
2016
|
2015
|
||||||
|
Deferred tax liabilities:
|
|||||||
|
Property and equipment
|
$
|
(8,557
|
)
|
$
|
(7,660
|
)
|
|
|
Prepaid expenses
|
(2,349
|
)
|
(1,780
|
)
|
|||
|
Other
|
(524
|
)
|
(361
|
)
|
|||
|
Deferred tax liabilities
|
$
|
(11,430
|
)
|
$
|
(9,801
|
)
|
|
|
Deferred tax assets:
|
|||||||
|
Property and equipment
|
$
|
1,082
|
|
$
|
793
|
|
|
|
Incentive and vacation accrual
|
2,640
|
|
2,668
|
|
|||
|
Deferred revenue - key money
|
1,703
|
|
1,769
|
|
|||
|
Allowance for doubtful accounts
|
72
|
|
46
|
|
|||
|
Other
|
605
|
|
689
|
|
|||
|
Other carryforwards
|
155
|
|
204
|
|
|||
|
Net operating loss carryforwards
|
49,787
|
|
53,985
|
|
|||
|
Valuation allowance
|
(11,430
|
)
|
(10,176
|
)
|
|||
|
Deferred tax assets
|
$
|
44,614
|
|
$
|
49,978
|
|
|
The Company records a valuation allowance to reduce its deferred tax assets to the amount that is most likely to be utilized in future periods to offset taxable income. As of December 31, 2016 and 2015, the Company had a valuation allowance of approximately
$11.4 million
and
$10.2 million
, respectively, related to net operating loss ("NOL") carryforwards and other deferred tax assets of its TRSs. The Company considered all available evidence, both positive and negative, including cumulative income in recent years and its current forecast of future income in its analysis. While the Company believes its forecast of future income is reasonable, it is inherently uncertain. If the Company’s projections of future income are lower than expected, the Company may need to establish an additional valuation allowance.
The Company’s NOLs will begin to expire in 2028 for federal tax purposes and during the period from 2018 to 2028 for state tax purposes. Additionally, the annual utilization of these NOLs is limited pursuant to Section 382 of the Code.
The Company is subject to examination by the U.S. Internal Revenue Service ("IRS") and various state jurisdictions. The tax years subject to examination vary by jurisdiction. With few exceptions, as of December 31, 2016, the Company is no longer subject to U.S. federal or state and local tax examinations by tax authorities for years before 2012. During 2016, the IRS commenced examination of the federal income tax return of the Company's primary TRS for the 2013 tax year. The Company anticipates the examination will be completed in 2017.
The Company had no accruals for tax uncertainties as of
December 31, 2016
and
2015
.
14. Segment Information
The Company separately evaluates the performance of each of its hotel properties. However, because each of the hotels has similar economic characteristics, facilities, and services, the hotel properties have been aggregated into a single operating segment.
F-32
15
.
Supplemental Information to Statements of Cash Flows (in thousands)
|
For the year ended December 31,
|
|||||||||||
|
2016
|
2015
|
2014
|
|||||||||
|
Interest paid, net of capitalized interest
|
$
|
56,294
|
|
$
|
48,524
|
|
$
|
52,424
|
|
||
|
Income taxes paid
|
$
|
1,290
|
|
$
|
1,012
|
|
$
|
2,111
|
|
||
|
Supplemental investing and financing transactions
|
|||||||||||
|
In conjunction with the acquisitions, the Company recorded the following:
|
|||||||||||
|
Purchase of real estate
|
$
|
—
|
|
$
|
177,169
|
|
$
|
631,950
|
|
||
|
Restricted cash reserves
|
—
|
|
1,548
|
|
—
|
|
|||||
|
Accounts receivable
|
—
|
|
179
|
|
807
|
|
|||||
|
Other assets
|
—
|
|
120
|
|
1,671
|
|
|||||
|
Mortgage debt assumed
|
—
|
|
(33,389
|
)
|
—
|
|
|||||
|
Fair value adjustment on mortgage debt assumed
|
—
|
|
(1,269
|
)
|
—
|
|
|||||
|
Advance deposits
|
—
|
|
(46
|
)
|
(659
|
)
|
|||||
|
Accounts payable and other liabilities
|
—
|
|
(543
|
)
|
(2,129
|
)
|
|||||
|
Acquisition of hotel properties, net
|
$
|
—
|
|
$
|
143,769
|
|
$
|
631,640
|
|
||
|
In conjunction with the sale of hotel properties, the Company recorded the following:
|
|||||||||||
|
Sale of hotel properties
|
$
|
301,540
|
|
$
|
252,500
|
|
$
|
137,829
|
|
||
|
Escrow related to certain post-closing obligations
|
(15,000
|
)
|
—
|
|
—
|
|
|||||
|
Transaction costs
|
(16,693
|
)
|
(9,055
|
)
|
(3,634
|
)
|
|||||
|
Operating prorations
|
(662
|
)
|
2,960
|
|
(1,526
|
)
|
|||||
|
Proceeds from the sale of hotel properties, net
|
$
|
269,185
|
|
$
|
246,405
|
|
$
|
132,669
|
|
||
|
Supplemental non-cash transactions
|
|||||||||||
|
Change in fair market value of designated interest rate swaps
|
$
|
11,700
|
|
$
|
(2,958
|
)
|
$
|
(7,703
|
)
|
||
|
Accrued capital expenditures
|
$
|
7,392
|
|
$
|
11,383
|
|
$
|
9,641
|
|
||
|
Distributions payable
|
$
|
41,486
|
|
$
|
41,409
|
|
$
|
42,114
|
|
||
|
Redemption of Operating Partnership units
|
$
|
4,325
|
|
$
|
—
|
|
$
|
—
|
|
||
16. Selected Quarterly Financial Data (unaudited)
The tables below set forth the Company's unaudited condensed consolidated quarterly financial data for the years ended
December 31, 2016
and
2015
(in thousands, except share and per share data). In the opinion of management, all adjustments (consisting of normal recurring accruals) necessary for a fair presentation of quarterly results have been reflected in the data. It is also management's opinion, however, that quarterly financial data for the hotel properties are not indicative of the financial results to be achieved in succeeding years or quarters. In order to obtain a more accurate indication of performance, there should be a review of the financial and operating results, changes in shareholders' equity, and cash flows for a period of several years.
F-33
|
For the year ended December 31, 2016
|
|||||||||||||||
|
First Quarter
|
Second Quarter
|
Third Quarter
|
Fourth Quarter
|
||||||||||||
|
Total revenue
|
$
|
275,171
|
|
$
|
317,112
|
|
$
|
296,259
|
|
$
|
271,453
|
|
|||
|
Net income
|
$
|
25,350
|
|
$
|
58,740
|
|
$
|
41,389
|
|
$
|
75,835
|
|
|||
|
Net income attributable to common shareholders
|
$
|
25,298
|
|
$
|
58,447
|
|
$
|
41,174
|
|
$
|
75,433
|
|
|||
|
Comprehensive income attributable to the Company
|
$
|
5,050
|
|
$
|
53,081
|
|
$
|
50,644
|
|
$
|
103,277
|
|
|||
|
Basic per share data:
|
|
|
|
|
|||||||||||
|
Net income attributable to common shareholders
|
$
|
0.20
|
|
$
|
0.47
|
|
$
|
0.33
|
|
$
|
0.61
|
|
|||
|
Diluted per share data:
|
|
|
|
|
|||||||||||
|
Net income attributable to common shareholders
|
$
|
0.20
|
|
$
|
0.47
|
|
$
|
0.33
|
|
$
|
0.61
|
|
|||
|
Basic weighted-average common shares outstanding
|
123,739,823
|
|
123,544,034
|
|
123,621,323
|
|
123,698,633
|
|
|||||||
|
Diluted weighted-average common shares outstanding
|
124,141,824
|
|
123,942,846
|
|
123,836,452
|
|
123,757,660
|
|
|||||||
|
For the year ended December 31, 2015
|
|||||||||||||||
|
First Quarter
|
Second Quarter
|
Third Quarter
|
Fourth Quarter
|
||||||||||||
|
Total revenue
|
$
|
270,405
|
|
$
|
301,252
|
|
$
|
289,420
|
|
$
|
275,263
|
|
|||
|
Net income
|
$
|
48,102
|
|
$
|
56,410
|
|
$
|
40,933
|
|
$
|
74,367
|
|
|||
|
Net income attributable to common shareholders
|
$
|
47,850
|
|
$
|
55,991
|
|
$
|
40,594
|
|
$
|
73,786
|
|
|||
|
Comprehensive income attributable to the Company
|
$
|
38,447
|
|
$
|
61,910
|
|
$
|
25,428
|
|
$
|
89,478
|
|
|||
|
Basic per share data:
|
|
|
|
|
|||||||||||
|
Net income attributable to common shareholders
|
$
|
0.36
|
|
$
|
0.43
|
|
$
|
0.32
|
|
$
|
0.58
|
|
|||
|
Diluted per share data:
|
|
|
|
|
|||||||||||
|
Net income attributable to common shareholders
|
$
|
0.36
|
|
$
|
0.42
|
|
$
|
0.31
|
|
$
|
0.59
|
|
|||
|
Basic weighted-average common shares outstanding
|
131,272,611
|
|
130,670,629
|
|
127,663,480
|
|
124,256,834
|
|
|||||||
|
Diluted weighted-average common shares outstanding
|
132,286,542
|
|
131,618,693
|
|
128,143,154
|
|
124,679,650
|
|
|||||||
F-34
RLJ Lodging Trust
Schedule III - Real Estate and Accumulated Depreciation
December 31, 2016
(amounts in thousands)
|
Initial Costs
|
Costs Capitalized Subsequent to Acquisition
|
Gross Amount at December 31, 2016
|
||||||||||||||||||||||||||||||||||
|
Description
|
Debt
|
Land &
Improvements
|
Building &
Improvements
|
Land, Building &
Improvements
|
Land &
Improvements
|
Buildings &
Improvements
|
Total (1)
|
Accumulated
Depreciation
|
Date
Acquired
|
Depreciation
Life
|
||||||||||||||||||||||||||
|
Marriott Austin South
|
$
|
—
|
|
$
|
2,253
|
|
$
|
16,522
|
|
$
|
1,665
|
|
$
|
2,253
|
|
$
|
18,187
|
|
$
|
20,440
|
|
$
|
4,661
|
|
2006
|
15 - 40 years
|
||||||||||
|
Marriott Denver South @ Park Meadows
|
—
|
|
5,385
|
|
39,488
|
|
3,559
|
|
5,352
|
|
43,080
|
|
48,432
|
|
11,031
|
|
2006
|
15 - 40 years
|
||||||||||||||||||
|
Marriott Louisville Downtown
|
80,000
|
|
—
|
|
89,541
|
|
4,040
|
|
—
|
|
93,581
|
|
93,581
|
|
24,121
|
|
2006
|
15 - 40 years
|
||||||||||||||||||
|
Marriott Chicago Midway
|
—
|
|
4,464
|
|
32,736
|
|
2,127
|
|
4,495
|
|
34,832
|
|
39,327
|
|
9,135
|
|
2006
|
15 - 40 years
|
||||||||||||||||||
|
Renaissance Boulder Flatiron Hotel
|
—
|
|
4,440
|
|
32,557
|
|
2,581
|
|
4,598
|
|
34,980
|
|
39,578
|
|
8,925
|
|
2006
|
15 - 40 years
|
||||||||||||||||||
|
Renaissance Fort Lauderdale Plantation Hotel
|
—
|
|
4,842
|
|
35,517
|
|
1,914
|
|
4,853
|
|
37,420
|
|
42,273
|
|
9,655
|
|
2006
|
15 - 40 years
|
||||||||||||||||||
|
Courtyard Austin Northwest Arboretum
|
—
|
|
1,443
|
|
10,585
|
|
2,934
|
|
1,447
|
|
13,515
|
|
14,962
|
|
3,256
|
|
2006
|
15 - 40 years
|
||||||||||||||||||
|
Courtyard Austin South
|
—
|
|
1,530
|
|
11,222
|
|
1,383
|
|
1,535
|
|
12,600
|
|
14,135
|
|
3,312
|
|
2006
|
15 - 40 years
|
||||||||||||||||||
|
Courtyard Chicago Downtown Magnificent Mile
|
—
|
|
8,140
|
|
59,696
|
|
4,290
|
|
8,142
|
|
63,984
|
|
72,126
|
|
16,195
|
|
2006
|
15 - 40 years
|
||||||||||||||||||
|
Courtyard Denver West Golden
|
—
|
|
1,325
|
|
9,716
|
|
1,414
|
|
1,325
|
|
11,130
|
|
12,455
|
|
2,860
|
|
2006
|
15 - 40 years
|
||||||||||||||||||
|
Courtyard Chicago Southeast Hammond
|
—
|
|
1,038
|
|
7,616
|
|
1,306
|
|
1,078
|
|
8,882
|
|
9,960
|
|
2,350
|
|
2006
|
15 - 40 years
|
||||||||||||||||||
|
Courtyard Indianapolis @ The Capitol
|
—
|
|
2,482
|
|
18,207
|
|
1,240
|
|
2,482
|
|
19,447
|
|
21,929
|
|
4,992
|
|
2006
|
15 - 40 years
|
||||||||||||||||||
|
Courtyard Boulder Longmont
|
—
|
|
1,192
|
|
8,745
|
|
909
|
|
1,192
|
|
9,654
|
|
10,846
|
|
2,531
|
|
2006
|
15 - 40 years
|
||||||||||||||||||
|
Courtyard Boulder Louisville
|
—
|
|
1,640
|
|
12,025
|
|
1,443
|
|
1,642
|
|
13,466
|
|
15,108
|
|
3,532
|
|
2006
|
15 - 40 years
|
||||||||||||||||||
|
Courtyard Louisville Northeast
|
—
|
|
1,374
|
|
10,079
|
|
845
|
|
1,382
|
|
10,916
|
|
12,298
|
|
2,880
|
|
2006
|
15 - 40 years
|
||||||||||||||||||
|
Courtyard Midway Airport
|
—
|
|
2,172
|
|
15,927
|
|
2,377
|
|
2,197
|
|
18,279
|
|
20,476
|
|
5,310
|
|
2006
|
15 - 40 years
|
||||||||||||||||||
|
Courtyard South Bend Mishawaka
|
—
|
|
640
|
|
4,699
|
|
1,240
|
|
642
|
|
5,937
|
|
6,579
|
|
1,722
|
|
2006
|
15 - 40 years
|
||||||||||||||||||
|
Courtyard Salt Lake City Airport
|
—
|
|
2,333
|
|
17,110
|
|
1,397
|
|
2,333
|
|
18,507
|
|
20,840
|
|
4,688
|
|
2006
|
15 - 40 years
|
||||||||||||||||||
|
Courtyard Houston Sugarland
|
—
|
|
1,217
|
|
8,931
|
|
1,224
|
|
1,217
|
|
10,155
|
|
11,372
|
|
2,514
|
|
2006
|
15 - 40 years
|
||||||||||||||||||
|
Courtyard Fort Lauderdale SW Miramar
|
—
|
|
1,619
|
|
11,872
|
|
1,179
|
|
1,619
|
|
13,051
|
|
14,670
|
|
2,978
|
|
2007
|
15 - 40 years
|
||||||||||||||||||
|
Courtyard Austin Downtown Convention Center
|
48,168
|
|
6,049
|
|
44,361
|
|
1,491
|
|
6,049
|
|
45,852
|
|
51,901
|
|
10,440
|
|
2007
|
15 - 40 years
|
||||||||||||||||||
|
Courtyard Austin Airport
|
—
|
|
1,691
|
|
12,404
|
|
3,637
|
|
1,753
|
|
15,979
|
|
17,732
|
|
3,302
|
|
2007
|
15 - 40 years
|
||||||||||||||||||
|
Residence Inn Austin Northwest Arboretum
|
—
|
|
1,403
|
|
10,290
|
|
1,959
|
|
1,403
|
|
12,249
|
|
13,652
|
|
3,045
|
|
2006
|
15 - 40 years
|
||||||||||||||||||
|
Residence Inn Austin South
|
—
|
|
802
|
|
5,883
|
|
936
|
|
805
|
|
6,816
|
|
7,621
|
|
1,664
|
|
2006
|
15 - 40 years
|
||||||||||||||||||
|
Residence Inn Austin North Parmer Lane
|
—
|
|
1,483
|
|
10,872
|
|
851
|
|
1,483
|
|
11,723
|
|
13,206
|
|
2,953
|
|
2006
|
15 - 40 years
|
||||||||||||||||||
|
Residence Inn Indianapolis Fishers
|
—
|
|
998
|
|
7,322
|
|
1,005
|
|
1,048
|
|
8,277
|
|
9,325
|
|
2,078
|
|
2006
|
15 - 40 years
|
||||||||||||||||||
|
Residence Inn Denver West Golden
|
—
|
|
1,222
|
|
8,963
|
|
1,188
|
|
1,222
|
|
10,151
|
|
11,373
|
|
2,511
|
|
2006
|
15 - 40 years
|
||||||||||||||||||
|
Residence Inn Chicago Southeast Hammond
|
—
|
|
980
|
|
7,190
|
|
996
|
|
1,042
|
|
8,124
|
|
9,166
|
|
2,028
|
|
2006
|
15 - 40 years
|
||||||||||||||||||
F-35
|
Initial Costs
|
Costs Capitalized Subsequent to Acquisition
|
Gross Amount at December 31, 2016
|
||||||||||||||||||||||||||||||||||
|
Description
|
Debt
|
Land &
Improvements
|
Building &
Improvements
|
Land, Building &
Improvements
|
Land &
Improvements
|
Buildings &
Improvements
|
Total (1)
|
Accumulated
Depreciation
|
Date
Acquired
|
Depreciation
Life
|
||||||||||||||||||||||||||
|
Residence Inn Houston By The Galleria
|
—
|
|
2,665
|
|
19,549
|
|
2,790
|
|
2,665
|
|
22,339
|
|
25,004
|
|
5,666
|
|
2006
|
15 - 40 years
|
||||||||||||||||||
|
Residence Inn Indianapolis Downtown On The Canal
|
—
|
|
2,670
|
|
19,588
|
|
2,095
|
|
2,670
|
|
21,683
|
|
24,353
|
|
5,507
|
|
2006
|
15 - 40 years
|
||||||||||||||||||
|
Residence Inn Longmont Boulder
|
—
|
|
1,407
|
|
10,321
|
|
796
|
|
1,407
|
|
11,117
|
|
12,524
|
|
2,809
|
|
2006
|
15 - 40 years
|
||||||||||||||||||
|
Residence Inn Boulder Louisville
|
—
|
|
1,298
|
|
9,519
|
|
972
|
|
1,298
|
|
10,491
|
|
11,789
|
|
2,694
|
|
2006
|
15 - 40 years
|
||||||||||||||||||
|
Residence Inn Louisville Northeast
|
—
|
|
1,319
|
|
9,675
|
|
1,093
|
|
1,325
|
|
10,762
|
|
12,087
|
|
2,690
|
|
2006
|
15 - 40 years
|
||||||||||||||||||
|
Residence Inn Merrillville
|
—
|
|
595
|
|
4,372
|
|
1,262
|
|
595
|
|
5,634
|
|
6,229
|
|
1,591
|
|
2006
|
15 - 40 years
|
||||||||||||||||||
|
Residence Inn Detroit Novi
|
—
|
|
1,427
|
|
10,445
|
|
1,862
|
|
1,432
|
|
12,302
|
|
13,734
|
|
2,932
|
|
2006
|
15 - 40 years
|
||||||||||||||||||
|
Residence Inn Chicago Oak Brook
|
—
|
|
—
|
|
20,436
|
|
924
|
|
—
|
|
21,360
|
|
21,360
|
|
5,477
|
|
2006
|
15 - 40 years
|
||||||||||||||||||
|
Residence Inn Fort Lauderdale Plantation
|
—
|
|
2,183
|
|
16,021
|
|
4,397
|
|
2,295
|
|
20,306
|
|
22,601
|
|
5,112
|
|
2006
|
15 - 40 years
|
||||||||||||||||||
|
Residence Inn Salt Lake City Airport
|
—
|
|
875
|
|
6,416
|
|
1,296
|
|
875
|
|
7,712
|
|
8,587
|
|
1,932
|
|
2006
|
15 - 40 years
|
||||||||||||||||||
|
Residence Inn San Antonio Downtown Market Sq
|
—
|
|
1,822
|
|
13,360
|
|
2,278
|
|
1,822
|
|
15,638
|
|
17,460
|
|
3,955
|
|
2006
|
15 - 40 years
|
||||||||||||||||||
|
Residence Inn Houston Sugarland
|
—
|
|
1,100
|
|
8,073
|
|
1,324
|
|
1,100
|
|
9,397
|
|
10,497
|
|
2,492
|
|
2006
|
15 - 40 years
|
||||||||||||||||||
|
Residence Inn Chicago Naperville
|
—
|
|
1,923
|
|
14,101
|
|
838
|
|
1,923
|
|
14,939
|
|
16,862
|
|
3,941
|
|
2006
|
15 - 40 years
|
||||||||||||||||||
|
Residence Inn Louisville Downtown
|
—
|
|
1,815
|
|
13,308
|
|
744
|
|
1,815
|
|
14,052
|
|
15,867
|
|
3,419
|
|
2007
|
15 - 40 years
|
||||||||||||||||||
|
Residence Inn Fort Lauderdale SW Miramar
|
—
|
|
1,692
|
|
12,409
|
|
1,544
|
|
1,695
|
|
13,950
|
|
15,645
|
|
3,165
|
|
2007
|
15 - 40 years
|
||||||||||||||||||
|
Residence Inn Austin Downtown Convention Center
|
32,112
|
|
3,767
|
|
27,626
|
|
620
|
|
3,767
|
|
28,246
|
|
32,013
|
|
6,467
|
|
2007
|
15 - 40 years
|
||||||||||||||||||
|
SpringHill Suites Austin North Parmer Lane
|
—
|
|
1,957
|
|
14,351
|
|
577
|
|
1,957
|
|
14,928
|
|
16,885
|
|
3,842
|
|
2006
|
15 - 40 years
|
||||||||||||||||||
|
SpringHill Suites Austin South
|
—
|
|
1,605
|
|
11,768
|
|
1,922
|
|
1,605
|
|
13,690
|
|
15,295
|
|
3,361
|
|
2006
|
15 - 40 years
|
||||||||||||||||||
|
SpringHill Suites Louisville Hurstbourne North
|
—
|
|
1,890
|
|
13,869
|
|
1,716
|
|
1,890
|
|
15,585
|
|
17,475
|
|
3,867
|
|
2006
|
15 - 40 years
|
||||||||||||||||||
|
SpringHill Suites South Bend Mishawaka
|
—
|
|
983
|
|
7,217
|
|
1,752
|
|
983
|
|
8,969
|
|
9,952
|
|
2,108
|
|
2006
|
15 - 40 years
|
||||||||||||||||||
|
SpringHill Suites Denver North Westminster
|
—
|
|
2,409
|
|
17,670
|
|
1,120
|
|
2,409
|
|
18,790
|
|
21,199
|
|
4,951
|
|
2006
|
15 - 40 years
|
||||||||||||||||||
|
SpringHill Suites Boulder Longmont
|
—
|
|
1,144
|
|
8,388
|
|
728
|
|
1,144
|
|
9,116
|
|
10,260
|
|
2,248
|
|
2007
|
15 - 40 years
|
||||||||||||||||||
|
Fairfield Inn & Suites Austin South Airport
|
—
|
|
505
|
|
3,702
|
|
1,126
|
|
505
|
|
4,828
|
|
5,333
|
|
1,083
|
|
2006
|
15 - 40 years
|
||||||||||||||||||
|
Fairfield Inn & Suites Denver Cherry Creek
|
—
|
|
1,203
|
|
8,823
|
|
1,277
|
|
1,203
|
|
10,100
|
|
11,303
|
|
2,630
|
|
2006
|
15 - 40 years
|
||||||||||||||||||
|
Fairfield Inn & Suites Chicago SE Hammond
|
—
|
|
722
|
|
5,301
|
|
1,324
|
|
727
|
|
6,620
|
|
7,347
|
|
1,643
|
|
2006
|
15 - 40 years
|
||||||||||||||||||
|
Fairfield Inn & Suites Key West
|
—
|
|
1,803
|
|
19,325
|
|
3,253
|
|
1,853
|
|
22,528
|
|
24,381
|
|
5,429
|
|
2006
|
15 - 40 years
|
||||||||||||||||||
|
Fairfield Inn & Suites Chicago Midway Airport
|
—
|
|
1,425
|
|
10,449
|
|
1,814
|
|
1,446
|
|
12,242
|
|
13,688
|
|
2,960
|
|
2006
|
15 - 40 years
|
||||||||||||||||||
F-36
|
Initial Costs
|
Costs Capitalized Subsequent to Acquisition
|
Gross Amount at December 31, 2016
|
||||||||||||||||||||||||||||||||||
|
Description
|
Debt
|
Land &
Improvements
|
Building &
Improvements
|
Land, Building &
Improvements
|
Land &
Improvements
|
Buildings &
Improvements
|
Total (1)
|
Accumulated
Depreciation
|
Date
Acquired
|
Depreciation
Life
|
||||||||||||||||||||||||||
|
Fairfield Inn & Suites San Antonio Dwntn Mkt
|
—
|
|
1,378
|
|
10,105
|
|
1,348
|
|
1,378
|
|
11,453
|
|
12,831
|
|
2,822
|
|
2006
|
15 - 40 years
|
||||||||||||||||||
|
Hampton Inn Chicago Midway Airport
|
—
|
|
2,747
|
|
20,143
|
|
2,797
|
|
2,793
|
|
22,894
|
|
25,687
|
|
5,806
|
|
2006
|
15 - 40 years
|
||||||||||||||||||
|
Hilton Garden Inn Chicago Midway Airport
|
—
|
|
2,978
|
|
21,842
|
|
1,209
|
|
3,000
|
|
23,029
|
|
26,029
|
|
5,982
|
|
2006
|
15 - 40 years
|
||||||||||||||||||
|
Sleep Inn Midway Airport
|
—
|
|
1,189
|
|
8,718
|
|
1,671
|
|
1,210
|
|
10,368
|
|
11,578
|
|
2,838
|
|
2006
|
15 - 40 years
|
||||||||||||||||||
|
Holiday Inn Express & Suites Midway Airport
|
—
|
|
1,874
|
|
13,742
|
|
745
|
|
1,895
|
|
14,466
|
|
16,361
|
|
3,693
|
|
2006
|
15 - 40 years
|
||||||||||||||||||
|
Hilton Garden Inn Bloomington
|
17,500
|
|
—
|
|
18,945
|
|
913
|
|
—
|
|
19,858
|
|
19,858
|
|
3,971
|
|
2009
|
15 - 40 years
|
||||||||||||||||||
|
TGI Friday's Chicago Midway
|
—
|
|
829
|
|
6,139
|
|
654
|
|
851
|
|
6,771
|
|
7,622
|
|
1,688
|
|
2006
|
15 - 40 years
|
||||||||||||||||||
|
Hampton Inn & Suites Clearwater St Petersburg Ulmerton Road
|
—
|
|
1,106
|
|
12,721
|
|
1,118
|
|
1,146
|
|
13,799
|
|
14,945
|
|
3,228
|
|
2007
|
15 - 40 years
|
||||||||||||||||||
|
Hampton Inn Garden City
|
—
|
|
5,691
|
|
22,764
|
|
780
|
|
5,717
|
|
23,518
|
|
29,235
|
|
5,570
|
|
2007
|
15 - 40 years
|
||||||||||||||||||
|
Courtyard Houston By The Galleria
|
26,000
|
|
3,069
|
|
22,508
|
|
1,416
|
|
3,069
|
|
23,924
|
|
26,993
|
|
5,411
|
|
2007
|
15 - 40 years
|
||||||||||||||||||
|
Hampton Inn Fort Walton Beach
|
—
|
|
8,774
|
|
6,109
|
|
1,603
|
|
8,875
|
|
7,611
|
|
16,486
|
|
1,672
|
|
2007
|
15 - 40 years
|
||||||||||||||||||
|
Embassy Suites Los Angeles Downey
|
26,500
|
|
4,857
|
|
29,943
|
|
6,007
|
|
4,962
|
|
35,845
|
|
40,807
|
|
7,561
|
|
2008
|
15 - 40 years
|
||||||||||||||||||
|
Hyatt House Austin Arboretum
|
11,000
|
|
2,813
|
|
15,940
|
|
2,079
|
|
2,813
|
|
18,019
|
|
20,832
|
|
3,632
|
|
2008
|
15 - 40 years
|
||||||||||||||||||
|
Hyatt House Dallas Lincoln Park
|
18,000
|
|
3,169
|
|
17,958
|
|
1,357
|
|
3,317
|
|
19,167
|
|
22,484
|
|
3,972
|
|
2008
|
15 - 40 years
|
||||||||||||||||||
|
Hyatt House Dallas Uptown
|
16,500
|
|
2,241
|
|
12,698
|
|
2,709
|
|
2,306
|
|
15,342
|
|
17,648
|
|
2,865
|
|
2008
|
15 - 40 years
|
||||||||||||||||||
|
Hyatt House Houston Galleria
|
13,000
|
|
2,976
|
|
16,866
|
|
1,994
|
|
2,976
|
|
18,860
|
|
21,836
|
|
3,922
|
|
2008
|
15 - 40 years
|
||||||||||||||||||
|
Embassy Suites Tampa Downtown Convention Ctr
|
—
|
|
2,161
|
|
71,017
|
|
2,330
|
|
2,359
|
|
73,149
|
|
75,508
|
|
12,437
|
|
2010
|
15 - 40 years
|
||||||||||||||||||
|
Fairfield Inn & Suites Washington DC Downtown
|
—
|
|
16,214
|
|
22,265
|
|
5,318
|
|
16,307
|
|
27,490
|
|
43,797
|
|
5,272
|
|
2010
|
15 - 40 years
|
||||||||||||||||||
|
Embassy Suites Fort Myers Estero
|
—
|
|
2,816
|
|
7,862
|
|
1,446
|
|
2,879
|
|
9,245
|
|
12,124
|
|
1,707
|
|
2010
|
15 - 40 years
|
||||||||||||||||||
|
Homewood Suites Washington DC Downtown
|
32,175
|
|
23,139
|
|
34,188
|
|
3,583
|
|
23,139
|
|
37,771
|
|
60,910
|
|
5,936
|
|
2010
|
15 - 40 years
|
||||||||||||||||||
|
Hampton Inn & Suites Denver Tech Center
|
—
|
|
2,373
|
|
9,180
|
|
1,829
|
|
2,428
|
|
10,954
|
|
13,382
|
|
2,187
|
|
2010
|
15 - 40 years
|
||||||||||||||||||
|
Hotel Indigo New Orleans Garden District
|
—
|
|
1,901
|
|
3,865
|
|
11,774
|
|
2,082
|
|
15,458
|
|
17,540
|
|
3,584
|
|
2010
|
15 - 40 years
|
||||||||||||||||||
|
Residence Inn Columbia
|
—
|
|
1,993
|
|
11,487
|
|
1,799
|
|
2,069
|
|
13,210
|
|
15,279
|
|
2,440
|
|
2010
|
15 - 40 years
|
||||||||||||||||||
|
Residence Inn National Harbor Washington DC
|
—
|
|
7,457
|
|
37,046
|
|
1,454
|
|
7,480
|
|
38,477
|
|
45,957
|
|
5,928
|
|
2010
|
15 - 40 years
|
||||||||||||||||||
|
Residence Inn Silver Spring
|
—
|
|
3,945
|
|
18,896
|
|
1,021
|
|
3,989
|
|
19,873
|
|
23,862
|
|
3,556
|
|
2010
|
15 - 40 years
|
||||||||||||||||||
|
Hilton Garden Inn New Orleans Convention Center
|
—
|
|
3,405
|
|
20,750
|
|
4,502
|
|
3,465
|
|
25,192
|
|
28,657
|
|
4,444
|
|
2010
|
15 - 40 years
|
||||||||||||||||||
|
Hampton Inn West Palm Beach Arprt Central
|
—
|
|
2,280
|
|
9,769
|
|
1,314
|
|
2,280
|
|
11,083
|
|
13,363
|
|
1,812
|
|
2010
|
15 - 40 years
|
||||||||||||||||||
F-37
|
Initial Costs
|
Costs Capitalized Subsequent to Acquisition
|
Gross Amount at December 31, 2016
|
||||||||||||||||||||||||||||||||||
|
Description
|
Debt
|
Land &
Improvements
|
Building &
Improvements
|
Land, Building &
Improvements
|
Land &
Improvements
|
Buildings &
Improvements
|
Total (1)
|
Accumulated
Depreciation
|
Date
Acquired
|
Depreciation
Life
|
||||||||||||||||||||||||||
|
Hilton Garden Inn West Palm Beach Airport
|
—
|
|
1,206
|
|
10,811
|
|
1,321
|
|
1,215
|
|
12,123
|
|
13,338
|
|
1,916
|
|
2010
|
15 - 40 years
|
||||||||||||||||||
|
Hilton Garden Inn Los Angeles Hollywood
|
—
|
|
5,303
|
|
19,136
|
|
5,858
|
|
5,521
|
|
24,776
|
|
30,297
|
|
4,722
|
|
2010
|
15 - 40 years
|
||||||||||||||||||
|
DoubleTree Metropolitan Hotel New York City
|
—
|
|
140,332
|
|
188,014
|
|
18,450
|
|
140,456
|
|
206,340
|
|
346,796
|
|
33,164
|
|
2010
|
15 - 40 years
|
||||||||||||||||||
|
Renaissance Pittsburgh Hotel
|
—
|
|
3,274
|
|
39,934
|
|
5,410
|
|
3,390
|
|
45,228
|
|
48,618
|
|
6,715
|
|
2011
|
15 - 40 years
|
||||||||||||||||||
|
Courtyard Atlanta Buckhead
|
—
|
|
2,860
|
|
21,668
|
|
3,077
|
|
2,875
|
|
24,730
|
|
27,605
|
|
3,776
|
|
2011
|
15 - 40 years
|
||||||||||||||||||
|
DoubleTree Hotel Columbia
|
—
|
|
1,933
|
|
6,486
|
|
5,451
|
|
2,049
|
|
11,821
|
|
13,870
|
|
2,256
|
|
2011
|
15 - 40 years
|
||||||||||||||||||
|
Marriott Denver Airport @ Gateway Park
|
26,500
|
|
3,083
|
|
38,356
|
|
3,722
|
|
3,175
|
|
41,986
|
|
45,161
|
|
6,666
|
|
2011
|
15 - 40 years
|
||||||||||||||||||
|
Embassy Suites West Palm Beach Central
|
—
|
|
3,656
|
|
9,614
|
|
5,599
|
|
3,792
|
|
15,077
|
|
18,869
|
|
3,203
|
|
2011
|
15 - 40 years
|
||||||||||||||||||
|
Hilton Garden Inn Durham Raleigh Research Triangle Park
|
—
|
|
1,751
|
|
4,763
|
|
5,351
|
|
1,878
|
|
9,987
|
|
11,865
|
|
2,557
|
|
2011
|
15 - 40 years
|
||||||||||||||||||
|
Hilton Garden Inn Pittsburgh University Place
|
—
|
|
1,975
|
|
18,490
|
|
7,961
|
|
2,037
|
|
26,389
|
|
28,426
|
|
4,918
|
|
2011
|
15 - 40 years
|
||||||||||||||||||
|
Hampton Inn Houston Near The Galleria
|
—
|
|
9,326
|
|
9,220
|
|
1,754
|
|
9,395
|
|
10,905
|
|
20,300
|
|
1,856
|
|
2011
|
15 - 40 years
|
||||||||||||||||||
|
Courtyard Charleston Historic District
|
—
|
|
2,714
|
|
35,828
|
|
833
|
|
2,763
|
|
36,612
|
|
39,375
|
|
4,884
|
|
2011
|
15 - 40 years
|
||||||||||||||||||
|
Residence Inn Bethesda Downtown
|
33,795
|
|
8,154
|
|
52,750
|
|
4,913
|
|
8,273
|
|
57,544
|
|
65,817
|
|
6,676
|
|
2012
|
15 - 40 years
|
||||||||||||||||||
|
Courtyard New York Manhattan Upper East Side
|
—
|
|
20,654
|
|
60,223
|
|
4,420
|
|
20,737
|
|
64,560
|
|
85,297
|
|
7,771
|
|
2012
|
15 - 40 years
|
||||||||||||||||||
|
Hilton Garden Inn San Francisco Oakland Bay Brg
|
—
|
|
11,902
|
|
22,758
|
|
2,185
|
|
11,947
|
|
24,898
|
|
36,845
|
|
3,054
|
|
2012
|
15 - 40 years
|
||||||||||||||||||
|
Embassy Suites Boston Waltham
|
—
|
|
6,268
|
|
56,025
|
|
3,252
|
|
6,322
|
|
59,223
|
|
65,545
|
|
6,647
|
|
2012
|
15 - 40 years
|
||||||||||||||||||
|
Courtyard Houston Downtown Convention Center
|
—
|
|
5,799
|
|
28,954
|
|
3,055
|
|
5,858
|
|
31,950
|
|
37,808
|
|
3,184
|
|
2013
|
15 - 40 years
|
||||||||||||||||||
|
Residence Inn Houston Downtown Convention Center
|
—
|
|
4,674
|
|
24,913
|
|
2,929
|
|
4,724
|
|
27,792
|
|
32,516
|
|
2,748
|
|
2013
|
15 - 40 years
|
||||||||||||||||||
|
SpringHill Suites Houston Downtown Convention Center
|
—
|
|
2,382
|
|
12,756
|
|
15,748
|
|
2,485
|
|
28,401
|
|
30,886
|
|
1,919
|
|
2013
|
15 - 40 years
|
||||||||||||||||||
|
Courtyard Waikiki Beach
|
—
|
|
557
|
|
79,033
|
|
9,142
|
|
670
|
|
88,062
|
|
88,732
|
|
7,940
|
|
2013
|
15 - 40 years
|
||||||||||||||||||
|
Courtyard San Francisco
|
—
|
|
11,277
|
|
18,198
|
|
26,816
|
|
11,291
|
|
45,000
|
|
56,291
|
|
2,565
|
|
2013
|
15 - 40 years
|
||||||||||||||||||
|
Residence Inn Atlanta Midtown Historic
|
—
|
|
2,812
|
|
6,044
|
|
6,883
|
|
2,939
|
|
12,800
|
|
15,739
|
|
1,042
|
|
2013
|
15 - 40 years
|
||||||||||||||||||
|
SpringHill Suites Portland Hillsboro
|
—
|
|
3,488
|
|
18,283
|
|
121
|
|
3,498
|
|
18,394
|
|
21,892
|
|
1,614
|
|
2013
|
15 - 40 years
|
||||||||||||||||||
|
Hilton Cabana Miami Beach
|
—
|
|
25,083
|
|
40,707
|
|
2,052
|
|
25,119
|
|
42,723
|
|
67,842
|
|
2,848
|
|
2014
|
15 - 40 years
|
||||||||||||||||||
|
Hyatt House Charlotte Center City
|
—
|
|
3,029
|
|
26,193
|
|
21
|
|
3,029
|
|
26,214
|
|
29,243
|
|
1,873
|
|
2014
|
15 - 40 years
|
||||||||||||||||||
|
Hyatt House Cypress Anaheim
|
—
|
|
3,995
|
|
9,164
|
|
3,839
|
|
4,354
|
|
12,644
|
|
16,998
|
|
1,172
|
|
2014
|
15 - 40 years
|
||||||||||||||||||
|
Hyatt House Emeryville San Francisco Bay Area
|
—
|
|
7,425
|
|
29,137
|
|
5,218
|
|
7,507
|
|
34,273
|
|
41,780
|
|
2,800
|
|
2014
|
15 - 40 years
|
||||||||||||||||||
|
Hyatt House San Diego Sorrento Mesa
|
—
|
|
10,419
|
|
21,289
|
|
1,183
|
|
10,530
|
|
22,361
|
|
32,891
|
|
1,767
|
|
2014
|
15 - 40 years
|
||||||||||||||||||
F-38
|
Initial Costs
|
Costs Capitalized Subsequent to Acquisition
|
Gross Amount at December 31, 2016
|
||||||||||||||||||||||||||||||||||
|
Description
|
Debt
|
Land &
Improvements
|
Building &
Improvements
|
Land, Building &
Improvements
|
Land &
Improvements
|
Buildings &
Improvements
|
Total (1)
|
Accumulated
Depreciation
|
Date
Acquired
|
Depreciation
Life
|
||||||||||||||||||||||||||
|
Hyatt House San Jose Silicon Valley
|
—
|
|
6,819
|
|
31,682
|
|
1
|
|
6,820
|
|
31,682
|
|
38,502
|
|
2,273
|
|
2014
|
15 - 40 years
|
||||||||||||||||||
|
Hyatt House San Ramon
|
—
|
|
5,713
|
|
11,852
|
|
995
|
|
5,717
|
|
12,843
|
|
18,560
|
|
1,045
|
|
2014
|
15 - 40 years
|
||||||||||||||||||
|
Hyatt House Santa Clara
|
—
|
|
8,044
|
|
27,703
|
|
1,560
|
|
8,044
|
|
29,263
|
|
37,307
|
|
2,144
|
|
2014
|
15 - 40 years
|
||||||||||||||||||
|
Hyatt Centric The Woodlands
|
—
|
|
5,950
|
|
16,882
|
|
21
|
|
5,957
|
|
16,896
|
|
22,853
|
|
1,229
|
|
2014
|
15 - 40 years
|
||||||||||||||||||
|
Hyatt Place Fremont Silicon Valley
|
—
|
|
6,208
|
|
13,730
|
|
976
|
|
6,209
|
|
14,705
|
|
20,914
|
|
1,189
|
|
2014
|
15 - 40 years
|
||||||||||||||||||
|
Hyatt Place Madison Downtown
|
—
|
|
6,701
|
|
25,478
|
|
—
|
|
6,701
|
|
25,478
|
|
32,179
|
|
1,810
|
|
2014
|
15 - 40 years
|
||||||||||||||||||
|
Embassy Suites Irvine Orange County
|
—
|
|
15,062
|
|
33,048
|
|
7,426
|
|
15,102
|
|
40,434
|
|
55,536
|
|
2,709
|
|
2014
|
15 - 40 years
|
||||||||||||||||||
|
Courtyard Portland City Center
|
—
|
|
8,019
|
|
53,024
|
|
1,118
|
|
8,021
|
|
54,140
|
|
62,161
|
|
3,598
|
|
2014
|
15 - 40 years
|
||||||||||||||||||
|
Hyatt Atlanta Midtown
|
—
|
|
3,737
|
|
41,731
|
|
239
|
|
3,737
|
|
41,970
|
|
45,707
|
|
2,653
|
|
2014
|
15 - 40 years
|
||||||||||||||||||
|
DoubleTree Grand Key Resort
|
—
|
|
48,192
|
|
27,770
|
|
4,576
|
|
48,226
|
|
32,312
|
|
80,538
|
|
2,106
|
|
2014
|
15 - 40 years
|
||||||||||||||||||
|
Hyatt Place Washington DC Downtown K Street
|
—
|
|
10,763
|
|
55,225
|
|
528
|
|
10,763
|
|
55,753
|
|
66,516
|
|
2,085
|
|
2015
|
15 - 40 years
|
||||||||||||||||||
|
Homewood Suites Seattle Lynnwood
|
—
|
|
3,933
|
|
30,949
|
|
20
|
|
3,953
|
|
30,949
|
|
34,902
|
|
1,204
|
|
2015
|
15 - 40 years
|
||||||||||||||||||
|
Residence Inn Palo Alto Los Altos
|
33,666
|
|
16,996
|
|
45,786
|
|
129
|
|
17,030
|
|
45,881
|
|
62,911
|
|
1,643
|
|
2015
|
15 - 40 years
|
||||||||||||||||||
|
$
|
414,916
|
|
$
|
671,204
|
|
$
|
2,723,231
|
|
$
|
331,497
|
|
$
|
675,889
|
|
$
|
3,050,043
|
|
$
|
3,725,932
|
|
$
|
520,517
|
|
|||||||||||||
_______________________________________________________________________________
(1) The aggregate cost of real estate for federal income tax purposes is approximately
$3.6 billion
at
December 31, 2016
.
F-39
The change in the total cost of the hotel properties is as follows:
|
2016
|
2015
|
2014
|
|||||||||
|
Reconciliation of Land and Buildings and Improvements
|
|||||||||||
|
Balance at beginning of period
|
$
|
3,942,413
|
|
$
|
3,711,887
|
|
$
|
3,461,251
|
|
||
|
Add: Acquisitions
|
—
|
|
163,652
|
|
573,936
|
|
|||||
|
Add: Improvements
|
40,308
|
|
84,615
|
|
59,485
|
|
|||||
|
Less: Sale of hotel properties (1)
|
(256,789
|
)
|
(16,738
|
)
|
(142,581
|
)
|
|||||
|
Less: Impairment loss
|
—
|
|
(1,003
|
)
|
(9,200
|
)
|
|||||
|
Less: Land, building and improvements of hotels held for sale
|
—
|
|
—
|
|
(231,004
|
)
|
|||||
|
Balance at end of period
|
$
|
3,725,932
|
|
$
|
3,942,413
|
|
$
|
3,711,887
|
|
||
_______________________________________________________________________________
(1) The sale of the hotel properties for the year ended December 31, 2015 is net of the hotels classified as held for sale for the year ended December 31, 2014 that were subsequently sold in 2015.
The change in the accumulated depreciation of the real estate assets is as follows:
|
2016
|
2015
|
2014
|
|||||||||
|
Reconciliation of Accumulated Depreciation
|
|||||||||||
|
Balance at beginning of period
|
$
|
(464,691
|
)
|
$
|
(382,266
|
)
|
$
|
(367,306
|
)
|
||
|
Add: Depreciation for the period
|
(91,400
|
)
|
(85,062
|
)
|
(81,892
|
)
|
|||||
|
Less: Sale of hotel properties (1)
|
35,574
|
|
2,637
|
|
24,383
|
|
|||||
|
Less: Accumulated depreciation of hotels held for sale
|
—
|
|
—
|
|
42,549
|
|
|||||
|
Balance at end of period
|
$
|
(520,517
|
)
|
$
|
(464,691
|
)
|
$
|
(382,266
|
)
|
||
_______________________________________________________________________________
(1) The sale of the hotel properties for the year ended December 31, 2015 is net of the hotels classified as held for sale for the year ended December 31, 2014 that were subsequently sold in 2015.
F-40
TABLE OF CONTENTS
Part IItem 1. BusinessItem 1A. Risk FactorsItem 1B. Unresolved Staff CommentsItem 2. PropertiesItem 3. Legal ProceedingsItem 4. Mine Safety DisclosuresPart IIItem 5. Market For Registrant's Common Equity, Related Shareholder Matters and Issuer Purchases Of Equity SecuritiesItem 6. Selected Financial DataItem 7. Management S Discussion and Analysis Of Financial Condition and Results Of OperationsItem 7A. Quantitative and Qualitative Disclosures About Market RiskItem 8. Financial Statements and Supplementary DataItem 9. Changes in and Disagreements with Accountants on Accounting and Financial DisclosuresItem 9A. Controls and ProceduresItem 9B. Other InformationPart IIIItem 10. Directors, Executive Officers and Corporate GovernanceItem 11. Executive CompensationItem 12. Security Ownership Of Certain Beneficial Owners and Management and Related Shareholder MattersItem 13. Certain Relationships and Related Transactions and Director IndependenceItem 14. Principal Accountant Fees and ServicesPart IVItem 15. Exhibits and Financial Statement SchedulesItem 16. Form 10-k SummaryItem 8. Financial Statements