UNITED STATES
SECURITIES AND EXCHANGE COMMISSION
Washington, D.C. 20549
FORM 10‑K
|
☒
|
ANNUAL REPORT PURSUANT TO SECTION 13 OR 15(d) OF THE SECURITIES EXCHANGE ACT OF 1934
|
For the fiscal year ended
December 31, 2019
or
|
☐
|
TRANSITION REPORT PURSUANT TO SECTION 13 OR 15(d) OF THE SECURITIES EXCHANGE ACT OF 1934
|
Commission file number 001-38183
RANGER ENERGY SERVICES, INC.
(Exact name of registrant as specified in its charter)
|
Delaware
|
81‑5449572
|
|
(State or other jurisdiction of incorporation or organization)
|
(I.R.S. Employer Identification No.)
|
800 Gessner Street, Suite 1000
Houston, Texas 77024
(713) 935‑8900
(Address, Including Zip Code, and Telephone Number, Including Area Code, of Registrant’s Principal Executive Offices)
Securities registered pursuant to Section 12(b) of the Act:
|
Title of each class
|
Trading Symbol
|
Name of each exchange on which registered
|
||
|
Class A Common Stock, $0.01 par value
|
RNGR
|
New York Stock Exchange
|
||
Indicate by check mark if the Registrant is a well-known seasoned issuer, as defined in Rule 405 of the Securities Act. Yes ☐ No ☒
Indicate by check mark if the Registrant is not required to file reports pursuant to Section 13 or Section 15(d) of the Act. Yes ☐ No ☒
Indicate by check mark whether the Registrant: (1) has filed all reports required to be filed by Section 13 or 15(d) of the Securities Exchange Act of 1934 during the preceding 12 months (or for such shorter period that the registrant was required to file such reports), and (2) has been subject to such filing requirements for the past 90 days. Yes ☒ No ☐
Indicate by check mark whether the Registrant has submitted electronically every Interactive Data File required to be submitted pursuant to Rule 405 of Regulation S-T during the preceding 12 months (or for such shorter period that the registrant was required to submit such files). Yes ☒ No ☐
Indicate by check mark whether the Registrant is a large accelerated filer, an accelerated filer, a non-accelerated filer, smaller reporting company, or an emerging growth company. See the definitions of “large accelerated filer,” “accelerated filer,” “smaller reporting company,” and “emerging growth company” in Rule 12b-2 of the Exchange Act.:
|
Large accelerated filer ☐
|
Accelerated filer ☐
|
Non-accelerated filer ☒
|
||
|
Smaller reporting company ☒
|
Emerging growth company ☒
|
|||
If an emerging growth company, indicate by check mark if the registrant has elected not to use the extended transition period for complying with any new or revised financial accounting standards provided pursuant to Section 13(a) of the Exchange Act. ☒
Indicate by check mark whether the Registrant is a shell company (as defined in Rule 12b-2 of the Exchange Act). Yes ☐ No ☒
As of
June 30, 2019
, the aggregate market value of the Class A Common Stock of Ranger Energy Services, Inc. held by non-affiliates of the Registrant was
$42.3 million
, based on the closing market price as reported on the New York Stock Exchange of
$8.05
. As of
February 26, 2020
, the Registrant had
8,632,788
shares of Class A Common Stock and
6,866,154
shares of Class B Common Stock outstanding.
DOCUMENTS INCORPORATED BY REFERENCE
Portions of the registrant’s definitive proxy statement for the
2020
Annual Meeting of Stockholders, to be filed no later than 120 days after the end of the fiscal year to which this Annual Report on Form 10-K relates, are incorporated by reference into Part III of this Annual Report on Form 10-K.
RANGER ENERGY SERVICES, INC.
TABLE OF CONTENTS
|
Item
|
Page
|
|||
CAUTIONARY STATEMENT REGARDING FORWARD-LOOKING STATEMENTS
The information in this Annual Report on Form 10-K (“Annual Report”) includes “forward‑looking statements” within the meaning of Section 27A of the Securities Act of 1933, as amended (the “Securities Act”) and Section 21E of the Exchange Act of 1934 (the “Exchange Act”), as amended. All statements, other than statements of historical fact included in this Form 10-K, regarding our strategy, future operations, financial position, estimated revenues and losses, projected costs, prospects, plans and objectives of management are forward‑looking statements. When used in this Form 10-K, the words “could,” “believe,” “anticipate,” “intend,” “estimate,” “expect,” “project” and similar expressions are intended to identify forward‑looking statements, although not all forward‑looking statements contain such identifying words. These forward‑looking statements are based on our current expectations and assumptions about future events and are based on currently available information as to the outcome and timing of future events.
Forward‑looking statements may include statements about:
|
•
|
our business strategy;
|
|
•
|
our operating cash flows, the availability of capital and our liquidity;
|
|
•
|
our future revenue, income and operating performance;
|
|
•
|
our ability to sustain and improve our utilization, revenues and margins;
|
|
•
|
our ability to maintain acceptable pricing for our services;
|
|
•
|
our future capital expenditures;
|
|
•
|
our ability to finance equipment, working capital and capital expenditures;
|
|
•
|
competition and government regulations;
|
|
•
|
our ability to obtain permits and governmental approvals;
|
|
•
|
pending legal or environmental matters;
|
|
•
|
marketing of oil and natural gas;
|
|
•
|
business or asset acquisitions, including the integration thereof;
|
|
•
|
general economic conditions;
|
|
•
|
credit markets;
|
|
•
|
our ability to successfully develop our research and technology capabilities and implement technological developments and enhancements;
|
|
•
|
uncertainty regarding our future operating results; and
|
|
•
|
plans, objectives, expectations and intentions contained in this Annual Report that are not historical.
|
We caution you that these forward‑looking statements are subject to all of the risks and uncertainties, most of which are difficult to predict and many of which are beyond our control. These risks include, but are not limited to, the risks described under “Part I, Item 1A. Risk Factors” in this Annual Report. Should one or more of the risks or uncertainties described occur, or should underlying assumptions prove incorrect, our actual results and plans could differ materially from those expressed in any forward‑looking statements.
All forward‑looking statements, expressed or implied, included in this Annual Report are expressly qualified in their entirety by this cautionary statement. This cautionary statement should also be considered in connection with any subsequent written or oral forward‑looking statements that we or persons acting on our behalf may issue. Except as otherwise required by applicable law, we disclaim any duty to update any forward‑looking statements, all of which are expressly qualified by the statements in this section, to reflect events or circumstances after the date of this Annual Report.
PART I
Except as otherwise indicated or required by the context, all references in this Annual Report to the “Company,” “Ranger,” “we,” “us” or “our” relate, prior to our initial public offering (the “Offering”), to Ranger Energy Services, LLC (“Ranger Services”) and Torrent Energy Services, LLC (“Torrent Services”) on a Combined basis, and following the Offering, to Ranger Energy Services, Inc. (“Ranger, Inc.”) and its consolidated subsidiaries. References in this Annual Report to “Ranger LLC” refer to RNGR Energy Services, LLC, which owns our operating subsidiaries, including Ranger Services and Torrent Services. References in this Annual Report to the “Existing Owners” refer to Ranger Energy Holdings, LLC (“Ranger Holdings”), Ranger Energy Holdings II, LLC (“Ranger Holdings II”), Torrent Energy Holdings, LLC (“Torrent Holdings”) and Torrent Energy Holdings II, LLC (“Torrent Holdings II”), the entities through which our legacy investors, including
CSL Capital Management, LLC (“CSL”), certain members of our management and other investors own their retained interest in us and Ranger LLC.
Item 1. Business
Overview
Ranger Energy Services, Inc. is a provider of onshore high specification (“high-spec”) well service rigs, wireline completion services and additional complementary services in the United States. We provide an extensive range of well site services to leading U.S. exploration and production (“E&P”) companies that are fundamental to establishing and maintaining the flow of oil and natural gas throughout the productive life of a well. Our focus has been positioning ourselves to serve a high-quality customer base by leveraging our young fleet, improving systems and streamlining processes, making Ranger an operator of choice for U.S. E&P companies that require completion and production services.
Our service offerings consist of well completion support, workover, well maintenance, wireline, fluid management, other complementary services, as well as installation, commissioning and operating of modular equipment, which are conducted in three reportable segments, as follows:
|
•
|
High Specification Rigs
. Provider of high-spec well service rigs and complementary equipment and services to facilitate operations throughout the lifecycle of a well.
|
|
•
|
Completion and Other Services
. Provider of wireline completion services necessary to bring a well on production and other ancillary services often utilized in conjunction with our high-spec rig services to maintain the production of a well.
|
|
•
|
Processing Solutions
. Provider of proprietary, modular equipment for the processing of natural gas.
|
We operate in most of the active oil and natural gas basins in the United States, including the Permian Basin, Denver-Julesburg Basin, Bakken Shale, Eagle Ford Shale, Haynesville Shale, Gulf Coast, South Central Oklahoma Oil Province and Sooner Trend Anadarko Basin Canadian and Kingfisher Counties plays. For further information related to our services and financial results of our operating segments, see “Part I, Item 1. Business—Our Segments,” “Part II, Item 7. Management Discussion and Analysis—Operating Results,” and “Part II, Item 8. Financial Statements and Supplementary Data—
Note 15 — Segment Reporting
.”
Ranger Inc. continues to combine our services offerings with a highly skilled and experienced workforce, enabling us to consistently deliver exceptional service while maintaining high health, safety and environmental standards. Personnel at Ranger are dedicated to redefining services for our customers, driving new thinking, raising standards and rising to challenges. We believe that our efficient operational performance, executed at a high level of integrity, strong safety record and low leverage provides a competitive advantage.
Organization
Ranger Inc. was incorporated as a Delaware corporation in February 2017. In conjunction with the Offering of Class A Common Stock, par value $0.01 per share (“Class A Common Stock”), which closed on
August 16, 2017
, and the corporate reorganization, we underwent in connection with the Offering, we became a holding company, the sole material assets of which consist of membership interests in Ranger LLC. Ranger LLC owns all of the outstanding equity interests in Ranger Services and Torrent Services, the subsidiaries through which it operates its assets. Through the consummation of the corporate reorganization, Ranger LLC is the sole managing member of, and is responsible for all operational, management and administrative decisions relating to, Ranger Services and Torrent Services’ business and consolidates the financial results of Ranger Services and Torrent Services and their subsidiaries.
1
The following diagram indicates our current ownership structure as a result of the Offering and the transactions related thereto:
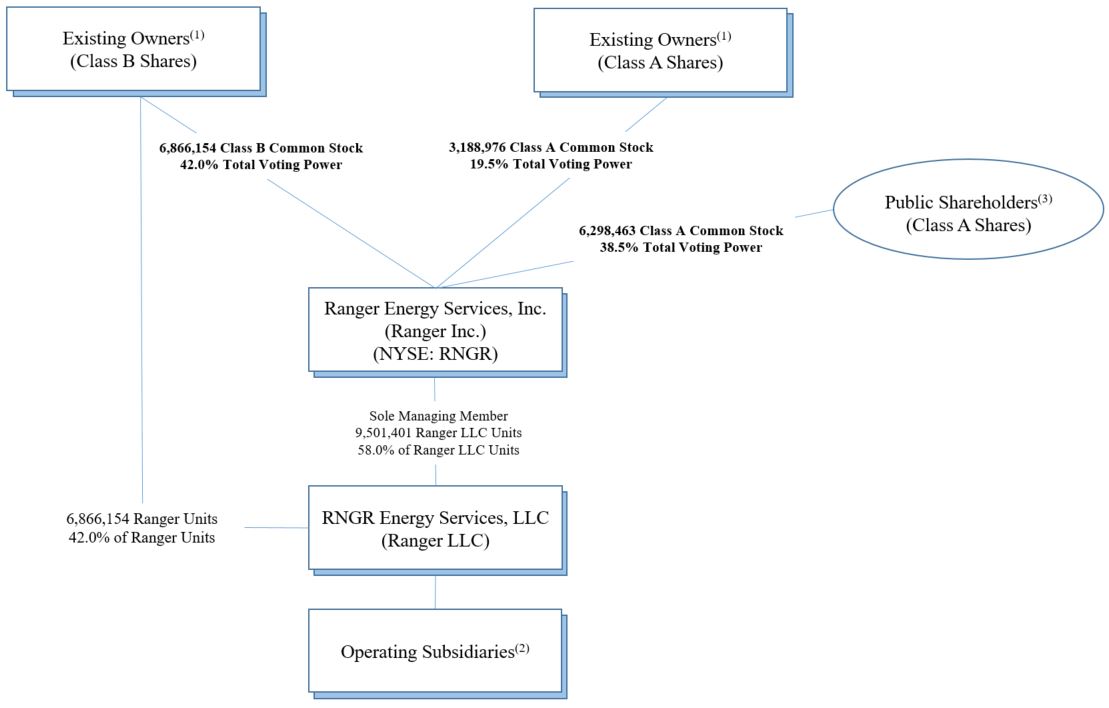
_________________________
|
(1)
|
CSL, Bayou Well Holdings Company, LLC, certain members of our management and other investors own all of the equity interests in the Existing Owners, where CSL holds a majority of the voting interests in each of the Existing Owners.
|
|
(2)
|
Inclusive of Ranger Services and Torrent Services and subsidiaries.
|
|
(3)
|
Inclusive of unvested restricted share awards.
|
Our Segments
We conduct our operations through multiple business lines that are organized into
three
reporting segments: High Specification Rigs, Completion and Other Services and Processing Solutions. The following provides additional detail on our reportable segments and the business lines within each segment.
High Specification Rigs
Our High Specification Rig segment provides high-spec well and complementary equipment and services to facilitate operations throughout the lifecycle of a well. We provide these advanced services to E&P companies, particularly to those operating in unconventional oil and natural gas reservoirs and requiring technically and operationally advanced services. Our high‑spec well service rigs are designed to support U.S. horizontal well demands.
Specifically, our high-spec rig services consist of the following:
|
•
|
Well completion support
. Our well completion support services are utilized subsequent to hydraulic fracturing operations but prior to placing a well into production, and primarily include unconventional well completion operations, including milling out composite plugs, frac sand or other downhole debris or obstructions that were introduced in the well as part of the completion process and installing production tubing and other permanent downhole equipment necessary to facilitate production.
|
|
•
|
Workovers
. Our workover services primarily facilitate major well repairs or modifications required to sustain the flow of oil and natural gas in a producing well. Workovers, which may require a few days to several weeks to complete and generally require additional auxiliary equipment, are typically more complex and more time consuming than well maintenance operations. Workover operations include major subsurface repairs such as the
|
2
repair or replacement of well casing, recovery or replacement of tubing and removal of foreign objects from the wellbore. All of our high‑spec well service rigs are designed to perform complex workover operations.
|
•
|
Well maintenance
. Our well maintenance services provide periodic maintenance required throughout the life of a well to sustain optimal levels of oil and natural gas production. Our well maintenance services primarily include the removal and replacement of downhole production equipment, including artificial lift components such as sucker rods and downhole pumps, the repair of failed production tubing and the repair and removal of other downhole production‑related byproducts such as frac sand or paraffin that impair well productivity. These and similar routine maintenance services involve relatively low‑cost, short‑duration operations that generally experience relatively stable demand notwithstanding changes in drilling activity.
|
In addition to our core well service rig operations, we also offer well service‑related equipment rentals, as described below.
|
•
|
Well Service‑Related Equipment Rentals
. Our well service‑related equipment rentals consist of a diverse fleet of rental items, including fluid pumps (various horsepower pumping equipment utilized to circulate fluid in and out of wellbores), power swivels (hydraulic motor‑driven, pipe‑rotating machines used to deliver shock‑free torque to the workstring or tubing during well service rig operations), well control packages (equipment used to ensure formation pressure is maintained within the wellbore during well service rig operations), hydraulic catwalks (mechanized lifting devices used to raise and lower drill pipe and tubing to and from the well service rig work floor), frac tanks, pipe racks and pipe handling tools. Our well service‑related equipment rentals are typically used in conjunction with the services provided by our high-spec well services.
|
We have a fleet of 139 well service rigs, which we believe to be among the newest and most advanced in the industry and are considered to be high-spec rigs, with high operating horsepower (“HP”) (450 HP or greater) and tall mast heights (102 feet or higher). In February 2017, we entered into a Purchase Agreement with National Oilwell Varco, Inc. (“NOV”), pursuant to which we accepted delivery of 28 high-spec rigs during the years ended December 31, 2018 and 2017.
The high‑spec well service rigs in our fleet, the substantial majority of which has been built since 2010, have an average age of approximately six years and feature modern operating components sourced from leading U.S. manufacturers. Approximately 60% of our existing high‑spec well service rigs were manufactured by NOV, with the remaining manufactured by Dragon/Cooper, Service King, Rig Works, Taylor, Mustang and Stewart & Stevenson Crown. The following table provides a summary of information regarding our high-spec well service rig fleet.
|
HP Rating
(1)
|
Mast Height
|
Mast Rating
(2)
|
Number of High-Spec Rigs
|
|||
|
550 — 600
|
112’ — 117’
|
250,000 — 300,000’
|
58
|
|||
|
500
|
104’ — 108’
|
240,000 — 250,000’
|
60
|
|||
|
450 — 475
|
102’ — 104’
|
200,000 — 250,000’
|
21
|
|||
|
Total High-Spec Rigs
|
139
|
|||||
______________________
|
(1)
|
Per manufacturer.
|
|
(2)
|
The mast ratings of our high-spec well service rigs complement their high operating HP and tall mast heights by allowing such rigs to safely support the higher weights associated with the long tubing strings used in long-lateral well completion operations and is measured in pounds.
|
The composition of our well service rig fleet makes it particularly well-suited to provide both completion-oriented services, the demand for which generally increases along with increased capital spending by E&P operators, and production-oriented services, the demand for which is less influenced, on a comparative basis, by such capital spending. The ability of our well service rigs to accommodate the needs of our E&P customers in a variety of economic conditions has historically allowed us to maintain relatively high rig utilization.
In connection with the operations of our high‑spec well service rigs, we also maintain a supply of additional service and rental equipment, including accumulators, acid and frac tanks, motor vehicles, trailers, tractors, catwalks, cementing units, pipe racks, power swivels, ram block assemblies, fluid pumps and related items.
Completion and Other Services
Our Completion and Other Services segment provides wireline completion services necessary to bring a well on production and other ancillary services often utilized in conjunction with our high-spec rig services to maintain the production of a well. Our completion and other services, as described in further detail below, strategically enhance our operating footprint by creating
3
operational efficiencies for our customers and allow us to capture a greater portion of their spending across the lifecycle of a well.
|
•
|
Wireline Services
. Our wireline services involve the use of wireline trucks equipped with a spool of cable that is unwound and lowered into oil and natural gas wells to convey specialized tools or equipment primarily for well completion, but also for well intervention, pipe recovery, plugging and abandonment purposes.
|
|
•
|
Fluid Management Services
. Our fluid management services consist of the hauling of oilfield fluids, including drilling mud, fresh water and saltwater used or produced in well drilling, completion and production. Additionally, we rent tanks to store such fluids at the wellsite.
|
|
•
|
Snubbing Services
. Our snubbing services consist of using our snubbing units together with our well service rigs in order to perform well completion, workover or maintenance activities. Our snubbing services enable operators to safely run or remove pipe and other associated downhole tools into pressurized or highly deviated wellbores.
|
|
•
|
Decommissioning
. Our decommissioning services primarily include plugging and abandonment, in which our well service rigs and wireline and cementing equipment are used to prepare non‑economic oil and natural gas wells to be permanently sealed or temporarily shut in. Decommissioning work is typically less sensitive to oil and natural gas prices than our other well service rig operations as a result of decommissioning obligations imposed by state regulations.
|
Services provided within our High Specification Rig and Completion and Other Services segments, as described above, are fundamental to establishing and maintaining the flow of oil and natural gas throughout the productive life of a well.
We have a fleet of wireline and high-pressure pump trucks that are utilized in our Completion and related services. Our wireline services utilize high-pressure pump trucks to pump fracturing plugs and perforating guns into extended reach horizontal wells for pump down perforating completion purposes. We perform snubbing services, which utilizes specialized trucks and equipment units to enable operators to safely run or remove pipe and other downhole tools from a pressurized well. Our fluid management services utilize trucks, pumps and other tools and equipment to control and separate completion fluids and to haul oilfield fluids used in production.
Processing Solutions
Our Processing Solutions segment engages in the rental, installation, commissioning, start‑up, operation and maintenance of Mechanical Refrigeration Units (“MRU”), Nitrogen Gas Liquid (“NGL”) stabilizer units, NGL storage units and related equipment. Our Processing Solutions segment provides a range of proprietary, modular equipment for the processing of rich natural gas streams at the wellhead or central gathering points in basins where drilling and completion activity has outpaced the development of permanent processing infrastructure.
We have developed a premium offering that includes proprietary designs and modern processing equipment, including modular MRU’s. Our modular units provide flexibility across a broad range of project requirements and operating environments, and are designed to allow for quick mobilization to minimize downtime and increase utilization, particularly in conjunction with the operational support provided by our expert field personnel. Our natural gas processing solutions assist our customers with meeting pipeline specifications, extracting higher value NGLs, providing fuel gas for wellsites and facilities and reducing emissions at the flare tip. Our modular units provide flexibility to match a broad range of project requirements and are designed to allow for quick mobilization and demobilization.
In addition to our proprietary natural gas and NGL processing equipment, we offer full transportation, installation and ongoing operation services in the field. Our turn‑key mobilization services include in‑bound transportation, site offloading, installation, commissioning, startup and training of field personnel. Our ongoing operations and maintenance services include daily onsite and callout services, daily field reports and NGL transportation and marketing arrangements. We also employ full‑time process and mechanical engineers with significant experience in designing gas treating and processing solutions to provide quality service to our customers.
We have a fleet of 33 MRUs that are modern, reliable and equipped to handle large volumes of natural gas while operating across a broad array of oilfield conditions with minimal downtime and maintenance. Our MRUs are constructed and assembled by third‑party vendors in accordance with our proprietary designs and with our oversight of sourcing and procurement. Our MRUs can be stacked and scaled to handle a range of projects and natural gas volumes and can generate temperatures downwards of -20 degrees Fahrenheit. In addition, we own and operate five auxiliary NGL stabilizer units (designed to assist our MRUs that require additional capacity to separate and capture valuable NGLs), 59 NGL storage tanks with bulkhead delivery systems and capacities of 18,000 gallons, 14 trailer‑mounted natural gas generators and additional supporting auxiliary equipment. Our proprietary natural gas and NGL processing equipment is generally designed to be mobile and purpose‑built to increase efficiency
4
and productivity while reducing safety risks. We also own and operate 50 gas coolers, which reduces the temperatures of the natural gas stream to allow further processing and meet pipeline specifications.
Other
We incur corporate and administrative costs that are not specific to any of the operating segments or business lines, which are reported as Other. For further information regarding the results of operations for each segment, please see “Part II, Item 7. Management’s Discussion and Analysis of Financial Condition and Results of Operations—Results of Operations” and “Part II, Item 8. Financial Statements and Supplementary Data-
Note 15 — Segment Reporting
.”
Competition
We provide services in various geographic regions across the United States, which are highly competitive. Our competitors include many large and small oilfield service providers. Our largest competitors in the high specification rig and completion services market include Basic Energy Services, Inc., Forbes Energy Services Ltd., Key Energy Services, Inc., KLX Energy Services, Nine Energy Service, Inc. and Pioneer Energy Services Corp. In the processing solutions market our primary competitors include GTUIT, LLC and Kinder Morgan Treating LP. In addition, our industry is highly fragmented and we compete regionally with a significant number of smaller service providers.
We believe that the principal competitive factors in the markets we serve are technical expertise, equipment capacity, work force competency, efficiency, safety record, reputation, experience and price. Additionally, projects are often awarded on a bid basis, which tends to create a highly competitive environment. We seek to differentiate ourselves from our competitors by delivering the highest-quality services and equipment possible, coupled with superior execution and operating efficiency in a safe working environment.
Cyclical Nature of Industry
We operate in a highly cyclical industry and the key factor driving demand for our services is the level of drilling activity by E&P companies. In turn, the level of drilling depends largely on the current and anticipated economics of new well completions. Global supply and demand for oil and the domestic supply and demand for natural gas are critical in assessing industry outlook. Demand for oil and natural gas is cyclical and subject to large, rapid fluctuations. E&P companies tend to increase capital expenditures in response to increases in oil and natural gas prices, which generally results in greater revenues and profits for oilfield service companies. Increased capital expenditures also lead to greater production, which historically has resulted in increased inventories and reduced prices, consequently reducing demand for oilfield services. The results of our operations, therefore, may fluctuate from period to period, and these fluctuations may distort comparisons of results across periods.
Seasonality
Our results of operations have historically reflected seasonal tendencies relating to holiday seasons, inclement weather and the conclusion of our customers’ annual drilling and completion of capital expenditure budgets. Our most notable declines generally occur in the fourth quarter of the calendar year. Additionally, some of the areas in which we have operations, including the Denver-Julesburg Basin and the Bakken Shale, are adversely affected by seasonal weather conditions, primarily during the winter months. During periods of heavy snow, ice, wind or rain, we may be unable to move our equipment between locations, thereby reducing our ability to provide services and generate revenues, or we could suffer weather-related damage to our facilities and equipment resulting in delays in operations.
Sales and Marketing
Our sales and marketing activities typically are performed through local operations in each geographical region and are supported by sales representatives at our corporate headquarters. Our senior management takes an active role in supporting our sales and marketing personnel. We believe our field sales personnel understand the region‑specific issues and customer operating procedures and therefore can more effectively target marketing activities. Our sales representatives work closely with our managers and field sales personnel to target market opportunities.
Significant Customers
We have strong relationships with a broad customer base, including EOG Resources, Inc., Concho Resources, Inc., Centennial Resource Development, Inc. and Pioneer Natural Resources Company. During the year ended
December 31, 2019
, EOG Resources, Inc. and Concho Resources accounted for approximately 17% and 14%, respectively, of our consolidated revenues and we worked for approximately 200 distinct customers. During the year ended
December 31, 2018
, EOG Resources, Inc. accounted for approximately 20% of our revenues. No other customer represents more than 10% of our consolidated revenues for the years ended
December 31, 2019
and
2018
. Our top five customers represented approximately 49% and
42%
of our consolidated revenues for
2019
and
2018
, respectively.
5
Suppliers
Our internal supply chain team manages sourcing and logistics to ensure flexibility and continuity of supply in a cost effective manner across all areas of our operations. We have built long‑term relationships with multiple industry leading suppliers of materials and equipment. We purchase a wide variety of materials, parts and components that are manufactured and supplied for our operations. We are not dependent on any single source of supply for those parts, supplies or materials. We have generally been able to obtain the equipment, parts and supplies necessary to support our operations on a timely basis.
Employees
We invest in attracting and retaining talented employees and believe we have good relationships with our employees. As of
December 31, 2019
, we had approximately 1,100 full-time, part-time and seasonal employees and no unionized labor. We hire independent contractors on an as-needed basis and are not a party to collective bargaining agreements.
Environmental and Occupational Safety and Health Matters
Our operations, which support the oil and natural gas exploration, development and production activities pursued by our customers, are subject to stringent and comprehensive federal, regional, state and local laws and regulations governing occupational safety and health, the discharge of materials into the environment, solid and hazardous waste management, fluid transportation and disposal and environmental protection. These laws and regulations may, among other things (i) limit or prohibit our operations on certain lands lying within wilderness, wetlands and other protected areas; (ii) require remedial measures to mitigate or clean-up pollution from former and ongoing operations; (iii) impose restrictions on the types, quantities and concentrations of various substances that can be released into the environment or injected in formations in connection with oil and natural gas drilling and production activities; (iv) impose specific safety and health standards or criteria addressing worker protection; and (v) impose substantial liabilities for pollution resulting from our operations.
Numerous governmental entities, including the U.S. Environmental Protection Agency (“EPA”) and analogous state agencies, have the power to enforce compliance with these laws and regulations and the permits issued under them. Any failure to comply with these laws and regulations may result in the assessment of sanctions, including administrative, civil and criminal penalties, the imposition of investigatory, remedial or corrective action obligations or the incurrence of capital expenditures; the occurrence of delays in the permitting or performance of projects; the issuance of orders enjoining performance of some or all of our operations in a particular area; and governmental or private claims for personal injury or property or natural resource damages.
The trend in environmental regulation has been to place more restrictions and limitations on activities that may adversely affect the environment, and thus any changes in environmental laws and regulations or re-interpretation of enforcement policies that result in more stringent and costly regulatory requirements could have a material adverse effect on our business, liquidity position, financial condition, results of operations and prospects. We may be unable to pass on such increased compliance costs to our customers. Moreover, accidental releases or spills may occur in the course of our operations, and we cannot assure you that we will not incur significant costs and liabilities as a result of such releases or spills, including any third-party claims for damage to property, natural resources or persons. Our customers may also incur increased costs or delays or restrictions in permitting or operating activities as a result of more stringent environmental laws and regulations, which may result in a curtailment of exploration, development or production activities that would reduce the demand for our services.
Worker Health and Safety
We are subject to the requirements of the federal Occupational Safety and Health Act (“OSHA”), and comparable state statutes that regulate the protection of the health and safety of workers. In addition, the OSHA hazard communication standard requires that information be maintained about hazardous materials used or produced in operations and that this information be provided to employees, state and local government authorities and the public.
Radioactive Materials
Naturally Occurring Radioactive Materials (“NORM”) may contaminate extraction and processing equipment used in the oil and natural gas industry, most often in the form of scale. The waste resulting from such contamination is regulated by federal and state laws. Standards have been developed for worker protection, treatment, storage, and disposal of NORM and NORM waste, management of NORM-contaminated waste piles, containers and tanks and limitations on the relinquishment of NORM-contaminated land for unrestricted use under the Resource Conservation and Recovery Act (“RCRA”) and state laws. We may incur significant costs or liabilities associated with elevated levels of NORM.
Hazardous Substances and Wastes and Naturally Occurring Radioactive Materials
The RCRA, and comparable state statutes, regulate the generation, treatment, storage, transportation, disposal and clean-up of hazardous and non-hazardous wastes. Pursuant to rules issued by the EPA, individual states can have delegated authority to administer some or all of the provisions of RCRA, sometimes in conjunction with their own, more stringent requirements. In
6
the course of our operations, we generate industrial wastes, such as paint wastes, waste solvents and oils that are regulated as hazardous materials. Drilling fluids, produced waters and other wastes associated with the exploration, development and production of oil or natural gas, if properly handled, are currently exempt from regulation as hazardous waste under RCRA and, instead, are regulated under RCRA’s less stringent non-hazardous waste provisions, or other state or federal laws.
However, it is possible that certain oil and natural gas drilling and production wastes now classified as non-hazardous could be classified as hazardous wastes in the future. For example, the EPA is required, by a consent decree, to propose a rulemaking for revision of certain RCRA Subtitle D criteria regulations pertaining to oil and natural gas wastes or sign a determination that revision of the regulations is not necessary no later than March 15, 2019. The EPA ultimately signed a determination that revision of the regulations is not necessary at this time. Nevertheless, reclassification of drilling fluids, produced waters and related wastes as hazardous under RCRA could result in an increase in our, as well as the oil and natural gas E&P industries’, costs to manage and dispose of generated wastes, which could have a material adverse effect on our business, liquidity position, financial condition, results of operations and prospects. Additionally, other wastes handled at E&P sites or generated in the course of providing well services may not fall within this exclusion.
The Comprehensive Environmental Response, Compensation and Liability Act (“CERCLA”) and comparable state laws impose strict, joint and several liability for environmental contamination and damages to natural resources without regard to fault or the legality of the original conduct on certain classes of persons. These persons include owners and operators of real property impacted by a release of hazardous substances and any company that transported, disposed of or arranged for the transport or disposal of hazardous substances to or at the site. Under CERCLA, such persons may be liable for, among other things, the costs of remediating the hazardous substances that have been released into the environment, damages to natural resources and the costs of certain health studies. In addition, where contamination may be present, it is not uncommon for the neighboring landowners and other third parties to file claims for personal injury, property damage and recovery of response costs.
Water Discharges and Discharges into Belowground Formations
The Federal Water Pollution Control Act, also known as the Clean Water Act (“CWA”), and analogous state laws, impose restrictions and strict controls with respect to the discharge of pollutants, including spills and leaks of oil and hazardous substances, into state waters and waters of the United States. The discharge of pollutants into regulated waters is prohibited, except in accordance with the terms of a permit issued by the EPA or an analogous state agency. Spill prevention, control and countermeasure plan requirements imposed under the CWA require appropriate containment berms and similar structures to help prevent the contamination of navigable waters in the event of a petroleum hydrocarbon tank spill, rupture or leak. In addition, the CWA and analogous state laws require individual permits or coverage under general permits for discharges of storm water runoff from certain types of facilities. The CWA also prohibits the discharge of dredge and fill material in regulated waters, including wetlands, unless authorized by permit. There has been substantial uncertainty regarding the scope of regulated waters in recent years, and any expansion in this scope could result in increased costs or timeframes to complete activities. The CWA and analogous state laws also may impose substantial civil and criminal penalties for non-compliance including spills and other non-authorized discharges.
The Oil Pollution Act of 1990 (“OPA”) sets minimum standards for prevention, containment and cleanup of oil spills. The OPA applies to vessels, offshore facilities and onshore facilities, including exploration and production facilities that may affect waters of the United States. Under the OPA, responsible parties including owners and operators of onshore facilities may be held strictly liable for oil cleanup costs and natural resource damages as well as a variety of public and private damages that may result from oil spills. The OPA also requires owners or operators of certain onshore facilities to prepare Facility Response Plans for responding to a worst-case discharge of oil into waters of the United States.
Our oil and natural gas producing customers dispose of flowback and produced water or certain other oilfield fluids gathered from oil and natural gas producing operations in accordance with permits issued by government authorities overseeing such disposal activities. While these permits are issued pursuant to existing laws and regulations, these legal requirements are subject to change based on concerns of the public or governmental authorities regarding such disposal activities. One such concern relates to recent seismic events near underground disposal wells used for the disposal by injection of flowback and produced water or certain other oilfield fluids resulting from oil and natural gas activities. When caused by human activity, such events are called induced seismicity. In response to concerns regarding induced seismicity, regulators in some states have imposed, or are considering imposing, additional requirements in the permitting of produced water disposal wells or otherwise to assess any relationship between seismicity and the use of such wells. States may, from time to time, develop and implement plans directing certain wells where seismic incidents have occurred to restrict or suspend disposal well operations. In addition, ongoing lawsuits allege that disposal well operations have caused damage to neighboring properties or otherwise violated state and federal rules regulating waste disposal. These developments could result in additional regulation and restrictions on the use of injection wells by our customers to dispose of flowback and produced water and certain other oilfield fluids. Increased regulation and
7
attention given to induced seismicity also could lead to greater opposition to, and litigation concerning, oil and natural gas activities utilizing injection wells for waste disposal.
Any one or more of these developments may necessitate that our customers limit disposal well volumes, rates or locations, or may require our customers or third party disposal well operators that dispose of customer wastewater to shut down disposal wells, which could adversely affect our customers’ business and result in a corresponding decrease in the need for our services, which could have a material adverse impact on our business, liquidity position, financial condition, results of operations and prospects.
Air Emissions
Some of our operations also result in emissions of regulated air pollutants. The federal Clean Air Act (“CAA”) and analogous state laws require permits for certain facilities that have the potential to emit substances into the atmosphere that could adversely affect environmental quality. These laws and their implementing regulations also impose limitations on air emissions and require adherence to maintenance, work practice, reporting and record keeping and other requirements. Failure to obtain a permit or to comply with permit or other regulatory requirements could result in the imposition of sanctions, including administrative, civil and criminal penalties. In addition, we or our customers could be required to shut down or retrofit existing equipment, leading to additional capital or operating expenses and operational delays.
Many of these regulatory requirements, including New Source Performance Standards (“NSPS”) and Maximum Achievable Control Technology standards, are expected to be made more stringent over time as a result of stricter ambient air quality standards and other air quality protection goals adopted by the EPA. Compliance with these or other new regulations could, among other things, require installation of new emission controls on some of our equipment, result in longer permitting timelines and significantly increase our capital expenditures and operating costs, which could adversely impact our business. For example, in June 2016, the EPA published additional final rules establishing new emissions standards for methane and additional standards for VOCs from certain new, modified and reconstructed equipment and processes in the oil and natural gas source category, including production, processing, transmission and storage activities, and is formally seeking additional information from oil and natural gas producing companies as necessary to eventually expand these final rules to include existing equipment and processes. However, following the change in presidential administration, there have been attempts to modify these regulations. In August 2019, the EPA proposed amendments to the 2016 standards that, among other things, would rescind methane-specific requirements applicable to sources in the oil and natural gas industry but retain emissions limits for VOCs. Legal challenges to any final rulemaking that rescinds the 2016 standards are expected. Therefore, the extent of future implementation of these standards is uncertain at this time. In addition, some of our customers may operate on federal or tribal lands, and are subject to further regulation, including by tribal authorities and the federal Bureau of Land Management (“BLM”). Potentially applicable regulations include EPA’s June 2016 Federal Implementation Plan (“FIP”) to implement the Federal Minor New Source Review Program on tribal lands for oil and gas production. The FIP creates a permit-by-rule process for minor sources that also incorporates emission limits and other requirements under various federal air quality standards, applying them to a range of equipment and processes used in oil and gas production. In April 2018, the EPA proposed revisions to reportedly streamline the FIP. Neither the FIP nor the revisions apply in areas of ozone non-attainment, except, as the result of a May 2019 rule, to the Indian country portion of the Uinta Basin Ozone Nonattainment Area. As a result, the EPA may impose area-specific regulations in certain areas identified as tribal lands that may require additional emissions controls on existing equipment. Such requirements will likely result in increased operating and compliance costs for our customers in these regions.
In November 2016, the BLM finalized a rule regulating the venting and flaring of natural gas, leak detection, air emissions from equipment, well maintenance and unloading, drilling and completions and royalties potentially owed for loss of such emissions from oil and natural gas facilities producing on federal and tribal leases. In September 2018, the BLM issued a final rule rescinding the agency’s 2016 methane rule, and litigation challenging the rescission is pending. Compliance with these and other air pollution control and permitting requirements has the potential to delay the development of oil and natural gas projects and increase costs for us and our customers. Moreover, our business could be materially affected if these or other similar requirements increase the cost of doing business for us and our customers, or reduce the demand for the oil and natural gas our customers produce, and thus have an adverse effect on the demand for our services.
Climate Change
The threat of climate change continues to attract considerable attention in the United States and in foreign countries. Numerous proposals have been made and could continue to be made at the international, national, regional and state levels of government to monitor and limit existing emissions of greenhouse gases (“GHG”) as well as to restrict or eliminate such future emissions. As a result, our operations as well as the operations of our oil and natural gas exploration and production customers are subject to a series of regulatory, political, litigation, and financial risks associated with the production and processing of fossil fuels and emission of GHG.
8
In the United States, no comprehensive climate change legislation has been implemented at the federal level. However, with the U.S. Supreme Court finding that GHG emissions constitute a pollutant under the CAA, the EPA has adopted rules that, among other things, establish construction and operating permit reviews for GHG emissions from certain large stationary sources, require the monitoring and annual reporting of GHG emissions from certain petroleum and natural gas system sources in the United States, implement New Source Performance Standards directing the reduction of methane from certain new, modified, or reconstructed facilities in the oil and natural gas sector, and together with the U.S. Department of Transportation (“DOT”), implement GHG emissions limits on vehicles manufactured for operation in the United States. Additionally, various states and groups of states have adopted or are considering adopting legislation, regulations or other regulatory initiatives that are focused on such areas as GHG cap and trade programs, carbon taxes, reporting and tracking programs, and restriction of emissions. At the international level, there is a non-binding agreement, the United Nations-sponsored Paris Agreement, for nations to limit their GHG emissions through individually-determined reduction goals every five years after 2020, although the United States has announced its withdrawal from such agreement, effective November 4, 2020.
Governmental, scientific and public concern over the threat of climate change arising from GHG emissions has resulted in increasing political risks in the United States, including climate change related pledges made by certain candidates seeking the office of the President of the United States in 2020. Two critical declarations made by one or more candidates running for the Democratic nomination for President include threats to take actions banning hydraulic fracturing of oil and natural gas wells and banning new leases for production of minerals on federal properties, including onshore lands and offshore waters. Other actions that could be pursued by presidential candidates may include the imposition of more restrictive requirements for the establishment of pipeline infrastructure or the permitting of LNG export facilities, as well as the reversal of the United States’ withdrawal from the Paris Agreement in November 2020. Litigation risks are also increasing, as a number of cities and other local governments have sought to bring suit against the largest oil and natural gas E&P companies in state or federal court, alleging, among other things, that such companies created public nuisances by producing fuels that contributed to global warming effects, such as rising sea levels, and therefore are responsible for roadway and infrastructure damages as a result.
There are also increasing financial risks for fossil fuel producers as shareholders currently invested in fossil-fuel energy companies concerned about the potential effects of climate change may elect in the future to shift some or all of their investments into non-energy related sectors. Institutional lenders who provide financing to fossil-fuel energy companies also have become more attentive to sustainable lending practices and some of them may elect not to provide funding for fossil fuel energy companies. Additionally, the lending practices of institutional lenders have been the subject of intensive lobbying efforts in recent years, oftentimes public in nature, by environmental activists, proponents of the international Paris Agreement, and foreign citizenry concerned about climate change not to provide funding for fossil fuel producers. Limitation of investments in and financings for fossil fuel energy companies could result in the restriction, delay or cancellation of drilling programs or development or production activities.
The adoption and implementation of new or more stringent international, federal or state legislation, regulations or other regulatory initiatives that impose more stringent standards for GHG emissions from the oil and natural gas sector or otherwise restrict the areas in which this sector may produce oil and natural gas or generate GHG emissions could result in increased costs of compliance or costs of consuming, and thereby reduce demand for, oil and natural gas, which could reduce demand for our services and products. Additionally, political, litigation and financial risks may result in our oil and natural gas customers restricting or cancelling production activities, incurring liability for infrastructure damages as a result of climatic changes, or impairing their ability to continue to operate in an economic manner, which also could reduce demand for our services and products. One or more of these developments could have a material adverse effect on our business, financial condition and results of operation.
Hydraulic Fracturing
Our customers are reliant on hydraulic fracturing services in connection with their production of oil and natural gas. Hydraulic fracturing stimulates production of oil and/or natural gas from dense subsurface rock formations by injecting water, sand and chemicals under pressure into the formation to fracture the surrounding rock and stimulate production.
Hydraulic fracturing typically is regulated by state oil and natural gas commissions, however the EPA has asserted federal regulatory authority pursuant to the Safe Drinking Water Act over certain hydraulic fracturing activities involving the use of diesel fuel and issued permitting guidance in February 2014 that applies to such activities. The EPA also finalized rules in June 2016 that prohibit the discharge of wastewater from hydraulic fracturing operations to publicly owned wastewater treatment plants. In addition, the EPA released its final report on the potential impacts of hydraulic fracturing on drinking water resources in December 2016. The final report concluded that “water cycle” activities associated with hydraulic fracturing may impact drinking water resources “under some circumstances,” noting that the following hydraulic fracturing water cycle activities and local- or regional-scale factors are more likely than others to result in more frequent or more severe impacts: water withdrawals for fracturing in times or areas of low water availability; surface spills during the management of fracturing fluids, chemicals or produced water; injection of fracturing fluids into wells with inadequate mechanical integrity; injection of fracturing fluids
9
directly into groundwater resources; discharge of inadequately treated fracturing wastewater to surface waters; and disposal or storage of fracturing wastewater in unlined pits.
Additionally, the BLM finalized a rule in March 2015 establishing standards for hydraulic fracturing on federal and American Indian lands, but subsequently repealed the rule in December 2017. BLM’s repeal of the rule has been challenged in federal court. In addition, various state and local governments have implemented, or are considering, increased regulatory oversight of hydraulic fracturing through additional permit requirements, operational restrictions, disclosure requirements, well construction and temporary or permanent bans on hydraulic fracturing in certain areas. For example, Texas, Colorado and North Dakota, among others, have adopted regulations that impose new or more stringent permitting, disclosure, disposal and well construction requirements on hydraulic fracturing operations.
In addition to state laws, local land use restrictions, such as city ordinances, may restrict drilling in general and/or hydraulic fracturing in particular. If new federal, state or local laws or regulations that significantly restrict hydraulic fracturing are adopted, such legal requirements could result in delays, eliminate certain drilling and injection activities and make it more difficult or costly to perform hydraulic fracturing. Any such regulations limiting or prohibiting hydraulic fracturing could result in decreased oil and natural gas E&P activities and, therefore, adversely affect demand for our services and our business. Such laws or regulations could also materially increase our costs of compliance and doing business.
Historically, our environmental compliance costs have not had a material adverse effect on our business, liquidity position, financial condition, results of operations and prospects, however, there can be no assurance that such costs will not be material in the future. It is possible that substantial costs for compliance or penalties for non-compliance may be incurred in the future. Moreover, it is possible that other developments, such as the adoption of stricter environmental laws, regulations and enforcement policies, could result in additional costs or liabilities that we cannot currently quantify.
State and Local Regulation
Our operations, and the operations of our customers, are subject to a variety of state and local environmental review and permitting requirements. Some states have state laws similar to major federal environmental laws and thus our operations are also subject to state requirements that may be more stringent than those imposed under federal law. For example, initiatives have been underway in the State of Colorado to limit or ban crude oil and natural gas exploration, development or operations. On April 16, 2019, the Governor of Colorado signed Senate Bill 19-181 (“SB 181”) into law. The legislation makes sweeping changes in Colorado oil and gas law, including, among other matters, requiring the Colorado Oil and Gas Conservation Commission (“COGCC”) to prioritize public health and environmental concerns in its decisions, instructing the COGCC to adopt rules to minimize emissions of methane and other air contaminants, and delegating considerable new authority to local governments to regulate surface impacts. Some local communities have adopted additional restrictions for oil and gas activities, such as requiring greater setbacks, and other groups have sought a cessation of permit issuances entirely until the COGCC publishes new rules in keeping with SB 181. Additionally, activist groups have submitted new ballot proposals for the 2020 election year, including proposals for increased drilling setbacks and increased bonding requirements.
Our operations may require state-law based permits in addition to federal permits, requiring state agencies to consider a range of issues, many the same as federal agencies, including, among other things, a project’s impact on wildlife and their habitats, historic and archaeological sites, aesthetics, agricultural operations and scenic areas. Texas has specific permitting and review processes for oilfield service operations, and state agencies may impose different or additional monitoring or mitigation requirements than federal agencies. The development of new sites and our existing operations also are subject to a variety of local environmental and regulatory requirements, including land use, zoning, building and transportation requirements.
Motor Carrier Operations
We operate as a motor carrier and therefore are subject to regulation by DOT and various state agencies. These regulatory authorities exercise broad powers, governing activities such as the authorization to engage in motor carrier operations; regulatory safety; hazardous materials labeling, placarding and marking; financial reporting; and certain mergers, consolidations and acquisitions. There are additional regulations specifically relating to the trucking industry, including requirements related to testing and weight and dimension specifications of equipment, drug testing and product handling. The trucking industry is subject to possible regulatory and legislative changes that may affect the economics of the industry by requiring changes in operating practices or by changing the demand for common or contract carrier services or the cost of providing truckload services. Some of these possible changes include increasingly stringent environmental regulations and fuel economy requirements, changes in the hours of service regulations which govern the amount of time driven in any specific period and requiring onboard black box recorder devices or limits on vehicle weight and size.
Interstate motor carrier operations are subject to safety requirements prescribed by DOT. Intrastate motor carrier operations are subject to safety regulations that often mirror federal regulations. Such matters as weight and dimension of equipment are also subject to federal and state regulations. DOT regulations also mandate drug testing of drivers. From time to time, various legislative proposals are introduced, including proposals to increase federal, state or local taxes, including taxes on motor fuels,
10
which may increase our costs or adversely impact the recruitment of drivers. We cannot predict whether, or in what form, any increase in such taxes applicable to us will be enacted.
Available Information
Our Annual Report on Form 10-K, Quarterly Reports on Form 10-Q, Current Reports on Form 8-K and amendments to those reports filed or furnished pursuant to Section 13(a) or 15(d) of the U.S. Securities Exchange Act of 1934 are available free of charge at our website at http://www.rangerenergy.com, as soon as reasonably practicable after having been electronically filed or furnished to the U.S. Securities and Exchange Commission (the “SEC”). The SEC maintains an internet site that contains reports, proxy, information statements and other information regarding issuers that file electronically with the SEC at http:www.sec.gov, including us.
Item 1A. Risk Factors
You should carefully consider the information in this Annual Report, including the matters addressed under “Cautionary Statement Regarding Forward‑Looking Statements” and the following risks before making an investment decision. If any of the following risks actually occur, the trading price of our Class A Common Stock could decline, and you may lose all or part of your investment. Additional risks not presently known to us or that we currently deem immaterial could also materially affect our business.
Risks Related to Our Business
Our business depends on domestic capital spending by the oil and natural gas industry, and reductions in such capital spending could have a material adverse effect on our business, liquidity position, financial condition, results of operations and prospects.
Our business is directly affected by our customers’ capital spending to explore for, develop and produce oil and natural gas in the United States. The significant decline in oil and natural gas prices that began in mid-2014 has caused a reduction in the exploration, development and production activities of most of our customers and their spending on our services. These cuts in spending have curtailed drilling programs, which resulted in a reduction in the demand for our services as compared to activity levels in early 2014, as well as in the prices we can charge. In addition, certain of our customers could become unable to pay their vendors and service providers, including us, as a result of the decline in commodity prices. Reduced discovery rates of new oil and natural gas reserves in our areas of operation as a result of decreased capital spending may also have a negative long‑term impact on our business, even in an environment of stronger oil and natural gas prices, to the extent the reduced number of wells that need our services or equipment more than offsets new drilling and completion activity and complexity. Any of these conditions or events could adversely affect our operating results. If the recent recovery does not continue or our customers fail to further increase their capital spending, it could have a material adverse effect on our business, liquidity position, financial condition, results of operations and prospects.
Industry conditions are influenced by numerous factors over which we have no control, including:
|
•
|
domestic and foreign economic conditions and supply of and demand for oil and natural gas;
|
|
•
|
the level of prices, and expectations about future prices, of oil and natural gas;
|
|
•
|
the level and cost of global and domestic oil and natural gas exploration, production, transportation of reserves and delivery;
|
|
•
|
taxes and governmental regulations, including the policies of governments regarding the exploration for and production and development of their oil and natural gas reserves;
|
|
•
|
political and economic conditions in oil and natural gas producing countries;
|
|
•
|
actions by the members of the Organization of Petroleum Exporting Countries (“OPEC”) and other countries, such as Russia, with respect to oil production levels and announcements of potential changes in such levels, including the failure of such countries to comply with production cuts;
|
|
•
|
sanctions and other restrictions placed on oil producing countries, such as Iran and Venezuela;
|
|
•
|
global weather conditions and natural disasters;
|
|
•
|
worldwide political, military and economic conditions;
|
11
|
•
|
the discovery rates of new oil and natural gas reserves;
|
|
•
|
shareholder activism or activities by non‑governmental organizations to restrict the exploration, development and production of oil and natural gas; and
|
|
•
|
uncertainty in capital and commodities markets.
|
The volatility of oil and natural gas prices may adversely affect the demand for our services and negatively impact our results of operations.
The demand for our services is primarily determined by current and anticipated oil and natural gas prices and the related levels of capital spending and drilling activity in the areas in which we have operations. Volatility, or the perception that oil or natural gas prices will decrease, affects the spending patterns of our customers and may result in the drilling of fewer new wells. This could lead to decreased demand for our services and lower utilization of our assets. We have, and may in the future, experience significant fluctuations in operating results as a result of the reactions of our customers to changes in oil and natural gas prices.
Prices for oil and natural gas historically have been extremely volatile and are expected to continue to be volatile. During the year ended December 31, 2019, the posted West Texas Intermediate (“WTI”) price for oil has ranged from a low of $44 per Barrel (“Bbl”) in January 2019 to a high of $67 per Bbl in April 2019. During the year ended December 31, 2019, the posted Henry Hub price for natural gas has ranged from a low of $2.07 per Million British Thermal Units (“MMbtu”) in August 2019 to a high of $3.59 per MMbtu in January 2019. If the prices of oil and natural gas continue to be volatile, reverse their recent increases or decline, our operations, financial condition, cash flows and level of expenditures may be materially and adversely affected.
Our operations are subject to inherent risks, some of which are beyond our control. These risks may be self‑insured, or may not be fully covered under our insurance policies.
Our operations are subject to hazards inherent in the oil and natural gas industry, such as, but not limited to, accidents, blowouts, explosions, craterings, fires, oil spills and releases of drilling, completion or fracturing fluids or hazardous materials into the environment. These conditions can cause:
|
•
|
disruption or suspension of operations;
|
|
•
|
substantial repair or replacement costs;
|
|
•
|
personal injury or loss of human life;
|
|
•
|
significant damage to or destruction of property and equipment;
|
|
•
|
environmental pollution, including groundwater contamination;
|
|
•
|
unusual or unexpected geological formations or pressures and industrial accidents; and
|
|
•
|
substantial revenue loss.
|
In addition, our operations are subject to, and exposed to, employee/employer liabilities and risks such as wrongful termination, discrimination, labor organizing, retaliation claims and general human resource‑related matters.
The occurrence of a significant event or adverse claim in excess of the insurance coverage that we maintain or that is not covered by insurance could have a material adverse effect on our business, liquidity position, financial condition, results of operations and prospects and may increase our costs. Claims for loss of oil and natural gas production and damage to formations can occur in the well services industry. Litigation arising from a catastrophic occurrence at a location where our equipment and services are being used may result in our being named as a defendant in lawsuits asserting large claims.
We do not have insurance against all risks, either because insurance is not available or because of the high premium costs. The occurrence of an event not fully insured against or the failure of an insurer to meet its insurance obligations could result in substantial losses. In addition, we may not be able to maintain adequate insurance in the future at rates we consider reasonable. Insurance may not be available to cover any or all of the risks to which we are subject, or, even if available, it may be inadequate, or insurance premiums or other costs could rise significantly in the future so as to make such insurance prohibitively expensive.
12
Reliance upon a few large customers may adversely affect our revenues and operating results.
If a major customer fails to pay us, our revenues would be impacted and our operating results and financial condition could be materially harmed. During times when the natural gas or crude oil markets weaken, our customers are more likely to experience financial difficulties, including being unable to access debt or equity financing, which could result in a reduction in our customers’ spending for our services and their non‑payment or inability to perform obligations owed to us. Further, if a customer was to enter into bankruptcy, it could also result in the cancellation of all or a portion of our service contracts with such customer at significant expense or loss of expected revenues to us. If we were to lose any material customer, we may not be able to redeploy our equipment at similar utilization or pricing levels or within a short period of time and such loss could have a material adverse effect on our business, liquidity position, financial condition, results of operations and prospects until the equipment is redeployed at similar utilization or pricing levels. It is likely that we will continue to derive a significant portion of our revenue from a relatively small number of customers in the future.
Our top five customers represented approximately 49% and 42% of our consolidated revenues for
2019
and
2018
, respectively. Within our High Specification Rig segment, our top five customers represented approximately 42% and 45% of our revenues for
2019
and
2018
, respectively. Within our Completion and Other Services segment, our top five customers represented approximately 71% and 68% of our revenues for
2019
and
2018
, respectively. Within our Processing Solutions segment, our top five customers represented approximately 82% of our revenues for both
2019
and
2018
. During the years ended
December 31, 2019
and
2018
, EOG Resources, Inc. accounted for approximately 17% and 20% of our consolidated revenues, respectively.
We face intense competition that may cause us to lose market share and could negatively affect our ability to market our services and expand our operations.
The oilfield services business is highly competitive and fragmented. Some of our competitors are small companies capable of competing effectively in our markets on a local basis, while others have a broader geographic scope, greater financial and other resources, or other cost efficiencies. Our competitors may be able to respond more quickly to new or emerging technologies and services and changes in customer requirements. Additionally, there may be new companies that enter our business, or re‑enter our business with significantly reduced indebtedness following emergence from bankruptcy, or our existing and potential customers may develop their own oilfield services business. Our ability to maintain current revenues and cash flows, and our ability to market our services and expand our operations, could be adversely affected by the activities of our competitors and our customers. If our competitors substantially increase the resources they devote to the development and marketing of competitive services or substantially decrease the prices at which they offer their services, we may be unable to effectively compete. Many contracts are awarded on a bid basis, which may further increase competition based primarily on price. The competitive environment may be further intensified by mergers and acquisitions among oil and natural gas companies or other events that have the effect of reducing the number of available customers. All of these competitive pressures could have a material adverse effect on our business, liquidity position, financial condition, results of operations and prospects. Some of our larger competitors provide a broader range of services on a regional, national or worldwide basis. These companies may have a greater ability to continue oilfield service activities during periods of low commodity prices and to absorb the burden of present and future federal, state, local and other laws and regulations. Any inability to compete effectively could have a material adverse impact on our financial condition and results of operations.
The growth of our business through potential future acquisitions may expose us to various risks, including those relating to difficulties in identifying suitable, accretive acquisition opportunities and integrating businesses, assets and personnel, as well as difficulties in obtaining financing for targeted acquisitions and the potential for increased leverage or debt service requirements.
We have pursued and intend to continue to pursue selected, accretive acquisitions of complementary assets and businesses. Acquisitions involve numerous risks, including:
|
•
|
unanticipated costs and exposure to liabilities assumed in connection with the acquired business or assets, including but not limited to environmental liabilities;
|
|
•
|
difficulties in integrating the operations and assets of the acquired business and the acquired personnel;
|
|
•
|
limitations on our ability to properly assess and maintain an effective internal control environment over an acquired business;
|
|
•
|
potential losses of key employees and customers of the acquired business;
|
|
•
|
risks of entering markets in which we have limited prior experience; and
|
|
•
|
increases in our expenses and working capital requirements.
|
13
Our ability to achieve the anticipated benefits of any acquisition will depend, in part, upon whether we can integrate the acquired business and/or assets into our existing business in an efficient and effective manner. The process of integrating an acquired business, including in connection with our corporate reorganization, may involve unforeseen costs and delays or other operational, technical and financial difficulties and may require a significant amount of time and resources. Our failure to incorporate the acquired business and assets into our existing operations successfully or to minimize any unforeseen operational difficulties could have a material adverse effect on our business, liquidity position, financial condition, results of operations and prospects. Further, any acquisition may involve other risks that may cause our business to suffer, including:
|
•
|
diversion of our management’s attention to evaluating, negotiating for and integrating acquired assets;
|
|
•
|
the challenge and cost of integrating acquired assets with those of ours while carrying on our ongoing business; and
|
|
•
|
the failure to realize the full benefits anticipated from the acquisition or to realize these benefits within our expected time frame.
|
Because the historical utilization rates of any acquired assets may be lower than ours in recent periods, our utilization could decrease during the course of an initial integration period. Accordingly, there can be no assurance the utilization for acquired assets will align with the utilization of our existing fleet or on our anticipated timeline or at all. Furthermore, there is intense competition for acquisition opportunities in our industry. Competition for acquisitions may increase the cost of, or cause us to refrain from, completing acquisitions.
In addition, we may not have sufficient capital resources to complete any additional acquisitions. Historically, we have financed our acquisitions primarily with funding from our equity investors, commercial borrowings and cash generated by operations. We may incur substantial indebtedness to finance future acquisitions and also may issue equity, debt or convertible securities in connection with such acquisitions. Debt service requirements could represent a significant burden on our results of operations and financial condition, and the issuance of additional equity or convertible securities could be dilutive to our existing shareholders. Furthermore, we may not be able to obtain additional financing as needed or on satisfactory terms.
Our ability to continue to grow through acquisitions and manage growth will require us to continue to invest in operational, financial and management information systems and to attract, retain, motivate and effectively manage our employees. The inability to effectively manage the integration of acquisitions, including in connection with our corporate reorganization, could reduce our focus on current operations, which, in turn, could negatively impact our earnings and growth. Our financial position and results of operations may fluctuate significantly from period to period, based on whether or not significant acquisitions are completed in particular periods.
We may have difficulty managing growth in our business, which could adversely affect our financial condition and results of operations.
Growth in accordance with our business plan, if achieved, could place a significant strain on our financial, operational and management resources. As we expand the scope of our activities and our geographic coverage through both organic growth and acquisitions, there will be additional demands on our financial, technical, operational and management resources. The failure to continue to upgrade our technical, administrative, operating and financial control systems or the occurrences of unexpected expansion difficulties, including the failure to recruit and retain experienced managers, engineers and other professionals in the oilfield services industry, could have a material adverse effect on our business, liquidity position, financial condition, results of operations and prospects and our ability to successfully or timely execute our business plan.
We may incur significant capital expenditures for new equipment as we grow our operations and may be required to incur further capital expenditures as a result of advancements in oilfield services technologies.
As we grow our operations we may be required to incur significant capital expenditures to build, acquire, update or replace our existing fixed assets and other equipment. Such demands on our capital and the increase in cost of labor necessary to operate such assets and other equipment could have a material adverse effect on our business, liquidity position, financial condition, results of operations and prospects and may increase our costs. To the extent we are unable to fund such projects, we may have less equipment available for service or our equipment may not be attractive to current or potential customers.
In addition, because the oilfield services industry is characterized by significant technological advancements and introductions of new products and services using new technologies, we may lose market share or be placed at a competitive disadvantage as competitors and others use or develop new technologies or technologies comparable to ours in the future. Further, we may face competitive pressure to implement or acquire certain new technologies at a substantial cost. Some of our competitors may have greater financial, technical and personnel resources than we do, which may allow them to gain technological advantages or implement new technologies before we can. Additionally, we may be unable to implement new technologies or services at all, on a timely basis or at an acceptable cost.
14
In addition to technological advancements by our competitors, new technology could also make it easier for our customers to vertically integrate their operations or otherwise conduct their activities without the need for our equipment and services, thereby reducing or eliminating the need for our services. For example, if further advancements in drilling and completion techniques cause our E&P customers to require well service rigs with different or higher specifications than those in our existing and expected future fleet, or to otherwise require well service equipment that we do not currently own or operate, we may be required to incur significant additional capital expenditures to obtain any such new rigs or other equipment in an effort to meet customer demand. Limits on our ability to effectively obtain, use, implement or integrate new technologies may have a material adverse effect on our business, liquidity position, financial condition, results of operations and prospects.
Increases in the scope or pace of midstream infrastructure development, or decreased federal or state regulation of natural gas pipelines, could decrease demand for our services.
Increases in the scope or pace of midstream infrastructure development could decrease demand for our services. Our processing solutions are designed for the processing of rich natural gas streams at the wellhead or central gathering points in basins where drilling and completion activity has outpaced the development of permanent processing infrastructure. Specifically, our modular MRUs are used by our customers to meet pipeline specifications, extract higher value NGLs, provide fuel gas for well sites and facilities and reduce emissions at the flare tip, services that are generally required when E&P companies drill oil and natural gas wells in basins without immediate access to sufficient midstream infrastructure and takeaway capacity. To the extent that permanent midstream infrastructure is developed in the basins in which we operate, or the pace of existing development is accelerated as a result of customer demand, the demand for our processing solutions could decrease.
In addition, there has recently been increasing public controversy regarding construction of new natural gas pipelines and the stringency of current regulation of natural gas pipelines, creating uncertainty as to the probability and timing of such construction. Decreases to the stringency of regulation of existing natural gas pipelines at either the state or federal level could reduce the demand for our services and could have a material adverse effect on our business, liquidity position, financial condition, results of operations and prospects.
Delays or restrictions in obtaining permits by us for our operations or by our customers for their operations could impair our business.
In most states, our operations and the operations of our customers require permits from one or more governmental agencies in order to perform drilling and completion activities, secure water rights, or other regulated activities. Such permits are typically issued by state agencies, but federal and local governmental permits may also be required. The requirements for such permits vary depending on the location where such regulated activities will be conducted. As with all governmental permitting processes, there is a degree of uncertainty as to whether a permit will be granted, the time it will take for a permit to be issued, and the conditions that may be imposed in connection with the granting of the permit. In addition, some of our customers’ drilling and completion activities may take place on federal land or Native American lands, requiring leases and other approvals from the federal government or Native American tribes to conduct such drilling and completion activities or other regulated activities. Under certain circumstances, federal agencies may cancel proposed leases for federal lands and refuse to grant or delay required approvals. Therefore, our customers’ operations in certain areas of the United States may be interrupted or suspended for varying lengths of time, causing a loss of revenues to us and adversely affecting our results of operations in support of those customers.
Federal or state legislative and regulatory initiatives related to induced seismicity could result in operating restrictions or delays in the drilling and completion of oil and natural gas wells that may reduce demand for our services and could have a material adverse effect on our business, liquidity position, financial condition, results of operations and prospects.
Our oil and natural gas customers dispose of flowback and produced water or certain other oilfield fluids gathered from oil and natural gas producing operations in accordance with permits issued by government authorities overseeing such disposal activities. While these permits are issued pursuant to existing laws and regulations, these legal requirements are subject to change based on concerns of the public or governmental authorities regarding such disposal activities. One such concern relates to recent seismic events near underground disposal wells used for the disposal by injection of flow back and produced water or certain other oilfield fluids resulting from oil and natural gas activities. When caused by human activity, such events are called induced seismicity.
In March 2016, the United States Geological Survey identified six states with the most significant hazards from induced seismicity, including Oklahoma, Kansas, Texas, Colorado, New Mexico, and Arkansas. In response to concerns regarding induced seismicity, regulators in some states have imposed, or are considering imposing, additional requirements in the permitting of produced water disposal wells or otherwise to assess any relationship between seismicity and the use of such wells. From time to time regulators develop and implement plans directing certain wells located in proximity to seismic incidents to restrict or suspend disposal well operations. In addition, ongoing lawsuits allege that disposal well operations have caused damage to neighboring properties or otherwise violated state and federal rules regulating waste disposal. These developments could result in additional regulation and restrictions on the use of injection wells by our customers to dispose of flowback and produced
15
water and certain other oilfield fluids. Increased regulation and attention given to induced seismicity also could lead to greater opposition to, and litigation concerning, oil and natural gas activities utilizing injection wells for waste disposal.
Any one or more of these developments may result in our customers having to limit disposal well volumes, disposal rates or locations, or require our customers or third party disposal well operators that are used to disposals of customers’ wastewater to shut down disposal wells, which developments could adversely affect our customers’ business and result in a corresponding decrease in the need for our services, which could have a material adverse effect on our business, liquidity position, financial condition, results of operations and prospects.
Changes in transportation regulations may increase our costs and negatively impact our results of operations.
We are subject to various transportation regulations including as a motor carrier by the DOT and by various federal, state and tribal agencies, whose regulations include certain permit requirements of highway and safety authorities. These regulatory authorities exercise broad powers over our trucking operations, generally governing such matters as the authorization to engage in motor carrier operations, safety, equipment testing, driver requirements and specifications and insurance requirements. The trucking industry is subject to possible regulatory and legislative changes that may impact our operations, such as changes in fuel emissions limits, hours of service regulations that govern the amount of time a driver may drive or work in any specific period, requirements for on‑board black box recorder devices or limits on vehicle weight and size. To the extent the federal government continues to develop and propose regulations relating to fuel quality, engine efficiency and greenhouse gas emissions, we may experience an increase in costs related to truck purchases and maintenance, impairment of equipment productivity, a decrease in the residual value of vehicles, unpredictable fluctuations in fuel prices and an increase in operating expenses. Increased truck traffic may contribute to deteriorating road conditions in some areas where our operations are performed.
Further, our operations could be affected by road construction, road repairs, detours and state and local regulations and ordinances restricting access to certain roads, including through routing and weight restrictions. In recent years, certain states, such as North Dakota and Texas, and certain counties have increased enforcement of weight limits on trucks used to transport raw materials, such as the fluids that we transport in connection with our fluids management services, on their public roads. It is possible that the states, counties and cities in which we operate our business may modify their laws to further reduce truck weight limits or impose curfews or other restrictions on the use of roadways. Such legislation and enforcement efforts could result in delays in, and increased costs to, transport fluids and otherwise conduct our business. Proposals to increase federal, state or local taxes, including taxes on motor fuels, are also made from time to time, and any such increase would increase our operating costs. Also, state and local regulation of permitted routes and times on specific roadways could adversely affect our operations. We cannot predict whether, or in what form, any legislative or regulatory changes or municipal ordinances applicable to our logistics operations will be enacted and to what extent any such legislation or regulations could increase our costs or otherwise adversely affect our business or operations.
We are subject to environmental and occupational health and safety laws and regulations that may expose us to significant costs and liabilities.
Our operations are subject to numerous federal, regional, state and local laws and regulations relating to protection of natural resources and the environment, occupational health and safety, air emissions and water discharges, and the management, transportation and disposal of solid and hazardous wastes and other materials. These laws and regulations impose numerous obligations that may impact our operations, including the acquisition of permits to conduct regulated activities, the imposition of restrictions on the types, quantities and concentrations of various substances that can be released into the environment or injected in formations in connection with oil and natural gas drilling and production activities, the incurrence of capital expenditures to mitigate or prevent releases of materials from our equipment, facilities or from customer locations where we are providing services, the imposition of substantial liabilities for pollution resulting from our operations, and the application of specific health and safety standards or criteria addressing worker protection. Any failure on our part or the part of our customers to comply with these laws and regulations could result in prohibitions or restrictions on operations, assessment of sanctions including administrative, civil and criminal penalties, issuance of corrective action orders requiring the performance of investigatory, remedial or curative activities or enjoining performance of some or all of our operations in a particular area, the occurrence of delays in the permitting or performance of projects and/or government or private claims for personal injury or property or natural resources damages.
Our business activities present risks of incurring significant environmental costs and liabilities, including costs and liabilities resulting from our handling and disposal of oilfield and other wastes, air emissions and wastewater discharges related to our operations and the historical operations and waste disposal practices of our predecessors. Moreover, accidental releases or spills may occur in the course of our operations, and we could incur significant costs and liabilities as a result of such releases or spills, including any third‑party claims for damage to property, natural resources or persons. In addition, private parties, including the owners of properties upon which we perform services and facilities where our wastes are taken for reclamation or disposal, also may have the right to pursue legal actions to enforce compliance as well as to seek damages for non‑compliance with environmental laws and regulations or for personal injury or property or natural resource damages. Some environmental
16
laws and regulations may impose strict liability, which means that in some situations we could be exposed to liability even if our conduct was lawful at the time it occurred or the conduct of, or conditions caused by, prior operators or other third parties.
The trend in environmental regulation has been to place more restrictions and limitations on activities that may adversely affect the environment, and thus any changes in environmental laws and regulations or re‑interpretation of enforcement policies that result in more stringent and costly regulatory requirements could have a material adverse effect on our business, liquidity position, financial condition, results of operations and prospects if we are unable to pass on such increased compliance costs to our customers. Our customers may also incur increased costs or delays or restrictions in permitting or operating activities as a result of more stringent environmental laws and regulations, which may result in a curtailment of exploration, development or production activities that would reduce the demand for our services.
We provide services to customers who operate on federal and tribal lands, which are subject to additional regulations.
We provide services to companies operating on federal and tribal lands. Various federal agencies within the U.S. Department of the Interior, particularly the BLM and the Bureau of Indian Affairs, along with certain Native American tribes, promulgate and enforce regulations pertaining to oil and natural gas operations on Native American tribal lands and minerals where some of our customers operate. Such operations are subject to additional regulatory requirements, including lease provisions, drilling and production requirements, surface use restrictions, environmental standards, royalty considerations and taxes. Operations on federal and tribal lands are frequently subject to delays.
The BLM finalized a rule in March 2015 establishing standards for hydraulic fracturing on federal and American Indian lands; however, the BLM repealed this rule in December 2017. The repeal has been challenged in federal court by the state of California and environmental groups. In November 2016, the BLM finalized a rule regulating the venting and flaring of natural gas, leak detection, air emissions from equipment, well maintenance and unloading, drilling and completions and royalties potentially owed for loss of such emissions from oil and natural gas facilities producing on federal and tribal leases. In September 2018, the BLM published a revised rule which rescinded and revised several components of the 2016 rule, which is the subject of pending litigation.
The EPA also issued a FIP in June 2016 to implement the Federal Minor New Source Review Program on tribal lands for oil and natural gas production. The FIP creates a permit‑by‑rule process for minor air sources that also incorporates emission limits and other requirements under various federal air quality standards, applying them to a range of equipment and processes used in oil and natural gas production. Neither the FIP nor the revisions apply in areas of ozone non-attainment, except, as the result of a May 2019 rule, to the Indian country portion of the Uinta Basin Ozone Nonattainment Area. As a result, the EPA may impose area-specific regulations in certain areas identified as tribal lands that may require additional emissions controls on existing equipment. Such requirements will likely result in increased operating and compliance costs for our customers in these regions.
Depending on the ultimate outcome of any agency reviews and pending litigation, these regulations could result in increased compliance costs or additional operating restrictions for us and our customers, and could have a material adverse effect on our business, liquidity position, cash flows, financial condition, results of operations, prospects, and demand for our services.
Federal and state legislative and regulatory initiatives relating to hydraulic fracturing could result in increased costs and additional operating restrictions or delays as well as adversely affect demand for our support services.
Hydraulic fracturing is an important and common practice that is used to stimulate production of natural gas and/or oil from dense subsurface rock formations. The hydraulic fracturing process involves the injection of water, sand and chemicals under pressure into the formation to fracture the surrounding rock and stimulate production. While we do not perform hydraulic fracturing, many of our customers do.
Hydraulic fracturing typically is regulated by state oil and natural gas commissions, but the EPA has asserted federal regulatory authority pursuant to the federal Safe Drinking Water Act over certain hydraulic fracturing activities involving the use of diesel fuel and issued permitting guidance in 2014 that applies to such activities. In addition, in June 2016, the EPA finalized regulations that prohibit the discharge of wastewater from hydraulic fracturing operations to publicly owned wastewater treatment plants.
In December 2016, the EPA released its final report on the potential impacts of hydraulic fracturing on drinking water resources. The final report concluded that “water cycle” activities associated with hydraulic fracturing may impact drinking water resources under certain limited circumstances. Since the report did not find a direct link between hydraulic fracturing itself and contamination of groundwater resources, this years-long study report does not appear to provide any basis for further regulation of hydraulic fracturing at the federal level at this time.
Various state and local governments have implemented, or are considering, increased regulatory oversight of hydraulic fracturing through additional permit requirements, operational restrictions, disclosure requirements, well construction, and temporary or permanent bans on hydraulic fracturing in certain areas. For example, initiatives have been underway in the State
17
of Colorado to limit or ban crude oil and natural gas exploration, development or operations. For further information, see our disclosure “Part I, Item1. Business — State and Local Regulations.” In addition, state and federal regulatory agencies have recently focused on a possible connection between the disposal of wastewater in underground injection wells and the increased occurrence of seismic activity, and regulatory agencies at all levels are continuing to study the possible linkage between oil and gas activity and induced seismicity. In response to these concerns, regulators in some states are seeking to impose additional requirements on hydraulic fracturing fluid disposal practices, including restrictions on the operations of produced water disposal wells and imposing more stringent requirements on the permitting of such wells. The adoption and implementation of any new laws or regulations that restrict our customers’ ability to dispose of produced water could result in increased operating costs for the customer, which in turn could indirectly reduce demand for our services.
Local governments also may seek to adopt ordinances within their jurisdictions regulating the time, place and manner of drilling activities in general or hydraulic fracturing activities in particular or prohibit the performance of well drilling in general or hydraulic fracturing in particular. If new federal, state or local laws or regulations that significantly restrict hydraulic fracturing are adopted, such legal requirements could result in delays, eliminate certain drilling and injection activities and make it more difficult or costly to perform hydraulic fracturing. Any such regulations limiting or prohibiting hydraulic fracturing could result in decreased oil and natural gas E&P activities and, therefore, adversely affect demand for our services and our business. Such laws or regulations could also materially increase our costs of compliance and doing business.
Climate change legislation or regulations restricting emissions of GHG could result in increased operating costs and reduced demand for our services.
The threat of climate change continues to attract considerable attention in the United States and in foreign countries. Numerous proposals have been made and could continue to be made at the international, national, regional and state levels of government to monitor and limit existing emissions of GHG as well as to restrict or eliminate such future emissions. As a result, our operations as well as the operations of our oil and natural gas exploration and production customers are subject to a series of regulatory, political, litigation, and financial risks associated with the production and processing of fossil fuels and emission of GHG.
In the United States, no comprehensive climate change legislation has been implemented at the federal level. However, with the U.S. Supreme Court finding that GHG emissions constitute a pollutant under the CAA, the EPA has adopted rules that, among other things, establish construction and operating permit reviews for GHG emissions from certain large stationary sources, require the monitoring and annual reporting of GHG emissions from certain petroleum and natural gas system sources in the United States, implement New Source Performance Standards directing the reduction of methane from certain new, modified, or reconstructed facilities in the oil and natural gas sector, and together with the DOT, implement GHG emissions limits on vehicles manufactured for operation in the United States. Additionally, various states and groups of states have adopted or are considering adopting legislation, regulations or other regulatory initiatives that are focused on such areas as GHG cap and trade programs, carbon taxes, reporting and tracking programs, and restriction of emissions. At the international level, there is a non-binding agreement, the United Nations-sponsored Paris Agreement, for nations to limit their GHG emissions through individually-determined reduction goals every five years after 2020, although the United States has announced its withdrawal from such agreement, effective November 4, 2020.
Governmental, scientific, and public concern over the threat of climate change arising from GHG emissions has resulted in increasing political risks in the United States, including climate change related pledges made by certain candidates seeking the office of the President of the United States in 2020. Two critical declarations made by one or more candidates running for the Democratic nomination for President include threats to take actions banning hydraulic fracturing of oil and natural gas wells and banning new leases for production of minerals on federal properties, including onshore lands and offshore waters. Other actions that could be pursued by presidential candidates may include the imposition of more restrictive requirements for the establishment of pipeline infrastructure or the permitting of LNG export facilities, as well as the reversal of the United States’ withdrawal from the Paris Agreement in November 2020. Litigation risks are also increasing, as a number of cities and other local governments have sought to bring suit against the largest oil and natural gas exploration and production companies in state or federal court, alleging, among other things, that such companies created public nuisances by producing fuels that contributed to global warming effects, such as rising sea levels, and therefore are responsible for roadway and infrastructure damages as a result.
18
There are also increasing financial risks for fossil fuel producers as shareholders currently invested in fossil-fuel energy companies concerned about the potential effects of climate change may elect in the future to shift some or all of their investments into non-energy related sectors. Institutional lenders who provide financing to fossil-fuel energy companies also have become more attentive to sustainable lending practices and some of them may elect not to provide funding for fossil fuel energy companies. Additionally, the lending practices of institutional lenders have been the subject of intensive lobbying efforts in recent years, oftentimes public in nature, by environmental activists, proponents of the international Paris Agreement, and foreign citizenry concerned about climate change not to provide funding for fossil fuel producers. Limitation of investments in and financings for fossil fuel energy companies could result in the restriction, delay or cancellation of drilling programs or development or production activities.
The adoption and implementation of new or more stringent international, federal or state legislation, regulations or other regulatory initiatives that impose more stringent standards for GHG emissions from the oil and natural gas sector or otherwise restrict the areas in which this sector may produce oil and natural gas or generate GHG emissions could result in increased costs of compliance or costs of consuming, and thereby reduce demand for, oil and natural gas, which could reduce demand for our services and products. Additionally, political, litigation and financial risks may result in our oil and natural gas customers restricting or cancelling production activities, incurring liability for infrastructure damages as a result of climatic changes, or impairing their ability to continue to operate in an economic manner, which also could reduce demand for our services and products. One or more of these developments could have a material adverse effect on our business, financial condition and results of operation.
We have debt obligations, and any additional future indebtedness, could adversely affect our financial condition.
As of
December 31, 2019
and
2018
our total debt was $
42.4
million and $
60.5
million, respectively.
We may also incur additional indebtedness in the future. If we do so, the risks related to our level of debt could intensify. Our indebtedness could have adverse consequences, including:
|
•
|
we may be unable to obtain financing in the future for working capital, capital expenditures, acquisitions, share repurchases, general corporate or other purposes;
|
|
•
|
we may be unable to use operating cash flow in other areas of our business because we must dedicate a substantial portion of these funds to service the debt;
|
|
•
|
we could become more vulnerable to general adverse economic and industry conditions, including increases in interest rates, to the extent that we incur variable rate indebtedness;
|
|
•
|
we may be competitively disadvantaged compared to our competitors that have greater access to capital resources; or
|
|
•
|
we may fail to comply with the various covenants in instruments governing any existing or future indebtedness.
|
Our Credit Facility subjects us to various financial and other restrictive covenants. These restrictions may limit our operational or financial flexibility and could subject us to potential defaults under our Credit Facility.
Our senior unsecured revolving credit facility (the “Credit Facility”) subjects us to significant financial and other restrictive covenants, including, but not limited to, restrictions on incurring additional debt and certain distributions. Our ability to comply with these financial condition tests can be affected by events beyond our control and we may not be able to comply.
Our Credit Facility contains certain financial covenants, including a certain minimum fixed charge coverage ratio during certain testing periods. Please see “Part II, Item 7. Management’s Discussion and Analysis of Financial Condition and Results of Operation—Liquidity and Capital Resources—Our Debt Agreements.”
If we are unable to remain in compliance with the financial covenants of our Credit Facility, then amounts outstanding thereunder may be accelerated and become due immediately. Any such acceleration could have a material adverse effect on our business, liquidity position, financial condition, results of operations and prospects.
In the event that we are unable to access sufficient capital to fund our business and planned capital expenditures, we may be required to curtail potential acquisitions, strategic growth projects, portions of our current operations and other activities. A lack of capital could result in a decrease in our operations, subject us to claims of breach under customer and supplier contracts and may force us to sell some of our assets or issue additional equity on an untimely or unfavorable basis, each of which could adversely affect our business, financial condition, results of operations and cash flows.
19
Changes in interest rates could adversely impact the price of our shares, our ability to issue equity or incur debt for acquisitions or other purposes.
Interest rates on future borrowings, credit facilities and debt offerings could be higher than current levels, causing our financing costs to increase accordingly. In addition, LIBOR and other “benchmark” rates are subject to ongoing national and international regulatory scrutiny and reform. On July 27, 2017, the U.K. Financial Conduct Authority announced that it will no longer persuade or compel banks to submit rates for the calculation of the LIBOR rates after 2021 (the “FCA Announcement”). The Alternative Reference Rate Committee, a committee convened by the Federal Reserve that includes major market participants, has proposed an alternative rate to replace U.S. Dollar LIBOR: the Secured Overnight Financing Rate, or “SOFR.” We are unable to predict the effect of the FCA Announcement or other reforms, whether currently enacted or enacted in the future. The outcome of reforms may result in increased interest expense to us. Changes in interest rates, either positive or negative, may affect the yield requirements of investors who invest in our shares, and a rising interest rate environment could have an adverse impact on the price of our shares, our ability to issue equity or incur debt for acquisitions or other purposes.
Fuel conservation measures could reduce demand for oil and natural gas which would in turn reduce the demand for our services.
Fuel conservation measures, alternative fuel requirements and increasing consumer demand for alternatives to oil and natural gas could reduce demand for oil and natural gas. The impact of the changing demand for oil and natural gas may have a material adverse effect on our business, liquidity position, financial condition, results of operations and prospects. Additionally, the increased competitiveness of alternative energy sources (such as wind, solar, geothermal, tidal, and biofuels) could reduce demand for hydrocarbons and therefore for our services, which would lead to a reduction in our revenues.
Unsatisfactory safety performance may negatively affect our customer relationships and, to the extent we fail to retain existing customers or attract new customers, adversely impact our revenues.
Our ability to retain existing customers and attract new business is dependent on many factors, including our ability to demonstrate that we can reliably and safely operate our business in a manner that is consistent with applicable laws, rules and permits, which legal requirements are subject to change. Existing and potential customers consider the safety record of their third‑party service providers to be of high importance in their decision to engage such providers. If one or more accidents were to occur at one of our operating sites, the affected customer may seek to terminate or cancel its use of our equipment or services and may be less likely to continue to use our services, which could cause us to lose substantial revenues. Furthermore, our ability to attract new customers may be impaired if they view our safety record as unacceptable. In addition, it is possible that we will experience multiple or particularly severe accidents in the future, causing our safety record to deteriorate. This may be more likely as we continue to grow, if we experience high employee turnover or labor shortage, or hire inexperienced personnel to bolster our staffing needs.
The Endangered Species Act and Migratory Bird Treaty Act and other restrictions intended to protect certain species of wildlife govern our and our customers’ operations and additional restrictions may be imposed in the future, which constraints could have an adverse impact on our ability to expand some of our existing operations or limit our customers’ ability to develop new oil and natural gas wells.
Oil and natural gas operations in our operating areas can be adversely affected by seasonal or permanent restrictions on drilling activities designed to protect various wildlife, which may limit our ability to operate in protected areas. Permanent restrictions imposed to protect endangered species could prohibit drilling in certain areas or require the implementation of expensive mitigation measures.
For example, to the extent species that are listed under the Endangered Species Act or similar state laws, or are protected under the Migratory Bird Treaty Act, or the designation of previously unprotected species as threatened or endangered in areas where we or our customers operate could cause us or our customers to incur increased costs arising from species protection measures and could result in delays or limitations in our or our customers’ performance of operations, which could adversely affect or reduce demand for our services.
We rely on a few key employees whose absence or loss could adversely affect our business.
Many key responsibilities within our business have been assigned to a small number of employees. The loss of their services could adversely affect our business. In particular, the loss of the services of one or more members of our executive team, including our President and Chief Executive Officer or Chief Financial Officer, could disrupt our operations. We do not maintain “key person” life insurance policies on any of our employees. As a result, we are not insured against any losses resulting from the death of our key employees.
20
We may be subject to claims for personal injury and property damage, which could materially and adversely affect our financial condition, results of operations and prospects.
Our services are subject to inherent risks that can cause personal injury or loss of life, damage to or destruction of property, equipment or the environment or the suspension of our operations. Litigation arising from operations where our services are provided may cause us to be named as a defendant in lawsuits asserting potentially large claims including claims for exemplary damages. We maintain what we believe is customary and reasonable insurance to protect our business against these potential losses, but such insurance may not be adequate to cover our liabilities, and we are not fully insured against all risks.
In addition, and subject to certain exceptions, our customers typically assume responsibility for, including control and removal of, all other pollution or contamination which may occur during operations, including that which may result from seepage or any other uncontrolled flow of drilling and completion fluids. We may have liability in such cases if we are negligent or commit willful acts. Our customers generally agree to indemnify us against claims arising from their employees’ personal injury or death to the extent that, in the case of our operations, their employees are injured or their properties are damaged by such operations, unless resulting from our gross negligence or willful misconduct. Our customers also generally agree to indemnify us for loss or destruction of customer‑owned property or equipment. In turn, we agree to indemnify our customers for loss or destruction of property or equipment we own and for liabilities arising from personal injury to or death of any of our employees, unless resulting from gross negligence or willful misconduct of the customer. However, we might not succeed in enforcing such contractual allocation or might incur an unforeseen liability falling outside the scope of such allocation. As a result, we may incur substantial losses which could materially and adversely affect our financial condition and results of operation.
Anti‑indemnity provisions enacted by many states may restrict or prohibit a party’s indemnification of us.
We typically enter into agreements with our customers governing the provision of our services, which usually include certain indemnification provisions for losses resulting from operations. Such agreements may require each party to indemnify the other against certain claims regardless of the negligence or other fault of the indemnified party; however, many states place limitations on contractual indemnity agreements, particularly agreements that indemnify a party against the consequences of its own negligence. Furthermore, certain states, including Louisiana, New Mexico, Texas and Wyoming, have enacted statutes generally referred to as “oilfield anti‑indemnity acts” expressly prohibiting certain indemnity agreements contained in or related to oilfield services agreements. Such anti‑indemnity acts may restrict or void a party’s indemnification of us, which could have a material adverse effect on our business, liquidity position, financial condition, results of operations and prospects.
Seasonal weather conditions and natural disasters could severely disrupt normal operations and harm our business.
Our operations are located in different regions of the United States. Some of these areas, including the Denver‑Julesburg Basin and the Bakken Shale, are adversely affected by seasonal weather conditions. During periods of heavy snow, ice, wind or rain, we may be unable to move our equipment between locations, thereby reducing our ability to provide services and generate revenues, or we could suffer weather‑related damage to our facilities and equipment, resulting in delays in operations. The exploration activities of our customers may also be affected during such periods of adverse weather conditions. Additionally, extended drought conditions in our operating regions could impact our ability or our customers’ ability to source sufficient water or increase the cost for such water. As a result, a natural disaster or inclement weather conditions could severely disrupt the normal operation of our business and adversely impact our financial condition and results of operations.
In addition, some scientists have concluded that increasing concentrations of GHG in the atmosphere may produce climate changes that have significant physical effects, such as increased frequency and severity of storms, droughts, and floods and other climate events that could have an adverse effect on our operations and the operations of our customers.
We may be subject to interruptions or failures in our information technology systems.
We rely on sophisticated information technology systems and infrastructure to support our business, including process control technology. Any of these systems are susceptible to outages due to fire, floods, power loss, telecommunications failures, usage errors by employees, computer viruses, cyber‑attacks or other security breaches or similar events. The failure of any of our information technology systems may cause disruptions in our operations, which could adversely affect our revenues and profitability.
21
We are subject to cyber security risks. A cyber incident could occur and result in information theft, data corruption, operational disruption and/or financial loss.
We depend on information technology systems that we manage, and others that are managed by our third-party service and equipment providers, to conduct our day-to-day operations, including critical systems, and these systems are subject to risk associated with cyber incidents or attacks. Our technology systems and networks, and those of our vendors, suppliers and other business partners, may become the target of cyber-attacks or information security breaches. These cyber security risks could disrupt our operations and result in downtime or the loss, theft, corruption or unauthorized release of intellectual property, proprietary information, customer and vendor data or other critical data, as well as result in higher costs to correct and remedy the effects of such incidents. Certain cyber incidents, such as surveillance, may remain undetected for an extended period of time. As the sophistication of cyber incidents continues to evolve, we will likely be required to expend additional resources to continue to modify or enhance our protective measures or to investigate and remediate any vulnerability to cyber incidents. Our insurance coverage for cyber-attacks may not be sufficient to cover all the losses we may experience as a result of such cyber-attacks.
A terrorist attack or armed conflict could harm our business.
The occurrence or threat of terrorist attacks in the United States or other countries, anti‑terrorist efforts and other armed conflicts involving the United States or other countries, including continued hostilities in the Middle East, may adversely affect the United States and global economies and could prevent us from meeting our financial and other obligations. If any of these events occur, the resulting political instability and societal disruption could reduce overall demand for oil and natural gas, potentially putting downward pressure on demand for our services and causing a reduction in our revenues. Oil and natural gas‑related facilities could be direct targets of terrorist attacks, and our operations could be adversely impacted if infrastructure integral to our customers’ operations is destroyed or damaged. Costs for insurance and other security may increase as a result of these threats, and some insurance coverage may become more difficult to obtain, if available at all.
We may record losses or impairment charges related to goodwill and long-lived assets.
Changes in future market conditions and prolonged periods of low utilization, changes in technology or the sale of assets below their carrying value may cause us to experience losses in our results of operations. These events could result in the recognition of impairment charges that negatively impact our financial results. Significant impairment charges as a result of a decline in market conditions or otherwise could have a material adverse effect on our results of operations in future periods. For example, in 2018, we recorded a goodwill impairment charge in our High Specification Rig segment of $9.0 million.
Risks Related to Our Class A Common Stock
CSL has the ability to direct the voting of a majority of our voting stock, and their interests may conflict with those of our other shareholders.
The Existing Owners, CSL Opportunities II, CSL Holdings II and CSL Energy Opportunities Master Fund, LLC (“CSL Master Fund”) own approximately 60.5% of our voting interests. CSL holds a majority of the voting interests in each of the Existing Owners, CSL Opportunities II, CSL Holdings II and CSL Master Fund. CSL and its affiliates beneficially own an aggregate of approximately 3,051,045 shares of Class A Common Stock, 6,416,154 units in Ranger LLC (“Ranger Units”) and 6,416,154 shares of our Class B Common Stock, par value $0.01 per share (“Class B Common Stock”). CSL’s beneficial ownership of greater than 50% of our voting stock means CSL will be able to control matters requiring shareholder approval, including the election of directors (other than certain rights of Bayou Holdings to designate nominees to our Board of Directors as discussed further herein), changes to our organizational documents and significant corporate transactions. This concentration of ownership makes it unlikely that any other holder or group of holders of our Class A Common Stock (other than Bayou Holdings) will be able to affect the way we are managed or the direction of our business. Further, we entered into a stockholders’ agreement with the Existing Owners and Bayou Holdings, CSL Opportunities II and CSL Holdings II (together, the “Bridge Loan Lenders”). Among other things, the stockholders’ agreement provides (i) CSL with the right to designate a certain number of nominees to our Board of Directors for so long as CSL beneficially owns at least 10% of our common stock and (ii) Bayou Holdings with the right to designate two nominees to our Board of Directors for so long as CSL beneficially owns at least 50% of our common stock. The interests of CSL and Bayou Holdings with respect to matters potentially or actually involving or affecting us, such as future acquisitions, financings and other corporate opportunities and attempts to acquire us, may conflict with the interests of our other shareholders.
Further, CSL and Bayou Holdings may have different tax positions from us, especially in light of the Tax Receivable Agreement (the “TRA”) we entered into with certain of our stockholders in connection with the Offering , that could influence their decisions regarding whether and when to support the disposition of assets, the incurrence or refinancing of new or existing indebtedness, or the termination of the TRA and the acceleration of our obligations thereunder. In addition, the determination of future tax reporting positions, the structuring of future transactions and the handling of any challenge by any taxing authority
22
to our tax reporting positions may take into consideration CSL’s or Bayou Holdings’ tax or other considerations that may differ from the considerations of us or our other shareholders.
Given this concentrated ownership, CSL (and, in certain circumstances, Bayou Holdings) would have to approve any potential acquisition of us. The existence of a significant shareholder and the stockholders’ agreement may have the effect of deterring hostile takeovers, delaying or preventing changes in control or changes in management, or limiting the ability of our other shareholders to approve transactions that they may deem to be in the best interests of our company. Moreover, CSL’s concentration of stock ownership may adversely affect the trading price of our Class A Common Stock to the extent investors perceive a disadvantage in owning stock of a company with a significant shareholder.
CSL, Bayou Holdings and their respective affiliates are not limited in their ability to compete with us, and the corporate opportunity provisions in our amended and restated certificate of incorporation could enable CSL and Bayou Holdings to benefit from corporate opportunities that might otherwise be available to us.
Our governing documents provide that CSL, Bayou Holdings and their respective affiliates (including portfolio investments of CSL and its affiliates) are not restricted from owning assets or engaging in businesses that compete directly or indirectly with us. In particular, subject to the limitations of applicable law, our amended and restated certificate of incorporation, among other things:
|
•
|
permits CSL, Bayou Holdings and their respective affiliates to conduct business that competes with us and to make investments in any kind of property in which we may make investments; and
|
|
•
|
provides that if CSL, Bayou Holdings or their respective affiliates, or any employee, partner, member, manager, officer or director of CSL, Bayou Holdings or their respective affiliates who is also one of our directors or officers, becomes aware of a potential business opportunity, transaction or other matter, they will have no duty to communicate or offer that opportunity to us.
|
CSL, Bayou Holdings or their respective affiliates may become aware, from time to time, of certain business opportunities and may direct such opportunities to other businesses in which they have invested, in which case we may not become aware of or otherwise have the ability to pursue such opportunity. Furthermore, such businesses may choose to compete with us for these opportunities, possibly causing these opportunities to not be available to us or causing them to be more expensive for us to pursue. In addition, CSL, Bayou Holdings and their respective affiliates may dispose of equipment or other assets in the future, without any obligation to offer us the opportunity to purchase any of those assets. As a result, our renouncing our interest and expectancy in any business opportunity that may be from time to time presented to CSL, Bayou Holdings and their respective affiliates could adversely impact our business or prospects if attractive business opportunities are procured by such parties for their own benefit rather than for ours.
A significant reduction of CSL’s ownership interests in us could adversely affect us.
We believe that CSL’s ownership interest in us provides with it an economic incentive to assist us to be successful. CSL is not subject to any obligation to maintain its ownership interest in us and may elect at any time to sell all or a substantial portion of or otherwise reduce its ownership interest in us. If CSL sells all or a substantial portion of its ownership interest in us, it may have less incentive to assist in our success and its affiliate(s) that are expected to serve as members of our Board of Directors may resign. Such actions could adversely affect our ability to successfully implement our business strategies which could adversely affect our cash flows or results of operations.
Certain of our executive officers and directors have significant duties with, and spend significant time serving, entities that may compete with us in seeking acquisitions and business opportunities and, accordingly, may have conflicts of interest in allocating time or pursuing business opportunities.
Certain of our executive officers and directors, who are responsible for managing the direction of our operations, hold positions of responsibility with other entities (including affiliated entities) that are in the oil and natural gas industry. These executive officers and directors may become aware of business opportunities that may be appropriate for presentation to us as well as to the other entities with which they are or may become affiliated. Due to these existing and potential future affiliations, these individuals may present potential business opportunities to other entities prior to presenting them to us, which could cause additional conflicts of interest. They may also decide that certain opportunities are more appropriate for other entities with which they are affiliated, and as a result, they may elect not to present those opportunities to us. These conflicts may not be resolved in our favor.
23
Our amended and restated certificate of incorporation and amended and restated bylaws, as well as Delaware law, contain provisions that could discourage acquisition bids or merger proposals, which may adversely affect the market price of our Class A Common Stock and could deprive our investors of the opportunity to receive a premium for their shares.
Our amended and restated certificate of incorporation authorizes our Board of Directors to issue preferred stock without shareholder approval in one or more series, designate the number of shares constituting any series, and fix the rights, preferences, privileges and restrictions thereof, including dividend rights, voting rights, rights and terms of redemption, redemption price or prices and liquidation preferences of such series. If our Board of Directors elects to issue preferred stock, it could be more difficult for a third party to acquire us. In addition, some provisions of our amended and restated certificate of incorporation and amended and restated bylaws could make it more difficult for a third party to acquire control of us, even if the change of control would be beneficial to our shareholders. These provisions include:
|
•
|
after CSL and its affiliates no longer collectively hold more than 50% of the voting power of our common stock, dividing our Board of Directors into three classes of directors, with each class serving staggered three-year terms;
|
|
•
|
after CSL and its affiliates no longer collectively hold more than 50% of the voting power of our common stock, providing that all vacancies, including newly created directorships, may, except as otherwise required by law or, if applicable, the rights of holders of a series of preferred stock, only be filled by the affirmative vote of a majority of directors then in office, even if less than a quorum (prior to such time, vacancies may also be filled by shareholders holding a majority of the outstanding shares entitled to vote);
|
|
•
|
after CSL and its affiliates no longer collectively hold more than 50% of the voting power of our common stock, permitting any action by shareholders to be taken only at an annual meeting or special meeting rather than by a written consent of the shareholders, subject to the rights of any series of preferred stock with respect to such rights;
|
|
•
|
after CSL and its affiliates no longer collectively hold more than 50% of the voting power of our common stock, permitting special meetings of our shareholders to be called only by our Board of Directors pursuant to a resolution adopted by the affirmative vote of a majority of the total number of authorized directors whether or not there exist any vacancies in previously authorized directorships (prior to such time, a special meeting may also be called at the request of shareholders holding a majority of the outstanding shares entitled to vote);
|
|
•
|
after CSL and its affiliates no longer collectively hold more than 50% of the voting power of our common stock, requiring the affirmative vote of the holders of at least 66
2/3
% in voting power of all then outstanding common stock entitled to vote generally in the election of directors, voting together as a single class, to remove any or all of the directors from office at any time, and directors will be removable only for “cause”;
|
|
•
|
prohibiting cumulative voting in the election of directors;
|
|
•
|
establishing advance notice provisions for shareholder proposals and nominations for elections to the board of directors to be acted upon at meetings of shareholders; and
|
|
•
|
providing that the Board of Directors is expressly authorized to adopt, or to alter or repeal our bylaws.
|
In addition, certain change of control events have the effect of accelerating the payment due under the TRA, which could be substantial and accordingly serve as a deterrent to a potential acquirer of our company. Please see “Part I, Item 1A. Risks Related to Our Structure—In certain cases, payments under the TRA may be accelerated and/or significantly exceed the actual benefits, if any, we realize in respect to the tax attributes subject to the Tax Receivable Agreement.”
24
Our amended and restated certificate of incorporation designates the Court of Chancery of the State of Delaware as the sole and exclusive forum for certain types of actions and proceedings that may be initiated by our shareholders, which could limit our shareholders’ ability to obtain a favorable judicial forum for disputes with us or our directors, officers, employees or agents.
Our amended and restated certificate of incorporation provides that, unless we consent in writing to the selection of an alternative forum, the Court of Chancery of the State of Delaware is, to the fullest extent permitted by applicable law, the sole and exclusive forum for (i) any derivative action or proceeding brought on our behalf, (ii) any action asserting a claim of breach of a fiduciary duty owed by any of our directors, officers, employees or agents to us or our shareholders, (iii) any action asserting a claim arising pursuant to any provision of the Delaware General Corporation Law (the “DGCL”), our amended and restated certificate of incorporation or our amended and restated bylaws, or (iv) any action asserting a claim against us that is governed by the internal affairs doctrine, in each such case subject to such Court of Chancery having personal jurisdiction over the indispensable parties named as defendants therein. Any person or entity purchasing or otherwise acquiring any interest in shares of our capital stock will be deemed to have notice of, and consented to, the provisions of our amended and restated certificate of incorporation described in the preceding sentence. This choice of forum provision may limit a shareholder’s ability to bring a claim in a judicial forum that it considers more likely to be favorable for disputes with us or our directors, officers, employees or agents, which may discourage such lawsuits against us and such persons. Alternatively, if a court were to find these provisions of our amended and restated certificate of incorporation inapplicable to, or unenforceable in respect of, one or more of the specified types of actions or proceedings, we may incur additional costs associated with resolving such matters in other jurisdictions, which could adversely affect our business, financial condition, results of operations or prospects.
If we were to pay cash dividends in the future on our Class A Common Stock, our Credit Facility places certain restrictions on our ability to do so. Consequently, your only opportunity to achieve a return on your investment is if the price of our Class A Common Stock appreciates.
We have not paid any dividends since our inception to holders of our Class A Common Stock and currently intend to retain any future earnings to finance the growth of our business. Additionally, our Credit Facility places certain restrictions on our ability to pay cash dividends. Consequently, your only opportunity to achieve a return on your investment in us will be if you sell your Class A Common Stock at a price greater than you paid for it. There is no guarantee that the price of our Class A Common Stock that will prevail in the market will ever exceed the price that you paid for it.
Future sales of our Class A Common Stock in the public market, or the perception that such sales may occur, could reduce our stock price, and any additional capital raised by us through the sale of equity or convertible securities may dilute your ownership in us.
We may sell additional shares of Class A Common Stock or securities convertible into Class A Common Stock in subsequent public offerings. As of
February 26, 2020
, we had
8,632,788
shares of Class A Common Stock outstanding, which may be resold immediately in the public market. As of
February 26, 2020
, the Existing Owners and the Bridge Loan Lenders owned
6,866,154
shares of our Class B Common Stock. The Existing Owners and the Bridge Loan Lenders are parties to a registration rights agreement, which requires us to effect the registration of any shares of Class A Common Stock held by an Existing Owner or Bridge Loan Lender or that an Existing Owner or Bridge Loan Lender receives upon redemption of its shares of Class B Common Stock.
In connection with the Offering and in May 2019, we filed registration statements with the SEC on Form S-8 providing for the registration of 1,250,000 shares and 1,600,000 shares, respectively, of our Class A Common Stock issued or reserved for issuance under our long term incentive plan. Subject to the satisfaction of vesting conditions, the expiration of lock-up agreements and the requirements of Rule 144, shares registered under the registration statement on Form S-8 are available for resale immediately in the public market without restriction.
We cannot predict the size of future issuances of our Class A Common Stock or securities convertible into Class A Common Stock or the effect, if any, that future issuances and sales of shares of our Class A Common Stock will have on the market price of our Class A Common Stock. Sales of substantial amounts of our Class A Common Stock, or the perception that such sales could occur, may adversely affect prevailing market prices of our Class A Common Stock.
25
We may issue preferred stock, the terms of which could adversely affect the voting power or value of our Class A Common Stock.
Our amended and restated certificate of incorporation authorizes us to issue, without the approval of our shareholders, one or more classes or series of preferred stock having such designations, preferences, limitations and relative rights, including preferences over our Class A Common Stock respecting dividends and distributions, as our Board of Directors may determine. The terms of one or more classes or series of preferred stock could adversely impact the voting power or value of our Class A Common Stock. For example, we might grant holders of preferred stock the right to elect some number of our directors in all events or on the happening of specified events or the right to veto specified transactions. Similarly, the repurchase or redemption rights or liquidation preferences we might assign to holders of preferred stock could affect the residual value of the Class A Common Stock.
We identified a material weakness in our internal control over financial reporting in prior years and may identify additional material weaknesses in the future or otherwise fail to maintain an effective system of internal controls, which may result in material misstatements of our financial statements or cause us to fail to meet our periodic reporting obligations.
As a public company, we are required to maintain control over financial reporting and to report any material weaknesses in those internal controls, subject to any exemptions that we avail ourselves to under the Jumpstart Our Business Startups Act of 2012 (the “JOBS Act”). We are required to perform system and process evaluation and testing of our internal control over financial reporting to allow management to report on the effectiveness of our internal control over financial reporting, as required by Section 404 of Sarbanes-Oxley, for our fiscal year ending December 31, 2019. As of December 31, 2017, we identified a material weakness related to non-routine and/or complex transactions attributable to the lack of sufficient qualified accounting personnel. To remediate this material weakness, we recruited technical, financial and accounting personnel and made significant advancements to our internal controls surrounding non-routine and complex arrangements to strengthen our financial reporting process since the Offering in August 2017. Based on testing performed by management, we believe the implemented controls are operating effectively and the previously reported material weakness was remediated as of December 31, 2018 and all controls are operating effectively as of December 31, 2019, however we may identify additional material weaknesses in the future or otherwise fail to maintain effective system of internal controls.
Our failure to implement and maintain effective internal control over financial reporting could result in errors in our financial statements that could result in a restatement of our financial statements and cause us to fail to meet our reporting obligations. Ineffective internal controls could also cause investors to lose confidence in our reported financial information, which could have a negative impact on the trading of our Class A Common Stock.
We are a “controlled company” within the meaning of NYSE rules and, as a result, qualify for, and intend to rely on exemptions from certain corporate governance requirements.
Through its interests in the Existing Owners, CSL holds a majority of the voting power of our capital stock. As a result, we are a controlled company within the meaning of NYSE corporate governance standards. Under NYSE rules, a company of which more than 50% of the voting power for the election of directors is held by an individual, a group or another company is a controlled company and may elect not to comply with certain NYSE corporate governance requirements, including the requirements that:
|
•
|
a majority of the Board of Directors consist of independent directors as defined under the rules of the NYSE;
|
|
•
|
the nominating and governance committee be composed entirely of independent directors with a written charter addressing the committee’s purpose and responsibilities; and
|
|
•
|
the compensation committee be composed entirely of independent directors with a written charter addressing the committee’s purpose and responsibilities.
|
These requirements will not apply to us as long as we remain a controlled company. Since our initial offering we have utilized some or all of these exemptions. Accordingly, you may not have the same protections afforded to shareholders of companies that are subject to all of the corporate governance requirements of the NYSE.
26
For as long as we are an emerging growth company and/or a smaller reporting company, we will not be required to comply with certain reporting requirements that apply to other public companies.
We are classified as an “emerging growth company” under the JOBS Act and as a “smaller reporting company” under the Exchange Act. For as long as we are an emerging growth company, which may be up to five full fiscal years, unlike other public companies, we will not be required to, among other things: (i) provide an auditor’s attestation report on management’s assessment of the effectiveness of our system of internal control over financial reporting pursuant to Section 404(b) of Sarbanes-Oxley; (ii) comply with any new requirements adopted by the Public Company Accounting Oversight Board (United States) (“PCAOB”) requiring mandatory audit firm rotation or a supplement to the auditor’s report in which the auditor would be required to provide additional information about the audit and the financial statements of the issuer; (iii) provide certain disclosures regarding executive compensation required of larger public companies; or (iv) hold nonbinding advisory votes on executive compensation. We will remain an emerging growth company for up to five years, although we will lose that status sooner if we have more than $1.07 billion of revenues in a fiscal year, have more than $700.0 million in market value of our Class A Common Stock held by non-affiliates or issue more than $1.0 billion of non-convertible debt over a three-year period.
For as long as we are a smaller reporting company, we will have certain reduced disclosure requirements with the SEC, including the ability to provide two years of audited financial statements and corresponding Management's Discussion and Analysis disclosures. We will remain a smaller reporting company until the aggregate market value of our outstanding common stock held by non-affiliates, calculated as of the end of our most recently complete second fiscal quarter, exceeds $250 million. We cannot predict whether investors will find our common stock less attractive because of our reliance on any of these exemptions. If some investors find our common stock less attractive, there may be a less active trading market for our common stock and our stock price may be more volatile.
To the extent that we rely on any of the exemptions available to emerging growth companies and/or smaller reporting companies, you will receive less information about our executive compensation and internal control over financial reporting than issuers that are not emerging growth companies. If some investors find our Class A Common Stock to be less attractive as a result, there may be a less active trading market for our Class A Common Stock and our stock price may be more volatile.
If securities or industry analysts do not publish research or reports about our business, if they adversely change their recommendations regarding our Class A Common Stock or if our operating results do not meet their expectations, our stock price could decline.
The trading market for our Class A Common Stock will be influenced by the research and reports that industry or securities analysts publish about us or our business. If one or more of these analysts cease coverage of our company or fail to publish reports on us regularly, we could lose visibility in the financial markets, which in turn could cause our stock price or trading volume to decline. Moreover, if one or more of the analysts who cover our company adversely changes his or her recommendation with respect to our Class A Common Stock or if our operating results do not meet their expectations, our stock price could decline.
Risks Related to Our Structure
We are a holding company. Our sole material asset is our equity interest in Ranger LLC and we are accordingly dependent upon distributions from Ranger LLC to pay taxes, make payments under the Tax Receivable Agreement and cover our corporate and other overhead expenses.
We are a holding company and have no material assets other than our equity interest in Ranger LLC. We have no independent means of generating revenues. To the extent Ranger LLC has available cash, we intend to cause Ranger LLC to make (i) generally pro rata distributions to its unit holders, including us, in an amount at least sufficient to allow us to pay our taxes and to make payments under the TRA and any subsequent tax receivable agreements that we may enter into in connection with future acquisitions and (ii) non-pro rata payments to us in an amount at least sufficient to reimburse us for our corporate and other overhead expenses. We are limited, however, in our ability to cause Ranger LLC and its subsidiaries to make these and other distributions or payments to us due to certain limitations, including restrictions under our Credit Facility and the cash requirements and financial condition of Ranger LLC. To the extent that we need funds and Ranger LLC or its subsidiaries are restricted from making such distributions or payments under applicable laws or regulations or under the terms of any future financing arrangements, or are otherwise unable to provide such funds, our liquidity and financial condition could be materially adversely affected.
Moreover, because we have no independent means of generating revenue, our ability to make payments under the TRA is dependent on the ability of Ranger LLC to make distributions to us in an amount sufficient to cover our obligations under the TRA. This ability, in turn, may depend on the ability of Ranger LLC’s subsidiaries to make distributions to it. The ability of Ranger LLC, its subsidiaries and other entities in which it directly or indirectly holds an equity interest to make such distributions is subject to, among other things, (i) the applicable provisions of Delaware law (or other applicable jurisdiction) that may limit the amount of funds available for distribution and (ii) restrictions in relevant debt instruments entered into by Ranger LLC or
27
its subsidiaries and/other entities in which it directly or indirectly holds an equity interest. To the extent that we are unable to make payments under the TRA for any reason, such payments will be deferred and will accrue interest until paid.
We are required to make payments under the Tax Receivable Agreement for certain tax benefits that we may claim, and the amounts of such payments could be significant.
Holders of Ranger Units other than Ranger (the “Ranger Unit Holders”) have the right to exchange their Ranger Units (and a corresponding number of shares of Class B Common Stock) for shares of our Class A Common Stock at an exchange ratio of one share of Class A Common Stock for each Ranger Unit (and a corresponding number of shares of Class B Common Stock) exchanged (subject to conversion rate adjustments for stock splits, stock dividends and reclassifications), or, if either we or Ranger LLC so elects, cash.
We have entered into a TRA with certain members of Ranger Unit Holders (each such person a “TRA Holder”). This agreement generally provides for the payment by us to each TRA Holder of 85% of the net cash savings, if any, in U.S. federal, state and local income and franchise tax that we actually realize (computed using the estimated impact of state and local taxes) or are deemed to realize in certain circumstances in periods after the Offering as a result of certain increases in tax basis and certain benefits attributable to imputed interest. We will retain the benefit of the remaining 15% of these cash savings. Payments we make under the TRA will be increased by any interest accrued from the due date (without extensions) of the corresponding tax return.
The term of the TRA commenced upon the completion of the Offering and will continue until all tax benefits that are subject to the TRA have been utilized or expired, unless we exercise our right to terminate the TRA (or the TRA is terminated due to other circumstances, including our breach of a material obligation thereunder or certain mergers, asset sales, other forms of business combination or other changes of control), and we make the termination payments specified in the TRA.
The payment obligations under the TRA are our obligations and not obligations of Ranger LLC, and we expect that the payments we will be required to make under the TRA will be substantial. Estimating the amount and timing of payments that may become due under the TRA is by its nature imprecise. For purposes of the TRA, cash savings in tax generally are calculated by comparing our actual tax liability (computed using the estimated impact of state and local taxes) to the amount we would have been required to pay had we not been able to utilize any of the tax benefits subject to the TRA. The actual increase in tax basis, as well as the amount and timing of any payments under the TRA, will vary depending upon a number of factors, including the timing of the redemptions of Ranger Units, the price of our Class A Common Stock at the time of each redemption, the extent to which such redemptions are taxable transactions, the amount of the redeeming TRA Holder’s tax basis in its Ranger Units at the time of the relevant redemption, the depreciation and amortization periods that apply to the increase in tax basis, the amount, character and timing of the taxable income we generate in the future, the U.S. federal income tax rates then applicable, and the portion of our payments under the TRA that constitute imputed interest or give rise to depreciable or amortizable tax basis.
Our ability to realize the tax benefits that we currently expect to be available as a result of the increases in tax basis created by redemptions and our ability to utilize the interest deductions imputed under the TRA depends on a number of assumptions, including that we earn sufficient taxable income each year during the period over which such deductions are available and that there are no adverse changes in applicable law or regulations. If our actual taxable income was insufficient or there were adverse changes in applicable law or regulations, we may be unable to realize all or a portion of these expected benefits and our cash flows could be negatively affected.
In certain cases, payments under the Tax Receivable Agreement may be accelerated and/or significantly exceed the actual benefits, if any, we realize in respect to the tax attributes subject to the Tax Receivable Agreement.
If we experience a change of control (as defined under the TRA, which includes certain mergers, asset sales and other forms of business combinations) or the TRA terminates early (at our election or it is terminated early due to our breach of a material obligation thereunder) our obligations under the TRA would accelerate and we would be required to make a substantial immediate payment equal to the present value of the anticipated future payments to be made by us under the TRA (determined by applying a discount rate equal to one-year London Interbank Offered Rate (“LIBOR”) plus 150 basis points). The calculation of hypothetical future payments will be based upon certain assumptions and deemed events set forth in the TRA, including (i) the assumption that we have sufficient taxable income to fully utilize the tax benefits covered by the TRA (including having sufficient taxable income to currently utilize any accumulated net operating loss carryforwards) and (ii) the assumption that any Ranger Units that the TRA Holders or their permitted transferees own on the termination date are deemed to be redeemed on the termination date. Any early termination payment may be made significantly in advance of, and may materially exceed, the actual realization, if any, of the future tax benefits to which the termination payment relates.
As a result of either an early termination or a change of control, we could be required to make payments under the TRA that exceed our actual cash tax savings under the TRA. In these situations, our obligations under the TRA could have a substantial negative impact on our liquidity and could have the effect of delaying, deferring or preventing certain mergers, asset sales or other forms of business combinations or changes of control that could be in the best interests of holders of our Class A Common
28
Stock. For example, if the TRA were terminated as of
December 31, 2019
the present value of the estimated termination payments would, in the aggregate, be approximately $11.3 million (calculated using a discount rate equal to one-year LIBOR plus 150 basis points applied against an undiscounted liability of approximately $11.8 million). The foregoing amount is merely an estimate and the actual payment could differ materially. There can be no assurance that we will be able to finance our obligations under the TRA.
In the event that our payment obligations under the Tax Receivable Agreement are accelerated upon certain mergers, other forms of business combinations or other changes of control, the consideration payable to holders of our Class A Common Stock could be substantially reduced.
If we experience a change of control (as defined under the TRA, which includes certain mergers, asset sales and other forms of business combinations), we would be obligated to make a substantial, immediate lump-sum payment, and such payment may be significantly in advance of, and may materially exceed, the actual realization, if any, of the future tax benefits to which the payment relates. As a result of this payment obligation, holders of our Class A Common Stock could receive substantially less consideration in connection with a change of control transaction than they would receive in the absence of such obligation. Further, our payment obligations under the TRA will not be conditioned upon the TRA Holders having a continued interest in us or Ranger LLC. Accordingly, the TRA Holders’ interests may conflict with those of the holders of our Class A Common Stock.
We will not be reimbursed for any payments made under the Tax Receivable Agreement in the event that any tax benefits are subsequently disallowed.
Payments under the TRA will be based on the tax reporting positions that we will determine. The TRA Holders will not reimburse us for any payments previously made under the TRA if any tax benefits that have given rise to payments under the TRA are subsequently disallowed, except that excess payments made to any TRA Holder will be netted against payments that would otherwise be made to such TRA Holder, if any, after our determination of such excess. As a result, in such circumstances, we could make payments that are greater than our actual cash tax savings, if any, and may not be able to recoup those payments, which could adversely affect our liquidity.
In certain circumstances, Ranger LLC will be required to make tax distributions to the Ranger Unit Holders, including us, and the tax distributions that Ranger LLC will be required to make may be substantial. To the extent we receive tax distributions in excess of our tax liabilities and obligations to make payments under the Tax Receivable Agreement and do not distribute such cash balances as dividends on our Class A Common Stock, the Ranger Unit Holders (other than us) would benefit from such accumulated cash balances if they exercise their Redemption Right.
Ranger LLC is treated as a partnership for U.S. federal income tax purposes and, as such, is not subject to U.S. federal income tax. Instead, taxable income is allocated to the Ranger Unit Holders, including us. Pursuant to the Ranger LLC Agreement, Ranger LLC will make generally pro rata cash distributions, or tax distributions, to the Ranger Unit Holders, including us, calculated using an assumed tax rate, to allow each of the Ranger Unit Holders to pay its respective taxes on such holder’s allocable share of Ranger LLC’s taxable income. Under applicable tax rules, Ranger LLC is required to allocate taxable income disproportionately to its members in certain circumstances. Because tax distributions are determined based on the Ranger Unit Holder that is allocated the largest amount of taxable income on a per unit basis and on an assumed tax rate that is the highest possible rate applicable to any Ranger Unit Holder, but will be made pro rata based on ownership, Ranger LLC may be required to make tax distributions that, in the aggregate, exceed the amount of taxes that Ranger LLC would have paid if it were taxed on its net income at the assumed rate. The pro rata distribution amounts may also be increased to the extent necessary, if any, to ensure that the amount distributed to Ranger Inc. is sufficient to enable Ranger Inc. to pay its actual tax liabilities and amounts payable under the TRA (other than accelerated amounts payable under the TRA as a result of a change of control or termination event, which we expect to be subject to restrictions contained in our Credit Facility).
Funds used by Ranger LLC to satisfy its tax distribution obligations will not be available for reinvestment in our business. Moreover, the tax distributions Ranger LLC will be required to make may be substantial, and may exceed (as a percentage of Ranger LLC’s income) the overall effective tax rate applicable to a similarly situated corporate taxpayer. In addition, because these payments will be calculated with reference to an assumed tax rate, and because of the disproportionate allocation of taxable income, these payments will likely significantly exceed the actual tax liability for many of the Ranger Unit Holders.
As a result of potential differences in the amount of taxable income allocable to us and to the other Ranger Unit Holders, as well as the use of an assumed tax rate in calculating Ranger LLC’s tax distribution obligations, we may receive distributions significantly in excess of our tax liabilities and obligations to make payments under the TRA. If we do not distribute such cash balances as dividends on our Class A Common Stock and instead, for example, hold such cash balances or lend them to Ranger LLC, the Ranger Unit Holders (other than us) would benefit from any value attributable to such accumulated cash balances as a result of their ownership of Class A Common Stock following a redemption of their Ranger Units pursuant to the Redemption Right or their receipt of an equivalent amount of cash.
29
If Ranger LLC were to become a publicly traded partnership taxable as a corporation for U.S. federal income tax purposes, we and Ranger LLC might be subject to potentially significant tax inefficiencies, and we would not be able to recover payments previously made by us under the Tax Receivable Agreement even if the corresponding tax benefits were subsequently determined to have been unavailable due to such status.
We intend to continue to operate such that Ranger LLC does not become a publicly traded partnership taxable as a corporation for U.S. federal income tax purposes. A “publicly traded partnership” is a partnership, the interests of which are traded on an established securities market or are readily tradable on a secondary market or the substantial equivalent thereof. Under certain circumstances, redemptions of Ranger Units pursuant to a Redemption Right (or our Call Right) or other transfers of Ranger Units could cause Ranger LLC to be treated as a publicly traded partnership. Applicable U.S. Treasury regulations provide for certain safe harbors from treatment as a publicly traded partnership, and we intend to continue to operate such that redemptions or other transfers of Ranger Units qualify for one or more such safe harbors. For example, we intend to continue to limit the number of Ranger Unit Holders, and the Ranger LLC Agreement provides for limitations on the ability of Ranger Unit Holders to transfer their Ranger Units and provides us, as managing member of Ranger LLC, with the right to impose restrictions (in addition to those already in place) on the ability of Ranger Unit Holders to redeem their Ranger Units pursuant to a Redemption Right to the extent we believe it is necessary to ensure that Ranger LLC will continue to be treated as a partnership for U.S. federal income tax purposes.
If Ranger LLC were to become a publicly traded partnership, significant tax inefficiencies might result for us and for Ranger LLC, as a result of our inability to file a consolidated U.S. federal income tax return with Ranger LLC. In addition, we may not be able to realize tax benefits covered under the TRA, and we would not be able to recover any payments previously made by us under the TRA, even if the corresponding tax benefits (including any claimed increase in the tax basis of Ranger LLC’s assets) were subsequently determined to have been unavailable.
Item 1B. Unresolved Staff Comments
None.
Item 2. Properties
We lease our principal executive offices, which are located at 800 Gessner Street, Suite 1000, Houston, Texas 77024. Our existing lease expires in 2020. As of
December 31, 2019
, we owned or leased maintenance facilities, yards and field offices around the U.S. and include the following:
|
Facility Location and Description
|
Purpose
|
Size of Location
(Square Footage/Acreage)
|
Leased / Owned
|
Lease
Expiration
|
||||||
|
High Specification Rigs
|
(square feet)
|
(acres)
|
||||||||
|
Palestine, Texas
|
Maintenance facility, Yard, Field office
|
2,000
|
3.0
|
Leased
|
2020
|
|||||
|
Dickinson, North Dakota
|
Maintenance facility, Yard, Field office
|
11,120
|
3.5
|
Owned
|
*
|
|||||
|
Milliken, Colorado
|
Maintenance facility, Yard, Field office
|
124,000
|
23.0
|
Owned
|
*
|
|||||
|
Newtown, North Dakota
|
Maintenance facility, Yard, Field office
|
10,000
|
3.5
|
Owned
|
*
|
|||||
|
Pleasanton, Texas
|
Maintenance facility, Yard, Field office
|
7,800
|
3.0
|
Owned
|
*
|
|||||
|
Completion and Other Services
|
||||||||||
|
Midland, Texas
|
Maintenance facility, Yard, Field office
|
36,231
|
12.0
|
Leased
|
2027
|
|||||
_________________________
* Not applicable.
Additionally, we lease several smaller facilities, which generally have shorter terms. We believe that our facilities are adequate for our operations and their locations allow us to efficiently serve our customers. We do not believe that any single facility is material to our operations and, if necessary, we could readily obtain a replacement facility.
Item 3. Legal Proceedings
Our operations are subject to a variety of risks and disputes normally incident to our business. As a result, we may, at any given time, be a defendant in various legal proceedings and litigation arising in the ordinary course of business. We are not currently a party to any legal proceedings that, if determined adversely against us, individually or in the aggregate, would have a material adverse effect on our business, liquidity position, financial condition, results of operations or prospects. We are, however, named defendants in certain lawsuits, investigations and claims arising in the ordinary course of conducting our
30
business, including employee‑related matters, and we expect that we will be named defendants in similar lawsuits, investigations and claims in the future. We maintain insurance policies with insurers in amounts and with coverage and deductibles that we, with the advice of our insurance advisers and brokers, believe are reasonable and prudent. We cannot, however, assure you that this insurance will be adequate to protect us from all material expenses related to potential future claims for personal injury and property damage or that these levels of insurance will be available in the future at economical prices. While the outcome of these lawsuits, investigations and claims cannot be predicted with certainty, we do not expect these matters to have a material adverse impact on our business, results of operations, cash flows or financial condition. Information regarding legal proceedings is presented in “Part II, Item 8. Financial Statements and Supplementary Data—
Note 13 — Commitments and Contingencies
.”
Item 4. Mine Safety Disclosure
Not applicable.
31
PART II
Item 5. Market for Registrant's Common Equity, Related Stockholders' Matters and Issuer Purchases of Equity
Securities
Market Information
Our Class A Common Stock is listed on the NYSE under the symbol “RNGR.” There is no public market for our Class B Common Stock. As of
February 26, 2020
, there were approximately
35
shareholders and
four
shareholders of record of our Class A Common Stock and Class B Common Stock, respectively, which does not include shareholders whose shares are held in “street name,” where such shares are held by a broker or other nominee. The actual number of beneficial shareholders is greater than the number of holders of record.
We have not paid any dividends since our inception to holders of our Class A Common Stock. We currently intend to retain any future earnings to finance the growth of our business.
Recent Sales of Unregistered Securities; Use of Proceeds from Registered Securities
On August 10, 2017, Ranger Services entered into a Master Reorganization Agreement (the “Master Reorganization Agreement”) under which the parties thereto effected a series of restructuring transactions in connection with the Offering. In connection with the Master Reorganization Agreement, an aggregate of $3.0 million (included within other current liabilities on the accompanying consolidated balance sheet as of December 31, 2018) was settled by the Company during the year ended
December 31, 2019
. At the Company’s discretion, the liability was settled with the issuance of 206,897 shares of Class A Common Stock to CSL Energy Holdings I, LLC and CSL Energy Holdings II, LLC in a private placement exempt from registration pursuant to Section 4(a)(2) of the Securities Act promulgated thereunder. Refer to “Item 8. Financial Statements and Supplementary Data—Note 1 — Organization and Business Operations” for further details.
Purchases of Equity Securities by the Issuer and Affiliated Purchasers
In June 2019, the Company announced that its Board of Directors approved a share repurchase program, authorizing the Company to purchase up to 10% of the Company’s currently outstanding Class A Common Stock held by non-affiliates, not to exceed 580,000 shares or $5.0 million in aggregate value. Share repurchases may take place from time to time on the open market or through privately negotiated transactions. The duration of the share repurchase program is 12 months and may be accelerated, suspended or discontinued at any time without notice.
The following table provides information with respect to Class A Common Stock purchases made by the Company during the three months ended
December 31, 2019
.
|
Period
|
Total number of shares repurchased
(1)
|
Average price paid per share
|
Total number of shares purchased as part of publicly announced plans or programs
(2)
|
Maximum number of shares that may yet be purchased under the plans or programs
(3)
|
|||||||||
|
October 1, 2019 through October 31, 2019
|
10,502
|
|
$
|
5.70
|
|
10,502
|
|
||||||
|
November 1, 2019 through November 30, 2019
|
19,207
|
|
5.96
|
|
19,207
|
|
|||||||
|
December 1, 2019 through December 31, 2019
|
36,754
|
|
7.12
|
|
36,754
|
|
|||||||
|
Total
|
66,463
|
|
66,463
|
|
466,063
|
|
|||||||
_________________________
|
(1)
|
During the three months ended
December 31, 2019
, the Company repurchased an aggregate 66,463 shares of Ranger Energy Services, Inc. Class A Common Stock in open-market transactions. All shares repurchased were pursuant to the repurchase program that was announced on June 27, 2019.
|
|
(2)
|
As of
December 31, 2019
, an aggregate of 113,937 shares were purchased for a total of $0.7 million since the inception of the repurchase plan program announced on June 27, 2019.
|
|
(3)
|
As of
December 31, 2019
, the maximum number of shares that may yet be purchased under the plan is 466,063 based on the closing price of Ranger Energy Services, Inc. Class A Common Stock on the New York Stock Exchange on December 31, 2019.
|
32
Stock Performance Graph
The graph below presents a comparison of the cumulative total return on our Class A Common Stock, assuming $100 was invested on August 10, 2017, the initial trading day for our common stock for the NYSE Composite Index and a self- determined peer group, which includes Basic Energy Services, Forbes Energy Services, Key Energy Services, KLX Energy Services, Nine Energy Service and Pioneer Energy Services.

The graph and related information should not be deemed “soliciting material” or to be “filed” with the SEC, nor should such information be incorporated by reference into any future filing under the Securities Act or the Exchange Act, except to the extent that we specifically incorporate such information by reference into such a filing. The graph and information is included for historical and comparative purposes only and should not be considered indicative of future stock performance.
33
Item 6. Selected Financial Data
The selected financial data as of December 31, 2019 and 2018 have been derived from the audited consolidated financial statements included in “Part II, Item 8. Financial Statements and Supplementary Data.” The following data should be read in conjunction with “Part II, Item 7. Management’s Discussion and Analysis of Financial Condition and Results of Operations” and the audited consolidated financial statements and the notes thereto included in “Part II, Item 8. Financial Statements and Supplementary Data.”
|
Year Ended December 31,
|
||||||||
|
2019
|
2018
|
|||||||
|
(in millions, except per share and hourly amounts)
|
||||||||
|
Statement of operations data
|
||||||||
|
Operating revenues
|
$
|
336.9
|
|
$
|
303.1
|
|
||
|
Operating income (loss)
|
$
|
12.4
|
|
$
|
(2.1
|
)
|
||
|
Net income (loss)
|
$
|
4.4
|
|
$
|
(5.8
|
)
|
||
|
Net income (loss) attributable to Ranger Energy Services, Inc.
|
$
|
1.8
|
|
$
|
(3.3
|
)
|
||
|
Per share earnings (loss) from continuing operations
|
||||||||
|
Basic
|
$
|
0.21
|
|
$
|
(0.39
|
)
|
||
|
Diluted
|
$
|
0.21
|
|
$
|
(0.39
|
)
|
||
|
Balance sheet data (at end of period)
|
||||||||
|
Working capital
|
$
|
3.6
|
|
$
|
2.2
|
|
||
|
Property and equipment, net
|
$
|
218.9
|
|
$
|
229.8
|
|
||
|
Total assets
|
$
|
293.5
|
|
$
|
302.5
|
|
||
|
Long-term debt, net
|
$
|
26.6
|
|
$
|
44.7
|
|
||
|
Total stockholders’ equity
|
$
|
203.0
|
|
$
|
192.0
|
|
||
|
Other financial data
|
||||||||
|
Net cash provided by operating activities
|
$
|
51.9
|
|
$
|
27.6
|
|
||
|
Net cash used in investing activities
|
$
|
(23.4
|
)
|
$
|
(74.4
|
)
|
||
|
Net cash (used in) provided by financing activities
|
$
|
(24.2
|
)
|
$
|
44.1
|
|
||
|
Capital Expenditures
|
$
|
23.5
|
|
$
|
75.9
|
|
||
|
Adjusted EBITDA
(1)
|
$
|
50.8
|
|
$
|
41.1
|
|
||
|
Rig Hours
|
249,100
|
|
290,000
|
|
||||
|
Average Monthly Hours per rig
|
148
|
|
176
|
|
||||
|
(1)
|
For a discussion of the non-GAAP financial measure, Adjusted EBITDA, including a reconciliation to its most directly comparable financial measure calculated and presented in accordance with GAAP, please read “Part II, Item 7. Management’s Discussion and Analysis of Financial Condition and Results of Operations—Note Regarding Non‑GAAP Financial Measure.”
|
34
Item 7. Management’s Discussion and Analysis of Financial Condition and Results of Operations
The following discussion and analysis should be read in conjunction with the historical financial statements and related notes included elsewhere in this Annual Report. This discussion contains “forward‑looking statements” reflecting our current expectations, estimates and assumptions concerning events and financial trends that may affect our future operating results or financial position. Actual results and the timing of events may differ materially from those contained in these forward‑looking statements due to a number of factors. Factors that could cause or contribute to such differences include, but are not limited to, market prices for oil and natural gas, capital expenditures, economic and competitive conditions, regulatory changes and other uncertainties, as well as those factors discussed below and elsewhere in this report. Please read Cautionary Statement Regarding Forward‑Looking Statements. Also, please read the risk factors and other cautionary statements described under “Part I, Item 1A.-Risk Factors.” We assume no obligation to update any of these forward‑looking statements, except as required by applicable law.
Our Segments
During the fourth quarter of 2018, the Company bifurcated the legacy Well Services segment into High Specification Rigs and Completion and Other Services due to the modifications made to its internal reporting and responsibilities of those reporting to the Chief Operating Decision Maker (
“CODM”
). As a result, the financial information being provided to the CODM was updated to align with the internal organization, which resulted in a new reportable segment discussed further below.
Our service offerings consist of well completion support, workover, well maintenance, wireline, fluid management, other complementary services, as well as installation, commissioning and operating of modular equipment, which are conducted in three reportable segments, as follows:
|
•
|
High Specification Rigs
. Provider of high-spec well service rigs and complementary equipment and services to facilitate operations throughout the lifecycle of a well.
|
|
•
|
Completion and Other Services
. Provider of wireline completion services necessary to bring a well on production and other ancillary services often utilized in conjunction with our high-spec rig services to maintain the production of a well.
|
|
•
|
Processing Solutions
. Provider of proprietary, modular equipment for the processing of natural gas.
|
For additional financial information about our segments, please see “Part II, Item 8. Financial and Supplementary Data —
Note 15 — Segment Reporting
.”
How We Generate Revenues
We generate revenues through the provision of a variety of oilfield services. These services are performed under a variety of contract structures, including a long term take‑or‑pay contract and various master service agreements, as supplemented by statements of work, pricing agreements and specific quotes. A portion of our master services agreements include provisions that establish pricing arrangements for a period of up to one year in length. However, the majority of those agreements provide for pricing adjustments based on market conditions. The majority of our services are priced based on prevailing market conditions and changing input costs at the time the services are provided, giving consideration to the specific requirements of the customer.
Costs of Conducting Our Business
The principal expenses involved in conducting our business are personnel, repairs and maintenance costs, general and administrative costs, depreciation and amortization and interest expense. We manage the level of our expenses, except depreciation and amortization and interest expense, based on several factors, including industry conditions and expected demand for our services. In addition, a significant portion of the costs we incur in our business is variable based on the quantities of specific services provided and the requirements of such services.
Direct cost of services and general and administrative expenses include the following major cost categories: (i) personnel costs and (ii) equipment costs (including repair and maintenance).
Personnel costs associated with our operational employees represent a significant cost of our business. A substantial portion of our labor costs is attributable to our crews and is partly variable based on the requirements of specific customers and operations. A key component of personnel costs relates to the ongoing training of our employees, which improves safety rates and reduces attrition. We also incur costs to employ personnel to support and manage our services and perform maintenance on our assets. Costs for these employees are not directly tied to our level of business activity.
We incur significant equipment costs in connection with the operation of our business, including repair and maintenance costs, as well as direct material costs.
35
How We Evaluate Our Operations
Management uses a variety of metrics to analyze our operating results and profitability, which include operating revenues, operating income (loss) and adjusted EBITDA, among others. Within our High Specification Rig segment, management uses metrics to analyze our activity levels and profitability, including rig hours and rig utilization.
Revenues
We analyze our revenues by comparing actual revenues to our internal projections for a given period and to prior periods to assess our performance. We believe that revenues are a meaningful indicator of the demand and pricing for our services.
Operating Income (Loss)
We analyze our operating income (loss), which we define as revenues less cost of services, general and administrative expenses, depreciation and amortization, impairment and other operating expenses, to measure our financial performance. We believe operating income (loss) is a meaningful metric because it provides insight on profitability and true operating performance based on the historical cost basis of our assets. We also compare operating income (loss) to our internal projections for a given period and to prior periods.
Adjusted EBITDA
We view Adjusted EBITDA, which is a non‑GAAP financial measure, as an important indicator of performance. We define Adjusted EBITDA as net income or loss before net interest expense, income tax provision or benefit, depreciation and amortization, equity‑based compensation, acquisition‑related and severance costs, impairment of goodwill and other non‑cash and certain other items that we do not view as indicative of our ongoing performance. See “—Results of Operations” and “—Note Regarding Non‑GAAP Financial Measure” for more information and reconciliations of net income (loss) to Adjusted EBITDA, the most directly comparable financial measure calculated and presented in accordance with GAAP.
Rig Hours
Within our High Specification Rigs segment, we analyze rig hours as an important indicator of our activity levels and profitability. Rig hours represent the aggregate number of hours that our well service rigs actively worked during the periods presented. We typically bill customers on an hourly basis during the period that a well service rig is actively working, making rig hours a useful metric for evaluating our profitability.
Rig Utilization
Within our High Specification Rigs segment, we analyze rig utilization as a further important indicator of our activity levels and profitability. We measure rig utilization by reference to average monthly hours per rig, which is calculated by dividing (i) the approximate, aggregate operating well service rig hours for the periods presented by (ii) the aggregate number of high specification rigs in our fleet during such period, as aggregated on a monthly basis utilizing a mid-month convention whereby a high specification rig is added to our fleet during a month, meaning that we have taken delivery of such high specification rig and is ready for service, is assumed to be in our fleet for one half of such month. We believe that rig utilization as measured by average monthly hours per well service rig is a meaningful indicator of the operational efficiency of our core revenue-producing assets, market demand for our well services and our ability to profitably capitalize on such demand. Our evaluation of our rig utilization as measured by average monthly hours per rig may not be comparable to that of our competitors. For example, our competitors’ well service rig fleets are typically comprised primarily of older, lower-spec well service rigs that are not as well suited to servicing modern horizontal well designs as are high-spec well service rigs, which may result in lower average rig hours per rig for our competitors’ fleets as compared to our fleet.
The primary factors that have historically impacted, and will likely continue to impact, our actual aggregate well service rig hours for any specified period are (i) customer demand, which is influenced by factors such as commodity prices, the complexity of well completion operations and technological advances in our industry, and (ii) our ability to meet such demand, which is influenced by changes in our fleet size and resulting rig availability, as well as weather, employee availability and related factors. The primary factors that have historically impacted, and will likely continue to impact, the aggregate number of well service rigs in our fleet during any specified period are the extent and timing of changes in the size of our well service rig fleet to meet short-term and expected long-term demand, and our ability to successfully maintain a fleet capable of ensuring sufficient, but not excess, rig availability to meet such demand.
36
Results of Operations
The
Year Ended December 31, 2019
compared to the
Year Ended December 31, 2018
The following table presents our results of operations for the year ended
December 31, 2019
as compared to the year ended
December 31, 2018
(in millions):
|
Year Ended December 31,
|
Variance
|
||||||||||||||
|
2019
|
2018
|
$
|
%
|
||||||||||||
|
Revenues
|
|||||||||||||||
|
High specification rigs
|
$
|
132.1
|
|
$
|
149.9
|
|
$
|
(17.8
|
)
|
(12
|
)%
|
||||
|
Completion and other services
|
184.3
|
|
136.0
|
|
48.3
|
|
36
|
%
|
|||||||
|
Processing solutions
|
20.5
|
|
17.2
|
|
3.3
|
|
19
|
%
|
|||||||
|
Total revenues
|
336.9
|
|
303.1
|
|
33.8
|
|
11
|
%
|
|||||||
|
Operating expenses
|
|||||||||||||||
|
Cost of services (exclusive of depreciation and amortization):
|
|||||||||||||||
|
High specification rigs
|
114.8
|
|
128.7
|
|
(13.9
|
)
|
(11
|
)%
|
|||||||
|
Completion and other services
|
139.0
|
|
100.2
|
|
38.8
|
|
39
|
%
|
|||||||
|
Processing solutions
|
9.2
|
|
8.0
|
|
1.2
|
|
15
|
%
|
|||||||
|
Total cost of services
|
263.0
|
|
236.9
|
|
26.1
|
|
11
|
%
|
|||||||
|
General and administrative
|
26.7
|
|
29.0
|
|
(2.3
|
)
|
(8
|
)%
|
|||||||
|
Depreciation and amortization
|
34.8
|
|
30.3
|
|
4.5
|
|
15
|
%
|
|||||||
|
Impairment of goodwill
|
—
|
|
9.0
|
|
(9.0
|
)
|
(100
|
)%
|
|||||||
|
Total operating expenses
|
324.5
|
|
305.2
|
|
19.3
|
|
6
|
%
|
|||||||
|
Operating income (loss)
|
12.4
|
|
(2.1
|
)
|
14.5
|
|
690
|
%
|
|||||||
|
Other expenses
|
|||||||||||||||
|
Interest expense, net
|
5.8
|
|
3.7
|
|
2.1
|
|
57
|
%
|
|||||||
|
Total other expenses
|
5.8
|
|
3.7
|
|
2.1
|
|
57
|
%
|
|||||||
|
Income (loss) before income tax expense
|
6.6
|
|
(5.8
|
)
|
12.4
|
|
214
|
%
|
|||||||
|
Income tax expense
|
2.2
|
|
—
|
|
2.2
|
|
100
|
%
|
|||||||
|
Net income (loss)
|
$
|
4.4
|
|
$
|
(5.8
|
)
|
$
|
10.2
|
|
176
|
%
|
||||
Revenues
. Revenues increased
$33.8 million
, or
11%
, to
$336.9 million
for the year ended
December 31, 2019
from
$303.1 million
for the year ended
December 31, 2018
. The change in revenues by segment was as follows:
High Specification Rigs.
High Specification Rig revenues decreased
$17.8 million
, or
12%
, to
$132.1 million
for the year ended
December 31, 2019
from
$149.9 million
for the year ended
December 31, 2018
. The decrease in rig services revenue was attributable to a 14% decline in total rig hours to 249,100 for the year ended
December 31, 2019
from 290,000 for the year ended
December 31, 2018
. The decline in total rig hours was partially offset by a 3% increase in the average revenue per rig hour
to
527
during
2019
compared to
512
during
2018
. The decrease is rig hours is primarily attributable to the decline in crude oil pricing.
Completion and Other Services.
Completion and Other Services revenues increased
$48.3 million
, or
36%
, to
$184.3 million
for the year ended
December 31, 2019
from
$136.0 million
for the year ended
December 31, 2018
. The increase is primarily attributable to our wireline business, which accounted for approximately $43.0 million, or 89%,
of the segment revenue
increase.
Our wireline business commenced operations during the fourth quarter of 2017 and we continued purchasing wireline units through 2018.
Processing Solutions.
Processing Solutions revenues increased
$3.3 million
, or
19%
, to
$20.5 million
for the year ended
December 31, 2019
from
$17.2 million
for the year ended
December 31, 2018
. The increase was primarily attributable to a 525% increase in gas coolers rented to 50 units as of
December 31, 2019
from eight units as of
December 31, 2018
. Additionally, there were increased revenues associated with our installation of MRUs and rentals of our generators and compressors.
Cost of services.
Cost of services increased
$26.1 million
, or
11%
, to
$263.0 million
for the year ended
December 31, 2019
from
$236.9 million
for the year ended
December 31, 2018
. As a percentage of revenue, cost of services was
78%
for both of the years ended
December 31, 2019
and
2018
. The change in cost of services by segment was as follows:
37
High Specification Rigs.
High Specification Rig cost of services decreased
$13.9 million
, or
11%
, to
$114.8 million
for the year ended
December 31, 2019
from
$128.7 million
for the year ended
December 31, 2018
. The decrease was primarily attributable to a reduction in variable expenses, notably employee costs and repair and maintenance costs, and corresponds with the decrease in rig hours and revenues.
Completion and Other Services.
Completion and Other Services cost of services increased
$38.8 million
, or
39%
, to
$139.0 million
for the year ended
December 31, 2019
from
$100.2 million
for the year ended
December 31, 2018
. The increase was primarily attributable to an increase in expenses related to employee costs, and corresponds with increased revenues associated with our wireline business.
Processing Solutions.
Processing Solutions cost of services increased
$1.2 million
, or
15%
, to
$9.2 million
for the year ended
December 31, 2019
from
$8.0 million
for the year ended
December 31, 2018
. The increase was primarily attributable to increases in installation and rental costs and corresponds with additional revenues.
General and administrative.
General and administrative expenses decreased
$2.3 million
, or
8%
, to
$26.7 million
for the year ended
December 31, 2019
from
$29.0 million
for the year ended
December 31, 2018
. The decrease in general and administrative expenses is primarily due to employee costs and professional fees.
Depreciation and amortization.
Depreciation and amortization increased
$4.5 million
, or
15%
, to
$34.8 million
for the year ended
December 31, 2019
from
$30.3 million
for the year ended
December 31, 2018
. The increase was attributable to depreciation expense related to a full year of depreciation expense for fixed assets placed into service during the year ended
December 31, 2018
, across all operating segments.
Interest expense, net.
Net interest expense increased
$2.1 million
, or
57%
, to
$5.8 million
for the year ended
December 31, 2019
from
$3.7 million
for the year ended
December 31, 2018
. The increase to net interest expense was primarily attributable to the Encina Master Financing Agreement (“Financing Agreement”).
Tax Expense.
Tax expense for the
year ended December 31, 2019
increase
d
$2.2 million
, or
100%
, to
$2.2 million
. The
increase
in tax expense was attributable to the utilization of pre-IPO net operating losses, primarily resulting in a non-cash income tax provision, in accordance with ASC 740-20-45-11(c),
for the
year ended December 31, 2019
.
Note Regarding Non‑GAAP Financial Measure
Adjusted EBITDA is not a financial measure determined in accordance with GAAP. We define Adjusted EBITDA as net income or loss before net interest expense, income tax provision or benefit, depreciation and amortization, equity‑based compensation, severance costs, impairment of goodwill and other non-cash and certain items that we do not view as indicative of our ongoing performance.
We believe Adjusted EBITDA is a useful performance measure because it allows for an effective evaluation of our operating performance when compared to our peers, without regard to our financing methods or capital structure. We exclude the items listed above from net income (loss) in arriving at Adjusted EBITDA because these amounts can vary substantially within our industry depending upon accounting methods, book values of assets, capital structures and the method by which the assets were acquired. Adjusted EBITDA should not be considered as an alternative to, or more meaningful than, net loss determined in accordance with GAAP. Certain items excluded from Adjusted EBITDA are significant components in understanding and assessing a company’s financial performance, such as a company’s cost of capital and tax structure, as well as the historic costs of depreciable assets, none of which are reflected in Adjusted EBITDA. Our presentation of Adjusted EBITDA should not be construed as an indication that our results will be unaffected by the items excluded from Adjusted EBITDA. Our computations of Adjusted EBITDA may not be identical to other similarly titled measures of other companies. The following table presents reconciliations of net income (loss), our most directly comparable financial measure calculated and presented in accordance with GAAP, to Adjusted EBITDA.
38
The Year Ended
December 31, 2019
compared to The Year Ended
December 31, 2018
|
Year Ended December 31, 2019
|
||||||||||||||||||||
|
High Specification Rigs
|
Completion and Other Services
|
Processing Solutions
|
Other
|
Total
|
||||||||||||||||
|
(in millions)
|
||||||||||||||||||||
|
Net income (loss)
|
$
|
(2.8
|
)
|
$
|
33.9
|
|
$
|
9.1
|
|
$
|
(35.8
|
)
|
$
|
4.4
|
|
|||||
|
Interest expense, net
|
—
|
|
—
|
|
—
|
|
5.8
|
|
5.8
|
|
||||||||||
|
Income tax expense
|
—
|
|
—
|
|
—
|
|
2.2
|
|
2.2
|
|
||||||||||
|
Depreciation and amortization
|
20.1
|
|
11.4
|
|
2.2
|
|
1.1
|
|
34.8
|
|
||||||||||
|
Equity based compensation
|
—
|
|
—
|
|
—
|
|
3.3
|
|
3.3
|
|
||||||||||
|
Severance costs
|
0.1
|
|
—
|
|
—
|
|
—
|
|
0.1
|
|
||||||||||
|
Impairment of goodwill
|
—
|
|
—
|
|
—
|
|
—
|
|
—
|
|
||||||||||
|
Loss on disposal of property and equipment
|
—
|
|
—
|
|
—
|
|
0.2
|
|
0.2
|
|
||||||||||
|
Adjusted EBITDA
|
$
|
17.4
|
|
$
|
45.3
|
|
$
|
11.3
|
|
$
|
(23.2
|
)
|
$
|
50.8
|
|
|||||
|
Year Ended December 31, 2018
|
||||||||||||||||||||
|
High Specification Rigs
|
Completion and Other Services
|
Processing Solutions
|
Other
|
Total
|
||||||||||||||||
|
(in millions)
|
||||||||||||||||||||
|
Net income (loss)
|
$
|
(6.9
|
)
|
$
|
27.6
|
|
$
|
7.7
|
|
$
|
(34.2
|
)
|
$
|
(5.8
|
)
|
|||||
|
Interest expense, net
|
—
|
|
—
|
|
—
|
|
3.7
|
|
3.7
|
|
||||||||||
|
Income tax expense
|
—
|
|
—
|
|
—
|
|
—
|
|
—
|
|
||||||||||
|
Depreciation and amortization
|
19.1
|
|
8.2
|
|
1.5
|
|
1.5
|
|
30.3
|
|
||||||||||
|
Equity based compensation
|
—
|
|
—
|
|
—
|
|
2.1
|
|
2.1
|
|
||||||||||
|
Severance costs
|
0.7
|
|
—
|
|
—
|
|
0.4
|
|
1.1
|
|
||||||||||
|
Impairment of goodwill
|
9.0
|
|
—
|
|
—
|
|
—
|
|
9.0
|
|
||||||||||
|
Loss on disposal of property and equipment
|
0.7
|
|
—
|
|
—
|
|
—
|
|
0.7
|
|
||||||||||
|
Adjusted EBITDA
|
$
|
22.6
|
|
$
|
35.8
|
|
$
|
9.2
|
|
$
|
(26.5
|
)
|
$
|
41.1
|
|
|||||
|
$ Variance
|
||||||||||||||||||||
|
High Specification Rigs
|
Completion and Other Services
|
Processing Solutions
|
Other
|
Total
|
||||||||||||||||
|
(in millions)
|
||||||||||||||||||||
|
Net income (loss)
|
$
|
4.1
|
|
$
|
6.3
|
|
$
|
1.4
|
|
$
|
(1.6
|
)
|
$
|
10.2
|
|
|||||
|
Interest expense, net
|
—
|
|
—
|
|
—
|
|
2.1
|
|
2.1
|
|
||||||||||
|
Income tax expense
|
—
|
|
—
|
|
—
|
|
2.2
|
|
2.2
|
|
||||||||||
|
Depreciation and amortization
|
1.0
|
|
3.2
|
|
0.7
|
|
(0.4
|
)
|
4.5
|
|
||||||||||
|
Equity based compensation
|
—
|
|
—
|
|
—
|
|
1.2
|
|
1.2
|
|
||||||||||
|
Severance costs
|
(0.6
|
)
|
—
|
|
—
|
|
(0.4
|
)
|
(1.0
|
)
|
||||||||||
|
Impairment of goodwill
|
(9.0
|
)
|
—
|
|
—
|
|
—
|
|
(9.0
|
)
|
||||||||||
|
Loss on disposal of property and equipment
|
(0.7
|
)
|
—
|
|
—
|
|
0.2
|
|
(0.5
|
)
|
||||||||||
|
Adjusted EBITDA
|
$
|
(5.2
|
)
|
$
|
9.5
|
|
$
|
2.1
|
|
$
|
3.3
|
|
$
|
9.7
|
|
|||||
Adjusted EBITDA for the year ended
December 31, 2019
increased
$9.7 million
to
$50.8 million
from
$41.1 million
for the year ended
December 31, 2018
. The change by segment was as follows:
High Specification Rigs.
High Specification Rigs Adjusted EBITDA decreased
$5.2 million
to
$17.4 million
from
$22.6 million
primarily due to a decrease in revenues of
$17.8 million
partially offset by a corresponding decrease in cost of services of
$13.9 million
.
39
Completion and Other Services.
Completion and Other Services Adjusted EBITDA increased
$9.5 million
to
$45.3 million
from
$35.8 million
due to an increase in revenues of
$48.3 million
partially offset by a corresponding increase in cost of services of
$38.8 million
.
Processing Solutions.
Processing Solutions Adjusted EBITDA increased
$2.1 million
to
$11.3 million
from
$9.2 million
due to an increase in revenue of
$3.3 million
partially offset by a corresponding increase in cost of services of
$1.2 million
.
Other.
Other
Adjusted EBITDA increased for the year ended
December 31, 2019
to a loss of
$23.2 million
from a loss
$26.5 million
due to decreased general and administrative expenses, which was related to a reduction of employee costs and professional fees. The balances included in Other reflect the general and administrative costs, interest expense, net and tax expense or benefit not directly attributable to any of our Segments.
Liquidity and Capital Resources
Overview
We require capital to fund ongoing operations, including maintenance expenditures on our existing fleet and equipment, organic growth initiatives, investments and acquisitions. Our primary sources of liquidity have been cash generated from operations and borrowings under our Credit Facility. We expect our future source of liquidity will primarily be cash generated from operations. We strive to maintain financial flexibility and proactively monitor potential capital sources to meet our investment and target liquidity requirements and to permit us to manage the cyclicality associated with our business.
As of
December 31, 2019
, we had total liquidity of $80.2 million, consisting of
$6.9 million
of cash on hand, operating cash flows of
$51.9 million
and availability under our Revolving Credit Facility of
$20.5 million
. We therefore expect to have sufficient funds to meet the Company’s liquidity requirements for at least the next 12 months.
Cash Flows
The following table presents our cash flows for the periods indicated:
|
|
Year Ended December 31,
|
Variance
|
|||||||||||||
|
|
2019
|
2018
|
$
|
%
|
|||||||||||
|
|
(in millions)
|
||||||||||||||
|
Net cash flows provided by operating activities
|
$
|
51.9
|
|
$
|
27.6
|
|
$
|
24.3
|
|
88
|
%
|
||||
|
Net cash flows used in investing activities
|
(23.4
|
)
|
(74.4
|
)
|
51.0
|
|
69
|
%
|
|||||||
|
Net cash flows (used in) provided by financing activities
|
(24.2
|
)
|
44.1
|
|
(68.3
|
)
|
(155
|
)%
|
|||||||
|
Net change in cash
|
$
|
4.3
|
|
$
|
(2.7
|
)
|
$
|
7.0
|
|
259
|
%
|
||||
Operating Activities
Net cash provided by operating activities increased
$24.3 million
to
$51.9 million
for the year ended
December 31, 2019
compared to
$27.6 million
for the year ended
December 31, 2018
. The increase in cash flows provided by operating activities is attributable to an increase in working capital cash provided by operating activities to
$7.4 million
during 2019 from working capital cash used of
$7.2 million
from 2018, and increased operating income for our Completion and Other Services and Processing Solutions segments. These increases were partially offset by a decrease in operating income from our High Specification Rig segment during the year ended
December 31, 2018
.
Investing Activities
Net cash used in investing activities decreased
$51.0 million
to a use of
$23.4 million
for the year ended
December 31, 2019
compared to
$74.4 million
for the year ended
December 31, 2018
. The decrease in cash flows used in investing activities is attributable to fixed assets purchased during the year ended
December 31, 2018
, where such assets were financed through our Credit Facility and Financing Agreement.
Financing Activities
Net cash used in financing activities increased
$68.3 million
to a use of
$24.2 million
for the year ended
December 31, 2019
compared to cash provided by financing activities of
$44.1 million
for the year ended
December 31, 2018
. The increase in cash flows used in financing activities is attributable to increased payments and decreased borrowings on our financing arrangements during the year ended December 31, 2019. During the year ended December 31, 2018, we utilized our financing arrangements to purchase fixed assets.
40
Supplemental Cash Flow Disclosures
We added assets of
$2.9 million
that were non-cash additions in the
year ended December 31, 2019
and purchased
$2.4 million
in finance leased assets. As of January 1, 2019, we added right of use (“ROU”) assets and liabilities of
$8.3 million
related to the adoption of Accounting Standards Codification (“ASC”) 842. See “Part II, Item 8. Financial Statements and Supplementary Data—
Note 2 — Summary of Significant Accounting Policies
” for more information related to the adoption of ASC 842. Also, we settled a $3.0 million liability by issuing Class A Common Stock to a related party.
Working Capital
Our working capital, which we define as total current assets less total current liabilities, was
$3.6 million
and
$2.2 million
at
December 31, 2019
and
2018
, respectively.
Our Debt Agreements
ESCO Notes Payable
In August 2017, we issued
$7.0 million
of seller’s notes as partial consideration for the acquisition of ESCO Leasing, LLC (“ESCO”). These notes included a note for
$1.2 million
, which was paid in
August 2018
and a note for
$5.8 million
, which was due in February 2019. The notes bore interest at
5.0%
payable quarterly until their respective maturity dates.
During the year ended
December 31, 2018
, we provided notice to ESCO that we are seeking to be indemnified for breach of contract. We exercised the right to stop payments of the remaining principal balance of
$5.8 million
on the Seller’s Notes and any unpaid interest, pending resolution of certain indemnification claims. Interest on the outstanding principal balance was accrued through the maturity date of the Note Payable.
Credit Facility
In August 2017, we entered into a
$50.0 million
Credit Facility by and among certain of Ranger’s subsidiaries, as borrowers, each of the lenders’ party thereto and Wells Fargo Bank, N.A., as administrative agent. The Credit Facility is subject to a borrowing base that is calculated based upon a percentage of the value of our eligible accounts receivable less certain reserves. The Credit Facility is scheduled to mature in August 2022.
The applicable margin for LIBOR loans ranges from
1.50%
to
2.0%
and the applicable margin for Base Rate loans ranges from
0.5%
to
1.0%
, in each case, depending on our average excess availability under the Credit Facility. The applicable margin for the LIBOR loan was
1.8%
as of
December 31, 2019
. As of
December 31, 2019
the Credit Facility had an interest rate of 3.5%.
As of
December 31, 2019
, under the Credit facility, we borrowed
$10.0 million
, with a borrowing capacity of
$30.5 million
, with a residual
$20.5 million
available for borrowing. We are in compliance with the Credit Facility covenants as of
December 31, 2019
. We capitalized fees of
$0.7 million
associated with the Credit Facility and will be amortized through maturity. Unamortized debt issuance costs as of
December 31, 2019
approximated
$0.5 million
.
In addition, the Credit Facility restricts our ability to make distributions on, or redeem or repurchase, our equity interests, except for certain distributions, including distributions of cash so long as, both at the time of the distribution and after giving effect to the distribution, no default exists under the Credit Facility and either (a) excess availability at all times during the preceding 90 consecutive days, on a pro forma basis and after giving effect to such distribution, is not less than the greater of (1) 22.5% of the lesser of (A) the maximum revolver amount and (B) the then-effective borrowing base and (2) $10.0 million or (b) if our fixed charge coverage ratio is at least 1.0x on a pro forma basis, excess availability at all times during the preceding 90 consecutive days, on a pro forma basis and after giving effect to such distribution, is not less than the greater of (1) 17.5% of the lesser of (A) the maximum revolver amount and (B) the then-effective borrowing base and (2) $7.0 million. If the foregoing threshold under clause (b) is met, we may not make such distributions (but may make certain other distributions, including under clause (a) above) prior to the earlier of the date that is (a) 12 months from closing or (b) the date that our fixed charge coverage ratio is at least 1.0x for two consecutive quarters. Our Credit Facility generally permits us to make distributions required under the TRA, but a ‘‘Change of Control’’ under the TRA constitutes an event of default under our Credit Facility, and our Credit Facility does not permit us to make payments under the TRA upon acceleration of our obligations thereunder unless no event of default exists or would result therefrom and we have been in compliance with the fixed charge coverage ratio for the most recent 12-month period on a pro forma basis. Our Credit Facility also requires us to maintain a fixed charge coverage ratio of at least 1.0x if our liquidity is less than $10.0 million until our liquidity is at least $10.0 million for 30 consecutive days. We are not subject to a fixed charge coverage ratio if we have no drawings under the Credit Facility and have at least $20.0 million of qualified cash.
41
The Credit Facility contains events of default customary for facilities of this nature, including, but not limited, to:
|
•
|
events of default resulting from our failure or the failure of any guarantors to comply with covenants and financial ratios;
|
|
•
|
the occurrence of a change of control;
|
|
•
|
the institution of insolvency or similar proceedings against us or any guarantor; and
|
|
•
|
the occurrence of a default under any other material indebtedness we or any guarantor may have.
|
Upon the occurrence and during the continuation of an event of default, subject to the terms and conditions of the Credit Facility, the lenders are able to declare any outstanding principal of our Credit Facility debt, together with accrued and unpaid interest, to be immediately due and payable and exercise other remedies.
Encina Master Financing and Security Agreement
In June 2018, the Company entered into a master financing and security agreement with Encina Equipment Finance SPV, LLC (the “Lender”) (“Financing Agreement”). The amount available to be provided by the Lender to the Company under the Financing Agreement was contemplated to be not less than
$35.0 million
, and not to exceed
$40.0 million
. The first financing was required to be in an amount up to
$22.0 million
, which was used by the Company to acquire certain capital equipment. Subsequent to the first financing, the Company borrowed an additional
$17.8 million
, net of expenses and in two tranches, under the Financing Agreement. As of
December 31, 2019
, the aggregate principal balance outstanding was
$27.7 million
under the Financing Agreement. The total borrowings under the Financing Agreement were borrowed in three tranches, where the amounts outstanding are payable ratably over
48 months
from the time of each borrowing. The three tranches mature in
July 2022
, November 2022 and January 2023. The Financing Agreement is secured by a lien on certain high specification rig assets.
Borrowings under the Financing Agreement bear interest at a rate per annum equal to the sum of
8.0%
plus the London Interbank Offered Rate (“LIBOR”), which was
1.8%
as of
December 31, 2019
. The Financing Agreement requires that the Company maintain leverage ratios of
2.50
to
1.00
. The Company was in compliance with the covenants under the Financing Agreement as of
December 31, 2019
.
The Company capitalized fees of
$0.9 million
associated with the Financing Agreement, which are included on the Consolidated Balance Sheets as a discount to the long term debt and will be amortized through maturity. Unamortized debt issuance costs as of
December 31, 2019
approximated
$0.6 million
.
Contractual and Commercial Commitments
The following table summarizes our contractual obligations and commercial commitments as of
December 31, 2019
:
|
Total
|
Less than
1 year
|
1 - 3 years
|
3 - 5 years
|
More than
5 years
|
||||||||||||||||
|
(in millions)
|
||||||||||||||||||||
|
Debt obligations
(1)
|
$
|
47.8
|
|
$
|
18.3
|
|
$
|
29.5
|
|
$
|
—
|
|
$
|
—
|
|
|||||
|
Finance lease obligations
(1)
|
9.3
|
|
5.5
|
|
3.6
|
|
0.2
|
|
—
|
|
||||||||||
|
Operating lease obligations
(2)
|
8.8
|
|
2.8
|
|
2.0
|
|
1.6
|
|
2.4
|
|
||||||||||
|
Total
|
$
|
65.9
|
|
$
|
26.6
|
|
$
|
35.1
|
|
$
|
1.8
|
|
$
|
2.4
|
|
|||||
_________________________
|
(1)
|
Debt and finance lease obligations include interest to be paid in future periods.
|
|
(2)
|
In addition to our right-of-use asset obligation, the operating leases include our obligations for contracts with terms of less than 12 months. The table above does not include any obligations related to certain of our office, yard and other various leases set to expire, that are more likely than not to be renewed, during the year ending December 31, 2020.
|
42
Tax Receivable Agreement
With respect to obligations we expect to incur under our TRA (except in cases where we elect to terminate the TRA early, the TRA is terminated early due to certain mergers, asset sales, other forms of business combinations or other changes of control or we have available cash but fail to make payments when due), generally we may elect to defer payments due under the TRA if we do not have available cash to satisfy our payment obligations under the TRA or if our contractual obligations limit our ability to make these payments. Any such deferred payments under the TRA generally will accrue interest. In certain cases, payments under the TRA may be accelerated and/or significantly exceed the actual benefits, if any, we realize in respect of the tax attributes subject to the TRA. We intend to account for any amounts payable under the TRA in accordance with ASC 450, Contingencies. Further, we intend to account for the effect of increases in tax basis and payments for such increases under the TRA arising from future redemptions as follows:
|
•
|
when future sales or redemptions occur, we will record a deferred tax asset for the gross amount of the income tax effect along with an offset of 85% of this as a liability payable under the TRA; the remaining difference between the deferred tax asset and tax receivable agreement liability will be recorded as additional paid‑in capital; and
|
|
•
|
to the extent we have recorded a deferred tax asset for an increase in tax basis to which a benefit is no longer expected to be realized due to lower future taxable income, we will reduce the deferred tax asset with a valuation allowance.
|
Critical Accounting Policies and Estimates
Our financial statements are prepared in accordance with GAAP. In connection with preparing our financial statements, we are required to make assumptions and estimates about future events, and apply judgments that affect the reported amounts of assets, liabilities, revenue, expense and the related disclosures. We base our assumptions, estimates and judgments on historical experience, current trends and other factors that management believes to be relevant at the time we prepare our consolidated financial statements. On a regular basis, management reviews the accounting policies, assumptions, estimates and judgments to ensure that our consolidated financial statements are presented fairly and in accordance with GAAP. However, because future events and their effects cannot be determined with certainty, actual results could differ materially from our assumptions and estimates.
Our significant accounting policies are discussed in our audited consolidated financial statements included elsewhere in this Annual Report. Management believes that the following accounting estimates are those most critical to fully understanding and evaluating our reported financial results, and they require management’s most difficult, subjective or complex judgments, resulting from the need to make estimates about the effect of matters that are inherently uncertain.
Property and Equipment
Policy description
Property and equipment is stated at cost or estimated fair market value at the acquisition date less accumulated depreciation. Depreciation is charged to expense on the straight‑line basis over the estimated useful life of each asset, with estimated useful lives reviewed by management on an annual basis. Expenditures for major renewals and betterments are capitalized while expenditures for maintenance and repairs are charged to expenses as incurred. Assets under capital lease obligations and leasehold improvements are amortized over the shorter of the lease term or their respective estimated useful lives. Depreciation does not begin until property and equipment is placed in service. Once placed in service, depreciation on property and equipment continues while being repaired, refurbished or between periods of deployment.
Judgments and assumptions
Accounting for our property and equipment requires us to estimate the expected useful lives of our fleet and related equipment and any related salvage value. The range of estimated useful lives is based on overall size and specifications of the fleet, expected utilization along with continuous repairs and maintenance that may or may not extend the estimated useful lives. To the extent the expenditures extends the expected useful life, these expenditures are capitalized and depreciated over the extended useful life.
Long‑lived Asset Impairment
Policy description
We evaluate the recoverability of the carrying value of long‑lived assets, including property and equipment and intangible assets, whenever events or circumstances indicate the carrying amount may not be recoverable. If a long‑lived asset is tested for recoverability and the undiscounted estimated future cash flows expected to result from the use and eventual disposition of the asset is less than the carrying amount of the asset, the asset cost is adjusted to fair value and an impairment loss is recognized as the amount by which the carrying amount of a long‑lived asset exceeds its fair value.
43
Judgments and assumptions
Our impairment analysis requires us to apply judgment in identifying impairment indicators and estimating future undiscounted cash flows of our fleets. If actual results are not consistent with our assumptions and estimates or our assumptions and estimates change due to new information, we may be exposed to an impairment charge. Key assumptions used to determine the undiscounted future cash flows include estimates of future fleet utilization and demands based on our assumptions around future commodity prices and capital expenditures of our customers.
Revenue Recognition
Policy description
Effective January 1, 2018, the Company adopted ASC Revenue from Contracts with Customers (“ASC 606”), using the modified retrospective method. This standard applies to all contracts with customers, except for contracts that are within the scope of other standards, such as leases, insurance, collaborative arrangements and financial instruments. Under ASC 606, an entity recognizes revenue when it transfers control of the promised goods or services to its customer, in an amount that reflects the consideration which the entity expects to receive in exchange for those goods or services. If control transfers to the customer over time, an entity selects a method to measure progress that is consistent with the objective of depicting its performance. The provisions of ASC 606 were applied to contracts not completed at January 1, 2018. There was no impact upon adoption of ASC 606. As a result, no disclosure of the impact for each financial statement line items is applicable.
In determining the appropriate amount of revenue to be recognized as the Company fulfills the obligations under its contracts with customers, the following steps must be performed at contract inception: (i) identification of the promised goods or services in the contract; (ii) determination of whether the promised goods or services are performance obligations, including whether they are distinct in the context of the contract; (iii) measurement of the transaction price, including the constraint on variable consideration; (iv) allocation of the transaction price to the performance obligations and (v) recognition of revenue when (or as) the Company satisfies each performance obligation.
We satisfy our performance obligation over time as the services are performed. The Company believes the output method is a reasonable measure of progress for the satisfaction of our performance obligations, which are satisfied over time, as it provides a faithful depiction of (i) our performance toward complete satisfaction of the performance obligation under the contract and (ii) the value transferred to the customer of the services performed under the contract. The Company has elected the right to invoice practical expedient for recognizing revenue. The Company invoices customers upon completion of the specified services and collection generally occurs within the payment terms agreed with customers. Accordingly, there is no financing component to our arrangements with customers.
Judgments and assumptions
Recording revenue involves the use of estimates and management judgment. We must make a determination at the time our services are provided whether the customer has the ability to make payments to us. While we do utilize past payment history, and, to the extent available for new customers, public credit information in making our assessment, the determination of whether collection of the consideration is probable is ultimately a judgment decision that must be made by management. We have disaggregated revenue and disclosed such disaggregation in a manner that is consistent with our reporting segments and further disaggregation is not considered to be useful to investors in understanding or assessing the results of operations or business.
Income Taxes
Policy description
The Company provides for income tax expense based on the liability method of accounting for income taxes. Deferred tax assets and liabilities are recorded based upon differences between the tax basis of assets and liabilities and their carrying values for financial reporting purposes and are measured using the enacted tax rates and laws that will be in effect when the differences are expected to reverse. A valuation allowance is established when it is more likely than not that some portion or all of the deferred tax assets will not be realized.
We currently believe that it is reasonably possible for us to achieve a three-year cumulative level of profitability within the next 12 months, and as early as the
first quarter of 2020
, which would enhance our ability to conclude that it is more likely than not that the deferred tax assets would be realized and support a release of a portion or substantially all of the valuation allowance. A release of the valuation allowance would result in the recognition of an increase in deferred tax assets and an income tax benefit in the period in which the release occurs, although the exact timing and amount of the release is subject to change based on numerous factors, including our projections of future taxable income, which we continue to assess based on available information each reporting period.
Judgments and assumptions
The establishment of a valuation allowance requires significant judgment and is impacted by various estimates. Both positive and negative evidence, as well as the objectivity and verifiability of that evidence, is considered in determining the
44
appropriateness of recording a valuation allowance on deferred tax assets. Under GAAP, the valuation allowance is recorded to reduce the Company’s deferred tax assets to an amount that is more likely than not to be realized and is based upon the uncertainty of the realization of certain federal and state deferred tax assets related to net operating loss carryforwards and other tax attributes.
Equity‑Based Compensation
Policy description
We record equity‑based payments at fair value on the date of the grant, and expense the value of these awards in compensation expense over the applicable vesting periods.
Judgments and assumptions
We estimate the fair value of our equity‑based compensation using an option pricing model that includes certain assumptions, such as volatility, dividend yield and risk free interest rate. Changes in these assumptions could change the fair value of our unit based awards and associated compensation expense in our consolidated statements of operations.
Recent Accounting Pronouncements
For information regarding new accounting policies or updates to existing accounting policies as a result of new accounting pronouncements, please refer to
Recent Accounting Pronouncements included in “Item 8. Financial Statements and Supplementary Data—
Note 2 — Summary of Significant Accounting Policies
.”
Off‑Balance Sheet Arrangements
We currently have no off‑balance sheet arrangements that have or are reasonably likely to have a current or future effect on our financial condition, changes in financial condition, revenues or expenses, results of operations, liquidity, capital expenditures or capital resources that is material to investors.
Jumpstart Our Business Act of 2012
We are an “emerging growth company” as defined in the JOBS Act. We will remain an emerging growth company until the earlier of (1) the last day of our fiscal year (a) following the fifth anniversary of the completion of the Offering, (b) in which we have total annual gross revenue of at least $1.07 billion, or (c) in which we are deemed to be a large accelerated filer, which means the market value of our common stock that is held by non-affiliates exceeds $700.0 million as of the last business day of our most recently completed second fiscal quarter, and (2) the date on which we have issued more than $1.0 billion in non-convertible debt securities during the prior three-year period. An emerging growth company may take advantage of specified reduced reporting and other burdens that are otherwise applicable generally to public companies. We have irrevocably opted out of the extended transition period and, as a result, we will adopt new or revised accounting standards on the relevant dates on which adoption of such standards is required for other public companies.
Item 7A. Quantitative and Qualitative Disclosures about Market Risks
The demand, pricing and terms for oil and natural gas services provided by us are largely dependent upon the level of activity for the U.S. oil and natural gas industry. Industry conditions are influenced by numerous factors over which we have no control, including, but not limited to: the supply of and demand for oil and natural gas; the level of prices, and expectations about future prices of oil and natural gas; the cost of exploring for, developing, producing and delivering oil and natural gas; the expected rates of declining current production; the discovery rates of new oil and natural gas reserves; available pipeline and other transportation capacity; weather conditions; domestic and worldwide economic conditions; political instability in oil‑producing countries; environmental regulations; technical advances affecting energy consumption; the price and availability of alternative fuels; the ability of oil and natural gas producers to raise equity capital and debt financing; and merger and divestiture activity among oil and natural gas producers.
Interest Rate Risk
We are exposed to interest rate risk, primarily associated with our Credit Facility and Financing Agreement. We had an aggregate of
$5.8 million
outstanding under notes payable from the ESCO acquisition as of
December 31, 2019
, with an interest rate of
5.0%
. In addition, as of
December 31, 2019
, we had
$10.0 million
outstanding under our Credit Facility, with an interest rate of
3.5%
. As of
December 31, 2019
, the aggregate principal balance outstanding was
$27.7 million
under the Financing Agreement, with an interest rate of 9.7%. A 1.0% increase or decrease in the weighted average interest rate would increase or decrease our interest expense by approximately $0.4 million annually. We do not currently hedge our interest rate exposure.
During 2017, policymakers announced that LIBOR will cease subsequent to 2021 and alternative reference rates (“ARRs”) are being developed to replace current LIBOR. In the United States, the Alternative Rates Committee selected the Secured Overnight Financing Rate (“SOFR”) as the preferred alternative reference rate to the US dollar LIBOR. ARRs are structured
45
differently than LIBOR rates, as they are a backward-looking overnight rate. Additionally, SOFR will be based on overnight Treasury General Collateral repossession rates, whereas LIBOR is based on unsecured transactions. We will monitor the continuous emergence of SOFR, as it could adversely impact our interest rate risk and therefore the amount of interest we pay on certain of our liabilities currently measured at LIBOR.
Credit Risk
The majority of our trade receivables have payment terms of 30 days or less. As of
December 31, 2019
, the top three trade receivable balances represented 12%, 8% and 7%, respectively, of consolidated accounts receivable. Within our High Specification Rig segment, the top three trade receivable balances represented 14%, 8% and 7%, respectively, of total High Specification Rig accounts receivable. Within our Completion and Other Services segment, the top three trade receivable balances represented 21%, 18% and 13%, respectively, of total Completion Services accounts receivable. Within our Processing Solutions segment, the top three trade receivable balances represented 26%, 21% and 20%, respectively, of total Processing Solutions accounts receivable. We mitigate the associated credit risk by performing credit evaluations and monitoring the payment patterns of our customers.
Commodity Price Risk
The market for our services is indirectly exposed to fluctuations in the prices of oil and natural gas to the extent such fluctuations impact the activity levels of our E&P customers. Any prolonged substantial reduction in oil and natural gas prices would likely affect oil and natural gas production levels and therefore affect demand for our services. We do not currently intend to hedge our indirect exposure to commodity price risk.
46
Item 8. Financial Statements and Supplementary Data
RANGER ENERGY SERVICES, INC.
INDEX TO CONSOLIDATED FINANCIAL STATEMENTS
|
Page
|
||
47
Report of Independent Registered Public Accounting Firm
To the Board of Directors and the Shareholders of
Ranger Energy Services, Inc.
Opinion on the Consolidated Financial Statements
We have audited the accompanying consolidated balance sheets of Ranger Energy Services, Inc. and its subsidiaries (collectively, the “Company”) as of
December 31, 2019
and
2018
, and the related consolidated statements of operations, stockholders’ equity, and cash flows for the years then ended and the related notes (collectively referred to as the “consolidated financial statements”). In our opinion, the consolidated financial statements present fairly, in all material respects, the financial position of the Company as of
December 31, 2019
and
2018
, and the results of their operations and their cash flows for the years then ended, in conformity with accounting principles generally accepted in the United States of America.
Change in Accounting Principle
As discussed in Note 2 to the consolidated financial statements, the Company has changed its method of accounting for leases during the year ended December 31, 2019, due to the adoption of Accounting Standards Codification Topic 842,
Leases
.
Basis for Opinion
These consolidated financial statements are the responsibility of the Company’s management. Our responsibility is to express an opinion on the Company’s consolidated financial statements based on our audits. We are a public accounting firm registered with the Public Company Accounting Oversight Board (United States) (“PCAOB”) and are required to be independent with respect to the Company in accordance with the U.S. federal securities laws and the applicable rules and regulations of the Securities and Exchange Commission and the PCAOB.
We conducted our audits in accordance with the standards of the PCAOB. Those standards require that we plan and perform the audit to obtain reasonable assurance about whether the consolidated financial statements are free of material misstatement, whether due to error or fraud. The Company is not required to have, nor were we engaged to perform an audit of internal control over financial reporting. As part of our audits we are required to obtain an understanding of internal controls over financial reporting but not for the purpose of expressing an opinion on the effectiveness of the Company’s internal control over financial reporting. Accordingly, we express no such opinion.
Our audits included performing procedures to assess the risks of material misstatement of the consolidated financial statements, whether due to error or fraud, and performing procedures that respond to those risks. Such procedures included examining, on a test basis, evidence regarding the amounts and disclosures in the consolidated financial statements. Our audits also included evaluating the accounting principles used and significant estimates made by management, as well as evaluating the overall presentation of the consolidated financial statements.
We believe that our audits and the report of the other auditors provide a reasonable basis for our opinion.
/s/ BDO USA, LLP
We have served as the Company’s auditor since 2016.
Houston, Texas
February 28, 2020
48
RANGER ENERGY SERVICES, INC.
CONSOLIDATED BALANCE SHEETS
(in millions, except share and per share amounts)
|
December 31,
|
||||||||
|
2019
|
2018
|
|||||||
|
Assets
|
||||||||
|
Current assets
|
||||||||
|
Cash and cash equivalents
|
$
|
6.9
|
|
$
|
2.6
|
|
||
|
Accounts receivable, net
|
41.5
|
|
45.4
|
|
||||
|
Contract assets
|
1.2
|
|
3.1
|
|
||||
|
Inventory
|
3.8
|
|
4.9
|
|
||||
|
Prepaid expenses
|
5.3
|
|
5.1
|
|
||||
|
Total current assets
|
58.7
|
|
61.1
|
|
||||
|
Property and equipment, net
|
218.9
|
|
229.8
|
|
||||
|
Intangible assets, net
|
9.3
|
|
10.0
|
|
||||
|
Operating lease right-of-use assets
|
6.5
|
|
—
|
|
||||
|
Other assets
|
0.1
|
|
1.6
|
|
||||
|
Total assets
|
$
|
293.5
|
|
$
|
302.5
|
|
||
|
Liabilities and Stockholders' Equity
|
||||||||
|
Current liabilities
|
||||||||
|
Accounts payable
|
$
|
13.8
|
|
$
|
17.2
|
|
||
|
Accrued expenses
|
18.4
|
|
18.5
|
|
||||
|
Finance lease obligations, current portion
|
5.1
|
|
4.4
|
|
||||
|
Long-term debt, current portion
|
15.8
|
|
15.8
|
|
||||
|
Other current liabilities
|
2.0
|
|
3.0
|
|
||||
|
Total current liabilities
|
55.1
|
|
58.9
|
|
||||
|
Operating lease right-of-use obligations
|
4.5
|
|
—
|
|
||||
|
Finance lease obligations
|
3.6
|
|
6.6
|
|
||||
|
Long-term debt, net
|
26.6
|
|
44.7
|
|
||||
|
Other long-term liabilities
|
0.7
|
|
0.3
|
|
||||
|
Total liabilities
|
$
|
90.5
|
|
$
|
110.5
|
|
||
|
Commitments and contingencies (Note 13)
|
|
|
|
|
||||
|
Stockholders' equity
|
||||||||
|
Preferred stock, $0.01 per share; 50,000,000 shares authorized; no shares issued or outstanding as of December 31, 2019 and December 31, 2018
|
—
|
|
—
|
|
||||
|
Class A Common Stock, $0.01 par value, 100,000,000 shares authorized; 8,839,788 shares issued and 8,725,851 shares outstanding as of December 31, 2019; 8,448,527 shares issued and outstanding as of December 31, 2018
|
0.1
|
|
0.1
|
|
||||
|
Class B Common Stock, $0.01 par value, 100,000,000 shares authorized; 6,866,154 shares issued and outstanding as of December 31, 2019 and December 31, 2018
|
0.1
|
|
0.1
|
|
||||
|
Less: Class A Common Stock held in treasury, at cost (113,937 shares)
|
(0.7
|
)
|
—
|
|
||||
|
Accumulated deficit
|
(8.1
|
)
|
(9.9
|
)
|
||||
|
Additional paid-in capital
|
121.8
|
|
111.6
|
|
||||
|
Total controlling interest stockholders' equity
|
113.2
|
|
101.9
|
|
||||
|
Non-controlling interest
|
89.8
|
|
90.1
|
|
||||
|
Total stockholders' equity
|
203.0
|
|
192.0
|
|
||||
|
Total liabilities and stockholders' equity
|
$
|
293.5
|
|
$
|
302.5
|
|
||
The accompanying notes are an integral part of these consolidated financial statements.
49
RANGER ENERGY SERVICES, INC.
CONSOLIDATED STATEMENTS OF OPERATIONS
(in millions, except share and per share amounts)
|
Years Ended December 31,
|
||||||||
|
2019
|
2018
|
|||||||
|
Revenues
|
||||||||
|
High specification rigs
|
$
|
132.1
|
|
$
|
149.9
|
|
||
|
Completion and other services
|
184.3
|
|
136.0
|
|
||||
|
Processing solutions
|
20.5
|
|
17.2
|
|
||||
|
Total revenues
|
336.9
|
|
303.1
|
|
||||
|
Operating expenses
|
||||||||
|
Cost of services (exclusive of depreciation and amortization):
|
||||||||
|
High specification rigs
|
114.8
|
|
128.7
|
|
||||
|
Completion and other services
|
139.0
|
|
100.2
|
|
||||
|
Processing solutions
|
9.2
|
|
8.0
|
|
||||
|
Total cost of services
|
263.0
|
|
236.9
|
|
||||
|
General and administrative
|
26.7
|
|
29.0
|
|
||||
|
Depreciation and amortization
|
34.8
|
|
30.3
|
|
||||
|
Impairment of goodwill
|
—
|
|
9.0
|
|
||||
|
Total operating expenses
|
324.5
|
|
305.2
|
|
||||
|
Operating income (loss)
|
12.4
|
|
(2.1
|
)
|
||||
|
Other expenses
|
||||||||
|
Interest expense, net
|
5.8
|
|
3.7
|
|
||||
|
Total other expenses
|
5.8
|
|
3.7
|
|
||||
|
Income (loss) before income tax expense
|
6.6
|
|
(5.8
|
)
|
||||
|
Income tax expense
|
2.2
|
|
—
|
|
||||
|
Net income (loss)
|
4.4
|
|
(5.8
|
)
|
||||
|
Less: Net income (loss) attributable to non-controlling interests
|
2.6
|
|
(2.5
|
)
|
||||
|
Net income (loss) attributable to Ranger Energy Services, Inc.
|
$
|
1.8
|
|
$
|
(3.3
|
)
|
||
|
Earnings (loss) per common share
|
||||||||
|
Basic
|
$
|
0.21
|
|
$
|
(0.39
|
)
|
||
|
Diluted
|
$
|
0.21
|
|
$
|
(0.39
|
)
|
||
|
Weighted average common shares outstanding
|
||||||||
|
Basic
|
8,634,013
|
|
8,425,593
|
|
||||
|
Diluted
|
8,634,013
|
|
8,425,593
|
|
||||
The accompanying notes are an integral part of these consolidated financial statements.
50
RANGER ENERGY SERVICES, INC.
CONSOLIDATED STATEMENT OF STOCKHOLDERS’ EQUITY
(in millions, except shares)
|
Year Ended December 31,
|
|||||||||||
|
2019
|
2018
|
2019
|
2018
|
||||||||
|
Quantity
|
Amount
|
||||||||||
|
Shares, Class A Common Stock
|
|||||||||||
|
Balance, beginning of period
|
8,448,527
|
|
8,413,178
|
|
$
|
0.1
|
|
$
|
0.1
|
|
|
|
Issuance of shares under share-based compensation plans
|
229,446
|
|
35,349
|
|
—
|
|
—
|
|
|||
|
Shares withheld for taxes on equity transactions
|
(45,082
|
)
|
—
|
|
—
|
|
—
|
|
|||
|
Issuance of Class A Common Stock to related party
|
206,897
|
|
—
|
|
—
|
|
—
|
|
|||
|
Balance, end of period
|
8,839,788
|
|
8,448,527
|
|
$
|
0.1
|
|
$
|
0.1
|
|
|
|
Shares, Class B Common Stock
|
|||||||||||
|
Balance, beginning of period
|
6,866,154
|
|
6,866,154
|
|
$
|
0.1
|
|
$
|
0.1
|
|
|
|
Balance, end of period
|
6,866,154
|
|
6,866,154
|
|
$
|
0.1
|
|
$
|
0.1
|
|
|
|
Treasury Stock
|
|||||||||||
|
Balance, beginning of period
|
—
|
|
—
|
|
$
|
—
|
|
$
|
—
|
|
|
|
Repurchase of Class A Common Stock
|
(113,937
|
)
|
—
|
|
(0.7
|
)
|
—
|
|
|||
|
Balance, end of period
|
(113,937
|
)
|
—
|
|
$
|
(0.7
|
)
|
$
|
—
|
|
|
|
Accumulated deficit
|
|||||||||||
|
Balance, beginning of period
|
$
|
(9.9
|
)
|
$
|
(6.6
|
)
|
|||||
|
Net income (loss) attributable to controlling interest
|
1.8
|
|
(3.3
|
)
|
|||||||
|
Balance, end of period
|
$
|
(8.1
|
)
|
$
|
(9.9
|
)
|
|||||
|
Additional paid-in capital
|
|||||||||||
|
Balance, beginning of period
|
$
|
111.6
|
|
$
|
110.1
|
|
|||||
|
Equity based compensation
|
3.1
|
|
1.5
|
|
|||||||
|
Shares withheld for taxes on equity transactions
|
(0.4
|
)
|
—
|
|
|||||||
|
Issuance of Class A Common Stock to related party
|
3.0
|
|
—
|
|
|||||||
|
Benefit from reversal of valuation allowance
|
1.4
|
|
—
|
|
|||||||
|
Impact of transactions affecting non-controlling interest
|
3.1
|
|
—
|
|
|||||||
|
Balance, end of period
|
$
|
121.8
|
|
$
|
111.6
|
|
|||||
|
Total controlling interest stockholders’ equity
|
|||||||||||
|
Balance, beginning of period
|
$
|
101.9
|
|
$
|
103.7
|
|
|||||
|
Net income (loss) attributable to controlling interest
|
1.8
|
|
(3.3
|
)
|
|||||||
|
Equity based compensation
|
3.1
|
|
1.5
|
|
|||||||
|
Shares withheld for taxes on equity transactions
|
(0.4
|
)
|
—
|
|
|||||||
|
Issuance of Class A Common Stock to related party
|
3.0
|
|
—
|
|
|||||||
|
Benefit from reversal of valuation allowance
|
1.4
|
|
—
|
|
|||||||
|
Impact of transactions affecting non-controlling interest
|
3.1
|
|
—
|
|
|||||||
|
Repurchase of Class A Common Stock
|
(0.7
|
)
|
|||||||||
|
Balance, end of period
|
$
|
113.2
|
|
$
|
101.9
|
|
|||||
|
Non-controlling interest
|
|||||||||||
|
Balance, beginning of period
|
$
|
90.1
|
|
$
|
92.0
|
|
|||||
|
Net income (loss) attributable to non-controlling interest
|
2.6
|
|
(2.5
|
)
|
|||||||
|
Equity based compensation
|
0.2
|
|
0.6
|
|
|||||||
|
Impact of transactions affecting non-controlling interest
|
(3.1
|
)
|
—
|
|
|||||||
|
Balance, end of period
|
$
|
89.8
|
|
$
|
90.1
|
|
|||||
|
Total Stockholders’ Equity
|
|||||||||||
|
Balance, beginning of period
|
$
|
192.0
|
|
$
|
195.7
|
|
|||||
|
Net income (loss)
|
4.4
|
|
(5.8
|
)
|
|||||||
|
Equity based compensation
|
3.3
|
|
2.1
|
|
|||||||
|
Shares withheld for taxes on equity transactions
|
(0.4
|
)
|
—
|
|
|||||||
|
Issuance of Class A Common Stock to related party
|
3.0
|
|
—
|
|
|||||||
|
Benefit from reversal of valuation allowance
|
1.4
|
|
—
|
|
|||||||
|
Repurchase of Class A Common Stock
|
(0.7
|
)
|
—
|
|
|||||||
|
Balance, end of period
|
$
|
203.0
|
|
$
|
192.0
|
|
|||||
The accompanying notes are an integral part of these consolidated financial statements.
51
RANGER ENERGY SERVICES, INC.
CONSOLIDATED STATEMENTS OF CASH FLOWS
(in millions)
|
Year ended December 31,
|
||||||||
|
2019
|
2018
|
|||||||
|
Cash Flows from Operating Activities
|
||||||||
|
Net income (loss)
|
$
|
4.4
|
|
$
|
(5.8
|
)
|
||
|
Adjustments to reconcile net income (loss) to net cash provided by operating activities:
|
||||||||
|
Depreciation and amortization
|
34.8
|
|
30.3
|
|
||||
|
Impairment of goodwill
|
—
|
|
9.0
|
|
||||
|
Equity based compensation
|
3.3
|
|
2.1
|
|
||||
|
Other costs, net
|
0.9
|
|
0.4
|
|
||||
|
Changes in operating assets and liabilities, net of the acquisition
|
||||||||
|
Accounts receivable
|
5.2
|
|
(13.5
|
)
|
||||
|
Contract assets
|
1.9
|
|
2.9
|
|
||||
|
Inventory
|
1.1
|
|
(3.4
|
)
|
||||
|
Prepaid expenses
|
(0.2
|
)
|
(0.9
|
)
|
||||
|
Other assets
|
0.8
|
|
(0.1
|
)
|
||||
|
Accounts payable
|
(1.1
|
)
|
0.2
|
|
||||
|
Accrued expenses
|
0.5
|
|
7.5
|
|
||||
|
Other long-term liabilities
|
0.3
|
|
(1.1
|
)
|
||||
|
Net cash provided by operating activities
|
51.9
|
|
27.6
|
|
||||
|
Cash Flows from Investing Activities
|
||||||||
|
Purchase of property and equipment
|
(24.2
|
)
|
(75.9
|
)
|
||||
|
Proceeds from disposal of property and equipment
|
0.8
|
|
5.5
|
|
||||
|
Acquisition costs, net of cash received
|
—
|
|
(4.0
|
)
|
||||
|
Net cash used in investing activities
|
(23.4
|
)
|
(74.4
|
)
|
||||
|
Cash Flows from Financing Activities
|
||||||||
|
Borrowings under Credit Facility
|
26.7
|
|
56.0
|
|
||||
|
Principal payments on Credit Facility
|
(35.2
|
)
|
(37.6
|
)
|
||||
|
Borrowings on Encina Master Financing Agreement, net of deferred financing costs
|
—
|
|
39.1
|
|
||||
|
Principal payments on Encina Master Financing Agreement
|
(9.8
|
)
|
(2.5
|
)
|
||||
|
Principal payments on ESCO Note Payable
|
—
|
|
(1.3
|
)
|
||||
|
Principal payments on financing lease obligations
|
(4.8
|
)
|
(9.6
|
)
|
||||
|
Repurchase of Class A Common Stock
|
(0.7
|
)
|
—
|
|
||||
|
Shares withheld on equity transactions
|
(0.4
|
)
|
—
|
|
||||
|
Net cash (used in) provided by financing activities
|
(24.2
|
)
|
44.1
|
|
||||
|
Increase (decrease) in Cash and Cash equivalents
|
4.3
|
|
(2.7
|
)
|
||||
|
Cash and Cash Equivalents, Beginning of Year
|
2.6
|
|
5.3
|
|
||||
|
Cash and Cash Equivalents, End of Year
|
$
|
6.9
|
|
$
|
2.6
|
|
||
|
Supplemental Cash Flows Information
|
||||||||
|
Interest paid
|
$
|
4.5
|
|
$
|
(2.1
|
)
|
||
|
Supplemental Disclosure of Non-cash Investing and Financing Activities
|
||||||||
|
Capital expenditures
|
$
|
(2.9
|
)
|
$
|
15.5
|
|
||
|
Additions to fixed assets through financing leases
|
$
|
2.4
|
|
$
|
(11.1
|
)
|
||
|
Initial operating lease right of use assets additions
|
$
|
(8.3
|
)
|
$
|
—
|
|
||
|
Issuance of Class A Common Stock to related party
|
$
|
3.0
|
|
$
|
—
|
|
||
The accompanying notes are an integral part of these consolidated financial statements.
52
RANGER ENERGY SERVICES, INC.
NOTES TO CONSOLIDATED FINANCIAL STATEMENTS
Note 1 — Organization and Business Operations
Business
Ranger Energy Services, Inc. (“Ranger, Inc.,” “Ranger,” or the “Company”) is a provider of onshore high specification (“high-spec”) well service rigs and complementary services in the United States. We provide an extensive range of well site services to leading U.S. exploration and production (“E&P”) companies that are fundamental to establishing and maintaining the flow of oil and natural gas throughout the productive life of a well.
Our service offerings consist of well completion support, workover, well maintenance, wireline, fluid management, other complementary services, as well as installation, commissioning and operating of modular equipment, which are conducted in three reportable segments, as follows:
|
•
|
High Specification Rigs
. Provider of high-spec well service rigs and complementary equipment and services to facilitate operations throughout the lifecycle of a well.
|
|
•
|
Completion and Other Services
. Provider of wireline completion services necessary to bring a well on production and other ancillary services often utilized in conjunction with our high-spec rig services to maintain the production of a well.
|
|
•
|
Processing Solutions
. Provider of proprietary, modular equipment for the processing of natural gas.
|
We operate in most of the active oil and natural gas basins in the United States, including the Permian Basin, Denver-Julesburg Basin, Bakken Shale, Eagle Ford Shale, Haynesville Shale, Gulf Coast, South Central Oklahoma Oil Province and Sooner Trend Anadarko Basin Canadian and Kingfisher Counties plays.
Organization
Ranger Inc. was incorporated as a Delaware corporation in
February 2017
. Ranger Inc. is a holding company, the sole material assets of which consist of membership interests in RNGR Energy Services, LLC a Delaware limited liability company (“Ranger LLC”). Ranger LLC owns all of the outstanding equity interests in Ranger Energy Services, LLC (“Ranger Services”) and Torrent Energy Services, LLC (“Torrent Services”), the subsidiaries through which it operates its assets. Ranger LLC is the sole managing member of Ranger Services and Torrent Services, and is responsible for all operational, management and administrative decisions relating to Ranger Services and Torrent Services’ business and consolidates the financial results of Ranger Services and Torrent Services and their subsidiaries.
Note 2 — Summary of Significant Accounting Policies
Basis of Presentation
The accompanying audited consolidated financial statements of the Company have been prepared in accordance with generally accepted accounting principles in the United States (“GAAP”) and pursuant to the rules and regulations of the U.S. Securities and Exchange Commission (“SEC”). In the opinion of management, all material adjustments, which are of a normal and recurring nature, necessary for the fair presentation of the financial results for all periods presented have been reflected. All intercompany balances and transactions have been eliminated.
Investments in which the Company exercises control are consolidated and the noncontrolling interests of such investments, which are not attributable directly or indirectly to the Company, are presented as a separate component of net income and equity in the accompanying consolidated financial statements. The Company has ownership interests in Ranger LLC, which is consolidated within the Company’s consolidated financial statements but is not wholly owned by the Company. Changes in the Company’s ownership interest in Ranger LLC, while it retains its controlling interest, are accounted for as equity transactions.
Use of Estimates
The preparation of consolidated financial statements in conformity with GAAP requires management to make estimates and assumptions that affect the reported amounts of assets and liabilities and disclosure of contingent assets and liabilities at the date of the consolidated financial statements and the reported amounts of revenue and expenses during the reporting period. Management uses historical and other pertinent information to determine these estimates. Actual results could differ from such estimates. Areas where critical accounting estimates are made by management include:
|
•
|
Depreciation and amortization of property and equipment and intangible assets;
|
|
•
|
Impairment of property and equipment, goodwill and intangible assets;
|
53
|
•
|
Revenue recognition;
|
|
•
|
Income taxes; and
|
|
•
|
Equity-based compensation.
|
Significant Accounting Policies
Cash and Cash Equivalents
All highly liquid investments with an original maturity of three months or less are considered cash equivalents. The Company maintains its cash accounts in financial institutions that are insured by the Federal Deposit Insurance Corporation. From time to time cash balances may exceed the insured amounts, however, the Company has not experienced any losses in such accounts and does not believe it is exposed to any significant credit risks.
Accounts Receivable, net
Accounts receivable, net are stated at the amount management expects to collect from outstanding balances. Before extending credit, the Company reviews a customer’s credit history and generally does not require collateral from its customers. The allowance for doubtful accounts is established as losses are estimated and are recorded through a provision for bad debts. Losses are charged against the allowance when management believes the uncollectibility of a receivable is confirmed. Subsequent recoveries, if any, are credited to the allowance. The allowance for doubtful accounts is evaluated on a regular basis by management and based on past experience and other factors, which, in management’s judgment, deserve current recognition in estimating possible bad debts. Such factors include growth and composition of accounts receivable, the relationship of the allowance for doubtful accounts to accounts receivable and current economic conditions. The allowance for doubtful accounts was
$1.6 million
and
$0.5 million
for the years ended
December 31, 2019
and
2018
, respectively. Bad debt expense recorded for the years ended
December 31, 2019
and
2018
was
$1.3 million
and
$0.2 million
, respectively.
|
Balance at Beginning of Year
|
Charged to Operations
|
Written Off
|
Balance at End of Year
|
|||||||||||||
|
Allowance for Doubtful Accounts Receivable
|
||||||||||||||||
|
2019
|
$
|
0.5
|
|
$
|
1.3
|
|
$
|
(0.2
|
)
|
$
|
1.6
|
|
||||
|
2018
|
$
|
1.3
|
|
$
|
0.2
|
|
$
|
(1.0
|
)
|
$
|
0.5
|
|
||||
Inventories
Inventories are carried at the lower of cost or net realizable value and primarily consist of supplies held for the Completion and Other Services segment.
Leases
Right-of-use (“ROU”) assets represent our right to use an underlying asset for the lease term and lease liabilities represent our obligation to make lease payments arising from the lease, discounted at our annual incremental borrowing rate (“IBR”). ROU assets and liabilities are recognized at commencement date based on the present value of lease payments over the lease term. Variable lease payments are excluded from the ROU asset and lease liabilities and are recognized in the period in which the obligation for those payments is incurred. For certain leases, where variable lease payments are incurred and relate primarily to common area maintenance, in substance fixed payments are included in the ROU asset and lease liability. For those leases that do not provide an implicit rate, we use an IBR based on the estimated rate of interest for a fully collateralized, fully amortizing loan over a similar term of the lease payments at commencement date. ROU assets also include any lease payments made and exclude lease incentives. Lease terms do not include options to extend or terminate the lease, as management does not consider them reasonably certain to exercise.
Effective January 1, 2019, the Company has adopted ASU 2016-02 and elected the following practical expedients and accounting policy elections for recognition, measurement and presentation:
|
•
|
The optional transition method, therefore, will not adjust comparative period financial information or make the new required lease disclosures for periods prior to the effective date;
|
|
•
|
the package of practical expedients to not reassess prior conclusions related to (i) contracts containing leases, (ii) lease classification and (iii) initial direct costs;
|
|
•
|
to make the accounting policy election for short-term leases, or leases with terms of 12 months or less, therefore the lease payments will be recorded as an expense on a straight line basis over the lease term; and
|
54
|
•
|
to combine lease and non-lease components.
|
Operating Leases
The Company enters into operating leases, primarily for real estate and equipment, with terms that vary from less than
12 months
to
eight years
. The operating leases are included in Operating lease right-of-use assets, Other current liabilities and Operating lease right-of-use obligations in the Consolidated Balance Sheet. Lease costs associated with our yards and field offices are included in Cost of Services and our executive offices are included in General and Administrative expenses in the Consolidated Statements of Operations.
Finance Leases
The Company enters into lease arrangements for certain vehicles, which are considered finance leases and generally have a term of
three
to
five years
. The assets and liabilities under finance leases are recorded at the lower of present value of the minimum lease payments or the fair value of the assets. The assets are amortized over the shorter of the estimated useful lives or over the lease term. The finance leases are included in Property and equipment, net, Finance lease obligations, current portion and Finance lease obligations in our Consolidated Balance Sheet.
Property and Equipment
Property and equipment is stated at cost or estimated fair market value at the acquisition date less accumulated depreciation. Depreciation is charged to expense on the straight‑line basis over the estimated useful life of each asset. Expenditures for major renewals and betterments are capitalized while expenditures for maintenance and repairs are charged to expenses as incurred. Depreciation does not begin until property and equipment is placed in service. Once placed in service, depreciation on property and equipment continues while being repaired, refurbished or between periods of deployment.
Long‑lived Asset Impairment
The Company evaluates the recoverability of the carrying value of long‑lived assets, including property and equipment and intangible assets, whenever events or circumstances indicate the carrying amount may not be recoverable. If a long‑lived asset is tested for recoverability and the undiscounted estimated future cash flows expected to result from the use and eventual disposition of the asset is less than the carrying amount of the asset, the asset cost is adjusted to fair value and an impairment loss is recognized as the amount by which the carrying amount of a long‑lived asset exceeds its fair value.
Intangible Assets
Identified intangible assets with determinable lives consist of customer relationships and trade names, as described in
Note 5 — Goodwill and Intangible Assets
. Customer relationships and trade names are straight-line amortized over their estimated useful lives.
Fair Value Measurements
Fair value is the price that would be received to sell an asset or paid to transfer a liability in an orderly transaction between market participants. In valuing certain assets and liabilities, the inputs used to measure fair value may fall into different levels of the fair value hierarchy, which are summarized as follows:
Level 1—Quoted prices in active markets for identical assets and liabilities.
Level 2—Other significant observable inputs.
Level 3—Significant unobservable inputs.
The Company’s financial instruments consist of cash and cash equivalents, trade receivables and trade payables, where the carrying amount approximates fair value due to the short‑term nature of each instrument. The fair value of long‑term debt approximates its carrying value based on the borrowing rates currently available to the Company for bank loans with similar terms and maturities. The Company did not have any assets or liabilities that were measured at fair value on a recurring basis at
December 31, 2019
and
2018
.
Revenue Recognition
In determining the appropriate amount of revenue to be recognized as the Company fulfills the obligations under its contracts with customers, the following steps must be performed at contract inception: (i) identification of the promised goods or services in the contract; (ii) determination of whether the promised goods or services are performance obligations, including whether they are distinct in the context of the contract; (iii) measurement of the transaction price, including the constraint on variable consideration; (iv) allocation of the transaction price to the performance obligations; and (v) recognition of revenue when, or as the Company satisfies each performance obligation.
55
The services of each segment are based on mutually agreed upon pricing with the customer prior to the services being performed and, given the nature of the services, do not include any warranty or right of return. Pricing for services are offered at hourly or daily rates, where the rates are, in part, determined by when services are performed and the nature of the specific job, with consideration for the extent of equipment, labor and consumables needed. Accordingly, the agreed upon pricing is considered to be variable consideration. Pricing for equipment rentals is based on fixed monthly service fees.
We satisfy our performance obligation over time as the services are performed. The Company believes the output method is a reasonable measure of progress for the satisfaction of our performance obligations, which are satisfied over time, as it provides a faithful depiction of (i) our performance toward complete satisfaction of the performance obligation under the contract and (ii) the value transferred to the customer of the services performed under the contract. The Company elected the “right to invoice” practical expedient for recognizing revenue. The Company invoices customers upon completion of the specified services and collection generally occurs within the payment terms agreed with customers. Accordingly, there is no financing component to our arrangements with customers.
All revenues transactions are presented on a net of sales tax in the consolidated statement of operations.
Contract Balances
Contract assets representing the Company’s rights to consideration for work completed but not billed amounted to
$1.2 million
and
$3.1 million
as of
December 31, 2019
and
2018
, respectively. Substantially all of the contract assets as of
December 31, 2019
and
2018
were invoiced during the subsequent periods.
The Company does not have any contract liabilities included in the consolidated balance sheets as of
December 31, 2019
and
2018
.
Income Taxes
The Company provides for income tax expense based on the liability method of accounting for income taxes. Deferred tax assets and liabilities are recorded based upon differences between the tax basis of assets and liabilities and their carrying values for financial reporting purposes and are measured using the enacted tax rates and laws that will be in effect when the differences are expected to reverse. A valuation allowance is established when it is more likely than not that some portion or all of the deferred tax assets will not be realized. The establishment of a valuation allowance requires significant judgment and is impacted by various estimates. Both positive and negative evidence, as well as the objectivity and verifiability of that evidence, is considered in determining the appropriateness of recording a valuation allowance on deferred tax assets. Under GAAP, the valuation allowance is recorded to reduce the Company’s deferred tax assets to an amount that is more likely than not to be realized and is based upon the uncertainty of the realization of certain federal and state deferred tax assets related to net operating loss carryforwards and other tax attributes. The ultimate realization of the deferred tax assets depends on the generation of sufficient taxable income. Deferred tax expense or benefit is the result of changes in deferred tax assets and liabilities and associated valuation allowances during the period. The impact of an uncertain tax position taken or expected to be taken on an income tax return is recognized in the financial statements at the largest amount that is more likely than not to be sustained upon examination by the relevant taxing authority.
The income tax provision reflects the full benefit of all positions that have been taken in the Company's income tax returns, except to the extent that such positions are uncertain and fall below the recognition requirements. In the event that the Company determines that a tax position meets the uncertainty criteria, an additional liability or benefit will result. The amount of unrecognized tax benefit requires management to make significant assumptions about the expected outcomes of certain tax positions included in filed or yet to be filed tax returns. At
December 31, 2019
and
2018
, the Company did not have any uncertain tax positions. The Company is subject to income taxes in the United States and in numerous state tax jurisdictions. The Company’s tax filings for
2018
and
2017
are subject to audit by the federal and state taxing authorities in most jurisdictions where we conduct business. None of the Company’s federal or state tax returns are currently under examination. These audits may result in assessments of additional taxes that are resolved with the authorities or through the courts.
The Company records income tax related interest and penalties, if applicable, as a component of tax expense. However, there were no such amounts recognized in the consolidated statements of operations in
2019
and
2018
.
Equity-Based Compensation
The financial statements reflect various equity-based compensation awards granted by Ranger. These awards include restricted stock and performance stock awards. The Company recognizes compensation expense related to equity-based awards granted based on the estimated fair value of the awards on the date of grant. The fair value of the equity-based awards on the grant date is generally recognized on a straight-line basis over the requisite service period, which is generally the vesting period of the respective awards. The fair value of the performance stock awards are estimated using an option pricing model that includes certain assumptions, such as volatility, dividend yield and the risk free interest rate. Changes in these assumptions could change the fair value of our unit based awards and associated compensation expense in our consolidated statements of operations.
56
Emerging Growth
Company and Smaller Reporting Company Status
The Company is an “emerging growth company” as defined in the Jumpstart Our Business Startups Act of 2012 (the “JOBS Act”). The Company will remain an emerging growth company until the earlier of (1) the last day of its fiscal year (a) following the fifth anniversary of the completion of the Offering, (b) in which its total annual gross revenue is at least
$1.07 billion
, or (c) in which the Company is deemed to be a large accelerated filer, which means the market value of our common stock that is held by non-affiliates exceeds
$700.0 million
as of the last business day of its most recently completed second fiscal quarter, or (2) the date on which the Company has issued more than
$1.0 billion
in non-convertible debt securities during the prior
three
-year period. An emerging growth company may take advantage of specified reduced reporting and other burdens that are otherwise applicable to public companies. The Company has irrevocably opted out of the extended transition period and, as a result, the Company will adopt new or revised accounting standards on the relevant dates on which adoption of such standards is required for other public companies.
The Company is also a “smaller reporting company” as defined by Rule 12b-2 of the Exchange Act. Smaller reporting company means an issuer that is not an investment company, an asset-back issuer, or a majority-owned subsidiary of a parent that is not a smaller reporting company and that (i) has a market value of common stock held by non-affiliates of less than
$250 million
; or (i) has annual revenues of less than
$100 million
and either no common stock held by non-affiliates or a market value of common stock held by non-affiliates of less than
$700 million
. Smaller reporting company status is determined on an annual basis.
Recent Accounting Pronouncements
Recently adopted accounting standards
On January 1, 2019, the Company adopted Accounting Standards Codification (“ASC”) Topic 842,
Leases.
Under the new provisions, all lessees will report an ROU asset and corresponding liability for the obligation to make payments for all leases, with an exception for those leases with a term of 12 months or less. All leases fall into one of two categories: (i) a financing lease or (ii) an operating lease. Additionally, it requires expanded disclosures regarding the nature, amount and timing of lease assets and obligations. The Company adopted this accounting standard using the modified retrospective approach and recognized an operating lease right-of-use asset and corresponding liability of
$8.3 million
on our condensed consolidated Balance Sheet. See
Note 7 — Leases
, for further details of the Company’s operating and financing leases.
Recently issued accounting standards
In June 2016, the Financial Accounting Standards Board (“FASB”) issued ASU 2016-13,
Financial Instruments - Credit Losses
, which replaces the incurred loss impairment methodology to reflect expected credit losses. The amendment requires the measurement of all expected credit losses for financial assets held at the reporting date to be performed based on historical experience, current conditions and reasonable and supportable forecasts. ASU 2016-13 is effective for annual and interim periods beginning after December 15, 2022, with early adoption permitted. The Company is evaluating the effect of this accounting standard on its consolidated financial statements.
With the exception of the standard above, there have been no new accounting pronouncements not yet effective that have significance, or potential significance, to the Company’s consolidated financial statements.
Note 3 — Acquisition
MVCI Acquisition
On January 31, 2018, the Company closed on the acquisition of MVCI Energy Services (“MVCI Acquisition”) for a total consideration of
$4.0 million
in cash. The MVCI Acquisition assets were primarily engaged in well testing services for its customers. The MVCI Acquisition was accounted for as a business combination. The Company evaluated its purchase allocation and has reported
$4.0 million
on its consolidated balance sheets as property and equipment. The pro forma results of operations for the MVCI Acquisition is not presented because the pro forma effects, individually and in the aggregate, are not material to the Company’s consolidated results of operations.
57
Note 4 — Property and Equipment
Property and equipment include the following (in millions):
|
Estimated
|
||||||||||
|
Useful Life
|
December 31,
|
|||||||||
|
(Years)
|
2019
|
2018
|
||||||||
|
High specification rigs
|
20
|
$
|
127.2
|
|
$
|
125.2
|
|
|||
|
High specification rigs machinery and equipment
|
5 - 10
|
38.3
|
|
40.4
|
|
|||||
|
Completions and other services machinery and equipment
|
5 - 10
|
55.8
|
|
43.0
|
|
|||||
|
Process solutions machinery and equipment
|
3 - 30
|
40.8
|
|
30.5
|
|
|||||
|
Vehicles
|
3 - 15
|
25.9
|
|
23.3
|
|
|||||
|
Other property and equipment
|
5 - 25
|
10.1
|
|
12.7
|
|
|||||
|
Property and equipment
|
298.1
|
|
275.1
|
|
||||||
|
Less: accumulated depreciation
|
(85.5
|
)
|
(52.5
|
)
|
||||||
|
Construction in progress
|
6.3
|
|
7.2
|
|
||||||
|
Property and equipment, net
|
$
|
218.9
|
|
$
|
229.8
|
|
||||
Depreciation expense was
$34.1 million
and
$29.5 million
for the years ended
December 31, 2019
and
2018
, respectively.
Note 5 — Goodwill and Intangible Assets
During the year ended
December 31, 2018
, the Company noted a sustained decrease in the stock price, which was an indication that the fair value of goodwill could have fallen below its carrying amount. As a result, the Company performed a quantitative impairment test and determined the goodwill was impaired. The Company estimated the implied fair value of the goodwill using a variety of valuation methods, including the income and market approaches. During the year ended
December 31, 2018
, the Company recognized a loss of
$9.0 million
associated with the remaining balance of goodwill. The estimate of fair value required the use of significant unobservable inputs, representative of a
Level 3
fair value measurement.
Definite lived intangible assets are comprised of the following (in millions):
|
Estimated
|
||||||||||
|
Useful Life
|
December 31,
|
|||||||||
|
(Years)
|
2019
|
2018
|
||||||||
|
Tradenames
|
3
|
$
|
—
|
|
$
|
0.1
|
|
|||
|
Customer relationships
|
10-18
|
11.4
|
|
11.4
|
|
|||||
|
Less: accumulated amortization
|
(2.1
|
)
|
(1.5
|
)
|
||||||
|
Intangible assets, net
|
$
|
9.3
|
|
$
|
10.0
|
|
||||
Amortization expense was
$0.7 million
and
$0.8 million
for the years ended
December 31, 2019
and
2018
, respectively. Amortization expense for the future periods is expected to be as follows (in millions):
|
For the years ending December 31,
|
Amount
|
|||
|
2020
|
$
|
0.7
|
|
|
|
2021
|
0.7
|
|
||
|
2022
|
0.7
|
|
||
|
2023
|
0.7
|
|
||
|
2024
|
0.8
|
|
||
|
Thereafter
|
5.7
|
|
||
|
Total
|
$
|
9.3
|
|
|
58
Note 6 — Accrued Expenses
Accrued expenses include the following (in millions):
|
December 31,
|
||||||||
|
2019
|
2018
|
|||||||
|
Accrued payables
|
$
|
8.3
|
|
$
|
5.6
|
|
||
|
Accrued compensation
|
6.3
|
|
6.2
|
|
||||
|
Accrued taxes
|
1.8
|
|
2.9
|
|
||||
|
Accrued insurance
|
2.0
|
|
3.8
|
|
||||
|
Accrued expenses
|
$
|
18.4
|
|
$
|
18.5
|
|
||
Note 7 — Leases
Operating Leases
Lease costs and other information related to operating leases for the
year ended December 31, 2019
is as follows (in millions):
|
Year Ended
|
||||
|
December 31, 2019
|
||||
|
Short-term lease costs
|
$
|
5.4
|
|
|
|
Operating lease cost
|
$
|
3.0
|
|
|
|
Operating cash outflows from operating leases
|
$
|
2.9
|
|
|
|
Weighted average remaining lease term
|
5.8 years
|
|
||
|
Weighted average discount rate
|
9.3
|
%
|
||
Aggregate future minimum lease payments under operating leases for the
year ended December 31, 2019
is as follows (in millions):
|
For the years ending December 31,
|
Total
|
|||
|
2020
|
$
|
2.5
|
|
|
|
2021
|
1.1
|
|
||
|
2022
|
0.9
|
|
||
|
2023
|
0.8
|
|
||
|
2024
|
0.8
|
|
||
|
Thereafter
|
2.4
|
|
||
|
Total future minimum lease payments
|
8.5
|
|
||
|
Less: amount representing interest
|
(2.0
|
)
|
||
|
Present value of future minimum lease payments
|
6.5
|
|
||
|
Less: current portion of operating lease obligations
|
(2.0
|
)
|
||
|
Long-term portion of operating lease obligations
|
$
|
4.5
|
|
|
59
Aggregate future minimum rental payments as of December 31, 2018, were
$2.9 million
,
$2.3 million
,
$0.9 million
,
$0.7 million
,
$0.7 million
and
$3.0 million
for the years ending December 31, 2019, 2020, 2021, 2022, 2023 and thereafter, respectively.
Finance Leases
Lease costs and other information related to finance leases for the
year ended December 31, 2019
is as follows (in millions):
|
Year Ended
|
||||
|
December 31, 2019
|
||||
|
Amortization of finance leases
|
$
|
5.2
|
|
|
|
Interest on lease liabilities
|
$
|
0.8
|
|
|
|
Financing cash outflows from finance leases
|
$
|
4.8
|
|
|
|
Weighted average remaining lease term
|
1.4 years
|
|
||
|
Weighted average discount rate
|
4.3
|
%
|
||
Aggregate future minimum lease payments under finance leases for the year ended December 31, 2019 and 2018 are as follows (in millions):
|
For the years ending December 31,
|
2019
|
2018
|
||||||
|
2019
|
$
|
—
|
|
$
|
5.0
|
|
||
|
2020
|
5.5
|
|
4.6
|
|
||||
|
2021
|
2.9
|
|
2.1
|
|
||||
|
2022
|
0.7
|
|
0.2
|
|
||||
|
2023
|
0.2
|
|
0.1
|
|
||||
|
Total future minimum lease payments
|
9.3
|
|
12.0
|
|
||||
|
Less: amount representing interest
|
(0.6
|
)
|
(1.0
|
)
|
||||
|
Present value of future minimum lease payments
|
8.7
|
|
11.0
|
|
||||
|
Less: current portion of finance lease obligations
|
(5.1
|
)
|
(4.4
|
)
|
||||
|
Long-term portion of finance lease obligations
|
$
|
3.6
|
|
$
|
6.6
|
|
||
Note 8 — Debt
The aggregate carrying amounts, net of issuance costs, of the Company’s debt consists of the following (in millions):
|
|
December 31,
|
|||||||
|
|
2019
|
2018
|
||||||
|
ESCO Notes Payable
|
$
|
5.8
|
|
$
|
5.8
|
|
||
|
Wells Fargo Credit Facility
|
9.5
|
|
17.9
|
|
||||
|
Encina Master Financing Agreement
|
27.1
|
|
36.8
|
|
||||
|
Total Debt
|
42.4
|
|
60.5
|
|
||||
|
Current portion of long-term debt
|
(15.8
|
)
|
(15.8
|
)
|
||||
|
Long term-debt, net
|
$
|
26.6
|
|
$
|
44.7
|
|
||
ESCO Notes Payable
In connection with the initial public offering (the “Offering”) and the ESCO Leasing, LLC (“ESCO”) acquisition, both of which occurred on
August 16, 2017
, the Company issued
$7.0 million
of Seller’s Notes as partial consideration for the ESCO acquisition. These notes included a note for
$1.2 million
, which was paid in
August 2018
and a note for
$5.8 million
, which was due in February 2019. The notes bore interest at
5.0%
payable quarterly until their respective maturity dates.
During the year ended
December 31, 2018
, the Company provided notice to ESCO that the Company is sought to be indemnified for breach of contract. The Company exercised its right to stop payments of the remaining principal balance of
$5.8 million
on the Seller’s Notes and any unpaid interest, pending resolution of certain indemnification claims. Interest on the outstanding principal balance was accrued through the maturity date of the Note Payable.
60
Credit Facility
On
August 16, 2017
, Ranger, LLC entered into a
$50.0 million
senior unsecured revolving credit facility (the “Credit Facility”) by and among certain of Ranger’s subsidiaries, as borrowers, each of the lenders party thereto and Wells Fargo Bank, N.A., as administrative agent. The Credit Facility is subject to a borrowing base that is calculated based upon a percentage of the value of the Company’s eligible accounts receivable less certain reserves. The Credit Facility is scheduled to mature on
August 16, 2022
.
The applicable margin for LIBOR loans ranges from
1.5%
to
2.0%
and the applicable margin for Base Rate loans ranges from
0.5%
to
1.0%
, in each case, depending on Ranger, LLC’s average excess availability under the Credit Facility. The applicable margin for the LIBOR loan was
1.8%
and the Credit Facility’s interest rate was
3.5%
as of
December 31, 2019
.
As of
December 31, 2019
, under the Credit facility, the Company borrowed
$10.0 million
, has a borrowing capacity of
$30.5 million
, with a residual
$20.5 million
available for borrowing. The Company is in compliance with the Credit Facility covenants as of
December 31, 2019
. The Company capitalized fees of
$0.7 million
associated with the Credit Facility, which are included on the consolidated balance sheets as a discount to the Credit Facility. Such fees will be amortized through maturity and are included in Interest Expense, net on the Consolidated Statements of Operations. Unamortized debt issuance costs as of
December 31, 2019
was
$0.5 million
.
Encina Master Financing and Security Agreement (“Financing Agreement”)
On
June 22, 2018
, the Company entered into a Financing Agreement with Encina Equipment Finance SPV, LLC (the “Lender”). The amount available to be provided by the Lender to the Company under the Financing Agreement was contemplated to be not less than
$35.0 million
, and not to exceed
$40.0 million
. The first financing was required to be in an amount up to
$22.0 million
, which was used by the Company to acquire certain capital equipment. Subsequent to the first financing, the Company borrowed an additional
$17.8 million
, net of expenses and in two tranches, under the Financing Agreement. We utilized proceeds to acquire certain capital equipment. The Financing Agreement is secured by a lien on certain high specification rig assets. As of
December 31, 2019
, the aggregate principal balance outstanding under the Financing Agreement was
$27.7 million
. The total borrowings under the Financing Agreement were borrowed in three tranches, where the amounts outstanding are payable ratably over
48 months
from the time of each borrowing. The three tranches mature in
July 2022
, November 2022 and January 2023.
Borrowings under the Financing Agreement bear interest at a rate per annum equal to the sum of
8.0%
plus the London Interbank Offered Rate (“LIBOR”), which was
1.8%
as of
December 31, 2019
. The Financing Agreement requires that the Company maintain leverage ratios of
2.50
to
1.00
. The Company was in compliance with the covenants under the Financing Agreement as of
December 31, 2019
.
The Company capitalized fees of
$0.9 million
associated with the Financing Agreement, which are included on the Consolidated Balance Sheets as a discount to the long term debt. Such fees will be amortized through maturity and are included in Interest Expense, net on the Consolidated Statements of Operations. Unamortized debt issuance costs as of
December 31, 2019
approximated
$0.6 million
.
Debt Obligations and Scheduled Maturities
As of
December 31, 2019
, aggregate principal repayments of total debt for the next five years are as follows (in millions):
|
For the years ending December 31,
|
Total
|
|||
|
2020
|
$
|
15.8
|
|
|
|
2021
|
10.0
|
|
||
|
2022
|
17.5
|
|
||
|
2023
|
0.2
|
|
||
|
Total
|
$
|
43.5
|
|
|
Note 9 — Equity
Equity Based Compensation
Overview
The Company has a Long-Term Incentive Plan (“LTIP”) for executives, employees, consultants and non-employee directors, under which awards can be granted in the form of stock options, stock appreciation rights, restricted stock, restricted stock awards (“RSAs”), performance awards, dividend equivalents, other stock-based awards, cash awards and substitute awards. Subject to adjustment in accordance with the terms of the LTIP,
2,850,000
shares of Class A Common Stock have been reserved
61
for issuance pursuant to awards under the LTIP. Class A Common Stock withheld to satisfy exercise prices or tax withholding obligations will be available for delivery pursuant to other awards. The LTIP will be administered by the Board or an alternative committee appointed by the Board.
RSAs
The Company has granted RSAs, which generally vest in three equal annual installments beginning on the first anniversary date of the grant. The aggregate value of awards granted during the year ended
December 31, 2019
and
2018
was
$4.5 million
and
$4.6 million
, respectively. As of
December 31, 2019
and
2018
, there was unrecognized expense related to unvested RSA’s of
$4.3 million
and
$2.9 million
, respectively.
The following table summarizes the unvested activity for RSAs during the years ended
December 31, 2019
and
2018
:
|
Shares
|
Weighted Average Grant Date Fair Value
|
Weighted Average Remaining Vesting Period
|
|||||||
|
Unvested at January 1, 2018
|
10,000
|
|
|
|
|||||
|
Granted
|
563,002
|
|
$
|
8.25
|
|
2.4 years
|
|||
|
Forfeited
|
(50,913
|
)
|
|
|
|||||
|
Vested
|
(40,379
|
)
|
|
|
|||||
|
Unvested at December 31, 2018
|
481,710
|
|
$
|
8.25
|
|
2.4 years
|
|||
|
Granted
|
590,091
|
|
$
|
7.59
|
|
2.1 years
|
|||
|
Forfeited
|
(80,767
|
)
|
|||||||
|
Vested
|
(229,446
|
)
|
|||||||
|
Unvested at December 31, 2019
|
761,588
|
|
$
|
7.84
|
|
1.8 years
|
|||
Performance Stock Units
The Company has granted performance awards to certain key employees, in the form of Performance Stock Units (“PSUs”), which are earned based on the achievement of certain market factors and performance targets at the discretion of the compensation committee of the board of directors. The PSUs are subject to a three-year measurement period during which the number of Class A Common Stock to be issued remains uncertain until the end of the measurement period and will generally cliff vest based on the level of achievement with respect to the applicable performance criteria. As defined in the respective PSU agreements, the performance criteria applicable to these awards is relative and absolute total shareholder return (“TSR”). Achievement with respect to the relative TSR criteria is determined by the Company’s TSR compared to the TSR of the defined peer group during the measurement period. Achievement with respect to the absolute TSR criteria is based on a measurement of the Company’s stock price growth during the measurement period.
The PSUs that were granted during the years ended
December 31, 2019
and 2018 will cliff vest, subject to the achievement of applicable performance criteria, on
March 21, 2022
and
December 31,
2021
, respectively. As of
December 31, 2019
, there was an aggregate of
$1.1 million
of unrecognized compensation cost related to PSUs.
The following table summarizes the unvested activity for PSUs during the years ended
December 31, 2019
and
2018
:
|
Relative
|
Absolute
|
|||||||||||||||||
|
Shares
|
Weighted Average
Grant Date Fair Value |
Weighted Average
Remaining Vesting Period |
Shares
|
Weighted Average
Grant Date Fair Value |
Weighted Average
Remaining Vesting Period |
|||||||||||||
|
Unvested as of January 1, 2018
|
—
|
|
—
|
|
||||||||||||||
|
Granted
|
45,218
|
|
$
|
8.59
|
|
1.0 year
|
45,218
|
|
$
|
4.38
|
|
1.0 year
|
||||||
|
Forfeited
|
(9,736
|
)
|
(9,736
|
)
|
||||||||||||||
|
Unvested as of December 31, 2018
|
35,482
|
|
$
|
8.59
|
|
1.0 year
|
35,482
|
|
$
|
4.38
|
|
1.0 year
|
||||||
|
Granted
|
52,960
|
|
$
|
11.96
|
|
2.2 years
|
52,960
|
|
$
|
9.50
|
|
2.2 years
|
||||||
|
Unvested as of December 31, 2019
|
88,442
|
|
|
|
1.8 years
|
88,442
|
|
|
|
1.8 years
|
||||||||
62
Share Issuance to Related Party
In connection with the Master Reorganization Agreement, an aggregate of
$3.0 million
(included within other current liabilities on the accompanying consolidated balance sheet as of December 31, 2018) was settled by the Company and CSL Energy Holdings I, LLC and CSL Energy Holdings II, LLC during the year ended
December 31, 2019
. At the Company’s discretion the liability was settled with the issuance of
206,897
Class A Common Stock.
Share Repurchase Program
In June 2019, the Board of Directors approved a share repurchase program, authorizing the Company to purchase up to
10%
of the outstanding Class A Common Stock held by non-affiliates, not to exceed
580,000
shares or
$5.0 million
in aggregate value. Share repurchases may take place from time to time on the open market or through privately negotiated transactions. The duration of the share repurchase program is 12 months and may be accelerated, suspended or discontinued at any time without notice. As of
December 31, 2019
, the Company has repurchased
$0.7 million
of Class A Common Stock under the program.
The following table summarizes the activity of treasury stock for the years ended
December 31, 2019
:
|
Treasury Stock
|
|||||||
|
Quantity
|
Amount
|
||||||
|
Balance at December 31, 2018
|
—
|
|
$
|
—
|
|
||
|
Repurchase of Class A Common Stock
|
113,937
|
|
0.7
|
|
|||
|
Balance at December 31, 2019
|
113,937
|
|
$
|
0.7
|
|
||
Note 10 — Risk Concentrations
Customer Concentrations
For the year ended
December 31, 2019
,
two
customers, EOG Resources and Concho Resources, accounted for approximately
17%
and
14%
, respectively, of the Company’s consolidated revenues. As of
December 31, 2019
, approximately
12%
and
8%
of the consolidated accounts receivable balance was due from these customers. For the year ended
December 31, 2018
,
one
customer, EOG Resources, accounted for approximately
20%
of the Company’s consolidated revenues. As of
December 31, 2018
, approximately
12%
of the consolidated accounts receivable balance was due from this customer.
Note 11 — Income Taxes
Ranger, LLC is treated as a partnership for U.S. federal income tax purposes and is subject to Texas Margin Tax, however not subject to federal or state income taxation. As a member in Ranger, LLC, the Company is subject to U.S. taxation on its allocable share of U.S. taxable income and the non-controlling interest members will pay taxes with respect to their allocable share of U.S. taxable income.
The Company is a corporation and is subject to U.S. federal income tax. The effective U.S. federal income tax rate applicable to the Company for the years ended
December 31, 2019
and
2018
was
21%
. Total income tax expense for the year ended
December 31, 2019
differed from amounts computed by applying the U.S. federal statutory tax rate of
21%
primarily due to non-deductible expenses, other state taxes, in addition to the adjustment for non-controlling interest that is not subject to federal tax.
The Company currently believes that it is reasonably possible to achieve a three-year cumulative level of profitability within the next 12 months, and as early as the first half of 2020, which would enhance the ability to conclude that is it more likely than not that the deferred tax assets would be realized and support a release of a portion or substantially all of the valuation allowance. A release of the valuation allowance would result in the recognition of an increase in deferred tax assets and an income tax benefit in the period in which the release occurs, although the exact timing and amount of the release is subject to change based on numerous factors, including projections of future taxable income, which continues to be assessed based on available information each reporting period.
63
|
Year Ended December 31,
|
|||||||
|
2019
|
2018
|
||||||
|
Current provision (benefit)
|
|||||||
|
Federal
|
$
|
—
|
|
$
|
—
|
|
|
|
State
|
0.4
|
|
(0.2
|
)
|
|||
|
Total current provision (benefit)
|
0.4
|
|
(0.2
|
)
|
|||
|
Deferred provision (benefit)
|
|||||||
|
Federal
|
1.4
|
|
—
|
|
|||
|
State
|
0.4
|
|
0.2
|
|
|||
|
Total deferred expense (benefit)
|
1.8
|
|
0.2
|
|
|||
|
Income tax expense (benefit)
|
$
|
2.2
|
|
$
|
—
|
|
|
A reconciliation of the expected income tax expense on income (loss) before income taxes using the statutory federal income tax rate of
21%
for
2019
to income tax expense follows (in millions):
|
December 31,
|
|||||||
|
2019
|
2018
|
||||||
|
Income (loss) before income taxes
|
$
|
6.6
|
|
$
|
(5.8
|
)
|
|
|
Statutory rate
|
21
|
%
|
21
|
%
|
|||
|
Income tax expense (benefit) computed at statutory rate
|
1.4
|
|
(1.2
|
)
|
|||
|
Reconciling items
|
|||||||
|
State income taxes, net of federal tax benefit
|
0.9
|
|
—
|
|
|||
|
Nontaxable (loss) income allocated to non-controlling interest
|
(0.6
|
)
|
0.6
|
|
|||
|
Non-deductible expenses and other
|
0.5
|
|
0.6
|
|
|||
|
Income tax expense (benefit)
|
$
|
2.2
|
|
$
|
—
|
|
|
As a result of the Offering and subsequent reorganization, the Company recorded a deferred tax asset, however a full valuation allowance has been recorded to reduce the Company’s net deferred tax assets to an amount that is more likely than not to be realized and is based upon the uncertainty of the realization of certain federal and state deferred tax assets related to net operating loss carryforwards and other tax attributes. The tax effects of the cumulative temporary differences resulting in the net deferred income tax liability, which are shown in Other Long-Term Liabilities on the consolidated balance sheet, are as follows (in millions):
|
December 31,
|
|||||||
|
2019
|
2018
|
||||||
|
Deferred income tax assets
|
|||||||
|
Net operating loss carryforward
|
$
|
16.4
|
|
$
|
15.7
|
|
|
|
Valuation allowance
|
(3.5
|
)
|
(5.4
|
)
|
|||
|
Net non-current deferred income tax asset
|
12.9
|
|
10.3
|
|
|||
|
Deferred income tax liabilities
|
|||||||
|
Investment in partnership
|
(12.9
|
)
|
(10.3
|
)
|
|||
|
Property and equipment
|
(0.5
|
)
|
(0.2
|
)
|
|||
|
Total non-current deferred income tax liability
|
$
|
(0.5
|
)
|
$
|
(0.2
|
)
|
|
As of
December 31, 2019
, the Company has net operating loss carryforwards of approximately
$71.7 million
, consisting of
$10.8 million
of section 382 limited losses expiring beginning in 2033, an estimated
$20.6 million
of non-section 382 limited losses expiring beginning in
2038
and
$40.3 million
of non-section 382 limited losses which carryforward indefinitely.
64
Note 12 — Earnings (Loss) per Share
Earnings (loss) per share is based on the amount of income (loss) allocated to the shareholders and the weighted average number of shares outstanding during the period for each class of common stock. Diluted earnings (loss) per share is computed giving effect to all potentially dilutive shares. The following table presents the Company’s calculation of basic and diluted earnings or loss per share for the years ended
December 31, 2019
and
2018
(in millions, except share and per share data):
|
Year Ended December 31,
|
||||||||
|
2019
|
2018
|
|||||||
|
Income (loss) (numerator):
|
||||||||
|
Basic:
|
||||||||
|
Net income (loss) attributable to Ranger Energy Services, Inc.
|
$
|
1.8
|
|
$
|
(3.3
|
)
|
||
|
Net income (loss) attributable to Class A Common Stock
|
$
|
1.8
|
|
$
|
(3.3
|
)
|
||
|
Diluted:
|
||||||||
|
Net income (loss) attributable to Ranger Energy Services, Inc.
|
$
|
1.8
|
|
$
|
(3.3
|
)
|
||
|
Net income (loss) attributable to Class A Common Stock
|
$
|
1.8
|
|
$
|
(3.3
|
)
|
||
|
Weighted average shares (denominator):
|
||||||||
|
Weighted average number of shares - basic
|
8,634,013
|
|
8,425,593
|
|
||||
|
Weighted average number of shares - diluted
|
8,634,013
|
|
8,425,593
|
|
||||
|
Basic earnings (loss) per share
|
$
|
0.21
|
|
$
|
(0.39
|
)
|
||
|
Diluted earnings (loss) per share
|
$
|
0.21
|
|
$
|
(0.39
|
)
|
||
During the year ended
December 31, 2019
, the Company excluded
6.9 million
shares of Common Stock issuable upon conversion of the Company’s Class B Common Stock and
1.2 million
equity-based awards in calculating diluted earnings per share, as the effect was anti-dilutive. For the year ended
December 31, 2018
, the Company excluded
6.9 million
shares of Common Stock issuable upon conversion of the Company’s Class B Common Stock,
0.5 million
equity-based awards and
0.2 million
Common Stock issuable upon payment of CSL liability, in calculating diluted loss per share, as the effect was anti-dilutive.
Note 13 — Commitments and Contingencies
Legal Matters
During the year ended
December 31, 2018
, the Company provided notice to ESCO Leasing, LLC that the Company is seeking to be indemnified for breach of contract. The Company exercised its right to stop payments of the remaining principal balance of
$5.8 million
on the Seller’s Notes and any unpaid interest, pending resolution of certain indemnification claims.
From time to time, the Company is involved in various legal matters arising in the normal course of business. The Company does not believe that the ultimate resolution of these matters will have a material adverse effect on its consolidated financial position or results of operations.
Note 14 — Related Party Transactions
Stockholders’ Agreement
In connection with the Offering, Ranger entered into a stockholders’ agreement (the “Stockholders’ Agreement”) with the Existing Owners and the Bridge Loan Lenders (defined below). Among other things, the Stockholders’ Agreement provides CSL and Bayou Wells Holdings Company, LLC (“Bayou Holdings”) with the right to designate nominees to Ranger’s board of directors (each, as applicable, a “CSL Director” or “Bayou Director”) as follows:
|
•
|
for so long as CSL beneficially owns at least
50%
of Ranger’s common stock, at least
three
members of the Board of Directors shall be CSL Directors and at least
two
members of the Board of Directors shall be Bayou Directors (which may include Richard Agee, Brett Agee or any other person that may be designated by Bayou Holdings in accordance with the terms of the stockholders’ agreement);
|
|
•
|
for so long as CSL beneficially owns less than
50%
but at least
30%
of Ranger’s common stock, at least
three
members of the Board of Directors shall be CSL Directors;
|
65
|
•
|
for so long as CSL beneficially owns less than
30%
but at least
20%
of Ranger’s common stock, at least
two
members of the Board of Directors shall be CSL Directors;
|
|
•
|
for so long as CSL beneficially owns less than
20%
but at least
10%
of Ranger’s common stock, at least
one
member of the Board of Directors shall be a CSL Director; and
|
|
•
|
once CSL beneficially owns less than
10%
of Ranger’s common stock, CSL will not have any Board designation rights.
|
In the event the size of Ranger’s Board of Directors is increased or decreased at any time to other than
eight
directors, CSL’s nomination rights will be proportionately increased or decreased, respectively, rounded up to the nearest whole number.
Redemption Rights
Under the Ranger LLC Agreement, holders of Ranger Units other than the Company (the “Ranger Unit Holders”) will, subject to certain limitations, have the right, pursuant to the Redemption Right (as defined in the Ranger LLC Agreement), to cause Ranger LLC to acquire all or a portion of their Ranger Units (along with a corresponding number of shares of Ranger’s Class B Common Stock) for, at Ranger LLC's election, (i) shares of the Company’s Class A Common Stock at a redemption ratio of
one
share of Class A Common Stock for each Ranger Unit redeemed, subject to conversion rate adjustments for stock splits, stock dividends, reclassification and other similar transactions, or (ii) cash in an amount equal to the Cash Election Value (defined below) of such Class A Common Stock. Ranger LLC will determine whether to issue shares of Class A Common Stock or cash in an amount equal to the Cash Election Value based on facts in existence at the time of the decision, which the Company expects would include the trading prices for the Class A Common Stock at the time relative to the cash purchase price for the Ranger Units, the availability of other sources of liquidity (such as an issuance of preferred stock) to acquire the Ranger Units and alternative uses for such cash. Alternatively, upon the exercise of the Redemption Right, the Company (instead of Ranger LLC) will have the right, pursuant to the Call Right (as defined in the Ranger LLC Agreement), to, for administrative convenience, acquire each tendered Ranger Unit directly from such Ranger Unit Holder for, at the Company’s election, (x) one share of Class A Common Stock or (y) cash in an amount equal to the value of a share of Class A Common Stock, based on a volume-weighted average price. In addition, upon a change of control of the Company, the Company has the right to require each Ranger Unit Holder (other than the Company) to exercise its Redemption Right with respect to some or all of such unitholder’s Ranger Units. As the Ranger Unit Holders redeem their Ranger Units, the Company’s membership interest in Ranger LLC will be correspondingly increased, the number of shares of Class A Common Stock outstanding will be increased, and the number of shares of Class B Common Stock outstanding will be reduced.
The Company’s acquisition (or deemed acquisition for U.S. federal income tax purposes) of Ranger Units pursuant to an exercise of the Redemption Right or the Call Right is expected to result in adjustments to the tax basis of the tangible and intangible assets of Ranger LLC, and such adjustments will be allocated to the Company. These adjustments would not have been available to the Company absent the acquisition or deemed acquisition of Ranger Units and are expected to reduce the amount of cash tax that the Company would otherwise be required to pay in the future.
“Cash Election Value” means, with respect to the shares of Class A Common Stock to be delivered to the redeeming Ranger Unit Holder by us pursuant to our Call Right, the amount that would be received if the number of shares of Class A Common Stock to which the redeeming Ranger Unit Holder would otherwise be entitled were sold at a per share price equal to the trailing
10
-day volume weighted average price of a share of Class A Common Stock on such redemption, net of actual or deemed offering expenses.
Payments
In connection with the Master Reorganization Agreement, an aggregate of
$3.0 million
(included within other current liabilities on the accompanying consolidated balance sheet as of December 31, 2018) was settled by the Company and CSL Energy Holdings I, LLC and CSL Energy Holdings II, LLC during the year ended
December 31, 2019
. At the Company’s discretion the liability was settled with the issuance of
206,897
Class A Common Stock.
Tax Receivable Agreement
On
August 16, 2017
, in connection with the Offering, the Company entered into a Tax Receivable Agreement (the “TRA”) with certain of the existing Ranger Unit holders and their permitted transferees (each such person, a “TRA Holder” and together, the “TRA Holders”). The TRA generally provides for the payment by the Company of
85%
of the net cash savings, if any, in U.S. federal, state and local income tax and franchise tax that the Company actually realizes (computed using simplifying assumptions to address the impact of state and local taxes) or is deemed to realize in certain circumstances in periods after the Offering as a result of (i) certain increases in tax basis that occur as a result of the Company’s acquisition (or deemed acquisition for U.S. federal income tax purposes) of all or a portion of such TRA Holder’s Ranger Units in connection with the Offering or pursuant to the exercise of the Redemption Right or the Call Right (each as defined in the Amended and Restated Limited Liability Company Agreement of Ranger LLC) and (ii) imputed interest deemed to be paid by the Company as a result of, and
66
additional tax basis arising from, any payments the Company makes under the TRA. The Company will retain the benefit of the remaining
15%
of these cash savings. The term of the TRA commenced on August 16, 2017 and will continue until all tax benefits that are subject to the TRA (or the TRA is terminated due to other circumstances, including the Company’s breach of a material obligation thereunder or certain mergers, assets sales, other forms of business combination or other changes of control) have been utilized or expired, unless the Company exercises its right to terminate the TRA. The payments under the TRA will not be conditioned upon a TRA Holder having a continued ownership interest in either Ranger LLC or the Company.
If the Company elects to terminate the TRA early or the TRA is terminated due to other circumstances (including the Company’s breach of a material obligation thereunder or certain mergers, asset sales other forms of business combinations or other changes of control), its obligations under the TRA would accelerate and it would be required to make an immediate payment equal to the present value of the anticipated future tax payments to be made by the Company under the TRA (determined by applying a discount rate of one-year LIBOR plus
150
basis points and based upon certain assumptions and deemed events set forth in the TRA). In addition, payments due under the TRA will be similarly accelerated following certain mergers or other changes of control.
Registration Rights Agreement
On
August 16, 2017
, in connection with the closing of the Offering, the Company entered into a Registration Rights Agreement (the “Registration Rights Agreement”) with certain stockholders (the “Holders”).
Pursuant to, and subject to the limitations set forth in, the Registration Rights Agreement, at any time after the
180
-day lock-up period, the Holders have the right to require the Company by written notice to prepare and file a registration statement registering the offer and sale of a number of their shares of Class A Common Stock. Reasonably in advance of the filing of any such registration statement, the Company is required to provide notice of the request to all other Holders who may participate in the registration. The Company is required to use all commercially reasonable efforts to maintain the effectiveness of any such registration statement until all shares covered by such registration statement have been sold. Subject to certain exceptions, the Company is not obligated to effect such a registration within ninety
90
days after the closing of any underwritten offering of shares of Class A Common Stock requested by the Holders pursuant to the Registration Rights Agreements. The Company is also not obligated to effect any registration where such registration has been requested by the holders of Registrable Securities (as defined in the Registration Rights Agreement) which represent less than
$25 million
, based on the five-day volume weighted average trading price of the Class A Common Stock on the New York Stock Exchange.
In addition, pursuant to the Registration Rights Agreement, the Holders have the right to require the Company, subject to certain limitations set forth therein, to effect a distribution of any or all of their shares of Class A Common Stock by means of an underwritten offering. Further, subject to certain exceptions, if at any time the Company proposes to register an offering of its equity securities or conduct an underwritten offering, whether or not for its account, then the Company must notify the Holders of such proposal at least three business days before the anticipated filing date or commencement of the underwritten offering, as applicable, to allow them to include a specified number of their shares in that registration statement or underwritten offering, as applicable.
These registration rights are subject to certain conditions and limitations, including the right of the underwriters to limit the number of shares to be included in a registration or offering and the Company’s right to delay or withdraw a registration statement under certain circumstances. The Company will generally pay all registration expenses in connection with its obligations under the Registration Rights Agreement, regardless of whether a registration statement is filed or becomes effective.
The obligations to register shares under the Registration Rights Agreement will terminate as to any Holder when the Registrable Securities held by such Holder are no longer subject to any restrictions on trading under the provisions of Rule 144 under the Securities Act of 1933, as amended (the “Securities Act”), including any volume or manner of sale restrictions. Registrable Securities means all shares of Class A Common Stock owned at any particular point in time by a Holder other than shares (i) sold pursuant to an effective registration statement under the Securities Act, (ii) sold in a transaction pursuant to Rule 144 under the Securities Act, (iii) that have ceased to be outstanding or (iv) that are eligible for resale without restriction and without the need for current public information pursuant to any section of Rule 144 under the Securities Act.
Note 15 — Segment Reporting
The Company’s operations are located in the United States and organized into
three
reporting segments: High Specification Rigs, Completion and Other Services and Processing Solutions. The reportable segments comprise the structure used by the Chief Operating Decision Maker (“CODM”) to make key operating decisions and assess performance during the years presented in the accompanying consolidated financial statements. The reportable segments have been categorized based on services provided in each line of business. The CODM evaluates the segments’ operating performance based on multiple measures including Adjusted EBITDA, rig hours and rig utilization. The tables below present the operating income (loss) measurement, as the Company believes this is most consistent with the principals used in measuring the condensed consolidated financial statements.
67
The following is a description of the segments:
High Specification Rigs
.
The Company’s High Specification Rigs facilitate operations throughout the lifecycle of a well, including (i) completion (ii) workover; (iii) well maintenance; and (iv) decommissioning. The Company provides these advanced well services to Exploration & Production (“E&P”) companies, particularly to those operating in unconventional oil and natural gas reservoirs and requiring technically and operationally advanced services. The Company’s high specification rigs are designed to support growing U.S. horizontal well demands. In addition to the core well service rig operations, the Company offers a suite of complementary services, including fluid management and well service-related equipment rentals.
Completion and Other Services.
The Completion and Other Services segment provides wireline completion services necessary to bring a well on production and other ancillary services consisting primarily of the Company’s wireline and snubbing lines of business along with other, non-rig well services to maintain the production of a well.
Processing Solutions
.
The Company provides a range of proprietary, modular equipment for the processing of rich natural gas streams at the wellhead or central gathering points in basins where drilling and completion activity has outpaced the development of permanent processing infrastructure.
Other.
The Company incurs costs, indicated as Other, that are not allocable to any of the operating segments or lines of business and include corporate general and administrative expenses as well as depreciation of office furniture and fixtures and other corporate assets.
Segment information for the years ended
December 31, 2019
and
2018
is as follows (in millions):
|
Year Ended December 31, 2019
|
||||||||||||||||||||
|
High Specification Rigs
|
Completion and Other Services
|
Processing Solutions
|
Other
|
Total
|
||||||||||||||||
|
Revenues
|
$
|
132.1
|
|
$
|
184.3
|
|
$
|
20.5
|
|
$
|
—
|
|
$
|
336.9
|
|
|||||
|
Cost of services
|
114.8
|
|
139.0
|
|
9.2
|
|
—
|
|
263.0
|
|
||||||||||
|
General and administrative
|
—
|
|
—
|
|
—
|
|
26.7
|
|
26.7
|
|
||||||||||
|
Depreciation and amortization
|
20.1
|
|
11.4
|
|
2.2
|
|
1.1
|
|
34.8
|
|
||||||||||
|
Impairment of goodwill
|
—
|
|
—
|
|
—
|
|
—
|
|
—
|
|
||||||||||
|
Operating income (loss)
|
(2.8
|
)
|
33.9
|
|
9.1
|
|
(27.8
|
)
|
12.4
|
|
||||||||||
|
Interest expense, net
|
—
|
|
—
|
|
—
|
|
5.8
|
|
5.8
|
|
||||||||||
|
Income tax expense
|
—
|
|
—
|
|
—
|
|
2.2
|
|
2.2
|
|
||||||||||
|
Net income (loss)
|
$
|
(2.8
|
)
|
$
|
33.9
|
|
$
|
9.1
|
|
$
|
(35.8
|
)
|
$
|
4.4
|
|
|||||
|
Capital expenditures
|
$
|
11.1
|
|
$
|
4.1
|
|
$
|
7.8
|
|
$
|
0.5
|
|
$
|
23.5
|
|
|||||
|
As of December 31, 2019
|
||||||||||||||||||||
|
Property and equipment, net
|
$
|
132.2
|
|
$
|
40.8
|
|
$
|
40.5
|
|
$
|
5.4
|
|
$
|
218.9
|
|
|||||
|
Total assets
|
$
|
186.1
|
|
$
|
57.4
|
|
$
|
42.6
|
|
$
|
7.4
|
|
$
|
293.5
|
|
|||||
68
|
Year Ended December 31, 2018
|
||||||||||||||||||||
|
High Specification Rigs
|
Completion and Other Services
|
Processing Solutions
|
Other
|
Total
|
||||||||||||||||
|
Revenues
|
$
|
149.9
|
|
$
|
136.0
|
|
$
|
17.2
|
|
$
|
—
|
|
$
|
303.1
|
|
|||||
|
Cost of services
|
128.7
|
|
100.2
|
|
8.0
|
|
—
|
|
236.9
|
|
||||||||||
|
General and administrative
|
—
|
|
—
|
|
—
|
|
29.0
|
|
29.0
|
|
||||||||||
|
Depreciation and amortization
|
19.1
|
|
8.2
|
|
1.5
|
|
1.5
|
|
30.3
|
|
||||||||||
|
Impairment of goodwill
|
9.0
|
|
—
|
|
—
|
|
—
|
|
9.0
|
|
||||||||||
|
Operating income (loss)
|
(6.9
|
)
|
27.6
|
|
7.7
|
|
(30.5
|
)
|
(2.1
|
)
|
||||||||||
|
Interest expense, net
|
—
|
|
—
|
|
—
|
|
3.7
|
|
3.7
|
|
||||||||||
|
Income tax expense
|
—
|
|
—
|
|
—
|
|
—
|
|
—
|
|
||||||||||
|
Net income (loss)
|
$
|
(6.9
|
)
|
$
|
27.6
|
|
$
|
7.7
|
|
$
|
(34.2
|
)
|
$
|
(5.8
|
)
|
|||||
|
Capital expenditures
|
$
|
29.8
|
|
$
|
35.1
|
|
$
|
10.3
|
|
$
|
0.7
|
|
$
|
75.9
|
|
|||||
|
As of December 31, 2018
|
||||||||||||||||||||
|
Property and equipment, net
|
$
|
159.2
|
|
$
|
35.0
|
|
$
|
34.3
|
|
$
|
1.3
|
|
$
|
229.8
|
|
|||||
|
Total assets
|
$
|
214.1
|
|
$
|
47.0
|
|
$
|
40.1
|
|
$
|
1.3
|
|
$
|
302.5
|
|
|||||
Note 16 — Selected Quarterly Financial Data (Unaudited)
The following table summarizes the unaudited quarterly statements of the Company for
2019
and
2018
(in millions, except per share data):
|
Three months ended
|
||||||||||||||||
|
March 31,
|
June 30,
|
September 30,
|
December 31,
|
|||||||||||||
|
2019
|
||||||||||||||||
|
Total revenues
|
$
|
88.3
|
|
$
|
84.3
|
|
$
|
84.1
|
|
$
|
80.2
|
|
||||
|
Operating income
|
$
|
5.2
|
|
$
|
4.0
|
|
$
|
1.6
|
|
$
|
1.6
|
|
||||
|
Net income (loss)
|
$
|
3.6
|
|
$
|
1.8
|
|
$
|
(0.9
|
)
|
$
|
(0.1
|
)
|
||||
|
Net income (loss) attributable to Ranger Energy Services, Inc.
|
$
|
2.0
|
|
$
|
1.0
|
|
$
|
(0.5
|
)
|
$
|
(0.7
|
)
|
||||
|
Basic earnings (loss) per share
|
$
|
0.24
|
|
$
|
0.12
|
|
$
|
(0.06
|
)
|
$
|
(0.01
|
)
|
||||
|
Diluted earnings (loss) per share
|
$
|
0.19
|
|
$
|
0.10
|
|
$
|
(0.06
|
)
|
$
|
(0.01
|
)
|
||||
|
2018
|
||||||||||||||||
|
Total revenues
|
$
|
62.6
|
|
$
|
73.1
|
|
$
|
82.1
|
|
$
|
85.3
|
|
||||
|
Operating income (loss)
|
$
|
(10.8
|
)
|
$
|
1.0
|
|
$
|
4.4
|
|
$
|
3.3
|
|
||||
|
Net income (loss)
|
$
|
(10.3
|
)
|
$
|
(1.2
|
)
|
$
|
4.0
|
|
$
|
1.7
|
|
||||
|
Net income (loss) attributable to Ranger Energy Services, Inc.
|
$
|
(5.7
|
)
|
$
|
(0.7
|
)
|
$
|
2.1
|
|
$
|
1.0
|
|
||||
|
Basic net income (loss) per share
|
$
|
(0.68
|
)
|
$
|
(0.08
|
)
|
$
|
0.24
|
|
$
|
0.12
|
|
||||
|
Diluted net income (loss) per share
|
$
|
(0.68
|
)
|
$
|
(0.08
|
)
|
$
|
0.23
|
|
$
|
0.11
|
|
||||
Immaterial Correction
During the preparation of the consolidated financial statements for the year ended December 31, 2019, we identified that the diluted weighted average number of shares and diluted earnings per share amounts for the quarterly periods ended March 31, June 30 and September 30, 2019 and related footnote disclosures were misstated in the interim financial statements filed on Form 10-Q due to a misapplication of the if-converted method of calculating diluted earnings per share. Other than as noted below, this error had no impact on the interim financial statements for the quarters ended March 31, June 30 and September 30, 2019.
For the period ended March 31, 2019, diluted weighted average shares should have been
15,614,429
instead of
9,730,710
, and diluted earnings per share should have been
$0.19
instead of
$0.21
. For the three months ended June 30, 2019, diluted weighted average shares should have been
15,412,431
instead of
9,491,683
, and diluted earnings per share should have been
$0.10
instead of
$0.11
. For the six months ended June 30, 2019, diluted weighted average shares should have been
15,361,162
instead of
9,458,976
, and diluted earnings per share should have been
$0.29
instead of
$0.32
. For the nine months ended September 30, 2019, diluted weighted average shares should have been
15,457,282
instead of
9,459,785
, and diluted earnings per share should have been
$0.25
instead of
$0.26
.
69
Management evaluated the error on previously issued financial statements and concluded the impact was immaterial. These amounts and related footnote disclosures will be revised when the March 31, June 30 and September 30, 2020, financial information is filed.
70
Item 9. Changes in and Disagreements with Accountants on Accounting and Financial Disclosures
Not applicable.
Item 9A. Controls and Procedures
Evaluation of Disclosure Controls and Procedures
As required by Rule 13a‑15(e) under the Exchange Act, we have evaluated, under the supervision and with the participation of management, including our chief executive officer and chief financial officer, the effectiveness of the design and operation of our disclosure controls and procedures (as defined in Rules 13a-15(e) and 15d‑15(e) under the Exchange Act) as of the end of the period covered by this Annual Report on Form 10-K. Our disclosure controls and procedures are designed to provide reasonable assurance that the information required to be disclosed by us in reports that we file or submit under the Exchange Act is accumulated and communicated to management, including our chief executive officer and chief financial officer, as appropriate, to allow timely decisions regarding required disclosure and is recorded, processed, summarized and reported within the time periods specified in the rules and forms of the SEC. Any controls and procedures, no matter how well designed and operated can only provide reasonable assurance of achieving the desired control objective and management necessarily applies its judgment in evaluating the cost-benefit relationship of all possible controls and procedures. Based upon this evaluation our principal executive officer and principal financial officer concluded that our disclosure controls and procedures were effective as of the end of the period covered by this Annual Report, at a reasonable assurance level.
Management’s Annual Report on Internal Control Over Financial Reporting
Management is responsible for establishing and maintaining adequate internal control over financial reporting as such term is defined in Exchange Act Rule 13a-15(f).
The internal control over financial reporting is a process designed under the supervision and with the participation of our principal executive officer and principal financial officer, and effected by the board of directors, management and other personnel, to provide reasonable assurance regarding the reliability of financial reporting and the preparation of the financial statements for external reporting purposes in accordance with generally accepted accounting principles.
Our internal control over financial reporting includes policies and procedures that:
|
•
|
pertain to the maintenance of records that in reasonable detail accurately and fairly reflect transactions of the Company;
|
|
•
|
provide reasonable assurance that transactions are recorded as necessary to permit preparation of financial statements in accordance with generally accepted accounting principles; and
|
|
•
|
provide reasonable assurance regarding prevention or timely detection of unauthorized transactions.
|
Because of its inherent limitations, internal control over financial reporting may not prevent or detect misstatements. Also, projections of any evaluations of effectiveness to future periods are subject to the risk that controls may become inadequate because of changes in conditions, or that the degree of compliance with our policies or procedures may deteriorate.
Management assessed the effectiveness of the Company’s internal control over financial reporting as of
December 31, 2019
, with the participation of our principal executive and principal financial officers, based on the framework established in Internal Control—Integrated Framework (2013) issued by the Committee of Sponsoring Organizations of the Treadway Commission, or COSO. Based on this assessment, management concluded that the Company maintained effective internal control over financial reporting as of
December 31, 2019
.
Attestation Report of the Registered Public Accounting Firm
Our independent registered public accounting firm will not be required to formally attest to the effectiveness of our internal controls over financial reporting for as long as we are an “emerging growth company” pursuant to the provisions of the JOBS Act.
Changes in Internal Control over Financial Reporting
There were no changes in our internal control over financial reporting during the year ended
December 31, 2019
that materially affected, or are reasonably likely to materially affect, our internal control over financial reporting.
Item 9B. Other Information
Not applicable.
71
PART III
Item 10. Directors, Executive Officers and Corporate Governance
Please see the information appearing in the proposal for the election of directors and under the headings “Executive Officers,” “Information Concerning Meetings and Committees of the Board of Directors,” “Code of Business Conduct and Ethics and Corporate Governance Guidelines” and “Delinquent Section 16(a) Reports” in the definitive proxy statement for our
2020
Annual Meeting of Shareholders for the information this Item 10 requires that is incorporated herein by reference.
Item 11. Executive Compensation
Please see the information appearing under the headings “Compensation Discussion and Analysis,” “Director Compensation,” “Executive Compensation,” “Compensation Committee Interlocks and Insider Participation” and “Report of the Compensation Committee” in the definitive proxy statement for our
2020
Annual Meeting of Shareholders for the information this Item 11 requires that is incorporated herein by reference.
Item 12. Security Ownership of Certain Beneficial Owners and Management and Related Stockholder Matters
Please see the information appearing under the heading “Security Ownership of Certain Beneficial Owners and Management” in the definitive proxy statement for our
2020
Annual Meeting of Shareholders for the information this Item 12 requires that is incorporated herein by reference.
Item 13. Certain Relationships and Related Transactions and Director Independence
Please see the information appearing in the proposal for the election of directors and under the heading “Certain Relationships and Related Transactions” in the definitive proxy statement for our
2020
Annual Meeting of Shareholders for the information this Item 13 requires that is incorporated herein by reference.
Item 14. Principal Accounting Fees and Services
Please see the information appearing in the proposal for the ratification of the appointment of our independent registered public accounting firm in the definitive proxy statement for our
2020
Annual Meeting of Shareholders for the information this Item 14 requires that is incorporated herein by reference.
72
PART IV
Item 15. Exhibits, Financial Statement Schedules
Financial Statements.
See index to Consolidated Financial Statements included beginning on Page 46.
Financial Statement Schedules.
No other financial statement schedules are submitted because either they are inapplicable or because the required information is included in the consolidated financial statements or notes thereto.
Exhibits.
The exhibits listed on the accompanying Exhibit Index are filed, furnished or incorporated by reference as part of this Annual Report, and such Exhibit Index is incorporated herein by reference.
|
Exhibit
Number
|
Description
|
||
|
2.1††
|
|
||
|
2.2††
|
|
||
|
3.1
|
|
||
|
3.2
|
|
||
|
**4.1
|
|
||
|
4.2
|
|
||
|
4.3
|
|
||
|
10.1
|
|
||
|
10.2†
|
|
||
|
10.3†
|
|
||
|
10.4†
|
|
||
|
10.5
|
|
||
|
10.6
|
|
||
|
10.7†
|
|
||
|
10.8†
|
|
||
73
|
10.9†
|
|
||
|
10.10†
|
|
||
|
10.11†
|
|
||
|
10.12†
|
|
||
|
10.13†
|
|
||
|
10.14†
|
|
||
|
10.15
|
|
||
|
10.16
|
|
||
|
10.17
|
|
||
|
10.18
|
|
||
|
10.19
|
|
||
|
10.20
|
|
||
|
*10.21†
|
|
||
|
10.22†
|
|
||
|
10.23
|
|
||
|
*21.1
|
|
||
|
*23.1
|
|
||
|
*31.1
|
|
||
|
*31.2
|
|
||
|
**32.1
|
|
||
|
**32.2
|
|
||
|
*101.CAL
|
|
XBRL Calculation Linkbase Document
|
|
|
*101.DEF
|
|
XBRL Definition Linkbase Document
|
|
|
*101.INS
|
|
XBRL Instance Document
|
|
|
*101.LAB
|
|
XBRL Labels Linkbase Document
|
|
|
*101.PRE
|
|
XBRL Presentation Linkbase Document
|
|
|
*101.SCH
|
|
XBRL Schema Document
|
|
|
*
|
Filed as an exhibit to this Annual Report on Form 10-K
|
|
|
**
|
Furnished as an exhibit to this Annual Report on Form 10-K
|
|
|
†
|
Compensatory plan or arrangement
|
|
|
††
|
Schedules and similar attachments have been omitted pursuant to Item 601(b)(2) of Regulation S-K. The registrant will furnish a supplemental copy of any omitted schedule or similar attachment to the SEC upon request.
|
|
74
Item 16. Form 10-K Summary
None.
SIGNATURES
Pursuant to the requirements of Section 13 or 15(d) of the Securities Exchange Act of 1934, the registrant has duly caused this Annual Report to be signed on its behalf by the undersigned, thereunto duly authorized.
|
Ranger Energy Services, Inc.
|
||
|
/s/ Darron M. Anderson
|
February 28, 2020
|
|
|
Darron M. Anderson
|
Date
|
|
|
President, Chief Executive Officer and Director
|
||
|
(Principal Executive Officer)
|
||
Pursuant to the requirements of the Securities Exchange Act of 1934, this Annual Report has been signed below by the following persons on behalf of the registrant and in the capacities and on the dates indicated.
|
Signature
|
Title
|
Date
|
||
|
/s/ Darron M. Anderson
|
President, Chief Executive Officer and Director
|
February 28, 2020
|
||
|
Darron M. Anderson
|
(Principal Executive Officer)
|
|||
|
/s/ J. Brandon Blossman
|
Chief Financial Officer
|
February 28, 2020
|
||
|
J. Brandon Blossman
|
(Principal Financial Officer)
|
|||
|
/s/ Mario H. Hernandez
|
Chief Accounting Officer
|
February 28, 2020
|
||
|
Mario H. Hernandez
|
(Principal Accounting Officer)
|
|||
|
/s/ Merrill A. Miller Jr.
|
Chairman of the Board
|
February 28, 2020
|
||
|
Merrill A. Miller, Jr.
|
||||
|
/s/ William M. Austin
|
Director
|
February 28, 2020
|
||
|
William M. Austin
|
||||
|
/s/ Brett T. Agee
|
Director
|
February 28, 2020
|
||
|
Brett T. Agee
|
||||
|
/s/ Richard E. Agee
|
Director
|
February 28, 2020
|
||
|
Richard E. Agee
|
||||
|
/s/ Krishna Shivram
|
Director
|
February 28, 2020
|
||
|
Krishna Shivram
|
||||
|
/s/ Charles S. Leykum
|
Director
|
February 28, 2020
|
||
|
Charles S. Leykum
|
||||
|
/s/ Gerald C. Cimador
|
Director
|
February 28, 2020
|
||
|
Gerald C. Cimador
|
||||
|
/s/ Michael C. Kearney
|
Director
|
February 28, 2020
|
||
|
Michael C. Kearney
|
||||
75
TABLE OF CONTENTS
Part IItem 1. BusinessNote 15 Segment ReportingItem 1A. Risk FactorsItem 1B. Unresolved Staff CommentsItem 2. PropertiesItem 3. Legal ProceedingsNote 13 Commitments and ContingenciesItem 4. Mine Safety DisclosurePart IIItem 5. Market For Registrant's Common Equity, Related Stockholders' Matters and Issuer Purchases Of EquityItem 6. Selected Financial DataItem 7. Management S Discussion and Analysis Of Financial Condition and Results Of OperationsNote 2 Summary Of Significant Accounting PoliciesItem 7A. Quantitative and Qualitative Disclosures About Market RisksItem 8. Financial Statements and Supplementary DataNote 1 Organization and Business OperationsNote 5 Goodwill and Intangible AssetsNote 7 LeasesNote 3 AcquisitionNote 4 Property and EquipmentNote 6 Accrued ExpensesNote 8 DebtNote 9 EquityNote 10 Risk ConcentrationsNote 11 Income TaxesNote 12 Earnings (loss) Per ShareNote 14 Related Party TransactionsNote 16 Selected Quarterly Financial Data (unaudited)Item 9. Changes in and Disagreements with Accountants on Accounting and Financial DisclosuresItem 9A. Controls and ProceduresItem 9B. Other InformationPart IIIItem 10. Directors, Executive Officers and Corporate GovernanceItem 11. Executive CompensationItem 12. Security Ownership Of Certain Beneficial Owners and Management and Related Stockholder MattersItem 13. Certain Relationships and Related Transactions and Director IndependenceItem 14. Principal Accounting Fees and ServicesPart IVItem 15. Exhibits, Financial Statement SchedulesItem 16. Form 10-k Summary