GIBRALTAR INDUSTRIES, INC.
10-Ks and 10-Qs
|
|
|
|
|
|
|
|
|
|
|
|
|
|
|
|
|
|
|
|
|
|
|
|
|
|
|
|
|
|
|
|
|
|
|
|
|
|
|
|
|
|
|
|
|
|
|
|
|
|
|
|
|
|
|
|
UNITED STATES SECURITIES AND EXCHANGE COMMISSION
Washington, D.C. 20549

FORM 10-K
(Mark One)
|
x
|
ANNUAL REPORT PURSUANT TO SECTION 13 OR 15 (d) OF THE SECURITIES ACT OF 1934
|
|
For The Fiscal Year Ended December 31, 2015
|
|
|
OR
|
|
|
¨
|
TRANSITION REPORT PURSUANT TO SECTION 13 OR 15 (d) OF THE SECURITIES EXCHANGE ACT OF 1934
|
|
For the transition period from
to
|
|
|
Commission File Number 0-22462
|
|
GIBRALTAR INDUSTRIES, INC.
(Exact name of Registrant as specified in its charter)
|
Delaware
|
|
16-1445150
|
|
(State or other jurisdiction of incorporation organization)
|
|
(I.R.S. Employer Identification No.)
|
|
3556 Lake Shore Road, P.O. Box 2028
Buffalo, New York
|
|
14219-0228
|
|
(address of principal executive offices)
|
|
(zip code)
|
|
Registrant’s telephone number, including area code: (716) 826-6500
|
||
|
Securities registered pursuant to Section 12(b) of the Act:
|
||
|
Title of each class
|
|
Name of each exchange on which registered
|
|
Common Stock, $0.01 par value
|
|
NASDAQ Global Select Market
|
Securities registered pursuant to Section 12(g) of the Act: NONE
Indicate by checkmark if the registrant is a well-known seasoned issuer, as defined in Rule 405 of the Securities Act. Yes
¨
No
x
.
Indicate by checkmark if the registrant is not required to file report pursuant to Section 13 or Section 15(d) of the Act. Yes
¨
No
x
.
Indicate by check mark whether the registrant (1) has filed all reports required to be filed by Section 13 or 15(d) of the Securities Exchange Act of 1934 during the preceding 12 months (or for such shorter period that the registrant was required to file such reports), and (2) has been subject to such filing requirements for the past 90 days. Yes
x
No
¨
.
Indicate by check mark whether the registrant has submitted electronically and posted on its corporate Website, if any, every Interactive Data File required to be submitted and posted pursuant to Rule 405 of Regulation S-T (§232.405 of this chapter) during the preceding 12 months (or for such shorter period that the registrant was required to submit and post such files). Yes
x
No
¨
.
Indicate by check mark if disclosure of delinquent filers pursuant to Item 405 of Regulation S-K is not contained herein, and will not be contained, to the best of the Registrant’s knowledge, in definitive proxy or information statements incorporated by reference in Part III of the Form 10-K or any amendment to this Form 10-K.
¨
Indicate by checkmark whether the registrant is a large accelerated filer, an accelerated filer, a non-accelerated filer, or a smaller reporting company. See the definition of “large accelerated filer”, “accelerated filer”, and “small reporting company” in Rule 12b-2 of the Exchange Act.
|
Large accelerated filer
|
¨
|
Accelerated filer
|
x
|
Non-accelerated filer
|
¨
|
Smaller reporting company
|
¨
|
Indicate by checkmark whether the registrant is a shell company (as defined in Rule 12b-2 of the Act). Yes
¨
No
x
The aggregate market value of the Common Stock outstanding and held by non-affiliates (as defined in Rule 405 under the Securities Act of 1933) of the registrant based upon the closing sale price of the Common Stock on the NASDAQ Global Select Market on
June 30, 2015
, the last business day of the registrant’s most recently completed second quarter, was approximately
$627.5 million
.
As of
February 16, 2016
, the number of common shares outstanding was:
31,318,773
DOCUMENTS INCORPORATED BY REFERENCE
Portions of the Registrant’s Definitive Proxy Statement for the Annual Meeting of Shareholders
(2015 Proxy Statement) are incorporated by reference into Part III of this report.
Exhibit Index begins on Page
98
Form 10-K Index
|
|
|
Page
Number
|
|
Item 1
|
||
|
Item 1A
|
||
|
Item 1B
|
||
|
Item 2
|
||
|
Item 3
|
||
|
Item 4
|
||
|
Item 5
|
||
|
Item 6
|
||
|
Item 7
|
||
|
Item 7A
|
||
|
Item 8
|
||
|
Item 9
|
||
|
Item 9A
|
||
|
Item 10
|
||
|
Item 11
|
||
|
Item 12
|
||
|
Item 13
|
||
|
Item 14
|
||
|
Item 15
|
||
2
Safe Harbor Statement
Certain information set forth herein includes statements that express our opinions, expectations, beliefs, plans, objectives, assumptions or projections regarding future events or future results and, therefore, are, or may be deemed to be, “forward-looking statements.” These forward-looking statements can generally be identified by the use of forward-looking terminology, including the terms “believes,” “estimates,” “anticipates,” “expects,” “estimates,” “seeks,” “projects,” “intends,” “plans,” “may,” “will” or “should” or, in each case, their negative or other variations or comparable terminology. These forward-looking statements include all matters that are not historical facts. They include statements regarding our intentions, beliefs or current expectations concerning, among other things, our results of operations, financial condition, liquidity, prospects, growth, competition, strategies and the industry in which we operate. By their nature, forward-looking statements involve risks and uncertainties because they relate to events and depend on circumstances that may or may not occur in the future. We believe that these risks and uncertainties include, but are not limited to, those described in Item 1A “Risk Factors.” Those factors should not be construed as exhaustive and should be read with the other cautionary statements in Item 1A “Risk Factors”. Although we base these forward-looking statements on assumptions that we believe are reasonable when made, we caution you that forward-looking statements are not guarantees of future performance and that our actual results of operations, financial condition and liquidity and the development of the industries in which we operate may differ materially from those made in or suggested by the forward-looking statements contained herein. In addition, even if our results of operations, financial condition and liquidity and the development of the industries in which we operate are consistent with the forward-looking statements contained in this document, those results or developments may not be indicative of results or developments in subsequent periods. Given these risks and uncertainties, you are cautioned not to place undue reliance on these forward-looking statements. Any forward-looking statements that we make herein speak only as of the date of those statements, and we undertake no obligation to update those statements or to publicly announce the results of any revisions to any of those statements to reflect future events or developments. Comparisons of results for current and any prior periods are not intended to express any future trends or indications of future performance, unless expressed as such, and should only be viewed as historical data.
|
Item 1.
|
Business
|
The Company
Gibraltar Industries, Inc. (the "Company") is a leading manufacturer and distributor of building products for industrial, transportation infrastructure, residential housing, renewable energy and resource conservation markets. Beginning in mid-2014, led by new executive leadership, the Company began a re-examination of its operations, competitive advantages, and strategies, all directed at re-setting a business strategy that would significantly elevate and accelerate the growth and financial returns of the Company. The new strategy, completed in late 2014, with execution initiated in 2015, is targeted at delivering best-in-class, sustainable value creation for our shareholders for the long-term. This value-generating strategy is intended to drive a transformational change in the Company’s portfolio and its financial results; and it has four key elements: operational excellence, product innovation, portfolio management, and acquisitions as a strategic accelerator.
Operational excellence is our first pillar in this strategy. 80/20 simplification ("80/20") is core to this part of the strategy which is based on the proven theory that 25% of the customers typically generate 89% of the revenue in a business, and 150% of the profitability. We are refocusing on the relatively small set of customers who bring in the vast majority of our revenue and profits, while working to raise other customers’ sales and margin profiles in a fair and responsible manner. Along these same lines, 25% of a company’s products are typically responsible for 89% of the revenue, so at the same time, we are focusing our resources on the high-volume customers and products that provide us with the greatest return.
We started the simplification process in the fourth quarter of 2014, with a comprehensive data analysis. We initiated execution in 2015 and are still in the early stages of implementation. We believe that over the first three years, we will drive 200 to 300 basis points of operating margin improvement from the 80/20 process with corresponding benefits from the resulting reduction of operational assets.
Product innovation is our second strategic pillar. Innovation is about allocating new and existing resources to opportunities that drive sustainable returns. We are focused on those products and technologies that have relevance to the end-user and can be differentiated from our competition. Our focus on innovation is centered on four areas: postal and parcel products, residential air management, infrastructure, and renewable energy. These respective markets are expected to grow based on demand for centralized mail and parcel delivery systems; zero carbon footprint homes; the large proportion of elevated bridges being structurally deficient or functionally obsolete; and energy sources not dependent on fossil fuels.
3
The third pillar of our strategy is portfolio management, which is a natural adjunct to the 80/20 initiative. Using the 80/20 process, we are evaluating all aspects of our current portfolio for future profitable growth and greater shareholder returns which will lead to consideration of any necessary refinements.
The final pillar of our strategy is acquisitions. We are focused on making strategic acquisitions in five key markets, four of which are served by existing platforms within the Company, including one platform acquired in June 2015, and the other is new. The existing platforms include the same areas where we are targeting the development of innovative products: postal and parcel solutions, infrastructure, residential air management and renewable energy. The remaining new platform is water management. What these growth platforms all have in common is that they are all large markets in which the underlying trends for customer convenience and safety, energy-savings and resource conservation are of increasing importance and are expected to drive long-term demand. These markets also offer the opportunity for higher returns on our investments than what we have generated in the past. The acquisition of Rough Brothers Manufacturing, Inc., RBI Solar, Inc., and affiliates, collectively known as "RBI" in June 2015 was the direct result of this fourth initiative.
The Company serves customers primarily throughout North America, Europe, and, to a lesser extent Asia. Our customers include major home improvement retailers, wholesalers, industrial distributors, contractors, solar developers and institutional and commercial growers of plants. As of
December 31, 2015
, we operated
48
facilities in
19
states, Canada, England, Germany, China and Japan which includes
33
manufacturing facilities and
eight
distribution centers, giving us a base of operations to provide customer support, delivery, service and quality to a number of regional and national customers and providing us with manufacturing and distribution efficiencies in North America, as well as a presence in the European and Asian markets.
The Company operates and reports its results in the following three operating segments, entitled “Residential Products”, “Industrial and Infrastructure Products” and "Renewable Energy and Conservation".
Our Residential Products segment focuses on the new residential housing construction and residential repair and remodeling activity. Its products are sold through major retail home centers, building material wholesalers, buying groups, roofing distributors, and residential contractors.
Our Industrial and Infrastructure Products segment focuses on a variety of markets including discrete and process manufacturing, highway and bridge construction markets, energy and power generation. This segment’s products are distributed through industrial, commercial and transportation contractors, industrial distributors and original equipment manufacturers.
Our Renewable Energy and Conservation segment focuses on the design, engineering, manufacturing and installation of solar racking systems and greenhouse structures. This segment's services and products are provided directly to end users and through product distribution channels.
The following table sets forth the primary products, applications, and end markets for each segment:
Residential Products Segment
|
Product
|
|
Applications
|
|
|
|
End Market
|
|
Roof & foundation ventilation products
|
|
Ventilation & whole-house air flow
|
|

|
|
Residential: new construction and repair and remodeling
|
|
Postal and parcel storage (single and cluster)
|
|
Secure storage for mail and package deliveries
|
|
|
||
|
Rain dispersion, trims and flashings, other accessories
|
|
Water protection; sun protection
|
|
|
||
4
Industrial and Infrastructure Products Segment
|
Product
|
|
Applications
|
|
End Market
|
|
Bar grating
|
|
Flooring, walkways, platforms, safety barriers
|
|
Discrete and process manufacturing; energy; power generation
|
|
Expanded metal and perforated metal
|
|
Security barriers / fencing; walkways / catwalks; filtration; architectural facades
|
|
Low-rise commercial; leisure and hospitality; automotive
|
|
Structural bearings and expansion joints for bridges and other structures
|
|
Preserve functionality under varying weight, wind, heat and seismic conditions
|
|
Bridge and elevated highway construction
|
Renewable Energy and Conservation Segment
|
Product
|
|
Applications
|
|
End Users
|
|
Solar racking systems: design, manufacture & installation
|
|
Ground mounts; roof mounts; canopies for carports
|
|
Solar developers; power companies; solar energy EPC contractors
|
|
Greenhouses: design, manufacture & installation
|
|
Retail, commercial, institutional & conservatories
|
|
Retail garden centers; conservatories & botanical gardens; commercial growers; schools & universities, car washes
|
We believe that we have established a reputation as an industry leader in our operating segments with respect to quality, service and innovation and have achieved strong competitive positions in our markets. We attribute our standing in the markets primarily to the following competitive strengths:
Leading market share.
We have a leading market position in many of the products and services we offer, and we estimate that a majority of our net sales for the year ended
December 31, 2015
were derived from the sale of products in which we had one of the leading U.S. market shares. We believe we have leading market shares in four distinct product families: roof-related ventilation; postal and parcel storage; bar grating; and structural bearings and expansion joints for bridges and other structures.
Furthermore, as a result of the acquisition of RBI, we are one of the leading manufacturers of greenhouses for retail and institutional applications in the U.S., as well as, one of the U.S.'s fastest growing providers of racking for photovoltaic solar systems.
Provider of value-added products and services.
We increasingly focus on value-added products and services, such as mail and package storage solutions, expansion joints and structural bearings for roadways and bridges, ventilation products, solar racking systems, and greenhouses for innovative business opportunities to improve our margins and profitability. Our products use complex and demanding production and treatment processes that require advanced production equipment, sophisticated technology and exacting quality control measures, along with specialized design and engineering skills. We have also targeted our acquisition strategy on manufacturers of innovative value-added products in key growth markets.
Solid relationships with blue-chip customers.
We have strong relationships with our customers, which include some of the largest distributors, retailers, institutional customers and contractors in the markets we serve. We have gained long-standing relationships, and we maintain and develop those relationships by offering an increasing range of products and providing quality customer support.
Commitment to quality
. We place great importance on providing our customers with high quality products for use in critical construction applications. We carefully select our raw material vendors and use inspection and analysis to maintain our quality standards so our products meet critical customer specifications. To meet customer specifications, we use documented procedures utilizing statistical process control systems linked directly to processing equipment to monitor many stages of production. A number of our facilities’ quality systems are registered under ISO 9001, an internationally recognized set of quality-assurance standards, and other industry standards.
5
Strong liquidity profile
. We strive to manage our cash resources to ensure we have sufficient liquidity to support the seasonality of our businesses, potential downturns in economic activity, and to fund growth initiatives. During the year ended
December 31, 2015
, we financed the purchase of RBI through a combination of approximately $118 million of cash on hand and borrowings of $30 million under the Company's revolving credit facility. These borrowings were subsequently paid prior to the end of 2015. Our liquidity as of
December 31, 2015
was $
348 million
, including
$69 million
of cash and $279 million of availability under our revolving credit facility. We believe that our low leverage and ample liquidity allow us to successfully manage our business, meet the demands of our customers, weather the cyclicality of certain end markets and take advantage of growth opportunities.
History of growth through acquisitions.
Over the last decade, we also have grown through acquisitions, such as RBI, (solar racking systems and greenhouses), D.S. Brown (expansion joints and bearing for roads and bridges), and Florence Manufacturing (mail storage), to help diversify our products and customers while growing our net sales and earnings, and improving our operating characteristics. One of the key pillars of our Company's value-generating strategy is to use acquisitions as a strategic accelerator to drive a transformational change in our portfolio and its financial results.
Recent developments
On June 9, 2015, the Company acquired RBI for
$148 million
. RBI has established itself during the past six years among North America’s fastest-growing providers of solar racking solutions and is also one of the largest manufacturers of commercial greenhouses in North America. RBI is a full service provider that engineers, manufactures and installs solar racking systems for solar developers and power companies. In addition, RBI designs, manufactures and erects greenhouses for commercial, institutional and retail customers. The acquisition of RBI is expected to enable the Company to leverage its expertise in structural metals manufacturing, materials sourcing and logistics to help meet the fast-growing global demand for solar racking solutions. The results of RBI have been included in the Company’s consolidated financial results since the date of the acquisition. The acquisition was financed through cash on hand and borrowings under our revolving credit facility.
Structured succession plan.
As part of a multi-year strategy developed by the Company's Board of Directors, an executive search committee was created to execute a leadership succession plan. The executive search committee consisted of Board members who used an outside search firm to identify potential candidates to fill the vacated President and Chief Operating Officer role and eventually assume the Chief Executive Office role. After an extensive search process, Frank Heard was hired in May 2014 as President and Chief Operating Officer. Mr. Heard joined our Company with extensive experience in the building products industry, including his 32 years of employment at Illinois Tool Works, Inc. In December 2014, the Board announced the appointment of Mr. Heard as Chief Executive Officer (CEO) and a member of the Board of Directors effective January 1, 2015.
Mr. Heard succeeded Brian Lipke who had been our CEO since 1987, the Chairman of our Board since 1992 and a director since the Company’s initial public offering. Mr. Lipke announced in October 2014 his intention to retire. He served as CEO through January 1, 2015 and as Executive Chairman of the Board until May 31, 2015 when he retired from the Board. At that time, William Montague, the Company’s Lead Independent Director was elected as Chairman of the Board.
In conjunction with the succession plan, several transitions were made on the Board of Directors in 2014 and 2015. Two directors retired at the end of 2014, three other directors, including Mr. Lipke, retired in 2015, and one additional director will retire in May 2016. Three new board members were elected and began service during 2014. In 2015, two additional new members were elected and began service during the year. The election and service of the new directors in both years occurred prior to the retirements of the seasoned directors in order to facilitate a smooth transition upon these retirements. These new board members bring a complement of industry, organizational development and governmental experience to the board.
Experienced Management Team.
Our executive management team is composed of talented and experienced managers possessing broad experience in operational excellence, new product development, and driving profitable growth gained over multiple business cycles. Along with the employment of Mr. Heard in 2014 as President and subsequent appointment as CEO, we made other senior leadership changes in early 2015, including the hiring and appointment of Kevin Viravec, the Industrial and Infrastructure Products President, along with the hiring of Paul Plourde, in the newly created position as leader of business development. Other developments include changes in leadership effective early 2015 in our Residential Products segment for both our postal and parcel products and our ventilation and roofing-related products, where Stephen Duffy and Charles Jerasa assumed new leadership positions, respectively. The acquisition of RBI resulted in the experienced hire of Rich Reilly, leader of the renewable energy group.
6
Economic Trends
End markets served by our business are subject to economic conditions which include but are not limited to interest rates, exchange rates, commodity costs, demand for residential construction, demand for repair and remodeling, government funding, tax policies and incentives, the level of industrial construction and transportation infrastructure projects, and demand for renewable energy sources.
During 2015 and 2014, residential construction markets continued to steadily and slowly improve with U.S. new housing starts reaching 1.1 million in 2015. Residential repair and remodel activity also continued to improve over the past two years, along with a slight increase in re-roofing activity, which correlates to demand for our roof-related products. While a slight market lift from the residential housing market was experienced during 2015, we generated incremental sales of our centralized mail storage products as postal authorities undertook an initial effort to transition from door-to-door delivery.
In our Industrial and Infrastructure Products segment, sales declined for 2015. The sales decrease was primarily impacted by a volume decline in our industrial products sold to the energy-related sector resulting from lower oil and gas prices as compared to 2014. Demand for our infrastructure products remained equivalent to 2014, but low due to the continued uncertainty of government funding for U.S. transportation products during the year. At the end of 2015, a new five-year infrastructure bill was passed reauthorizing U.S. federal transportation funding that should favorably impact demand for our products over the next few years.
Demand for solar racking systems increased over the past year as end users continue to look for renewable energy sources that are not dependent on fossil fuels. In late 2015, U.S. legislation extending the Solar Investment Tax Credit was signed into law extending the credit beyond 2016 for both residential and commercial projects which is expected to stimulate additional demand for our solar racking systems. Also, demand for greenhouses increased in 2015 for locally grown produce and seed research.
Commodity prices for materials such as steel and aluminum have also declined during the year. These fluctuations impact the cost of raw materials we purchase and the pricing we offer to our customers.
Products
Residential Products
The Residential Products segment is primarily, but not exclusively, a manufacturer of metal and resin-based products used in residential new construction and for home repair and remodeling. This segment operates
12
manufacturing facilities and
two
distribution centers throughout the United States giving it a base of operations to provide customer support, delivery, service, and quality to a number of regional and national customers, while providing manufacturing and distribution efficiencies in North America.
We manufacture an extensive variety of products that are sold through a number of sales channels including major retail home centers, building material wholesalers, buying groups, roofing distributors, and residential contractors.
Our product offerings include a full line of roof and foundation ventilation products and accessories, including solar powered units; postal and parcel storage products, including single mailboxes, cluster boxes for multi-unit housing and package locker systems; roof edging and flashing; soffits and trim; drywall corner bead; metal roofing and accessories; rain dispersion products, including gutters and accessories; and exterior retractable awnings; each of which can be sold separately or as an integral part of a program sale.
We improve our offerings of residential products by introducing new products, enhancing existing products, adjusting product specifications to respond to building code and regulatory changes, and providing additional solutions to homeowners and contractors. New products introduced in recent years include electronic parcel lockers, roof top safety kits, chimney caps, heat trace coils and exterior, remote-controlled deck awnings for sun protection, and solar-powered ventilation products. Our electronic parcel lockers provide residents in multifamily communities a secure receptacle to handle both package deliveries and receipt of other delivered goods. Our ventilation and roof flashing products afford protection and extend the life of structures while providing a safer, healthier environment for the residents. Our cluster box mail delivery products provide delivery cost savings to the postal service while offering secure storage for delivered mail and packages. Our building products are manufactured primarily from galvanized and painted steel, anodized and painted aluminum, and various resins.
Our production capabilities allow us to process a wide range of metals and plastics necessary for manufacturing residential products. Most of our production is completed using automatic roll forming machines, stamping presses, paint lines, and
7
injection molding equipment. We maintain our equipment with a thorough preventive maintenance program allowing us to meet the demanding quality and delivery requirements of our customers. Gibraltar also sources some products from third-party vendors when cost savings can be generated.
Industrial and Infrastructure Products
The Industrial and Infrastructure Products segment is primarily, but not exclusively, a manufacturer and distributor of metal products used in a variety of end markets such as discrete and process manufacturing, highway and bridge construction, energy and mining. We operate
16
manufacturing facilities and
five
distribution centers throughout the United States, Canada, England, and Germany, giving us a base of operations to provide customer support, delivery, service, and quality to a number of regional and national customers, and providing us with manufacturing and distribution efficiencies in North America, as well as a presence in the European market.
We manufacture an extensive variety of products that are sold through a number of sales channels including industrial, commercial and transportation contractors and industrial fabricators.
Our product offerings include a full line of fabricated bar grating and safety plank grating used in industrial flooring, walkways, stairs, platforms, safety barriers, drainage covers, and ventilation grates; expanded and perforated metal used in walkways, catwalks, automotive trim, shelving, fencing, barriers, and other applications where both visibility and security are necessary; fiberglass grating used in areas where high strength, light weight, low maintenance, and corrosion resistance are required; and expansion joint systems, bearing assemblies, and pavement sealing systems used in bridges, elevated highways, airport runways, and rail crossings.
We improve our offerings of industrial and infrastructure products by introducing new products, enhancing existing products, adjusting product specifications to respond to commercial building code and regulatory changes, and providing additional solutions to original equipment manufacturers and contractors. New products introduced in recent years include customized perforated and expanded metal to penetrate a range of new markets such as architectural facades for buildings (museums, sports stadiums and retail outlets); front grilles for a major truck tractor manufacturer; interior ceilings and lighting fixtures; and outdoor railings and balustrades. Our expanded grating fabrication capabilities have been successfully serving new applications such as wind towers and our manufacturing process of aluminum-swaged grating has extended our sales penetration into the water and wastewater markets. In addition, we have extended our transportation infrastructure products into new markets. For example, long-lasting pavement sealants for roadways are now being installed on airport runways; structural bearings for elevated highways and bridges have been installed on an offshore oil production platform; and corrosion-protection products for cable-suspension bridges are now marketed and sold internationally.
Our production capabilities allow us to process a wide range of metals necessary for manufacturing industrial products. Most of our production is completed using computer numerical control ("CNC”) machines, shears, slitters, press brakes, milling, welding, and numerous automated assembly machines. We maintain our equipment with a thorough preventive maintenance program, including in-house tool and die shops, allowing us to meet the demanding service requirements of many of our customers.
Renewable Energy and Conservation
The Renewable Energy and Conservation segment is primarily a designer and provider of fully-engineered solutions for solar racking systems and greenhouse structures. Our solar racking and greenhouse businesses employ a fully integrated approach with in-house engineering and design, fabrication, and installation capabilities. We have five manufacturing facilities and one distribution center and operate in the United States, Germany, China and Japan.
An integral part of each project is the fabrication of specifically designed metal structures for highly- engineered applications including: racking for ground-mounted solar arrays; racking for solar installations on rooftops of carports, and commercial and residential structures; as well as, commercial-scale greenhouses and canopies. Both the solar racking and greenhouse projects involve attaching glass to metal and use the same raw materials including steel and aluminum. Most of our production is completed using CNC machines, roll forming machines, laser cutters and numerous fabrication tools. All structural metal components are designed, fabricated and erected in accordance with the latest structural steel and aluminum guidelines.
We improve our offerings of products by introducing new products, enhancing existing products, adjusting product specifications to respond to commercial building codes and regulatory changes, and providing additional solutions to contractors and end users. New products introduced in recent years include greenhouse structures which focus on metal framed canopy structures, car washes and pool enclosures, and solar racking systems for carports. Our car washes and canopy
8
structures serve a market preference for light transparent structures. Solar racking systems for carports serve as protection for cars from the effects of the sun and intense heat by providing a renewable energy resource. Similarly, solar racking systems installed on idle land, such as solid waste landfills, converts such land into a useful property by providing power generating capabilities.
Engineering and Technical Services
Our businesses employ engineers and other technical personnel to perform a variety of key tasks. They help maintain fully-equipped, modern laboratories to support our operations. These laboratories enable us to verify, analyze, and document the physical, chemical, metallurgical, and mechanical properties of our raw materials and products. In addition, our engineering staff employs a range of drafting software to design highly specialized and technically precise products. In our Renewable Energy and Conservation segment, drawings are designed, signed and sealed by licensed engineers. Technical service personnel also work in conjunction with our sales force to determine the types of products and services required for the particular needs of our customers.
Suppliers and Raw Materials
Our business is required to maintain sufficient quantities of raw material inventory in order to accommodate our customers’ short lead times. Accordingly, we plan our purchases to maintain raw materials at sufficient levels to satisfy the anticipated needs of our customers. We have implemented ERP systems to better manage our inventory, forecast customer orders, enable efficient supply chain management, and allow for more timely counter-measures to changing customer demand and market conditions.
The primary raw materials we purchase are flat-rolled and plate steel, aluminum, and resins. We purchase flat-rolled and plate steel and aluminum at regular intervals on an as-needed basis, primarily from the major North American mills, as well as a limited amount from domestic service centers and foreign steel importers. Substantially all of our resins are purchased from domestic vendors, primarily through distributors, with a small amount direct from manufacturers. Supply has been adequate from these sources to fulfill our needs. Because of our strategy to develop longstanding relationships in our supply chain, we have been able to adjust our deliveries of raw materials to match our required inventory positions to support our on-time deliveries to customers while allowing us to manage our investment in inventory and working capital.
The cost of our raw material purchases of steel, aluminum, and resins is significantly linked to commodity markets. The markets for commodities are highly cyclical and the costs of purchasing these raw materials can be volatile due to a number of factors including general economic conditions, domestic and worldwide demand, labor costs, competition, import duties, tariffs, and currency exchange rates. Changes in commodity costs not only impact the cost of our raw materials but also influence the prices we offer our customers. We have largely managed fluctuations in the market by maintaining lean inventory levels and increasing the efficiency of our manufacturing processes. However, in limited situations, where we have fixed price contacts to supply goods covering multiple quarters, we have used hedge contracts to mitigate the risk of changes in commodity costs.
We purchase natural gas and electricity from suppliers in proximity to our operations.
Even though we have long-term relationships with our suppliers, we have no long-term contractual commitments. Management continually examines and improves our purchasing practices across our geographically dispersed facilities in order to streamline purchasing across similar commodities.
Intellectual Property
We actively protect our proprietary rights throughout North America, Europe and Asia by the use of trademark, copyright, and patent registrations. While we do not believe that any individual item of our intellectual property is material, we believe our trademarks, copyrights, and patents provide us with a competitive advantage when marketing our products to customers. We also believe our brands are well recognized in the markets we serve and we believe they stand for high-quality manufactured goods at a competitive price. These trademarks and trade names allow us to maintain product leadership positions for the goods we offer.
9
Sales and Marketing
Our products and services are sold primarily by channel partners who are called on by our sales personnel and outside sales representatives located throughout the United States, Canada, Europe and Asia. We have organized sales teams to focus on specific customers and national accounts through which we provide enhanced supply solutions and improve our ability to increase the number of products that we sell. Our sales staff works with certain retail customers to optimize shelf space for our products which is expected to increase sales at these locations. Our sales regularly involve competitive bidding processes, and our reputation for meeting delivery time lines and strict specifications make us a preferred provider for many customers.
We focus on providing our customers with industry leading customer service. Our business units generate numerous publications, catalogs, and other printed materials to facilitate the ordering process. In addition, we provide our retail customers with point-of-sale marketing aids to encourage consumer spending on our products in their stores. Continual communication with our customers allows us to understand their concerns and provides us with the opportunity to identify solutions that will meet their needs. We are able to meet our customers’ demand requirements due to our efficient manufacturing processes and extensive distribution network.
Customers and Distribution
Our customers are located primarily throughout North America and Europe, and, to a lesser extent, in Asia.
Our Residential Products segment operates principally in the residential new construction and repair and remodeling markets. A majority of our products are sold through sales channels. Major customers include home improvement retailers, building product distributors, residential contractors, and postal services for our Residential Products segment.
Our Industrial and Infrastructure Products segment serves a variety of commercial construction and industrial markets; bridge and highway construction markets; and a variety of industrial markets. Discrete and process manufacturers, transportation contractors and automotive suppliers are major customers in our Industrial and Infrastructure Products segment.
Our Renewable Energy and Conservation segment primarily contracts with solar developers, power system providers, retail garden centers, conservatories and botanical gardens, commercial growers, and schools and universities.
One customer, a home improvement retailer, purchases from both the Residential Products segment and Renewable Energy and Conservation segment, represented 11% of our consolidated net sales for
2015
, and 12% for both
2014
and
2013
. No other customer in any segment accounted for more than 10% of our consolidated net sales.
Our products are distributed to our customers using common carriers and our own fleet of trucks. We maintain distribution centers that complement our manufacturing plants from which we ship products and ensure on-time delivery while maintaining efficiency within our distribution process.
Backlog
While the majority of our products have short lead time order cycles, we have aggregated approximately $154 million of backlog at
December 31, 2015
. The backlog primarily relates to certain business units in our Industrial and Infrastructure Products and our Renewable Energy and Conservation segments. We believe that the majority of our backlog will be shipped during
2016
.
Competition
Gibraltar operates in highly competitive markets. We compete against several competitors in all three of our segments with different competitors in each major product category. A few of our competitors may be larger, have greater financial resources, or have less financial leverage than we do. As a result, these competitors may be better positioned to respond to any downward pricing pressure or other adverse economic or industry conditions or to identify and acquire companies or product lines compatible with their business.
We compete with competitors based on the range of products offered, quality, price, and delivery, as well as, serving as a full service provider for project management in certain segments. Although some of our competitors are large companies, the majority are small to medium-sized and do not offer the large range of building products we do.
The prices paid for raw materials used in our operations, primarily steel, aluminum, and resins, are volatile due to a number of factors beyond our control, including but not limited to supply shortages, general industry and economic conditions, labor costs, import duties, tariffs, and currency exchange rates. Although we have strategies to help mitigate the volatility in raw
10
material costs, such as reducing inventory levels, our competitors who choose not to maintain inventories as large as ours may be better able to mitigate the effects of this volatility and, thereby, compete effectively against us on product price.
We believe our broad range of products, high quality, and sustained ability to meet exacting customer delivery requirements gives us a competitive advantage over many of our competitors.
Employees
At
December 31, 2015
and
2014
, we employed 2,628 and 2,416 employees, respectively. We also employ a number of temporary employees to address peaks in staffing requirements. Approximately 12% of our workforce was represented by unions through various collective bargaining agreements (CBAs) as of
December 31, 2015
. Three of our six CBAs will expire and are expected to be renegotiated in 2016. We historically have had good relationships with our unions and we expect future negotiations with our unions to result in contracts that provide benefits that are consistent with those provided in our current agreements.
Seasonality
Our net sales and income are generally lower in the first and fourth quarters compared to the second and third quarters primarily due to the seasonality of construction activity. Our sales volume is driven by residential renovation and other industrial construction activities which typically peak during warmer weather and decline due to inclement weather in the winter months. Operating margins are impacted by this seasonality because our operating costs have fixed cost components.
Governmental Regulation
Our manufacturing facilities and distribution centers are subject to many federal, state, and local requirements relating to the protection of the environment. Our production processes use some environmentally sensitive materials. For example, we lubricate our machines with oil and use oil baths to treat some of our products. While we cannot guarantee that we will not incur material expenses to comply with environmental requirements, we believe that we operate our business in material compliance with all environmental laws and regulations, do not anticipate any material expenditures to continue to meet environmental requirements, and do not believe that future compliance with such laws and regulations will have a material adverse effect on our financial condition or results of operations. However, we could incur operating costs or capital expenditures in complying with new or more stringent environmental requirements in the future or with current requirements if they are applied to our facilities in a way we do not anticipate. In addition, new or more stringent regulation of our energy suppliers could cause them to increase the price of energy they supply us.
Our operations are also governed by many other laws and regulations covering our labor relationships, the zoning of our facilities, our general business practices, and other matters. We believe that we are in material compliance with these laws and regulations and do not believe that future compliance with such laws and regulations will have a material adverse effect on our financial condition or results of operations.
Internet Information
Copies of the Company’s Annual Reports on Form 10-K, Quarterly Reports on Form 10-Q, Current Reports on Form 8-K, and amendments to those reports filed or furnished pursuant to Section 13(a) or 15(d) of the Securities Exchange Act of 1934 are available free of charge through the Company’s website (www.gibraltar1.com) as soon as reasonably practicable after the Company electronically files the material with, or furnishes it to, the Securities and Exchange Commission.
|
Item 1A.
|
Risk Factors
|
Future results and the market price for Gibraltar’s common shares are subject to numerous risks, many which are driven by factors that cannot be controlled or predicted. The following discussion, as well as other sections of this Annual Report on Form 10-K, including “PART II — Item 7. — Management’s Discussion and Analysis of Financial Condition and Results of Operations,” describe certain business and other risks affecting the Company. Consideration should be given to the risk factors described below as well as those in the Safe Harbor Statement at the beginning of this Annual Report on Form 10-K, in conjunction with reviewing the forward-looking statements and other information contained in this Annual Report on Form 10-K. These risks are not the only risks we face. Our business operations and market for our securities could also be affected by additional factors that are not presently known to us or that we currently consider to be immaterial in our operations.
11
Macroeconomic factors outside of our control may adversely affect our business, our industry, and the businesses and industries of many of our customer and suppliers.
Macroeconomic factors have a significant impact on our business, including our ability to generate profitable margins, customer demand and the availability of credit and other capital. Our operations are subject to the effects of domestic and international economic conditions including government monetary and trade policies, as well as, the relative debt levels of the U.S. and the other countries which form the market for our products. The changing costs of energy, in particular the depressed price of oil plus other commodities, has, and will likely continue to, negatively impact demand for our bar grating and expanded metal products. In addition, the strengthening of the U.S. dollar impacts the prices we charge and costs we incur to export and import products. We are unable to predict the impact on our business of changes in domestic and international economic conditions. The construction market has shown signs of stabilizing. However, as discussed in this and prior reports, the markets in which we operate have been challenging over the past few years and the possibility remains that the domestic or global economies, or certain industry sectors of those economies that are key to our sales, may continue to be slow or could deteriorate, which could result in a corresponding decrease in demand for our products and negatively impact our results of operations and financial condition.
Our amount of leverage and debt service obligations could adversely affect our ability to raise additional capital to fund our operations, limit our ability to react to changes in the economy or our industry, and prevent us from meeting our obligations.
We had total indebtedness of $209.3 million as of
December 31, 2015
, of which $208.9 million is long-term debt. Our current level of indebtedness and the debt we may need to incur in the future to fund strategic acquisitions, investments or for other purposes could have significant consequences to our business, including the following:
|
•
|
Our interest expense could increase if interest rates increase because the loans under our Senior Credit Agreement bear interest at a floating rate. Depending on interest rates and debt maturities, a substantial portion of our cash flow from operations could be dedicated to paying principal, premium, if any, and interest on our indebtedness, thereby reducing funds available for our acquisition strategy and capital expenditures or to dispose of material assets or operations, seek additional debt or equity capital or restructure or refinance our indebtedness;
|
|
•
|
Our significant amount of debt could make us more vulnerable to changes in economic conditions and increases in prevailing interest rates;
|
|
•
|
Our ability to obtain additional debt or equity financing for working capital, capital expenditures, product development, debt service requirements, acquisitions, and general corporate or other purposes may be limited;
|
|
•
|
Our indebtedness may limit our ability to adjust to changing market conditions and place us at a competitive disadvantage compared to our competitors which have less debt; and
|
|
•
|
Any increase in the amount of debt we have outstanding increases the risk of non-compliance with some of the covenants in our debt agreements which require us to maintain specific financial ratios.
|
Our debt instruments impose operational and financial restrictive covenants on us which restrict our ability to respond to changes or take certain actions and may adversely affect our operations.
The Senior Credit Agreement and the indenture governing our 6.25% Notes contain several financial and other restrictive covenants, including restrictions on our ability to:
|
•
|
incur additional indebtedness and guarantee indebtedness;
|
|
•
|
pay dividends or make other distributions or repurchase or redeem our capital stock;
|
|
•
|
prepay, redeem or repurchase certain debt;
|
|
•
|
issue certain preferred stock or similar equity securities;
|
|
•
|
make loans and investments;
|
|
•
|
sell assets;
|
|
•
|
incur liens;
|
|
•
|
enter into transactions with affiliates; and
|
|
•
|
enter into agreements restricting our subsidiaries’ ability to pay dividends.
|
A significant decline in our operating income could cause us to violate these covenants. A covenant violation would require a waiver from our lenders, which could result in incurring additional financing fees that would be costly and adversely affect our profitability and cash flows. If a waiver was not provided, the lenders could elect to declare all amounts outstanding under such facilities to be immediately due and payable and terminate all commitments to extend further credit.
12
We make estimates in accounting for contracts and changes in these estimates may have significant impacts on our earnings.
Revenue representing approximately 17% of 2015 sales was accounted for using the percentage of completion, cost-to-cost method of accounting. Under this method, we recognize revenue as work progresses toward completion as determined by the ratio of cumulative costs incurred to date to estimated total contract costs at completion, multiplied by the total estimated contract revenue, less cumulative revenue recognized in prior periods. Changes in these required estimates could have a material adverse effect on sales and profits. Any adjustments are recognized in the period in which the change becomes known using the cumulative catch-up method of accounting. For contracts with anticipated losses at completion, we establish a provision for the entire amount of the estimated remaining loss and charge it against income in the period in which the loss becomes known. Amounts representing performance incentives, penalties, contract claims and the impacts of scope change negotiations are considered in estimating revenues, costs and profits when they can be reliably estimated and realization is considered probable. Due to the substantial judgmental estimates involved with this process, our actual results could differ materially or could be settled unfavorably from our estimates.
We rely on a few customers for a significant portion of our net sales. The loss of those customers would adversely affect our business.
Our ten largest customers accounted for approximately 34%, 31%, and 29%, of our net sales during
2015
,
2014
, and
2013
, respectively, with our largest customer, a retail home improvement center, accounting for approximately 11% of our consolidated net sales during
2015
and 12% of our consolidated net sales for both
2014
and
2013
.
A loss of sales due to decreased demand from the construction market, the home repair and remodel market, any significant customer in these markets, or a decrease in the prices that we can realize from sales of our products to customers in these markets could adversely affect our profitability and cash flows. The end markets we serve have been and are expected to continue to be cyclical, with product demand based on numerous factors such as seasonal weather, availability of credit and capital, interest rates, general economic conditions, consumer confidence, unemployment levels, and other factors beyond our control. Although our customers periodically provide indications of their product needs and purchases, they generally purchase our products on an order-by-order basis, and the relationship, as well as particular orders, can be terminated at any time. The loss, bankruptcy, or significant decrease in business from any of our major customers would have a material adverse effect on our business, results of operations, and cash flows.
Our business is highly competitive and increased competition could reduce our gross profit, net income, and cash flow.
The principal markets that we serve are highly competitive. Competition is based primarily on product functionality, quality, price, raw material and inventory availability, and the ability to meet delivery schedules dictated by customers. We compete in our principal markets with companies of various sizes, some of which have greater financial and other resources than we do and some of which have better established brand names in the markets we serve. Increased competition could force us to lower our prices or to offer additional services or enhanced products at a higher cost to us, which could reduce our gross profit, net income, and cash flow and cause us to lose market share.
Our future operating results may be affected by fluctuations in raw material costs. We may not be able to pass on increased raw material costs to our customers.
Our principal raw materials are commodity products consisting of steel, aluminum, and resins, which we purchase from multiple primary suppliers. The commodity market as a whole is cyclical, and, at times, availability and pricing can be volatile due to a number of factors beyond our control, including general economic conditions, domestic and worldwide demand, labor costs, competition, import duties, tariffs, and currency exchange rates. This volatility can significantly affect our raw material costs.
In an environment of increasing raw material prices, competitive conditions will impact the amount of any commodity price increases we can pass on to our customers. In the event of rapidly decreasing raw material prices, we may be left to absorb the cost of higher cost inventory as customers receive reduced pricing related to decreases in raw material costs. To the extent we are unable to match our costs to purchase raw materials to prices given to our customers, the profitability of our business and resulting cash flows could be adversely affected.
We rely on subcontractors and suppliers to perform their contractual obligations
Some of our contracts with customers involve subcontracts with other companies, on which we rely for performing a portion of the services we provide to our customers. There is a risk that we may have disputes with our subcontractors, including disputes regarding the quality and timeliness of work performed by our subcontractors or customer concerns with the subcontractor.
13
Failure by our subcontractors to satisfactorily provide on a timely basis the agreed-upon services or supplies may materially and adversely impact our ability to perform our obligations as the prime contractor similarly, failure by our suppliers to deliver. raw materials, components or equipment parts from our suppliers may affect our ability to meet our customers' needs and may have an adverse effect upon our profitability. Failure of our raw materials or components to conform to our specification could also result in delays in our ability to timely deliver and may have an adverse impact on our relationships with our customers, and our ability to fully realize the revenue expected from sales to those customers.
Our strategy depends on identification, management and successful integration of future acquisitions
Historically, we have grown through a combination of internal growth plus external expansion through acquisitions. Although we intend to continue to seek additional acquisition opportunities in accordance with our business strategy, we cannot provide any assurance that we will be able to identify appropriate acquisition candidates, or, if we do, that we will be able to negotiate successfully the terms of an acquisition, finance the acquisition or integrate the acquisition into our existing operations. Failure to integrate any acquisition successfully may cause significant operating inefficiencies, incur unforeseen obligations, loss of customers, and could adversely affect our profitability. Consummating an acquisition could require us to raise additional funds through additional equity or debt financing. which could increase our interest expense and reduce our cash flows and available funds.
We are subject to information system security risks and cyber intrusions and other information system threats could materially adversely affect our business and results of operations.
We are dependent upon information systems technology and networks in connection with a variety of business activities, in which we distribute information internally and also to our customers and suppliers. We use this distributed information for a number of important functions, including among other things inventory procurement and control, management of production, scheduling of deliveries, human resource and legal compliance matters, and recording and reporting financial and other disclosures required by the SEC. In addition, we collect and store significant amounts of confidential data and information regarding our employees, customers and suppliers, some of which is personally identifiable. This information technology and data is subject to theft, damage, or interruption from a variety of sources, including but not limited to natural disasters, accidents, power disruptions, telecommunications failures, acts of terrorism or war, malicious computer code, such as worms, viruses and Trojan horses, security breaches, and defects in design. Our ability to effectively manage our business depends upon the security, reliability and functionality of our information systems and networks.
We have taken various measures to manage our risks related to information system and network disruptions, to secure our systems and networks from damage from malicious computer code, and to prevent unauthorized access to our information systems and networks. Nevertheless, such measures cannot provide absolute security due to software defects, employee error, malfeasance, faulty password management, or other irregularities. Advanced cyber-security threats, sometimes developed and exploited by criminal enterprises and foreign government intelligence agencies, are constantly evolving to attack newly discovered flaws in the security design of software. The vendors of the software we use support their products by developing updates that address security flaws, but they may not become aware of the flaw until after a number of companies experience an intrusion through means of the flaw. Therefore we cannot assure you that we can detect or prevent all attempts to access our systems and networks and misappropriate or damage our data. A security breach, system failure, or corruption of our systems and networks could prevent us from conducting our business or otherwise negatively impact our operations and financial results. In addition, cyber attacks could threaten, or even impair, the integrity and value of our trade secrets and other sensitive intellectual property, as well as reveal personally identifiable information of our employees and customers.
S
ystems integration and implementation issues could disrupt our internal operations.
In connection with the acquisitions we make, we customarily must integrate legacy information technology systems of the acquired business with our information technology infrastructure, and in some cases, implement new information technology systems for the business. In addition, as the functionality of available information systems increases, we may need to implement significant upgrades or even replace some of our primary information technology systems across significant parts of our businesses and operations. The implementation of new information technology solutions could lead to interruptions of information flow internally and to our customers and suppliers while the implementation project is being completed. Any failure to integrate legacy systems of acquisitions or to implement new systems properly could negatively impact our operations and financial results.
We depend on our senior management team, and the unexpected loss of any member could adversely affect our operations.
Our success is dependent on the management and leadership skills of our senior executive and divisional management teams. The unexpected loss of any of these individuals, or our inability to attract and retain additional personnel could prevent us from successfully executing our business strategy. We cannot assure you that we will be able to retain our existing senior
14
management personnel or to attract additional qualified personnel when needed. We have not entered into employment agreements with any of our senior management personnel other than Frank G. Heard, our President and Chief Executive Officer.
We could incur substantial costs in order to comply with, or to address any violations of, environmental, health and safety laws.
Our operations and facilities are subject to a variety of federal, state, local, and foreign laws and regulations relating to the protection of the environment and human health and safety. Compliance with these laws and regulations sometimes involves substantial operating costs and capital expenditures, and any failure to maintain or achieve compliance with these laws and regulations or with the permits required for our operations could result in fines and civil or criminal sanctions, third-party claims for property damage or personal injury, cleanup costs or temporary or permanent discontinuance of operations, including claims arising from the businesses and facilities that we have sold. We sometimes use hazardous and regulated substances such as petroleum products, hydraulic fluids, and solvents in our operations and are responsible for the proper handling, storage and disposal of hazardous materials and wastes. For certain businesses we have divested, we have provided limited indemnifications for environmental contamination to the successor owners. We have also acquired and continue to acquire businesses and facilities to add to our operations. While we sometimes receive indemnification for pre-existing environmental contamination, the party providing the indemnification may not have sufficient resources to cover the cost of any required measures. Certain facilities of ours have been in operation for many years and we may be liable for remediation of any contamination at our current or former facilities; or at off-site locations where wastes have been sent for disposal, regardless of fault or whether we, our predecessors or others are responsible for such contamination. We have been responsible for remediation of contamination at some of our locations and, while such costs have not been material to date, the cost of remediation of any these and newly-discovered contamination cannot be quantified, and we cannot assure you that it will not materially affect our profits or cash flows. Changes in environmental laws, regulations or enforcement policies, including without limitation new or more stringent regulations affecting disposal of hazardous substances and waste, greenhouse gas emissions or use of fossil fuels, could have a material adverse effect on our business, financial condition, or results of operations.
Labor disruptions at any of our major customers or at our own manufacturing facilities could adversely affect our results of operations and cash flow.
Many of our customers have unionized workforces and could experience labor disruptions such as work stoppages, slow-downs, and strikes. A labor disruption at one or more of our customers could interrupt production or sales by that customer and cause the customer to halt or limit orders for our products and services. Any such reduction in the demand for our products and services would adversely affect our net sales, results of operations, and cash flow.
In addition, approximately
12%
of our own employees are represented by unions through various collective bargaining agreements.
Three
of our six CBAs expire and are expected to be renegotiated in 2016. It is likely that our unionized employees will seek an increase in wages and benefits at the expiration of these agreements, and we may be unable to negotiate new agreements without labor disruption or on terms favorable to us. In addition, labor organizing activities could occur at any of our facilities. If any labor disruption were to occur at our facilities, we could lose sales due to interruptions in production and could incur additional costs, which would adversely affect our net sales, results of operations, and cash flow.
Our operations are subject to seasonal fluctuations that may impact our cash flow.
Our net sales are generally lower in the first and fourth quarters primarily as a result of reduced activity in the building industry due to inclement weather. In addition, quarterly results may be affected by the timing of shipments of large customer orders. Therefore, our cash flow from operations may vary from quarter to quarter. If, as a result of any such fluctuation, our quarterly cash flows were significantly reduced, we may not be able to service our indebtedness or maintain covenant compliance.
Economic, political, and other risks associated with foreign operations could adversely affect our financial results.
Although the large majority of our business activity takes place in the United States, we derive a portion of our revenues and earnings from operations in other countries, and are subject to risks associated with doing business internationally. Our sales originating outside the United States represented approximately 11% of our consolidated net sales during the year ended
December 31, 2015
. We have facilities in Canada, England, Germany, China and Japan. We believe that our business activities outside of the United States involve a higher degree of risk than our domestic activities. The risks of doing business in foreign countries include deterioration of foreign economic conditions, uncertainty over the stability of the Eurozone and China, the potential for adverse changes in the local political climates, in diplomatic relations between foreign countries and the United States or in governmental policies, laws or regulations, terrorist activity that may cause social disruption, logistical and communications challenges, costs of complying with a variety of differing laws and regulations, difficulty in staffing and
15
managing geographically diverse operations, deterioration of foreign economic conditions, currency rate fluctuations, foreign exchange restrictions, differing local business practices and cultural considerations, restrictions on imports and exports or sources of supply, and changes in duties or taxes. Adverse changes in any of these risks could adversely affect our net sales, results of operations, and cash flows.
Future terror attacks, war, natural disasters or other catastrophic events beyond our control could negatively impact our operations and financial results.
Terror attacks, war, or other civil disturbances, natural disasters and other catastrophic events could lead to economic instability, decreased capacity to product our products and decreased demand for our products. From time to time, terrorist attacks worldwide have caused instability in global financial markets. Also, our facilities could be subject to damage from fires, floods, earthquakes or other natural or man-made disasters. Such interruptions could have an adverse effect on our operations, cash flows and financial results.
The nature of our business exposes us to product liability, product warranty and other claims, and other legal proceedings.
We are involved in product liability, product warranty and other claims relating to the products we manufacture and distribute Although we currently maintain what we believe to be suitable and adequate insurance in excess of our self-insured amounts, there can be no assurance that we will be able to maintain such insurance on acceptable terms or that such insurance will provide adequate protection against potential liabilities. Product liability claims can be expensive to defend and can divert the attention of management and other personnel for significant periods, regardless of the ultimate outcome. Claims of this nature could also have a negative impact on customer confidence in our products and our Company. We cannot assure you that any current or future claims will not adversely affect our reputation, financial condition, operating results, and cash flows.
If we are required to take additional non-cash impairment charges to earnings, such charges could be significant and have a material impact on our results of operations.
We review the carrying value of long-lived assets for impairment when events or changes in circumstances indicate that the carrying amount of the assets may not be recoverable. We also test goodwill in each of our reporting units and intangible assets with indefinite lives for impairment annually in the fourth quarter or sooner at interim dates if events or changes in circumstances indicate that the carrying value of the asset may exceed fair value. In recent years, we have recorded significant non-cash impairment charges for goodwill and other intangible assets as a result of reductions in the estimated fair values of certain businesses. Should the markets for our products deteriorate or should we decide to invest capital differently than as expected, or should other cash flow assumptions change, it is possible that we will be required to record additional non-cash impairment charges to our earnings in the future, which could be significant and have a material impact on our results of operations.
The expiration, elimination or reduction of solar rebates, credits and incentives may adversely impact our business.
A variety of federal, state and local government agencies provide incentives to promote electricity generation from renewable sources such as solar power. These incentives are in the form of rebates, tax credits and other financial incentives which help to motivate end users, distributors, system integrators and others to install solar powered generating systems. Any changes to reduce, shorten or eliminate the scope and availability of these incentive programs could materially impact the demand for our related products, our financial condition and results of operations.
We have not completed an assessment of RBI’s internal controls over financial reporting and therefore, significant deficiencies or material weaknesses may exist.
Under current SEC guidelines, the period in which management may omit an assessment of an acquired business's internal control over financial reporting from its assessment of the registrant's internal control may not extend beyond one year from the date of acquisition, nor may such assessment be omitted from more than one annual management report on internal control over financial reporting.
Pursuant to this guidance, we have excluded RBI, which was acquired on June 9, 2015, from the scope of management’s assessment of the effectiveness of the Company’s internal control over financial reporting as of December 31, 2015. However, we will be required to include RBI in the scope of our assessment beginning in 2016. In connection with our 2016 assessment, “significant deficiencies” or “material weaknesses” in RBI’s internal control over financial reporting may be detected. To the extent that such deficiencies are identified, we may incur costs associated with our efforts to address these deficiencies that could negatively affect our financial condition and operating results. Furthermore, if we are unable to correct such deficiencies in a timely manner, our ability to record, process, summarize and report financial data may be adversely affected, which may result in a material
16
misstatement in our financial statements. Such
failure could materially and adversely impact our business and subject us to potential investigations, liability and penalties.
|
Item 1B.
|
Unresolved Staff Comments
|
None.
|
Item 2.
|
Properties
|
Our principal executive office and headquarters is located in Buffalo, New York, in a leased facility. As of
December 31, 2015
, we operated
36
domestic facilities and 12 foreign facilities, of which
34
were leased and
14
were owned. We believe the facilities we operate and their equipment are effectively utilized, well maintained, in good condition, and will be able to accommodate our capacity needs to meet current levels of demand. Our North American, European and Asian manufacturing facilities are well maintained and our sites are located to optimize customer service, market requirements, distribution capability and freight costs. We continuously review our anticipated requirements for facilities and, on the basis of that review, may from time to time acquire additional facilities and/or dispose of existing facilities.
|
Item 3.
|
Legal Proceedings
|
From time to time, the Company is named a defendant in legal actions arising out of the normal course of business. The Company is not a party to any material pending legal proceedings. The Company is also not a party to any other pending legal proceedings other than ordinary, routine litigation incidental to its business. The Company maintains liability insurance against risks arising out of the normal course of business.
|
Item 4.
|
Mine Safety Disclosures
|
Not applicable.
17
|
Item 5.
|
Market for Common Equity and Related Stockholder Matters
|
As of
December 31, 2015
there were 108 shareholders of record of the Company’s common stock. However, the Company believes that it has a significantly higher number of shareholders because of the number of shares that are held by nominees.
The Company’s common stock is traded in the over-the-counter market and quoted on the NASDAQ Global Select Market (“NASDAQ”) under the symbol “ROCK.” The following table sets forth the high and low sale prices per share for the Company’s common stock for each quarter of
2015
and
2014
as reported on the NASDAQ Stock Exchange.
|
|
2015
|
2014
|
|||||||||||||
|
|
High
|
Low
|
High
|
Low
|
|||||||||||
|
Fourth Quarter
|
$
|
27.31
|
|
$
|
18.30
|
|
$
|
16.26
|
|
$
|
12.96
|
|
|||
|
Third Quarter
|
$
|
20.90
|
|
$
|
16.00
|
|
$
|
16.32
|
|
$
|
13.69
|
|
|||
|
Second Quarter
|
$
|
20.96
|
|
$
|
16.03
|
|
$
|
18.96
|
|
$
|
15.25
|
|
|||
|
First Quarter
|
$
|
16.87
|
|
$
|
13.76
|
|
$
|
18.90
|
|
$
|
17.43
|
|
|||
The Company did not declare cash dividends during the years ended
December 31, 2015
and
2014
. Cash dividends are declared at the discretion of the Company’s Board of Directors. The Board of Directors determines to pay dividends based upon such factors as the Company’s cash flow, financial condition, capital requirements, debt covenant requirements, and other relevant conditions.
Equity Compensation Plan Information
The following table summarizes information as of
December 31, 2015
concerning securities authorized for issuance under the Company’s stock option plans:
|
Plan Category
|
Number of
Securities to be
Issued Upon
Exercise of
Outstanding
Options
|
Weighted-
Average
Exercise Price
of Outstanding
Options
|
Number of Securities
Remaining Available for
Future Issuance Under
Equity Compensation
Plans (1)
|
||||||
|
Equity Compensation Plans Approved by Security Holders
|
458,349
|
|
$
|
16.57
|
|
691,236
|
|
||
|
1
|
Consists of the Gibraltar Industries, Inc. 2015 Equity Incentive Plan (the Plan). Upon adoption of the 2015 Equity Incentive Plan, the Company amended the 2005 Equity Incentive Plan (Prior Plan) and is no longer allowed to issue awards under the Prior Plan. Note 12 of the Company’s audited consolidated financial statements included in Item 8 of this Annual Report on Form 10-K provides additional information regarding the Plan and securities issuable upon exercise of options. All currently effective equity compensation plans have been approved by the Company’s shareholders.
|
18
Performance Graph
The performance graph shown below compares the cumulative total shareholder return on the Company’s common stock, based on the market price of the common stock, with the total return of the S&P SmallCap 600 Index and the S&P SmallCap 600 Industrials Index for the five-year period ended
December 31, 2015
. The comparison of total return assumes that a fixed investment of $100 was invested on December 31, 2010 in common stock and in each of the foregoing indices and further assumes the reinvestment of dividends. The stock price performance shown on the graph is not necessarily indicative of future price performance.
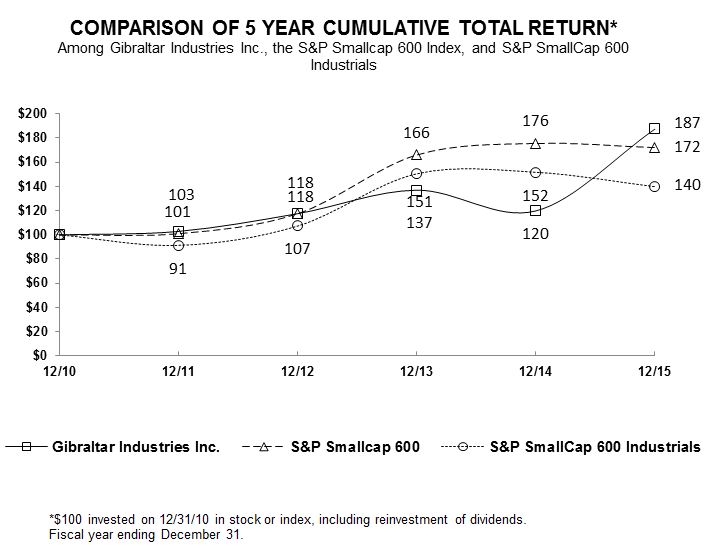
19
|
Item 6.
|
Selected Financial Data
|
(in thousands, except per share data)
The following selected historical consolidated financial data for each of the five years in the period ended
December 31, 2015
are derived from the Company’s audited financial statements as reclassified for discontinued operations. The selected historical consolidated financial data should be read in conjunction with the Company’s audited consolidated financial statements and notes thereto contained in Item 8 and “Management’s Discussion and Analysis of Financial Condition and Results of Operations” set forth in Item 7 of this Annual Report on Form 10-K.
|
|
Year Ended December 31,
|
||||||||||||||||||
|
|
2015
|
2014
|
2013
|
2012
|
2011
|
||||||||||||||
|
Net sales
|
$
|
1,040,873
|
|
$
|
862,087
|
|
$
|
827,567
|
|
$
|
790,058
|
|
$
|
766,607
|
|
||||
|
Intangible asset impairment
|
$
|
4,863
|
|
$
|
107,970
|
|
$
|
23,160
|
|
$
|
4,628
|
|
$
|
—
|
|
||||
|
Income (loss) from operations
|
$
|
48,085
|
|
$
|
(70,417
|
)
|
$
|
21,480
|
|
$
|
40,261
|
|
$
|
36,158
|
|
||||
|
Interest expense
|
$
|
15,003
|
|
$
|
14,421
|
|
$
|
22,489
|
|
$
|
18,582
|
|
$
|
19,363
|
|
||||
|
Income (loss) before taxes
|
$
|
37,100
|
|
$
|
(84,750
|
)
|
$
|
(832
|
)
|
$
|
22,167
|
|
$
|
16,885
|
|
||||
|
Provision for (benefit of) income taxes
|
$
|
13,624
|
|
$
|
(2,958
|
)
|
$
|
4,797
|
|
$
|
9,517
|
|
$
|
7,669
|
|
||||
|
Income (loss) from continuing operations
|
$
|
23,476
|
|
$
|
(81,792
|
)
|
$
|
(5,629
|
)
|
$
|
12,650
|
|
$
|
9,216
|
|
||||
|
Income (loss) from continuing operations per share – Basic
|
$
|
0.75
|
|
$
|
(2.63
|
)
|
$
|
(0.18
|
)
|
$
|
0.41
|
|
$
|
0.30
|
|
||||
|
Weighted average shares outstanding – Basic
|
31,233
|
|
31,066
|
|
30,930
|
|
30,752
|
|
30,507
|
|
|||||||||
|
Income (loss) from continuing operations per share – Diluted
|
$
|
0.74
|
|
$
|
(2.63
|
)
|
$
|
(0.18
|
)
|
$
|
0.41
|
|
$
|
0.30
|
|
||||
|
Weighted average shares outstanding – Diluted
|
31,545
|
|
31,066
|
|
30,930
|
|
30,857
|
|
30,650
|
|
|||||||||
|
Current assets
|
$
|
351,422
|
|
$
|
360,431
|
|
$
|
322,400
|
|
$
|
267,238
|
|
$
|
268,854
|
|
||||
|
Current liabilities
|
$
|
185,395
|
|
$
|
134,085
|
|
$
|
119,913
|
|
$
|
117,585
|
|
$
|
128,424
|
|
||||
|
Total assets
|
$
|
889,772
|
|
$
|
810,471
|
|
$
|
889,571
|
|
$
|
879,846
|
|
$
|
867,043
|
|
||||
|
Total debt
|
$
|
209,282
|
|
$
|
209,911
|
|
$
|
209,416
|
|
$
|
203,975
|
|
$
|
202,151
|
|
||||
|
Shareholders’ equity
|
$
|
410,086
|
|
$
|
387,229
|
|
$
|
471,749
|
|
$
|
476,822
|
|
$
|
459,936
|
|
||||
|
Capital expenditures
|
$
|
12,373
|
|
$
|
23,291
|
|
$
|
14,940
|
|
$
|
11,351
|
|
$
|
11,552
|
|
||||
|
Depreciation
|
$
|
17,869
|
|
$
|
19,712
|
|
$
|
20,478
|
|
$
|
19,673
|
|
$
|
19,872
|
|
||||
|
Amortization
|
$
|
12,679
|
|
$
|
5,720
|
|
$
|
6,572
|
|
$
|
6,671
|
|
$
|
6,309
|
|
||||
20
|
Item 7.
|
Management’s Discussion and Analysis of Financial Condition and Results of Operations
|
The following Management’s Discussion and Analysis of Financial Condition and Results of Operations should be read in conjunction with the Company’s risk factors and its consolidated financial statements and notes thereto included in Item 1A and Item 8, respectively, of this Annual Report on Form 10-K. Certain information set forth herein Item 7 constitutes “forward-looking statements” as that term is used in the Private Securities Litigation Reform Act of 1995. Such forward-looking statements are based, in whole or in part, on management’s beliefs, estimates, assumptions, and currently available information. For a more detailed discussion of what constitutes a forward-looking statement and of some of the factors that could cause actual results to differ materially from such forward-looking statements, please refer to the “Safe Harbor Statement” on page 3 of this Annual Report on Form 10-K.
Company Overview
Gibraltar Industries is a leading manufacturer and distributor of building products for the industrial, infrastructure, residential, renewable energy and conservation markets. Beginning in mid-2014, led by new executive leadership, the Company began a re-examination of its operations, competitive advantages, and strategies, all directed at re-setting a business strategy that would significantly elevate and accelerate the growth and financial returns of the Company. The new strategy, completed in late 2014, with execution initiated in 2015, is targeted at delivering best-in-class, sustainable value creation for our shareholders for the long-term. This value-generating strategy is intended to drive a transformational change in the Company’s portfolio and its financial results; and it has four key elements: operational excellence, product innovation, portfolio management, and acquisitions as a strategic accelerator.
On June 9, 2015, the Company acquired Rough Brothers Manufacturing, Inc., RBI Solar, Inc., and affiliates, collectively known as "RBI" for
$148 million
. RBI has established itself during the past six years among North America’s fastest-growing providers of solar racking solutions and is also one of the largest manufacturers of commercial greenhouses in North America. RBI is a full service provider that engineers, manufactures and installs solar racking systems for solar developers and power companies. In addition, RBI designs, manufactures and erects greenhouses for commercial and institutional customers as well as retailers. The acquisition of RBI is expected to enable the Company to leverage its expertise in structural metals manufacturing, materials sourcing and logistics to help meet the fast-growing global demand for solar racking solutions. The results of RBI have been included in the Company’s consolidated financial results since the date of the acquisition. The acquisition was financed through cash on hand and borrowings under our revolving credit facility.
The Company serves customers primarily throughout North America, Europe, and, to a lesser extent Asia. Our customers include major home improvement retailers, wholesalers, industrial distributors, contractors. solar developers and institutional and commercial growers of plants. As of
December 31, 2015
, we operated
48
facilities in
19
states, Canada, England, Germany, China and Japan which includes
33
manufacturing facilities and
eight
distribution centers, giving us a base of operations to provide customer support, delivery, service and quality to a number of regional and national customers and providing us with manufacturing and distribution efficiencies in North America, as well as a presence in the European and Asian markets.
The Company operates and reports its results in the following three operating segments, entitled “Residential Products”, “Industrial and Infrastructure Products” and "Renewable and Energy Conservation".
Our Residential Products segment focuses on the new residential housing construction and residential repair and remodeling activity. Its products are sold through major retail home centers, building material wholesalers, buying groups, roofing distributors, and residential contractors.
Our Industrial and Infrastructure Products segment focuses on a variety of markets including discrete and process manufacturing, highway and bridge construction markets, energy and power generation. This segment’s products are distributed through industrial, commercial and transportation contractors, industrial distributors and original equipment manufacturers.
Our Renewable Energy and Conservation segment focuses on the design, engineering, manufacturing and installation of solar racking systems and greenhouse structures. This segment's services and products are provided directly to end users and through product distribution channels.
The end markets our businesses serve include residential housing, industrial manufacturing, transportation infrastructure, and renewable energy and conservation, are subject to economic conditions that are influenced by various factors. These factors include but are not limited to changes in general economic conditions, interest rates, exchange rates, commodity costs, demand
21
for residential construction, governmental policies and funding, tax policies and the level of non-residential construction and infrastructure projects. As a result of the Company's re-examination of its operations and re-setting of its business strategy noted above, we believe we are prepared to respond timely to changes in these factors. We have and expect to continue to restructure our operations, including consolidation of facilities, reducing overhead costs, curtailing investments in inventory, and managing our business to generate incremental cash. Additionally, we believe our new strategy has enabled us to better react to fluctuations in commodity costs and customer demand, and has helped in improving margins. We have used the improved cash flows generated by these initiatives to maintain low levels of debt, improve our liquidity position, and invest in growth initiatives. Overall, we are striving to achieve stronger financial results, make more efficient use of capital, and deliver higher shareholder returns.
Results of Operations
Year Ended
December 31, 2015
Compared to Year Ended
December 31, 2014
The following table sets forth selected results of operations data (in thousands) and its percentages of net sales for the years ended December 31:
|
2015
|
2014
|
||||||||||||
|
Net sales
|
$
|
1,040,873
|
|
100.0
|
%
|
$
|
862,087
|
|
100.0
|
%
|
|||
|
Cost of sales
|
853,897
|
|
82.0
|
%
|
722,042
|
|
83.8
|
%
|
|||||
|
Gross profit
|
186,976
|
|
18.0
|
%
|
140,045
|
|
16.2
|
%
|
|||||
|
Selling, general, and administrative expense
|
134,028
|
|
12.9
|
%
|
102,492
|
|
11.9
|
%
|
|||||
|
Intangible asset impairment
|
4,863
|
|
0.5
|
%
|
107,970
|
|
12.5
|
%
|
|||||
|
Income (loss) from operations
|
48,085
|
|
4.6
|
%
|
(70,417
|
)
|
(8.2
|
)%
|
|||||
|
Interest expense
|
15,003
|
|
1.4
|
%
|
14,421
|
|
1.6
|
%
|
|||||
|
Other income
|
(4,018
|
)
|
(0.4
|
)%
|
(88
|
)
|
—
|
%
|
|||||
|
Income (loss) before taxes
|
37,100
|
|
3.6
|
%
|
(84,750
|
)
|
(9.8
|
)%
|
|||||
|
Provision for (benefit of) income taxes
|
13,624
|
|
1.3
|
%
|
(2,958
|
)
|
(0.3
|
)%
|
|||||
|
Income (loss) from continuing operations
|
23,476
|
|
2.3
|
%
|
(81,792
|
)
|
(9.5
|
)%
|
|||||
|
Loss from discontinued operations
|
(28
|
)
|
—
|
%
|
(32
|
)
|
—
|
%
|
|||||
|
Net income (loss)
|
$
|
23,448
|
|
2.3
|
%
|
$
|
(81,824
|
)
|
(9.5
|
)%
|
|||
The following table sets forth the Company’s net sales by reportable segment for the years ended December 31 (in thousands):
|
|
Change due to
|
||||||||||||||||||
|
|
2015
|
2014
|
Total
Change
|
Foreign Currency
|
Operations
|
||||||||||||||
|
Net sales:
|
|||||||||||||||||||
|
Residential Products
|
$
|
475,653
|
|
$
|
431,915
|
|
$
|
43,738
|
|
$
|
(8,030
|
)
|
$
|
51,768
|
|
||||
|
Industrial and Infrastructure Products
|
378,224
|
|
431,432
|
|
(53,208
|
)
|
(12,033
|
)
|
(41,175
|
)
|
|||||||||
|
Less Inter-Segment Sales
|
(1,536
|
)
|
(1,260
|
)
|
(276
|
)
|
—
|
|
(276
|
)
|
|||||||||
|
376,688
|
|
430,172
|
|
(53,484
|
)
|
(12,033
|
)
|
(41,451
|
)
|
||||||||||
|
Renewable Energy and Conservation
|
188,532
|
|
—
|
|
188,532
|
|
—
|
|
188,532
|
|
|||||||||
|
Consolidated
|
$
|
1,040,873
|
|
$
|
862,087
|
|
$
|
178,786
|
|
$
|
(20,063
|
)
|
$
|
198,849
|
|
||||
Consolidated net sales
increased
by
$178.8 million
, or
20.7%
, to
$1.0 billion
for
2015
compared to
2014
. The
increase
was the net result of sales generated by RBI of
$188.5 million
or 21.9%, acquired in June 2015, along with a 1.2% increase in volume, partially offset by foreign currency fluctuations which totaled $20.1 million.
Net sales in our Residential Products segment
increased
10.1%
or
$43.7 million
to
$475.7 million
in
2015
compared to
$431.9 million
in
2014
. The
increase
from prior year was primarily the result of an 11.0% increase in volume along with a 0.9% increase in pricing to customers, partially offset by foreign currency fluctuations which decreased net sales by $8.0 million for the year. The volume increase was largely the result of stronger demand for our postal and parcel storage products driven by postal authorities' initial efforts to convert existing door-to-door deliveries to centralized delivery. Additionally, higher sales of our roofing-related ventilation and rain dispersion products also contributed to the net sales growth in this segment as well.
22
Net sales in our Industrial and Infrastructure Products segment
decreased
12.4%
or
$53.5 million
to
$376.7 million
in
2015
compared to
$430.2 million
in
2014
. Apart from the $12.0 million impact of exchange rate fluctuations, the remaining
decrease
in net sales of
$41.5 million
was due to lower volume along with a 1.0% decrease in pricing to customers. This segment was primarily impacted by a decline in volume for our industrial products generated from energy-related sectors, largely the result of lower commodity prices, along with a decline in oil and gas prices. Demand for our infrastructure products, including components for bridges and elevated highways, related to these projects remained essentially unchanged from prior year as uncertainty in government funding for U.S. transportation projects prevailed throughout 2015. In December 2015, a new infrastructure bill was passed authorizing U.S. federal funding for five years that should positively impact future demand for products sold by this segment.
Our consolidated gross margin
increased
to
18.0%
for
2015
compared to
16.2%
for
2014
.
Within our Residential Products segment, both gross profit and gross margin, as a percentage of sales, increased as compared to 2014. This segment largely benefited from volume increases along with cost reductions resulting from our company-wide initiatives to simplify our business processes and product lines. Partially offsetting these increases were currency fluctuations resulting from the strengthening U.S. dollar and restructuring charges incurred to conduct the company-wide simplification initiatives. We believe completing these initiatives will lead to further improved margins in future periods.
In our Industrial and Infrastructure Products segment, its modestly higher gross profit and gross margin, as a percentage of sales, primarily resulted from an improved alignment of material costs to customer selling prices. Lower volumes in our industrial products, currency fluctuations resulting from the strengthening U.S. dollar and restructuring charges incurred to conduct the company-wide simplification initiatives partially offset the increase to gross profit, yet had minimal impact on the segment's gross margin as compared to the prior year.
The results of the Renewable Energy and Conservation operating segment contributed to both the increase in the consolidated gross profit and gross margin for 2015 as compared to 2014 when we did not own RBI or participate in this operating segment.
Selling, general, and administrative (SG&A) expenses
increased
by
$31.5 million
, or
30.8%
, to
$134.0 million
for
2015
from
$102.5 million
for
2014
. The
$31.5 million
increase
was primarily the net result of $24.0 million of incremental SG&A expense of RBI, plus $11.7 million of higher performance-based compensation, and a $2.9 million charge for senior leadership transition costs, partially offset by a $6.8 million gain on the sale leaseback of one of our facilities during 2015. SG&A expenses as a percentage of net sales increased to
12.9%
for
2015
compared to
11.9%
for
2014
.
During 2015, we recognized intangible asset impairment charges of
$4.9 million
due to a reduction in estimated fair values of indefinite-lived trademarks at certain reporting units. The largest portion of the impairment was
$4.4 million
related to intangibles in our Industrial and Infrastructure Products segment. In 2014, we recognized intangible asset impairment charges of
$108.0 million
. The charges stemmed from lower estimated fair values of certain reporting units. The largest portion of the impairment was
$92.5 million
related to intangibles in our Industrial and Infrastructure Products segment.
The following table sets forth the Company’s income from operations and income from operations as a percentage of net sales by reportable segment for the years ended December 31 (in thousands):
|
|
|
|
|
Change Due To
|
|||||||||||||||||||||||
|
|
2015
|
2014
|
Total
Change
|
Intangible
Impairment
|
Foreign Currency
|
Operations
|
|||||||||||||||||||||
|
Income (loss) from operations:
|
|||||||||||||||||||||||||||
|
Residential Products
|
$
|
46,804
|
|
9.8
|
%
|
$
|
16,416
|
|
3.8
|
%
|
$
|
30,388
|
|
$
|
14,995
|
|
$
|
(8,030
|
)
|
$
|
23,423
|
|
|||||
|
Industrial and Infrastructure Products
|
15,581
|
|
4.1
|
%
|
(74,634
|
)
|
(17.3
|
)%
|
90,215
|
|
88,112
|
|
(3,000
|
)
|
5,103
|
|
|||||||||||
|
Renewable Energy and Conservation
|
12,659
|
|
6.7
|
%
|
—
|
|
—
|
%
|
12,659
|
|
—
|
|
—
|
|
12,659
|
|
|||||||||||
|
Unallocated Corporate Expenses
|
(26,959
|
)
|
(2.6
|
)%
|
(12,199
|
)
|
(1.4
|
)%
|
(14,760
|
)
|
—
|
|
—
|
|
(14,760
|
)
|
|||||||||||
|
Consolidated income (loss)
|
$
|
48,085
|
|
4.6
|
%
|
$
|
(70,417
|
)
|
(8.2
|
)%
|
$
|
118,502
|
|
$
|
103,107
|
|
$
|
(11,030
|
)
|
$
|
26,425
|
|
|||||
Our Residential Products segment generated an operating margin of
9.8%
in
2015
compared to an operating margin of
3.8%
in
2014
. Excluding the impact of prior year impairment charges and foreign currency fluctuations resulting from the strengthening U.S. dollar, this segment realized a
$23.4 million
increase in income from operations. This increase was the
23
result of higher sales volumes for postal products, a more favorable alignment of material costs to customer selling prices and a gain of $6.8 million on the sale leaseback of a facility during the first quarter of 2015.
Offsetting this increa
se were charges of $7.8 million incurred related to the Company-wide initiatives to simplify our business processes and product lines throughout the organization which commenced in the second quarter of 2015.
Our Industrial and Infrastructure Products segment generated an operating margin of
4.1%
during
2015
compared to an operating margin of -
17.3%
during
2014
. Excluding the impact of a net change in intangible asset impairment charges and foreign currency fluctuations, this segment's increase in income from operations was
$5.1 million
. An improved alignment of material costs to customer selling prices along with benefits from cost reductions more than offset the effects of decreased sales volume in our industrial products and additional charges of $2.2 million incurred to conduct the Company-wide simplification initiatives.
Corporate expenses
increased
$
14.8 million
, or 121.0% for
2015
from $
12.2 million
for
2014
to $
27.0 million
for
2015
The increase from the prior year was primarily the result of an increase in performance based compensation expense of $7.5 million, $2.5 million for senior leadership transition costs, and $2.3 million of net charges for acquisition related items.
Other income of
$4.0 million
in
2015
increased from
$0.1 million
in
2014
. This income is primarily comprised of net gains on derivative contracts for hedges on foreign currencies and select raw materials related to transactions in our Residential Products segment, offset by foreign currency translation losses.
Interest expense
increased
$0.6 million
to $
15.0 million
for
2015
from
$14.4 million
for
2014
. In
2015
, we borrowed funds under our 2011 revolving credit facility to help finance the acquisition of RBI in June 2015, which contributed to the
increase
in expense as compared to the prior year. These borrowings were paid in full prior to the end of 2015. During
2014
, no amounts were outstanding under our revolving credit facility.
We recognized a provision for income taxes of $
13.6 million
for
2015
, an effective tax rate of 36.7%, compared with a benefit from income taxes of $
3.0 million
, an effective rate of 3.5% for
2014
. The difference between the Company’s recorded charge for
2015
and the expense that would result from applying the U.S. statutory rate of 35% is primarily attributable to the tax impact of state taxes and non-deductible permanent differences recognized during the year. The effective tax rate for 2014 was primarily attributable to the tax impact of the non-deductible goodwill and intangible asset impairments recognized in 2014.
Year Ended
December 31, 2014
Compared to Year Ended
December 31, 2013
The following table sets forth selected results of operations data (in thousands) and its percentages of net sales for the years ended December 31:
|
|
2014
|
2013
|
|||||||||||
|
Net sales
|
$
|
862,087
|
|
100.0
|
%
|
$
|
827,567
|
|
100.0
|
%
|
|||
|
Cost of sales
|
722,042
|
|
83.8
|
%
|
669,470
|
|
80.9
|
%
|
|||||
|
Gross profit
|
140,045
|
|
16.2
|
%
|
158,097
|
|
19.1
|
%
|
|||||
|
Selling, general, and administrative expense
|
102,492
|
|
11.9
|
%
|
113,457
|
|
13.7
|
%
|
|||||
|
Intangible asset impairment
|
107,970
|
|
12.5
|
%
|
23,160
|
|
2.8
|
%
|
|||||
|
(Loss) income from operations
|
(70,417
|
)
|
(8.2
|
)%
|
21,480
|
|
2.6
|
%
|
|||||
|
Interest expense
|
14,421
|
|
1.6
|
%
|
22,489
|
|
2.7
|
%
|
|||||
|
Other income
|
(88
|
)
|
—
|
%
|
(177
|
)
|
—
|
%
|
|||||
|
Loss before taxes
|
(84,750
|
)
|
(9.8
|
)%
|
(832
|
)
|
(0.1
|
)%
|
|||||
|
(Benefit of) provision for income taxes
|
(2,958
|
)
|
(0.3
|
)%
|
4,797
|
|
0.6
|
%
|
|||||
|
Loss from continuing operations
|
(81,792
|
)
|
(9.5
|
)%
|
(5,629
|
)
|
(0.7
|
)%
|
|||||
|
Loss from discontinued operations
|
(32
|
)
|
—
|
%
|
(4
|
)
|
—
|
%
|
|||||
|
Net loss
|
$
|
(81,824
|
)
|
(9.5
|
)%
|
$
|
(5,633
|
)
|
(0.7
|
)%
|
|||
24
The following table sets forth the Company’s net sales by reportable segment for the years ended December 31 (in thousands):
|
|
|||||||||||
|
|
2014
|
2013
|
Total
Change
|
||||||||
|
Net sales:
|
|||||||||||
|
Residential Products
|
$
|
431,915
|
|
$
|
394,071
|
|
$
|
37,844
|
|
||
|
Industrial and Infrastructure Products
|
431,432
|
|
435,168
|
|
(3,736
|
)
|
|||||
|
Less Inter-Segment Sales
|
(1,260
|
)
|
(1,672
|
)
|
412
|
|
|||||
|
430,172
|
|
433,496
|
|
(3,324
|
)
|
||||||
|
Consolidated
|
$
|
862,087
|
|
$
|
827,567
|
|
$
|
34,520
|
|
||
Net sales
increased
by
$34.5 million
, or
4.2%
, to
$862.1 million
for
2014
from net sales of
$827.6 million
for
2013
. The
increase
was the result of a 3.2% increase in volume, a 0.7% increase in pricing to customers, and 0.3% increase due to sales generated by an acquisition completed in September 2013.
Net sales in our Residential Products segment
increased
9.6%
or
$37.8 million
to
$431.9 million
in
2014
compared to
$394.1 million
in
2013
. The
increase
from prior year was primarily the result of a 9.5% increase in volume along with a 0.7% increase due to sales generated by an acquisition completed in 2013, slightly offset by a 0.5% decrease in pricing to customers. The most significant contributor to the increased sales was higher demand for our centralized postal and parcel storage products. As postal authorities strive to convert door-to-door deliveries to centralized deliveries, sales of our cluster unit mail boxes have benefited. This segment also benefited from modestly higher sales of our roofing-related ventilation and rain dispersion products. The lower selling prices were primarily the result of meeting selective competitive situations.
Net sales in our Industrial and Infrastructure Products segment
decreased
0.8%
or
$3.3 million
to
$430.2 million
in
2014
compared to
$433.5 million
in
2013
. The
decrease
was the result of a 2.5% decrease in volume partially offset by a 1.7% increase in pricing to customers. Lower demand for our transportation infrastructure products including components for bridges and elevated highways accounted for the volume decrease. Demand in this market is highly dependent on governmental funding and transportation projects continue to be negatively impacted by the uncertainty in government funding. The modest increase in pricing offered to customers was the result of covering raw material inflation.
Despite the
increase
in consolidated net sales, our gross margin
decreased
to
16.2%
for
2014
compared to
19.1%
for
2013
. Contributing to the lower gross margin were competitive pressures on pricing and increasing raw material costs. We also incurred additional costs to increase our manufacturing capacity this year in our Residential Products segment, and initial inefficiencies contributed to the margin compression. An unfavorable mix of products with lower margins as compared to the prior year further contributed to the margin compression in our Industrial and Infrastructure Products segment. These factors contributed to the overall margin decline, but were partially offset by cost reductions resulting from staffing reductions in support functions implemented during the year.
Selling, general, and administrative (SG&A) expenses
decreased
by
$11.0 million
, or
9.7%
, to
$102.5 million
for
2014
from
$113.5 million
for
2013
. The
$11.0 million
decrease
was largely the result of a $8.1 million decrease in variable performance based compensation as compared to 2013, plus a $1.4 million reduction in contingent consideration (or "earn-out") payable to the seller of a business acquired by the Company in 2013. The payable is adjusted on a quarterly basis through the Company's Statement of Operations based on the acquired business's projected EBITDA (Earnings Before Interest, Taxes, Depreciation and Amortization) through September 30, 2015. SG&A expenses as a percentage of net sales decreased to
11.9%
for
2014
compared to
13.7%
for
2013
.
During 2014, we recognized intangible asset impairment charges of
$108.0 million
. The charges stemmed from lower estimated fair values of certain reporting units. The largest portion of the impairment was
$92.5 million
related to intangibles in our Industrial and Infrastructure Products segment. In 2013, we recognized intangible asset impairment charges of
$23.2 million
due to a reduction in the estimated fair value primarily in our European-based business in our Industrial and Infrastructure Products segment.
25
The following table sets forth the Company’s income from operations and income from operations as a percentage of net sales by reportable segment for the years ended December 31 (in thousands):
|
|
|
|
|
Change Due To
|
|||||||||||||||||||
|
|
2014
|
2013
|
Total
Change
|
Intangible
Impairment
|
Operations
|
||||||||||||||||||
|
Income (loss) from operations:
|
|||||||||||||||||||||||
|
Residential Products
|
$
|
16,416
|
|
3.8
|
%
|
$
|
34,965
|
|
8.9
|
%
|
$
|
(18,549
|
)
|
$
|
(14,435
|
)
|
$
|
(4,114
|
)
|
||||
|
Industrial and Infrastructure Products
|
(74,634
|
)
|
(17.3
|
)%
|
7,169
|
|
1.6
|
%
|
(81,803
|
)
|
(70,375
|
)
|
(11,428
|
)
|
|||||||||
|
Unallocated Corporate Expenses
|
(12,199
|
)
|
(1.4
|
)%
|
(20,654
|
)
|
(2.5
|
)%
|
8,455
|
|
—
|
|
8,455
|
|
|||||||||
|
Consolidated (loss) income
|
$
|
(70,417
|
)
|
(8.2
|
)%
|
$
|
21,480
|
|
2.6
|
%
|
$
|
(91,897
|
)
|
$
|
(84,810
|
)
|
$
|
(7,087
|
)
|
||||
|
2014
|
2013
|
||||||||||||||||||||||
|
Income from Operations
|
Goodwill and Intangible Asset Impairment
|
Income from Operations before Impairment
|
Income from Operations
|
Goodwill and Intangible Asset Impairment
|
Income from Operations before Impairment
|
||||||||||||||||||
|
Income (loss) from operations without impairment charges:
|
|||||||||||||||||||||||
|
Residential Products
|
$
|
16,416
|
|
$
|
15,435
|
|
$
|
31,851
|
|
$
|
34,965
|
|
$
|
1,000
|
|
$
|
35,965
|
|
|||||
|
Industrial and Infrastructure Products
|
(74,634
|
)
|
92,535
|
|
17,901
|
|
7,169
|
|
22,160
|
|
29,329
|
|
|||||||||||
|
Unallocated Corporate Expenses
|
(12,199
|
)
|
—
|
|
(12,199
|
)
|
(20,654
|
)
|
—
|
|
(20,654
|
)
|
|||||||||||
|
Consolidated (loss) income
|
$
|
(70,417
|
)
|
$
|
107,970
|
|
$
|
37,553
|
|
$
|
21,480
|
|
$
|
23,160
|
|
$
|
44,640
|
|
|||||
Our Residential Products segment generated an operating margin of
3.8%
in
2014
compared to an operating margin of
8.9%
in
2013
. Excluding the impairment charges of
$15.4 million
for
2014
and
$1.0 million
for
2013
, the Residential Products segment generated operating income of
$31.9 million
or 7.4% of sales in
2014
compared to
$36.0 million
or 9.1% of sales for
2013
, a
decrease
of
$4.1 million
, or 11.4%. The decreased profitability was the result of additional costs incurred to increase our manufacturing capacity this year which were not fully recovered by higher sales. This segment also incurred higher raw material costs and a less favorable alignment of material costs to customer selling prices as compared to 2013.
Our Industrial and Infrastructure Products segment generated an operating margin of -
17.3%
during
2014
compared to an operating margin of
1.6%
during
2013
. Excluding the
2014
and
2013
impairment charges of
$92.5 million
and
$22.2 million
, respectively, the Industrial and Infrastructure segment generated operating income of
$17.9 million
or 4.2% of sales in
2014
compared to operating income of
$29.3 million
or 6.8% of sales in
2013
. The
$11.4 million
decrease was due to a less favorable product mix of lower shipments to the transportation infrastructure market as compared to 2013, plus a less favorable alignment of material costs to customer selling prices and raw material cost inflation.
Corporate expenses
decreased
$8.5 million
, or 40.9% for
2014
from $
20.7 million
for
2013
to
$12.2 million
for
2014
The decrease was primarily the result of a decrease in variable performance based compensation expense of $6.7 million from prior year along with a a $1.4 million reduction in contingent consideration payable to the seller of assets acquired by the Company in 2013.
Interest expense
decreased
$8.1 million
to
$14.4 million
for
2014
from
$22.5 million
for
2013
. The significant
decrease
in expense resulted from the redemption of the $204.0 million of the 8% Notes in the first quarter of 2013. In connection with this transaction, the Company recorded a charge of approximately $7.2 million, which included $3.7 million for the prepayment premium paid to holders of the 8% Notes, $2.2 million to write-off deferred financing fees and $1.3 million for the unamortized original issue discount related to the 8% Notes. The $7.2 million charge was partially offset by lower interest expense of approximately $0.4 million resulting from the lower coupon rate on the $210.0 million 6.25% Notes issued in the first quarter of 2013 as compared to the 8% Notes. During
2014
and
2013
, no amounts were outstanding under our revolving credit facility.
We recognized a benefit from income taxes of
$3.0 million
for
2014
, an effective tax rate of 3.5%, compared with a provision for income taxes of
$4.8 million
, an effective rate of -576.6% for
2013
. The difference between the Company’s recorded benefit for
2014
and the benefit that would result from applying the U.S. statutory rate of 35% is primarily attributable to the tax
26
impact of the non-deductible goodwill and intangible asset impairments recognized in 2014. The effective tax rate for 2013 was primarily attributable to the tax impact of the non-deductible goodwill impairment, state taxes, and the reversal of $2.3 million valuation allowance for certain state deferred tax assets.
Outlook
We begin 2016 fully focused on continuing to drive transformational change in our business and in our financial results through the execution of our four-pillar strategy, which includes operational improvement, portfolio management, product innovation and acquisitions. In the near term, we are confident that Gibraltar will achieve the three key financial objectives we have set for 2016: increasing earnings, making more efficient use of our capital, and delivering higher shareholder returns than we did in 2015.
For 2016, we expect the Company will generate increased revenues and earnings compared to 2015. 2016 consolidated revenues are expected to range between $1.06 billion and $1.08 billion - up approximately 3% from 2015.
This 3% projected growth in consolidated revenues includes the net effect of two changes, of which is a decrease in our Residential Products segment revenues in 2016 due to the completion in December 2015 of a 2-year contract for centralized mail receptacles and the addition of incremental revenues in 2016 for our RBI acquisition which closed in mid-June 2015.
Concerning each segment, and starting with our Residential Products segment, our expectations for its 2016 performance compared to 2015 includes its revenues decreasing by approximately 15%. This decrease is based on the 2015 completion of a specific customer’s 2-year contract for centralized mail receptacles, partially offset by gradually improving market conditions for U.S. new housing starts and equivalent-to-2015 demand from remodeling activities.
Our Industrial and Infrastructure Products segment is expecting equivalent revenues this year, compared to 2015. Low commodity prices, including oil, depressed order rates throughout 2015. We expect the lower level of demand from key industrial markets such as upstream oil and gas production will continue to affect 2016. In late December 2015, a new U.S. federal transportation five-year $305 billion highway appropriation was signed into law. We expect this legislation to meaningfully affect this segment’s revenues beginning in 2017.
Concerning our newly-titled Renewable Energy & Conservation segment (comprised of RBI), we believe there will be continued and increasing demand for solar-generated electricity, with a continuing stimulus beyond 2016 from the U.S.’s 5-year extension of the federal investment tax credit. This segment’s 2016 revenues should increase over 2015 led by higher market demand for renewable energy.
Regarding profitability in 2016, we expect improvement in earnings to come from additional cost efficiencies derived from the 80/20 simplification initiative, plus the incremental accretive earnings from RBI. We also expect restructuring charges in 2016 related to our continuing simplification initiative. In 2015 we incurred $9.9 million of such charges largely related to reductions in inventory and other operating assets. In 2016 we could incur comparable amounts of restructuring charges for yet approved projects impacting inventory, fixed assets, and facilities. Overall, our simplification initiative, which commenced in late 2014, is expected to drive a total of 200 to 300 basis points increase in operating margin over the first three years of this initiative.
Liquidity and Capital Resources
General
Our principal capital requirements are to fund our operations with working capital, the purchase of capital improvements for our businesses and facilities, and to fund acquisitions. We will continue to invest in growth opportunities as appropriate while focusing on working capital efficiency and profit improvement opportunities to minimize the cash invested to operate our business. We have successfully generated positive cash flows from operating activities which have funded our capital requirements and assisted in the funding of our recent acquisitions as noted below in the “Cash Flows” section of Item 7 of this Annual Report on Form 10-K.
On December 9, 2015, we entered into the Company's Fifth Amended and Restated Credit Agreement (the Senior Credit Agreement) which includes a 5-year, $300 million revolving credit facility and provides Gibraltar with access to capital and improved financial flexibility. As of
December 31, 2015
, our liquidity of $
348.4 million
consisted of
$68.9 million
of cash and $
279.5 million
of availability under our revolving credit facility as compared to liquidity of $
209.0 million
as of
December 31,
27
2014
. We believe this liquidity, together with the cash expected to be generated from operations, should be sufficient to fund working capital needs and simplification initiatives that likely will need cash to fund transitions and future growth. We continue to search for strategic acquisitions and a larger acquisition may require additional borrowings and/or the issuance of our common stock.
Our Senior Credit Agreement provides the Company with liquidity and capital resources for use by our U.S. operations. Historically, our foreign operations have generated cash flow from operations sufficient to invest in working capital and fund their capital improvements. As of
December 31, 2015
, our foreign subsidiaries held $
29.3 million
of cash. We believe cash held by our foreign subsidiaries provides our foreign operations with the necessary liquidity to meet future obligations and allows the foreign business units to reinvest in their operations. These cash resources could eventually be used to grow our business internationally. Repatriation of this cash for domestic purposes could result in significant tax consequences.
Over the long-term, we expect that future obligations, including strategic business opportunities such as acquisitions, may be financed through a number of sources, including internally available cash, availability under our revolving credit facility, new debt financing, the issuance of equity securities, or any combination of the above. Any potential acquisitions are evaluated based on our acquisition strategy, which includes the enhancement of our existing products, operations, or capabilities, expanding our access to new products, markets, and customers, and the improvement of shareholder value. Our 2015 acquisition of RBI was funded through a combination of cash on hand and borrowings under the Company's revolving credit facility. These borrowings were repaid prior to the end of 2015.
These expectations are forward-looking statements based upon currently available information and may change if conditions in the credit and equity markets deteriorate or other circumstances change. To the extent that operating cash flows are lower than current levels, or sources of financing are not available or not available at acceptable terms, our future liquidity may be adversely affected.
Cash Flows
The following table sets forth selected cash flow data for the years ended December 31 (in thousands):
|
2015
|
2014
|
||||||
|
Cash provided by (used in):
|
|||||||
|
Operating activities of continuing operations
|
$
|
86,684
|
|
$
|
32,583
|
|
|
|
Investing activities of continuing operations
|
(125,340
|
)
|
(17,022
|
)
|
|||
|
Financing activities of continuing operations
|
(184
|
)
|
(322
|
)
|
|||
|
Discontinued operations
|
—
|
|
(41
|
)
|
|||
|
Effect of exchange rate changes
|
(2,912
|
)
|
(1,627
|
)
|
|||
|
Net (decrease) increase in cash and cash equivalents
|
$
|
(41,752
|
)
|
$
|
13,571
|
|
|
During the year ended
December 31, 2015
, net cash provided by continuing operations totaled
$86.7 million
. This amount was primarily driven by non-cash net charges totaling $
43.5 million
that included depreciation, amortization, deferred income taxes, stock compensation, non-cash restructuring costs and intangible asset impairment charges, along with income from continuing operations of $
23.5 million
and a decrease in working capital and other net assets of $19.7 million. Net cash provided by continuing operations for
2014
was
$32.6 million
and was primarily driven by non-cash net charges totaling
$129.6 million
that included depreciation, amortization, deferred income taxes, stock compensation, and an intangible asset impairment, partially offset by loss from continuing operations of $
81.8 million
.
During 2015, our cash invested in other net assets decreased by $19.7 million. The decrease in other net assets was primarily due to an increase in liabilities for long term equity incentive plans resulting from stronger performance of both the Company's financial results, as well as, the Company's stock price in 2015. A deferred gain due to a sale leaseback transaction and the timing of tax and interest payments also contributed to the decrease in other net assets. While the Company’s total investment in working capital was unchanged from the prior year, accounts receivable increased by $17.2 million as a result of higher net sales in the fourth quarter of 2015 compared to 2014, largely the result of the acquisition of RBI. This increase in accounts receivable was essentially offset by a $22.3 million decrease in inventory and a $5.1 million decrease in accounts payable. The decrease in inventory was largely due to the Company's 80/20 simplification process, which has resulted in the discontinuation of less profitable product lines and the corresponding disposal of inventory associated with those product lines. Accounts payable decreased due to the timing of vendor payments made near year end. During the year ended
December 31, 2014
, cash
28
flow invested in working capital and other net assets included $14.3 million and $8.6 million increases in accounts receivable and inventory, respectively, partially offset by a $11.2 million increase in accounts payable.
Net cash used in investing activities for
2015
of $
125.3 million
primarily consisted of $140.6 million of net cash paid for the acquisition of RBI and capital expenditures of $12.4 million partially offset by $26.5 million received from the sale-leaseback of a property. Net cash used in investing activities for 2014 of
$17.0 million
was primarily due to capital expenditures of $23.3 million partially offset by $6.0 million received from the sale of two properties.
Net cash used in financing activities for
2015
of $
0.2 million
primarily consisted of debt issuance cost payments of $1.2 million, the purchase of treasury stock of $1.0 million, payments of long-term debt borrowings, net of proceeds, of $0.4 million, offset by the proceeds received from the issuance of common stock of $1.8 million and a tax benefit from equity compensation of $0.6 million. Net cash used in financing activities for 2014 of
$0.3 million
was the result of the purchase of treasury stock of $0.6 million and $0.4 million in long term debt payments, partially offset by the proceeds from the issuance of common stock of $0.6 million.
Senior Credit Agreement and Senior Subordinated Notes
Our Senior Credit Agreement is committed through December 9, 2020. Borrowings under the 2015 Senior Credit Agreement are secured by the trade receivables, inventory, personal property, equipment, and certain real property of the Company’s significant domestic subsidiaries. The Senior Credit Agreement provides for a revolving credit facility and letters of credit in an aggregate amount of $300 million. The Company can request additional financing from the banks to increase the revolving credit facility to $500 million or enter into a term loan of up to $200 million subject to conditions set forth in the Senior Credit Agreement.
There are three quarterly maintenance covenants contained in the Senior Credit Agreement, which require: (i) a Maximum Senior Secured Leverage Ratio of 3.25x; (ii) a Maximum Total Leverage Ratio of 4.50x; and (iii) a Minimum Interest Coverage Ratio of 3.00x. As of
December 31, 2015
, the Company was in compliance with these financial covenants. The Senior Credit Agreement contains other provisions and events of default that are customary for similar agreements and may limit the Company’s ability to take various actions.
Borrowings under the Senior Credit Agreement bear interest at a variable interest rate based on the LIBOR plus an additional margin that ranges from 1.25% to 2.25% for LIBOR loans based on the Total Leverage Ratio. In addition, the revolving credit facility is subject to an undrawn commitment fee ranging between 0.20% and 0.30% based on the Total Leverage Ratio and the daily average undrawn balance.
As of
December 31, 2015
, we had $
279.5 million
of availability under the Senior Credit Agreement net of outstanding letters of credit of $
20.5 million
. To finance the acquisition of RBI in the second quarter of 2015, we borrowed amounts under the revolving credit facility which were repaid prior to the end of 2015. No amounts were outstanding under our revolving credit facility as of December 31,
2015
or our predecessor credit facility as of December 31,
2014
.
In addition to our Senior Credit Agreement, the Company issued $210.0 million of 6.25% Notes in January 2013 which are due February 1, 2021. Provisions of the 6.25% Notes include, without limitation, restrictions on indebtedness, liens, and distributions from restricted subsidiaries, asset sales, affiliate transactions, dividends, and other restricted payments. Dividend payments are subject to annual limits of the greater of $0.25 per share or $25 million. The 6.25% Notes are redeemable at the option of the Company, in whole or in part, at any time on or after February 1, 2017, at the redemption price. The redemption prices are 103.13% and 101.56% of the principal amount thereof if the redemption occurs during the 12-month periods beginning February 1, of the years 2017 and 2018, respectively, and 100% of the principal amount thereof on and after February 1, 2019, in each case plus accrued and unpaid interest to the applicable redemption date. In addition, prior to February 1, 2016, the Company may redeem up to 35% of the aggregate principal amount of the Notes with the net cash proceeds of certain equity offerings by the Company at a redemption price of 106.25% of the principal amount thereof, plus accrued and unpaid interest to the redemption date. In the event of a Change in Control (as defined in the Senior Subordinated 6.25% Notes Indenture), each holder of the 6.25% Notes may require the Company to repurchase all or a portion of such holder’s 6.25% Notes at a purchase price equal to 101% of the principal amount thereof. The Senior Subordinated 6.25% Notes Indenture also contains provisions that limit additional borrowings based on the Company’s consolidated interest coverage ratio.
29
Off Balance Sheet Arrangements
The Company does not have any off balance sheet arrangements, other than operating leases, that have or are reasonably likely to have a current or future material effect on our financial condition, changes in financial condition, revenues or expenses, results of operations, liquidity, capital expenditures, or capital resources.
Contractual Obligations
The following table summarizes by category our Company’s expected future cash outflows associated with contractual obligations in effect at
December 31, 2015
(in thousands):
|
|
Payments Due by Period
|
||||||||||||||||||
|
Contractual Obligation
|
Total
|
Less than
One Year
|
One to Three
Years
|
Three to
Five Years
|
More Than
Five Years
|
||||||||||||||
|
Fixed rate debt
|
$
|
210,000
|
|
$
|
—
|
|
$
|
—
|
|
$
|
—
|
|
$
|
210,000
|
|
||||
|
Interest on fixed rate debt
|
66,719
|
|
13,125
|
|
26,250
|
|
26,250
|
|
1,094
|
|
|||||||||
|
Operating lease obligations
|
48,177
|
|
12,817
|
|
20,753
|
|
9,397
|
|
5,210
|
|
|||||||||
|
Pension and other post-retirement payments
|
7,173
|
|
1,359
|
|
1,514
|
|
1,278
|
|
3,022
|
|
|||||||||
|
Management stock purchase plan
1
|
9,326
|
|
2,351
|
|
4,142
|
|
2,598
|
|
235
|
|
|||||||||
|
Variable rate debt (including interest)
2
|
3,238
|
|
409
|
|
815
|
|
809
|
|
1,205
|
|
|||||||||
|
Performance stock unit awards
|
8,593
|
|
2,723
|
|
5,870
|
|
—
|
|
—
|
|
|||||||||
|
Other
|
859
|
|
267
|
|
356
|
|
236
|
|
—
|
|
|||||||||
|
Total
|
$
|
354,085
|
|
$
|
33,051
|
|
$
|
59,700
|
|
$
|
40,568
|
|
$
|
220,766
|
|
||||
|
1
|
Includes amounts due to retired participants of the Management Stock Purchase Plan (MSPP). Excludes the future payments due to active participants of the MSPP, which represents a liability of $9.6 million as of
December 31, 2015
. The timing of future payments to active participants cannot be accurately estimated as we are uncertain of when active participants’ service to the Company will terminate.
|
|
2
|
Calculated using the interest rate in effect of 0.30% at
December 31, 2015
.
|
Critical Accounting Policies
The preparation of the financial statements in conformity with accounting principles generally accepted in the United States of America requires management to make decisions based upon estimates, assumptions, and factors it considers relevant to the circumstances. Such decisions include the selection of applicable principles and the use of judgment in their application, the results of which could differ from those anticipated.
A summary of the Company’s significant accounting policies are described in Note 1 of the Company’s consolidated financial statements included in Item 8 of this Annual Report on Form 10-K.
Our most critical accounting policies include:
|
•
|
valuation of accounts receivable;
|
|
•
|
valuation of inventory;
|
|
•
|
the allocation of the purchase price of acquisitions to the fair value of acquired assets and liabilities;
|
|
•
|
the assessment of recoverability of depreciable and amortizable long-lived assets;
|
|
•
|
the assessment of recoverability of goodwill and other indefinite-lived intangible assets;
|
|
•
|
accounting for income taxes and deferred tax assets and liabilities and,
|
|
•
|
revenue recognition on contracts.
|
Management reviews these estimates, including the allowance for doubtful accounts and inventory reserves, on a regular basis and makes adjustments based on historical experience, current conditions, and future expectations. Management believes these estimates are reasonable, but actual results could differ from these estimates.
Valuation of Accounts Receivable
Our accounts receivable represent those amounts that have been billed to our customers but not yet collected, as well as, costs in excess of billings which principally represent revenues recognized on contracts that were not billable as of the balance sheet
30
date. As of
December 31, 2015
and
2014
, allowances for doubtful accounts of
$4.9 million
and
$4.3 million
were recorded, or approximately
3%
and
4%
of gross accounts receivable for both periods, respectively. We record an allowance for doubtful accounts based on the portion of those accounts receivable that we believe are potentially uncollectible based on various factors, including experience, creditworthiness of customers, and current market and economic conditions. If the financial condition of customers were to deteriorate, resulting in impairment of their ability to make payments, additional allowances may be required. Changes in judgments on these factors could impact the timing of costs recognized.
Valuation of Inventories
We record our inventories at the lower of cost or market. We determine the cost basis of our inventory on a first-in, first-out basis using a standard cost methodology that approximates actual cost. On a regular basis, we calculate an estimated market value of our inventory, considered to be the prevailing selling price for the inventory less the cost to complete and sell the product. We compare the current carrying value of our inventory to the estimated market value to determine whether a reserve to value inventory at the lower of cost or market is necessary. We recorded insignificant charges during the three year period ended
December 31, 2015
to value our inventory at the lower of cost or market.
We regularly review inventory on hand and record provisions for excess, obsolete, and slow-moving inventory based on historical and current sales trends. We recorded reserves for excess, obsolete, and slow-moving inventory of
$7.4 million
and
$5.6 million
at
December 31, 2015
and
2014
, respectively, or approximately
6%
and
4%
of gross inventories for
2015
and
2014
, respectively. Changes in product demand and our customer base may affect the value of inventory on hand, which may require higher provisions for obsolete inventory.
In addition, as a result of the Company's 80/20 simplification initiative, we have identified low-volume, internally-produced products which have been or will be planned to be outsourced or discontinued. We have recorded charges of $5.9 million during the year ended
December 31, 2015
related to the write-down of inventory associated with either discontinued product lines or the reduction of manufactured goods offered within a product line. These assets were written down to their sale or scrap value, and were subsequently sold or disposed of. Further simplification initiatives in 2016 could be identified which may result in additional write-downs of inventory.
Accounting for Acquired Assets and Liabilities
When we acquire a business, we allocate the purchase price to the assets acquired and liabilities assumed in the transaction at their respective estimated fair values. We record any premium over the fair value of net assets acquired as goodwill. Significant judgment is necessary to determine the fair value of the purchase price. The allocation of the purchase price involves judgments and estimates both in characterizing the assets and in determining their fair value. The way we characterize the assets has important implications, as long-lived assets with definitive lives, for example, are depreciated or amortized, whereas goodwill is tested annually for impairment, as explained below.
With respect to determining the fair value of the purchase price, the most subjective estimates involve valuations of contingent consideration. We engage independent third party valuation specialists to assist in the determination of the fair value of contingent consideration. Key assumptions used to value the contingent consideration include future projections and discount rates.
With respect to determining the fair value of assets, the most subjective estimates involve valuations of long-lived assets, such as property, plant, and equipment as well as identified intangible assets. We use all available information to make these fair value determinations and engage independent valuation specialists to assist in the fair value determination of the acquired long-lived assets. The fair values of long-lived assets are determined using valuation techniques that use discounted cash flow methods, independent market appraisals, and other acceptable valuation techniques.
Due to the subjectivity inherent in determining the fair value of long-lived assets and the significant number of acquisitions we have completed, we believe the allocation of purchase price to acquired assets and liabilities is a critical accounting policy.
Impairment of Depreciable and Amortizable Long-lived Assets
We test long-lived assets for impairment when events or changes in circumstances indicate that the carrying amount of those assets may not be recoverable and exceeds their fair value, or on an annual basis at minimum. During our annual test, we perform a recoverability test by comparing the carrying amount of asset groups to future undiscounted cash flows expected to result from the use of the assets. The impairment loss would be measured as the amount by which the carrying amount of a long-lived asset exceeds its fair value as determined by discounted cash flow method, an independent market appraisal of the asset, or another acceptable valuation technique.
31
In 2015, after completing the recoverability test, none of the Company's reporting unit's future undiscounted cash flows were less than the carrying amount of its assets. However, as a result of the Company's 80/20 simplification initiative, we have identified low-volume, internally-produced products which have been or will be planned to be outsourced or discontinued. We have recorded charges of $2.6 million during the year ended
December 31, 2015
related to the impairment of property, plant and equipment associated with either discontinued product lines or the reduction of manufactured goods offered within a product line. These assets were written down to their sale or scrap value, and were subsequently sold or disposed of. Further simplification initiatives in 2016 could be identified which may result in additional impairments.
Goodwill and Other Indefinite-lived Intangible Asset Impairment Testing
Testing Methodology
Our goodwill and indefinite-lived intangible asset balances of
$292.4 million
and
$50.5 million
as of
December 31, 2015
, respectively, are subject to impairment testing. We test goodwill and indefinite-lived intangible assets for impairment on an annual basis as of October 31 and at interim dates when indicators of impairment are present. Indicators of impairment could include a significant long-term adverse change in business climate, poor indicators of operating performance, or a sale or disposition of a significant portion of a reporting unit. As a result of the October 31, 2015 test, the Company recognized indefinite-lived intangible asset impairment charges of $4.9 million for the year ended
December 31, 2015
.
We test goodwill for impairment at the reporting unit level. We identify our reporting units by assessing whether the components of our Company constitute businesses for which discrete financial information is available and segment management regularly reviews the operating results of those components. Companies may perform a qualitative assessment as the initial step in the annual goodwill impairment testing process for all or selected reporting units. Companies are also allowed to bypass the qualitative analysis and perform a quantitative analysis if desired. Economic uncertainties and the length of time from the calculation of a baseline fair value are factors that we would consider in determining whether to perform a quantitative test.
When we evaluate the potential for goodwill impairment using a qualitative assessment, we consider factors including, but not limited to, macroeconomic conditions, industry conditions, the competitive environment, changes in the market for our products and services, regulatory and political developments, entity specific factors such as strategy and changes in key personnel and overall financial performance. If, after completing this assessment, it is determined that it is more likely than not that the fair value of a reporting unit is less than its carrying value, we proceed to a quantitative two-step impairment test.
During
2015
, we conducted a quantitative analysis for eleven of the twelve reporting units identified, of which eight units had goodwill at the beginning of the fiscal year. For the remaining reporting unit, RBI, the Company conducted a qualitative test rather than a quantitative test due to the recent acquisition date of this reporting unit on June 9, 2015. As such, for purposes of the annual goodwill impairment test as of October 31, 2015, the Company concluded that it was more likely than not that the fair value was greater than the carrying value and a quantitative test was not required to be conducted.
The quantitative goodwill impairment test consists of comparing the fair value of a reporting unit with its carrying amount including goodwill. If the carrying amount of the reporting unit exceeds the reporting unit’s fair value, the implied fair value of goodwill is compared to the carrying amount of goodwill. An impairment loss is recognized for the amount by which the carrying amount of goodwill exceeds the implied fair value of goodwill.
Step one of the quantitative goodwill impairment test consists of comparing the fair value of a reporting unit with its carrying amount including goodwill. The fair value of each reporting unit is determined using two valuation techniques: an income approach and a market approach.
The income approach included a discounted cash flow model relying on significant assumptions consisting of revenue growth rates and profit margins based on internal forecasts, terminal value, and the weighted average cost of capital (WACC) used to discount future cash flows. The WACC is calculated based upon the capital structure of eleven market participants in the Company’s peer group.
The market approach consisted of applying the Earnings Before Interest, Taxes, Depreciation and Amortization (EBITDA) multiple to the forecasted EBITDA to be generated in the next two years. The market approach also relied on the same significant assumptions used in the discounted cash flow model, consisting of revenue growth rates and profit margins based on internal forecasts and the EBITDA multiple selected from an analysis of peer companies. Similar to the WACC analysis, we assessed the risk of each reporting unit achieving its forecasts with consideration given to how each reporting unit has performed historically compared to forecasts.
32
Annual Impairment Testing
For the first nine months ended September 30, 2015, we concluded that no indicators of impairment existed at interim dates and did not perform any interim impairment tests related to goodwill and indefinite-lived intangible assets. The Company performed its annual impairment test as of October 31,
2015
during which we tested goodwill and other indefinite-lived intangible assets for impairment.
The
2015
annual quantitative goodwill impairment test examined eleven of the twelve reporting units and used the two valuation technique methodologies noted above (income and market approaches), and WACC calculation employed in prior years. The following table summarizes the WACC and EBITDA multiple ranges used during the annual goodwill impairment test performed during
2015
:
|
Date of Impairment Test
|
WACC
|
|
October 31, 2015
|
11.3% to 13.1%
|
|
|
EBITDA Multiple
|
|
October 31, 2015
|
|
|
2016 EBITDA forecast
|
6.7
|
|
2015 EBITDA forecast
|
10.2
|
As a result of our quantitative testing, none of the reporting units with goodwill as of our testing date had carrying values in excess of their fair values. Therefore, there were no impairment charges against goodwill recorded as of
December 31, 2015
. The Company recorded impairment charges against goodwill of $104,565,000 and $21,040,000 as of
December 31, 2014
and
2013
, respectively.
The Company will continue to monitor impairment indicators and financial results in future periods. If cash flows change or if the market value of the Company’s stock decreases, there may be additional impairment charges. Impairment charges could be based on factors such as the Company’s stock price, forecasted cash flows, assumptions used, control premiums, or other variables.
33
Analysis of Results
The following table sets forth the amount of goodwill allocated to each reporting unit tested for goodwill impairment and the percentage by which the estimated fair value of each reporting unit exceeded its carrying value as of the October 31,
2015
goodwill impairment test (in thousands):
|
Reporting Unit
|
Goodwill Allocated
to Reporting Unit as of January 1, 2015
|
Percentage By
Which Estimated
Fair Value Exceeds
Carrying Value (b)
|
Currency Translation Adjustment
|
Acquisition
|
Goodwill Allocated
to Reporting Unit as of December 31, 2015
|
|||||||||||||||
|
#1
|
$
|
113,966
|
|
22
|
%
|
$
|
—
|
|
$
|
—
|
|
$
|
113,966
|
|
||||||
|
#2
|
31,678
|
|
24
|
%
|
—
|
|
—
|
|
31,678
|
|
||||||||||
|
#3
|
27,332
|
|
98
|
%
|
—
|
|
—
|
|
27,332
|
|
||||||||||
|
#4
|
23,081
|
|
41
|
%
|
(1,054
|
)
|
—
|
|
22,027
|
|
||||||||||
|
#5
|
22,808
|
|
127
|
%
|
—
|
|
—
|
|
22,808
|
|
||||||||||
|
#6
|
8,256
|
|
26
|
%
|
—
|
|
—
|
|
8,256
|
|
||||||||||
|
#7
|
5,334
|
|
124
|
%
|
—
|
|
—
|
|
5,334
|
|
||||||||||
|
#8
|
3,588
|
|
533
|
%
|
—
|
|
—
|
|
3,588
|
|
||||||||||
|
#9
|
—
|
|
N/A
|
|
—
|
|
—
|
|
—
|
|
||||||||||
|
#10
|
—
|
|
N/A
|
|
—
|
|
—
|
|
—
|
|
||||||||||
|
#11
|
—
|
|
N/A
|
|
—
|
|
—
|
|
—
|
|
||||||||||
|
#12
|
—
|
|
N/A
|
|
221
|
|
57,180
|
|
57,401
|
|
(a)
|
|||||||||
|
Total
|
$
|
236,043
|
|
$
|
(833
|
)
|
$
|
57,180
|
|
$
|
292,390
|
|
||||||||
(a)
Due to the recent acquisition date, the Company conducted a qualitative test rather than a quantitative test as of October 31, 2015.
(b) No reporting units were deemed "at risk," which we define as a percentage of less than 10% by which estimated fair value exceeds carrying value.
The October 31,
2015
goodwill impairment test includes significant assumptions. We analyzed several macroeconomic indicators that impact each reporting unit to provide a reasonable estimate of revenue growth in future periods. We considered these forecasts in developing each reporting unit’s revenue growth rates over the next five years depending on the level of correlation between macroeconomic factors and net sales for each reporting unit. We concluded that this approach provided a reasonable estimate of long-term revenue growth and cash flows for each reporting unit.
Operating margins used to estimate future cash flows are based on margins generated during the past few years, adjusted for consolidation of facilities, cost reductions and restructuring activities, including our 80/20 simplification processes.
In addition to revenue growth and operating margin forecasts, the discounted cash flow model used to estimate the fair value of each reporting unit also uses assumptions for the amount of working capital needed to support each reporting unit. We forecasted stable to modest improvement in working capital management for future periods at each reporting unit based on past performance. We continue to maintain low levels of working capital management through our 80/20 simplification process, a strong focus on strategic investments of capital and by portfolio management. Our days of working capital ratio was 57 for the year ended
December 31, 2015
. We believe continued improvement in our ability to manage working capital will allow us to increase the cash flow generated from each reporting unit.
The terminal value of each reporting unit was based on a projected terminal year of forecasted cash flows in our discounted cash flow model. We made an assumption that cash flows would grow 3.0% each year thereafter in the North American markets, and 2.0% each year thereafter in the European markets served by the Company, based on our approximation of gross domestic product growth. This assumption was based on a third-party forecast of future economic growth over the long-term.
The discounted cash flow model uses the WACC to discount cash flows in the forecasted period and to discount the terminal value to present value. To determine the WACC, we used a standard valuation method, the capital asset pricing model, based on readily available and current market data of peer companies considered market participants. Acknowledging the risk inherent in each reporting units’ ability to achieve long-term forecasted cash flows, in applying the income approach we increased the
34
WACC of each reporting unit based upon each reporting unit’s past operating performance and their relative ability to achieve the forecasted cash flows.
As noted above, we used two commonly accepted valuation techniques to estimate a fair value for each reporting unit. The estimated fair value for each reporting unit was calculated using a weighted average between the calculated amounts determined under the income approach and the market approach. We weighted the income approach more heavily (67%) as the technique uses a long-term approach that considers the expected operating profit of each reporting unit during periods where macroeconomic indicators are nearer historical averages. We weighted the remaining (33%) using the market approach which values the reporting units using forecasted
2015
and
2016
EBITDA values based on current economic conditions and takes a more short-term approach. We believe the income approach considers the expected recovery in our end markets better than the market approach. Therefore, we concluded that the income approach more accurately estimated the fair value of the reporting units as it considers earnings potential during a longer term and does not use the short-term perspective used by the market approach. Accordingly, we concluded that the market participants who execute transactions to sell or buy a business in the current economic environment would place greater emphasis on the income approach.
The following table sets forth the Company’s estimated fair value and carrying value for each reporting unit as of October 31,
2015
(in thousands):
|
Reporting Unit
|
Estimated
Fair Value
|
Carrying
Value
|
|||||
|
#1
|
$
|
109,706
|
|
$
|
90,051
|
|
|
|
#2
|
88,063
|
|
70,966
|
|
|||
|
#3
|
70,613
|
|
35,662
|
|
|||
|
#4
|
143,084
|
|
101,428
|
|
|||
|
#5
|
69,385
|
|
30,547
|
|
|||
|
#6
|
68,061
|
|
54,184
|
|
|||
|
#7
|
18,979
|
|
8,481
|
|
|||
|
#8
|
34,285
|
|
5,413
|
|
|||
|
#9
|
5,843
|
|
7,950
|
|
|||
|
#10
|
9,185
|
|
12,983
|
|
|||
|
#11
|
52,583
|
|
24,947
|
|
|||
|
#12
|
147,585
|
|
142,270
|
|
|||
|
Corporate
|
(135,709
|
)
|
(4,705
|
)
|
|||
|
Total
|
$
|
681,663
|
|
$
|
580,177
|
|
|
|
Net Debt
|
$
|
166,949
|
|
||||
|
Equity (Net Book Value)
|
413,228
|
|
|||||
|
Total
|
$
|
580,177
|
|
||||
The “Corporate” category includes unallocated corporate cash out-flows. Unallocated corporate cash out-flows include executive compensation and other administrative costs. We have grown substantially through acquisitions and our strategy is to allow business unit management to operate the business units autonomous of corporate management. For example, each business unit has its own accounting, marketing, purchasing, information technology, and executive functions. As a result, we believe a market participant would not consider unallocated corporate cash flows when valuing each reporting unit and these cash flows have been properly excluded from the valuation of the reporting units.
Indefinite-Lived Intangibles
We test our intangible assets for impairment by comparing the fair value of the indefinite-lived intangible asset, determined using a discounted cash flow model, with its carrying amount. The assumptions used to determine the fair value of our indefinite-lived intangible assets are consistent with the assumptions employed in the determination of the fair values of our reporting units. An impairment loss would be recognized for the carrying amount in excess of its fair value. The fair values of the impaired trademarks were determined using an income approach consisting of the relief-from-royalty method. The Company recognized impairment charges related to trademark intangible assets during the annual test for 2015 and 2014 of
35
$4,863,000 and $2,700,000, respectively. As a result of the interim test for 2013, the Company recognized impairment charges of $2,454,000.
Accounting for Income Taxes and Deferred Tax Assets and Liabilities
Significant management judgment is required in determining our provision for income taxes, deferred tax assets and liabilities, and any valuation allowances. Our effective tax rates differ from the statutory rate due to the impact of permanent differences between income or loss reported for financial statement purposes and tax purposes, provisions for uncertain tax positions, state taxes, and income generated by international operations. Our effective tax rate was
36.7%
for
2015
. The effective tax rates were
3.5%
, and -
576.6%
for the years ended December
2014
and
2013
, respectively. Our future effective tax rates could be adversely affected by earnings being lower than anticipated in countries where we have lower statutory rates and vice versa. Changes in the valuation of our deferred tax assets or liabilities or changes in tax laws or interpretations thereof may also adversely affect our future effective tax rate. In addition, we are subject to the continuous examination of our income tax returns by the Internal Revenue Service and other tax authorities. We regularly assess the likelihood of adverse outcomes resulting from these examinations to determine the adequacy of our provision for income taxes.
Deferred tax assets and liabilities are determined based upon the differences between the financial statement and tax bases of assets and liabilities as measured by the enacted tax rates that will be in effect when these differences reverse. Valuation allowances are provided if, based upon the weight of available evidence, it is more likely than not that some or all of the deferred tax assets will not be realized.
Regarding deferred income tax assets, we maintained a valuation allowance of
$0.8 million
and
$0.4 million
as of December 31,
2015
and
2014
, respectively, due to uncertainties related to our ability to realize these assets, primarily consisting of state net operating losses and other deferred tax assets. The valuation allowances are based on estimates of taxable income in each of the jurisdictions in which we operate and the period over which our deferred tax assets will be recoverable. If market conditions improve and future results of operations exceed our current expectations, our existing tax valuation allowances may be adjusted, such as the $2.3 million benefit recognized in the fourth quarter of 2013. Alternatively, if market conditions deteriorate further or future operating results do not meet expectations, future assessments may result in a determination that some or all of the deferred tax assets are not realizable. As a result, we may need to establish additional tax valuation allowances for all or a portion of the gross deferred tax assets, which may have a material adverse effect on our results of operations and financial condition.
It is our policy to classify estimated interest and penalties due to tax authorities as income tax. Insignificant amounts of interest and penalties were recognized in the provision for income taxes for the years ended
December 31, 2015
,
2014
and
2013
. Additionally, we classify tax credits as a reduction to income tax expense.
The Company recognizes the tax benefit from an uncertain tax position only if it is more likely than not that the tax position will be sustained on examination by tax authorities, based on the technical merits of each position. The tax benefits recognized in the financial statements from such a position are measured based on the largest benefit that has a greater than fifty percent likelihood of being realized upon ultimate resolution. As of
December 31, 2015
and
2014
, the liability for uncertainty in income tax positions was
$3.9 million
and
$1.4 million
million, respectively. The increase from 2014 to 2015 was primarily due to a $3.0 million uncertain income tax position being recognized upon the acquisition of RBI on June 9, 2015. This was offset by a $3.0 million indemnification asset discussed in Note 5, "Acquisitions." Due to the high degree of uncertainty regarding the timing of potential future cash flows associated with these liabilities, we are unable to make a reasonably reliable estimate of the amount and period in which these liabilities might be paid.
Revenue Recognition on Contracts
The vast majority of our sales agreements are for standard products and services, with revenue recognized on the accrual basis at the time of shipment of goods, transfer of title and customer acceptance, where required. However, revenue representing 17% of 2015 sales was accounted for using the percentage of completion, cost-to-cost method of accounting as a result of the Company's acquisition of RBI on June 9, 2015. This method of revenue recognition only pertains to the activities of RBI.
Revenue on contracts using the percentage of completion method of accounting is recognized as work progresses toward completion as determined by the ratio of cumulative costs incurred to date to estimated total contract costs at completion, multiplied by the total contract revenue. Changes in estimates affecting sales, costs and profits are recognized in the period in which the change becomes known using the cumulative catch-up method of accounting, resulting in the cumulative effect of changes reflected in the period. Estimates are reviewed and updated quarterly for substantially all contracts. A significant change in an estimate on one or more contracts could have a material effect on our results of operations.
36
Contract costs include all direct costs related to contract performance. Selling and administrative expenses are charged to operations as incurred. Provisions for estimated losses on uncompleted contracts are made in the period in which such losses are determined. Because of inherent uncertainties in estimating costs, it is reasonably possible that changes in performance could result in revisions to cost and revenue, which are recognized in the period when the revisions are determined.
Recent Accounting Pronouncements
In April 2014, the Financial Accounting Standards Board (FASB) issued Accounting Standards Update 2014-08, "Presentation of Financial Statements (Topic 205) and Property, Plant, and Equipment (Topic 360)." The amendments in this update affect the presentation on the financial statements of assets which are disposed of or classified as held for sale. The amendments in Topic 205 and 360 are effective prospectively beginning on or after December 15, 2014. This standard was adopted on January 1, 2015 and it did not have a material impact on the Company's consolidated financial results.
In May 2014, the FASB issued Accounting Standards Update 2014-09, "Revenue from Contracts with Customers (Topic 606)." The update clarifies the principles for recognizing revenue and develops a common standard for U.S. Generally Accepted Accounting Principles and International Financial Reporting Standards. More specifically, the core principle of the guidance is that an entity should recognize revenue to depict the transfer of promised goods or services to customers in an amount that reflects the consideration to which the entity expects to be entitled in exchange for those goods or services. In August 2015, the FASB issued Accounting Standards Update 2015-14. This update deferred the effective date of Topic 606 for annual reporting periods beginning after December 15, 2017, including interim periods within that reporting period. Early adoption is not permitted. The Company is currently evaluating the impact of adopting the new standard on revenue recognition and its consolidated financial statements.
In January 2015, the Financial Accounting Standards Board (FASB) issued Accounting Standards Update 2015-01, "Income Statement - Extraordinary and Unusual Items (Subtopic 225-20)." The amendments in this Update simplify the income statement presentation by eliminating the concept of extraordinary items. The amendment in this Update is effective beginning after December 15, 2015, and early adoption is permitted. The Company adopted the amendments in this Update as of March 31, 2015, and the adoption does not have a material impact on either the Company's financial results, or the presentation of those results.
In February 2015, the Financial Accounting Standards Board (FASB) issued Accounting Standards Update 2015-02, "Consolidation (Topic 810)." The amendments in this Update change the analysis that a reporting entity must perform to determine whether it should consolidate certain types of legal entities specifically related to variable interest entities, limited partnerships, and other similar legal entities. The amendments in this Update are effective beginning after December 15, 2015, and early adoption is permitted. The Company adopted the amendments in this Update as of March 31, 2015, and the adoption does not have a material impact on the Company's financial results.
In April 2015, the Financial Accounting Standards Board (FASB) issued Accounting Standards Update (Update) 2015-03, "Interest - Imputation of Interest (Subtopic 835-30)." The Update was issued to change the presentation of debt issuance costs from an asset to a direct deduction from the related liability. In August 2015, the Financial Accounting Standards Board issued Update 2015-15, "Interest-Imputation of Interest (Subtopic 835-30)." The previously issued Update 2015-03, "Interest-Imputation of Interest (Subtopic 835-30)" was silent on presentation or subsequent measurement of debt issuance costs related to line-of-credit arrangements. The amendments to this Update clarify that an entity can defer and present debt issuance costs as an asset and subsequently amortize the deferred debt issuance costs ratably over the term of the line-of-credit arrangement, regardless if there are outstanding borrowings on the line-of-credit arrangement. The Company adopted these Updates as of September 30, 2015. The adoption of this guidance was retrospectively applied as a change in accounting principle to both periods presented on the balance sheet in accordance with Update 2015-03. The adoption decreased other assets, which includes our deferred financing costs on our debt obligation, by $3.9 million and $3.7 million for the years ended December 31, 2015 and 2014, respectively, and comparably decreased long-term debt on our Balance Sheets. This guidance did not have any impact on our Statements of Operations or our Statements of Cash Flows.
In April 2015, the Financial Accounting Standards Board issued Accounting Standards Update 2015-05, "Intangibles - Goodwill and Other - Internal Use Software (Subtopic 350-40)." The amendments in this Update provide guidance to customers about whether a cloud computing arrangement includes a software license and the accounting treatment for the arrangement. The amendments in this Update are effective December 15, 2015 and early adoption is permitted. The Company adopted the amendments in this Update as of June 30, 2015, and the adoption does not have any impact on the Company's financial results.
37
In May 2015, the Financial Accounting Standards Board issued Accounting Standards Update 2015-07, "Fair Value Measurement (Topic 820)." The amendments in this Update remove the requirement to categorize within the fair value hierarchy all investments for which fair value is measured using the net asset value per share as a practical expedient. The amendments in this update are effective beginning after December 15, 2015 and early adoption is permitted. The Company adopted the amendments in this Update as of June 30, 2015, and the adoption does not have any impact on the Company's financial results.
In May 2015, the Financial Accounting Standards Board issued Accounting Standards Update 2015-08, "Business Combinations (Topic 805)." This Update relates to pushdown accounting and the amendments and modifications made to SEC paragraphs pursuant to Staff Accounting Bulletin Number 115. The Company adopted the amendments in this Update as of June 30, 2015, and the adoption does not have any impact on the Company's financial results.
In June 2015, the Financial Accounting Standards Board issued Accounting Standards Update 2015-10, "Technical Corrections and Improvements." The object of this Update is to clarify the Codification, correct unintended application of guidance, or make minor improvements to the Codification that are not expected to have a significant effect on current accounting practice. Transition guidance varies based on the different amendments in this Update beginning after December 15, 2015 and early adoption is permitted. The Company adopted the amendments in this Update as of June 30, 2015, and the adoption does not have any impact on the Company's financial results.
In July 2015, the Financial Accounting Standards Board issued Accounting Standards Update 2015-11, "Inventory (Topic 330)." The amendments to this Update were issued to change the measurement of inventory to the lower of cost and net realizable value. The guidance, which is effective for fiscal years beginning after December 15, 2016, and interim periods within those fiscal years, may be applied prospectively and early adopted for the beginning of an interim or annual period. The Company is currently evaluating the impact of adopting the new standard and is not expected to have a material impact on the our Balance Sheet or Statements of Operations.
In September 2015, the Financial Accounting Standards Board issued Accounting Standards Update 2015-16, "Business Combinations (Topic 805)." The amendments to this Update require that an acquirer of a business combination recognize adjustments to provisional amounts identified during the measurement period in the reporting period in which the adjustments are determined. The guidance, which is effective for fiscal years beginning after December 15, 2015, and interim periods within those fiscal years, may be applied prospectively and early adopted for the beginning of an interim or annual period. The Company adopted the amendments in this Update as of September 30, 2015, and the adoption does not have a material impact on the Company's financial statements.
In November 2015, the Financial Accounting Standards Board issued Accounting Standards Update 2015-17, "Income Taxes (Topic 740)." The amendments to this Update were issued to simplify the presentation of deferred income taxes requiring that deferred tax liabilities and assets be classified as noncurrent in a classified statement of financial position. The Company early adopted this Update as of December 31, 2015. The adoption of this guidance was prospectively applied as a change in accounting principle for the year ended December 31, 2015 in accordance with Update 2015-17. The adoption decreased other current assets by $10.0 million, which previously included our deferred current tax assets, and comparably decreased deferred income taxes on our Balance Sheet. This guidance did not have any impact on our Statement of Operations or our Statement of Cash Flows.
|
Item 7A.
|
Quantitative and Qualitative Disclosures about Market Risk
|
In the ordinary course of business, the Company is exposed to various market risk factors, including changes in general economic conditions, competition, and raw materials pricing and availability. In addition, the Company is exposed to other financial market risks, primarily related to its long-term debt and foreign operations.
Raw Material Pricing Risk
We are subject to market risk exposure related to volatility in the price of steel, aluminum and resins. A significant amount of our cost of sales relates to material costs. Our business is heavily dependent on the price and supply of our raw materials. Our various products are fabricated from steel, primarily hot-rolled and galvanized steel coils, plate and bars, produced by steel mills. We have other lesser volume products that are fabricated from aluminum coils, extrusions, and plastic resins. The commodity market, which includes the steel, aluminum, and resin industries, is highly cyclical in nature, and commodity costs have been volatile in recent years, and may become more volatile in the future. Commodity costs are influenced by numerous factors beyond our control, including general economic conditions, the availability of raw materials, competition, labor costs, freight and transportation costs, production costs, import duties and other trade restrictions.
38
The Company principally manages its exposures to the market fluctuations in the steel and resins industries through management of its core business activities. Although we have the ability to purchase steel from a number of suppliers, a production cutback by one or more of our current suppliers could create challenges in meeting delivery schedules to our customers. The prices we offer to our customers are also impacted by changes in commodity costs. We manage the alignment of the cost of our raw materials and prices offered to customers and attempt to pass changes to raw material costs through to our customers. To improve our management of commodity costs, we attempt to maintain lean inventory levels. Our investment in ERP systems was made to increase our effectiveness in this process.
We have not entered into long-term contracts for the purchase of raw materials and have not maintained inventory levels in excess of our production requirements. However, from time to time, we may purchase raw materials in advance of commodity cost increases.
We rely on major suppliers for our supply of raw materials. During 2015, we purchased our raw materials from domestic and foreign suppliers in an effort to purchase the lowest cost material as possible.
We cannot accurately calculate the pre-tax impact a one percent change in the commodity costs would have on our 2015 operating results as the change in commodity costs would both impact the cost to purchase materials and the selling prices we offer our customers. The impact to our operating results would significantly depend on the competitive environment and the costs of other alternative building products, which could impact our ability to pass commodity costs to our customers.
To manage the risk associated with the fluctuations in the price of aluminum, the Company employs a combination of our normal operating activities, as discussed with regards to steel and resins above, and through the use of derivative financial instruments pursuant to the Company’s hedging practices and policies. We intend that the financial impact of these commodity hedging instruments primarily offset the corresponding changes in the fluctuations in the cost of aluminum being hedged. The Company’s derivative financial instruments are used to manage differences in the amount, timing, and duration of the Company’s known or expected cash receipts and its known or expected cash payments principally related to the Company’s inventory and sales.
The Company entered into commodity options during 2014. The Company believes these instruments mitigate exposure in aluminum prices. Derivative accounting guidance requires that derivative instruments be recognized as either assets or liabilities at fair value. Gibraltar does not utilize the special election provided for under the accounting guidance for these commodity options and therefore, they are recorded at fair value through earnings as their fair value changes.
Although the Company’s commodity options do not qualify or are not accounted for under hedge accounting, we do not hold or issue derivative financial instruments for trading or other speculative purposes. We monitor our derivative positions against our commercial exposure.
Interest Rate Risk
To manage interest rate risk, Gibraltar uses both fixed and variable interest rate debt. Our fixed rate debt consists of the Company’s Senior Subordinated 6.25% Notes and was the only significant debt that remains outstanding at year end. We believe we limited our exposure to interest rate risk as a result of repaying substantially all variable rate debt and the long-term nature of our fixed rate debt. However, the Company will continue to monitor changes in its debt levels and access to capital ensuring interest rate risk is appropriately managed.
At
December 31, 2015
, our fixed rate debt consisted primarily of $210.0 million of our 6.25% Notes. The Company’s $210.0 million of 6.25% Notes were issued in January 2013 and are due February 1, 2021.
Our variable rate debt consists primarily of the revolving credit facility under the Senior Credit Agreement, which was amended and restated on December 9, 2015, and other debt. No amounts are outstanding on the revolving credit facility as of
December 31, 2015
. Borrowings under the revolving credit facility bear interest at a variable interest rate based upon the LIBOR plus an additional margin. A hypothetical 1% increase or decrease in interest rates would have changed the
2015
interest expense by approximately $0.1 million.
39
Foreign Exchange Risk
Gibraltar has foreign exchange risk due to our international operations, primarily in Canada, Europe, and Asia and through sales and purchases from foreign customers and vendors. Changes in the values of currencies of foreign countries affect our financial position and cash flows when translated into U.S. Dollars. The Company principally manages its exposures to many of these foreign exchange rate risks solely through management of its core business activities. We cannot accurately calculate the pre-tax impact that a one percent change in the exchange rates of foreign currencies would have on our 2015 operating results as the changes in exchange rates would impact the cost of materials, the U.S dollar revenue equivalents, and potentially the prices offered to our overseas customers.
The Company also manages the risks relating to currency fluctuations through the use of derivative financial instruments pursuant to the Company’s hedging practices and policies. The Company uses foreign currency derivatives including currency forward agreements and currency options to manage its exposure to fluctuations in the exchange rates. Currency forward agreements involve fixing the exchange rates for delivery of a specified amount of foreign currency on a specified date. The currency forward agreements are typically cash settled in U.S. dollars for their fair value at or close to their settlement date. The Company also uses currency option contracts under which the Company pays a premium for the right to sell a specified amount of a foreign currency prior to the maturity date of the option.
The effective portion of changes in the fair value of derivatives designated and that qualify as cash flow hedges of foreign exchange risk is recorded as a component of equity and is subsequently reclassified into earnings in the period that the hedged forecasted transaction affects earnings. The ineffective portion of the change in fair value of the derivative, as well as amounts excluded from the assessment of hedge effectiveness, is recognized directly in earnings.
40
|
Item 8.
|
Financial Statements and Supplementary Data
|
|
|
Page Number
|
|
Financial Statements:
|
|
|
Supplementary Data:
|
|
41
Report of Independent Registered Public Accounting Firm
The Board of Directors and Shareholders of Gibraltar Industries, Inc.
We have audited the accompanying consolidated balance sheets of Gibraltar Industries, Inc. as of December 31, 2015 and 2014, and the related consolidated statements of operations, comprehensive income, shareholders’ equity, and cash flows for each of the three years in the period ended December 31, 2015. These financial statements are the responsibility of the Company’s management. Our responsibility is to express an opinion on these financial statements based on our audits.
We conducted our audits in accordance with the standards of the Public Company Accounting Oversight Board (United States). Those standards require that we plan and perform the audit to obtain reasonable assurance about whether the financial statements are free of material misstatement. An audit includes examining, on a test basis, evidence supporting the amounts and disclosures in the financial statements. An audit also includes assessing the accounting principles used and significant estimates made by management, as well as evaluating the overall financial statement presentation. We believe that our audits provide a reasonable basis for our opinion.
In our opinion, the financial statements referred to above present fairly, in all material respects, the consolidated financial position of Gibraltar Industries, Inc. at December 31, 2015 and 2014 and the consolidated results of its operations and its cash flows for each of the three years in the period ended December 31, 2015, in conformity with U.S. generally accepted accounting principles.
As discussed in Note 17 to the consolidated financial statements, the Company changed its method of presenting deferred tax assets and liabilities in the consolidated balance sheet as a result of the adoption of the amendments to the FASB Accounting Standards Codification resulting from Accounting Standards Update No. 2015-17, “Balance Sheet Classification of Deferred Taxes,” effective December 31, 2015.
We also have audited, in accordance with the standards of the Public Company Accounting Oversight Board (United States), Gibraltar Industries, Inc.’s internal control over financial reporting as of December 31, 2015, based on criteria established in Internal Control-Integrated Framework issued by the Committee of Sponsoring Organizations of the Treadway Commission (2013 framework) and our report dated February 18, 2016 expressed an unqualified opinion thereon.
/s/ Ernst & Young LLP
Buffalo, New York
February 18, 2016
42
GIBRALTAR INDUSTRIES, INC.
CONSOLIDATED STATEMENTS OF OPERATIONS
(in thousands, except per share data)
|
|
Year Ended December 31,
|
||||||||||
|
|
2015
|
2014
|
2013
|
||||||||
|
Net sales
|
$
|
1,040,873
|
|
$
|
862,087
|
|
$
|
827,567
|
|
||
|
Cost of sales
|
853,897
|
|
722,042
|
|
669,470
|
|
|||||
|
Gross profit
|
186,976
|
|
140,045
|
|
158,097
|
|
|||||
|
Selling, general, and administrative expense
|
134,028
|
|
102,492
|
|
113,457
|
|
|||||
|
Intangible asset impairment
|
4,863
|
|
107,970
|
|
23,160
|
|
|||||
|
Income (loss) from operations
|
48,085
|
|
(70,417
|
)
|
21,480
|
|
|||||
|
Interest expense
|
15,003
|
|
14,421
|
|
22,489
|
|
|||||
|
Other income
|
(4,018
|
)
|
(88
|
)
|
(177
|
)
|
|||||
|
Income (loss) before taxes
|
37,100
|
|
(84,750
|
)
|
(832
|
)
|
|||||
|
Provision for (benefit of) income taxes
|
13,624
|
|
(2,958
|
)
|
4,797
|
|
|||||
|
Income (loss) from continuing operations
|
23,476
|
|
(81,792
|
)
|
(5,629
|
)
|
|||||
|
Discontinued operations:
|
|||||||||||
|
Loss before taxes
|
(44
|
)
|
(51
|
)
|
(7
|
)
|
|||||
|
Benefit of income taxes
|
(16
|
)
|
(19
|
)
|
(3
|
)
|
|||||
|
Loss from discontinued operations
|
(28
|
)
|
(32
|
)
|
(4
|
)
|
|||||
|
Net income (loss)
|
$
|
23,448
|
|
$
|
(81,824
|
)
|
$
|
(5,633
|
)
|
||
|
Net earnings per share – Basic:
|
|||||||||||
|
Income (loss) from continuing operations
|
$
|
0.75
|
|
$
|
(2.63
|
)
|
$
|
(0.18
|
)
|
||
|
Loss from discontinued operations
|
—
|
|
—
|
|
—
|
|
|||||
|
Net income (loss)
|
$
|
0.75
|
|
$
|
(2.63
|
)
|
$
|
(0.18
|
)
|
||
|
Weighted average shares outstanding – Basic
|
31,233
|
|
31,066
|
|
30,930
|
|
|||||
|
Net earnings per share – Diluted:
|
|||||||||||
|
Income (loss) from continuing operations
|
$
|
0.74
|
|
$
|
(2.63
|
)
|
$
|
(0.18
|
)
|
||
|
Loss from discontinued operations
|
—
|
|
—
|
|
—
|
|
|||||
|
Net income (loss)
|
$
|
0.74
|
|
$
|
(2.63
|
)
|
$
|
(0.18
|
)
|
||
|
Weighted average shares outstanding – Diluted
|
31,545
|
|
31,066
|
|
30,930
|
|
|||||
See accompanying notes to consolidated financial statements.
43
GIBRALTAR INDUSTRIES, INC.
CONSOLIDATED STATEMENTS OF COMPREHENSIVE INCOME
(in thousands)
|
|
Year Ended December 31,
|
||||||||||
|
|
2015
|
2014
|
2013
|
||||||||
|
Net income (loss)
|
$
|
23,448
|
|
$
|
(81,824
|
)
|
$
|
(5,633
|
)
|
||
|
Other comprehensive (loss) income:
|
|||||||||||
|
Foreign currency translation adjustment
|
(6,228
|
)
|
(4,364
|
)
|
(2,108
|
)
|
|||||
|
Reclassification of loss on cash flow hedges, net of tax
|
143
|
|
(143
|
)
|
—
|
|
|||||
|
Adjustment to retirement benefit liability, net of tax
|
49
|
|
(24
|
)
|
53
|
|
|||||
|
Adjustment to post-retirement healthcare benefit liability, net of tax
|
171
|
|
(1,435
|
)
|
45
|
|
|||||
|
Other comprehensive loss
|
(5,865
|
)
|
(5,966
|
)
|
(2,010
|
)
|
|||||
|
Total comprehensive income (loss)
|
$
|
17,583
|
|
$
|
(87,790
|
)
|
$
|
(7,643
|
)
|
||
See accompanying notes to consolidated financial statements.
44
GIBRALTAR INDUSTRIES, INC.
CONSOLIDATED BALANCE SHEETS
(in thousands)
|
December 31, 2015
|
December 31, 2014
|
||||||
|
Assets
|
|||||||
|
Current assets:
|
|||||||
|
Cash and cash equivalents
|
$
|
68,858
|
|
$
|
110,610
|
|
|
|
Accounts receivable, net of reserve
|
164,969
|
|
101,141
|
|
|||
|
Inventories
|
107,058
|
|
128,743
|
|
|||
|
Other current assets
|
10,537
|
|
19,937
|
|
|||
|
Total current assets
|
351,422
|
|
360,431
|
|
|||
|
Property, plant, and equipment, net
|
118,932
|
|
129,575
|
|
|||
|
Goodwill
|
292,390
|
|
236,044
|
|
|||
|
Acquired intangibles
|
123,013
|
|
82,215
|
|
|||
|
Other assets
|
4,015
|
|
2,206
|
|
|||
|
$
|
889,772
|
|
$
|
810,471
|
|
||
|
Liabilities and Shareholders’ Equity
|
|||||||
|
Current liabilities:
|
|||||||
|
Accounts payable
|
$
|
89,204
|
|
$
|
81,246
|
|
|
|
Accrued expenses
|
67,605
|
|
52,439
|
|
|||
|
Billings in excess of cost
|
28,186
|
|
—
|
|
|||
|
Current maturities of long-term debt
|
400
|
|
400
|
|
|||
|
Total current liabilities
|
185,395
|
|
134,085
|
|
|||
|
Long-term debt
|
208,882
|
|
209,511
|
|
|||
|
Deferred income taxes
|
42,654
|
|
49,772
|
|
|||
|
Other non-current liabilities
|
42,755
|
|
29,874
|
|
|||
|
Shareholders’ equity:
|
|||||||
|
Preferred stock, $0.01 par value; authorized 10,000 shares; none outstanding
|
—
|
|
—
|
|
|||
|
Common stock, $0.01 par value; authorized 50,000 shares; 31,779 and 31,342 shares outstanding at December 31, 2015 and 2014, respectively
|
317
|
|
313
|
|
|||
|
Additional paid-in capital
|
253,458
|
|
247,232
|
|
|||
|
Retained earnings
|
178,073
|
|
154,625
|
|
|||
|
Accumulated other comprehensive loss
|
(15,416
|
)
|
(9,551
|
)
|
|||
|
Cost of 484 and 429 common shares held in treasury in 2015 and 2014
|
(6,346
|
)
|
(5,390
|
)
|
|||
|
Total shareholders’ equity
|
410,086
|
|
387,229
|
|
|||
|
$
|
889,772
|
|
$
|
810,471
|
|
||
See accompanying notes to consolidated financial statements.
45
GIBRALTAR INDUSTRIES, INC.
CONSOLIDATED STATEMENTS OF CASH FLOWS
(in thousands)
|
|
Year Ended December 31,
|
||||||||||
|
|
2015
|
2014
|
2013
|
||||||||
|
Cash Flows from Operating Activities
|
|||||||||||
|
Net income (loss)
|
$
|
23,448
|
|
$
|
(81,824
|
)
|
$
|
(5,633
|
)
|
||
|
Loss from discontinued operations
|
(28
|
)
|
(32
|
)
|
(4
|
)
|
|||||
|
Income (loss) from continuing operations
|
23,476
|
|
(81,792
|
)
|
(5,629
|
)
|
|||||
|
Adjustments to reconcile net income (loss) to net cash provided by operating activities:
|
|||||||||||
|
Depreciation and amortization
|
30,548
|
|
25,432
|
|
27,050
|
|
|||||
|
Intangible asset impairment
|
4,863
|
|
107,970
|
|
23,160
|
|
|||||
|
Loss on early note redemption
|
—
|
|
—
|
|
7,166
|
|
|||||
|
Stock compensation expense
|
3,891
|
|
3,150
|
|
2,564
|
|
|||||
|
Net (gain) loss on sale of assets
|
(6,431
|
)
|
45
|
|
5
|
|
|||||
|
Restructuring charges (recoveries), non-cash
|
8,504
|
|
(455
|
)
|
1,616
|
|
|||||
|
Benefit of deferred income taxes
|
(2,051
|
)
|
(6,640
|
)
|
(1,237
|
)
|
|||||
|
Other, net
|
4,222
|
|
60
|
|
3,185
|
|
|||||
|
Changes in operating assets and liabilities (excluding the effects of acquisitions):
|
|||||||||||
|
Accounts receivable
|
(17,215
|
)
|
(14,323
|
)
|
(1,020
|
)
|
|||||
|
Inventories
|
22,271
|
|
(8,599
|
)
|
(4,971
|
)
|
|||||
|
Other current assets and other assets
|
759
|
|
(2,456
|
)
|
(398
|
)
|
|||||
|
Accounts payable
|
(5,157
|
)
|
11,205
|
|
417
|
|
|||||
|
Accrued expenses and other non-current liabilities
|
19,004
|
|
(1,014
|
)
|
8,396
|
|
|||||
|
Net cash provided by operating activities of continuing operations
|
86,684
|
|
32,583
|
|
60,304
|
|
|||||
|
Net cash used in operating activities of discontinued operations
|
—
|
|
(41
|
)
|
(9
|
)
|
|||||
|
Net cash provided by operating activities
|
86,684
|
|
32,542
|
|
60,295
|
|
|||||
|
Cash Flows from Investing Activities
|
|||||||||||
|
Purchases of property, plant, and equipment
|
(12,373
|
)
|
(23,291
|
)
|
(14,940
|
)
|
|||||
|
Cash paid for acquisitions, net of cash acquired
|
(140,621
|
)
|
—
|
|
(5,536
|
)
|
|||||
|
Net proceeds from sale of property and equipment
|
26,500
|
|
5,992
|
|
12,610
|
|
|||||
|
Other, net
|
1,154
|
|
277
|
|
—
|
|
|||||
|
Net cash used in investing activities
|
(125,340
|
)
|
(17,022
|
)
|
(7,866
|
)
|
|||||
|
Cash Flows from Financing Activities
|
|||||||||||
|
Long-term debt payments
|
(73,642
|
)
|
(407
|
)
|
(205,094
|
)
|
|||||
|
Proceeds from long-term debt
|
73,242
|
|
—
|
|
210,000
|
|
|||||
|
Payment of note redemption fees
|
—
|
|
—
|
|
(3,702
|
)
|
|||||
|
Payment of debt issuance costs
|
(1,166
|
)
|
(35
|
)
|
(3,899
|
)
|
|||||
|
Purchase of treasury stock at market prices
|
(956
|
)
|
(575
|
)
|
(714
|
)
|
|||||
|
Excess tax benefit from stock compensation
|
537
|
|
100
|
|
72
|
|
|||||
|
Net proceeds from issuance of common stock
|
1,801
|
|
595
|
|
648
|
|
|||||
|
Net cash used in financing activities
|
(184
|
)
|
(322
|
)
|
(2,689
|
)
|
|||||
|
Effect of exchange rate changes on cash
|
(2,912
|
)
|
(1,627
|
)
|
(729
|
)
|
|||||
|
Net (decrease) increase in cash and cash equivalents
|
(41,752
|
)
|
13,571
|
|
49,011
|
|
|||||
|
Cash and cash equivalents at beginning of year
|
110,610
|
|
97,039
|
|
48,028
|
|
|||||
|
Cash and cash equivalents at end of year
|
$
|
68,858
|
|
$
|
110,610
|
|
$
|
97,039
|
|
||
See accompanying notes to consolidated financial statements.
46
GIBRALTAR INDUSTRIES, INC.
CONSOLIDATED STATEMENTS OF SHAREHOLDERS’ EQUITY
(in thousands)
|
|
Common Stock
|
Additional
Paid-In Capital
|
Retained Earnings
|
Accumulated
Other
Comprehensive Loss
|
Treasury Stock
|
Total
Shareholders’ Equity
|
|||||||||||||||||||||||
|
|
Shares
|
Amount
|
Shares
|
Amount
|
|||||||||||||||||||||||||
|
Balance at December 31, 2012
|
30,938
|
|
$
|
309
|
|
$
|
240,107
|
|
$
|
242,082
|
|
$
|
(1,575
|
)
|
350
|
|
$
|
(4,101
|
)
|
$
|
476,822
|
|
|||||||
|
Net loss
|
—
|
|
—
|
|
—
|
|
(5,633
|
)
|
—
|
|
—
|
|
—
|
|
(5,633
|
)
|
|||||||||||||
|
Foreign currency translation adjustment
|
—
|
|
—
|
|
—
|
|
—
|
|
(2,108
|
)
|
—
|
|
—
|
|
(2,108
|
)
|
|||||||||||||
|
Adjustment to retirement benefit liability, net of taxes of $30
|
—
|
|
—
|
|
—
|
|
—
|
|
53
|
|
—
|
|
—
|
|
53
|
|
|||||||||||||
|
Adjustment to post-retirement healthcare benefit liability, net of taxes of $45
|
—
|
|
—
|
|
—
|
|
—
|
|
45
|
|
—
|
|
—
|
|
45
|
|
|||||||||||||
|
Stock compensation expense
|
—
|
|
—
|
|
2,564
|
|
—
|
|
—
|
|
—
|
|
—
|
|
2,564
|
|
|||||||||||||
|
Excess tax benefit from stock compensation
|
—
|
|
—
|
|
72
|
|
—
|
|
—
|
|
—
|
|
—
|
|
72
|
|
|||||||||||||
|
Net settlement of restricted stock units
|
120
|
|
2
|
|
(2
|
)
|
—
|
|
—
|
|
45
|
|
(714
|
)
|
(714
|
)
|
|||||||||||||
|
Issuance of restricted stock
|
13
|
|
—
|
|
—
|
|
—
|
|
—
|
|
—
|
|
—
|
|
—
|
|
|||||||||||||
|
Stock options exercised
|
60
|
|
—
|
|
648
|
|
—
|
|
—
|
|
—
|
|
—
|
|
648
|
|
|||||||||||||
|
Balance at December 31, 2013
|
31,131
|
|
$
|
311
|
|
$
|
243,389
|
|
$
|
236,449
|
|
$
|
(3,585
|
)
|
395
|
|
$
|
(4,815
|
)
|
$
|
471,749
|
|
|||||||
|
Net loss
|
—
|
|
—
|
|
—
|
|
(81,824
|
)
|
—
|
|
—
|
|
—
|
|
(81,824
|
)
|
|||||||||||||
|
Foreign currency translation adjustment
|
—
|
|
—
|
|
—
|
|
—
|
|
(4,364
|
)
|
—
|
|
—
|
|
(4,364
|
)
|
|||||||||||||
|
Adjustment to retirement benefit liability, net of taxes of $9
|
—
|
|
—
|
|
—
|
|
—
|
|
(24
|
)
|
—
|
|
—
|
|
(24
|
)
|
|||||||||||||
|
Adjustment to post-retirement healthcare benefit liability, net of taxes of $830
|
—
|
|
—
|
|
—
|
|
—
|
|
(1,435
|
)
|
—
|
|
—
|
|
(1,435
|
)
|
|||||||||||||
|
Unrealized loss on cash flow hedges, net of tax of $82
|
—
|
|
—
|
|
—
|
|
—
|
|
(143
|
)
|
—
|
|
—
|
|
(143
|
)
|
|||||||||||||
|
Stock compensation expense
|
—
|
|
—
|
|
3,150
|
|
—
|
|
—
|
|
—
|
|
—
|
|
3,150
|
|
|||||||||||||
|
Excess tax benefit from stock compensation
|
—
|
|
—
|
|
100
|
|
—
|
|
—
|
|
—
|
|
—
|
|
100
|
|
|||||||||||||
|
Net settlement of restricted stock units
|
136
|
|
1
|
|
(1
|
)
|
—
|
|
—
|
|
34
|
|
(575
|
)
|
(575
|
)
|
|||||||||||||
|
Issuance of restricted stock
|
22
|
|
—
|
|
—
|
|
—
|
|
—
|
|
—
|
|
—
|
|
—
|
|
|||||||||||||
|
Stock options exercised
|
53
|
|
1
|
|
594
|
|
—
|
|
—
|
|
—
|
|
—
|
|
595
|
|
|||||||||||||
|
Balance at December 31, 2014
|
31,342
|
|
$
|
313
|
|
$
|
247,232
|
|
$
|
154,625
|
|
$
|
(9,551
|
)
|
429
|
|
$
|
(5,390
|
)
|
$
|
387,229
|
|
|||||||
|
Net income
|
—
|
|
—
|
|
—
|
|
23,448
|
|
—
|
|
—
|
|
—
|
|
23,448
|
|
|||||||||||||
|
Foreign currency translation adjustment
|
—
|
|
—
|
|
—
|
|
—
|
|
(6,228
|
)
|
—
|
|
—
|
|
(6,228
|
)
|
|||||||||||||
|
Adjustment to retirement benefit liability, net of taxes of $26
|
—
|
|
—
|
|
—
|
|
—
|
|
49
|
|
—
|
|
—
|
|
49
|
|
|||||||||||||
|
Adjustment to post-retirement healthcare benefit liability, net of taxes of $99
|
—
|
|
—
|
|
—
|
|
—
|
|
171
|
|
—
|
|
—
|
|
171
|
|
|||||||||||||
|
Unrealized loss on cash flow hedges, net of tax of $82
|
—
|
|
—
|
|
—
|
|
—
|
|
143
|
|
—
|
|
—
|
|
143
|
|
|||||||||||||
|
Stock compensation expense
|
—
|
|
—
|
|
3,891
|
|
—
|
|
—
|
|
—
|
|
—
|
|
3,891
|
|
|||||||||||||
|
Excess tax benefit from stock compensation
|
—
|
|
—
|
|
537
|
|
—
|
|
—
|
|
—
|
|
—
|
|
537
|
|
|||||||||||||
|
Net settlement of restricted stock units
|
297
|
|
3
|
|
(3
|
)
|
—
|
|
—
|
|
55
|
|
(956
|
)
|
(956
|
)
|
|||||||||||||
|
Issuance of restricted stock
|
21
|
|
—
|
|
—
|
|
—
|
|
—
|
|
—
|
|
—
|
|
—
|
|
|||||||||||||
|
Stock options exercised
|
119
|
|
1
|
|
1,801
|
|
—
|
|
—
|
|
—
|
|
—
|
|
1,802
|
|
|||||||||||||
|
Balance at December 31, 2015
|
31,779
|
|
$
|
317
|
|
$
|
253,458
|
|
$
|
178,073
|
|
$
|
(15,416
|
)
|
484
|
|
$
|
(6,346
|
)
|
$
|
410,086
|
|
|||||||
See accompanying notes to consolidated financial statements.
47
GIBRALTAR INDUSTRIES, INC.
NOTES TO CONSOLIDATED FINANCIAL STATEMENTS
1. SUMMARY OF SIGNIFICANT ACCOUNTING POLICIES
Principles of consolidation
The consolidated financial statements include the accounts of Gibraltar Industries, Inc. and subsidiaries (the Company). All significant intercompany accounts and transactions have been eliminated in consolidation.
Use of estimates
The preparation of the consolidated financial statements in conformity with accounting principles generally accepted in the United States of America requires management to make estimates and assumptions that affect the amounts reported in the consolidated financial statements and accompanying notes. Actual results could differ from those estimates.
Revenue recognition
The vast majority of our revenue is recognized when products are shipped or service is provided, the customer takes ownership and assumes the risk of loss, collection of the corresponding receivable is probable, persuasive evidence of an arrangement exists, and the sales price is fixed or determinable. Sales returns, allowances, and customer incentives, including rebates, are treated as reductions to sales and are provided for based on historical experience and current estimates.
As a result of the acquisition of RBI Solar, Inc., Rough Brothers Manufacturing, Inc., and affiliates (collectively "RBI") on June 9, 2015, the Company began recording revenues using percentage of completion accounting as calculated by the cost-to-cost measurement method on contracts. This method of revenue recognition only pertains to the activities of RBI.
For the year ended December 31, 2015,
16.7%
of revenue was recognized under the percentage of completion method.
Revenue from contracts using the percentage of completion method of accounting is recognized as work progresses toward completion as determined by the ratio of cumulative costs incurred to date to estimated total contract costs at completion, multipled by the total contract revenue. Changes in estimates affecting sales, costs and profits are recognized in the period in which the change becomes known using the cumulative catch-up method of accounting, resulting in the cumulative effect of changes reflected in the period. Estimates are reviewed and updated quarterly for all contracts. A significant change in an estimate on one or more contracts could have a material effect on our results of operations.
Contract costs include all direct costs related to contract performance. Selling and administrative expenses are charged to operations as incurred. Provisions for estimated losses on uncompleted contracts are recognized in the period in which such losses are determined. Because of inherent uncertainties in estimating costs, it is reasonably possible that changes in performance could result in revisions to cost and revenue, which are recognized in the period when the revisions are determined.
Cash and cash equivalents
Cash and cash equivalents include cash on hand, checking accounts, and all highly liquid investments with a maturity of three months or less.
Accounts receivable
Accounts receivable are composed of trade and contract receivables recorded at either the invoiced amount or costs in excess of billings, are expected to be collected within one year, and do not bear interest. The allowance for doubtful accounts is the Company’s best estimate of the probable amount of uncollectible accounts in the Company’s existing accounts receivable. The Company determines the allowance based on a number of factors, including experience, credit worthiness of customers, and current market and economic conditions. The Company reviews the allowance for doubtful accounts on a regular basis. Account balances are charged against the allowance after all means of collection have been exhausted and the potential for recovery is considered remote. The following table summarizes activity recorded within the allowance for doubtful accounts balances for the years ended December 31 (in thousands):
48
|
2015
|
2014
|
2013
|
|||||||||
|
Beginning balance
|
$
|
4,280
|
|
$
|
4,774
|
|
$
|
4,481
|
|
||
|
Bad debt expense
|
1,404
|
|
1,095
|
|
910
|
|
|||||
|
Accounts written off and other adjustments
|
(816
|
)
|
(1,589
|
)
|
(617
|
)
|
|||||
|
Ending balance
|
$
|
4,868
|
|
$
|
4,280
|
|
$
|
4,774
|
|
||
Concentrations of credit risk on accounts receivable are limited to those from significant customers that are believed to be financially sound. The Company's
two
most significant customers include a home improvement retailer and a postal service. While both these customers purchase from the Residential Products segment, the home improvement retailer also purchases from our Renewable Energy and Conservation segment. Accounts receivable as a percentage of consolidated accounts receivable from the home improvement retailer and a postal service at
December 31, 2015
, were
11.8%
and
5.5%
, respectively, and
17.1%
and
11.5%
, respectively, as of
December 31, 2014
.
Net sales as a percentage of consolidated net sales to the home improvement retailer were
10.6%
and
11.5%
for the years ended
December 31, 2015
and
2014
, respectively. Note 2 "Accounts Receivable" contains additional information on the Company's accounts receivable.
Inventories
Inventories are valued at the lower of cost, determined using the first-in, first-out method, or market value. Shipping and handling costs are recognized as a component of cost of sales. The Company records adjustments to reduce the cost of inventory to its net realizable value, if required, at the business unit level for estimated excess, obsolete, and slow-moving inventory. Factors influencing these adjustments include historical and current sales trends. Note 3 “Inventories” contains additional information on the Company’s inventory.
Property, plant, and equipment
Property, plant, and equipment are stated at cost and depreciated over their estimated useful lives using the straight-line method. Interest is capitalized in connection with construction of qualified assets. Expenditures that extend the useful lives of assets are capitalized, while repair and maintenance costs are expensed as incurred. The estimated useful lives of land improvements, buildings, and building improvements are
15
to
40
years, while the estimated useful lives for machinery and equipment are
3
to
20
years. Accelerated depreciation methods are used for income tax purposes.
The table below sets forth the amount of interest capitalized and depreciation expense recognized during the years ended December 31 (in thousands):
|
2015
|
2014
|
2013
|
|||||||||
|
Capitalized interest
|
$
|
166
|
|
$
|
420
|
|
$
|
182
|
|
||
|
Depreciation expense
|
$
|
17,869
|
|
$
|
19,712
|
|
$
|
20,478
|
|
||
Acquisition related assets and liabilities
Accounting for the acquisition of a business as a purchase transaction requires an allocation of the purchase price to the assets acquired and the liabilities assumed in the transaction at their respective estimated fair values. The most difficult estimations of individual fair values are those involving long-lived assets, such as property, plant, and equipment and intangible assets. The Company uses all available information to make these fair value determinations and, for major business acquisitions, engages independent valuation specialists to assist in the fair value determination of the acquired long-lived assets.
Goodwill and other intangible assets
The Company tests goodwill for impairment at the reporting unit level on an annual basis at October 31, or more frequently if an event occurs, or circumstances change, that indicate that the fair value of a reporting unit could be below its carrying amount. The reporting units are at the component level, or one level below the operating segment level. Goodwill is assigned to each reporting unit as of the date the reporting unit is acquired and based upon the expected synergies of the acquisition.
The Company may elect to perform a qualitative assessment that considers economic, industry and company-specific factors for some or all of our selected reporting units. If, after completing the assessment, it is determined that it is more likely than not
49
that the fair value of a reporting unit is less than its carrying value, we proceed to a quantitative test. We may also elect to perform a quantitative test instead of a qualitative test for any or all of our reporting units.
The quantitative impairment test consists of comparing the fair value of a reporting unit, determined using two valuation techniques, with its carrying amount including goodwill. If the carrying amount of the reporting unit exceeds its fair value, comparing the implied fair value of goodwill with its carrying amount. An impairment loss would be recognized for the carrying amount of goodwill in excess of its implied fair value.
The Company also tests its indefinite-lived intangible assets for impairment on an annual basis as of October 31, or more frequently if an event occurs, or circumstances change, that indicate that the fair value of an indefinite-lived intangible asset could be below its carrying amount. The impairment test consists of comparing the fair value of the indefinite-lived intangible asset, determined using discounted cash flows on a relief-from-royalty basis, with its carrying amount. An impairment loss would be recognized for the carrying amount in excess of its fair value. Acquired identifiable intangible assets are recorded at estimated cost. Identifiable intangible assets with finite useful lives are amortized over their estimated useful lives.
Impairment of long-lived assets
Long-lived assets, including acquired identifiable intangible assets, are reviewed for impairment whenever events or changes in circumstances indicate that the carrying amount of those assets may not be recoverable. The Company uses undiscounted cash flows to determine whether impairment exists and measures any impairment loss by approximating fair value using acceptable valuation techniques, including discounted cash flow models and third-party appraisals. The Company recognized impairment charges related to intangible assets during the years ended December 31, 2015, 2014 and 2013. In addition, the Company recognized a number of impairment charges related to restructuring plans during the three year period ended December 31, 2015 as described in Note 16 of the consolidated financial statements.
Deferred charges
Deferred charges associated with initial costs incurred to enter into new debt arrangements are included as a component of long-term debt and are amortized as a part of interest expense over the terms of the associated debt agreements. Portions of these deferred financing charges were written off as a result of entering into amended and restated credit agreements and the redemption and reissuance of bonds as discussed in Note 8 of the consolidated financial statements.
Advertising
The Company expenses advertising costs as incurred. For the years December 31,
2015
,
2014
and
2013
, advertising costs were
$4,700,000
,
$4,000,000
and
$4,000,000
, respectively.
Foreign currency transactions and translation
The assets and liabilities of the Company’s foreign subsidiaries are translated into U.S. dollars at the rate of exchange in effect at the balance sheet date. Income and expense items are translated at the average exchange rates prevailing during the period.
Income taxes
The provision for income taxes is determined using the asset and liability approach. Under this approach, deferred income taxes represent the expected future tax consequences of temporary differences between the carrying amounts and tax basis of assets and liabilities. The Company records a valuation allowance to reduce deferred tax assets when uncertainty exists regarding their realization.
Equity-based compensation
The Company measures the cost of equity-based compensation based on grant date fair value and recognizes the cost over the period in which the employee is required to provide service in exchange for the award. Equity-based compensation consists of grants of stock options, restricted stock, restricted stock units, and performance stock units. Equity-based compensation expense is included as a component of selling, general, and administrative expenses. The Company’s equity-based compensation plans are discussed in more detail in Note 12 of the consolidated financial statements.
Derivatives and hedging
50
The Company records all derivatives on the balance sheet at fair value. The accounting for changes in the fair value of derivatives depends on whether the Company has elected to designate a derivative in a hedging relationship and apply hedge accounting and whether the hedging relationship has satisfied the criteria necessary to apply hedge accounting. Derivative instruments that hedge a forecasted transaction or the variability of cash flows related to a recognized asset or liability are designated as a cash flow hedge. Hedge accounting generally provides matching the timing of gain or loss recognition on the hedging instrument with the recognition of the changes in the fair value of the hedged asset or liability that are attributable to the earnings effect of the hedged forecasted transactions in a cash flow hedge. Although certain of the Company's derivative financial instruments do not qualify or are not accounted for under hedge accounting, the Company does not hold or issue derivative financial instruments for trading or speculative purposes.
The effective portion of changes in the fair value of derivatives designated and that qualify as cash flow hedges of foreign exchange risk is recorded in other comprehensive income and is subsequently reclassified into earnings and reported in revenue in the period that the hedged forecasted transaction affects earnings. Any ineffective portion of the change in fair value of the derivative is recognized directly into earnings in other (income) expense. The Company's policy is to de-designate cash flow hedges at the time forecasted transactions are recognized as assets or liabilities on the balance sheet and report subsequent changes in fair value through the other (income) expense line on our statement of operations where the gain or loss due to movements in currency rates on the underlying asset or liability is revalued. If it becomes probable that the originally forecasted transaction will not occur, the gain or loss related to the hedge recorded within accumulated other comprehensive income is immediately recognized into net income.
Sale-Leaseback Transactions
During the first quarter of 2015, in order to capitalize on favorable real estate market conditions, the Company entered into a transaction to sell one of its real estate properties to an independent third party for
$26,373,000
. The Company leased back the entire property under a
five
year operating lease agreement. In accordance with the U.S. generally accepted accounting principles, the Company accounted for the transaction as a sale-leaseback. The net present value of the Company's future minimum lease payments of
$5,765,000
were less than the gain on sale of
$13,144,000
. As such, the portion of the gain equal to the fair value of the future minimum lease payments was deferred and is being amortized on a straight-line basis over the five year term of the lease. The gain exceeding the fair value of the minimum lease payments amounted to
$7,379,000
and was recognized during the quarter ended March 31, 2015 as a component of selling, general, and administrative expenses. The minimum lease payment for each of the five years is
$1,378,000
.
In June 2014, the Company determined that it no longer required full use of the available space on one of its real estate properties. The Company entered into a transaction to sell the property to an independent third party for
$4,500,000
, and leaseback a portion of the building from the purchaser. The Company leased back approximately
50%
of the building under a
five
year operating lease agreement. In accordance with U.S. generally accepted accounting principles, the Company accounted for the transaction as a sale-leaseback. The net present value of the Company's future minimum lease payments of
$892,000
were greater than the gain on sale of
$829,000
. As such, the gain was deferred and is being amortized on a straight-line basis over the five year life of the lease. The minimum lease payment in the first year is
$202,000
and escalates at
3%
over the remaining
four
years.
These amounts have been included in the future minimum lease payments table in Note 19 of the consolidated financial statements.
Recent accounting pronouncements
In April 2014, the Financial Accounting Standards Board (FASB) issued Accounting Standards Update 2014-08, "Presentation of Financial Statements (Topic 205) and Property, Plant, and Equipment (Topic 360)." The amendments in this update affect the presentation on the financial statements of assets which are disposed of or classified as held for sale. The amendments in Topic 205 and 360 are effective prospectively beginning on or after December 15, 2014. This standard was adopted on January 1, 2015 and it did not have a material impact on the Company's consolidated financial results.
In May 2014, the FASB issued Accounting Standards Update 2014-09, "Revenue from Contracts with Customers (Topic 606)." The update clarifies the principles for recognizing revenue and develops a common standard for U.S. Generally Accepted Accounting Principles and International Financial Reporting Standards. More specifically, the core principle of the guidance is that an entity should recognize revenue to depict the transfer of promised goods or services to customers in an amount that reflects the consideration to which the entity expects to be entitled in exchange for those goods or services. In August 2015, the FASB issued Accounting Standards Update 2015-14. This update deferred the effective date of Topic 606 for annual reporting periods beginning after December 15, 2017, including interim periods within that reporting period. Early adoption is not
51
permitted. The Company is currently evaluating the impact of adopting the new standard on revenue recognition and its consolidated financial statements.
In January 2015, the Financial Accounting Standards Board (FASB) issued Accounting Standards Update 2015-01, "Income Statement - Extraordinary and Unusual Items (Subtopic 225-20)." The amendments in this Update simplify the income statement presentation by eliminating the concept of extraordinary items. The amendment in this Update is effective beginning after December 15, 2015, and early adoption is permitted. The Company adopted the amendments in this Update as of March 31, 2015, and the adoption does not have a material impact on either the Company's financial results, or the presentation of those results.
In February 2015, the Financial Accounting Standards Board (FASB) issued Accounting Standards Update 2015-02, "Consolidation (Topic 810)." The amendments in this Update change the analysis that a reporting entity must perform to determine whether it should consolidate certain types of legal entities specifically related to variable interest entities, limited partnerships, and other similar legal entities. The amendments in this Update are effective beginning after December 15, 2015, and early adoption is permitted. The Company adopted the amendments in this Update as of March 31, 2015, and the adoption does not have a material impact on the Company's financial results.
In April 2015, the Financial Accounting Standards Board (FASB) issued Accounting Standards Update (Update) 2015-03, "Interest - Imputation of Interest (Subtopic 835-30)." The Update was issued to change the presentation of debt issuance costs from an asset to a direct deduction from the related liability. In August 2015, the Financial Accounting Standards Board issued Update 2015-15, "Interest-Imputation of Interest (Subtopic 835-30)." The previously issued Update 2015-03, "Interest-Imputation of Interest (Subtopic 835-30)" was silent on presentation or subsequent measurement of debt issuance costs related to line-of-credit arrangements. The amendments to this Update clarify that an entity can defer and present debt issuance costs as an asset and subsequently amortize the deferred debt issuance costs ratably over the term of the line-of-credit arrangement, regardless if there are outstanding borrowings on the line-of-credit arrangement. The Company adopted these Updates as of September 30, 2015. The adoption of this guidance was retrospectively applied as a change in accounting principle to both periods presented on the balance sheet in accordance with Update 2015-03. The adoption decreased other assets, which includes our deferred financing costs on our debt obligation, by
$3.9 million
and
$3.7 million
for the years ended December 31, 2015 and 2014, respectively, and comparably decreased long-term debt on our Balance Sheets. This guidance did not have any impact on our Statements of Operations or our Statements of Cash Flows.
In April 2015, the Financial Accounting Standards Board issued Accounting Standards Update 2015-05, "Intangibles - Goodwill and Other - Internal Use Software (Subtopic 350-40)." The amendments in this Update provide guidance to customers about whether a cloud computing arrangement includes a software license and the accounting treatment for the arrangement. The amendments in this Update are effective December 15, 2015 and early adoption is permitted. The Company adopted the amendments in this Update as of June 30, 2015, and the adoption does not have any impact on the Company's financial results.
In May 2015, the Financial Accounting Standards Board issued Accounting Standards Update 2015-07, "Fair Value Measurement (Topic 820)." The amendments in this Update remove the requirement to categorize within the fair value hierarchy all investments for which fair value is measured using the net asset value per share as a practical expedient. The amendments in this update are effective beginning after December 15, 2015 and early adoption is permitted. The Company adopted the amendments in this Update as of June 30, 2015, and the adoption does not have any impact on the Company's financial results.
In May 2015, the Financial Accounting Standards Board issued Accounting Standards Update 2015-08, "Business Combinations (Topic 805)." This Update relates to pushdown accounting and the amendments and modifications made to SEC paragraphs pursuant to Staff Accounting Bulletin Number 115. The Company adopted the amendments in this Update as of June 30, 2015, and the adoption does not have any impact on the Company's financial results.
In June 2015, the Financial Accounting Standards Board issued Accounting Standards Update 2015-10, "Technical Corrections and Improvements." The object of this Update is to clarify the Codification, correct unintended application of guidance, or make minor improvements to the Codification that are not expected to have a significant effect on current accounting practice. Transition guidance varies based on the different amendments in this Update beginning after December 15, 2015 and early adoption is permitted. The Company adopted the amendments in this Update as of June 30, 2015, and the adoption does not have any impact on the Company's financial results.
In July 2015, the Financial Accounting Standards Board issued Accounting Standards Update 2015-11, "Inventory (Topic 330)." The amendments to this Update were issued to change the measurement of inventory to the lower of cost and net
52
realizable value. The guidance, which is effective for fiscal years beginning after December 15, 2016, and interim periods within those fiscal years, may be applied prospectively and early adopted for the beginning of an interim or annual period. The Company is currently evaluating the impact of adopting the new standard which is not expected to have a material impact on the our Balance Sheet or Statements of Operations.
In September 2015, the Financial Accounting Standards Board issued Accounting Standards Update 2015-16, "Business Combinations (Topic 805)." The amendments to this Update require that an acquirer of a business combination recognize adjustments to provisional amounts identified during the measurement period in the reporting period in which the adjustments are determined. The guidance, which is effective for fiscal years beginning after December 15, 2015, and interim periods within those fiscal years, may be applied prospectively and early adopted for the beginning of an interim or annual period. The Company adopted the amendments in this Update as of September 30, 2015, and the adoption does not have a material impact on the Company's financial statements.
In November 2015, the Financial Accounting Standards Board issued Accounting Standards Update 2015-17, "Income Taxes (Topic 740)." The amendments to this Update were issued to simplify the presentation of deferred income taxes requiring that deferred tax liabilities and assets be classified as noncurrent in a classified statement of financial position. The Company early adopted this Update as of December 31, 2015. The adoption of this guidance was prospectively applied as a change in accounting principle for the year ended December 31, 2015 in accordance with Update 2015-17. The adoption decreased other current assets by
$10.0 million
, which previously included our deferred current tax assets, and comparably decreased deferred income taxes on our Balance Sheet. This guidance did not have any impact on our Statement of Operations or our Statement of Cash Flows.
2. ACCOUNTS RECEIVABLE
Accounts receivable at December 31 consisted of the following (in thousands):
|
2015
|
2014
|
||||||
|
Trade accounts receivable
|
$
|
102,277
|
|
$
|
105,421
|
|
|
|
Contract receivables:
|
|||||||
|
Amounts billed
|
53,830
|
|
—
|
|
|||
|
Costs in excess of billings
|
13,730
|
|
—
|
|
|||
|
Total contract receivables
|
67,560
|
|
—
|
|
|||
|
Total accounts receivables
|
169,837
|
|
105,421
|
|
|||
|
Less allowance for doubtful accounts
|
(4,868
|
)
|
(4,280
|
)
|
|||
|
Accounts receivable
|
$
|
164,969
|
|
$
|
101,141
|
|
|
Contract receivables are primarily associated with developers, contractors and customers in connection with the Renewable Energy and Conservation segment. Costs in excess of billings principally represent revenues recognized on contracts that were not billable as of the balance sheet date. These amounts will be billed in accordance with contract terms, generally as certain milestones are reached or upon shipment. All of the costs in excess of billings are expected to be collected within one year. In situations where billings exceed revenues recognized, the excess is included in billings in excess of cost in the Consolidated Balance Sheet.
3. INVENTORIES
Inventories at December 31 consisted of the following (in thousands):
|
2015
|
2014
|
||||||
|
Raw material
|
$
|
47,117
|
|
$
|
58,665
|
|
|
|
Work-in-process
|
16,238
|
|
12,841
|
|
|||
|
Finished goods
|
43,703
|
|
57,237
|
|
|||
|
Total inventories
|
$
|
107,058
|
|
$
|
128,743
|
|
|
53
The following table summarizes activity recorded within the reserve for excess, obsolete and slow moving inventory for the years ended December 31 (in thousands):
|
2015
|
2014
|
2013
|
|||||||||
|
Beginning balance
|
$
|
5,575
|
|
$
|
5,570
|
|
$
|
4,907
|
|
||
|
Excess, obsolete and slow moving inventory expense
|
1,539
|
|
731
|
|
2,068
|
|
|||||
|
Scrapped inventory and other adjustments
|
314
|
|
(726
|
)
|
(1,405
|
)
|
|||||
|
Ending balance
|
$
|
7,428
|
|
$
|
5,575
|
|
$
|
5,570
|
|
||
4. PROPERTY, PLANT, AND EQUIPMENT
Components of property, plant, and equipment at December 31 consisted of the following (in thousands):
|
2015
|
2014
|
||||||
|
Land and land improvements
|
$
|
6,520
|
|
$
|
10,538
|
|
|
|
Building and improvements
|
47,775
|
|
59,377
|
|
|||
|
Machinery and equipment
|
234,336
|
|
219,408
|
|
|||
|
Construction in progress
|
4,112
|
|
7,859
|
|
|||
|
Property, plant, and equipment, gross
|
292,743
|
|
297,182
|
|
|||
|
Less: accumulated depreciation
|
(173,811
|
)
|
(167,607
|
)
|
|||
|
Property, plant, and equipment, net
|
$
|
118,932
|
|
$
|
129,575
|
|
|
5. ACQUISITIONS
2015 Acquisition
On June 9, 2015, the Company acquired all of the outstanding stock of RBI. RBI has established itself during the past six years among North America’s fastest-growing providers of photovoltaic solar racking solutions and is among the largest commercial greenhouse manufacturers in North America.
RBI is a full service provider that engineers, manufactures and installs solar racking systems for solar developers and power companies. In addition, RBI designs and manufactures greenhouses for commercial, institutional and retail customers. The acquisition of RBI is expected to enable the Company to leverage its expertise in structural metals manufacturing, materials sourcing and logistics to help meet the fast-growing global demand for solar racking solutions. The results of RBI have been included in the Company’s consolidated financial results since the date of acquisition (within the Company's Renewable Energy and Conservation segment). The aggregate purchase consideration for the acquisition of RBI was approximately
$147,585,000
as of December 31, 2015, which includes a working capital adjustment and certain other adjustments provided for in the stock purchase agreement. A working capital adjustment of
$6,302,000
was paid by the Company during the third quarter of 2015. The remaining purchase adjustment of
$2,314,000
will be paid in the first quarter of 2016.
The purchase price for the acquisition was allocated to the assets acquired and liabilities assumed based upon their respective fair values. The excess consideration of
$57,180,000
, was recorded as goodwill of which
$37,969,000
is deductible for tax purposes. Goodwill represents future economic benefits arising from other assets acquired that could not be individually identified including workforce additions, growth opportunities, and increased presence in the building products markets.
The allocation of the purchase consideration to the fair value of the assets acquired and liabilities assumed is as follows as of the date of the acquisition (in thousands):
54
|
Cash
|
$
|
4,651
|
|
|
Working capital
|
21,436
|
|
|
|
Property, plant, and equipment
|
12,797
|
|
|
|
Acquired intangible assets
|
56,392
|
|
|
|
Other assets
|
3,049
|
|
|
|
Deferred income taxes
|
(4,892
|
)
|
|
|
Other liabilities
|
(3,028
|
)
|
|
|
Goodwill
|
57,180
|
|
|
|
Fair value of purchase consideration
|
$
|
147,585
|
|
The Company recorded an indemnification asset and liability of
$3.0 million
on the opening balance sheet related to the seller’s obligation to fully indemnify the Company for the outcome of potential contingent liabilities related to the uncertainty of income tax positions in foreign jurisdictions. The liability and related indemnification asset may or may not be realized, and any unrealized liability is scheduled to expire in 2018.
The intangible assets acquired in this acquisition consisted of the following (in thousands):
|
Fair Value
|
Estimated
Useful Life |
||||
|
Trademarks
|
$
|
13,550
|
|
Indefinite
|
|
|
Technology
|
3,550
|
|
7-15 years
|
||
|
Customer relationships
|
32,892
|
|
11-17 years
|
||
|
Non-compete agreements
|
1,300
|
|
5 years
|
||
|
Backlog
|
5,100
|
|
0.5 years
|
||
|
Total
|
$
|
56,392
|
|
||
The following unaudited pro forma financial information presents the combined results of continuing operations as if the acquisition of RBI had occurred as of January 1, 2014. The pro forma information includes certain adjustments, including depreciation and amortization expense, interest expense and certain other adjustments, together with related income tax effects. The pro forma amounts may not be indicative of the results that actually would have been achieved had the acquisitions occurred as of January 1, 2014 and are not necessarily indicative of future results of the combined companies (in thousands, except per share data):
|
Twelve Months Ended December 31,
|
|||||||
|
2015
|
2014
|
||||||
|
Net sales
|
$
|
1,128,915
|
|
$
|
1,026,014
|
|
|
|
Net income (loss)
|
$
|
33,587
|
|
$
|
(46,714
|
)
|
|
|
Net income (loss) per share - Basic
|
$
|
1.08
|
|
$
|
(1.50
|
)
|
|
|
Net income (loss) per share - Diluted
|
$
|
1.06
|
|
$
|
(1.50
|
)
|
|
2013 Acquisition
In September 2013, the Company purchased the assets of a domestic designer and distributor of solar-powered roof and attic ventilation products. The results of this acquisition have been included in the Company’s consolidated financial results since the date of acquisition (within the Company’s Residential Products segment). The fair value of the aggregate purchase consideration for the assets acquired was
$7,454,000
. As part of the purchase agreement, the Company was required to pay additional consideration, or an earn-out provision, based on the acquired business’s EBITDA through the last day of the twenty-fourth month period following the closing date of the acquisition. The Company recorded a payable of
$2,322,000
to reflect the fair value of the Company’s obligation at the date of the acquisition. Adjustments to this payable have been reflected in the Company’s Statement of Operations. The fair value of the Company’s obligation was
$61,000
and
$368,000
as of
December 31, 2015
and
2014
, respectively. The change in fair value resulted in gains recorded to SG&A of
$480,000
and
55
$1,611,000
during the years ended
December 31, 2015
and
2014
, respectively. The Company also recorded
$8,000
and
$75,000
to interest expense for this obligation during the years ended
December 31, 2015
and
2014
, respectively. The Company expects to remit the final payment of
$61,000
to the seller in early 2016.
The purchase price for the acquisition was allocated to the assets acquired and liabilities assumed based upon their respective fair values. The excess consideration was recorded as goodwill and totaled
$2,466,000
, all of which is deductible for tax purposes. Goodwill represents future economic benefits arising from other assets acquired that could not be individually identified including growth opportunities and increased presence in the building products markets.
The allocation of purchase consideration to the assets acquired and liabilities assumed during 2013 are as follows (in thousands):
|
Working capital
|
$
|
2,665
|
|
|
Property, plant, and equipment
|
153
|
|
|
|
Acquired intangible assets
|
2,170
|
|
|
|
Goodwill
|
2,466
|
|
|
|
Fair value of purchase consideration
|
$
|
7,454
|
|
The intangible assets acquired in this acquisition consisted of the following (in thousands):
|
Fair Value
|
Estimated
Useful Life |
||||
|
Trademarks
|
$
|
640
|
|
Indefinite
|
|
|
Technology
|
260
|
|
15 Years
|
||
|
Customer relationships
|
1,130
|
|
15 Years
|
||
|
Non-compete agreements
|
140
|
|
5 Years
|
||
|
Total
|
$
|
2,170
|
|
||
The 2015 acquisition of RBI was financed through a combination of cash on hand and borrowings under the Company's revolving credit facility. The 2013 acquisition was financed through cash on hand. The Company incurred certain acquisition-related costs composed of legal and consulting fees, and these costs were recognized as a component of selling, general, and administrative expenses in the consolidated statement of operations. The Company also recognized costs related to the sale of inventory at fair value as a result of allocating the purchase price of recent acquisitions.
All acquisition related costs (including the gains recognized as a result of the change in fair value of the earn-out obligation) consisted of the following for the years ended December 31 (in thousands):
|
2015
|
2014
|
2013
|
|||||||||
|
Selling, general and administrative costs
|
$
|
732
|
|
$
|
(1,594
|
)
|
$
|
(34
|
)
|
||
|
Cost of sales
|
230
|
|
206
|
|
685
|
|
|||||
|
Total acquisition related costs
|
$
|
962
|
|
$
|
(1,388
|
)
|
$
|
651
|
|
||
56
6. GOODWILL AND RELATED INTANGIBLE ASSETS
Goodwill
The changes in the carrying amount of goodwill for the years ended December 31 were as follows (in thousands):
|
Residential
Products
|
Industrial and
Infrastructure
Products
|
Renewable Energy and Conservation
|
Total
|
||||||||||||
|
Balance at December 31, 2013
|
$
|
195,520
|
|
$
|
145,654
|
|
$
|
—
|
|
$
|
341,174
|
|
|||
|
Impairment
|
(14,235
|
)
|
(90,330
|
)
|
—
|
|
(104,565
|
)
|
|||||||
|
Foreign currency translation
|
—
|
|
(565
|
)
|
—
|
|
(565
|
)
|
|||||||
|
Balance at December 31, 2014
|
$
|
181,285
|
|
$
|
54,759
|
|
$
|
—
|
|
$
|
236,044
|
|
|||
|
Acquired goodwill
|
—
|
|
—
|
|
57,180
|
|
57,180
|
|
|||||||
|
Foreign currency translation
|
—
|
|
(1,055
|
)
|
221
|
|
(834
|
)
|
|||||||
|
Balance at December 31, 2015
|
$
|
181,285
|
|
$
|
53,704
|
|
$
|
57,401
|
|
$
|
292,390
|
|
|||
Goodwill is recognized net of accumulated impairment losses of
$255,530,000
as of
December 31, 2015
and
2014
.
Annual Impairment Testing
The Company performed its annual goodwill impairment test as of October 31,
2015
,
2014
, and
2013
. The Company did not recognize any impairment charges during 2015 as a result of the annual goodwill impairment test. During 2014, the Company incurred impairment charges as a result of the October 31 annual test. The impairment charges recognized in 2013 resulted from the interim test performed during the third quarter. No additional impairment charges were incurred as of the annual test in 2013.
During the October 31,
2015
impairment test, the Company conducted a quantitative analysis for
eleven
of the
twelve
reporting units identified for review. For the remaining reporting unit, RBI. the Company conducted a qualitative test rather than a quantitative test due to the recent acquisition date of this reporting unit on June 9, 2015. As such, for purposes of the annual goodwill impairment test as of October 31, 2015, the Company concluded that it was more likely than not that the fair value was greater than the carrying value and a quantitative test was not required to be conducted.
Step one of the impairment test consists of comparing the fair value of a reporting unit with its carrying amount including goodwill. The fair value of each reporting unit evaluated under the quantitative test was determined using two valuation techniques: an income approach and a market approach. Each valuation approach relies on significant assumptions including a weighted average cost of capital (WACC). The WACC is calculated based upon the capital structure of market participants in the Company’s peer group. Other assumptions used to calculate fair value for each reporting unit include projected revenue growth, forecasted cash flows, and earnings multiples based on the market value of the Company and market participants within its peer group.
The following table summarizes the WACC calculation ranges used during the annual goodwill impairment tests performed during
2015
and
2014
:
|
Date of Impairment Test
|
WACC
|
|
|
October 31, 2015
|
11.3% to 13.1%
|
|
|
October 31, 2014
|
12.9% to 13.6%
|
|
As a result of our annual testing for 2015, none of the reporting units with goodwill as of our testing date had carrying values in excess of their fair values. As such, no goodwill impairment charges were recorded during 2015.
During our 2014 annual goodwill impairment test, we identified reporting units with carrying values in excess of fair value. Therefore, the Company initiated step two of the goodwill impairment test which involved calculating the implied fair value of goodwill by allocating the fair value of the reporting unit to the fair value of its assets and liabilities other than goodwill, calculating an implied fair value of goodwill, and comparing the implied fair value to the carrying amount of goodwill. As a result of step two of the annual goodwill impairment test, the Company estimated that the implied fair value of goodwill for the
57
reporting units was less than their carrying values by
$104,565,000
for the year ended December 31, 2014 which has been recorded as impairment charges.
Interim Impairment Testing
We test goodwill and indefinite-lived intangible assets for impairment on an annual basis as of October 31 and at interim dates when indicators of impairment are present. During the third quarter of 2013, we significantly revised our forecast to reflect lower revenue and operating margin expectations for the Company in 2013. As a result, we concluded there was an indicator of impairment requiring an interim impairment test for
four
of our reporting units,
two
within the Residential Products segment and
two
within the Industrial and Infrastructure Products segment. In
2015
and 2014, no indicators of impairment were identified as of interim dates; therefore, no interim tests were performed.
The 2013 interim impairment test used similar valuation methodology as used during the annual tests (income and market approaches), and WACC calculation employed in the interim test. The Company based the WACC on similar market participants used in the interim test. Other assumptions used in the multiples approach such as projected revenue growth and forecasted cash flows for the Company’s reporting units were also similar to those used during the interim test. A third party projection of peer companies’ earnings multiples, projected revenue growth, and forecasted cash flows were obtained for the analysis as well.
Of the
four
reporting units identified during the 2013 interim test,
one
of the reporting units in the Industrial and Infrastructure Products segment, and the Company’s sole business in Europe, had a carrying value in excess of the fair value due to decreased revenue projections, affected by recessionary economic conditions. Therefore, the Company initiated step two of the goodwill impairment test which involved calculating the implied fair value of goodwill by allocating the fair value of the reporting unit to the fair value of its assets and liabilities other than goodwill, calculating an implied fair value of goodwill, and comparing the implied fair value to the carrying amount of goodwill. As a result of step two of the goodwill impairment test, the Company estimated that the implied fair value of goodwill for the reporting unit was less than its carrying value by
$21,040,000
, for which an impairment charge was recorded as of September 30, 2013.
Acquired Intangible Assets
Acquired intangible assets consist of the following (in thousands):
|
|
December 31, 2015
|
December 31, 2014
|
|
||||||||||||||
|
|
Gross
Carrying
Amount
|
Accumulated
Amortization
|
Gross
Carrying
Amount
|
Accumulated
Amortization
|
Estimated
Useful Life
|
||||||||||||
|
Indefinite-lived intangible assets:
|
|||||||||||||||||
|
Trademarks
|
$
|
50,538
|
|
$
|
—
|
|
$
|
42,720
|
|
$
|
—
|
|
Indefinite
|
||||
|
Finite-lived intangible assets:
|
|||||||||||||||||
|
Trademarks
|
5,861
|
|
1,884
|
|
3,886
|
|
1,827
|
|
5 to 15 Years
|
||||||||
|
Unpatented technology
|
28,072
|
|
10,656
|
|
24,527
|
|
8,768
|
|
5 to 20 Years
|
||||||||
|
Customer relationships
|
85,419
|
|
35,673
|
|
52,974
|
|
31,554
|
|
5 to 17 Years
|
||||||||
|
Non-compete agreements
|
3,107
|
|
1,771
|
|
1,807
|
|
1,550
|
|
4 to 10 Years
|
||||||||
|
Backlog
|
6,480
|
|
6,480
|
|
1,330
|
|
1,330
|
|
.5 to 2 Years
|
||||||||
|
128,939
|
|
56,464
|
|
84,524
|
|
45,029
|
|
||||||||||
|
Total acquired intangible assets
|
$
|
179,477
|
|
$
|
56,464
|
|
$
|
127,244
|
|
$
|
45,029
|
|
|||||
The Company recognized impairment charges related to indefinite-lived trademark intangible assets for the years ended
December 31, 2015
, 2014 and 2013. The Company also recognized impairment charges related to finite-lived intangible assets for the year ended December 31, 2014. The impairment charges related to the indefinite-lived trademarks in 2015, 2014 and 2013 were recognized as a result of the Company’s impairment test of indefinite-lived intangibles. The fair values of the impaired trademarks were determined using an income approach consisting of the relief-from-royalty method. The 2014 impairment charges related to the finite-lived intangibles were recognized as a result of the estimated future discounted cash flows of the asset being less than its carrying value. The fair value of the impaired finite-lived intangibles was determined using an income approach consisting of either the relief-from-royalty method or the excess earnings method. In addition, the Company recognized amortization expense related to the finite-lived intangible assets.
58
The following table summarizes the impairment charges for the years ended December 31 (in thousands):
|
2015
|
2014
|
2013
|
|||||||||
|
Residential Products
|
$
|
440
|
|
$
|
1,200
|
|
$
|
1,454
|
|
||
|
Industrial and Infrastructure Products
|
4,423
|
|
2,205
|
|
1,000
|
|
|||||
|
Impairment charges
|
$
|
4,863
|
|
$
|
3,405
|
|
$
|
2,454
|
|
||
The following table summarizes amortization expense for the years ended December 31 (in thousands):
|
2015
|
2014
|
2013
|
|||||||||
|
Amortization expense
|
$
|
12,679
|
|
$
|
5,720
|
|
$
|
6,572
|
|
||
Amortization expense related to acquired intangible assets for the next five years ended December 31 is estimated as follows (in thousands):
|
2016
|
$
|
8,604
|
|
|
2017
|
$
|
8,272
|
|
|
2018
|
$
|
7,715
|
|
|
2019
|
$
|
7,044
|
|
|
2020
|
$
|
6,532
|
|
7. ACCRUED EXPENSES
Accrued expenses at December 31 consist of the following (in thousands):
|
2015
|
2014
|
||||||
|
Compensation
|
$
|
22,215
|
|
$
|
18,490
|
|
|
|
Customer rebates
|
9,733
|
|
9,639
|
|
|||
|
Insurance
|
9,057
|
|
9,041
|
|
|||
|
Interest and taxes
|
11,742
|
|
6,989
|
|
|||
|
Acquisition payable
|
2,314
|
|
—
|
|
|||
|
Other
|
12,544
|
|
8,280
|
|
|||
|
Total accrued expenses
|
$
|
67,605
|
|
$
|
52,439
|
|
|
Accrued expenses for insurance are primarily for general liability, workers’ compensation and employee healthcare policies for which the Company is self-insured up to certain per-occurrence and aggregate limits. The amounts accrued represent our best estimates of the probable amount of claims to be paid. Differences between the amounts accrued and the amount that may be reasonably possible of payment are not material.
Long-term debt at December 31 consists of the following (in thousands):
|
2015
|
2014
|
||||||
|
Senior Subordinated 6.25% Notes
|
$
|
210,000
|
|
$
|
210,000
|
|
|
|
Other debt
|
3,200
|
|
3,600
|
|
|||
|
Less unamortized debt issuance costs
|
(3,918
|
)
|
(3,689
|
)
|
|||
|
Total debt
|
209,282
|
|
209,911
|
|
|||
|
Less current maturities
|
400
|
|
400
|
|
|||
|
Total long-term debt
|
$
|
208,882
|
|
$
|
209,511
|
|
|
The Company's Fifth Amended and Restated Credit Agreement dated December 9, 2015 (the Senior Credit Agreement) provides for a revolving credit facility. The Senior Credit Agreement was amended and restated in order to convert it into a secured cash flow revolver.
59
Borrowings under the Senior Credit Agreement are secured by the trade receivables, inventory, personal property, equipment, and certain real property of the Company’s significant domestic subsidiaries. The Senior Credit Agreement provides for a revolving credit facility and letters of credit in an aggregate amount of
$300 million
. The Company can request additional financing from the banks to increase the revolving credit facility to
$500 million
or enter into a term loan of up to
$200 million
subject to conditions set forth in the Senior Credit Agreement.
The terms of the Senior Credit Agreement provide that the revolving credit facility will terminate on December 9, 2020.
Interest rates on the revolving credit facility are based on the LIBOR plus an additional margin that ranges from
1.25%
to
2.25%
for LIBOR loans based on the Total Leverage Ratio.
In addition, the revolving credit facility is subject to an undrawn commitment fee ranging between
0.20%
and
0.30%
based on the Total Leverage Ratio and the daily average undrawn balance.
Standby letters of credit of
$20,459,000
have been issued under the Senior Credit Agreement to third parties on behalf of the Company as of
December 31, 2015
. These letters of credit reduce the amount otherwise available under the revolving credit facility. As of December 31, 2015, the Company had
$279,541,000
of availability under the revolving credit facility.
No
borrowings were outstanding under the revolving credit facility at
December 31, 2015
and
December 31, 2014
.
There are three financial covenants contained in the Senior Credit Agreement, which require: (i) a Maximum Senior Secured Leverage Ratio of 3.25x; (ii) a Maximum Total Leverage Ratio of 4.50x; and (iii) a Minimum Interest Coverage Ratio of
3.00
x. As of
December 31, 2015
, the Company was in compliance with these financial covenants. The Senior Credit Agreement contains other provisions and events of default that are customary for similar agreements and may limit the Company’s ability to take various actions.
On January 31, 2013, the Company issued
$210 million
of
6.25%
Senior Subordinated Notes (
6.25%
Notes) due
February 1, 2021
. In connection with the issuance of the
6.25%
Notes, the Company initiated a tender offer for the purchase of the outstanding
$204 million
of
8%
Senior Subordinated Notes (
8%
Notes). Simultaneously with the closing of the sale of the
6.25%
Notes, the Company purchased tendered notes or called for redemption of all of the remaining
8%
Notes that were not purchased. In connection with the redemption and tender offer, the Company satisfied and discharged its obligations under the
8%
Notes during the first quarter of 2013. The Company recorded a charge of approximately
$7,166,000
in the first quarter of 2013, including
$3,702,000
for the prepayment premium paid to holders of the
8%
Notes,
$2,199,000
to write-off deferred financing fees and
$1,265,000
for the unamortized original issue discount related to the
8%
Notes. In connection with the issuance of the
6.25%
Notes, the Company paid
$3,755,000
in placement and other fees which are recorded as deferred financing costs and included in other assets.
The provisions of the
6.25%
Notes include, without limitation, restrictions on indebtedness, liens, and distributions from restricted subsidiaries, asset sales, affiliate transactions, dividends, and other restricted payments. Dividend payments are subject to annual limits of the greater of
$0.25
per share or
$25 million
. The
6.25%
Notes are redeemable at the option of the Company, in whole or in part, at any time on or after February 1, 2017, at the redemption price. The redemption prices are
103.13%
, and
101.56%
of the principal amount thereof if the redemption occurs during the 12-month periods beginning February 1, of the years 2017 and 2018, respectively, and
100%
of the principal amount thereof on and after February 1, 2019, in each case plus accrued and unpaid interest to the applicable redemption date. In addition, prior to February 1, 2016, the Company may redeem up to
35%
of the aggregate principal amount of the Notes with the net cash proceeds of certain equity offerings by the Company at a redemption price of
106.25%
of the principal amount thereof, plus accrued and unpaid interest to the redemption date. In the event of a Change in Control, each Shareholder of the
6.25%
Notes may require the Company to repurchase all or a portion of such holder’s
6.25%
Notes at a purchase price equal to
101%
of the principal amount thereof.
The aggregate maturities of long-term debt for the next five years and thereafter are as follows (in thousands):
|
2016
|
$
|
400
|
|
|
2017
|
$
|
400
|
|
|
2018
|
$
|
400
|
|
|
2019
|
$
|
400
|
|
|
2020
|
$
|
400
|
|
|
Thereafter
|
$
|
211,200
|
|
60
Total cash paid for interest in the years ended December 31 was (in thousands):
|
2015
|
2014
|
2013
|
|||||||||
|
Cash paid for interest
|
$
|
15,374
|
|
$
|
13,864
|
|
$
|
24,880
|
|
||
9. EMPLOYEE RETIREMENT PLANS
Pension
The Company has an unfunded supplemental pension plan which provides defined pension benefits to certain salaried employees upon retirement. Benefits under the plan are based on the salaries of individual plan participants in the year they were admitted into the plan. The plan has been frozen and no additional participants will be added to the plan in the future.The following table presents the changes in the plan’s projected benefit obligation, fair value of plan assets, and funded status for the years ended December 31 (in thousands):
|
2015
|
2014
|
2013
|
|||||||||
|
Projected benefit obligation at January 1
|
$
|
1,961
|
|
$
|
2,179
|
|
$
|
2,478
|
|
||
|
Service cost
|
—
|
|
—
|
|
—
|
|
|||||
|
Interest cost
|
66
|
|
88
|
|
80
|
|
|||||
|
Actuarial (gains) losses
|
(39
|
)
|
9
|
|
(58
|
)
|
|||||
|
Benefits paid
|
(303
|
)
|
(315
|
)
|
(321
|
)
|
|||||
|
Projected benefit obligation at December 31
|
1,685
|
|
1,961
|
|
2,179
|
|
|||||
|
Fair value of plan assets
|
—
|
|
—
|
|
—
|
|
|||||
|
Under funded status
|
(1,685
|
)
|
(1,961
|
)
|
(2,179
|
)
|
|||||
|
Unamortized prior service cost
|
10
|
|
24
|
|
39
|
|
|||||
|
Unrecognized actuarial gain
|
(218
|
)
|
(179
|
)
|
(188
|
)
|
|||||
|
Net amount recognized
|
$
|
(1,893
|
)
|
$
|
(2,116
|
)
|
$
|
(2,328
|
)
|
||
Amounts recognized in the consolidated financial statements consisted of (in thousands):
|
Accrued pension liability:
|
|||||||||||
|
Current portion
|
$
|
(372
|
)
|
$
|
(395
|
)
|
$
|
(415
|
)
|
||
|
Long term portion
|
(1,313
|
)
|
(1,566
|
)
|
(1,764
|
)
|
|||||
|
Pre-tax accumulated other comprehensive income – retirement benefit liability adjustment
|
(208
|
)
|
(155
|
)
|
(149
|
)
|
|||||
|
Net amount recognized
|
$
|
(1,893
|
)
|
$
|
(2,116
|
)
|
$
|
(2,328
|
)
|
||
The plan’s accumulated benefit obligation equaled the projected benefit obligation as of
December 31, 2015
,
2014
, and
2013
. The measurement date used to determine pension benefit measures was December 31.
Components of net periodic pension cost for the years ended December 31 were as follows (in thousands):
|
2015
|
2014
|
2013
|
|||||||||
|
Interest cost
|
$
|
66
|
|
$
|
88
|
|
$
|
80
|
|
||
|
Amortization of unrecognized prior service cost
|
14
|
|
15
|
|
14
|
|
|||||
|
Net periodic pension cost
|
$
|
80
|
|
$
|
103
|
|
$
|
94
|
|
||
|
Assumptions used to calculate the benefit obligation:
|
|||||||||||
|
Discount rate
|
3.94
|
%
|
3.74
|
%
|
4.45
|
%
|
|||||
61
Expected benefit payments from the plan for the years ended December 31 are as follows (in thousands):
|
2016
|
$
|
372
|
|
|
2017
|
$
|
360
|
|
|
2018
|
$
|
327
|
|
|
2019
|
$
|
228
|
|
|
2020
|
$
|
137
|
|
|
Years 2021 - 2025
|
$
|
492
|
|
Foreign Pension
The Company has another unfunded supplemental pension plan at one of our European subsidiaries which provides defined pension benefits to certain employees upon retirement. The plan has been frozen and no additional participants will be added to the plan in the future. The projected benefit obligation at
December 31, 2015
and
2014
is
$362,000
and
$410,000
, respectively. A pre-tax accumulated other comprehensive loss retirement benefit liability adjustment of
$91,000
and
$113,000
has been recognized in
2015
and
2014
, respectively, in the Company’s financial statements, for a net liability of
$271,000
and
$297,000
at December 31,
2015
and
2014
, respectively.
401(k)
Employees of all U.S. subsidiaries are eligible to participate in the Company’s 401(k) Plan.
Multiemployer Pension Plans
In addition, the Company contributes to a number of multiemployer defined benefit pension plans under the terms of collective-bargaining agreements that cover union-represented employees. The risks of participating in these multiemployer plans are different from single-employer plans in the following aspects:
|
a)
|
Assets contributed to the multiemployer plan by one employer may be used to provide benefits to employees of other participating employers.
|
|
b)
|
If a participating employer stops contributing to the plan, the unfunded obligations of the plan may be borne by the remaining participating employers.
|
|
c)
|
If the Company chooses to stop participating in some of the multiemployer plans, the Company may be required to pay those plans an amount based on the underfunded status of the plan, referred to as a withdrawal liability.
|
The Company’s participation in these plans for the year ended
December 31, 2015
is outlined in the table below. The “EIN/ Pension Plan Number” column provides the Employee Identification Number (EIN) and three-digit plan number, if applicable. Unless otherwise noted, the most recent Pension Protection Act (PPA) zone status available in
2015
and
2014
is for the plan’s year ended
December 31, 2014
and
2013
, respectively. The zone status is based on information that the Company received from the plans and is certified by the plans’ actuaries. Among other factors, plans in the red zone are generally less than
65%
funded, plans in the yellow zone are less than
80%
funded, and plans in the green zone are at least
80%
funded.
|
|
EIN/ Pension
|
PPA Zone Status
|
Surcharge
|
||||
|
Pension Fund
|
Plan Number
|
2014
|
2013
|
Imposed
|
|||
|
National Integrated Group Pension Plan
|
22-6190618-001
|
Red
|
Red
|
Yes
|
|||
|
Sheet Metal Workers’ National Pension Plan
|
52-6112463-001
|
Yellow
|
Red
|
Yes
|
|||
|
Sheet Metal Workers’ Pension Plan of Northern California
|
51-6115939-001
|
Red
|
Red
|
No
|
|||
At
December 31, 2015
, the Company employed
2,628
people, of which approximately
12%
were represented by unions through various collective bargaining agreements (CBAs).
Three
of the Company's
six
CBAs expire and will be renegotiated in 2016. These multi-employer pension plans’ collective bargaining agreements expire
April 1, 2016
,
April 10, 2016
, and
June 30, 2016
, respectively. All of the funds have rehabilitation plans in place. Each plan with a rehabilitation plan requires minimum contributions from the Company. Given the status of these plans, it is reasonably possible that future contributions to the plans
62
will increase although the Company cannot reasonably estimate a possible range of increased contributions as of
December 31, 2015
.
The Company did not contribute more than
5%
of any fund’s total contributions in any of the three years in the period ended
December 31, 2015
. The table below sets forth the contributions made by the Company to each multiemployer plan for the years ended December 31 (in thousands):
|
Pension Fund
|
2015
|
2014
|
2013
|
||||||||
|
National Integrated Group Pension Plan
|
$
|
246
|
|
$
|
233
|
|
$
|
222
|
|
||
|
Sheet Metal Workers’ National Pension Plan
|
56
|
|
61
|
|
78
|
|
|||||
|
Sheet Metal Workers’ Pension Plan of Northern California
|
31
|
|
35
|
|
28
|
|
|||||
|
$
|
333
|
|
$
|
329
|
|
$
|
328
|
|
|||
At the date the financial statements were issued, Forms 5500 were not available for the plan year ended
December 31, 2015
.
Total Retirement Plan Expense
Total expense for all retirement plans for the years ended December 31 was (in thousands):
|
2015
|
2014
|
2013
|
||||||||
|
$
|
2,934
|
|
$
|
2,816
|
|
$
|
2,838
|
|
||
10. OTHER POSTRETIREMENT BENEFITS
The Company has an unfunded postretirement healthcare plan which provides health insurance to certain employees and their spouses upon retirement. This plan has been frozen and no additional participants will be added to the plan in the future.
The following table presents the changes in the accumulated postretirement benefit obligation related to the Company’s unfunded postretirement healthcare benefits at December 31 (in thousands):
|
2015
|
2014
|
2013
|
|||||||||
|
Projected benefit obligation at January 1
|
$
|
8,202
|
|
$
|
5,900
|
|
$
|
5,954
|
|
||
|
Service cost
|
26
|
|
16
|
|
16
|
|
|||||
|
Interest cost
|
300
|
|
255
|
|
203
|
|
|||||
|
Plan amendments
|
—
|
|
—
|
|
603
|
|
|||||
|
Actuarial (gain) loss
|
(29
|
)
|
2,387
|
|
(553
|
)
|
|||||
|
Benefits paid, net of contributions
|
(350
|
)
|
(356
|
)
|
(323
|
)
|
|||||
|
Projected benefit obligation at December 31
|
8,149
|
|
8,202
|
|
5,900
|
|
|||||
|
Fair value of plan assets
|
—
|
|
—
|
|
—
|
|
|||||
|
Under funded status
|
(8,149
|
)
|
(8,202
|
)
|
(5,900
|
)
|
|||||
|
Unamortized prior service cost
|
515
|
|
559
|
|
603
|
|
|||||
|
Unrecognized actuarial loss
|
3,736
|
|
3,962
|
|
1,653
|
|
|||||
|
Net amount recognized
|
$
|
(3,898
|
)
|
$
|
(3,681
|
)
|
$
|
(3,644
|
)
|
||
In October 2014 the Society of Actuaries issued new mortality tables and a mortality improvement scale which were applied when measuring the postretirement benefit obligation as of December 31, 2014. Because the new tables and improvement scale reflect today’s longer life expectancies, it resulted in an actuarial loss and an increase in our projected benefit obligation during 2014. As a result, net periodic postretirement benefit cost charged to expense has increased as a result of increases in the amortization of the actuarial loss.
63
Amounts recognized in the consolidated financial statements consisted of (in thousands):
|
2015
|
2014
|
2013
|
|||||||||
|
Accrued postretirement benefit liability
|
|||||||||||
|
Current portion
|
$
|
(368
|
)
|
$
|
(368
|
)
|
$
|
(356
|
)
|
||
|
Long term portion
|
(7,781
|
)
|
(7,834
|
)
|
(5,544
|
)
|
|||||
|
Pre-tax accumulated other comprehensive loss – unamortized post-retirement healthcare costs
|
4,251
|
|
4,521
|
|
2,256
|
|
|||||
|
Net amount recognized
|
$
|
(3,898
|
)
|
$
|
(3,681
|
)
|
$
|
(3,644
|
)
|
||
Components of net periodic postretirement benefit cost charged to expense for the years ended December 31 were as follows (in thousands):
|
2015
|
2014
|
2013
|
|||||||||
|
Service cost
|
$
|
26
|
|
$
|
16
|
|
$
|
16
|
|
||
|
Interest cost
|
300
|
|
255
|
|
203
|
|
|||||
|
Amortization of unrecognized prior service cost
|
44
|
|
44
|
|
—
|
|
|||||
|
Loss amortization (
2
)
|
197
|
|
78
|
|
123
|
|
|||||
|
Net periodic benefit cost
|
$
|
567
|
|
$
|
393
|
|
$
|
342
|
|
||
|
Assumptions used to calculate the benefit obligation:
|
|||||||||||
|
Discount rate
|
3.9
|
%
|
3.7
|
%
|
4.5
|
%
|
|||||
|
Annual rate of increase in the per capita cost of:
|
|||||||||||
|
Medical costs before age 65 (
1)
|
7.8
|
%
|
8.0
|
%
|
8.5
|
%
|
|||||
|
Medical costs after age 65 (
1)
|
6.8
|
%
|
7.0
|
%
|
7.3
|
%
|
|||||
|
Prescription drug costs (
1)
|
11.0
|
%
|
9.0
|
%
|
7.8
|
%
|
|||||
(1) It was assumed that these rates would gradually decline to
4%
by 2075.
(2) Actuarial (gains)/losses are amortized utilizing the corridor approach. Differences between actual experience and the actuarial assumptions are reflected in (gain)/loss. If the total net (gain) or loss exceeds 10 percent of the greater of the accumulated postretirement benefit obligation or plan asset, this excess must be amortized over the average remaining service period of the active plan participants. If most of the plan participants are inactive, the amortization period is the expected future lifetime of inactive plan participants.
A 1% change in the annual medical inflation rate issued would have the following impact on the amounts reported at December 31 are as follows (in thousands):
|
2015
|
2014
|
||||||
|
Effect on accumulated postretirement benefit obligation
|
|||||||
|
1% increase
|
$
|
963
|
|
$
|
969
|
|
|
|
1% decrease
|
$
|
(825
|
)
|
$
|
(830
|
)
|
|
|
Effect on annual service and interest costs
|
|||||||
|
1% increase
|
$
|
40
|
|
$
|
34
|
|
|
|
1% decrease
|
$
|
(34
|
)
|
$
|
(28
|
)
|
|
The measurement date used to determine postretirement benefit obligation measures was December 31.
64
Expected benefit payments from the plan for the years ended December 31 are as follows (in thousands):
|
2016
|
$
|
368
|
|
|
2017
|
$
|
389
|
|
|
2018
|
$
|
404
|
|
|
2019
|
$
|
428
|
|
|
2020
|
$
|
447
|
|
|
Years 2021 - 2025
|
$
|
2,422
|
|
11. ACCUMULATED OTHER COMPREHENSIVE (LOSS) INCOME
The cumulative balance of each component of accumulated other comprehensive (loss) income is as follows (in thousands):
|
Foreign
Currency
Translation
Adjustment
|
Cash Flow Hedges
|
Minimum Pension Liability Adjustment
|
Unamortized
Post-Retirement
Health Care
Costs
|
Total Pre-Tax Amount
|
Tax (Benefit) Expense
|
Accumulated
Other
Comprehensive
(Loss) Income
|
|||||||||||||||||||||
|
Balance at December 31, 2013
|
$
|
(2,201
|
)
|
$
|
—
|
|
$
|
76
|
|
$
|
(2,256
|
)
|
$
|
(4,381
|
)
|
$
|
(796
|
)
|
$
|
(3,585
|
)
|
||||||
|
Other comprehensive loss on cash flow hedge before reclassification
|
—
|
|
(875
|
)
|
—
|
|
—
|
|
(875
|
)
|
(319
|
)
|
(556
|
)
|
|||||||||||||
|
Reclassified loss on cash flow hedge from other comprehensive (loss) income
|
—
|
|
650
|
|
—
|
|
—
|
|
650
|
|
237
|
|
413
|
|
|||||||||||||
|
Minimum pension and post retirement health care plan adjustments
|
—
|
|
—
|
|
(33
|
)
|
(2,265
|
)
|
(2,298
|
)
|
(839
|
)
|
(1,459
|
)
|
|||||||||||||
|
Foreign currency translation adjustment
|
(4,364
|
)
|
—
|
|
—
|
|
—
|
|
(4,364
|
)
|
—
|
|
(4,364
|
)
|
|||||||||||||
|
Balance at December 31, 2014
|
$
|
(6,565
|
)
|
$
|
(225
|
)
|
$
|
43
|
|
$
|
(4,521
|
)
|
$
|
(11,268
|
)
|
$
|
(1,717
|
)
|
$
|
(9,551
|
)
|
||||||
|
Reclassified loss on cash flow hedge from other comprehensive (loss) income
|
—
|
|
225
|
|
—
|
|
—
|
|
225
|
|
82
|
|
143
|
|
|||||||||||||
|
Minimum pension and post retirement health care plan adjustments
|
—
|
|
—
|
|
75
|
|
270
|
|
345
|
|
125
|
|
220
|
|
|||||||||||||
|
Foreign currency translation adjustment
|
(6,228
|
)
|
—
|
|
—
|
|
—
|
|
(6,228
|
)
|
—
|
|
(6,228
|
)
|
|||||||||||||
|
Balance at December 31, 2015
|
$
|
(12,793
|
)
|
$
|
—
|
|
$
|
118
|
|
$
|
(4,251
|
)
|
$
|
(16,926
|
)
|
$
|
(1,510
|
)
|
$
|
(15,416
|
)
|
||||||
The realized losses relating to the Company’s foreign currency cash flow hedges have been reclassified from Accumulated Other Comprehensive Loss and included in net sales in the Consolidated Statement of Operations.
The realized adjustments relating to the Company’s minimum pension liability and post retirement health care costs were reclassified from Accumulated Other Comprehensive Loss and included in Selling, General and Administrative Expenses in the Consolidated Statement of Operations.
12. EQUITY-BASED COMPENSATION
Equity-based payments to employees and directors, including grants of stock options, restricted stock units, performance stock units, and restricted stock, are recognized in the statements of operations based on the grant-date fair value of the award. The Company uses the straight-line method of attributing the value of stock-based compensation expense over the vesting periods. Stock compensation expense recognized during the period is based on the value of the portion of equity-based awards that is ultimately expected to vest during the period. Vesting requirements vary for directors, executives, and key employees with a vesting period that typically equals
four
years with graded vesting.
On May 7, 2015, the shareholders of the Company authorized the Gibraltar Industries, Inc. 2015 Equity Incentive Plan (the "Plan") and simultaneously amended the 2005 Equity Incentive Plan (the "Prior Plan"). The Plan is an incentive compensation
65
plan that allows the Company to grant equity-based incentive compensation awards to eligible participants to provide them an additional incentive to promote the business of the Company, to increase their proprietary interest in the success of the Company, and to encourage them to remain in the Company’s employ. Awards under the plan may be in the form of options, restricted shares, restricted units, performance shares, performance stock units, and rights. The Plan provides for the issuance of up to
1,250,000
shares of common stock and includes
274,374
shares of common stock which were reserved for issuance under the Prior Plan. Vesting terms and award life are governed by the award document. The amendment of the Prior Plan provides that effective immediately, no further awards will be granted under the terms of the Prior Plan.
Options, Restricted Stock Units, Performance Stock Units, Restricted Stock Awards
The following table provides the number of options, shares of restricted stock, as well as, restricted stock units and performance stock units (that will convert to shares upon vesting) that were issued during the years ended December 31 along with the weighted-average grant-date fair value of each award:
|
|
2015
|
2014
|
2013
|
|||||||||||||||||
|
Awards
|
Number of
Awards
|
Weighted
Average
Grant Date
Fair Value
|
Number of
Awards
|
Weighted
Average
Grant Date
Fair Value
|
Number of
Awards
|
Weighted
Average
Grant Date
Fair Value
|
||||||||||||||
|
Restricted stock units
|
212,419
|
|
$
|
17.78
|
|
218,857
|
|
$
|
16.96
|
|
150,570
|
|
$
|
14.60
|
|
|||||
|
Restricted shares
|
21,318
|
|
$
|
17.48
|
|
21,721
|
|
$
|
16.76
|
|
13,188
|
|
$
|
16.83
|
|
|||||
|
Options
|
37,500
|
|
$
|
25.44
|
|
—
|
|
$
|
—
|
|
—
|
|
$
|
—
|
|
|||||
|
Performance stock units
|
396,714
|
|
$
|
19.78
|
|
—
|
|
$
|
—
|
|
—
|
|
$
|
—
|
|
|||||
At
December 31, 2015
,
691,000
shares were available for issuance under the Plan as incentive stock options or other stock awards.
Included in the performance stock units disclosed above are
321,714
units awarded in June 2015. The final number of performance stock units that will convert to shares will be determined based on RBI's gross profit performance relative to their targeted gross profit for 2016 and 2017. The remaining
75,000
units were awarded in December 2015. The number of shares to be issued to the recipients will be determined based upon the ranking of the Company's total shareholder return over a
three
(3) year performance period ended December 31, 2018 compared to the total shareholder return of companies in the S&P Small Cap Industrial Sector over such period.
The Company recognized the following compensation expense in connection with awards that vested under the Plan and the Prior Plan along with the related tax benefits recognized during the years ended December 31 (in thousands):
|
2015
|
2014
|
2013
|
|||||||||
|
Expense recognized under the Prior Plan
|
$
|
1,953
|
|
$
|
3,150
|
|
$
|
2,564
|
|
||
|
Expense recognized under the Plan
|
1,938
|
|
—
|
|
—
|
|
|||||
|
Total stock compensation expense
|
$
|
3,891
|
|
$
|
3,150
|
|
$
|
2,564
|
|
||
|
Tax benefits recognized related to stock compensation expense
|
$
|
1,518
|
|
$
|
1,229
|
|
$
|
1,000
|
|
||
66
The fair value of the restricted shares, restricted stock units, and performance stock units issued during the three years ended
December 31, 2015
was based on the grant-date fair value. The fair value of stock options granted was estimated on the date of grant using the Black-Scholes option pricing model.
No
options were granted in
2014
and
2013
. Expected stock volatility was based on volatility of the Company’s stock price using a historical period commensurate with the expected life of the options. The following table provides the weighted average assumptions used to value stock options issued during the year ended December 31:
|
Year of Grant
|
Fair Value
|
Expected Life (in years)
|
Expected Stock Volatility
|
Risk-free Interest Rate
|
Annual Forfeiture Rate
|
Expected Dividend Yield
|
||||||||||||
|
2015
|
$
|
7.67
|
|
4.00
|
35.7
|
%
|
1.5
|
%
|
—
|
%
|
—
|
%
|
||||||
The following table summarizes the ranges of outstanding and exercisable options at
December 31, 2015
:
|
Range of Exercise Prices
|
Options
Outstanding
|
Weighted Average
Remaining
Contractual Life
(in years)
|
Weighted
Average
Exercise
Price
|
Options
Exercisable
|
Weighted
Average
Exercise
Price
|
||||||||||
|
$8.90 – $8.90
|
42,000
|
|
4.63
|
$
|
8.90
|
|
42,000
|
|
$
|
8.90
|
|
||||
|
$9.74 – $9.74
|
121,941
|
|
5.63
|
$
|
9.74
|
|
121,941
|
|
$
|
9.74
|
|
||||
|
$11.89 – $18.78
|
117,033
|
|
2.52
|
$
|
16.14
|
|
117,033
|
|
$
|
16.14
|
|
||||
|
$20.52 – $23.78
|
139,875
|
|
1.68
|
$
|
22.81
|
|
139,875
|
|
$
|
22.81
|
|
||||
|
$23.79 – $25.44
|
37,500
|
|
9.93
|
$
|
25.44
|
|
—
|
|
$
|
—
|
|
||||
|
458,349
|
|
420,849
|
|
||||||||||||
The weighted average remaining life of options exercisable at
December 31, 2015
is
3.42
years. The intrinsic value of options exercisable at
December 31, 2015
was
$4,065,000
.
The following table summarizes information about stock option transactions:
|
Options
|
Weighted
Average
Exercise
Price
|
Weighted
Average
Remaining
Contractual
Life
(in years)
|
Aggregate
Intrinsic Value
|
|||||||||
|
Balance at January 1, 2013
|
711,624
|
|
$
|
14.97
|
|
|||||||
|
Exercised
|
(59,750
|
)
|
11.00
|
|
||||||||
|
Forfeited
|
(29,750
|
)
|
12.38
|
|
||||||||
|
Balance at December 31, 2013
|
622,124
|
|
$
|
15.48
|
|
|||||||
|
Exercised
|
(52,805
|
)
|
11.18
|
|
||||||||
|
Forfeited
|
—
|
|
—
|
|
||||||||
|
Balance at December 31, 2014
|
569,319
|
|
$
|
15.88
|
|
|||||||
|
Granted
|
37,500
|
|
25.44
|
|
||||||||
|
Exercised
|
(119,096
|
)
|
15.13
|
|
||||||||
|
Forfeited
|
(750
|
)
|
9.74
|
|
||||||||
|
Expired
|
(28,624
|
)
|
20.56
|
|
||||||||
|
Balance at December 31, 2015
|
458,349
|
|
$
|
16.57
|
|
3.42
|
$
|
4,065,000
|
|
|||
The aggregate intrinsic value in the preceding table represents the total pre-tax intrinsic value, based on the
$25.44
per share market price of the Company’s common stock as of
December 31, 2015
, which would have been received by the option holders had all option holders with an exercise price below the per share market price on
December 31, 2015
, exercised their options as of that date.
67
The following table sets forth the aggregate intrinsic value of options exercised and aggregate fair value of restricted stock units and restricted shares that vested during the years ended December 31 (in thousands):
|
2015
|
2014
|
2013
|
|||||||||
|
Aggregate intrinsic value of options exercised
|
$
|
1,089
|
|
$
|
326
|
|
$
|
398
|
|
||
|
Aggregate fair value of vested restricted stock units
|
$
|
6,578
|
|
$
|
2,416
|
|
$
|
1,900
|
|
||
|
Aggregate fair value of vested restricted shares
|
$
|
111
|
|
$
|
364
|
|
$
|
222
|
|
||
The following table summarizes information about non-vested restricted stock units and performance stock units (that will convert to shares upon vesting) and restricted shares:
|
Restricted
Stock Units
|
Weighted
Average
Grant Date
Fair Value
|
Restricted
Shares
|
Weighted
Average
Grant Date
Fair Value
|
Performance Stock Units
|
Weighted Average Grant Date Fair Value
|
|||||||||||||||
|
Balance at December 31, 2014
|
647,492
|
|
$
|
15.26
|
|
10,259
|
|
$
|
15.89
|
|
—
|
|
$
|
—
|
|
|||||
|
Granted
|
212,419
|
|
17.78
|
|
21,318
|
|
17.48
|
|
396,714
|
|
19.78
|
|
||||||||
|
Vested
|
(297,080
|
)
|
17.13
|
|
(7,156
|
)
|
15.49
|
|
—
|
|
—
|
|
||||||||
|
Forfeited
|
(14,016
|
)
|
15.43
|
|
(2,936
|
)
|
17.71
|
|
—
|
|
—
|
|
||||||||
|
Balance at December 31, 2015
|
548,815
|
|
$
|
15.22
|
|
21,485
|
|
$
|
17.59
|
|
396,714
|
|
$
|
19.78
|
|
|||||
As of
December 31, 2015
, there was
$12,479,000
of total unrecognized compensation cost related to non-vested options, restricted shares, and restricted stock units. That cost is expected to be recognized over a weighted average period of
2.8 years
.
Performance Stock Units - Settled in Cash
In January 2013, the Company awarded
304,000
performance stock units with grant date fair value of
$4,123,000
. As of December 31, 2015,
237,000
of the originally awarded performance stock units remained outstanding after forfeitures. The final number of performance stock units earned was determined based on the Company’s actual return on invested capital (ROIC) for 2013 relative to the improved ROIC targeted for the performance period ending December 31, 2013. During the performance period, the participants earned
50.0%
of target, aggregating
114,000
performance stock units compared to the target of
237,000
awards.
In January 2014 and June 2014, the Company awarded
212,000
and
19,000
, respectively, of performance stock units with a grant date fair value of
$3,914,000
and
$319,000
, respectively. The final number of performance stock units earned was determined based on the Company's actual return on invested capital (ROIC) for 2014. Based on the actual 2014 ROIC, no shares were earned during the performance period.
In January 2015, the Company awarded
219,000
performance stock units with a grant date fair value of
$4,039,000
. As of December 31, 2015, all of the originally awarded performance stock units remained outstanding. The final number of performance stock units earned was determined based on the Company's ROIC for 2015. During the performance periods, the participants earned
200%
of target, aggregating
438,000
performance share units compared to the target of
219,000
awards.
The cost of the
2013
,
2014
, and
2015
performance stock awards are recognized over the requisite vesting period, which ranges between
one year
and
three years
, depending on the date a participant turns
60
and completes
5
years of service. After the vesting period, any performance stock units earned will convert to cash based on the trailing
90
-day closing price of the Company’s common stock as of
December 31, 2015
,
2016
, and
2017
and be payable to participants in January
2016
,
2017
, and
2018
, respectively.
The following table summarizes the compensation expense recognized from the change in fair value and vesting of performance stock units awarded for the years ended December 31 (in thousands):
|
2015
|
2014
|
2013
|
|||||||||
|
Performance stock unit compensation expense
|
$
|
6,965
|
|
$
|
31
|
|
$
|
2,214
|
|
||
68
Management Stock Purchase Plan
The Management Stock Purchase Plan (MSPP) is an integral component of the Plan and provides participants the ability to defer a portion of their salary, their annual bonus under the Management Incentive Compensation Plan, and Directors’ fees. The deferral is converted to restricted stock units and credited to an account together with a company-match in restricted stock units equal to a percentage of the deferral amount. The account is converted to cash at the trailing
200
-day average closing price of the Company’s stock and payable to the participants upon a termination of their service to the Company. The matching portion vests only if the participant has reached their sixtieth (
60
t
h
) birthday. If a participant terminates prior to age sixty (
60
), the match is forfeited. Upon termination, the account is converted to a cash account that accrues interest at
2%
over the then current ten-year U.S. Treasury note rate. The account is then paid out in either
one
lump sum, or in
five
or
ten
equal annual cash installments at the participant’s election.
The fair value of restricted stock units held in the MSPP equals the trailing 200-day average closing price of the Company’s common stock as of the last day of the period. During the years ended December 31,
2015
,
2014
, and
2013
, respectively,
94,047
,
119,105
, and
132,037
restricted stock units that will convert to cash upon vesting were credited to participant accounts. At
December 31, 2015
and
2014
, the value of the restricted stock units in the MSPP was
$19.95
and
$15.68
per unit, respectively. At
December 31, 2015
and
2014
,
519,668
and
647,371
restricted stock units were credited to participant accounts including
59,091
and
62,455
, respectively, of unvested restricted stock units.
The MSPP is a share-based liability settled in cash. The following table sets forth the cash paid to settle these liability awards and expense recognized for the years ended December 31 (in thousands):
|
2015
|
2014
|
2013
|
|||||||||
|
Share-based liabilities paid
|
$
|
1,901
|
|
$
|
2,120
|
|
$
|
531
|
|
||
|
MSPP expense
|
$
|
2,767
|
|
$
|
329
|
|
$
|
3,857
|
|
||
13. DERIVATIVE INSTRUMENTS AND HEDGING ACTIVITIES
The Company is exposed to certain risks arising from both its business operations and economic conditions. The primary risks that the Company manages through its derivative instruments are foreign currency exchange rate risk and commodity pricing risk. Accordingly, we have instituted hedging programs that are accounted for in accordance with Topic 815, “Derivatives and Hedging.”
|
•
|
Our foreign currency hedging program is a cash flow hedge program designed to limit the exposure to variability in expected future cash flows. The Company uses foreign currency forward agreements and currency options, all of which mature within
six months
, to manage its exposure to fluctuations in the foreign currency exchange rates. These contracts are not currently designated as hedging instruments in accordance with Topic 815, and therefore changes in fair value are recorded through earnings.
|
|
•
|
Our commodity price hedging program is designed to mitigate the risks associated with market fluctuations in the price of commodities. The Company uses commodity options, which are classified as economic hedges, to manage this risk. All economic hedges are recorded at fair value through earnings, as the Company does not qualify to use the hedge accounting designation as prescribed by Topic 815.
|
Although certain of our derivative financial instruments do not qualify or are not accounted for under hedge accounting, we do not hold or issue derivative financial instruments for trading or other speculative purposes. We monitor our derivative positions using techniques including market valuations and sensitivity analyses. Hedge accounting generally provides for the matching of the timing of gain or loss recognition on the hedging instrument with the recognition of the changes in the fair value of the hedged asset or liability. These changes in fair value are attributable to the earnings effect of the hedged forecasted transactions in a cash flow hedge.
We consider the classification of the underlying hedged item’s cash flows in determining the classification for the designated derivative instrument’s cash flows. We classify derivative instrument cash flows from hedges of changes in foreign currency as operating activities due to the nature of the hedged item. Cash flows from derivative instruments not designated under hedge accounting, such as our aluminum price options, are classified as investing activities.
Derivatives not designated as hedging instruments
To minimize commodity price exposure, the Company has commodity options with notional amounts of
$810,000
at
December 31, 2015
. This derivative instrument matures in January 2016.
69
To minimize foreign currency exposure, the Company has foreign currency options and forwards with notional amounts of
$12,000,000
and
$3,756,000
, respectively at
December 31, 2015
. These derivative instruments mature at various times through June 2016.
These commodity options and forward exchange options are recorded in the consolidated balance sheet at fair value and the resulting gains or losses are recorded to other income in the consolidated statement of operations. The (gains) losses recognized for the twelve months ended
December 31,
are as follows (in thousands):
|
Derivatives not designated as hedging instruments
|
2015
|
2014
|
|||||
|
Commodity options
|
$
|
399
|
|
$
|
685
|
|
|
|
Foreign exchange forwards
|
187
|
|
(731
|
)
|
|||
|
Foreign exchange options (1)
|
(5,736
|
)
|
(1,015
|
)
|
|||
|
Total non-designated derivative realized (gain) loss, net
|
$
|
(5,150
|
)
|
$
|
(1,061
|
)
|
|
(1) Includes a loss of
$182,000
for the discontinuation of cash flow hedges for which the forecasted transactions are not expected to occur within the originally forecasted time frame.
Summary of Derivatives
Derivatives consist of the following (in thousands):
|
December 31, 2015
|
December 31, 2014
|
|||||||||
|
Derivatives not designated as hedging instruments
|
Classification
|
Fair Value
|
Fair Value
|
|||||||
|
Commodity options
|
Other current assets
|
$
|
—
|
|
$
|
591
|
|
|||
|
Commodity options
|
Other assets
|
—
|
|
162
|
|
|||||
|
Foreign exchange options
|
Other current assets
|
1,792
|
|
1,851
|
|
|||||
|
Foreign exchange options
|
Other assets
|
—
|
|
445
|
|
|||||
|
Total assets
|
$
|
1,792
|
|
$
|
3,049
|
|
||||
|
Foreign exchange forwards
|
Accrued expenses
|
$
|
14
|
|
$
|
—
|
|
|||
14. FAIR VALUE MEASUREMENTS
FASB ASC Topic 820, “Fair Value Measurements and Disclosures,” defines fair value, sets out a framework for measuring fair value, and requires certain disclosures about fair value measurements. A fair value measurement assumes that the transaction to sell an asset or transfer a liability occurs in the principal market for the asset or liability. Fair value is defined based upon an exit price model. ASC 820 establishes a valuation hierarchy for disclosure of the inputs used to measure fair value into three broad levels. A financial asset or liability’s classification within the hierarchy is determined based on the lowest level input that is significant to the fair value measurement as follows:
|
•
|
Level 1 - Unadjusted quoted prices in active markets that are accessible to the reporting entity at the measurement date for identical assets and liabilities.
|
|
•
|
Level 2 - Inputs are quoted prices for similar assets and liabilities in active markets or inputs that are observable for the asset or liability, either directly or indirectly through market corroboration, for substantially the full term of the financial instrument.
|
|
•
|
Level 3 - Unobservable inputs for the assets or liability supported by little or no market activity. Level 3 inputs are based on the Company’s assumptions used to measure assets and liabilities at fair value.
|
70
The following table sets forth by level, within the fair value hierarchy, our assets (liabilities) carried at fair value as of
December 31, 2015
and
2014
(in thousands):
|
December 31, 2015
|
|||||||||||||||||
|
Classification
|
Level 1
|
|
Level 2
|
|
Level 3
|
|
Total
|
||||||||||
|
Carried at fair value
|
|||||||||||||||||
|
Contingent consideration liability
|
Accrued expenses
|
$
|
—
|
|
$
|
—
|
|
$
|
(61
|
)
|
$
|
(61
|
)
|
||||
|
Foreign currency exchange options
|
Other current assets
|
—
|
|
1,792
|
|
—
|
|
1,792
|
|
||||||||
|
Foreign currency exchange forward
|
Accrued expenses
|
—
|
|
(14
|
)
|
—
|
|
(14
|
)
|
||||||||
|
Disclosed at fair value
|
|||||||||||||||||
|
Total long-term debt
|
Long-term debt
|
$
|
(214,007
|
)
|
$
|
—
|
|
$
|
—
|
|
$
|
(214,007
|
)
|
||||
|
December 31, 2014
|
|||||||||||||||||
|
Classification
|
Level 1
|
|
Level 2
|
|
Level 3
|
|
Total
|
||||||||||
|
Carried at fair value
|
|||||||||||||||||
|
Contingent consideration liability
|
Accrued expenses
|
$
|
—
|
|
$
|
—
|
|
$
|
(328
|
)
|
$
|
(328
|
)
|
||||
|
Foreign currency exchange options
|
Other current assets
|
—
|
|
1,851
|
|
—
|
|
1,851
|
|
||||||||
|
Foreign currency exchange options
|
Other assets
|
—
|
|
445
|
|
—
|
|
445
|
|
||||||||
|
Commodity instruments
|
Other current assets
|
—
|
|
591
|
|
—
|
|
591
|
|
||||||||
|
Commodity instruments
|
Other assets
|
—
|
|
162
|
|
—
|
|
162
|
|
||||||||
|
Disclosed at fair value
|
|||||||||||||||||
|
Total long-term debt
|
Long-term debt
|
$
|
(215,831
|
)
|
$
|
—
|
|
$
|
—
|
|
$
|
(215,831
|
)
|
||||
Contingent consideration liability
As described in Note 5 of the consolidated financial statements, the Company acquired the assets of a business in 2013 for which a portion of the purchase consideration is based on an earn-out provision. This liability resulting from this earn-out provision is based on the acquired business’s future EBITDA through 2015. A discounted cash flow analysis, incorporating a Monte Carlo simulation, was used to determine the fair value of a contingent consideration liability. The simulation used a triangular distribution of
500,000
trails and was performed incorporating assumptions such as projected future incomes, upside potentials, low-end expectations, expected synergies to calculate the EBITDA. The calculated EBITDA was subsequently discounted at the pretax cost of debt to determine the fair value. The liability is revalued at each year end for actual EBITDA incurred during the earn-out period to determine the updated fair value.
Derivative instruments and hedging activities
As described in Note 13 of the consolidated financial statements, the Company holds derivative foreign currency exchange options and forwards, as well as, commodity options. The fair values of foreign currency exchange contracts are determined through the use of cash flow models that utilize observable market data inputs to estimate fair value. These observable market data inputs include foreign exchange rate and credit spread curves. In addition, the Company received fair value estimates from the foreign currency contract counterparties to verify the reasonableness of the Company’s estimates.
The fair value of commodity options is determined through the use of cash flow models that utilize observable market data inputs to estimate fair value. These observable market data inputs include forward rates and implied volatility. In addition, the Company received fair value estimates from the commodity contract counterparty to verify the reasonableness of the Company’s estimates.
Debt
At
December 31, 2015
and
2014
, the carrying value of outstanding long-term debt net of unamortized debt issuance costs was
$209,282,000
and
$209,911,000
, respectively. The fair value of the Company’s Senior Subordinated
6.25%
Notes in the table above was estimated based on quoted market prices.
The Company’s other financial instruments primarily consist of cash and cash equivalents, accounts receivable, notes receivable, and accounts payable. The carrying values for our financial instruments approximate fair value. The Company did
71
not have any other material assets or liabilities carried at fair value and measured on a recurring basis as of
December 31, 2015
and
2014
.
Other non-recurring fair value measurements
Long-lived assets
The Company also recognized the impairment of certain property, plant, and equipment during the years ended
December 31, 2015
,
2014
and
2013
. The impairment charges were calculated by determining the fair value of the property, plant, and equipment using unobservable inputs which primarily include replacement cost less depreciation or market data for transactions involving similar assets. These inputs are classified as Level 3 inputs. See Note 16 of the consolidated financial statements for more disclosure regarding the impairment of certain property, plant, and equipment.
During
2015
,
2014
, and
2013
, the Company also recognized impairments to intangible assets. The impairment charges were calculated by determining the fair value of these assets. The fair value measurements were calculated using discounted cash flow analyses which rely upon unobservable inputs classified as Level 3 inputs. See Note 6 of the consolidated financial statements for more disclosure regarding the impairment of intangible assets.
The Company also applied fair value principles during the goodwill impairment tests performed during
2015
,
2014
, and
2013
. Step one of the goodwill impairment test consisted of determining a fair value for each of the Company’s reporting units. The fair value for the Company’s reporting units cannot be determined using readily available quoted Level 1 or Level 2 inputs that are observable or available from active markets. Therefore, the Company used two valuation models to estimate the fair values of its reporting units, both of which use Level 3 inputs. To estimate the fair values of reporting units, the Company uses significant estimates and judgmental factors. The key estimates and factors used in the valuation models include revenue growth rates and profit margins based on internal forecasts, terminal value, WACC, and earnings multiples. As a result of the goodwill impairment test performed during
2014
and
2013
, the Company recognized goodwill impairment charges. See Note 6 of the consolidated financial statements for the results of the Company’s goodwill impairment tests.
Acquisitions
As described in Note 5 of the consolidated financial statements, the Company acquired all of the outstanding stock of RBI on June 9, 2015 and the assets of one business during the year ended December 31, 2013. The estimated fair values allocated to the assets acquired and liabilities assumed relied upon fair value measurements based in part on Level 3 inputs. The valuation techniques used to assign fair values to inventory, property, plant and equipment, and intangible assets included the cost approach, market approach, relief-from-royalty approach, and other income approaches. The valuation techniques relied on a number of inputs that included the cost and condition of the property, plant and equipment, forecasted net sales and incomes, and royalty rates. In addition, the Company has a contingent consideration liability related to the earn-out provision for the 2013 acquisition discussed in Note 5 that is recorded at fair value on a recurring basis each reporting period. A discounted cash flow analysis, which takes into account a discount rate, forecasted EBITDA of the acquired business and the Company’s estimate of the probability of the acquired business achieving the forecasted EBITDA is used to determine the fair value of this liability at each reporting period until the liability is expected to be settled in 2016. The fair value of this liability is determined using Level 3 inputs. The fair value of this liability is sensitive primarily to changes in the forecasted EBITDA of the acquired business.
15. DISCONTINUED OPERATIONS
For certain divestiture transactions, the Company has agreed to indemnify the buyer for various liabilities that may arise after the disposal date, subject to limits of time and amount. The Company is a party to certain claims made under these indemnification provisions. For the years ended
December 31, 2015
,
2014
, and
2013
, management recorded a contingent liability for such provisions related to discontinued operations. Management does not believe that the outcome of such claims, or other claims, would significantly affect the Company’s financial condition or results of operations.
16. EXIT ACTIVITY COSTS AND ASSET IMPAIRMENTS
The Company’s business strategy has been formulated to effect a transformation of its operations and much-improved financial results over a five year period. In 2015, the first year of this planned transformation, an 80/20 simplification initiative commenced across many of our business units. This initiative, in part, focuses the Company’s internal resources on further increasing the value provided to our customers. A result of this initiative in 2015 was the identification of low-volume, internally-produced products which have been or will be planned to be outsourced or discontinued. There were costs resulting
72
from this identification that aggregated
$8,504,000
. These charges relate to the write-down of inventory and impairment of machinery and equipment associated with either discontinued product lines or the reduction of manufactured goods offered within a product line. These assets were written down to their sale or scrap value, and were subsequently sold or disposed of. Exit activity costs of
$1,418,000
were incurred relating to contract termination costs, severance costs, and other moving and closing costs. These costs were the result of the closing and consolidation of
four
facilities, relocation of inventory and equipment at those facilities and the reduction of workforce associated with the discontinued products and closed facilities. Lastly, the Company sold and leased back a facility which resulted in a gain of
$6,799,000
.
In 2014, the Company closed and consolidated
two
facilities which resulted in asset impairment charges of
$208,000
and exit activity costs of
$2,126,000
. In addition, the Company recognized a gain on the sale of a consolidated facility previously impaired in 2013 of
$663,000
.
The following table sets forth the asset impairment charges, exit activity costs and gain on facilities sold in conjunction with these efforts, incurred by segment during the years ended December 31 related to the restructuring activities described above (in thousands):
|
2015
|
2014
|
2013
|
|||||||||||||||||||||||||||||||||||||||||
|
Inventory write-downs &/or asset impairment charges
|
Exit activity costs
|
Gain on sale leaseback
|
Total
|
Inventory write-downs &/or asset impairment charges
|
Exit activity costs
|
Gain on sale
|
Total
|
Inventory write-downs &/or asset impairment charges
|
Exit activity costs
|
Total
|
|||||||||||||||||||||||||||||||||
|
Residential Products
|
$
|
6,495
|
|
$
|
1,256
|
|
$
|
(6,799
|
)
|
$
|
952
|
|
$
|
83
|
|
$
|
1,332
|
|
$
|
(663
|
)
|
$
|
752
|
|
$
|
1,616
|
|
$
|
905
|
|
$
|
2,521
|
|
||||||||||
|
Industrial & Infrastructure Products
|
2,009
|
|
162
|
|
—
|
|
2,171
|
|
125
|
|
794
|
|
—
|
|
919
|
|
—
|
|
113
|
|
113
|
|
|||||||||||||||||||||
|
Total exit activity costs & asset impairments
|
$
|
8,504
|
|
$
|
1,418
|
|
$
|
(6,799
|
)
|
$
|
3,123
|
|
$
|
208
|
|
$
|
2,126
|
|
$
|
(663
|
)
|
$
|
1,671
|
|
$
|
1,616
|
|
$
|
1,018
|
|
$
|
2,634
|
|
||||||||||
The following table provides a summary of where the above exit activity costs and asset impairments are recorded in the consolidated statements of operations for the years ended December 31 (in thousands):
|
2015
|
2014
|
2013
|
|||||||||
|
Cost of sales
|
$
|
9,381
|
|
$
|
843
|
|
$
|
2,519
|
|
||
|
Selling, general, and administrative expense
|
(6,258
|
)
|
828
|
|
115
|
|
|||||
|
Total exit activity costs and asset impairments
|
$
|
3,123
|
|
$
|
1,671
|
|
$
|
2,634
|
|
||
The following table reconciles the beginning and ending liability for exit activity costs relating to the Company’s facility consolidation efforts (in thousands):
|
2015
|
2014
|
||||||
|
Balance as of January 1
|
$
|
575
|
|
$
|
1,092
|
|
|
|
Exit activity costs recognized
|
1,418
|
|
2,126
|
|
|||
|
Cash payments
|
(1,390
|
)
|
(2,643
|
)
|
|||
|
Balance as of December 31
|
$
|
603
|
|
$
|
575
|
|
|
17. INCOME TAXES
The components of income (loss) before taxes from continuing operations consisted of the following for the years ended December 31 (in thousands):
|
2015
|
2014
|
2013
|
|||||||||
|
Domestic
|
$
|
40,176
|
|
$
|
(87,179
|
)
|
$
|
19,787
|
|
||
|
Foreign
|
(3,076
|
)
|
2,429
|
|
(20,619
|
)
|
|||||
|
Income (loss) before taxes from continuing operations
|
$
|
37,100
|
|
$
|
(84,750
|
)
|
$
|
(832
|
)
|
||
73
The provision for (benefit of) income taxes from continuing operations for the years ended December 31 consisted of the following (in thousands):
|
2015
|
2014
|
2013
|
|||||||||
|
Current:
|
|||||||||||
|
U.S. Federal
|
$
|
12,294
|
|
$
|
1,684
|
|
$
|
3,635
|
|
||
|
State
|
2,010
|
|
1,265
|
|
1,507
|
|
|||||
|
Foreign
|
1,371
|
|
733
|
|
892
|
|
|||||
|
Total current
|
15,675
|
|
3,682
|
|
6,034
|
|
|||||
|
Deferred:
|
|||||||||||
|
U.S. Federal
|
(178
|
)
|
(6,373
|
)
|
2,655
|
|
|||||
|
State
|
273
|
|
(203
|
)
|
(2,847
|
)
|
|||||
|
Foreign
|
(2,146
|
)
|
(64
|
)
|
(1,045
|
)
|
|||||
|
Total deferred
|
(2,051
|
)
|
(6,640
|
)
|
(1,237
|
)
|
|||||
|
Provision for income taxes
|
$
|
13,624
|
|
$
|
(2,958
|
)
|
$
|
4,797
|
|
||
The (benefit of) provision for income taxes from discontinued operations for the years ended December 31 consisted of the following (in thousands):
|
2015
|
2014
|
2013
|
|||||||||
|
Current:
|
|||||||||||
|
U.S. Federal
|
$
|
(15
|
)
|
$
|
(18
|
)
|
$
|
(3
|
)
|
||
|
State
|
(1
|
)
|
(1
|
)
|
—
|
|
|||||
|
Foreign
|
—
|
|
—
|
|
—
|
|
|||||
|
(Benefit of) provision for income taxes
|
$
|
(16
|
)
|
$
|
(19
|
)
|
$
|
(3
|
)
|
||
The provision for income taxes from continuing operations differs from the federal statutory rate of
35%
for the years December 31 due to the following (in thousands):
|
|
2015
|
2014
|
2013
|
|||||||||||||||||
|
Statutory rate
|
$
|
12,985
|
|
35.0
|
%
|
$
|
(29,664
|
)
|
35.0
|
%
|
$
|
(291
|
)
|
35.0
|
%
|
|||||
|
Intangible asset impairment
|
—
|
|
—
|
%
|
26,637
|
|
(31.4
|
)%
|
7,241
|
|
(870.3
|
)%
|
||||||||
|
State taxes, less federal effect
|
1,845
|
|
5.0
|
%
|
606
|
|
(0.7
|
)%
|
1,382
|
|
(166.1
|
)%
|
||||||||
|
Change in valuation allowance
|
284
|
|
0.7
|
%
|
94
|
|
(0.1
|
)%
|
(2,268
|
)
|
272.6
|
%
|
||||||||
|
Federal tax credits
|
(242
|
)
|
(0.7
|
)%
|
(255
|
)
|
0.3
|
%
|
(517
|
)
|
62.1
|
%
|
||||||||
|
Uncertain tax positions
|
(344
|
)
|
(0.9
|
)%
|
(169
|
)
|
0.2
|
%
|
(515
|
)
|
61.9
|
%
|
||||||||
|
Foreign rate differential
|
(6
|
)
|
—
|
%
|
(311
|
)
|
0.4
|
%
|
(163
|
)
|
19.6
|
%
|
||||||||
|
Non-deductible expenses
|
(793
|
)
|
(2.1
|
)%
|
173
|
|
(0.2
|
)%
|
(66
|
)
|
7.9
|
%
|
||||||||
|
Other
|
(105
|
)
|
(0.3
|
)%
|
(69
|
)
|
—
|
%
|
(6
|
)
|
0.7
|
%
|
||||||||
|
$
|
13,624
|
|
36.7
|
%
|
$
|
(2,958
|
)
|
3.5
|
%
|
$
|
4,797
|
|
(576.6
|
)%
|
||||||
74
Deferred tax liabilities (assets) at December 31 consist of the following (in thousands):
|
2015
|
2014
|
||||||
|
Depreciation
|
$
|
18,667
|
|
$
|
18,896
|
|
|
|
Goodwill
|
36,058
|
|
29,175
|
|
|||
|
Intangible assets
|
19,291
|
|
18,637
|
|
|||
|
Other
|
1,742
|
|
1,464
|
|
|||
|
Gross deferred tax liabilities
|
75,758
|
|
68,172
|
|
|||
|
Equity compensation
|
(13,023
|
)
|
(11,826
|
)
|
|||
|
Other
|
(20,847
|
)
|
(16,988
|
)
|
|||
|
Gross deferred tax assets
|
(33,870
|
)
|
(28,814
|
)
|
|||
|
Valuation allowances
|
766
|
|
400
|
|
|||
|
Deferred tax assets, net of valuation allowances
|
(33,104
|
)
|
(28,414
|
)
|
|||
|
Net deferred tax liabilities
|
$
|
42,654
|
|
$
|
39,758
|
|
|
The Company early adopted the Financial Accounting Standards Boards Accounting Standards Update 2015-17, "Income Taxes (Topic 740)" effective December 31, 2015. The Update requires deferred tax liabilities and assets be classified as noncurrent in a classified statement of financial position. The Company adopted this Update on a prospective basis. Therefore, the Company reclassed its current deferred tax assets included in other current assets to deferred income taxes (noncurrent liability) on its Balance Sheet at December 31, 2015. Net current deferred tax assets of
$10,014,000
are included in other current assets in the consolidated balance sheet at December 31,
2014
.
Deferred taxes include net deferred tax assets relating to certain state and foreign tax jurisdictions. A reduction of the carrying amount of deferred tax assets by a valuation allowance is required if it is more likely than not that such assets will not be realized. The following sets forth a reconciliation of the beginning and ending amount of the Company’s valuation allowance (in thousands):
|
2015
|
2014
|
2013
|
|||||||||
|
Balance as of January 1
|
$
|
400
|
|
$
|
306
|
|
$
|
2,574
|
|
||
|
Cost charged to the tax provision
|
286
|
|
144
|
|
—
|
|
|||||
|
Purchase accounting adjustment
|
158
|
|
—
|
|
—
|
|
|||||
|
Reductions
|
(78
|
)
|
(50
|
)
|
(2,268
|
)
|
|||||
|
Balance as of December 31
|
$
|
766
|
|
$
|
400
|
|
$
|
306
|
|
||
The Company made net payments for income taxes, for the following amounts for the years ended December 31 (in thousands):
|
2015
|
2014
|
2013
|
|||||||||
|
Payments made for income taxes, net
|
$
|
(11,879
|
)
|
$
|
(6,509
|
)
|
$
|
(7,564
|
)
|
||
Provision has not been made for U.S. taxes on
$28,830,000
of undistributed earnings of foreign subsidiaries. Those earnings have been and will continue to be indefinitely reinvested. As of
December 31, 2015
, the Company’s foreign operations held
$29,261,000
of cash that provides foreign operations with liquidity to reinvest in working capital and capital expenditures for their operations. Any excess earnings could be used to grow the Company’s foreign operations through launches of new capital projects or additional acquisitions. Determination of the amount of unrecognized deferred U.S. income tax liability is not practicable due to the complexities associated with its hypothetical calculation.
75
A reconciliation of the beginning and ending amount of unrecognized tax benefits is as follows (in thousands):
|
2015
|
2014
|
2013
|
|||||||||
|
Balance as of January 1
|
$
|
1,414
|
|
$
|
1,694
|
|
$
|
2,485
|
|
||
|
Additions for tax positions of the current year
|
148
|
|
180
|
|
83
|
|
|||||
|
Additions for tax positions of prior years
|
2,955
|
|
93
|
|
—
|
|
|||||
|
Reductions for tax positions of prior years for:
|
|||||||||||
|
Settlements and changes in judgment
|
(331
|
)
|
(154
|
)
|
(26
|
)
|
|||||
|
Lapses of applicable statute of limitations
|
(310
|
)
|
(399
|
)
|
(848
|
)
|
|||||
|
Balance as of December 31
|
$
|
3,876
|
|
$
|
1,414
|
|
$
|
1,694
|
|
||
The Company and its U.S. subsidiaries file a U.S. federal consolidated income tax return. Foreign and U.S. state jurisdictions have statute of limitations generally ranging from
four
to
ten years
. Currently, the Company is under examination in Germany for
2009
through
2012
. The Company's U.S. federal consolidated income tax return remains subject to examination for 2014 and 2015.
All unrecognized tax benefits would affect the effective tax rate, if recognized as of
December 31, 2015
and
2014
. The Company classifies accrued interest and penalties related to unrecognized tax benefits in income tax expense. Interest (net of federal tax benefit) and penalties recognized during the years ended December 31 were (in thousands):
|
2015
|
2014
|
2013
|
|||||||||
|
Interest and penalties recognized as income
|
$
|
(87
|
)
|
$
|
(28
|
)
|
$
|
(92
|
)
|
||
At
December 31, 2015
, the Company had net operating loss carry forwards for federal, state, and foreign income tax purposes totaling
$30,383,000
. The federal and state net operating loss carry forwards will expire between
2016
and
2025
. The foreign net operating loss carry forwards have an indefinite carry forward period. The Company recognized
$2,571,000
of deferred tax assets, net of the federal tax benefit, related to these net operating losses prior to any valuation allowances.
18. EARNINGS PER SHARE
Basic earnings per share is based on the weighted average number of common shares outstanding. Diluted earnings per share is based on the weighted average number of common shares outstanding, as well as dilutive potential common shares which, in the Company’s case, include shares issuable under the equity compensation plans described in Note 12 of the consolidated financial statements. The weighted average number of shares and conversions utilized in the calculation of diluted earnings per share does not include potential anti-dilutive common shares aggregating
643,000
,
503,000
, and
762,000
at
December 31, 2015
,
2014
, and
2013
, respectively. The treasury stock method is used to calculate dilutive shares, which reduces the gross number of dilutive shares by the number of shares purchasable from the proceeds of the options assumed to be exercised and the unrecognized expense related to the restricted stock and restricted stock awards assumed to have vested.
The following table sets forth the computation of basic and diluted earnings per share for the years ended December 31 (in thousands):
|
2015
|
2014
|
2013
|
|||||||||
|
Numerator:
|
|||||||||||
|
Income (loss) from continuing operations
|
$
|
23,476
|
|
$
|
(81,792
|
)
|
$
|
(5,629
|
)
|
||
|
Loss from discontinued operations
|
(28
|
)
|
(32
|
)
|
(4
|
)
|
|||||
|
Net income (loss) available to common shareholders
|
$
|
23,448
|
|
$
|
(81,824
|
)
|
$
|
(5,633
|
)
|
||
|
Denominator for basic earnings per share:
|
|||||||||||
|
Weighted average shares outstanding
|
31,233
|
|
31,066
|
|
30,930
|
|
|||||
|
Denominator for diluted earnings per share:
|
|||||||||||
|
Common stock options and restricted stock
|
312
|
|
—
|
|
—
|
|
|||||
|
Weighted average shares and conversions
|
31,545
|
|
31,066
|
|
30,930
|
|
|||||
76
For the years ended
December 31, 2014
and
2013
, all stock options, unvested restricted stock, and unvested restricted stock units were anti-dilutive and, therefore, not included in the dilutive loss per share calculations. The number of weighted average stock options, unvested restricted stock, and unvested restricted stock units that were not included in the dilutive loss per share calculations because the effect would have been anti-dilutive was
211,000
and
177,000
shares for the years ended
December 31, 2014
and
2013
, respectively.
19. COMMITMENTS AND CONTINGENCIES
The Company leases certain facilities and equipment under operating leases. As leases expire, it can be expected that, in the normal course of business, certain leases will be renewed or replaced. Certain lease agreements include escalating rent payments over the lease terms. The Company expenses rent on a straight-line basis over the lease term which commences on the date the Company has the right to control the property. Rent expense under operating leases for the years ended December 31 aggregated (in thousands):
|
2015
|
2014
|
2013
|
|||||||||
|
Rent expense
|
$
|
13,959
|
|
$
|
12,290
|
|
$
|
11,796
|
|
||
Future minimum lease payments under these noncancelable operating leases as of December 31, 2015 are as follows (in thousands):
|
2016
|
$
|
12,817
|
|
|
2017
|
$
|
11,413
|
|
|
2018
|
$
|
9,340
|
|
|
2019
|
$
|
5,828
|
|
|
2020
|
$
|
3,569
|
|
|
Thereafter
|
$
|
5,210
|
|
The Company is a party to certain claims and legal actions generally incidental to its business. Management does not believe that the outcome of these actions, which are not clearly determinable at the present time, would significantly affect the Company’s financial condition or results of operations.
Escheat Audits
The State of Delaware, Department of Finance, Division of Revenue (Unclaimed Property), has notified numerous companies, including Gibraltar Industries, Inc., that the State will examine its books and records and those of its subsidiaries and related entities to determine compliance with the Delaware Escheat Laws. The review is being conducted by a third party on behalf of the State. Sixteen other states have retained the same third party and have sent similar notifications to Gibraltar. The scope of each state’s audit varies. The State of Delaware advises, for example, that the scope of its examination will be for the period 1981 through the present. The exposure, if any, related to the audits is not currently determinable.
20. RELATED PARTY TRANSACTIONS
An officer of one of the Company's operating segments is the owner of certain real estate properties leased for manufacturing and distribution purposes by that operating segment. The leases are in effect until June 2018 and June 2020. For the year ended
December 31, 2015
, the Company incurred
$523,000
of lease expense for these properties. All amounts incurred during 2015 were expensed as a component of cost of sales.
21. SEGMENT INFORMATION
The Company is organized into
three
reportable segments on the basis of the production process and products and services provided by each segment, identified as follows:
|
(i)
|
Residential Products, which primarily includes roof and foundation ventilation products, mail and package storage products, rain dispersion products and roofing accessories;
|
|
(ii)
|
Industrial and Infrastructure Products, which primarily includes fabricated bar grating, expanded and perforated metal, expansion joints and structural bearings; and
|
|
(iii)
|
Renewable Energy and Conservation, which primarily includes designing, engineering, manufacturing and installation of solar racking systems and greenhouse structures.
|
77
When determining the reportable segments, the Company aggregated operating segments based on their similar economic and operating characteristics.
The following table illustrates certain measurements used by management to assess the performance of the segments described above as of and for the years ended December 31 (in thousands):
|
2015
|
2014
|
2013
|
|||||||||
|
Net sales:
|
|||||||||||
|
Residential Products
|
$
|
475,653
|
|
$
|
431,915
|
|
$
|
394,071
|
|
||
|
Industrial and Infrastructure Products
|
378,224
|
|
431,432
|
|
435,168
|
|
|||||
|
Less: Intersegment sales
|
(1,536
|
)
|
(1,260
|
)
|
(1,672
|
)
|
|||||
|
376,688
|
|
430,172
|
|
433,496
|
|
||||||
|
Renewable Energy and Conservation
|
188,532
|
|
—
|
|
—
|
|
|||||
|
Total consolidated net sales
|
$
|
1,040,873
|
|
$
|
862,087
|
|
$
|
827,567
|
|
||
|
Income (loss) from operations:
|
|||||||||||
|
Residential Products
|
$
|
46,804
|
|
$
|
16,416
|
|
$
|
34,965
|
|
||
|
Industrial and Infrastructure Products
|
15,581
|
|
(74,634
|
)
|
7,169
|
|
|||||
|
Renewable Energy and Conservation
|
12,659
|
|
—
|
|
—
|
|
|||||
|
Unallocated Corporate Expenses
|
(26,959
|
)
|
(12,199
|
)
|
(20,654
|
)
|
|||||
|
$
|
48,085
|
|
$
|
(70,417
|
)
|
$
|
21,480
|
|
|||
|
Depreciation and Amortization
|
|||||||||||
|
Residential Products
|
$
|
9,967
|
|
$
|
10,699
|
|
$
|
11,421
|
|
||
|
Industrial and Infrastructure Products
|
12,108
|
|
13,910
|
|
14,688
|
|
|||||
|
Renewable Energy and Conservation
|
7,811
|
|
—
|
|
—
|
|
|||||
|
Unallocated Corporate Expenses
|
662
|
|
823
|
|
941
|
|
|||||
|
$
|
30,548
|
|
$
|
25,432
|
|
$
|
27,050
|
|
|||
|
Total assets
|
|||||||||||
|
Residential Products
|
$
|
363,339
|
|
$
|
394,092
|
|
$
|
389,506
|
|
||
|
Industrial and Infrastructure Products
|
273,987
|
|
308,150
|
|
411,093
|
|
|||||
|
Renewable Energy and Conservation
|
215,211
|
|
—
|
|
—
|
|
|||||
|
Unallocated Corporate Expenses
|
37,235
|
|
108,229
|
|
88,972
|
|
|||||
|
$
|
889,772
|
|
$
|
810,471
|
|
$
|
889,571
|
|
|||
|
Capital expenditures
|
|||||||||||
|
Residential Products
|
$
|
3,328
|
|
$
|
12,731
|
|
$
|
5,937
|
|
||
|
Industrial and Infrastructure Products
|
4,846
|
|
10,425
|
|
8,755
|
|
|||||
|
Renewable Energy and Conservation
|
3,871
|
|
—
|
|
—
|
|
|||||
|
Unallocated Corporate Expenses
|
328
|
|
135
|
|
248
|
|
|||||
|
$
|
12,373
|
|
$
|
23,291
|
|
$
|
14,940
|
|
|||
78
Net sales by region or origin and long-lived assets by region of domicile for the years ended and as of December 31 are as follows (in thousands):
|
2015
|
2014
|
2013
|
|||||||||
|
Net sales
|
|||||||||||
|
North America
|
$
|
968,414
|
|
$
|
816,473
|
|
$
|
784,926
|
|
||
|
Europe
|
48,216
|
|
45,614
|
|
42,641
|
|
|||||
|
Asia
|
24,243
|
|
—
|
|
—
|
|
|||||
|
Total
|
$
|
1,040,873
|
|
$
|
862,087
|
|
$
|
827,567
|
|
||
|
Long-lived assets
|
|||||||||||
|
North America
|
$
|
110,571
|
|
$
|
122,824
|
|
$
|
125,816
|
|
||
|
Europe
|
11,084
|
|
8,957
|
|
8,210
|
|
|||||
|
Asia
|
1,292
|
|
—
|
|
—
|
|
|||||
|
Total
|
$
|
122,947
|
|
$
|
131,781
|
|
$
|
134,026
|
|
||
22. SUPPLEMENTAL FINANCIAL INFORMATION
The following information sets forth the consolidating summary financial statements of the issuer (Gibraltar Industries, Inc.) and guarantors, which guarantee the Senior Subordinated
6.25%
Notes due February 1, 2021, and the non-guarantors. The guarantors are 100% owned subsidiaries of the issuer and the guarantees are full, unconditional, joint and several.
Investments in subsidiaries are accounted for by the parent using the equity method of accounting. The guarantor subsidiaries and non-guarantor subsidiaries are presented on a combined basis. The principal elimination entries eliminate investments in subsidiaries and intercompany balances and transactions.
79
GIBRALTAR INDUSTRIES, INC.
CONSOLIDATING STATEMENTS OF OPERATIONS
YEAR ENDED
DECEMBER 31, 2015
(in thousands)
|
Gibraltar
Industries, Inc.
|
Guarantor
Subsidiaries
|
Non-Guarantor
Subsidiaries
|
Eliminations
|
Total
|
|||||||||||||||
|
Net sales
|
$
|
—
|
|
$
|
960,614
|
|
$
|
109,984
|
|
$
|
(29,725
|
)
|
$
|
1,040,873
|
|
||||
|
Cost of sales
|
—
|
|
785,085
|
|
94,949
|
|
(26,137
|
)
|
853,897
|
|
|||||||||
|
Gross profit
|
—
|
|
175,529
|
|
15,035
|
|
(3,588
|
)
|
186,976
|
|
|||||||||
|
Selling, general, and administrative expense
|
133
|
|
116,529
|
|
17,366
|
|
—
|
|
134,028
|
|
|||||||||
|
Intangible asset impairment
|
—
|
|
4,863
|
|
—
|
|
—
|
|
4,863
|
|
|||||||||
|
(Loss) income from operations
|
(133
|
)
|
54,137
|
|
(2,331
|
)
|
(3,588
|
)
|
48,085
|
|
|||||||||
|
Interest expense (income)
|
13,609
|
|
1,469
|
|
(75
|
)
|
—
|
|
15,003
|
|
|||||||||
|
Other expense (income)
|
50
|
|
(3,801
|
)
|
(267
|
)
|
—
|
|
(4,018
|
)
|
|||||||||
|
(Loss) income before taxes
|
(13,792
|
)
|
56,469
|
|
(1,989
|
)
|
(3,588
|
)
|
37,100
|
|
|||||||||
|
(Benefit of) provision for income taxes
|
(4,427
|
)
|
18,827
|
|
(776
|
)
|
—
|
|
13,624
|
|
|||||||||
|
(Loss) income from continuing operations
|
(9,365
|
)
|
37,642
|
|
(1,213
|
)
|
(3,588
|
)
|
23,476
|
|
|||||||||
|
Discontinued operations:
|
|||||||||||||||||||
|
Loss before taxes
|
—
|
|
(44
|
)
|
—
|
|
—
|
|
(44
|
)
|
|||||||||
|
Benefit of income taxes
|
—
|
|
(16
|
)
|
—
|
|
—
|
|
(16
|
)
|
|||||||||
|
Loss from discontinued operations
|
—
|
|
(28
|
)
|
—
|
|
—
|
|
(28
|
)
|
|||||||||
|
Equity in earnings from subsidiaries
|
36,401
|
|
(1,213
|
)
|
—
|
|
(35,188
|
)
|
—
|
|
|||||||||
|
Net income
|
$
|
27,036
|
|
$
|
36,401
|
|
$
|
(1,213
|
)
|
$
|
(38,776
|
)
|
$
|
23,448
|
|
||||
80
GIBRALTAR INDUSTRIES, INC.
CONSOLIDATING STATEMENTS OF OPERATIONS
YEAR ENDED
DECEMBER 31, 2014
(in thousands)
|
Gibraltar
Industries, Inc.
|
Guarantor
Subsidiaries
|
Non-Guarantor
Subsidiaries
|
Eliminations
|
Total
|
|||||||||||||||
|
Net sales
|
$
|
—
|
|
$
|
792,078
|
|
$
|
88,096
|
|
$
|
(18,087
|
)
|
$
|
862,087
|
|
||||
|
Cost of sales
|
—
|
|
661,041
|
|
77,914
|
|
(16,913
|
)
|
722,042
|
|
|||||||||
|
Gross profit
|
—
|
|
131,037
|
|
10,182
|
|
(1,174
|
)
|
140,045
|
|
|||||||||
|
Selling, general, and administrative expense
|
128
|
|
95,735
|
|
6,629
|
|
—
|
|
102,492
|
|
|||||||||
|
Intangible asset impairment
|
—
|
|
107,970
|
|
—
|
|
—
|
|
107,970
|
|
|||||||||
|
(Loss) income from operations
|
(128
|
)
|
(72,668
|
)
|
3,553
|
|
(1,174
|
)
|
(70,417
|
)
|
|||||||||
|
Interest expense (income)
|
13,568
|
|
995
|
|
(142
|
)
|
—
|
|
14,421
|
|
|||||||||
|
Other expense (income)
|
144
|
|
(328
|
)
|
96
|
|
—
|
|
(88
|
)
|
|||||||||
|
(Loss) income before taxes
|
(13,840
|
)
|
(73,335
|
)
|
3,599
|
|
(1,174
|
)
|
(84,750
|
)
|
|||||||||
|
(Benefit of) provision for income taxes
|
(4,381
|
)
|
753
|
|
670
|
|
—
|
|
(2,958
|
)
|
|||||||||
|
(Loss) income from continuing operations
|
(9,459
|
)
|
(74,088
|
)
|
2,929
|
|
(1,174
|
)
|
(81,792
|
)
|
|||||||||
|
Discontinued operations:
|
|||||||||||||||||||
|
Loss before taxes
|
—
|
|
(51
|
)
|
—
|
|
—
|
|
(51
|
)
|
|||||||||
|
Benefit of income taxes
|
—
|
|
(19
|
)
|
—
|
|
—
|
|
(19
|
)
|
|||||||||
|
Loss from discontinued operations
|
—
|
|
(32
|
)
|
—
|
|
—
|
|
(32
|
)
|
|||||||||
|
Equity in earnings from subsidiaries
|
(71,191
|
)
|
2,929
|
|
—
|
|
68,262
|
|
—
|
|
|||||||||
|
Net (loss) income
|
$
|
(80,650
|
)
|
$
|
(71,191
|
)
|
$
|
2,929
|
|
$
|
67,088
|
|
$
|
(81,824
|
)
|
||||
81
GIBRALTAR INDUSTRIES, INC.
CONSOLIDATING STATEMENTS OF OPERATIONS
YEAR ENDED
DECEMBER 31, 2013
(in thousands)
|
Gibraltar
Industries, Inc.
|
Guarantor
Subsidiaries
|
Non-Guarantor
Subsidiaries
|
Eliminations
|
Total
|
|||||||||||||||
|
Net sales
|
$
|
—
|
|
$
|
758,790
|
|
$
|
91,198
|
|
$
|
(22,421
|
)
|
$
|
827,567
|
|
||||
|
Cost of sales
|
—
|
|
610,049
|
|
81,073
|
|
(21,652
|
)
|
669,470
|
|
|||||||||
|
Gross profit
|
—
|
|
148,741
|
|
10,125
|
|
(769
|
)
|
158,097
|
|
|||||||||
|
Selling, general, and administrative expense
|
171
|
|
105,693
|
|
7,593
|
|
—
|
|
113,457
|
|
|||||||||
|
Intangible asset impairment
|
—
|
|
1,000
|
|
22,160
|
|
—
|
|
23,160
|
|
|||||||||
|
(Loss) income from operations
|
(171
|
)
|
42,048
|
|
(19,628
|
)
|
(769
|
)
|
21,480
|
|
|||||||||
|
Interest expense (income)
|
21,214
|
|
1,399
|
|
(124
|
)
|
—
|
|
22,489
|
|
|||||||||
|
Other income
|
—
|
|
(177
|
)
|
—
|
|
—
|
|
(177
|
)
|
|||||||||
|
(Loss) income before taxes
|
(21,385
|
)
|
40,826
|
|
(19,504
|
)
|
(769
|
)
|
(832
|
)
|
|||||||||
|
(Benefit of) provision for income taxes
|
(7,480
|
)
|
12,430
|
|
(153
|
)
|
—
|
|
4,797
|
|
|||||||||
|
(Loss) income from continuing operations
|
(13,905
|
)
|
28,396
|
|
(19,351
|
)
|
(769
|
)
|
(5,629
|
)
|
|||||||||
|
Discontinued operations:
|
|||||||||||||||||||
|
Loss before taxes
|
—
|
|
(7
|
)
|
—
|
|
—
|
|
(7
|
)
|
|||||||||
|
Benefit of income taxes
|
—
|
|
(3
|
)
|
—
|
|
—
|
|
(3
|
)
|
|||||||||
|
Loss from discontinued operations
|
—
|
|
(4
|
)
|
—
|
|
—
|
|
(4
|
)
|
|||||||||
|
Equity in earnings from subsidiaries
|
9,041
|
|
(19,351
|
)
|
—
|
|
10,310
|
|
—
|
|
|||||||||
|
Net (loss) income
|
$
|
(4,864
|
)
|
$
|
9,041
|
|
$
|
(19,351
|
)
|
$
|
9,541
|
|
$
|
(5,633
|
)
|
||||
82
GIBRALTAR INDUSTRIES, INC.
CONSOLIDATED STATEMENTS OF COMPREHENSIVE INCOME
YEAR ENDED
DECEMBER 31, 2015
(in thousands)
|
Gibraltar
Industries, Inc.
|
Guarantor
Subsidiaries
|
Non-Guarantor
Subsidiaries
|
Eliminations
|
Total
|
|||||||||||||||
|
Net income
|
$
|
27,036
|
|
$
|
36,401
|
|
$
|
(1,213
|
)
|
$
|
(38,776
|
)
|
$
|
23,448
|
|
||||
|
Other comprehensive (loss) income:
|
|||||||||||||||||||
|
Foreign currency translation adjustment
|
—
|
|
—
|
|
(6,228
|
)
|
—
|
|
(6,228
|
)
|
|||||||||
|
Unrealized loss on cash flow hedges, net of tax
|
—
|
|
143
|
|
—
|
|
—
|
|
143
|
|
|||||||||
|
Adjustment to retirement benefit liability, net of tax
|
—
|
|
34
|
|
15
|
|
—
|
|
49
|
|
|||||||||
|
Adjustment to post-retirement healthcare benefit liability, net of tax
|
—
|
|
171
|
|
—
|
|
—
|
|
171
|
|
|||||||||
|
Other comprehensive income (loss)
|
—
|
|
348
|
|
(6,213
|
)
|
—
|
|
(5,865
|
)
|
|||||||||
|
Total comprehensive income (loss)
|
$
|
27,036
|
|
$
|
36,749
|
|
$
|
(7,426
|
)
|
$
|
(38,776
|
)
|
$
|
17,583
|
|
||||
83
GIBRALTAR INDUSTRIES, INC.
CONSOLIDATED STATEMENTS OF COMPREHENSIVE INCOME
YEAR ENDED
DECEMBER 31, 2014
(in thousands)
|
Gibraltar
Industries, Inc.
|
Guarantor
Subsidiaries
|
Non-Guarantor
Subsidiaries
|
Eliminations
|
Total
|
|||||||||||||||
|
Net (loss) income
|
$
|
(80,650
|
)
|
$
|
(71,191
|
)
|
$
|
2,929
|
|
$
|
67,088
|
|
$
|
(81,824
|
)
|
||||
|
Other comprehensive (loss) income:
|
|||||||||||||||||||
|
Foreign currency translation adjustment
|
—
|
|
—
|
|
(4,364
|
)
|
—
|
|
(4,364
|
)
|
|||||||||
|
Adjustment to retirement benefit liability, net of tax
|
—
|
|
3
|
|
(27
|
)
|
—
|
|
(24
|
)
|
|||||||||
|
Adjustment to post-retirement healthcare benefit liability, net of tax
|
—
|
|
(1,435
|
)
|
—
|
|
—
|
|
(1,435
|
)
|
|||||||||
|
Unrealized loss on cash flow hedges, net of tax
|
—
|
|
(143
|
)
|
—
|
|
—
|
|
(143
|
)
|
|||||||||
|
Other comprehensive (loss)
|
—
|
|
(1,575
|
)
|
(4,391
|
)
|
—
|
|
(5,966
|
)
|
|||||||||
|
Total comprehensive (loss)
|
$
|
(80,650
|
)
|
$
|
(72,766
|
)
|
$
|
(1,462
|
)
|
$
|
67,088
|
|
$
|
(87,790
|
)
|
||||
84
GIBRALTAR INDUSTRIES, INC.
CONSOLIDATED STATEMENTS OF COMPREHENSIVE INCOME
YEAR ENDED
DECEMBER 31, 2013
(in thousands)
|
Gibraltar
Industries, Inc.
|
Guarantor
Subsidiaries
|
Non-Guarantor
Subsidiaries
|
Eliminations
|
Total
|
|||||||||||||||
|
Net (loss) income
|
$
|
(4,864
|
)
|
$
|
9,041
|
|
$
|
(19,351
|
)
|
$
|
9,541
|
|
$
|
(5,633
|
)
|
||||
|
Other comprehensive (loss) income:
|
|||||||||||||||||||
|
Foreign currency translation adjustment
|
—
|
|
—
|
|
(2,108
|
)
|
—
|
|
(2,108
|
)
|
|||||||||
|
Adjustment to retirement benefit liability, net of tax
|
—
|
|
53
|
|
—
|
|
—
|
|
53
|
|
|||||||||
|
Adjustment to post-retirement healthcare benefit liability, net of tax
|
—
|
|
45
|
|
—
|
|
—
|
|
45
|
|
|||||||||
|
Other comprehensive income (loss)
|
—
|
|
98
|
|
(2,108
|
)
|
—
|
|
(2,010
|
)
|
|||||||||
|
Total comprehensive (loss) income
|
$
|
(4,864
|
)
|
$
|
9,139
|
|
$
|
(21,459
|
)
|
$
|
9,541
|
|
$
|
(7,643
|
)
|
||||
85
GIBRALTAR INDUSTRIES, INC.
CONSOLIDATING BALANCE SHEETS
DECEMBER 31, 2015
(in thousands)
|
Gibraltar
Industries, Inc.
|
Guarantor
Subsidiaries
|
Non-Guarantor
Subsidiaries
|
Eliminations
|
Total
|
|||||||||||||||
|
Assets
|
|||||||||||||||||||
|
Current assets:
|
|||||||||||||||||||
|
Cash and cash equivalents
|
$
|
—
|
|
$
|
39,597
|
|
$
|
29,261
|
|
$
|
—
|
|
$
|
68,858
|
|
||||
|
Accounts receivable, net
|
—
|
|
142,674
|
|
22,295
|
|
—
|
|
164,969
|
|
|||||||||
|
Intercompany balances
|
15,023
|
|
12,033
|
|
(27,056
|
)
|
—
|
|
—
|
|
|||||||||
|
Inventories
|
—
|
|
99,132
|
|
7,926
|
|
—
|
|
107,058
|
|
|||||||||
|
Other current assets
|
4,535
|
|
2,957
|
|
3,045
|
|
—
|
|
10,537
|
|
|||||||||
|
Total current assets
|
19,558
|
|
296,393
|
|
35,471
|
|
—
|
|
351,422
|
|
|||||||||
|
Property, plant, and equipment, net
|
—
|
|
106,413
|
|
12,519
|
|
—
|
|
118,932
|
|
|||||||||
|
Goodwill
|
—
|
|
270,017
|
|
22,373
|
|
—
|
|
292,390
|
|
|||||||||
|
Acquired intangibles
|
—
|
|
111,734
|
|
11,279
|
|
—
|
|
123,013
|
|
|||||||||
|
Other assets
|
—
|
|
4,015
|
|
—
|
|
—
|
|
4,015
|
|
|||||||||
|
Investment in subsidiaries
|
603,208
|
|
54,792
|
|
—
|
|
(658,000
|
)
|
—
|
|
|||||||||
|
$
|
622,766
|
|
$
|
843,364
|
|
$
|
81,642
|
|
$
|
(658,000
|
)
|
$
|
889,772
|
|
|||||
|
Liabilities and Shareholders’ Equity
|
|||||||||||||||||||
|
Current liabilities:
|
|||||||||||||||||||
|
Accounts payable
|
$
|
—
|
|
$
|
81,551
|
|
$
|
7,653
|
|
$
|
—
|
|
$
|
89,204
|
|
||||
|
Accrued expenses
|
5,127
|
|
55,363
|
|
7,115
|
|
—
|
|
67,605
|
|
|||||||||
|
Billings in excess of cost
|
—
|
|
20,548
|
|
7,638
|
|
—
|
|
28,186
|
|
|||||||||
|
Current maturities of long-term debt
|
—
|
|
400
|
|
—
|
|
—
|
|
400
|
|
|||||||||
|
Total current liabilities
|
5,127
|
|
157,862
|
|
22,406
|
|
—
|
|
185,395
|
|
|||||||||
|
Long-term debt
|
207,553
|
|
1,329
|
|
—
|
|
—
|
|
208,882
|
|
|||||||||
|
Deferred income taxes
|
—
|
|
38,763
|
|
3,891
|
|
—
|
|
42,654
|
|
|||||||||
|
Other non-current liabilities
|
—
|
|
42,202
|
|
553
|
|
—
|
|
42,755
|
|
|||||||||
|
Shareholders’ equity
|
410,086
|
|
603,208
|
|
54,792
|
|
(658,000
|
)
|
410,086
|
|
|||||||||
|
$
|
622,766
|
|
$
|
843,364
|
|
$
|
81,642
|
|
$
|
(658,000
|
)
|
$
|
889,772
|
|
|||||
86
GIBRALTAR INDUSTRIES, INC.
CONSOLIDATING BALANCE SHEETS
DECEMBER 31, 2014
(in thousands)
|
Gibraltar
Industries, Inc.
|
Guarantor
Subsidiaries
|
Non-Guarantor
Subsidiaries
|
Eliminations
|
Total
|
|||||||||||||||
|
Assets
|
|||||||||||||||||||
|
Current assets:
|
|||||||||||||||||||
|
Cash and cash equivalents
|
$
|
—
|
|
$
|
91,466
|
|
$
|
19,144
|
|
$
|
—
|
|
$
|
110,610
|
|
||||
|
Accounts receivable, net
|
—
|
|
91,713
|
|
9,428
|
|
—
|
|
101,141
|
|
|||||||||
|
Intercompany balances
|
21,619
|
|
(1,850
|
)
|
(19,769
|
)
|
—
|
|
—
|
|
|||||||||
|
Inventories
|
—
|
|
120,091
|
|
8,652
|
|
—
|
|
128,743
|
|
|||||||||
|
Other current assets
|
4,484
|
|
14,488
|
|
965
|
|
—
|
|
19,937
|
|
|||||||||
|
Total current assets
|
26,103
|
|
315,908
|
|
18,420
|
|
—
|
|
360,431
|
|
|||||||||
|
Property, plant, and equipment, net
|
—
|
|
116,628
|
|
12,947
|
|
—
|
|
129,575
|
|
|||||||||
|
Goodwill
|
—
|
|
229,558
|
|
6,486
|
|
—
|
|
236,044
|
|
|||||||||
|
Acquired intangibles
|
—
|
|
77,259
|
|
4,956
|
|
—
|
|
82,215
|
|
|||||||||
|
Other assets
|
—
|
|
2,206
|
|
—
|
|
—
|
|
2,206
|
|
|||||||||
|
Investment in subsidiaries
|
573,664
|
|
32,404
|
|
—
|
|
(606,068
|
)
|
—
|
|
|||||||||
|
$
|
599,767
|
|
$
|
773,963
|
|
$
|
42,809
|
|
$
|
(606,068
|
)
|
$
|
810,471
|
|
|||||
|
Liabilities and Shareholders’ Equity
|
|||||||||||||||||||
|
Current liabilities:
|
|||||||||||||||||||
|
Accounts payable
|
$
|
—
|
|
$
|
74,751
|
|
$
|
6,495
|
|
$
|
—
|
|
$
|
81,246
|
|
||||
|
Accrued expenses
|
5,469
|
|
45,561
|
|
1,409
|
|
—
|
|
52,439
|
|
|||||||||
|
Current maturities of long-term debt
|
—
|
|
400
|
|
—
|
|
—
|
|
400
|
|
|||||||||
|
Total current liabilities
|
5,469
|
|
120,712
|
|
7,904
|
|
—
|
|
134,085
|
|
|||||||||
|
Long-term debt
|
207,069
|
|
2,442
|
|
—
|
|
—
|
|
209,511
|
|
|||||||||
|
Deferred income taxes
|
—
|
|
47,717
|
|
2,055
|
|
—
|
|
49,772
|
|
|||||||||
|
Other non-current liabilities
|
—
|
|
29,428
|
|
446
|
|
—
|
|
29,874
|
|
|||||||||
|
Shareholders’ equity
|
387,229
|
|
573,664
|
|
32,404
|
|
(606,068
|
)
|
387,229
|
|
|||||||||
|
$
|
599,767
|
|
$
|
773,963
|
|
$
|
42,809
|
|
$
|
(606,068
|
)
|
$
|
810,471
|
|
|||||
87
GIBRALTAR INDUSTRIES, INC.
CONDENSED CONSOLIDATING STATEMENTS OF CASH FLOWS
DECEMBER 31, 2015
(in thousands)
|
Gibraltar
Industries,
Inc.
|
Guarantor
Subsidiaries
|
Non-Guarantor
Subsidiaries
|
Eliminations
|
Total
|
|||||||||||||||
|
Cash Flows from Operating Activities
|
|||||||||||||||||||
|
Net cash (used in) provided by operating activities
|
$
|
(13,309
|
)
|
|
$
|
94,440
|
|
$
|
5,553
|
|
$
|
—
|
|
$
|
86,684
|
|
|||
|
Cash Flows from Investing Activities
|
|||||||||||||||||||
|
Purchases of property, plant, and equipment
|
—
|
|
(11,754
|
)
|
(619
|
)
|
—
|
|
(12,373
|
)
|
|||||||||
|
Cash paid for acquisitions, net of cash acquired
|
—
|
|
(114,145
|
)
|
(26,476
|
)
|
—
|
|
(140,621
|
)
|
|||||||||
|
Net proceeds from sale of property and equipment
|
—
|
|
26,500
|
|
—
|
|
—
|
|
26,500
|
|
|||||||||
|
Other, net
|
—
|
|
1,154
|
|
—
|
|
—
|
|
1,154
|
|
|||||||||
|
Net cash used in investing activities
|
—
|
|
(98,245
|
)
|
(27,095
|
)
|
—
|
|
(125,340
|
)
|
|||||||||
|
Cash Flows from Financing Activities
|
|||||||||||||||||||
|
Long-term debt payments
|
—
|
|
(73,642
|
)
|
—
|
|
—
|
|
(73,642
|
)
|
|||||||||
|
Proceeds from long-term debt
|
—
|
|
73,242
|
|
—
|
|
—
|
|
73,242
|
|
|||||||||
|
Payment of debt issuance costs
|
—
|
|
(1,166
|
)
|
—
|
|
—
|
|
(1,166
|
)
|
|||||||||
|
Purchase of treasury stock at market prices
|
(956
|
)
|
—
|
|
—
|
|
—
|
|
(956
|
)
|
|||||||||
|
Intercompany financing
|
11,927
|
|
(46,498
|
)
|
34,571
|
|
—
|
|
—
|
|
|||||||||
|
Excess tax benefit from stock compensation
|
537
|
|
—
|
|
—
|
|
—
|
|
537
|
|
|||||||||
|
Net proceeds from issuance of common stock
|
1,801
|
|
—
|
|
—
|
|
—
|
|
1,801
|
|
|||||||||
|
Net cash provided by (used in) financing activities
|
13,309
|
|
(48,064
|
)
|
34,571
|
|
—
|
|
(184
|
)
|
|||||||||
|
Effect of exchange rate changes on cash
|
—
|
|
—
|
|
(2,912
|
)
|
—
|
|
(2,912
|
)
|
|||||||||
|
Net (decrease) increase in cash and cash equivalents
|
—
|
|
(51,869
|
)
|
10,117
|
|
—
|
|
(41,752
|
)
|
|||||||||
|
Cash and cash equivalents at beginning of year
|
—
|
|
91,466
|
|
19,144
|
|
—
|
|
110,610
|
|
|||||||||
|
Cash and cash equivalents at end of year
|
$
|
—
|
|
$
|
39,597
|
|
$
|
29,261
|
|
$
|
—
|
|
$
|
68,858
|
|
||||
88
GIBRALTAR INDUSTRIES, INC.
CONDENSED CONSOLIDATING STATEMENTS OF CASH FLOWS
DECEMBER 31, 2014
(in thousands)
|
Gibraltar
Industries,
Inc.
|
Guarantor
Subsidiaries
|
Non-Guarantor
Subsidiaries
|
Eliminations
|
Total
|
|||||||||||||||
|
Cash Flows from Operating Activities
|
|||||||||||||||||||
|
Net cash (used in) provided by operating activities of continuing operations
|
$
|
(13,437
|
)
|
$
|
40,820
|
|
$
|
5,200
|
|
$
|
—
|
|
$
|
32,583
|
|
||||
|
Net cash used in operating activities of discontinued operations
|
—
|
|
(41
|
)
|
—
|
|
—
|
|
(41
|
)
|
|||||||||
|
Net cash (used in) provided by operating activities
|
(13,437
|
)
|
40,779
|
|
5,200
|
|
—
|
|
32,542
|
|
|||||||||
|
Cash Flows from Investing Activities
|
|||||||||||||||||||
|
Other investing activities
|
—
|
|
277
|
|
—
|
|
—
|
|
277
|
|
|||||||||
|
Purchases of property, plant, and equipment
|
—
|
|
(19,286
|
)
|
(4,005
|
)
|
—
|
|
(23,291
|
)
|
|||||||||
|
Net proceeds from sale of property and equipment
|
—
|
|
5,989
|
|
3
|
|
—
|
|
5,992
|
|
|||||||||
|
Net cash used in investing activities
|
—
|
|
(13,020
|
)
|
(4,002
|
)
|
—
|
|
(17,022
|
)
|
|||||||||
|
Cash Flows from Financing Activities
|
|||||||||||||||||||
|
Long-term debt payments
|
—
|
|
(407
|
)
|
—
|
|
—
|
|
(407
|
)
|
|||||||||
|
Payment of debt issuance costs
|
—
|
|
(35
|
)
|
—
|
|
—
|
|
(35
|
)
|
|||||||||
|
Purchase of treasury stock at market prices
|
(575
|
)
|
—
|
|
—
|
|
—
|
|
(575
|
)
|
|||||||||
|
Intercompany financing
|
13,317
|
|
(11,707
|
)
|
(1,610
|
)
|
—
|
|
—
|
|
|||||||||
|
Tax benefit from equity compensation
|
100
|
|
—
|
|
—
|
|
—
|
|
100
|
|
|||||||||
|
Net proceeds from issuance of common stock
|
595
|
|
—
|
|
—
|
|
—
|
|
595
|
|
|||||||||
|
Net cash provided by (used in) financing activities
|
13,437
|
|
(12,149
|
)
|
(1,610
|
)
|
—
|
|
(322
|
)
|
|||||||||
|
Effect of exchange rate changes on cash
|
—
|
|
—
|
|
(1,627
|
)
|
—
|
|
(1,627
|
)
|
|||||||||
|
Net increase (decrease) in cash and cash equivalents
|
—
|
|
15,610
|
|
(2,039
|
)
|
—
|
|
13,571
|
|
|||||||||
|
Cash and cash equivalents at beginning of year
|
—
|
|
75,856
|
|
21,183
|
|
—
|
|
97,039
|
|
|||||||||
|
Cash and cash equivalents at end of year
|
$
|
—
|
|
$
|
91,466
|
|
$
|
19,144
|
|
$
|
—
|
|
$
|
110,610
|
|
||||
89
GIBRALTAR INDUSTRIES, INC.
CONDENSED CONSOLIDATING STATEMENTS OF CASH FLOWS
DECEMBER 31, 2013
(in thousands)
|
Gibraltar
Industries, Inc.
|
Guarantor
Subsidiaries
|
Non-Guarantor
Subsidiaries
|
Eliminations
|
Total
|
|||||||||||||||
|
Cash Flows from Operating Activities
|
|||||||||||||||||||
|
Net cash (used in) provided by operating activities of continuing operations
|
$
|
(9,023
|
)
|
$
|
64,994
|
|
$
|
4,333
|
|
$
|
—
|
|
$
|
60,304
|
|
||||
|
Net cash used in operating activities of discontinued operations
|
—
|
|
(9
|
)
|
—
|
|
—
|
|
(9
|
)
|
|||||||||
|
Net cash (used in) provided by operating activities
|
(9,023
|
)
|
64,985
|
|
4,333
|
|
—
|
|
60,295
|
|
|||||||||
|
Cash Flows from Investing Activities
|
|||||||||||||||||||
|
Cash paid for acquisitions, net of cash acquired
|
—
|
|
(5,536
|
)
|
—
|
|
—
|
|
(5,536
|
)
|
|||||||||
|
Purchases of property, plant, and equipment
|
—
|
|
(11,719
|
)
|
(3,221
|
)
|
—
|
|
(14,940
|
)
|
|||||||||
|
Net proceeds from sale of property and equipment
|
—
|
|
12,592
|
|
18
|
|
—
|
|
12,610
|
|
|||||||||
|
Net cash used in investing activities
|
—
|
|
(4,663
|
)
|
(3,203
|
)
|
—
|
|
(7,866
|
)
|
|||||||||
|
Cash Flows from Financing Activities
|
|||||||||||||||||||
|
Long-term debt payments
|
(204,000
|
)
|
(1,094
|
)
|
—
|
|
—
|
|
(205,094
|
)
|
|||||||||
|
Proceeds from long-term debt
|
210,000
|
|
—
|
|
—
|
|
—
|
|
210,000
|
|
|||||||||
|
Payment of debt issuance costs
|
(3,858
|
)
|
(41
|
)
|
—
|
|
—
|
|
(3,899
|
)
|
|||||||||
|
Payment of note redemption fees
|
(3,702
|
)
|
—
|
|
—
|
|
—
|
|
(3,702
|
)
|
|||||||||
|
Purchase of treasury stock at market prices
|
(714
|
)
|
—
|
|
—
|
|
—
|
|
(714
|
)
|
|||||||||
|
Intercompany financing
|
10,577
|
|
(9,494
|
)
|
(1,083
|
)
|
—
|
|
—
|
|
|||||||||
|
Tax benefit from equity compensation
|
72
|
|
—
|
|
—
|
|
—
|
|
72
|
|
|||||||||
|
Net proceeds from issuance of common stock
|
648
|
|
—
|
|
—
|
|
—
|
|
648
|
|
|||||||||
|
Net cash provided by (used in) financing activities
|
9,023
|
|
(10,629
|
)
|
(1,083
|
)
|
—
|
|
(2,689
|
)
|
|||||||||
|
Effect of exchange rate changes on cash
|
—
|
|
—
|
|
(729
|
)
|
—
|
|
(729
|
)
|
|||||||||
|
Net increase (decrease) in cash and cash equivalents
|
—
|
|
49,693
|
|
(682
|
)
|
—
|
|
49,011
|
|
|||||||||
|
Cash and cash equivalents at beginning of year
|
—
|
|
26,163
|
|
21,865
|
|
—
|
|
48,028
|
|
|||||||||
|
Cash and cash equivalents at end of year
|
$
|
—
|
|
$
|
75,856
|
|
$
|
21,183
|
|
$
|
—
|
|
$
|
97,039
|
|
||||
90
23. QUARTERLY UNAUDITED FINANCIAL DATA
GIBRALTAR INDUSTRIES, INC.
QUARTERLY UNAUDITED FINANCIAL DATA
(in thousands, except per share data)
|
|
2015 Quarters Ended
|
||||||||||||||||||
|
|
March 31
|
June 30
|
Sept. 30
|
Dec. 31
|
Total
|
||||||||||||||
|
Net sales
|
$
|
200,615
|
|
$
|
253,171
|
|
$
|
304,994
|
|
$
|
282,093
|
|
$
|
1,040,873
|
|
||||
|
Gross profit
|
$
|
29,915
|
|
$
|
44,119
|
|
$
|
61,396
|
|
$
|
51,546
|
|
$
|
186,976
|
|
||||
|
Income from operations
|
$
|
8,970
|
|
$
|
11,201
|
|
$
|
23,394
|
|
$
|
4,520
|
|
$
|
48,085
|
|
||||
|
Interest expense
|
$
|
3,700
|
|
$
|
3,811
|
|
$
|
3,878
|
|
$
|
3,614
|
|
$
|
15,003
|
|
||||
|
Income from continuing operations
|
$
|
5,537
|
|
$
|
4,087
|
|
$
|
13,632
|
|
$
|
220
|
|
$
|
23,476
|
|
||||
|
Loss from discontinued operations
|
$
|
(28
|
)
|
$
|
—
|
|
$
|
—
|
|
$
|
—
|
|
$
|
(28
|
)
|
||||
|
Net income
|
$
|
5,509
|
|
$
|
4,087
|
|
$
|
13,632
|
|
$
|
220
|
|
$
|
23,448
|
|
||||
|
Income per share from continuing operations:
|
|||||||||||||||||||
|
Basic
|
$
|
0.18
|
|
$
|
0.13
|
|
$
|
0.44
|
|
$
|
0.01
|
|
$
|
0.75
|
|
||||
|
Diluted
|
$
|
0.18
|
|
$
|
0.13
|
|
$
|
0.43
|
|
$
|
0.01
|
|
$
|
0.74
|
|
||||
|
Loss per share from discontinued operations:
|
|||||||||||||||||||
|
Basic
|
$
|
—
|
|
$
|
—
|
|
$
|
—
|
|
$
|
—
|
|
$
|
—
|
|
||||
|
Diluted
|
$
|
—
|
|
$
|
—
|
|
$
|
—
|
|
$
|
—
|
|
$
|
—
|
|
||||
|
|
2014 Quarters Ended
|
||||||||||||||||||
|
|
March 31
|
June 30
|
Sept. 30
|
Dec. 31
|
Total
|
||||||||||||||
|
Net sales
|
$
|
191,032
|
|
$
|
234,960
|
|
$
|
234,101
|
|
$
|
201,994
|
|
$
|
862,087
|
|
||||
|
Gross profit
|
$
|
29,864
|
|
$
|
40,123
|
|
$
|
41,578
|
|
$
|
28,480
|
|
$
|
140,045
|
|
||||
|
Income (loss) from operations
|
$
|
333
|
|
$
|
14,730
|
|
$
|
18,392
|
|
$
|
(103,872
|
)
|
$
|
(70,417
|
)
|
||||
|
Interest expense
|
$
|
3,640
|
|
$
|
3,691
|
|
$
|
3,657
|
|
$
|
3,433
|
|
$
|
14,421
|
|
||||
|
(Loss) income from continuing operations
|
$
|
(2,086
|
)
|
$
|
6,431
|
|
$
|
9,571
|
|
$
|
(95,708
|
)
|
$
|
(81,792
|
)
|
||||
|
Loss from discontinued operations
|
$
|
—
|
|
$
|
—
|
|
$
|
(31
|
)
|
$
|
(1
|
)
|
$
|
(32
|
)
|
||||
|
Net (loss) income
|
$
|
(2,086
|
)
|
$
|
6,431
|
|
$
|
9,540
|
|
$
|
(95,709
|
)
|
$
|
(81,824
|
)
|
||||
|
(Loss) income per share from continuing operations:
|
|||||||||||||||||||
|
Basic
|
$
|
(0.07
|
)
|
$
|
0.21
|
|
$
|
0.31
|
|
$
|
(3.08
|
)
|
$
|
(2.63
|
)
|
||||
|
Diluted
|
$
|
(0.07
|
)
|
$
|
0.21
|
|
$
|
0.31
|
|
$
|
(3.08
|
)
|
$
|
(2.63
|
)
|
||||
|
Loss per share from discontinued operations:
|
|||||||||||||||||||
|
Basic
|
$
|
—
|
|
$
|
—
|
|
$
|
(0.01
|
)
|
$
|
—
|
|
$
|
—
|
|
||||
|
Diluted
|
$
|
—
|
|
$
|
—
|
|
$
|
(0.01
|
)
|
$
|
—
|
|
$
|
—
|
|
||||
91
|
Item 9.
|
Changes in and Disagreements with Accountants on Accounting and Financial Disclosure
|
Not applicable.
|
Item 9A.
|
Controls and Procedures
|
Evaluation of Disclosure Controls and Procedures
The Company maintains a system of disclosure controls and procedures (as defined in Rule 13a-15(e) and 15d-15(e) under the Securities Exchange Act of 1934). The Company’s Chief Executive Officer and the Chief Financial Officer evaluated the effectiveness of the Company’s disclosure controls as of the end of the period covered in this report. Based upon that evaluation and the definition of disclosure controls and procedures contained in Rule 13a-15(e) and 15d-15(e) under the Securities Exchange Act of 1934, the Company’s Chief Executive Officer, and Chief Financial Officer have concluded that as of the end of such period the Company’s disclosure controls and procedures were effective.
Management’s Annual Report on Internal Control Over Financial Reporting
The management of Gibraltar Industries, Inc. is responsible for establishing and maintaining adequate internal control over financial reporting for the Company, as such term is defined in Rule 13a-15(f) under the Securities Exchange Act of 1934. Under the supervision and with the participation of management, including the Company’s Chief Executive Officer and the Chief Financial Officer, the Company conducted an evaluation of the effectiveness of internal control over financial reporting based on the framework in
Internal Control – Integrated Framework
issued by the Committee of Sponsoring Organizations of the Treadway Commission
(2013 framework
)
. Based on the Company’s evaluation, management concluded that the Company’s internal control over financial reporting was effective as of
December 31, 2015
.
The Company completed the acquisition of RBI in 2015, which was excluded from management's annual report on internal control over financial reporting as of
December 31, 2015
. The Company acquired the outstanding stock of RBI on June 9, 2015 and its results have been included in our 2015 consolidated financial statements. Total and net assets constituted $215.2 million and $157.9 million, respectively, as of
December 31, 2015
and net sales and net income constituted $188.5 million and $10.1 million, respectively, for the year then ended.
The effectiveness of the Company’s internal control over financial reporting as of
December 31, 2015
has been audited by Ernst & Young LLP, an independent registered public accounting firm, as stated in their report which is included below in this Item 9A of this Annual Report on Form 10-K.
Changes in Internal Control over Financial Reporting
There have been no changes in the Company’s internal control over financial reporting (as defined by Rule 13a-15(f)) that occurred during the three months ended
December 31, 2015
that have materially affected the Company’s internal control over financial reporting.
Effective during our first quarter of 2015, we are utilizing the 2013 version of the Internal Control - Integrated Framework issued by the Committee of Sponsoring Organizations of the Treadway Commission.
92
Report of Independent Registered Public Accounting Firm
The Board of Directors and Shareholders of Gibraltar Industries, Inc.
We have audited Gibraltar Industries, Inc.’s internal control over financial reporting as of December 31, 2015, based on criteria established in Internal Control - Integrated Framework issued by the Committee of Sponsoring Organizations of the Treadway Commission (2013 framework) (the COSO criteria). Gibraltar Industries, Inc.’s management is responsible for maintaining effective internal control over financial reporting, and for its assessment of the effectiveness of internal control over financial reporting included in the accompanying Management’s Annual Report on Internal Control Over Financial Reporting. Our responsibility is to express an opinion on the company’s internal control over financial reporting based on our audit.
We conducted our audit in accordance with the standards of the Public Company Accounting Oversight Board (United States). Those standards require that we plan and perform the audit to obtain reasonable assurance about whether effective internal control over financial reporting was maintained in all material respects. Our audit included obtaining an understanding of internal control over financial reporting, assessing the risk that a material weakness exists, testing and evaluating the design and operating effectiveness of internal control based on the assessed risk, and performing such other procedures as we considered necessary in the circumstances. We believe that our audit provides a reasonable basis for our opinion.
A company’s internal control over financial reporting is a process designed to provide reasonable assurance regarding the reliability of financial reporting and the preparation of financial statements for external purposes in accordance with generally accepted accounting principles. A company’s internal control over financial reporting includes those policies and procedures that (1) pertain to the maintenance of records that, in reasonable detail, accurately and fairly reflect the transactions and dispositions of the assets of the company; (2) provide reasonable assurance that transactions are recorded as necessary to permit preparation of financial statements in accordance with generally accepted accounting principles, and that receipts and expenditures of the company are being made only in accordance with authorizations of management and directors of the company; and (3) provide reasonable assurance regarding prevention or timely detection of unauthorized acquisition, use, or disposition of the company’s assets that could have a material effect on the financial statements.
Because of its inherent limitations, internal control over financial reporting may not prevent or detect misstatements. Also, projections of any evaluation of effectiveness to future periods are subject to risk that controls may become inadequate because of changes in conditions or that the degree of compliance with the policies or procedures may deteriorate.
As indicated in the accompanying Management's Annual Report on Internal Control Over Financial Reporting, management's assessment of and conclusion on the effectiveness of internal control over financial reporting did not include the internal controls of Rough Brothers Manufacturing, Inc., RBI Solar, Inc., and affiliates, collectively known as "RBI", which is included in the 2015 consolidated financial statements of Gibraltar Industries, Inc. and constituted $215.2 million and $157.9 million of total and net assets, respectively, as of December 31, 2015 and $188.5 million and $10.1 million of net sales and net income, respectively, for the year then ended. Our audit of internal control over financial reporting of Gibraltar Industries, Inc. also did not include an evaluation of the internal control over financial reporting of RBI.
In our opinion, Gibraltar Industries, Inc. maintained, in all material respects, effective internal control over financial reporting as of December 31, 2015, based on the COSO criteria.
We have also audited, in accordance with the standards of the Public Company Accounting Oversight Board (United States), the consolidated balance sheets of Gibraltar Industries, Inc. as of December 31, 2015 and 2014, and the related consolidated statement of operations, comprehensive income, shareholders’ equity and cash flows for each of the three years in the period ended December 31, 2015 of Gibraltar Industries, Inc. and our report dated February 18, 2016 expressed an unqualified opinion thereon.
/s/ Ernst & Young LLP
Buffalo, New York
February 18, 2016
93
|
Item 10.
|
Directors, Executive Officers, and Corporate Governance
|
Information regarding directors and executive officers of the Company, as well as the required disclosures with respect to the Company’s audit committee financial expert, is incorporated herein by reference to the information included in the Company’s
2016
Proxy Statement which will be filed with the Commission within 120 days after the end of the Company’s
2015
fiscal year.
The Company has adopted a Code of Ethics that applies to the President and Chief Executive Officer, Senior Vice President and Chief Financial Officer, and other senior financial officers and executives of the Company. The complete text of this Code of Ethics is available in the corporate governance section of our website at www.gibraltar1.com. The Company does not intend to incorporate the contents of our website into this Annual Report on Form 10-K.
|
Item 11.
|
Executive Compensation
|
Information regarding executive compensation is incorporated herein by reference to the information included in the Company’s
2016
Proxy Statement which will be filed with the Commission within 120 days after the end of the Company’s
2015
fiscal year.
|
Item 12.
|
Security Ownership of Certain Beneficial Owners and Management and Related Stockholder Matters
|
Information regarding security ownership of certain beneficial owners and management is incorporated herein by reference to the information included in the Company’s
2016
Proxy Statement which will be filed with the Commission within 120 days after the end of the Company’s
2015
fiscal year.
|
Item 13.
|
Certain Relationships and Related Transactions and Director Independence
|
Information regarding certain relationships and related transactions is incorporated herein by reference to the information included in the Company’s
2016
Proxy Statement which will be filed with the Commission within 120 days after the end of the Company’s
2015
fiscal year.
|
Item 14.
|
Principal Accounting Fees and Services
|
Information regarding principal accounting fees and services is incorporated herein by reference to the information included in the Company’s
2016
Proxy Statement which will be filed with the Commission within 120 days after the end of the Company’s
2015
fiscal year.
94
|
Item 15.
|
Exhibits and Financial Statement Schedules
|
|
(a)
|
Documents filed as part of this report:
|
||||
|
(1)
|
The following financial statements are included:
|
||||
|
(i)
|
Report of Independent Registered Public Accounting Firm
|
||||
|
(ii)
|
Consolidated Statements of Operations for the Years Ended December 31, 2015, 2014, and 2013
|
||||
|
(iii)
|
Consolidated Statements of Comprehensive Income for the Years Ended December 31, 2015, 2014, and 2013
|
||||
|
(iv)
|
Consolidated Balance Sheets as of December 31, 2015 and 2014
|
||||
|
(v)
|
Consolidated Statements of Cash Flows for the Years Ended December 31, 2015, 2014, and 2013
|
||||
|
(vi)
|
Consolidated Statements of Shareholders’ Equity and Comprehensive Income for the Years Ended December 31, 2015, 2014, and 2013
|
||||
|
(vii)
|
Notes to Consolidated Financial Statements
|
||||
|
(2)
|
The following Financial Statement Schedules for the years ended December 31, 2015, 2014, and 2013 are included in this Annual Report on Form 10-K:
|
||||
|
(i)
|
Quarterly Unaudited Financial Data (included in notes to consolidated financial statements)
|
||||
|
Schedules other than those listed above are omitted because the conditions requiring their filing do not exist, or because the required information is provided in the consolidated financial statements, including the notes thereto.
|
|||||
|
(3)
|
Exhibits: the index of exhibits to this Annual Report on Form 10-K included herein is set forth on the attached Exhibit Index beginning on page 98.
|
||||
|
(b)
|
Other Information:
|
||||
|
Not applicable
|
|||||
95
SIGNATURES
Pursuant to the requirements of Section 13 or 15(d) of the Securities and Exchange Act of 1934, the Registrant has duly caused this report to be signed on its behalf by the undersigned, thereunto duly authorized.
|
GIBRALTAR INDUSTRIES, INC.
|
|||
|
By
|
|
/s/ Frank G. Heard
|
|
|
|
Frank G. Heard
|
||
|
|
President and
Chief Executive Officer
|
||
|
|
Dated: February 18, 2016
|
||
In accordance with the Securities and Exchange Act of 1934, this report has been signed below by the following persons on behalf of the Registrant and in the capacities and on the dates indicated.
|
SIGNATURE
|
|
TITLE
|
|
DATE
|
|
/s/ Frank G. Heard
|
|
President, Chief Executive Officer (principal executive officer) and Director
|
|
February 18, 2016
|
|
Frank G. Heard
|
|
|
||
|
/s/ Kenneth W. Smith
|
|
Senior Vice President and Chief Financial Officer (principal financial and accounting officer)
|
|
February 18, 2016
|
|
Kenneth W. Smith
|
|
|
||
|
/s/ William P. Montague
|
Chairman of the Board
|
February 18, 2016
|
||
|
William P. Montague
|
||||
|
/s/ Sharon M. Brady
|
|
Director
|
|
February 18, 2016
|
|
Sharon M. Brady
|
|
|
||
|
/s/ William J. Colombo
|
|
Director
|
|
February 18, 2016
|
|
William J. Colombo
|
|
|
||
|
/s/ Jane L. Corwin
|
|
Director
|
|
February 18, 2016
|
|
Jane L. Corwin
|
|
|
||
|
/s/ Craig A. Hindman
|
Director
|
February 18, 2016
|
||
|
Craig A. Hindman
|
||||
|
/s/ Vinod M. Khilnani
|
|
Director
|
|
February 18, 2016
|
|
Vinod M. Khilnani
|
|
|
||
|
/s/ James B. Nish
|
|
Director
|
|
February 18, 2016
|
|
James B. Nish
|
|
|
||
96
Exhibit Index
|
Exhibit
Number
|
|
Exhibit
|
|
3.1
|
|
Certificate of Incorporation of registrant (incorporated by reference to Exhibit 3.1 to the Company’s Registration Statement on Form S-4 (Registration No. 333-135908)), as amended by Certificate of Amendment of Certificate of Incorporation of Gibraltar Industries, Inc. filed May 22, 2012 (incorporated by reference to Exhibit 3.1 of the Company’s Current Report on Form 8-K filed May 22, 2012), and further amended by Certification of Amendment of Certificate of Incorporation of Gibraltar Industries, Inc. filed on May 11, 2015 (incorporated by reference to Exhibit 3.1 of the Company's Current Report on Form 8-K filed May 12, 2015)
|
|
3.2
|
|
Amended and Restated By Laws of Gibraltar Industries, Inc. effective January 1, 2015 (incorporated by reference to Exhibit 3.1 to the Company’s Current Report on Form 8-K filed on January 5, 2015)
|
|
4.1
|
|
Specimen Common Share Certificate (incorporated by reference number to Exhibit 4.1 to the Company’s Registration Statement on Form S-1 (Registration No. 33-69304))
|
|
4.2
|
|
Indenture for 6.25% Notes dated as of January 31, 2013, among the Company, the Guarantors (as defined therein) and the Trustee (incorporated by reference to Exhibit 4.1 to the Company’s Current Report on Form 8-K filed on February 1, 2013).
|
|
10.1*
|
|
Amended and Restated Employment Agreement dated as of January 1, 2015 between the Registrant and Brian J. Lipke (incorporated by reference to Exhibit 10.1 to the Company’s Current Report on Form 8-K filed January 5, 2015)
|
|
10.2*
|
|
Employment Agreement dated as of May 9, 2014 between the Registrant and Frank G. Heard (incorporated by reference to Exhibit 10.1 to the Company’s Current Report on Form 8-K filed May 15, 2014), as amended by Employment Agreement, dated January 1, 2015 (incorporated by reference to Exhibit 10.2 to the Company’s Current Report on Form 8-K filed January 5, 2015)
|
|
10.3*
|
|
Amended and Restated Change in Control Agreement between the Company and Brian J. Lipke dated December 23, 2013 (incorporated by reference to Exhibit 10.1 to the Company’s Current Report on Form 8-K filed December 23, 2013)
|
|
10.4*
|
|
Change in Control Agreement between the Company and Frank G. Heard dated January 1, 2015 (incorporated by reference to Exhibit 10.3 to the Company’s Current Report on Form 8-K filed January 5, 2015)
|
|
10.5*
|
|
Change in Control Agreement between the Company and Kenneth W. Smith (incorporated by reference to Exhibit 10.3 to the Company’s Current Report on Form 8-K filed February 24, 2009)
|
|
10.6*
|
|
Change in Control Agreement between the Company and Paul M. Murray (incorporated by reference to Exhibit 10.5 to the Company’s Current Report on Form 8-K filed February 24 , 2009)
|
|
10.7*
|
|
Gibraltar 401(k) Plan Amendment and Restatement Effective October 1, 2004 as amended by the First, Second, and Third Amendments to the Amendment and Restatement Effective October 1, 2004 (incorporated by reference to Exhibit 10.19 to the Company’s Annual Report on Form 10-K for the year ended December 31, 2004)
|
|
10.8*
|
|
Gibraltar Deferred Compensation Plan Amended and Restated, effective January 1, 2009 (incorporated by reference to Exhibit 10.2 to the Company’s Current Report on Form 8-K filed February 24, 2009)
|
|
10.9*
|
|
Amended and Restated Gibraltar Industries, Inc. 2005 Equity Incentive Plan (incorporated by reference to Exhibit 10.1 to the Company’s Current Report on Form 8-K filed December 21, 2006), as amended by Second Amendment to Third Amendment and Restatement of Equity Incentive Plan, dated May 7, 2015 (incorporated by reference to Exhibit 10.2 to the Company’s Current Report on Form 8-K filed May 12, 2015)
|
97
|
10.10*
|
|
Fourth Amendment and Restatement of the Gibraltar Industries, Inc. Management Stock Purchase Plan, dated June 27, 2012 (incorporated by reference to Exhibit 10.1 to the Company’s Current Report on Form 8-K filed June 27, 2012), as amended by adding an Appendix Applicable to Canadian Residents, dated June 11, 2014 (incorporated by reference to Exhibit 10.1 to the Company's Current Report on Form 8-K filed June 17, 2014) and further amended by the First Amendment to the Fourth Amendment and Restatement of the Management Stock Purchase Plan dated May 7, 2015 (incorporated by reference to Exhibit 10.2 to the Company's Current Report of Form 8-K filed May 12, 2015).
|
|
10.11*
|
|
Gibraltar Industries, Inc. Omnibus Code Section 409A Compliance Policy, dated December 30, 2008 (incorporated by reference to Exhibit 10.3 to the Company’s Current Report on Form 8-K filed January 6, 2009)
|
|
10.12*
|
|
Summary Description of Annual Management Incentive Compensation Plan (incorporated by reference to Exhibit 10.1 to the Company’s Current Report on Form 8-K filed February 24, 2009)
|
|
10.13*
|
|
Gibraltar Industries, Inc. 2005 Equity Incentive Plan Form of Award of Restricted Units (Long Term Incentive) (incorporated by reference to Exhibit 99.2 to the Company’s Current Report on Form 8-K filed May 25, 2005)
|
|
10.14*
|
|
Gibraltar Industries, Inc. 2005 Equity Incentive Plan Form of Award of Non-Qualified Option (incorporated by reference to Exhibit 99.3 to the Company’s Current Report on Form 8-K filed May 25, 2005)
|
|
10.15*
|
|
Gibraltar Industries, Inc. 2005 Equity Incentive Plan Form of Award (Retirement) (incorporated by reference to Exhibit 10.1 of the Company’s Current Report on Form 8-K filed August 9, 2011)
|
|
10.16*
|
|
Gibraltar Industries, Inc. 2005 Equity Incentive Plan Form of Award of Performance Units (incorporated by reference to Exhibit 10.1 to the Company’s Current Report on Form 8-K filed January 6, 2012)
|
|
10.17*
|
|
Gibraltar Industries, Inc. 2005 Equity Incentive Plan Form of Award of Performance Units (incorporated by reference to Exhibit 10.1 to the Company’s Current Report on Form 8-K filed January 7, 2013)
|
|
10.18*
|
|
Gibraltar Industries, Inc. 2005 Equity Incentive Plan Form of Award of Performance Units (incorporated by reference to Exhibit 10.1 to the Company’s Current Report on Form 8-K filed January 6, 2014)
|
|
10.19*
|
Gibraltar Industries, Inc. 2005 Equity Incentive Plan Form of Award of Restricted Units dated January 2, 2014 (incorporated by reference to Exhibit 10.2 to the Company’s Current Report on Form 8-K filed January 6, 2014)
|
|
|
10.20*
|
|
Fifth Amended and Restated Credit Agreement dated December 9, 2015 among Gibraltar Industries, Inc. and Gibraltar Steel Corporation of New York, as borrowers, the lenders parties thereto, Key Bank National Association, as administrative agent, KeyBank Capital Markets Inc. as joint lead arranger, JPMorgan Chase Bank, N.A., as joint lead arranger, Bank of America, N.A., as co-documentation agent, M&T Bank, as co-documentation agent, Citizens Bank, N.A., as co-documentation agent, and PNC Bank, National Association, as co-documentation agent (incorporated by reference to Exhibit 10.1 of the Company’s Current Report on Form 8-K filed December 15, 2015)
|
|
10.21*
|
Gibraltar Industries, Inc. 2015 Equity Incentive Plan dated December 31, 2015 (incorporated by reference to Exhibit 10.4 to the Company's Current Report on Form 8-K filed January 7, 2016)
|
|
|
10.22*
|
Gibraltar Industries, Inc. 2015 Management Stock Purchase Plan dated May 7, 2015 (incorporated by reference to Exhibit 10.5 to the Company's Current Report on Form 8-K filed May 12, 2015), as amended by Management Stock Purchase Plan dated December 31, 2015 (incorporated by reference to Exhibit 10.5 to the Company's Current Report on Form 8-K filed January 7, 2016), and further amended by the Gibraltar Industries, Inc. Management Stock Purchase Plan Second Amendment dated January 28, 2016 (incorporated by reference to Exhibit 10.1 to the Company's Current Report on Form 8-K filed January 28, 2016)
|
|
|
10.23*
|
Gibraltar Industries, Inc. 2015 Equity Incentive Plan Form of Award of Restricted Stock dated May 7, 2015 (incorporated by reference to Exhibit 10.3 to the Company's Current Report on Form 8-K filed May 12, 2015)
|
|
98
|
10.24*
|
Gibraltar Industries, Inc. 2015 Equity Incentive Plan Form of Award of Performance Units dated December 31, 2015 (incorporated by reference to Exhibit 10.1 to the Company's Current Report on Form 8-K filed January 7, 2016)
|
|
|
10.25*
|
Gibraltar Industries, Inc. 2015 Equity Incentive Plan Form of Award of Non-Qualified Options dated December 31, 2015 (incorporated by reference to Exhibit 10.2 to the Company's Current Report on Form 8-K filed January 7, 2016)
|
|
|
10.26*
|
Gibraltar Industries, Inc. 2015 Equity Incentive Plan Form of Award of Restricted Units dated December 31, 2015 (incorporated by reference to Exhibit 10.3 to the Company's Current Report on Form 8-K filed January 7, 2016)
|
|
|
10.27
|
Stock Purchase Agreement among Gibraltar Industries, Inc., Sunlight US Co., Inc., Richard Reilly, Rough Brother Manufacturing, Inc., RBI Solar, Inc., and Delta T Solutions, Inc. dated June 9, 2015 (incorporated by reference to Exhibit 2.1 of the Company's Current Report on Form 8-K filed June 15, 2015).
|
|
99
|
Exhibit
Number
|
|
Exhibit
|
|
21
|
|
Subsidiaries of the Registrant
|
|
23.1
|
|
Consent of Independent Registered Public Accounting Firm
|
|
31.1
|
|
Certification of President and Chief Executive Officer pursuant to Section 302 of the Sarbanes-Oxley Act of 2002
|
|
31.2
|
|
Certification of Senior Vice President and Chief Financial Officer pursuant to Section 302 of the Sarbanes-Oxley Act of 2002
|
|
32.1
|
|
Certification of President and Chief Executive Officer pursuant to Title 18, United States Code, Section 1350, as adopted pursuant to Section 906 of the Sarbanes-Oxley Act of 2002
|
|
32.2
|
|
Certification of Senior Vice President and Chief Financial Officer pursuant to Title 18, United States Code, Section 1350, as adopted pursuant to Section 906 of the Sarbanes-Oxley Act of 2002
|
|
101.INS
|
|
XBRL Instance Document **
|
|
101.SCH
|
|
XBRL Taxonomy Extension Schema Document**
|
|
101.CAL
|
|
XBRL Taxonomy Extension Calculation Linkbase Document**
|
|
101.LAB
|
|
XBRL Taxonomy Extension Label Linkbase Document **
|
|
101.PRE
|
|
XBRL Taxonomy Extension Presentation Linkbase Document **
|
|
101.DEF
|
|
XBRL Taxonomy Extension Definition Linkbase Document **
|
|
*
|
Document is a management contract or compensatory plan or agreement.
|
|
**
|
Submitted electronically with this Annual Report on Form 10-K.
|
100
TABLE OF CONTENTS
Part IItem 1. BusinessItem 1A. Risk FactorsItem 1B. Unresolved Staff CommentsItem 2. PropertiesItem 3. Legal ProceedingsItem 4. Mine Safety DisclosuresPart IIItem 5. Market For Common Equity and Related Stockholder MattersItem 6. Selected Financial DataItem 7. Management S Discussion and Analysis Of Financial Condition and Results Of OperationsItem 7A. Quantitative and Qualitative Disclosures About Market RiskItem 8. Financial Statements and Supplementary DataItem 9. Changes in and Disagreements with Accountants on Accounting and Financial DisclosureItem 9A. Controls and ProceduresPart IIIItem 10. Directors, Executive Officers, and Corporate GovernanceItem 11. Executive CompensationItem 12. Security Ownership Of Certain Beneficial Owners and Management and Related Stockholder MattersItem 13. Certain Relationships and Related Transactions and Director IndependenceItem 14. Principal Accounting Fees and ServicesPart IVItem 15. Exhibits and Financial Statement Schedules