ROCKWELL AUTOMATION, INC
10-Ks and 10-Qs
|
|
|
|
|
|
|
|
|
|
|
|
|
|
|
|
|
|
|
|
|
|
|
|
|
|
|
|
|
|
|
|
|
|
|
|
|
|
|
|
|
|
|
|
|
|
|
|
|
|
|
|
|
UNITED STATES
SECURITIES AND EXCHANGE COMMISSION
Washington, D.C. 20549
____________
Form 10-K
ANNUAL REPORT PURSUANT TO SECTION 13 OR 15(d) OF
THE SECURITIES EXCHANGE ACT OF 1934
For the fiscal year ended
September 30, 2017
Commission file number 1-12383
Rockwell Automation, Inc.
(Exact name of registrant as specified in its charter)
|
Delaware
|
|
25-1797617
|
|
(State or other jurisdiction of
|
|
(I.R.S. Employer
|
|
incorporation or organization)
|
|
Identification No.)
|
|
1201 South 2
nd
Street
|
|
|
|
Milwaukee, Wisconsin
|
|
53204
|
|
(Address of principal executive offices)
|
|
(Zip Code)
|
Registrant’s telephone number, including area code:
+1 (414) 382-2000
Securities registered pursuant to Section 12(b) of the Act
:
|
Title of each class
|
|
Name of each exchange on which registered
|
|
Common Stock, $1 Par Value
|
|
New York Stock Exchange
|
Securities registered pursuant to Section 12(g) of the Act: None
Indicate by check mark if the registrant is a well-known seasoned issuer, as defined in Rule 405 of the Securities Act. Yes
☑
No
☐
Indicate by check mark if the registrant is not required to file reports pursuant to Section 13 or Section 15(d) of the Act. Yes
☐
No
☑
Indicate by check mark whether the registrant (1) has filed all reports required to be filed by Section 13 or 15(d) of the Securities Exchange Act of 1934 during the preceding 12 months (or for such shorter period that the registrant was required to file such reports), and (2) has been subject to such filing requirements for the past 90 days. Yes
☑
No
☐
Indicate by check mark whether the registrant has submitted electronically and posted on its corporate Web site, if any, every Interactive Data File required to be submitted and posted pursuant to Rule 405 of Regulation S-T during the preceding 12 months (or for such shorter period that the registrant was required to submit and post such files). Yes
☑
No
☐
Indicate by check mark if disclosure of delinquent filers pursuant to Item 405 of Regulation S-K is not contained herein, and will not be contained, to the best of registrant’s knowledge, in definitive proxy or information statements incorporated by reference in Part III of this Form 10-K or any amendment to this Form 10-K.
☐
Indicate by check mark whether the registrant is a large accelerated filer, an accelerated filer, a non-accelerated filer, smaller reporting company, or an emerging growth company. See definitions of “large accelerated filer,” “accelerated filer,” “smaller reporting company,” and “emerging growth company” in Rule 12b-2 of the Exchange Act. (Check one):
|
Large Accelerated Filer
|
☑
|
Accelerated Filer
|
☐
|
|||
|
Non-accelerated Filer
|
☐ (Do not check if smaller reporting company)
|
Smaller Reporting Company
|
☐
|
|||
|
Emerging Growth Company
|
☐
|
|||||
If an emerging growth company, indicate by check mark if the registrant has elected not to use the extended transition period for complying with any new or revised financial accounting standards provided pursuant to Section 13(a) of the Exchange Act. ☐
Indicate by check mark whether the registrant is a shell company (as defined in Rule 12b-2 of the Act). Yes
☐
No
☑
The aggregate market value of registrant’s voting stock held by non-affiliates of registrant on
March 31, 2017
was approximately
$19.9 billion
.
128,502,915
shares of registrant’s Common Stock, par value $1 per share, were outstanding on
October 31, 2017
.
DOCUMENTS INCORPORATED BY REFERENCE
Certain information contained in the Proxy Statement for the Annual Meeting of Shareowners of registrant to be held on
February 6, 2018
is incorporated by reference into Part III hereof.
FORWARD-LOOKING STATEMENTS
This Annual Report contains statements (including certain projections and business trends) that are “forward-looking statements” as defined in the Private Securities Litigation Reform Act of 1995. Words such as “believe”, “estimate”, “project”, “plan”, “expect”, “anticipate”, “will”, “intend” and other similar expressions may identify forward-looking statements. Actual results may differ materially from those projected as a result of certain risks and uncertainties, many of which are beyond our control, including but not limited to:
|
•
|
macroeconomic factors, including global and regional business conditions, the availability and cost of capital, commodity prices, the cyclical nature of our customers’ capital spending, sovereign debt concerns and currency exchange rates;
|
|
•
|
laws, regulations and governmental policies affecting our activities in the countries where we do business;
|
|
•
|
the successful development of advanced technologies and demand for and market acceptance of new and existing products;
|
|
•
|
the availability, effectiveness and security of our information technology systems;
|
|
•
|
competitive products, solutions and services and pricing pressures, and our ability to provide high quality products, solutions and services;
|
|
•
|
a disruption of our business due to natural disasters, pandemics, acts of war, strikes, terrorism, social unrest or other causes;
|
|
•
|
our ability to manage and mitigate the risk related to security vulnerabilities and breaches of our products, solutions and services;
|
|
•
|
intellectual property infringement claims by others and the ability to protect our intellectual property;
|
|
•
|
the uncertainty of claims by taxing authorities in the various jurisdictions where we do business;
|
|
•
|
our ability to attract, develop, and retain qualified personnel;
|
|
•
|
our ability to manage costs related to employee retirement and health care benefits;
|
|
•
|
the uncertainties of litigation, including liabilities related to the safety and security of the products, solutions and services we sell;
|
|
•
|
our ability to manage and mitigate the risks associated with our solutions and services businesses;
|
|
•
|
disruptions to our distribution channels or the failure of distributors to develop and maintain capabilities to sell our products;
|
|
•
|
the successful integration and management of acquired businesses and technologies;
|
|
•
|
the availability and price of components and materials;
|
|
•
|
the successful execution of our cost productivity initiatives; and
|
|
•
|
other risks and uncertainties, including but not limited to those detailed from time to time in our Securities and Exchange Commission (SEC) filings.
|
These forward-looking statements reflect our beliefs as of the date of filing this report. We undertake no obligation to update or revise any forward-looking statement, whether as a result of new information, future events or otherwise. See Item 1A.
Risk Factors
for more information.
Item 1.
Business
General
Rockwell Automation, Inc. (“Rockwell Automation” or the “Company”),
a leader in industrial automation and information, makes its customers more productive and the world more sustainable
. Our products, solutions and services are designed to meet our customers’ needs to reduce total cost of ownership, maximize asset utilization, improve time to market and reduce enterprise business risk.
The Company continues the business founded as the Allen-Bradley Company in 1903. The privately-owned Allen-Bradley Company was a leading North American manufacturer of industrial automation equipment when the former Rockwell International Corporation (RIC) purchased it in 1985.
The Company was incorporated in Delaware in connection with a tax-free reorganization completed on December 6, 1996, pursuant to which we divested our former aerospace and defense businesses (the A&D Business) to The Boeing Company (Boeing). In the reorganization, RIC contributed all of its businesses, other than the A&D Business, to the Company and distributed all capital stock of the Company to RIC’s shareowners. Boeing then acquired RIC.
2
As used herein, the terms “we”, “us”, “our”, “Rockwell Automation” or the “Company” include subsidiaries and predecessors unless the context indicates otherwise. Information included in this Annual Report on Form 10-K refers to our continuing businesses unless otherwise indicated.
Whenever an Item of this Annual Report on Form 10-K refers to information in our Proxy Statement for our Annual Meeting of Shareowners to be held on
February 6, 2018
(the Proxy Statement), or to information under specific captions in Item 7.
Management’s Discussion and Analysis of Financial Condition and Results of Operations
(MD&A), or in Item 8.
Financial Statements and Supplementary Data
(the Financial Statements), the information is incorporated in that Item by reference. All date references to years and quarters refer to our fiscal year and quarters unless otherwise stated.
Operating Segments
We have two operating segments: Architecture & Software and Control Products & Solutions. In
2017
, our total sales were
$6.3 billion
. Our Architecture & Software operating segment recorded sales of
$2.9 billion
(
46 percent
of our total sales) in
2017
. Our Control Products & Solutions operating segment recorded sales of
$3.4 billion
(
54 percent
of our total sales) in
2017
.
Our Architecture & Software operating segment is headquartered in Mayfield Heights, Ohio, and our Control Products & Solutions operating segment is headquartered in Milwaukee, Wisconsin. Both operating segments share a common sales organization and supply chain and conduct business globally. Major markets served by both segments consist of consumer industries, including food and beverage, home and personal care and life sciences; transportation, including automotive and tire; and heavy industries, including oil and gas, mining and metals.
Additional information with respect to our operating segments, including a description of our operating segments and their contributions to sales and operating earnings for each of the three years ended
September 30, 2017
,
2016
and
2015
is contained in Note 16 in the Financial Statements and under the caption
Results of Operations
in MD&A.
Geographic Information
In
2017
, sales to customers in the United States accounted for
55 percent
of our total sales. We do business in more than
80
countries around the world. The largest sales outside the United States on a country-of-destination basis are in China, Canada, Mexico, Italy, the United Kingdom, Germany and Brazil. See Item 1A.
Risk Factors
for a discussion of risks associated with our global operations. Sales and property information by major geographic area for each of the past three years is contained in Note 16 in the Financial Statements.
Competition
Our competitors range from large diversified corporations that also have business interests outside of industrial automation to smaller companies that specialize in niche industrial automation products, solutions and services. Factors that influence our competitive position include the breadth of our product portfolio and scope of solutions, technology differentiation, domain expertise, installed base, distribution network, quality of products, solutions and services, global presence and price. Major competitors of both segments include Siemens AG, ABB Ltd, Schneider Electric SA, Emerson Electric Co., Mitsubishi Electric Corp. and Honeywell International Inc.
Distribution
In most countries, we sell primarily through independent distributors in conjunction with our direct sales force. In other countries, we sell through a combination of our direct sales force and to a lesser extent, through independent distributors. Approximately
75 percent
of our global sales are through independent distributors. Sales to our largest distributor in
2017
,
2016
and
2015
were approximately
10 percent
of our total sales.
Research and Development
Our research and development spending for the years ended September 30,
2017
,
2016
and
2015
was
$348.2 million
,
$319.3 million
and
$307.3 million
, respectively. Customer-sponsored research and development was not significant in
2017
,
2016
or
2015
.
Employees
At
September 30, 2017
, we had
approximately
22,000
employees. Approximately
8,500
were employed in the United States.
3
Raw Materials
We purchase a wide range of equipment, components, finished products and materials used in our business. The raw materials essential to the manufacture of our products generally are available at competitive prices. We have a broad base of suppliers and subcontractors. We depend upon the ability of our suppliers and subcontractors to meet performance and quality specifications and delivery schedules. See Item 1A.
Risk Factors
for a discussion of risks associated with our reliance on third party suppliers.
Backlog
Our total order backlog consists of (in millions):
|
September 30,
|
||||||||
|
2017
|
2016
|
|||||||
|
Architecture & Software
|
$
|
205.1
|
|
$
|
185.8
|
|
||
|
Control Products & Solutions
|
1,091.6
|
|
1,024.6
|
|
||||
|
|
$
|
1,296.7
|
|
|
$
|
1,210.4
|
|
|
Backlog is not necessarily indicative of results of operations for future periods due to the short-cycle nature of most of our sales activities. Backlog orders scheduled beyond
2018
were approximately
$269 million
as of
September 30, 2017
.
Environmental Protection Requirements
Information about the effect of compliance with environmental protection requirements and resolution of environmental claims is contained in Note 15 in the Financial Statements. See Item 1A.
Risk Factors
for a discussion of risks associated with liabilities and costs related to environmental remediation.
Patents, Licenses and Trademarks
We own or license numerous patents and patent applications related to our products and operations. While in the aggregate our patents and licenses are important in the operation of our business, we do not believe that loss or termination of any one of them would materially affect our business or financial condition. Various claims of patent infringement and requests for patent indemnification have been made to us. We believe that none of these claims or requests will have a material adverse effect on our financial condition. See Item 1A.
Risk Factors
for a discussion of risks associated with our intellectual property.
The Company’s name and its registered trademark “Rockwell Automation
®
” and other trademarks such as “Allen-Bradley
®
”, “A-B
®
” and “PlantPAx Process Automation System
™
” are important to both of our business segments. In addition, we own other important trademarks that we use, such as “PowerFlex
®
” for our AC drives, and “Rockwell Software
®
” and “FactoryTalk
®
” for our software offerings.
Seasonality
Our business segments are not subject to significant seasonality. However, the calendarization of our results can vary and may be affected by the seasonal spending patterns of our customers due to their annual budgeting processes and their working schedules.
Available Information
We maintain a website at
http://www.rockwellautomation.com
. Our annual reports on Form 10-K, quarterly reports on Form 10-Q, current reports on Form 8-K and any amendments to such reports filed or furnished pursuant to Section 13(a) or 15(d) of the Securities Exchange Act of 1934 (the Exchange Act), as well as our annual reports to shareowners and Section 16 reports on Forms 3, 4 and 5, are available free of charge on this site through the “Investors” link as soon as reasonably practicable after we file or furnish these reports with the SEC. All reports we file with the SEC are also available free of charge via EDGAR through the SEC’s website at
http://www.sec.gov
. Our Guidelines on Corporate Governance and charters for our Board committees are also available on our website. The information contained on and linked from our website is not incorporated by reference into this Annual Report on Form 10-K.
4
Item 1A.
Risk Factors
In the ordinary course of our business, we face various strategic, operating, compliance and financial risks. These risks could have an impact on our business, financial condition, operating results and cash flows. Our most significant risks are set forth below and elsewhere in this Annual Report on Form 10-K.
Our Enterprise Risk Management (ERM) process seeks to identify and address significant risks. Our ERM process assesses, manages, and monitors risks consistent with the integrated risk framework in
Internal Control — Integrated Framework (2013)
issued by the Committee of Sponsoring Organizations of the Treadway Commission (COSO). We believe that risk-taking is an inherent aspect of the pursuit of our growth and performance strategy. Our goal is to manage risks prudently rather than avoid risks. We can mitigate risks and their impact on the Company only to a limited extent.
A team of senior executives prioritizes identified risks and assigns an executive to address each major identified risk area and lead action plans to manage risks. Our Board of Directors provides oversight of the ERM process and reviews significant identified risks. The Audit Committee of the Board of Directors also reviews significant financial risk exposures and the steps management has taken to monitor and manage them. Our other Board committees also play a role in risk management, as set forth in their respective charters.
Our goal is to proactively manage risks in a structured approach in conjunction with strategic planning, with the intent to preserve and enhance shareowner value. However, the risks set forth below and elsewhere in this Annual Report on Form 10-K and other risks and uncertainties could adversely affect us and cause our results to vary materially from recent results or from our anticipated future results.
Adverse changes in business or industry conditions and volatility and disruption of the capital and credit markets may result in decreases in our sales and profitability.
We are subject to macroeconomic cycles and when recessions occur, we may experience reduced orders, payment delays or defaults, supply chain disruptions or other factors as a result of the economic challenges faced by our customers, prospective customers and suppliers.
Demand for our products is sensitive to changes in levels of industrial production and the financial performance of major industries that we serve. As economic activity slows, credit markets tighten, or sovereign debt concerns arise, companies tend to reduce their levels of capital spending, which could result in decreased demand for our products.
Our ability to access the credit markets and the costs of borrowing are affected by the strength of our credit rating and current market conditions. If our access to credit, including the commercial paper market, is adversely affected by a change in market conditions or otherwise, our cost of borrowings may increase or our ability to fund operations may be reduced.
We sell to customers around the world and are subject to the risks of doing business in many countries.
We do business in more than
80
countries around the world. Approximately
45 percent
of our sales in
2017
were to customers outside the U.S. In addition, many of our manufacturing operations, suppliers and employees are located in many places around the world. The future success of our business depends in large part on growth in our sales in non-U.S. markets. Our global operations are subject to numerous financial, legal and operating risks, such as political and economic instability; prevalence of corruption in certain countries; enforcement of contract and intellectual property rights; and compliance with existing and future laws, regulations and policies, including those related to tariffs, investments, taxation, trade controls, product content and performance, employment and repatriation of earnings. In addition, we are affected by changes in foreign currency exchange rates, inflation rates and interest rates.
An inability to respond to changes in customer preferences could result in decreased demand for our products.
Our success depends in part on our ability to anticipate and offer products that appeal to the changing needs and preferences of our customers in the various markets we serve. Developing new products requires high levels of innovation, and the development process is often lengthy and costly. If we are not able to anticipate, identify, develop and market products that respond to changes in customer preferences, demand for our products could decline.
5
Failures or security breaches of our products, manufacturing environment, or information technology systems could have an adverse effect on our business.
We rely heavily on information technology (IT) in our products, solutions and services for customers, manufacturing environment, and in our enterprise IT infrastructure in order to achieve our business objectives. Despite the implementation of security measures, IT systems, including our corporate enterprise systems, manufacturing systems, and industrial control systems such as those we sell and service, are vulnerable to unauthorized access by nation states, hackers, cyber-criminals, malicious insiders and other actors who may engage in fraud, theft of confidential or proprietary information and sabotage. These systems are also vulnerable to malware (including ransomware), cyber attack, and other events, ranging from individual attempts to advanced persistent threats. Recent global cyber attacks have been perpetuated by compromising software updates in widely-used software products, increasing the risk of this potential threat. In some cases, these malware attacks were spread throughout the supply chain, moving from one company to the next via authorized network connections.
Our products, solutions and services are used by our direct and indirect customers in applications that may be subject to information theft, tampering or sabotage. Among other industries, our products, solutions and services are often employed in the control of critical infrastructure. Careless or malicious actors could cause a customer’s process to be disrupted or could cause equipment to operate in an improper manner that could result in harm to people or property. While we continue to improve the security attributes of our products, solutions and services, we can reduce risk, not eliminate it. To a significant extent, the security of our customers’ systems depends on how those systems are designed, installed, protected, configured, updated and monitored, much of which are typically outside our control.
Our business uses IT resources on a dispersed, global basis for a wide variety of functions including development, engineering, manufacturing, sales, accounting, and human resources. Our vendors, partners, employees and customers have access to, and share, information across multiple locations via various digital technologies. In addition, we rely on partners and vendors for a wide range of outsourced activities. Secure connectivity is important to these ongoing operations. Also, our partners and vendors frequently have access to our confidential information as well as confidential information about our customers, employees and others.
Our information security efforts, under the leadership of our Chief Information Security Officer and Chief Product Security Officer, with the support of the entire management team, include major programs designed to address security governance, product security, identification and protection of critical assets, insider risk, third-party risk, and cyber defense operations. We believe these measures reduce, but cannot eliminate, the risk of an information security incident.
Any significant security incidents could have an adverse impact on sales, harm our reputation and cause us to incur legal liability and increased costs to address such events and related security concerns.
There are inherent risks in our solutions and services businesses.
Risks inherent in the sale of solutions and services include assuming greater responsibility for successfully delivering projects that meet a particular customer specification, including defining and controlling contract scope, efficiently executing projects, and managing the performance and quality of our subcontractors and suppliers. If we are unable to manage and mitigate these risks, we could incur cost overruns, liabilities and other losses that would adversely affect
our results of operations.
New legislative and regulatory actions could adversely affect our business.
Legislative and regulatory action may be taken in the various countries and other jurisdictions where we operate that may affect our business activities in these countries or may otherwise increase our costs to do business. For example, we are increasingly required to comply with various environmental and other material, product, certification and labeling laws and regulations. Our customers may also be required to comply with such legislative and regulatory requirements. These requirements could increase our costs and could potentially have an adverse effect on our ability to ship our products into certain jurisdictions. Changes in these requirements could impact demand for our products, solutions and services.
6
Our industry is highly competitive.
We face strong competition in all of our market segments in several significant respects. We compete based on breadth and scope of our product portfolio and solution and service offerings, technology differentiation, the domain expertise of our employees and partners, product performance, quality of our products, solutions and services, knowledge of integrated systems and applications that address our customers’ business challenges, pricing, delivery and customer service. The relative importance of these factors differs across the geographic markets and product areas that we serve and across our market segments. We seek to maintain acceptable pricing levels across and within geographic markets by continually developing advanced technologies for new products and product enhancements and offering complete solutions for our customers’ business problems. In addition, we continue to drive productivity to reduce our cost structure. If we fail to achieve our objectives, to keep pace with technological changes, or to provide high quality products, solutions and services, we may lose business or experience price erosion and correspondingly lower sales and margins. We expect the level of competition to remain high in the future, which could limit our ability to maintain or increase our market share or profitability.
We face the potential harms of natural disasters, pandemics, acts of war, terrorism, international conflicts or other disruptions to our operations.
Our business depends on the movement of people and goods around the world. Natural disasters, pandemics, acts or threats of war or terrorism, international conflicts, political instability and the actions taken by governments could cause damage to or disrupt our business operations, our suppliers or our customers, and could create economic instability. Although it is not possible to predict such events or their consequences, these events could decrease demand for our products or make it difficult or impossible for us to deliver products.
Intellectual property infringement claims of others and the inability to protect our intellectual property rights could harm our business and our customers.
Others may assert intellectual property infringement claims against us or our customers. We frequently provide a limited intellectual property indemnity in connection with our terms and conditions of sale to our customers and in other types of contracts with third parties. Indemnification payments and legal expenses to defend claims could be costly.
In addition, we own the rights to many patents, trademarks, brand names and trade names that are important to our business. The inability to enforce our intellectual property rights may have an adverse effect on our results of operations. Expenses related to enforcing our intellectual property rights could be significant.
Claims from taxing authorities could have an adverse effect on our income tax expense and financial position.
We conduct business in many countries, which requires us to interpret and comply with the income tax laws and rulings in each of those taxing jurisdictions. Due to the ambiguity of tax laws among those jurisdictions as well as the uncertainty of how underlying facts may be construed, our estimates of income tax liabilities may differ from actual payments or assessments. We must successfully defend any claims from taxing authorities to avoid an adverse effect on our operating results and financial position.
Our business success depends on attracting, developing, and retaining highly qualified personnel.
Our success depends in part on the efforts and abilities of our management team and key employees. Their skills, experience and industry knowledge significantly benefit our operations and performance. Difficulty attracting, developing, and retaining members of our management team and key employees could have a negative effect on our business, operating results and financial condition.
Increasing employee benefit costs could have a negative effect on our operating results and financial condition.
One important aspect of attracting and retaining qualified personnel is continuing to offer competitive employee retirement and health care benefits. The expenses we record for our pension and other postretirement benefit pension plans depend on factors such as changes in market interest rates, the value of plan assets, mortality assumptions and health care trend rates. Significant unfavorable changes in these factors would increase our expenses. Expenses related to employer-funded health care benefits depend on laws and regulations, which could change, as well as health care cost inflation. An inability to control costs related to employee and retiree benefits could negatively impact our operating results and financial condition.
7
We rely on our distribution channel for a substantial portion of our sales.
In the United States and Canada, a large percentage of our sales are through distributors. In certain other countries, the majority of our sales are also through a limited number of distributors. We depend on the capabilities and competencies of our distributors to sell our products and services and deliver value to our customers. Disruptions to our existing distribution channel or the failure of distributors to maintain and develop the appropriate capabilities to sell our products and services could adversely affect our sales. A disruption could result from the sale of a distributor to a competitor, financial instability of a distributor or other events.
Potential liabilities and costs from litigation (including asbestos claims and environmental remediation) could reduce our profitability.
Various lawsuits, claims and proceedings have been or may be asserted against us relating to the conduct of our business, including those pertaining to the safety and security of the products, solutions and services we sell, employment, contract matters, and environmental remediation.
We have been named as a defendant in lawsuits alleging personal injury as a result of exposure to asbestos that was used in certain of our products many years ago. Our products may also be used in hazardous industrial activities, which could result in product liability claims. The uncertainties of litigation (including asbestos claims) and the uncertainties related to the collection of insurance coverage make it difficult to predict the ultimate resolution.
Our operations are subject to various environmental regulations that are concerned with human health, the limitation and control of emissions and discharges into the air, ground, and water, the quality of air and bodies of water, and the handling, use and disposal of specified substances. Our financial responsibility to clean up contaminated property or for natural resource damages may extend to previously owned or used properties, waterways and properties owned by unrelated companies or individuals, as well as properties that we currently own and use, regardless of whether the contamination is attributable to prior owners. We have been named as a potentially responsible party at cleanup sites and may be so named in the future, and the costs associated with these current and future sites may be significant.
We have, from time to time, divested certain of our businesses. In connection with these divestitures, certain lawsuits, claims and proceedings may be instituted or asserted against us related to the period that we owned the businesses, either because we agreed to retain certain liabilities related to these periods or because such liabilities fall upon us by operation of law. In some instances, the divested business has assumed the liabilities; however, it is possible that we might be responsible for satisfying those liabilities if the divested business is unable to do so.
Failure to identify, manage, complete, and integrate acquisitions and technology investments may adversely affect our business.
As part of our strategy, we may pursue acquisitions of or investment opportunities in businesses as well as the purchase of technology from third parties. In order to be successful with these transactions, we must identify attractive acquisition or investment opportunities, successfully complete the transaction, and manage post-closing matters, such as integration of the acquired business or technology. We may not be able to identify or complete beneficial acquisition or transaction opportunities given the intense competition for them. Even if we successfully identify and complete such transactions, we may not be able to successfully address risks and uncertainties inherent in such transactions, including:
|
•
|
difficulties in integrating the purchased operations, technologies, products or services, retaining the acquired business’ customers and achieving the expected benefits of the acquisition, such as sales increases, access to technologies, cost savings and increases in geographic or product presence, in the desired time frames;
|
|
•
|
loss of key employees of the acquired business;
|
|
•
|
legal and compliance issues;
|
|
•
|
difficulties implementing and maintaining consistent standards, controls, procedures, policies and information systems; and
|
|
•
|
diversion of management’s attention from other business concerns.
|
Future acquisitions and technology investments could result in debt, dilution, liabilities, increased interest expense, restructuring charges and amortization expenses related to intangible assets.
8
We rely on suppliers to provide equipment, components and services.
Our business requires that we buy equipment, components and services including finished products, electronic components and commodities such as copper, aluminum and steel. Our reliance on suppliers involves certain risks, including:
|
•
|
poor quality or an insecure supply chain, which could adversely affect the reliability and reputation of our products;
|
|
•
|
changes in the cost of these purchases due to inflation, exchange rates, commodity market volatility or other factors;
|
|
•
|
intellectual property risks such as ownership of rights or alleged infringement by suppliers;
|
|
•
|
information security risks associated with providing confidential information to suppliers; and
|
|
•
|
shortages of components, commodities or other materials, which could adversely affect our manufacturing efficiencies and ability to make timely delivery.
|
Any of these uncertainties could adversely affect our profitability and ability to compete. We also maintain several single-source supplier relationships, because either alternative sources are not available or the relationship is advantageous due to performance, quality, support, delivery, capacity, or price considerations. Unavailability or delivery delays of single-source components or products could adversely affect our ability to ship the related products in a timely manner. The effect of unavailability or delivery delays would be more severe if associated with our higher volume and more profitable products. Even where substitute sources of supply are available, qualifying the alternate suppliers and establishing reliable supplies could cost more or could result in delays and a loss of sales.
9
Item 1B.
Unresolved Staff Comments
None.
Item 2.
Properties
We operate manufacturing facilities in the United States and multiple other countries. Manufacturing space occupied approximately 3.3 million square feet, of which 38 percent was in the United States and Canada. Our global headquarters are located in Milwaukee, Wisconsin in a facility that we own. We lease the remaining facilities noted below. Most of our facilities are shared by operations in both segments and may be used for multiple purposes such as administrative, manufacturing, warehousing and / or distribution.
The following table sets forth information regarding our headquarter locations as of
September 30, 2017
.
|
|
|
|
|
|
Location
|
|
Segment/Region
|
|
|
|
|
|
|
|
Milwaukee, Wisconsin, United States
|
|
Global Headquarters and Control Products & Solutions
|
|
|
Mayfield Heights, Ohio, United States
|
|
Architecture & Software
|
|
|
Cambridge, Canada
|
|
Canada
|
|
|
Capelle, Netherlands / Diegem, Belgium
|
|
Europe, Middle East and Africa
|
|
|
Hong Kong
|
|
Asia Pacific
|
|
|
Weston, Florida, United States
|
|
Latin America
|
|
|
|
|||
|
The following table sets forth information regarding the manufacturing square footage of our principal locations as of September 30, 2017.
|
|||
|
Location
|
|
Manufacturing Square Footage
|
|
|
|
|
|
|
|
Monterrey, Mexico
|
|
637,000
|
|
|
Aarau, Switzerland
|
|
284,000
|
|
|
Twinsburg, Ohio, United States
|
|
257,000
|
|
|
Mequon, Wisconsin, United States
|
|
240,000
|
|
|
Cambridge, Canada
|
|
216,000
|
|
|
Harbin, China
|
|
162,000
|
|
|
Shanghai, China
|
141,000
|
|
|
|
Singapore
|
|
139,000
|
|
|
Katowice, Poland
|
|
138,000
|
|
|
Tecate, Mexico
|
|
135,000
|
|
|
Ladysmith, Wisconsin, United States
|
|
124,000
|
|
|
Richland Center, Wisconsin, United States
|
|
124,000
|
|
|
Jundiai, Brazil
|
115,000
|
|
|
There are no major encumbrances (other than financing arrangements, which in the aggregate are not significant) on any of our plants or equipment. In our opinion, our properties have been well maintained, are in sound operating condition and contain all equipment and facilities necessary to operate at present levels.
10
Item 3.
Legal Proceedings
The information required by this Item is contained in Note 15 in the Financial Statements within the section entitled
Other Matters
.
Item 4A.
Executive Officers of the Company
The name, age, office and position held with the Company and principal occupations and employment during the past five years of each of the executive officers of the Company as of November 1,
2017
are:
|
|
|
|
|
Name, Office and Position, and Principal Occupations and Employment
|
Age
|
|
|
|
|
|
|
Blake D. Moret
— President and Chief Executive Officer since July 1, 2016; previously Senior Vice President
|
54
|
|
|
Sujeet Chand —
Senior Vice President and Chief Technology Officer
|
59
|
|
|
Patrick P. Goris
— Senior Vice President and Chief Financial Officer since February 7, 2017; previously Vice President, Finance, Architecture and Software and (from 2013-2015) Operating and Engineering Services, and (from July 2015) Vice President, Investor Relations
|
46
|
|
|
Theodore D. Crandall
— Senior Vice President since February 7, 2017; previously Senior Vice President and Chief Financial Officer
|
62
|
|
|
David M. Dorgan
— Vice President and Controller
|
53
|
|
|
Steven W. Etzel
— Vice President and Treasurer
|
57
|
|
|
Elik I. Fooks
— Senior Vice President since March 16, 2017; previously Vice President and General Manager, Sensing, Safety, and Connectivity Business
|
66
|
|
|
Rebecca W. House
— Senior Vice President, General Counsel and Secretary since January 3, 2017; previously Assistant General Counsel, Operations and Compliance, and Assistant Secretary at Harley-Davidson, Inc. (motorcycle manufacturer)
|
44
|
|
|
Frank C. Kulaszewicz —
Senior Vice President
|
53
|
|
|
John P. McDermott
— Senior Vice President
|
59
|
|
|
John M. Miller
— Vice President and Chief Intellectual Property Counsel
|
50
|
|
|
Robert B. Murphy
— Senior Vice President, Operations and Engineering Services since May 2, 2016; previously Vice President, Manufacturing Operations
|
58
|
|
|
Christopher Nardecchia
— Senior Vice President and Chief Information Officer since November 1, 2017; previously Vice President and Chief Information Officer, Global Operations and Supply Chain, Amgen, Inc. (biopharmaceutical company)
|
55
|
|
|
Susan J. Schmitt —
Senior Vice President, Human Resources
|
54
|
|
There are no family relationships, as defined by applicable SEC rules, between any of the above executive officers and any other executive officer or director of the Company. No officer of the Company was selected pursuant to any arrangement or understanding between the officer and any person other than the Company. All executive officers are elected annually.
11
Item 5.
Market for the Company’s Common Equity, Related Stockholder Matters and Issuer Purchases of Equity Securities
Market Information
Our common stock is listed on the New York Stock Exchange and trades under the symbol “ROK.” On October 31,
2017
, there were
17,064
shareowners of record of our common stock.
The following table sets forth the high and low sales price of our common stock on the New York Stock Exchange-Composite Transactions reporting system during each quarter of our fiscal years ended
September 30, 2017
and
2016
:
|
|
2017
|
2016
|
||||||||||||||
|
Fiscal Quarters
|
High
|
Low
|
High
|
Low
|
||||||||||||
|
First
|
$
|
139.64
|
|
$
|
114.46
|
|
$
|
111.03
|
|
$
|
98.47
|
|
||||
|
Second
|
157.30
|
|
135.18
|
|
115.62
|
|
87.53
|
|
||||||||
|
Third
|
165.39
|
|
148.31
|
|
120.60
|
|
107.17
|
|
||||||||
|
Fourth
|
179.50
|
|
158.00
|
|
123.11
|
|
110.89
|
|
||||||||
We declare and pay dividends at the sole discretion of our Board of Directors. During
2017
we declared and paid aggregate cash dividends of
$3.04
per common share. During the first quarter of fiscal
2017
, we increased our quarterly dividend per common share
5 percent
to
76 cents
per common share effective with the dividend payable in December
2016
(
$3.04
per common share annually). During
2016
we declared and paid aggregate cash dividends of
$2.90
per common share.
Company Purchases
The table below sets forth information with respect to purchases made by or on behalf of us of shares of our common stock during the three months ended
September 30, 2017
:
|
Period
|
Total Number of Shares Purchased
|
Average Price Paid Per Share
(1)
|
Total Number of Shares Purchased as Part of Publicly Announced Plans or Programs
|
Maximum Approx. Dollar Value of Shares that May Yet Be Purchased Under the Plans or Programs
(2)
|
||||||||||
|
July 1 – 31, 2017
|
149,700
|
|
$
|
164.73
|
|
149,700
|
|
$
|
618,311,524
|
|
||||
|
August 1 – 31, 2017
|
60,000
|
|
165.11
|
|
60,000
|
|
608,404,669
|
|
||||||
|
September 1 – 30, 2017
|
—
|
|
—
|
|
—
|
|
608,404,669
|
|
||||||
|
Total
|
209,700
|
|
164.84
|
|
209,700
|
|
|
|||||||
|
(1)
|
Average price paid per share includes brokerage commissions.
|
|
(2)
|
On April 6, 2016, the Board of Directors authorized us to expend $1.0 billion to repurchase shares of our common stock. Our repurchase program allows us to repurchase shares at management's discretion or at our broker’s discretion pursuant to a share repurchase plan subject to price and volume parameters.
|
12
Performance Graph
The following information is not deemed to be “soliciting material” or to be “filed” with the SEC or subject to Regulation 14A or 14C under the Securities Exchange Act of 1934, as amended (Exchange Act) or to the liabilities of Section 18 of the Exchange Act, and will not be deemed to be incorporated by reference into any filing of the Company under the Securities Act of 1933, as amended, or the Exchange Act, except to the extent the Company specifically incorporates it by reference into such a filing.
The following line graph compares the cumulative total shareowner return on our Common Stock against the cumulative total return of the S&P Composite-500 Stock Index and the S&P Electrical Components & Equipment (S&P Electrical C&E) Index for the period of five fiscal years from October 1, 2012 to September 30, 2017, assuming in each case a fixed investment of $100 at the respective closing prices on September 30, 2012 and reinvestment of all dividends.
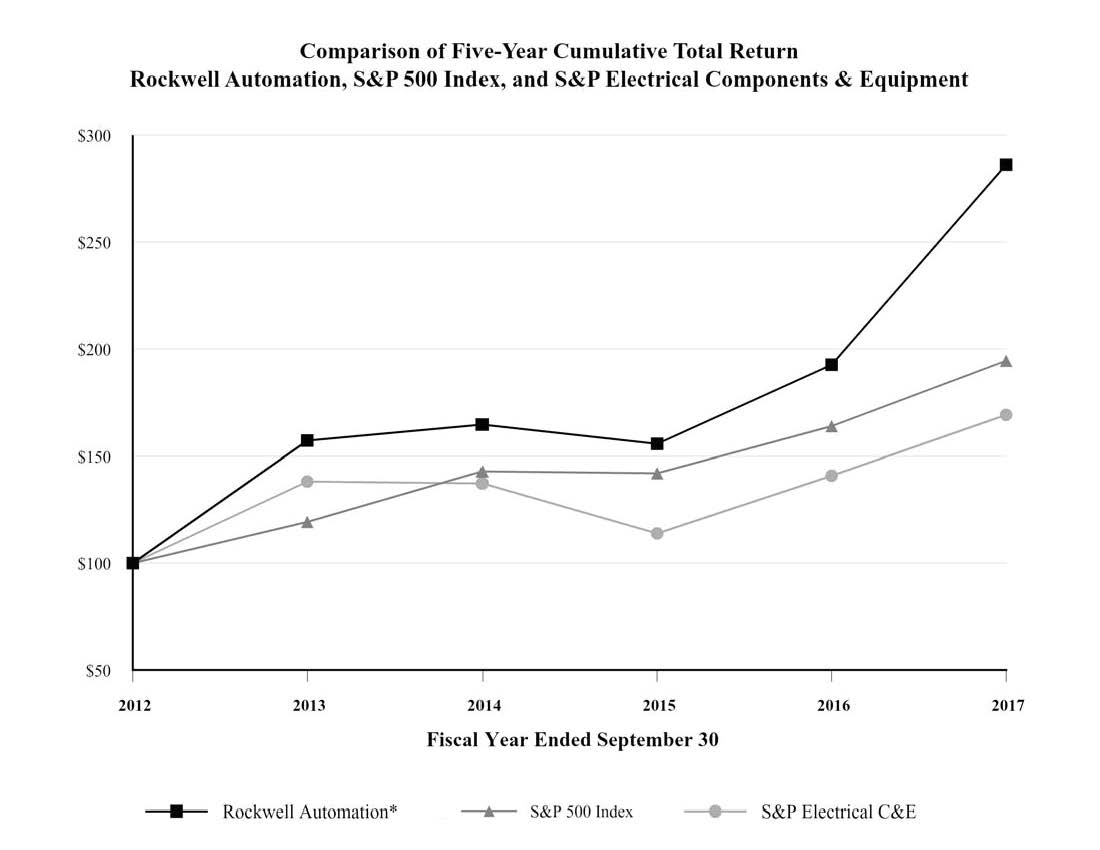
The cumulative total returns on Rockwell Automation Common Stock and each index as of each
September 30, 2012
through
2017
plotted in the above graph are as follows:
|
2012
|
2013
|
2014
|
2015
|
2016
|
2017
|
||||||||||||||||||
|
Rockwell Automation*
|
$
|
100.00
|
|
$
|
157.17
|
|
$
|
164.66
|
|
$
|
155.63
|
|
$
|
192.64
|
|
$
|
286.17
|
|
|||||
|
S&P 500 Index
|
100.00
|
|
119.34
|
|
142.89
|
|
142.02
|
|
163.93
|
|
194.44
|
|
|||||||||||
|
S&P Electrical Components & Equipment
|
100.00
|
|
138.10
|
|
137.20
|
|
113.89
|
|
140.88
|
|
169.23
|
|
|||||||||||
|
Cash dividends per common share
|
1.745
|
|
1.98
|
|
2.32
|
|
2.60
|
|
2.90
|
|
3.04
|
|
|||||||||||
* Includes the reinvestment of all dividends in our Common Stock.
13
Item 6.
Selected Financial Data
The following table sets forth selected consolidated financial data of our continuing operations. The data should be read in conjunction with MD&A and the Financial Statements. The selected financial data below has been derived from our audited consolidated financial statements.
|
|
Year Ended September 30,
|
|||||||||||||||||||
|
|
2017
|
2016
|
2015
|
2014
|
2013
|
|||||||||||||||
|
(in millions, except per share data)
|
||||||||||||||||||||
|
Consolidated Statement of Operations Data:
|
|
|
|
|
||||||||||||||||
|
Sales
|
$
|
6,311.3
|
|
$
|
5,879.5
|
|
$
|
6,307.9
|
|
$
|
6,623.5
|
|
$
|
6,351.9
|
|
|||||
|
Interest expense
|
76.2
|
|
71.3
|
|
63.7
|
|
59.3
|
|
60.9
|
|
||||||||||
|
Net income
(1)
|
825.7
|
|
729.7
|
|
827.6
|
|
826.8
|
|
756.3
|
|
||||||||||
|
Earnings per share:
|
|
|||||||||||||||||||
|
Basic
|
6.42
|
|
5.60
|
|
6.15
|
|
5.98
|
|
5.43
|
|
||||||||||
|
Diluted
|
6.35
|
|
5.56
|
|
6.09
|
|
5.91
|
|
5.36
|
|
||||||||||
|
Cash dividends per share
|
3.04
|
|
2.90
|
|
2.60
|
|
2.32
|
|
1.98
|
|
||||||||||
|
Consolidated Balance Sheet Data:
(at end of period)
|
|
|||||||||||||||||||
|
Total assets
|
$
|
7,161.7
|
|
$
|
7,101.2
|
|
$
|
6,404.7
|
|
$
|
6,224.3
|
|
$
|
5,844.6
|
|
|||||
|
Short-term debt and current portion of long-term debt
|
600.4
|
|
448.6
|
|
—
|
|
325.0
|
|
179.0
|
|
||||||||||
|
Long-term debt
|
1,243.4
|
|
1,516.3
|
|
1,500.9
|
|
900.4
|
|
905.1
|
|
||||||||||
|
Shareowners’ equity
|
2,663.6
|
|
1,990.1
|
|
2,256.8
|
|
2,658.1
|
|
2,585.5
|
|
||||||||||
|
Other Data:
|
|
|||||||||||||||||||
|
Capital expenditures
|
$
|
141.7
|
|
$
|
116.9
|
|
$
|
122.9
|
|
$
|
141.0
|
|
$
|
146.2
|
|
|||||
|
Depreciation
|
138.7
|
|
143.3
|
|
133.1
|
|
122.5
|
|
113.8
|
|
||||||||||
|
Intangible asset amortization
|
30.2
|
|
28.9
|
|
29.4
|
|
30.0
|
|
31.4
|
|
||||||||||
|
(1)
|
During the fourth quarter of fiscal 2017, we sold a product distribution business within our Control Products & Solutions segment. This business held no intellectual property and included products sold outside of our core channel and under different brands. We sold this business for approximately $94 million and recorded a pre-tax gain of
$60.8 million
, which is included within Other Income (Expense) in the Consolidated Statement of Operations.
|
14
Item 7.
Management’s Discussion and Analysis of Financial Condition and Results of Operations
Results of Operations
Non-GAAP Measures
The following discussion includes organic sales, total segment operating earnings and margin, Adjusted Income, Adjusted EPS, Adjusted Effective Tax Rate and free cash flow, which are non-GAAP measures. See
Supplemental Sales Information
for a reconciliation of reported sales to organic sales and a discussion of why we believe this non-GAAP measure is useful to investors. See
Results of Operations
for a reconciliation of income before income taxes to total segment operating earnings and margin and a discussion of why we believe these non-GAAP measures are useful to investors. See
Results of Operations
for a reconciliation of income from continuing operations, diluted EPS from continuing operations and effective tax rate to Adjusted Income, Adjusted EPS and Adjusted Effective Tax Rate, respectively, and a discussion of why we believe these non-GAAP measures are useful to investors. See
Financial Condition
for a reconciliation of cash flows from operating activities to free cash flow and a discussion of why we believe this non-GAAP measure is useful to investors.
Overview
Rockwell Automation, Inc.,
a leader in industrial automation and information, makes its customers more productive and the world more sustainable
. Overall demand for our products, solutions and services is driven by:
|
•
|
investments in manufacturing, including upgrades, modifications and expansions of existing facilities or production lines and new facilities or production lines;
|
|
•
|
investments in basic materials production capacity, which may be related to commodity pricing levels;
|
|
•
|
our customers’ needs for faster time to market, lower total cost of ownership, improved asset utilization and optimization, and enterprise risk management;
|
|
•
|
our customers’ needs to continuously improve quality, safety and sustainability;
|
|
•
|
industry factors that include our customers’ new product introductions, demand for our customers’ products or services and the regulatory and competitive environments in which our customers operate;
|
|
•
|
levels of global industrial production and capacity utilization;
|
|
•
|
regional factors that include local political, social, regulatory and economic circumstances; and
|
|
•
|
the spending patterns of our customers due to their annual budgeting processes and their working schedules.
|
Long-term Strategy
Our strategy is to bring The Connected Enterprise to life. We integrate control and information across the enterprise to help industrial companies and their people be more productive. Our vision of being the most valued global provider of innovative industrial automation and information products, solutions and services is supported by our growth and performance strategy, which seeks to:
|
•
|
achieve organic sales growth in excess of the automation market by expanding our served market and strengthening our competitive differentiation;
|
|
•
|
diversify our sales streams by broadening our portfolio of products, solutions and services, expanding our global presence and serving a wider range of industries and applications;
|
|
•
|
grow market share by gaining new customers and by capturing a larger share of existing customers’ spending;
|
|
•
|
enhance our market access by building our channel capability and partner network;
|
|
•
|
acquire companies that serve as catalysts to organic growth by adding complementary technology, expanding our served market, or enhancing our domain expertise or market access;
|
|
•
|
deploy human and financial resources to strengthen our technology leadership and our intellectual capital business model;
|
|
•
|
continuously improve quality and customer experience; and
|
|
•
|
drive annual cost productivity.
|
By implementing the above strategy, we seek to achieve our long-term financial goals, including above-market organic sales growth, EPS growth above sales growth, return on invested capital in excess of 20 percent and free cash flow equal to about 100 percent of Adjusted Income. We expect acquisitions to add a percentage point or more per year to long-term sales growth.
15
Our customers face the challenge of remaining globally cost competitive and automation can help them achieve their productivity and sustainability objectives. Our value proposition is to help our customers reduce time to market, lower total cost of ownership, improve asset utilization and manage enterprise risks.
Differentiation through Technology Innovation and Domain Expertise
We seek a technology leadership position in industrial automation. We believe that our three platforms - integrated architecture, intelligent motor control and solutions and services - provide the foundation for a long-term sustainable competitive advantage.
Our integrated control and information architecture, with Logix at its core, is an important differentiator. We are the only automation provider that can support discrete, process, batch, safety, motion and power control on the same hardware platform with the same software programming environment. Our integrated architecture is scalable with standard open communications protocols making it easier for customers to implement it more cost effectively.
Intelligent motor control is one of our core competencies and an important aspect of an automation system. These products and solutions enhance the availability, efficiency and safe operation of our customers' critical and most energy-intensive plant assets. Our intelligent motor control offering can be integrated seamlessly with the Logix architecture.
Domain expertise refers to the industry and application knowledge required to deliver solutions and services that support customers through the entire life cycle of their automation investment. The combination of industry-specific domain expertise of our people with our innovative technologies enables us to help our customers solve their manufacturing and business challenges.
Global Expansion
As the manufacturing world continues to expand, we must be able to meet our customers’ needs around the world. Approximately
60 percent
of our employees and
45 percent
of our sales are outside the U.S. We continue to expand our footprint in emerging markets.
As we expand in markets with considerable growth potential and shift our global footprint, we expect to continue to broaden the portfolio of products, solutions and services that we provide to our customers in these regions. We have made significant investments to globalize our manufacturing, product development and customer-facing resources in order to be closer to our customers throughout the world. The emerging markets of Asia Pacific, including China and India, Latin America, Central and Eastern Europe and Africa are projected to be the fastest growing over the long term, due to higher levels of infrastructure investment and the growing middle-class population. We believe that increased demand for consumer products in these markets will lead to manufacturing investment and provide us with additional growth opportunities in the future.
Enhanced Market Access
Over the past decade, our investments in technology and globalization have enabled us to expand our addressed market to over $90 billion. Our process initiative has been the most important contributor to this expansion and remains our largest growth opportunity. Logix is the technology foundation that enabled us to become an industry leader for process applications. We complement that with a growing global network of engineers and partners to provide solutions to process customers.
OEMs represent another area of addressed market expansion and an important growth opportunity. To remain competitive, OEMs need to find the optimal balance of machine cost and performance while reducing their time to market. Our scalable integrated architecture and intelligent motor control offerings, along with design productivity tools and our motion and safety products, can assist OEMs in addressing these business needs.
We have developed a powerful network of channel partners, technology partners and commercial partners that act as amplifiers to our internal capabilities and enable us to serve our customers’ needs around the world.
Broad Range of Industries Served
We apply our knowledge of manufacturing applications to help customers solve their business challenges. We serve customers in a wide range of industries, including consumer products, heavy industries and transportation.
Our consumer products customers are engaged in the food and beverage, home and personal care and life sciences industries. These customers’ needs include new capacity, incremental capacity from existing facilities, flexible manufacturing and regulatory compliance. These customers operate in an environment where product innovation and time to market are critical factors.
16
We serve customers in heavy industries, including oil and gas, mining, aggregates, cement, metals, energy, semiconductor, pulp and paper and water/wastewater. Companies in resource-based industries typically invest in capacity expansion when commodity prices are relatively high and global demand for basic materials is increasing. In addition, there is ongoing investment in upgrades of aging automation systems and productivity.
In the transportation industry, factors such as geographic expansion, investment in new model introductions and more flexible manufacturing technologies influence customers’ automation investment decisions. Our sales in transportation are primarily to automotive and tire manufacturers.
All of these industries also generate maintenance repair order (MRO) and ongoing services revenue related to the installed base.
Outsourcing and Sustainability Trends
Demand for our products, solutions and services across all industries benefits from the outsourcing and sustainability needs of our customers. Customers increasingly desire to outsource engineering services to achieve a more flexible cost base. Our manufacturing application knowledge enables us to serve these customers globally.
We help our customers meet their sustainability needs pertaining to energy efficiency, environmental and safety goals. Customers across all industries are investing in more energy-efficient manufacturing processes and technologies, such as intelligent motor control and energy efficient solutions and services. In addition, environmental and safety objectives often spur customers to invest to ensure compliance and implement sustainable business practices.
Acquisitions
Our acquisition strategy focuses on products, solutions and services that will be catalytic to the organic growth of our core offerings.
In September 2016, we acquired Maverick Technologies, a leading systems integrator. This acquisition significantly enhances our expertise in key process and batch applications that help our customers realize greater productivity and improved global competitiveness through process control and information management solutions.
In September 2016, we acquired Automation Control Products, a premier provider in centralized thin client, remote desktop and server management software. This acquisition strengthens our ability to provide our customers with visual display and software solutions to manage information and streamline workflows for a more connected manufacturing environment.
In March 2016, we acquired MagneMotion Inc., a leading manufacturer of intelligent conveying systems. This acquisition continues our strategy to build a portfolio of smart manufacturing technologies by expanding our existing capabilities in independent cart technology.
In October 2014, we acquired the assets of ESC Services, Inc., a global provider of lockout-tagout services and solutions. This acquisition enables our customers to increase their asset utilization and strengthen their enterprise risk management.
We believe these acquisitions will help us expand our served market and deliver value to our customers.
Continuous Improvement
Productivity and continuous improvement are important components of our culture. We have programs in place that drive ongoing process improvement, functional streamlining, material cost savings and manufacturing productivity. Our implementation of common global processes and an enterprise-wide business system is nearly complete. These are intended to improve profitability that can be used to fund investments in growth and to offset inflation. Our ongoing productivity initiatives target both cost reduction and improved asset utilization. Charges for workforce reductions and facility rationalization may be required in order to effectively execute our productivity programs.
17
U. S. Industrial Economic Trends
In
2017
, sales in the U.S. accounted for
55 percent
of our total sales. The various indicators we use to gauge the direction and momentum of our served U.S. markets include:
|
•
|
The Industrial Production (IP) Index, published by the Federal Reserve, which measures the real output of manufacturing, mining, and electric and gas utilities. The IP Index is expressed as a percentage of real output in a base year, currently 2012. Historically there has been a meaningful correlation between the changes in the IP Index and the level of automation investment made by our U.S. customers in their manufacturing base.
|
|
•
|
The Manufacturing Purchasing Managers’ Index (PMI), published by the Institute for Supply Management (ISM), which indicates the current and near-term state of manufacturing activity in the U.S. According to the ISM, a PMI measure above 50 indicates that the U.S. manufacturing economy is generally expanding while a measure below 50 indicates that it is generally contracting.
|
|
•
|
Industrial Equipment Spending, compiled by the Bureau of Economic Analysis, which provides insight into spending trends in the broad U.S. industrial economy. This measure over the longer term has proven to demonstrate a reasonable correlation with our domestic growth.
|
|
•
|
Capacity Utilization (Total Industry), published by the Federal Reserve, which measures plant operating activity. Historically there has been a meaningful correlation between Capacity Utilization and levels of U.S. IP.
|
The table below depicts the trends in these indicators from fiscal
2015
to
2017
. In the fourth quarter of fiscal 2017, all four indicators improved compared to the same quarter in the prior year, with PMI and Industrial Equipment Spending also improving sequentially.
|
IP
Index
|
PMI
|
Industrial
Equipment
Spending
(in billions)
|
Capacity
Utilization
(percent)
|
|||||||||
|
Fiscal 2017 quarter ended:
|
|
|
|
|
||||||||
|
September 2017
|
104.7
|
|
60.8
|
|
245.5
|
|
76.1
|
|
||||
|
June 2017
|
105.1
|
|
57.8
|
|
241.7
|
|
76.6
|
|
||||
|
March 2017
|
103.7
|
|
57.2
|
|
234.3
|
|
75.8
|
|
||||
|
December 2016
|
103.3
|
|
54.5
|
|
229.0
|
|
75.8
|
|
||||
|
Fiscal 2016 quarter ended:
|
|
|
|
|||||||||
|
September 2016
|
103.1
|
|
51.7
|
|
226.0
|
|
75.8
|
|
||||
|
June 2016
|
102.9
|
|
52.8
|
|
224.4
|
|
75.7
|
|
||||
|
March 2016
|
103.1
|
|
51.7
|
|
220.6
|
|
75.8
|
|
||||
|
December 2015
|
103.4
|
|
47.9
|
|
224.0
|
|
76.0
|
|
||||
|
Fiscal 2015 quarter ended:
|
|
|
|
|||||||||
|
September 2015
|
104.4
|
|
50.1
|
|
220.7
|
|
76.7
|
|
||||
|
June 2015
|
104.3
|
|
53.0
|
|
221.9
|
|
76.8
|
|
||||
|
March 2015
|
105.4
|
|
52.3
|
|
216.8
|
|
77.8
|
|
||||
|
December 2014
|
106.3
|
|
54.9
|
|
216.5
|
|
78.6
|
|
||||
Note: Economic indicators are subject to revisions by the issuing organizations.
18
Non-U.S. Economic Trends
In
2017
, sales outside the U.S. accounted for
45 percent
of our total sales. These customers include both indigenous companies and multinational companies with expanding global presence. In addition to the global factors previously mentioned in the “Overview” section, international demand, particularly in emerging markets, has historically been driven by the strength of the industrial economy in each region, investments in infrastructure and expanding consumer markets. We use changes in the respective countries' gross domestic product and IP as indicators of the growth opportunities in each region where we do business.
Having seen a return to industrial production growth in all regions in fiscal year 2017, further growth is forecast for fiscal year 2018. In Europe, business sentiment remains at high levels, while in Asia the macroeconomic environment is stable. In Latin America, business confidence and investment levels in Brazil are improving, although growth is expected to slow in Mexico. Industrial production and GDP growth in Canada is expected to continue in fiscal year 2018.
19
Summary of Results of Operations
In
2017
, sales were
$6,311.3 million
, an increase of
7.3 percent
year over year. Organic sales increased
6.1 percent
. Currency translation reduced sales by
0.3 percentage points
, and acquisitions contributed
1.5 percentage points
to sales growth. Growth was broad-based across regions and was led by strength in the automotive, semiconductor, and food and beverage industries.
The following is a summary of our results related to key growth initiatives:
|
•
|
Logix reported and organic sales increased
10 percent
year over year compared to
2016
.
|
|
•
|
Process initiative sales increased 13 percent in
2017
compared to
2016
, and process initiative organic sales increased 4 percent. Currency translation reduced process sales by one percentage point, and acquisitions contributed 10 percentage points to process sales growth.
|
|
•
|
Sales in emerging countries increased 8.7 percent in
2017
compared to
2016
. Organic sales in emerging countries increased 10.1 percent year over year. Currency translation reduced sales in emerging countries by 1.5 percentage points, and acquisitions contributed 0.1 percentage points to sales growth.
|
20
The following table reflects our sales and operating results for the years ended
September 30, 2017
,
2016
and
2015
(in millions, except per share amounts):
|
|
Year Ended September 30,
|
|||||||||||
|
|
2017
|
2016
|
2015
|
|||||||||
|
Sales
|
|
|
|
|||||||||
|
Architecture & Software
|
$
|
2,899.3
|
|
$
|
2,635.2
|
|
$
|
2,749.5
|
|
|||
|
Control Products & Solutions
|
3,412.0
|
|
3,244.3
|
|
3,558.4
|
|
||||||
|
Total sales (a)
|
$
|
6,311.3
|
|
$
|
5,879.5
|
|
$
|
6,307.9
|
|
|||
|
Segment operating earnings
(1)
|
|
|
|
|||||||||
|
Architecture & Software
|
$
|
781.5
|
|
$
|
695.0
|
|
$
|
808.6
|
|
|||
|
Control Products & Solutions
|
451.6
|
|
493.7
|
|
551.9
|
|
||||||
|
Total segment operating earnings
(2)
(b)
|
1,233.1
|
|
1,188.7
|
|
1,360.5
|
|
||||||
|
Purchase accounting depreciation and amortization
|
(21.4
|
)
|
(18.4
|
)
|
(21.0
|
)
|
||||||
|
General corporate — net
|
(76.3
|
)
|
(79.7
|
)
|
(85.6
|
)
|
||||||
|
Non-operating pension costs
|
(82.6
|
)
|
(76.2
|
)
|
(62.7
|
)
|
||||||
|
Gain on sale of business
(4)
|
60.8
|
|
—
|
|
—
|
|
||||||
|
Interest expense
|
(76.2
|
)
|
(71.3
|
)
|
(63.7
|
)
|
||||||
|
Income before income taxes (c)
|
1,037.4
|
|
943.1
|
|
1,127.5
|
|
||||||
|
Income tax provision
|
(211.7
|
)
|
(213.4
|
)
|
(299.9
|
)
|
||||||
|
Net income
|
$
|
825.7
|
|
$
|
729.7
|
|
$
|
827.6
|
|
|||
|
|
|
|
||||||||||
|
Diluted EPS
|
$
|
6.35
|
|
$
|
5.56
|
|
$
|
6.09
|
|
|||
|
Adjusted EPS
(3)
|
$
|
6.76
|
|
$
|
5.93
|
|
$
|
6.40
|
|
|||
|
Diluted weighted average outstanding shares
|
129.9
|
|
131.1
|
|
135.7
|
|
||||||
|
Total segment operating margin
(2)
(b/a)
|
19.5
|
%
|
20.2
|
%
|
21.6
|
%
|
||||||
|
Pre-tax margin (c/a)
|
16.4
|
%
|
16.0
|
%
|
17.9
|
%
|
||||||
|
(1)
|
See Note 16 in the Financial Statements for the definition of segment operating earnings.
|
|
(2)
|
Total segment operating earnings and total segment operating margin are non-GAAP financial measures. We exclude purchase accounting depreciation and amortization, general corporate – net, non-operating pension costs, interest expense and income tax provision because we do not consider these costs to be directly related to the operating performance of our segments. We believe that these measures are useful to investors as measures of operating performance. We use these measures to monitor and evaluate the profitability of our operating segments. Our measures of total segment operating earnings and total segment operating margin may be different from measures used by other companies.
|
|
(3)
|
Adjusted EPS is a non-GAAP earnings measure that excludes the non-operating pension costs and their related income tax effects. See
Adjusted Income, Adjusted EPS and Adjusted Effective Tax Rate Reconciliation
for more information on this non-GAAP measure.
|
|
(4)
|
During the fourth quarter of fiscal 2017, we sold a product distribution business within our Control Products & Solutions segment. This business held no intellectual property and included products sold outside of our core channel and under different brands. We sold this business for approximately $94 million and recorded a pre-tax gain of
$60.8 million
, which is included within Other Income (Expense) in the Consolidated Statement of Operations.
|
21
Purchase accounting depreciation and amortization and non-operating pension costs are not allocated to our operating segments because these costs are excluded from our measurement of each segment's operating performance for internal purposes. If we were to allocate these costs, we would attribute them to each of our segments as follows (in millions):
|
|
Year Ended September 30,
|
|||||||||||
|
|
2017
|
2016
|
2015
|
|||||||||
|
Purchase accounting depreciation and amortization
|
|
|
|
|||||||||
|
Architecture & Software
|
$
|
6.4
|
|
$
|
3.9
|
|
$
|
4.3
|
|
|||
|
Control Products & Solutions
|
14.0
|
|
13.5
|
|
15.7
|
|
||||||
|
Non-operating pension costs
|
||||||||||||
|
Architecture & Software
|
29.7
|
|
26.9
|
|
22.6
|
|
||||||
|
Control Products & Solutions
|
46.4
|
|
42.0
|
|
35.3
|
|
||||||
The increases in non-operating pension costs in both segments in fiscal
2017
were primarily due to the decrease in our U.S. discount rate from 4.55 percent for fiscal 2016 to 3.75 percent for fiscal
2017
.
Adjusted Income, Adjusted EPS and Adjusted Effective Tax Rate Reconciliation
Adjusted Income, Adjusted EPS and Adjusted Effective Tax Rate are non-GAAP earnings measures that exclude non-operating pension costs and their related income tax effects. Non-operating pension costs include defined benefit plan interest cost, expected return on plan assets, amortization of actuarial gains and losses and the impact of any plan curtailments or settlements. These components of net periodic pension cost primarily relate to changes in pension assets and liabilities that are a result of market performance; we consider these costs to be unrelated to the operating performance of our business. We believe that Adjusted Income, Adjusted EPS and Adjusted Effective Tax Rate provide useful information to our investors about our operating performance and allow management and investors to compare our operating performance period over period. Adjusted EPS is also used as a financial measure of performance for our annual incentive compensation. Our measures of Adjusted Income, Adjusted EPS and Adjusted Effective Tax Rate may be different from measures used by other companies. These non-GAAP measures should not be considered a substitute for income from continuing operations, diluted EPS and effective tax rate.
The following are the components of operating and non-operating pension costs for the years ended
September 30, 2017
,
2016
and
2015
(in millions):
|
Year Ended September 30,
|
||||||||||||
|
2017
|
2016
|
2015
|
||||||||||
|
Service cost
|
$
|
97.0
|
|
$
|
88.0
|
|
$
|
85.7
|
|
|||
|
Amortization of prior service credit
|
(3.7
|
)
|
(2.9
|
)
|
(2.7
|
)
|
||||||
|
Operating pension costs
|
93.3
|
|
85.1
|
|
83.0
|
|
||||||
|
Interest cost
|
151.6
|
|
169.5
|
|
167.2
|
|
||||||
|
Expected return on plan assets
|
(225.2
|
)
|
(218.3
|
)
|
(223.2
|
)
|
||||||
|
Amortization of net actuarial loss
|
152.9
|
|
124.5
|
|
118.7
|
|
||||||
|
Special termination benefit
|
0.5
|
|
0.5
|
|
—
|
|
||||||
|
Settlements
|
2.8
|
|
—
|
|
—
|
|
||||||
|
Non-operating pension costs
|
82.6
|
|
76.2
|
|
62.7
|
|
||||||
|
Net periodic pension cost
|
$
|
175.9
|
|
$
|
161.3
|
|
$
|
145.7
|
|
|||
22
The following are reconciliations of income from continuing operations, diluted EPS from continuing operations and effective tax rate to Adjusted Income, Adjusted EPS and Adjusted Effective Tax Rate, respectively, for the years ended
September 30, 2017
,
2016
and
2015
(in millions, except per share amounts and percentages):
|
|
Year Ended September 30,
|
|||||||||||
|
|
2017
|
2016
|
2015
|
|||||||||
|
Income from continuing operations
|
$
|
825.7
|
|
$
|
729.7
|
|
$
|
827.6
|
|
|||
|
Non-operating pension costs
|
82.6
|
|
76.2
|
|
62.7
|
|
||||||
|
Tax effect of non-operating pension costs
|
(29.6
|
)
|
(27.5
|
)
|
(21.9
|
)
|
||||||
|
Adjusted Income
|
$
|
878.7
|
|
$
|
778.4
|
|
$
|
868.4
|
|
|||
|
Diluted EPS from continuing operations
|
$
|
6.35
|
|
$
|
5.56
|
|
$
|
6.09
|
|
|||
|
Non-operating pension costs per diluted share
|
0.64
|
|
0.58
|
|
0.46
|
|
||||||
|
Tax effect of non-operating pension costs per diluted share
|
(0.23
|
)
|
(0.21
|
)
|
(0.15
|
)
|
||||||
|
Adjusted EPS
|
$
|
6.76
|
|
$
|
5.93
|
|
$
|
6.40
|
|
|||
|
Effective tax rate
|
20.4
|
%
|
22.6
|
%
|
26.6
|
%
|
||||||
|
Tax effect of non-operating pension costs
|
1.1
|
%
|
1.0
|
%
|
0.4
|
%
|
||||||
|
Adjusted Effective Tax Rate
|
21.5
|
%
|
23.6
|
%
|
27.0
|
%
|
||||||
23
2017
Compared to
2016
|
(in millions, except per share amounts)
|
2017
|
2016
|
Change
|
|||||||||
|
Sales
|
$
|
6,311.3
|
|
$
|
5,879.5
|
|
$
|
431.8
|
|
|||
|
Income before income taxes
|
1,037.4
|
|
943.1
|
|
94.3
|
|
||||||
|
Diluted EPS
|
6.35
|
|
5.56
|
|
0.79
|
|
||||||
|
Adjusted EPS
|
6.76
|
|
5.93
|
|
0.83
|
|
||||||
Sales
Sales in fiscal
2017
increased
7.3 percent
compared to
2016
. Organic sales increased
6.1 percent
. Currency translation reduced sales by
0.3 percentage points
, and acquisitions contributed
1.5 percentage points
to sales growth. Pricing contributed less than one percentage point to growth.
The table below presents our sales, attributed to the geographic regions based upon country of destination, for the year ended
September 30, 2017
and the percentage change from the same period a year ago (in millions, except percentages):
|
Change vs.
|
Change in Organic
Sales
(1)
vs.
|
|||||||||
|
Year Ended September 30, 2017
|
Year Ended September 30, 2016
|
Year Ended September 30, 2016
|
||||||||
|
United States
|
$
|
3,458.4
|
|
7.6
|
%
|
5.2
|
%
|
|||
|
Canada
|
343.4
|
|
8.5
|
%
|
7.7
|
%
|
||||
|
Europe, Middle East and Africa
|
1,193.7
|
|
4.1
|
%
|
3.8
|
%
|
||||
|
Asia Pacific
|
866.4
|
|
13.3
|
%
|
13.9
|
%
|
||||
|
Latin America
|
449.4
|
|
2.6
|
%
|
4.1
|
%
|
||||
|
Total sales
|
$
|
6,311.3
|
|
7.3
|
%
|
6.1
|
%
|
|||
|
(1)
|
Organic sales are sales excluding the effect of changes in currency exchange rates and acquisitions. See
Supplemental Sales Information
for information on this non-GAAP measure.
|
|
•
|
Sales in the United States increased year over year, led by strength in the automotive and consumer industries.
|
|
•
|
Sales in Canada grew, with growth led by the pulp and paper, consumer, and automotive industries.
|
|
•
|
EMEA sales increased compared to the prior year, with growth in both emerging and developed countries.
|
|
•
|
Asia Pacific sales increased year over year, with strong growth across the region, particularly within the semiconductor industry.
|
|
•
|
Sales growth in Latin America was mixed with growth led by Mexico, partially offset by declines across the rest of the region.
|
General Corporate - Net
General corporate - net expenses were
$76.3 million
in fiscal
2017
compared to
$79.7 million
in fiscal
2016
.
Income before Income Taxes
Income before income taxes
increased
10 percent
from
$943.1 million
in
2016
to
$1,037.4 million
in
2017
, primarily due to the gain on sale of a business in the fourth quarter and an increase in segment operating earnings. Total segment operating earnings
increased
4 percent
year over year from
$1,188.7 million
in
2016
to
$1,233.1 million
in
2017
, primarily due to higher sales, partially offset by higher incentive compensation and restructuring charges. In fiscal 2016, we did not incur expenses related to our primary annual incentive compensation plans, which are based on our company's performance. In fiscal 2017, we recorded approximately $115 million related to these plans.
24
Income Taxes
The effective tax rate in
2017
was
20.4 percent
compared to
22.6 percent
in
2016
. The Adjusted Effective Tax Rate in
2017
was
21.5 percent
compared to
23.6 percent
in
2016
. The decreases in the effective tax rate and the Adjusted Effective Tax Rate were primarily due to larger favorable discrete tax items in the current year.
See Note 14 in the Financial Statements for a complete reconciliation of the United States statutory tax rate to the effective tax rate and more information on tax events in
2017
and
2016
affecting each year's respective tax rates.
Architecture & Software
|
(in millions, except percentages)
|
2017
|
2016
|
Change
|
|
||||||||||
|
Sales
|
$
|
2,899.3
|
|
$
|
2,635.2
|
|
$
|
264.1
|
|
|
||||
|
Segment operating earnings
|
781.5
|
|
695.0
|
|
86.5
|
|
|
|||||||
|
Segment operating margin
|
27.0
|
%
|
26.4
|
%
|
0.6
|
|
pts
|
|||||||
Sales
Architecture & Software sales
increased
10.0 percent
in
2017
compared to
2016
. Organic sales
increased
9.4 percent
, the effects of currency translation reduced sales by
0.3 percentage points
, and acquisitions contributed
0.9 percentage points
to sales growth. Pricing contributed approximately one percentage point to growth during the year. All regions experienced reported and organic sales growth. The United States was the strongest performing region. Logix reported and organic sales increased
10 percent
in
2017
compared to
2016
.
Operating Margin
Architecture & Software segment operating earnings
increased
12 percent
. Operating margin was
27.0 percent
in
2017
compared to
26.4 percent
in
2016
, primarily due to higher sales, partially offset by higher incentive compensation and restructuring charges.
Control Products & Solutions
|
(in millions, except percentages)
|
2017
|
2016
|
Change
|
|
||||||||||
|
Sales
|
$
|
3,412.0
|
|
$
|
3,244.3
|
|
$
|
167.7
|
|
|
||||
|
Segment operating earnings
|
451.6
|
|
493.7
|
|
(42.1
|
)
|
|
|||||||
|
Segment operating margin
|
13.2
|
%
|
15.2
|
%
|
(2.0
|
)
|
pts
|
|||||||
Sales
Control Products & Solutions sales
increased
5.2 percent
in
2017
compared to
2016
. Organic sales
increased
3.4 percent
, the effects of currency translation reduced sales by
0.2 percentage points
, and acquisitions contributed
2.0 percentage points
to sales growth. Pricing did not have a significant impact on growth during the year. All regions experienced reported and organic sales growth. The United States and Asia Pacific were the strongest performing regions.
Sales in our solutions and services businesses increased 4 percent year over year. Organic sales in our solutions and services businesses increased 1 percent during
2017
, and acquisitions contributed 3 percentage points to growth.
Product sales increased 6 percent year over year. Product organic sales increased 7 percent year over year in
2017
, and currency translation reduced sales by approximately 1 percentage point.
Operating Margin
Control Products & Solutions segment operating earnings
decreased
9 percent
year over year. Segment operating margin was
13.2 percent
in
2017
compared to
15.2 percent
a year ago, primarily due to higher incentive compensation and restructuring charges, partially offset by higher sales.
25
2016
Compared to
2015
|
(in millions, except per share amounts)
|
2016
|
2015
|
Change
|
|||||||||
|
Sales
|
$
|
5,879.5
|
|
$
|
6,307.9
|
|
$
|
(428.4
|
)
|
|||
|
Income before income taxes
|
943.1
|
|
1,127.5
|
|
(184.4
|
)
|
||||||
|
Diluted EPS
|
5.56
|
|
6.09
|
|
(0.53
|
)
|
||||||
|
Adjusted EPS
|
5.93
|
|
6.40
|
|
(0.47
|
)
|
||||||
Sales
Sales in fiscal
2016
decreased
6.8 percent
compared to
2015
. Organic sales decreased
3.9 percent
, and currency translation reduced sales by
3.0 percentage points
. Pricing contributed less than one percentage point to growth.
The table below presents our sales, attributed to the geographic regions based upon country of destination, for the year ended
September 30, 2016
and the percentage change from the same period a year ago (in millions, except percentages):
|
Change vs.
|
Change in Organic
Sales
(1)
vs.
|
|||||||||
|
Year Ended September 30, 2016
|
Year Ended September 30, 2015
|
Year Ended September 30, 2015
|
||||||||
|
United States
|
$
|
3,213.4
|
|
(6.8
|
)%
|
(6.9
|
)%
|
|||
|
Canada
|
316.4
|
|
(13.7
|
)%
|
(6.8
|
)%
|
||||
|
Europe, Middle East and Africa
|
1,147.2
|
|
(2.3
|
)%
|
1.8
|
%
|
||||
|
Asia Pacific
|
764.4
|
|
(8.4
|
)%
|
(4.8
|
)%
|
||||
|
Latin America
|
438.1
|
|
(9.9
|
)%
|
7.2
|
%
|
||||
|
Total sales
|
$
|
5,879.5
|
|
(6.8
|
)%
|
(3.9
|
)%
|
|||
|
(1)
|
Organic sales are sales excluding the effect of changes in currency exchange rates and acquisitions. See
Supplemental Sales Information
for information on this non-GAAP measure.
|
|
•
|
Sales in the United States declined year over year, mainly due to weakness in heavy industries, particularly oil and gas.
|
|
•
|
Sales in Canada decreased due to the unfavorable impact of currency translation as well as declines in heavy industries, particularly oil and gas.
|
|
•
|
EMEA sales decreased due to the unfavorable impact of currency translation. Organic sales increased in both mature Europe and emerging countries.
|
|
•
|
Asia Pacific sales declined due to the unfavorable impact of currency translation as well as a decrease in organic sales in China.
|
|
•
|
Latin America sales decreased due to the unfavorable impact of currency translation. Organic sales growth in the region was led by Mexico.
|
26
General Corporate - Net
General corporate - net expenses were
$79.7 million
in fiscal
2016
compared to
$85.6 million
in fiscal
2015
.
Income before Income Taxes
Income before income taxes
decreased
16 percent
from
$1,127.5 million
in
2015
to
$943.1 million
in
2016
, primarily due to a decrease in segment operating earnings. Total segment operating earnings
decreased
13 percent
year over year from $1,360.5 million in 2015 to $1,188.7 million in 2016, primarily due to lower organic sales and unfavorable currency effects.
Income Taxes
The effective tax rate in
2016
was
22.6 percent
compared to
26.6 percent
in
2015
. The Adjusted Effective Tax Rate in
2016
was
23.6 percent
compared to
27.0 percent
in
2015
. The decreases in the effective tax rate and the Adjusted Effective Tax Rate were primarily due to an incremental benefit from the retroactive and permanent extension of the U.S. federal research and development tax credit (U.S. research tax credit) in the first quarter of 2016, a more favorable geographic mix of our pre-tax income and discrete tax items.
See Note 14 in the Financial Statements for a complete reconciliation of the United States statutory tax rate to the effective tax rate and more information on tax events in
2016
and
2015
affecting each year's respective tax rates.
Architecture & Software
|
(in millions, except percentages)
|
2016
|
2015
|
Change
|
|
||||||||||
|
Sales
|
$
|
2,635.2
|
|
$
|
2,749.5
|
|
$
|
(114.3
|
)
|
|
||||
|
Segment operating earnings
|
695.0
|
|
808.6
|
|
(113.6
|
)
|
|
|||||||
|
Segment operating margin
|
26.4
|
%
|
29.4
|
%
|
(3.0
|
)
|
pts
|
|||||||
Sales
Architecture & Software sales
decreased
4.2 percent
in
2016
compared to
2015
. Organic sales
decreased
1.5 percent
, the effects of currency translation reduced sales by
3.0 percentage points
, and acquisitions contributed
0.3 percentage points
to sales growth. Pricing contributed approximately one percentage point to growth during the year. All regions experienced a decline in sales during the year except EMEA. Excluding the impact of currency translation, growth in Latin America and EMEA was more than offset by decreases in the remaining regions. Logix sales decreased
7 percent
in
2016
compared to
2015
. Logix organic sales decreased
4 percent
year over year, and currency translation reduced sales by 3 percentage points.
Operating Margin
Architecture & Software segment operating earnings decreased 14 percent. Operating margin was
26.4 percent
in
2016
compared to
29.4 percent
in
2015
, primarily due to unfavorable mix and currency effects as well as lower organic sales.
27
Control Products & Solutions
|
(in millions, except percentages)
|
2016
|
2015
|
Change
|
|
||||||||||
|
Sales
|
$
|
3,244.3
|
|
$
|
3,558.4
|
|
$
|
(314.1
|
)
|
|
||||
|
Segment operating earnings
|
493.7
|
|
551.9
|
|
(58.2
|
)
|
|
|||||||
|
Segment operating margin
|
15.2
|
%
|
15.5
|
%
|
(0.3
|
)
|
pts
|
|||||||
Sales
Control Products & Solutions sales decreased 8.8 percent in 2016 compared to 2015. Organic sales decreased 5.8 percent, and currency translation reduced sales by 3.0 percentage points. Pricing contributed less than one percentage point to growth during the year. All regions experienced a year-over-year decrease in sales. Excluding the impact of currency translation, growth in Latin America was more than offset by declines in the remaining regions.
Sales in our solutions and services businesses decreased 11 percent year over year. Organic sales in our solutions and services businesses decreased 8 percent during 2016, and currency translation reduced sales by 3 percentage points.
Product sales decreased 5 percent year over year. Product organic sales decreased 2 percent year over year in 2016, and currency translation reduced sales by 3 percentage points.
Operating Margin
Control Products & Solutions segment operating earnings decreased 11 percent year over year. Segment operating margin was 15.2 percent in 2016 compared to 15.5 percent a year ago, primarily due to lower organic sales, partially offset by productivity.
28
Financial Condition
The following is a summary of our cash flows from operating, investing and financing activities, as reflected in the Consolidated Statement of Cash Flows (in millions):
|
|
Year Ended September 30,
|
|||||||||||
|
|
2017
|
2016
|
2015
|
|||||||||
|
Cash provided by (used for):
|
|
|
|
|||||||||
|
Operating activities
|
$
|
1,034.0
|
|
$
|
947.3
|
|
$
|
1,187.7
|
|
|||
|
Investing activities
|
(516.7
|
)
|
(440.0
|
)
|
(246.9
|
)
|
||||||
|
Financing activities
|
(649.6
|
)
|
(397.7
|
)
|
(608.1
|
)
|
||||||
|
Effect of exchange rate changes on cash
|
16.8
|
|
(10.5
|
)
|
(96.7
|
)
|
||||||
|
Cash (used for) provided by continuing operations
|
$
|
(115.5
|
)
|
$
|
99.1
|
|
$
|
236.0
|
|
|||
The following table summarizes free cash flow (in millions), which is a non-GAAP financial measure:
|
|
Year Ended September 30,
|
|||||||||||
|
|
2017
|
2016
|
2015
|
|||||||||
|
Cash provided by continuing operating activities
|
$
|
1,034.0
|
|
$
|
947.3
|
|
$
|
1,187.7
|
|
|||
|
Capital expenditures
|
(141.7
|
)
|
(116.9
|
)
|
(122.9
|
)
|
||||||
|
Excess income tax benefit from share-based compensation
|
—
|
|
3.3
|
|
12.4
|
|
||||||
|
Free cash flow
|
$
|
892.3
|
|
$
|
833.7
|
|
$
|
1,077.2
|
|
|||
Our definition of free cash flow takes into consideration capital investments required to maintain our businesses' operations and execute our strategy. Cash provided by continuing operating activities adds back non-cash depreciation expense to earnings but does not reflect a charge for necessary capital expenditures. Our definition of free cash flow excludes the operating cash flows and capital expenditures related to our discontinued operations, if any. Operating, investing and financing cash flows of our discontinued operations, if any, are presented separately in our statement of cash flows. In the first quarter of fiscal year 2017, we adopted a new share-based compensation accounting standard that requires the excess income tax benefit from share-based compensation to be classified as an operating, rather than as a financing, cash flow. In previous periods, we added this benefit back to our calculation of free cash flow in order to generally classify cash flows arising from income taxes as operating cash flows. Beginning in the first quarter of fiscal year 2017, no adjustment is necessary as this benefit is already included in operating cash flows. In our opinion, free cash flow provides useful information to investors regarding our ability to generate cash from business operations that is available for acquisitions and other investments, service of debt principal, dividends and share repurchases. We use free cash flow, as defined, as one measure to monitor and evaluate our performance, including as a financial measure for our annual incentive compensation. Our definition of free cash flow may differ from definitions used by other companies.
Cash provided by operating activities was
$1,034.0 million
for the year ended
September 30, 2017
compared to
$947.3 million
for the year ended
September 30, 2016
. Free cash flow was
$892.3 million
for the year ended
September 30, 2017
compared to
$833.7 million
for the year ended
September 30, 2016
. The year-over-year increases in cash provided by operating activities and free cash flow were primarily due to lower incentive compensation and income tax payments, partially offset by a voluntary contribution of $200.0 million to our U.S. qualified pension plan in
2017
.
We repurchased approximately
2.3 million
shares of our common stock under our share repurchase program in
2017
at a total cost of
$336.6 million
. In
2016
, we repurchased approximately
4.6 million
shares of our common stock under our share repurchase program at a total cost of
$500.2 million
. At
September 30, 2017
there were no outstanding common stock share repurchases recorded in accounts payable. At
September 30, 2016
, there were
$5.3 million
of outstanding common stock share repurchases recorded in accounts payable that did not settle until
2017
. Our decision to repurchase shares in
2018
will depend on business conditions, free cash flow generation, other cash requirements and stock price. On April 6, 2016, the Board of Directors authorized us to expend an additional $1.0 billion to repurchase shares of our common stock. At
September 30, 2017
we had approximately
$608.4 million
remaining for share repurchases under our existing board authorization. See Part II, Item 5.
Market for the Company’s Common Equity, Related Stockholder Matters and Issuer Purchases of Equity Securities
, for additional information regarding share repurchases.
29
We expect future uses of cash to include working capital requirements, capital expenditures, additional contributions to our retirement plans, acquisitions of businesses, dividends to shareowners, repurchases of common stock and repayments of debt, including the current portion of long-term debt. We expect capital expenditures in
2018
to be about
$160 million
. We expect to fund the
$250.0 million
current portion of long term debt due December 2017 with the issuance of commercial paper. We expect to fund future uses of cash with a combination of existing cash balances and short-term investments, cash generated by operating activities, commercial paper borrowings or a new issuance of debt or other securities.
Given our extensive international operations, significant amounts of our cash, cash equivalents and short-term investments (funds) are held by non-U.S. subsidiaries where our undistributed earnings are indefinitely reinvested. Generally, these funds would be subject to U.S. tax if repatriated. As of
September 30, 2017
, substantially all of our funds were held by these non-U.S. subsidiaries. The percentage of these funds held by non-U.S. subsidiaries can vary from quarter to quarter although substantially all of our funds were held by these non-U.S. subsidiaries on average over the past eight quarters. We have not encountered and do not expect to encounter any difficulty meeting the liquidity requirements of our domestic and international operations.
In addition to cash generated by operating activities, we have access to existing financing sources, including the public debt markets and unsecured credit facilities with various banks. Our short-term debt obligations are primarily comprised of commercial paper borrowings. Commercial paper borrowings outstanding were
$350.0 million
at
September 30, 2017
, with a weighted average interest rate of
1.26 percent
and weighted average maturity period of
10 days
. Commercial paper borrowings outstanding were
$448.6 million
at
September 30, 2016
, with a weighted average interest rate of
0.57 percent
and weighted average maturity period of
35 days
.
At
September 30, 2017
and
2016
, our total current borrowing capacity under our unsecured revolving credit facility expiring in March 2020 was
$1.0 billion
. We can increase the aggregate amount of this credit facility by up to
$350.0 million
, subject to the consent of the banks in the credit facility. We have not borrowed against this credit facility during the years ended
September 30, 2017
or
2016
. In December 2016, we amended the financial covenant under this credit facility. The previous financial covenant, which limited our debt-to-total-capital ratio to 60 percent, was replaced with a minimum EBITDA-to-interest ratio of 3.0 to 1.0. The EBITDA-to-interest ratio is defined in the amendment as the ratio of consolidated EBITDA (as defined in the amendment) for the preceding four quarters to consolidated interest expense for the same period. We believe the new covenant provides us greater financial flexibility. Separate short-term unsecured credit facilities of approximately
$128.4 million
at
September 30, 2017
were available to non-U.S. subsidiaries. Borrowings under our non-U.S. credit facilities at
September 30, 2017
and
September 30, 2016
were not significant. We were in compliance with all covenants under our credit facilities at
September 30, 2017
and
September 30, 2016
. Additional information related to our credit facilities is included in Note 5 in the Financial Statements.
Among other uses, we can draw on our credit facility as a standby liquidity facility to repay our outstanding commercial paper as it matures. This access to funds to repay maturing commercial paper is an important factor in maintaining the short-term credit ratings set forth in the table below. Under our current policy with respect to these ratings, we expect to limit our other borrowings under our credit facility, if any, to amounts that would leave enough credit available under the facility so that we could borrow, if needed, to repay all of our then outstanding commercial paper as it matures.
The following is a summary of our credit ratings as of
September 30, 2017
:
|
|
|
|
|
|||
|
Credit Rating Agency
|
Short Term Rating
|
Long Term Rating
|
Outlook
|
|||
|
Standard & Poor’s
|
A-1
|
A
|
Stable
|
|||
|
Moody’s
|
P-2
|
A3
|
Stable
|
|||
|
Fitch Ratings
|
F1
|
A
|
Stable
|
|||
Our ability to access the commercial paper market, and the related costs of these borrowings, is affected by the strength of our credit ratings and market conditions. We have not experienced any difficulty in accessing the commercial paper market to date. If our access to the commercial paper market is adversely affected due to a change in market conditions or otherwise, we would expect to rely on a combination of available cash and our unsecured committed credit facility to provide short-term funding. In such event, the cost of borrowings under our unsecured committed credit facility could be higher than the cost of commercial paper borrowings.
We regularly monitor the third-party depository institutions that hold our cash and cash equivalents and short-term investments. We diversify our cash and cash equivalents and short-term investments among counterparties to minimize exposure to any one of these entities. Our emphasis is primarily on safety and liquidity of principal and secondarily on maximizing yield on those funds.
30
We use foreign currency forward exchange contracts to manage certain foreign currency risks. We enter into these contracts to hedge our exposure to foreign currency exchange rate variability in the expected future cash flows associated with certain third-party and intercompany transactions denominated in foreign currencies forecasted to occur within the next two years. We also use these contracts to hedge portions of our net investments in certain non-U.S. subsidiaries against the effect of exchange rate fluctuations on the translation of foreign currency balances to the U.S. dollar. In addition, we use foreign currency forward exchange contracts that are not designated as hedges to offset transaction gains or losses associated with some of our assets and liabilities resulting from intercompany loans or other transactions with third parties that are denominated in currencies other than our entities' functional currencies. Our foreign currency forward exchange contracts are usually denominated in currencies of major industrial countries. We diversify our foreign currency forward exchange contracts among counterparties to minimize exposure to any one of these entities.
Cash dividends to shareowners were
$390.7 million
in
2017
(
$3.04
per common share),
$378.2 million
in
2016
(
$2.90
per common share) and
$350.1 million
in
2015
(
$2.60
per common share). Our quarterly dividend rate as of
September 30, 2017
is
$0.76
per common share (
$3.04
per common share annually), which is determined at the sole discretion of our Board of Directors.
A summary of our projected contractual cash obligations at
September 30, 2017
is as follows (in millions):
|
|
Payments by Period
|
|||||||||||||||||||||||||||
|
|
Total
|
2018
|
2019
|
2020
|
2021
|
2022
|
Thereafter
|
|||||||||||||||||||||
|
Long-term debt and interest (a)
|
$
|
2,969.3
|
|
$
|
314.6
|
|
$
|
57.6
|
|
$
|
354.0
|
|
$
|
51.4
|
|
$
|
51.4
|
|
$
|
2,140.3
|
|
|||||||
|
Minimum operating lease payments
|
285.0
|
|
73.3
|
|
62.4
|
|
52.1
|
|
36.6
|
|
25.8
|
|
34.8
|
|
||||||||||||||
|
Postretirement benefits (b)
|
77.8
|
|
9.7
|
|
9.3
|
|
6.0
|
|
4.9
|
|
4.7
|
|
43.2
|
|
||||||||||||||
|
Pension funding contribution (c)
|
53.8
|
|
53.8
|
|
—
|
|
—
|
|
—
|
|
—
|
|
—
|
|
||||||||||||||
|
Purchase obligations (d)
|
48.2
|
|
22.2
|
|
10.0
|
|
10.2
|
|
3.1
|
|
0.6
|
|
2.1
|
|
||||||||||||||
|
Other long-term liabilities (e)
|
83.0
|
|
11.0
|
|
—
|
|
—
|
|
—
|
|
—
|
|
—
|
|
||||||||||||||
|
Unrecognized tax benefits (f)
|
35.1
|
|
—
|
|
—
|
|
—
|
|
—
|
|
—
|
|
—
|
|
||||||||||||||
|
Total
|
3,552.2
|
|
484.6
|
|
139.3
|
|
422.3
|
|
96.0
|
|
|
82.5
|
|
2,220.4
|
|
|||||||||||||
|
(a)
|
The amounts for long-term debt assume that the respective debt instruments will be outstanding until their scheduled maturity dates. The amounts include interest but exclude the amounts to be paid or received under interest rate swap contracts, including the
$4.6 million
fair value adjustment recorded for the interest rate swap contracts at
September 30, 2017
and the unamortized discount of
$44.8 million
at
September 30, 2017
. The 2018 amount includes the
$250.0 million
5.65% notes due in December 2017. See Note 5 in the Financial Statements for more information regarding our long-term debt.
|
|
(b)
|
Our postretirement benefit plans are unfunded and are subject to change. Amounts reported are estimates of future benefit payments, to the extent estimable.
|
|
(c)
|
Amounts reported for pension funding contributions reflect current estimates of known commitments. Contributions to our pension plans beyond
2018
will depend on future investment performance of our pension plan assets, changes in discount rate assumptions and governmental regulations in effect at the time. Amounts subsequent to
2018
are excluded from the summary above, as these amounts cannot be estimated with certainty. The minimum contribution for our U.S. pension plan as required by the Employee Retirement Income Security Act (ERISA) is currently zero. We may make additional contributions to this plan at the discretion of management.
|
|
(d)
|
This item includes contractual commitments for capital expenditures, certain materials purchases and long-term obligations under agreements with various service providers.
|
|
(e)
|
Other long-term liabilities include environmental remediation costs, conditional asset retirement obligations and indemnification liabilities, net of related receivables. Amounts subsequent to
2018
are excluded from the summary above, as we are unable to make a reasonably reliable estimate of when the liabilities will be paid.
|
|
(f)
|
Amount for unrecognized tax benefits includes accrued interest and penalties. We are unable to make a reasonably reliable estimate of when the liabilities for unrecognized tax benefits will be settled or paid.
|
31
Supplemental Sales Information
We translate sales of subsidiaries operating outside of the United States using exchange rates effective during the respective period. Therefore, changes in currency exchange rates affect our reported sales. Sales by acquired businesses also affect our reported sales. We believe that organic sales, defined as sales excluding the effects of changes in currency exchange rates and acquisitions, which is a non-GAAP financial measure, provides useful information to investors because it reflects regional and operating segment performance from the activities of our businesses without the effect of changes in currency exchange rates and acquisitions. We use organic sales as one measure to monitor and evaluate our regional and operating segment performance. We determine the effect of changes in currency exchange rates by translating the respective period’s sales using the same currency exchange rates that were in effect during the prior year. When we acquire businesses, we exclude sales in the current period for which there are no comparable sales in the prior period. When we divest a business, we exclude sales in the prior period for which there are no comparable sales in the current period. Organic sales growth is calculated by comparing organic sales to reported sales in the prior year, excluding divestitures. We attribute sales to the geographic regions based on the country of destination.
The following is a reconciliation of our reported sales by geographic region to organic sales (in millions):
|
Year Ended September 30, 2016
|
|||||||||||||||||||||||
|
|
Year Ended September 30, 2017
|
||||||||||||||||||||||
|
Sales
|
Effect of
Changes in
Currency
|
Sales
Excluding
Changes in
Currency
|
Effect of
Acquisitions
|
Organic
Sales
|
Sales
|
||||||||||||||||||
|
United States
|
$
|
3,458.4
|
|
$
|
0.5
|
|
$
|
3,458.9
|
|
$
|
(77.9
|
)
|
$
|
3,381.0
|
|
$
|
3,213.4
|
|
|||||
|
Canada
|
343.4
|
|
(2.5
|
)
|
340.9
|
|
(0.1
|
)
|
340.8
|
|
316.4
|
|
|||||||||||
|
Europe, Middle East and Africa
|
1,193.7
|
|
3.7
|
|
1,197.4
|
|
(6.8
|
)
|
1,190.6
|
|
1,147.2
|
|
|||||||||||
|
Asia Pacific
|
866.4
|
|
6.5
|
|
872.9
|
|
(2.4
|
)
|
870.5
|
|
764.4
|
|
|||||||||||
|
Latin America
|
449.4
|
|
6.9
|
|
456.3
|
|
(0.2
|
)
|
456.1
|
|
438.1
|
|
|||||||||||
|
Total Company Sales
|
$
|
6,311.3
|
|
$
|
15.1
|
|
$
|
6,326.4
|
|
$
|
(87.4
|
)
|
$
|
6,239.0
|
|
$
|
5,879.5
|
|
|||||
|
Year Ended September 30, 2015
|
|||||||||||||||||||||||
|
|
Year Ended September 30, 2016
|
||||||||||||||||||||||
|
Sales
|
Effect of
Changes in
Currency
|
Sales
Excluding
Changes in
Currency
|
Effect of
Acquisitions
|
Organic
Sales
|
Sales
|
||||||||||||||||||
|
United States
|
$
|
3,213.4
|
|
$
|
2.1
|
|
$
|
3,215.5
|
|
$
|
(6.9
|
)
|
$
|
3,208.6
|
|
$
|
3,446.8
|
|
|||||
|
Canada
|
316.4
|
|
25.1
|
|
341.5
|
|
—
|
|
341.5
|
|
366.6
|
|
|||||||||||
|
Europe, Middle East and Africa
|
1,147.2
|
|
49.1
|
|
1,196.3
|
|
(1.1
|
)
|
1,195.2
|
|
1,174.0
|
|
|||||||||||
|
Asia Pacific
|
764.4
|
|
31.7
|
|
796.1
|
|
(1.6
|
)
|
794.5
|
|
834.5
|
|
|||||||||||
|
Latin America
|
438.1
|
|
83.0
|
|
521.1
|
|
—
|
|
521.1
|
|
486.0
|
|
|||||||||||
|
Total Company Sales
|
$
|
5,879.5
|
|
$
|
191.0
|
|
$
|
6,070.5
|
|
$
|
(9.6
|
)
|
$
|
6,060.9
|
|
$
|
6,307.9
|
|
|||||
32
The following is a reconciliation of our reported sales by operating segment to organic sales (in millions):
|
Year Ended September 30, 2016
|
|||||||||||||||||||||||
|
|
Year Ended September 30, 2017
|
||||||||||||||||||||||
|
Sales
|
Effect of
Changes in
Currency
|
Sales
Excluding
Changes in
Currency
|
Effect of
Acquisitions
|
Organic
Sales
|
Sales
|
||||||||||||||||||
|
Architecture & Software
|
$
|
2,899.3
|
|
$
|
7.1
|
|
$
|
2,906.4
|
|
$
|
(22.5
|
)
|
$
|
2,883.9
|
|
$
|
2,635.2
|
|
|||||
|
Control Products & Solutions
|
3,412.0
|
|
8.0
|
|
3,420.0
|
|
(64.9
|
)
|
3,355.1
|
|
3,244.3
|
|
|||||||||||
|
Total Company Sales
|
$
|
6,311.3
|
|
$
|
15.1
|
|
$
|
6,326.4
|
|
$
|
(87.4
|
)
|
$
|
6,239.0
|
|
$
|
5,879.5
|
|
|||||
|
Year Ended September 30, 2015
|
|||||||||||||||||||||||
|
|
Year Ended September 30, 2016
|
||||||||||||||||||||||
|
Sales
|
Effect of
Changes in
Currency
|
Sales
Excluding
Changes in
Currency
|
Effect of
Acquisitions
|
Organic
Sales
|
Sales
|
||||||||||||||||||
|
Architecture & Software
|
$
|
2,635.2
|
|
$
|
83.7
|
|
$
|
2,718.9
|
|
$
|
(9.3
|
)
|
$
|
2,709.6
|
|
$
|
2,749.5
|
|
|||||
|
Control Products & Solutions
|
3,244.3
|
|
107.3
|
|
3,351.6
|
|
(0.3
|
)
|
3,351.3
|
|
3,558.4
|
|
|||||||||||
|
Total Company Sales
|
$
|
5,879.5
|
|
$
|
191.0
|
|
$
|
6,070.5
|
|
$
|
(9.6
|
)
|
$
|
6,060.9
|
|
$
|
6,307.9
|
|
|||||
33
Critical Accounting Estimates
We believe the following accounting estimates are the most critical to the understanding of our financial statements as they could have the most significant effect on our reported results and require subjective or complex judgments by management. Accounting principles generally accepted in the United States require us to make estimates and assumptions that affect the reported amounts of assets and liabilities at the date of the consolidated financial statements and revenues and expenses during the periods reported. These estimates are based on our best judgment about current and future conditions, but actual results could differ from those estimates. Refer to Note 1 in the Financial Statements for information regarding our significant accounting policies.
Retirement Benefits — Pension
Pension costs and obligations are actuarially determined and are influenced by assumptions used to estimate these amounts, including the discount rate and the expected rate of return on plan assets. Changes in any of the assumptions and the amortization of differences between the assumptions and actual experience will affect the amount of pension expense in future periods.
Our global pension expense in
2017
was
$175.9 million
compared to
$161.3 million
in
2016
. Approximately 77 percent of our
2017
global pension expense relates to our U.S. pension plan. The actuarial assumptions used to determine our
2017
U.S. pension expense included the following: discount rate of
3.75 percent
(compared to
4.55 percent
for
2016
) and expected rate of return on plan assets of
7.50 percent
(compared to
7.50 percent
for
2016
).
For
2018
our U.S. discount rate will increase to
3.90 percent
from
3.75 percent
in
2017
. The discount rate was set as of our September 30 measurement date and was determined by modeling a portfolio of bonds that match the expected cash flow of our benefit plans.
For
2018
our expected rate of return on U.S. plan assets will remain
7.50 percent
. In estimating the expected return on plan assets, we considered actual returns on plan assets over the long term, adjusted for forward-looking considerations, such as inflation, interest rates, equity performance and the active management of the plan’s invested assets. We also considered our current and expected mix of plan assets in setting this assumption. The financial markets produced positive returns in
2017
. The plan’s debt securities return was positive. The plan’s equity securities return was above the expected return range in
2017
, as U.S. and international equity returns were positive for the year. The actual return for our portfolio of U.S. plan assets was approximately
8.95 percent
annualized for the 15 years ended
September 30, 2017
, and was approximately
7.45 percent
annualized for the 20 years ended
September 30, 2017
.
The target allocations and ranges of long-term expected return for our major categories of U.S. plan assets are as follows:
|
Asset Category
|
Target Allocations
|
Expected Return
|
||||
|
Equity securities
|
55%
|
9%
|
–
|
10%
|
||
|
Debt securities
|
40%
|
4%
|
–
|
6%
|
||
|
Other
|
5%
|
6%
|
–
|
11%
|
||
The changes in our discount rate and return on plan assets have an inverse relationship with our net periodic benefit cost. The change in our discount rate also has an inverse relationship with our projected benefit obligation.
The following chart illustrates the estimated change in projected benefit obligation and annual net periodic benefit cost assuming a change of 25 basis points in the key assumptions for our U.S. pension plans (in millions):
|
|
Pension Benefits
|
|||||||
|
Change in
Projected Benefit
Obligation
|
Change in Net Periodic Benefit Cost
(1)
|
|||||||
|
Discount rate
|
$
|
130.4
|
|
$
|
12.7
|
|
||
|
Return on plan assets
|
—
|
|
6.7
|
|
||||
(1) Change includes both operating and non-operating pension costs.
More information regarding pension benefits is contained in Note 12 in the Financial Statements.
34
Revenue Recognition
—
Customer Incentives
We offer various incentive programs that provide distributors and direct sale customers with cash rebates, account credits or additional products, solutions and services based on meeting specified program criteria. Customer incentives are recognized as a reduction of sales if distributed in cash or customer account credits. Customer incentives are recognized in cost of sales for additional products, solutions and services to be provided. We record accruals at the time of revenue recognition as a current liability within Customer returns, rebates and incentives in our Consolidated Balance Sheet or, where a right of setoff exists, as a reduction of Receivables.
Our primary incentive program provides distributors with cash rebates or account credits based on agreed amounts that vary depending on the customer to whom our distributor ultimately sells the product. A critical assumption used in estimating the accrual for this program is the time period from when revenue is recognized to when the rebate is processed. Our estimate is based primarily on historical experience. If the time period were to change by 10 percent, the effect would be an adjustment to the accrual of approximately
$9.7 million
.
More information regarding our revenue recognition and returns, rebates and incentives policies are contained in Note 1 in the Financial Statements.
Income Taxes
—
Undistributed Earnings
Our annual tax rate depends on the extent earnings are indefinitely reinvested outside the U.S. Indefinite reinvestment is determined by management's judgment about and intentions concerning the future operations of the Company. We have not provided U.S. deferred taxes for
$3,526.0 million
of undistributed earnings of certain non-U.S. subsidiaries, since these earnings have been determined to be indefinitely reinvested outside the U.S. and thus are not subject to U.S. income taxes and foreign withholding taxes. It is not practicable to estimate the amount of additional taxes that may be payable upon distribution of these earnings.
More information regarding income taxes is contained in Note 14 in the Financial Statements.
Recent Accounting Pronouncements
See Note 1 in the Financial Statements regarding recent accounting pronouncements.
35
Item 7A.
Quantitative and Qualitative Disclosures About Market Risk
We are exposed to market risk during the normal course of business from changes in foreign currency exchange rates and interest rates. We manage exposure to these risks through a combination of normal operating and financing activities as well as derivative financial instruments in the form of foreign currency forward exchange contracts. We sometimes use interest rate swap contracts to manage the balance of fixed and floating rate debt.
Foreign Currency Risk
We are exposed to foreign currency risks that arise from normal business operations. These risks include the translation of local currency balances of foreign subsidiaries, transaction gains and losses associated with intercompany loans with foreign subsidiaries and transactions denominated in currencies other than a location’s functional currency. Our objective is to minimize our exposure to these risks through a combination of normal operating activities and the use of foreign currency forward exchange contracts. Contracts are usually denominated in currencies of major industrial countries. The fair value of our foreign currency forward exchange contracts is an asset of
$13.5 million
and a liability of
$36.4 million
at
September 30, 2017
. We enter into these contracts with major financial institutions that we believe to be creditworthy.
We do not enter into derivative financial instruments for speculative purposes. In
2017
and
2016
, the relative strengthening of the U.S. dollar against foreign currencies had an unfavorable impact on our sales and results of operations. While future changes in foreign currency exchange rates are difficult to predict, our sales and profitability may be adversely affected if the U.S. dollar strengthens relative to
2017
levels.
Certain of our locations have assets and liabilities denominated in currencies other than their functional currencies. We enter into foreign currency forward exchange contracts to offset the transaction gains or losses associated with some of these assets and liabilities. For such assets and liabilities without offsetting foreign currency forward exchange contracts, a 10 percent adverse change in the underlying foreign currency exchange rates would reduce our pre-tax income by approximately $21.4 million.
We record all derivatives on the balance sheet at fair value regardless of the purpose for holding them. The use of foreign currency forward exchange contracts allows us to manage transactional exposure to exchange rate fluctuations as the gains or losses incurred on these contracts will offset, in whole or in part, losses or gains on the underlying foreign currency exposure. Derivatives that are not designated as hedges for accounting purposes are adjusted to fair value through earnings. For derivatives that are hedges, depending on the nature of the hedge, changes in fair value are either offset by changes in the fair value of the hedged assets, liabilities or firm commitments through earnings or recognized in other comprehensive loss until the hedged item is recognized in earnings. We recognize the ineffective portion of a derivative’s change in fair value in earnings immediately. There was no impact on earnings due to ineffective hedges in
2017
or
2016
. A hypothetical 10 percent adverse change in underlying foreign currency exchange rates associated with the hedged exposures and related contracts would not be significant to our financial condition or results of operations.
Interest Rate Risk
In addition to existing cash balances and cash provided by normal operating activities, we use a combination of short-term and long-term debt to finance operations. We are exposed to interest rate risk on certain of these debt obligations.
Our short-term debt obligations are primarily comprised of commercial paper borrowings. Commercial paper borrowings outstanding were
$350.0 million
at
September 30, 2017
, with a weighted average interest rate of
1.26 percent
and weighted average maturity period of
10 days
. Commercial paper borrowings outstanding were
$448.6 million
at
September 30, 2016
, with a weighted average interest rate of
0.57 percent
and weighted average maturity period of
35 days
. We have issued, and anticipate continuing to issue, additional short-term commercial paper obligations as needed. Changes in market interest rates on commercial paper borrowings affect our results of operations. A hypothetical 50 basis point increase in average market interest rates related to our short-term debt would not be significant to our results of operations or financial condition.
We had outstanding fixed rate long-term debt obligations with a carrying value of
$1,243.4 million
at
September 30, 2017
and
$1,516.3 million
at
September 30, 2016
. The fair value of this debt was
$1,452.6 million
at
September 30, 2017
and
$1,780.5 million
at
September 30, 2016
. The potential reduction in fair value on such fixed-rate debt obligations from a hypothetical 50 basis point increase in market interest rates would not be significant to the overall fair value of our long-term debt. We currently have no plans to repurchase our outstanding fixed-rate instruments before their maturity and, therefore, fluctuations in market interest rates would not have an effect on our results of operations or shareowners’ equity.
In February 2015, we entered into interest rate swap contracts, which we designated as fair value hedges. These interest rate swaps effectively converted the
$600.0 million
aggregate principal amount of our
2.050 percent
notes payable in March 2020 (2020 Notes) and
2.875 percent
notes payable in March 2025 (2025 Notes) to floating rate debt, each at a rate based on three-month LIBOR plus a fixed spread. The effective floating interest rates were
1.755 percent
for the 2020 Notes and
2.165 percent
for the 2025 Notes at
September 30, 2017
. The fair value of our interest rate swap contracts at
September 30, 2017
was a net unrealized
loss
of
$4.6 million
. A hypothetical 50 basis point increase in average market interest rates related to our interest rate swaps would not be significant to our results of operations or financial condition.
36
Item 8.
Financial Statements and Supplementary Data
(in millions, except per share amounts)
|
|
September 30,
|
||||||
|
|
2017
|
2016
|
|||||
|
ASSETS
|
|||||||
|
Current assets:
|
|
|
|||||
|
Cash and cash equivalents
|
$
|
1,410.9
|
|
$
|
1,526.4
|
|
|
|
Short-term investments
|
1,124.6
|
|
902.8
|
|
|||
|
Receivables
|
1,135.5
|
|
1,079.0
|
|
|||
|
Inventories
|
558.7
|
|
526.6
|
|
|||
|
Other current assets
|
191.0
|
|
150.2
|
|
|||
|
Total current assets
|
4,420.7
|
|
4,185.0
|
|
|||
|
Property, net
|
583.9
|
|
578.3
|
|
|||
|
Goodwill
|
1,077.7
|
|
1,073.9
|
|
|||
|
Other intangible assets, net
|
238.0
|
|
255.3
|
|
|||
|
Deferred income taxes
|
443.6
|
|
633.9
|
|
|||
|
Other assets
|
397.8
|
|
374.8
|
|
|||
|
Total
|
$
|
7,161.7
|
|
$
|
7,101.2
|
|
|
|
LIABILITIES AND SHAREOWNERS’ EQUITY
|
|||||||
|
Current liabilities:
|
|
|
|||||
|
Short-term debt
|
$
|
350.4
|
|
$
|
448.6
|
|
|
|
Current portion of long-term debt
|
250.0
|
|
—
|
|
|||
|
Accounts payable
|
623.2
|
|
543.1
|
|
|||
|
Compensation and benefits
|
272.6
|
|
145.6
|
|
|||
|
Advance payments from customers and deferred revenue
|
240.6
|
|
214.5
|
|
|||
|
Customer returns, rebates and incentives
|
188.8
|
|
176.5
|
|
|||
|
Other current liabilities
|
220.2
|
|
447.6
|
|
|||
|
Total current liabilities
|
2,145.8
|
|
1,975.9
|
|
|||
|
Long-term debt
|
1,243.4
|
|
1,516.3
|
|
|||
|
Retirement benefits
|
892.5
|
|
1,430.2
|
|
|||
|
Other liabilities
|
216.4
|
|
188.7
|
|
|||
|
Commitments and contingent liabilities (Note 15)
|
|
|
|||||
|
Shareowners’ equity:
|
|
|
|||||
|
Common stock ($1.00 par value, shares issued: 181.4)
|
181.4
|
|
181.4
|
|
|||
|
Additional paid-in capital
|
1,638.0
|
|
1,588.2
|
|
|||
|
Retained earnings
|
6,103.4
|
|
5,668.4
|
|
|||
|
Accumulated other comprehensive loss
|
(1,179.2
|
)
|
(1,538.8
|
)
|
|||
|
Common stock in treasury, at cost (shares held: 2017, 53.0; 2016, 52.9)
|
(4,080.0
|
)
|
(3,909.1
|
)
|
|||
|
Total shareowners’ equity
|
2,663.6
|
|
1,990.1
|
|
|||
|
Total
|
$
|
7,161.7
|
|
$
|
7,101.2
|
|
|
See Notes to Consolidated Financial Statements.
37
(in millions, except per share amounts)
|
|
Year Ended September 30,
|
||||||||||
|
|
2017
|
2016
|
2015
|
||||||||
|
Sales
|
|
|
|
||||||||
|
Products and solutions
|
$
|
5,628.9
|
|
$
|
5,239.3
|
|
$
|
5,652.2
|
|
||
|
Services
|
682.4
|
|
640.2
|
|
655.7
|
|
|||||
|
|
6,311.3
|
|
5,879.5
|
|
6,307.9
|
|
|||||
|
Cost of sales
|
|
|
|
||||||||
|
Products and solutions
|
(3,254.3
|
)
|
(2,982.1
|
)
|
(3,157.2
|
)
|
|||||
|
Services
|
(432.8
|
)
|
(421.9
|
)
|
(447.6
|
)
|
|||||
|
|
(3,687.1
|
)
|
(3,404.0
|
)
|
(3,604.8
|
)
|
|||||
|
Gross profit
|
2,624.2
|
|
2,475.5
|
|
2,703.1
|
|
|||||
|
Selling, general and administrative expenses
|
(1,591.5
|
)
|
(1,467.4
|
)
|
(1,506.4
|
)
|
|||||
|
Other income (expense) (Note 13)
|
80.9
|
|
6.3
|
|
(5.5
|
)
|
|||||
|
Interest expense
|
(76.2
|
)
|
(71.3
|
)
|
(63.7
|
)
|
|||||
|
Income before income taxes
|
1,037.4
|
|
943.1
|
|
1,127.5
|
|
|||||
|
Income tax provision (Note 14)
|
(211.7
|
)
|
(213.4
|
)
|
(299.9
|
)
|
|||||
|
Net income
|
$
|
825.7
|
|
$
|
729.7
|
|
$
|
827.6
|
|
||
|
Earnings per share:
|
|
|
|
||||||||
|
Basic
|
$
|
6.42
|
|
$
|
5.60
|
|
$
|
6.15
|
|
||
|
Diluted
|
$
|
6.35
|
|
$
|
5.56
|
|
$
|
6.09
|
|
||
|
Weighted average outstanding shares:
|
|
|
|
||||||||
|
Basic
|
128.4
|
|
130.2
|
|
134.5
|
|
|||||
|
Diluted
|
129.9
|
|
131.1
|
|
135.7
|
|
|||||
See Notes to Consolidated Financial Statements.
38
CONSOLIDATED STATEMENT OF COMPREHENSIVE INCOME
(in millions)
|
|
Year Ended September 30,
|
||||||||||
|
|
2017
|
2016
|
2015
|
||||||||
|
Net income
|
$
|
825.7
|
|
$
|
729.7
|
|
$
|
827.6
|
|
||
|
Other comprehensive income (loss):
|
|
|
|
||||||||
|
Pension and other postretirement benefit plan adjustments (net of tax expense (benefit) of $159.3, ($73.7) and ($106.6))
|
312.8
|
|
(142.7
|
)
|
(187.7
|
)
|
|||||
|
Currency translation adjustments
|
57.2
|
|
(42.5
|
)
|
(199.9
|
)
|
|||||
|
Net change in unrealized gains and losses on cash flow hedges (net of tax (benefit) expense of ($2.8), ($6.7) and $4.5)
|
(10.3
|
)
|
(19.0
|
)
|
1.0
|
|
|||||
|
Net change in unrealized gains and losses on available-for-sale investments
|
(0.1
|
)
|
—
|
|
—
|
|
|||||
|
Other comprehensive income (loss)
|
359.6
|
|
(204.2
|
)
|
(386.6
|
)
|
|||||
|
Comprehensive income
|
$
|
1,185.3
|
|
$
|
525.5
|
|
$
|
441.0
|
|
||
See Notes to Consolidated Financial Statements.
39
(in millions)
See Notes to Consolidated Financial Statements.
|
|
Year Ended September 30,
|
|||||||||||
|
|
2017
|
2016
|
2015
|
|||||||||
|
Operating activities:
|
|
|
|
|||||||||
|
Net income
|
$
|
825.7
|
|
$
|
729.7
|
|
$
|
827.6
|
|
|||
|
Adjustments to arrive at cash provided by operating activities:
|
|
|
|
|||||||||
|
Depreciation
|
138.7
|
|
143.3
|
|
133.1
|
|
||||||
|
Amortization of intangible assets
|
30.2
|
|
28.9
|
|
29.4
|
|
||||||
|
Share-based compensation expense
|
38.5
|
|
40.5
|
|
41.5
|
|
||||||
|
Retirement benefit expense
|
176.0
|
|
157.1
|
|
141.3
|
|
||||||
|
Pension contributions
|
(254.9
|
)
|
(44.3
|
)
|
(41.0
|
)
|
||||||
|
Deferred income taxes
|
33.8
|
|
(70.5
|
)
|
(29.3
|
)
|
||||||
|
Gain on sale of business
|
(60.8
|
)
|
—
|
|
—
|
|
—
|
|
||||
|
Net loss (gain) on disposition of property
|
0.1
|
|
1.7
|
|
(0.1
|
)
|
||||||
|
Excess income tax benefit from share-based compensation
|
—
|
|
(3.3
|
)
|
(12.4
|
)
|
||||||
|
Changes in assets and liabilities, excluding effects of acquisitions and foreign currency adjustments:
|
||||||||||||
|
Receivables
|
(53.0
|
)
|
(18.9
|
)
|
73.4
|
|
||||||
|
Inventories
|
(30.4
|
)
|
4.6
|
|
(2.5
|
)
|
||||||
|
Accounts payable
|
81.1
|
|
32.3
|
|
17.3
|
|
||||||
|
Advance payments from customers and deferred revenue
|
21.3
|
|
11.7
|
|
20.7
|
|
||||||
|
Compensation and benefits
|
124.7
|
|
(81.1
|
)
|
(33.9
|
)
|
||||||
|
Income taxes
|
(22.2
|
)
|
(8.9
|
)
|
27.3
|
|
||||||
|
Other assets and liabilities
|
(14.8
|
)
|
24.5
|
|
(4.7
|
)
|
||||||
|
Cash provided by operating activities
|
1,034.0
|
|
947.3
|
|
1,187.7
|
|
||||||
|
Investing activities:
|
|
|
|
|||||||||
|
Capital expenditures
|
(141.7
|
)
|
(116.9
|
)
|
(122.9
|
)
|
||||||
|
Acquisition of businesses, net of cash acquired
|
(1.1
|
)
|
(139.1
|
)
|
(21.2
|
)
|
||||||
|
Purchases of investments
|
(1,444.2
|
)
|
(1,070.7
|
)
|
(867.6
|
)
|
||||||
|
Proceeds from maturities of investments
|
912.6
|
|
886.3
|
|
762.7
|
|
||||||
|
Proceeds from sale of investments
|
62.6
|
|
—
|
|
—
|
|
||||||
|
Proceeds from sale of business
|
94.0
|
|
—
|
|
—
|
|
||||||
|
Proceeds from sale of property
|
1.1
|
|
0.4
|
|
2.1
|
|
||||||
|
Cash used for investing activities
|
(516.7
|
)
|
(440.0
|
)
|
(246.9
|
)
|
||||||
|
Financing activities:
|
|
|
|
|||||||||
|
Net (repayment) issuance of short-term debt
|
(98.2
|
)
|
448.6
|
|
(325.0
|
)
|
||||||
|
Issuance of long-term debt, net of discount and issuance costs
|
—
|
|
—
|
|
594.3
|
|
||||||
|
Cash dividends
|
(390.7
|
)
|
(378.2
|
)
|
(350.1
|
)
|
||||||
|
Purchases of treasury stock
|
(342.6
|
)
|
(507.6
|
)
|
(598.4
|
)
|
||||||
|
Proceeds from the exercise of stock options
|
181.9
|
|
36.2
|
|
60.3
|
|
||||||
|
Excess income tax benefit from share-based compensation
|
—
|
|
3.3
|
|
12.4
|
|
||||||
|
Other financing activities
|
—
|
|
—
|
|
(1.6
|
)
|
||||||
|
Cash used for financing activities
|
(649.6
|
)
|
(397.7
|
)
|
(608.1
|
)
|
||||||
|
Effect of exchange rate changes on cash
|
16.8
|
|
(10.5
|
)
|
(96.7
|
)
|
||||||
|
(Decrease) increase in cash and cash equivalents
|
(115.5
|
)
|
99.1
|
|
236.0
|
|
||||||
|
Cash and cash equivalents at beginning of year
|
1,526.4
|
|
1,427.3
|
|
1,191.3
|
|
||||||
|
Cash and cash equivalents at end of year
|
$
|
1,410.9
|
|
$
|
1,526.4
|
|
$
|
1,427.3
|
|
|||
40
CONSOLIDATED STATEMENT OF SHAREOWNERS’ EQUITY
(in millions, except per share amounts)
|
|
Year Ended September 30,
|
||||||||||
|
|
2017
|
2016
|
2015
|
||||||||
|
Common stock
(no shares issued during years)
|
$
|
181.4
|
|
$
|
181.4
|
|
$
|
181.4
|
|
||
|
Additional paid-in capital
|
|
|
|
||||||||
|
Beginning balance
|
1,588.2
|
|
1,552.1
|
|
1,512.3
|
|
|||||
|
Income tax benefit from share-based compensation
|
—
|
|
3.3
|
|
12.4
|
|
|||||
|
Share-based compensation expense
|
37.4
|
|
39.5
|
|
40.7
|
|
|||||
|
Shares delivered under incentive plans
|
12.4
|
|
(6.7
|
)
|
(13.3
|
)
|
|||||
|
Ending balance
|
1,638.0
|
|
1,588.2
|
|
1,552.1
|
|
|||||
|
Retained earnings
|
|
|
|
||||||||
|
Beginning balance
|
5,668.4
|
|
5,316.9
|
|
4,839.6
|
|
|||||
|
Net income
|
825.7
|
|
729.7
|
|
827.6
|
|
|||||
|
Cash dividends (2017, $3.04 per share; 2016, $2.90 per share; 2015, $2.60 per share)
|
(390.7
|
)
|
(378.2
|
)
|
(350.1
|
)
|
|||||
|
Shares delivered under incentive plans
|
—
|
|
—
|
|
(0.2
|
)
|
|||||
|
Ending balance
|
6,103.4
|
|
5,668.4
|
|
5,316.9
|
|
|||||
|
Accumulated other comprehensive loss
|
|
|
|
||||||||
|
Beginning balance
|
(1,538.8
|
)
|
(1,334.6
|
)
|
(948.0
|
)
|
|||||
|
Other comprehensive income (loss)
|
359.6
|
|
(204.2
|
)
|
(386.6
|
)
|
|||||
|
Ending balance
|
(1,179.2
|
)
|
(1,538.8
|
)
|
(1,334.6
|
)
|
|||||
|
Common stock in treasury, at cost
|
|
|
|
||||||||
|
Beginning balance
|
(3,909.1
|
)
|
(3,459.0
|
)
|
(2,927.2
|
)
|
|||||
|
Purchases
|
(337.3
|
)
|
(500.4
|
)
|
(606.4
|
)
|
|||||
|
Shares delivered under incentive plans
|
166.4
|
|
50.3
|
|
74.6
|
|
|||||
|
Ending balance
|
(4,080.0
|
)
|
(3,909.1
|
)
|
(3,459.0
|
)
|
|||||
|
Total shareowners’ equity
|
$
|
2,663.6
|
|
$
|
1,990.1
|
|
$
|
2,256.8
|
|
||
See Notes to Consolidated Financial Statements.
41
NOTES TO CONSOLIDATED FINANCIAL STATEMENTS
1. Basis of Presentation and Accounting Policies
Rockwell Automation, Inc. (“Rockwell Automation” or “the Company”),
a leader in industrial automation and information, makes its customers more productive and the world more sustainable
.
Basis of Presentation
Our consolidated financial statements are prepared in accordance with accounting principles generally accepted in the United States (U.S. GAAP).
Principles of Consolidation
The accompanying consolidated financial statements include the accounts of the Company and its wholly-owned and controlled majority-owned subsidiaries. Intercompany accounts and transactions have been eliminated in consolidation. Investments in affiliates over which we do not have control but exercise significant influence are accounted for using the equity method of accounting. These affiliated companies are not material individually or in the aggregate to our financial position, results of operations or cash flows.
Use of Estimates
The preparation of consolidated financial statements in accordance with U.S. GAAP requires us to make estimates and assumptions that affect the reported amounts of assets and liabilities at the date of the consolidated financial statements and revenues and expenses during the periods reported. Actual results could differ from those estimates. We use estimates in accounting for, among other items, customer returns, rebates and incentives; allowance for doubtful accounts; excess and obsolete inventory; share-based compensation; acquisitions; product warranty obligations; retirement benefits; litigation, claims and contingencies, including environmental matters, conditional asset retirement obligations and contractual indemnifications; and income taxes. We account for changes to estimates and assumptions prospectively when warranted by factually-based experience.
Revenue Recognition
We recognize revenue when it is realized or realizable and earned. Product and solution sales consist of industrial automation and information solutions; hardware and software products; and custom-engineered systems. Service sales include multi-vendor customer technical support and repair, asset management and optimization consulting and training. All service sales recorded in the Consolidated Statement of Operations are associated with our Control Products & Solutions segment.
For approximately
85 percent
of our consolidated sales, we record sales when all of the following have occurred: persuasive evidence of a sales agreement exists; pricing is fixed or determinable; collection is reasonably assured; and products have been delivered and acceptance has occurred, as may be required according to contract terms, or services have been rendered. Within this category, we will at times enter into arrangements that involve the delivery of multiple products and/or the performance of services, such as installation and commissioning. The timing of delivery, though varied based upon the nature of the undelivered component, is generally short-term in nature. For these arrangements, revenue is allocated to each deliverable based on that element's relative selling price, provided the delivered element has value to customers on a standalone basis and, if the arrangement includes a general right of return, delivery or performance of the undelivered items is probable and substantially in our control. Relative selling price is obtained from sources such as vendor-specific objective evidence, which is based on our separate selling price for that or a similar item, or from third-party evidence such as how competitors have priced similar items. If such evidence is not available, we use our best estimate of the selling price, which includes various internal factors such as our pricing strategy and market factors.
We recognize substantially all of the remainder of our sales as construction-type contracts using either the percentage-of-completion or completed contract methods of accounting. We record sales relating to these contracts using the percentage-of-completion method when we determine that progress toward completion is reasonably and reliably estimable; we use the completed contract method for all others. Under the percentage-of-completion method, we recognize sales and gross profit as work is performed using the relationship between actual costs incurred and total estimated costs at completion. Under the percentage-of-completion method, we adjust sales and gross profit for revisions of estimated total contract costs or revenue in the period the change is identified. We record estimated losses on contracts when they are identified.
42
NOTES TO CONSOLIDATED FINANCIAL STATEMENTS (Continued)
1. Basis of Presentation and Accounting Policies (Continued)
We use contracts and customer purchase orders to determine the existence of a sales agreement. We use shipping documents and customer acceptance, when applicable, to verify delivery. We assess whether the fee is fixed or determinable based on the payment terms associated with the transaction and whether the sales price is subject to refund or adjustment. We assess collectibility based on the creditworthiness of the customer as determined by credit evaluations and analysis, as well as the customer’s payment history.
Shipping and handling costs billed to customers are included in sales and the related costs are included in cost of sales in the Consolidated Statement of Operations.
Returns, Rebates and Incentives
Our primary incentive program provides distributors with cash rebates or account credits based on agreed amounts that vary depending on the customer to whom our distributor ultimately sells the product. We also offer various other incentive programs that provide distributors and direct sale customers with cash rebates, account credits or additional products, solutions and services based on meeting specified program criteria. Certain distributors are offered a right to return product, subject to contractual limitations.
We record accruals for customer returns, rebates and incentives at the time of revenue recognition based primarily on historical experience. Returns, rebates and incentives are recognized as a reduction of sales if distributed in cash or customer account credits. Rebates and incentives are recognized in cost of sales for additional products, solutions and services to be provided. Accruals are reported as a current liability in our balance sheet or, where a right of setoff exists, as a reduction of accounts receivable.
Taxes on Revenue Producing Transactions
Taxes assessed by governmental authorities on revenue producing transactions, including sales, value added, excise and use taxes, are recorded on a net basis (excluded from revenue).
Cash and Cash Equivalents
Cash and cash equivalents include time deposits, certificates of deposit, and other fixed income securities with original maturities of three months or less at the time of purchase.
Short-term Investments
Short-term investments include time deposits, certificates of deposit and other fixed income securities with original maturities longer than three months at the time of purchase and less than one year from period end. All investments meeting the definition of a security are accounted for as available-for-sale and stated at fair value. All other investments are stated at cost, which approximates fair value.
Receivables
We record an allowance for doubtful accounts based on customer-specific analysis and general matters such as current assessments of past due balances and economic conditions. Receivables are stated net of an allowance for doubtful accounts of
$24.9 million
at
September 30, 2017
and
$24.5 million
at
September 30, 2016
. In addition, receivables are stated net of an allowance for certain customer returns, rebates and incentives of
$11.9 million
at
September 30, 2017
and
$7.9 million
at
September 30, 2016
.
Inventories
Inventories are stated at the lower of cost or market using the first-in, first-out (FIFO) or average cost methods. Market is determined on the basis of estimated realizable values.
Property
Property, including internal-use software, is stated at cost. We calculate depreciation of property using the straight-line method over
5
to
40 years
for buildings and improvements,
3
to
20 years
for machinery and equipment and
3
to
8 years
for computer hardware and internal-use software. We capitalize significant renewals and enhancements and write off replaced units. We expense maintenance and repairs, as well as renewals of minor amounts. Property acquired during the year that is accrued within accounts payable or other current liabilities at year end is considered to be a non-cash investing activity and is excluded from cash used for capital expenditures in the Consolidated Statement of Cash Flows. Capital expenditures of
$29.6 million
,
$29.9 million
and
$27.3 million
were accrued within accounts payable and other current liabilities at
September 30, 2017
,
2016
and
2015
, respectively.
43
NOTES TO CONSOLIDATED FINANCIAL STATEMENTS (Continued)
1. Basis of Presentation and Accounting Policies (Continued)
Intangible Assets
Goodwill and other intangible assets generally result from business acquisitions. We account for business acquisitions by allocating the purchase price to tangible and intangible assets acquired and liabilities assumed at their fair values; the excess of the purchase price over the allocated amount is recorded as goodwill.
We review goodwill and other intangible assets with indefinite useful lives for impairment annually or more frequently if events or circumstances indicate impairment may be present. Any excess in carrying value over the estimated fair value is charged to results of operations. We perform our annual impairment test during the second quarter of our fiscal year.
We amortize certain customer relationships on an accelerated basis over the period of which we expect the intangible asset to generate future cash flows. We amortize all other intangible assets with finite useful lives on a straight-line basis over their estimated useful lives. Useful lives assigned range from
3
to
15 years
for trademarks,
8
to
20 years
for customer relationships,
5
to
17 years
for technology and
5
to
30 years
for other intangible assets.
Intangible assets also include costs of software developed or purchased by our software business to be sold, leased or otherwise marketed. Amortization of these computer software products is calculated on a product-by-product basis as the greater of (a) the unamortized cost at the beginning of the year times the ratio of the current year gross revenue for a product to the total of the current and anticipated future gross revenue for that product or (b) the straight-line amortization over the remaining estimated economic life of the product.
Impairment of Long-Lived Assets
We evaluate the recoverability of the recorded amount of long-lived assets whenever events or changes in circumstances indicate that the recorded amount of an asset may not be fully recoverable. Impairment is assessed when the undiscounted expected future cash flows derived from an asset are less than its carrying amount. If we determine that an asset is impaired, we measure the impairment to be recognized as the amount by which the recorded amount of the asset exceeds its fair value. We report assets to be disposed of at the lower of the recorded amount or fair value less cost to sell. We determine fair value using a discounted future cash flow analysis.
Derivative Financial Instruments
We use derivative financial instruments in the form of foreign currency forward exchange contracts to manage certain foreign currency risks. We enter into these contracts to hedge our exposure to foreign currency exchange rate variability in the expected future cash flows associated with certain third-party and intercompany transactions denominated in foreign currencies forecasted to occur within the next two years. We also use these contracts to hedge portions of our net investments in certain non-U.S. subsidiaries against the effect of exchange rate fluctuations on the translation of foreign currency balances to the U.S. dollar. Additionally, we use derivative financial instruments in the form of interest rate swap contracts to manage our borrowing costs of certain long-term debt. We designate and account for these derivative financial instruments as hedges under U.S. GAAP.
Furthermore, we use foreign currency forward exchange contracts that are not designated as hedges to offset transaction gains or losses associated with some of our assets and liabilities resulting from intercompany loans or other transactions with third parties that are denominated in currencies other than our entities' functional currencies. It is our policy to execute such instruments with global financial institutions that we believe to be creditworthy and not to enter into derivative financial instruments for speculative purposes. Foreign currency forward exchange contracts are usually denominated in currencies of major industrial countries.
Foreign Currency Translation
We translate assets and liabilities of subsidiaries operating outside of the United States with a functional currency other than the U.S. dollar into U.S. dollars using exchange rates at the end of the respective period. We translate sales, costs and expenses at average exchange rates effective during the respective period. We report foreign currency translation adjustments as a component of other comprehensive income (loss). Currency transaction gains and losses are included in results of operations in the period incurred.
Research and Development Expenses
We expense research and development (R&D) costs as incurred; these costs were
$348.2 million
in
2017
,
$319.3 million
in
2016
and
$307.3 million
in
2015
. We include R&D expenses in cost of sales in the Consolidated Statement of Operations.
44
NOTES TO CONSOLIDATED FINANCIAL STATEMENTS (Continued)
1. Basis of Presentation and Accounting Policies (Continued)
Income Taxes
We account for uncertain tax positions by determining whether it is more likely than not that a tax position will be sustained upon examination based on the technical merits of the position. For tax positions that meet the more-likely-than-not recognition threshold, we determine the amount of benefit to recognize in the consolidated financial statements based on our assertion of the most likely outcome resulting from an examination, including the resolution of any related appeals or litigation processes.
Earnings Per Share
We present basic and diluted earnings per share (EPS) amounts. Basic EPS is calculated by dividing earnings available to common shareowners, which is income excluding the allocation to participating securities, by the weighted average number of common shares outstanding during the year, excluding unvested restricted stock. Diluted EPS amounts are based upon the weighted average number of common and common-equivalent shares outstanding during the year. We use the treasury stock method to calculate the effect of outstanding share-based compensation awards, which requires us to compute total employee proceeds as the sum of the amount the employee must pay upon exercise of the award and the amount of unearned share-based compensation costs attributed to future services. Share-based compensation awards for which the total employee proceeds of the award exceed the average market price of the same award over the period have an antidilutive effect on EPS, and accordingly, we exclude them from the calculation. Antidilutive share-based compensation awards for the years ended
September 30, 2017
(
0.7 million
shares),
2016
(
2.2 million
shares) and
2015
(
1.4 million
shares) were excluded from the diluted EPS calculation. U.S. GAAP requires unvested share-based payment awards that contain non-forfeitable rights to dividends or dividend equivalents, whether paid or unpaid, to be treated as participating securities and included in the computation of earnings per share pursuant to the two-class method. Our participating securities are composed of unvested restricted stock and non-employee director restricted stock units.
The following table reconciles basic and diluted EPS amounts (in millions, except per share amounts):
|
2017
|
2016
|
2015
|
||||||||||
|
Net income
|
$
|
825.7
|
|
$
|
729.7
|
|
$
|
827.6
|
|
|||
|
Less: Allocation to participating securities
|
(0.9
|
)
|
(0.7
|
)
|
(0.7
|
)
|
||||||
|
Net income available to common shareowners
|
$
|
824.8
|
|
$
|
729.0
|
|
$
|
826.9
|
|
|||
|
Basic weighted average outstanding shares
|
128.4
|
|
130.2
|
|
134.5
|
|
||||||
|
Effect of dilutive securities
|
|
|
|
|||||||||
|
Stock options
|
1.2
|
|
0.9
|
|
1.1
|
|
||||||
|
Performance shares
|
0.3
|
|
—
|
|
0.1
|
|
||||||
|
Diluted weighted average outstanding shares
|
129.9
|
|
131.1
|
|
135.7
|
|
||||||
|
Earnings per share:
|
|
|
|
|||||||||
|
Basic
|
$
|
6.42
|
|
$
|
5.60
|
|
$
|
6.15
|
|
|||
|
Diluted
|
$
|
6.35
|
|
$
|
5.56
|
|
$
|
6.09
|
|
|||
Share-Based Compensation
We recognize share-based compensation expense for equity awards on a straight-line basis over the service period of the award based on the fair value of the award as of the grant date.
Product and Workers’ Compensation Liabilities
We record accruals for product and workers’ compensation claims in the period in which they are probable and reasonably estimable. Our principal self-insurance programs include product liability and workers’ compensation where we self-insure up to a specified dollar amount. Claims exceeding this amount up to specified limits are covered by insurance policies purchased from commercial insurers. We estimate the liability for the majority of the self-insured claims using our claims experience for the periods being valued.
45
NOTES TO CONSOLIDATED FINANCIAL STATEMENTS (Continued)
1. Basis of Presentation and Accounting Policies (Continued)
Environmental Matters
We record liabilities for environmental matters in the period in which our responsibility is probable and the costs can be reasonably estimated. We make changes to the liabilities in the periods in which the estimated costs of remediation change. At third-party environmental sites where more than one potentially responsible party has been identified, we record a liability for our estimated allocable share of costs related to our involvement with the site, as well as an estimated allocable share of costs related to the involvement of insolvent or unidentified parties. If we determine that recovery from insurers or other third parties is probable and a right of setoff exists, we record the liability net of the estimated recovery. If we determine that recovery from insurers or other third parties is probable but a right of setoff does not exist, we record a liability for the total estimated costs of remediation and a receivable for the estimated recovery. At environmental sites where we are the sole responsible party, we record a liability for the total estimated costs of remediation. Ongoing operating and maintenance expenditures included in our environmental remediation obligations are discounted to present value over the probable future remediation period. Our remaining environmental remediation obligations are undiscounted due to subjectivity of timing and/or amount of future cash payments.
Conditional Asset Retirement Obligations
We record liabilities for costs related to legal obligations associated with the retirement of a tangible, long-lived asset that results from the acquisition, construction, development or the normal operation of the long-lived asset. The obligation to perform the asset retirement activity is not conditional even though the timing or method may be conditional.
Recent Accounting Pronouncements
In March 2017, the FASB issued a new standard regarding the presentation of net periodic pension and postretirement benefit costs. This standard requires the service cost component to be reported in the income statement in the same line item as other compensation costs arising from services rendered by the related employees during the period. The other components of net periodic benefit cost are required to be presented separately from the service cost component in either a separate line item or within another appropriate line item with disclosure of where those costs are recorded. This standard also requires that only the service cost component is eligible for capitalization, when applicable. This standard is effective for us for reporting periods starting October 1, 2018. We are currently evaluating the impact the adoption of this standard will have on our consolidated financial statements and related disclosures.
In March 2016, the Financial Accounting Standards Board (FASB) issued a new standard on share-based compensation. This requirement is effective for us no later than October 1, 2017; however, we elected to adopt earlier as of October 1, 2016. This standard requires entities to record the excess income tax benefit or deficiency from share-based compensation within the income tax provision rather than within additional paid-in capital. This change reduced our income tax provision by
$29.0 million
in the year ended
September 30, 2017
. The standard also requires this benefit or deficiency to be classified as an operating cash flow rather than as a financing cash flow. The requirement to record the benefit or deficiency within the income tax provision is effective on a prospective basis. We have elected to adopt the cash flow presentation requirement on a prospective basis. Our adoption of all other requirements under the new standard did not have a material impact on our consolidated financial statements and related disclosures.
In February 2016, the FASB issued a new standard on accounting for leases that requires lessees to recognize right-of-use assets and lease liabilities for most leases, among other changes to existing lease accounting guidance. The new standard also requires additional qualitative and quantitative disclosures about leasing activities. This standard is effective for us for reporting periods beginning October 1, 2019. We are currently evaluating the impact the adoption of this standard will have on our consolidated financial statements and related disclosures.
In May 2014, the FASB issued a new standard on revenue recognition related to contracts with customers. This standard supersedes nearly all existing revenue recognition guidance and involves a five-step principles-based approach to recognizing revenue. The underlying principle is to recognize revenue when promised goods or services are transferred to customers in an amount that reflects the consideration that is expected to be received for those goods or services. The new standard will also require additional qualitative and quantitative disclosures about contracts with customers, significant judgments made in applying the revenue guidance, and assets recognized from the costs to obtain or fulfill a contract. We will adopt this new standard under the modified retrospective method in the first quarter of fiscal 2019, with the cumulative effect of initially applying the guidance recognized in retained earnings at the adoption date. We have established a project plan and a cross-functional implementation team to adopt the new standard. We are in the process of identifying and implementing necessary changes to accounting policies, processes, controls and systems to enable compliance with this new standard. We continue to evaluate the impact the adoption of this standard will have on our consolidated financial statements and related disclosures.
46
NOTES TO CONSOLIDATED FINANCIAL STATEMENTS (Continued)
2. Goodwill and Other Intangible Assets
Changes in the carrying amount of goodwill for the years ended
September 30, 2017
and
2016
were (in millions):
|
Architecture &
Software
|
Control
Products &
Solutions
|
Total
|
||||||||||
|
Balance as of September 30, 2015
|
$
|
388.0
|
|
$
|
640.8
|
|
$
|
1,028.8
|
|
|||
|
Acquisition of businesses
|
35.0
|
|
37.7
|
|
72.7
|
|
||||||
|
Translation
|
(8.5
|
)
|
(19.1
|
)
|
(27.6
|
)
|
||||||
|
Balance as of September 30, 2016
|
414.5
|
|
659.4
|
|
1,073.9
|
|
||||||
|
Acquisition of business
|
—
|
|
0.8
|
|
0.8
|
|
||||||
|
Divestiture of business (Note 13)
|
—
|
|
(10.3
|
)
|
(10.3
|
)
|
||||||
|
Translation
|
2.7
|
|
10.6
|
|
13.3
|
|
||||||
|
Balance as of September 30, 2017
|
$
|
417.2
|
|
$
|
660.5
|
|
$
|
1,077.7
|
|
|||
During the year ended
September 30, 2016
, we recognized goodwill of
$72.7 million
and other intangible assets of
$57.5 million
resulting from three acquisitions. In March 2016, we acquired MagneMotion Inc., a manufacturer of intelligent conveying systems. In September 2016, we acquired Automation Control Products (ACP), a provider of centralized thin client, remote desktop and server management software, and Maverick Technologies (Maverick), a systems integrator. We assigned the full amount of goodwill related to MagneMotion Inc. and ACP to our Architecture & Software segment and the full amount of goodwill related to Maverick to our Control Products & Solutions segment.
47
NOTES TO CONSOLIDATED FINANCIAL STATEMENTS (Continued)
2. Goodwill and Other Intangible Assets (Continued)
Other intangible assets consist of (in millions):
|
|
September 30, 2017
|
|||||||||||
|
Carrying
Amount
|
Accumulated
Amortization
|
Net
|
||||||||||
|
Amortized intangible assets:
|
|
|
|
|||||||||
|
Computer software products
|
$
|
194.8
|
|
$
|
113.2
|
|
$
|
81.6
|
|
|||
|
Customer relationships
|
114.5
|
|
61.5
|
|
53.0
|
|
||||||
|
Technology
|
104.8
|
|
57.9
|
|
46.9
|
|
||||||
|
Trademarks
|
32.3
|
|
21.1
|
|
11.2
|
|
||||||
|
Other
|
11.4
|
|
9.8
|
|
1.6
|
|
||||||
|
Total amortized intangible assets
|
457.8
|
|
263.5
|
|
194.3
|
|
||||||
|
Allen-Bradley
®
trademark not subject to amortization
|
43.7
|
|
—
|
|
43.7
|
|
||||||
|
Total
|
$
|
501.5
|
|
$
|
263.5
|
|
$
|
238.0
|
|
|||
|
|
September 30, 2016
|
|||||||||||
|
Carrying
Amount
|
Accumulated
Amortization
|
Net
|
||||||||||
|
Amortized intangible assets:
|
|
|
|
|||||||||
|
Computer software products
|
$
|
182.4
|
|
$
|
103.4
|
|
$
|
79.0
|
|
|||
|
Customer relationships
|
112.6
|
|
51.9
|
|
60.7
|
|
||||||
|
Technology
|
103.9
|
|
48.5
|
|
55.4
|
|
||||||
|
Trademarks
|
31.4
|
|
17.0
|
|
14.4
|
|
||||||
|
Other
|
11.0
|
|
8.9
|
|
2.1
|
|
||||||
|
Total amortized intangible assets
|
441.3
|
|
229.7
|
|
211.6
|
|
||||||
|
Allen-Bradley
®
trademark not subject to amortization
|
43.7
|
|
—
|
|
43.7
|
|
||||||
|
Total
|
$
|
485.0
|
|
$
|
229.7
|
|
$
|
255.3
|
|
|||
Computer software products represent costs of computer software to be sold, leased or otherwise marketed. Computer software products amortization expense was
$9.8 million
in
2017
,
$11.5 million
in
2016
and
$9.4 million
in
2015
.
Estimated amortization expense is
$27.5 million
in
2018
,
$24.5 million
in
2019
,
$21.4 million
in
2020
,
$20.6 million
in
2021
and
$18.7 million
in
2022
.
We performed our annual evaluation of goodwill and indefinite life intangible assets for impairment as required by U.S. GAAP during the second quarter of
2017
and concluded that these assets are not impaired.
3. Inventories
Inventories consist of (in millions):
|
|
September 30,
|
|||||||
|
|
2017
|
2016
|
||||||
|
Finished goods
|
$
|
218.7
|
|
$
|
215.8
|
|
||
|
Work in process
|
168.0
|
|
158.0
|
|
||||
|
Raw materials
|
172.0
|
|
152.8
|
|
||||
|
Inventories
|
$
|
558.7
|
|
$
|
526.6
|
|
||
48
NOTES TO CONSOLIDATED FINANCIAL STATEMENTS (Continued)
4. Property, net
Property consists of (in millions):
|
|
September 30,
|
|||||||
|
|
2017
|
2016
|
||||||
|
Land
|
$
|
5.2
|
|
$
|
4.5
|
|
||
|
Buildings and improvements
|
351.6
|
|
333.7
|
|
||||
|
Machinery and equipment
|
1,145.8
|
|
1,085.1
|
|
||||
|
Internal-use software
|
461.5
|
|
451.1
|
|
||||
|
Construction in progress
|
131.7
|
|
108.4
|
|
||||
|
Total
|
2,095.8
|
|
1,982.8
|
|
||||
|
Less accumulated depreciation
|
(1,511.9
|
)
|
(1,404.5
|
)
|
||||
|
Property, net
|
$
|
583.9
|
|
$
|
578.3
|
|
||
Long-term debt consists of (in millions):
|
|
September 30,
|
|||||||
|
|
2017
|
2016
|
||||||
|
5.65% notes, payable in December 2017
|
250.0
|
|
250.0
|
|
||||
|
2.050% notes, payable in March 2020
|
298.7
|
|
305.1
|
|
||||
|
2.875% notes, payable in March 2025
|
296.7
|
|
314.4
|
|
||||
|
6.70% debentures, payable in January 2028
|
250.0
|
|
250.0
|
|
||||
|
6.25% debentures, payable in December 2037
|
250.0
|
|
250.0
|
|
||||
|
5.20% debentures, payable in January 2098
|
200.0
|
|
200.0
|
|
||||
|
Unamortized discount and other
|
(52.0
|
)
|
(53.2
|
)
|
||||
|
Total
|
$
|
1,493.4
|
|
$
|
1,516.3
|
|
||
|
Less current portion
|
(250.0
|
)
|
—
|
|
||||
|
Long-term debt
|
1,243.4
|
|
1,516.3
|
|
||||
In February 2015, upon issuance of our notes payable in March 2020 (2020 Notes) and March 2025 (2025 Notes), we entered into fixed-to-floating interest rate swap contracts with multiple banks that effectively converted the
$600.0 million
aggregate principal amount to floating rate debt, each at a rate based on three-month LIBOR plus a fixed spread. The effective floating interest rates were
1.755 percent
for the 2020 Notes and
2.165 percent
for the 2025 Notes at
September 30, 2017
. The aggregate fair value of the interest rate swap contracts at
September 30, 2017
was a net unrealized
loss
of
$4.6 million
. We have designated these swaps as fair value hedges. The individual contracts are recorded in Other liabilities in the Consolidated Balance Sheet with corresponding adjustments to the carrying value of the underlying debt. Additional information related to our interest rate swap contracts is included in Note 9.
At
September 30, 2017
and
2016
, our total borrowing capacity under our unsecured revolving credit facility expiring in
March 2020
was
$1.0 billion
. We can increase the aggregate amount of this credit facility by up to
$350.0 million
, subject to the consent of the banks in the credit facility. We have not borrowed against this credit facility during the years ended
September 30, 2017
or
2016
. Borrowings under this credit facility bear interest based on short-term money market rates in effect during the period the borrowings are outstanding. In December 2016, we amended the financial covenant under this credit facility. The previous financial covenant, which limited our debt-to-total-capital ratio to
60 percent
, was replaced with a minimum EBITDA-to-interest ratio of
3.0
to 1.0. The EBITDA-to-interest ratio is defined in the amendment as the ratio of consolidated EBITDA (as defined in the amendment) for the preceding four quarters to consolidated interest expense for the same period. We believe the new covenant provides us greater financial flexibility. Separate short-term unsecured credit facilities of approximately
$128.4 million
at
September 30, 2017
were available to non-U.S. subsidiaries. Borrowings under our non-U.S. credit facilities at
September 30, 2017
and
2016
were not significant. There are no significant commitment fees or compensating balance requirements under any of our credit facilities.
49
NOTES TO CONSOLIDATED FINANCIAL STATEMENTS - (Continued)
5. Long-term and Short-term Debt (Continued)
Our short-term debt obligations are primarily comprised of commercial paper borrowings. Commercial paper borrowings outstanding were
$350.0 million
at
September 30, 2017
and
$448.6 million
at
September 30, 2016
. The weighted average interest rate of the commercial paper outstanding was
1.26 percent
at
September 30, 2017
and
0.57 percent
at
September 30, 2016
.
Interest payments were
$74.2 million
during
2017
,
$69.2 million
during
2016
and
$60.8 million
during
2015
.
6. Other Current Liabilities
Other current liabilities consist of (in millions):
|
|
September 30,
|
|||||||
|
|
2017
|
2016
|
||||||
|
Unrealized losses on foreign exchange contracts (Note 9)
|
$
|
31.3
|
|
$
|
15.6
|
|
||
|
Product warranty obligations (Note 7)
|
28.5
|
|
28.0
|
|
||||
|
Taxes other than income taxes
|
42.7
|
|
43.1
|
|
||||
|
Accrued interest
|
16.9
|
|
16.9
|
|
||||
|
Income taxes payable
|
32.6
|
|
28.6
|
|
||||
|
Rocky Flats settlement (Note 18)
|
—
|
|
242.5
|
|
||||
|
Other
|
68.2
|
|
72.9
|
|
||||
|
Other current liabilities
|
$
|
220.2
|
|
$
|
447.6
|
|
||
7. Product Warranty Obligations
We record a liability for product warranty obligations at the time of sale to a customer based upon historical warranty experience. Most of our products are covered under a warranty period that runs for twelve months from either the date of sale or installation. We also record a liability for specific warranty matters when they become known and reasonably estimable.
Changes in product warranty obligations were (in millions):
|
|
September 30,
|
|||||||
|
|
2017
|
2016
|
||||||
|
Beginning balance
|
$
|
28.0
|
|
$
|
27.9
|
|
||
|
Warranties recorded at time of sale
|
25.8
|
|
25.0
|
|
||||
|
Adjustments to pre-existing warranties
|
(0.2
|
)
|
1.2
|
|
||||
|
Settlements of warranty claims
|
(25.1
|
)
|
(26.1
|
)
|
||||
|
Ending balance
|
$
|
28.5
|
|
$
|
28.0
|
|
||
50
8. Investments
We invest in certificates of deposit, time deposits, commercial paper and other fixed income securities. All investments meeting the U.S. GAAP definition of a security were classified as available-for-sale as of
September 30, 2017
and
2016
. Unrealized gains and losses on available-for-sale investments are included in our Consolidated Balance Sheet as a component of accumulated other comprehensive loss, net of any deferred taxes. Realized gains and losses are included in net income.
Our investments consist of (in millions):
|
September 30,
|
||||||||
|
2017
|
2016
|
|||||||
|
Certificates of deposit and time deposits
|
$
|
1,005.3
|
|
$
|
902.8
|
|
||
|
Commercial paper
|
20.3
|
|
—
|
|
||||
|
Corporate debt securities
|
199.4
|
|
—
|
|
||||
|
Government securities
|
116.8
|
|
—
|
|
||||
|
Asset-backed securities
|
45.8
|
|
—
|
|
||||
|
Total
|
$
|
1,387.6
|
|
$
|
902.8
|
|
||
Pre-tax gross unrealized gains and losses on available-for-sale investments were not material at
September 30, 2017
. Pre-tax gross realized gains and losses on available-for-sale investments were not material for the years ended
September 30, 2017
and
2016
. At
September 30, 2017
, there were
$1.0 million
of outstanding purchases of investments recorded in accounts payable that did not settle until the next fiscal year.
We evaluated all investments for which the fair value was less than amortized cost for impairment on an individual security basis at
September 30, 2017
. This assessment included consideration of our intent and ability to hold the security and the credit risks specific to each security. We determined that the declines in fair value of these investments were not other than temporary as of
September 30, 2017
, and accordingly we did not recognize any impairment charges in net income.
The table below summarizes the contractual maturities of our investments as of
September 30, 2017
(in millions). Actual maturities may differ from the contractual maturities below as borrowers may have the right to prepay certain obligations.
|
Fair Value
|
||||
|
Less than one year
|
$
|
1,124.6
|
|
|
|
Due in one to five years
|
263.0
|
|
||
|
Total
|
$
|
1,387.6
|
|
|
Classification of our investments as current or noncurrent is based on the nature of the investment and when the investment is reasonably expected to be realized. These investments were included in the following line items within the Consolidated Balance Sheet (in millions):
|
September 30,
|
||||||||
|
2017
|
2016
|
|||||||
|
Short-term investments
|
$
|
1,124.6
|
|
$
|
902.8
|
|
||
|
Other assets
|
263.0
|
|
—
|
|
||||
|
Total
|
$
|
1,387.6
|
|
$
|
902.8
|
|
||
Information regarding the fair value of our investments is contained in Note 9 in the Financial Statements.
9. Derivative Instruments and Fair Value Measurement
We use foreign currency forward exchange contracts and foreign currency denominated debt obligations to manage certain foreign currency risks. We also use interest rate swap contracts to manage risks associated with interest rate fluctuations. The following information explains how we use and value these types of derivative instruments and how they impact our consolidated financial statements.
Additional information related to the impacts of cash flow hedges on other comprehensive income (loss) is included in Note 10.
51
NOTES TO CONSOLIDATED FINANCIAL STATEMENTS (Continued)
9. Derivative Instruments and Fair Value Measurement (Continued)
Types of Derivative Instruments and Hedging Activities
Cash Flow Hedges
We enter into foreign currency forward exchange contracts to hedge our exposure to foreign currency exchange rate variability in the expected future cash flows associated with certain third-party and intercompany transactions denominated in foreign currencies forecasted to occur within the next
two years
(cash flow hedges). We report in other comprehensive income (loss) the effective portion of the gain or loss on derivative financial instruments that we designate and that qualify as cash flow hedges. We reclassify these gains or losses into earnings in the same periods when the hedged transactions affect earnings. To the extent forward exchange contracts designated as cash flow hedges are ineffective, changes in value are recorded in earnings through the maturity date. There was
no impact
on earnings due to ineffective cash flow hedges. At
September 30, 2017
, we had a U.S. dollar-equivalent gross notional amount of
$741.2 million
of foreign currency forward exchange contracts designated as cash flow hedges.
The pre-tax amount of (losses) gains recorded in other comprehensive income (loss) related to cash flow hedges that would have been recorded in the Consolidated Statement of Operations had they not been so designated was (in millions):
|
2017
|
2016
|
2015
|
||||||||||
|
Forward exchange contracts
|
$
|
(16.1
|
)
|
$
|
(6.6
|
)
|
$
|
41.7
|
|
|||
The pre-tax amount of gains (losses) reclassified from accumulated other comprehensive loss into the Consolidated Statement of Operations related to derivative forward exchange contracts designated as cash flow hedges, which offset the related gains and losses on the hedged items during the periods presented, was (in millions):
|
2017
|
2016
|
2015
|
||||||||||
|
Sales
|
$
|
0.3
|
|
$
|
(5.5
|
)
|
$
|
(8.4
|
)
|
|||
|
Cost of sales
|
(2.8
|
)
|
25.5
|
|
44.6
|
|
||||||
|
Selling, general and administrative expenses
|
(0.5
|
)
|
(0.9
|
)
|
—
|
|
||||||
|
Total
|
$
|
(3.0
|
)
|
$
|
19.1
|
|
$
|
36.2
|
|
|||
Approximately
$15.4 million
of pre-tax net unrealized
losses
on cash flow hedges as of
September 30, 2017
will be reclassified into earnings during the next 12 months. We expect that these net unrealized
losses
will be offset when the hedged items are recognized in earnings.
Net Investment Hedges
We use foreign currency forward exchange contracts and foreign currency denominated debt obligations to hedge portions of our net investments in non-U.S. subsidiaries (net investment hedges) against the effect of exchange rate fluctuations on the translation of foreign currency balances to the U.S. dollar. For all instruments that are designated as net investment hedges and meet effectiveness requirements, the net changes in value of the designated hedging instruments are recorded in accumulated other comprehensive loss within shareowners’ equity where they offset gains and losses recorded on our net investments globally. To the extent forward exchange contracts or foreign currency denominated debt designated as net investment hedges are ineffective, changes in value are recorded in earnings through the maturity date. There was
no impact
on earnings due to ineffective net investment hedges. At
September 30, 2017
, we had a gross notional amount of
$677.3 million
of foreign currency forward exchange contracts designated as net investment hedges.
The pre-tax amount of (losses) gains recorded in other comprehensive income (loss) related to net investment hedges that would have been recorded in the Consolidated Statement of Operations had they not been so designated was (in millions):
|
2017
|
2016
|
2015
|
||||||||||
|
Forward exchange contracts
|
$
|
(16.3
|
)
|
$
|
2.3
|
|
$
|
(4.4
|
)
|
|||
|
Foreign currency denominated debt
|
—
|
|
0.8
|
|
1.0
|
|
||||||
|
Total
|
$
|
(16.3
|
)
|
$
|
3.1
|
|
$
|
(3.4
|
)
|
|||
52
NOTES TO CONSOLIDATED FINANCIAL STATEMENTS (Continued)
9. Derivative Instruments and Fair Value Measurement (Continued)
Fair Value Hedges
We use interest rate swap contracts to manage the borrowing costs of certain long-term debt. In February 2015, we issued
$600.0 million
in aggregate principal amount of fixed rate notes. Upon issuance of these notes, we entered into fixed-to-floating interest rate swap contracts that effectively convert these notes from fixed rate debt to floating rate debt. We designate these contracts as fair value hedges because they hedge the changes in fair value of the fixed rate notes resulting from changes in interest rates. The changes in value of these fair value hedges are recorded as gains or losses in interest expense and are offset by the losses or gains on the underlying debt instruments, which are also recorded in interest expense. There was
no impact
on earnings due to ineffective fair value hedges. At
September 30, 2017
, the aggregate notional value of our interest rate swaps designated as fair value hedges was
$600.0 million
.
The pre-tax amount of net
(losses) gains
recognized within the Consolidated Statement of Operations related to derivative instruments designated as fair value hedges, which fully offset the related net
gains and losses
on the hedged debt instruments during the periods presented, was (in millions):
|
2017
|
2016
|
2015
|
||||||||||
|
Interest expense
|
$
|
(24.1
|
)
|
$
|
14.1
|
|
$
|
5.4
|
|
|||
Derivatives Not Designated as Hedging Instruments
Certain of our locations have assets and liabilities denominated in currencies other than their functional currencies resulting from intercompany loans and other transactions with third parties denominated in foreign currencies. We enter into foreign currency forward exchange contracts that we do not designate as hedging instruments to offset the transaction gains or losses associated with some of these assets and liabilities. Gains and losses on derivative financial instruments for which we do not elect hedge accounting are recognized in the Consolidated Statement of Operations in each period, based on the change in the fair value of the derivative financial instruments. At
September 30, 2017
, we had a U.S. dollar-equivalent gross notional amount of
$224.9 million
of foreign currency forward exchange contracts not designated as hedging instruments.
The pre-tax amount of (losses) gains from forward exchange contracts not designated as hedging instruments recognized in the Consolidated Statement of Operations was (in millions):
|
2017
|
2016
|
2015
|
||||||||||
|
Cost of sales
|
$
|
(1.8
|
)
|
$
|
0.9
|
|
$
|
—
|
|
|||
|
Other income (expense)
|
(8.6
|
)
|
(11.1
|
)
|
20.8
|
|
||||||
|
Total
|
$
|
(10.4
|
)
|
$
|
(10.2
|
)
|
$
|
20.8
|
|
|||
53
NOTES TO CONSOLIDATED FINANCIAL STATEMENTS (Continued)
9. Derivative Instruments and Fair Value Measurement (Continued)
Fair Value of Financial Instruments
U.S. GAAP defines fair value as the price that would be received for an asset or paid to transfer a liability (exit price) in an orderly transaction between market participants in the principal or most advantageous market for the asset or liability. U.S. GAAP also classifies the inputs used to measure fair value into the following hierarchy:
|
Level 1:
|
|
Quoted prices in active markets for identical assets or liabilities.
|
|
Level 2:
|
|
Quoted prices in active markets for similar assets or liabilities, quoted prices for identical or similar assets or liabilities in markets that are not active, or inputs other than quoted prices that are observable for the asset or liability.
|
|
Level 3:
|
|
Unobservable inputs for the asset or liability.
|
Derivative Instruments
We recognize all derivative financial instruments as either assets or liabilities at fair value in the Consolidated Balance Sheet. We value our forward exchange contracts using a market approach. We use a valuation model based on inputs including forward and spot prices for currency and interest rate curves. We did not change our valuation techniques during fiscal
2017
,
2016
or
2015
. It is our policy to execute such instruments with major financial institutions that we believe to be creditworthy and not to enter into derivative financial instruments for speculative purposes. We diversify our foreign currency forward exchange contracts among counterparties to minimize exposure to any one of these entities. Our foreign currency forward exchange contracts are usually denominated in currencies of major industrial countries. The U.S. dollar-equivalent gross notional amount of our forward exchange contracts totaled
$1,643.4 million
at
September 30, 2017
. Currency pairs (buy/sell) comprising the most significant contract notional values were United States dollar (USD)/euro, USD/Swiss franc, USD/Canadian dollar and Swiss franc/euro.
We value interest rate swap contracts using a market approach based on observable market inputs including publicized swap curves.
The fair value of our derivatives and their location in our Consolidated Balance Sheet were (in millions):
|
|
|
Fair Value (Level 2)
|
||||||||
|
Derivatives Designated as Hedging Instruments
|
Balance Sheet Location
|
September 30, 2017
|
September 30, 2016
|
|||||||
|
Forward exchange contracts
|
Other current assets
|
$
|
12.4
|
|
$
|
5.2
|
|
|||
|
Forward exchange contracts
|
Other assets
|
0.3
|
|
0.6
|
|
|||||
|
Forward exchange contracts
|
Other current liabilities
|
(19.1
|
)
|
(11.7
|
)
|
|||||
|
Forward exchange contracts
|
Other liabilities
|
(5.1
|
)
|
(1.8
|
)
|
|||||
|
Interest rate swap contracts
|
Other assets
|
—
|
|
19.5
|
|
|||||
|
Interest rate swap contracts
|
Other liabilities
|
(4.6
|
)
|
—
|
|
|||||
|
Total
|
|
$
|
(16.1
|
)
|
$
|
11.8
|
|
|||
|
|
|
Fair Value (Level 2)
|
||||||||
|
Derivatives Not Designated as Hedging Instruments
|
Balance Sheet Location
|
September 30, 2017
|
September 30, 2016
|
|||||||
|
Forward exchange contracts
|
Other current assets
|
$
|
0.8
|
|
$
|
4.4
|
|
|||
|
Forward exchange contracts
|
Other current liabilities
|
(12.2
|
)
|
(3.9
|
)
|
|||||
|
Total
|
|
$
|
(11.4
|
)
|
$
|
0.5
|
|
|||
54
NOTES TO CONSOLIDATED FINANCIAL STATEMENTS (Continued)
9. Derivative Instruments and Fair Value Measurement (Continued)
Investments
We recognize all available-for-sale investments at fair value in the Consolidated Balance Sheet. The valuation methodologies used for our investments measured at fair value are described as follows.
Certificates of deposit and time deposits
— These investments are stated at cost, which approximates fair value.
Commercial paper
— These investments are stated at amortized cost, which approximates fair value.
Corporate debt securities
— Valued at either the yields currently available on comparable securities of issuers with similar credit ratings or valued under a discounted cash flow approach that maximizes observable inputs, such as current yields of similar instruments, but includes adjustments for certain risks that may not be observable such as credit and liquidity risks.
Government securities
— Valued at the most recent closing price on the active market on which the individual securities are traded or, absent an active market, utilizing observable inputs such as closing prices in less frequently traded markets.
Asset-backed securities
— Valued using a discounted cash flow approach that maximizes observable inputs, such as current yields of benchmark instruments, but includes adjustments for certain risks that may not be observable such as credit and liquidity risks.
The methods described above may produce a fair value calculation that may not be indicative of net realizable value or reflective of future fair values. Furthermore, while we believe our valuation methods are appropriate and consistent with other market participants, the use of different methodologies or assumptions to determine the fair value of certain financial instruments could result in a different fair value measurement at the reporting date. We did not hold any Level 3 investments or have any transfers between levels of fair value measurements during the periods presented.
Fair values of our investments were (in millions):
|
September 30, 2017
|
||||||||||||||||
|
Level 1
|
Level 2
|
Level 3
|
Total
|
|||||||||||||
|
Certificates of deposit and time deposits
|
$
|
—
|
|
$
|
1,005.3
|
|
$
|
—
|
|
$
|
1,005.3
|
|
||||
|
Commercial paper
|
—
|
|
20.3
|
|
—
|
|
20.3
|
|
||||||||
|
Corporate debt securities
|
—
|
|
199.4
|
|
—
|
|
199.4
|
|
||||||||
|
Government securities
|
98.9
|
|
17.9
|
|
—
|
|
116.8
|
|
||||||||
|
Asset-backed securities
|
—
|
|
45.8
|
|
—
|
|
45.8
|
|
||||||||
|
Total
|
$
|
98.9
|
|
$
|
1,288.7
|
|
$
|
—
|
|
$
|
1,387.6
|
|
||||
|
September 30, 2016
|
||||||||||||||||
|
Level 1
|
Level 2
|
Level 3
|
Total
|
|||||||||||||
|
Certificates of deposit and time deposits
|
$
|
—
|
|
$
|
902.8
|
|
$
|
—
|
|
$
|
902.8
|
|
||||
|
Commercial paper
|
—
|
|
—
|
|
—
|
|
—
|
|
||||||||
|
Corporate debt securities
|
—
|
|
—
|
|
—
|
|
—
|
|
||||||||
|
Government securities
|
—
|
|
—
|
|
—
|
|
—
|
|
||||||||
|
Asset-backed securities
|
—
|
|
—
|
|
—
|
|
—
|
|
||||||||
|
Total
|
$
|
—
|
|
$
|
902.8
|
|
$
|
—
|
|
$
|
902.8
|
|
||||
55
NOTES TO CONSOLIDATED FINANCIAL STATEMENTS (Continued)
9. Derivative Instruments and Fair Value Measurement (Continued)
Other Financial Instruments
We also hold financial instruments consisting of cash, short-term debt and long-term debt. The fair values of our cash and short-term debt approximate their carrying amounts as reported in our Consolidated Balance Sheet due to the short-term nature of these instruments.
We base the fair value of long-term debt upon quoted market prices for the same or similar issues. The fair value of long-term debt below considers the terms of the debt excluding the impact of derivative and hedging activity. The carrying amount of a portion of our long-term debt is impacted by fixed-to-floating interest rate swap contracts that are designated as fair value hedges.
The following table presents the carrying amounts and estimated fair values of financial instruments not measured at fair value in the Consolidated Balance Sheet (in millions):
|
September 30, 2017
|
|||||||||||||||||||
|
Fair Value
|
|||||||||||||||||||
|
Carrying Amount
|
Total
|
Level 1
|
Level 2
|
Level 3
|
|||||||||||||||
|
Cash and cash equivalents
|
$
|
1,410.9
|
|
$
|
1,410.9
|
|
$
|
1,299.4
|
|
$
|
111.5
|
|
$
|
—
|
|
||||
|
Short-term debt
|
350.4
|
|
350.4
|
|
—
|
|
350.4
|
|
—
|
|
|||||||||
|
Current portion of long-term debt
|
250.0
|
|
251.6
|
|
—
|
|
251.6
|
|
—
|
|
|||||||||
|
Long-term debt
|
1,243.4
|
|
1,452.6
|
|
—
|
|
1,452.6
|
|
—
|
|
|||||||||
|
September 30, 2016
|
|||||||||||||||||||
|
Fair Value
|
|||||||||||||||||||
|
Carrying Amount
|
Total
|
Level 1
|
Level 2
|
Level 3
|
|||||||||||||||
|
Cash and cash equivalents
|
$
|
1,526.4
|
|
$
|
1,526.4
|
|
$
|
1,480.6
|
|
$
|
45.8
|
|
$
|
—
|
|
||||
|
Short-term debt
|
448.6
|
|
448.6
|
|
—
|
|
448.6
|
|
—
|
|
|||||||||
|
Current portion of long-term debt
|
—
|
|
—
|
|
—
|
|
—
|
|
—
|
|
|||||||||
|
Long-term debt
|
1,516.3
|
|
1,780.5
|
|
—
|
|
1,780.5
|
|
—
|
|
|||||||||
56
NOTES TO CONSOLIDATED FINANCIAL STATEMENTS (Continued)
10. Shareowners’ Equity
Common Stock
At
September 30, 2017
, the authorized stock of the Company consisted of
one billion
shares of common stock, par value
$1.00
per share, and
25 million
shares of preferred stock, without par value. At
September 30, 2017
,
10.8 million
shares of authorized common stock were reserved for various incentive plans.
Changes in outstanding common shares are summarized as follows (in millions):
|
2017
|
2016
|
2015
|
|||||||
|
Beginning balance
|
128.5
|
|
132.4
|
|
136.7
|
|
|||
|
Treasury stock purchases
|
(2.3
|
)
|
(4.6
|
)
|
(5.4
|
)
|
|||
|
Shares delivered under incentive plans
|
2.2
|
|
0.7
|
|
1.1
|
|
|||
|
Ending balance
|
128.4
|
|
128.5
|
|
132.4
|
|
|||
At
September 30, 2017
there were no outstanding common stock share repurchases recorded in accounts payable. At
September 30, 2016
there were
$5.3 million
of outstanding common stock share repurchases recorded in accounts payable that did not settle until
2017
.
Accumulated Other Comprehensive Loss
Changes in accumulated other comprehensive loss by component for the years ended
September 30, 2017
,
2016
and
2015
were (in millions):
|
Pension and other postretirement benefit plan adjustments, net of tax (Note 12)
|
Accumulated currency translation adjustments, net of tax
|
Net unrealized gains (losses) on cash flow hedges, net of tax
|
Net unrealized gains (losses) on available-for-sale investments, net of tax
|
Total accumulated other comprehensive loss, net of tax
|
||||||||||||||||
|
Balance as of September 30, 2014
|
$
|
(909.4
|
)
|
$
|
(52.5
|
)
|
$
|
13.9
|
|
$
|
—
|
|
$
|
(948.0
|
)
|
|||||
|
Other comprehensive (loss) income before reclassifications
|
(257.3
|
)
|
(199.9
|
)
|
36.7
|
|
—
|
|
(420.5
|
)
|
||||||||||
|
Amounts reclassified from accumulated other comprehensive loss
|
69.6
|
|
—
|
|
(35.7
|
)
|
—
|
|
33.9
|
|
||||||||||
|
Other comprehensive (loss) income
|
(187.7
|
)
|
(199.9
|
)
|
1.0
|
|
—
|
|
(386.6
|
)
|
||||||||||
|
Balance as of September 30, 2015
|
$
|
(1,097.1
|
)
|
$
|
(252.4
|
)
|
$
|
14.9
|
|
$
|
—
|
|
$
|
(1,334.6
|
)
|
|||||
|
Other comprehensive (loss) income before reclassifications
|
(216.5
|
)
|
(42.5
|
)
|
(3.6
|
)
|
—
|
|
(262.6
|
)
|
||||||||||
|
Amounts reclassified from accumulated other comprehensive loss
|
73.8
|
|
—
|
|
(15.4
|
)
|
—
|
|
58.4
|
|
||||||||||
|
Other comprehensive (loss) income
|
(142.7
|
)
|
(42.5
|
)
|
(19.0
|
)
|
—
|
|
(204.2
|
)
|
||||||||||
|
Balance as of September 30, 2016
|
$
|
(1,239.8
|
)
|
$
|
(294.9
|
)
|
$
|
(4.1
|
)
|
$
|
—
|
|
$
|
(1,538.8
|
)
|
|||||
|
Other comprehensive income (loss) before reclassifications
|
215.2
|
|
57.2
|
|
(12.3
|
)
|
(0.1
|
)
|
260.0
|
|
||||||||||
|
Amounts reclassified from accumulated other comprehensive loss
|
97.6
|
|
—
|
|
2.0
|
|
—
|
|
99.6
|
|
||||||||||
|
Other comprehensive income (loss)
|
$
|
312.8
|
|
$
|
57.2
|
|
$
|
(10.3
|
)
|
$
|
(0.1
|
)
|
$
|
359.6
|
|
|||||
|
Balance as of September 30, 2017
|
$
|
(927.0
|
)
|
$
|
(237.7
|
)
|
$
|
(14.4
|
)
|
$
|
(0.1
|
)
|
$
|
(1,179.2
|
)
|
|||||
57
NOTES TO CONSOLIDATED FINANCIAL STATEMENTS (Continued)
10. Shareowners’ Equity (Continued)
The reclassifications out of accumulated other comprehensive loss to the Consolidated Statement of Operations for the years ended
September 30, 2017
,
2016
and
2015
were (in millions):
|
Year Ended September 30,
|
Affected Line in the Consolidated Statement of Operations
|
||||||||||||
|
|
2017
|
2016
|
2015
|
||||||||||
|
Pension and other postretirement benefit plan adjustments:
|
|||||||||||||
|
Amortization of prior service credit
|
$
|
(9.8
|
)
|
$
|
(14.0
|
)
|
$
|
(17.2
|
)
|
(a)
|
|||
|
Amortization of net actuarial loss
|
155.2
|
|
126.8
|
|
123.2
|
|
(a)
|
||||||
|
Settlements
|
2.8
|
|
—
|
|
—
|
|
(a)
|
||||||
|
148.2
|
|
112.8
|
|
106.0
|
|
Income before income taxes
|
|||||||
|
(50.6
|
)
|
(39.0
|
)
|
(36.4
|
)
|
Income tax provision
|
|||||||
|
$
|
97.6
|
|
$
|
73.8
|
|
$
|
69.6
|
|
Net income
|
||||
|
Net unrealized (gains) losses on cash flow hedges:
|
|||||||||||||
|
Forward exchange contracts
|
$
|
(0.3
|
)
|
$
|
5.5
|
|
$
|
8.4
|
|
Sales
|
|||
|
Forward exchange contracts
|
2.8
|
|
(25.5
|
)
|
(44.6
|
)
|
Cost of sales
|
||||||
|
Forward exchange contracts
|
0.5
|
|
0.9
|
|
—
|
|
Selling, general and administrative expenses
|
||||||
|
3.0
|
|
(19.1
|
)
|
(36.2
|
)
|
Income before income taxes
|
|||||||
|
(1.0
|
)
|
3.7
|
|
0.5
|
|
Income tax provision
|
|||||||
|
$
|
2.0
|
|
$
|
(15.4
|
)
|
$
|
(35.7
|
)
|
Net income
|
||||
|
Total reclassifications
|
$
|
99.6
|
|
$
|
58.4
|
|
$
|
33.9
|
|
Net income
|
|||
(a) Reclassified from accumulated other comprehensive loss into cost of sales and selling, general and administrative expenses. These components are included in the computation of net periodic benefit costs. See Note 12 for further information.
58
NOTES TO CONSOLIDATED FINANCIAL STATEMENTS (Continued)
11. Share-Based Compensation
During
2017
,
2016
and
2015
we recognized
$38.5 million
,
$40.5 million
and
$41.5 million
of pre-tax share-based compensation expense, respectively. The total income tax benefit related to share-based compensation expense was
$12.3 million
,
$12.9 million
and
$13.2 million
during
2017
,
2016
and
2015
, respectively. We recognize compensation expense on grants of share-based compensation awards on a straight-line basis over the service period of each award recipient. As of
September 30, 2017
, total unrecognized compensation cost related to share-based compensation awards was
$34.6 million
, net of estimated forfeitures, which we expect to recognize over a weighted average period of approximately
1.7 years
.
Our 2012 Long-Term Incentives Plan, as amended (2012 Plan), authorizes us to deliver up to
11.8 million
shares of our common stock upon exercise of stock options or upon grant or in payment of stock appreciation rights, performance shares, performance units, restricted stock units and restricted stock. Our 2003 Directors Stock Plan, as amended, authorizes us to deliver up to
0.5 million
shares of our common stock upon exercise of stock options or upon grant of shares of our common stock and restricted stock units. Shares relating to awards under our 2012 Plan, 2008 Long-Term Incentives Plan, as amended, or our 2000 Long-Term Incentives Plan, as amended, that terminate by expiration, forfeiture, cancellation or otherwise without the issuance or delivery of shares will be available for further awards under the 2012 Plan. Approximately
5.6 million
shares under our 2012 Plan and
0.2 million
shares under our 2003 Directors Stock Plan remain available for future grant or payment at
September 30, 2017
. We use treasury stock to deliver shares of our common stock under these plans. Our 2012 Plan does not permit share-based compensation awards to be granted after February 7, 2022.
Stock Options
We have granted non-qualified and incentive stock options to purchase our common stock under various incentive plans at prices equal to the fair market value of the stock on the grant dates. The exercise price for stock options granted under the plans may be paid in cash, already-owned shares of common stock or a combination of cash and such shares. Stock options expire
ten years
after the grant date and vest ratably over
three years
.
The per-share weighted average fair value of stock options granted during the years ended
September 30, 2017
,
2016
and
2015
was
$25.70
,
$21.28
and
$26.70
, respectively. The total intrinsic value of stock options exercised was
$141.1 million
,
$21.9 million
and
$46.1 million
during
2017
,
2016
and
2015
, respectively. We estimated the fair value of each stock option on the date of grant using the Black-Scholes pricing model and the following assumptions:
|
2017
|
2016
|
2015
|
|||||||
|
Average risk-free interest rate
|
1.85
|
%
|
1.76
|
%
|
1.61
|
%
|
|||
|
Expected dividend yield
|
2.21
|
%
|
2.78
|
%
|
2.25
|
%
|
|||
|
Expected volatility
|
24
|
%
|
29
|
%
|
31
|
%
|
|||
|
Expected term (years)
|
5.1
|
|
5.1
|
|
5.1
|
|
|||
The average risk-free interest rate is based on U.S. Treasury security rates corresponding to the expected term in effect as of the grant date. The expected dividend yield is based on the expected annual dividend as a percentage of the market value of our common stock as of the grant date. We determined expected volatility using daily historical volatility of our stock price over the most recent period corresponding to the expected term as of the grant date. We determined the expected term of the stock options using historical data adjusted for the estimated exercise dates of unexercised options.
59
NOTES TO CONSOLIDATED FINANCIAL STATEMENTS (Continued)
11. Share-Based Compensation (Continued)
A summary of stock option activity for the year ended
September 30, 2017
is:
|
Shares
(in thousands)
|
Wtd. Avg.
Exercise
Price
|
Wtd. Avg.
Remaining
Contractual
Term (years)
|
Aggregate
Intrinsic Value
of In-The-Money
Options
(in millions)
|
||||||||||
|
Outstanding at October 1, 2016
|
5,098
|
|
$
|
90.96
|
|
|
|
||||||
|
Granted
|
1,024
|
|
138.09
|
|
|
|
|||||||
|
Exercised
|
(2,168
|
)
|
81.70
|
|
|
|
|||||||
|
Forfeited
|
(59
|
)
|
122.45
|
|
|
|
|||||||
|
Canceled
|
(6
|
)
|
65.54
|
|
|
|
|||||||
|
Outstanding at September 30, 2017
|
3,889
|
|
108.10
|
|
7.2
|
$
|
272.6
|
|
|||||
|
Vested or expected to vest at September 30, 2017
|
2,642
|
|
92.07
|
|
5.7
|
227.6
|
|
||||||
|
Exercisable at September 30, 2017
|
1,847
|
|
92.14
|
|
5.6
|
158.9
|
|
||||||
Performance Share Awards
Certain officers and key employees are also eligible to receive shares of our common stock in payment of performance share awards granted to them. Grantees of performance shares will be eligible to receive shares of our common stock depending upon our total shareowner return, assuming reinvestment of all dividends, relative to the performance of companies in the S&P 500 Index over a
three
-year period. The awards actually earned will range from
zero percent
to
200 percent
of the targeted number of performance shares for the three-year performance periods and will be paid, to the extent earned, in the fiscal quarter following the end of the applicable three-year performance period.
A summary of performance share activity for the year ended
September 30, 2017
is as follows:
|
Performance
Shares
(in thousands)
|
Wtd. Avg.
Grant Date
Share
Fair Value
|
||||||
|
Outstanding at October 1, 2016
|
240
|
|
$
|
98.73
|
|
||
|
Granted
(1)
|
42
|
|
174.37
|
|
|||
|
Adjustment
for performance results achieved
(2)
|
(58
|
)
|
108.48
|
|
|||
|
Vested and issued
|
(6
|
)
|
108.48
|
|
|||
|
Forfeited
|
(28
|
)
|
94.41
|
|
|||
|
Outstanding at September 30, 2017
|
190
|
|
112.64
|
|
|||
|
(1)
|
Performance shares granted assuming achievement of performance goals at target.
|
|
(2)
|
Adjustments were due to the number of shares vested under the fiscal 2014 awards at the end of the three-year performance period ended
September 30, 2016
being lower than the target number of shares.
|
The following table summarizes information about performance shares vested during the years ended September 30,
2017
,
2016
and
2015
:
|
2017
|
2016
|
2015
|
||||||||||
|
Percent payout
|
10
|
%
|
93
|
%
|
187
|
%
|
||||||
|
Shares vested (in thousands)
|
6
|
|
67
|
|
154
|
|
||||||
|
Total fair value of shares vested (in millions)
|
$
|
0.9
|
|
$
|
7.1
|
|
$
|
17.2
|
|
|||
For the three-year performance period ending
September 30, 2017
, the payout will be
187 percent
of the target number of shares, with a maximum of
139,000
shares to be delivered in payment under the awards in
December 2017
.
60
NOTES TO CONSOLIDATED FINANCIAL STATEMENTS (Continued)
11. Share-Based Compensation (Continued)
The per-share fair value of performance share awards granted during the years ended
September 30, 2017
,
2016
and
2015
was
$174.37
,
$87.64
and
$103.70
, respectively, which we determined using a Monte Carlo simulation and the following assumptions:
|
2017
|
2016
|
2015
|
|||||||
|
Average risk-free interest rate
|
1.35
|
%
|
1.21
|
%
|
0.96
|
%
|
|||
|
Expected dividend yield
|
2.20
|
%
|
2.75
|
%
|
2.22
|
%
|
|||
|
Expected volatility
|
23
|
%
|
22
|
%
|
24
|
%
|
|||
The average risk-free interest rate is based on the three-year U.S. Treasury security rate in effect as of the grant date. The expected dividend yield is based on the expected annual dividend as a percentage of the market value of our common stock as of the grant date. The expected volatilities were determined using daily historical volatility for the most recent three-year period as of the grant date.
Restricted Stock and Restricted Stock Units
We grant restricted stock and restricted stock units to certain employees, and non-employee directors may elect to receive a portion of their compensation in restricted stock units. Restrictions on employee restricted stock and employee restricted stock units generally lapse over periods ranging from
one
to
five years
. Director restricted stock units generally are payable upon retirement. We value restricted stock and restricted stock units at the closing market value of our common stock on the date of grant. The weighted average grant date fair value of restricted stock and restricted stock unit awards granted during the years ended
September 30, 2017
,
2016
and
2015
was
$138.32
,
$105.38
and
$115.02
, respectively. The total fair value of shares vested during the years ended
September 30, 2017
,
2016
, and
2015
was
$7.6 million
,
$7.0 million
, and
$8.0 million
, respectively.
A summary of restricted stock and restricted stock unit activity for the year ended
September 30, 2017
is as follows:
|
Restricted
Stock and
Restricted
Stock Units
(in thousands)
|
Wtd. Avg.
Grant Date
Share
Fair Value
|
||||||
|
Outstanding at October 1, 2016
|
156
|
|
$
|
108.63
|
|
||
|
Granted
|
52
|
|
138.32
|
|
|||
|
Vested
|
(54
|
)
|
109.82
|
|
|||
|
Forfeited
|
(13
|
)
|
110.51
|
|
|||
|
Outstanding at September 30, 2017
|
141
|
|
118.87
|
|
|||
We also granted approximately
8,000
shares of unrestricted common stock to non-employee directors during the year ended
September 30, 2017
. The weighted average grant date fair value of the unrestricted stock awards granted during the years ended
September 30, 2017
,
2016
, and
2015
was
$129.68
,
$98.79
and
$111.43
, respectively.
61
NOTES TO CONSOLIDATED FINANCIAL STATEMENTS (Continued)
12. Retirement Benefits
We sponsor funded and unfunded pension plans and other postretirement benefit plans for our employees. The pension plans cover most of our employees and provide for monthly pension payments to eligible employees after retirement. Pension benefits for salaried employees generally are based on years of credited service and average earnings. Pension benefits for hourly employees are primarily based on specified benefit amounts and years of service. Effective July 1, 2010 we closed participation in our U.S. and Canada pension plans to employees hired after June 30, 2010. Employees hired after June 30, 2010 are instead eligible to participate in employee savings plans. The Company contributions are based on age and years of service and range from
3% to 7%
of eligible compensation. Effective October 1, 2010, we also closed participation in our U.K. pension plan to employees hired after September 30, 2010 and these employees are now eligible for a defined contribution plan. Benefits to be provided to plan participants hired before July 1, 2010 or October 1, 2010, respectively, are not affected by these changes. Our policy with respect to funding our pension obligations is to fund the minimum amount required by applicable laws and governmental regulations. We were not required to make contributions to satisfy minimum funding requirements in our U.S. pension plans. However, we made a voluntary contribution of
$200.0 million
to our U.S. qualified pension plan in 2017. We did not make voluntary contributions to our U.S. qualified pension plan in
2016
or
2015
. Other postretirement benefits are primarily in the form of retirement medical plans that cover most of our employees in the U.S. and Canada and provide for the payment of certain medical costs of eligible employees and dependents after retirement.
The components of net periodic benefit cost (income) are (in millions):
|
|
|
|
|
Other Postretirement
|
||||||||||||||||||||
|
|
Pension Benefits
|
Benefits
|
||||||||||||||||||||||
|
|
2017
|
2016
|
2015
|
2017
|
2016
|
2015
|
||||||||||||||||||
|
Service cost
|
$
|
97.0
|
|
$
|
88.0
|
|
$
|
85.7
|
|
$
|
1.4
|
|
$
|
1.3
|
|
$
|
1.5
|
|
||||||
|
Interest cost
|
151.6
|
|
169.5
|
|
167.2
|
|
2.5
|
|
3.3
|
|
4.1
|
|
||||||||||||
|
Expected return on plan assets
|
(225.2
|
)
|
(218.3
|
)
|
(223.2
|
)
|
—
|
|
—
|
|
—
|
|
||||||||||||
|
Amortization:
|
||||||||||||||||||||||||
|
Prior service credit
|
(3.7
|
)
|
(2.9
|
)
|
(2.7
|
)
|
(6.1
|
)
|
(11.1
|
)
|
(14.5
|
)
|
||||||||||||
|
Net actuarial loss
|
152.9
|
|
124.5
|
|
118.7
|
|
2.3
|
|
2.3
|
|
4.5
|
|
||||||||||||
|
Special termination benefit
|
0.5
|
|
0.5
|
|
—
|
|
—
|
|
—
|
|
—
|
|
||||||||||||
|
Settlements
|
2.8
|
|
—
|
|
—
|
|
—
|
|
—
|
|
—
|
|
||||||||||||
|
Net periodic benefit cost (income)
|
$
|
175.9
|
|
$
|
161.3
|
|
$
|
145.7
|
|
$
|
0.1
|
|
$
|
(4.2
|
)
|
$
|
(4.4
|
)
|
||||||
62
NOTES TO CONSOLIDATED FINANCIAL STATEMENTS (Continued)
12. Retirement Benefits (Continued)
Benefit obligation, plan assets, funded status and net liability information is summarized as follows (in millions):
|
|
Pension Benefits
|
Other Postretirement
Benefits
|
||||||||||||||
|
|
2017
|
2016
|
2017
|
2016
|
||||||||||||
|
Benefit obligation at beginning of year
|
$
|
4,785.9
|
|
$
|
4,282.2
|
|
$
|
86.9
|
|
$
|
93.3
|
|
||||
|
Service cost
|
97.0
|
|
88.0
|
|
1.4
|
|
1.3
|
|
||||||||
|
Interest cost
|
151.6
|
|
169.5
|
|
2.5
|
|
3.3
|
|
||||||||
|
Actuarial (gains) losses
|
(221.9
|
)
|
515.4
|
|
(3.8
|
)
|
(0.2
|
)
|
||||||||
|
Plan amendments
|
(6.9
|
)
|
(10.0
|
)
|
—
|
|
—
|
|
||||||||
|
Plan participant contributions
|
3.9
|
|
4.3
|
|
3.4
|
|
4.0
|
|
||||||||
|
Benefits paid
|
(251.9
|
)
|
(232.0
|
)
|
(13.4
|
)
|
(14.9
|
)
|
||||||||
|
Special termination benefit
|
0.5
|
|
0.5
|
|
—
|
|
—
|
|
||||||||
|
Settlements
|
(13.8
|
)
|
—
|
|
—
|
|
—
|
|
||||||||
|
Curtailments
|
(1.0
|
)
|
—
|
|
—
|
|
—
|
|
||||||||
|
Currency translation and other
|
41.6
|
|
(32.0
|
)
|
0.8
|
|
0.1
|
|
||||||||
|
Benefit obligation at end of year
|
4,585.0
|
|
4,785.9
|
|
77.8
|
|
86.9
|
|
||||||||
|
Plan assets at beginning of year
|
3,447.9
|
|
3,262.5
|
|
—
|
|
—
|
|
||||||||
|
Actual return on plan assets
|
315.5
|
|
394.3
|
|
—
|
|
—
|
|
||||||||
|
Company contributions
|
254.9
|
|
44.3
|
|
10.0
|
|
10.9
|
|
||||||||
|
Plan participant contributions
|
3.9
|
|
4.3
|
|
3.4
|
|
4.0
|
|
||||||||
|
Benefits paid
|
(251.9
|
)
|
(232.0
|
)
|
(13.4
|
)
|
(14.9
|
)
|
||||||||
|
Settlements
|
(13.8
|
)
|
—
|
|
—
|
|
—
|
|
||||||||
|
Currency translation and other
|
31.8
|
|
(25.5
|
)
|
—
|
|
—
|
|
||||||||
|
Plan assets at end of year
|
3,788.3
|
|
3,447.9
|
|
—
|
|
—
|
|
||||||||
|
Funded status of plans
|
$
|
(796.7
|
)
|
$
|
(1,338.0
|
)
|
$
|
(77.8
|
)
|
$
|
(86.9
|
)
|
||||
|
Net amount on balance sheet consists of:
|
||||||||||||||||
|
Other assets
|
$
|
10.6
|
|
$
|
0.1
|
|
$
|
—
|
|
$
|
—
|
|
||||
|
Compensation and benefits
|
(11.7
|
)
|
(11.6
|
)
|
(9.5
|
)
|
(10.5
|
)
|
||||||||
|
Retirement benefits
|
(795.6
|
)
|
(1,326.5
|
)
|
(68.3
|
)
|
(76.4
|
)
|
||||||||
|
Net amount on balance sheet
|
$
|
(796.7
|
)
|
$
|
(1,338.0
|
)
|
$
|
(77.8
|
)
|
$
|
(86.9
|
)
|
||||
Amounts included in accumulated other comprehensive loss, net of tax, at
September 30, 2017
and
2016
which have not yet been recognized in net periodic benefit cost are as follows (in millions):
|
|
Pension Benefits
|
Other Postretirement
Benefits
|
||||||||||||||
|
|
2017
|
2016
|
2017
|
2016
|
||||||||||||
|
Prior service cost (credit)
|
$
|
5.3
|
|
$
|
4.9
|
|
$
|
(12.2
|
)
|
$
|
(15.9
|
)
|
||||
|
Net actuarial loss
|
921.9
|
|
1,235.1
|
|
12.0
|
|
15.7
|
|
||||||||
|
Total
|
$
|
927.2
|
|
$
|
1,240.0
|
|
$
|
(0.2
|
)
|
$
|
(0.2
|
)
|
||||
During
2017
, we recognized prior service credits of
$9.8 million
(
$6.4 million
net of tax) and net actuarial losses of
$155.2 million
(
$101.8 million
net of tax) in pension and other postretirement net periodic benefit cost, which were included in accumulated other comprehensive loss at
September 30, 2016
. In
2018
, we expect to recognize prior service credits of
$4.9 million
(
$3.5 million
net of tax), and net actuarial losses of
$115.4 million
(
$75.2 million
net of tax) in pension and other postretirement net periodic benefit cost, which are included in accumulated other comprehensive loss at
September 30, 2017
.
The accumulated benefit obligation for our pension plans was
$4,252.2 million
and
$4,429.1 million
at
September 30, 2017
and
2016
, respectively.
63
NOTES TO CONSOLIDATED FINANCIAL STATEMENTS (Continued)
12. Retirement Benefits (Continued)
Net Periodic Benefit Cost Assumptions
Significant assumptions used in determining net periodic benefit cost included in the Consolidated Statement of Operations for the period ended September 30 are (in weighted averages):
|
Pension Benefits
September 30,
|
Other Postretirement Benefits
September 30,
|
|||||||||||||||||
|
|
2017
|
2016
|
2015
|
2017
|
2016
|
2015
|
||||||||||||
|
U.S. Plans
|
|
|
|
|
|
|
||||||||||||
|
Discount rate
|
3.75
|
%
|
4.55
|
%
|
4.50
|
%
|
3.10
|
%
|
3.85
|
%
|
3.65
|
%
|
||||||
|
Expected return on plan assets
|
7.50
|
%
|
7.50
|
%
|
7.50
|
%
|
—
|
|
—
|
|
—
|
|
||||||
|
Compensation increase rate
|
3.50
|
%
|
3.75
|
%
|
3.75
|
%
|
—
|
|
—
|
|
—
|
|
||||||
|
Non-U.S. Plans
|
||||||||||||||||||
|
Discount rate
|
1.77
|
%
|
2.67
|
%
|
3.01
|
%
|
2.80
|
%
|
3.60
|
%
|
3.50
|
%
|
||||||
|
Expected return on plan assets
|
5.12
|
%
|
5.21
|
%
|
5.31
|
%
|
—
|
|
—
|
|
—
|
|
||||||
|
Compensation increase rate
|
2.86
|
%
|
3.11
|
%
|
3.16
|
%
|
—
|
|
—
|
|
—
|
|
||||||
Net Benefit Obligation Assumptions
Significant assumptions used in determining the benefit obligations included in the Consolidated Balance Sheet are (in weighted averages):
|
Pension Benefits
September 30,
|
Other Postretirement Benefits
September 30,
|
|||||||||||
|
|
2017
|
2016
|
2017
|
2016
|
||||||||
|
U.S. Plans
|
|
|
|
|
||||||||
|
Discount rate
|
3.90
|
%
|
3.75
|
%
|
3.40
|
%
|
3.10
|
%
|
||||
|
Compensation increase rate
|
3.50
|
%
|
3.50
|
%
|
—
|
|
—
|
|
||||
|
Health care cost trend rate
(1)
|
—
|
|
—
|
|
6.50
|
%
|
6.50
|
%
|
||||
|
Non-U.S. Plans
|
|
|||||||||||
|
Discount rate
|
2.30
|
%
|
1.77
|
%
|
3.20
|
%
|
2.80
|
%
|
||||
|
Compensation increase rate
|
2.99
|
%
|
2.86
|
%
|
—
|
|
—
|
|
||||
|
Health care cost trend rate
(1)
|
—
|
|
—
|
|
4.50
|
%
|
4.95
|
%
|
||||
|
(1)
|
The health care cost trend rate reflects the estimated increase in gross medical claims costs. As a result of the plan amendment adopted effective October 1, 2002, our effective per person retiree medical cost increase is zero percent beginning in 2005 for the majority of our postretirement benefit plans. For our other plans, we assume the gross health care cost trend rate will decrease to
5.50%
in
2019
for U.S. Plans and will not change in
2018
for Non-U.S. Plans.
|
64
NOTES TO CONSOLIDATED FINANCIAL STATEMENTS (Continued)
12. Retirement Benefits (Continued)
In determining the expected long-term rate of return on assets assumption, we consider actual returns on plan assets over the long term, adjusted for forward-looking considerations, such as inflation, interest rates, equity performance and the active management of the plan’s invested assets. We also considered our current and expected mix of plan assets in setting this assumption. This resulted in the selection of the weighted average long-term rate of return on assets assumption. Our global weighted-average targeted and actual asset allocations at September 30, by asset category, are:
|
|
Allocation
|
Target
|
September 30,
|
|||||||
|
Asset Category
|
Range
|
Allocations
|
2017
|
2016
|
||||||
|
Equity securities
|
40%
|
–
|
65%
|
52%
|
50%
|
50%
|
||||
|
Debt securities
|
30%
|
–
|
50%
|
40%
|
42%
|
41%
|
||||
|
Other
|
0%
|
–
|
15%
|
8%
|
8%
|
9%
|
||||
The investment objective for pension funds related to our defined benefit plans is to meet the plan’s benefit obligations, while maximizing the long-term growth of assets without undue risk. We strive to achieve this objective by investing plan assets within target allocation ranges and diversification within asset categories. Target allocation ranges are guidelines that are adjusted periodically based on ongoing monitoring by plan fiduciaries. Investment risk is controlled by rebalancing to target allocations on a periodic basis and ongoing monitoring of investment manager performance relative to the investment guidelines established for each manager.
As of
September 30, 2017
and
2016
, our pension plans do not directly own our common stock.
In certain countries where we operate, there are no legal requirements or financial incentives provided to companies to pre-fund pension obligations. In these instances, we typically make benefit payments directly from cash as they become due, rather than by creating a separate pension fund.
The valuation methodologies used for our pension plans’ investments measured at fair value are described as follows. There have been no changes in the methodologies used at
September 30, 2017
and
2016
.
Common stock
— Valued at the closing price reported on the active market on which the individual securities are traded.
Mutual funds
— Valued at the net asset value (NAV) reported by the fund.
Corporate debt
— Valued at either the yields currently available on comparable securities of issuers with similar credit ratings or valued under a discounted cash flow approach that maximizes observable inputs, such as current yields of similar instruments, but includes adjustments for certain risks that may not be observable such as credit and liquidity risks.
Government securities
— Valued at the most recent closing price on the active market on which the individual securities are traded or, absent an active market, utilizing observable inputs such as closing prices in less frequently traded markets.
Common collective trusts
— Valued at the NAV as determined by the custodian of the fund. The NAV is based on the fair value of the underlying assets owned by the fund, minus its liabilities then divided by the number of units outstanding.
Private equity and alternative equity
— Valued at the estimated fair value, as determined by the respective fund manager, based on the NAV of the investment units held at year end, which is subject to judgment.
Real estate funds
— Consists of the real estate funds, which provide an indirect investment into a diversified and multi-sector portfolio of property assets. Publicly-traded real estate funds are valued at the most recent closing price reported on the SIX Swiss Exchange. The remainder is valued at the estimated fair value, as determined by the respective fund manager, based on the NAV of the investment units held at year end, which is subject to judgment.
Insurance contracts
— Valued at the aggregate amount of accumulated contribution and investment income less amounts used to make benefit payments and administrative expenses which approximates fair value.
Other
— Consists of other fixed income investments and common collective trusts with a mix of equity and fixed income underlying assets. Other fixed income investments are valued at the most recent closing price reported in the markets in which the individual securities are traded, which may be infrequently.
65
NOTES TO CONSOLIDATED FINANCIAL STATEMENTS (Continued)
12. Retirement Benefits (Continued)
The methods described above may produce a fair value calculation that may not be indicative of net realizable value or reflective of future fair values. Furthermore, while we believe our valuation methods are appropriate and consistent with other market participants, the use of different methodologies or assumptions to determine the fair value of certain financial instruments could result in a different fair value measurement at the reporting date. Refer to Note 9 for further information regarding levels in the fair value hierarchy.
In accordance with ASC Subtopic 820-10, certain investments that are measured at fair value using the NAV (or its equivalent) practical expedient have not been classified in the fair value hierarchy. The fair value amounts presented in this table are intended to permit reconciliation of the fair value hierarchy to the line items presented in the consolidated financial statements. The guidance under this subtopic was effective for us starting in fiscal 2017 and is required to be adopted on a retrospective basis. Accordingly, certain investments which were classified in the fair value hierarchy in the prior year are now presented as a single fair value outside of the hierarchy.
The following table presents our pension plans’ investments measured at fair value as of
September 30, 2017
:
|
Level 1
|
Level 2
|
Level 3
|
Total
|
|||||||||||||
|
U.S. Plans
|
||||||||||||||||
|
Cash and cash equivalents
|
$
|
1.1
|
|
$
|
—
|
|
$
|
—
|
|
$
|
1.1
|
|
||||
|
Equity securities:
|
||||||||||||||||
|
Mutual funds
|
230.1
|
|
—
|
|
—
|
|
230.1
|
|
||||||||
|
Common stock
|
911.7
|
|
—
|
|
—
|
|
911.7
|
|
||||||||
|
Common collective trusts
|
—
|
|
411.2
|
|
—
|
|
411.2
|
|
||||||||
|
Fixed income securities:
|
||||||||||||||||
|
Corporate debt
|
—
|
|
663.7
|
|
—
|
|
663.7
|
|
||||||||
|
Government securities
|
247.0
|
|
109.4
|
|
—
|
|
356.4
|
|
||||||||
|
Common collective trusts
|
—
|
|
204.1
|
|
—
|
|
204.1
|
|
||||||||
|
Other types of investments:
|
||||||||||||||||
|
Insurance contracts
|
—
|
|
—
|
|
0.9
|
|
0.9
|
|
||||||||
|
Total U.S. Plans investments in fair value hierarchy
|
$
|
1,389.9
|
|
$
|
1,388.4
|
|
$
|
0.9
|
|
2,779.2
|
|
|||||
|
U.S. Plans investments measured at NAV:
|
||||||||||||||||
|
Private equity
|
49.9
|
|
||||||||||||||
|
Alternative equity
|
61.0
|
|
||||||||||||||
|
Total U.S. Plans investments
|
2,890.1
|
|
||||||||||||||
|
Non-U.S. Plans
|
||||||||||||||||
|
Cash and cash equivalents
|
$
|
3.3
|
|
$
|
—
|
|
$
|
—
|
|
3.3
|
|
|||||
|
Equity securities:
|
||||||||||||||||
|
Common stock
|
57.3
|
|
—
|
|
—
|
|
57.3
|
|
||||||||
|
Common collective trusts
|
—
|
|
311.1
|
|
—
|
|
311.1
|
|
||||||||
|
Fixed income securities:
|
||||||||||||||||
|
Corporate debt
|
—
|
|
37.0
|
|
—
|
|
37.0
|
|
||||||||
|
Government securities
|
1.2
|
|
14.8
|
|
—
|
|
16.0
|
|
||||||||
|
Common collective trusts
|
—
|
|
301.1
|
|
—
|
|
301.1
|
|
||||||||
|
Other types of investments:
|
||||||||||||||||
|
Real estate funds
|
—
|
|
86.6
|
|
—
|
|
86.6
|
|
||||||||
|
Insurance contracts
|
—
|
|
—
|
|
71.5
|
|
71.5
|
|
||||||||
|
Other
|
—
|
|
—
|
|
4.8
|
|
4.8
|
|
||||||||
|
Total Non-U.S. Plans investments in fair value hierarchy
|
$
|
61.8
|
|
$
|
750.6
|
|
$
|
76.3
|
|
888.7
|
|
|||||
|
Non-U.S. Plans investments measured at NAV:
|
||||||||||||||||
|
Real estate funds
|
9.5
|
|
||||||||||||||
|
Total Non-U.S. Plans investments
|
898.2
|
|
||||||||||||||
|
Total investments measured at fair value
|
$
|
3,788.3
|
|
|||||||||||||
66
NOTES TO CONSOLIDATED FINANCIAL STATEMENTS (Continued)
12. Retirement Benefits (Continued)
The following table presents our pension plans’ investments measured at fair value as of
September 30, 2016
:
|
Level 1
|
Level 2
|
Level 3
|
Total
|
|||||||||||||
|
U.S. Plans
|
||||||||||||||||
|
Cash and cash equivalents
|
$
|
2.9
|
|
$
|
—
|
|
$
|
—
|
|
$
|
2.9
|
|
||||
|
Equity securities:
|
||||||||||||||||
|
Mutual funds
|
203.6
|
|
—
|
|
—
|
|
203.6
|
|
||||||||
|
Common stock
|
705.9
|
|
—
|
|
—
|
|
705.9
|
|
||||||||
|
Common collective trusts
|
—
|
|
483.6
|
|
—
|
|
483.6
|
|
||||||||
|
Fixed income securities:
|
||||||||||||||||
|
Corporate debt
|
—
|
|
591.8
|
|
—
|
|
591.8
|
|
||||||||
|
Government securities
|
252.6
|
|
99.5
|
|
—
|
|
352.1
|
|
||||||||
|
Common collective trusts
|
—
|
|
161.4
|
|
—
|
|
161.4
|
|
||||||||
|
Other types of investments:
|
||||||||||||||||
|
Insurance contracts
|
—
|
|
—
|
|
0.9
|
|
0.9
|
|
||||||||
|
Total U.S. Plans investments in fair value hierarchy
|
$
|
1,165.0
|
|
$
|
1,336.3
|
|
$
|
0.9
|
|
2,502.2
|
|
|||||
|
U.S. Plans investments measured at NAV:
|
||||||||||||||||
|
Private equity
|
57.1
|
|
||||||||||||||
|
Alternative equity
|
56.9
|
|
||||||||||||||
|
Total U.S. Plans investments
|
2,616.2
|
|
||||||||||||||
|
Non-U.S. Plans
|
||||||||||||||||
|
Cash and cash equivalents
|
$
|
1.9
|
|
$
|
—
|
|
$
|
—
|
|
1.9
|
|
|||||
|
Equity securities:
|
||||||||||||||||
|
Common stock
|
48.6
|
|
—
|
|
—
|
|
48.6
|
|
||||||||
|
Common collective trusts
|
—
|
|
279.3
|
|
—
|
|
279.3
|
|
||||||||
|
Fixed income securities:
|
||||||||||||||||
|
Corporate debt
|
—
|
|
34.1
|
|
—
|
|
34.1
|
|
||||||||
|
Government securities
|
10.0
|
|
7.6
|
|
—
|
|
17.6
|
|
||||||||
|
Common collective trusts
|
—
|
|
271.1
|
|
—
|
|
271.1
|
|
||||||||
|
Other types of investments:
|
||||||||||||||||
|
Real estate funds
|
—
|
|
85.4
|
|
—
|
|
85.4
|
|
||||||||
|
Insurance contracts
|
—
|
|
—
|
|
79.7
|
|
79.7
|
|
||||||||
|
Other
|
—
|
|
—
|
|
4.8
|
|
4.8
|
|
||||||||
|
Total Non-U.S. Plans investments in fair value hierarchy
|
$
|
60.5
|
|
$
|
677.5
|
|
$
|
84.5
|
|
822.5
|
|
|||||
|
Non-U.S. Plans investments measured at NAV:
|
||||||||||||||||
|
Real estate funds
|
9.2
|
|
||||||||||||||
|
Total Non-U.S. Plans investments
|
831.7
|
|
||||||||||||||
|
Total investments measured at fair value
|
$
|
3,447.9
|
|
|||||||||||||
67
NOTES TO CONSOLIDATED FINANCIAL STATEMENTS (Continued)
12. Retirement Benefits (Continued)
The table below sets forth a summary of changes in fair market value of our pension plans’ Level 3 assets for the year ended
September 30, 2017
:
|
|
Balance October 1, 2016
|
Realized Gains (Losses)
|
Unrealized Gains (Losses)
|
Purchases, Sales, Issuances, and Settlements, Net
|
Balance September 30, 2017
|
|||||||||||||||
|
U.S. Plans
|
||||||||||||||||||||
|
Insurance contracts
|
$
|
0.9
|
|
$
|
—
|
|
$
|
—
|
|
$
|
—
|
|
$
|
0.9
|
|
|||||
|
Non-U.S. Plans
|
||||||||||||||||||||
|
Insurance contracts
|
79.7
|
|
—
|
|
(13.4
|
)
|
5.2
|
|
71.5
|
|
||||||||||
|
Other
|
4.8
|
|
—
|
|
—
|
|
—
|
|
4.8
|
|
||||||||||
|
|
$
|
85.4
|
|
$
|
—
|
|
$
|
(13.4
|
)
|
$
|
5.2
|
|
$
|
77.2
|
|
|||||
The table below sets forth a summary of changes in fair market value of our pension plans’ Level 3 assets for the year ended
September 30, 2016
:
|
Balance October 1, 2015
|
Realized Gains (Losses)
|
Unrealized Gains (Losses)
|
Purchases, Sales, Issuances, and Settlements, Net
|
Balance September 30, 2016
|
||||||||||||||||
|
U.S. Plans
|
||||||||||||||||||||
|
Insurance contracts
|
$
|
0.9
|
|
$
|
—
|
|
$
|
—
|
|
$
|
—
|
|
$
|
0.9
|
|
|||||
|
Non-U.S. Plans
|
||||||||||||||||||||
|
Insurance contracts
|
63.8
|
|
—
|
|
14.5
|
|
1.4
|
|
79.7
|
|
||||||||||
|
Other
|
4.4
|
|
—
|
|
—
|
|
0.4
|
|
4.8
|
|
||||||||||
|
|
$
|
69.1
|
|
$
|
—
|
|
$
|
14.5
|
|
$
|
1.8
|
|
$
|
85.4
|
|
|||||
Estimated Future Payments
We expect to contribute
$53.8 million
related to our worldwide pension plans and
$9.7 million
to our postretirement benefit plans in
2018
.
The following benefit payments, which include employees’ expected future service, as applicable, are expected to be paid (in millions):
|
Pension Benefits
|
Other
Postretirement Benefits
|
|||||||
|
2018
|
$
|
267.1
|
|
$
|
9.7
|
|
||
|
2019
|
258.3
|
|
9.3
|
|
||||
|
2020
|
272.7
|
|
6.0
|
|
||||
|
2021
|
289.0
|
|
4.9
|
|
||||
|
2022
|
305.8
|
|
4.7
|
|
||||
|
2023 – 2027
|
1,451.6
|
|
20.2
|
|
||||
68
NOTES TO CONSOLIDATED FINANCIAL STATEMENTS (Continued)
12. Retirement Benefits (Continued)
Other Postretirement Benefits
A one percentage point change in assumed health care cost trend rates would not have a material impact on our service and interest cost components or postretirement benefit obligation.
Pension Benefits
Information regarding our pension plans with accumulated benefit obligations in excess of the fair value of plan assets (underfunded plans) at September 30,
2017
and
2016
are as follows (in millions):
|
2017
|
2016
|
|||||||
|
Projected benefit obligation
|
$
|
4,280.9
|
|
$
|
4,784.5
|
|
||
|
Accumulated benefit obligation
|
3,956.8
|
|
4,428.0
|
|
||||
|
Fair value of plan assets
|
3,473.6
|
|
3,446.5
|
|
||||
Defined Contribution Savings Plans
We also sponsor certain defined contribution savings plans for eligible employees. Expense related to these plans was
$41.5 million
in
2017
,
$38.6 million
in
2016
and
$46.3 million
in
2015
.
13. Other Income (Expense)
The components of other income (expense) are (in millions):
|
2017
|
2016
|
2015
|
||||||||||
|
Gain on sale of business
|
$
|
60.8
|
|
$
|
—
|
|
$
|
—
|
|
|||
|
Interest income
|
19.6
|
|
12.7
|
|
10.7
|
|
||||||
|
Royalty income
|
8.9
|
|
2.9
|
|
2.9
|
|
||||||
|
Legacy product liability and environmental charges
|
(8.3
|
)
|
(12.7
|
)
|
(19.8
|
)
|
||||||
|
Other
|
(0.1
|
)
|
3.4
|
|
0.7
|
|
||||||
|
Other income (expense)
|
$
|
80.9
|
|
$
|
6.3
|
|
$
|
(5.5
|
)
|
|||
In September 2017, we sold W Interconnections, Inc. and subsidiaries, which was included within our Control Products & Solutions segment, for approximately
$94.0 million
. We recorded a pre-tax gain of
$60.8 million
as a result of this divestiture, which is included within Other Income (Expense) in the Consolidated Statement of Operations.
69
NOTES TO CONSOLIDATED FINANCIAL STATEMENTS (Continued)
14. Income Taxes
Selected income tax data (in millions):
|
2017
|
2016
|
2015
|
||||||||||
|
Components of income before income taxes:
|
|
|
|
|||||||||
|
United States
|
$
|
547.2
|
|
$
|
512.1
|
|
$
|
660.5
|
|
|||
|
Non-United States
|
490.2
|
|
431.0
|
|
467.0
|
|
||||||
|
Total
|
$
|
1,037.4
|
|
$
|
943.1
|
|
$
|
1,127.5
|
|
|||
|
Components of the income tax provision:
|
|
|
|
|||||||||
|
Current:
|
|
|
|
|||||||||
|
United States
|
$
|
67.3
|
|
$
|
175.9
|
|
$
|
238.6
|
|
|||
|
Non-United States
|
109.9
|
|
91.7
|
|
73.6
|
|
||||||
|
State and local
|
0.7
|
|
16.3
|
|
17.0
|
|
||||||
|
Total current
|
177.9
|
|
283.9
|
|
329.2
|
|
||||||
|
Deferred:
|
|
|
|
|||||||||
|
United States
|
44.6
|
|
(53.7
|
)
|
(30.3
|
)
|
||||||
|
Non-United States
|
(14.1
|
)
|
(8.8
|
)
|
2.6
|
|
||||||
|
State and local
|
3.3
|
|
(8.0
|
)
|
(1.6
|
)
|
||||||
|
Total deferred
|
33.8
|
|
(70.5
|
)
|
(29.3
|
)
|
||||||
|
Income tax provision
|
$
|
211.7
|
|
$
|
213.4
|
|
$
|
299.9
|
|
|||
|
Total income taxes paid
|
$
|
211.9
|
|
$
|
299.8
|
|
$
|
313.1
|
|
|||
Effective Tax Rate Reconciliation
The reconciliation between the U.S. federal statutory rate and our effective tax rate was:
|
2017
|
2016
|
2015
|
|||||||
|
Statutory tax rate
|
35.0
|
%
|
35.0
|
%
|
35.0
|
%
|
|||
|
State and local income taxes
|
0.7
|
|
0.6
|
|
0.9
|
|
|||
|
Non-United States taxes
|
(9.3
|
)
|
(8.6
|
)
|
(7.9
|
)
|
|||
|
Tax effect of foreign dividends
|
0.5
|
|
0.1
|
|
(0.2
|
)
|
|||
|
Foreign currency transaction loss
|
(1.9
|
)
|
(0.8
|
)
|
—
|
|
|||
|
Share-based compensation
|
(2.8
|
)
|
—
|
|
—
|
|
|||
|
Research and development tax credit
|
(0.6
|
)
|
(2.0
|
)
|
(0.6
|
)
|
|||
|
Change in valuation allowances
|
0.1
|
|
(0.6
|
)
|
(0.5
|
)
|
|||
|
Domestic manufacturing deduction
|
(0.9
|
)
|
(1.2
|
)
|
(1.2
|
)
|
|||
|
Adjustments for prior period tax matters
|
(0.4
|
)
|
0.4
|
|
0.5
|
|
|||
|
Other
|
—
|
|
(0.3
|
)
|
0.6
|
|
|||
|
Effective income tax rate
|
20.4
|
%
|
22.6
|
%
|
26.6
|
%
|
|||
We operate in certain non-U.S. tax jurisdictions under government-sponsored tax incentive programs, which may be extended if certain additional requirements are met. The program which generates the primary benefit will expire in
2022
. The tax benefit attributable to these programs was
$43.4 million
(
$0.33
per diluted share) in
2017
,
$33.9 million
(
$0.26
per diluted share) in
2016
and
$36.5 million
(
$0.27
per diluted share) in
2015
.
70
NOTES TO CONSOLIDATED FINANCIAL STATEMENTS (Continued)
14. Income Taxes (Continued)
Deferred Taxes
The tax effects of temporary differences that give rise to our net deferred income tax assets (liabilities) at September 30,
2017
and
2016
were (in millions):
|
2017
|
2016
|
|||||||
|
Deferred income tax assets:
|
|
|
||||||
|
Compensation and benefits
|
$
|
18.8
|
|
$
|
16.2
|
|
||
|
Inventory
|
20.2
|
|
18.0
|
|
||||
|
Returns, rebates and incentives
|
45.9
|
|
55.1
|
|
||||
|
Retirement benefits
|
305.5
|
|
493.6
|
|
||||
|
Environmental remediation and other site-related costs
|
33.4
|
|
34.8
|
|
||||
|
Share-based compensation
|
32.4
|
|
40.6
|
|
||||
|
Other accruals and reserves
|
71.3
|
|
60.5
|
|
||||
|
Net operating loss carryforwards
|
20.4
|
|
24.4
|
|
||||
|
Tax credit carryforwards
|
15.3
|
|
13.7
|
|
||||
|
Capital loss carryforwards
|
10.3
|
|
9.9
|
|
||||
|
Other
|
11.1
|
|
11.4
|
|
||||
|
Subtotal
|
584.6
|
|
778.2
|
|
||||
|
Valuation allowance
|
(18.6
|
)
|
(17.3
|
)
|
||||
|
Net deferred income tax assets
|
566.0
|
|
760.9
|
|
||||
|
Deferred income tax liabilities:
|
|
|
||||||
|
Property
|
(74.0
|
)
|
(63.5
|
)
|
||||
|
Intangible assets
|
(45.9
|
)
|
(54.9
|
)
|
||||
|
Other
|
(2.5
|
)
|
(8.6
|
)
|
||||
|
Deferred income tax liabilities
|
(122.4
|
)
|
(127.0
|
)
|
||||
|
Total net deferred income tax assets
|
$
|
443.6
|
|
$
|
633.9
|
|
||
We have not provided U.S. deferred taxes for
$3,526.0 million
of undistributed earnings of certain non-U.S. subsidiaries, since these earnings have been determined to be indefinitely reinvested outside the U.S. and thus are not subject to U.S. income taxes and foreign withholding taxes. It is not practicable to estimate the amount of additional taxes that may be payable upon distribution of these earnings.
We believe it is more likely than not that we will realize our deferred tax assets through the reduction of future taxable income, other than for the deferred tax assets reflected below.
Tax attributes and related valuation allowances at
September 30, 2017
were (in millions):
|
Tax Attribute to be Carried Forward
|
Tax Benefit Amount
|
Valuation Allowance
|
Carryforward
Period Ends |
|||||||||
|
Non-United States net operating loss carryforward
|
$
|
6.2
|
|
$
|
5.8
|
|
2018
|
-
|
2027
|
|||
|
Non-United States net operating loss carryforward
|
4.7
|
|
1.7
|
|
Indefinite
|
|||||||
|
Non-United States capital loss carryforward
|
10.3
|
|
10.3
|
|
Indefinite
|
|||||||
|
United States net operating loss carryforward
|
1.2
|
|
—
|
|
2019
|
-
|
2033
|
|||||
|
United States tax credit carryforward
|
2.2
|
|
—
|
|
2018
|
-
|
2037
|
|||||
|
State and local net operating loss carryforward
|
8.3
|
|
0.2
|
|
2018
|
-
|
2037
|
|||||
|
State tax credit carryforward
|
13.1
|
|
0.6
|
|
2019
|
-
|
2032
|
|||||
|
Total
|
46.0
|
|
18.6
|
|
||||||||
71
NOTES TO CONSOLIDATED FINANCIAL STATEMENTS (Continued)
14. Income Taxes (Continued)
Unrecognized Tax Benefits
A reconciliation of our gross unrecognized tax benefits, excluding interest and penalties, is as follows (in millions):
|
2017
|
2016
|
2015
|
||||||||||
|
Gross unrecognized tax benefits balance at beginning of year
|
$
|
32.4
|
|
$
|
43.9
|
|
$
|
38.9
|
|
|||
|
Additions based on tax positions related to the current year
|
1.9
|
|
2.3
|
|
2.1
|
|
||||||
|
Additions based on tax positions related to prior years
|
10.8
|
|
14.9
|
|
11.6
|
|
||||||
|
Reductions based on tax positions related to prior years
|
(0.1
|
)
|
—
|
|
(1.0
|
)
|
||||||
|
Reductions related to settlements with taxing authorities
|
(7.7
|
)
|
(27.1
|
)
|
(4.3
|
)
|
||||||
|
Reductions related to lapses of statute of limitations
|
(6.3
|
)
|
(1.6
|
)
|
(1.6
|
)
|
||||||
|
Effect of foreign currency translation
|
0.1
|
|
—
|
|
(1.8
|
)
|
||||||
|
Gross unrecognized tax benefits balance at end of year
|
$
|
31.1
|
|
$
|
32.4
|
|
$
|
43.9
|
|
|||
The amount of gross unrecognized tax benefits that would reduce our effective tax rate if recognized was
$31.1 million
,
$32.4 million
and
$43.9 million
at
September 30, 2017
,
2016
and
2015
, respectively.
Accrued interest and penalties related to unrecognized tax benefits were
$4.0 million
and
$5.2 million
at
September 30, 2017
and
2016
, respectively. We recognize interest and penalties related to unrecognized tax benefits in the income tax provision. Benefits (expense) recognized were
$1.2 million
,
($0.1) million
and
$2.4 million
in
2017
,
2016
and
2015
, respectively.
We believe it is reasonably possible that the amount of gross unrecognized tax benefits could be reduced by up to
$9.5 million
in the next 12 months as a result of the resolution of tax matters in various global jurisdictions and the lapses of statutes of limitations. If all of the unrecognized tax benefits were recognized, the net reduction to our income tax provision, including the recognition of interest and penalties and offsetting tax assets, could be up to
$4.4 million
.
We conduct business globally and are routinely audited by the various tax jurisdictions in which we operate. We are no longer subject to U.S. federal income tax examinations for years before
2014
and are no longer subject to state, local and non-U.S. income tax examinations for years before
2003
.
15. Commitments and Contingent Liabilities
Obligations and expected recoveries related to environmental remediation costs, conditional asset retirement obligations and other recorded indemnification matters as of
September 30, 2017
and
2016
are as follows:
|
|
2017
|
2016
|
|||||
|
Environmental remediation costs
|
$
|
67.6
|
|
$
|
73.9
|
|
|
|
Conditional asset retirement obligations
|
21.2
|
|
20.6
|
|
|||
|
Indemnification liabilities
|
12.0
|
|
17.0
|
|
|||
|
Total recorded liabilities
|
100.8
|
|
111.5
|
|
|||
|
Recorded probable expected recoveries
|
(17.8
|
)
|
(22.5
|
)
|
|||
|
Net recorded liabilities
|
$
|
83.0
|
|
$
|
89.0
|
|
|
As of
September 30, 2017
, we have estimated the total reasonably possible costs we could incur from these environmental remediation and indemnification liabilities to be
$121.3 million
(
$98.4 million
, net of related receivables).
Environmental Matters
Federal, state and local requirements relating to the discharge of substances into the environment, the disposal of hazardous wastes and other activities affecting the environment have and will continue to have an effect on our manufacturing operations. Thus far, compliance with environmental requirements and resolution of environmental claims have been accomplished without material effect on our business, financial condition or results of operations.
72
NOTES TO CONSOLIDATED FINANCIAL STATEMENTS (Continued)
15. Commitments and Contingent Liabilities (Continued)
We have been designated as a potentially responsible party at
13
Superfund sites, excluding sites as to which our records disclose no involvement or as to which our potential liability has been finally determined and assumed by third parties. In addition, various other lawsuits, claims and proceedings have been asserted against us seeking remediation of alleged environmental impairments, principally at previously owned properties.
Environmental remediation cost liabilities and related expected recoveries at
September 30, 2017
are as follows (in millions):
|
|
2017
|
||
|
Other current liabilities
|
$
|
10.7
|
|
|
Other liabilities
|
56.9
|
|
|
|
Total recorded environmental remediation costs
(1)
|
67.6
|
|
|
|
Receivables
|
(1.2
|
)
|
|
|
Other assets
|
(10.1
|
)
|
|
|
Total recorded probable expected recoveries
|
(11.3
|
)
|
|
|
Net environmental remediation costs
|
$
|
56.3
|
|
|
(1)
|
Includes
$47.5 million
related to discounted ongoing operating and maintenance expenditures.
|
Based on our assessment, we believe that our expenditures for environmental capital investment and remediation necessary to comply with present regulations governing environmental protection and other expenditures for the resolution of environmental claims will not have a material effect on our business, financial condition or results of operations. We cannot assess the possible effect of compliance with future requirements.
Conditional Asset Retirement Obligations
We accrue for costs related to a legal obligation associated with the retirement of a tangible long-lived asset that results from the acquisition, construction, development or the normal operation of the long-lived asset. The obligation to perform the asset retirement activity is not conditional even though the timing or method may be conditional. Identified conditional asset retirement obligations include asbestos abatement and remediation of soil contamination beneath current and previously divested facilities. We estimate conditional asset retirement obligations using site-specific knowledge and historical industry expertise.
Conditional asset retirement obligations and related expected recoveries at
September 30, 2017
and
2016
are as follows (in millions):
|
|
2017
|
2016
|
|||||
|
Other current liabilities
|
$
|
0.7
|
|
$
|
0.7
|
|
|
|
Other liabilities
|
20.5
|
|
19.9
|
|
|||
|
Total recorded conditional asset retirement obligations
|
21.2
|
|
20.6
|
|
|||
|
Receivables
|
(0.1
|
)
|
(0.1
|
)
|
|||
|
Other assets
|
(0.2
|
)
|
(0.2
|
)
|
|||
|
Total recorded probable expected recoveries
|
(0.3
|
)
|
(0.3
|
)
|
|||
|
Net conditional asset retirement obligations
|
$
|
20.9
|
|
$
|
20.3
|
|
|
There have been no significant changes in liabilities incurred, liabilities settled, accretion expense or revisions in estimated cash flows for the periods ended
September 30, 2017
and
2016
, respectively.
Other Matters
Various other lawsuits, claims and proceedings have been or may be instituted or asserted against us relating to the conduct of our business, including those pertaining to product liability, environmental, safety and health, intellectual property, employment and contract matters. Although the outcome of litigation cannot be predicted with certainty and some lawsuits, claims or proceedings may be disposed of unfavorably to us, we believe the disposition of matters that are pending or have been asserted will not have a material effect on our business, financial condition or results of operations.
73
NOTES TO CONSOLIDATED FINANCIAL STATEMENTS (Continued)
15. Commitments and Contingent Liabilities (Continued)
We (including our subsidiaries) have been named as a defendant in lawsuits alleging personal injury as a result of exposure to asbestos that was used in certain components of our products many years ago. Currently there are a few thousand claimants in lawsuits that name us as defendants, together with hundreds of other companies. In some cases, the claims involve products from divested businesses, and we are indemnified for most of the costs. However, we have agreed to defend and indemnify asbestos claims associated with products manufactured or sold by our former Dodge mechanical and Reliance Electric motors and motor repair services businesses prior to their divestiture by us, which occurred on January 31, 2007. We are also responsible for half of the costs and liabilities associated with asbestos cases against our former Rockwell International Corporation's divested measurement and flow control business. But in all cases, for those claimants who do show that they worked with our products or products of divested businesses for which we are responsible, we nevertheless believe we have meritorious defenses, in substantial part due to the integrity of the products, the encapsulated nature of any asbestos-containing components, and the lack of any impairing medical condition on the part of many claimants. We defend those cases vigorously. Historically, we have been dismissed from the vast majority of these claims with no payment to claimants.
We have maintained insurance coverage that we believe covers indemnity and defense costs, over and above self-insured retentions, for claims arising from our former Allen-Bradley subsidiary. Following litigation against Nationwide Indemnity Company (Nationwide) and Kemper Insurance (Kemper), the insurance carriers that provided liability insurance coverage to Allen-Bradley, we entered into separate agreements on April 1, 2008 with both insurance carriers to further resolve responsibility for ongoing and future coverage of Allen-Bradley asbestos claims. In exchange for a lump sum payment, Kemper bought out its remaining liability and has been released from further insurance obligations to Allen-Bradley. Nationwide entered into a cost share agreement with us to pay the substantial majority of future defense and indemnity costs for Allen-Bradley asbestos claims. We believe that this arrangement with Nationwide will continue to provide coverage for Allen-Bradley asbestos claims throughout the remaining life of the asbestos liability.
We also have rights to historic insurance policies that provide indemnity and defense costs, over and above self-insured retentions, for claims arising out of certain asbestos liabilities relating to the divested measurement and flow control business. We initiated litigation against several insurers to pursue coverage for these claims, subject to each carrier's policy limits, and the case is now pending in Los Angeles County Superior Court. In September 2016, we entered into settlement agreements with certain insurance company defendants. In exchange for a lump sum payment, Lamorak Insurance Company bought out its remaining liability and has been released from further insurance obligations relating to the measurement and flow control business. Certain Underwriters at Lloyd’s, London and certain London Market Insurance Companies entered into a cost share agreement to pay a portion of future defense and indemnity costs for measurement and flow control asbestos claims. We believe this arrangement will continue to provide partial coverage for these asbestos claims throughout the remaining life of asbestos liability.
The uncertainties of asbestos claim litigation make it difficult to predict accurately the ultimate outcome of asbestos claims. That uncertainty is increased by the possibility of adverse rulings or new legislation affecting asbestos claim litigation or the settlement process. Subject to these uncertainties and based on our experience defending asbestos claims, we do not believe these lawsuits will have a material effect on our business, financial condition or results of operations.
We have, from time to time, divested certain of our businesses. In connection with these divestitures, certain lawsuits, claims and proceedings may be instituted or asserted against us related to the period that we owned the businesses, either because we agreed to retain certain liabilities related to these periods or because such liabilities fall upon us by operation of law. In some instances the divested business has assumed the liabilities; however, it is possible that we might be responsible to satisfy those liabilities if the divested business is unable to do so.
In connection with the spin-offs of our former automotive business, semiconductor systems business and Rockwell Collins avionics and communications business, the spun-off companies have agreed to indemnify us for substantially all contingent liabilities related to the respective businesses, including environmental and intellectual property matters.
In conjunction with the sale of our Dodge mechanical and Reliance Electric motors and motor repair services businesses, we agreed to indemnify Baldor Electric Company for costs and damages related to certain legal, legacy environmental and asbestos matters of these businesses arising before January 31, 2007, for which the maximum exposure would be capped at the amount received for the sale.
74
NOTES TO CONSOLIDATED FINANCIAL STATEMENTS (Continued)
15. Commitments and Contingent Liabilities (Continued)
Indemnification liabilities and related expected recoveries at
September 30, 2017
and
2016
are as follows (in millions):
|
|
2017
|
2016
|
|||||
|
Other current liabilities
|
$
|
2.5
|
|
$
|
4.9
|
|
|
|
Other liabilities
|
9.5
|
|
12.1
|
|
|||
|
Total recorded indemnification liabilities
|
12.0
|
|
17.0
|
|
|||
|
Receivables
|
(1.6
|
)
|
(3.5
|
)
|
|||
|
Other assets
|
(4.6
|
)
|
(7.3
|
)
|
|||
|
Total recorded probable expected recoveries
|
(6.2
|
)
|
(10.8
|
)
|
|||
|
Net indemnification liabilities
|
$
|
5.8
|
|
$
|
6.2
|
|
|
Included in the above are certain environmental indemnification liabilities that are substantially indemnified by ExxonMobil Corporation for which we have recorded a liability of
$6.6 million
and
$11.0 million
, and a related receivable of
$6.2 million
and
$10.8 million
, as of
September 30, 2017
and
2016
, respectively.
In many countries we provide a limited intellectual property indemnity as part of our terms and conditions of sale. We also at times provide limited intellectual property indemnities in other contracts with third parties, such as contracts concerning the development and manufacture of our products. As of
September 30, 2017
, we were not aware of any material indemnification claims that were probable or reasonably possible of an unfavorable outcome. Historically, claims that have been made under the indemnification agreements have not had a material impact on our business, financial condition or results of operations; however, to the extent that valid indemnification claims arise in the future, future payments by us could be significant and could have a material adverse effect on our business, financial condition or results of operations in a particular period.
Lease Commitments
Rental expense was
$115.1 million
in
2017
,
$115.5 million
in
2016
and
$117.0 million
in
2015
. As of
September 30, 2017
, minimum future rental commitments under operating leases having noncancelable lease terms in excess of one year are payable as follows (in millions):
|
2018
|
$
|
73.3
|
|
|
2019
|
62.4
|
|
|
|
2020
|
52.1
|
|
|
|
2021
|
36.6
|
|
|
|
2022
|
25.8
|
|
|
|
Beyond 2022
|
34.8
|
|
|
|
Total
|
$
|
285.0
|
|
Commitments from third parties under sublease agreements having noncancelable lease terms in excess of one year were not significant as of
September 30, 2017
. Most leases contain renewal options for varying periods, and certain leases include options to purchase the leased property.
75
NOTES TO CONSOLIDATED FINANCIAL STATEMENTS (Continued)
16. Business Segment Information
Rockwell Automation,
a leader in industrial automation and information, makes its customers more productive and the world more sustainable
. We determine our operating segments based on the information used by our chief operating decision maker, our Chief Executive Officer, to allocate resources and assess performance. Based upon this information, we organize our products, solutions and services into two operating segments: Architecture & Software and Control Products & Solutions.
Architecture & Software
The Architecture & Software segment contains all of the hardware, software and communication components of our integrated control and information architecture which are capable of controlling the customer’s industrial processes and connecting with their business enterprise. Architecture & Software has a broad portfolio of products including:
|
•
|
Control platforms that perform multiple control disciplines and monitoring of applications, including discrete, batch and continuous process, drives control, motion control and machine safety control. Our platform products include controllers, electronic operator interface devices, electronic input/output devices, communication and networking products and industrial computers. The information-enabled Logix controllers provide integrated multi-discipline control that is modular and scalable.
|
|
•
|
Software products that include configuration and visualization software used to operate and supervise control platforms, advanced process control software, manufacturing execution systems (MES) and information solutions software that enables customers to improve operational productivity and meet regulatory requirements.
|
|
•
|
Other products, including sensors, machine safety components and linear motion control products.
|
Control Products & Solutions
The Control Products & Solutions segment combines a comprehensive portfolio of intelligent motor control and industrial control products, application expertise and project management capabilities. This comprehensive portfolio includes:
|
•
|
Low and medium voltage electro-mechanical and electronic motor starters, motor and circuit protection devices, AC/DC variable frequency drives, push buttons, signaling devices, termination and protection devices, relays and timers.
|
|
•
|
Value-added solutions ranging from packaged solutions such as configured drives and motor control centers to automation and information solutions where we provide design, integration and start-up services for custom-engineered hardware and information software.
|
|
•
|
Services designed to help maximize a customer’s automation investment and provide total life-cycle support, including technical support and repair, asset management, training, predictive and preventative maintenance, and safety and network consulting.
|
76
NOTES TO CONSOLIDATED FINANCIAL STATEMENTS (Continued)
16. Business Segment Information (Continued)
The following tables reflect the sales and operating results of our reportable segments for the years ended
September 30
,
2017
,
2016
and
2015
(in millions):
|
2017
|
2016
|
2015
|
||||||||||
|
Sales:
|
|
|
|
|||||||||
|
Architecture & Software
|
$
|
2,899.3
|
|
$
|
2,635.2
|
|
$
|
2,749.5
|
|
|||
|
Control Products & Solutions
|
3,412.0
|
|
3,244.3
|
|
3,558.4
|
|
||||||
|
Total
|
$
|
6,311.3
|
|
$
|
5,879.5
|
|
$
|
6,307.9
|
|
|||
|
Segment operating earnings:
|
|
|
|
|||||||||
|
Architecture & Software
|
$
|
781.5
|
|
$
|
695.0
|
|
$
|
808.6
|
|
|||
|
Control Products & Solutions
|
451.6
|
|
493.7
|
|
551.9
|
|
||||||
|
Total
|
1,233.1
|
|
1,188.7
|
|
1,360.5
|
|
||||||
|
Purchase accounting depreciation and amortization
|
(21.4
|
)
|
(18.4
|
)
|
(21.0
|
)
|
||||||
|
General corporate-net
|
(76.3
|
)
|
(79.7
|
)
|
(85.6
|
)
|
||||||
|
Non-operating pension costs
|
(82.6
|
)
|
(76.2
|
)
|
(62.7
|
)
|
||||||
|
Gain on sale of business
|
60.8
|
|
—
|
|
—
|
|
||||||
|
Interest expense
|
(76.2
|
)
|
(71.3
|
)
|
(63.7
|
)
|
||||||
|
Income before income taxes
|
$
|
1,037.4
|
|
$
|
943.1
|
|
$
|
1,127.5
|
|
|||
Among other considerations, we evaluate performance and allocate resources based upon segment operating earnings before income taxes, interest expense, costs related to corporate offices, non-operating pension costs, certain nonrecurring corporate initiatives, gains and losses from the disposition of businesses and purchase accounting depreciation and amortization. Depending on the product, intersegment sales within a single legal entity are either at cost or cost plus a mark-up, which does not necessarily represent a market price. Sales between legal entities are at an appropriate transfer price. We allocate costs related to shared segment operating activities to the segments using a methodology consistent with the expected benefit.
The following tables summarize the identifiable assets at
September 30
,
2017
,
2016
and
2015
and the provision for depreciation and amortization and the amount of capital expenditures for property for the years then ended for each of the reportable segments and Corporate (in millions):
|
2017
|
2016
|
2015
|
||||||||||
|
Identifiable assets:
|
|
|
|
|||||||||
|
Architecture & Software
|
$
|
2,482.8
|
|
$
|
2,054.3
|
|
$
|
1,790.5
|
|
|||
|
Control Products & Solutions
|
2,078.2
|
|
2,034.6
|
|
2,078.1
|
|
||||||
|
Corporate
|
2,600.7
|
|
3,012.3
|
|
2,536.1
|
|
||||||
|
Total
|
$
|
7,161.7
|
|
$
|
7,101.2
|
|
$
|
6,404.7
|
|
|||
|
Depreciation and amortization:
|
|
|
|
|||||||||
|
Architecture & Software
|
$
|
69.3
|
|
$
|
75.0
|
|
$
|
69.7
|
|
|||
|
Control Products & Solutions
|
75.0
|
|
77.3
|
|
70.3
|
|
||||||
|
Corporate
|
3.2
|
|
1.5
|
|
1.5
|
|
||||||
|
Total
|
147.5
|
|
153.8
|
|
141.5
|
|
||||||
|
Purchase accounting depreciation and amortization
|
21.4
|
|
18.4
|
|
21.0
|
|
||||||
|
Total
|
$
|
168.9
|
|
$
|
172.2
|
|
$
|
162.5
|
|
|||
|
Capital expenditures for property:
|
|
|
|
|||||||||
|
Architecture & Software
|
$
|
30.0
|
|
$
|
24.7
|
|
$
|
29.4
|
|
|||
|
Control Products & Solutions
|
42.1
|
|
41.5
|
|
56.8
|
|
||||||
|
Corporate
|
69.6
|
|
50.7
|
|
36.7
|
|
||||||
|
Total
|
$
|
141.7
|
|
$
|
116.9
|
|
$
|
122.9
|
|
|||
77
NOTES TO CONSOLIDATED FINANCIAL STATEMENTS (Continued)
16. Business Segment Information (Continued)
Identifiable assets at Corporate consist principally of cash, net deferred income tax assets, prepaid pension and property. Property shared by the segments and used in operating activities is also reported in Corporate identifiable assets and Corporate capital expenditures. Corporate identifiable assets include shared net property balances of
$259.3 million
,
$264.8 million
and
$266.8 million
at
September 30, 2017
,
2016
and
2015
, respectively, for which depreciation expense has been allocated to segment operating earnings based on the expected benefit to be realized by each segment. Corporate capital expenditures include
$69.6 million
,
$50.7 million
and
$36.7 million
in
2017
,
2016
and
2015
, respectively, that will be shared by our operating segments.
We conduct a significant portion of our business activities outside the United States. The following tables present sales and property by geographic region (in millions):
|
|
Sales
|
Property
|
||||||||||||||||||||||
|
|
2017
|
2016
|
2015
|
2017
|
2016
|
2015
|
||||||||||||||||||
|
United States
|
$
|
3,458.4
|
|
$
|
3,213.4
|
|
$
|
3,446.8
|
|
$
|
443.4
|
|
$
|
445.4
|
|
$
|
472.1
|
|
||||||
|
Canada
|
343.4
|
|
316.4
|
|
366.6
|
|
8.8
|
|
7.3
|
|
7.3
|
|
||||||||||||
|
Europe, Middle East and Africa
|
1,193.7
|
|
1,147.2
|
|
1,174.0
|
|
52.5
|
|
49.9
|
|
50.4
|
|
||||||||||||
|
Asia Pacific
|
866.4
|
|
764.4
|
|
834.5
|
|
40.0
|
|
37.4
|
|
41.9
|
|
||||||||||||
|
Latin America
|
449.4
|
|
438.1
|
|
486.0
|
|
39.2
|
|
38.3
|
|
33.9
|
|
||||||||||||
|
Total
|
$
|
6,311.3
|
|
$
|
5,879.5
|
|
$
|
6,307.9
|
|
$
|
583.9
|
|
$
|
578.3
|
|
$
|
605.6
|
|
||||||
We attribute sales to the geographic regions based on the country of destination.
In most countries, we sell primarily through independent distributors in conjunction with our direct sales force. In other countries, we sell through a combination of our direct sales force and to a lesser extent, through independent distributors. We sell large systems and service offerings principally through our direct sales force, though opportunities are sometimes identified through distributors. Sales to our largest distributor in
2017
,
2016
and
2015
, which are attributable to both segments, were approximately
10 percent
of our total sales.
78
17. Quarterly Financial Information (Unaudited)
|
|
2017 Quarters
|
|
|||||||||||||||||
|
(in millions, except per share amounts)
|
First
|
Second
|
Third
|
Fourth
|
2017
|
||||||||||||||
|
Sales
|
$
|
1,490.3
|
|
$
|
1,554.3
|
|
$
|
1,599.2
|
|
1,667.5
|
|
$
|
6,311.3
|
|
|||||
|
Gross profit
|
642.3
|
|
656.5
|
|
677.7
|
|
647.7
|
|
2,624.2
|
|
|||||||||
|
Income before income taxes
|
257.6
|
|
230.3
|
|
276.0
|
|
273.5
|
|
1,037.4
|
|
|||||||||
|
Net income
|
214.7
|
|
189.5
|
|
216.9
|
|
204.6
|
|
825.7
|
|
|||||||||
|
Earnings per share:
|
|
|
|
|
|
||||||||||||||
|
Basic
|
1.67
|
|
1.47
|
|
1.69
|
|
1.59
|
|
6.42
|
|
|||||||||
|
Diluted
|
1.65
|
|
1.45
|
|
1.67
|
|
1.57
|
|
6.35
|
|
|||||||||
|
|
2016 Quarters
|
|
||||||||||||||||||
|
(in millions, except per share amounts)
|
First
|
Second
|
Third
|
Fourth
|
2016
|
|||||||||||||||
|
Sales
|
$
|
1,426.6
|
|
$
|
1,440.3
|
|
$
|
1,474.0
|
|
$
|
1,538.6
|
|
$
|
5,879.5
|
|
|||||
|
Gross profit
|
612.7
|
|
594.1
|
|
616.8
|
|
651.9
|
|
2,475.5
|
|
||||||||||
|
Income before income taxes
|
236.9
|
|
217.0
|
|
252.3
|
|
236.9
|
|
943.1
|
|
||||||||||
|
Net income
|
185.5
|
|
168.0
|
|
191.0
|
|
185.2
|
|
729.7
|
|
||||||||||
|
Earnings per share:
|
|
|
|
|
|
|||||||||||||||
|
Basic
|
1.41
|
|
1.29
|
|
1.47
|
|
1.44
|
|
5.60
|
|
||||||||||
|
Diluted
|
1.40
|
|
1.28
|
|
1.46
|
|
1.43
|
|
5.56
|
|
||||||||||
Note: The sum of the quarterly per share amounts will not necessarily equal the annual per share amounts presented.
18. Rocky Flats Settlement
From 1975 to 1989, Rockwell International Corporation (RIC) operated the Rocky Flats facility in Colorado for the U.S. Department of Energy (DoE). In 1990, a class of landowners near Rocky Flats sued RIC and Dow Chemical, another former operator of the facility. In May 2016, the parties agreed to settle this case and the DoE authorized the settlement. Under the court approved settlement agreement, we and Dow Chemical agreed to pay
$375.0 million
in the aggregate to resolve the claims. Under RIC’s contract with the DoE and federal law, RIC was entitled to indemnification by the DoE for its portion of the settlement amount, which was
$243.75 million
. When RIC was acquired by Boeing in 1996, we agreed to indemnify Boeing for RIC’s liabilities related to Rocky Flats and received the benefits of RIC’s corresponding indemnity rights against the DoE. Pursuant to the settlement agreement, in fiscal 2016, RIC paid an initial amount of
$1.25 million
to the plaintiff class escrow fund. In January 2017, the DoE fulfilled its indemnification obligation by paying
$243.75 million
, and the full amount of RIC's obligation under the settlement agreement has now been transferred to the plaintiff class escrow fund. As a result, we were not required to make any payment under the settlement agreement.
79
REPORT OF INDEPENDENT REGISTERED PUBLIC ACCOUNTING FIRM
To the Board of Directors and Shareowners of
Rockwell Automation, Inc.
Milwaukee, Wisconsin
We have audited the accompanying consolidated balance sheets of Rockwell Automation, Inc. and subsidiaries (the “Company”) as of
September 30, 2017
and
2016
, and the related consolidated statements of operations, comprehensive income, cash flows, and shareowners’ equity for each of the three years in the period ended
September 30, 2017
. Our audits also included the financial statement schedule listed in the Index at Item 15(a)(2). We also have audited the Company’s internal control over financial reporting as of
September 30, 2017
, based on criteria established in
Internal Control — Integrated Framework (2013)
issued by the Committee of Sponsoring Organizations of the Treadway Commission. The Company’s management is responsible for these financial statements and financial statement schedule, for maintaining effective internal control over financial reporting, and for its assessment of the effectiveness of internal control over financial reporting, included in the accompanying Management’s Report on Internal Control over Financial Reporting. Our responsibility is to express an opinion on these financial statements and financial statement schedule and an opinion on the Company’s internal control over financial reporting based on our audits.
We conducted our audits in accordance with the standards of the Public Company Accounting Oversight Board (United States). Those standards require that we plan and perform the audit to obtain reasonable assurance about whether the financial statements are free of material misstatement and whether effective internal control over financial reporting was maintained in all material respects. Our audits of the financial statements included examining, on a test basis, evidence supporting the amounts and disclosures in the financial statements, assessing the accounting principles used and significant estimates made by management, and evaluating the overall financial statement presentation. Our audit of internal control over financial reporting included obtaining an understanding of internal control over financial reporting, assessing the risk that a material weakness exists, and testing and evaluating the design and operating effectiveness of internal control based on the assessed risk. Our audits also included performing such other procedures as we considered necessary in the circumstances. We believe that our audits provide a reasonable basis for our opinions.
A company’s internal control over financial reporting is a process designed by, or under the supervision of, the company’s principal executive and principal financial officers, or persons performing similar functions, and effected by the company’s board of directors, management, and other personnel to provide reasonable assurance regarding the reliability of financial reporting and the preparation of financial statements for external purposes in accordance with generally accepted accounting principles. A company’s internal control over financial reporting includes those policies and procedures that (1) pertain to the maintenance of records that, in reasonable detail, accurately and fairly reflect the transactions and dispositions of the assets of the company; (2) provide reasonable assurance that transactions are recorded as necessary to permit preparation of financial statements in accordance with generally accepted accounting principles and that receipts and expenditures of the company are being made only in accordance with authorizations of management and directors of the company; and (3) provide reasonable assurance regarding prevention or timely detection of unauthorized acquisition, use, or disposition of the company’s assets that could have a material effect on the financial statements.
Because of the inherent limitations of internal control over financial reporting, including the possibility of collusion or improper management override of controls, material misstatements due to error or fraud may not be prevented or detected on a timely basis. Also, projections of any evaluation of the effectiveness of the internal control over financial reporting to future periods are subject to the risk that the controls may become inadequate because of changes in conditions, or that the degree of compliance with the policies or procedures may deteriorate.
In our opinion, the consolidated financial statements referred to above present fairly, in all material respects, the financial position of Rockwell Automation, Inc. and subsidiaries as of
September 30, 2017
and
2016
, and the results of their operations and their cash flows for each of the three years in the period ended
September 30, 2017
, in conformity with accounting principles generally accepted in the United States of America. Also, in our opinion, such financial statement schedule, when considered in relation to the basic consolidated financial statements taken as a whole, presents fairly, in all material respects, the information set forth therein. Also, in our opinion, the Company maintained, in all material respects, effective internal control over financial reporting as of
September 30, 2017
, based on the criteria established in
Internal Control — Integrated Framework (2013)
issued by the Committee of Sponsoring Organizations of the Treadway Commission
.
/s/ DELOITTE & TOUCHE LLP
Milwaukee, Wisconsin
November 15, 2017
80
Item 9.
Changes in and Disagreements with Accountants on Accounting and Financial Disclosure
None.
Item 9A.
Controls and Procedures
Evaluation of Disclosure Controls and Procedures
Under the supervision and with the participation of our management, including the Chief Executive Officer and Chief Financial Officer, we have evaluated the effectiveness, as of
September 30, 2017
, of our disclosure controls and procedures, as defined in Rule 13a-15(e) and Rule 15d-15(e) of the Exchange Act. Based on that evaluation, our Chief Executive Officer and Chief Financial Officer have concluded that our disclosure controls and procedures were effective as of
September 30, 2017
.
Management’s Report on Internal Control Over Financial Reporting
We are responsible for establishing and maintaining adequate internal control over financial reporting, as defined in Rule 13a-15(f) under the Exchange Act. Our internal control over financial reporting is a process designed to provide reasonable assurance regarding the reliability of our financial reporting and the preparation of financial statements for external purposes in accordance with generally accepted accounting principles. Under the supervision and with the participation of our management, including the Chief Executive Officer and Chief Financial Officer, we evaluated the effectiveness of our internal control over financial reporting based on the framework in
Internal Control — Integrated Framework (2013)
issued by the Committee of Sponsoring Organizations of the Treadway Commission (COSO). Based upon that evaluation, management has concluded that our internal control over financial reporting was effective as of
September 30, 2017
.
The effectiveness of our internal control over financial reporting as of
September 30, 2017
has been audited by Deloitte & Touche LLP, as stated in their report that is included on the previous two pages.
Because of its inherent limitations, internal control over financial reporting may not prevent or detect misstatements. Also, projections of any evaluation of effectiveness to future periods are subject to the risk that controls may become inadequate because of the changes in conditions, or that the degree of compliance with the policies or procedures may deteriorate.
Changes in Internal Control Over Financial Reporting
There has not been any change in our internal control over financial reporting (as such term is defined in Exchange Act Rule 13a-15(f)) during the fiscal quarter to which this report relates that has materially affected, or is reasonably likely to materially affect, our internal control over financial reporting. In connection with our adoption of the new revenue recognition standard in the first quarter of fiscal 2019, we expect to implement additional functionality within our enterprise-wide information technology system which could result in enhancements and modifications to related internal controls over financial reporting during fiscal 2018.
Item 9B.
Other Information
None.
81
Item 10.
Directors, Executive Officers and Corporate Governance
Other than the information below, the information required by this Item is incorporated by reference to the sections entitled
Election of Directors
and
Stock Ownership Information
in the Proxy Statement.
No nominee for director was selected pursuant to any arrangement or understanding between the nominee and any person other than the Company pursuant to which such person is or was to be selected as a director or nominee. See also the information about executive officers of the Company under Item 4A of Part I.
We have adopted a code of ethics that applies to our executive officers, including the principal executive officer, principal financial officer and principal accounting officer. A copy of our Code of Conduct is posted on our Internet site at
http://www.rockwellautomation.com
under the “Investors” link. In the event that we amend or grant any waiver from a provision of the code of ethics that applies to the principal executive officer, principal financial officer or principal accounting officer and that requires disclosure under applicable SEC rules, we intend to disclose such amendment or waiver and the reasons therefor on our Internet site.
Item 11.
Executive Compensation
The information required by this Item is incorporated by reference to the sections entitled
Executive Compensation
,
Election of Directors
and
Compensation Committee Report
in the Proxy Statement.
Item 12.
Security Ownership of Certain Beneficial Owners and Management and Related Stockholder Matters
Other than the information below, the information required by this Item is incorporated by reference to the sections entitled
Stock Ownership Information
in the Proxy Statement.
The following table provides information as of
September 30, 2017
about our common stock that may be issued upon the exercise of options, warrants and rights granted to employees, consultants or directors under all of our existing equity compensation plans, including our 2012 Long-Term Incentives Plan, 2008 Long-Term Incentives Plan, 2000 Long-Term Incentives Plan and 2003 Directors Stock Plan.
|
Number of Securities to be issued upon Exercise of Outstanding Options, Warrants and Rights
|
Weighted Average Exercise Price of Outstanding Options, Warrants and Rights
|
Number of Securities Remaining Available for Future Issuance under Equity Compensation Plans (excluding Securities reflected in Column (a))
|
|||||||||
|
Plan Category
|
(a)
|
|
(b)
|
(c)
|
|
||||||
|
Equity compensation plans approved by shareowners
|
4,292,975
|
|
(1)
|
$
|
108.10
|
|
(2)
|
5,814,821
|
|
(3)
|
|
|
Equity compensation plans not approved by shareowners
|
—
|
|
|
n/a
|
|
—
|
|
|
|||
|
Total
|
4,292,975
|
|
|
$
|
108.10
|
|
5,814,821
|
|
|
||
|
(1)
|
Represents outstanding options and shares issuable in payment of outstanding performance shares (at maximum payout) and restricted stock units under our 2012 Long-Term Incentives Plan, 2008 Long-Term Incentives Plan, 2000 Long-Term Incentives Plan and 2003 Directors Stock Plan.
|
|
(2)
|
Represents the weighted average exercise price of outstanding options and does not take into account the performance shares and restricted units.
|
|
(3)
|
Represents
5,584,383
and
230,438
shares available for future issuance under our 2012 Long-Term Incentives Plan and our 2003 Directors Stock Plan, respectively.
|
82
Item 13.
Certain Relationships and Related Transactions, and Director Independence
The information required by this Item is incorporated by reference to the sections entitled
Election of Directors
in the Proxy Statement.
Item 14.
Principal Accountant Fees and Services
The information required by this Item is incorporated by reference to the section entitled
Audit Matters
in the Proxy Statement.
83
Item 15.
Exhibits and Financial Statement Schedule
(a) Financial Statements, Financial Statement Schedule and Exhibits
|
(1)
|
Financial Statements (all financial statements listed below are those of the Company and its consolidated subsidiaries)
|
|
Consolidated Balance Sheet, September 30, 2017 and 2016
|
|
|
Consolidated Statement of Operations, years ended September 30, 2017, 2016 and 2015
|
|
|
Consolidated Statement of Comprehensive Income, years ended September 30, 2017, 2016 and 2015
|
|
|
Consolidated Statement of Cash Flows, years ended September 30, 2017, 2016 and 2015
|
|
|
Consolidated Statement of Shareowners’ Equity, years ended September 30, 2017, 2016 and 2015
|
|
|
Notes to Consolidated Financial Statements
|
|
|
Report of Independent Registered Public Accounting Firm
|
|
|
(2)
|
Financial Statement Schedule for the years ended September 30,
2017
,
2016
and
2015
|
|
|
Page
|
|
|
|
Schedule II—Valuation and Qualifying Accounts
|
|
|
|
Schedules not filed herewith are omitted because of the absence of conditions under which they are required or because the information called for is shown in the consolidated financial statements or notes thereto.
|
(3)
|
Exhibits
|
|
|
|||
|
|
|||
|
|
|||
|
|
|||
|
|
|||
|
|
|||
|
|
|||
|
|
|||
|
|
|||
|
|
|||
|
|
|||
84
|
|
|||
|
|
|||
|
|
|||
|
|
|||
|
|
|||
|
|
|||
|
|
|||
|
|
|||
|
|
|||
|
|
|||
|
|
|||
|
|
|||
|
|
|||
|
|
|||
|
|
|||
|
|
|||
|
|
|||
85
|
|
|||
|
|
|||
|
|
|||
|
|
|||
|
|
|||
|
|
|||
|
|
|||
|
|
|||
|
|
|||
|
|
|||
|
|
|||
|
|
|||
|
|
|||
|
|
|||
|
|
|||
|
|
|||
86
|
|
|||
|
|
|||
|
|
|||
|
|
|||
|
|
|||
|
|
|||
|
|
|||
|
|
|||
|
|
|||
|
|
|||
|
|
|||
|
|
|||
|
|
|||
|
|
|||
|
|
|||
87
|
|
|||
|
|
|||
|
|
|||
|
|
|||
|
|
|||
|
|
|||
|
|
|||
|
|
|||
|
|
|||
|
|
|||
|
101
|
|
Interactive Data Files.
|
|
_________________________
|
*
|
|
Management contract or compensatory plan or arrangement.
|
88
SIGNATURES
Pursuant to the requirements of Section 13 or
15(d)
of the Securities Exchange Act of 1934, the registrant has duly caused this report to be signed on its behalf by the undersigned, thereunto duly authorized.
|
|
ROCKWELL AUTOMATION, INC.
|
|
|
|
|
|
|
|
By
|
/s/ PATRICK P. GORIS
|
|
Patrick P. Goris
|
||
|
|
|
Senior Vice President and
|
|
|
|
Chief Financial Officer
|
Dated:
November 15, 2017
Pursuant to the requirements of the Securities Exchange Act of 1934, this report has been signed below on the
15
th day of
November 2017
by the following persons on behalf of the registrant and in the capacities indicated.
|
By
|
/s/ P
ATRICK
P. G
ORIS
|
|
Patrick P. Goris
|
|
|
|
Senior Vice President and
|
|
|
Chief Financial Officer
|
|
|
(Principal Financial Officer)
|
|
|
|
|
By
|
/s/ D
AVID
M. D
ORGAN
|
|
David M. Dorgan
|
|
|
|
Vice President and Controller
|
|
|
(Principal Accounting Officer)
|
|
Blake D. Moret*
|
|
|
President and
|
|
|
Chief Executive Officer
|
|
|
(Principal Executive Officer)
|
|
|
and Director
|
|
|
|
Keith D. Nosbusch*
|
|
|
Chairman of the Board
|
|
Betty C. Alewine*
|
|
|
Director
|
|
|
J. Phillip Holloman*
|
|
|
Director
|
|
|
|
Steven R. Kalmanson*
|
|
|
Director
|
|
|
James P. Keane*
|
|
|
Director
|
|
Lawrence D. Kingsley*
|
|
|
Director
|
|
|
|
William T. McCormick, Jr.*
|
|
|
Director
|
|
|
Donald R. Parfet *
|
|
|
Director
|
|
Lisa A. Payne*
|
|
|
Director
|
|
|
Thomas W. Rosamilia*
|
|
|
Director
|
|
|
|
|
|
Patricia A. Watson*
|
|
|
Director
|
|
|
*By
|
/s/ R
EBECCA
W. H
OUSE
|
|
Rebecca W. House, Attorney-in-fact**
|
|
|
**By
|
authority of powers of attorney filed herewith
|
89
SCHEDULE II
ROCKWELL AUTOMATION, INC.
VALUATION AND QUALIFYING ACCOUNTS
For the Years Ended
September 30, 2017
,
2016
and
2015
|
|
Balance at
|
Additions
|
|
|
||||||||||||||||
|
(in millions)
|
Beginning
of
Year
|
Charged to
Costs and
Expenses
|
Charged to
Other
Accounts
|
Deductions(b)
|
Balance at
End of
Year
|
|||||||||||||||
|
Description
|
|
|
|
|
|
|||||||||||||||
|
*Year ended September 30, 2017
|
|
|
|
|
|
|||||||||||||||
|
Allowance for doubtful accounts (a)
|
$
|
24.5
|
|
$
|
5.0
|
|
$
|
—
|
|
$
|
4.6
|
|
$
|
24.9
|
|
|||||
|
Valuation allowance for deferred tax assets
|
17.3
|
|
1.5
|
|
0.4
|
|
0.6
|
|
18.6
|
|
||||||||||
|
*Year ended September 30, 2016
|
|
|
|
|
|
|||||||||||||||
|
Allowance for doubtful accounts (a)
|
$
|
24.8
|
|
$
|
10.9
|
|
$
|
—
|
|
$
|
11.2
|
|
$
|
24.5
|
|
|||||
|
Valuation allowance for deferred tax assets
|
22.2
|
|
1.0
|
|
0.6
|
|
6.5
|
|
17.3
|
|
||||||||||
|
*Year ended September 30, 2015
|
|
|
|
|
|
|||||||||||||||
|
Allowance for doubtful accounts (a)
|
$
|
22.2
|
|
$
|
8.1
|
|
$
|
—
|
|
$
|
5.5
|
|
$
|
24.8
|
|
|||||
|
Valuation allowance for deferred tax assets
|
27.8
|
|
2.5
|
|
—
|
|
8.1
|
|
22.2
|
|
||||||||||
|
(a)
|
Includes allowances for current and other long-term receivables.
|
|
|
|
|
(b)
|
Consists of amounts written off for the allowance for doubtful accounts and adjustments resulting from our ability to utilize foreign tax credits, capital losses, or net operating loss carryforwards for which a valuation allowance had previously been recorded.
|
|
|
|
|
*
|
Amounts reported relate to continuing operations in all periods presented.
|
90
INDEX TO EXHIBITS*
|
|
|
|
|
Exhibit No.
|
Exhibit
|
|
|
|
||
|
|
||
|
|
||
|
|
||
|
|
||
|
|
||
|
|
||
|
|
||
|
101
|
|
Interactive Data Files.
|
|
*
|
|
See Part IV, Item 15(a)(3) for exhibits incorporated by reference.
|
91
TABLE OF CONTENTS
Part IItem 1. BusinessItem 1A. Risk FactorsItem 1B. Unresolved Staff CommentsItem 2. PropertiesItem 3. Legal ProceedingsItem 4A. Executive Officers Of The CompanyPart IIItem 5. Market For The Company S Common Equity, Related Stockholder Matters and Issuer Purchases Of Equity SecuritiesItem 6. Selected Financial DataItem 7. Management S Discussion and Analysis Of Financial Condition and Results Of OperationsItem 7A. Quantitative and Qualitative Disclosures About Market RiskItem 8. Financial Statements and Supplementary DataItem 9. Changes in and Disagreements with Accountants on Accounting and Financial DisclosureItem 9A. Controls and ProceduresItem 9B. Other InformationPart IIIItem 10. Directors, Executive Officers and Corporate GovernanceItem 11. Executive CompensationItem 12. Security Ownership Of Certain Beneficial Owners and Management and Related Stockholder MattersItem 13. Certain Relationships and Related Transactions, and Director IndependenceItem 14. Principal Accountant Fees and ServicesPart IVItem 15. Exhibits and Financial Statement Schedule