ROSS STORES, INC.
10-Ks and 10-Qs
|
|
|
|
|
|
|
|
|
|
|
|
|
|
|
|
|
|
|
|
|
|
|
|
|
|
|
|
|
|
|
|
|
|
|
|
|
|
|
|
|
|
|
|
|
|
|
|
|
|
|
|
|
|
|
|
|
|
|
UNITED STATES
SECURITIES AND EXCHANGE COMMISSION
Washington, D.C. 20549
FORM 10-K
|
(Mark one)
|
|||
|
X
|
|
ANNUAL REPORT PURSUANT TO SECTION 13 OR 15(d) OF THE SECURITIES EXCHANGE ACT OF 1934
|
|
|
For the fiscal year ended February 1, 2014
|
|||
|
or
|
|||
|
TRANSITION REPORT PURSUANT TO SECTION 13 or 15(d) OF THE SECURITIES EXCHANGE ACT OF 1934
|
|||
|
For the transition period from ________ to ________
|
|||
Commission file number 0-14678
Ross Stores, Inc.
(Exact name of registrant as specified in its charter)
|
Delaware
|
94-1390387
|
|
|
(State or other jurisdiction of incorporation or organization)
|
(I.R.S. Employer Identification No.)
|
|
|
|
||
|
5130 Hacienda Drive, Dublin, California
|
94568-7579
|
|
|
(Address of principal executive offices)
|
(Zip Code)
|
|
|
|
||
|
Registrant's telephone number, including area code
|
(925) 965-4400
|
|
Securities registered pursuant to Section 12(b) of the Act:
|
Title of each class
|
Name of each exchange on which registered
|
|
|
Common stock, par value $.01
|
Nasdaq Global Select Market
|
|
Securities registered pursuant to Section 12(g) of the Act:
Title of each class
None
Indicate by check mark if the registrant is a well-known seasoned issuer, as defined in Rule 405 of the Securities Act. Yes
X
No
Indicate by check mark if the registrant is not required to file reports pursuant to Section 13 or Section 15(d) of the Act. Yes
No
X
Indicate by check mark whether the registrant (1) has filed all reports required to be filed by Section 13 or 15(d) of the Securities Exchange Act of 1934 during the preceding 12 months (or for such shorter period that the registrant was required to file such reports), and (2) has been subject to such filing requirements for the past 90 days. Yes
X
No
Indicate by check mark whether the registrant has submitted electronically and posted on its corporate Web site, if any, every Interactive Data File required to be submitted and posted pursuant to Rule 405 of Regulation S-T (§232.405 of this chapter) during the preceding 12 months (or for such shorter period that the registrant was required to submit and post such files). Yes
X
No
Indicate by check mark if disclosure of delinquent filers pursuant to Item 405 of Regulation S-K is not contained herein, and will not be contained, to the best of registrant's knowledge, in definitive proxy or information statements incorporated by reference in Part III of this Form 10-K or any amendment to this Form 10-K.
Indicate by check mark whether the registrant is a large accelerated filer, an accelerated filer, a non-accelerated filer, or a smaller reporting company. See definitions of “large accelerated filer,” “accelerated filer” and “smaller reporting company” in Rule 12b-2 of the Exchange Act. Large accelerated filer
X
Accelerated filer
Non-accelerated filer
Smaller reporting company
Indicate by check mark whether the registrant is a shell company (as defined in Rule 12b-2 of the Act). Yes
No
X
The aggregate market value of the voting common stock held by non-affiliates of the Registrant as of
August 3, 2013
was
$14,570,821,195
, based on the closing price on that date as reported by the NASDAQ Global Select Market®. Shares of voting stock held by each director and executive officer have been excluded in that such persons may be deemed to be affiliates. This determination of affiliate status is not necessarily a conclusive determination for other purposes.
The number of shares of Common Stock, with $.01 par value, outstanding on
March 12, 2014
was
212,969,295
.
Documents incorporated by reference:
Portions of the Proxy Statement for the Registrant's
2014
Annual Meeting of Stockholders, which will be filed on or before
June 2, 2014
, are incorporated herein by reference into Part III.
1
Ross Stores, Inc. and its subsidiaries (“we” or the “Company”) operate two brands of off-price retail apparel and home fashion
stores—Ross Dress for Less
®
(“Ross”) and dd’s DISCOUNTS
®
.
Ross is the largest off-price apparel and home fashion chain in the United States, with
1,146
locations in
33 states, the District of Columbia and Guam
, as of
February 1, 2014
. Ross offers first-quality, in-season, name brand and designer apparel, accessories, footwear, and home fashions for the entire family at everyday savings of 20% to 60% off department and specialty store regular prices. Ross target customers are primarily from middle income households.
We also operate
130
dd’s DISCOUNTS stores in
10 states
as of
February 1, 2014
. dd's DISCOUNTS features more moderately-priced first-quality, in-season, name brand apparel, accessories, footwear, and home fashions for the entire family at everyday savings of 20% to 70% off moderate department and discount store regular prices. The typical dd’s DISCOUNTS store is located in an established shopping center in a densely populated urban or suburban neighborhood and its target customers typically come from households with more moderate incomes than Ross customers.
The merchant, store, and distribution organizations for Ross and dd’s DISCOUNTS are separate and distinct. The two chains share certain other corporate and support services.
Both our Ross and dd's DISCOUNTS brands target value-conscious women and men between the ages of 18 and 54. The decisions we make, from merchandising, purchasing, and pricing, to the locations of our stores, are based on these customer profiles. We believe that both brands derive a competitive advantage by offering a wide assortment of product within each of our merchandise categories in organized and easy-to-shop store environments.
Our mission is to offer competitive values to our target customers by focusing on the following key strategic objectives:
•
Maintain an appropriate level of recognizable brands, labels, and fashions at strong discounts throughout the store.
•
Meet customer needs on a local basis.
•
Deliver an in-store shopping experience that reflects the expectations of the off-price customer.
•
Manage real estate growth to compete effectively across all our markets.
We refer to our fiscal years ended
February 1, 2014
,
February 2, 2013
, and
January 28, 2012
as fiscal
2013
, fiscal
2012
, and fiscal
2011
, respectively. Fiscal
2012
was a 53-week year. Fiscal
2013
and
2011
were each 52-week years.
Merchandising, Purchasing, and Pricing
We seek to provide our customers with a wide assortment of first-quality, in-season, brand name and designer apparel, accessories, footwear, and home merchandise for the entire family at everyday savings of 20% to 60% below department and specialty store regular prices at Ross, and 20% to 70% below moderate department and discount store regular prices at dd’s DISCOUNTS. We sell recognizable brand name merchandise that is current and fashionable in each category. New merchandise typically is received from three to six times per week at both Ross and dd’s DISCOUNTS stores. Our buyers review their merchandise assortments on a weekly basis, enabling them to respond to selling trends and purchasing opportunities in the market. Our merchandising strategy is reflected in our advertising, which emphasizes a strong value message. Our stores offer a treasure-hunt shopping experience where customers can find great savings every day on a broad assortment of brand name bargains for the family and the home.
Merchandising.
Our merchandising strategy incorporates a combination of off-price buying techniques to purchase advance-of-season, in-season, and past-season merchandise for both Ross and dd’s DISCOUNTS. We believe nationally recognized name brands sold at compelling discounts will continue to be an important determinant of our success. We generally leave the brand name label on the merchandise we sell.
We have established merchandise assortments that we believe are attractive to our target customers. Although we offer fewer classifications of merchandise than most department stores, we generally offer a large selection within each classification with a wide assortment of vendors, labels, prices, colors, styles, and fabrics within each size or item. The mix of comparable store sales by department in fiscal
2013
was approximately as follows:
Ladies
29%
,
Home Accents and Bed and Bath
24%
,
Accessories, Lingerie, Fine Jewelry, and Fragrances
13%
,
Shoes
13%
,
Men's
2
13%
, and
Children's
8%
. Our merchandise offerings also include, but are not limited to, small furniture and furniture accents, educational toys and games, luggage, gourmet food and cookware, watches, and sporting goods.
Purchasing.
We have a combined network of approximately
7,900
merchandise vendors and manufacturers for both Ross and dd’s DISCOUNTS and believe we have adequate sources of first-quality merchandise to meet our requirements. We purchase the vast majority of our merchandise directly from manufacturers, and we have not experienced any difficulty in obtaining sufficient merchandise inventory.
We believe that our ability to effectively execute certain off-price buying strategies is a key factor in our success. Our buyers use a number of methods that enable us to offer our customers brand name and designer merchandise at strong everyday discounts relative to department and specialty stores for Ross and moderate department and discount stores for dd’s DISCOUNTS. By purchasing later in the merchandise buying cycle than department, specialty, and discount stores, we are able to take advantage of imbalances between retailers’ demand for products and manufacturers’ supply of those products.
Unlike most department and specialty stores, we typically do not require that manufacturers provide promotional allowances, co-op advertising allowances, return privileges, split shipments, drop shipments to stores, or delayed deliveries of merchandise. For most orders, only one delivery is made to one of our four distribution centers. These flexible requirements further enable our buyers to obtain significant discounts on in-season purchases.
The majority of the apparel and apparel-related merchandise that we offer in all of our stores is acquired through opportunistic purchases created by manufacturer overruns and canceled orders both during and at the end of a season. These buys are referred to as "close-out" and "packaway" purchases. Close-outs can be shipped to stores in-season, allowing us to get in-season goods into our stores at lower prices. Packaway merchandise is purchased with the intent that it will be stored in our warehouses until a later date, which may even be the beginning of the same selling season in the following year. Packaway purchases are an effective method of increasing the percentage of prestige and national brands at competitive savings within our merchandise assortments. Packaway merchandise is mainly fashion basics and, therefore, not usually affected by shifts in fashion trends.
In fiscal
2013
, we continued our emphasis on this important sourcing strategy in response to compelling opportunities available in the marketplace. Packaway accounted for approximately
49%
and
47%
of total inventories as of
February 1, 2014
and
February 2, 2013
, respectively, and reflects our merchants’ continued ability to take advantage of a large amount of close-out opportunities in the marketplace. We believe the strong discounts we are able to offer on packaway merchandise are one of the key drivers of our business results.
Our primary buying offices are located in New York City and Los Angeles, the nation's two largest apparel markets. These strategic locations allow our buyers to be in the market on a daily basis, sourcing opportunities and negotiating purchases with vendors and manufacturers. These locations also enable our buyers to strengthen vendor relationships—a key element to the success of our off-price buying strategies.
Over the past year, we continued to make strategic investments in our merchandising organization to further enhance our ability to deliver name brand bargains to our customers. At the end of fiscal
2013
, we had approximately
660
merchants for Ross and dd’s DISCOUNTS combined. The Ross and dd’s DISCOUNTS buying organizations are separate and distinct, and each includes merchandise management, buyers, and assistant buyers. Ross and dd’s DISCOUNTS buyers have on average
eight
years of experience, including merchandising positions with other retailers such as Bloomingdale's, Burlington Coat Factory, Foot Locker, Kohl’s, Loehmann’s, Lord & Taylor, Macy's, Marshalls, Nordstrom, Saks, and T.J. Maxx. We expect to continue to make additional targeted investments in new merchants to further develop our relationships with an expanding number of manufacturers and vendors. Our ongoing objective is to strengthen our ability to procure the most desirable brands and fashions at competitive discounts.
The off-price buying strategies utilized by our experienced team of merchants enable us to purchase Ross merchandise at net prices that are lower than prices paid by department and specialty stores, and to purchase dd’s DISCOUNTS merchandise at net prices that are lower than prices paid by moderate department and discount stores.
Pricing.
Our policy is to sell brand name merchandise at Ross that is priced 20% to 60% below most department and specialty store regular prices. At dd’s DISCOUNTS, we sell more moderate brand name product and fashions that are priced 20% to 70% below most moderate department and discount store regular prices. Our pricing policy is reflected on the price tag displaying our selling price as well as the comparable selling price for that item in department and
3
specialty stores for Ross merchandise, or in more moderate department and discount stores for dd’s DISCOUNTS merchandise.
Our pricing strategy at Ross differs from that of a department or specialty store. We purchase our merchandise at lower prices and mark it up less than a department or specialty store. This strategy enables us to offer customers consistently low prices and compelling value. On a weekly basis our buyers review specified departments in our stores for possible markdowns based on the rate of sale as well as at the end of fashion seasons to promote faster turnover of merchandise inventory and to accelerate the flow of fresh product. A similar pricing strategy is in place at dd’s DISCOUNTS where prices are compared to those in moderate department and discount stores.
Stores
As of
February 1, 2014
, we operated a total of
1,276
stores comprised of
1,146
Ross stores and
130
dd’s DISCOUNTS stores. Our stores are located predominantly in community and neighborhood shopping centers in heavily populated urban and suburban areas. Where the size of the market and real estate opportunities permit, we cluster Ross stores to benefit from economies of scale in advertising, distribution, and field management. We do the same for dd’s DISCOUNTS stores.
We believe a key element of our success at both Ross and dd’s DISCOUNTS, is our organized, attractive, easy-to-shop, in-store environments which allow customers to shop at their own pace. While our stores promote a self-service, treasure hunt shopping experience, the layouts are designed to enhance customer convenience in their merchandise presentation, dressing rooms, checkout, and merchandise return areas. Our store's sales area is based on a prototype single floor design with a racetrack aisle layout. A customer can locate desired departments by signs displayed just below the ceiling of each department. We enable our customers to select among sizes and prices through prominent category and sizing markers. At most stores, shopping carts and / or baskets are available at the entrance for customer convenience. Cash registers are primarily located at store exits for customer ease and efficient staffing.
We use point-of-sale (“POS”) hardware and software systems in all stores, which minimizes transaction time for the customer at the checkout counter by electronically scanning each ticket at the point of sale and authorizing personal checks, debit, credit, and stored-value cards in a matter of seconds. For Ross and dd’s DISCOUNTS combined, approximately
62%
and
61%
of payments in fiscal
2013
and fiscal
2012
, respectively, were made with credit cards and debit cards. We provide cash, credit card, and debit card refunds on all merchandise (not used, worn, or altered) returned with a receipt within 30 days. Merchandise returns having a receipt older than 30 days are exchanged or refunded with store credit.
Operating Costs
Consistent with the other aspects of our business strategy, we strive to keep operating costs as low as possible. Among the factors which have enabled us to do this are: labor costs that are generally lower than full-price department and specialty stores due to a store design that creates a self-service retail format and due to the utilization of labor saving technologies; economies of scale with respect to general and administrative costs resulting from centralized merchandising, marketing, and purchasing decisions; and flexible store layout criteria which facilitate conversion of existing buildings to our formats.
Information Systems
We continue to invest in new information systems and technology to provide a platform for growth over the next several years. Recent initiatives include enhancements to our merchandise planning, core merchandising, allocation management, and store labor management systems. These initiatives support our expansion in both new and existing markets and our assortment execution and plan achievement, while also supporting future growth. In addition, we completed the build-out and relocation of our new data center in fiscal
2013
.
4
Distribution
We have four
distribution processing facilities – two in California, one in Pennsylvania, and one in South Carolina. We ship all of our merchandise to our stores through these distribution centers, which are large, highly automated, and built to suit our specific off-price business model. Two additional distribution centers in Rock Hill, South Carolina and Shafter, California are currently under construction and expected to open in 2014 and 2015, respectively.
Currently we own
two
and lease
three
other warehouse facilities for packaway storage. We are in the process of building two additional warehouses which we plan to open in 2014. We also use other third-party facilities as needed for storage of packaway inventory.
We also utilize third-party cross dock facilities to distribute merchandise to stores on a regional basis. Shipments are made by contract carriers to the stores three to six times per week depending on location.
We believe that our distribution centers with their current expansion capabilities will provide adequate processing capacity to support our current store growth. Information on the size and locations of our distribution centers and warehouse facilities is found under “Properties” in Item 2.
Advertising
Advertising for Ross Dress for Less relies primarily on television to communicate the Ross value proposition—everyday savings off the same brands carried at leading department stores. This strategy reflects our belief that television is the most efficient and cost effective medium for communicating our brand position. We continue to utilize additional channels to build awareness. Advertising for dd’s DISCOUNTS is primarily focused on new store grand openings and local grass roots initiatives.
Trademarks
The trademarks for Ross Dress For Less
®
and dd’s DISCOUNTS
®
have been registered with the United States Patent and Trademark Office.
Employees
As of
February 1, 2014
, we had approximately
66,300
total employees, including an estimated
48,900
part-time employees. Additionally, we hire temporary employees especially during the peak seasons. Our employees are non-union. Management considers the relationship between the Company and our employees to be good.
Competition
We believe the principal competitive factors in the off-price retail apparel and home fashion industry are offering significant discounts on brand name merchandise, offering a well-balanced assortment that appeals to our target customers, and consistently providing store environments that are convenient and easy to shop. To execute this concept, we continue to make strategic investments in our merchandising organization. We also continue to make improvements to our core merchandising system to strengthen our ability to plan, buy, and allocate product based on more local versus regional trends. We believe that we are well positioned to compete on the basis of each of these factors.
Nevertheless, the retail apparel market is highly fragmented and competitive. We face a challenging macro-economic and retail environment that creates intense competition for business from department stores, specialty stores, discount stores, warehouse stores, other off-price retailers, and manufacturer-owned outlet stores, many of which are units of large national or regional chains that have substantially greater resources. We also compete to some degree with retailers that sell apparel and home fashions through catalogs or online. The retail apparel and home-related businesses may become even more competitive in the future.
5
Available Information
The internet address for our corporate website is www.rossstores.com. Our Annual Reports on Form 10-K, quarterly reports on Form 10-Q, current reports on Form 8-K, Proxy Statements, and amendments to those reports are made available free of charge on or through the Investors section of our corporate website promptly after being electronically filed with the Securities and Exchange Commission. The information found on our corporate website is not part of this, or any other report or regulatory filing we file with or furnish to the Securities and Exchange Commission.
Our Annual Report on Form 10-K for fiscal
2013
, and information we provide in our Annual Report to Stockholders, press releases, telephonic reports, and other investor communications, including those on our corporate website, may contain forward-looking statements with respect to anticipated future events and our projected financial performance, operations, and competitive position that are subject to risks and uncertainties that could cause our actual results to differ materially from those forward-looking statements and our prior expectations and projections. Refer to Management’s Discussion and Analysis for a more complete identification and discussion of “Forward-Looking Statements.”
Our financial condition, results of operations, cash flows, and the performance of our common stock may be adversely affected by a number of risk factors. Risks and uncertainties that apply to both Ross and dd's DISCOUNTS include, without limitation, the following:
We are subject to the economic and industry risks that affect large retailers operating in the United States.
Our business is exposed to the risks of a large, multi-store retailer, which must continually and efficiently obtain and distribute a supply of fresh merchandise throughout a large and growing network of stores and distribution centers. These risk factors include:
|
•
|
An increase in the level of competitive pressures in the apparel or home-related merchandise retailing industry.
|
|
•
|
Changes in the level of consumer spending on or preferences for apparel or home-related merchandise.
|
|
•
|
The impacts from the macro-economic environment and financial and credit markets that affect consumer disposable income and consumer confidence, including but not limited to interest rates, recession, inflation, deflation, energy costs, tax rates and policy, unemployment trends, and fluctuating commodity costs.
|
|
•
|
Changes in geopolitical and geoeconomic conditions.
|
|
•
|
Unseasonable weather trends that could affect consumer demand for seasonal apparel and apparel-related products.
|
|
•
|
Changes in the availability, quantity, or quality of attractive brand name merchandise at desirable discounts that could impact our ability to purchase product and continue to offer customers a wide assortment of merchandise at competitive prices.
|
|
•
|
Potential disruptions in the supply chain or in information systems that could impact our ability to deliver product to our stores in a timely and cost-effective manner.
|
|
•
|
A change in the availability, quality, or cost of new store real estate locations.
|
|
•
|
A downturn in the economy or a natural disaster in California or in another region where we have a concentration of stores or a distribution center. Our corporate headquarters, Los Angeles buying office, two distribution centers, one warehouse, and
25%
of our stores are located in California.
|
We are subject to operating risks as we attempt to execute on our merchandising and growth strategies.
The continued success of our business depends in part upon our ability to increase sales at our existing store locations, to open new stores, and to operate stores on a profitable basis. Our existing strategies and store and distribution center expansion programs may not result in a continuation of our anticipated revenue or profit growth. In executing our off-price retail strategies and working to improve efficiencies, expand our store network, and reduce our costs, we face a number of operational risks, including our ability to:
|
•
|
Attract, train, and retain associates with the retail talent necessary to execute our strategies.
|
|
•
|
Effectively operate and continually upgrade our various supply chain, store, core merchandising, and other information systems.
|
|
•
|
Improve our merchandising and transaction processing capabilities, and the reliability and security of our data communication systems, through implementation of new processes and systems enhancements.
|
6
|
•
|
Protect against security breaches, including cyber-attacks on our transaction processing and computer information systems, that could result in the theft, transfer or unauthorized disclosure of customer, credit card, employee or other private and valuable information that we collect and process in the ordinary course of our business, and avoid resulting damage to our reputation, loss of customer confidence, exposure to litigation and regulatory action, unanticipated costs and disruption of our operations.
|
|
•
|
Improve new store sales and profitability, especially in newer regions and markets.
|
|
•
|
Add capacity to our existing distribution centers, find new distribution center sites, and build out planned additional distribution centers timely and cost effectively.
|
|
•
|
Achieve and maintain targeted levels of productivity and efficiency in our existing and future distribution centers.
|
|
•
|
Lease or acquire acceptable new store sites with favorable demographics and long-term financial returns.
|
|
•
|
Identify and successfully enter new geographic markets.
|
|
•
|
Achieve planned gross margins by effectively managing inventories, markdowns, and inventory shortage.
|
|
•
|
Effectively manage all operating costs of the business, the largest of which are payroll and benefit costs for store and distribution center employees.
|
Not applicable.
At
February 1, 2014
, we operated a total of
1,276
stores, of which
1,146
were Ross locations in
33 states, the District of Columbia and Guam
, and
130
were dd’s DISCOUNTS stores in
10 states
. All stores are leased, with the exception of
three
locations which we own.
During fiscal
2013
, we opened
65
new Ross stores and closed
10
existing stores. The average approximate Ross store size is
29,100
square feet.
During fiscal
2013
, we opened
23
new dd’s DISCOUNTS stores and closed
one
existing store. The average approximate dd’s DISCOUNTS store size is
23,600
square feet.
During fiscal
2013
,
no
one store accounted for more than 1% of our sales.
We carry earthquake insurance to help mitigate the risk of financial loss due to an earthquake.
Our real estate strategy in
2014
is to open stores in states where we currently operate to increase our market penetration and to reduce overhead and advertising expenses as a percentage of sales in each market. We also expect to continue our store expansion in newer markets in
2014
. Important considerations in evaluating a new store location in both newer and more established markets are the availability and quality of potential sites, demographic characteristics, competition, and population density of the local trade area. In addition, we continue to consider opportunistic real estate acquisitions.
7
The following table summarizes the locations of our stores by state/territory as of
February 1, 2014
and
February 2, 2013
.
|
State/Territory
|
February 1, 2014
|
|
February 2, 2013
|
|
||
|
Alabama
|
20
|
20
|
||||
|
Arizona
|
67
|
64
|
||||
|
Arkansas
|
4
|
4
|
||||
|
California
|
315
|
304
|
||||
|
Colorado
|
27
|
29
|
||||
|
Delaware
|
1
|
1
|
||||
|
District of Columbia
|
1
|
1
|
||||
|
Florida
|
156
|
145
|
||||
|
Georgia
|
51
|
48
|
||||
|
Guam
|
1
|
1
|
||||
|
Hawaii
|
15
|
13
|
||||
|
Idaho
|
10
|
10
|
||||
|
Illinois
|
37
|
23
|
||||
|
Indiana
|
2
|
|
1
|
|
||
|
Kansas
|
4
|
|
2
|
|
||
|
Kentucky
|
3
|
|
2
|
|
||
|
Louisiana
|
13
|
12
|
||||
|
Maryland
|
22
|
20
|
||||
|
Mississippi
|
6
|
5
|
||||
|
Missouri
|
14
|
8
|
|
|||
|
Montana
|
6
|
6
|
||||
|
Nevada
|
29
|
28
|
||||
|
New Jersey
|
11
|
11
|
||||
|
New Mexico
|
9
|
8
|
||||
|
North Carolina
|
36
|
34
|
||||
|
Oklahoma
|
19
|
19
|
||||
|
Oregon
|
28
|
26
|
||||
|
Pennsylvania
|
39
|
40
|
||||
|
South Carolina
|
22
|
20
|
||||
|
Tennessee
|
29
|
26
|
||||
|
Texas
|
189
|
180
|
||||
|
Utah
|
15
|
15
|
||||
|
Virginia
|
34
|
33
|
||||
|
Washington
|
39
|
38
|
||||
|
Wyoming
|
2
|
2
|
||||
|
Total
|
1,276
|
|
1,199
|
|
||
Where possible, we obtain sites in buildings requiring minimal alterations, allowing us to establish stores in new locations in a relatively short period of time at reasonable costs in a given market. At
February 1, 2014
, the majority of our stores had unexpired original lease terms ranging from
three to ten years
with
three to four
renewal options of five years each. The average unexpired original lease term of our leased stores is
five years or 21 years
if renewal options are included. See Note E of Notes to Consolidated Financial Statements.
See additional discussion under “Stores” in Item 1.
8
The following table summarizes the location and approximate sizes of our distribution centers, warehouses, and office locations as of
February 1, 2014
. Square footage information for the distribution centers and warehouses represents total ground floor area of the facility. Square footage information for office space represents total space occupied. See additional discussion in Management’s Discussion and Analysis.
|
Location
|
Approximate Square Footage
|
|
Own / Lease
|
||
|
Distribution centers
|
|||||
|
Carlisle, Pennsylvania
|
425,000
|
|
Own
|
||
|
Fort Mill, South Carolina
|
1,300,000
|
|
Own
|
||
|
Moreno Valley, California
|
1,300,000
|
|
Own
|
||
|
Perris, California
|
1,300,000
|
|
Own
|
||
|
Rock Hill, South Carolina¹
|
1,200,000
|
|
Own
|
||
|
Warehouses
|
|||||
|
Carlisle, Pennsylvania
|
239,000
|
|
Lease
|
||
|
Carlisle, Pennsylvania
|
246,000
|
|
Lease
|
||
|
Fort Mill, South Carolina
|
255,000
|
|
Lease
|
||
|
Fort Mill, South Carolina
|
423,000
|
|
Own
|
||
|
Fort Mill, South Carolina²
|
428,000
|
|
Own
|
||
|
Perris, California²
|
699,000
|
|
Own
|
||
|
Riverside, California
|
449,000
|
|
Own
|
||
|
Office space
|
|||||
|
Dublin, California
|
414,000
|
|
Own
|
||
|
Los Angeles, California
|
52,000
|
|
Lease
|
||
|
New York City, New York³
|
411,000
|
|
Lease
|
||
|
Pleasanton, California
4
|
192,000
|
|
Lease
|
||
|
Truck trailer parking lots
|
|||||
|
Perris, California
|
10 acres
|
|
Lease
|
||
|
Moreno Valley, California
|
20 acres
|
|
Lease
|
||
¹
We are currently in the process of completing the infrastructure build-out of this distribution center site with an estimated occupancy of 2014.
²
We are currently in the process of completing construction of these warehouses with an estimated occupancy of 2014.
³We plan to purchase our New York buying office in 2014
.
4
Our former corporate headquarters is leased under several facility leases the majority of which expire in June 2014. The lease term for the remaining space of approximately 11,000 square feet expires in March 2015. We do not plan to renew any of these leases. In January 2014, we moved to our current corporate headquarters in Dublin, California.
See additional discussion under “Distribution” in Item 1.
9
Like many California retailers, we have been named in class action lawsuits alleging violation of wage and hour and other employment laws. Class action litigation remains pending as of
February 1, 2014
.
We are also party to various other legal and regulatory proceedings arising in the normal course of business. Actions filed against us include commercial, product and product safety, customer, intellectual property, and labor and employment-related claims, including lawsuits in which private plaintiffs or governmental agencies allege that we violated local, state or federal laws. Actions against us are in various procedural stages. Many of these proceedings raise factual and legal issues and are subject to uncertainties.
We believe that the resolution of our pending class action litigation and other currently pending legal proceedings will not have a material adverse effect on our financial condition, results of operations, or cash flows.
Not applicable.
Executive Officers of the Registrant
The following sets forth the names and ages of our executive officers, indicating each person's principal occupation or employment during at least the past five years. The term of office is at the discretion of our Board of Directors.
|
Name
|
Age
|
|
Position
|
||
|
Michael Balmuth
|
63
|
|
Vice Chairman and Chief Executive Officer
|
||
|
Douglas Baker
|
55
|
|
President and Chief Merchandising Officer, dd’s DISCOUNTS
|
||
|
James S. Fassio
|
59
|
|
President and Chief Development Officer
|
||
|
Michael O’Sullivan
|
50
|
|
President and Chief Operating Officer
|
||
|
Barbara Rentler
|
56
|
|
President and Chief Merchandising Officer, Ross Dress for Less
|
||
|
Lisa Panattoni
|
51
|
|
Group Executive Vice President, Merchandising
|
||
|
John G. Call
|
55
|
|
Executive Vice President, Finance and Legal, and Corporate Secretary
|
||
|
Michael J. Hartshorn
|
46
|
|
Senior Vice President, Chief Financial Officer and Principal Accounting Officer
|
||
Mr. Balmuth joined the Board of Directors as Vice Chairman and became Chief Executive Officer in September 1996. From February 2005 to December 2009, he also served as President. He was Executive Vice President, Merchandising from July 1993 to September 1996 and Senior Vice President and General Merchandise Manager from November 1989 to July 1993. Before joining Ross, he was Senior Vice President and General Merchandising Manager at Bon Marché in Seattle from September 1988 to November 1989. From April 1986 to September 1988, he served as Executive Vice President and General Merchandising Manager for Karen Austin Petites.
Mr. Baker has served as President and Chief Merchandising Officer, dd’s DISCOUNTS, since March 2011. He was Executive Vice President, Merchandising dd’s DISCOUNTS from June 2009 to March 2011 and Senior Vice President and General Merchandise Manager of dd's DISCOUNTS from December 2006 to June 2009. Mr. Baker joined Ross in November 1995 as Vice President and Divisional Merchandise Manager. Prior to joining Ross, he worked for Value City Department Stores from 1984 to 1995. His previous retail experience also includes Marshalls and Hills Department Stores.
Mr. Fassio became President and Chief Development Officer in December 2009. Prior to this, he was Executive Vice President, Property Development, Construction and Store Design from February 2005 to December 2009. From March 1991 to February 2005, he served as Senior Vice President, Property Development, Construction and Store Design. He joined the Company in June 1988 as Vice President of Real Estate. Prior to joining Ross, Mr. Fassio held various retail and real estate positions with Safeway Stores, Inc.
10
Mr. O’Sullivan became President and Chief Operating Officer in December 2009. From February 2005 to December 2009, he served as Executive Vice President and Chief Administrative Officer, after joining Ross in September 2003 as Senior Vice President, Strategic Planning and Marketing. From 1991 to 2003, Mr. O’Sullivan was with Bain & Company, most recently as a partner, providing consulting advice to retail, consumer goods, financial services and private equity clients.
Ms. Rentler has served as President and Chief Merchandising Officer, Ross Dress for Less, since December 2009, with responsibility for all merchandising categories at Ross. From December 2006 to December 2009, she was Executive Vice President, Merchandising, with responsibility for all Ross Apparel and Apparel-related products. She also served as Executive Vice President and Chief Merchandising Officer of dd’s DISCOUNTS from February 2005 to December 2006, Senior Vice President and Chief Merchandising Officer of dd's DISCOUNTS from January 2004 to February 2005 and Senior Vice President and General Merchandise Manager at Ross Dress for Less from February 2001 to January 2004. Prior to that, she held various merchandising positions since joining the Company in February 1986.
Ms. Panattoni was named Group Executive Vice President, Merchandising for Ross Home and Men’s in December 2009. She joined the Company in January 2005 as Senior Vice President and General Merchandise Manager of Ross Home and was promoted to Executive Vice President in October 2005. Prior to joining Ross, Ms. Panattoni was with The TJX Companies, where she served as Senior Vice President of Merchandising and Marketing for HomeGoods from 1998 to 2004 and as Divisional Merchandise Manager of the Marmaxx Home Store from 1994 to 1998.
Mr. Call has served as Executive Vice President, Finance and Legal, and Corporate Secretary since March 2014. From February 2012 to February 2014, Mr. Call was Group Senior Vice President and Chief Financial Officer, with oversight for Legal and the Corporate Secretary function added in November 2012. From June 1997 to January 2012, he was Senior Vice President and Chief Financial Officer and also served as Corporate Secretary from June 1997 to February 2009. Mr. Call was Senior Vice President, Chief Financial Officer, Secretary and Treasurer of Friedman’s from 1993 until 1997. For five years prior to joining Friedman’s, Mr. Call held various positions with Ernst & Young LLP.
Mr. Hartshorn has served as Senior Vice President, Chief Financial Officer since February 2014. He was Senior Vice President and Deputy Chief Financial Officer from January 2012 to February 2014. Prior to this, he was Group Vice President, Finance and Treasurer from March 2011 to January 2012 and Vice President, Finance and Treasurer from April 2006 to March 2011. From 2002 to 2006, he held a number of management roles in our information technology and supply chain organizations. He initially joined the Company in 2000 as Director and Assistant Controller. For seven years prior to joining Ross, Mr. Hartshorn held various financial roles at the May Department Stores Company.
General information.
See the information set forth under the caption "Quarterly Financial Data (Unaudited)" under Note K of Notes to Consolidated Financial Statements in Item 8 of this Annual Report, which is incorporated herein by reference. Our stock is traded on The NASDAQ Global Select Market
®
under the symbol ROST. There were
822
stockholders of record as of
March 12, 2014
and the closing stock price on that date was
$72.38
per share.
Cash dividends.
In
February 2014
, our Board of Directors declared a quarterly cash dividend of
$0.20
per common share, payable on
March 31, 2014
. Our Board of Directors declared cash dividends of
$0.17
per common share in January, May, August, and November
2013
, cash dividends of
$0.14
per common share in January, May, August, and November
2012
, and cash dividends of
$0.11
per common share in January, May, August, and November
2011
.
11
Issuer purchases of equity securities.
Information regarding shares of common stock we repurchased during the fourth quarter of fiscal
2013
is as follows:
|
Period
|
Total number
of shares
(or units) purchased
¹
|
|
Average price
paid per share (or unit)
|
Total number
of shares
(or units)
purchased as
part of publicly
announced
plans or programs
|
|
Maximum
number (or
approximate
dollar value) of
shares (or units)
that may yet be
purchased under
the plans or programs ($000)
|
||||||
|
November
|
|
|||||||||||
|
(11/03/2013 - 11/30/2013)
|
331,931
|
|
$77.98
|
329,948
|
|
$652,900
|
||||||
|
December
|
||||||||||||
|
(12/01/2013 - 01/04/2014)
|
799,775
|
|
$73.11
|
791,782
|
|
$595,000
|
||||||
|
January
|
||||||||||||
|
(01/05/2014 - 02/01/2014)
|
633,334
|
|
$71.11
|
633,215
|
|
$550,000
|
||||||
|
Total
|
1,765,040
|
|
$73.31
|
1,754,945
|
|
$550,000
|
²
|
|||||
|
1
|
|
We acquired 10,095 shares of treasury stock during the quarter ended February 1, 2014. Treasury stock includes shares purchased from employees for tax withholding purposes related to vesting of restricted stock grants. All remaining shares were repurchased under our publicly announced stock repurchase program.
|
|
2
|
|
In January 2013, our Board of Directors approved a two-year $1.1 billion stock repurchase program for fiscal 2013 and 2014.
|
See Note H of Notes to Consolidated Financial Statements for equity compensation plan information. The information under Item 12 of this Annual Report on Form 10-K under the caption “Equity compensation plan information” is incorporated herein by reference.
Stockholder Return Performance Graph
The following information in this Item 5 shall not be deemed filed for purposes of Section 18 of the Securities Act of 1934, nor shall it be deemed incorporated by reference in any filing under the Securities Act of 1933.
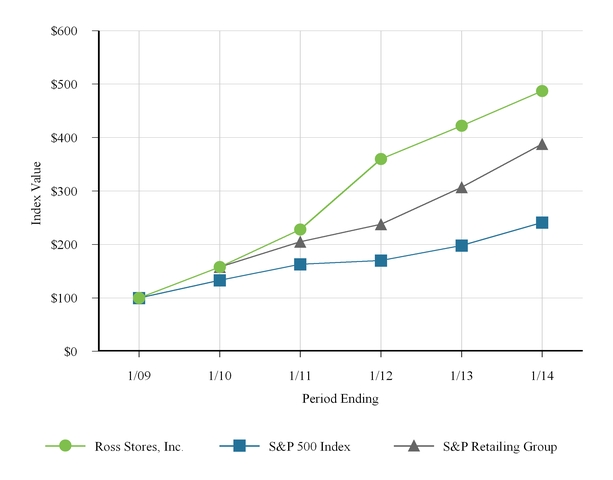
Total stockholder returns for our common stock outperformed the Standard & Poor’s (“S&P”) 500 Index and the S&P Retailing Group over the last five years as set forth in the graph below. The cumulative total return listed below assumed an initial investment of $100 and reinvestment of dividends at each fiscal year end and measures the performance of this investment as of the last trading day in the month of January for each of the following five years. These measurement dates are based on the historical month-end data available and may vary slightly from our actual fiscal year-end date for each period. Data with respect to returns for the S&P indexes is not readily available for periods shorter than one month. The graph is a historical representation of past performance only and is not necessarily indicative of future performance.
12
COMPARISON OF 5 YEAR CUMULATIVE TOTAL RETURN
Among Ross Stores, Inc., the S&P 500 Index, and S&P Retailing Group
|
Indexed Returns for Years Ended
|
||||||||||||||||||
|
Base Period
|
|
|||||||||||||||||
|
Company / Index
|
2009
|
|
2010
|
|
2011
|
|
2012
|
|
2013
|
|
2014
|
|
||||||
|
Ross Stores, Inc.
|
100
|
|
158
|
|
228
|
|
360
|
|
422
|
|
487
|
|
||||||
|
S&P 500 Index
|
100
|
|
133
|
|
163
|
|
170
|
|
198
|
|
241
|
|
||||||
|
S&P Retailing Group
|
100
|
|
158
|
|
205
|
|
238
|
|
307
|
|
388
|
|
||||||
13
The following selected financial data is derived from our consolidated financial statements. The data set forth below should be read in conjunction with “Management’s Discussion and Analysis of Financial Condition and Results of Operations,” the section “Forward-Looking Statements” in this Annual Report on Form 10-K and our consolidated financial statements and notes thereto.
|
($000, except per share data)
|
2013
|
2012¹
|
2011
|
2010
|
2009
|
||||||||||||||
|
Operations
|
|||||||||||||||||||
|
Sales
|
$
|
10,230,353
|
|
$
|
9,721,065
|
|
$
|
8,608,291
|
|
$
|
7,866,100
|
|
$
|
7,184,213
|
|
||||
|
Cost of goods sold
|
7,360,924
|
|
7,011,428
|
|
6,240,760
|
|
5,729,735
|
|
5,327,278
|
|
|||||||||
|
Percent of sales
|
72.0
|
%
|
72.1
|
%
|
72.5
|
%
|
72.8
|
%
|
74.2
|
%
|
|||||||||
|
Selling, general and administrative
|
1,526,366
|
|
1,437,886
|
|
1,304,065
|
|
1,229,775
|
|
1,130,813
|
|
|||||||||
|
Percent of sales
|
14.9
|
%
|
14.8
|
%
|
15.2
|
%
|
15.6
|
%
|
15.7
|
%
|
|||||||||
|
Interest (income) expense, net
|
(247
|
)
|
6,907
|
|
10,322
|
|
9,569
|
|
7,593
|
|
|||||||||
|
Earnings before taxes
|
1,343,310
|
|
1,264,844
|
|
1,053,144
|
|
897,021
|
|
718,529
|
|
|||||||||
|
Percent of sales
|
13.1
|
%
|
13.0
|
%
|
12.2
|
%
|
11.4
|
%
|
10.0
|
%
|
|||||||||
|
Provision for taxes on earnings
|
506,006
|
|
478,081
|
|
395,974
|
|
342,224
|
|
275,772
|
|
|||||||||
|
Net earnings
|
837,304
|
|
786,763
|
|
657,170
|
|
554,797
|
|
442,757
|
|
|||||||||
|
Percent of sales
|
8.2
|
%
|
8.1
|
%
|
7.6
|
%
|
7.1
|
%
|
6.2
|
%
|
|||||||||
|
Basic earnings per share²
|
$
|
3.93
|
|
$
|
3.59
|
|
$
|
2.91
|
|
$
|
2.35
|
|
$
|
1.80
|
|
||||
|
Diluted earnings per share²
|
$
|
3.88
|
|
$
|
3.53
|
|
$
|
2.86
|
|
$
|
2.31
|
|
$
|
1.77
|
|
||||
|
Cash dividends declared
|
|
|
|||||||||||||||||
|
per common share²
|
$
|
0.510
|
|
³
|
$
|
0.590
|
|
$
|
0.470
|
|
$
|
0.350
|
|
$
|
0.245
|
|
|||
|
¹ Fiscal 2012 was a 53-week year; all other fiscal years presented were 52 weeks.
|
|||||||||||||||||||
|
² All per share amounts have been adjusted for the two-for-one stock split effective December 15, 2011.
|
|||||||||||||||||||
|
³ Dividend declaration of $0.20 per share for the fourth quarter which historically had been declared in January was declared in February 2014.
|
|||||||||||||||||||
14
Selected Financial Data
|
($000, except per share data)
|
2013
|
2012¹
|
2011
|
2010
|
2009
|
|||||||||||||||
|
Financial Position
|
||||||||||||||||||||
|
Cash and cash equivalents
|
$
|
423,168
|
|
$
|
646,761
|
|
$
|
649,835
|
|
$
|
833,924
|
|
$
|
768,343
|
|
|||||
|
Merchandise inventory
|
1,257,155
|
|
1,209,237
|
|
1,130,070
|
|
1,086,917
|
|
872,498
|
|
||||||||||
|
Property and equipment, net
|
1,875,299
|
|
1,493,284
|
|
1,241,722
|
|
983,776
|
|
942,999
|
|
||||||||||
|
Total assets
|
3,896,797
|
|
3,670,561
|
|
3,301,209
|
|
3,116,204
|
|
2,768,633
|
|
||||||||||
|
Return on average assets
|
22
|
%
|
23
|
%
|
20
|
%
|
19
|
%
|
17
|
%
|
||||||||||
|
Working capital
|
474,102
|
|
608,845
|
|
578,319
|
|
690,919
|
|
554,933
|
|
||||||||||
|
Current ratio
|
1.3:1
|
1.4:1
|
1.4:1
|
1.5:1
|
1.5:1
|
|||||||||||||||
|
Long-term debt
|
150,000
|
|
150,000
|
|
150,000
|
|
150,000
|
|
150,000
|
|
||||||||||
|
Long-term debt as a percent
|
|
|||||||||||||||||||
|
of total capitalization
|
7
|
%
|
8
|
%
|
9
|
%
|
10
|
%
|
11
|
%
|
||||||||||
|
Stockholders' equity
|
2,007,302
|
|
1,766,863
|
|
1,493,012
|
|
1,332,692
|
|
1,157,293
|
|
||||||||||
|
Return on average
|
|
|||||||||||||||||||
|
stockholders' equity
|
44
|
%
|
48
|
%
|
47
|
%
|
45
|
%
|
41
|
%
|
||||||||||
|
Book value per common share
|
|
|
||||||||||||||||||
|
outstanding at year-end²
|
$
|
9.41
|
|
$
|
8.00
|
|
$
|
6.58
|
|
$
|
5.64
|
|
$
|
4.71
|
|
|||||
|
|
||||||||||||||||||||
|
Operating Statistics
|
|
|||||||||||||||||||
|
Number of stores opened
|
88
|
|
82
|
|
80
|
|
56
|
|
56
|
|
||||||||||
|
Number of stores closed
|
11
|
|
8
|
|
10
|
|
6
|
|
7
|
|
||||||||||
|
Number of stores at year-end
|
1,276
|
|
1,199
|
|
1,125
|
|
1,055
|
|
1,005
|
|
||||||||||
|
Comparable store sales increase³
|
||||||||||||||||||||
|
(52-week basis)
|
3
|
%
|
6
|
%
|
5
|
%
|
5
|
%
|
6
|
%
|
||||||||||
|
Sales per average square foot of
|
|
|||||||||||||||||||
|
selling space (52-week basis)
|
$
|
362
|
|
$
|
355
|
|
$
|
338
|
|
$
|
324
|
|
$
|
311
|
|
|||||
|
Square feet of selling space
|
|
|||||||||||||||||||
|
at year-end (000)
|
28,900
|
|
27,800
|
|
26,100
|
|
24,800
|
|
23,700
|
|
||||||||||
|
Number of employees at year-end
|
66,300
|
|
57,500
|
|
53,900
|
|
49,500
|
|
45,600
|
|
||||||||||
|
Number of common stockholders
|
|
|||||||||||||||||||
|
of record at year-end
|
823
|
|
831
|
|
817
|
|
804
|
|
767
|
|
||||||||||
|
¹ Fiscal 2012 was a 53-week year; all other fiscal years presented were 52 weeks.
|
||||||||||||||||||||
|
² All per share amounts have been adjusted for the two-for-one stock split effective December 15, 2011.
|
||||||||||||||||||||
|
³ Comparable stores are stores open for more than 14 complete months.
|
||||||||||||||||||||
15
Overview
Ross Stores, Inc. operates two brands of off-price retail apparel and home fashion stores—Ross Dress for Less
®
(“Ross”) and dd’s DISCOUNTS
®
. Ross is the largest off-price apparel and home fashion chain in the United States with
1,146
locations in
33 states, the District of Columbia and Guam
as of
February 1, 2014
. Ross offers first-quality, in-season, name brand and designer apparel, accessories, footwear, and home fashions for the entire family at everyday savings of 20% to 60% off department and specialty store regular prices. We also operate
130
dd’s DISCOUNTS stores in
10 states
that feature a more moderately-priced assortment of first-quality, in-season, name brand apparel, accessories, footwear, and home fashions for the entire family at everyday savings of 20% to 70% off moderate department and discount store regular prices as of
February 1, 2014
.
Our primary objective is to pursue and refine our existing off-price strategies to maintain or improve both profitability and financial returns over the long term. In establishing appropriate growth targets for our business, we closely monitor market share trends for the off-price industry and believe our share gains over the past few years were driven mainly by continued focus on value by consumers. Our sales and earnings gains in
2013
continued to benefit from efficient execution of our off-price model throughout all areas of our business. Our merchandise and operational strategies are designed to take advantage of the expanding market share of the off-price industry as well as the ongoing customer demand for name brand fashions for the family and home at compelling everyday discounts.
Looking ahead to
2014
, we are planning additional incremental reductions in average store inventory levels while continuing to maintain strict controls on operating expenses as part of our strategy to maximize our profitability.
We refer to our fiscal years ended
February 1, 2014
,
February 2, 2013
, and
January 28, 2012
as fiscal
2013
, fiscal
2012
, and fiscal
2011
, respectively. Fiscal
2012
was 53 weeks. Fiscal
2013
and
2011
were 52 weeks.
Results of Operations
The following table summarizes the financial results for fiscal
2013
,
2012
, and
2011
:
|
2013
|
|
2012
|
|
¹
|
2011
|
|
||||||
|
Sales
|
||||||||||||
|
Sales (millions)
|
$
|
10,230
|
|
$
|
9,721
|
|
$
|
8,608
|
|
|||
|
Sales growth
|
5.2
|
%
|
12.9
|
%
|
9.4
|
%
|
||||||
|
Comparable store sales growth (52-week basis)
|
3
|
%
|
6
|
%
|
5
|
%
|
||||||
|
Costs and expenses (as a percent of sales)
|
||||||||||||
|
Cost of goods sold
|
72.0
|
%
|
72.1
|
%
|
72.5
|
%
|
||||||
|
Selling, general and administrative
|
14.9
|
%
|
14.8
|
%
|
15.2
|
%
|
||||||
|
Interest (income) expense, net
|
—
|
|
0.1
|
%
|
0.1
|
%
|
||||||
|
Earnings before taxes (as a percent of sales)
|
13.1
|
%
|
13.0
|
%
|
12.2
|
%
|
||||||
|
|
||||||||||||
|
Net earnings (as a percent of sales)
|
8.2
|
%
|
8.1
|
%
|
7.6
|
%
|
||||||
¹
Fiscal 2012 was a 53-week year; all other fiscal years presented were 52 weeks.
16
Stores.
Total stores open at the end of fiscal
2013
,
2012
, and
2011
were
1,276
,
1,199
, and
1,125
, respectively. The number of stores at the end of fiscal
2013
,
2012
, and
2011
increased by
6%
,
7%
, and
7%
from the respective prior years. Our expansion strategy is to open additional stores based on market penetration, local demographic characteristics, competition, expected store profitability, and the ability to leverage overhead expenses. We continually evaluate opportunistic real estate acquisitions and opportunities for potential new store locations. We also evaluate our current store locations and determine store closures based on similar criteria.
|
Store Count
|
2013
|
|
2012
|
|
2011
|
|
||
|
Beginning of the period
|
1,199
|
|
1,125
|
|
1,055
|
|
||
|
Opened in the period
|
88
|
|
82
|
|
80
|
|
||
|
Closed in the period
|
(11)
|
|
(8
|
)
|
(10
|
)
|
||
|
End of the period
|
1,276
|
|
1,199
|
|
1,125
|
|
||
|
Selling square footage at the end of the period (000)
|
28,900
|
|
27,800
|
|
26,100
|
|
||
Sales.
Sales for fiscal
2013
increased
$0.5 billion
, or
5.2%
, compared to the
prior year
due to the opening of
77
net new stores during
2013
and a
3%
increase in comparable store sales (defined as stores that have been open for more than 14 complete months). Sales for fiscal
2012
increased
$1.1 billion
, or
12.9%
, compared to the prior year due to the opening of
74
net new stores during
2012
, a
6%
increase in sales from comparable stores, and approximately $149 million in sales from the 53rd week.
Our sales mix is shown below for fiscal
2013
,
2012
, and
2011
:
|
2013
|
|
2012
|
|
2011
|
|
||||
|
Ladies
|
29
|
%
|
29
|
%
|
29
|
%
|
|||
|
Home Accents and Bed and Bath
|
24
|
%
|
24
|
%
|
25
|
%
|
|||
|
Accessories, Lingerie, Fine Jewelry, and Fragrances
|
13
|
%
|
13
|
%
|
13
|
%
|
|||
|
Shoes
|
13
|
%
|
13
|
%
|
12
|
%
|
|||
|
Men's
|
13
|
%
|
13
|
%
|
13
|
%
|
|||
|
Children's
|
8
|
%
|
8
|
%
|
8
|
%
|
|||
|
Total
|
100
|
%
|
100
|
%
|
100
|
%
|
|||
We intend to address the competitive climate for off-price apparel and home goods by pursuing and refining our existing strategies and by continuing to strengthen our organization, diversify our merchandise mix, and more fully develop our systems to improve regional and local merchandise offerings. Although our strategies and store expansion program contributed to sales gains in fiscal
2013
,
2012
, and
2011
, we cannot be sure that they will result in a continuation of sales growth or in an increase in net earnings.
Cost of goods sold.
Cost of goods sold in fiscal
2013
increased
$349.5 million
compared to the prior year mainly due to increased sales from the opening of
77
net new stores during the year and a
3%
increase in sales from comparable stores.
Cost of goods sold as a percentage of sales for fiscal
2013
decreased approximately 15 basis points from the prior year. This improvement was due primarily to a 45 basis point increase in merchandise gross margin, which was partially offset by increases in occupancy of about 20 basis points and increases in distribution and buying expenses of about 5 basis points each.
Cost of goods sold in fiscal
2012
increased
$770.7 million
compared to the prior year mainly due to increased sales from the opening of
74
net new stores during the year and a
6%
increase in sales from comparable stores.
Cost of goods sold as a percentage of sales for fiscal
2012
decreased approximately 40 basis points from the prior year. This improvement was due primarily to a 40 basis point increase in merchandise gross margin. In addition, occupancy leveraged 25 basis points and distribution expenses as a percent of sales also declined approximately 15
17
basis points. These favorable items were partially offset by increases in buying and freight costs of 25 and 10 basis points, respectively, and 5 basis points related to the year over year true-up in our shortage reserve.
We cannot be sure that the gross profit margins realized in fiscal
2013
,
2012
, and
2011
will continue in future years.
Selling, general and administrative expenses.
For fiscal
2013
, selling, general and administrative expenses (“SG&A”) increased
$88.5 million
compared to the prior year, mainly due to increased store operating costs reflecting the opening of
77
net new stores during the year. SG&A as a percentage of sales for fiscal
2013
increased by approximately 15 basis points compared to the prior year primarily due to higher costs related to the relocation of our data center.
For fiscal
2012
, SG&A increased
$133.8 million
compared to the prior year, mainly due to increased store operating costs reflecting the opening of
74
net new stores during the year. SG&A as a percentage of sales for fiscal
2012
decreased by approximately 35 basis points compared to the prior year primarily due to leverage on store operating expenses.
The largest component of SG&A is payroll. The total number of employees, including both full and part-time, as of fiscal year end
2013
,
2012
, and
2011
was approximately
66,300
,
57,500
, and
53,900
, respectively.
Interest (income) expense, net.
In fiscal
2013
, interest expense decreased by
$7.2 million
primarily due to higher capitalization of interest related to construction of our new distribution centers. Interest income decreased by
$0.1 million
primarily due to lower investment yields as compared to the prior year. As a percentage of sales, net interest expense in fiscal
2013
decreased by approximately five basis points compared to the same period in the prior year. The table below shows interest expense and income for fiscal
2013
,
2012
, and
2011
:
|
($ millions)
|
2013
|
|
2012
|
|
2011
|
|
||||||
|
Interest expense
|
$
|
0.3
|
|
$
|
7.5
|
|
$
|
11.0
|
|
|||
|
Interest income
|
(0.5
|
)
|
(0.6
|
)
|
(0.7
|
)
|
||||||
|
Total interest (income) expense, net
|
$
|
(0.2
|
)
|
$
|
6.9
|
|
$
|
10.3
|
|
|||
Taxes on earnings.
Our effective tax rate for fiscal
2013
,
2012
and
2011
was approximately
38%
in each year, which represents the applicable combined federal and state statutory rates reduced by the federal benefit of state taxes deductible on federal returns. The effective rate is impacted by changes in laws, location of new stores, level of earnings, and the resolution of tax positions with various taxing authorities. We anticipate that our effective tax rate for fiscal
2014
will be about 38%.
Net earnings.
Net earnings as a percentage of sales for fiscal
2013
were higher than fiscal
2012
primarily due to lower cost of goods sold partially offset by higher SG&A. Net earnings as a percentage of sales for fiscal
2012
were higher compared to fiscal
2011
primarily due to both lower cost of goods sold and lower SG&A expenses.
Earnings per share
. Diluted earnings per share in fiscal
2013
was
$3.88
compared to
$3.53
in the prior year period. The
10%
increase in diluted earnings per share is attributable to an approximate
6%
increase in net earnings and a
4%
reduction in weighted average diluted shares outstanding, largely due to the repurchase of common stock under our stock repurchase program. Diluted earnings per share in fiscal
2012
was
$3.53
compared to
$2.86
in fiscal
2011
. The
23%
increase in diluted earnings per share is attributable to a
20%
increase in net earnings and a
3%
reduction in weighted average diluted shares outstanding, largely due to the repurchase of common stock under our stock repurchase program.
Financial Condition
Liquidity and Capital Resources
Our primary sources of funds for our business activities are cash flows from operations and short-term trade credit. Our primary ongoing cash requirements are for merchandise inventory purchases, payroll, rent, taxes, and capital expenditures in connection with new and existing stores, and investments in distribution centers, information systems, and buying and corporate offices. We also use cash to repurchase stock under our stock repurchase program and to pay dividends.
18
|
($ millions)
|
2013
|
|
2012
|
|
2011
|
|
|||||
|
Cash provided by operating activities
|
$
|
1,022.0
|
|
$
|
979.6
|
|
$
|
820.1
|
|
||
|
Cash used in investing activities
|
(563.8
|
)
|
(425.7
|
)
|
(471.8
|
)
|
|||||
|
Cash used in financing activities
|
(681.8
|
)
|
(557.0
|
)
|
(532.4
|
)
|
|||||
|
Net decrease in cash and cash equivalents
|
$
|
(223.6
|
)
|
|
$
|
(3.1
|
)
|
$
|
(184.1
|
)
|
|
Operating Activities
Net cash provided by operating activities was
$1,022.0 million
,
$979.6 million
, and
$820.1 million
in fiscal
2013
,
2012
, and
2011
respectively, and was primarily driven by net earnings excluding non-cash expenses for depreciation and amortization. Our primary source of operating cash flow is the sale of our merchandise inventory. We regularly review the age and condition of our merchandise and are able to maintain current merchandise inventory in our stores through replenishment processes and liquidation of slower-moving merchandise through clearance markdowns.
Net cash from operations increased in
2013
compared to
2012
and in
2012
compared to
2011
primarily due to higher net earnings.
The change in total merchandise inventory, net of the change in accounts payable, resulted in a use of cash of approximately
$52 million
,
$39 million
, and
$55 million
for fiscal
2013
,
2012
, and
2011
, respectively. Accounts payable leverage (defined as accounts payable divided by merchandise inventory) was
62%
,
67%
, and
67%
as of
February 1, 2014
,
February 2, 2013
, and
January 28, 2012
, respectively. Changes in accounts payable leverage are primarily driven by timing of packaway receipts and payments. Accounts payable leverage at the end of fiscal
2013
was also impacted due to the timing shift of the dividend declaration from January 2014 to February
2014
.
As a regular part of our business, packaway inventory levels will vary over time based on availability of compelling opportunities in the marketplace. Packaway merchandise is purchased with the intent that it will be stored in our warehouses until a later date. The timing of the release of packaway inventory to our stores is principally driven by the product mix and seasonality of the merchandise, and its relation to our store merchandise assortment plans. As such, the aging of packaway varies by merchandise category and seasonality of purchase, but typically packaway remains in storage less than six months. We expect to continue to take advantage of packaway inventory opportunities to deliver bargains to our customers.
Changes in packaway inventory levels impact our operating cash flow. At the end of fiscal
2013
, packaway inventory was
49%
of total inventory compared to
47%
and
49%
at the end of fiscal
2012
and
2011
, respectively.
Investing Activities
Net cash used in investing activities was
$563.8 million
,
$425.7 million
, and
$471.8 million
in fiscal
2013
,
2012
, and
2011
, respectively. The increase in cash used for investing activities in fiscal
2013
compared to fiscal
2012
was primarily due to an increase in our capital expenditures. The decrease in cash used for investing activities for fiscal
2012
compared to fiscal
2011
was primarily due to a transfer of funds in fiscal 2011 into restricted accounts to serve as collateral for our insurance obligations.
In fiscal
2013
,
2012
, and
2011
, our capital expenditures were
$550.5 million
,
$424.4 million
, and
$416.3 million
, respectively. Our capital expenditures include costs to build or expand distribution centers, develop our new data center, open new stores and improve existing stores, and for various other expenditures related to our information technology systems, buying, and corporate offices. We opened
88
,
82
, and
80
new stores in fiscal
2013
,
2012
, and
2011
, respectively. In 2013 we purchased the land and building of our previously leased 1.3 million square foot Perris, California distribution center for $70 million; we also spent approximately $60 million building out our new corporate headquarters. Our buying offices, our former corporate headquarters, two truck and trailer parking facilities, three warehouse facilities, and all but three of our store locations are leased and, except for certain leasehold improvements and equipment, do not represent capital investments.
19
Our capital expenditures over the last three years are set forth in the table below:
|
($ millions)
|
2013
|
|
2012
|
|
2011
|
|
||||||
|
Distribution
|
$
|
248.4
|
|
$
|
157.9
|
|
$
|
86.1
|
|
|||
|
New stores
|
121.3
|
|
118.7
|
|
114.2
|
|
||||||
|
Existing stores
|
59.1
|
|
86.9
|
|
126.8
|
|
||||||
|
Information systems, corporate, and other
|
121.7
|
|
60.9
|
|
89.2
|
|
||||||
|
Total capital expenditures
|
$
|
550.5
|
|
$
|
424.4
|
|
$
|
416.3
|
|
|||
In October 2013, we entered into a Sale-Purchase Agreement under which we have the right to purchase the office building where our New York buying office is located for $222 million. The building is subject to a 99 year ground lease through June 2111. The Sale-Purchase Agreement contemplates completion of the sale and purchase of the building on or before September 20, 2014, subject to satisfaction of various closing conditions. Under the Sale-Purchase Agreement, we provided a deposit of 10% of the purchase price. In the event we are unable or choose not to complete the purchase of the building, we would forfeit the deposit but have no further liability to the seller or obligation to complete the purchase. In September 2013, we deposited $11.1 million and provided an $11.1 million standby letter of credit to meet the 10% deposit obligation. In January 2014, we deposited an additional $2.2 million in escrow for the building bringing our total deposit to $13.3 million. We plan to finance the purchase of the building in 2014.
We are forecasting approximately
$800 million
in capital expenditures for fiscal year
2014
, up from
$550.5 million
in fiscal
2013
. In addition to funding costs for fixtures and leasehold improvements to open both new Ross and dd’s DISCOUNTS stores, the upgrade or relocation of existing stores, investments in information technology systems, and for various other expenditures related to our stores, distribution centers, buying and corporate offices, this higher capital spending is primarily driven by the expected purchase of our New York buying office and continued construction of our two new distribution centers. We expect to primarily fund capital expenditures with available cash and cash flows from operations and with proceeds from our planned financing of the purchase of our New York buying office.
We purchased
$12.0 million
and
$5.4 million
of investments in fiscal
2013
and fiscal
2012
, respectively. We purchased no investments in fiscal
2011
. We had proceeds from investments of
$1.6 million
,
$6.2 million
, and
$4.6 million
in fiscal
2013
,
2012
, and
2011
, respectively.
Financing Activities
Net cash used in financing activities was
$681.8 million
,
$557.0 million
, and
$532.4 million
in fiscal
2013
,
2012
, and
2011
, respectively. During fiscal
2013
,
2012
, and
2011
, our liquidity and capital requirements were provided by available cash and cash flows from operations.
In January 2013, our Board of Directors approved a two-year $1.1 billion stock repurchase program for fiscal 2013 and 2014. We repurchased
8.2 million
,
7.5 million
, and
11.3 million
shares of common stock for aggregate purchase prices of approximately
$550 million
,
$450 million
, and
$450 million
in fiscal
2013
,
2012
, and
2011
, respectively. We also acquired
496,000
,
505,000
, and
442,000
shares of treasury stock from our employee stock equity compensation programs, for aggregate purchase prices of approximately
$29.9 million
,
$29.4 million
, and
$15.9 million
during fiscal
2013
,
2012
, and
2011
, respectively.
In
February 2014
, our Board of Directors declared a quarterly cash dividend of
$0.20
per common share, payable on
March 31, 2014
. Our Board of Directors declared cash dividends of
$0.17
per common share in January, May, August, and November
2013
, cash dividends of
$0.14
per common share in January, May, August, and November
2012
, and cash dividends of
$0.11
per common share in January, May, August, and November
2011
.
During fiscal
2013
,
2012
, and
2011
, we paid dividends of
$147.9 million
,
$125.7 million
, and
$102.0 million
, respectively.
Short-term trade credit represents a significant source of financing for merchandise inventory. Trade credit arises from customary payment terms and trade practices with our vendors. We regularly review the adequacy of credit available to us from all sources and expect to be able to maintain adequate trade, bank, and other credit lines to meet our capital and liquidity requirements, including lease payment obligations in
2014
.
Our existing $600 million unsecured revolving credit facility expires in June 2017 and contains a $300 million sublimit for issuance of standby letters of credit. Interest on this facility is based on LIBOR plus an applicable margin (currently
20
100 basis points) and is payable quarterly and upon maturity. As of
February 1, 2014
, we had no borrowings or standby letters of credit outstanding on this facility and our $600 million credit facility remains in place and available.
We estimate that existing cash balances, cash flows from operations, bank credit lines, and trade credit are adequate to meet our operating cash needs and to fund our planned capital investments, common stock repurchases, and quarterly dividend payments for at least the next twelve months.
Contractual Obligations
The table below presents our significant contractual obligations as of
February 1, 2014
:
|
Less than
1 year
|
|
1 - 3
years
|
|
3 - 5
years
|
|
After 5
years
|
|
Total¹
|
|
||||||||||
|
($000)
|
|||||||||||||||||||
|
Senior notes
|
$
|
—
|
|
$
|
—
|
|
$
|
85,000
|
|
$
|
65,000
|
|
$
|
150,000
|
|
||||
|
Interest payment obligations
|
9,668
|
|
19,335
|
|
18,657
|
|
12,203
|
|
59,863
|
|
|||||||||
|
Operating leases (rent obligations)
|
417,443
|
|
801,735
|
|
569,380
|
|
498,371
|
|
2,286,929
|
|
|||||||||
|
Purchase obligations
|
1,792,423
|
|
19,260
|
|
—
|
|
—
|
|
1,811,683
|
|
|||||||||
|
Total contractual obligations
|
$
|
2,219,534
|
|
$
|
840,330
|
|
$
|
673,037
|
|
$
|
575,574
|
|
$
|
4,308,475
|
|
||||
1
We have a
$104.9 million
liability for unrecognized tax benefits that is included in other long-term liabilities on our consolidated balance sheet. This liability is excluded from the schedule above as the timing of payments cannot be reasonably estimated.
Senior notes.
We have issued two series of unsecured senior notes in the aggregate principal amount of $150 million, held by various institutional investors. The Series A notes totaling $85 million are due in December 2018 and bear interest at a rate of 6.38%. The Series B notes totaling $65 million are due in December 2021 and bear interest at a rate of 6.53%. Interest on these notes is included in Interest payment obligations in the table above. These notes are subject to prepayment penalties for early payment of principal.
Borrowings under these notes are subject to certain operating and financial covenants, including interest coverage and other financial ratios. As of
February 1, 2014
, we were in compliance with these covenants.
Off-Balance Sheet Arrangements
Operating leases
. We currently lease our buying offices, our former corporate headquarters, three warehouse facilities, all but three of our store locations, and two truck and trailer parking facilities. Except for certain leasehold improvements and equipment, these leased locations do not represent long-term capital investments.
We lease three warehouses. Two of the warehouses are in Carlisle, Pennsylvania with leases expiring in
2016
and
2017
. The third warehouse is in Fort Mill, South Carolina, with a lease expiring in
2016
. The leases for all three warehouses contain renewal provisions.
We lease a 10-acre parcel for trailer parking adjacent to our Perris, California distribution center that expires in 2017 and a 20-acre facility located in Moreno Valley, California primarily for ancillary truck and trailer parking that expires in 2015. Both of these leases contain renewal provisions.
We lease approximately
192,000
square feet of office space for our former corporate headquarters in Pleasanton, California, under several facility leases. The term for the majority of these leases expires in June 2014. The lease term for the remaining space of approximately 11,000 square feet expires in March 2015. We do not plan to renew any of these leases.
We currently lease approximately
411,000
and
52,000
square feet of office space for our New York City and Los Angeles buying offices, respectively. The lease terms for these facilities expire in
2022
and
2017
, respectively, and contain renewal provisions. We plan to purchase our New York buying office in 2014.
21
Purchase obligations.
As of
February 1, 2014
we had purchase obligations of approximately
$1,812 million
. These purchase obligations primarily consist of merchandise inventory purchase orders, commitments related to construction projects, store fixtures and supplies, and information technology service and maintenance contracts.
Commercial Credit Facilities
The table below presents our significant available commercial credit facilities at
February 1, 2014
:
|
Amount of Commitment Expiration Per Period
|
|||||||||||||||||||
|
Less than 1
year |
|
Total amount
committed |
|
||||||||||||||||
|
($000)
|
1 - 3 years
|
|
3 - 5 years
|
|
After 5 years
|
|
|||||||||||||
|
Revolving credit facility
|
$
|
—
|
|
$
|
—
|
|
$
|
600,000
|
|
$
|
—
|
|
$
|
600,000
|
|
||||
|
Total commercial commitments
|
$
|
—
|
|
$
|
—
|
|
$
|
600,000
|
|
$
|
—
|
|
$
|
600,000
|
|
||||
|
For additional information relating to this credit facility, refer to Note D of Notes to Consolidated Financial Statements.
|
|||||||||||||||||||
Revolving credit facility.
Our existing $600 million unsecured revolving credit facility expires in June 2017 and contains a $300 million sublimit for issuance of standby letters of credit. Interest on this facility is based on LIBOR plus an applicable margin (currently 100 basis points) and is payable quarterly and upon maturity. As of
February 1, 2014
we had no borrowings outstanding or standby letters of credit issued under this facility.
Our revolving credit facility and senior notes have covenant restrictions requiring us to maintain certain interest coverage and other financial ratios. In addition, the interest rates under the revolving credit facility may vary depending on actual interest coverage ratios achieved. As of
February 1, 2014
we were in compliance with these covenants.
Standby letters of credit and collateral trust.
We use standby letters of credit outside of our revolving credit facility in addition to a funded trust to collateralize our insurance obligations. As of
February 1, 2014
and
February 2, 2013
, we had
$24.3 million
and
$33.8 million
, respectively, in standby letters of credit outstanding and
$47.2 million
and
$34.9 million
, respectively, in a collateral trust. The standby letters of credit are collateralized by restricted cash and the collateral trust consists of restricted cash, cash equivalents, and investments.
As of
February 1, 2014
, we also had an $11.1 million standby letter of credit in connection with our New York buying office Sale-Purchase Agreement.
Trade letters of credit.
We had
$31.6 million
and
$38.0 million
in trade letters of credit outstanding at
February 1, 2014
and
February 2, 2013
, respectively.
Effects of inflation or deflation.
We do not consider the effects of inflation or deflation to be material to our financial position and results of operations.
Other
Critical Accounting Policies
The preparation of our consolidated financial statements requires our management to make estimates and assumptions that affect the reported amounts. These estimates and assumptions are evaluated on an ongoing basis and are based on historical experience and on various other factors that management believes to be reasonable. We believe the following critical accounting policies describe the more significant judgments and estimates used in the preparation of our consolidated financial statements.
Merchandise inventory.
Our merchandise inventory is stated at the lower of cost (determined using a weighted average basis) or net realizable value. We purchase manufacturer overruns and canceled orders both during and at the end of a season which are referred to as "packaway" inventory. Packaway inventory is purchased with the intent that it will be stored in our warehouses until a later date. The timing of the release of packaway inventory to our stores is principally driven by the product mix and seasonality of the merchandise, and its relation to the Company’s store merchandise assortment plans. As such, the aging of packaway varies by merchandise category and seasonality of purchase, but typically packaway remains in storage less than six months. Packaway inventory accounted for
22
approximately
49%
,
47%
, and
49%
of total inventories as of
February 1, 2014
,
February 2, 2013
, and
January 28, 2012
, respectively. Merchandise inventory includes acquisition, processing, and storage costs related to packaway inventory.
Included in the carrying value of our merchandise inventory is a provision for shortage. The shortage reserve is based on historical shortage rates as evaluated through our annual physical merchandise inventory counts and cycle counts. If actual market conditions, markdowns, or shortage are less favorable than those projected by us, or if sales of the merchandise inventory are more difficult than anticipated, additional merchandise inventory write-downs may be required.
Long-lived assets.
We record a long-lived asset impairment charge when events or changes in circumstances indicate that the carrying amount of a long-lived asset may not be recoverable based on estimated future cash flows. An impairment loss would be recognized if analysis of the undiscounted cash flow of an asset group was less than the carrying value of the asset group. If our actual results differ materially from projected results, an impairment charge may be required in the future. In the course of performing our annual analysis, we determined that no long-lived asset impairment charge was required for fiscal
2013
,
2012
, or
2011
.
Depreciation and amortization expense.
Property and equipment are stated at cost, less accumulated depreciation and amortization. Depreciation is calculated using the straight-line method over the estimated useful life of the asset, typically ranging from three to 12 years for equipment and 20 to 40 years for land improvements and buildings. The cost of leasehold improvements is amortized over the lesser of the useful life of the asset or the applicable lease term.
Lease accounting.
When a lease contains “rent holidays” or requires fixed escalations of the minimum lease payments, we record rental expense on a straight-line basis over the term of the lease and the difference between the average rental amount charged to expense and the amount payable under the lease is recorded as deferred rent. We begin recording rent expense on the lease possession date. Tenant improvement allowances are included in other long-term liabilities and are amortized over the lease term. Changes in tenant improvement allowances are included as a component of operating activities in the consolidated statements of cash flows.
Insurance obligations.
We use a combination of insurance and self-insurance for a number of risk management activities, including workers’ compensation, general liability, and employee-related health care benefits. Our self-insurance and deductible liability is determined actuarially, based on claims filed and an estimate of claims incurred but not reported. Should a greater amount of claims occur compared to what is estimated or the costs of medical care increase beyond what was anticipated, our recorded reserves may not be sufficient and additional charges could be required.
Stock-based compensation.
We recognize compensation expense based upon the grant date fair value of all stock-based awards. We use historical data to estimate pre-vesting forfeitures and to recognize stock-based compensation expense. All stock-based compensation awards are expensed over the service or performance periods of the awards.
Income taxes.
We account for our uncertain tax positions in accordance with Accounting Standards Codification (“ASC”) 740. We are required to make assumptions and judgments regarding our income tax exposures. Our policy is to recognize interest and/or penalties related to all tax positions in income tax expense. To the extent that accrued interest and penalties do not ultimately become payable, amounts accrued will be reduced and reflected as a reduction of the overall income tax provision in the period that such determination is made.
The critical accounting policies noted above are not intended to be a comprehensive list of all of our accounting policies. In many cases, the accounting treatment of a particular transaction is specifically dictated by Generally Accepted Accounting Principles (“GAAP”), with no need for management’s judgment in their application. There are also areas in which management’s judgment in selecting one alternative accounting principle over another would not produce a materially different result. See our audited consolidated financial statements and notes thereto under Item 8 in this Annual Report on Form 10-K, which contain accounting policies and other disclosures required by GAAP.
23
Forward-Looking Statements
Our Annual Report on Form 10-K for fiscal
2013
, and information we provide in our Annual Report to Stockholders, press releases, telephonic reports, and other investor communications including those on our corporate website, may contain a number of forward-looking statements regarding, without limitation, planned store growth, new markets, expected sales, projected earnings levels, capital expenditures, and other matters. These forward-looking statements reflect our then current beliefs, projections, and estimates with respect to future events and our projected financial performance, operations, and competitive position. The words “plan,” “expect,” “target,” “anticipate,” “estimate,” “believe,” “forecast,” “projected,” “guidance,” “looking ahead” and similar expressions identify forward-looking statements.
Future economic and industry trends that could potentially impact revenue, profitability, and growth remain difficult to predict. As a result, our forward-looking statements are subject to risks and uncertainties which could cause our actual results to differ materially from those forward-looking statements and our previous expectations and projections. Refer to Item 1A in this Annual Report on Form 10-K for a more complete discussion of risk factors for Ross and dd's DISCOUNTS. The factors underlying our forecasts are dynamic and subject to change. As a result, any forecasts or forward-looking statements speak only as of the date they are given and do not necessarily reflect our outlook at any other point in time. We disclaim any obligation to update or revise these forward-looking statements.
We are exposed to market risks, which primarily include changes in interest rates. We do not engage in financial transactions for trading or speculative purposes.
We occasionally use forward contracts to hedge against fluctuations in foreign currency prices. We had no outstanding forward contracts as of
February 1, 2014
.
Interest that is payable on our revolving credit facility is based on variable interest rates and is, therefore, affected by changes in market interest rates. As of
February 1, 2014
, we had no borrowings outstanding under our revolving credit facility.
In addition, we have two outstanding series of unsecured notes held by institutional investors: Series A for $85 million accrues interest at 6.38% and Series B for $65 million accrues interest at 6.53%. The amount outstanding under these notes as of
February 1, 2014
was $150 million.
Interest is receivable on our short- and long-term investments. Changes in interest rates may impact interest income recognized in the future, or the fair value of our investment portfolio.
A hypothetical 100 basis point increase or decrease in prevailing market interest rates would not have a material impact on our consolidated financial position, results of operations, cash flows, or the fair values of our short- and long-term investments as of and for the year ended
February 1, 2014
. We do not consider the potential losses in future earnings and cash flows from reasonably possible, near-term changes in interest rates to be material.
24
|
Year Ended
|
|
Year Ended
|
|
Year Ended
|
|
|||||||
|
($000, except per share data)
|
February 1, 2014
|
|
February 2, 2013
|
|
January 28, 2012
|
|
||||||
|
Sales
|
$
|
10,230,353
|
|
$
|
9,721,065
|
|
$
|
8,608,291
|
|
|||
|
Costs and Expenses
|
||||||||||||
|
Costs of goods sold
|
7,360,924
|
|
7,011,428
|
|
6,240,760
|
|
||||||
|
Selling, general and administrative
|
1,526,366
|
|
1,437,886
|
|
1,304,065
|
|
||||||
|
Interest (income) expense, net
|
(247
|
)
|
6,907
|
|
10,322
|
|
||||||
|
Total costs and expenses
|
8,887,043
|
|
8,456,221
|
|
7,555,147
|
|
||||||
|
Earnings before taxes
|
1,343,310
|
|
1,264,844
|
|
1,053,144
|
|
||||||
|
Provision for taxes on earnings
|
506,006
|
|
478,081
|
|
395,974
|
|
||||||
|
Net earnings
|
$
|
837,304
|
|
$
|
786,763
|
|
$
|
657,170
|
|
|||
|
Earnings per share
|
||||||||||||
|
Basic
|
$
|
3.93
|
|
$
|
3.59
|
|
$
|
2.91
|
|
|||
|
Diluted
|
$
|
3.88
|
|
$
|
3.53
|
|
$
|
2.86
|
|
|||
|
Weighted average shares outstanding (000)
|
||||||||||||
|
Basic
|
212,881
|
|
219,130
|
|
225,915
|
|
||||||
|
Diluted
|
215,805
|
|
222,784
|
|
229,982
|
|
||||||
|
The accompanying notes are an integral part of these consolidated financial statements.
|
||||||||||||
25
Consolidated Statements of Comprehensive Income
|
Year Ended
|
|
Year Ended
|
|
Year Ended
|
|
|||||||
|
($000)
|
February 1, 2014
|
|
February 2, 2013
|
|
January 28, 2012
|
|
||||||
|
Net earnings
|
$
|
837,304
|
|
$
|
786,763
|
|
$
|
657,170
|
|
|||
|
Other comprehensive income:
|
||||||||||||
|
Change in unrealized (loss) gain on investments, net of tax
|
(196
|
)
|
(50
|
)
|
147
|
|
||||||
|
Comprehensive income
|
$
|
837,108
|
|
$
|
786,713
|
|
$
|
657,317
|
|
|||
|
The accompanying notes are an integral part of these consolidated financial statements.
|
||||||||||||
26
|
($000, except share data)
|
February 1, 2014
|
|
February 2, 2013
|
|
|||
|
Assets
|
|||||||
|
Current Assets
|
|||||||
|
Cash and cash equivalents
|
$
|
423,168
|
|
$
|
646,761
|
|
|
|
Short-term investments
|
12,006
|
|
1,087
|
|
|||
|
Accounts receivable
|
62,612
|
|
59,617
|
|
|||
|
Merchandise inventory
|
1,257,155
|
|
1,209,237
|
|
|||
|
Prepaid expenses and other
|
101,991
|
|
94,318
|
|
|||
|
Deferred income taxes
|
10,227
|
|
20,407
|
|
|||
|
Total current assets
|
1,867,159
|
|
2,031,427
|
|
|||
|
Property and Equipment
|
|||||||
|
Land and buildings
|
478,973
|
|
372,659
|
|
|||
|
Fixtures and equipment
|
1,678,397
|
|
1,551,590
|
|
|||
|
Leasehold improvements
|
813,972
|
|
732,671
|
|
|||
|
Construction-in-progress
|
510,221
|
|
258,691
|
|
|||
|
3,481,563
|
|
2,915,611
|
|
||||
|
Less accumulated depreciation and amortization
|
1,606,264
|
|
1,422,327
|
|
|||
|
Property and equipment, net
|
1,875,299
|
|
1,493,284
|
|
|||
|
Long-term investments
|
3,710
|
|
4,374
|
|
|||
|
Other long-term assets
|
150,629
|
|
141,476
|
|
|||
|
Total assets
|
$
|
3,896,797
|
|
$
|
3,670,561
|
|
|
|
Liabilities and Stockholders’ Equity
|
|||||||
|
Current Liabilities
|
|||||||
|
Accounts payable
|
$
|
779,455
|
|
$
|
807,534
|
|
|
|
Accrued expenses and other
|
359,929
|
|
320,415
|
|
|||
|
Accrued payroll and benefits
|
235,324
|
|
241,129
|
|
|||
|
Income taxes payable
|
18,349
|
|
53,504
|
|
|||
|
Total current liabilities
|
1,393,057
|
|
1,422,582
|
|
|||
|
Long-term debt
|
150,000
|
|
150,000
|
|
|||
|
Other long-term liabilities
|
287,567
|
|
246,815
|
|
|||
|
Deferred income taxes
|
58,871
|
|
84,301
|
|
|||
|
Commitments and contingencies
|
|
|
|
|
|||
|
Stockholders’ Equity
|
|||||||
|
Common stock, par value $.01 per share
|
2,134
|
|
2,207
|
|
|||
|
Authorized 600,000,000 shares
|
|||||||
|
Issued and outstanding 213,420,000 and
|
|||||||
|
220,721,000 shares, respectively
|
|||||||
|
Additional paid-in capital
|
935,591
|
|
866,519
|
|
|||
|
Treasury stock
|
(121,559
|
)
|
(91,708
|
)
|
|||
|
Accumulated other comprehensive income
|
389
|
|
585
|
|
|||
|
Retained earnings
|
1,190,747
|
|
989,260
|
|
|||
|
Total stockholders’ equity
|
2,007,302
|
|
1,766,863
|
|
|||
|
Total liabilities and stockholders’ equity
|
$
|
3,896,797
|
|
$
|
3,670,561
|
|
|
|
The accompanying notes are an integral part of these consolidated financial statements.
|
|||||||
27
Consolidated Statements of Stockholders' Equity
|
Additional paid-in capital
|
|
Accumulated
other comprehensive income (loss)
|
|
|||||||||||||||||||||||
|
Common stock
|
Treasury stock
|
|
Retained earnings
|
|
||||||||||||||||||||||
|
(000)
|
Shares
|
|
Amount
|
|
Total
|
|
||||||||||||||||||||
|
Balance at January 29, 2011
|
236,126
|
|
$
|
2,362
|
|
$
|
739,545
|
|
$
|
(46,408
|
)
|
$488
|
$
|
636,705
|
|
$
|
1,332,692
|
|
||||||||
|
Net earnings
|
—
|
|
—
|
|
—
|
|
—
|
|
—
|
|
657,170
|
|
657,170
|
|
||||||||||||
|
Unrealized investment gain, net
|
—
|
|
—
|
|
—
|
|
—
|
|
147
|
|
—
|
|
147
|
|
||||||||||||
|
Common stock issued under stock
|
||||||||||||||||||||||||||
|
plans, net of shares
|
||||||||||||||||||||||||||
|
used for tax withholding
|
2,002
|
|
20
|
|
17,270
|
|
(15,854
|
)
|
—
|
|
—
|
|
1,436
|
|
||||||||||||
|
Tax benefit from equity issuance
|
—
|
|
—
|
|
19,040
|
|
—
|
|
—
|
|
—
|
|
19,040
|
|
||||||||||||
|
Stock-based compensation
|
—
|
|
—
|
|
40,404
|
|
—
|
|
—
|
|
—
|
|
40,404
|
|
||||||||||||
|
Common stock repurchased
|
(11,264
|
)
|
(113
|
)
|
(27,364
|
)
|
—
|
|
—
|
|
(422,523
|
)
|
(450,000
|
)
|
||||||||||||
|
Dividends declared ($0.47 per share)
|
—
|
|
—
|
|
—
|
|
—
|
|
—
|
|
(107,877
|
)
|
(107,877
|
)
|
||||||||||||
|
Balance at January 28, 2012
|
226,864
|
|
$
|
2,269
|
|
$
|
788,895
|
|
$
|
(62,262
|
)
|
$635
|
$
|
763,475
|
|
$
|
1,493,012
|
|
||||||||
|
Net earnings
|
—
|
|
—
|
|
—
|
|
—
|
|
—
|
|
786,763
|
|
786,763
|
|
||||||||||||
|
Unrealized investment loss, net
|
—
|
|
—
|
|
—
|
|
—
|
|
(50
|
)
|
—
|
|
(50
|
)
|
||||||||||||
|
Common stock issued under stock
|
||||||||||||||||||||||||||
|
plans, net of shares
|
||||||||||||||||||||||||||
|
used for tax withholding
|
1,315
|
|
13
|
|
19,030
|
|
(29,446
|
)
|
—
|
|
—
|
|
(10,403
|
)
|
||||||||||||
|
Tax benefit from equity issuance
|
—
|
|
—
|
|
29,989
|
|
—
|
|
—
|
|
—
|
|
29,989
|
|
||||||||||||
|
Stock-based compensation
|
—
|
|
—
|
|
48,952
|
|
—
|
|
—
|
|
—
|
|
48,952
|
|
||||||||||||
|
Common stock repurchased
|
(7,458
|
)
|
(75
|
)
|
(20,347
|
)
|
—
|
|
—
|
|
(429,578
|
)
|
(450,000
|
)
|
||||||||||||
|
Dividends declared ($0.59 per share)
|
—
|
|
—
|
|
—
|
|
—
|
|
—
|
|
(131,400
|
)
|
(131,400
|
)
|
||||||||||||
|
Balance at February 2, 2013
|
220,721
|
|
$
|
2,207
|
|
$
|
866,519
|
|
$
|
(91,708
|
)
|
$585
|
$
|
989,260
|
|
$
|
1,766,863
|
|
||||||||
|
Net earnings
|
—
|
|
—
|
|
—
|
|
—
|
|
—
|
|
837,304
|
|
837,304
|
|
||||||||||||
|
Unrealized investment loss, net
|
—
|
|
—
|
|
—
|
|
—
|
|
(196
|
)
|
—
|
|
(196
|
)
|
||||||||||||
|
Common stock issued under stock
|
||||||||||||||||||||||||||
|
plans, net of shares
|
||||||||||||||||||||||||||
|
used for tax withholding
|
878
|
|
9
|
|
19,065
|
|
(29,851
|
)
|
—
|
|
—
|
|
(10,777
|
)
|
||||||||||||
|
Tax benefit from equity issuance
|
—
|
|
—
|
|
27,661
|
|
—
|
|
—
|
|
—
|
|
27,661
|
|
||||||||||||
|
Stock-based compensation
|
—
|
|
—
|
|
46,847
|
|
—
|
|
—
|
|
—
|
|
46,847
|
|
||||||||||||
|
Common stock repurchased
|
(8,179
|
)
|
(82
|
)
|
(24,501
|
)
|
—
|
|
—
|
|
(525,417
|
)
|
(550,000
|
)
|
||||||||||||
|
Dividends declared ($0.51 per share)
|
—
|
|
—
|
|
—
|
|
—
|
|
—
|
|
(110,400
|
)
|
(110,400
|
)
|
||||||||||||
|
Balance at February 1, 2014
|
213,420
|
|
$
|
2,134
|
|
$
|
935,591
|
|
$
|
(121,559
|
)
|
$389
|
$
|
1,190,747
|
|
$
|
2,007,302
|
|
||||||||
|
The accompanying notes are an integral part of these consolidated financial statements.
|
||||||||||||||||||||||||||
28
|
Year Ended
|
|
Year Ended
|
|
Year Ended
|
|
||||||
|
($000)
|
February 1, 2014
|
|
February 2, 2013
|
|
January 28, 2012
|
|
|||||
|
Cash Flows From Operating Activities
|
|||||||||||
|
Net earnings
|
$
|
837,304
|
|
$
|
786,763
|
|
$
|
657,170
|
|
||
|
Adjustments to reconcile net earnings to net cash provided by operating activities:
|
|
||||||||||
|
Depreciation and amortization
|
206,111
|
|
185,491
|
|
159,892
|
|
|||||
|
Stock-based compensation
|
46,847
|
|
48,952
|
|
40,404
|
|
|||||
|
Deferred income taxes
|
(15,250
|
)
|
(39,028
|
)
|
21,722
|
|
|||||
|
Tax benefit from equity issuance
|
27,661
|
|
29,989
|
|
19,040
|
|
|||||
|
Excess tax benefit from stock-based compensation
|
(26,906
|
)
|
(29,103
|
)
|
(18,180
|
)
|
|||||
|
Change in assets and liabilities:
|
|
||||||||||
|
Merchandise inventory
|
(47,918
|
)
|
(79,167
|
)
|
(43,153
|
)
|
|||||
|
Other current assets
|
(9,875
|
)
|
(14,474
|
)
|
(10,329
|
)
|
|||||
|
Accounts payable
|
(4,104
|
)
|
40,109
|
|
(11,614
|
)
|
|||||
|
Other current liabilities
|
(18,562
|
)
|
18,146
|
|
(2,109
|
)
|
|||||
|
Other long-term, net
|
26,695
|
|
31,966
|
|
7,262
|
|
|||||
|
Net cash provided by operating activities
|
1,022,003
|
|
979,644
|
|
820,105
|
|
|||||
|
Cash Flows From Investing Activities
|
|||||||||||
|
Additions to property and equipment
|
(550,515
|
)
|
(424,434
|
)
|
(416,271
|
)
|
|||||
|
Increase in restricted cash and investments
|
(2,895
|
)
|
(2,107
|
)
|
(60,086
|
)
|
|||||
|
Purchases of investments
|
(12,012
|
)
|
(5,430
|
)
|
—
|
|
|||||
|
Proceeds from investments
|
1,614
|
|
6,247
|
|
4,589
|
|
|||||
|
Net cash used in investing activities
|
(563,808
|
)
|
(425,724
|
)
|
(471,768
|
)
|
|||||
|
Cash Flows From Financing Activities
|
|||||||||||
|
Excess tax benefit from stock-based compensation
|
26,906
|
|
29,103
|
|
18,180
|
|
|||||
|
Issuance of common stock related to stock plans
|
19,074
|
|
19,043
|
|
17,290
|
|
|||||
|
Treasury stock purchased
|
(29,851
|
)
|
(29,446
|
)
|
(15,854
|
)
|
|||||
|
Repurchase of common stock
|
(550,000
|
)
|
(450,000
|
)
|
(450,000
|
)
|
|||||
|
Dividends paid
|
(147,917
|
)
|
(125,694
|
)
|
(102,042
|
)
|
|||||
|
Net cash used in financing activities
|
(681,788
|
)
|
(556,994
|
)
|
(532,426
|
)
|
|||||
|
Net decrease in cash and cash equivalents
|
(223,593
|
)
|
(3,074
|
)
|
(184,089
|
)
|
|||||
|
Cash and cash equivalents:
|
|||||||||||
|
Beginning of year
|
646,761
|
|
649,835
|
|
833,924
|
|
|||||
|
End of year
|
$
|
423,168
|
|
$
|
646,761
|
|
$
|
649,835
|
|
||
|
Supplemental Cash Flow Disclosures
|
|||||||||||
|
Interest paid
|
$
|
9,668
|
|
$
|
9,668
|
|
$
|
9,668
|
|
||
|
Income taxes paid
|
$
|
506,182
|
|
$
|
435,808
|
|
$
|
370,074
|
|
||
|
The accompanying notes are an integral part of these consolidated financial statements.
|
|||||||||||
29
Notes to Consolidated Financial Statements
Note A: Summary of Significant Accounting Policies
Business.
Ross Stores, Inc. and its subsidiaries (the “Company”) is an off-price retailer of first-quality, in-season, name brand and designer apparel, accessories, footwear, and home fashions for the entire family. At the end of fiscal
2013
, the Company operated
1,146
Ross Dress for Less
®
(“Ross”) locations in
33 states, the District of Columbia and Guam
, and
130
dd’s DISCOUNTS
®
stores in
10 states
. The Ross and dd's DISCOUNTS stores are supported by four distribution centers. The Company’s headquarters, one buying office, two operating distribution centers, one warehouse, and
25%
of its stores are located in California.
Segment reporting.
The Company has one reportable segment. The Company’s operations include only activities related to off-price retailing in stores throughout the United States.
Basis of presentation and fiscal year.
The consolidated financial statements include the accounts of the Company and its subsidiaries, all of which are wholly-owned. Intercompany transactions and accounts have been eliminated. The Company follows the National Retail Federation fiscal calendar and utilizes a 52-53 week fiscal year whereby the fiscal year ends on the Saturday nearest to January 31. The fiscal years ended
February 1, 2014
,
February 2, 2013
and
January 28, 2012
are referred to as fiscal
2013
, fiscal
2012
, and fiscal
2011
, respectively. Fiscal
2012
was 53 weeks. Fiscal
2013
and
2011
were each 52 weeks.
Stock dividend.
On December 15, 2011 the Company issued a
two
-for-one stock split in the form of a
100 percent
stock dividend. All share and per share amounts have been adjusted for the two-for-one stock split effective December 15, 2011.
Use of accounting estimates.
The preparation of consolidated financial statements in conformity with Generally Accepted Accounting Principles in the United States of America (“GAAP”) requires the Company to make estimates and assumptions that affect the reported amounts of assets, liabilities, and disclosures of contingent assets and liabilities at the date of the consolidated financial statements and the reported amounts of revenue and expenses during the reporting period. Actual results could differ from those estimates. The Company’s significant accounting estimates include valuation reserves for inventory shortage, packaway inventory costs, useful lives of fixed assets, insurance reserves, and reserves for uncertain tax positions.
Purchase obligations.
As of
February 1, 2014
, the Company had purchase obligations of approximately
$1,812 million
. These purchase obligations primarily consist of merchandise inventory purchase orders, commitments related to store fixtures and supplies, and information technology service and maintenance contracts.
Cash and cash equivalents.
Cash equivalents consist of highly liquid, fixed income instruments purchased with an original maturity of three months or less.
Restricted cash, cash equivalents, and investments.
The Company has restricted cash, cash equivalents, and investments that serve as collateral for certain insurance obligations of the Company. These restricted funds are invested in bank deposits, money market mutual funds, U.S. Government and agency securities, and corporate securities and cannot be withdrawn from the Company’s account without the prior written consent of the secured parties. The following table summarizes total restricted cash, cash equivalents, and investments which were included in prepaid expenses and other and other long-term assets in the Consolidated Balance Sheet as of February 1, 2014 and February 2, 2013:
|
Restricted Assets ($000)
|
2013
|
|
2012
|
|
||||
|
Prepaid expenses and other
|
$
|
20,734
|
|
$
|
19,941
|
|
||
|
Other long-term assets
|
50,763
|
|
48,821
|
|
||||
|
Total
|
$
|
71,497
|
|
|
$
|
68,762
|
|
|
The classification between current and long-term is based on the timing of expected payments of the insurance obligations.
Estimated fair value of financial instruments.
The carrying value of cash and cash equivalents, short- and long-term investments, restricted cash and cash equivalents, restricted investments, accounts receivable, other long-term
30
assets, accounts payable, and other long-term liabilities approximates their estimated fair value. See Note B and Note D for additional fair value information.
Cash and cash equivalents were
$423.2 million
and
$646.8 million
, at
February 1, 2014
and
February 2, 2013
, respectively, and include bank deposits and money market funds for which the fair value was determined using quoted prices for identical assets in active markets, which are considered to be Level 1 inputs under the fair value measurements and disclosures guidance.
Investments.
The Company’s investments are comprised of various debt securities. At
February 1, 2014
and
February 2, 2013
, these investments were classified as available-for-sale and are stated at fair value. Investments are classified as either short- or long-term based on their original maturities and the Company’s intent. Investments with an original maturity of less than one year are classified as short-term. See Note B for additional information.
Merchandise inventory.
Merchandise inventory is stated at the lower of cost (determined using a weighted average basis) or net realizable value. The Company purchases manufacturer overruns and canceled orders both during and at the end of a season which are referred to as "packaway" inventory. Packaway inventory is purchased with the intent that it will be stored in the Company's warehouses until a later date. The timing of the release of packaway inventory to the stores is principally driven by the product mix and seasonality of the merchandise, and its relation to the Company’s store merchandise assortment plans. As such, the aging of packaway varies by merchandise category and seasonality of purchase, but typically packaway remains in storage less than six months. Packaway inventory accounted for approximately
49%
and
47%
, of total inventories as of
February 1, 2014
and
February 2, 2013
. Merchandise inventory includes acquisition, processing, and storage costs related to packaway inventory. The cost of the Company’s merchandise inventory is reduced by valuation reserves for shortage based on historical shortage experience from the Company’s physical merchandise inventory counts and cycle counts.
Cost of goods sold.
In addition to
product costs, the Company includes in cost of goods sold its buying, distribution and freight expenses as well as occupancy costs, and depreciation and amortization related to the Company’s retail stores, buying, and distribution facilities. Buying expenses include costs to procure merchandise inventories. Distribution expenses include the cost of operating the Company’s distribution centers.
Prepaid expenses and other.
Prepaid expenses and other as of
February 1, 2014
and
February 2, 2013
consisted of the following:
|
($000)
|
2013
|
|
2012
|
|
||||
|
Restricted cash and investments
|
$
|
20,734
|
|
$
|
19,941
|
|
||
|
Prepaid expenses
|
81,257
|
|
74,377
|
|
||||
|
Total
|
$
|
101,991
|
|
$
|
94,318
|
|
||
Property and equipment.
Property and equipment are stated at cost, less accumulated depreciation and amortization. Depreciation is calculated using the straight-line method over the estimated useful life of the asset, typically ranging from three to 12 years for equipment and 20 to 40 years for land improvements and buildings. Depreciation and amortization expense on property and equipment was
$206.1 million
,
$185.5 million
, and
$159.9 million
for fiscal
2013
,
2012
, and
2011
, respectively. The cost of leasehold improvements is amortized over the useful life of the asset or the applicable lease term, whichever is less. Computer hardware and software costs, net of depreciation, of
$209.4 million
and
$166.2 million
at
February 1, 2014
and
February 2, 2013
, respectively, are included in fixtures and equipment and are amortized over their estimated useful life, generally ranging from three to seven years. The Company capitalizes interest during the construction period. Interest capitalized was
$10.8 million
,
$3.9 million
, and
$0.5 million
in fiscal
2013
, fiscal
2012
, and fiscal
2011
, respectively. As of
February 1, 2014
,
February 2, 2013
, and
January 28, 2012
the Company had
$61.3 million
,
$23.7 million
, and
$11.1 million
, respectively, of property and equipment purchased but not yet paid. These purchases are included in Property and Equipment and in Accounts payable and Accrued expenses and other in the accompanying consolidated balance sheets.
In July 2013, the Company purchased the land and building of its previously leased,
1.3 million
square foot Perris, California distribution center for
$70 million
.
In October 2013, the Company entered into a Sale-Purchase Agreement under which it has the right to purchase the office building where its New York buying office is located for
$222 million
. The building is subject to a
99
year ground lease through June 2111. The Sale-Purchase Agreement contemplates completion of the sale and purchase of the building on or before September 20, 2014, subject to satisfaction of various closing conditions. Under the Sale-Purchase
31
Agreement, the Company provided a deposit of
10%
of the purchase price. In the event the Company is unable or chooses not to complete the purchase of the building, the Company would forfeit the deposit but have no further liability to the seller or obligation to complete the purchase. In September 2013, the Company deposited
$11.1 million
and provided an
$11.1 million
standby letter of credit to meet the 10% deposit obligation. In January 2014, the Company deposited an additional
$2.2 million
in escrow for the building bringing the total deposit to
$13.3 million
. The Company plans to finance the purchase of the building in 2014.
Other long-term assets.
Other long-term assets as of
February 1, 2014
and
February 2, 2013
consisted of the following:
|
($000)
|
2013
|
|
2012
|
|
||||
|
Deferred compensation (Note B)
|
$
|
88,269
|
|
$
|
76,911
|
|
||
|
Restricted cash and investments
|
50,763
|
|
48,821
|
|
||||
|
Goodwill
|
2,889
|
|
2,889
|
|
||||
|
Deposits
|
3,285
|
|
3,185
|
|
||||
|
Other
|
5,423
|
|
9,670
|
|
||||
|
Total
|
$
|
150,629
|
|
$
|
141,476
|
|
||
Other assets
are principally comprised of prepaid rent and other long-term prepayments.
Property and other long-term assets that are subject to amortization are reviewed for impairment whenever events or changes in circumstances indicate that the carrying amount of an asset may not be recoverable. Intangible assets that are not subject to amortization, including goodwill, are tested for impairment annually or more frequently if events or changes in circumstances indicate that the asset may be impaired. Based on the Company’s evaluation during fiscal
2013
,
2012
, and
2011
, no impairment charges were recorded.
Store closures.
The Company continually reviews the operating performance of individual stores. For stores that are closed, the Company records a liability for future minimum lease payments net of estimated sublease recoveries and related ancillary costs at the time the liability is incurred. In
2013
, the Company closed
11
Ross stores. In
2012
, the Company closed
eight
Ross stores. The lease loss liability was
$6.3 million
and
$3.4 million
, as of
February 1, 2014
and
February 2, 2013
, respectively. Operating costs, including depreciation, of stores to be closed are expensed during the period they remain in use.
Accounts payable.
Accounts payable represents amounts owed to third parties at the end of the period. Accounts payable includes book cash overdrafts (checks issued under zero balance accounts not yet presented for payment) in excess of cash balances in such accounts of approximately
$75.7 million
and
$82.6 million
at
February 1, 2014
and
February 2, 2013
, respectively. The Company includes the change in book cash overdrafts in operating cash flows.
Insurance obligations.
The Company uses a combination of insurance and self-insurance for a number of risk management activities, including workers’ compensation, general liability, and employee-related health care benefits. The self-insurance and deductible liability is determined actuarially, based on claims filed and an estimate of claims incurred but not yet reported. Self-insurance and deductible reserves as of
February 1, 2014
and
February 2, 2013
consisted of the following:
|
($000)
|
2013
|
|
2012
|
|
||||
|
Workers’ compensation
|
$
|
82,223
|
|
$
|
80,079
|
|
||
|
General liability
|
34,524
|
|
30,670
|
|
||||
|
Medical plans
|
3,537
|
|
3,451
|
|
||||
|
Total
|
$
|
120,284
|
|
$
|
114,200
|
|
||
Workers’ compensation and self-insured medical plan liabilities are included in Accrued payroll and benefits, and accruals for general liability are included in Accrued expenses and other in the accompanying consolidated balance sheets.
32
Other long-term liabilities.
Other long-term liabilities as of
February 1, 2014
and
February 2, 2013
consisted of the following:
|
($000)
|
2013
|
|
2012
|
|
||||
|
Deferred compensation (Note G)
|
$
|
88,269
|
|
$
|
76,911
|
|
||
|
Deferred rent
|
64,671
|
|
62,250
|
|
||||
|
Income taxes (Note F)
|
104,944
|
|
82,483
|
|
||||
|
Tenant improvement allowances
|
19,744
|
|
23,944
|
|
||||
|
Other
|
9,939
|
|
1,227
|
|
||||
|
Total
|
$
|
287,567
|
|
$
|
246,815
|
|
||
Lease accounting.
When a lease contains “rent holidays” or requires fixed escalations of the minimum lease payments, the Company records rental expense on a straight-line basis over the term of the lease and the difference between the average rental amount charged to expense and the amount payable under the lease is recorded as deferred rent. The Company begins recording rent expense on the lease possession date. Tenant improvement allowances are included in Other long-term liabilities and are amortized over the lease term. Changes in tenant improvement allowances are included as a component of operating activities in the consolidated statements of cash flows.
Revenue recognition.
The Company recognizes revenue at the point of sale and maintains an allowance for estimated future returns. Sales of stored value cards are deferred until they are redeemed for the purchase of Company merchandise. The Company’s stored value cards do not have expiration dates. Based upon historical redemption rates, a small percentage of stored value cards will never be redeemed, which represents breakage. The Company recognizes income from stored value card breakage as a reduction of operating expenses when redemption by a customer is considered to be remote. Income recognized from breakage was not significant in fiscal
2013
,
2012
, and
2011
.
Sales tax collected is not recognized as revenue and is included in Accrued expenses and other.
Allowance for sales returns.
An allowance for the gross margin loss on estimated sales returns is included in Accrued expenses and other in the consolidated balance sheets. The allowance for sales returns consists of the following:
|
($000)
|
Beginning Balance
|
|
Additions
|
|
Returns
|
|
Ending Balance
|
|
||||||||
|
Year ended:
|
||||||||||||||||
|
February 1, 2014
|
$
|
7,165
|
|
$
|
699,835
|
|
$
|
(699,569
|
)
|
$
|
7,431
|
|
||||
|
February 2, 2013
|
$
|
6,426
|
|
$
|
680,058
|
|
$
|
(679,319
|
)
|
$
|
7,165
|
|
||||
|
January 28, 2012
|
$
|
5,869
|
|
$
|
606,293
|
|
$
|
(605,736
|
)
|
$
|
6,426
|
|
||||
Store pre-opening.
Store pre-opening costs are expensed in the period incurred.
Advertising.
Advertising costs are expensed in the period incurred and are included in Selling, general and administrative expenses. Advertising costs for fiscal
2013
,
2012
, and
2011
were
$70.2 million
,
$67.7 million
, and
$59.9 million
, respectively.
Stock-based compensation.
The Company recognizes compensation expense based upon the grant date fair value of all stock-based awards, typically over the vesting period. See Note C for more information on the Company’s stock-based compensation plans.
Taxes on earnings.
The Company accounts for income taxes in accordance with Accounting Standards Codification (“ASC”) 740, “Accounting for Income Taxes,” which requires the recognition of deferred tax assets and liabilities for the expected future tax consequences of events that have been recognized in the Company's consolidated financial statements or tax returns. In estimating future tax consequences, the Company generally considers all expected future events other than changes in the tax law or tax rates. ASC 740 also clarifies the criteria that an individual tax position must satisfy for some or all of the benefits of that position to be recognized in a company’s consolidated financial statements and prescribes a recognition threshold of more-likely-than-not, and a measurement standard for all tax positions taken or expected to be taken on a tax return, in order for those tax positions to be recognized in the consolidated financial statements. See Note F.
33
Treasury stock.
The Company records treasury stock at cost. Treasury stock includes shares purchased from employees for tax withholding purposes related to vesting of restricted stock grants.
Earnings per share
(“EPS”).
The Company computes and reports both basic EPS and diluted EPS. Basic EPS is computed by dividing net earnings by the weighted average number of common shares outstanding for the period. Diluted EPS is computed by dividing net earnings by the sum of the weighted average number of common shares and dilutive common stock equivalents outstanding during the period. Diluted EPS reflects the total potential dilution that could occur from outstanding equity plan awards, including unexercised stock options and unvested shares of both performance and non-performance based awards of restricted stock and restricted stock units.
In fiscal
2013
,
2012
, and
2011
there were
2,900
,
53,900
, and
5,900
weighted average shares, respectively, that were excluded from the calculation of diluted EPS because their effect would have been anti-dilutive for those years.
The following is a reconciliation of the number of shares (denominator) used in the basic and diluted EPS computations:
|
Shares in (000s)
|
Basic EPS
|
|
Effect of dilutive
common stock equivalents
|
|
Diluted EPS
|
|
||||||
|
2013
|
||||||||||||
|
Shares
|
212,881
|
|
2,924
|
|
215,805
|
|
||||||
|
Amount
|
$
|
3.93
|
|
$
|
(0.05
|
)
|
$
|
3.88
|
|
|||
|
2012
|
||||||||||||
|
Shares
|
219,130
|
|
3,654
|
|
222,784
|
|
||||||
|
Amount
|
$
|
3.59
|
|
$
|
(0.06
|
)
|
$
|
3.53
|
|
|||
|
2011
|
||||||||||||
|
Shares
|
225,915
|
|
4,067
|
|
229,982
|
|
||||||
|
Amount
|
$
|
2.91
|
|
$
|
(0.05
|
)
|
$
|
2.86
|
|
|||
Sales mix.
The Company’s sales mix is shown below for fiscal
2013
,
2012
, and
2011
:
|
2013
|
|
2012
|
|
2011
|
|
|||
|
Ladies
|
29
|
%
|
29
|
%
|
29
|
%
|
||
|
Home Accents and Bed and Bath
|
24
|
%
|
24
|
%
|
25
|
%
|
||
|
Accessories, Lingerie, Fine Jewelry, and Fragrances
|
13
|
%
|
13
|
%
|
13
|
%
|
||
|
Shoes
|
13
|
%
|
13
|
%
|
12
|
%
|
||
|
Men's
|
13
|
%
|
13
|
%
|
13
|
%
|
||
|
Children's
|
8
|
%
|
8
|
%
|
8
|
%
|
||
|
Total
|
100
|
%
|
100
|
%
|
100
|
%
|
||
Comprehensive income.
Comprehensive income includes net earnings and components of other comprehensive income (loss), net of tax, consisting of unrealized investment gains or losses.
34
Note B: Investments and Restricted Investments
The amortized cost and fair value of the Company’s available-for-sale securities as of
February 1, 2014
were:
|
($000)
|
Amortized
cost |
|
Unrealized
gains |
|
Unrealized
losses |
|
Fair value
|
|
Short-term
|
|
Long-term
|
|
||||||||||||
|
Investments
|
|
|
|
|
|
|
|
|
|
|
||||||||||||||
|
Corporate securities
|
$
|
3,298
|
|
$
|
325
|
|
$
|
(4
|
)
|
$
|
3,619
|
|
$
|
—
|
|
$
|
3,619
|
|
||||||
|
U.S. government and agency securities
|
12,005
|
|
1
|
|
—
|
|
12,006
|
|
12,006
|
|
—
|
|
||||||||||||
|
Mortgage-backed securities
|
86
|
|
5
|
|
—
|
|
91
|
|
—
|
|
91
|
|
||||||||||||
|
Total investments
|
15,389
|
|
331
|
|
(4
|
)
|
15,716
|
|
12,006
|
|
3,710
|
|
||||||||||||
|
Restricted Investments
|
||||||||||||||||||||||||
|
Corporate securities
|
110
|
|
5
|
|
—
|
|
115
|
|
115
|
|
—
|
|
||||||||||||
|
U.S. government and agency securities
|
3,728
|
|
266
|
|
—
|
|
3,994
|
|
145
|
|
3,849
|
|
||||||||||||
|
Total restricted investments
|
3,838
|
|
271
|
|
—
|
|
4,109
|
|
260
|
|
3,849
|
|
||||||||||||
|
Total
|
$
|
19,227
|
|
$
|
602
|
|
$
|
(4
|
)
|
$
|
19,825
|
|
$
|
12,266
|
|
$
|
7,559
|
|
||||||
The amortized cost and fair value of the Company's available-for-sale securities as of
February 2, 2013
were:
|
($000)
|
Amortized
cost |
|
Unrealized
gains |
|
Unrealized
losses |
|
Fair value
|
Short-term
|
Long-term
|
|||||||||||||||
|
Investments
|
||||||||||||||||||||||||
|
Corporate securities
|
$
|
4,715
|
|
$
|
468
|
|
$
|
(14
|
)
|
$
|
5,169
|
|
$
|
1,013
|
|
$
|
4,156
|
|
||||||
|
Mortgage-backed securities
|
276
|
|
16
|
|
—
|
|
292
|
|
74
|
|
218
|
|
||||||||||||
|
Total investments
|
4,991
|
|
484
|
|
(14
|
)
|
5,461
|
|
1,087
|
|
4,374
|
|
||||||||||||
|
Restricted Investments
|
||||||||||||||||||||||||
|
Corporate securities
|
1,360
|
|
34
|
|
—
|
|
1,394
|
|
1,275
|
|
119
|
|
||||||||||||
|
U.S. government and agency securities
|
3,748
|
|
397
|
|
—
|
|
4,145
|
|
—
|
|
4,145
|
|
||||||||||||
|
Total restricted investments
|
5,108
|
|
431
|
|
—
|
|
5,539
|
|
1,275
|
|
4,264
|
|
||||||||||||
|
Total
|
$
|
10,099
|
|
$
|
915
|
|
$
|
(14
|
)
|
$
|
11,000
|
|
$
|
2,362
|
|
$
|
8,638
|
|
||||||
The change in fair value of investment securities for fiscal years
2013
,
2012
, and
2011
was a decrease of
$0.3 million
and
$0.1 million
, and an increase of
$0.2 million
, respectively.
Accounting standards pertaining to fair value measurements establish a three-tier fair value hierarchy, which prioritizes the inputs used in measuring fair value. These tiers include: Level 1, defined as observable inputs such as quoted prices in active markets; Level 2, defined as inputs other than quoted prices in active markets that are either directly or indirectly observable; and Level 3, defined as unobservable inputs in which little or no market data exists, therefore requiring an entity to develop its own assumptions. This fair value hierarchy also requires the Company to maximize the use of observable inputs and minimize the use of unobservable inputs when measuring fair value. Corporate, U.S. government and agency, and mortgage-backed securities are classified within Level 1 or Level 2 because these securities are valued using quoted market prices or alternative pricing sources and models utilizing market observable inputs.
35
Investments and restricted investments measured at fair value at
February 1, 2014
are summarized below:
|
Fair Value Measurements at Reporting Date
|
|||||||||||||||
|
February 1,
2014 |
|
Quoted prices in
active markets for
identical assets
|
|
Significant
other
observable
inputs
|
|
Significant
unobservable
inputs
|
|
||||||||
|
($000)
|
(Level 1)
|
|
(Level 2)
|
|
(Level 3)
|
|
|||||||||
|
Investments
|
|||||||||||||||
|
Corporate securities
|
$
|
3,619
|
|
$
|
—
|
|
$
|
3,619
|
|
$
|
—
|
|
|||
|
U.S. government and agency securities
|
12,006
|
|
12,006
|
|
—
|
|
—
|
|
|||||||
|
Mortgage-backed securities
|
91
|
|
—
|
|
91
|
|
—
|
|
|||||||
|
Total investments
|
15,716
|
|
12,006
|
|
3,710
|
|
—
|
|
|||||||
|
Restricted Investments
|
|||||||||||||||
|
Corporate securities
|
115
|
|
—
|
|
115
|
|
—
|
|
|||||||
|
U.S. government and agency securities
|
3,994
|
|
3,994
|
|
—
|
|
—
|
|
|||||||
|
Total restricted investments
|
4,109
|
|
3,994
|
|
115
|
|
—
|
|
|||||||
|
Total
|
$
|
19,825
|
|
$
|
16,000
|
|
$
|
3,825
|
|
$
|
—
|
|
|||
Investments and restricted investments measured at fair value at
February 2, 2013
are summarized below:
|
Fair Value Measurements at Reporting Date
|
|||||||||||||||
|
February 2,
2013 |
|
Quoted prices in
active markets for identical assets |
|
Significant
other
observable
inputs
|
|
Significant
unobservable
inputs
|
|
||||||||
|
($000)
|
(Level 1)
|
|
(Level 2)
|
|
(Level 3)
|
|
|||||||||
|
Investments
|
|||||||||||||||
|
Corporate securities
|
$
|
5,169
|
|
$
|
—
|
|
$
|
5,169
|
|
$
|
—
|
|
|||
|
Mortgage-backed securities
|
292
|
|
—
|
|
292
|
|
—
|
|
|||||||
|
Total investments
|
5,461
|
|
—
|
|
5,461
|
|
—
|
|
|||||||
|
Restricted Investments
|
|||||||||||||||
|
Corporate securities
|
1,394
|
|
—
|
|
1,394
|
|
—
|
|
|||||||
|
U.S. government and agency securities
|
4,145
|
|
4,145
|
|
—
|
|
—
|
|
|||||||
|
Total restricted investments
|
5,539
|
|
4,145
|
|
1,394
|
|
—
|
|
|||||||
|
Total
|
$
|
11,000
|
|
$
|
4,145
|
|
$
|
6,855
|
|
$
|
—
|
|
|||
The future maturities of investment and restricted investment securities at
February 1, 2014
were:
|
Investments
|
Restricted Investments
|
||||||||||||||
|
($000)
|
Cost basis
|
|
Estimated fair value
|
|
Cost basis
|
|
Estimated fair value
|
|
|||||||
|
Maturing in one year or less
|
$
|
12,005
|
|
$
|
12,006
|
|
$
|
254
|
|
$
|
260
|
|
|||
|
Maturing after one year through five years
|
3,384
|
|
3,710
|
|
3,186
|
|
3,425
|
|
|||||||
|
Maturing after five years through ten years
|
—
|
|
—
|
|
398
|
|
424
|
|
|||||||
|
Total
|
$
|
15,389
|
|
$
|
15,716
|
|
$
|
3,838
|
|
$
|
4,109
|
|
|||
36
The underlying assets in the Company’s non-qualified deferred compensation program as of
February 1, 2014
and
February 2, 2013
(included in other long-term assets and in other long-term liabilities) primarily consist of participant-directed money market, stable value, stock, and bond funds. The fair value measurement for funds with quoted market prices in active markets (Level 1) and for funds without quoted market prices in active markets (Level 2) are as follows:
|
($ millions)
|
2013
|
|
2012
|
|
|||
|
Level 1
|
$
|
76.9
|
|
$
|
65.9
|
|
|
|
Level 2
|
11.4
|
|
11.0
|
|
|||
|
Total
|
$
|
88.3
|
|
$
|
76.9
|
|
|
Fair market value for Level 2 funds is considered to be the sum of participant funds invested under a group annuity contract plus accrued interest.
Note C: Stock-Based Compensation
For fiscal
2013
,
2012
, and
2011
, the Company recognized stock-based compensation expense as follows:
|
($000)
|
2013
|
|
2012
|
|
2011
|
|
|||||
|
Restricted stock
|
$
|
30,921
|
|
$
|
29,191
|
|
$
|
22,994
|
|
||
|
Performance awards
|
13,812
|
|
17,872
|
|
15,944
|
|
|||||
|
ESPP
|
2,114
|
|
1,889
|
|
1,466
|
|
|||||
|
Total
|
$
|
46,847
|
|
$
|
48,952
|
|
$
|
40,404
|
|
||
Capitalized stock-based compensation cost was not significant in any year.
No
stock options were granted during fiscal
2013
,
2012
, and
2011
. The Company recognizes expense for ESPP purchase rights equal to the value of the
15%
discount given on the purchase date. At
February 1, 2014
, the Company had
one
stock-based compensation plan, which is further described in Note H.
Total stock-based compensation recognized in the Company's Consolidated Statements of Earnings for fiscal
2013
,
2012
, and
2011
is as follows:
|
Statements of Earnings Classification ($000)
|
2013
|
|
2012
|
|
2011
|
|
|||||
|
Cost of goods sold
|
$
|
24,432
|
|
$
|
22,915
|
|
$
|
17,670
|
|
||
|
Selling, general and administrative
|
22,415
|
|
26,037
|
|
22,734
|
|
|||||
|
Total
|
$
|
46,847
|
|
$
|
48,952
|
|
$
|
40,404
|
|
||
Senior notes.
The Company has issued two series of unsecured senior notes in the aggregate principal amount of
$150 million
, held by various institutional investors. The Series A notes totaling
$85 million
are due in
December 2018
and bear interest at a rate of
6.38%
. The Series B notes totaling
$65 million
are due in
December 2021
and bear interest at a rate of
6.53%
. The fair value of these notes as of
February 1, 2014
of approximately
$182 million
is estimated by obtaining comparable market quotes which are considered to be Level 1 inputs under the fair value measurements and disclosures guidance. The senior notes are subject to prepayment penalties for early payment of principal.
Revolving credit facility.
The Company's
$600 million
unsecured revolving credit facility expires in
June 2017
and contains a
$300 million
sublimit for issuance of standby letters of credit. Interest on this facility is based on LIBOR plus an applicable margin (currently
100
basis points) and is payable quarterly and upon maturity. As of
February 1, 2014
37
the Company had
no
borrowings or standby letters of credit outstanding under this facility and the
$600 million
credit facility remains in place and available.
Borrowings under the credit facility and the senior notes are subject to certain covenants, including interest coverage and other financial ratios. In addition, the interest rates under the revolving credit facility may vary depending on actual interest coverage ratios achieved. As of
February 1, 2014
, the Company was in compliance with these covenants.
Standby letters of credit and collateral trust.
The Company uses standby letters of credit outside of its revolving credit facility in addition to a funded trust to collateralize its insurance obligations. As of
February 1, 2014
and
February 2, 2013
, the Company had
$24.3 million
and
$33.8 million
, respectively, in standby letters of credit and
$47.2 million
and
$34.9 million
, respectively, in a collateral trust. The standby letters of credit are collateralized by restricted cash and the collateral trust consists of restricted cash, cash equivalents, and investments.
As of
February 1, 2014
, the Company also had an
$11.1 million
standby letter of credit in connection with the New York buying office Sale-Purchase Agreement.
Trade letters of credit.
The Company had
$31.6 million
and
$38.0 million
in trade letters of credit outstanding at
February 1, 2014
and
February 2, 2013
, respectively.
Note E: Leases
The Company leases all but
three
of its store locations with original, non-cancelable terms that in general range from
three
to
ten
years. Store leases typically contain provisions for
three
to
four
renewal options of
five
years each. Most store leases also provide for minimum annual rentals and for payment of certain expenses. In addition, some store leases also have provisions for additional rent based on a percentage of sales.
The Company leases
three
warehouses.
Two
of the warehouses are in Carlisle, Pennsylvania with leases expiring in
2016
and
2017
. The third warehouse is in Fort Mill, South Carolina, with a lease expiring in
2016
. The leases for all three warehouses contain renewal provisions.
The Company leases a
10
-acre parcel for trailer parking adjacent to its Perris, California distribution center, that expires in 2017 and a
20
-acre facility located in Moreno Valley, California primarily for ancillary truck and trailer parking that expires in 2015. Both of these leases contain renewal provisions.
The Company leases approximately
192,000
square feet of office space for its former headquarters in Pleasanton, California, under several facility leases the majority of which expire in June 2014. The term for the remaining space of approximately
11,000
square feet expires in March 2015. The Company does not plan to renew any of these leases.
The Company leases approximately
411,000
and
52,000
, square feet of office space for its New York City and Los Angeles buying offices, respectively. The lease terms for these facilities expire in
2022
and
2017
, respectively, and contain renewal provisions. The Company plans to purchase its New York buying office in 2014.
The aggregate future minimum annual lease payments under leases in effect at
February 1, 2014
are as follows:
|
($000)
|
Total operating leases
|
|
||
|
2014
|
$
|
417,443
|
|
|
|
2015
|
430,394
|
|
||
|
2016
|
371,341
|
|
||
|
2017
|
317,126
|
|
||
|
2018
|
252,254
|
|
||
|
Thereafter
|
498,371
|
|
||
|
Total minimum lease payments
|
$
|
2,286,929
|
|
|
Total rent expense was
$434.9 million
,
$406.6 million
, and
$380.0 million
in fiscal
2013
,
2012
, and
2011
, respectively.
38
Note F: Taxes on Earnings
The provision for income taxes consisted of the following:
|
($000)
|
2013
|
|
2012
|
|
2011
|
|
||||||
|
Current
|
||||||||||||
|
Federal
|
$
|
486,203
|
|
$
|
485,882
|
|
$
|
343,550
|
|
|||
|
State
|
35,053
|
|
31,227
|
|
30,702
|
|
||||||
|
521,256
|
|
517,109
|
|
374,252
|
|
|||||||
|
Deferred
|
||||||||||||
|
Federal
|
(11,055
|
)
|
(37,178
|
)
|
25,383
|
|
||||||
|
State
|
(4,195
|
)
|
(1,850
|
)
|
(3,661
|
)
|
||||||
|
(15,250
|
)
|
(39,028
|
)
|
21,722
|
|
|||||||
|
Total
|
$
|
506,006
|
|
$
|
478,081
|
|
$
|
395,974
|
|
|||
In fiscal
2013
,
2012
, and
2011
, the Company realized tax benefits of
$27.7 million
,
$30.0 million
and
$19.0 million
, respectively, related to employee equity programs that were credited to additional paid-in capital.
The provision for taxes for financial reporting purposes is different from the tax provision computed by applying the statutory federal income tax rate. The differences are reconciled below:
|
2013
|
|
2012
|
|
2011
|
|
||||
|
Federal income taxes at the statutory rate
|
35
|
%
|
35
|
%
|
35
|
%
|
|||
|
State income taxes (net of federal benefit) and other, net
|
3
|
%
|
3
|
%
|
3
|
%
|
|||
|
Total
|
38
|
%
|
38
|
%
|
38
|
%
|
|||
39
The components of deferred income taxes at
February 1, 2014
and
February 2, 2013
are as follows:
|
($000)
|
2013
|
|
2012
|
|
||||
|
Deferred Tax Assets
|
||||||||
|
Accrued liabilities
|
$
|
87,835
|
|
$
|
72,266
|
|
||
|
Deferred compensation
|
31,034
|
|
28,040
|
|
||||
|
Stock-based compensation
|
33,048
|
|
28,781
|
|
||||
|
Deferred rent
|
17,888
|
|
16,984
|
|
||||
|
California franchise taxes
|
16,479
|
|
13,376
|
|
||||
|
Employee benefits
|
16,177
|
|
18,315
|
|
||||
|
Other
|
4,992
|
|
3,686
|
|
||||
|
207,453
|
|
181,448
|
|
|||||
|
Deferred Tax Liabilities
|
||||||||
|
Depreciation
|
(212,383
|
)
|
(210,343
|
)
|
||||
|
Merchandise inventory
|
(28,558
|
)
|
(18,802
|
)
|
||||
|
Supplies
|
(10,730
|
)
|
(9,766
|
)
|
||||
|
Prepaid expenses
|
(4,426
|
)
|
(6,431
|
)
|
||||
|
(256,097
|
)
|
(245,342
|
)
|
|||||
|
Net Deferred Tax Liabilities
|
$
|
(48,644
|
)
|
$
|
(63,894
|
)
|
||
|
Classified as:
|
||||||||
|
Current net deferred tax asset
|
$
|
10,227
|
|
$
|
20,407
|
|
||
|
Long-term net deferred tax liability
|
(58,871
|
)
|
(84,301
|
)
|
||||
|
Net Deferred Tax Liabilities
|
$
|
(48,644
|
)
|
$
|
(63,894
|
)
|
||
The changes in amounts of unrecognized tax benefits (gross of federal tax benefits and excluding interest and penalties) at fiscal
2013
,
2012
, and
2011
are as follows:
|
($000)
|
2013
|
|
2012
|
|
2011
|
|
||||||
|
Unrecognized tax benefits - beginning of year
|
$
|
65,667
|
|
$
|
56,524
|
|
$
|
43,990
|
|
|||
|
Gross increases:
|
||||||||||||
|
Tax positions in current period
|
15,591
|
|
11,009
|
|
9,245
|
|
||||||
|
Tax positions in prior period
|
2,418
|
|
4,167
|
|
12,193
|
|
||||||
|
Gross decreases:
|
||||||||||||
|
Tax positions in prior periods
|
(519
|
)
|
(1,476
|
)
|
(4,491
|
)
|
||||||
|
Lapse of statute limitations
|
(2,274
|
)
|
(1,312
|
)
|
(682
|
)
|
||||||
|
Settlements
|
(560
|
)
|
(3,245
|
)
|
(3,731
|
)
|
||||||
|
Unrecognized tax benefits - end of year
|
$
|
80,323
|
|
$
|
65,667
|
|
$
|
56,524
|
|
|||
At the end of fiscal
2013
,
2012
, and
2011
, the reserves for unrecognized tax benefits were
$104.9 million
,
$82.5 million
, and
$72.4 million
inclusive of
$24.6 million
,
$16.8 million
, and
$15.9 million
of related interest and penalties, respectively. The Company accounts for interest and penalties related to unrecognized tax benefits as a part of its provision for taxes on earnings. If recognized,
$49.9 million
would impact the Company’s effective tax rate. The difference between the total amount of unrecognized tax benefits and the amounts that would impact the effective tax rate relates to amounts attributable to deferred income tax assets and liabilities. These amounts are net of federal and state income taxes.
During the next twelve months, it is reasonably possible that the statute of limitations may lapse pertaining to positions taken by the Company in prior year tax returns. If this occurs, the total amount of unrecognized tax benefits may decrease, reducing the provision for taxes on earnings by up to
$4.8 million
.
40
The Company is generally open to audit by the Internal Revenue Service under the statute of limitations for fiscal years
2010
through
2013
. The Company’s state income tax returns are generally open to audit under the various statutes of limitations for fiscal years
2009
through
2013
. Certain state tax returns are currently under audit by state tax authorities. The Company does not expect the results of these audits to have a material impact on the consolidated financial statements.
Note G: Employee Benefit Plans
The Company has a defined contribution plan that is available to certain employees. Under the plan, employee and Company contributions and accumulated plan earnings qualify for favorable tax treatment under Section 401(k) of the Internal Revenue Code. This plan permits employees to make contributions up to the maximum limits allowable under the Internal Revenue Code. The Company matches up to
4%
of the employee’s salary up to the plan limits. Company matching contributions to the 401(k) plan were
$10.4 million
,
$9.4 million
, and
$8.7 million
in fiscal
2013
,
2012
, and
2011
, respectively.
The Company also has an Incentive Compensation Plan which provides cash awards to key management and employees based on Company and individual performance.
The Company also makes available to management a Non-qualified Deferred Compensation Plan which allows management to make payroll contributions on a pre-tax basis in addition to the 401(k) plan. Other long-term assets include
$88.3 million
and
$76.9 million
at
February 1, 2014
and
February 2, 2013
, respectively, of long-term plan investments, at market value, set aside or designated for the Non-qualified Deferred Compensation Plan (See Note B). Plan investments are designated by the participants, and investment returns are not guaranteed by the Company. The Company has a corresponding liability to participants of
$88.3 million
and
$76.9 million
at
February 1, 2014
and
February 2, 2013
, respectively, included in Other long-term liabilities in the consolidated balance sheets.
In addition, the Company has certain individuals who receive or will receive post-employment medical benefits. The estimated liability for these benefits of
$6.8 million
and
$6.6 million
is included in Accrued expenses and other in the accompanying consolidated balance sheets as of
February 1, 2014
and
February 2, 2013
, respectively.
Note H: Stockholders' Equity
Common stock.
The Company repurchased
8.2 million
,
7.5 million
, and
11.3 million
shares of common stock for aggregate purchase prices of approximately
$550 million
,
$450 million
, and
$450 million
in fiscal
2013
,
2012
, and
2011
, respectively. In January 2013, the Company’s Board of Directors approved a
two
-year
$1.1 billion
stock repurchase program for fiscal 2013 and 2014.
The following table summarizes the Company’s stock repurchase activity in fiscal
2013
,
2012
, and
2011
:
|
Fiscal Year
|
Shares repurchased (in millions)
|
|
Average repurchase price
|
Repurchased
(in millions)
|
|||
|
2013
|
8.2
|
|
$67.24
|
$550
|
|||
|
2012
|
7.5
|
|
$60.34
|
$450
|
|||
|
2011
|
11.3
|
|
$39.95
|
$450
|
|||
Preferred stock.
The Company has
four million
shares of preferred stock authorized, with a par value of
$.01
per share.
No
preferred stock is issued or outstanding.
Dividends.
In
February 2014
, the Company’s Board of Directors declared a quarterly cash dividend of
$0.20
per common share, payable on
March 31, 2014
. The Company’s Board of Directors declared cash dividends of
$0.17
per common share in January, May, August, and November
2013
, cash dividends of
$0.14
per common share in January, May, August, and November
2012
, and cash dividends of
$0.11
per common share in January, May, August, and November
2011
.
2008 Equity Incentive Plan.
In 2008, the Company’s stockholders approved the adoption of the Ross Stores, Inc. 2008 Equity Incentive Plan (the “2008 Plan”) with an initial share reserve of
16.5 million
shares of the Company’s common stock, of which
12.0 million
shares can be issued as full value awards. The 2008 Plan provides for various types of incentive awards, which may potentially include the grant of stock options, stock appreciation rights, restricted stock purchase rights, restricted stock bonuses, restricted stock units, performance shares, performance units, and
41
deferred compensation awards. As of
February 1, 2014
, there were
7.0 million
shares that remained available for grant under the 2008 Plan.
A summary of the stock option activity for fiscal
2013
is presented below:
|
(000, except per share data)
|
Number of shares
|
|
Weighted
average
exercise price
|
|
Weighted average remaining contractual term
|
Aggregate
intrinsic value
|
||||
|
Outstanding at February 2, 2013
|
1,715
|
|
$13.79
|
|||||||
|
Granted
|
—
|
|
—
|
|
||||||
|
Exercised
|
(539
|
)
|
13.17
|
|
||||||
|
Forfeited
|
(7
|
)
|
13.63
|
|
||||||
|
Outstanding at February 1, 2014, all vested
|
1,169
|
|
$14.07
|
1.47
|
$62,957
|
|||||
The following table summarizes information about the weighted average remaining contractual life (in years) and the weighted average exercise prices for stock options both outstanding and exercisable as of
February 1, 2014
(number of shares in thousands):
|
Options outstanding and exercisable
|
|||||||||||||||||
|
Exercise price range
|
Number of shares
|
|
Remaining life
|
Exercise price
|
|
||||||||||||
|
$
|
11.39
|
|
to
|
$
|
13.81
|
|
240
|
|
1.34
|
$12.90
|
|||||||
|
13.83
|
|
to
|
13.91
|
|
286
|
|
1.93
|
13.89
|
|
||||||||
|
13.92
|
|
to
|
14.33
|
|
182
|
|
1.24
|
14.27
|
|
||||||||
|
14.35
|
|
to
|
14.35
|
|
235
|
|
1.02
|
14.35
|
|
||||||||
|
14.38
|
|
to
|
16.39
|
|
226
|
|
1.70
|
15.09
|
|
||||||||
|
$
|
11.39
|
|
to
|
$
|
16.39
|
|
1,169
|
|
1.47
|
$14.07
|
|||||||
A summary of the restricted stock activity for fiscal
2013
is presented below:
|
(000, except per share data)
|
Number of
shares
|
|
Weighted
average
grant date
fair value
|
|
||
|
Unvested at February 2, 2013
|
4,560
|
|
$29.96
|
|||
|
Awarded
|
780
|
|
58.56
|
|
||
|
Released
|
(1,273
|
)
|
24.68
|
|
||
|
Forfeited
|
(153
|
)
|
36.46
|
|
||
|
Unvested at February 1, 2014
|
3,914
|
|
$37.14
|
|||
The market value of shares of restricted stock and of the stock underlying restricted stock units at the date of grant is amortized to expense ratably over the vesting period of generally
three
to
five
years. The unamortized compensation expense at
February 1, 2014
and
February 2, 2013
was
$74.9 million
and
$75.8 million
, respectively, which is expected to be recognized over a weighted average remaining period of
1.7
years. Intrinsic value for restricted stock, defined as the closing market value on the last business day of fiscal year
2013
(or
$67.91
), was
$265.8 million
. A total of
6,986,000
,
7,202,000
, and
7,811,000
shares were available for new restricted stock awards at the end of fiscal
2013
,
2012
, and
2011
, respectively. During fiscal
2013
,
2012
, and
2011
, shares purchased by the Company for tax withholding totaled
496,000
,
505,000
, and
442,000
shares, respectively, and are considered treasury shares which are available for reissuance. As of
February 1, 2014
and
February 2, 2013
, the Company held
4,354,000
and
3,858,000
shares of treasury stock, respectively.
Performance share awards.
The Company has a performance share award program for senior executives. A performance share award represents a right to receive shares of restricted stock or restricted stock units on a specified settlement date based on the Company’s attainment of a profitability-based performance goal during the performance period, which is the Company’s fiscal year. If attained, the restricted stock or units then vest over a service period,
42
generally
two
to
three
years from the date the performance award was granted. The release of shares related to restricted stock units earned is deferred generally for
one
year from the date earned. The Company issued approximately
240,000
,
280,000
, and
467,000
shares in settlement of the fiscal
2013
,
2012
, and
2011
awards.
Employee Stock Purchase Plan.
Under the Employee Stock Purchase Plan (“ESPP”), eligible employees participating in the quarterly offering period can choose to have up to the lesser of
10%
or
$21,250
of their annual base earnings withheld to purchase the Company’s common stock. The purchase price of the stock is
85%
of the closing market price on the date of purchase. Purchases occur on a quarterly basis (on the last trading day of each calendar quarter). The Company recognizes expense for ESPP purchase rights equal to the value of the
15%
discount given on the purchase date.
During fiscal
2013
,
2012
, and
2011
, employees purchased approximately
208,000
,
211,000
, and
243,000
shares, respectively, of the Company’s common stock under the plan at weighted average per share prices of
$57.57
,
$50.67
, and
$34.24
, respectively. Through
February 1, 2014
, approximately
19,142,000
shares had been issued under this plan and
858,000
shares remained available for future issuance.
Note I: Related Party Transactions
The Company has a consulting agreement with Norman Ferber, its Chairman of the Board of Directors, under which the Company pays him an annual consulting fee of
$1.3 million
through
May 2016
. In addition, the agreement provides for administrative support and health and other benefits for the individual and his dependents, which totaled approximately
$0.3 million
in fiscal
2013
and
2012
and
$0.2 million
in
2011
, along with amounts to cover premiums through May 2016 on a life insurance policy with a death benefit of
$2.0 million
. On termination of Mr. Ferber’s consultancy with the Company, the Company will pay Mr. Ferber
$75,000
per year for a period of
10
years.
Robert Ferber, the son of Norman Ferber, is a buyer with the Company. For fiscal
2013
, the Company paid Robert Ferber compensation including salary and bonus of approximately
$134,000
.
Note J: Litigation, Claims, and Assessments
Like many California retailers, the Company has been named in class action lawsuits alleging violation of wage and hour and other employment laws. Class action litigation remains pending as of
February 1, 2014
.
The Company is also party to various other legal and regulatory proceedings arising in the normal course of business. Actions filed against the Company include commercial, product and product safety, customer, intellectual property, and labor and employment-related claims, including lawsuits in which private plaintiffs or governmental agencies allege that the Company violated local, state or federal laws. Actions against the Company are in various procedural stages. Many of these proceedings raise factual and legal issues and are subject to uncertainties.
In the opinion of management, the resolution of pending class action litigation and other currently pending legal proceedings is not expected to have a material adverse effect on the Company’s financial condition, results of operations, or cash flows.
43
Note K: Quarterly Financial Data (Unaudited)
Summarized quarterly financial information for fiscal
2013
and
2012
is presented in the tables below.
Year ended
February 1, 2014
:
|
Quarter Ended
|
||||||||||||||||||
|
($000, except per share data)
|
May 4, 2013
|
|
August 3, 2013
|
|
November 2, 2013
|
|
February 1, 2014
|
|
||||||||||
|
Sales
|
$
|
2,539,914
|
|
$
|
2,551,277
|
|
$
|
2,398,122
|
|
$
|
2,741,040
|
|
||||||
|
Cost of goods sold
|
1,798,811
|
|
1,823,777
|
|
1,746,235
|
|
1,992,101
|
|
||||||||||
|
Selling, general and administrative
|
361,968
|
|
381,193
|
|
381,860
|
|
401,345
|
|
||||||||||
|
Interest expense (income), net
|
209
|
|
(175
|
)
|
(152
|
)
|
(129
|
)
|
||||||||||
|
Total costs and expenses
|
2,160,988
|
|
2,204,795
|
|
2,127,943
|
|
2,393,317
|
|
||||||||||
|
Earnings before taxes
|
378,926
|
|
346,482
|
|
270,179
|
|
347,723
|
|
||||||||||
|
Provision for taxes on earnings
|
144,314
|
|
133,361
|
|
98,561
|
|
129,770
|
|
||||||||||
|
Net earnings
|
$
|
234,612
|
|
$
|
213,121
|
|
$
|
171,618
|
|
$
|
217,953
|
|
||||||
|
Earnings per share – basic
1
|
$
|
1.09
|
|
$
|
1.00
|
|
$
|
0.81
|
|
$
|
1.04
|
|
||||||
|
Earnings per share – diluted
1
|
$
|
1.07
|
|
$
|
0.98
|
|
$
|
0.80
|
|
$
|
1.02
|
|
||||||
|
Cash dividends declared per share
|
||||||||||||||||||
|
on common stock
|
$
|
—
|
|
$
|
0.17
|
|
$
|
0.17
|
|
$
|
0.17
|
|
||||||
|
Stock price
|
||||||||||||||||||
|
High
|
$
|
66.07
|
|
$
|
69.20
|
|
$
|
77.63
|
|
$
|
81.64
|
|
||||||
|
Low
|
$
|
55.23
|
|
$
|
63.29
|
|
$
|
64.76
|
|
$
|
67.66
|
|
||||||
|
1
Quarterly EPS results may not equal full year amounts due to rounding.
|
44
Year ended
February 2, 2013
:
|
Quarter Ended
|
||||||||||||||||||
|
($000, except per share data)
|
April 28, 2012
|
|
July 28, 2012
|
|
October 27, 2012
|
|
February 2, 2013
|
|
3
|
|||||||||
|
Sales
|
$
|
2,356,841
|
|
$
|
2,340,855
|
|
$
|
2,262,723
|
|
$
|
2,760,646
|
|
||||||
|
Cost of goods sold
|
1,679,127
|
|
1,689,643
|
|
1,648,997
|
|
1,993,661
|
|
||||||||||
|
Selling, general and administrative
|
337,811
|
|
352,089
|
|
357,983
|
|
390,003
|
|
||||||||||
|
Interest expense, net
|
2,232
|
|
2,086
|
|
1,643
|
|
946
|
|
||||||||||
|
Total costs and expenses
|
2,019,170
|
|
2,043,818
|
|
2,008,623
|
|
2,384,610
|
|
||||||||||
|
Earnings before taxes
|
337,671
|
|
297,037
|
|
254,100
|
|
376,036
|
|
||||||||||
|
Provision for taxes on earnings
|
129,058
|
|
115,013
|
|
94,576
|
|
139,434
|
|
||||||||||
|
Net earnings
|
$
|
208,613
|
|
$
|
182,024
|
|
$
|
159,524
|
|
$
|
236,602
|
|
||||||
|
Earnings per share – basic
1
|
$
|
0.94
|
|
$
|
0.83
|
|
$
|
0.73
|
|
$
|
1.09
|
|
||||||
|
Earnings per share – diluted
1
|
$
|
0.93
|
|
$
|
0.81
|
|
$
|
0.72
|
|
$
|
1.07
|
|
||||||
|
Cash dividends declared per share
|
||||||||||||||||||
|
on common stock
|
$
|
—
|
|
$
|
0.14
|
|
$
|
0.14
|
|
$
|
0.31
|
|
2
|
|||||
|
Stock price
|
||||||||||||||||||
|
High
|
$
|
62.22
|
|
$
|
69.23
|
|
$
|
69.98
|
|
$
|
61.15
|
|
||||||
|
Low
|
$
|
50.70
|
|
$
|
60.35
|
|
$
|
60.32
|
|
$
|
52.39
|
|
||||||
|
1
Quarterly EPS results may not equal full year amounts due to rounding.
|
|
2
Includes $.14 per share dividend declared in November 2012 and $.17 per share dividend declared in January 2013.
|
|
3
The quarter ended February 2, 2013 was a 14-week quarter; all other quarters presented were 13 weeks.
|
45
REPORT OF INDEPENDENT REGISTERED PUBLIC ACCOUNTING FIRM
Board of Directors and Stockholders
Ross Stores, Inc.
Dublin, California
We have audited the accompanying consolidated balance sheets of Ross Stores, Inc., and subsidiaries (the "Company") as of February 1, 2014 and February 2, 2013, and the related consolidated statements of earnings, comprehensive income, stockholders' equity, and cash flows for each of the three years in the period ended February 1, 2014. We also have audited the Company's internal control over financial reporting as of February 1, 2014, based on criteria established in
Internal Control - Integrated Framework (1992)
issued by the Committee of Sponsoring Organizations of the Treadway Commission. The Company's management is responsible for these financial statements, for maintaining effective internal control over financial reporting, and for its assessment of the effectiveness of internal control over financial reporting, included in the accompanying “Management’s Annual Report on Internal Control over Financial Reporting”. Our responsibility is to express an opinion on these financial statements and an opinion on the Company's internal control over financial reporting based on our audits.
We conducted our audits in accordance with the standards of the Public Company Accounting Oversight Board (United States). Those standards require that we plan and perform the audit to obtain reasonable assurance about whether the financial statements are free of material misstatement and whether effective internal control over financial reporting was maintained in all material respects. Our audits of the financial statements included examining, on a test basis, evidence supporting the amounts and disclosures in the financial statements, assessing the accounting principles used and significant estimates made by management, and evaluating the overall financial statement presentation. Our audit of internal control over financial reporting included obtaining an understanding of internal control over financial reporting, assessing the risk that a material weakness exists, and testing and evaluating the design and operating effectiveness of internal control based on the assessed risk. Our audits also included performing such other procedures as we considered necessary in the circumstances. We believe that our audits provide a reasonable basis for our opinions.
A company's internal control over financial reporting is a process designed by, or under the supervision of, the company's principal executive and principal financial officers, or persons performing similar functions, and effected by the company's board of directors, management, and other personnel to provide reasonable assurance regarding the reliability of financial reporting and the preparation of financial statements for external purposes in accordance with generally accepted accounting principles. A company's internal control over financial reporting includes those policies and procedures that (1) pertain to the maintenance of records that, in reasonable detail, accurately and fairly reflect the transactions and dispositions of the assets of the company; (2) provide reasonable assurance that transactions are recorded as necessary to permit preparation of financial statements in accordance with generally accepted accounting principles, and that receipts and expenditures of the company are being made only in accordance with authorizations of management and directors of the company; and (3) provide reasonable assurance regarding prevention or timely detection of unauthorized acquisition, use, or disposition of the company's assets that could have a material effect on the financial statements.
Because of the inherent limitations of internal control over financial reporting, including the possibility of collusion or improper management override of controls, material misstatements due to error or fraud may not be prevented or detected on a timely basis. Also, projections of any evaluation of the effectiveness of the internal control over financial reporting to future periods are subject to the risk that the controls may become inadequate because of changes in conditions, or that the degree of compliance with the policies or procedures may deteriorate.
In our opinion, the consolidated financial statements referred to above present fairly, in all material respects, the financial position of the Company as of February 1, 2014 and February 2, 2013, and the results of their operations and their cash flows for each of the three years in the period ended February 1, 2014, in conformity with accounting principles generally accepted in the United States of America. Also, in our opinion, the Company maintained, in all material respects, effective internal control over financial reporting as of February 1, 2014, based on the criteria established in
Internal Control - Integrated Framework (1992)
issued by the Committee of Sponsoring Organizations of the Treadway Commission
.
/s/
DELOITTE & TOUCHE LLP
San Francisco, California
April 1, 2014
46
None
Disclosure Controls and Procedures
Our management, with the participation of our Chief Executive Officer and Chief Financial Officer, conducted an evaluation of the effectiveness of our “disclosure controls and procedures,” (as defined in Exchange Act Rule 13a-15(e)), as of the end of the period covered by this report. Our disclosure controls and procedures are designed to provide reasonable assurance of achieving their objectives. Based on that evaluation, our Chief Executive Officer and Chief Financial Officer concluded that our disclosure controls and procedures were effective at that reasonable assurance level as of the end of the period covered by this report.
It should be noted that any system of controls, however well designed and operated, can provide only reasonable, and not absolute, assurance that the objectives of the system will be met. In addition, the design of any control system is based in part upon certain assumptions about the likelihood of future events.
Management’s Annual Report on Internal Control Over Financial Reporting
Our management is responsible for establishing and maintaining adequate internal control over financial reporting, as defined in Exchange Act Rule 13a-15(f). Our internal control over financial reporting is designed to provide reasonable assurance regarding the reliability of financial reporting and the preparation of consolidated financial statements for external purposes in accordance with generally accepted accounting principles.
Under the supervision and with the participation of our management, including our Chief Executive Officer and Chief Financial Officer, we conducted an evaluation of the effectiveness of our internal control over financial reporting based on the framework established by the Committee of Sponsoring Organizations of the Treadway Commission (COSO) as set forth in
Internal Control — Integrated Framework (1992)
. Based on our evaluation under the framework in
Internal Control — Integrated Framework (1992)
, our management concluded that our internal control over financial reporting was effective as of
February 1, 2014
.
Our internal control over financial reporting as of
February 1, 2014
has also been audited by Deloitte & Touche LLP, an independent registered public accounting firm, and their opinion as to the effectiveness of our internal control over financial reporting is stated in their report, dated
April 1, 2014
, which is included in Item 8 in this Annual Report on Form 10-K.
Because of its inherent limitations, internal control over financial reporting may not prevent or detect misstatements. It should be noted that any system of controls, however well designed and operated, can provide only reasonable, and not absolute, assurance that the objectives of the system will be met. In addition, the design of any control system is based in part upon certain assumptions about the likelihood of future events. Also, projections of any evaluation of effectiveness to future periods are subject to the risk that controls may become inadequate because of changes in conditions, or that the degree of compliance with the policies or procedures may deteriorate.
Quarterly Evaluation of Changes in Internal Control Over Financial Reporting
Our management, with the participation of our Chief Executive Officer and Chief Financial Officer, also conducted an evaluation of our internal control over financial reporting to determine whether any change occurred during the fourth fiscal quarter of
2013
that has materially affected, or is reasonably likely to materially affect, our internal control over financial reporting. Based on that evaluation, our management concluded that there was no such change during the fourth fiscal quarter.
None
47
Information required by Item 401 of Regulation S-K is incorporated herein by reference to the sections entitled “Executive Officers of the Registrant” at the end of Part I of this report; and to the sections of the Ross Stores, Inc. Proxy Statement for the Annual Meeting of Stockholders to be held on Wednesday,
May 21, 2014
(the “Proxy Statement”) entitled “Information Regarding Nominees and Incumbent Directors.” Information required by Item 405 of Regulation S-K is incorporated by reference to the Proxy Statement under the section titled “Section 16(a) Beneficial Ownership Reporting Compliance.” We have not made any material changes to the procedures by which our stockholders may recommend nominees to the Board of Directors. Information required by Item 407(d)(4) and (d)(5) of Regulation S-K is incorporated by reference to the Proxy Statement under the section entitled “Information Regarding Nominees and Incumbent Directors” under the caption “Audit Committee.”
Our Board of Directors has adopted a Code of Ethics for Senior Financial Officers that applies to the Company's Chief Executive Officer, Chief Merchandising Officer, Chief Development Officer, Chief Operating Officer, Executive Vice President, Finance and Legal, Chief Financial Officer, Group Vice President, Finance and Treasurer, Controller, Vice President, Accounting and Assistant Controller, Vice President Finance, Vice President Tax, Assistant Treasurer, Investor and Media Relations personnel, and other positions that may be designated by the Company. This Code of Ethics is posted on our corporate website (www.rossstores.com) under
Corporate Governance in the Investors Section. We intend to satisfy the disclosure requirements of Item 5.05 of Form 8-K regarding any future amendments to, or waivers from, our Code of Ethics for Senior Financial Officers by posting any changed version on the same corporate website.
The information required by Item 402 of Regulation S-K is incorporated herein by reference to the sections of the Proxy Statement entitled “Compensation of Directors” and “Executive Compensation” under the captions “Compensation Discussion and Analysis,” “Summary Compensation Table,” “All Other Compensation,” “Perquisites,” “Discussion of Summary Compensation,” “Grants of Plan-Based Awards During Fiscal Year,” “Outstanding Equity Awards at Fiscal Year-End,” “Option Exercises and Stock Vested,” “Non-Qualified Deferred Compensation,” and “Potential Payments Upon Termination or Change in Control.”
The information required by Items 407(e)(4) and (e)(5) of Regulation S-K are incorporated herein by reference to the sections of the Proxy Statement entitled “Compensation Committee Interlocks and Insider Participation” and “Compensation Committee Report.”
48
Equity compensation plan information
. The following table summarizes the equity compensation plans under which the Company’s common stock may be issued as of
February 1, 2014
:
|
Shares in (000s)
|
(a)
Number of securities
to be issued upon
exercise of
outstanding options and rights
|
|
(b)
Weighted average
exercise price per
share of outstanding options and rights
|
(c)
Number of securities
remaining available for
future issuance
(excluding securities reflected in column (a))
1
|
|
||||
|
Equity compensation plans
|
|
||||||||
|
approved by security holders
|
1,421
|
|
2
|
$14.04
|
7,844
|
|
3
|
||
|
Equity compensation plans not
|
|||||||||
|
approved by security holders
4
|
42
|
|
$14.81
|
—
|
|
||||
|
Total
|
1,463
|
|
$14.07
|
7,844
|
|
||||
1
After approval by stockholders of the 2008 Equity Incentive Plan in May 2008, any shares remaining available for grant in the share reserves of
the 2004 Equity Incentive Plan, 1992 Stock Option Plan, the 2000 Equity Plan, the 1991 Outside Directors Stock Option Plan, and the 1988 Restricted Stock Plan were automatically canceled.
2
Represents shares reserved for options granted under the prior 1992 Stock Option Plan, the prior 1991 Outside Directors Stock Option Plan, and the 2004 Equity Incentive Plan.
3
Includes
858,000
shares reserved for issuance under the Employee Stock Purchase Plan and
6,986,000
shares reserved for issuance under the 2008 Equity Incentive Plan.
4
Represents shares reserved for options granted under the prior 2000 Equity Incentive Plan, which was approved by the Company’s Board of Directors in March 2000.
The information required by Item 403 of Regulation S-K is incorporated herein by reference to the section of the Proxy Statement entitled "Stock Ownership of Certain Beneficial Owners and Management."
The information required by Items 404 and 407(a) of Regulation S-K are incorporated herein by reference to the section of the Proxy Statement entitled “Information Regarding Nominees and Incumbent Directors” including the captions “Audit Committee,” “Compensation Committee,” and “Nominating and Corporate Governance Committee,” and the section of the Proxy Statement entitled “Certain Transactions.”
Information concerning principal accountant fees and services will appear in the Proxy Statement in the Ross Stores, Inc. Board of Directors Audit Committee Report under the caption “Summary of Audit, Audit-Related, Tax and All Other Fees.” Such information is incorporated herein by reference.
49
(a) The following consolidated financial statements, schedules, and exhibits are filed as part of this report or are incorporated herein as indicated:
|
1.
|
List of Consolidated Financial Statements.
|
The following consolidated financial statements are included herein under Item 8:
Consolidated Statements of Earnings for the years ended
February 1, 2014
,
February 2, 2013
, and
January 28, 2012
.
Consolidated Statements of Comprehensive Income for the years ended
February 1, 2014
,
February 2, 2013
, and
January 28, 2012
.
Consolidated Balance Sheets at
February 1, 2014
and
February 2, 2013
.
Consolidated Statements of Stockholders' Equity for the years ended
February 1, 2014
,
February 2, 2013
, and
January 28, 2012
.
Consolidated Statements of Cash Flows for the years ended
February 1, 2014
,
February 2, 2013
, and
January 28, 2012
.
Notes to Consolidated Financial Statements.
Report of Independent Registered Public Accounting Firm.
2. List of Consolidated Financial Statement Schedules.
Schedules are omitted because they are not required, not applicable, or such information is included in the consolidated financial statements or notes thereto which are included in this Report.
3. List of Exhibits (in accordance with Item 601 of Regulation S-K).
Incorporated herein by reference to the list of Exhibits contained in the Exhibit Index within this Report.
50
SIGNATURES
Pursuant to the requirements of Section 13 or 15 (d) of the Securities Exchange Act of 1934, the Registrant has duly caused this Report to be signed on its behalf by the undersigned, thereunto duly authorized.
|
ROSS STORES, INC.
|
|||
|
(Registrant)
|
|||
|
|
By:
|
/s/Michael Balmuth
|
|
|
Date:
|
April 1, 2014
|
|
Michael Balmuth
|
|
Vice Chairman and
|
|||
|
Chief Executive Officer
|
|||
Pursuant to the requirements of the Securities Exchange Act of 1934, this report has been signed below by the following persons on behalf of the Registrant and in the capacities and on the dates indicated.
|
Signature
|
Title
|
Date
|
||
|
/s/Michael Balmuth
|
Vice Chairman and
|
|
April 1, 2014
|
|
|
Michael Balmuth
|
Chief Executive Officer, Director
|
|||
|
|
||||
|
/s/Michael J. Hartshorn
|
Senior Vice President, Chief Financial Officer, and
|
April 1, 2014
|
||
|
Michael J. Hartshorn
|
Principal Accounting Officer
|
|||
|
/s/Norman A. Ferber
|
Chairman of the Board, Director
|
April 1, 2014
|
||
|
Norman A. Ferber
|
||||
|
|
||||
|
/s/K. Gunnar Bjorklund
|
Director
|
April 1, 2014
|
||
|
K. Gunnar Bjorklund
|
||||
|
|
||||
|
/s/Michael J. Bush
|
Director
|
April 1, 2014
|
||
|
Michael J. Bush
|
||||
|
|
||||
|
/s/Sharon D. Garrett
|
Director
|
April 1, 2014
|
||
|
Sharon D. Garrett
|
||||
|
|
||||
|
/s/G. Orban
|
Director
|
April 1, 2014
|
||
|
George P. Orban
|
||||
|
|
||||
|
/s/Larry S. Peiros
|
Director
|
April 1, 2014
|
||
|
Lawrence S. Peiros
|
||||
|
|
||||
|
/s/G. L. Quesnel
|
Director
|
April 1, 2014
|
||
|
Gregory L. Quesnel
|
||||
51
INDEX TO EXHIBITS
|
Exhibit
|
|
|
Number
|
Exhibit
|
|
3.1
|
Amendment of Certificate of Incorporation dated May 21, 2004 and Amendment of Certificate of Incorporation dated June 5, 2002 and Corrected First Restated Certificate of Incorporation, incorporated by reference to Exhibit 3.1 to the Form 10-Q filed by Ross Stores, Inc. for its quarter ended July 31, 2004.
|
|
|
|
|
3.2
|
Amendment of Certificate of Incorporation dated July 18, 2011, incorporated by reference to Exhibit 3.3 to the Form 10-Q filed by Ross Stores, Inc. for its quarter ended July 30, 2011.
|
|
|
|
|
3.3
|
Amended and Restated Bylaws of Ross Stores, Inc. as amended, January 23, 2013, incorporated by reference to Exhibit 3.3 to the Form 10-K filed by Ross Stores, Inc. for its fiscal year ended February 2, 2013.
|
|
4.1
|
Note Purchase Agreement dated October 17, 2006, incorporated by reference to Exhibit 10.2 to the Form 10-Q filed by Ross Stores, Inc. for its quarter ended October 28, 2006.
|
|
|
|
|
10.1
|
Revolving Credit Agreement dated March 3, 2011, incorporated by reference to Exhibit 10.1 to the Form 10-Q filed by Ross Stores, Inc. for its quarter ended April 30, 2011.
|
|
10.2
|
Amendment No. 1 to Revolving Credit Agreement dated June 27, 2012, incorporated by reference to Exhibit 10.1 to the Form 10-Q filed by Ross Stores, Inc. for its quarter ended July 28, 2012.
|
|
|
|
|
MANAGEMENT CONTRACTS AND COMPENSATORY PLANS (EXHIBITS 10.3 - 10.44)
|
|
|
|
|
|
10.3
|
Third Amended and Restated Ross Stores, Inc. 1992 Stock Option Plan, incorporated by reference to Exhibit 10.5 to the Form 10-K filed by Ross Stores, Inc. for its fiscal year ended January 29, 2000.
|
|
|
|
|
10.4
|
Amendment to Third Amended and Restated Ross Stores, Inc. 1992 Stock Option Plan, incorporated by reference to Exhibit 10.4 to the Form 10-Q filed by Ross Stores, Inc. for its quarter ended August 4, 2001.
|
|
|
|
|
10.5
|
Ross Stores, Inc. 2000 Equity Incentive Plan, incorporated by reference to Exhibit 10.7 to the Form 10-K filed by Ross Stores, Inc. for its fiscal year ended January 29, 2000.
|
|
|
|
|
10.6
|
Amended and Restated Ross Stores, Inc. Employee Stock Purchase Plan dated November 20, 2007, incorporated by reference to Exhibit 10.6 to the Form 10-K filed by Ross Stores, Inc. for its fiscal year ended February 2, 2008.
|
|
10.7
|
Amended and Restated Ross Stores, Inc. 1991 Outside Directors Stock Option Plan, as amended through January 30, 2003, incorporated by reference to Exhibit 10.9 to the Form 10-K filed by Ross Stores, Inc. for its fiscal year ended February 1, 2003.
|
|
10.8
|
Ross Stores Executive Medical Plan, incorporated by reference to Exhibit 10.9 to the Form 10-K filed by Ross Stores, Inc. for its fiscal year ended January 30, 1999.
|
|
10.9
|
Ross Stores Executive Dental Plan, incorporated by reference to Exhibit 10.10 to the Form 10-K filed by Ross Stores, Inc. for its fiscal year ended January 30, 1999.
|
52
|
10.10
|
Third Amended and Restated Ross Stores, Inc. Non-Qualified Deferred Compensation Plan effective December 31, 2008, incorporated by reference to Exhibit 10.7 to the Form 10-Q filed by Ross Stores, Inc. for its quarter ended April 30, 2011.
|
|
|
|
|
10.11
|
Ross Stores, Inc. Second Amended and Restated Incentive Compensation Plan, incorporated by reference to the appendix to the Definitive Proxy Statement on Schedule 14A filed by Ross Stores, Inc. on April 12, 2006.
|
|
|
|
|
10.12
|
Ross Stores, Inc. 2004 Equity Incentive Plan, incorporated by reference to Exhibit 99 to the Definitive Proxy Statement on Schedule 14A filed by Ross Stores, Inc. on April 15, 2004.
|
|
|
|
|
10.13
|
First Amendment to the Ross Stores, Inc. 2004 Equity Incentive Plan, effective May 17, 2005, incorporated by reference to Exhibit 10.2 to the Form 10-Q filed by Ross Stores, Inc. for its quarter ended July 30, 2005.
|
|
|
|
|
10.14
|
Second Amendment to the Ross Stores, Inc. 2004 Equity Incentive Plan effective March 22, 2007, incorporated by reference to Exhibit 10.7 to the Form 10-Q filed by Ross Stores, Inc. for its quarter ended May 5, 2007.
|
|
|
|
|
10.15
|
Form of Stock Option Agreement for Non-Employee Directors for options granted pursuant to Ross Stores, Inc. 2004 Equity Incentive Plan, incorporated by reference to Exhibit 10.3 to the Form 10-Q filed by Ross Stores, Inc. for its quarter ended July 30, 2005.
|
|
|
|
|
10.16
|
Ross Stores, Inc. 2008 Equity Incentive Plan, as amended through March 18, 2009, incorporated by reference to Exhibit 10.1 to the Form 10-Q filed by Ross Stores, Inc. for its quarter ended May 2, 2009.
|
|
|
|
|
10.17
|
Form of Nonemployee Director Equity Notice of Grant of Restricted Stock and Restricted Stock Agreement under the Ross Stores, Inc. 2008 Equity Incentive Plan, incorporated by reference to Exhibit 99.2 to the Form 8-K filed by Ross Stores, Inc. on May 23, 2008.
|
|
10.18
|
Form of Nonemployee Director Equity Notice of Grant of Restricted Stock Units and Restricted Stock Units Agreement under the Ross Stores, Inc. 2008 Equity Incentive Plan, incorporated by reference to Exhibit 99.3 to the Form 8-K filed by Ross Stores, Inc. on May 23, 2008.
|
|
10.19
|
Form of Notice of Grant of Restricted Stock and Restricted Stock Agreement under the Ross Stores, Inc. 2008 Equity Incentive Plan, incorporated by reference to Exhibit 99.4 to the Form 8-K filed by Ross Stores, Inc. on May 23, 2008.
|
|
|
|
|
10.20
|
Form of Notice of Grant of Restricted Stock Units and Restricted Stock Units Agreement under the Ross Stores, Inc. 2008 Equity Incentive Plan, incorporated by reference to Exhibit 99.5 to the Form 8-K filed by Ross Stores, Inc. on May 23, 2008.
|
|
|
|
|
10.21
|
Form of Notice of Grant of Stock Option and Stock Option Agreement under the Ross Stores, Inc. 2008 Equity Incentive Plan, incorporated by reference to Exhibit 99.7 to the Form 8-K filed by Ross Stores, Inc. on May 23, 2008.
|
|
|
|
|
10.22
|
Ross Stores, Inc. Restricted Stock Agreement, incorporated by reference to Exhibit 10.2 to the Form 10-Q filed by Ross Stores, Inc. for its quarter ended May 2, 2009.
|
|
10.23
|
Ross Stores, Inc. Restricted Stock Agreement for Nonemployee Director, incorporated by reference to Exhibit 10.3 to the Form 10-Q filed by Ross Stores, Inc. for its quarter ended May 2, 2009.
|
53
|
10.24
|
Form of Notice of Grant of Performance Shares and Performance Share Agreement under the Ross Stores, Inc. 2008 Equity Incentive Plan, incorporated by reference to Exhibit 10.2 to the Form 10-Q filed by Ross Stores, Inc. for its quarter ended July 30, 2011.
|
|
10.25
|
Form of Indemnity Agreement between Ross Stores, Inc. for Directors and Executive Officers, incorporated by reference to Exhibit 10.26 to the Form 10-K filed by Ross Stores, Inc. for its fiscal year ended February 2, 2013.
|
|
10.26
|
Forms of Executive Employment Agreement between Ross Stores, Inc. and Executives, incorporated by reference to Exhibit 10.2 to the Form 10-Q filed by Ross Stores, Inc. for its quarter ended April 30, 2011.
|
|
10.27
|
Forms of Executive Employment Agreement between Ross Stores, Inc. and Executives, incorporated by reference to Exhibit 10.1 to the Form 10-Q filed by Ross Stores, Inc. for its quarter ended May 4, 2013.
|
|
10.28
|
Amended and Restated Independent Contractor Consultancy Agreement effective January 6, 2010 between Norman A. Ferber and Ross Stores, Inc., incorporated by reference to Exhibit 10.47 to the Form 10-K filed by Ross Stores, Inc. for its fiscal year ended January 30, 2010.
|
|
10.29
|
Amended Independent Contractor Consultancy Agreement effective January 30, 2012 between Norman A. Ferber and Ross Stores, Inc., incorporated by reference to Exhibit 10.52 to the Form 10-K filed by Ross Stores, Inc. for its fiscal year ended January 28, 2012.
|
|
10.30
|
Amended and Restated Retirement Benefit Package Agreement effective January 6, 2010 between Norman A. Ferber and Ross Stores, Inc., incorporated by reference to Exhibit 10.48 to the Form 10-Q filed by Ross Stores, Inc. for its quarter ended May 1, 2010.
|
|
10.31
|
Amended Retirement Benefits Package Agreement effective January 30, 2012 between Norman A. Ferber and Ross Stores, Inc., incorporated by reference to Exhibit 10.53 to the Form 10-K filed by Ross Stores, Inc. for its fiscal year ended January 28, 2012.
|
|
10.32
|
Employment Agreement effective May 31, 2001 between Michael Balmuth and Ross Stores, Inc., incorporated by reference to Exhibit 10.3 to the Form 10-Q filed by Ross Stores, Inc. for its quarter ended August 4, 2001.
|
|
10.33
|
First Amendment to the Employment Agreement effective January 30, 2003 between Michael Balmuth and Ross Stores, Inc., incorporated by reference to Exhibit 10.1 to the Form 10-Q filed by Ross Stores, Inc. for its quarter ended May 3, 2003.
|
|
10.34
|
Second Amendment to the Employment Agreement effective May 18, 2005 between Michael Balmuth and Ross Stores, Inc., incorporated by reference to Exhibit 10.1 to the Form 10-Q filed by Ross Stores, Inc. for its quarter ended July 30, 2005.
|
|
|
|
|
10.35
|
Restated Third Amendment to the Employment Agreement effective April 6, 2007 between Michael Balmuth and Ross Stores, Inc. incorporated by reference to Exhibit 10.42 to the Form 10-K filed by Ross Stores, Inc. for its year ended January 31, 2009.
|
|
|
|
|
10.36
|
Fourth Amendment to the Employment Agreement effective June 9, 2009 between Michael Balmuth and Ross Stores, Inc., incorporated by reference to Exhibit 10.10 to the Form 10-Q filed by Ross Stores, Inc. for its quarter ended August 1, 2009, and to Exhibit A-1 included in Exhibit 10.36 to the Form 10-Q filed by Ross Stores, Inc. for its quarter ended May 1, 2010.
|
|
|
|
54
|
10.37
|
Fifth Amendment to the Employment Agreement effective April 23, 2010 between Michael Balmuth and Ross Stores, Inc., incorporated by reference to Exhibit 10.2 to the Form 10-Q filed by Ross Stores, Inc. for its quarter ended May 1, 2010.
|
|
|
|
|
10.38
|
Sixth Amendment to the Employment Agreement effective June 1, 2011 between Michael Balmuth and Ross Stores, Inc., incorporated by reference to Exhibit 10.1 to the Form 10-Q filed by Ross Stores, Inc. for its quarter ended July 30, 2011.
|
|
|
|
|
10.39
|
Employment Agreement effective June 1, 2012 between Michael Balmuth and Ross Stores, Inc., incorporated by reference to Exhibit 10.1 to the Form 10-Q filed by Ross Stores, Inc. for its quarter ended October 27, 2012.
|
|
10.40
|
Notice of Grant of Restricted Stock Units and Restricted Stock Units Agreement pursuant to the Ross Stores, Inc. 2008 Equity Incentive Plan to Michael Balmuth on August 15, 2012, incorporated by reference to Exhibit 10.2 to the Form 10-Q filed by Ross Stores, Inc. for its quarter ended October 27, 2012.
|
|
10.41
|
Executive Employment Agreement effective March 16, 2013 between Barbara Rentler and Ross Stores, Inc., incorporated by reference to Exhibit 10.4 to the Form 10-Q filed by Ross Stores, Inc. for its quarter ended May 4, 2013.
|
|
10.42
|
Executive Employment Agreement effective March 16, 2013 between Michael O’Sullivan and Ross Stores, Inc., incorporated by reference to Exhibit 10.3 to the Form 10-Q filed by Ross Stores, Inc. for its quarter ended May 4, 2013.
|
|
10.43
|
Executive Employment Agreement effective March 16, 2013 between James Fassio and Ross Stores, Inc., incorporated by reference to Exhibit 10.2 to the Form 10-Q filed by Ross Stores, Inc. for its quarter ended May 4, 2013.
|
|
10.44
|
Executive Employment Agreement effective February 6, 2012 between John G. Call and Ross Stores, Inc., incorporated by reference to Exhibit 10.1 to the Form 10-Q filed by Ross Stores, Inc. for its quarter ended April 28, 2012.
|
|
21
|
Subsidiaries.
|
|
|
|
|
23
|
Consent of Independent Registered Public Accounting Firm.
|
|
|
|
|
31.1
|
Certification of Chief Executive Officer Pursuant to Sarbanes-Oxley Act Section 302(a).
|
|
|
|
|
31.2
|
Certification of Chief Financial Officer Pursuant to Sarbanes-Oxley Act Section 302(a).
|
|
|
|
|
32.1
|
Certification of Chief Executive Officer Pursuant to 18 U.S.C. Section 1350.
|
|
|
|
|
32.2
|
Certification of Chief Financial Officer Pursuant to 18 U.S.C. Section 1350.
|
|
|
|
|
101.INS
|
XBRL Instance Document
|
|
|
|
|
101.SCH
|
XBRL Taxonomy Extension Schema
|
|
|
|
|
101.CAL
|
XBRL Taxonomy Extension Calculation Linkbase
|
|
|
|
55
|
|
|
|
101.DEF
|
XBRL Taxonomy Extension Definition Linkbase
|
|
|
|
|
101.LAB
|
XBRL Taxonomy Extension Label Linkbase
|
|
|
|
|
101.PRE
|
XBRL Taxonomy Extension Presentation Linkbase
|
56
TABLE OF CONTENTS
Part IItem 1. BusinessItem 1A. Risk FactorsItem 1B. Unresolved Staff CommentsItem 2. PropertiesItem 3. Legal ProceedingsItem 4. Mine Safety DisclosuresPart IIItem 5. Market For Registrant S Common Equity, Related Stockholder Matters and Issuer Purchases Of Equity SecuritiesItem 6. Selected Financial DataItem 7. Management's Discussion and Analysis Of Financial Condition and Results Of OperationsItem 7A. Quantitative and Qualitative Disclosures About Market RiskItem 8. Financial Statements and Supplementary DataItem 9. Changes in and Disagreements with Accountants on Accounting and Financial DisclosureItem 9A. Controls and ProceduresItem 9B. Other InformationPart IIIItem 10. Directors, Executive Officers and Corporate GovernanceItem 11. Executive CompensationItem 12. Security Ownership Of Certain Beneficial Owners and Management and Related Stockholder MattersItem 13. Certain Relationships and Related Transactions, and Director IndependenceItem 14. Principal Accountant Fees and ServicesPart IVItem 15. Exhibits, Financial Statement Schedules