REGO PAYMENT ARCHITECTURES, INC.
10-Ks and 10-Qs
|
|
|
|
|
UNITED STATES
SECURITIES AND EXCHANGE COMMISSION
WASHINGTON, DC 20549
FORM 10-K
(Mark One)
|
þ
|
ANNUAL REPORT PURSUANT TO SECTION 13 OR 15(d) OF THE SECURITIES EXCHANGE ACT OF 1934
|
For the fiscal year ended December 31, 2014
OR
|
o
|
TRANSITION REPORT PURSUANT TO SECTION 13 OR 15(d) OF THE SECURITIES EXCHANGE ACT OF 1934
|
For the transition period from
_________
to
_________
Commission File Number 0-53944
|
VIRTUAL PIGGY, INC.
|
(Exact Name of Registrant as Specified in Its Charter)
|
Delaware
|
35-2327649
|
|
|
(State or Other Jurisdiction of
Incorporation or Organization)
|
(IRS Employer
Identification No.)
|
|
1221 Hermosa Avenue, Suite 210
Hermosa Beach, CA 90254
|
||
|
(Address of Principal Executive Offices)
(Zip Code)
|
Registrant’s telephone number, including area code:
(310) 853-1950
Securities registered pursuant to Section 12(b) of the Act:
None
Securities registered pursuant to Section 12(g) of the Act:
Common Stock, $0.0001 par value
Indicate by check mark if the registrant is a well-known seasoned issuer, as defined in Rule 405 of the Securities Act. Yes
o
or No
þ
Indicate by check mark if the registrant is not required to file reports pursuant to Section 13 or Section 15(d) of the Act. Yes
o
or No
þ
Indicate by check mark whether the registrant (1) has filed all reports required to be filed by Section 13 or 15(d) of the Securities Exchange Act of 1934 during the preceding 12 months (or for such shorter period that the registrant was required to file such reports), and (2) has been subject to such filing requirements for the past 90 days. Yes
þ
or No
o
Indicate by check mark whether the registrant has submitted electronically and posted on its corporate Web site, if any, every Interactive Data File required to be submitted and posted pursuant to Rule 405 of Regulation S-T (§232.405 of this chapter) during the preceding 12 months (or for such shorter period that the registrant was required to submit and post such files). Yes
þ
or No
o
Indicate by check mark if disclosure of delinquent filers pursuant to Item 405 of Regulation S-K (§229.405) is not contained herein, and will not be contained, to the best of registrant’s knowledge, in definitive proxy or information statements incorporated by reference in Part III of this Form 10-K or any amendment to this Form 10-K.
o
Indicate by check mark whether the registrant is a large accelerated filer, an accelerated filer, a non-accelerated filer, or a smaller reporting company. See the definitions of “large accelerated filer,” “accelerated filer” and “smaller reporting company” in Rule 12b-2 of the Exchange Act. (Check one):
|
Large accelerated filer
o
|
Accelerated filer
þ
|
Non-accelerated filer
o
(Do not check if a smaller reporting company)
|
Smaller reporting company
o
|
Indicate by check mark whether the registrant is a shell company (as defined in Rule 12b-2 of the Exchange Act). Yes
o
No
þ
The aggregate market value of the common stock held by non-affiliates of the registrant was $70,143,339 as of June 30, 2014 based on the price in which the common stock of the registrant was last sold as reported by the OTC Bulletin Board. Shares of common stock held by each current executive officer and director and by each person who is known by the registrant to own 5% or more of the outstanding common stock have been excluded from this computation in that such persons may be deemed to be affiliates of the registrant. This determination of affiliate status is not a conclusive determination for other purposes.
We had 119,117,626 shares of common stock outstanding as of the close of business on March 1, 2015.
DOCUMENTS INCORPORATED BY REFERENCE
Portions of the Proxy Statement for the 2015 Annual Meeting of Stockholders are incorporated by reference into Part III of this report. Except as expressly incorporated by reference, the Registrant's Proxy Statement shall not be deemed to be part of this Form 10-K.
VIRTUAL PIGGY, INC.
Year Ended December 31, 2014
|
Page
|
||
|
PART I
|
||
|
1
|
||
|
8
|
||
|
17
|
||
|
17
|
||
|
17
|
||
|
17
|
||
|
PART II
|
||
|
18
|
||
|
20
|
||
|
20
|
||
|
26
|
||
|
26
|
||
|
26
|
||
|
26
|
||
|
27
|
||
|
PART III
|
||
|
28
|
||
|
28
|
||
|
28
|
||
|
28
|
||
|
28
|
||
|
PART IV
|
||
|
29
|
SPECIAL NOTE REGARDING FORWARD-LOOKING STATEMENTS
This report contains “forward-looking statements” within the meaning of Section 27A of the Securities Act of 1933, as amended (the “Securities Act”), and Section 21E of the Securities Exchange Act of 1934, as amended (the “Exchange Act”). All statements other than statements of historical fact included or incorporated by reference in this annual report on Form 10-K, including without limitation, statements regarding our future financial position, business strategy, budgets, projected revenues, projected costs and plans and objectives of management for future operations, are forward-looking statements. Forward-looking statements generally can be identified by the use of forward-looking terminology such as “may,” “will,” “expects,” “intends,” “plans,” “projects,” “estimates,” “anticipates,” or “believes” or the negative thereof or any variation thereon or similar terminology or expressions. We have based these forward-looking statements on our current expectations and projections about future events. These forward-looking statements are not guarantees and are subject to known and unknown risks, uncertainties and assumptions about us that may cause our actual results, levels of activity, performance or achievements to be materially different from any future results, levels of activity, performance or achievements expressed or implied by such forward-looking statements. Important factors that could cause actual results to differ materially from our expectations include, but are not limited to: our ability to raise additional capital, our limited operating history, our limited revenues generated to date, our ability to attract and retain qualified personnel, our dependence on third party developers who we cannot control, our ability to develop and introduce a new service to the market in a timely manner, market acceptance of our services, our limited experience in a relatively new industry, the ability to successfully develop licensing programs and generate business, rapid technological change in relevant markets, unexpected network interruptions or security breaches, changes in demand for current and future intellectual property rights, legislative, regulatory and competitive developments, intense competition with larger companies, general economic conditions, and other factors set forth under “Item 1A. — Risk Factors” below and “Item 7 — Management’s Discussion and Analysis of Financial Condition and Results of Operations” below. Except as required by law, we assume no duty to update or revise our forward-looking statements.
General Development
Virtual Piggy, Inc. (the “Company,” “we”, or “us”) was incorporated in Delaware on February 11, 2008 under the name Chimera International Group, Inc. On April 4, 2008, we amended our certificate of incorporation and changed our name to Moggle, Inc. On August 22, 2011, we filed a Certificate of Ownership with the Secretary of State of Delaware, pursuant to which the Company’s newly-formed wholly-owned subsidiary, Virtual Piggy Incorporated was merged into and with the Company (the “Merger”). In connection with the Merger and in accordance with Section 253 of the Delaware General Corporation Law, the name of the Company was changed from “Moggle, Inc.” to “Virtual Piggy, Inc.” Our principal offices are located at 1221 Hermosa Avenue, Suite 210, Hermosa Beach, California 90254 and our telephone number is (310) 853-1950.
As of the date of this report, we have not generated significant revenues. Our initial business plan was to develop an online game platform to allow game companies to create, monetize and distribute massive multiplayer online games (MMOG). The Virtual Piggy technology was the monetization component of this overall platform (our “Platform”). During 2010, we analyzed the market potential for an expanded Virtual Piggy solution and decided to concentrate our efforts on the delivery of a full-featured Virtual Piggy solution that was not restricted to online gaming. The expanded Virtual Piggy solution is designed to provide a complete online solution for families and parents to teach their children about financial management and spending on gaming, retail, music and entertainment. In late 2013, we rebranded our Virtual Piggy product under the name “Oink®”.
Overview
We are a technology company that delivers an online ecommerce solution for the family. Our system allows parents and their children to manage, allocate funds and track their expenditures, savings and charitable giving online. Our system is designed to allow a minor to transact online without a credit card by gaining the parents’ permission ahead of time and allowing the parent to set up the rules of use.
Oink is a digital wallet technology designed for Generation Z. Generation Z represents 25% of the US population and is generally referred to as people born between 1995-2012 and coming of age between 2013-2020. Generation Z is uniquely characterized by growing up in a highly sophisticated media and computer environment with greater internet savvy than any previous generation. They use the mobile internet more than any other generation on a daily basis. Members of Generation Z have an average of $17/week in allowance money and they control approximately $44 billion in annual spending power in the US. Oink provides a secure system to allow Generation Z and young millennials manage their finances and transact online and offline in a secure and legally compliant manner.
The Oink wallet can be loaded by parents and supports a recurring allowance. Prior to December 2014, Oink was available for use at online retailers only. In December 2014, in partnership with Discover, Oink launched a stored value wallet solution backed by a Discover reloadable prepaid card. The card can be funded by the parent and provides the ability for the account holder to make purchases both online and at the approximately 7 million locations in the US where Discover is accepted.
Our Oink product is a solution for the family that engages the parent first, and in turn offers a solution for a teen or tween to transact online and in-store, while doing it in a manner consistent with the Children’s Online Privacy Protection Act (“COPPA”) and other similar international children’s privacy laws. It therefore enables businesses to interact and transact with these teens and tweens. Oink was launched in the US in 2012 and was launched in the European markets in 2013.
The introduction of the reloadable prepaid Oink card, backed by Discover, has opened up the number of retailers where Oink can be used to over seven million in the US. Currently the Oink prepaid card is available in the US only, however Oink is investigating other territories for 2015 activation.
Industry Background
There are over 800 million teens in the world and over 20 million in the US alone, most without credit cards. This is Generation Z, those born after the millennials (from 1995 to present) most of whom are currently under the age of 18. Marketers have been focused on the millennials for more than a decade. Generation Z is a generation that influences all family purchases and has disposable income. On average Gen Z receive $17/week in allowance which gives them $44 billion spending power in the US per year.
Because there is no direct financial solution for this group, they still use either cash or their parent’s funding source (credit card) and hence there is still a lack of quantification of the
dollar
size of the kids “spending” market, which is separate from the dollars spent
on
kids. Marketers and regulators have taken note of the change and made a shift to a more “digital” approach to their overall strategy. Additionally, kids’ access to increasingly available technology has fueled concerns about security, safety and compliance with government regulations. As children march toward adulthood, parents are providing the means for children to have products (money), and technology is providing them the increasingly easy opportunity to do so.
With this as a backdrop, Virtual Piggy has identified an emerging need to provide a financial platform that provides this generation with an alternative solution to traditional banking and solves current limitations on their ability to safely transact online.
Looking at the Youth Market
We view the potential of the Youth Market as three markets.
A current market — Kids have their own money and have “access” to their parents’ money (pester power) for buying things to meet their needs/wants.
A market of influencers — Parents want to give their children every opportunity possible to be happy and successful and therefore allow children to weigh in on family decisions about purchases.
A future market — Children can be influenced by brands from a very early age. The early and consistent exposure to brands is carried forward into adulthood and creates loyal adult consumers.
Current Market
– Reports on how much money is spent directly by kids, with ranges from about $25 to $50 billion annually in the USA, vary between different ages. What is changing is the easy opportunity to spend as well as save some of that allowance. Many organizations have recognized the opportunity to help families manage the balance between kid’s spending and saving.
A Market of Influencers
— The Journal of Behavioral Studies in Business suggests that “tweens” influence over $600 billion of family spending. A Harris Poll Youth Study report indicates that kids have over $200 billion in spending power. Harris Interactive polled 5,077 people between the age of 8 and 24 through an online survey. The survey was held in August of 2011. These results show that kids have more of their own money than ever before. They have a greater influence on their parents’ purchases as well. Among teens, 69% have mobile phones and 34% claim to have chosen their phone or influenced their parents to purchase the one they wanted. This shows that children and young adults are having more input on the family’s purchases.
A Future Market —
Manufacturers and retailers — regardless of whether their products are targeted toward kids or not — view young consumers as a segment to be cultivated. A positive experience in a brick and mortar store or a website that is easy to navigate and attractive will have a lasting impression on a child. As such, advertisers are closely monitored and regulated as far as how and what they target toward kids. Regardless, there is data showing that children as young as 18 months have the ability to recognize brands.
Some Demographics
The roughly 40 million teens and tweens in the US certainly cannot be conveniently grouped together into a single segment. As a first pass, we look at them by age and interests.
Age
“Tweens” and Teens are viewed broadly to be the 9 to 17-year-olds and are the sweet spot for protection by COPPA Laws and Oink benefits by attempting to target the parents of that target group. This group fuels the appetite for a wide variety of online activities — from general retail, social networks, toys, sports, food ordering, and online games. It is difficult to get an estimate for this particular segment within the larger youth market, but we view the opportunity to get in touch with parents of these teens and tweens to be significant given the advantages of the Oink product, the desire of the parents and the attractiveness to this age group for “independence” from their parents.
Oink and Its Relationship to the Children’s Online Privacy Protection Act (“COPPA”)
Though Oink does not target or collect the personal information of the under 13 age group, and rather targets parents and families as a whole, Oink must still be compliant with COPPA. Oink meets the requirements imposed by COPPA, including the recent amendments.
Other Consumer Privacy Protection Legislation
In late 2010, the FTC and the Department of Commerce (“DOC”) each issued a staff report proposing new frameworks for consumer privacy protection; the FTC report called for federal “Do Not Track” legislation. The FTC has also increased its enforcement actions against companies that fail to live up to their privacy or data security commitments to consumers. A number of privacy and data security bills have been introduced in Congress that address the collection, maintenance and use of personal information, web browsing and geolocation data, and establish data security and breach notification requirements. Some state legislatures have adopted legislation that regulates how businesses operate on the Internet, including measures relating to privacy, data security and data breaches. Several Congressional hearings have examined privacy implications for online, offline and mobile data. The DOC recently issued a “green paper” on cybersecurity, and the White House has proposed cybersecurity legislation.
A number of foreign governments also have either adopted or are considering data privacy and security regulations. For example, the EU is currently reviewing its data privacy directive, which became effective in 1998 and sets baseline standards for the collection, use, disclosure, storage, security and transfer of personal data (collectively referred to as “data processing”). Among the proposed revisions are new rules that strengthen requirements to obtain explicit consent for data processing; special rules requiring parental consent for collecting children’s personal data; data breach obligations for all industry sectors and enhanced remedies for violations of privacy. Different policy options, including new regulations, are being considered at both the EU and member state levels.
The Opportunity
In most western countries, Under 18s do not have access to credit cards or PayPal accounts. They are very reliant on cash, and yet they have disposable income. In 2013, a Piper Jaffray market research report on teens showed that the 35.6 million U.S. teens represent over $200 billion of annual spending power. A 2014 survey by Honey and Sparks showed that Generation Z receives over $44 billion per year in allowance money alone. These teens spend their time online on mobile devices, sharing interests with friends, and have their own unique spending and saving habits. 74% of teens are mobile internet users, compared to 55% of adults, and almost 80% of teens are browsing for goods online. The global market serving this demographic segment presents a significant business opportunity for online retailers. Many on-line purchases made by this group were incurred without adult supervision. In fact, unauthorized transactions by children contribute to “friendly fraud” which accounts for more than one third of the total fraud for online accepting merchants and is a growing risk for online retailers. Merchants need a mechanism that will allow parents to oversee and approve of their children’s online purchases.
In addition to “friendly fraud”, new media companies, social networks, online gaming providers, and online retailers that wish to reach out to the credit card-less generation are faced with the challenge of interacting with this audience while complying with COPPA and other international children’s privacy laws. There have been many instances of this age group not being protected enough by the new media companies and being placed in extreme danger by introduction to online predators. There have been and will continue to be many lawsuits and government regulatory enforcement actions against these new media companies with respect to their handling and use of children’s personal information. More importantly, until measures are taken to provide a secure online environment for this age group, children will be placed in danger online.
Our Solution
Our platform has been designed and will be directed to:
|
|
·
|
providing an environment where parents can safely deliver a digitized allowance to their children and put in place the necessary controls. For the teen or tween, this for the first time, gives them the ability to make informed purchasing decisions themselves;
|
|
|
·
|
solving the “friendly fraud” problem for website operators, providers, and online retailers; and
|
|
|
·
|
permitting website operators and online retailers to transact online business with parents in compliance with COPPA and other state and federal laws, including but not limited to Section 5 of the FTC Act (Unfair or Deceptive Acts or Practices).
|
Our platform enables parents/guardians to set up an account for their children in order for them to have the ability to pay merchants quickly and easily without providing their name, address or any other personal information. To make purchases using Oink, children need to disclose only a user name and password.
Our initial product offerings consist of the Oink product, and the Parent Match technology and have since expanded to include the Oink Reloadable Prepaid Card. Oink was developed in response to the growing need for parents/guardians to allow their children to transact online in a controlled manner in light of an increasing number of online services and products targeted towards children. Oink provides an online payment profile that allows parents to set up, monitor and control their children’s online spending. Parents can establish how much a child can spend in a single transaction, or over time, and also control the merchants with which the child can transact business. Parents also have the ability to set up approval rules and notification methods. The Oink product tracks all spending and parents can receive alerts and reports on spending patterns. Additionally, parents now have the ability to order an Oink Reloadable Prepaid Card in order for their children to transact online or in-store within parameters set by the parent/guardian.
Oink has been integrated into all the major US payment processing gateways, including Chase Paymentech™, CyberSource, Authorize.Net and PayPal, and can process transactions from all major credit and debit card systems, including MasterCard, Visa, and American Express. Recently, we became integrated and certified by WorldPay, which covers a large part of the European marketplace. Oink is hosted on Layered Tech, Inc.’s PCI compliant platform, which provides security, robustness and reliability.
Oink has received and remains ESRB privacy certified, and has achieved and maintains PCI DSS level 1 certification in 2011. The PCI Security Standards Council offers comprehensive standards to enhance payment card data security. Virtual Piggy, Inc. was audited and recertified to be in compliance with PCI DSS in December 2012, 2013, and 2014.
The Oink product became operational during 2011 and 2012. The Parent Match technology became operational in 2013 as part of extensions to the child profile components of Oink. Oink launched the prepaid card in 2014.
Our Intellectual Property
Intellectual property is important to our business. The Company has three issued patents with the United States Patent and Trademark Office (“USPTO”), entitled “Systems and Method for Verifying the Age of an Internet User,” “System and Method for Virtual Piggy Bank Wish-List,” and “System and Method for Virtual Piggy Bank." The Company has filed for one provisional U.S. patent application, as well as twelve non-provisional U.S. patent applications, four of which are pending, three of which have been allowed, and five of which have been abandoned. Additionally, the Company has been granted two patents in Germany, entitled “Virtual Piggy Bank” and “Parent Match.” The Company also has patents pending in Australia, Brazil, Canada (“Parent Match” has been allowed), Europe, and the Republic of Korea under the Patent Cooperation Treaty (“PCT”). Costs associated with the registration and legal defense of the patents have been capitalized and are amortized on a straight-line basis over the estimated lives of the patents.
The following are the names and brief descriptions of our applications:
Virtual Piggy Bank
.
A method of providing control preferences for a prospective Internet user, the method comprising the steps of establishing a first account, the settings of the first account being stored in a database; establishing a second account, the settings of the second account being stored in the database; linking the first and second accounts such that control settings of the second account are determined through the first account; and making a purchase from the second account consistent with the control settings of the second account.
Parent Match
.
A method of providing control preferences set by a person for a second person who is a prospective Internet user, the method comprising the steps of establishing a first account, the settings of the first account being stored in a database; establishing a second account, the settings of the second account being stored in the database; linking the first and second accounts such that control settings of the second account are determined through the first account; and viewing Internet content from the second account consistent with the control settings of the second account.
Verifying the Age of an Internet User
.
A system and method of verifying the age of a prospective internet user, the method comprising creating an age check account with a service requester; activating the age check system through the account; inputting into the age check system a user’s information; checking user’s information by age check system; and notifying service requester of checked user’s information by the age check system.
Virtual Piggy Bank Having Dashboard and Debit Card
. A computer-implemented method of establishing an online account for a prospective user, the method comprising the steps of establishing a first account through direct deposit, the settings of the first account being stored in a database; establishing a second account, the settings of the second account being stored in the database, wherein the second account includes a debit card associated with the direct deposit account; linking the first and second accounts such that control settings of the second account are determined through the first account; and making a purchase from the second account using the debit card consistent with the control settings of the second account.
System and Method for Virtual Piggybank Wishlist
. A non-transitory computer-readable storage medium, storing one or more programs configured for execution, the one or more programs for monitoring, transmitting, and recording usage of a computer or mobile device connected to a network, the one or more programs including instructions for establishing a first account, the settings of the first account being stored in a database; establishing a second account, the settings of the second account being stored in the database, wherein the second account includes a wish-list; linking the first and second accounts such that control settings of the second account are determined through the first account; and making a purchase from the wish-list of the second account consistent with the control settings of the second account.
System and Method for Donating to Charitable Organizations
. A computer-implemented method of establishing an online account for a prospective user, the method comprising the steps of establishing a first account through direct deposit, the settings of the first account being stored in a database; establishing a second account, the settings of the second account being stored in the database, wherein the second account includes a debit card associated with the direct deposit account; linking the first and second accounts such that control settings of the second account are determined through the first account; and making a donation from the second account using the debit card consistent with the control settings of the second account.
Until such time as the remaining pending patents are awarded, if ever, we intend to rely on trade secret protection and/or confidentiality agreements with our employees, customers, business partners and others to protect our intellectual property rights.
Furthermore, we have filed trademark applications pertaining to our service with the USPTO, the European Community, and Canada. The USPTO has already granted us service mark registrations for Oink, Oink (stylized), PiggyPick, Virtual Piggy, Virtual Piggy and design (horizontal), the PIG design, Parent Match, Quickconnect, Virtual Piggy Youth Empowered Parent Approved and Design, Youth Empowered. Parent Approved, and Oink.com. The European Community has already granted us registration for Virtual Piggy, Virtual Piggy and Design, Virtual Piggy Youth Empowered Parent Approved and Design, PiggyPick, Wishlist Wednesday, the PIG design, and the PIG design (alternative). The Canadian Intellectual Property Office has already granted the registration for VP Authenticate.
Despite certain precautions taken by us, it may be possible for third parties to obtain and use our intellectual property without authorization. This risk may be increased due to the lack of any patent and/or copyright protection. If any of our proprietary rights are misappropriated or we are forced to defend our intellectual property rights, we will have to incur substantial costs. Such litigation could result in substantial costs and diversion of our resources, including diverting the time and effort of our senior management, and could disrupt our business, as well as have a material adverse effect on our business, prospects, financial condition and results of operations. Management will from time to time determine whether applying for and pursuing patent and copyright protection is appropriate for us. We have no guarantee that any applications will be granted or, if awarded, whether they will offer us any meaningful protection from other companies in our business, or that we will have the financial resources to oppose any actual or threatened infringement by any third party. Furthermore, any patent or copyrights that we may be granted may be held by a court to infringe on the intellectual property rights of others and subject us to the payment of damage awards.
In addition, we cannot be certain that our technology will not infringe upon patents, copyrights or other intellectual property rights held by third parties. While we know of no basis for any claims of this type, the existence of and ownership of intellectual property can be difficult to verify and we have not made an exhaustive search of all patent filings. We may become subject to legal proceedings and claims from time to time relating to the intellectual property of others in the ordinary course of our business. If we are found to have violated the intellectual property rights of others, we may be enjoined from using such intellectual property, and we may incur licensing fees or be forced to develop alternative technology or obtain other licenses. In addition, we may incur substantial expenses in defending against these third party infringement claims and be diverted from devoting time to our business and operational issues, regardless of the merits of any such claim.
Research and Development
During 2014, 2013 and 2012, our research and development expenses were $3.3 million, $2.7 million and $1.5 million, respectively, all of which were borne by us.
Our Revenue Model
As of the date of this report, we have not generated significant revenue. We take a small percentage of every transaction from an online merchant. Until very recently this was our only revenue source. As we enter 2015, we expect to have additional revenue streams by generating consumer fees. We charge an annual fee of $10 for an Oink prepaid card product. It is our intention to keep the fees to the consumer as low as possible. We also expect to see additional revenue from our channel partners as the online gaming side of our business starts to accelerate. As part of our launch of the Oink card with Discover, Discover is paying us basis point fees every time the Oink cards are presented on the Discover network. While low, we believe these fees will start to generate revenue in 2015. We are also seeing affiliate fees from merchants.
Our Plan of Operation
A phased approach to the introduction of our Platform is planned.
As of the date of this report, we have completed the design and development of the core Oink platform. We continue to enhance the app that links to the Oink wallet. We launched Oink into Europe in February 2013. The Oink service is running live and processing live transactions with merchants and consumers. The Oink reloadable prepaid card was launched in December 2014 and is in live use across the United States. The card product is currently being used to meet a wide variety of youth needs including; clothing and general retail, gaming, food and dining.
Sales and Marketing Strategy
In 2015 we are focusing on onboarding the youth market in the US and are working with our latest advisory board member Rodney Jerkins to access the youth market directly. We believe this direct engagement is critical to growing the Oink user base.
We are also looking at other international markets for the Oink wallet and markets that are more adult focused.
Parents and Youth
Parent and Youth outreach marketing strategy includes:
|
|
·
|
Co-marketing with teen influencers and stars to drive awareness and use of the product
|
|
|
·
|
Awareness campaign that will include press coverage in key publications, media outlets, and consumer blogs focused on the targeted users
|
|
|
·
|
Digital advertising, social media campaigns, and strategic partnerships that drive user acquisition
|
|
|
·
|
Participation with organizations and advocacy groups interested in youth empowerment and opportunity
|
|
|
·
|
Outreach to schools, sports venues and educational facilities
|
Seasonality
We expect transaction activity patterns for our services to mirror general consumer buying patterns which are typically significantly higher during the fourth quarter of the calendar year, due primarily to the increased demand during the year-end holiday buying season, except for online gaming consumers which have more consistent use during the year.
Competition
The online payment solutions business is intensely competitive. It is characterized by the continuous introduction of new entrants into the market and the development of new technologies and product offerings. Although payment services such as PayPal and Teen Visa can be viewed as our competitors, we do not believe that either provides the type of family friendly solution that not only teaches children about saving, spending, and giving, but that is also compliant with COPPA, and other laws that users of all ages need to be aware of, including but not limited to privacy, data collection, and security. We believe we have built and continue to build a financial solution that is not only good for the youth market, but one that will be requested by them over other products. In addition, parents may also choose to pay through a variety of alternative means, including offline payment methods such as cash, check or money order. To compete effectively, we expect that we will we need to expend significant resources in technology and marketing.
Government Regulation
The industry which we serve is subject to regulation by the FTC, laws such as COPPA, and other laws relating to collection, use, retention, and security. Complying with these varying U.S. and international requirements could cause us to incur substantial costs or require us to change our business practices in a manner adverse to our business. In addition, we have and post on our websites our own privacy policies and practices concerning the collection, use and disclosure of user data. Any failure, or perceived failure, by us to comply with our posted privacy policies or with any regulatory requirements or orders or other federal, state or international privacy or consumer protection-related laws and regulations could result in proceedings or actions against us by governmental entities or others, subject us to significant penalties and negative publicity and adversely affect us. In addition, we are subject to the possibility of security breaches, which themselves may result in a violation of these laws.
Employees
As of December 31, 2014, we had 29 employees, who were working in the areas of sales, marketing, programming and product development, web development, legal, finance and administration. None of our employees are represented by a union or covered by a collective bargaining agreement. We believe that our relations with our employees are good.
Company Information
Virtual Piggy’s website can be found on the Internet at www.oink.com. The website contains information about the Company and our operations. We make available free of charge through a link on our website our Annual Reports on Form 10-K, Quarterly Reports on Form 10-Q, and Current Reports on Form 8-K, and amendments to these reports, as soon as we electronically file such material with, or furnish such material to, the Securities and Exchange Commission (SEC). These reports may be accessed on our website by following the link under Investor and then clicking on SEC filings.
An investment in our common stock involves a high degree of risk. You should carefully consider the following risk factors in addition to other information in this Annual Report on Form 10-K before purchasing our common stock. The risks and uncertainties described below are those that we currently deem to be material and that we believe are specific to our company and our industry. In addition to these risks, our business may be subject to risks currently unknown to us. If any of these or other risks actually occurs, our business may be adversely affected, the trading price of our common stock may decline, and you may lose all or part of your investment.
RISKS RELATED TO OUR BUSINESS
We have a history of losses, have yet to begin generating significant revenue, will require additional capital, and our auditors have raised substantial doubt about our ability to continue as a going concern.
We have experienced net losses in each fiscal quarter since our inception and as of December 31, 2014, have an accumulated deficit of approximately $52.0 million. We incurred net losses to common shareholders of approximately $11.0 million
during the year ended December 31, 2014, approximately $16.0 million during the year ended December 31, 2013, and approximately $12.0 million during the year ended December 31, 2012. Depending on the speed at which we begin to generate revenue, and to the degree we continue to accelerate spending to take advantage of our market opportunity, we will need additional capital to execute our business plan. As a result of these conditions, the report of our independent accountants issued in connection with the audit of our financial statements as of and for our fiscal year ended December 31, 2014 contained a qualification raising a substantial doubt about our ability to continue as a going concern.
In order to execute our business plan and pay expenses in connection with unforeseen events, we will need to raise additional capital, which may not be available on terms acceptable to us, if at all.
In order to execute our current business plan, we will need to raise additional capital. The amount of funding required will be determined by many factors, some of which are beyond our control, and we may require such funds sooner than currently anticipated or to cover unforeseen expenses. We expect that any such funding would be raised through sales of our debt or equity securities. When raising additional funding, general market conditions or the then-current market price of our common stock may not support capital raising transactions. We have not made arrangements to obtain additional financing and we can provide no assurance that additional financing will be available in an amount or on terms acceptable to us, if at all. If we cannot raise funds when they are needed or if such funds cannot be obtained on acceptable terms, we may not be able to (a) pay our costs and expenses as they are incurred, (b) execute our business plan, (c) take advantage of future opportunities, or (d) respond to competitive pressures or unanticipated requirements or in the extreme case, liquidate the Company. This may seriously harm our business, financial condition and results of operations.
We are a start-up company with an unproven business model which makes it difficult to evaluate our current business and future prospects.
We are a essentially a start-up company introducing new services and technologies. Although we have completed the development part of our services and have signed agreements with merchants, we have not generated significant revenue. We expect to generate all of our future revenues from the development and marketing of our COPPA compliant payment solution to online merchants and through the sale of our Oink card to system users. Accordingly, we have only a very limited operating history and have not generated significant revenue upon which to base an evaluation of our current business and future prospects. Although our management team has substantial experience in developing and managing businesses, they have never developed or offered such a technology and there can be no assurance that we will be able to successfully develop and market such a technology. If we are unable to fully develop and commercialize our Platform, or manage other challenges facing development stage companies, such as raising additional capital, managing existing and expanding operations, and hiring qualified personnel, we may continue to be unprofitable or, in the extreme case, be forced to cease operations. Before purchasing our common stock, you should consider an investment in our common stock in light of the risks, uncertainties and difficulties frequently encountered by early stage companies in new and evolving markets such as ours, including those described herein. We may not be able to successfully address any or all of these risks. Failure to adequately address such risks would have a material adverse effect on our financial condition and results of operation and could cause our business to fail.
Our management has limited experience in our relatively new industry, which may make it difficult for you to evaluate our business prospects.
Our senior management does not have direct experience in the online payment or retailing industries. There can be no assurance that our management team will be successful in working together to develop and market our Platform. In addition, the online payment industry is a relatively new industry. Although there a number of online payment solutions, relatively few are directed specifically to the “Under 18” market segment. You must consider our business prospects in light of the risks and difficulties we will encounter in the future in a new and rapidly evolving industry. We may not be able to successfully address these risks and difficulties, which could materially harm our business prospects, financial condition and results of operations.
We are developing a unique service platform which is new to the market and there is substantial uncertainty regarding the level of consumer and industry acceptance, if any, of our platform.
Our Platform is intended to provide a unique solution to certain website operators and online merchants. As we do not believe any provider is currently offering such a solution, it is very difficult for us to predict the level of demand and market acceptance of our Platform by consumers or online retailers. As regulations, consumer and industry preferences and trends evolve, there is a high degree of uncertainty about whether users will value some or all of the key features which we intend to incorporate into the Platform. The failure of the marketplace to deem our features desirable may discourage use of our Platform and limit our ability to generate any meaningful revenues or profits which would have a material adverse effect on our business, operating results, and financial condition.
Fluctuations in demand for our Platform may have a material adverse effect on our business, operating results and financial condition.
We are subject to fluctuations in demand for our Platform due to a variety of factors, including general economic conditions, including the possibility of a prolonged period of limited economic growth or possible economic decline in the U.S., competition, adverse effects of the ongoing sovereign debt crisis in Europe, including its expected negative impact on European economic growth versus the rest of the world; disruptions to the credit and financial markets in Europe, the U.S., and elsewhere; contractions or limited growth in consumer spending or consumer credit; and adverse economic conditions that may be specific to the Internet, ecommerce and payments industries.
We are also subject to product obsolescence, technological change, shifts in buying patterns, financial difficulties and budget constraints of current and potential customers, levels of demand for virtual goods, awareness of security threats to IT systems, and other factors. While such factors may, in some periods increase revenues, fluctuations in demand can also negatively impact our revenues.
Weak consumer spending may adversely affect our business prospects, financial condition and results of operations.
Our ability to attract new users, and encourage users to purchase items through our website, and use our payment services in times where consumer spending is weak could materially and adversely affect our business, financial condition and results of operations.
Undetected programming errors or flaws in our Platform could harm our reputation or prevent market acceptance of the Platform which would materially and adversely affect our business prospects, reputation, financial condition and results of operations.
The Platform may contain programming errors or flaws, which may become apparent only after sustained use in the market. In addition, the Platform was developed using programs and engines developed by and/or licensed from third party vendors, which may include programming errors or flaws over which we have no control. If our users have a negative experience with the Platform, related to or caused by undetected programming errors or flaws, they may be less inclined to continue or resume use of the Platform or recommend the Platform to other potential users. Undetected programming errors in the Platform can also cause our users to cease using the Platform or delay market acceptance of the Platform, either of which could materially and adversely affect our business, financial condition and results of operations.
Our future growth is largely dependent upon our ability to develop technologies that achieve market acceptance with acceptable margins.
The markets for our products and services are characterized by constant technological changes, frequent introductions of new products and services and evolving industry standards. Our ability to execute our business depends upon a number of factors, including our ability to identify emerging technological and market trends in our target end-markets, develop and maintain competitive products, create our Platform that differentiates our services from those of our competitors, and develop and bring services to market quickly and cost-effectively. In addition, we will need to effectively manage risks associated with new products and production ramp issues as well as risks that new products may have quality or other defects in early stages of introduction. The process of developing new high technology products, services and solutions and enhancing our existing products is complex, costly and uncertain. Our ability to continually refine and successfully commercialize the Platform will require substantial technological innovation and requires the investment of significant resources. These development efforts may not lead to the ongoing evolution of the Platform on a timely basis or meet the needs of our customers as fully as competitive offerings. Any failure by us to anticipate customers’ changing needs and emerging technology trends accurately could significantly harm our market share and results of operations. In addition, the markets for our services may not develop or grow as we anticipate. The failure of our products to gain market acceptance or their obsolescence due to more attractive offerings by competitors could significantly impact our revenues and adversely affect our business, operations and financial results.
Security breaches and other disruptions could compromise our information and expose us to liability, which would cause our business and reputation to suffer.
In the ordinary course of our business, we collect and store sensitive data, including intellectual property, our proprietary business information and that of our customers and business partners, and personally identifiable information of our customers and employees, in our data centers and on our networks. The secure processing, maintenance and transmission of this information is critical to our operations and business strategy. Despite our security measures, our information technology and infrastructure may be vulnerable to attacks by hackers or breached due to employee error, malfeasance or other disruptions. Any such breach could compromise our networks and the information stored there could be accessed, publicly disclosed, lost or stolen. Any such access, disclosure or other loss of information could result in legal claims or proceedings, liability under laws that protect the privacy of personal information, and regulatory penalties, disrupt our operations and the services we provide to customers, and damage our reputation, and cause a loss of confidence in our products and services, which could adversely affect our business/operating margins, revenues and competitive position.
Our plans are dependent upon key individuals and the ability to attract qualified personnel, as well as our relationship with outside developers.
In order to execute our business plan, we will be dependent upon Jo Webber, our Chairman of the Board and Chief Executive Officer, Pradeep Ittycheria, a director and Chief Technology Officer, as well as other key personnel. The loss of any of the foregoing individuals could have a material adverse effect upon our business prospects. Moreover our success continues to depend to a significant extent on our ability to identify, attract, hire, train and retain qualified professional, creative, technical and managerial personnel. Competition for such personnel is intense, and there can be no assurance that we will be successful in identifying, attracting, hiring, training and retaining such personnel in the future. The competition for software developers, and technical directors is especially intense because the software market has significantly expanded over the past several years. If we are unable to hire, assimilate and retain such qualified personnel in the future, our business, operating results, and financial condition could be materially adversely effected. We may also depend on third party contractors and other partners, to develop our Platform as well as any future enhancements thereto. There can be no assurance that we will be successful in either attracting and retaining qualified personnel, or creating arrangements with such third parties. The failure to succeed in these endeavors would have a material adverse effect on our ability to consummate our business plans.
Our lack of patent and/or copyright protection and any unauthorized use of the Platform by third parties, may adversely affect our
business.
Although we have made seven patent applications with the United States Patent and Trademark Office related to our Platform, only three have been issued as of the date of this report. We also rely on a combination of protections provided by contracts, including confidentiality and nondisclosure agreements, and common law rights, such as trade secrets, to protect our intellectual property. However, we cannot assure you that we will be able to adequately protect our technology or other intellectual property from misappropriation in the U.S. and abroad. This risk may be increased due to the lack of complete patent and/or copyright protection. Any patent issued to us could be challenged, invalidated or circumvented or rights granted thereunder may not provide a competitive advantage to us. Furthermore, patent applications that we file may not result in issuance of a patent or, if a patent is issued, the patent may not be issued in a form that is advantageous to us. Despite our efforts to protect our intellectual property rights, others may independently develop similar products, duplicate our products or design around our patents and other rights. In addition, it is difficult to monitor compliance with, and enforce, our intellectual property rights on a worldwide basis in a cost-effective manner. In jurisdictions where foreign laws provide less intellectual property protection than afforded in the U.S. and abroad, our technology or other intellectual property may be compromised, and our business would be materially adversely affected. If any of our proprietary rights are misappropriated or we are forced to defend our intellectual property rights, we will have to incur substantial costs. Such litigation could result in substantial costs and diversion of our resources, including diverting the time and effort of our senior management, and could disrupt our business, as well as have a material adverse effect on our business, prospects, financial condition and results of operations. We can provide no assurance that we will have the financial resources to oppose any actual or threatened infringement by any third party. Furthermore, any patent or copyrights that we may be granted may be held by a court to infringe on the intellectual property rights of others and subject us to the payment of damage awards.
We may be subject to claims with respect to the infringement of intellectual property rights of others, which could result in substantial costs and diversion of our financial and management
resource
s.
Third parties may claim that we are infringing on their intellectual property rights. We may violate the rights of others without our knowledge. We may expose ourselves to additional liability if we agree to indemnify our clients against third party infringement claims. While we know of no basis for any claims of this type, the existence of and ownership of intellectual property can be difficult to verify and we have not made an exhaustive search of all patent filings. Additionally, most patent applications are kept confidential for twelve to eighteen months, or longer, and we would not be aware of potentially conflicting claims that they make. We may become subject to legal proceedings and claims from time to time relating to the intellectual property of others in the ordinary course of our business. If we are found to have violated the intellectual property rights of others, we may be enjoined from using such intellectual property, and we may incur licensing fees or be forced to develop alternative technology or obtain other licenses. In addition, we may incur substantial expenses in defending against these third party infringement claims and be diverted from devoting time to our business and operational issues, regardless of the merits of any such claim. In addition, in the event that we recruit employees from other technology companies, including certain potential competitors, and these employees are used in the development of portions of the Platform which are similar to the development in which they were involved at their former employers, we may become subject to claims that such employees have improperly used or disclosed trade secrets or other proprietary information. If any such claims were to arise in the future, litigation or other dispute resolution procedures might be necessary to retain our ability to offer our current and future services, which could result in substantial costs and diversion of our financial and management resources. Successful infringement or licensing claims against us may result in substantial monetary damages, which may materially disrupt the conduct of our business and have a material adverse effect on our reputation, business, financial condition and results of operations. Even if intellectual property claims brought against us are without merit, they could result in costly and time consuming litigation, and may divert our management and key personnel from operating our business.
If we are unable to effectively protect our intellectual property rights on a worldwide basis, we may not be successful in the planned international expansion of our Platform.
Access to worldwide markets depends in part on the strength of our intellectual property portfolio. There can be no assurance that, as our business expands into new areas, we will be able to independently develop the technology, software or know-how necessary to conduct our business or that we can do so without infringing the intellectual property rights of others. To the extent that we have to rely on licensed technology from others, there can be no assurance that we will be able to obtain licenses at all or on terms we consider reasonable. The lack of a necessary license could expose us to claims for damages and/or injunction from third parties, as well as claims for indemnification by our customers in instances where we have a contractual or other legal obligation to indemnify them against damages resulting from infringement claims. With regard to our own intellectual property, we intend to actively enforce and protect our rights. However, there can be no assurance that our efforts will be adequate to prevent the misappropriation or improper use of our protected technology in international markets.
If we are unable successfully to manage growth, our operations could be adversely affected.
Our progress is expected to require the full utilization of our management, financial and other resources, which to date has occurred with limited working capital. Our ability to manage growth effectively will depend on our ability to improve and expand operations, including our financial and management information systems, and to recruit, train and manage sales personnel. There can be no assurance that we will be able to manage growth effectively. If we do not properly manage the growth of our business, we may experience significant strains on our management and operations and disruptions in our business. Various risks arise when companies and industries grow quickly. If our business or industry grows too quickly, our ability to meet customer demand in a timely and efficient manner could be challenged. We may also experience development delays as we seek to meet increased demand for our products. Our failure to properly manage the growth that we or our industry might experience could negatively impact our ability to execute on our operating plan and, accordingly, could have an adverse impact on our business, our cash flow and results of operations, and our reputation with our current or potential customers.
As a public company, we are required to incur substantial expenses.
We are subject to the periodic reporting requirements of the Exchange Act, which requires, among other things, review, audit, and public reporting of our financial results, business activities, and other matters. SEC regulations, including regulations enacted as a result of the Sarbanes-Oxley Act of 2002, have also substantially increased the accounting, legal, and other costs related to compliance with SEC reporting obligations. If we do not have current information about our Company available to market makers, they will not be able to trade our stock. The public company costs of preparing and filing annual and quarterly reports, and other information with the SEC will cause our expenses to be higher than they would be if we were privately-held. These increased costs may be material and may include the hiring of additional employees and/or the retention of additional advisors and professionals. Our failure to comply with the federal securities laws could result in private or governmental legal action against us and/or our officers and directors, which could have a detrimental effect on our business and finances, the value of our stock, and the ability of stockholders to resell their stock.
We process, store and use personal information, which subjects us to governmental regulation and laws related to privacy, and our actual or perceived failure to comply with these obligations could harm our business.
We receive, store and process personal information. There are numerous federal, state and local laws around the world regarding privacy and the storing, sharing, use, processing, disclosure and protection of personal information, the scope of which are changing, subject to differing interpretations, and may be inconsistent between countries or conflict with other rules. We attempt to comply with all applicable laws, policies, legal obligations and industry codes of conduct relating to privacy and data protection, to the best extent possible. However, these obligations may be interpreted and applied in a manner that is inconsistent from one jurisdiction to another and may conflict with other rules or our practices. Any actual or perceived failure by us to comply with such laws and regulations, or any compromise of security that results in the unauthorized release or transfer of personally identifiable information, may result in governmental enforcement actions, litigation or public statements against us by consumer advocacy groups, which could adversely affect our business, operating results and financial condition.
The impact of laws regulating financial institutions may adversely impact our business.
The impact of laws regulating financial institutions, including the Dodd-Frank Wall Street Reform and Consumer Protection Act may adversely impact our business as a result of our reliance on merchants to provide services for our Platform.
We operate in a highly competitive industry and compete against many large companies.
Many companies worldwide are dedicated to providing online payment solutions including mobile payments, electronic funds transfer networks, cross-border access to networks, prepaid cards, bill pay networks and other online and offline payment methods. The market in which we operate is characterized by numerous and larger competitors, including PayPal, credit card companies, and credit card processors that offer services to online retailers, rapid technological changes, and intense competition. We expect more companies to enter the online payment business, particularly the segment aimed at serving the “Under 18” demographic. Most if not all of these competitors have longer operating histories, significantly greater financial, technical, marketing, customer service and other resources, and greater name recognition than us. As a result, they may respond to new or emerging technologies and changes in customer requirements faster and more effectively than we can. If any current online payment solution develops a COPPA compliant service, it would be substantially more difficult for us to introduce and distribute our Platform to the market, and our business, financial condition and results of operations would be materially and adversely affected.
Changes to payment card networks or bank fees, rules, or practices could harm our business and, if we do not comply with the rules, could result in a termination of our ability to accept credit cards
.
If we are unable to accept credit cards, our competitive position would be seriously damaged.
We belong to or directly access payment card networks, such as Visa, MasterCard and the National Automated Clearing House Association (“NACHA”), in order to accept or facilitate the processing of credit cards and debit cards (including some types of prepaid cards) for merchants. We also expect to rely on banks or other payment processors to process transactions, and must pay fees for this service. From time to time, payment card networks have increased, and may increase in the future, the interchange fees and assessments that they charge for each transaction using one of their cards. Generally, payment card processors have the right to pass any increases in interchange fees and assessments on to payment systems like ours as well as increase their own fees for processing. Changes in interchange fees and assessments could increase our operating costs and reduce profit margins, if any. In addition, in some markets, governments have required Visa and MasterCard to reduce interchange fees, or have opened investigations as to whether Visa or MasterCard's interchange fees and practices violate antitrust law. The financial reform law enacted in 2010 authorizes the Federal Reserve Board to regulate debit card interchange rates and debit card network exclusivity provisions, and the Federal Reserve Board has proposed rules that include caps on debit card interchange fees at significantly lower rates than Visa or MasterCard currently charge. We expect to be required by our processors to comply with payment card network operating rules, which generally include the obligation to reimburse processors for any fines they are assessed by payment card networks as a result of any rule violations by users of Oink. The payment card networks set and interpret the card rules which could be more difficult or expensive to comply with. We also expect to be required to comply with payment card networks' special operating rules for Internet payment services. Some of these rules may be difficult or even impossible for us to comply with. If we are unable to comply with these rules, we may be subject to fines for any failure to comply with such rules or we may lose our ability to gain access to the credit card associations or NACHA.
Any capacity constraints or system disruptions, including natural disasters, could have a material adverse effect on our business
Our business will rely significantly on Internet technologies and infrastructure. Therefore, the performance and reliability of our Internet sites and network infrastructure will be critical to our ability to attract and retain users, merchants and strategic partners. Any system error, outage or failure, or a sudden and significant increase in traffic, may result in the unavailability of sites and significantly delay response times. Individual, sustained or repeated occurrences could result in a loss of potential or existing users. Our systems and operations will be vulnerable to interruption or malfunction due to certain events beyond our control, including natural disasters, telecommunications failures and computer hacking. We will also rely on Web browsers and online service providers to provide Internet access to our sites. There can be no assurance that we will be able to expand our network infrastructure, either alone or through use of third-party hosting systems or service providers, on a timely basis sufficient to meet demand. Our operations and services depend on the extent to which our computer equipment and the computer equipment of our third-party network providers is protected against damage from fire, earthquakes, terrorist acts, natural disasters, computer viruses, unauthorized entry, power loss, telecommunications failures, and similar events. Despite precautions taken by us and our third-party network providers, over which we have no control, a natural disaster or other unanticipated problems at our headquarters or a third-party provider could cause interruptions in the services that we provide. If disruptions occur, we may have no means of replacing these network elements on a timely basis or at all. Any accident, incident, system failure, or discontinuance of operations involving our network or a third-party network that causes interruptions in our operations could have a material adverse effect on our ability to provide services to our customers and, in turn, on our business, financial condition, and results of operations.
Our business will be dependent upon broadband carriers.
We will rely on broadband providers to provide high speed data communications capacity to our customers. We may experience disruptions or capacity constraints in these broadband services. If disruptions or capacity constraints occur, we may have no means of replacing these services, on a timely basis or at all. In addition, broadband access may be limited or unavailable in certain areas, thereby reducing our potential market.
We have limited experience competing in international markets. Our proposed international expansion plans will expose us to greater political, intellectual property, regulatory, exchange rate fluctuation and other risks, which could harm our business.
We have commenced marketing our products in countries outside of the United States. Certain markets in which we are expected to undertake international expansion may have technology and online industries that are less well developed than in the United States. There are certain risks inherent in doing business in international markets, such as the following:
|
|
·
|
Uncertainty of product acceptance by different cultures;
|
|
|
·
|
Unforeseen changes in regulatory requirements;
|
|
|
·
|
Difficulties in staffing and managing multinational operations;
|
|
|
·
|
State-imposed restrictions on the repatriation of funds;
|
|
|
·
|
Currency fluctuations;
|
|
|
·
|
Difficulties in finding appropriate foreign licensees or joint venture partners;
|
|
|
·
|
Laws and business practices that favor local competitors;
|
|
|
·
|
Expenses associated with localizing our products, including offering customers the ability to transact business in different languages and multiple currencies;
|
|
|
·
|
Potentially adverse tax consequences;
|
|
|
·
|
Less stringent and/or narrower intellectual property protection; and
|
|
|
·
|
General economic conditions, including the possibility of a prolonged period of limited economic growth or possible economic decline in Europe; adverse effects of the ongoing sovereign debt crisis in Europe, including its expected negative impact on European economic growth versus the rest of the world; and disruptions to the credit and financial markets in Europe.
|
There is a risk that these factors will have an adverse effect on our ability successfully to operate internationally and on our results of operations and financial condition.
We may be subject to credit card transaction fraud
Our business model depends upon the processing of credit cards and includes the sale of gift cards. In cases where we are the merchant of record on a gift card sale, we could be held financially responsible for the value of gift cards which are purchased using a fraudulent or stolen credit card. While we use software and safeguards to ensure that credit cards we accept are valid, there can be no assurance that credit card fraud will not occur. In addition, in the case of transactions where our merchant is in the United States and is the merchant of record, we are not generally responsible for credit card fraud. However, given that our business is dependent on the successful processing of credit cards and payment solutions, fraudulent processing could have an adverse effect on our merchant relationships and could result in liability. Additionally, other countries have varying rules on who the responsible party would be in certain variations of credit card or other payment fraud. While we are researching such international policies and rules and are implementing safeguards to minimize risk, there can be no assurance that we will not incur liability relating to credit card or other payment fraud.
RISKS RELATED TO OUR COMMON STOCK
Our strategic alternatives process may not result in a successful corporate transaction or liquidity event.
We have previously announced that our Board of Directors is exploring our strategic alternatives. Any process of exploring strategic alternatives includes market risk and other uncertainties. There can be no assurance that the aforementioned exploration of strategic alternatives will result in the successful consummation of a liquidity event, capital raise or other corporate transaction, on a basis that will provide any specific level of value to our common stockholders or other security holders, or at all.
We do not currently have an investment bank engaged with respect to the strategic alternatives process, however, we are in discussions with investment banking firms with respect to such an engagement. We remain committed to the exploration and assessment of our strategic alternatives.
Our officers and directors own a large amount of our common stock, are in a position to affect all maters requiring shareholder approval, which may limit minority shareholders’ ability to influence corporate affairs.
As of March 1, 2015, our officers and directors beneficially own an aggregate of 24,521,629 shares of our common stock (which includes 11,580,525 shares of common stock underlying warrants and options exercisable within 60 days). Assuming that the only such convertible securities exercised are by our officers and directors, we would have outstanding 130,698,151 shares of common stock. In such event, our officers and directors would beneficially own approximately 18.8% of our outstanding common stock. These persons are in a position to significantly affect all matters requiring shareholder approval, including the election of directors. The interests of our officers, directors and their affiliates may differ from the interests of other shareholders with respect to the issuance of shares, business transactions with or sales to other companies, selection of officers and directors and other business decisions. The other shareholders would be severely limited in their ability to override their decisions. This level of control may also have an adverse impact on the market value of our shares because they may institute or undertake transactions, policies or programs that result in losses, may not take steps to increase our visibility in the financial community and/or may sell sufficient numbers of shares to significantly decrease our price per share.
Trading in our common stock has been limited, there is no significant trading market for our common stock, and purchasers of our common stock may be unable to sell their shares.
Our common stock is currently eligible for quotation on the OTC QB, however trading to date has been limited. If activity in the market for shares of our common stock does not increase, purchasers of our shares may find it difficult to sell their shares. We currently do not meet the initial listing criteria for any registered securities exchange, including the Nasdaq Stock Market. The OTC Bulletin Board is a less recognized market than the foregoing exchanges and is often characterized by low trading volume and significant price fluctuations. These and other factors may further impair our stockholders’ ability to sell their shares when they want to and/or could depress our stock price. As a result, stockholders may find it difficult to dispose of, or obtain accurate quotations of the price of our securities because smaller quantities of shares could be bought and sold, transactions could be delayed and security analyst and news coverage of our Company may be limited. These factors could result in lower prices and larger spreads in the bid and ask prices for our shares of common stock.
We may not be able to qualify to have our common stock listed on a national stock exchange
The Company’s common stock currently trades on the Over the Counter Market (“OTC QB”) in the United States. Listing requirements for exchanges such as NASDAQ include financial and trading requirements that, as of December 31, 2014 the Company does not meet. The listing process can be lengthy, is discretionary and ultimately must include meeting financial and trading requirements. There can be no assurance that the Company will ever be listed on a national stock exchange. Currently, the Company does not qualify for listing based on its stock price, among other things. Therefore, certain institutional investors may not be able to purchase the Company’s common stock as a result of their own ownership guidelines and liquidity in the Company’s common stock would remain more limited. Further, the Company’s ability to raise money through subsequent offerings of its common stock will be more limited if the Company is not able to list on a national exchange.
Applicable SEC rules governing the trading of “penny stocks” may limit the trading and liquidity of our common stock which may affect the trading price of our common stock.
Our common stock is a “penny stock” as defined under Rule 3a51-1 of the Exchange Act, and is accordingly subject to SEC rules and regulations that impose limitations upon the manner in which our common stock can be publicly traded. Penny stocks generally are equity securities with a per share price of less than $5.00 (other than securities registered on some national securities exchanges or quoted on NASDAQ). The penny stock rules require a broker-dealer, prior to a transaction in a penny stock not otherwise exempt from the rules, to deliver a standardized risk disclosure document that provides information about penny stocks and the nature and level of risks in the penny stock market. The broker-dealer also must provide the customer with current bid and offer quotations for the penny stock, the compensation of the broker-dealer and its salesperson in the transaction, and, if the broker-dealer is the sole market maker, the broker-dealer must disclose this fact and the broker-dealer’s presumed control over the market, and monthly account statements showing the market value of each penny stock held in the customer’s account. In addition, broker-dealers who sell these securities to persons other than established customers and “accredited investors” must make a special written determination that the penny stock is a suitable investment for the purchaser and receive the purchaser’s written agreement to the transaction. Consequently, these requirements may have the effect of reducing the level of trading activity, if any, of our common stock and reducing the liquidity of an investment in our common stock.
We have outstanding shares of preferred stock with rights and preferences superior to those of our common stock.
The issued and outstanding shares of Series A Cumulative Convertible Preferred Stock and Series B Cumulative Convertible Preferred Stock grant the holders of such preferred stock anti-dilution, voting, dividend and liquidation rights that are superior to those held by the holders of our common stock. In addition, upon the issuance or deemed issuance of additional shares of common stock in the future for a price below the applicable preferred stock conversion price (currently $0.90 per share), the conversion price of the Series A and Series B Cumulative Convertible Preferred Stock will be lowered based on a full-ratchet formula for twelve months from the respective original issue dates and pursuant to a weighted average formula thereafter, which will have the effect of immediately diluting the holders of our common stock.
Sales of a substantial number of shares of our common stock in the public market originally issued through the conversion of preferred stock, exercise of options or warrants, or additional financing transactions could adversely affect the market price of our common stock and would have a dilutive effect upon our shareholders.
Historically, our common stock has been thinly traded. This low trading volume may have had a significant effect on the market price of our common stock, which may not be indicative of the market price in a more liquid market. As of March 1, 2015, options and warrants for the purchase of 42,976,526 shares of our common stock were outstanding and 13,697,800 shares of common stock were issuable upon conversion of our outstanding Series A and B Cumulative Convertible Preferred Stock and promissory notes convertible into Series B Cumulative Convertible Preferred Stock. Sales of a substantial number of shares of our common stock in the public market originally issued through the conversion of convertible notes, preferred stock, exercise of options or warrants, or additional financing transactions could adversely affect the market price of our common stock.
We intend to raise additional funds in the future through issuances of securities and such additional funding may be dilutive to shareholders or impose operational restrictions.
We intend to raise additional capital in the future to help fund our operations through sales of shares of our common stock or securities convertible into shares of our common stock, as well as issuances of debt. Such additional financing may be dilutive to our shareholders, and debt financing, if available, may involve restrictive covenants which may limit our operating flexibility. If additional capital is raised through the issuances of shares of our common stock or securities convertible into shares of our common stock, the percentage ownership of existing shareholders will be reduced. These shareholders may experience additional dilution in net book value per share and any additional equity securities may have rights, preferences and privileges senior to those of the holders of our common stock.
Because we do not expect to pay dividends for the foreseeable future, investors seeking cash dividends should not purchase shares of common stock.
We have never declared or paid any cash dividends on our common stock. We currently intend to retain future earnings, if any, to finance the expansion of our business. As a result, we do not anticipate paying any cash dividends in the foreseeable future. Our payment of any future dividends will be at the discretion of our board of directors after taking into account various factors, including but not limited to our financial condition, operating results, cash needs, growth plans and the terms of any credit agreements that we may be a party to at the time. Accordingly, investors must rely on sales of their shares, after price appreciation, which may never occur, as the only way to realize any return on their investment. Investors seeking cash dividends should not purchase our shares.
We are not subject to certain corporate governance provisions of the Sarbanes-Oxley Act of 2002 and without voluntary compliance with such provisions, our shareholders will not receive the benefits and protections they were enacted to provide.
Since our common stock is not listed for trading on a national securities exchange, we are not subject to certain of the corporate governance requirements established by the national securities exchanges pursuant to the Sarbanes-Oxley Act of 2002. These include rules relating to independent directors, and independent director nomination, audit and compensation committees. Unless we voluntarily elect to comply with those obligations, investors in our shares will not have the protections offered by those corporate governance provisions.
We will be required to remain current in our filings with the SEC or our securities will not be eligible for continued quotation on the OTC QB.
We are required to remain current in our filings with the SEC in order for our shares of common stock to continue to be eligible for quotation on the OTC QB. In the event that we become delinquent in our required filings with the SEC, quotation of shares of our common stock will be terminated following a 30 day grace period if we do not make our required filing during that time. In such event purchasers of our common stock may find it difficult to sell the shares purchased.
If we issue shares of preferred stock with superior rights to the shares of common stock, it could result in a decrease in the value of our common stock and delay or prevent a change in control of us.
Our board of directors is authorized to issue up to 2,000,000 shares of preferred stock with such rights, designation, and preferences as determined by our board of directors. As of the date of this report, we have issued 136,978 shares of preferred stock (consisting of 108,600 shares of Series A Cumulative Convertible Preferred Stock and 28,378 shares of Series B Cumulative Convertible Preferred Stock) and 1,863,022 shares remain unissued. Our board of directors has the power to establish the dividend rates, liquidation preferences, voting rights, redemption and conversion terms and privileges with respect to any series of preferred stock without shareholder approval. Depending upon our future financial needs, our board may, in the exercise of its business discretion, determine to issue additional shares of preferred stock having rights superior to those of our common stock which may result in a decrease in the value or market price of such shares. Holders of such preferred stock may have the right to receive dividends, certain preferences in liquidation and conversion rights. The issuance of preferred stock could, under certain circumstances, have the effect of delaying, deferring or preventing a change in control of us without further vote or action by the stockholders and may adversely affect the voting and other rights of the holders of the shares of our common stock.
Provisions of our certificate of incorporation, bylaws and Delaware law may make a contested takeover of our Company more difficult.
Certain provisions of our certificate of incorporation, bylaws and the General Corporation Law of the State of Delaware ("DGCL") could deter a change in our management or render more difficult an attempt to obtain control of us, even if such a proposal is favored by a majority of our stockholders. For example, we are subject to the provisions of the DGCL that prohibit a public Delaware corporation from engaging in a broad range of business combinations with a person who, together with affiliates and associates, owns 15% or more of the corporation’s outstanding voting shares (an "interested stockholder") for three years after the person became an interested stockholder, unless the business combination is approved in a prescribed manner. Our certificate of incorporation also includes undesignated preferred stock, which may enable our board of directors to discourage an attempt to obtain control of us by means of a tender offer, proxy contest, merger or otherwise. Finally, our bylaws include an advance notice procedure for stockholders to nominate directors or submit proposals at a stockholders meeting. Delaware law and our charter may therefore inhibit a takeover.
The influx of additional shares of our common stock onto the market pursuant to SEC Rule 144 may create downward pressure on the trading price of our common stock.
A material percentage of the currently outstanding shares of our common stock are
“restricted securities”
within the meaning of Rule 144 under the Securities Act of 1933, as amended. As restricted securities, these shares may be resold only pursuant to an effective registration statement, under the requirements of Rule 144, or other applicable exemptions from registration under the Act and applicable state securities laws. Generally, Rule 144 provides that a person who has held restricted securities for a prescribed period may, under certain conditions, publicly resell such shares. Under Rule 144, a non-affiliate (i.e., a stockholder who has not been an officer, director or control person for at least 90 consecutive days) may freely resell restricted securities issued by a reporting company so long as such securities have been held by the owner for a period of at least one year, or under certain circumstances six months. The availability of a large number of shares for sale to the public under Rule 144 and the sale of such shares in public markets could have an adverse effect on the market price of our common stock.
We may require shareholders to authorize additional shares for us to properly finance our business
Upon the Company’s formation, and through a subsequent approval, our shareholders authorized and approved 230,000,000 shares of common stock. Currently, only 57.4 million of such shares remain available for issuance. To finance and continue to grow our business, we will require additional capital and have historically relied upon the issuance of common stock for such financing. Should our shareholders be unwilling to approve a sufficient increase in the number of our authorized shares of common stock, we would be required to finance our business with debt or other instruments, which may be difficult or impossible to secure on terms acceptable to us. If that were to occur, we may not be able to (a) pay our costs and expenses as they are incurred, (b) execute our business plan, (c) take advantage of future opportunities, or (d) respond to competitive pressures or unanticipated requirements or in the extreme case, liquidate the Company.
RISKS RELATED TO OUR FINANCIAL STATEMENTS
Management’s judgment could impact the amount of non-cash compensation expense
To estimate the fair value of our stock option awards we currently use the Black-Scholes options pricing model. The determination of the fair value of equity-based awards on the date of grant using an options pricing model is affected by our then current stock price as well as assumptions regarding a number of complex and subjective variables. Management is required to make certain judgments for these variables which include the expected stock price volatility over the term of the awards, the expected term of options based on employee exercise behaviors, and the risk-free interest rate. One of the factors used in determining such value is stock volatility. Because of the limited trading activity of our common stock, prior to January 1, 2014, we used the stock volatility of four peer companies. To the extent that we used different peer companies to measure volatility, a different stock volatility factor may have resulted which would have caused a different stock valuation and a related increase or decrease in non-cash compensation expense. If actual results are not consistent with our assumptions and judgments used in estimating key assumptions, in future periods, the stock option expense that we record for future grants may differ significantly from what we have recorded in the current period.
None.
Our principal offices are currently located at 1221 Hermosa Avenue, Suite 210, Hermosa Beach, California 90254 and Princes House, Jermyn Street, London, United Kingdom. We have a lease for the Hermosa Avenue location which expires in July 2016 at a monthly rental of $6,934. In London, we have a lease which expires October 2016 at a monthly rental of
£
7,840. As of March 1, 2015, the Company is in negotiations to assign this lease to a third party. We also lease additional space in other areas to house portions of our development team and other employees when our operations require such additional office space.
We are not a party to any pending legal proceedings, nor are we aware of any governmental authority contemplating any legal proceeding against us.
In September 2014, the Company received a subpoena from the Securities and Exchange Commission with respect to the preservation and production of documents relating to an investigation into trading in the Company’s stock. The subpoena states that it should not be construed as an indication by the Securities and Exchange Commission that any violation of law has occurred, nor as a reflection upon any person, entity or security. The Company is cooperating fully with the terms of the subpoena.
Not applicable.
Our common stock is quoted on the OTC QB market under the trading symbol “VPIG.OB”. The following table sets forth the range of high and low bid prices of our common stock for the periods indicated as reported by the OTC QB. Until recently, there was only sporadic and intermittent trading activity of our common stock. The quoted prices represent only prices between dealers on each trading day as submitted from time to time by certain of the securities dealers wishing to trade in our common stock, do not reflect retail mark-ups, mark-downs or commissions, and may not represent, or differ substantially from, prices in actual transactions.
|
Fiscal Year Ended December 31, 2014
|
High
|
Low
|
|
Quarter ended March 31, 2014
|
$1.73
|
$0.98
|
|
Quarter ended June 30, 2014
|
$1.46
|
$0.85
|
|
Quarter ended September 30, 2014
|
$1.15
|
$0.91
|
|
Quarter ended December 31, 2014
|
$0.95
|
$0.39
|
|
Fiscal Year Ended December 31, 2013
|
High
|
Low
|
|
Quarter ended March 31, 2013
|
$1.68
|
$0.91
|
|
Quarter ended June 30, 2013
|
$3.38
|
$1.46
|
|
Quarter ended September 30, 2013
|
$2.68
|
$0.78
|
|
Quarter ended December 31, 2013
|
$1.37
|
$0.90
|
Common Stockholders
As of December 23, 2014, our shares of Common Stock were held by 163 stockholders of record.
Dividend Policy
We have never declared or paid a cash dividend. At this time, we do not anticipate paying dividends in the foreseeable future. The declaration and payment of dividends is subject to the discretion of our board of directors and will depend upon our earnings (if any), our financial condition, and our capital requirements.
Stock Performance Graph
|
Total Return To Shareholders
|
||||||
|
(Includes reinvestment of dividends)
|
|
INDEXED RETURNS
|
|||||||||||||||||||||||
|
Base
|
Years Ending December 31,
|
||||||||||||||||||||||
|
Period
|
|||||||||||||||||||||||
|
Company / Index
|
Dec09
|
2010
|
2011
|
2012
|
2013
|
2014
|
|||||||||||||||||
|
Virtual Piggy, Inc.
|
100 | 36.96 | 26.09 | 43.48 | 43.91 | 16.96 | |||||||||||||||||
|
NASDAQ Composite Index
|
100 | 118.02 | 117.04 | 137.47 | 192.62 | 221.02 | |||||||||||||||||
|
S&P 1500 Internet Software & Services
|
100 | 102.68 | 108.27 | 132.32 | 190.75 | 204.20 | |||||||||||||||||
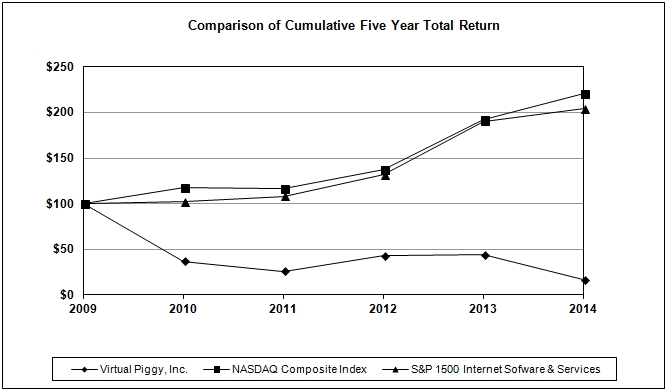
Purchases of equity securities by the issuer and affiliated purchasers
The Company did not repurchase any common stock in the fourth quarter of 2014.
Transfer Agent
Our Transfer Agent is Island Stock Transfer and their address and phone number are 100 Second Avenue South, Suite 7055, St. Petersburg, Florida 33701; (727) 289-0010.
Summary and Selected Data
|
For the Year Ending December 31,
|
||||||||||||||||||||
|
|
2010
|
2011
|
2012
|
2013
|
2014
|
|||||||||||||||
|
|
||||||||||||||||||||
|
Revenue
|
- | $ | 3,926 | $ | 1,213 | $ | 2,456 | $ | 5,708 | |||||||||||
|
|
||||||||||||||||||||
|
Operating Loss
|
$ | (1,086,346 | ) | $ | (2,688,485 | ) | $ | (11,954,870 | ) | $ | (15,980,721 | ) | $ | (15,080,540 | ) | |||||
|
|
||||||||||||||||||||
|
Net Loss
|
$ | (1,489,190 | ) | $ | (2,724,796 | ) | $ | (12,039,726 | ) | $ | (15,976,372 | ) | $ | (9,654,838 | ) | |||||
|
Net Loss Per Share
|
$ | (0.03 | ) | $ | (0.04 | ) | $ | (0.14 | ) | $ | (0.15 | ) | $ | (0.14 | ) | |||||
|
December 31,
|
||||||||||||||||||||
|
|
2010 | 2011 | 2012 | 2013 | 2014 | |||||||||||||||
|
|
||||||||||||||||||||
|
|
||||||||||||||||||||
|
Cash
|
$ | 1,574,448 | $ | 186,159 | $ | 7,371,036 | $ | 1,752,461 | $ | 1,652,392 | ||||||||||
|
Current Assets
|
$ | 1,597,389 | $ | 190,424 | $ | 7,466,589 | $ | 1,978,694 | $ | 2,251,928 | ||||||||||
|
Total Assets
|
$ | 1,609,793 | $ | 280,539 | $ | 7,990,784 | $ | 2,941,184 | $ | 3,114,170 | ||||||||||
|
|
||||||||||||||||||||
|
Current Liabilities
|
$ | 90,015 | $ | 642,953 | $ | 1,154,602 | $ | 3,063,594 | $ | 1,555,706 | ||||||||||
|
Total Liabilities
|
$ | 90,015 | $ | 642,953 | $ | 1,154,602 | $ | 3,063,594 | $ | 1,555,706 | ||||||||||
|
Liabilities & Stockholders Equity
|
$ | 1,609,793 | $ | 280,539 | $ | 7,990,784 | $ | 2,941,184 | $ | 3,114,170 | ||||||||||
This Management’s Discussion and Analysis of Financial Condition And Results Of Operations and other parts of this Annual Report on Form 10-K contain forward-looking statements that involve risks and uncertainties. All forward-looking statements included in this Annual Report on Form 10-K are based on information available to us on the date hereof, and except as required by law, we assume no obligation to update any such forward-looking statements. Our actual results may differ materially from those anticipated in these forward-looking statements as a result of a number of factors, including those set forth under the caption Item 1A “Risk Factors” and elsewhere herein. The following should be read in conjunction with our annual financial statements contained elsewhere in this report.
Overview
Virtual Piggy, Inc. (“the Company”) was incorporated in the state of Delaware on February 11, 2008. Oink from Virtual Piggy is a family wallet and shopping application that provides a safe and secure payment solution for the family. Oink is designed to provide efficiency and security for online and mobile payments, and is expanding to handle in store payments. Oink is in operational use in the US, Canada, UK and soon to be other parts of Europe. Oink functions as a digital wallet allowing payments to be made by all family members while providing the ability for parents to allocate and monitor funds and spending. Key benefits to the consumer of the Oink service include payment security, the payment consent and the transparency provided.
The Oink product enables online businesses to interact and transact with the “Under 18” market in a manner consistent with the Children’s Online Privacy Protection Act (“COPPA”) and other similar international children’s privacy laws. Oink was launched in the US in 2012 and was launched in the European market in 2013.
We secure agreements with a variety of businesses including merchants, gaming publishers, e-commerce platforms, payment aggregators, and payment processors to provide Oink’s services. We expect to see growth in both the user base and the engagement level throughout 2015, as we go live with several major digital goods providers and as we release our new offers functionality that will drive affiliate marketing revenue for the Company. We have affiliate agreements with over 200 merchants in the US market. In 2014, we embarked on a program to build our channel partners and to date have secured over 20 channel partner arrangements in the US and Europe.
To date we have not generated material revenues. We currently earn revenue by charging a percentage to the merchant or gaming publisher for each transaction processed. In addition, in the second quarter ended June 30, 2014, we received our first affiliate marketing revenues – a channel we expect to grow in future quarters. We also expect to see some revenue from partner referral agreements. As we enter 2015, we also expect additional revenue streams, including consumer fees. We charge an annual fee of $10 for an Oink prepaid card product. It is our intention to keep the fees to the consumer as low as possible. We also expect additional revenue from our channel partners as the online gaming side of our business starts to accelerate. As part of our launch of the Oink card with Discover, Discover is paying us basis point fees for every time the cards are presented on the Discover network. While low, these fees are starting to generate revenue.
Strategic Outlook
We believe that the virtual goods market will continue to grow over the long term. Within the market, we intend to provide services to the online industry to allow them to transact with children in compliance with COPPA and similar international privacy laws. We believe that this particular opportunity is relatively untapped and expect to be a leading provider of online transactions for children.
Sustained spending on technology, our ability to raise additional financing, the continued growth of the online market, and compliance with regulatory and reporting requirements are all external conditions that may affect our ability to execute our business plan. In addition, the online payment industry is intensely competitive, and most participants have longer operating histories, significantly greater financial, technical, marketing, customer service and other resources, and greater name recognition. In addition, certain potential customers, particularly large organizations, may view our small size and limited financial resources as a negative even if they prefer our offering to those of our competitors.
Our primary strategic objectives over the next 12-18 months are to increase our user base and the engagement level of that base. We plan to achieve that by the addition of several new gaming publishers who are currently in the integration phase and by the introduction of our new prepaid card program backed by Discover. The Oink Discover card is linked to the teens Oink wallet and provides parents with the ability to provide a safe and controlled payment method for their teens on the go. The Oink app gives secure access to parents and teens on family spending and allows parents to easily add funds, monitor spending, remove and select categories and shut down a card if necessary. We are planning to market our new Discover card offering, our expanded online merchant and gaming network and affiliate marketing programs through a combination of social media programs and co-promotions with publishers merchants and other strategic partners. In addition, our new streamlined teen app was released in the third quarter of 2014 which we believe will drive additional exposure and usage for Oink. As our service grows, we intend to hire additional information technology staff to maintain our product offerings and develop new products to increase our market share.
We believe that our near-term success will depend particularly on our ability to develop customer awareness and confidence in our service. Since we have limited capital resources, we will need to closely manage our expenses and conserve our cash by continually monitoring any increase in expenses and reducing or eliminating unnecessary expenditures. Our prospects must be considered in light of the risks, expenses and difficulties encountered by companies at an early stage of development, particularly given that we operate in new and rapidly evolving markets, that we have limited financial resources, and face an uncertain economic environment. We may not be successful in addressing such risks and difficulties.
Results of Operations
Comparison of the Years Ended December 31, 2014 and 2013
The following discussion analyzes our results of operations for the years ended December 31, 2014 and 2013. The following information should be considered together with our financial statements for such periods and the accompanying notes thereto.
Revenue/Net Loss
Revenue
We have not generated significant revenue since our inception. For the years ended December 31, 2014 and 2013, we generated revenues of $5,708 and $2,456, respectively. Our volume of transactions in 2014 increased 4 times over those from 2013, but remain well below the level necessary to support our operations. As we add additional merchants and in particular, online gaming companies, we anticipate that our transaction volume will increase. Additionally, the addition of the Discover Card program in the fourth quarter of 2014 is also expected to increase our transaction volume. The Oink service is available through an iOS App, merchant or game publisher website, Android app and through the Oink.com website.
A user may access and use the service through any of these points of entry. Revenue is generated through a number of mechanisms as follows:
Transactional Revenue
A merchant or game publisher pays fees on any transactions that are driven through the Oink payment service. Oink has several live integrated online retail merchants, gaming companies and over 1,000 Facebook games in this category. The typical fees for this service are 1.5% to 3.0%. We expect to receive transactional revenue in the US, Canada and the UK.
Affiliate Revenue
This is a new category of revenue for Virtual Piggy and is currently in the US only. Oink serves up curated offers to consumers and receives a percentage fee on any transactions that occur by the consumer regardless of whether the consumer uses Oink as the payment method. The typical fees from this service are 2% to 8%. In September 2014, the Oink app v2.0 was launched which includes affiliate deals and offers. The app is free to use and a user does not have to be a member of the Oink community to access Oink deals. We encourage users to sign up for Oink so they can save offers for later use and management. To date, we have affiliate programs with over 200 retailers in the US.
Partner Referrals
In 2014, Oink has signed a number of partnerships with e-commerce platform partners and receives referral fees for any time a merchant or gaming publisher signs up with the partner. Our first revenue from this program was seen towards the end of the third quarter ended September 2014. We expect this revenue line to increase in 2015.
Card Fees
In the fourth quarter of 2014, Oink launched a prepaid card tied to a user’s Oink account. The fees consist of an annual fee and usages fees which will be paid by the card user. In addition, we receive fees from Discover for each transaction made using the Oink card.
Net Loss
Our net loss attributable to common stockholders increased $0.6 million to $16.6 million for the year ended December 31, 2014 compared to $16.0 million for the year ended December 31, 2013, as a result of decreased expenses and the change in fair value of the embedded derivative liability as further described below.
Sales and Marketing Expenses
Sales and marketing expenses decreased by $2.2 million, or 30% in 2014 to $5.1 million compared with $7.3 million in 2013. During 2014, while we increased our spending on sales and marketing staff and consultants, we decreased our spending on marketing promotions by approximately $2.1 million, as we balanced our marketing programs with our available cash resources.
Product Development
Product development expenses increased by $0.6 million, or 22% in 2014 to $3.2 million compared with $2.7 million in 2013. During 2014, we expanded the size of our product development team in the United States and Europe to develop and build our new mobile and other applications.
Integration and Customer Support
Integration and customer support expenses increased by $0.1 million, or 14% in 2014 to $0.8 million compared with $0.7 million in 2013. We have increased the size of our integration team as new merchants have been contracted to use the Oink service.
General and Administrative Expenses
General and administrative expenses increased by $0.8 million, or 18% in 2014 to $5.4 million compared with $4.6 million in 2013. During 2014, we wrote off $255,368 of capitalized patent and trademark costs, we incurred an unfavorable foreign currency translation adjustment of $165,649, we paid an amount to a former employee to settle litigation, and incurred increased costs for our office rent and for insurance, in addition to slightly higher compensation costs.
Strategic Consulting Expenses
Strategic consulting expenses decreased by $0.2 million, or 31% in 2014 to $0.5 million compared with $0.8 million in 2013. During 2014, we reduced the cash cost of strategic consultants by $687,069, offset by higher non-cash compensation for the valuation of equity awards aggregating $449,301.
Comparison of the Years Ended December 31, 2013 and 2012
The following discussion analyzes our results of operations for the years ended December 31, 2013 and 2012. The following information should be considered together with our financial statements for such periods and the accompanying notes thereto.
Revenue/Net Loss
We have not generated significant revenue since our inception. For the years ended December 31, 2013 and 2012, we generated revenues of $2,456 and $1,213, respectively.
Our net loss increased $4.0 million to $16.0 million for the year ended December 31, 2013 compared to $12.0 million for the year ended December 31, 2012, as a result of increased expenses as further described below.
Sales and Marketing Expenses
Sales and marketing expenses increased by $5.2 million, or 248% in 2013 to $7.3 million compared with $2.1 million in 2012. During 2013, we expanded the size of our sales and marketing team in the United States and built a new team in Europe to help increase our merchant base and to commence our user acquisition campaign. We commenced that campaign in March 2013 and spent approximately $2.6 million on targeted advertising and promotions. We additionally increased costs to rebrand our product to Oink and to promote our product to the target market.
Product Development
Product development expenses increased by $1.2 million, or 73% in 2013 to $2.7 million compared with $1.5 million in 2012. During 2013, we expanded the size of our product development team in the United States and built a new team in Europe to develop and build our new mobile applications. We also hired personnel in 2013 to staff our new product management function.
Integration and Customer Support
Integration and customer support expenses increased by $0.2 million, or 53% in 2013 to $0.7 million compared with $0.5 million in 2012. We added additional personnel to integrate our product with our merchants, and hired personnel to provide customer support.
General and Administrative Expenses
General and administrative expenses increased by $1.2 million, or 36% in 2013 to $4.6 million compared with $3.4 million in 2012. During 2013, we expanded our management team through the hiring of a chief financial officer and a general counsel, and added several support staff in line with the growth of the Company. Our legal and professional fees increased by approximately $325,000 in connection with our global expansion and various other initiatives. Additionally, rent and other operating costs increased overall in 2013 from the increase in our staff and the addition of our London office.
Strategic Consulting Expenses
Strategic consulting expenses decreased by $3.7 million, or 83% in 2013 to $0.8 million compared with $4.5 million in 2012. During 2012, we engaged various consultants to advise the Company and compensated them in the form of cash and stock options. During 2013, we entered into fewer of those agreements. Much of these costs are non-cash costs resulting from the valuation of stock or stock options granted. Without the non-cash compensation charge, expenses paid in cash for 2013 and 2012 were $0.7 million and $0.6 million, respectively.
Liquidity and Capital Resources
Net cash used in operating activities increased $1.8 million to $15.2 million for the year ended December 31, 2014 as compared to $13.5 million for the year ended December 31, 2013. The increase resulted primarily from expanded operations including marketing the Oink product, hiring employees and establishing the infrastructure of the Company.
Net cash used in investing activities was $0.3 million for the year ended December 31, 2014, materially unchanged from the $0.4 million for the year ended December 31, 2013. The small variance resulted from the purchase of equipment and additional costs of patents and trademark applications.
Net cash provided by financing activities increased by $7.0 million to $15.3 million for the year ended December 31, 2014 from $8.3 million for the year ended December 31, 2013. Cash provided by financing activities during the year ended December 31, 2014 consisted of our Series A Preferred Stock offering, netting $10.9 million, our Series B Preferred Stock offering netting $2.5 million and our warrant exchange offer, netting $2.7 million, offset by the re-payment of our $1.0 million bridge loan.
Subsequent to December 31, 2014, in March 2015,
the Company raised gross proceeds of $2,000,000 through the issuance of its 10% Secured Convertible Promissory Notes due March 2016, to certain accredited investors.
As we have not realized significant revenues since our inception, we have financed our operations through public and private offerings of debt and equity securities. We do not currently maintain a line of credit or term loan with any commercial bank or other financial institution.
Since our inception, we have focused on developing and implementing our business plan. We believe that our existing cash resources will not be sufficient to sustain our operations during the next twelve months.
We currently need to generate sufficient revenues to support our cost structure to enable us to pay ongoing costs and expenses as they are incurred, finance the continued development of Oink, and execute the business plan. If we cannot generate sufficient revenue to fund our business plan, we intend to seek to raise such financing through the sale of debt and/or equity securities. The issuance of additional equity would result in dilution to existing shareholders. If we are unable to obtain additional funds when they are needed or if such funds cannot be obtained on terms acceptable to us, we will be unable to execute upon the business plan or pay costs and expenses as they are incurred, which would have a material, adverse effect on our business, financial condition and results of operations.
Even if we are successful in generating sufficient revenue or in raising sufficient capital in order to complete the marketing of Oink, our ability to continue in business as a viable going concern can only be achieved when our revenues reach a level that sustains our business operations. We raised approximately $7.3 million through sales of common stock and warrants, in addition to a bridge loan, in 2013, and $14.9 million in 2014, net of repayment of the bridge loan. The Oink product was introduced to the marketplace in the third quarter of 2011 and formally launched in the U.S. in 2012. We do not project that significant revenue will be developed until later in 2015 and in 2016. There can be no assurance that we will raise sufficient proceeds, or any proceeds, for us to implement fully our proposed business plan to aggressively develop and market our Oink product. Moreover there can be no assurance that even if our Oink product is marketed effectively and we achieve our user acquisition goals, that we will generate revenues sufficient to fund our operations. In either such situation, we may not be able to continue our operations and our business might fail.
As of March 16, 2015, the Company has a cash position of approximately $1.7 million. Based upon the current cash position and the Company
’
s planned expense run rate, management believes the Company has funds currently to finance its operations through May 2015.
The foregoing forward-looking information was prepared by us in good faith based upon assumptions that we believe to be reasonable. No assurance can be given, however, regarding the attainability of the projections or the reliability of the assumptions on which they are based. The projections are subject to the uncertainties inherent in any attempt to predict the results of our operations, especially where new products and services are involved. Certain of the assumptions used will inevitably not materialize and unanticipated events will occur. Actual results of operations are, therefore, likely to vary from the projections and such variations may be material and adverse to us. Accordingly, no assurance can be given that such results will be achieved. Moreover due to changes in technology, new product announcements, competitive pressures, system design and/or other specifications we may be required to change the current plans for our Oink products.
Off-Balance Sheet Arrangements
As of December 31, 2014, we did not have any relationships with unconsolidated entities or financial partners, such as entities often referred to as structured finance or special purpose entities, established for the purpose of facilitating off-balance sheet arrangements or other contractually narrow or limited purposes. As such, we are not materially exposed to any financing, liquidity, market or credit risk that could arise if we had engaged in such relationships.
Contractual Obligations
At December 31, 2014, the Company was obligated under various non-cancelable operating lease arrangements for property as follows:
|
2015
|
$
|
286,053
|
||
|
2016
|
191,800
|
|||
|
$
|
477,853
|
Critical Accounting Policies
Our financial statements are impacted by the accounting policies used and the estimates and assumptions made by management during their preparation. A complete summary of these policies is included in Note 1 of the Notes to Financial Statements included elsewhere herein. We have identified below the accounting policies that are of particular importance in the presentation of our financial position, results of operations and cash flows and which require the application of significant judgment by management.
Stock-based Compensation
We have adopted the fair value recognition provisions Financial Accounting Standards Board Accounting Standards Codification (“FASB ASC”) 718. In addition, the Securities and Exchange Commission issued Staff Accounting Bulletin No. 107 “
Share-Based Payment
” (“SAB 107”) in March, 2005, which provides supplemental FASB ASC 718 application guidance based on the views of the SEC. Under FASB ASC 718, compensation cost recognized includes compensation cost for all share-based payments granted beginning January 1, 2006, based on the grant date fair value estimated in accordance with the provisions of FASB ASC 718.
We have used the Black-Scholes option-pricing model to estimate the option fair values. The option-pricing model requires a number of assumptions, of which the most significant are, expected stock price volatility, the expected pre-vesting forfeiture rate and the expected option term (the amount of time from the grant date until the options are exercised or expire).
Compensation expense for unvested options granted to non-employees in previous periods is being amortized over the term of the consulting agreement.
Revenue Recognition
In accordance with Securities and Exchange Commission (“SEC”) Staff Accounting Bulletin No. 104, Revenue Recognition (Codified in FASB ASC 605), we will recognize revenue when (i) persuasive evidence of a customer or distributor arrangement exists or acceptance occurs, (ii) a retailer, distributor or wholesaler receives the goods, (iii) the price is fixed or determinable, and (iv) collectability of the sales revenues is reasonably assured. Subject to these criteria, we will generally recognize revenue from Oink and ParentMatch at the time of the sale of the associated product.
Recently Issued Accounting Pronouncements
Recently issued accounting pronouncements are discussed in Note 1 of the Notes to Financial Statements contained elsewhere in this report.
Foreign Currency Exposure
We have commenced operations internationally that are denominated in foreign currencies, primarily the British pound. We transact business in British Pounds and have insignificant international revenues but do have operating costs. Our cash flow, results of operations and certain of our intercompany balances that are exposed to foreign exchange rate fluctuations may differ from expectations and we may record gains or losses due to foreign currency fluctuations. However, we have not experienced significant fluctuations through the current date.
Interest Rate Risk
Other than our fixed rate convertible notes, we do not have any outstanding debt and are not exposed to material interest rate risk.
Investment Risk
Our cash is invested in money market accounts and is not subject to significant interest rate risk.
The financial statements required to be filed pursuant to this Item 8 are appended to this report beginning on page F-1 located immediately after the signature page.
Not applicable.
Disclosure Controls and Procedures
Our management has evaluated, under the supervision and with the participation of our Chief Executive Officer and Chief Financial Officer, the effectiveness of our disclosure controls and procedures (as defined in Rules 13a-15(e) or 15(d)-15(e) under the Exchange Act) as of the end of the period covered by this report pursuant to Rule 13a-15(b) under the Exchange Act. Based on this evaluation, our Chief Executive Officer and Chief Financial Officer concluded that, as of December 31, 2014, our disclosure controls and procedures were effective to ensure (i) that information we are required to disclose in reports that we file or submit under the Securities Exchange Act of 1934 is recorded, processed, summarized and reported within the time periods specified in the SEC’s rules and forms, and (ii) that such information is accumulated and communicated to management, including our Chief Executive Officer and Chief Financial Officer, in order to allow timely decisions regarding required disclosure.
Management’s Report on Internal Control Over Financial Reporting
Our management is responsible for establishing and maintaining adequate internal control over financial reporting as defined in Rule 13a-15(f) under the Securities Exchange Act of 1934 as amended. Internal control over financial reporting is a process designed to provide reasonable assurance regarding the reliability of financial reporting and the preparation of financial statements for external purposes in accordance with generally accepted accounting principles. Because of its inherent limitations, internal control over financial reporting may not prevent or detect misstatements. Also, projections of any evaluation of effectiveness to future periods are subject to the risk that controls may become inadequate because of changes in conditions, or that the degree of compliance with the policies or procedures may deteriorate.
Our management conducted an evaluation of the effectiveness of our internal controls over financial reporting as of December 31, 2014 using criteria established in Internal Control — Integrated Framework (1992) issued by the Committee of Sponsoring Organizations of the Treadway Commission (COSO). Our management has concluded that our internal control over financial reporting was effective as of December 31, 2014.
This annual report includes an attestation report of our registered public accounting firm regarding internal control over financial reporting.
Changes in Internal Control Over Financial Reporting
There have not been any changes in our internal control over financial reporting (as defined in Rules 13a-15(f) and 15d-15(f) under the Securities Exchange Act) that occurred during the fiscal quarter ended December 31, 2014 that have materially affected, or are reasonably likely to materially affect, our internal control over financial reporting.
On November 24, 2014, we granted to Joseph Dwyer, our Chief Financial Officer, pursuant to our 2013 Equity Incentive Plan, 2,000,000 shares of restricted common stock, which vest in three equal annual installments from the date of grant.
Reference is made to the disclosure required by Items 401, 405, 406 and 407(c)(3), (d)(4) and (d)(5) of Regulation S-K to be contained in the Registrant's definitive proxy statement to be mailed to shareholders on or prior to April 30, 2015, and to be filed with the Securities and Exchange Commission.
Reference is made to the disclosure required by Items 402 and 407(e)(4) and (e)(5) of Regulation S-K to be contained in the Registrant's definitive proxy statement to be mailed to shareholders on or prior to April 30, 2015, and to be filed with the Securities and Exchange Commission.
Reference is made to the disclosure required by Items 201(d) and 403 of Regulation S-K to be contained in the Registrant's definitive proxy statement to be mailed to shareholders on or prior to April 30, 2015, and to be filed with the Securities and Exchange Commission.
Reference is made to the disclosure required by Items 404 and 407(a) of Regulation S-K to be contained in the Registrant's definitive proxy statement to be mailed to shareholders on or prior to April 30, 2015, and to be filed with the Securities and Exchange Commission.
Reference is made to the disclosure required by Item 9(e) of Schedule 14A to be contained in the Registrant's definitive proxy statement to be mailed to shareholders on or prior to April 30, 2015, and to be filed with the Securities and Exchange Commission.
|
|
(a)
|
Audited financial statements.
|
|
|
(b)
|
The following exhibits are filed as part of this report.
|
|
Exhibit
Number
|
Description
|
|
|
3.1
|
Certificate of Incorporation (incorporated by reference to Exhibit 3.1 to the Company’s registration statement on Form S-1 (Reg. # 333-152050) filed with the Commission on July 1, 2008).
|
|
|
3.2
|
Certificate of Ownership (incorporated by reference to Exhibit 3.1 to the Company’s current report on Form 8-K filed with the Commission on August 30, 2011).
|
|
|
3.3
|
Certificate of Amendment of Certificate of Incorporation (incorporated by reference to Exhibit 3.1 to the Company’s current report on Form 8-K filed with the Commission on December 19, 2013).
|
|
|
3.4
|
Certificate of Amendment of Certificate of Incorporation (incorporated by reference to Exhibit 3.1 to the Company’s current report on Form 8-K filed with the Commission on August 20, 2014).
|
|
|
3.5
|
Amended and Restated Bylaws (incorporated by reference to Exhibit 3.1 to the Company’s current report on Form 8-K filed with the Commission on March 7, 2012).
|
|
|
3.6
|
Certificate of Designations of Preferences, Rights and Limitations of Series A Cumulative Convertible Preferred Stock (incorporated by reference to Exhibit 3.1 to the Company’s current report on Form 8-K filed with the Commission on January 29, 2014).
|
|
|
3.7
|
Certificate of Designations of Preferences, Rights and Limitations of Series B Cumulative Convertible Preferred Stock (incorporated by reference to Exhibit 3.1 to the Company’s current report on Form 8-K filed with the Commission on October 31, 2014).
|
|
|
4.1
|
Specimen Common Stock Certificate (incorporated by reference to Exhibit 4.1 to the Company’s registration statement on Form S-1/A (Reg. # 333-152050) filed with the Commission on August 13, 2008).
|
|
|
4.2
|
Form of Securities Purchase Agreement (incorporated by reference to Exhibit 10.1 to the Company’s current report on Form 8-K filed with the Commission on February 13, 2012).
|
|
|
4.3
|
Form of Warrant (incorporated by reference to Exhibit 3.1 to the Company’s current report on Form 8-K filed with the Commission on February 13, 2012).
|
|
|
4.4
|
Form of Securities Purchase Agreement (incorporated by reference to Exhibit 10.1 to the Company’s current report on Form 8-K filed with the Commission on April 3, 2013).
|
|
|
4.5
|
Form of Securities Purchase Agreement (incorporated by reference to Exhibit 10.1 to the Company’s current report on Form 8-K filed with the Commission on May 29, 2013).
|
|
|
4.6
|
Form of Warrant to Purchase Common Stock (incorporated by reference to Exhibit 10.2 to the Company’s current report on Form 8-K filed with the Commission on May 29, 2013).
|
|
|
4.7
|
Form of Note and Warrant Purchase Agreement (incorporated by reference to Exhibit 10.1 to the Company’s current report on Form 8-K filed with the Commission on December 31, 2013).
|
|
|
4.8
|
Form of Securities Purchase Agreement (incorporated by reference to Exhibit 10.1 to the Company’s current report on Form 8-K filed with the Commission on January 29, 2014).
|
|
|
4.9
|
Form of Warrant (incorporated by reference to Exhibit 10.2 to the Company’s current report on Form 8-K filed with the Commission on January 29, 2014).
|
|
4.10
|
Form of Securities Purchase Agreement (incorporated by reference to Exhibit 10.1 to the Company’s current report on Form 8-K filed with the Commission on October 31, 2014).
|
|
|
4.11
|
Form of Warrant (incorporated by reference to Exhibit 10.2 to the Company’s current report on Form 8-K filed with the Commission on October 31, 2014).
|
|
|
10.1*
|
Employment Agreement between the Company and Ernest Cimadamore (incorporated by reference to Exhibit 10.2 to the Company’s registration statement on Form S-1 (Reg. # 333-152050) filed with the Commission on July 1, 2008).
|
|
|
10.2*
|
Offer Letter, dated February 2, 2012, by and between the Company and Jo Webber (incorporated by reference to Exhibit 10.2 to the Company’s annual report on Form 10-K filed with the Commission on March 15, 2013).
|
|
|
10.3*
|
Offer Letter, dated November 26, 2012, by and between the Company and Joseph Dwyer (incorporated by reference to Exhibit 10.1 to the Company’s current report on Form 8-K filed with the Commission on November 28, 2012).
|
|
10.4*
|
Offer Letter, dated November 16, 2011, by and between the Company and Tom Keefer (incorporated by reference to Exhibit 10.2 to the Company’s annual report on Form 10-K filed with the Commission on March 15, 2013).
|
|
|
10.5*
|
2008 Equity Incentive Plan (incorporated by reference to Exhibit 4.2 to the Company’s registration statement on Form S-1 (Reg. # 333-152050) filed with the Commission on July 1, 2008).
|
|
|
10.6*
|
2013 Equity Incentive Plan (incorporated by reference to Exhibit 10.1 to the Company’s current report on Form 8-K filed with the Commission on March 8, 2013).
|
|
| 23.1** | Consent of Independent Registered Public Accounting Firm | |
|
31.1**
|
Certification of the principal executive officer of the Company, pursuant to Securities Exchange Act Rule 13a-14(a)
|
|
31.2**
|
Certification of the principal financial officer of the Company, pursuant to Securities Exchange Act Rule 13a-14(a)
|
|
|
32.1**
|
Certification pursuant to 18 U.S.C. Section 1350, as adopted pursuant to Section 906 of The Sarbanes-Oxley Act of 2002, signed by the chief executive officer of the Company
|
|
|
32.2**
|
Certification pursuant to 18 U.S.C. Section 1350, as adopted pursuant to Section 906 of The Sarbanes-Oxley Act of 2002, signed by the chief financial officer of the Company
|
|
|
101.INS**
|
XBRL Instance Document
|
|
|
101.SCH**
|
XBRL Taxonomy Extension Schema Document
|
|
|
101.CAL**
|
XBRL Taxonomy Extension Calculation Linkbase Document
|
|
|
101.DEF**
|
XBRL Taxonomy Extension Definition Linkbase Document
|
|
|
101.LAB**
|
XBRL Taxonomy Extension Label Linkbase
|
|
|
101.PRE**
|
XBRL Taxonomy Extension Presentation Linkbase Document
|
* Management contract or compensatory plan or arrangement
**filed herewith
SIGNATURES
Pursuant to the requirements of Section 13 or 15(d) of the Securities Exchange Act of 1934, the Registrant has duly caused this Report to be signed on its behalf by the undersigned, thereunto duly authorized, on this 16th day of March, 2015.
|
Virtual Piggy, Inc.
|
|||
|
By:
|
/s/ Jo Webber
|
||
|
Jo Webber
,
Chairman of the Board, Chief
Executive Officer and Principal Executive
Officer
|
|||
|
/s/ Joseph Dwyer
|
|||
|
Chief Financial Officer and
Principal Accounting Officer
|
|||
Pursuant to the requirements of the Securities Exchange Act of 1934, this Report on Form 10-K has been signed below by the following persons on behalf of the Registrant and in the capacities and on the dates indicated:
|
Signature
|
Title
|
Date
|
||
|
/s/ Jo Webber
|
Chairman of the Board, Chief Executive Officer and
Director
|
March 16, 2015
|
||
|
Jo Webber
|
||||
|
/s/ Ernest Cimadamore
|
Secretary and Director
|
March 16, 2015
|
||
|
Ernest Cimadamore
|
||||
|
/s/ Joseph Dwyer
|
Chief Financial Officer and Principal Accounting Officer
|
March 16, 2015
|
||
|
Joseph Dwyer
|
||||
|
/s/ Kirk Bradley
|
Director
|
March 16, 2015
|
||
|
Kirk Bradley
|
||||
|
/s/ George O. McDaniel
|
Director
|
March 16, 2015
|
||
|
George O. McDaniel
|
|
/s/William J. Tobia
|
Director
|
March 16, 2015
|
||
|
William J. Tobia
|
|
/s/Darr Aley
|
Director
|
March 16, 2015
|
||
|
Darr Aley
|
Virtual Piggy, Inc.
|
PAGE
|
||
|
F-2
|
||
|
F-3
|
||
|
F-4
|
||
|
F-5
|
||
|
F-6
|
||
|
F-7
|
||
|
F-8 to F-23
|
||
To the Board of Directors and
Stockholders of Virtual Piggy, Inc.
We have audited the accompanying balance sheets of Virtual Piggy, Inc. as of December 31, 2014 and 2013, and the related statements of operations, comprehensive loss, stockholders’ equity (deficit), and cash flows for each of the three years in the period ended December 31, 2014. We also have audited Virtual Piggy, Inc.’s internal control over financial reporting as of December 31, 2014, based on criteria established in
Internal Control—Integrated Framework (1992)
issued by the Committee of Sponsoring Organizations of the Treadway Commission (COSO). Virtual Piggy, Inc.’s management is responsible for these financial statements, for maintaining effective internal control over financial reporting, and for its assessment of the effectiveness of internal control over financial reporting, included in the accompanying Management’s Report on Internal Control Over Financial Reporting. Our responsibility is to express an opinion on these financial statements and an opinion on the company’s internal control over financial reporting based on our audits.
We conducted our audits in accordance with the standards of the Public Company Accounting Oversight Board (United States). Those standards require that we plan and perform the audits to obtain reasonable assurance about whether the financial statements are free of material misstatement and whether effective internal control over financial reporting was maintained in all material respects. Our audits of the financial statements included examining, on a test basis, evidence supporting the amounts and disclosures in the financial statements, assessing the accounting principles used and significant estimates made by management, and evaluating the overall financial statement presentation. Our audit of internal control over financial reporting included obtaining an understanding of internal control over financial reporting, assessing the risk that a material weakness exists, and testing and evaluating the design and operating effectiveness of internal control based on the assessed risk. Our audits also included performing such other procedures as we considered necessary in the circumstances. We believe that our audits provide a reasonable basis for our opinions.
A company’s internal control over financial reporting is a process designed to provide reasonable assurance regarding the reliability of financial reporting and the preparation of financial statements for external purposes in accordance with generally accepted accounting principles. A company’s internal control over financial reporting includes those policies and procedures that (1) pertain to the maintenance of records that, in reasonable detail, accurately and fairly reflect the transactions and dispositions of the assets of the company; (2) provide reasonable assurance that transactions are recorded as necessary to permit preparation of financial statements in accordance with generally accepted accounting principles, and that receipts and expenditures of the company are being made only in accordance with authorizations of management and directors of the company; and (3) provide reasonable assurance regarding prevention or timely detection of unauthorized acquisition, use, or disposition of the company’s assets that could have a material effect on the financial statements.
Because of its inherent limitations, internal control over financial reporting may not prevent or detect misstatements. Also, projections of any evaluation of effectiveness to future periods are subject to the risk that controls may become inadequate because of changes in conditions, or that the degree of compliance with the policies or procedures may deteriorate.
In our opinion, the financial statements referred to above present fairly, in all material respects, the financial position of Virtual Piggy, Inc. as of December 31, 2014 and 2013, and the results of its operations and its cash flows for each of the three years in the period ended December 31, 2014, in conformity with accounting principles generally accepted in the United States of America. Also in our opinion, Virtual Piggy, Inc. maintained, in all material respects, effective internal control over financial reporting as of December 31, 2014, based on criteria established in
Internal Control—Integrated Framework (1992)
issued by COSO.
The accompanying financial statements have been prepared assuming that the Company will continue as a going concern. As discussed in Note 2 to the financial statements, the Company's losses from development stage activities raise substantial doubt about its ability to continue as a going concern. The financial statements do not include any adjustments that might result from the outcome of this uncertainty.
/s/ Morison Cogen LLP
Bala Cynwyd, PA
March
16
, 2015
Virtual Piggy, Inc.
|
December 31,
|
||||||||
|
2014
|
2013
|
|||||||
|
ASSETS
|
||||||||
|
CURRENT ASSETS
|
||||||||
|
Cash and cash equivalents
|
$ | 1,652,392 | $ | 1,752,461 | ||||
|
Accounts receivable
|
7,607 | 1,000 | ||||||
|
Prepaid expenses
|
591,929 | 225,233 | ||||||
|
TOTAL CURRENT ASSETS
|
2,251,928 | 1,978,694 | ||||||
|
PROPERTY AND EQUIPMENT
|
||||||||
|
Computer equipment
|
109,978 | 89,021 | ||||||
|
Furniture and fixtures
|
79,634 | 57,238 | ||||||
|
Leasehold improvements
|
81,659 | - | ||||||
| 271,271 | 146,259 | |||||||
|
Less: accumulated depreciation
|
(91,742 | ) | (41,544 | ) | ||||
| 179,529 | 104,715 | |||||||
|
OTHER ASSETS
|
||||||||
|
Deposit
|
46,483 | 118,118 | ||||||
|
Patents and trademarks, net of accumulated
|
||||||||
|
amortization of $75,292 and $42,129
|
636,230 | 739,657 | ||||||
| 682,713 | 857,775 | |||||||
|
TOTAL ASSETS
|
$ | 3,114,170 | $ | 2,941,184 | ||||
|
LIABILITIES AND STOCKHOLDERS' EQUITY
|
||||||||
|
CURRENT LIABILITIES
|
||||||||
|
Accounts payable and accrued expenses
|
$ | 829,372 | $ | 2,149,681 | ||||
|
Deferred revenue
|
2,685 | - | ||||||
|
Preferred stock dividend liability
|
723,649 | - | ||||||
|
Notes payable, net of discount of $0 and $86,087
|
- | 913,913 | ||||||
|
TOTAL CURRENT LIABILITIES
|
1,555,706 | 3,063,594 | ||||||
|
CONTINGENCIES
|
||||||||
|
STOCKHOLDERS' EQUITY (DEFICIT)
|
||||||||
|
Preferred stock, $.0001 par value; 2,000,000 preferred shares
|
||||||||
|
authorized; 195,000 preferred shares Series A authorized; 108,600 shares
|
||||||||
|
issued and outstanding at December 31, 2014 and none issued and
|
||||||||
|
outstanding at December 31, 2013
|
11 | - | ||||||
|
Preferred stock, $.0001 par value; 2,000,000 preferred shares
|
||||||||
|
authorized; 222,222 preferred shares Series B authorized; 28,378 shares
|
||||||||
|
issued and outstanding at December 31, 2014 and none issued and
|
||||||||
|
outstanding at December 31, 2013
|
3 | - | ||||||
|
Common stock, $ .0001 par value; 230,000,000 shares authorized;
|
||||||||
|
119,117,626 and 111,396,768 shares issued and outstanding at
|
||||||||
|
December 31, 2014 and December 31, 2013
|
11,912 | 11,140 | ||||||
|
Additional paid in capital
|
53,458,324 | 35,318,751 | ||||||
|
Accumulated deficit
|
(52,060,191 | ) | (35,450,446 | ) | ||||
|
Cumulative translation adjustment
|
148,405 | (1,855 | ) | |||||
|
STOCKHOLDERS' EQUITY (DEFICIT)
|
1,558,464 | (122,410 | ) | |||||
|
TOTAL LIABILITIES AND STOCKHOLDERS' EQUITY
|
$ | 3,114,170 | $ | 2,941,184 | ||||
The accompanying notes are an integral part of these financial statements.
Virtual Piggy, Inc.
For the Years Ended December 31, 2014, 2013 and 2012
|
For the Years Ended
|
||||||||||||
|
Ended December 31,
|
||||||||||||
|
2014
|
2013
|
2012
|
||||||||||
|
SALES
|
$ | 5,708 | $ | 2,456 | $ | 1,213 | ||||||
|
OPERATING EXPENSES
|
||||||||||||
|
Sales and marketing
|
5,096,034 | 7,275,815 | 2,092,551 | |||||||||
|
Product development
|
3,257,279 | 2,650,600 | 1,530,348 | |||||||||
|
Integration and customer support
|
815,083 | 712,351 | 465,277 | |||||||||
|
General and administrative
|
5,378,644 | 4,567,436 | 3,368,675 | |||||||||
|
Strategic consulting
|
539,208 | 776,975 | 4,499,232 | |||||||||
|
Total operating expenses
|
15,086,248 | 15,983,177 | 11,956,083 | |||||||||
|
NET OPERATING LOSS
|
(15,080,540 | ) | (15,980,721 | ) | (11,954,870 | ) | ||||||
|
OTHER INCOME (EXPENSE)
|
||||||||||||
|
Interest income
|
6,602 | 10,731 | 5,704 | |||||||||
|
Interest expense
|
(94,566 | ) | (6,382 | ) | (90,560 | ) | ||||||
|
Change in fair value of embedded derivative liability
|
5,513,666 | - | - | |||||||||
| 5,425,702 | 4,349 | (84,856 | ) | |||||||||
|
NET LOSS
|
(9,654,838 | ) | (15,976,372 | ) | (12,039,726 | ) | ||||||
|
Less: Deemed dividend distributions
|
(6,231,260 | ) | - | - | ||||||||
|
Less: Accrued preferred dividends
|
(723,649 | ) | - | - | ||||||||
|
NET LOSS ATTRIBUTABLE TO COMMON STOCKHOLDERS
|
$ | (16,609,747 | ) | $ | (15,976,372 | ) | $ | (12,039,726 | ) | |||
|
BASIC AND DILUTED NET LOSS PER
|
||||||||||||
|
COMMON SHARE
|
$ | (0.14 | ) | $ | (0.15 | ) | $ | (0.14 | ) | |||
|
BASIC AND DILUTED WEIGHTED AVERAGE
|
||||||||||||
|
COMMON SHARES OUTSTANDING
|
116,690,412 | 107,704,996 | 85,325,709 | |||||||||
The accompanying notes are an integral part of these financial statements.
Virtual Piggy, Inc.
For the Years Ended December 31, 2014, 2013 and 2012
|
For the years ended
|
||||||||||||
|
Ended December 31,
|
||||||||||||
|
2014
|
2013
|
2012
|
||||||||||
|
NET LOSS
|
$ | (9,654,838 | ) | $ | (15,976,372 | ) | $ | (12,039,726 | ) | |||
|
OTHER COMPREHENSIVE INCOME
|
||||||||||||
|
Foreign Currency Translation Adjustments, net of tax
|
150,260 | (1,855 | ) | - | ||||||||
|
TOTAL OTHER COMPREHENSIVE INCOME, net of tax
|
150,260 | (1,855 | ) | - | ||||||||
|
COMPREHENSIVE LOSS
|
$ | (9,504,578 | ) | $ | (15,978,227 | ) | $ | (12,039,726 | ) | |||
The accompanying notes are an integral part of these financial statements.
Virtual Piggy, Inc.
For the two years ended December 31, 2014
|
Preferred
|
Preferred
|
Common
|
||||||||||||||||||||||||||||||||||||||||||||||
|
Stock Series A
|
Stock Series B
|
Stock
|
Common Stock
|
Additional
|
Cumulative
|
|||||||||||||||||||||||||||||||||||||||||||
|
Number of
|
Number of
|
Number of
|
Common Stock
|
Subscription
|
Paid-In
|
Accumulated
|
Translation
|
|||||||||||||||||||||||||||||||||||||||||
|
Shares
|
Amount
|
Shares
|
Amount
|
Shares
|
Amount
|
Subscribed
|
Receivable
|
Capital
|
Deficit
|
Adjustment
|
Total
|
|||||||||||||||||||||||||||||||||||||
|
Balance at December 31, 2011
|
- | $ | - | - | $ | - | 66,871,422 | $ | 6,687 | $ | - | $ | - | $ | 7,065,247 | $ | (7,434,348 | ) | $ | - | $ | (362,414 | ) | |||||||||||||||||||||||||
|
Issuance of shares of common stock and warrants through private placement at $.70 per unit
|
- | - | - | - | 20,426,948 | 2,044 | - | - | 7,084,888 | - | - | 7,086,932 | ||||||||||||||||||||||||||||||||||||
|
Issuance of shares of common stock and warrants through private placement at $.80 per unit
|
- | - | - | - | 2,625,000 | 262 | - | - | 1,049,738 | - | - | 1,050,000 | ||||||||||||||||||||||||||||||||||||
|
Issuances of shares of common stock for services
|
- | - | - | - | 1,363,185 | 136 | - | - | 3,312,401 | - | - | 3,312,537 | ||||||||||||||||||||||||||||||||||||
|
Issuances of shares of commons stock to discharge notes payable and interest at $.70 per unit
|
- | - | - | - | 571,428 | 57 | - | - | 199,943 | - | - | 200,000 | ||||||||||||||||||||||||||||||||||||
|
Issuance of shares of common stock with respect to settlement agreement valued at $.85 per share
|
- | - | - | - | 350,000 | 35 | - | - | 297,465 | - | - | 297,500 | ||||||||||||||||||||||||||||||||||||
|
Issuance of shares of common stock through private placement at $.70 per share
|
- | - | - | - | 7,942,858 | 794 | - | - | 5,559,206 | - | - | 5,560,000 | ||||||||||||||||||||||||||||||||||||
|
Issuance of shares of common stock through private placement at $.75 per share
|
- | - | - | - | 666,667 | 67 | - | - | 499,933 | - | - | 500,000 | ||||||||||||||||||||||||||||||||||||
|
Exercise of stock options
|
- | - | - | - | 600,000 | 60 | - | - | 23,940 | - | - | 24,000 | ||||||||||||||||||||||||||||||||||||
|
Issuance of equity for services
|
- | - | - | - | - | - | - | - | 1,235,353 | - | - | 1,235,353 | ||||||||||||||||||||||||||||||||||||
|
Stock issuance costs
|
- | - | - | - | - | - | - | - | (28,000 | ) | - | - | (28,000 | ) | ||||||||||||||||||||||||||||||||||
|
Common stock subscription for 62,500 units through private placement at $.80 per unit
|
- | - | - | - | - | - | 50,000 | (50,000 | ) | - | - | - | - | |||||||||||||||||||||||||||||||||||
|
Net loss
|
- | - | - | - | - | - | - | - | - | (12,039,726 | ) | - | (12,039,726 | ) | ||||||||||||||||||||||||||||||||||
|
Balance December 31, 2012
|
- | - | - | - | 101,417,508 | 10,142 | 50,000 | (50,000 | ) | 26,300,114 | (19,474,074 | ) | - | 6,836,182 | ||||||||||||||||||||||||||||||||||
|
Issuance of shares of common stock and 93,750 warrants through private placement at $.80 per unit
|
- | - | - | - | 125,000 | 13 | - | - | 49,987 | - | - | 50,000 | ||||||||||||||||||||||||||||||||||||
|
Issuance of shares of common stock through a private placement at $0.75 per share
|
- | - | - | - | 1,133,334 | 113 | - | - | 849,887 | - | - | 850,000 | ||||||||||||||||||||||||||||||||||||
|
Issuance of shares of common stock and 1,436,277 warrants through a private placement at $1.80 per share
|
- | - | - | - | 2,872,553 | 287 | - | - | 5,170,308 | - | - | 5,170,595 | ||||||||||||||||||||||||||||||||||||
|
Common stock subscription for 62,500 units through private placement at $.80 per unit
|
- | - | - | - | - | - | (50,000 | ) | 50,000 | - | - | - | - | |||||||||||||||||||||||||||||||||||
|
Stock issuance costs
|
- | - | - | - | - | - | - | - | (395,221 | ) | - | - | (395,221 | ) | ||||||||||||||||||||||||||||||||||
|
Fair value of warrants issued with notes payable
|
- | - | - | - | - | - | - | - | 92,469 | - | - | 92,469 | ||||||||||||||||||||||||||||||||||||
|
Exercise of stock options
|
- | - | - | - | 1,116,667 | 112 | - | - | 184,888 | - | - | 185,000 | ||||||||||||||||||||||||||||||||||||
|
Exercise of warrants
|
- | - | - | - | 4,705,185 | 470 | - | - | 1,432,123 | - | - | 1,432,593 | ||||||||||||||||||||||||||||||||||||
|
Issuance of equity for services
|
- | - | - | - | 26,521 | 3 | - | - | 1,626,457 | - | - | 1,626,460 | ||||||||||||||||||||||||||||||||||||
|
Revaluation of options and warrants
|
- | - | - | - | - | - | - | - | 7,739 | - | - | 7,739 | ||||||||||||||||||||||||||||||||||||
|
Net loss
|
- | - | - | - | - | - | - | - | - | (15,976,372 | ) | - | (15,976,372 | ) | ||||||||||||||||||||||||||||||||||
|
Cumulative translation adjustment
|
- | - | - | - | - | - | - | - | - | - | (1,855 | ) | (1,855 | ) | ||||||||||||||||||||||||||||||||||
|
Balance December 31, 2013
|
- | - | - | - | 111,396,768 | 11,140 | - | - | 35,318,751 | (35,450,446 | ) | (1,855 | ) | (122,410 | ) | |||||||||||||||||||||||||||||||||
|
Issuance of shares of convertible preferred stock and 10,860,000 warrants through private placement at $100 per unit
|
108,600 | 11 | - | - | - | - | - | - | 5,722,164 | - | - | 5,722,175 | ||||||||||||||||||||||||||||||||||||
|
Issuance of shares of convertible preferred stock and 28,378 warrants through private placement at $90 per unit
|
- | - | 28,378 | 3 | - | - | - | - | 2,178,176 | - | - | 2,178,179 | ||||||||||||||||||||||||||||||||||||
|
Issuance of shares of common stock from exercise of warrants through warrant exchange offering at $.50 per share
|
- | - | - | - | 5,042,287 | 504 | - | - | 2,520,600 | - | - | 2,521,104 | ||||||||||||||||||||||||||||||||||||
|
Issuance of shares of common stock at $0.70 replacing warrants
|
- | - | - | - | 2,000,000 | 200 | - | - | 48,384 | - | - | 48,584 | ||||||||||||||||||||||||||||||||||||
|
Exercise of stock options
|
- | - | - | - | 100,000 | 10 | - | - | 74,990 | - | - | 75,000 | ||||||||||||||||||||||||||||||||||||
|
Exercise of warrants
|
- | - | - | - | 278,571 | 28 | - | - | 139,258 | - | - | 139,286 | ||||||||||||||||||||||||||||||||||||
|
Revaluation of options and warrants
|
- | - | - | - | - | - | - | - | 136,663 | - | - | 136,663 | ||||||||||||||||||||||||||||||||||||
|
Issuance of equity for services
|
- | - | - | - | 300,000 | 30 | - | - | 1,286,274 | - | - | 1,286,304 | ||||||||||||||||||||||||||||||||||||
|
Deemed dividend distribution in conjunction with Preferred Series A offering
|
- | - | - | - | - | - | - | - | 5,137,825 | (5,137,825 | ) | - | - | |||||||||||||||||||||||||||||||||||
|
Deemed dividend distribution in conjunction with warrant exchange offering
|
- | - | - | - | - | - | - | - | 717,594 | (717,594 | ) | - | - | |||||||||||||||||||||||||||||||||||
|
Deemed dividend distribution in conjunction with Preferred Series B offering
|
- | - | - | - | - | - | - | - | 375,841 | (375,841 | ) | - | - | |||||||||||||||||||||||||||||||||||
|
Stock issuance costs
|
- | - | - | - | - | - | - | - | (198,196 | ) | - | - | (198,196 | ) | ||||||||||||||||||||||||||||||||||
|
Accrued preferred dividend
|
- | - | - | - | - | - | - | - | - | (723,647 | ) | - | (723,647 | ) | ||||||||||||||||||||||||||||||||||
|
Net loss
|
- | - | - | - | - | - | - | - | (9,654,838 | ) | - | (9,654,838 | ) | |||||||||||||||||||||||||||||||||||
|
Cumulative translation adjustment
|
- | - | - | - | - | - | - | - | - | - | 150,260 | 150,260 | ||||||||||||||||||||||||||||||||||||
|
Balance December 31, 2014
|
108,600 | $ | 11 | 28,378 | $ | 3 | 119,117,626 | $ | 11,912 | $ | - | $ | - | $ | 53,458,324 | $ | (52,060,191 | ) | $ | 148,405 | $ | 1,558,464 | ||||||||||||||||||||||||||
The accompanying notes are an integral part of these financial statements.
Virtual Piggy, Inc.
For the Years Ended December 31, 2014, 2013 and 2012
|
Year Ended December 31,
|
||||||||||||
|
2014
|
2013
|
2012
|
||||||||||
|
CASH FLOWS FROM OPERATING ACTIVITIES
|
||||||||||||
|
Net loss
|
$ | (9,654,838 | ) | $ | (15,976,372 | ) | $ | (12,039,726 | ) | |||
|
Adjustments to reconcile net loss to net cash
|
||||||||||||
|
used in operating activities
|
||||||||||||
|
Fair value of warrants issued in exchange for services
|
- | 549,915 | - | |||||||||
|
Fair value of options issued in exchange for services
|
905,504 | 1,035,213 | 1,235,353 | |||||||||
|
Fair value of stock issued in exchange for services
|
429,384 | 49,071 | 3,312,537 | |||||||||
|
Revaluation of options and warrants
|
136,663 | - | - | |||||||||
|
Change in fair value of embedded derivative liability
|
(5,513,666 | ) | - | - | ||||||||
|
Accretion of discount on notes payable
|
86,087 | 6,383 | 65,560 | |||||||||
|
Depreciation and amortization
|
100,013 | 56,641 | 25,392 | |||||||||
|
Loss on abandonment of patents and disposal of fixed assets
|
284,889 | 6,107 | 2,726 | |||||||||
|
(Increase) decrease in assets
|
||||||||||||
|
Accounts receivable
|
(6,607 | ) | (947 | ) | 2,447 | |||||||
|
Prepaid expenses
|
(366,696 | ) | (129,733 | ) | (93,735 | ) | ||||||
|
Deposits
|
71,635 | (53,118 | ) | (62,333 | ) | |||||||
|
Increase (decrease) in liabilities
|
||||||||||||
|
Accounts payable, accrued expenses and litigation settlement
|
(1,320,309 | ) | 995,079 | 1,118,589 | ||||||||
|
Deferred revenue
|
2,685 | - | - | |||||||||
|
Net cash used in operating activities
|
(14,845,256 | ) | (13,461,761 | ) | (6,433,190 | ) | ||||||
|
CASH FLOWS FROM INVESTING ACTIVITIES
|
||||||||||||
|
Purchase of equipment
|
(164,341 | ) | (42,313 | ) | (103,326 | ) | ||||||
|
Patent and trademark costs
|
(191,948 | ) | (405,612 | ) | (296,539 | ) | ||||||
|
Net cash used in investing activities
|
(356,289 | ) | (447,925 | ) | (399,865 | ) | ||||||
|
CASH FLOWS FROM FINANCING ACTIVITIES
|
||||||||||||
|
Proceeds from note payable - stockholders
|
- | 1,000,000 | - | |||||||||
|
Repayment of note payable - stockholders
|
(1,000,000 | ) | - | (175,000 | ) | |||||||
|
Proceeds from issuance of preferred stock and warrants
|
13,414,020 | - | - | |||||||||
|
Proceeds from issuance of common stock
|
- | 6,070,595 | 14,196,932 | |||||||||
|
Proceeds from exercise of options
|
75,000 | 185,000 | 24,000 | |||||||||
|
Proceeds from exercise of warrants
|
2,660,390 | 1,432,592 | - | |||||||||
|
Stock issuance costs
|
(198,194 | ) | (395,221 | ) | (28,000 | ) | ||||||
|
Net cash provided by financing activities
|
14,951,216 | 8,292,966 | 14,017,932 | |||||||||
|
EFFECT OF EXCHANGE RATE ON CASH
|
150,260 | (1,855 | ) | - | ||||||||
|
NET INCREASE (DECREASE) IN CASH AND
|
||||||||||||
|
CASH EQUIVALENTS
|
(100,069 | ) | (5,618,575 | ) | 7,184,877 | |||||||
|
CASH AND CASH EQUIVALENTS - BEGINNING OF PERIOD
|
1,752,461 | 7,371,036 | 186,159 | |||||||||
|
CASH AND CASH EQUIVALENTS - END OF PERIOD
|
$ | 1,652,392 | $ | 1,752,461 | $ | 7,371,036 | ||||||
|
SUPPLEMENTAL SCHEDULE OF NON-CASH FINANCING ACTIVITIES:
|
||||||||||||
|
Interest paid
|
$ | 8,478 | $ | - | $ | - | ||||||
|
Fair value of beneficial conversion value as discount against Preferred Stock
|
$ | 5,513,666 | $ | - | $ | - | ||||||
|
Fair value of warrant liability as discount against Preferred Stock
|
$ | 5,513,666 | $ | - | $ | - | ||||||
|
Accretion of discount on preferred stock as deemed distribution
|
$ | 5,513,666 | $ | - | $ | - | ||||||
|
Deemed dividend distribution in conjunction with warrant exchange
|
$ | 717,594 | $ | - | $ | - | ||||||
|
Accrued preferred dividend
|
$ | 723,649 | $ | - | $ | - | ||||||
|
Conversion of notes payable and accrued interest into common stock
|
$ | - | $ | - | $ | 200,000 | ||||||
|
Fair value of warrants issued as discount for note payable
|
$ | - | $ | 92,470 | $ | - | ||||||
|
Common stock subscription
|
$ | - | $ | - | $ | 50,000 | ||||||
|
Issuance of common stock for settlement of payable
|
$ | - | $ | - | $ | 297,500 | ||||||
The accompanying notes are an integral part of these financial statements.
Virtual Piggy, Inc.
Nature of the Business
Virtual Piggy, Inc. (the “Company”) was incorporated in the state of Delaware on February 11, 2008. Virtual Piggy is a technology company that delivers an online ecommerce solution for the family. Its system allows parents and their children to manage, allocate funds and track their expenditures, savings and charitable giving online. Its system is designed to allow the child to transact online without a credit card by gaining the parent’s permission ahead of time and allowing the parent to set up the rules of use and authorized spending limits. The Company’s principal office is located in Hermosa Beach, California and in 2013 the Company opened an office in London, England to support the sales and marketing efforts in Europe and the development of our mobile applications.
Virtual Piggy’s technology, branded as “Oink,” enables online businesses to interact and transact with the “Under 18” market in a manner consistent with the Children’s Online Privacy Protection Act (“COPPA”) and other similar international children’s privacy laws. Oink was launched in the US in 2012 and in the European market in 2013, and now has the capability to offer and deliver gift cards.
The Company secures agreements with merchants, retail and gaming e-commerce platforms and payment processors, which allows it to offer its Oink service to its user base. Over 20 retailers and gaming companies are using Oink with their e-commerce systems and the Company is in the process of integrating the other signed retailers and gaming companies. The Company is continuing to add merchants which provides more opportunities for its registered systems users to purchase products online.
Basis of Presentation
The accompanying financial statements are presented in accordance with accounting principles generally accepted in the United States of America.
The Company’s activities are subject to significant risks and uncertainties, including failing to secure additional funding to operationalize the Company’s current technology before another company develops similar technology to compete with the Company.
Use of Estimates
The preparation of financial statements in conformity with accounting principles generally accepted in the United States requires management to make estimates and assumptions that affect the reported amounts of assets and liabilities and disclosure of contingent assets and liabilities at the date of the financial statements and the reported amounts of revenues and expenses during the reporting period. Actual results could differ from these estimates.
Comprehensive Income
The Company follows Financial Accounting Standards Board Accounting Standards Codification (“FASB ASC”) 220 in reporting comprehensive income. Comprehensive income is a more inclusive financial reporting methodology that includes disclosure of certain financial information that historically has not been recognized in the calculation of net income. The Company has one item of other comprehensive income, consisting of a foreign translation adjustment.
Fair Value of Financial Instruments
The Company’s financial instruments consist of accounts receivable, accounts payable and accrued expenses. The carrying value of accounts receivable, accounts payable and accrued expenses approximate their fair value because of their short maturities.
Virtual Piggy, Inc.
Notes to the Financial Statements
The Company follows FASB ASC 820,
Fair Value Measurements and Disclosures
, and applies it to all assets and liabilities that are being measured and reported on a fair value basis. The statement requires that assets and liabilities carried at fair value will be classified and disclosed in one of the following three categories:
Level 1: Quoted market prices in active markets for identical assets or liabilities
Level 2: Observable market based inputs or unobservable inputs that are corroborated by market data
Level 3: Unobservable inputs that are not corroborated by market data
The level in the fair value hierarchy within which a fair value measurement falls is based on the lowest level input that is significant to the fair value measurement in its entirety.
Foreign Currency Translation
The functional currency of operations outside the U.S. is British Pounds.
Concentration of Credit Risk Involving Cash
The Company may have deposits with a financial institution which at times exceed Federal Deposit Insurance Corporation (“FDIC”) coverage. The Company has not experienced any losses from maintaining cash accounts in excess of federally insured limits.
Cash and Cash Equivalents
For purposes of reporting cash flows, the Company considers all cash accounts, which are not subject to withdrawal restrictions or penalties, and certificates of deposit and commercial paper with original maturities of 90 days or less to be cash or cash equivalents.
Property and Equipment
Property, equipment and leasehold improvements are stated at cost. Depreciation is computed using the straight-line method over the estimated useful lives of the assets. Maintenance and repairs of property are charged to operations, and major improvements are capitalized. Upon retirement, sale, or other disposition of property and equipment, the costs and accumulated depreciation are eliminated from the accounts, and any resulting gain or loss is included in operations. The cost of leasehold improvements is amortized over the lesser length of the related leases or the estimated useful lives of the assets. Depreciation of property and equipment was $60,006, $28,190 and $13,336 for the years ended December 31, 2014, 2013 and 2012 and is included in general and administrative expenses.
The Company’s depreciation and amortization policies on property and equipment are as follows:
|
Useful life
|
|||
|
(in years)
|
|||
|
Computer equipment
|
3 - 5
|
||
|
Furniture and fixtures
|
7
|
||
|
Leasehold improvements
|
Term of lease
|
Patents and Trademarks
The Company has three issued patents with the United States Patent and Trademark Office (“USPTO”), entitled “System and Method for Verifying the Age of an Internet User,” “System and Method for Virtual Piggy Bank Wish-List,” and “System and Method for Virtual Piggy Bank.” The Company has filed for one provisional U.S. patent application, as well as twelve non-provisional U.S. patent applications, four of which are pending, three of which have been allowed, and five of which have been abandoned. Additionally, the Company has been granted two patents in Germany, entitled “Virtual Piggy Bank” and “Parent Match.” The Company also has patents pending in Australia, Brazil, Canada (“Parent Match” has been allowed), Europe, and the Republic of Korea under the Patent Cooperation Treaty (“PCT”). Costs associated with the registration and legal defense of the patents have been capitalized and are amortized on a straight-line basis over the estimated lives of the patents.
Virtual Piggy, Inc.
Notes to the Financial Statements
Long-Lived Assets
The Company evaluates the recoverability of its long-lived assets in accordance with FASB ASC 360 “Property, Plant, and Equipment.” The Company reviews long-lived assets for impairment whenever events or changes in circumstances indicate that the carrying amount of an asset may not be recoverable. Recoverability of long-lived assets are measured by a comparison of the carrying amount of an asset to future cash flows expected to be generated by the asset, undiscounted and without interest or independent appraisals. If such assets are considered to be impaired, the impairment to be recognized is measured by the amount by which the carrying amount of the asset exceeds the fair value of the assets.
Revenue Recognition
In accordance with Securities and Exchange Commission (“SEC”) Staff Accounting Bulletin (“SAB”) No. 104,
Revenue Recognition
(Codified in FASB ASC 605), the Company will recognize revenue when (i) persuasive evidence of a customer or distributor arrangement exists or acceptance occurs, (ii) a retailer, distributor or wholesaler receives the goods, (iii) the price is fixed or determinable, and (iv) collectability of the sales revenues is reasonably assured. Subject to these criteria, the Company will generally recognize revenue at the time of the sale of the associated product.
Income Taxes
The Company follows FASB ASC 740 when accounting for income taxes, which requires an asset and liability approach to financial accounting and reporting for income taxes. Deferred income tax assets and liabilities are computed annually for temporary differences between the financial statements and tax bases of assets and liabilities that will result in taxable or deductible amounts in the future based on enacted tax laws and rates applicable to the periods in which the differences are expected to affect taxable income. Valuation allowances are established when necessary to reduce deferred tax assets to the amount expected to be realized. Income tax expense is the tax payable or refundable for the period plus or minus the change during the period in deferred tax assets and liabilities. Tax years from 2011 through 2014 remain subject to examination by major tax jurisdictions.
Stock-based Payments
The Company accounts for stock-based compensation under the provisions of FASB ASC 718,
Compensation—Stock Compensation
which requires the measurement and recognition of compensation expense for all stock-based awards made to employees and directors based on estimated fair values on the grant date. The Company estimates the fair value of stock-based awards on the date of grant using the Black-Scholes model. The value of the portion of the award that is ultimately expected to vest is recognized as expense over the requisite service periods using the straight-line method. The Company accounts for stock-based compensation awards to non-employees in accordance with FASB ASC 505 -50, Equity-Based Payments to Non-Employees (“ASC 505-50”). Under ASC 505-50, the Company determines the fair value of the warrants or stock-based compensation awards granted as either the fair value of the consideration received or the fair value of the equity instruments issued, whichever is more reliably measurable. All issuances of stock options or other equity instruments to non-employees as consideration for goods or services received by the Company are accounted for based on the fair value of the equity instruments issued. Any stock options issued to non-employees are recorded as an expense and additional paid-in capital in stockholders’ equity over the applicable service periods.
Advertising Costs
Advertising costs are expensed as incurred. Advertising costs were $327,483, $839,576 and $0 for the years ended December 31, 2014, 2013 and 2012, respectively. These costs are included in sales and marketing expenses.
Product Development Costs
In accordance with FASB ASC 730, research and development costs are expensed when incurred. Research and development costs were $3,257,279, $2,650,600 and $1,530,348 for the years ended December 31, 2014, 2013 and 2012, respectively.
Loss Per Share
The Company follows FASB ASC 260 when reporting Earnings Per Share resulting in the presentation of basic and diluted earnings per share. Because the Company reported a net loss for the each of three years ended December 31, 2014, common stock equivalents, including preferred stock, stock options and warrants were anti-dilutive; therefore, the amounts reported for basic and diluted loss per share were the same.
Start-up Costs
In accordance with FASB ASC 720
,
start-up costs are expensed as incurred.
Segment Information
The Company is organized and operates as one operating segment. In accordance with FASB ASC 280,
Segment Reporting
, the chief operating decision-maker has been identified as the Chief Executive Officer, who reviews operating results to make decisions about allocating resources and assessing performance for the entire Company subject to Board approval. Since the Company operates in one segment and provides one group of similar products, all financial segment and product line information required by FASB ASC 280
can be found in the consolidated financial statements.
Virtual Piggy, Inc.
Notes to the Financial Statements
Recently Adopted Accounting Pronouncements
In July 2013, the FASB issued ASU No. 2013-11,
Income Taxes (Topic 740): Presentation of an Unrecognized Tax Benefit When a Net Operating Loss Carry-forward, a Similar Tax Loss, or a Tax Credit Carry-forward Exists
. The amendment includes explicit guidance as to when an unrecognized tax benefit should be presented as a reduction to a deferred tax asset or presented as a liability. The amendments are effective for fiscal years, and interim periods within those years, beginning after December 15, 2013. The amendments should be applied prospectively to all unrecognized tax benefits that exist at the effective date. Retrospective application is permitted. Since the amendment impacts classification requirements only, the adoption on January 1, 2014 did not have a material impact on the Company’s financial position.
In June 2014, the FASB issued ASU No. 2014-10, Development Stage Entities (Topic 915), Elimination of Certain Financial Reporting Requirements, Including an Amendment to Variable Interest Entities Guidance in Topic 810, Consolidation. The amendments in this update remove the definition of a development stage entity from the Master Glossary of the Accounting Standards Codification, thereby removing the financial reporting distinction between development stage entities and other reporting entities from U.S. GAAP. In addition, the amendments eliminate the requirements for development stage entities to (1) present inception-to-date information in the statements of income, cash flows, and shareholder equity, (2) label the financial statements as those of a development stage entity, (3) disclose a description of the development stage activities in which the entity is engaged, and (4) disclose in the first year in which the entity is no longer a development stage entity that in prior years it had been in the development stage.
The amendments also clarify that the guidance in Topic 275,
Risks and Uncertainties
, is applicable to entities that have not commenced planned principal operations.
The amendments related to the elimination of inception-to-date information and the other remaining disclosure requirements of Topic 915 should be applied retrospectively except for the clarification to Topic 275, which shall be applied prospectively. For public business entities, those amendments are effective for annual reporting periods beginning after December 15, 2014, and interim periods therein.
For public business entities, the amendment eliminating the exception to the sufficiency-of-equity-at-risk criterion for development stage entities in paragraph 810-10-15-16 should be applied retrospectively for annual reporting periods beginning after December 15, 2015, and interim periods therein.
Early application of each of the amendments is permitted for any annual reporting period or interim period for which the entity’s financial statements have not yet been issued (public business entities) or made available for issuance (other entities). Upon adoption, entities will no longer present or disclose any information required by Topic 915.
The Company adopted the amendments retrospectively beginning with the interim period ended June 30, 2014.
Recently Issued Accounting Pronouncements Not Yet Adopted
In August 2014, the FASB issued ASU 2014-15,
Presentation of Financial Statements – Going Concern (Subtopic 205-40), Disclosure of Uncertainties about an Entity’s Ability to Continue as a Going Concern
. The amendments in this Update provide guidance about management’s responsibility to evaluate whether there are conditions or events, considered in the aggregate, that raise substantial doubt about the entity’s ability to continue as a going concern within one year after the date that the financial statements are issued and to provide related footnote disclosures. Substantial doubt about an entity’s ability to continue as a going concern exists when relevant conditions and events, considered in the aggregate, indicate that it is probable that the entity will be unable to meet its obligations as they become due within one year after the date that the financial statements are issued. The amendments in this Update are effective for the annual period ending after December 15, 2016, and for annual periods and interim periods thereafter. Early application is permitted.
Reclassifications
Certain amounts in the 2013 statements of operations have been reclassified in order for them to be in conformity with the 2014 presentation.
Virtual Piggy, Inc.
Notes to the Financial Statements
The accompanying financial statements have been prepared assuming that the Company will continue as a going concern. The Company has incurred significant losses and experienced negative cash flow from operations since inception. These conditions raise substantial doubt about the Company’s ability to continue as a going concern. The financial statements do not include any adjustments that might result from the outcome of this uncertainty.
Since inception, the Company has focused on developing and implementing its business plan. The Company believes that its existing cash resources will not be sufficient to sustain operations during the next twelve months.
The Company currently needs to generate revenue in order to sustain its operations. In the event that the Company cannot generate sufficient revenue to sustain its operations, the Company will need to reduce expenses or obtain financing through the sale of debt and/or equity securities. The issuance of additional equity would result in dilution to existing shareholders. If the Company is unable to obtain additional funds when they are needed or if such funds cannot be obtained on terms acceptable to the Company, the Company would likely be unable to execute upon the business plan or pay costs and expenses as they are incurred, which would have a material, adverse effect on the business, financial condition and results of operations.
The Company’s current monetization model is to derive a percentage of all revenues generated by online merchants using the Oink service. Merchants are billed at the end of each month for all transactions that have been processed by the Company on their behalf in the prior month. As the merchant base and consumer base grows, and as the trend to higher online spending levels continues, the Company expects to generate additional revenue to support operations.
As of March 16, 2015, the Company has a cash position of approximately $1.7 million. Based upon the current cash position and the Company
’
s planned expense run rate, management believes the Company has funds currently to finance its operations through May 2015.
The Company continues to apply for patents and purchased the Oink trademark in November 2013. Accordingly, costs associated with the registration of the patents have been capitalized and are amortized on a straight-line basis over the estimated lives of the patents (20 years). The trademark is also being amortized on a straight-line basis over its estimated useful life of 20 years. At December 31, 2014 and 2013, capitalized patent and trademark costs, net of accumulated amortization, were $636,230 and $739,657. Amortization expense for patents and trademarks was $40,007, $28,451 and $12,056 for the years ended December 31, 2014, 2013 and 2012.
During 2014, the Company abandoned its application for several of its patents and trademarks. Accordingly, the Company recorded a charge to general and administrative expenses for $183,592 relating to costs previously capitalized with respect to these applications.
On December 27, 2013, the Company entered into two identical agreements with two stockholders that each include a note payable in the amount of $500,000 and two-year warrants to purchase 37,500 shares of the Company’s common stock at $0.01 and two-year warrants to purchase 50,000 shares of the Company’s common stock at $1.00 per share. The notes bore interest at 10% per annum and were payable upon the earlier of:
|
a.
|
5 days after the sale of the Company’s securities in one transaction or series of related transactions, which sale resulted in gross proceeds to the Company of at least $3 million;
|
|
|
b.
|
Upon (i) the sale or other disposition of all or substantially all of the Company’s assets or (ii) the acquisition of the Company by another entity by means of any transaction or series of related transactions to which the Company is a party other than a transaction or series of transactions in which the holders of the voting securities of the Company outstanding immediately prior to such transaction continue to retain, as a result of shares in the Company held by such holders prior to such transaction, at least 50% of the total voting power represented by the voting securities of the Company or such surviving entity outstanding immediately after such transaction or series of transactions; or
|
|
|
c.
|
February 28, 2014.
|
Virtual Piggy, Inc.
Notes to the Financial Statements
The warrants were valued at $92,470, fair value, using the Black-Scholes option pricing model to calculate the grant-date fair value of the warrants, with the following assumptions: no dividend yield, expected volatility of 22.2%, risk free interest rate of .4% and expected option life of 2 years. The warrant values were treated as a discount to the value of the note payable in accordance with FASB ASC 835-30-25,
Recognition
and were accreted over the term of the note payable for financial statement purposes. These notes were repaid in full in January 2014 and therefore the remaining unamortized discount was fully accreted.
During the years ended December 31, 2014 and 2013, $86,087 and $6,383 of interest, respectively, was accreted on the notes payable.
The Company follows FASB ASC 740-10-10 whereby an entity recognizes deferred tax assets and liabilities for future tax consequences or events that have been previously recognized in the Company’s financial statements or tax returns. The measurement of deferred tax assets and liabilities is based on provisions of enacted tax law. The effects of future changes in tax laws or rates are not anticipated.
At December 31, 2014, the Company has a net operating loss (“NOL”) that approximates $48 million. Consequently, the Company may have NOL carryforwards available for federal income tax purposes, which would begin to expire in 2028. Deferred tax assets would arise from the recognition of anticipated utilization of these net operating losses to offset future taxable income.
The income tax (benefit) provision consists of the following:
|
December 31,
|
||||||||||||
|
2014
|
2013
|
2012
|
||||||||||
|
Current
|
$ | (3,418,000 | ) | $ | (5,864,000 | ) | $ | (4,789,000 | ) | |||
|
Deferred
|
(547,000 | ) | (650,000 | ) | (502,000 | ) | ||||||
|
Change in valuation allowance
|
3,965,000 | 6,514,000 | 5,291,000 | |||||||||
| $ | - | $ | - | $ | - | |||||||
The following is a reconciliation of the tax derived by applying the U.S. Federal Statutory Rate of 35% to the earnings before income taxes and comparing that to the recorded tax provisions:
|
December 31, 2014
|
December 31, 2013
|
December 31, 2012
|
||||||||||||||||||||||
|
Amount
|
%
|
Amount
|
%
|
Amount
|
%
|
|||||||||||||||||||
|
U.S federal income tax benefit at
|
||||||||||||||||||||||||
|
Federal statutory rate
|
$ | (3,379,000 | ) | (35 | ) | $ | (5,592,000 | ) | (35 | ) | $ | (4,214,000 | ) | (35 | ) | |||||||||
|
State tax, net of federal tax effect
|
(579,000 | ) | (6 | ) | (959,000 | ) | (6 | ) | (704,000 | ) | (6 | ) | ||||||||||||
|
Non-deductible share-based compensation
|
(40,000 | ) | (0 | ) | - | - | (373,000 | ) | (3 | ) | ||||||||||||||
|
Non-deductible other expenses
|
33,000 | - | 37,000 | - | - | - | ||||||||||||||||||
|
Change in valuation allowance
|
3,965,000 | 41 | 6,514,000 | 41 | 5,291,000 | 44 | ||||||||||||||||||
|
Net
|
$ | - | - | $ | - | - | $ | - | - | |||||||||||||||
Virtual Piggy, Inc.
Notes to Financial Statements
The primary components of the Company’s December 31, 2014 and 2013 deferred tax assets, liabilities and related valuation allowances are as follows:
|
December 31,
|
||||||||
|
2014
|
2013
|
|||||||
|
Deferred tax asset for NOL carryforwards
|
$ | (19,714,000 | ) | $ | (16,296,000 | ) | ||
|
Deferred tax asset for stock based compensation
|
(1,837,000 | ) | (1,290,000 | ) | ||||
|
Valuation allowance
|
21,551,000 | 17,586,000 | ||||||
|
Net
|
$ | - | $ | - | ||||
The Company entered into a settlement agreement with an investor in 2012, whereby the Company agreed to pay the investor a settlement of $450,000 and the investor agreed to cease trading in the Company’s stock and to return warrants issued to the investor. The Company’s insurance carrier agreed to reimburse the Company with respect to this litigation. Both the settlement payment and the insurance company settlement were completed in 2013.
On April 10, 2014, the Company was named in a law suit in superior court for the State of California filed by a former employee alleging wrongful termination and seeking monetary damages and legal fees. During the three months ended September 30, 2014, the matter was settled in mediation.
Series A Preferred Stock
In January 2014, the Company, pursuant to a Securities Purchase Agreement (the “Series A Purchase Agreement”), issued in a private placement to certain accredited investors, 50,450 shares of the Company’s Series A Cumulative Convertible Preferred Stock (the “Series A Preferred Stock”) at an original issue price of $100 per share (the “Original Series A Issue Price”) and two-year warrants to purchase 5,045,000 shares of the Company’s common stock at an exercise price of $1.00 per share (the “Series A Warrants”), for an aggregate purchase price of $5,045,000. Pursuant to the Series A Purchase Agreement, the Company also granted piggyback registration rights to the holders of the Series A Preferred Stock and Series A Warrants. The Series A Purchase Agreement provides that the holders of the Series A Preferred Stock shall be entitled to nominate two directors of the Company. Dividends accrue at a rate of 8% and are cumulative. The Company had incurred and capitalized approximately $141,000 of costs associated with this offering, which were charged to additional paid in capital when the transaction was consummated.
In accordance with FASB ASC 480 and 815, the Series A Preferred Stock has been classified as permanent equity and was valued at $3,396,175, net of the beneficial conversion feature of $1,648,825, at January 27, 2014.
The conversion feature of the Series A Preferred Stock is an embedded derivative, which is classified as a liability in accordance with FASB ASC 815 and was valued in accordance with FASB ASC 470 as a beneficial conversion feature at a fair market value of $1,648,825 at January 27, 2014, and $0 at December 31, 2014. This was classified as an embedded derivative liability and a discount to Series A Preferred Stock. Since the Series A Preferred Stock can be converted at any time, the full amount of the discount was accreted and reflected as a deemed distribution.
Because the Series A Preferred Stock can be converted at any time, the embedded derivative was classified as a current liability.
The Series A Warrants associated with the Series A Preferred Stock were also classified as equity, in accordance with FASB ASC 480-10-25. Therefore it is not necessary to bifurcate the Series A Warrants from the Series A Preferred Stock.
The Series A Preferred Stock has a preference in liquidation equal to two times the Original Series A Issue Price to be paid out of assets available for distribution prior to holders of common stock and thereafter participates with the holders of common stock in any remaining proceeds subject to an aggregate cap of 2.5 times the Original Series A Issue Price. The Series A Preferred Stockholders may cast the number of votes equal to the number of whole shares of common stock into which the shares of Series A Preferred Stock can be converted. The Series A Preferred Stock also contains customary approval rights with respect to certain matters.
The conversion price of the Series A Preferred Stock was subsequently reduced from $1.00 to $0.90 per share, resulting from the
issuance by the Company of Series B Preferred Stock with a conversion price of $0.90 per share.
Virtual Piggy, Inc.
Notes to Financial Statements
The Series A Preferred Stock is subject to mandatory conversion if certain registration or related requirements are satisfied and the average closing price of the Company’s common stock exceeds 2.5 times the conversion price over a period of twenty consecutive trading days.
On April 30, 2014, the Company sold, in a private placement to certain accredited investors, an additional 58,150 shares of Series A Preferred Stock and Series A Warrants to purchase 5,815,000 shares of the Company’s common stock for an aggregate purchase price of $5,815,000. In accordance with FASB ASC 480 and 815, the additional Series A Preferred Stock has been classified as permanent equity and was valued at $2,326,000, net of the beneficial conversion feature of $3,489,000, at April 30, 2014. The Company had incurred and capitalized approximately $6,000 of costs associated with this offering, which were charged to additional paid in capital when the transaction was consummated.
The conversion feature of the additional Series A Preferred Stock is an embedded derivative, which is classified as a liability in accordance with FASB ASC 815 and was valued in accordance with FASB ASC 470 as a beneficial conversion feature at a fair market value of $3,489,000 at April 30, 2014 and $0 at December 31, 2014. This was classified as an embedded derivative liability and a discount to Series A Preferred Stock. Since the Series A Preferred Stock can be converted at any time, the full amount of the discount was accreted and reflected as a deemed distribution.
Series B Preferred Stock
In October 2014, the Company, pursuant to a Securities Purchase Agreement (the “Series B Purchase Agreement”), issued in a private placement to certain accredited investors, 28,378 shares of the Company’s Series B Cumulative Convertible Preferred Stock (the “Series B Preferred Stock”) at an original issue price of $90 per share (the “Original Series B Issue Price”) and two-year warrants to purchase 2,837,800 shares of the Company’s common stock at an exercise price of $1.00 per share (the “Series B Warrants”), for an aggregate purchase price of $2,554,020. Pursuant to the Series B Purchase Agreement , the Company also granted piggyback registration rights to the holders of the Series B Preferred Stock and Series B Warrants. Dividends accrue at a rate of 8% and are cumulative. The Company had incurred and capitalized approximately $24,029 of costs associated with this offering, which were charged to additional paid in capital when the transaction was consummated.
In accordance with FASB ASC 480 and 815, the Series B Preferred Stock has been classified as permanent equity and was valued at $2,178,179, net of the beneficial conversion feature of $375,841, at October 30, 2014.
The conversion feature of the Series B Preferred Stock is an embedded derivative, which is classified as a liability in accordance with FASB ASC 815 and was valued in accordance with FASB ASC 470 as a beneficial conversion feature at a fair market value of $375,841 at October 30, 2014, and $0 at December 31, 2014. This was classified as an embedded derivative liability and a discount to Series B Preferred Stock. Since the Series B Preferred Stock can be converted at any time, the full amount of the discount was accreted and reflected as a deemed distribution.
Because the Series B Preferred Stock can be converted at any time, the embedded derivative is classified as a current liability.
The Series B Warrants associated with the Series B Preferred Stock were also classified as equity, in accordance with FASB ASC 480-10-25. Therefore it is not necessary to bifurcate the Series B Warrants from the Series B Preferred Stock.
The Series B Preferred Stock is pari passu with the Series A Preferred Stock and has a preference in liquidation equal to two times the Original Issue Price to be paid out of assets available for distribution prior to holders of common stock and thereafter participates with the holders of common stock in any remaining proceeds subject to an aggregate cap of 2.5 times the Original Issue Price. The Series B Preferred Stockholders may cast the number of votes equal to the number of whole shares of common stock into which the shares of Series B Preferred Stock can be converted. The Series B Preferred Stock also contains customary approval rights with respect to certain matters.
The conversion price of the Series B Preferred Stock is currently $0.90 per share. The Series B Preferred Stock is subject to mandatory conversion if certain registration or related requirements are satisfied and the average closing price of the Company’s common stock exceeds 2.5 times the conversion price over a period of twenty consecutive trading days.
As of December 31, 2014, the value of the cumulative 8% dividends for all preferred stock was $723,649. Such dividends will be paid when and if declared payable by the Company’s board of directors or upon the occurrence of certain liquidation events. In accordance with FASB ASC 260-10-45-11, the Company has recorded these accrued dividends as a non-current liability.
Virtual Piggy, Inc.
Notes to Financial Statements
Derivative Liabilities
For purposes of determining whether certain instruments are derivatives for accounting treatment, the Company follows the accounting standard that provides guidance for determining whether an equity-linked financial instrument, or embedded feature, is
indexed to an entity’s own stock. The standard applies to any freestanding financial instruments or embedded features that have the characteristics of a derivative, and to any freestanding financial instruments that are potentially settled in an entity’s own common stock.
The Company has identified the following liabilities that are measured at fair value on a recurring basis, summarized as follows:
|
December 31, 2014
|
Level 1
|
Level 2
|
Level 3
|
Total
|
||||||||||||
|
Derivative liability related to fair value of beneficial conversion
feature
|
$
|
-
|
$
|
-
|
$
|
-
|
$
|
-
|
||||||||
|
Total
|
$
|
-
|
$
|
-
|
$
|
-
|
$
|
-
|
||||||||
The following table details the approximate fair value measurements within the fair value hierarchy of the Company’s derivative liabilities using Level 2 inputs:
|
Total
|
||||
|
Balance at January 1, 2014
|
$
|
-
|
||
|
Preferred Stock issued
|
5,513,666
|
|||
|
Change in fair value of derivative liabilities
|
(5,513,666)
|
|||
|
Balance at December 31, 2014
|
$
|
-
|
||
Virtual Piggy, Inc.
Notes to the Financial Statements
As of December 31, 2014, the beneficial conversion feature of the Preferred Stock is treated as an embedded derivative liability and changes in the fair value were recognized in earnings. The shares of Preferred Stock are convertible into shares of the Company’s common stock, which did trade in an active securities market; therefore the embedded derivative liability was valued using the following market based inputs:
|
Closing Trading Price of Common Stock
|
$
|
0.39
|
||
|
Series A Preferred Stock Effective Conversion Price
|
(0.39)
|
|||
|
Intrinsic value of conversion option per share
|
$
|
-
|
The Company has no assets that are measured at fair value on a recurring basis. There were no assets or liabilities measured at fair value on a non-recurring basis as of December 31, 2014 and December 31, 2013.
Private Placements of Securities
In December 2011, the Company commenced a private placement of up to $5,000,000 consisting of up to 12,500,000 shares of the Company’s common stock and warrants to purchase up to 6,250,000 shares of the Company’s common stock. The shares and warrants were sold in units with each unit comprised of two shares and one warrant at a purchase price of $.80 per unit. During December 2011, the Company sold 625,000 units and raised $500,000. On January 11, 2012, the Company amended the Securities Purchase Agreement dated December 1, 2011, by reducing the price of one unit from $.80 to $.70. This increased the number of units to be sold from 6,250,000 units to 7,142,858 units. It also required the Company to issue to one investor an additional 89,286 units, consisting of 178,572 shares common stock and warrants to purchase an additional 89,286 shares of common stock. During the three months ended March 31, 2012, the Company issued an additional 3,922,356 units and raised $2,745.650.
On April 5, 2012, the Company commenced a private placement of up to $3,500,000 consisting of up to 10,000,000 shares of the Company’s common stock and warrants to purchase up to 5,000,000 shares of the Company’s common stock at an exercise price of $.50 per share. The shares and warrants were sold in units with each unit comprised of two shares and one warrant at a purchase price of $.70 per unit. In accordance with the terms of the offering documents, the offering amount was increased to $4 million. From April 5, 2012 to June 30, 2012, the Company sold 6,201,831units and raised $4,341,282.
On April 2, 2012, the Company entered into a settlement agreement with a former consultant of the Company. In connection with the settlement, the Company made a settlement payment to the consultant of $30,000 and issued the consultant 350,000 shares of the Company’s common stock, which were valued at $297,500, fair value, or $.85 per share.
On April 26, 2012, the remaining balance of the notes payable of $175,000 and accrued interest of $25,000 was converted into 571,428 shares of the Company’s common stock and warrants to purchase 285,714 shares of the Company’s common stock.
On May 2, 2012, the Company entered into a securities purchase agreement with a non-U.S. person, pursuant to which the Company issued and sold 187,500 units at a purchase price of $0.80 per unit, in consideration of gross proceeds of $150,000. Each unit consisted of: (i) two shares of the Company’s common stock, (ii) a warrant to purchase one share of the Company’s common stock at an exercise price of $0.50 per share for a term of two years, and (iii) a warrant to purchase one half share of the Company’s common stock at an exercise price of $1.00 per share for a term of three years. Pursuant to the securities purchase agreement, the purchaser also agreed to purchase an additional $850,000 of units by November 1, 2012. The Company received $950,000 as of December 31, 2012 under this agreement and received the remaining $50,000 on March 1, 2013.
On May 21, 2012, the Company issued five consultants an aggregate of 1,363,185 shares of the Company’s common stock for services, which were valued in the aggregate at $3,312,537, fair value or $2.43 per share, which was the stock price on the day of issuance
On July 5, 2012, the Company commenced a private placement of up to $100,000 consisting of up to 125,000 units of the Company’s common stock and warrants to purchase up to 125,000 shares of the Company’s common stock at an exercise price of $.50 per share with a term of two years (“Series A Warrants”) and warrants to purchase up to 62,500 at an exercise price of $1.00 per share with a term of three years (“Series B Warrants”). The shares and warrants were sold in units with each unit comprised of two shares and one Series A warrant and one Series B warrant at a purchase price of $.80 per unit. As of August 8, 2012, the Company received gross proceeds of $100,000 under this private placement.
During November and December 2012, the Company entered into private placements for shares of the Company’s common stock. The shares were sold at a purchase price of $.70 per share. Through December 31, 2012, 7,942,858 shares were sold raising $5,560,000.
In December 2012, the Company entered into private placements for shares of the Company’s common stock. The shares were sold at a purchase price of $.75 per share. Through December 31, 2012, 666,667 shares were sold raising $500,000.
During the first quarter of 2013, the Company entered into a private placement for shares of the Company’s common stock. The shares were sold at a purchase price of $0.80 per share. 125,000 shares were sold resulting in proceeds of $50,000.
During the first quarter of 2013, the Company entered into a private placement for shares of the Company’s common stock. The shares were sold at a purchase price of $0.75 per share. Through June 30, 2013, 1,133,334 shares were sold resulting in proceeds of $850,000. Issuance costs related to this private placement were $60,783.
On April 15, 2013, the Company issued 26,521 restricted shares of the Company’s common stock to five members of the Board of Directors that were valued at $49,071. In conjunction with this the five members of the Board also received in aggregate options to purchase 1,050,000 shares of the Company’s common stock. These options were valued at $519,080, fair value. The Company uses the Black-Scholes option pricing model to calculate the grant-date fair value of the options, with the following assumptions: no dividend yield, expected volatility of 29.0%, risk free interest rate of .69% and expected option life of five years. The options expire five years from the date of issuance. Options granted are being expensed over the three year vesting term.
On May 28, 2013, the Company entered into a Securities Purchase Agreement with accredited investors, pursuant to which it issued and sold in a private placement an aggregate of 2,572,553 units at a purchase price of $1.80 per unit (the “Offering”), with each unit being comprised of one (1) share of the Company’s common stock and a warrant to purchase one-half (0.5) of a share of common stock at an exercise price of $3.00 per share for a period of three years. On May 29, 2013, the Company issued and sold an additional 300,000 units pursuant to the Offering. The Company retained a placement agent in connection with the Offering. The gross proceeds of the offering were $5,170,595. The Company paid the placement agent aggregate placement agent fees in the amount of $151,408 plus $155,118 as an expense allowance. In addition, the placement agent received three year warrants to purchase an aggregate of 287,255 shares of the Company’s common stock at an exercise price of $1.80 per share.
In 2013, options and warrants to purchase 5,821,852 shares of the Company’s common stock were exercised at an average price of $0.28 per share for net proceeds to the Company of $1,617,593.
In 2014, options and warrants to purchase 378,571 shares of the Company’s common stock were exercised at an average price of $0.57 per share for net proceeds to the Company of $214,286.
Exchange of Warrants and Deemed Dividend
Effective February 7, 2014, when the market price of our common stock was $1.18 per share, the Company completed an exchange offering with certain investors in our 2011 to 2012 Private Placements to exercise their current warrants at $0.50 per share and receive a new warrant which would be convertible into the same number of common shares as the original warrant. The new warrant has an exercise price of $1.00. The Company has recognized a deemed dividend of $717,594 in the Statement of Operations for the year ended December 31, 2014, attributable to the incremental fair value resulting from the modification of these warrants. The fair value of the new warrants was valued using the Black-Scholes option pricing model to calculate the grant-date fair value of the warrants, with the following assumptions: no dividend yield, expected volatility of 143.2%, risk free interest rate of 0.30% and expected option life approximating two years. The warrants expire two years from the date of issuance. Pursuant to the offering, the Company received aggregate cash consideration of $2,521,143 from exercised warrants to purchase 5,042,287 shares of Company common stock.
Virtual Piggy, Inc.
Notes to Financial Statements
Extension of Warrants
In June 2014, the Company extended by one year the term of 514,286 warrants with an exercise price of $0.75 which were to expire in June 2014. The fair value of the extended warrants was valued using the Black-Scholes option pricing model to calculate the grant-date fair value of the warrants, with the following assumptions: no dividend yield, expected volatility of 99.6%, risk free interest rate of 0.11% and expected option life approximating one year. The Company recognized compensation expense of $108,000 which was charged to general and administrative expenses.
In February 2014, the Company extended warrants previously granted to two of its executive officers, which included 1,142,588 warrants exercisable at $0.04 per share and 100,000 warrants exercisable at $.75 per share for an additional two years. The increase in fair value of this term extension was $28,663 which was expensed during the period. The Company used the Black-Scholes option pricing model to calculate the increase in fair value, with the following assumptions: no dividend yield, expected volatility of 89.3% to 89.5%, risk free interest rate of 0.33%, and expected warrant life of 2 years.
Issuance of Restricted Shares
In April, 2014, the Company issued 300,000 shares of restricted stock in connection with a consulting agreement. Such shares vested monthly over a six month period. The shares were valued at the closing stock price on the date of issuance which was $1.27, valuing the shares at $381,000 which were expensed over a six month period in 2014 in accordance with the term of the consulting agreement.
In November, 2014, one of the Company’s executive officers voluntarily terminated his option grant of 1,000,000 shares. The Company issued to such executive a replacement grant of 2,000,000 shares of restricted stock which vest annually over a three year period in accordance with the Company’s 2013 Equity Incentive Plan. The shares were valued at the closing stock price on the date of issuance which was $0.70, valuing the shares at $1.4 million, fair value, which are being expensed over the vesting term.
During 2008, the Board of Directors (“Board”) of the Company adopted the 2008 Equity Incentive Plan (“2008 Plan”) that was approved by the shareholders. Under the Plan, the Company is authorized to grant options to purchase up to 25,000,000 shares of common stock to any officer, other employee or director of, or any consultant or other independent contractor who provides services to the Company. The Plan is intended to permit stock options granted to employees under the 2008 Plan to qualify as incentive stock options under Section 422 of the Internal Revenue Code of 1986, as amended (“Incentive Stock Options”). All options granted under the 2008 Plan, which are not intended to qualify as Incentive Stock Options are deemed to be non-qualified options (“Non-Statutory Stock Options”). As of December 31, 2014, options to purchase 13,104,995 shares of common stock have been issued and are unexercised, and 1,378,338 shares are available for grants under the 2008 Plan.
During 2013, the Board adopted the 2013 Equity Incentive Plan (“2013 Plan”), which was approved by stockholders at the 2013 annual meeting of stockholders. Under the 2013 Plan, the Company is authorized to grant awards of stock options, restricted stock, restricted stock units and other stock-based awards of up to an aggregate of 5,000,000 shares of common stock to any officer, employee, director or consultant. The 2013 Plan is intended to permit stock options granted to employees under the 2013 Plan to qualify as Incentive Stock Options. All options granted under the 2013 Plan, which are not intended to qualify as Incentive Stock Options are deemed to be Non-Statutory Stock Options. As of December 31, 2014, under the 2013 Plan grants of restricted stock and options to purchase 4,985,832 shares of common stock have been issued and are unvested or unexercised, and 14,168 shares of common stock remain available for grants under the 2013 Plan.
The 2008 Plan and 2013 Plan are administered by the Board or its compensation committee, which determines the persons to whom awards will be granted, the number of awards to be granted, and the specific terms of each grant, including the vesting thereof, subject to the terms of the applicable Plan.
In connection with Incentive Stock Options, the exercise price of each option may not be less than 100% of the fair market value of the common stock on the date of the grant (or 110% of the fair market value in the case of a grantee holding more than 10% of the outstanding stock of the Company).
Prior to January 1, 2014, volatility in all instances presented is the Company’s estimate of volatility that is based on the volatility of other public companies that are in closely related industries to the Company. Beginning January 1, 2014, volatility in all instances presented is the Company’s estimate of volatility that is based on the historical volatility of the Company’s stock history.
Virtual Piggy, Inc.
Notes to Financial Statements
The following table presents the weighted-average assumptions used to estimate the fair values of the stock options granted during the three years ended December 31, 2014:
|
Year Ending December 31,
|
||||||||||||
|
2014
|
2013
|
2012
|
||||||||||
|
Risk Free Interest Rate
|
1.52 | % | 0.86 | % | 0.89 | % | ||||||
|
Expected Volatility
|
94 | % | 25 | % | 29 | % | ||||||
|
Expected Life (in years)
|
5.0 | 4.6 | 4.9 | |||||||||
|
Dividend Yield
|
0 | % | 0 | % | 0 | % | ||||||
|
Weighted average estimated fair value of options during the period
|
$ | 0.63 | $ | 0.40 | $ | 0.32 | ||||||
The following table summarizes the activities for our stock options for the year ended December 31, 2014:
|
Options Outstanding
|
|||||||||||||
|
Number of
Shares
|
Weighted-
Average
Exercise Price
|
Weighted-
Average
Remaining
Contractual
Term
(in years)
|
Aggregate
Intrinsic
Value
(in 000’s) (1)
|
||||||||||
|
|
|||||||||||||
|
Balance as of December 31, 2013
|
18,817,499
|
$
|
0.90
|
||||||||||
|
Granted
|
3,085,000
|
$
|
0.92
|
||||||||||
|
Exercised
|
(100,000
|
)
|
$
|
0.75
|
|||||||||
|
Forfeited/canceled
|
(3,146,673
|
)
|
$
|
1.24
|
|||||||||
|
Expired
|
(1,984,999
|
)
|
$
|
1.39
|
|||||||||
|
Balance as of December 31, 2014
|
16,670,827
|
$
|
0.78
|
2.1
|
$
|
1.225
|
|||||||
|
Exercisable as of December 31, 2014
|
12,007,060
|
$
|
0.70
|
1.5
|
$
|
1,225
|
|||||||
|
Exercisable as of December 31, 2014 and expected to vest
thereafter
|
16,570,827
|
$
|
0.78
|
2.1
|
$
|
1,225
|
|||||||
|
(1)
|
The aggregate intrinsic value is calculated as the difference between the exercise price of the underlying awards and the closing stock price of $0.39 for our common stock on December 31, 2014.
|
During the year ended December 31, 2014, 2013 and 2012, the weighted average fair value of stock options granted during the period was $1,930,379, $1,544,141 and $3,123,130, respectively. The fair value of stock options is expensed over the vesting term in accordance with the terms of the related stock option agreements.
During the year ended December 31, 2014, 2013 and 2012, the intrinsic value of stock options exercised during the period was $98,000, $2,715,167, and $921,000 respectively.
For the years ended December 31, 2014, 2013 and 2012, the Company expensed $905,304, $1,035,213 and $1,235,353, respectively, relative to the fair value of stock options granted.
As of December 31, 2014, there was $1,302,096 of unrecognized compensation cost related to outstanding stock options. This amount is expected to be recognized over a weighted-average period of 2.1 years. To the extent the actual forfeiture rate is different from what we have estimated, stock-based compensation related to these awards will be different from our expectations. The difference between the stock options exercisable at December 31, 2014 and the stock options exercisable and expected to vest relates to stock options with milestones tied to vesting.
Virtual Piggy, Inc.
Notes to Financial Statements
The following table summarizes the activities of our unvested stock options for the year ended December 31, 2014:
|
Unvested Stock Options
|
||||||||||||||||
|
Number of
Awards |
Weighted
Average Exercise Price |
Weighted
Average Grant Date Fair Value |
Weighted
Average Remaining Amortization Period (Years) |
|||||||||||||
|
Unvested stock options at December 31, 2013
|
8,616,258 | $ | 1.20 | $ | 0.28 | |||||||||||
|
Granted
|
3,085,000 | $ | 0.92 | $ | 0.63 | |||||||||||
|
Cancelled/Forfeited
|
(2,411,673 | ) | $ | 1.27 | $ | 0.43 | ||||||||||
|
Expired
|
(1,550,000 | ) | $ | 1.40 | $ | 0.33 | ||||||||||
|
Vested
|
(3,075,818 | ) | $ | 1.09 | $ | 0.30 | ||||||||||
|
Unvested stock options at December 31, 2014
|
4,663,767 | $ | 0.98 | $ | 0.40 |
2.08
|
||||||||||
Virtual Piggy, Inc.
Notes to the Financial Statements
The following table summarizes the activities for our warrants for the year ended December 31, 2014:
|
Warrants Outstanding
|
||||||||||||
|
Number of
Shares
|
Weighted-
Average Exercise Price |
Weighted-
Average
Remaining
Contractual
Term
(in years)
|
Aggregate
Intrinsic
Value
(in 000’s) (1)
|
|||||||||
|
Balance as of December 31, 2013
|
13,887,1811
|
$
|
0.81
|
|||||||||
|
Granted
|
20,115,087
|
$
|
1.00
|
|||||||||
|
Exercised
|
(5,320,858
|
) |
$
|
0.50
|
||||||||
|
Forfeited/canceled
|
$
|
|||||||||||
|
Expired
|
(2,050,000
|
) |
$
|
0.84
|
||||||||
|
Balance as of December 31, 2014
|
26,631,410
|
$
|
1.01
|
1.2
|
$
|
428
|
||||||
|
Exercisable as of December 31, 2014
|
26,631,410
|
$
|
1.01
|
1.2
|
$
|
428
|
||||||
|
Exercisable as of December 31, 2014 and expected to vest
thereafter
|
26,631,410
|
$
|
1.01
|
1.1
|
$
|
428
|
||||||
|
(1)
|
The aggregate intrinsic value is calculated as the difference between the exercise price of the underlying warrants and the closing stock price of $0.39 for our common stock on December 31, 2014.
All warrants were vested on the date of grant.
|
For the years ended December 31, 2014, 2013 and 2012, total rent expense under leases amounted to $604,875, $376,038 and $146,319, respectively. At December 31, 2014, the Company was obligated under various non-cancelable operating lease arrangements for property as follows:
|
2015
|
$
|
286,053
|
||
|
2016
|
191,800
|
|||
|
$
|
477,853
|
During the years ended December 31, 2014, 2013 and 2012, a consultant owning more than 5% of the Company was paid for consulting and travel expenses to provide strategic advice to the Company. On January 1, 2013, the Company entered into an agreement with this consultant, whereby the Company would pay the consultant $12,500 per month beginning January 1, 2013 for a term of one year. In June 2013, this contract was terminated. Consulting fees paid during the years ended December 31, 2014, 2013 and 2012 were $0, $130,000 and $187,000, respectively. Reimbursable business expenses of $5,927, $41,459 and $76,383 were paid during the years ended December 31, 2014, 2013 and 2012, respectively.
During the years ended December 31, 2014, 2013 and 2012, a marketing company owned by the Secretary and his spouse was paid $0, $0 and $14,560, respectively.
During the years ended December 31, 2014, 2013 and 2012, the certified public accounting firm owned by the former Chief Financial Officer was paid $124,950, $152,800 and $143,800 and for accounting services.
In September 2012, the Company entered into a consulting agreement with a company which is partly owned by one of our directors. The agreement granted this company options to purchase 100,000 shares of common stock on the date on which the agreement was executed. The options were valued at $81,697 and expensed in 2012. Additionally, the agreement set forth the terms under which this company could earn additional stock options based on achieving milestones related to merchant acquisition. No additional compensation was earned, and this agreement expired in November 2012.
Virtual Piggy, Inc.
Notes to the Financial Statements
On February 23, 2015, the Board of Directors of the Company approved amendments extending the term of outstanding warrants to purchase in the aggregate 3,877,970 shares of common stock of the Company at exercise prices ranging from $0.01 per share to $1.00 per share. These warrants were scheduled to expire at various dates during 2015 and were each extended for an additional one year period from the applicable current expiration date, with the new expiration dates ranging from February 23, 2016 to December 28, 2016. The Company will record a non-cash compensation charge in the first quarter of 2015 of approximately $220,000 which is the fair value of this term extension.
On February 23, 2015, the board of directors of the Company approved the grant of 200,000 options to purchase Virtual Piggy stock to each of the four independent members of the board of directors as compensation for their services. Such options are exercisable at $0.46 per share and vest annually over a three year period. The fair value of these options is $264,586, which will be amortized to expense over a three year period on a straight line basis.
On March 6, 2015, the Company, pursuant to a Securities Purchase Agreement (the “Purchase Agreement”), issued $2,000,000 aggregate principal amount of its 10% Secured Convertible Promissory Notes due March 5, 2016 (the “Notes”) to certain accredited investors (the “Investors”).
The Notes are convertible by the holders, at any time, into shares of the Company’s Series B Preferred Stock at a conversion price of $90.00 per share, subject to adjustment for stock splits, stock dividends and similar transactions with respect to the Series B Preferred Stock only. Each share of Series B Preferred Stock is currently convertible into 100 shares of the Company’s common stock at a current conversion price of $0.90 per share, subject to anti-dilution adjustment as described in the Certificate of Designation of the Series B Preferred Stock. In addition, pursuant to the terms of a Security Agreement entered into on March 6, 2015 by and among the Company, the Investors and a collateral agent acting on behalf of the Investors (the “Security Agreement”), the Notes are secured by a lien against substantially all of the Company’s business assets. Pursuant to the Purchase Agreement, the Company also granted piggyback registration rights to the holders of the Series B Preferred Stock upon a conversion of the Notes.
F-23
TABLE OF CONTENTS
Part IItem 1. BusinessItem 1A. Risk FactorsItem 1B. Unresolved Staff CommentsItem 2. PropertiesItem 3. Legal ProceedingsItem 4. Mine Safety DisclosuresPart IIItem 5. Market For Registrant S Common Equity, Related Stockholder Matters and Issuer Purchases Of Equity SecuritiesItem 6. Selected Financial DataItem 7. Management S Discussion and Analysis Of Financial Condition and Results Of OperationsItem 7A. Quantitative and Qualitative Disclosures About Market RiskItem 8. Financial Statements and Supplementary DataItem 9. Changes in and Disagreements with Accountants on Accounting and Financial DisclosureItem 9A. Controls and ProceduresItem 9B. Other InformationPart IIIItem 10. Directors, Executive Officers and Corporate GovernanceItem 11. Executive CompensationItem 12. Security Ownership Of Certain Beneficial Owners and Management and Related Stockholder MattersItem 13. Certain Relationships and Related Transactions, and Director IndependenceItem 14. Principal Accountant Fees and ServicesPart IVItem 15. Exhibits and Financial Statement SchedulesNote 1 Summary Of Significant Accounting PoliciesNote 1 Summary Of Significant Accounting Policies (continued)Note 2 Going ConcernNote 3 Patents and TrademarksNote 4 Notes PayableNote 5 - Income TaxesNote 6 LitigationNote 7 Convertible Preferred StockNote 8 Fair Value Of Financial InstrumentsNote 9 Stockholders EquityNote 10 - Stock Options and WarrantsNote 11 - Operating LeasesNote 12 Related Party TransactionsNote 13 Subsequent Events