RED ROBIN GOURMET BURGERS INC
10-Ks and 10-Qs
|
|
|
|
|
|
|
|
|
|
|
|
|
|
|
|
|
|
|
|
|
|
|
|
|
|
|
|
|
|
|
|
|
|
|
|
|
|
|
|
|
|
|
|
|
|
|
|
|
|
|
|
|
|
|
|
QuickLinks
-- Click here to rapidly navigate through this document
UNITED STATES
SECURITIES AND EXCHANGE COMMISSION
Washington, D.C. 20549
______________________________________________________________
FORM 10-K
|
ý
|
|
ANNUAL REPORT PURSUANT TO SECTION 13 OR 15(d) OF THE SECURITIES EXCHANGE ACT OF 1934
|
For the fiscal year ended
December 29, 2013
|
o
|
|
TRANSITION REPORT PURSUANT TO SECTION 13 OR 15(d) OF THE SECURITIES EXCHANGE ACT OF 1934
|
For the transition period from to
Commission file number 001-34851
______________________________________________________________
RED ROBIN GOURMET BURGERS, INC.
(Exact name of registrant as specified in its charter)
|
Delaware
(State or other jurisdiction of
incorporation or organization)
|
|
84-1573084
(I.R.S. Employer
Identification No.)
|
|
6312 S Fiddler's Green Circle, Suite 200N
|
|
|
|
Greenwood Village, CO
|
|
80111
|
|
(Address of principal executive offices)
|
|
(Zip Code)
|
(303) 846-6000
(Registrant's telephone number, including area code)
______________________________________________________________
Securities Registered Pursuant to Section 12(b) of the Act:
Common Stock, $0.001 par value
Name of each exchange on which registered: NASDAQ (Global Select Market)
Securities Registered Pursuant to Section 12(g) of the Act:
Indicate by check mark if the registrant is a well-known seasoned issuer, as defined in Rule 405 of the Securities Act. Yes
ý
No
o
Indicate by check mark if the registrant is not required to file reports pursuant to Section 13 or 15(d) of the Act. Yes
o
No
ý
Indicate by check mark whether the registrant (1) has filed all reports required to be filed by Section 13 or 15(d) of the Securities Exchange Act of 1934 during the preceding 12 months (or for such shorter period that the registrant was required to file such reports), and (2) has been subject to such filing requirements for the past 90 days. Yes
ý
No
o
Indicate by check mark whether the registrant has submitted electronically and posted on its corporate Website, if any, every Interactive Data File required to be submitted and posted pursuant to Rule 405 of Regulation S-T (§232.405 of this chapter) during the preceding 12 months (or for such shorter period that the registrant was required to submit and post such files). Yes
ý
No
o
Indicate by check mark if disclosure of delinquent filers pursuant to Item 405 of Regulation S-K (§229.405 of this chapter) is not contained herein, and will not be contained, to the best of registrant's knowledge, in definitive proxy or information statements incorporated by reference in Part III of this Form 10-K or any amendment to this Form 10-K.
ý
Indicate by check mark whether the registrant is a large accelerated filer, an accelerated filer, a non-accelerated filer, or a smaller reporting company. See the definitions of "large accelerated filer," "accelerated filer" and "smaller reporting company" in Rule 12b-2 of the Exchange Act.
|
Large accelerated filer
ý
|
|
Accelerated filer
o
|
|
Non-accelerated filer
o
(Do not check if a
smaller reporting company)
|
|
Smaller reporting company
o
|
Indicate by check mark whether the registrant is a shell company (as defined in Rule 12b-2 of the Act). Yes
o
No
ý
The aggregate market value of the voting and non-voting common stock held by non-affiliates (based on the closing price on the last business day of the registrant's most recently completed second fiscal quarter on The NASDAQ Global Select Market) was $840.9 million. All executive officers and directors of the registrant have been deemed, solely for the purpose of the foregoing calculation, to be "affiliates" of the registrant.
There were
14,404,643
shares of common stock outstanding as of
February 20, 2014
.
DOCUMENTS INCORPORATED BY REFERENCE
Certain information required for Items 10, 11, 12, 13 and 14 of Part III of this Annual Report on Form 10-K is incorporated by reference to the registrant's definitive proxy statement for the 2014 annual meeting of stockholders.
RED ROBIN GOURMET BURGERS, INC.
TABLE OF CONTENTS
|
|
|
Page
|
|
PART I
|
||
|
PART II
|
||
|
PART III
|
||
|
PART IV
|
||
1
Overview
Red Robin Gourmet Burgers, Inc., together with its subsidiaries, is a casual dining restaurant chain focused on serving an imaginative selection of high quality gourmet burgers in a fun environment welcoming to guests of all ages. We opened the first Red Robin® restaurant in Seattle, Washington in September 1969 and opened the first Red Robin’s Burger Works® in Denver, Colorado in November 2011. In 1979, the first franchised Red Robin® restaurant was opened in Yakima, Washington. In 2001, we formed Red Robin Gourmet Burgers, Inc., a Delaware corporation, and consummated a reorganization of the company. Since that time, Red Robin Gourmet Burgers, Inc. has owned, either directly or indirectly, all of the outstanding capital stock or membership interests, respectively, of Red Robin International, Inc., and our other operating subsidiaries through which we operate our Company-owned restaurants. Unless otherwise provided in this Annual Report on Form 10-K, references to "Red Robin," "we", "us", "our", and the "Company" refer to Red Robin Gourmet Burgers, Inc. and our consolidated subsidiaries. For the 52-week fiscal year
2013
, we generated total revenues of
$1.0 billion
. As of the end of our fiscal year on
December 29, 2013
, the Red Robin system included
495
restaurants, of which
361
were Company-owned, and
134
were operated under franchise agreements with 18 franchisees. Our franchisees are independent organizations to whom we provide certain support. See "Restaurant Franchise and Licensing Arrangements" for additional information about our franchise program. As of
December 29, 2013
, there were Red Robin® restaurants in 42 states and two Canadian provinces.
Financial information for our single operating segment is included in Notes to the Consolidated Financial Statements in Part II, Item 8 of this report.
Business Strategy
We are committed to delivering superior experiences for our guests which we believe will lead to operating and financial results greater than our casual dining peers. Through our engaged and motivated team members, our mission is to deliver a customized experience and create a unique connection with guests of all ages who want to enjoy craveable gourmet burgers in a fun, energetic environment with attentive and friendly service. We have identified and continue to search for opportunities that will drive strong financial performance through increasing guest traffic and revenue, improving operational efficiencies and expense management, enhancing our restaurant environments and expanding our restaurant base. We have built key short-term and long-term strategies and initiatives around these opportunities, as well as optimizing returns through allocation of our capital. These objectives include:
|
•
|
Increasing guest engagement.
We have developed initiatives to increase profitable guest traffic and sales in our restaurants through greater frequency of visits and increasing our average guest check. We plan to grow our average check through selling incremental items while allowing the guest to manage their total cost with different price points. See "Marketing and Advertising" below for additional information about our marketing strategy and initiatives.
|
|
•
|
Improving operational efficiencies and expense management.
We continue to focus on managing our expenses in the operation of our restaurants and in our selling, general and administrative functions. Our restaurant operating costs include food and other commodities, labor cost and benefits, restaurant supplies, utilities, occupancy, and other operating costs. Macroeconomic and other external factors, such as commodity and other price increases have historically resulted in upward trends in these costs. We have been implementing multiple programs to mitigate the impact of these external factors, including continued optimization of our distribution and supply chain relationships, labor productivity improvement efforts and initiatives to streamline operational processes. We are in the process of implementing a major overhaul of our data infrastructure, including the replacement of several key operational and financial systems. We will continue these initiatives and examine additional opportunities to reduce overhead costs and improve efficiencies throughout our organization as part of our ongoing cost management efforts.
|
|
•
|
Expanding our footprint.
We are focused on disciplined deployment of capital to both grow the brand and to maximize long-term shareholder returns by optimizing the return on our capital investments. Capital development decisions include the evaluation of a number of opportunities including new development sites, restaurant sizes, markets and trade areas, relocations and remodels. Other capital allocation decisions include the appropriate mix of Company-owned and franchise units, debt levels, capital structure and use of capital we generate. In fiscal year
2013
, we opened
22
new Company-owned restaurants, including one Red Robin’s Burger Works®, our fast casual prototype, relocated two Red Robin® restaurants and remodeled 19 Red Robin® restaurants to our new brand standards. We plan on opening 20 new Company-owned Red Robin® restaurants in fiscal year 2014, in addition to five Red Robin's
|
2
Burger Works® restaurants. We also plan to remodel another 50 Red Robin® restaurants, in addition to the 32 restaurants remodeled in fiscal years 2013 and 2012.
Restaurant Concept
The Red Robin brand has many desirable attributes, including a strong guest-focused culture, a talented team and a passion for success. Red Robin was founded on four core values:
Honor, Integrity, Continually Seeking Knowledge
and
Having Fun
. These core values form the foundation for how we treat our team members, guests, and communities.
Our menu features our signature product, a line of gourmet burgers which we make from premium quality, fresh ground beef; and other products made from chicken breasts, fish fillets, turkey patties, as well as vegetarian and vegan burger options. We offer a wide selection of buns—including ciabatta, gluten free, sesame, onion and whole grain buns, and jalapeno rolls—with a wide variety of toppings—including fresh guacamole, barbeque sauce, grilled pineapple, crispy onion straws, sauteed mushrooms, fried jalapenos, bruschetta salsa, coleslaw and dill pickle slices, eight different cheeses, and a fried egg. We have recently added an everyday value line of burgers (Red's Tavern Double Burger™) which can be "styled up" in several ways, and a premium half pound burger (Red Robin's Finest) made with 100% Angus beef. In addition to burgers which accounted for approximately 46% of our total food sales in fiscal year 2013, Red Robin serves an array of other items that appeal to a broad range of guests. These items include a variety of appetizers (priced at $3, $5, $7 and $9), sweet potato fries, salads, soups, seafood and other entrees, desserts, and the Company's signature Mad Mixology® alcoholic and non-alcoholic specialty beverages. All of our gourmet burgers are served with our all-you-can-eat Bottomless Steak Fries® or a guest may choose alternative bottomless sides. In addition, we specialize in offering items our guests can order or modify to meet their dietary needs and preferences.
We believe in giving our guests the "gift of time." All of Red Robin's menu items are designed to be delivered to guests in a time-efficient manner to accommodate the guests' timetable. Our service sequence is designed to consistently prepare our menu items at a speed which allows guests to enjoy time-efficient lunches and dinners. However, our first goal is to customize the experience to what the guest wants - be it speed or a more relaxed dining occasion. We strive to meet the needs of our guests by offering a choice of experiences and occasions from time-pressured meals to a place to relax and unwind with friends. Red Robin also has an unparalleled and extraordinary approach to guest service using Unbridled Acts®. We have catalogued thousands of stories of Red Robin team members who live our values through random acts of kindness they bestow upon restaurant guests and other team members. Many examples of our Unbridled Acts® can be found on our website,
www.redrobin.com
. We encourage our team members to execute on the aspects of service that we have identified to be our biggest drivers of our guest loyalty.
We also strive to provide our guests with exceptional dining value and the ability to customize their experience. In fiscal year 2013, we had an average check per guest of approximately $12.17, including beverages. We believe this price-to-value relationship, our innovative gourmet burgers, salads and sandwiches, our Red's Tavern Double platform offering everyday value starting at $6.99, and our new, Red Robin's Finest burgers differentiate us from our competitors, and allow us to appeal to a broad base of consumers with a wide range of income levels. A low average guest check relative to casual dining competitors, combined with swift service, engaging team members and a family-friendly atmosphere further differentiates us from many other casual dining restaurants.
Operations
Restaurant Management
Our typical restaurant management team consists of a general manager, an assistant general manager, a kitchen manager, and one or two assistant managers depending on restaurant sales volumes. The management team of each restaurant is responsible for the day-to-day operation of that restaurant, including hiring, training, and developing of team members, as well as operating results. Our typical restaurant employs approximately 65 hourly team members, most of whom work part-time.
For our new restaurants, we try to identify seasoned leadership teams 12 months in advance of opening, with the expectation that seasoned leadership will provide a better team member and guest experience while enabling a new restaurant to quickly reach normalized operations.
3
Learning and Development
We strive to maintain quality and consistency in each of our restaurants through the training and supervision of team members and the establishment of, and adherence to, high standards relating to personnel performance, food and beverage preparation and production as well as the maintenance of our restaurants. Each restaurant has a core group of certified learning coaches who provide on-the-job instruction for new team members who must complete a final certification for their position. These certified learning coaches participate in a "train-the-trainer" workshop that provides them with knowledge and tactics to enable them to coach our team members to meet our standards.
Restaurant managers are required to complete a Management Foundations training program in one of our certified training restaurants that includes guest service, kitchen and management responsibilities. Newly trained managers are then assigned to their home restaurant where they obtain ongoing training with their general manager. We place a high priority on our continuing management development programs in order to ensure that qualified managers are available and prepared for future restaurant openings and to fill open management positions. We utilize periodic scorecards for ongoing coaching and conduct annual performance reviews with each manager to discuss prior performance and future performance goals. Annually, we hold a leadership conference during which our general managers receive additional training in areas such as on leadership, food safety, management systems, hospitality, and other relevant topics.
For new restaurants, team members complete a training process to ensure the smooth and efficient operation of the restaurant from the first day it opens to the public. We also continue to enhance our manager training curriculum to better prepare new managers for the challenging environment that a new restaurant creates so they can confidently execute our processes, systems, and values.
Prior to opening a new restaurant, our training and opening team travels to the new restaurant location to prepare for an intensive training program for all team members hired for the new restaurant opening. Part of the training team remains on-site for a period after the opening of the restaurant while an additional team of training support provides several weeks of on-site support following opening.
Quality Control and Purchasing
Our food safety and quality assurance programs help manage our commitment to quality ingredients and food preparation. Our systems are designed to protect our food supply from product receipt through preparation and service. We provide detailed specifications for our food ingredients, products, and supplies to our suppliers. We qualify and audit our manufacturers and growers. Our restaurant managers are certified in a comprehensive safety and sanitation course by the National Restaurant Association's ServSafe program. Minimum cooking requirements, specifically safe handling and cooling procedures, and frequent temperature and quality checks ensure the safety and quality of all food we serve in our restaurants. In order to provide the freshest ingredients and products and to maximize operating efficiencies between purchase and usage, each restaurant's management team determines the restaurant's daily usage requirements for food ingredients, products and supplies, and accordingly, orders from approved suppliers and distributors. The restaurant management team inspects deliveries to ensure that the products received meet our safety and quality specifications. Additionally, we utilize the services of an independent auditing company to perform unannounced comprehensive food safety and sanitation inspections in all Red Robin® restaurants.
To maximize our purchasing efficiencies and obtain the best possible prices for our high-quality ingredients, products and supplies, our centralized purchasing team negotiates supply agreements which may include fixed price contracts that vary in term lengths or formula based pricing agreements which can fluctuate on changes in raw material commodity pricing. Ground beef represented approximately 14% of our total cost of goods in fiscal year 2013 and chicken represented approximately 10%. In fiscal year 2014, we expect our cost of ground beef to increase 4 to 5% from fiscal year 2013. Our contracts for chicken are generally fixed price contracts for a fixed term with multiple suppliers and we do not anticipate any significant increases in costs of chicken in fiscal year 2014. In addition, we have entered into supply agreements for our steak fries, fry oil, ketchup and select other commodities at prices that are, in aggregate, slightly above 2013 levels. We monitor the primary commodities we purchase and extend contract positions when applicable in order to minimize the impact of fluctuations in price and availability. However, certain commodities, primarily ground beef, remain subject to market price fluctuations. We continue to identify competitively priced, high quality alternative manufacturers, suppliers, growers, and distributors that are available should the need arise; however, we have not experienced significant disruptions in our supply chain.
4
Restaurant Development
Red Robin seeks to grow its restaurant base prudently considering a number of factors including general economic conditions, expected financial performance, availability of appropriate locations, competition in local markets and the availability of teams to manage new locations. We believe that site selection is critical to our success and thus we devote substantial time and effort evaluating each prospective site. Our site selection criteria focuses on identifying markets, trade areas and specific sites that are likely to yield the greatest density of desirable demographic characteristics, heavy retail traffic, and high visibility. Over the past three years, we have opened a total of 48 new restaurants, relocated three units, and closed two restaurants.
In 2011, we introduced Red Robin's Burger Works®, a smaller non-traditional prototype with a limited menu and limited service that we are developing in order to serve the needs of our guests in markets where full-sized sites are not available, such as central business districts, urban areas and other non-traditional sites. We expect most Red Robin's Burger Works® restaurants to range between 1,800 and 2,200 square feet and compete with other fast-casual chains for time pressed guests seeking higher quality food than from quick-service chains. We have opened six Red Robin's Burger Works® restaurants since November 2011 and we continue to evaluate the results of different types of trade areas as well as optimize operating performance. The underlying restaurant performance has been mixed with sales at our central business district and lifestyle trade areas performing as expected and our college campus locations performing below our expectations. For 2014, we plan to focus our Red Robin’s Burger Works® development efforts in central business district locations while we consider the viability of college campus sites.
During 2014, the Company expects to open 20 new Company-owned full and mid-size Red Robin® restaurants in addition to five Red Robin's Burger Works®. The costs of a full-sized 6,000 square foot Red Robin® restaurant and a mid-sized 4,400 square foot Red Robin® restaurant range from $1.8 to $2.0 million and $1.3 to $1.8 million, respectively, depending on location (stand alone, mall or in-line retail) assuming it is a leased location. The cost of a Red Robin's Burger Works® ranges from $0.5 million to $0.8 million.
Restaurant Franchise and Licensing Arrangements
As of December 29, 2013, we had 18 franchisees that were operating 134 restaurants in 20 states and two Canadian provinces. In fiscal year 2013, our franchisees closed one restaurant and opened two new restaurants. We expect that our franchisees will open up to two new restaurants in fiscal year 2014. Our two largest franchisees own 21 restaurants located in Michigan and Ohio and 20 restaurants in eastern Pennsylvania, respectively.
While we have not actively sought new franchisees in recent years, we are reviewing opportunities to expand our franchise program which, long term, may include development of new franchises and new geographic regions; optimize our mix of company owned restaurants and franchised restaurants; and work with our existing franchisees to open new franchised restaurants where there are attractive development opportunities. In fiscal year 2013, we granted an existing franchisee exclusive territory to open 5 Red Robin® restaurants in western Texas.
Our typical franchise arrangement consists of an area development agreement ("ADA") and a separate franchise agreement for each restaurant. Our current form of ADA grants the franchisee the exclusive right to develop restaurants in a defined area over a defined term, which is usually five years. Upon execution of the ADA, a franchisee pays us a $10,000 development fee for each restaurant the franchisee agrees to develop. At this time, we have two ADAs with two franchisees. For existing franchisees that do not have a current ADA, we may negotiate individually the terms under which they may develop additional restaurants.
When a franchisee opens a new restaurant, we collect a franchise fee of $25,000, which is in addition to the development fee we collect from the franchisee under the ADA. The franchise agreement for the restaurant authorizes the franchisee to operate the restaurant using our trademarks, service marks, trade dress, operating systems, recipes, manuals, processes, and related items. The franchise agreement typically grants the franchisee an initial term of 20 years and the option to extend the term for an additional 10 years provided the franchisee satisfies certain conditions.
We recognize area development fees and franchise fees as income when we have performed all of our material obligations and initial services, including assistance in developing and opening the restaurant, related to each fee or when the ADA terminates with unused fees for undeveloped restaurants. Until earned, we account for these fees as an accrued liability. Our standard form of franchise agreement requires the franchisee to pay a royalty fee equal to 4.0% of adjusted gross restaurant sales. However, certain franchisees pay royalty fees ranging from 3.0% to 3.5% of adjusted gross restaurant sales under agreements we negotiated with those franchisees in prior years.
5
Franchise Compliance Assurance
We actively work with and monitor our franchisees' performance to help them develop and operate their restaurants in compliance with Red Robin's systems and procedures. During the restaurant development phase, we review the franchisee's site selection and provide the franchisee with our prototype building plans. We provide trainers to assist the franchisee in opening the restaurant for business. We advise the franchisee on all menu items, management training, and equipment and food purchases. On an ongoing basis, we conduct brand equity reviews of all franchise restaurants to determine their level of effectiveness in executing our concept.
To continuously improve our marketing programs and operating systems, we maintain an advertising advisory council comprised of corporate and franchisee members. Through this council, we solicit the input of our franchisees on marketing programs, including their suggestions as to which new menu items we should test and feature in future promotions. We also exchange best operating practices with our franchisees as we strive to improve our operating systems while attaining a high level of franchisee participation.
Information Technology
We rely on information systems in all aspects of our operations, including (but not limited to) point-of-sale transaction processing in our restaurants; operation of our restaurants; management of our inventories; collection of cash; payment of payroll and other obligations; and various other processes and procedures.
Our corporate offices and Company-owned restaurants are enabled with information technology and decision support systems. In our restaurants, these systems are designed to provide operational tools for sales, inventory, and labor management. This technology includes industry-specific, off-the-shelf systems, as well as proprietary software such as tools designed to optimize food and beverage costs and labor costs. These systems are integrated with our point-of-sale systems to provide daily, weekly and period-to-date information that is important for managers to run an efficient and effective operation, and to provide financial reporting information. We also use other systems to interact with our guests. These include an online guest feedback system, which provides real-time results on guest service, food quality, and atmosphere to each of our restaurants.
We also utilize centralized financial, accounting, and human resources/personnel systems for Company-owned restaurants. In addition, we use an operations scorecard which integrates data from our centralized systems with the distributed information managed in our restaurants. We believe these combined tools are important in analyzing and improving our operations, profit margins and other results.
In order to increase efficiency and operational capabilities, we have committed to a significant capital investment to upgrade and expand some of these systems. In 2013, we completed the deployments of a new labor management system and a new financial management system to our Company-owned restaurants. In 2014, we will continue to invest in our systems as we implement a major overhaul of our data infrastructure, including the replacement of our supply chain management system.
We accept electronic payment cards from our guests for payment in our restaurants. We also receive and maintain certain personal information about our guests and team members. We have systems and processes in place that focus on the protection of our guests' credit card information and other private information that we are required to protect, such as our team members' personal information. We have taken a number of steps to prevent the occurrence of security breaches in this respect. Our systems have been carefully designed and configured to protect against data loss or compromise. For example, because of the number of credit card transactions processed in our Company-owned stores, we are required to maintain the highest level of Payment Card Industry ("PCI") Data Security Standard compliance at our corporate offices and Company-owned restaurants. These standards, set by a consortium of the major credit card companies, require certain levels of system security and procedures to protect our customers' credit card and other personal information. Our credit card security practices and systems are certified as compliant with the PCI Data Security Standard annually by an independent, qualified security assessor.
We also engage other security assessors and auditors to review and advise us on our other data security practices with respect to protection of other sensitive personal information that we obtain from guests and team members.
6
Marketing and Advertising
We build brand equity and awareness primarily through national marketing, including national television, digital, social media programs, email, loyalty and public relations initiatives. These programs are funded primarily through cooperative creative development and national media advertising funds.
In recent years, we have undertaken significant market research initiatives to gain feedback and perceptions in order to inform our business decisions. Among other things, we use a guest satisfaction tool in all restaurants that provides immediate feedback from guests, via the Internet or by phone, on their experiences. Restaurant managers use this information to help them identify areas of focus to strengthen restaurant performance and track progress. We also continually monitor our national brand equity scores and business drivers among both current and potential guests, and we track the frequency and purchase behavior of guests who are members of our Red Robin Royalty
TM
loyalty program. In fiscal year 2012, we began testing our brand transformation program to enhance our service, menu, food presentation and other guest experiences. Our brand transformation goal is to maintain our position as a go-to place for families while attracting more visits from adult guests dining together. In fiscal year 2013, we implemented key service changes, a new menu format, new plating and food presentation and remodeled another 19 restaurants to our new brand standards.
A key focus for us continues to be delivering innovative menu items consistent with our gourmet burger positioning and doing so at an everyday value to our guests. Our fiscal year 2012 marketing strategy included the launch of our Tavern Double platform for an everyday value starting price of $6.99 with bottomless fries as well as limited time offers ("LTOs") supported by national television advertising. All were supported with in-restaurant marketing materials. In fiscal year 2013 we moved to a continuity media plan and new ad campaign ("A Million Reasons") and focused our media less on LTOs. We also introduced the first burger in the Red Robin's Finest line in fiscal year 2013 to add premium burger options to our menu.
Team Members
As of December 29, 2013, we had 24,336 employees, to whom we refer as team members, consisting of 24,021 team members at Company-owned restaurants and 315 team members at our corporate headquarters and field offices. None of our team members are covered by a collective bargaining agreement. We consider our team member relations to be good.
We support our team members by offering competitive wages and benefits for eligible team members, including medical and other insurance, an employee stock purchase plan and equity-based awards for eligible corporate and operations employees at the director level and above. We motivate and prepare our team members by providing them with opportunities for increased responsibilities and advancement. At certain levels, we also offer performance-based incentives tied to sales, profitability, and/or certain qualitative measures.
Executive Officers
The following table sets forth information about our executive officers:
|
Name
|
Age
|
Position
|
|||
|
Stephen E. Carley
|
61
|
|
Chief Executive Officer
(1)
|
||
|
Eric C. Houseman
|
46
|
|
President and Chief Operating Officer
|
||
|
Todd A. Brighton
|
56
|
|
Senior Vice President and Chief Development Officer
|
||
|
Stuart B. Brown
|
48
|
|
Senior Vice President and Chief Financial Officer
|
||
|
Cathy Cooney
|
62
|
|
Senior Vice President and Chief People Officer
|
||
|
Michael L. Kaplan
|
45
|
|
Senior Vice President, Secretary and Chief Legal Officer
|
||
|
Chris Laping
|
41
|
|
Senior Vice President and Chief Information Officer
|
||
|
Denny Marie Post
|
56
|
|
Senior Vice President and Chief Marketing Officer
|
||
(1)
Also a member of the Company's board of directors.
Stephen E. Carley.
Mr. Carley was appointed Chief Executive Officer in September 2010. He previously served from April 2001 until September 2010 as the Chief Executive Officer of El Pollo Loco, a privately held restaurant company headquartered in Costa Mesa, California. Prior to his service at El Pollo Loco, Mr. Carley served in various management positions with several companies, including PhotoPoint Corp., Universal City Hollywood, PepsiCo Inc., and the Taco Bell Group.
Eric C. Houseman.
Mr. Houseman joined Red Robin in 1993. He was appointed President and Chief Operating Officer of Red Robin in August 2005. He previously served as Vice President of Operations from March 2000 until August 2005,
7
Director of Operations—Oregon/Washington from January 2000 to March 2000, Senior Regional Operations Director from September 1998 to January 2000, and General Manager from January 1995 to September 1998.
Todd A. Brighton.
Mr. Brighton joined Red Robin in April 2001 as Vice President of Development. He was appointed Senior Vice President and Chief Development Officer in August 2005. From August 1999 until his employment with Red Robin, Mr. Brighton worked for RTM Restaurant Group in Atlanta, Georgia as Director of Real Estate.
Stuart B. Brown.
Mr. Brown joined Red Robin as Senior Vice President and Chief Financial Officer in September 2011. From October 2006 until joining the Company, Mr. Brown served as Chief Financial Officer of DCT Industrial Trust Inc., a publicly traded real estate investment trust. Prior to his role at DCT Industrial Trust Inc., Mr. Brown was Vice President and Chief Accounting Officer of Federal Realty Investment Trust, from 2003 to 2006. Mr. Brown also served as Vice President, Finance at Giant Food, Inc., a domestic retail grocery chain that is part of the Netherlands-based Royal Ahold supermarket company, and in other corporate and operational finance positions at Royal Ahold over approximately ten years.
Cathy Cooney.
Ms. Cooney joined the Company as Senior Vice President and Chief People Officer in July 2013. Ms. Cooney previously served as Executive Vice President, Human Resources of CareFusion Corporation from September 2009 to June 2011 and prior its spinoff she served as Senior Vice President, Human Resources-Clinical and Medical Products of Cardinal Health from July 2008 to September 2009. She was Senior Vice President, Human Resources-Clinical Technologies and Services from September 2004 to July 2008 and Senior Vice President, Human Resources-Leadership Development of Cardinal Health from January 2003 to September 2004.
Michael L. Kaplan.
Mr. Kaplan joined Red Robin as Senior Vice President, Chief Legal Officer and Secretary in October 2013. Prior to joining the Company, he served as Senior Vice President, General Counsel, Chief Security Officer and Corporate Secretary of DAE Aviation Holdings, Inc. (d/b/a Standard Aero), a privately held global aviation maintenance company, from January 2010 to September 2013 and as a Shareholder at Greenberg Traurig, LLP, an international law firm, from January 2002 to January 2010.
Chris Laping.
Mr. Laping joined Red Robin as Vice President and Chief Information Officer in June 2007 and was promoted to Senior Vice President in February 2011. Mr. Laping brings more than 20 years of information technology and business transformation experience to Red Robin. Prior to joining Red Robin, Mr. Laping worked at Statêra, Inc. from February 2006 to June 2007 as Principal and Chief Information Officer and served as a technology consultant to the Company. Before working as a consultant, Mr. Laping worked from 2001 until 2006 as a Vice President and Chief Information Officer for GMAC Commercial Holding Capital Corp.
Denny Marie Post.
Ms. Post joined the Company as Chief Marketing Officer in August 2011. Before joining Red Robin, Ms. Post was the Managing Member of mm&i Consulting LLC, a marketing consulting firm, from June 2010 to July 2011. She served as Senior Vice President, Chief Marketing Officer of T-Mobile USA from July 2008 to May 2010, as Senior Vice President, Global Beverage, Food and Quality at Starbucks Corporation from February 2007 to June 2008, as Senior Vice President, Chief Concept Officer of Burger King Corp. from April 2004 to January 2007, and prior to that, in various marketing executive roles at YUM! Brands, Inc.
Competition
The restaurant industry is highly competitive and our guests may choose to purchase food at supermarkets or other food retailers. We compete against other segments of the restaurant industry, including quick-service and fast-casual restaurants. The number, size and strength of competitors vary by region, concept, market and even restaurant. We compete on the basis of taste, quality, price of food offered, guest service, ambiance, location, and overall dining experience. In particular, we face competition from concepts focused on the sale of hamburgers, including quick service and fast casual. Many of these concepts are expanding faster than us and are penetrating both geographic and demographic markets that we target as well. Moreover, many of these concepts compete with smaller-sized building units, which allow them greater flexibility in site selection and market penetration.
We believe that our guest demographics, strong brand recognition, gourmet burger concept, attractive price-value relationship, and the quality of our food and service enable us to differentiate ourselves from our competitors. We believe we compete favorably with respect to each of these factors. Many of our competitors are well-established national, regional, or local chains which may have substantial financial, marketing, and other resources. We also compete with many other restaurant and retail establishments for site locations and team members.
8
Seasonality
Our business is subject to seasonal fluctuations. Historically, sales in most of our restaurants have been higher during the summer months and winter holiday season due to factors including our retail-oriented locations and family appeal. As a result, our quarterly and annual operating results and comparable restaurant sales may fluctuate significantly as a result of seasonality. Accordingly, results for any one quarter or year are not necessarily indicative of results to be expected for any other quarter or for any year, and comparable restaurant sales for any particular future period may decrease.
Trademarks
We have a number of registered trademarks and service marks, including the Red Robin®, Red Robin Gourmet Burgers®, Red Robin America's Gourmet Burgers & Spirits®, Red Robin's Burger Works®, "YUMMM®", Red Robin Gourmet Burgers and Brews
TM
and Red Robin Royalty
TM
names and logos. We have registered or filed applications for trademarks for these marks, among others, with the United States Patent and Trademark Office and in Canada, and we have applied to register various trademarks in certain other international jurisdictions.
In order to better protect our brand, we have also registered the Internet domain name
www.redrobin.com
. We believe that our trademarks, service marks, and other intellectual property rights have significant value and are important to our brand building efforts and the marketing of our restaurant concept.
Government Regulation
Our restaurants are subject to licensing and regulation by state and local health, safety, fire, and other authorities, including licensing requirements and regulations for the sale of alcoholic beverages and food. To date, we have been able to obtain and maintain all necessary licenses, permits, and approvals. The development and construction of new restaurants is subject also to compliance with applicable zoning, land use, and environmental regulations. We are also subject to federal regulation and state laws that regulate the offer and sale of franchises and substantive aspects of the franchisor-franchisee relationship. Various federal and state labor laws govern our relationship with our team members and affect operating costs. These laws govern minimum wage requirements, overtime pay, meal and rest breaks, unemployment tax rates, health care and benefits, workers' compensation rates, citizenship or residency requirements, child labor regulations, and discriminatory conduct. Federal, state and local government agencies have established or are in the process of establishing regulations requiring that we disclose to our guests nutritional information regarding the items we serve.
Available Information
We maintain a link to investor relations information on our website,
www.redrobin.com
, where we make available, free of charge, our Securities and Exchange Commission ("SEC") filings, including our Annual Reports on Form 10-K, Quarterly Reports on Form 10-Q, Current Reports on Form 8-K and all amendments to those reports filed or furnished pursuant to Section 13(a) or 15(d) of the Securities Exchange Act of 1934, as amended (the "Exchange Act"), as soon as reasonably practicable after we electronically file such material with, or furnish it to, the SEC. All SEC filings are also available at the SEC's website at
www.sec.gov.
Our website and the information contained on or connected to our website are not incorporated by reference herein, and our web address is included as an inactive textual reference only.
Forward-Looking Statements
Certain information and statements contained in this report are forward-looking statements within the meaning of the Private Securities Litigation Reform Act of 1995 (the "PSLRA") codified at Section 27A of the Securities Act of 1933, as amended (the "Securities Act"), and Section 21E of the Exchange Act. This statement is included for purposes of complying with the safe harbor provisions of the PSLRA. Forward-looking statements include statements regarding our expectations, beliefs, intentions, plans, objectives, goals, strategies, future events or performance and underlying assumptions and other statements which are other than statements of historical facts. These statements may be identified, without limitation, by the use of forward-looking terminology such as "anticipate," "assume," "believe," "could," "estimate," "expect," "future," "intend," "may," "plan," "project," "will," "would," and similar expressions. Certain forward-looking statements are included in this Annual Report on Form 10-K, principally in the sections captioned "Business," "Legal Proceedings," "Consolidated Financial Statements" and "Management's Discussion and Analysis of Financial Condition and Results of Operations." Forward-looking statements relate to, among other things:
|
•
|
our business objectives and strategic plans, including the strength of our long-term growth and profit, expense management and operational efficiency and capital deployment opportunities;
|
|
•
|
our ability to attract new guests and retain loyal guests, and our initiatives targeted at adult guests;
|
|
•
|
any future price increases, and their effect on our revenue and profit;
|
9
|
•
|
the timing and cost of implementing a major overhaul of our information technology systems and data infrastructure including the replacement of several key operational and financial systems and related benefits;
|
|
•
|
our ability to open and operate additional restaurants in both new and existing markets profitably, the anticipated number and type of new restaurants and the timing of such openings;
|
|
•
|
estimated costs of opening and operating new restaurants, including general and administrative, marketing and franchise development costs, and the ability to effectively utilize alternative unit sizes;
|
|
•
|
anticipated restaurant operating costs, including commodity and food prices, labor and energy costs and selling, general and administrative expenses and ability to reduce overhead costs and improve efficiencies;
|
|
•
|
expected future revenues and earnings, comparable and non-comparable restaurant sales, results of operations, and future restaurant growth (both Company-owned and franchised);
|
|
•
|
our brand transformation initiatives, including the anticipated number of store remodels, financial performance and the timing of such remodeling;
|
|
•
|
anticipated Red Robin's Burger Works® development efforts;
|
|
•
|
anticipated advertising costs to support 2014 marketing activities and tactics, including our Red Robin Royalty
TM
program and the effect on revenue and guest counts;
|
|
•
|
future capital deployment strategies and the amounts of capital expenditures, including potential share repurchases, and new restaurant development;
|
|
•
|
our expectation that we will have adequate cash from operations and credit facility borrowings to meet all future debt service, capital expenditures, and working capital requirements in fiscal year 2014 and beyond;
|
|
•
|
anticipated compliance with debt covenants;
|
|
•
|
the sufficiency of the supply of commodities and labor pool to carry on our business;
|
|
•
|
our franchise program, and possible changes to our focus within the franchise program;
|
|
•
|
anticipated restaurant closings and related impairment charges;
|
|
•
|
anticipated interest and tax expense;
|
|
•
|
expectations about our interest rate swap;
|
|
•
|
the effect of the adoption of new accounting standards on our financial and accounting systems and analysis programs;
|
|
•
|
expectations regarding competition and our competitive advantages; and
|
|
•
|
expectations regarding consumer preferences and consumer discretionary spending.
|
Although we believe that the expectations reflected in our forward-looking statements are based on reasonable assumptions, such expectations may prove to be materially incorrect due to known and unknown risks and uncertainties.
In some cases, information regarding certain important factors that could cause actual results to differ materially from a forward-looking statement appears together with such statement. In addition, the factors described under Critical Accounting Policies and Estimates and Risk Factors, as well as other possible factors not listed, could cause actual results to differ materially from those expressed in forward-looking statements, including, without limitation, the following: the effectiveness of our business improvement initiatives; effectiveness of our marketing campaign; uncertainty regarding general economic conditions and economic recovery; concentration of restaurants in certain markets and lack of market awareness in new markets; changes in consumer disposable income; consumer spending trends and habits; ineffectiveness of our information technology efforts; regional mall and lifestyle center traffic trends; increased competition and discounting in the casual dining restaurant market; costs and availability of food and beverage inventory; changes in commodity prices, particularly ground beef; changes in energy and labor costs, including health care and market wage levels; limitations on the Company's ability to execute stock repurchases due to lack of available shares or acceptable stock price levels or other market or Company-specific conditions; our ability to attract qualified managers and team members; changes in the availability of capital or credit facility borrowings; costs and other effects of legal claims by team members, franchisees, customers, vendors, stockholders and others, including settlement of those claims or negative publicity regarding food safety or cyber security; effectiveness of management strategies and decisions; weather conditions and related events in regions where our restaurants are operated; and changes in accounting standards policies and practices or related interpretations by auditors or regulatory entities.
All forward-looking statements speak only as of the date made. All subsequent written and oral forward-looking statements attributable to us, or persons acting on our behalf, are expressly qualified in their entirety by the cautionary statements. Except as required by law, we undertake no obligation to update any forward-looking statement to reflect events or circumstances after the date on which it is made or to reflect the occurrence of anticipated or unanticipated events or circumstances.
10
An investment in our common stock involves a high degree of risk. You should carefully read and consider the risks described below before making an investment decision. The occurrence of any of the following risks could materially harm our business, financial condition, results of operations, or cash flows. The trading price or value of our common stock could decline, and you could lose all or part of your investment. When making an investment decision with respect to our common stock, you should also refer to the other information contained or incorporated by reference in this Annual Report on Form 10-K, including our consolidated financial statements and the related notes.
Risks Related to Our Business
Our business improvement initiatives may not continue to be successful or achieve the desired results, in a timely fashion.
We continue to evolve our business improvement initiatives that are designed to both improve the Company's results in the short term and create sustainable growth in the long term. These initiatives continue to focus on enhancing our guest experience to increase top line revenue, improving operating efficiency and expense management, and growing our restaurant base through new Company-owned and franchised restaurants. They include our initiatives to elevate our guest experience through our brand transformation initiative and to upgrade our information technology systems, and the development of varying size restaurant prototypes to expand our ability to grow our restaurant base. While many of these initiatives have been implemented in various stages and are generating positive results, there is no assurance that these initiatives and the projects undertaken to accomplish such initiatives will continue to be successful, or that the Company has, or will have sufficient resources to fully and successfully implement, sustain results from, or achieve additional expected benefits from them.
Our marketing and branding strategies to attract, engage and retain our guests may not be successful, which could negatively affect our business.
We continue to evolve our marketing and branding strategies in order to appeal to customers and compete effectively to attract, engage and retain customers. Our unique loyalty program, "Red Robin Royalty™" has experienced some success in driving sales and guest counts by providing loyal guests with various incentives and rewards. We intend to continue our focus on serving families while targeting adult occasions, and to grow beverage and food sales, including alcoholic beverages, appetizers, and desserts, through menu and service enhancements. We do not have any assurance that our marketing strategies will be successful. If new advertising, modified branding, and other marketing programs and methods are not successful, we may not generate the level of restaurant sales we expect and the expense associated with these programs may negatively affect our financial results. Moreover, many of our competitors have larger marketing resources and more extensive national marketing strategies and media usage, and we may not be able to successfully compete against those established programs.
As part of our marketing efforts, we rely on search engine marketing and social media platforms such as Facebook® and Twitter® to attract and retain guests. There are a variety of risks associated with the use of social media, including the improper disclosure of proprietary information, negative comments about the Company, exposure of personally identifiable information, fraud, or out-of-date information. The inappropriate use of social media vehicles by our guests or team members could increase our costs, lead to litigation or result in negative publicity that could damage our reputation.
Our success depends on our ability to effectively compete in the restaurant industry to attract and retain guests.
Competition in the restaurant industry is intense and barriers to entry are low. Our competitors include a large and diverse group of restaurants in all segments ranging from quick serve and fast casual to "polished casual" and those verging on fine dining. These competitors range from independent local operators that have opened restaurants in various markets, high growth targeted "better" burger concepts in the quick serve and fast casual space, to the well-capitalized national restaurant companies. Many of these concepts have already captured segments of the market that we are targeting, such as adult-only occasions, and are expanding faster than we are, penetrating both desirable geographic and demographic markets. Many of our competitors are well established in the casual dining market segment and in certain geographic locations and some of our competitors have substantially greater financial, marketing, and other resources than we have available. Accordingly, they may be better equipped than us to increase marketing or to take other measures to maintain their competitive position, including the use of significant discount offers to attract guests. Our guests may also choose to purchase food at supermarkets or other food retailers.
We also compete with other restaurants and retail establishments for real estate and attractive locations including locations for our smaller prototype restaurants, Red Robin's Burger Works
®
. There is no assurance that these smaller prototypes will successfully compete with other restaurant concepts.
11
Uncertainty regarding continued weakness in the economic environment may negatively affect consumer spending and guest visits, which may negatively affect our revenues and our results of operations and may continue to do so in the future.
Continued uncertainty regarding economic conditions and the rate of economic recovery affects the restaurant industry, and may negatively affect the results of operations and financial condition of the Company and its customers, distributors, and suppliers. These conditions include continued unemployment, weakness and lack of consistent improvement in the housing markets; downtrend or delays in residential or commercial real estate development; volatility in financial markets; inflationary pressures; and reduced consumer confidence. As a result, our guests may continue to remain apprehensive about the economy and maintain or further reduce their level of discretionary spending. This could affect the frequency with which our guests choose to dine out or the amount they spend on meals, thereby decreasing our revenues and potentially negatively affecting our operating results. We believe there is a risk that prolonged negative or uncertain economic conditions might cause consumers to make long-lasting changes to their discretionary spending behavior, including dining out less frequently on a more permanent basis, which would have a negative effect on our business. Moreover, our restaurants are primarily located near high density retail areas such as regional malls, lifestyle centers, big box shopping centers, and entertainment centers. We depend on a high volume of visitors at these centers to attract guests to our restaurants. A decline in development or closures of businesses in these settings or a decline in visitors to retail areas near our restaurants could negatively affect our restaurant sales.
If the implementation of our upgraded information technology systems continues to be delayed, or there is a material failure in such systems, our business operations and profits could be negatively affected, and our systems may be inadequate to support our future growth strategies.
We rely heavily on information technology systems in all aspects of our operations including our restaurant point-of-sale systems, financial systems, marketing programs, employee engagement, supply chain management, and various other processes and transactions. Our ability to effectively manage and run our business depends on the reliability and capacity of our information technology systems, including technology services and systems for which we contract from third parties.
In order to increase efficiency and operational capabilities and to support growth, we committed to a significant capital investment to upgrade and expand our information technology systems and services. We have encountered ongoing challenges and delays in implementing our upgraded infrastructure system which has caused delays in realizing anticipated benefits and additional costs. If the expansion and stabilization of such systems and services, which are currently underway, continue to be delayed, are unsuccessful or otherwise do not accomplish our intended goals, our operations could be significantly affected, and, among other things, our ability to efficiently manage or scale material functions in our operations could be impaired. Despite the significant capital investment to upgrade the systems and services identified above, these new systems and services may be insufficient to achieve or continue to achieve the expected results. These systems and our business needs will continue to evolve and require upgrading and maintenance over time, consequently requiring additional significant future commitments of resources and capital.
We rely on our management team for the development and execution of our business strategy and the loss of any member of our management team could negatively affect our operating results.
Our key team members, particularly our executive team, are central to our success and difficult to replace. We may be unable to retain them or attract other highly qualified team members, particularly if we do not offer competitive employment terms. The loss of the services of any of our management team or the failure to implement an appropriate succession plan could prevent us from achieving our business strategy and initiatives, which could adversely affect our operating results.
Our operations are susceptible to the changes in cost and availability of commodities which could negatively affect our operating results.
Our profitability depends in part on our ability to anticipate and react to changes in commodity costs. Various factors beyond our control, including adverse weather conditions, governmental regulation and monetary policy, product availability, recalls of food products, and seasonality, as well as the effects of the current macroeconomic environment on our suppliers, may affect our commodity costs or cause a disruption in our supply chain. In an effort to mitigate some of this risk, we have entered into fixed price agreements on some of our food and beverage products, including certain proteins, produce and cooking oil. As of the end of fiscal year 2013, approximately 46% of our estimated fiscal 2014 annual food and beverage purchases were covered by fixed price contracts, most of which are scheduled to expire at various times during fiscal year 2014. Changes in the price or availability of commodities for which we do not have fixed price contracts could have a material adverse affect on our profitability. Expiring contracts with our food suppliers could also result in unfavorable renewal terms and therefore increase costs associated with these suppliers or may necessitate negotiations with alternate suppliers. We may be unable to obtain favorable contract terms with suppliers or adjust our purchasing practices and menu prices to respond to changing food costs, and a failure to do so could negatively affect our operating results.
12
Price increases may negatively affect guest visits.
We may make future price increases, primarily to offset increased costs and operating expenses. We cannot provide assurance that any future price increases will not deter guests from visiting our restaurants, reduce the frequency of their visits, or affect their purchasing decisions.
Changes in consumer preferences could negatively affect our results of operations.
The restaurant industry is characterized by the continual introduction of new concepts and is subject to rapidly changing consumer preferences, tastes and eating and purchasing habits. Our restaurants compete on the basis of a varied menu and feature burgers, salads, soups, appetizers, other entrees, desserts, and our signature alcoholic and non-alcoholic beverages in a family-friendly atmosphere. Our continued success depends, in part, upon the continued popularity of these foods and this style of casual dining. Shifts in consumer preferences away from this cuisine or dining style could have a material adverse effect on our future profitability. In addition, competitors' use of significant advertising and food discounting could influence our guests' dining choices. One of our strategies moving forward is to shift to a balance of providing both family-friendly and adult-focused guest experiences, referencing our legacy. There is no assurance that this shift will be successful or that it will not negatively affect our family guest experience.
Further, changing health or dietary preferences may cause consumers to avoid our products in favor of alternative foods. The food service industry as a whole rests on consumer preferences and demographic trends at the local, regional, national and international levels, and the effect on consumer eating habits of new information regarding diet, nutrition and health. New laws requiring additional nutritional information to be disclosed on our menus, changes in nutritional guidelines issued by the federal government agencies, issuance of similar guidelines or statistical information by other federal, state or local municipalities, or academic studies, among other things, may affect consumer choice and cause consumers to significantly alter their dining choices in ways that adversely affect our sales and profitability.
The failure of or security breach involving our information technology systems could interrupt our business, damage our reputation and negatively affect our operations and profits.
Our information technology systems, including technology services and systems for which we contract from third parties, communication systems and electronic data could be subject or vulnerable to damage or interruption from earthquakes, terrorist attacks, floods, fires, power loss, telecommunications failures, computer viruses, loss of data, unauthorized data breaches or other attempts to harm our systems. A failure of these systems to operate effectively, problems with transitioning to upgraded or replacement systems, or any other failure to maintain a continuous and secure cyber network could result in interruption to our services, adversely affect our reputation, and negatively impact our results of operations.
Moreover, we accept electronic payment cards from our guests for payment in our restaurants. We also receive and maintain certain personal information about our guests and team members. A number of restaurant operators and retailers have experienced security breaches in which credit and debit card information may have been stolen. If we experienced a security breach, we could become subject to claims, lawsuits or other proceedings for purportedly fraudulent transactions arising out of the theft of credit or debit card information, compromised security and information systems, failure of our employees to comply with applicable laws, the unauthorized acquisition or use of such information by third parties, or other similar claims. Any such incidents or proceedings could adversely affect our reputation and our results of operations, and could result in the imposition of penalties or cause us to incur significant unplanned losses and expenditures, including those necessary to remediate any damage to persons whose personal information may have been compromised.
Because of the number of credit card transactions processed in our Company-owned restaurants, we are required to maintain the highest level of Payment Card Industry ("PCI") Data Security Standard compliance at our corporate offices and Company-owned restaurants. If we do not maintain the required level of PCI compliance, we could be subject to costly fines or additional fees from the card brands that we accept, or lose our ability to accept those payment cards. Our franchisees are separate businesses that have different levels of compliance required depending on the number of credit card transactions processed. If any failure by them to maintain the appropriate level of PCI compliance negatively impacts their business operations, we could face a loss of or reduction in royalties or other payments they are required to remit to us.
Expanding our restaurant base is critical to our long-term growth, and our ability to open and profitably operate new restaurants is subject to factors beyond our control.
Our initiatives include a focus on continued growth of our restaurant base through new restaurants. The expansion of our restaurant base depends in large part on our ability and the ability of our franchisees to timely and efficiently open new restaurants and to operate these restaurants on a profitable basis. Delays or failures in opening new restaurants, or the inability to profitably operate them once opened, could materially and adversely affect our planned growth. The success of our
13
expansion strategy and the success of new restaurants depends upon numerous factors, many of which are beyond our control, including the following:
|
•
|
improvement in the macroeconomic environment nationally and regionally that affects restaurant-level performance and influences our decisions on the rate of expansion, timing, and the number of restaurants to be opened;
|
|
•
|
identification of and ability to secure an adequate supply of available and suitable restaurant sites;
|
|
•
|
negotiation of favorable lease and construction terms;
|
|
•
|
cost and availability of capital to fund restaurant expansion and operation;
|
|
•
|
the availability of construction materials and labor;
|
|
•
|
our ability to manage construction and development costs of new restaurants;
|
|
•
|
timely adherence to development schedules;
|
|
•
|
securing required governmental approvals and permits and in a timely manner;
|
|
•
|
availability and retention of qualified operating personnel to staff our new restaurants, especially managers;
|
|
•
|
competition in our markets and general economic conditions that may affect consumer spending or choice;
|
|
•
|
our ability to attract and retain guests; and
|
|
•
|
our ability to operate at acceptable profit margins.
|
The Company is subject to the risks presented by acquisitions.
As part of our expansion efforts, the Company has acquired some of its franchised restaurants in the past. In the future, the Company may, from time to time, consider opportunistic acquisitions of restaurants operated by franchisees or other operators. Any future acquisitions will be accompanied by the risks commonly encountered in acquisitions. These risks include among other things:
|
•
|
the difficulty of integrating operations and personnel;
|
|
•
|
the potential disruption to our ongoing business;
|
|
•
|
the potential distraction of management, the inability to maintain uniform standards, controls, procedures and policies; and
|
|
•
|
impairment of relationships with team members and guests as a result of changes in ownership and management.
|
New or less mature restaurants, once opened, may vary in profitability and levels of operating revenue for six months or more.
New and less mature restaurants typically experience higher operating costs in both dollars and percentage of revenue initially when compared to restaurants in the comparable restaurant base. Although the average unit volumes and restaurant level profit margins have performed well on average in recent years, there is no assurance that new restaurants will continue to experience such successes, given the uncertain state of the economy. Our restaurants are currently taking approximately six months or more to reach normalized operating levels due to inefficiencies typically associated with new restaurants. These include operating costs, which are often significantly greater during the first several months of operation and fluctuating guest counts. Further, there is no assurance that our less mature restaurants will attain operating results similar to those of our existing restaurants.
The large number of Company-owned restaurants concentrated in the western United States makes us susceptible to changes in economic and other trends in that region and restaurant expansion in our existing markets could erode sales of our existing restaurants.
As of December 29, 2013, a total of 165 or 45.7% of all Company-owned restaurants, representing 53.4% of restaurant revenue, were located in the western United States (i.e., Arizona, California, Colorado, Nevada, Oregon, Idaho, New Mexico and Washington). As a result, we are particularly susceptible to negative trends and economic conditions in this region, including its labor market. As a result of the economic recession, we had a more substantial decline in guest traffic at our restaurants in the western United States, which has had a negative effect on our operations as a whole. In addition, given our geographic concentration, negative publicity regarding any of our restaurants in the western United States could have a material adverse effect on our business and operations, as could other regional occurrences such as local strikes, energy shortages, or increases in energy prices, droughts, earthquakes, fires, or other natural disasters.
Because we typically draw guests from a relatively small radius around each of our restaurants, the sales performance and guest counts for existing restaurants near the area in which a new restaurant opens may decline due to the opening of the new restaurant.
14
Our revenues and operating results may fluctuate significantly due to various risks and unexpected circumstances, including increases in costs, seasonality, weather, and other factors outside our control.
We are subject to a number of significant risks that might cause our actual quarterly and annual results to fluctuate significantly or be negatively affected. These risks include but are not limited to: extended periods of inclement weather which may affect guest visits as well as limit the availability and cost of key commodities such as beef, poultry, potatoes and other items that are important ingredients in our products; material disruptions in our supply chain; changes in borrowings and interest rates; changes to accounting methods or philosophies; impairment of long-lived assets, including goodwill, and losses on restaurant closures; unanticipated expenses from natural disasters and repairs to damaged or lost property.
Moreover, our business fluctuates seasonally. Historically, sales in most of our restaurants have been higher during the summer months and winter holiday season. As a result, our quarterly and annual operating results and comparable restaurant sales may fluctuate significantly as a result of seasonality and the factors discussed above. Accordingly, results for any one quarter or year are not necessarily indicative of results to be expected for any other quarter or for any year, and comparable restaurant sales for any particular future period may decrease.
Our franchisees could take actions that could harm our business, expose us to liability or damage our reputation.
Franchisees are independent entities and are not our employees, partners, or affiliates. We share with our franchisees what we believe to be best practices in the restaurant industry; however, franchisees operate their restaurants as independent businesses. Consequently, the quality of franchised restaurant operations may be diminished by any number of factors beyond our control. Moreover, franchisees may not successfully operate restaurants in a manner consistent with our standards and requirements or may not hire and train qualified managers and other restaurant personnel. In addition, as independent businesses, franchisees may not be required to comply with the same levels of business or regulatory compliance that we are. While we try to ensure that the quality of our brand and compliance with our operating standards, and the confidentiality thereof, are maintained by all of our franchisees, we cannot provide assurance that our franchisees will avoid actions that negatively affect the reputation of Red Robin or the value of our proprietary information. Our image and reputation and the image and reputation of other franchisees may suffer materially, and system-wide sales could significantly decline if our franchisees do not operate restaurants according to our standards.
Further, we are subject to federal and state laws that regulate the offer and sale of franchises and aspects of the licensor-licensee relationship. Failure to comply with these laws and regulations could subject us to liability for actions of the franchisees, or expose us to liability to franchisees, or fines and penalties for non-compliance.
Decreased cash flow from operations, or an inability to access credit could negatively affect our business initiatives or may result in our inability to execute our revenue, expense and capital deployment strategies.
Our ability to fund our operating plans and to implement our capital deployment strategies depends on sufficient cash flow from operations or other financing, including using funding under our revolving credit agreement. Our capital deployment strategies include but are not limited to repurchases of our stock, paying down debt, new restaurant development, our brand transformation initiative, investment in advertising, and franchise expansion. If we experience decreased cash flow from operations, our ability to fund our operations and planned initiatives, and to take advantage of growth opportunities, may be delayed or negatively affected. In addition, these disruptions or a negative effect on our revenues could affect our ability to borrow or comply with our covenants under our credit facility. Moreover, any repurchase by us of our shares of common stock will further reduce cash available for operations and future growth, as well as debt repayment.
Our future success depends on our ability to protect our intellectual property.
Our business prospects will depend in part on our ability to protect our proprietary information and intellectual property, including the Red Robin®, Red Robin Gourmet Burgers®, Red Robin America's Gourmet Burgers & Spirits®, Red Robin's Burger Works®, "YUMMM®", Red Robin Gourmet Burgers and Brews™ and Red Robin Royalty™ names and logos. We have registered or filed applications for trademarks for these names and logos, among others, with the United States Patent and Trademark Office and in Canada and we have applied to register various trademarks in certain other international jurisdictions. Our trademarks could be infringed in ways that leave us without redress, such as by imitation or by filings by others in jurisdictions where we are not currently registered. In addition, we rely on trade secrets and proprietary know-how in operating our restaurants, and we employ various methods to protect those trade secrets and that proprietary know-how. However, such methods may not afford adequate protection and others could independently develop similar know-how or obtain access to our know-how, concepts and recipes. Consequently, our business could be negatively affected and less profitable if we are unable to successfully defend and protect our intellectual property.
15
Risks Related to the Restaurant Industry
Food safety and food-borne illness concerns and any related unfavorable publicity could have an adverse effect on our business.
We dedicate substantial resources to ensuring that our guests enjoy safe, quality food products. Nonetheless, restaurant businesses such as ours can be adversely affected by publicity resulting from complaints or litigation regarding poor food quality, food-borne illness, personal injury, food tampering, adverse health effects of consumption of various food products or high-calorie foods, or other concerns. Food safety issues also could be caused by food suppliers or distributors and, as a result, could be out of our control. Regardless of the source or cause, any report of food-borne illnesses such as E. coli, hepatitis A, trichinosis or salmonella, and other food safety issues including food tampering or contamination, at one of our or a franchisee's restaurants, could adversely affect our reputation and have a negative impact on our sales. The occurrence of food-borne illnesses or food safety issues could also adversely affect the price and availability of affected ingredients, resulting in higher costs and lower margins.
Health concerns relating to the consumption of beef, chicken, or other food products could affect consumer preferences and could negatively affect our results of operations.
Consumer preferences could be affected by health concerns about food-related illness, the consumption of beef, the key ingredient in many of our menu items, or negative publicity or publication of government or industry findings concerning food quality, illness and injury. Further, consumers may react negatively to reports concerning our food products or health or other concerns or operating issues stemming from one or more of our restaurants. Such negative publicity, whether or not valid, may negatively affect demand for our food and could result in decreased guest traffic to our restaurants. A decrease in guest traffic to our restaurants as a result of these health concerns or negative publicity or as a result of a change in our menu or concept could materially harm our business and negatively affect our profitability.
Our business could be adversely affected by increased labor costs, including costs related to the increase in minimum wage and new heath care laws.
Labor is a primary component in the cost of operating our business. Increased labor costs, whether due to competition, unionization, increased minimum and tip wage, state unemployment rates, employee benefits costs or otherwise, may adversely impact our operating expenses. A considerable amount of our restaurant team members are paid at rates related to the federal or state minimum wage. Further, we have a substantial number of restaurants located in states or municipalities where the minimum wage is greater than the federal minimum wage, including California. California has enacted legislation that will increase its minimum wage from $8 an hour to $9 an hour effective July 2014, and then to $10 an hour effective January 2016. We anticipate that additional legislation increasing minimum wage standards will be enacted in future periods. The Patient Protection and Affordable Care Act of 2010 (the “PPACA”) includes provisions requiring health care coverage for all Americans beginning in 2014. In the past, many of our eligible team members chose not to participate in our Company sponsored health care plans for various reasons but we expect to continue to see increased enrollment and related costs due to the impact of changes in the health care laws. Our distributors and suppliers also may be affected by higher minimum wage or health care costs, which could result in higher costs for goods and services supplied to us. In addition, a shortage in the labor pool or other general inflationary pressures or changes could also increase our labor costs. In the past, we have been able to offset increases in labor costs by improving our productivity in our restaurants or taking gradual increases in pricing but there is no guarantee that we can continue to do so in the future. If our labor costs increase and we are not able to offset costs through productivity or efficiency gains, or pass along the costs in the form of increased prices to our guests, then it could have a material adverse effect on our results of operations.
Our failure to remain in compliance with governmental laws and regulations as they continually evolve, and the associated costs of compliance, could cause our business results to suffer.
Our business is subject to various federal, state, and local government laws and regulations, including, among others, those relating to our employees, public health and safety, food safety, nutritional disclosure, alcoholic beverage control, public accommodations, and financial and disclosure reporting and controls. These laws and regulations continually evolve and change. We may fail to maintain compliance with all laws and regulations despite our best efforts. Changes in applicable laws and regulatory requirements, or failure to comply with them could result in, among other things, increased exposure to litigation, administrative enforcement actions or governmental investigations or proceedings; revocation of required licenses or approvals; fines; and civil and criminal liability. These negative consequences could increase the cost of or interfere with our ability to operate our business and execute our strategies.
Various federal and state employment laws govern our relationship with our team members and affect operating costs. These laws govern employee classification, wage rates and payment requirements including tip credit laws, meal and rest breaks, unemployment and other taxes, health care and benefits, workers' compensation rates, citizenship or residency
16
requirements, labor relations, child labor regulations, and discriminatory conduct. Changes in these laws or our failure to comply with enforcement requirements could require changes to our operations that could harm our operating results. For example, although we require all of our team members to provide us with the government-specified documentation evidencing their employment eligibility, some of our team members, without our knowledge, may not meet federal citizenship or residency requirements, which could lead to a disruption in our work force.
We are subject to "dram shop" statutes in some states. These statutes generally allow a person injured by an intoxicated person to recover damages from an establishment that wrongfully served alcoholic beverages to such intoxicated person. Failure to comply with alcoholic beverage control or dram shop regulations could subject the Company to liability and could negatively affect our business.
A significant increase in litigation could have a material adverse effect on our results of operations, financial condition and business prospects.
As a member of the restaurant industry, we are sometimes the subject of complaints or litigation, including class action lawsuits, from guests alleging illness, injury, or other food quality, health, or operational concerns. Negative publicity resulting from these allegations could harm our restaurants, regardless of whether the allegations are valid or whether we are liable. In fact, we are subject to the same risks of negative publicity resulting from these sorts of allegations even if the claim actually involves one of our franchisees.
In addition, any failure by us to comply with the various federal and state labor laws governing our relationship with our team members including requirements pertaining to minimum wage, overtime pay, meal and rest breaks, unemployment tax rates, workers' compensation rates, citizenship or residency requirements, child labor regulations, and discriminatory conduct, may have a material adverse effect on our business or operations. We have been subject to such claims from time to time. The possibility of a material adverse effect on our business relating to employment litigation is even more pronounced given the high concentration of team members employed in the western United States, as this region, and California in particular, has a substantial amount of legislative and judicial activity pertaining to employment-related issues. Further, employee claims against us based on, among other things, discrimination, harassment, or wrongful termination may divert our financial and management resources that would otherwise be used to benefit the future performance of our operations.
None.
We currently lease the real estate for a majority of our Company-owned restaurant facilities under operating leases with remaining terms ranging from less than one year to just over 15 years excluding options to extend. These leases generally contain options which permit us to extend the lease term at an agreed rent or at prevailing market rates. Certain leases provide for contingent rents, which are determined as a percentage of adjusted gross restaurant sales in excess of specified levels. We record a contingent rent liability and the corresponding rent expense when specified levels have been achieved or when management determines that achieving the specified levels during the fiscal year is probable. Certain lease agreements also require the Company to pay maintenance, insurance, and property tax costs.
We own real estate for 31 Company-owned restaurants located in Arizona (3); Arkansas (2); California (1); Colorado (3); Georgia (1); Illinois (1); Indiana (1); Maryland (1); Missouri (1); North Carolina (3); Ohio (5); Pennsylvania (3); Virginia (4); and Washington (2). In addition, we own a property in Texas which we lease to others.
Our corporate headquarters is located in Greenwood Village, Colorado. We occupy this facility under a lease that expires on May 31, 2018. We opened a test kitchen and training facility in 2011 located in Englewood, Colorado. We occupy this facility under a lease that expires August 31, 2018.
Our traditional prototype restaurant is a freestanding building averaging approximately 6,000 square feet and approximately 200 seats. In 2012, we introduced a new, mid-sized prototype of our full service restaurant which is approximately 4,400 square feet and has approximately 145 seats. We typically operate our restaurants under ground leases for land on which we build our restaurants. However, we also have developed restaurants using in-line, end cap, and mall locations in addition to our conversions of existing restaurant and other retail structures. Our non-traditional prototype, Red Robin's Burger Works®, allows Red Robin to develop projects in high foot traffic and non-traditional locations such as urban areas/downtowns, stadiums, military bases and airports, as well as in regional retail centers. The typical Red Robin's Burger Works® prototype is between 1,800 and 2,200 square feet, with approximately 50 seats. As of
December 29, 2013
, we operated approximately 2.3 million square feet for both our Red Robin® and Red Robin’s Burger Works® restaurants.
17
In the normal course of business, there are various claims in process, matters in litigation and other contingencies. These include employment related claims and claims from guests or team members alleging illness, injury or other food quality, health or operational concerns. To date, no claims of these types of litigation, certain of which are covered by insurance policies, have had a material effect on the Company. While it is not possible to predict the outcome of these suits, legal proceedings and claims with certainty, management is of the opinion that adequate provision for potential losses associated with these matters has been made in the financial statements and that the ultimate resolution of these matters will not have a material adverse effect on our financial position and results of operations.
Not applicable.
18
Our common stock is listed on The NASDAQ Global Select Market under the symbol RRGB. The table below sets forth the high and low per share sales prices for our common stock as reported by The NASDAQ Global Select Market for the indicated periods (based on our fiscal quarters).
|
|
Sales Price
|
|||||||
|
|
High
|
Low
|
||||||
|
2013
|
|
|||||||
|
4th Quarter
|
$
|
84.20
|
|
$
|
71.34
|
|
||
|
3rd Quarter
|
74.17
|
|
55.82
|
|
||||
|
2nd Quarter
|
59.90
|
|
43.91
|
|
||||
|
1st Quarter
|
46.11
|
|
35.29
|
|
||||
|
2012
|
|
|
||||||
|
4th Quarter
|
$
|
35.13
|
|
$
|
27.18
|
|
||
|
3rd Quarter
|
34.21
|
|
27.80
|
|
||||
|
2nd Quarter
|
37.49
|
|
28.26
|
|
||||
|
1st Quarter
|
37.98
|
|
27.36
|
|
||||
As of February 20, 2014, there were approximately 124 registered owners of our common stock.
Dividends
We did not declare or pay any cash dividends on our common stock during fiscal years
2013
and
2012
. We currently anticipate that we will retain any future cash flow to fund our operations and expansion of our business, to pay down debt or to repurchase stock. In addition, our credit agreement may limit us from declaring or paying any dividends or making any other repurchases on any of our shares in an aggregate amount not to exceed $50 million and are subject to our leverage ratio. Accordingly, we do not anticipate declaring or paying any cash dividends on our common stock in the foreseeable future. Our credit agreement may also limit our ability to engage in stock repurchases.
Any future determination relating to our dividend policy will be made at the discretion of our board of directors and will depend on then existing conditions including our financial condition, results of operations, contractual restrictions, capital requirements, business prospects, and other factors our board of directors may deem relevant.
Issuer Purchases of Equity Securities
During the fiscal quarter ended
December 29, 2013
, the Company did not have any sales of securities in transactions that were not registered under the Securities Act that have not been reported in a Current Report on Form 8-K. The table below provides a summary of the Company's purchases of its own common stock during fourth quarter of fiscal year
2013
.
|
Period(1)
|
Total Number
of Shares (or
Units)
Purchased
|
Average
Price Paid
per Share
(or Unit)
|
Total Number of Shares
(or Units) Purchased as
Part of Publicly
Announced Plans or
Programs(2)
|
Maximum Number (or
Approximate Dollar Value)
of Shares (or Units) that
May Yet Be Purchased
Under the Plans or
Programs(2)
|
||||||||||
|
November 7, 2013 - November 29, 2013
|
19,146
|
|
$
|
80.01
|
|
56,034
|
|
$
|
45,965,458
|
|
||||
|
December 2, 2013 - December 29, 2013
|
12,782
|
|
$
|
75.80
|
|
68,816
|
|
$
|
44,996,628
|
|
||||
|
Pursuant to Publicly Announced Plans or Programs(2)
|
31,928
|
|
$
|
78.32
|
|
|
|
|
|
|||||
___________________________________
|
(1)
|
The reported periods conform to the Company's fiscal calendar composed of thirteen 28-day periods.
|
|
(2)
|
In November 2012, the Company’s board of directors re-authorized a repurchase of up to $50 million of the Company’s common stock. This authorization became effective on January 1, 2013, and will terminate upon completing the repurchase of $50 million of common stock unless earlier terminated by the Company’s board of
|
19
directors. Purchases may be made from time to time at the Company’s discretion and the timing and amount of any share repurchases will be determined based on share price, market conditions, legal requirements and other factors. The repurchase program may be suspended or discontinued at any time. Since January 1, 2013, the Company has purchased 68,816 shares for a total of $5.0 million. As of
December 29, 2013
, there was approximately $45.0 million remaining under the current board authorization for future stock repurchases.
Performance Graph
The following graph compares the yearly percentage in cumulative total stockholders' return on Common Stock of the Company since December 28, 2008, with the cumulative total return over the same period for (i) the Russell 3000 Index, and (ii) the Bloomberg U.S. Full Service Restaurant Index.
Pursuant to rules of the SEC, the comparison assumes $100 was invested on December 28, 2008, the last trading day in the Company's 2008 fiscal year, in the Company's Common Stock and in each of the indices.
This performance graph shall not be deemed to be "soliciting material" or to be "filed" under either the Securities Act or the Exchange Act.
COMPARISON OF 5 YEAR CUMULATIVE TOTAL RETURN*
Among Red Robin Gourmet Burgers, Inc., The Russell 3000 Index
and Bloomberg U.S. Full Service Restaurant Index
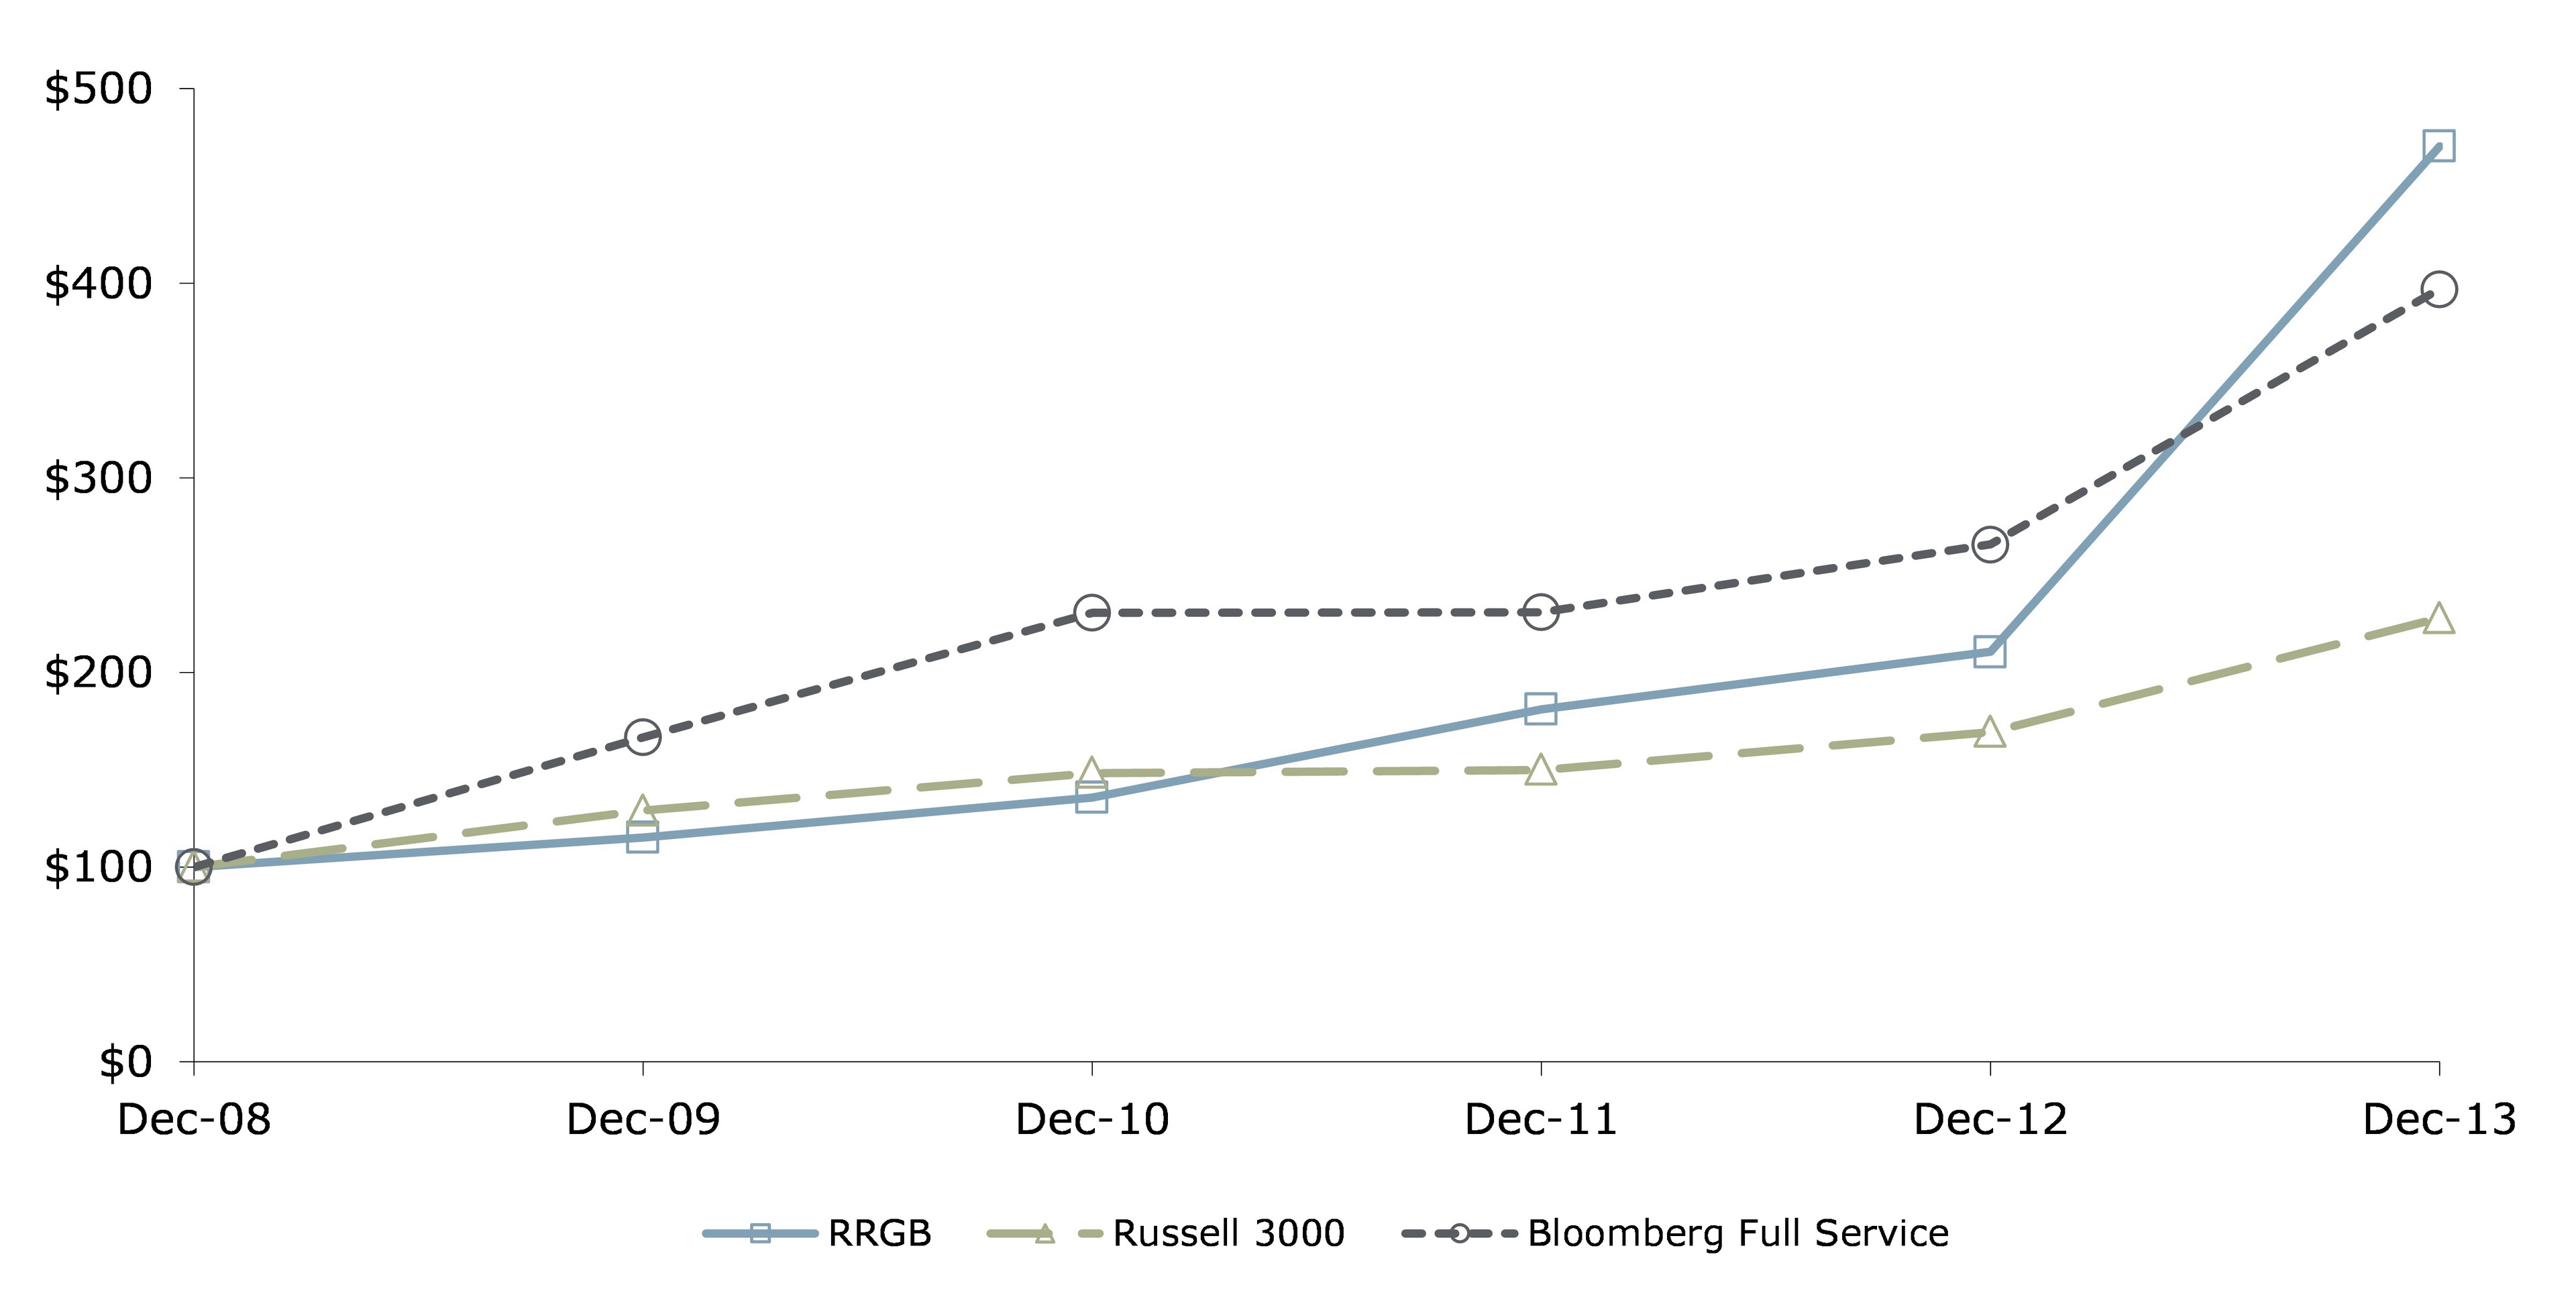
|
|
Fiscal Years Ended
|
||||||||||||||||||||||
|
|
December 28, 2008
|
December 27, 2009
|
December 26, 2010
|
December 25, 2011
|
December 30, 2012
|
December 29, 2013
|
|||||||||||||||||
|
Red Robin Gourmet Burgers, Inc.
|
$
|
100.00
|
|
$
|
115.07
|
|
$
|
135.65
|
|
$
|
181.05
|
|
$
|
210.51
|
|
$
|
470.36
|
|
|||||
|
Russell 3000
|
100.00
|
|
128.86
|
|
148.17
|
|
149.80
|
|
169.33
|
|
227.77
|
|
|||||||||||
|
Bloomberg U.S. Full Service Restaurant
Index
|
100.00
|
|
166.60
|
|
230.62
|
|
230.88
|
|
265.65
|
|
396.81
|
|
|||||||||||
___________________________________
|
*
|
$100 invested on 12/31/08 in stock or index, including reinvestment of dividends based on calendar years ending December 31 for purposes of comparability.
|
20
The table below contains selected consolidated financial and operating data. The statement of income, cash flow and balance sheet data for each fiscal year has been derived from our consolidated financial statements. You should read this information together with "Management's Discussion and Analysis of Financial Condition and Results of Operations" and our consolidated financial statements and the related notes included elsewhere in this Annual Report on Form 10-K.
|
Fiscal Year Ended
|
||||||||||||||||||||
|
|
December 29, 2013
|
December 30, 2012
|
December 25, 2011
|
December 26, 2010
|
December 27, 2009
|
|||||||||||||||
|
(in thousands, except per share data)
|
(52 Weeks)
|
(53 Weeks)
|
(52 Weeks)
|
(52 Weeks)
|
(52 Weeks)
|
|||||||||||||||
|
Statement of Income Data:
|
|
|
|
|
||||||||||||||||
|
Revenue:
|
|
|
|
|
|
|||||||||||||||
|
Restaurant revenue
|
$
|
1,000,198
|
|
$
|
960,994
|
|
$
|
898,842
|
|
$
|
846,389
|
|
$
|
828,031
|
|
|||||
|
Total revenues
|
1,017,247
|
|
977,132
|
|
914,850
|
|
864,269
|
|
841,045
|
|
||||||||||
|
Total costs and expenses
(1)(2)(3)(4)
|
973,433
|
|
931,923
|
|
886,849
|
|
854,536
|
|
813,104
|
|
||||||||||
|
Income from operations
|
43,814
|
|
45,209
|
|
28,001
|
|
9,733
|
|
27,941
|
|
||||||||||
|
Net income
|
32,239
|
|
28,331
|
|
20,577
|
|
7,299
|
|
17,599
|
|
||||||||||
|
Earnings per share
|
|
|
|
|
|
|
|
|
||||||||||||
|
Basic
|
$
|
2.27
|
|
$
|
1.97
|
|
$
|
1.36
|
|
$
|
0.47
|
|
$
|
1.14
|
|
|||||
|
Diluted
|
$
|
2.22
|
|
$
|
1.93
|
|
$
|
1.34
|
|
$
|
0.46
|
|
$
|
1.14
|
|
|||||
|
Shares used in computing earnings per share
|
|
|
|
|
|
|
|
|
||||||||||||
|
Basic
|
14,225
|
|
14,411
|
|
15,122
|
|
15,536
|
|
15,392
|
|
||||||||||
|
Diluted
|
14,510
|
|
14,669
|
|
15,357
|
|
15,709
|
|
15,504
|
|
||||||||||
|
Balance Sheet Data:
|
|
|
|
|
|
|
|
|
||||||||||||
|
Cash and cash equivalents
|
$
|
17,108
|
|
$
|
22,440
|
|
$
|
35,036
|
|
$
|
17,889
|
|
$
|
20,268
|
|
|||||
|
Total assets
|
634,645
|
|
597,132
|
|
592,976
|
|
579,257
|
|
600,095
|
|
||||||||||
|
Long-term debt, including current portion
|
88,714
|
|
134,995
|
|
156,931
|
|
158,522
|
|
191,334
|
|
||||||||||
|
Total stockholders' equity
|
347,403
|
|
306,919
|
|
294,698
|
|
300,661
|
|
288,622
|
|
||||||||||
|
Cash Flow Data:
|
|
|
|
|
|
|
|
|
||||||||||||
|
Net cash provided by operating activities
|
$
|
113,529
|
|
$
|
94,379
|
|
$
|
95,697
|
|
$
|
70,613
|
|
$
|
90,615
|
|
|||||
|
Net cash used in investing activities
|
(78,231
|
)
|
(63,305
|
)
|
(43,355
|
)
|
(35,060
|
)
|
(49,548
|
)
|
||||||||||
|
Net cash (used in) provided by financing activities
|
(40,630
|
)
|
(43,670
|
)
|
(35,195
|
)
|
(37,932
|
)
|
(31,957
|
)
|
||||||||||
|
Selected Operating Data:
|
|
|
|
|
|
|
|
|
||||||||||||
|
Net sales per square foot in Company-owned restaurants
|
$
|
451
|
|
$
|
449
|
|
$
|
435
|
|
$
|
424
|
|
$
|
422
|
|
|||||
|
Total operating weeks
(5)
|
18,012
|
|
17,607
|
|
16,635
|
|
16,112
|
|
15,701
|
|
||||||||||
|
Company-owned restaurants open at end of period
|
361
|
|
339
|
|
327
|
|
314
|
|
306
|
|
||||||||||
|
Franchised restaurants open at end of period
|
134
|
|
133
|
|
137
|
|
136
|
|
133
|
|
||||||||||
|
Comparable restaurant net sales increase (decrease)
(6)(7)(8)
|
4.0
|
%
|
1.1
|
%
|
2.3
|
%
|
(0.4
|
)%
|
(11.5
|
)%
|
||||||||||
___________________________________
|
(1)
|
Fiscal year 2013 includes a pre-tax non-cash asset impairment charges of $1.5 million related to the impairment of four restaurants.
|
|
(2)
|
Fiscal year 2011 reflects significant and infrequent pre-tax charges of $1.4 related to executive transition and pre-tax non-cash asset impairment charges of $4.3 million related to the impairment of three restaurants.
|
|
(3)
|
Fiscal year 2010 reflects a significant and infrequent pre-tax charge of $2.6 million related to the retirement of the Company's chief executive officer and appointment of a new chief executive officer. Fiscal year 2010 also includes a pre-tax non-cash asset impairment charge of $6.1 million related to the impairment of four restaurants.
|
21
|
(4)
|
Fiscal year 2009 includes a net significant and infrequent pre-tax charge of $4.0 million related to an option tender offer completed during the first quarter 2009. This one-time charge represents the compensation expense related to the acceleration of vesting on the unvested options tendered in the offer, which would otherwise have been expensed over their vesting period in the future if they had not been tendered.
|
|
(5)
|
Total operating weeks represent the number of weeks that the Company-owned restaurants are opened during the reporting period.
|
|
(6)
|
Comparable restaurants include those Company-owned restaurants that have been open for five full quarters of operations at the beginning of the periods presented. Please see "Management's Discussion and Analysis of Financial Condition and Results of Operations—Total Revenues" for a further discussion of our comparable restaurant designation.
|
|
(7)
|
Net sales are gross sales net of incentives and discounts, primarily related to our loyalty program.
|
|
(8)
|
Comparable restaurant sales increase and average annual comparable restaurant sales volumes for 2012 were calculated on a 53-week basis.
|
Overview
Description of the Business
Red Robin Gourmet Burgers, Inc., a Delaware corporation, together with its subsidiaries ("Red Robin," "we," "us," "our" or the "Company"), primarily develops, operates and franchises casual-dining restaurants with
495
locations as of
December 29, 2013
, the Company's fiscal year end. The Company operated
361
Company-owned restaurants located in 35 states comprised of
355
casual dining locations and
six
Red Robin's Burger Works®, a smaller non-traditional prototype with a limited menu and limited service. The Company also franchises restaurants, of which there were
134
restaurants in 20 states and two Canadian provinces as of
December 29, 2013
.
The Company operates its business as one operating and one reportable segment.
Our primary source of revenue is from the sale of food and beverages at Company-owned restaurants. We also earn revenue from royalties and fees from franchised restaurants.
The Company's fiscal year ends on the last Sunday of each calendar year. Most of our fiscal years have 52 weeks; however we experience a 53rd week once every five or six years. Our discussion for fiscal years 2013 and 2011, which ended on
December 29, 2013
and
December 25, 2011
, refers to a 52-week period. Fiscal year 2012, which ended
December 30, 2012
, refers to a 53-week period with the 53rd week falling in the fourth quarter. In fiscal year 2012, the 53rd week added approximately $21 million to net restaurant sales, $3.1 million to net income and $0.21 to diluted earnings per share.
Financial and Operational Highlights for Fiscal Year 2013
|
•
|
Financial Performance.
|
|
◦
|
Total revenues increased $40.1 million, or 4.1%, to $1.0 billion for the 52 weeks ended
December 29, 2013
as compared to $977.1 million in the 53 weeks ended
December 30, 2012
, primarily due to a
$35.8 million
or
4.0%
increase in comparable restaurant revenue and $23.9 million revenue from 22 new restaurant openings. The increase was partially offset by a decrease of approximately $21 million related to the 53rd week that was included in fiscal year 2012.
|
|
◦
|
Restaurant operating costs, as a percentage of restaurant revenue, decreased 100 basis points to 78.3% in fiscal year 2013 compared to 79.3% in fiscal year 2012, primarily as a result of reduced promotional activities and supply costs, leverage from higher restaurant sales volumes on the fixed costs and reductions in food, beverage and labor costs.
|
|
◦
|
Net income improved 13.8% to $32.2 million in fiscal year 2013 (52 weeks) from $28.3 million in fiscal year 2012 (53 weeks). Diluted earnings per share increased 15.0% to $2.22 as compared to $1.93 in fiscal year 2012. Excluding the impact of a non-cash charge of $0.06 per diluted share related to the impairment of four underperforming restaurants and a charge of $0.09 per diluted share related to a non-recurring special bonus awarded by the board, net income per diluted share in fiscal year 2013 was $2.37.
|
|
•
|
Marketing.
Our Red Robin Royalty™ loyalty program operates in all of our Company-owned restaurants and in 75 of our franchised restaurants. Engaging our guests through this program is a key part of our marketing strategy and uses offers designed to increase the frequency of guest visits. We are also using the program to generate awareness of new
|
22
menu items and to engage our guests with smart rewards. We have altered our media strategy and advertising campaign approach in 2013 to more weeks on air with fewer hiatuses and ads which feature a consistent spokeswoman. We are also relying more on digital, social and earned media to deliver our message to our core target audience. Our “Take Back the Bar” initiative continues to increase our alcoholic beverage mix, differentiate our brand and help target adult diners.
|
•
|
Brand Transformation Initiative.
As of
December 29, 2013
, we have remodeled 32 of our Company-owned Red Robin
®
restaurants to our new brand standards as we continue to learn about guest response and test financial returns. In August 2013, we rolled-out new plating and presentation standards and a new spiral menu format to all Company-owned and franchised restaurants. We plan to remodel an additional 50 Company-owned Red Robin
®
restaurants during fiscal year 2014.
|
|
•
|
Restaurant Development.
We opened
22
new Red Robin
®
restaurants and relocated two restaurants during fiscal year
2013
. We expect to open 20 new Red Robin
®
restaurants in fiscal year 2014. In fiscal year 2013, our franchisees closed one restaurant and opened two new restaurants. We expect that our franchisees will open up to two new restaurants in 2014. As of
December 29, 2013
, we had
361
Company-owned Red Robin
®
restaurants and Red Robin’s Burger Works
®
and our franchisees operated 134 Red Robin
®
restaurants.
|
With regards to Red Robin’s Burger Works
®,
we opened one restaurant in 2013 bringing our total operating to six. We continue to evaluate the results of different types of trade areas as well as optimize operating performance. The underlying restaurant performance has been mixed with sales at our central business district and lifestyle trade areas performing as expected and our college campus locations performing below our expectations. For 2014, we plan to focus our Red Robin’s Burger Works
®
development efforts in central business district locations and plan to open five new restaurants in two new major metropolitan markets.
Unit Data
The following table details data pertaining to the number of Company-owned and franchised restaurants for the fiscal years indicated.
|
2013
|
2012
|
2011
|
|||||||
|
Company-owned:
|
|
|
|
||||||
|
Beginning of period
|
339
|
|
327
|
|
314
|
|
|||
|
Opened during the period
(1)
|
22
|
|
14
|
|
13
|
|
|||
|
Acquired from franchisee
|
—
|
|
1
|
|
—
|
|
|||
|
Closed during the period
|
—
|
|
(3
|
)
|
—
|
|
|||
|
End of period
|
361
|
|
339
|
|
327
|
|
|||
|
Franchised:
|
|
|
|
||||||
|
Beginning of period
|
133
|
|
137
|
|
136
|
|
|||
|
Opened during the period
|
2
|
|
—
|
|
3
|
|
|||
|
Sold or closed during the period
(3)
|
(1
|
)
|
(4
|
)
|
(2
|
)
|
|||
|
End of period
|
134
|
|
133
|
|
137
|
|
|||
|
Total number of restaurants
|
495
|
|
472
|
|
464
|
|
|||
___________________________________
|
(1)
|
Includes
one
Red Robin's Burger Works® in 2013,
four
in 2012 and
one
in 2011.
|
|
(2)
|
Excludes
one
franchised restaurant that was closed in 2013 and re-opened during the same year and
three
franchised restaurants that were closed in 2012 and re-opened during the same year.
|
23
Results of Operations
Operating results for each fiscal year presented below are expressed as a percentage of total revenues, except for the components of restaurant operating costs, which are expressed as a percentage of restaurant revenues:
|
2013
|
2012
|
2011
|
|||||||
|
|
(52 Weeks)
|
(53 Weeks)
|
(52 Weeks)
|
||||||
|
Revenues:
|
|
|
|
||||||
|
Restaurant revenue
|
98.3
|
%
|
98.3
|
%
|
98.3
|
%
|
|||
|
Franchise royalties and fees
|
1.4
|
|
1.5
|
|
1.5
|
|
|||
|
Other revenue
|
0.3
|
|
0.2
|
|
0.2
|
|
|||
|
Total revenues
|
100.0
|
%
|
100.0
|
%
|
100.0
|
%
|
|||
|
Costs and expenses:
|
|
|
|
||||||
|
Restaurant operating costs (exclusive of depreciation and amortization shown separately below):
|
|
|
|
||||||
|
Cost of sales
|
25.0
|
|
25.2
|
|
25.3
|
|
|||
|
Labor
|
33.5
|
|
33.6
|
|
33.8
|
|
|||
|
Other operating
|
12.3
|
|
13.1
|
|
13.8
|
|
|||
|
Occupancy
|
7.4
|
|
7.4
|
|
7.3
|
|
|||
|
Total restaurant operating costs
|
78.3
|
|
79.3
|
|
80.2
|
|
|||
|
Depreciation and amortization
|
5.7
|
|
5.7
|
|
6.0
|
|
|||
|
Selling, general and administrative
|
12.2
|
|
11.3
|
|
11.3
|
|
|||
|
Pre-opening costs
|
0.6
|
|
0.4
|
|
0.4
|
|
|||
|
Asset impairment charge
|
0.1
|
|
—
|
|
0.5
|
|
|||
|
Income from operations
|
4.3
|
|
4.6
|
|
3.1
|
|
|||
|
Other (income) expense:
|
|
|
|
||||||
|
Interest expense, net
|
0.3
|
|
0.6
|
|
0.6
|
|
|||
|
Loss on debt refinancing
|
—
|
|
0.3
|
|
—
|
|
|||
|
Total other expenses
|
0.3
|
|
0.9
|
|
0.6
|
|
|||
|
Income before income taxes
|
4.1
|
|
3.8
|
|
2.4
|
|
|||
|
Provision for income taxes
|
(0.9
|
)
|
(0.9
|
)
|
(0.2
|
)
|
|||
|
Net income
|
3.2
|
%
|
2.9
|
%
|
2.2
|
%
|
|||
___________________________________
Certain percentage amounts in the table above do not total due to rounding as well as the fact that restaurant operating costs are expressed as a percentage of restaurant revenues and not total revenues.
24
Revenues
|
(Revenues in thousands)
|
2013
|
2012
|
2013 - 2012 Percent Change
|
2011
|
2012 - 2011 Percent Change
|
|||||||||||||
|
Restaurant revenue
|
$
|
1,000,198
|
|
$
|
960,994
|
|
4.1
|
%
|
$
|
898,842
|
|
6.9
|
%
|
|||||
|
Franchise royalties and fees
|
14,378
|
|
14,501
|
|
(0.8
|
)%
|
14,151
|
|
2.5
|
%
|
||||||||
|
Other revenue
|
2,671
|
|
1,637
|
|
63.2
|
%
|
1,857
|
|
(11.8
|
)%
|
||||||||
|
Total revenues
|
$
|
1,017,247
|
|
$
|
977,132
|
|
4.1
|
%
|
$
|
914,850
|
|
6.8
|
%
|
|||||
|
Average weekly net sales volumes in Company-owned restaurants
(1)
|
$
|
56,159
|
|
$
|
54,922
|
|
2.3
|
%
|
$
|
54,043
|
|
1.6
|
%
|
|||||
|
Total operating weeks
|
18,012
|
|
17,607
|
|
2.3
|
%
|
16,635
|
|
5.8
|
%
|
||||||||
|
Net sales per square foot
|
$
|
451
|
|
$
|
449
|
|
0.4
|
%
|
$
|
435
|
|
3.2
|
%
|
|||||
___________________________________
|
(1)
|
Excludes Red Robin's Burger Works®.
|
Restaurant revenue, which is comprised almost entirely of food and beverage sales, increased by
$39.2 million
, or
4.1%
, for the
52 weeks ended
December 29, 2013
as compared to the 53 weeks in fiscal year
2012
. Adjusting for the 53rd week in fiscal 2012, which was approximately $21 million, restaurant revenue increased approximately $60.0 million in fiscal year 2013. Comparable restaurant revenues grew
$35.8 million
or
4.0%
during fiscal year
2013
primarily as a result of a 4.3% increase in average guest check, partially offset by 0.3% decrease in guest counts. The increase in average guest check resulted from a combination of menu price increases and increased sales of items including beverages and appetizers, partially offset by higher discounts including those associated with our Red Robin Royalty™ loyalty program. Revenue from our non-comparable restaurants, which includes restaurants opened after the third quarter of fiscal 2011 or closed since the beginning of 2012, contributed an increase of $24.4 million in fiscal year 2013.
In
2012
, restaurant revenue increased
$62.2 million
, or
6.9%
, from fiscal year
2011
. The inclusion of the 53rd week in fiscal 2012 contributed approximately $21 million to restaurant revenue. Adjusting out the extra week in 2012, revenue in our comparable restaurant base increased approximately $9.9 million or 1.1% during 2012 primarily as a result of a 1.7% increase in average guest checks partially offset by 0.6% decrease in guest counts. We believe the increase in average guest check resulted from a combination of menu price increases and increased sales of items including beverages, partially offset by higher discounts including those associated with our Red Robin Royalty™ loyalty program. Revenue from our non-comparable restaurants, which includes restaurants opened after the third quarter of fiscal 2010 or closed since the beginning of 2011, contributed an increase of $28.8 million in fiscal year 2012.
Average weekly net sales volumes represent the total restaurant revenue for all Company-owned casual dining restaurants (excluding Red Robin's Burger Works®) for each time period presented, divided by the number of operating weeks in the period. Comparable restaurant average weekly sales volumes include those restaurants that are in the comparable base at the end of each period presented. New restaurants are primarily restaurants that are open but by definition not included in the comparable category because they have not yet operated for five full quarters. Fluctuations in average weekly net sales volumes for comparable restaurants reflect the effect of same store sales changes as well as the performance of new restaurants entering the comparable base during the period and the average square feet of our restaurants.
Franchise royalties and fees consist primarily of royalty income and initial franchise fees. This revenue decreased
$0.1 million
or
0.8%
, from fiscal year
2012
. The year-over-year decrease in franchise royalties and fees is primarily attributable to having one less week in fiscal year
2013
compared to fiscal year
2012
and the closing of four franchise restaurants in 2012, partially offset by a 1.6% increase in comparable sales for U.S. restaurants and a 3.6% increase for Canadian restaurants. Franchise royalties and fees for fiscal year
2012
increased over fiscal year
2011
primarily due to having an additional one week in fiscal year 2012 compared to fiscal year 2011 and to an increase in sales reported by our franchisees as they experienced a 1.9% increase in comparable sales for U.S. restaurants and a 4.7% increase for Canadian restaurants.
Other revenue consists primarily of gift card breakage. For the fiscal years ended
December 29, 2013
and
December 30, 2012
, we recognized
$2.1 million
and $1.5 million of gift card breakage. In fiscal year
2011
, we recognized $1.7 million of gift card breakage including $0.4 million of third-party gift card revenue as an initial cumulative program adjustment for gift card sales sold in third-party retail locations recognized in the first quarter.
25
Cost of Sales
|
(In thousands, except percentages)
|
2013
|
2012
|
2013 - 2012 Percent Change
|
2011
|
2012 - 2011 Percent Change
|
|||||||||||||
|
Cost of sales
|
$
|
250,237
|
|
$
|
242,641
|
|
3.1
|
%
|
$
|
227,063
|
|
6.9
|
%
|
|||||
|
As a percent of restaurant revenue
|
25.0
|
%
|
25.2
|
%
|
(0.2
|
)%
|
25.3
|
%
|
(0.1
|
)%
|
||||||||
Cost of sales, which is comprised of food and beverage costs, is variable and generally fluctuates with sales volume. Cost of sales as a percentage of restaurant revenue decreased
20
basis points in fiscal year
2013
compared to fiscal year
2012
. This decrease as a percentage of restaurant revenue was caused by a decrease in costs of produce, ground beef, cheese, and french fries, partially offset by an increase in the cost of food preparation, dairy, and draft beer.
Cost of sales as a percentage of restaurant revenue decreased 10 basis points in fiscal year 2012 compared to fiscal year 2011. This decrease as a percentage of restaurant revenue was caused by a decrease in produce, cheese, and poultry costs, which were mostly offset by an increase in the cost of potatoes, ground beef, and fry oil.
Labor
|
(In thousands, except percentages)
|
2013
|
2012
|
2013 - 2012 Percent Change
|
2011
|
2012 - 2011 Percent Change
|
|||||||||||||
|
Labor
|
$
|
335,113
|
|
$
|
323,100
|
|
3.7
|
%
|
$
|
303,503
|
|
6.1
|
%
|
|||||
|
As a percent of restaurant revenue
|
33.5
|
%
|
33.6
|
%
|
(0.1
|
)%
|
33.8
|
%
|
(0.2
|
)%
|
||||||||
Labor costs include restaurant-level hourly wages and management salaries as well as related taxes and benefits. In fiscal year
2013
, labor as a percentage of restaurant revenue decreased 10 basis points compared to fiscal year
2012
. This decrease primarily resulted from 50 basis points of lower costs related to health insurance claims, workers' compensation costs, and higher hourly productivity, leverage on higher sales as well as a reduction in accrued vacation and payroll taxes. These reductions were partially offset by 40 basis points of higher costs related primarily to increases in management costs, kitchen labor and training.
In fiscal year 2012, labor as a percentage of restaurant revenue decreased 20 basis points compared to 2011. This decrease primarily resulted from 50 basis points of lower costs related to higher hourly productivity, leverage on higher sales as well as a reduction in accrued vacation and payroll taxes. These reductions were partially offset by 30 basis points of higher costs related primarily to increases in group insurance costs and variable compensation.
Other Operating
|
(In thousands, except percentages)
|
2013
|
2012
|
2013 - 2012 Percent Change
|
2011
|
2012 - 2011 Percent Change
|
|||||||||||||
|
Other operating
|
$
|
123,479
|
|
$
|
125,471
|
|
(1.6
|
)%
|
$
|
124,238
|
|
1.0
|
%
|
|||||
|
As a percent of restaurant revenue
|
12.3
|
%
|
13.1
|
%
|
(0.8
|
)%
|
13.8
|
%
|
(0.7
|
)%
|
||||||||
Other operating costs include costs such as restaurant supplies, utilities, and other costs such as service repairs and maintenance costs. During fiscal year
2013
, other operating costs as a percentage of restaurant revenue decreased 80 basis points over the prior year due primarily to lower local restaurant promotional expenses and supply costs.
During fiscal year 2012, other operating costs as a percentage of restaurant revenue decreased 70 basis points over the prior year due primarily to a 30 basis point decrease in cleaning and supply costs due to cost management efforts, a 20 basis point decrease in utilities and repair and maintenance costs, and a 20 basis point decrease in payment card processing fees resulting from legislative changes.
Occupancy
|
(In thousands, except percentages)
|
2013
|
2012
|
2013 - 2012 Percent Change
|
2011
|
2012 - 2011 Percent Change
|
|||||||||||||
|
Occupancy
|
$
|
74,079
|
|
$
|
70,971
|
|
4.4
|
%
|
$
|
65,785
|
|
7.9
|
%
|
|||||
|
As a percent of restaurant revenue
|
7.4
|
%
|
7.4
|
%
|
—
|
%
|
7.3
|
%
|
0.1
|
%
|
||||||||
26
Occupancy costs include fixed rents, property taxes, common area maintenance charges, general liability insurance, contingent rents, and other property costs. Occupancy costs incurred prior to opening our new restaurants are included in Pre-opening costs. In fiscal year
2013
, occupancy costs as a percent of restaurant revenue were flat as compared to fiscal year
2012
. Occupancy costs increased
$3.1 million
or
4.4%
, primarily due to the increase in fixed rents and real estate taxes related to the additional restaurants opened in fiscal year
2013
. Our fixed rents for the fiscal years ended
December 29, 2013
and
December 30, 2012
were $47.8 million and $45.8 million.
In fiscal year 2012, occupancy costs as a percent of restaurant revenue increased 10 basis points over the prior year due mainly to higher fixed rents related to the opening of new restaurants in addition to approximately $1.4 million related to the 53rd week included in fiscal year 2012. Fixed rents for the fiscal years ended
2012
and 2011 were $45.8 million and $42.5 million.
Depreciation and Amortization
|
(In thousands, except percentages)
|
2013
|
2012
|
2013 - 2012 Percent Change
|
2011
|
2012 - 2011 Percent Change
|
|||||||||||||
|
Depreciation and amortization
|
$
|
58,200
|
|
$
|
55,468
|
|
4.9
|
%
|
$
|
55,272
|
|
0.4
|
%
|
|||||
|
As a percent of total revenues
|
5.7
|
%
|
5.7
|
%
|
—
|
%
|
6.0
|
%
|
(0.3
|
)%
|
||||||||
Depreciation and amortization includes depreciation on capital expenditures for restaurants and corporate assets as well as amortization of acquired franchise rights, leasehold interests and certain liquor licenses. In fiscal year
2013
, depreciation and amortization expense increased
$2.7 million
or
4.9%
over the prior year, primarily related to new restaurants opened in fiscal year
2013
.
Depreciation and amortization expense remained relatively flat in fiscal year 2012 as compared to 2011 as the increases related to new restaurant openings were mostly offset by assets that became fully depreciated during the current year. Depreciation and amortization expense as a percentage of total revenue for fiscal year 2012, decreased due to leverage from higher restaurant sales volumes.
Selling, General and Administrative
|
(In thousands, except percentages)
|
2013
|
2012
|
2013 - 2012 Percent Change
|
2011
|
2012 - 2011 Percent Change
|
|||||||||||||
|
Selling, general and administrative
|
$
|
124,278
|
|
$
|
110,798
|
|
12.2
|
%
|
$
|
103,124
|
|
7.4
|
%
|
|||||
|
As a percent of total revenues
|
12.2
|
%
|
11.3
|
%
|
0.9
|
%
|
11.3
|
%
|
—
|
%
|
||||||||
Selling, general and administrative costs include all corporate and administrative functions. Components of this category include corporate, regional and franchise support salaries and benefits, travel, information systems, training, office rent, professional and consulting fees, board of directors' expenses, legal expenses and marketing costs.
Selling, general and administrative costs in fiscal year
2013
increased
$13.5 million
or 12.2% as compared to
2012
. The increase was driven primarily by a $9.4 million increase in salaries and benefits due to investments in talent to support value-enhancing initiatives and higher incentive based compensation, which included $1.6 million special bonus awarded to our management that is expected to be non-recurring. In addition, selling costs increased $3.0 million, primarily due to costs associated with increased gift card sales.
In fiscal year 2012, selling, general and administrative costs increased $7.7 million from 2011 primarily due to $3.5 million higher gift card fees and production costs, $3.1 million higher salaries and benefits partially due to the extra week in fiscal 2012, and $1.1 million higher consulting fees associated with information technology infrastructure changes.
Pre-opening Costs
|
(In thousands, except percentages)
|
2013
|
2012
|
2013 - 2012 Percent Change
|
2011
|
2012 - 2011 Percent Change
|
|||||||||||||
|
Pre-opening costs
|
$
|
6,530
|
|
$
|
3,474
|
|
88.0
|
%
|
$
|
3,527
|
|
(1.5
|
)%
|
|||||
|
As a percent of total revenues
|
0.6
|
%
|
0.4
|
%
|
0.2
|
%
|
0.4
|
%
|
—
|
%
|
||||||||
|
Average per restaurant pre-opening costs
|
$
|
297
|
|
$
|
238
|
|
24.8
|
%
|
$
|
264
|
|
(9.8
|
)%
|
|||||
Pre-opening costs, which are expensed as incurred, consist of the costs of labor, hiring, and training the initial work force
27
for our new restaurants, occupancy costs incurred prior to opening, travel expenses for our training teams, the cost of food and beverages used in training, marketing and supplies costs, and other direct costs related to the opening of new restaurants. Pre-opening costs for fiscal years
2013
,
2012
, and
2011
reflect the opening of
22
,
14
, and
13
new restaurants and relocation of two restaurants in fiscal year 2013. Average per restaurant pre-opening costs represents total costs incurred for those restaurants that opened for business during the periods presented including Red Robin's Burger Works® restaurants. The fiscal year 2013 average pre-opening per restaurant increased from 2012 due primarily to the start of construction on eight new restaurants to be opened in the following year versus four in 2012.
The fiscal 2012 average per restaurant pre-opening costs decreased over fiscal 2011 due primarily to the inclusion of four Red Robin's Burger Works® restaurants which were opened in fiscal 2012. Pre-opening costs for these smaller-scale restaurants are lower than the pre-opening costs for our traditional size restaurants.
Asset Impairment Charge and Restaurant Closure Costs
During fiscal year
2013
, the Company determined that four Company-owned restaurants were impaired. The Company recognized a non-cash pre-tax impairment charge of
$1.5 million
resulting from the continuing and projected future results of these restaurants. During fiscal year 2012, the Company determined that no Company-owned restaurants were impaired. During fiscal year 2011, the Company determined that three Company-owned restaurants were impaired and recognized a pre-tax non-cash impairment charge of $4.3 million. The Company reviewed each restaurant's past and present operating performance combined with projected future results, primarily through projected undiscounted cash flows, which indicated impairment. The carrying amount of each restaurant was compared to its fair value as determined by management. The impairment charge represents the excess of each restaurant's carrying amount over its fair value.
We closed three restaurants in fiscal year
2012
and recognized charges of $0.3 million related to lease terminations and other closing-related costs.
Interest Expense
Interest expense in fiscal years
2013
,
2012
, and
2011
was
$2.7 million
,
$5.7 million
, and
$5.9 million
. Interest expense decreased in fiscal year
2013
due to a lower average debt balance and a lower weighted average interest rate of 2.7% versus 3.9% in 2012. Interest expense was lower in fiscal 2012 than 2011 due to a lower average debt balance, partially offset by a higher weighted average interest rate of 3.9% versus 3.4% in 2011.
On December 14, 2012, we entered into a new credit facility ("New Credit Facility") thereby terminating our previous credit facility, which had been amended and restated on May 6, 2011 ("Previous Facility"). See
Liquidity and Capital Resources, Credit Facility
for further discussion. In connection with the debt refinancing, we re-designated our variable-to-fixed interest rate swap agreement which was used to hedge the floating interest rate on a portion of the outstanding term loan under the Previous Facility. The Company recorded a non-cash pre-tax charge of $1.2 million as a result of the de-designation to recognize net losses that had been previously recognized in accumulated other comprehensive loss. We also recognized a non-cash pre-tax charge of $1.7 million to write-off certain unamortized loan origination costs associated with the Previous Facility.
Provision for Income Taxes
The provision for income taxes increased $0.5 million to
$9.0 million
in fiscal year
2013
as compared to
$8.5 million
in fiscal year
2012
and
$1.5 million
in fiscal year 2011. Our effective income tax rate was 21.8% in fiscal year 2013, 23.1% in fiscal year 2012, and 6.8% in fiscal 2011. The decrease in our fiscal 2013 effective tax rate is due mainly to the increase in current year general business tax credits and an increase in state income tax credits. The increase in our effective tax rate for fiscal 2012 was primarily attributable to the increase in earnings before income taxes as well as a decrease in general business tax credits.
Liquidity and Capital Resources
General
Cash and cash equivalents decreased
$5.3 million
to
$17.1 million
at
December 29, 2013
, from
$22.4 million
at the beginning of the fiscal year. This decrease in our cash position was primarily the net result of:
|
•
|
$47.3 million
net repayments to the borrowings under the New Credit Facility and capital leases;
|
|
•
|
$78.9 million
used for the construction of new restaurants, expenditures for facility improvements, and investments in information technology; and
|
28
|
•
|
$5.0 million
used for the purchase of Company stock; partially offset by
|
|
•
|
$113.5 million
of cash provided by operating activities;
|
|
•
|
$11.7 million
in proceeds and the related tax benefit from stock option exercises and purchases of common stock through the employee stock purchase plan.
|
We expect to continue to reinvest available cash flows from operations to develop new restaurants or invest in existing restaurants and infrastructure, pay down debt, and maintain the flexibility to use excess cash to opportunistically repurchase our common stock and execute our long term strategic initiatives.
Cash Flows
The table below summarizes our cash flows from operating, investing and financing activities for each of the past three fiscal years (in thousands):
|
2013
|
2012
|
2011
|
||||||||||
|
Net cash provided by operating activities
|
$
|
113,529
|
|
$
|
94,379
|
|
$
|
95,697
|
|
|||
|
Net cash used in investing activities
|
(78,231
|
)
|
(63,305
|
)
|
(43,355
|
)
|
||||||
|
Net cash used in financing activities
|
(40,630
|
)
|
(43,670
|
)
|
(35,195
|
)
|
||||||
|
Net (decrease) increase in cash and cash equivalents
|
$
|
(5,332
|
)
|
$
|
(12,596
|
)
|
$
|
17,147
|
|
|||
Operating Cash Flows
Net cash provided by operating activities increased
$19.1 million
to
$113.5 million
in
2013
as compared to
$94.4 million
in
2012
. Of the
$19.1 million
increase, approximately
$15.8 million
of the increase relates to profit from restaurant operations due to a reduction in operating costs of approximately 100 basis points and an increase in restaurant revenues, partially offset by an increase in pre-opening costs related to new restaurants. The balance of the increase relates to higher trade payables and accrued payroll costs, partially offset by higher salaries, benefits and incentive-based compensation and an increase in gift card fees and production costs.
Net cash flows provided by operating activities were $94.4 million in 2012 compared to $95.7 million in 2011. The $1.3 million decrease over prior year is primarily due to increases in selling, general and administrative costs, a higher rate of redemptions relative to cash receipts from gift cards and incentive programs, and cash payments for income taxes, which more than offset $20.1 million of increases in cash flow related to improved restaurant operating costs, sales increases from new and existing restaurants and the addition of a 53rd operating week in 2012.
Investing Cash Flows
Net cash flows used in investing activities increased
$14.9 million
from
$63.3 million
in
2012
to
$78.2 million
in
2013
. The increase over prior year is due primarily to investments in new restaurants and restaurant remodels, partially offset by decreases in technology infrastructure and, to a lesser extent, maintenance capital. The following table lists the components of our investment in property, equipment and intangible assets for fiscal year
2013
(in millions):
|
|
Year Ended
December 29, 2013
|
||
|
New restaurants
|
$
|
50.7
|
|
|
Restaurant remodels
|
11.3
|
|
|
|
Restaurant maintenance capital
|
10.3
|
|
|
|
Investment in technology infrastructure and other
|
6.6
|
|
|
|
Purchases of property, equipment and intangible assets
|
$
|
78.9
|
|
Net cash flows used in investing activities increased $19.9 million from $43.4 million in 2011 to $63.3 million in 2012. The increase over prior year is due primarily to increased investments in brand transformation initiatives, technology infrastructure, and $3.2 million paid to acquire a franchise restaurant in 2012. Investing cash flows included
$60.0 million
and
$44.1 million
in capital expenditures in
2012
and
2011
.
In fiscal year 2014, capital expenditures are expected to be approximately $85 to $90 million though this amount may increase if we determine to expand the number of restaurant remodels. In addition to the construction of new restaurants, we will continue our investment in restaurant remodels and capital improvements.
29
Financing Cash Flows
Cash used in our financing activities decreased
$3.1 million
from
$43.7 million
in
2012
to
$40.6 million
in
2013
. This decrease is due primarily to a $25.2 million increase in net debt payments partially offset by a $19.3 million decrease in cash used to repurchase stock, a $4.5 million increase in cash proceeds from the exercise of employee stock options and employee stock purchases and a $3.5 million tax benefit related to the exercise of stock options.
Net cash flows used in financing activities were
$43.7 million
in
2012
compared to
$35.2 million
in
2011
. The
$8.5 million
increase in cash used in financing activities primarily relates to a $20.5 million increase in net debt payments partially offset by $8.7 million decrease in cash used to repurchase stock, $2.8 million decrease in cash used to refinance our credit facility in 2012, and $0.7 million increase in cash proceeds from the exercise of employee stock options and the employee stock purchase plan.
Credit Facility.
We entered into our Previous Facility on May 6, 2011 in order to provide a more flexible capital structure and facilitate our growth plans. Borrowings under the Previous Facility could be used by us for general corporate purposes including, among other uses, to repurchase shares of our capital stock, to continue to finance restaurant construction, and for working capital and general corporate requirements. The Previous Facility was comprised of (i) a $100 million revolving credit facility maturing on May 6, 2016 and (ii) a $150 million term loan maturing on May 6, 2016, both with rates based on the London Interbank Offered Rate ("LIBOR") plus a spread based on leverage or a base rate plus a spread based on leverage (base rate is the highest of (a) the Prime Rate, (b) the Federal Funds Rate plus 0.50% and (c) LIBOR for an Interest Period of one month plus 1%). The Previous Facility also allowed us, subject to lender participation, to increase the revolving credit facility or term loan by up to an additional $100 million in the future. As part of the Previous Facility, we could request the issuance of up to $20 million in letters of credit, the outstanding amount of which reduces the net borrowing capacity under the revolving credit facility. The Previous Facility required the payment of an annual commitment fee based upon the unused portion of the credit facility. The Previous Facility's interest rates and the annual commitment rate were based on a financial leverage ratio, as defined in the credit agreement. Our obligations under the Previous Facility were secured by first priority liens and security interests in substantially all of our assets, which included the capital stock of our certain subsidiaries. Additionally, the Previous Facility included a negative pledge on all tangible and intangible assets (including all real and personal property) with customary exceptions.
On December 14, 2012, we terminated the Previous Facility and entered into a new credit facility ("New Credit Facility") with a consortium of banks. The New Credit Facility provides for a
$225 million
revolving line of credit with a sublimit for the issuance of up to
$25 million
in letters of credits and swingline loans up to
$15 million
, and maintains the option to increase this credit facility in the future, subject to lenders' participation, by up to an additional
$100 million
in the aggregate. Borrowings under the New Credit Facility are subject to rates based on LIBOR plus a spread based on leverage or a base rate plus a spread based on leverage (base rate is the highest of (a) the Prime Rate, (b) the Federal Funds Rate plus
0.50%
and (c) LIBOR for an interest period of one month plus
1%
). This
$225 million
revolving line of credit matures on December 14, 2017. Borrowings under the New Credit Facility are secured by first priority liens and security interests in substantially all of our assets, which include the capital stock of our certain subsidiaries, and are available for financing activities including restaurant construction costs, working capital and general corporate purposes, including, among other uses, to refinance certain indebtedness, permitted acquisitions and redemption of capital stock. We do not believe that any of our lenders will not be able to fulfill their lending commitments under our New Credit Facility. As of
December 29, 2013
and
December 30, 2012
, we had outstanding borrowings under the New Credit Facility revolver of
$78.5 million
and
$125.0 million
in addition to amounts issued under letters of credit of
$8.1 million
and
$6.8 million
, which reduce the amount available under the credit facility but are not recorded as debt.
Proceeds from the New Credit Facility were used to repay the $121.9 million outstanding balance of the term loan of the Previous Facility and to pay related transaction fees and expenses associated with the refinancing of debt. Loan origination costs associated with the New Credit Facility are included as deferred costs in Other assets, net in the accompanying consolidated balance sheet as of
December 29, 2013
and
December 30, 2012
.
In August 2011, we entered into a variable-to-fixed interest rate swap agreement with Rabobank International, Utrecht ("Rabobank") to hedge the floating interest rate on a portion of the term loan under our Previous Facility. The interest rate swap had an effective date of August 5, 2011 and an initial notional amount of $74.1 million. In accordance with its original terms $6.6 million, $4.7 million and $0.9 million of the initial $74.1 million notional amount expired in
2013
,
2012
and
2011
. The remaining notional amount of
$61.9 million
as of
December 29, 2013
decreases quarterly and is set to expire on June 30, 2015 with a notional hedge amount of $50.6 million. Under the swap, we are required to make quarterly payments based on a fixed interest rate of 1.135%, calculated based on the remaining notional amount. In exchange, we receive interest on the notional amount at a variable rate that is based on the 3-month spot LIBOR rate quarterly. Concurrent with the December 14, 2012 refinancing of the loan agreement that was designated as being hedged by this swap, the Company de-designated the original hedging relationship for this swap and consequently reclassified the
$1.2 million
deferred losses in Accumulated other
30
comprehensive loss into earnings. On December 14, 2012, the Company re-designated the swap on the New Credit Facility's
$225 million
revolver.
Covenants.
We are subject to a number of customary covenants under our New Credit Facility, including limitations on additional borrowings, acquisitions, capital expenditures, stock repurchases, lease commitments and dividend payments, and requirements to maintain certain financial ratios. As of
December 29, 2013
, we were in compliance with all debt covenants.
Debt Outstanding.
Total debt and capital lease obligations outstanding decreased
$46.3 million
to
$88.7 million
at
December 29, 2013
from
$135.0 million
at
December 30, 2012
, primarily due to our net repayments on the New Credit Facility. Our New Credit Facility matures in 2017.
Stock Repurchase.
In August 2010, the Company's board of directors authorized a repurchase of up to $50.0 million of the Company's common stock which was scheduled to expire on December 31, 2011. The Company's board of directors re-authorized a repurchase of up to $50.0 million of the Company's common stock in October 2011 and again in November 2012.
The current authorization will terminate upon completing the repurchase of $50 million of common stock unless terminated earlier by the Company's board of directors. Purchases may be made from time to time at the Company's discretion and the timing and amount of any share repurchases will be determined based on share price, market conditions, legal requirements and other factors. The repurchase program does not obligate the Company to acquire any particular amount of common stock, and it may be suspended or discontinued at any time.
In fiscal year
2013
, we repurchased 68,816 shares with an average purchase price of $72.71 per share for a total of $5.0 million. In fiscal year
2012
, we repurchased 802,722 shares with an average purchase price of $30.28 per share for a total of $24.3 million. In fiscal year
2011
, we repurchased 1.2 million shares with an average purchase price of $27.56 per share for a total of $33.0 million.
Contractual Obligations.
The following table summarizes the amounts of payments due under specified contractual obligations as of
December 29, 2013
(in thousands):
|
Payments Due by Period
|
||||||||||||||||||||
|
Total
|
2014
|
2015 - 2016
|
2017 - 2018
|
2019 and
Thereafter |
||||||||||||||||
|
Long-term debt obligations
(1)
|
$
|
83,961
|
|
$
|
1,375
|
|
$
|
2,772
|
|
$
|
79,814
|
|
$
|
—
|
|
|||||
|
Capital lease obligations
(2)
|
12,448
|
|
1,308
|
|
1,890
|
|
1,800
|
|
7,450
|
|
||||||||||
|
Operating lease obligations
(3)
|
390,879
|
|
52,595
|
|
99,236
|
|
85,535
|
|
153,513
|
|
||||||||||
|
Purchase obligations
(4)
|
36,226
|
|
19,137
|
|
6,164
|
|
4,990
|
|
5,935
|
|
||||||||||
|
Other non current liabilities
(5)
|
4,028
|
|
993
|
|
688
|
|
369
|
|
1,978
|
|
||||||||||
|
Total contractual obligations
|
$
|
527,542
|
|
$
|
75,408
|
|
$
|
110,750
|
|
$
|
172,508
|
|
$
|
168,876
|
|
|||||
___________________________________
|
(1)
|
Long-term debt obligations represent minimum required principal payments under our credit agreement including estimated interest of $5.5 million based on a
1.73%
average borrowing interest rate.
|
|
(2)
|
Capital lease obligations include interest of
$3.1 million
.
|
|
(3)
|
Operating lease obligations represent future minimum lease commitments payable for land, buildings, and equipment used in our operations. This table excludes contingent rents, including amounts which are determined as a percentage of adjusted sales in excess of specified levels.
|
|
(4)
|
Purchase obligations include commitments for the construction of new restaurants and other capital improvement projects and lease commitments for Company-owned restaurants where leases have been executed but construction has not begun. It also includes the Company's share of system-wide commitments for beverage and supply items. These amounts require estimates and could vary due to the timing of volumes. Excluded are any agreements that are cancelable without significant penalty.
|
|
(5)
|
Other non-current liabilities include executive deferred compensation, uncertain tax positions, and vendor deposits.
|
Financial Condition and Future Liquidity.
We require capital principally to grow the business through new restaurant construction, as well as to maintain, improve and refurbish existing restaurants, support for infrastructure needs, and for general operating purposes. In addition, we have and may continue to use capital to pay principal on our borrowings and repurchase our common stock. Our primary short-term and long-term sources of liquidity are expected to be cash flows from operations and our revolving credit facility. Based upon current levels of operations and anticipated growth, we expect that cash flows from operations will be sufficient to meet debt service, capital expenditures, and working capital requirements for at least the next twelve months. We and the restaurant industry in general maintain relatively low levels of accounts receivable and inventories,
31
and vendors generally grant short-term trade credit for purchases, such as food and supplies. We also continually invest in our business through the addition of new restaurants and refurbishment of existing restaurants, which are reflected as long-term assets and not as part of working capital.
We typically maintain current liabilities in excess of our current assets which results in a working capital deficit. We are able to operate with a working capital deficit because restaurant sales are primarily conducted on a cash or credit card basis. Rapid turnover of inventory results in limited investment in inventories, and cash from sales is usually received before related payables for food, supplies and payroll become due. In addition, receipts from the sale of gift cards are received well in advance of related redemptions. Rather than maintain higher cash balances that would result from this pattern of operating cash flows, we typically utilize operating cash flows in excess of those required for currently-maturing liabilities to pay for capital expenditures, debt repayment or to repurchase stock. When necessary, we utilize our revolving credit facility to satisfy short-term liquidity requirements. However, we believe that our future cash flows will be sufficient to satisfy any working capital deficits.
Inflation
The primary inflationary factors affecting our operations are food, labor costs, energy costs, and materials used in the construction of new restaurants. A large number of our restaurant personnel are paid at rates based on the applicable minimum wage, and increases in the minimum wage have directly affected our labor costs in recent years. Many of our leases require us to pay taxes, maintenance, repairs, insurance, and utilities, all of which are generally subject to inflationary increases. We believe inflation had a negative impact on our financial condition and results of operations in fiscal year
2013
, due primarily to higher wages, costs for certain supplies, and commodity prices for certain foods we purchased at market rates. Uncertainties related to fluctuations in costs, including energy costs, commodity prices, annual indexed wage increases and construction materials make it difficult to predict what impact, if any, inflation may have on our business during 2014, but it is anticipated that inflation will continue to have a negative impact in fiscal year 2014.
Seasonality
Our business is subject to seasonal fluctuations. Historically, sales in most of our restaurants have been higher during the summer months and winter holiday season. As a result, our quarterly and annual operating results and comparable restaurant sales may fluctuate significantly as a result of seasonality. Accordingly, results for any one quarter or year are not necessarily indicative of results to be expected for any other quarter or for any year, and comparable restaurant sales for any particular future period may decrease.
Critical Accounting Policies and Estimates
We have identified the following as the Company's most critical accounting policies, which are those that are most important to the portrayal of the Company's financial condition and results and require management's most subjective and complex judgment. Information regarding the Company's other significant accounting policies is disclosed in Note 1,
Description of Business and Summary of Significant Accounting Policies,
of the Notes to the Consolidated Financial Statements in Part II, Item 8 of this report.
Impairment of Long-Lived Assets.
Long-lived assets, including restaurant sites, leasehold improvements, other fixed assets, and amortizable intangible assets are reviewed when indicators of impairment are present. Expected cash flows associated with an asset are the key factor in determining the recoverability of the asset. Identifiable cash flows are measured at the restaurant level. The estimate of cash flows is based upon, among other things, certain assumptions about expected future operating performance, including assumptions on future revenue trends. Management's estimates of undiscounted cash flows may differ from actual cash flows due to, among other things, changes in economic conditions, changes to our business model, or changes in operating performance. If the sum of the undiscounted cash flows is less than the carrying value of the asset, we recognize an impairment loss, measured as the amount by which the carrying value exceeds the fair value of the asset.
Judgments made by management related to the expected useful lives of long-lived assets and our ability to realize undiscounted cash flows in excess of the carrying amounts of such assets are affected by factors such as the ongoing maintenance and improvements of the assets, changes in economic conditions, and changes in operating performance. As the ongoing expected cash flows and carrying amounts of long-lived assets are assessed, these factors could cause us to realize a material impairment charge. During fiscal year
2013
, the Company determined that four Company-owned restaurants were impaired, which resulted in a non-cash pre-tax impairment charge of
$1.5 million
. During fiscal 2012, the Company determined that no Company-owned restaurants were impaired. During 2011, we determined that three Company-owned restaurants were impaired, which resulted in a non-cash pre-tax impairment charge of $4.3 million. Each restaurant's past and present operating performance were reviewed combined with projected future results, primarily through projected undiscounted cash flows, which indicated possible impairment. We compared the carrying amount of each restaurant's assets to its fair value as estimated by management. The fair value of the long-lived assets is typically determined using a discounted cash flow projection model
32
to estimate expected future cash flows. The discount factor is determined using external information regarding the risk-free rate of return, industry beta factors, and premium adjustments. These factors are combined with internal information such as the Company's average cost of debt and effective tax rate to determine a weighted average cost of capital which is applied to the undiscounted cash flows. In certain cases, management uses market information, when available, to estimate the fair value of a restaurant. The impairment charges represent the excess of each restaurant's carrying amount over its estimated fair value.
Goodwill.
We evaluate goodwill annually or more frequently if indicators of impairment are present. We performed step one of the impairment test as of
December 29, 2013
. Step one of the impairment test is based upon a comparison of the carrying value of our net assets, including goodwill balances, to the fair value of our net assets. Fair value is measured using a combination of the market capitalization method, the income approach, and the market approach. The market capitalization method uses the Company's stock price to derive fair value. The income approach consists of utilizing the discounted cash flow method that incorporates our estimates of future revenues and costs, discounted using a risk-adjusted discount rate. Our estimates used in the income approach are consistent with the plans and estimates used to manage operations. The market approach utilizes multiples of profit measures in order to estimate the fair value of the assets. We do evaluate all methods to ensure reasonably consistent results. Additionally, we evaluate the key input factors in the models used to determine whether a moderate change in any input factor or combination of factors would significantly change the results of the tests. Based on the completion of the step one test, we determined that goodwill was not impaired as of
December 29, 2013
. However, an impairment charge may be triggered in the future if the value of our stock declines, sales in our restaurants decline, or if there are significant adverse changes in the operating environment of the restaurant industry. We have followed a consistent approach to evaluating whether there are impairments of goodwill. The Company makes adjustments to assumptions to reflect management's view of current market and economic conditions.
Lease Accounting.
Under the provisions of certain of our leases, there are rent holidays and/or escalations in payments over the base lease term, as well as renewal periods. The effects of rent holidays and escalations are reflected in rent costs on a straight-line basis over the expected lease term, which includes cancelable option periods when it is deemed to be reasonably assured that we will exercise such option periods due to the fact that we would incur an economic penalty for not doing so. The lease term commences on the date when we become legally obligated for the rent payments which coincides with the time when the landlord delivers the property for us to develop and we waive contract contingencies. All rent costs recognized during construction periods are expensed immediately as pre-opening expenses.
Judgments made by management for its lease obligations include the probable term for each lease that affects the classification and accounting for a lease as capital or operating; the rent holidays and/or escalations in payments that are taken into consideration when calculating straight-line rent; incremental borrowing rates; and the term over which leasehold improvements for each restaurant facility are amortized. These judgments may produce materially different amounts of depreciation, amortization and rent expense than would be reported if different assumed lease terms were used. We have not made any changes to the nature of the assumptions used to account for leases in the past three years.
Insurance/Self-Insurance Liabilities.
The Company is self-insured for a portion of losses related to group health insurance, general liability and workers' compensation. We maintain stop-loss coverage with third party insurers to limit our total exposure. The self-insurance liability represents an estimate of the cost of claims incurred and unpaid as of the balance sheet date. The estimated liability is not discounted and is established based upon analysis of historical data and actuarial based estimates, as well as incurred but not reported claims, and is closely monitored and adjusted when warranted by changing circumstances. Should a greater number of claims occur compared to what was estimated, or should medical costs or other claim costs increase beyond what was expected, our accrued liabilities might not be sufficient, and additional expenses may be recorded. Actual claims experience could also be more favorable than estimated, resulting in expense reductions. Unanticipated changes in our estimates may produce materially different amounts of expense than that reported historically under these programs. We have not made any significant changes to the nature of the assumptions used to account our self-insurance liabilities in the past three years.
Income Taxes.
The determination of the Company's provision for income taxes requires management's judgment in the use of estimates and the interpretation and application of complex tax laws. Judgment is also required in assessing the timing and amounts of deductible and taxable items. The Company establishes contingency reserves for material, known tax exposures relating to deductions, transactions and other matters involving some uncertainty as to the proper tax treatment of the item. The Company's reserves reflect its judgment as to the resolution of the issues involved if subject to judicial review. Several years may elapse before a particular matter, for which the Company has established a reserve, is audited and finally resolved or clarified. While the Company believes that its reserves are adequate to cover reasonably expected tax risks, issues raised by a tax authority may be finally resolved at an amount different than the related reserve. Such differences could materially increase or decrease the Company's income tax provision in the current and/or future periods. When facts and circumstances change (including a resolution of an issue or statute of limitations expiration), these reserves are adjusted through the provision for income taxes in the period of change. To the extent the Company determines that it will not realize the benefit of some or all of
33
its deferred tax assets, then these assets will be adjusted through the Company's provision for income taxes in the period in which this determination is made.
Unearned Revenues.
Unearned revenues represent our liability for gift cards that have been sold but not yet redeemed, as well as, deferred revenues related to our loyalty program. We recognize sales when the gift card is redeemed by the customer. Although there are no expiration dates or dormancy fees for our gift cards, based on our historical gift card redemption patterns, we can reasonably estimate the amount of gift cards for which redemption is remote, which is referred to as "breakage." We recognize breakage within other revenue for unused gift card amounts in proportion to actual gift card redemptions, which is also referred to as the "redemption recognition" method. The estimated value of gift cards expected to go unused is recognized over the expected period of redemption as the remaining gift card values are redeemed. Utilizing this method, we estimate both the amount of breakage and the time period of redemption. If actual redemption patterns vary from our estimates, actual gift card breakage income may differ from the amounts recorded. We update our estimate of our breakage rate periodically and apply that rate to gift card redemptions.
In January 2011, we began rolling out our Red Robin Royalty™ loyalty program in all Company-owned restaurants. Under the terms of the program, among other benefits, a registered member receives an award for a free entrée after the purchase of nine qualifying entrées. We recognize the current sale of an entrée and defer a portion of the revenue to reflect partial pre-payment for the future entrée the member is entitled to receive. We estimate the future value of the award based on the historical average value of redemptions. We also estimate what portion of registered members are not likely to reach the ninth purchase based on historical activity and recognize the deferred revenue related to those purchases. We recognize the deferred revenue on earned rewards when redeemed or upon expiration, which is 60 days after the award is earned. We compare the estimate of the value of future awards to historical redemptions to evaluate the reasonableness of the deferred amount
Stock-Based Compensation.
We account for stock-based compensation in accordance with fair value recognition provisions, under which we recognize stock-based compensation using the Black-Scholes or Monte Carlo (for performance-based units) option pricing model and recognize expense on a graded vesting basis over the requisite service periods of an option. Determining the appropriate fair value model and calculating the fair value of stock-based payment awards require the input of highly subjective and judgmental assumptions including volatility, forfeiture rates, and expected option life. If any of the assumptions used in the model change significantly, stock-based compensation expense may differ materially in the future from that recorded in the current period. We have not made any changes to the nature of the assumptions used to account for stock-based compensation in the past three years. During 2010, the Company granted performance-based restricted stock units ("PSUs") to executives and other key employees. These PSUs contain a market condition based on Total Shareholder Return and measure the overall stock price performance of the Company to the stock price performance of a selected industry peer group. The fair value of the PSUs was calculated using the Monte Carlo valuation method. This method utilizes multiple input variables to determine the probability of the Company achieving the market condition and the fair value of the awards. This method uses judgment and estimation which is the responsibility of management.
Off Balance Sheet Arrangements
Except for operating leases (primarily restaurant leases) entered into the normal course of business, we do not have any material off balance sheet arrangements.
Recent Accounting Pronouncements
In July 2013, the Financial Accounting Standards Board (“FASB”) issued
Presentation of an Unrecognized Tax Benefit When a Net Operating Loss Carryforward, a Similar Tax Loss, or a Tax Credit Carryforward Exists
, which requires entities to present its unrecognized tax benefits net of its deferred tax assets when settlement in this manner is available under the tax law, which would be based on facts and circumstances as of the balance sheet reporting date and would not consider future events. Gross presentation in the notes to the financial statements will still be required. This update does not require any new recurring disclosures and is effective for annual and interim periods beginning after December 15, 2013, which will require us to adopt these provisions in the first quarter of fiscal 2014. We do not expect the adoption of this guidance will have a material impact on our financial statements.
In February 2013, the FASB issued
Reporting of Amounts Reclassified Out of Accumulated Other Comprehensive Income,
which requires entities to present the effects on the line items of net income of significant amounts reclassified out of accumulated other comprehensive income, but only if the item reclassified is required under GAAP to be reclassified to net income in its entirety in the same reporting period. The guidance is effective for fiscal years beginning after December 15, 2012. The adoption of this guidance did not have a significant impact on the Company’s consolidated financial statements.
34
In January 2013, the FASB issued
Clarifying the Scope of Disclosures about Offsetting Assets and Liabilities
, which clarifies the scope of transactions that are subject to the disclosures about offsetting and will require disclosure of information about the effect or potential effect of financial instrument netting arrangements on financial position. Entities will be required to present both net (offset amounts) and gross information in the notes to the financial statements for relevant assets and liabilities that are offset. This guidance is effective for fiscal years beginning on or after January 1, 2013, and interim periods within those annual periods. The adoption of this guidance in fiscal 2014 is not expected to have a material impact on the Company’s consolidated financial statements.
Under our New Credit Facility, we are exposed to market risk from changes in interest rates on borrowings, which bear interest at one of the following rates we select: an Alternate Base Rate ("ABR"), based on the Prime Rate plus 0.50% to 1.25%, or the London Interbank Offered Rate ("LIBOR"), based on the relevant one, three or six-month LIBOR, at our discretion, plus 1.50% to 2.25%. The spread, or margin, for ABR and LIBOR loans under the New Credit Facility is subject to quarterly adjustment based on our then current leverage ratio, as defined by the credit agreement. As of
December 29, 2013
, we had
$16.6 million
of borrowings subject to variable interest rates. A 1.0% change in the effective interest rate applied to these loans would have resulted in pre-tax interest expense fluctuation of
$0.2 million
on an annualized basis.
Our objective in managing exposure to interest rate changes is to limit the effect of interest rate changes on earnings and cash flows and to lower overall borrowing costs. To achieve this objective, we have used an interest rate swap and may use other means such as caps to manage our net exposure to interest rate changes related to our borrowings. As appropriate, on the date derivative contracts are entered into, we designate derivatives as either a hedge of the fair value of a recognized asset or liability or of an unrecognized firm commitment (fair value hedge), or a hedge of a forecasted transaction or of the variability of cash flows to be received or paid related to a recognized asset or liability (cash flow hedge).
The Company had one interest rate swap at
December 29, 2013
and
December 30, 2012
and its counterparty is Rabobank International, Utrecht ("Rabobank"). The Company entered into this variable-to-fixed interest rate swap agreement with Rabobank in August 2011 to hedge the floating interest rate on a portion of the term loan under the Previous Facility. The interest rate swap was effective August 5,
2011
with an initial notional amount of
$74.1 million
. In accordance with its original terms, the notional amount of the interest rate swap amortizes over time from
$74.1 million
at inception to
$50.6 million
at its maturity on June 30, 2015. The remaining notional amount as of
December 29, 2013
and
December 30, 2012
was
$61.9 million
and
$68.4 million
. Under the terms of the interest rate swap, the quarterly cash payment or receipt is equal to the net of (1) the fixed interest rate of
1.135%
paid by the Company and (2) the 3 month LIBOR rate for the applicable interest period received by the Company multiplied by the remaining notional amount as of the payment date. Concurrent with the December 14, 2012 refinancing of the Previous Facility (See Note 7
Borrowings
), the Company de-designated the original hedging relationship for this interest rate swap and consequently re-designated the interest rate swap on the New Credit Facility's
$225 million
revolving line. Refer to Note 8,
Derivative and Other Comprehensive Income
, of Notes to Consolidated Financial Statements of this report.
Primarily all of our transactions are conducted, and our accounts are denominated, in United States dollars. Accordingly, we are not exposed to significant foreign currency risk.
Many of the food products we purchase are affected by changes in weather, production, availability, seasonality, and other factors outside our control. In an effort to mitigate some of this risk, we have entered into fixed price agreements on some of our food and beverage products, including certain proteins, produce and cooking oil. As of the end of fiscal year
2013
, approximately 46% of our estimated annual food and beverage purchases were covered by fixed price contracts, most of which are scheduled to expire at various times during fiscal year 2014. These contracts may exclude related expenses such as fuel surcharges and other fees. In addition, we believe that almost all of our food and supplies are available from several sources, which helps to reduce or mitigate these risks.
35
RED ROBIN GOURMET BURGERS, INC.
INDEX
|
|
Page
|
|
Report of Independent Registered Public Accounting Firm
|
|
|
Consolidated Balance Sheets
|
|
|
Consolidated Statements of Income
|
|
|
Consolidated Statements of Comprehensive Income
|
|
|
Consolidated Statements of Stockholders' Equity
|
|
|
Consolidated Statements of Cash Flows
|
|
|
Notes to Consolidated Financial Statements
|
|
36
REPORT OF INDEPENDENT REGISTERED PUBLIC ACCOUNTING FIRM
To the Board of Directors and Stockholders of
Red Robin Gourmet Burgers, Inc.
Greenwood Village, Colorado
We have audited the accompanying consolidated balance sheets of Red Robin Gourmet Burgers, Inc. and subsidiaries (the "Company") as of
December 29, 2013
and
December 30, 2012
, and the related consolidated statements of income, comprehensive income, stockholders' equity, and cash flows for each of the three years in the period ended
December 29, 2013
. These financial statements are the responsibility of the Company's management. Our responsibility is to express an opinion on these financial statements based on our audits.
We conducted our audits in accordance with the standards of the Public Company Accounting Oversight Board (United States). Those standards require that we plan and perform the audit to obtain reasonable assurance about whether the financial statements are free of material misstatement. An audit includes examining, on a test basis, evidence supporting the amounts and disclosures in the financial statements. An audit also includes assessing the accounting principles used and significant estimates made by management, as well as evaluating the overall financial statement presentation. We believe that our audits provide a reasonable basis for our opinion.
In our opinion, such consolidated financial statements present fairly, in all material respects, the financial position of Red Robin Gourmet Burgers, Inc. and subsidiaries as of
December 29, 2013
and
December 30, 2012
, and the results of their operations and their cash flows for each of the three years in the period ended
December 29, 2013
, in conformity with accounting principles generally accepted in the United States of America.
We have also audited, in accordance with the standards of the Public Company Accounting Oversight Board (United States), the Company's internal control over financial reporting as of
December 29, 2013
, based on the criteria established in
Internal Control—Integrated Framework (1992)
issued by the Committee of Sponsoring Organizations of the Treadway Commission and our report date
d
February 24, 2014
expressed an unqualified opinion on the Company's internal control over financial reporting.
/s/ DELOITTE & TOUCHE LLP
Denver, Colorado
February 24, 2014
37
RED ROBIN GOURMET BURGERS, INC.
(In thousands, except per share amounts)
|
December 29, 2013
|
December 30, 2012
|
|||||||
|
Assets:
|
||||||||
|
Current Assets:
|
||||||||
|
Cash and cash equivalents
|
$
|
17,108
|
|
$
|
22,440
|
|
||
|
Accounts receivable, net
|
22,568
|
|
16,386
|
|
||||
|
Inventories
|
21,992
|
|
18,371
|
|
||||
|
Prepaid expenses and other current assets
|
15,766
|
|
13,439
|
|
||||
|
Income tax receivable
|
260
|
|
858
|
|
||||
|
Deferred tax asset
|
2,952
|
|
3,010
|
|
||||
|
Total current assets
|
80,646
|
|
74,504
|
|
||||
|
Property and equipment, net
|
444,727
|
|
413,258
|
|
||||
|
Goodwill
|
62,525
|
|
62,525
|
|
||||
|
Intangible assets, net
|
36,800
|
|
37,203
|
|
||||
|
Other assets, net
|
9,947
|
|
9,642
|
|
||||
|
Total assets
|
$
|
634,645
|
|
$
|
597,132
|
|
||
|
Liabilities and Stockholders' Equity:
|
||||||||
|
Current Liabilities:
|
||||||||
|
Trade accounts payable
|
$
|
19,117
|
|
$
|
14,241
|
|
||
|
Construction related payables
|
14,682
|
|
4,694
|
|
||||
|
Accrued payroll and payroll-related liabilities
|
45,919
|
|
31,476
|
|
||||
|
Unearned revenue
|
35,740
|
|
28,187
|
|
||||
|
Accrued liabilities
|
23,628
|
|
22,901
|
|
||||
|
Current portion of capital lease obligations
|
826
|
|
784
|
|
||||
|
Total current liabilities
|
139,912
|
|
102,283
|
|
||||
|
Deferred rent
|
51,985
|
|
44,801
|
|
||||
|
Long-term debt
|
79,375
|
|
125,000
|
|
||||
|
Long-term portion of capital lease obligations
|
8,513
|
|
9,211
|
|
||||
|
Other non-current liabilities
|
7,457
|
|
8,918
|
|
||||
|
Total liabilities
|
287,242
|
|
290,213
|
|
||||
|
Stockholders' Equity:
|
||||||||
|
Common stock; $0.001 par value: 30,000 shares authorized; 17,851 and 17,499 shares issued; 14,350 and 13,999 shares outstanding
|
18
|
|
17
|
|
||||
|
Preferred stock, $0.001 par value: 3,000 shares authorized; no shares issued and outstanding
|
—
|
|
—
|
|
||||
|
Treasury stock 3,501 and 3,500 shares, at cost
|
(110,486
|
)
|
(107,589
|
)
|
||||
|
Paid-in capital
|
197,145
|
|
185,974
|
|
||||
|
Accumulated other comprehensive (loss) income, net of tax
|
(25
|
)
|
5
|
|
||||
|
Retained earnings
|
260,751
|
|
228,512
|
|
||||
|
Total stockholders' equity
|
347,403
|
|
306,919
|
|
||||
|
Total liabilities and stockholders' equity
|
$
|
634,645
|
|
$
|
597,132
|
|
||
See Notes to Consolidated Financial Statements.
38
RED ROBIN GOURMET BURGERS, INC.
(In thousands, except per share data)
|
Year Ended
|
||||||||||||
|
December 29, 2013
|
December 30, 2012
|
December 25, 2011
|
||||||||||
|
Revenues:
|
||||||||||||
|
Restaurant revenue
|
$
|
1,000,198
|
|
$
|
960,994
|
|
$
|
898,842
|
|
|||
|
Franchise royalties and fees
|
14,378
|
|
14,501
|
|
14,151
|
|
||||||
|
Other revenue
|
2,671
|
|
1,637
|
|
1,857
|
|
||||||
|
Total revenues
|
1,017,247
|
|
977,132
|
|
914,850
|
|
||||||
|
Costs and expenses:
|
||||||||||||
|
Restaurant operating costs (excluding depreciation and amortization shown separately below):
|
||||||||||||
|
Cost of sales
|
250,237
|
|
242,641
|
|
227,063
|
|
||||||
|
Labor (includes $151, $349 and $626 of stock-based compensation)
|
335,113
|
|
323,100
|
|
303,503
|
|
||||||
|
Other operating
|
123,479
|
|
125,471
|
|
124,238
|
|
||||||
|
Occupancy
|
74,079
|
|
70,971
|
|
65,785
|
|
||||||
|
Depreciation and amortization
|
58,200
|
|
55,468
|
|
55,272
|
|
||||||
|
Selling, general and administrative expenses (includes $3,672, $3,459 and $2,693 of stock-based compensation)
|
124,278
|
|
110,798
|
|
103,124
|
|
||||||
|
Pre-opening costs
|
6,530
|
|
3,474
|
|
3,527
|
|
||||||
|
Asset impairment charges
|
1,517
|
|
—
|
|
4,337
|
|
||||||
|
Total costs and expenses
|
973,433
|
|
931,923
|
|
886,849
|
|
||||||
|
Income from operations
|
43,814
|
|
45,209
|
|
28,001
|
|
||||||
|
Other (income) expense:
|
||||||||||||
|
Interest expense
|
2,692
|
|
5,662
|
|
5,885
|
|
||||||
|
Loss on debt refinancing
|
—
|
|
2,919
|
|
—
|
|
||||||
|
Interest income and other, net
|
(127
|
)
|
(229
|
)
|
28
|
|
||||||
|
Total other expenses
|
2,565
|
|
8,352
|
|
5,913
|
|
||||||
|
Income before income taxes
|
41,249
|
|
36,857
|
|
22,088
|
|
||||||
|
Provision for income taxes
|
9,010
|
|
8,526
|
|
1,511
|
|
||||||
|
Net income
|
$
|
32,239
|
|
$
|
28,331
|
|
$
|
20,577
|
|
|||
|
Earnings per share:
|
||||||||||||
|
Basic
|
$
|
2.27
|
|
$
|
1.97
|
|
$
|
1.36
|
|
|||
|
Diluted
|
$
|
2.22
|
|
$
|
1.93
|
|
$
|
1.34
|
|
|||
|
Weighted average shares outstanding:
|
||||||||||||
|
Basic
|
14,225
|
|
14,411
|
|
15,122
|
|
||||||
|
Diluted
|
14,510
|
|
14,669
|
|
15,357
|
|
||||||
See Notes to Consolidated Financial Statements.
39
RED ROBIN GOURMET BURGERS, INC.
CONSOLIDATED STATEMENTS OF COMPREHENSIVE INCOME
(In thousands)
|
Year Ended
|
||||||||||||
|
December 29, 2013
|
December 30, 2012
|
December 25, 2011
|
||||||||||
|
Net income
|
$
|
32,239
|
|
$
|
28,331
|
|
$
|
20,577
|
|
|||
|
Cash Flow Hedges:
|
||||||||||||
|
Net change in fair value of interest rate swap
|
(123
|
)
|
(1,127
|
)
|
(742
|
)
|
||||||
|
Net loss reclassified into interest expense
|
80
|
|
449
|
|
650
|
|
||||||
|
Loss on de-designation reclassified into loss on debt refinancing
|
—
|
|
1,220
|
|
—
|
|
||||||
|
Total change in unrealized gain (loss) related to cash flow hedges
|
(43
|
)
|
542
|
|
(92
|
)
|
||||||
|
Income tax benefit (expense) related to items of other comprehensive income
|
13
|
|
(211
|
)
|
(37
|
)
|
||||||
|
Other comprehensive (loss) income, net of tax
|
(30
|
)
|
331
|
|
(129
|
)
|
||||||
|
Total comprehensive income
|
$
|
32,209
|
|
$
|
28,662
|
|
$
|
20,448
|
|
|||
See Notes to Consolidated Financial Statements.
40
RED ROBIN GOURMET BURGERS, INC.
CONSOLIDATED STATEMENTS OF STOCKHOLDERS' EQUITY
(In thousands)
|
Common Stock
|
Treasury Stock
|
Accumulated
Other
Comprehensive
Income
(Loss)
net of tax
|
||||||||||||||||||||||||||||
|
Paid-in
Capital
|
Retained
Earnings
|
|||||||||||||||||||||||||||||
|
Shares
|
Amount
|
Shares
|
Amount
|
Total
|
||||||||||||||||||||||||||
|
Balance, December 26, 2010
|
17,102
|
|
$
|
17
|
|
1,501
|
|
$
|
(50,321
|
)
|
$
|
171,558
|
|
$
|
(197
|
)
|
$
|
179,604
|
|
$
|
300,661
|
|
||||||||
|
Exercise of options and issuance of restricted stock
|
145
|
|
—
|
|
—
|
|
—
|
|
2,200
|
|
—
|
|
—
|
|
2,200
|
|
||||||||||||||
|
Tax expense on exercise of stock options
|
—
|
|
—
|
|
—
|
|
—
|
|
389
|
|
—
|
|
—
|
|
389
|
|
||||||||||||||
|
Acquisition of treasury stock
|
—
|
|
—
|
|
1,196
|
|
(32,964
|
)
|
—
|
|
|
|
|
|
(32,964
|
)
|
||||||||||||||
|
Non-cash stock compensation
|
—
|
|
—
|
|
—
|
|
—
|
|
3,480
|
|
—
|
|
—
|
|
3,480
|
|
||||||||||||||
|
Common stock issued through employee stock purchase plan
|
29
|
|
—
|
|
—
|
|
—
|
|
484
|
|
|
|
—
|
|
484
|
|
||||||||||||||
|
Net Income
|
20,577
|
|
20,577
|
|
||||||||||||||||||||||||||
|
Other comprehensive loss
|
—
|
|
—
|
|
—
|
|
—
|
|
—
|
|
(129
|
)
|
—
|
|
(129
|
)
|
||||||||||||||
|
Balance, December 25, 2011
|
17,276
|
|
17
|
|
2,697
|
|
(83,285
|
)
|
178,111
|
|
(326
|
)
|
200,181
|
|
294,698
|
|
||||||||||||||
|
Exercise of options and issuance of restricted stock
|
198
|
|
—
|
|
—
|
|
—
|
|
2,561
|
|
—
|
|
—
|
|
2,561
|
|
||||||||||||||
|
Tax expense on exercise of stock options
|
—
|
|
—
|
|
—
|
|
—
|
|
683
|
|
—
|
|
—
|
|
683
|
|
||||||||||||||
|
Acquisition of treasury stock
|
—
|
|
—
|
|
803
|
|
(24,304
|
)
|
—
|
|
|
|
|
|
(24,304
|
)
|
||||||||||||||
|
Non-cash stock compensation
|
—
|
|
—
|
|
—
|
|
—
|
|
4,034
|
|
—
|
|
—
|
|
4,034
|
|
||||||||||||||
|
Common stock issued through employee stock purchase plan
|
25
|
|
—
|
|
—
|
|
—
|
|
585
|
|
—
|
|
—
|
|
585
|
|
||||||||||||||
|
Net income
|
—
|
|
—
|
|
—
|
|
—
|
|
—
|
|
—
|
|
28,331
|
|
28,331
|
|
||||||||||||||
|
Other comprehensive income
|
—
|
|
—
|
|
—
|
|
—
|
|
—
|
|
331
|
|
—
|
|
331
|
|
||||||||||||||
|
Balance, December 30, 2012
|
17,499
|
|
17
|
|
3,500
|
|
(107,589
|
)
|
185,974
|
|
5
|
|
228,512
|
|
306,919
|
|
||||||||||||||
|
Exercise of options, issuance of restricted stock, shares exchanged for exercise and tax
|
331
|
|
1
|
|
(68
|
)
|
2,106
|
|
3,103
|
|
—
|
|
—
|
|
5,210
|
|
||||||||||||||
|
Tax benefit on exercise of stock options
|
—
|
|
—
|
|
—
|
|
—
|
|
3,481
|
|
—
|
|
—
|
|
3,481
|
|
||||||||||||||
|
Acquisition of treasury stock
|
—
|
|
—
|
|
69
|
|
(5,003
|
)
|
—
|
|
—
|
|
—
|
|
(5,003
|
)
|
||||||||||||||
|
Non-cash stock compensation
|
—
|
|
—
|
|
—
|
|
—
|
|
3,990
|
|
—
|
|
—
|
|
3,990
|
|
||||||||||||||
|
Common stock issued through employee stock purchase plan
|
21
|
|
—
|
|
—
|
|
—
|
|
597
|
|
—
|
|
—
|
|
597
|
|
||||||||||||||
|
Net income
|
—
|
|
—
|
|
—
|
|
—
|
|
—
|
|
—
|
|
32,239
|
|
32,239
|
|
||||||||||||||
|
Other comprehensive loss
|
—
|
|
—
|
|
—
|
|
—
|
|
—
|
|
(30
|
)
|
—
|
|
(30
|
)
|
||||||||||||||
|
Balance, December 29, 2013
|
17,851
|
|
$
|
18
|
|
3,501
|
|
$
|
(110,486
|
)
|
$
|
197,145
|
|
$
|
(25
|
)
|
$
|
260,751
|
|
$
|
347,403
|
|
||||||||
See Notes to Consolidated Financial Statements.
41
RED ROBIN GOURMET BURGERS, INC.
(In thousands)
|
Year Ended
|
||||||||||||
|
December 29, 2013
|
December 30, 2012
|
December 25, 2011
|
||||||||||
|
Cash Flows From Operating Activities:
|
||||||||||||
|
Net income
|
$
|
32,239
|
|
$
|
28,331
|
|
$
|
20,577
|
|
|||
|
Adjustments to reconcile net income to net cash provided by operating activities:
|
||||||||||||
|
Depreciation and amortization
|
58,200
|
|
55,468
|
|
55,272
|
|
||||||
|
Gift card breakage
|
(2,106
|
)
|
(1,486
|
)
|
(1,687
|
)
|
||||||
|
Provision for deferred income taxes and benefit from exercise of stock options
|
(1,662
|
)
|
1,846
|
|
2,221
|
|
||||||
|
Loss on debt refinance
|
—
|
|
2,919
|
|
—
|
|
||||||
|
Asset impairment charges
|
1,517
|
|
—
|
|
4,337
|
|
||||||
|
Stock-based compensation
|
3,823
|
|
3,808
|
|
3,319
|
|
||||||
|
Amortization of debt issuance costs and other
|
449
|
|
1,652
|
|
1,074
|
|
||||||
|
Changes in operating assets and liabilities, net of effects of acquired business:
|
||||||||||||
|
Accounts receivable and other current assets
|
(2,334
|
)
|
(4,062
|
)
|
(7,345
|
)
|
||||||
|
Inventory
|
(3,621
|
)
|
(285
|
)
|
(2,003
|
)
|
||||||
|
Other assets
|
(1,816
|
)
|
(3,408
|
)
|
(276
|
)
|
||||||
|
Trade accounts payable and accrued liabilities
|
17,571
|
|
(696
|
)
|
2,961
|
|
||||||
|
Unearned revenue
|
7,830
|
|
5,516
|
|
11,436
|
|
||||||
|
Deferred rent
|
3,439
|
|
4,776
|
|
5,811
|
|
||||||
|
Net cash provided by operating activities
|
113,529
|
|
94,379
|
|
95,697
|
|
||||||
|
Cash Flows From Investing Activities:
|
||||||||||||
|
Purchases of property, equipment and intangible assets
|
(78,876
|
)
|
(59,960
|
)
|
(44,085
|
)
|
||||||
|
Acquisition of franchise restaurants, net of cash acquired
|
—
|
|
(3,247
|
)
|
—
|
|
||||||
|
Other investing activities
|
645
|
|
(98
|
)
|
730
|
|
||||||
|
Net cash used in investing activities
|
(78,231
|
)
|
(63,305
|
)
|
(43,355
|
)
|
||||||
|
Cash Flows From Financing Activities:
|
|
|
|
|
|
|
||||||
|
Borrowings of long-term debt
|
141,500
|
|
125,000
|
|
188,500
|
|
||||||
|
Payments of long-term debt and capital leases
|
(188,783
|
)
|
(147,049
|
)
|
(190,025
|
)
|
||||||
|
Purchase of treasury stock
|
(5,003
|
)
|
(24,304
|
)
|
(32,964
|
)
|
||||||
|
Debt issuance costs
|
—
|
|
(949
|
)
|
(3,662
|
)
|
||||||
|
Tax benefit from exercise of stock options
|
3,481
|
|
—
|
|
—
|
|
||||||
|
Proceeds from exercise of stock options and employee stock purchase plan
|
8,175
|
|
3,632
|
|
2,956
|
|
||||||
|
Net cash used in financing activities
|
(40,630
|
)
|
(43,670
|
)
|
(35,195
|
)
|
||||||
|
Net (decrease) increase in cash and cash equivalents
|
$
|
(5,332
|
)
|
$
|
(12,596
|
)
|
$
|
17,147
|
|
|||
|
Cash and cash equivalents, beginning of year
|
22,440
|
|
35,036
|
|
17,889
|
|
||||||
|
Cash and cash equivalents, end of year
|
$
|
17,108
|
|
$
|
22,440
|
|
$
|
35,036
|
|
|||
See Notes to Consolidated Financial Statements.
42
RED ROBIN GOURMET BURGERS, INC.
NOTES TO CONSOLIDATED FINANCIAL STATEMENTS
1. Description of Business and Summary of Significant Accounting Policies
Red Robin Gourmet Burgers, Inc., together with its subsidiaries ("Red Robin" or the "Company"), a Delaware corporation, develops and operates casual-dining and fast-casual restaurants. At
December 29, 2013
, the Company owned and operated
361
restaurants located in
35
states. The Company also sells franchises, of which there were
134
restaurants, in
20
states and
two
Canadian provinces as of
December 29, 2013
. The Company operates its business as
one
operating and
one
reportable segment.
Principles of Consolidation and Fiscal Year
—The consolidated financial statements of the Company include the accounts of Red Robin and its wholly owned subsidiaries after elimination of all intercompany accounts and transactions. The Company's fiscal year is 52 or 53 weeks ending the last Sunday of the calendar year. Fiscal year
2013
included 52 weeks ending
December 29, 2013
, fiscal year
2012
included 53 weeks ending
December 30, 2012
and fiscal year
2011
included 52 weeks ending
December 25, 2011
. Fiscal year 2014 will include 52 weeks and will end on December 28, 2014.
Use of Estimates
—The preparation of financial statements in conformity with accounting principles generally accepted in the United States requires management to make estimates and assumptions that affect the reported amounts of assets and liabilities and disclosure of contingent assets and liabilities at the date of the financial statements and the reported amounts of revenues and expenses during the reporting periods. The areas that require management's most significant estimates are impairment of long lived assets, goodwill, lease accounting, insurance/self-insurance reserves, estimating fair value, income taxes, unearned revenue and stock-based compensation expense. Actual results could differ from those estimates.
Cash Equivalents
—The Company considers all highly liquid instruments with an original maturity of three months or less to be cash equivalents. Amounts receivable from credit card issuers are typically converted to cash within
two
to
four
days of the original sales transaction and are considered to be cash equivalents.
Cash and cash equivalents are maintained with multiple financial institutions. Generally, these deposits may be redeemed upon demand and are maintained with financial institutions with reputable credit and therefore bear minimal credit risk. The Company holds cash and cash equivalents at financial institutions in excess of amounts covered by the Federal Depository Insurance Corporation (the "FDIC") and sometimes invests excess cash in money market funds not insured by the FDIC.
Accounts Receivable
—Accounts receivable consists primarily of trade receivables due from franchisees for royalties, as well as third-party gift card receivables. In fiscal year
2013
, there was approximately
$10.7 million
of gift cards in transit in accounts receivable related to gift cards that were sold by third-party retailers, but for which cash settlement occurs anywhere from
15
to
45
days from sale, compared to
$8.8 million
in fiscal year
2012
. In fiscal year
2013
, there was approximately
$5.2 million
related to tenant improvement allowances in accounts receivable compared to
$2.9 million
in fiscal year
2012
.
Inventories
—Inventories consist of food, beverages, and supplies valued at the lower of cost (first-in, first-out method) or market. At the end of fiscal years
2013
and
2012
, food and beverage inventories were
$6.8 million
and
$6.2 million
and supplies inventories were
$15.2 million
and
$12.2 million
.
Property and Equipment
—Property and equipment are recorded at cost. Expenditures for major additions and improvements are capitalized and minor replacements, maintenance, and repairs are expensed as incurred. Depreciation is computed on the straight-line method, based on the shorter of the estimated useful lives or the terms of the underlying leases of the related assets. Interest incurred on funds used to construct Company-owned restaurants is capitalized and amortized over the estimated useful life of the related assets. Capitalized interest totaled
$0.3 million
in both fiscal years
2013
and
2012
and
$0.2 million
in fiscal year
2011
.
The estimated useful lives for property and equipment are:
|
Buildings
|
5 to 20 years
|
|
|
Leasehold improvements
|
Shorter of lease term or estimated useful life, not to exceed 20 years
|
|
|
Furniture, fixtures and equipment
|
3 to 7 years
|
|
|
Restaurant property leased to others
|
3 to 20 years
|
|
The Company capitalizes certain overhead related to the development and construction of its new restaurants, as well as certain information technology infrastructure upgrades. Capitalized overhead for the years ended
December 29, 2013
,
43
RED ROBIN GOURMET BURGERS, INC.
NOTES TO CONSOLIDATED FINANCIAL STATEMENTS (Continued)
December 30, 2012
and
December 25, 2011
was
$3.4 million
,
$2.7 million
, and
$2.4 million
. Costs incurred for the potential development of restaurants that are subsequently terminated are expensed. No material expense has been incurred in any of the fiscal years presented.
Goodwill and Intangible Assets, net
—Goodwill represents the excess of purchase price over the fair value of identifiable net assets acquired. Intangible assets are comprised primarily of leasehold interests, acquired franchise rights and the costs of purchased liquor licenses. Leasehold interests primarily represent the fair values of acquired lease contracts having contractual rents lower than fair market rents and are amortized on a straight-line basis over the remaining initial lease term. Acquired franchise rights, which represented the acquired value of franchise contracts, are amortized over the term of the franchise agreements. The costs of obtaining non-transferable liquor licenses from local government agencies are capitalized and generally amortized over a period of up to
20 years
. The costs of purchasing transferable liquor licenses through open markets in jurisdictions with a limited number of authorized liquor licenses are capitalized as indefinite-lived intangible assets.
Goodwill, which is not subject to amortization, is evaluated for impairment annually or more frequently at the level of the Company's single operating segment, which also represents the Company's only reporting unit, if indicators of impairment are present. The Company performed step one of the impairment test on the last day of the fiscal year,
December 29, 2013
. Step one of the impairment test is based upon a comparison of the carrying value of net assets, including goodwill balances, to the fair value of net assets. Fair value is measured using a combination of the market capitalization method, the income approach, and the market approach. The market capitalization method uses the Company's stock price to derive fair value. The income approach consists of utilizing the discounted cash flow method that incorporates the Company's estimates of future revenues and costs, discounted using a risk-adjusted discount rate. The Company's estimates used in the income approach are consistent with the plans and estimates used to manage operations. The market approach utilizes multiples of profit measures in order to estimate the fair value of the assets. The Company evaluates all methods to ensure reasonably consistent results. Additionally, the Company evaluates the key input factors in the models used to determine whether a moderate change in any input factor or combination of factors would significantly change the results of the tests. Based on the completion of the step one test, it was determined that goodwill was not impaired as of
December 29, 2013
. However, an impairment charge may be triggered in the future if the value of the Company's stock declines, sales in the Company's restaurants decline significantly, or if there are significant adverse changes in the operating environment of the restaurant industry. The Company has followed a consistent approach to evaluating whether there are impairments of goodwill. The Company makes adjustments to assumptions to reflect management's view of current market and economic conditions. There was no impairment recorded during fiscal years
2013
,
2012
and
2011
.
Liquor licenses with indefinite lives are reviewed for impairment annually or whenever events or changes in circumstances indicate that the carrying amount may not be recoverable. If the carrying amount is not recoverable, we record an impairment charge for the excess of the carrying amount over the fair value. We determine fair value based on prices in the open market for license in same or similar jurisdictions. No impairment charges were required to be recorded for the fiscal years
2013
,
2012
and
2011
.
Impairment of Long-Lived Assets
—The Company reviews its long-lived assets, including land, property and equipment, and amortizable intangible assets for impairment whenever events or changes in circumstances indicate that the carrying amount of an asset may not be recoverable. Recoverability of assets to be held and used is measured by a comparison of the carrying amount of the assets to the future undiscounted net cash flows expected to be generated by the assets. Identifiable cash flows are measured at the lowest level for which they are largely independent of the cash flows of other groups of assets and liabilities, generally at the restaurant level. If the assets are determined to be impaired, the amount of impairment recognized is the amount by which the carrying amount of the assets exceeds their fair value. Fair value is generally determined using forecasted cash flows discounted using an estimated weighted average cost of capital. Restaurant sites and other assets to be disposed of are reported at the lower of their carrying amount or fair value, less estimated costs to sell. During fiscal years
2013
and
2011
, the Company recorded impairments of certain long-lived assets. There was no impairment recorded during fiscal year
2012
. See Note 3,
Restaurant Impairment and Restaurant Closures
.
Fair Value Measurements
—The Company measures certain financial assets and liabilities at fair value in accordance with the accounting guidance for measuring fair value. These assets and liabilities are measured at each reporting period, and certain of these are revalued as required. Refer to Note 9,
Fair Value Measurements
.
Other Assets, net
—Other assets, net consist primarily of assets related to various deposits, the employee deferred compensation plan and unamortized debt issuance costs. Debt issuance costs are capitalized and amortized to interest expense on a straight-line basis which approximates the effective interest rate method over the term of the Company's long term debt. Due to the Company's refinancing of debt in December
2012
, the Company wrote off
$1.7 million
of certain unamortized loan origination costs associated with the previous credit facility. Refer to Note 7
Borrowings
. Debt issuance costs at the end of fiscal years
2013
and
2012
were
$1.4 million
and
$1.8 million
.
44
RED ROBIN GOURMET BURGERS, INC.
NOTES TO CONSOLIDATED FINANCIAL STATEMENTS (Continued)
Revenue Recognition
—Revenues consist of sales from restaurant operations, gift card breakage, franchise royalties and fees, and other miscellaneous revenue. Revenues from restaurant sales are recognized when payment is tendered at the point of sale.
The Company sells gift cards which do not have an expiration date, and it does not deduct dormancy fees from outstanding gift card balances. The Company recognizes revenue from gift cards when: (i) the gift card is redeemed by the customer; or (ii) the likelihood of the gift card being redeemed by the customer is remote (gift card breakage), and the Company determines that there is not a legal obligation to remit the unredeemed gift card balance to the relevant jurisdiction. The determination of the gift card breakage rate is based upon the Company's specific historical redemption patterns. The Company recognizes gift card breakage by applying its estimate of the rate of gift card breakage over the period of estimated performance (currently
24 months
). The Company completed initial analysis of unredeemed gift card liabilities for gift cards sold in third party locations during the first quarter of
2011
and recognized
$0.4 million
into revenue as an initial adjustment. No adjustments were recorded during fiscal years
2013
and
2012
. For the fiscal years ended
2013
,
2012
and
2011
, the Company recognized
$2.1 million
,
$1.5 million
and
$1.7 million
(inclusive of the initial adjustments) into revenue related to unredeemed gift card breakage. Gift card breakage is included in other revenue in the consolidated statements of operations. Unearned gift card revenue at the end of fiscal years
2013
and
2012
was
$29.8 million
and
$23.6 million
.
The Company typically grants franchise rights to franchisees for a term of
20
years, with the right to extend the term for an additional
ten
years if various conditions are satisfied by the franchisee. The Company provides management expertise, training, pre-opening assistance and restaurant operating assistance in exchange for area development fees, franchise fees, license fees and royalties of
3%
to
4%
of the franchised adjusted gross restaurant sales. The Company recognizes area development fees and franchise fees as income when the Company has performed all material obligations and initial services, which generally occurs upon the opening of the new restaurant. Until earned, these fees are accounted for as an accrued liability. Area development fees are recognized proportionately with the opening of each new restaurant. Royalties are accrued as earned and are calculated each period based on the franchisee's reported adjusted sales.
The Company accounts for its Red Robin Royalty™ loyalty program using a deferred revenue approach in accordance with United States Generally Accepted Accounting Principles ("U.S. GAAP") related to loyalty programs. Red Robin Royalty™ deferred revenue primarily relates to a program in which registered members earn an award for a free entrée for every
nine
entrées purchased. We recognize the current sale of an entrée and defer a portion of the revenue to reflect partial pre-payment for the future entrée the member is entitled to receive. We estimate the future value of the award based on the historical average value of redemptions. We also estimate what portion of registered members are not likely to reach the ninth purchase based on historical activity and recognize the deferred revenue related to those purchases. We recognize the deferred revenue in Restaurant Revenue on earned rewards when redeemed or upon expiration, which is
60
days after the award is earned. We compare the estimate of the value of future awards to historical redemptions to evaluate the reasonableness of the deferred amount. Deferred loyalty revenue, which was included in Unearned revenue in the accompanying consolidated balance sheets, was
$5.9 million
and
$4.6 million
at
December 29, 2013
and
December 30, 2012
.
Advertising
—Advertising production costs are expensed in the period when the advertising first takes place. Other advertising and marketing costs are expensed as incurred. Advertising and marketing costs were
$37.0 million
,
$33.5 million
, and
$29.0 million
in fiscal years
2013
,
2012
and
2011
, and are included in selling, general, and administrative expenses in the consolidated statements of income.
Under the Company's franchise agreements, both the Company and the franchisees must contribute a minimum percentage of revenues to
two
marketing and national media advertising funds (the Marketing Funds). These Marketing Funds are used to develop and distribute Red Robin® branded marketing materials, for media purchases and for administrative costs. The Company's portion of costs incurred by the Marketing Funds is recorded as selling, general and administrative expenses in the Company's consolidated statements of income. Restricted cash includes amounts contributed to the Marketing Funds held for future use.
Rent
—The Company's leases generally contain escalating rent payments over the lease term as well as optional renewal periods. The Company accounts for its leases by recognizing rent expense on a straight-line basis over the lease term, which includes reasonably assured renewal periods. The lease term begins when the Company has the right to control the use of the property, which is typically before rent payments are due under the lease agreement. The difference between the rent expense and rent paid is recorded as deferred rent in the consolidated balance sheet. Rent expense for the period prior to the restaurant opening is expensed in pre-opening costs. Tenant incentives used to fund leasehold improvements are recorded in deferred rent and amortized as reductions of lease rent expense ratably over the lease term.
Additionally, certain of the Company's operating lease agreements contain clauses that provide for additional contingent rent based on a percentage of sales greater than certain specified target amounts. The Company recognizes contingent rent
45
RED ROBIN GOURMET BURGERS, INC.
NOTES TO CONSOLIDATED FINANCIAL STATEMENTS (Continued)
expense prior to the achievement of the specified target that triggers contingent rent, provided the achievement of that target is considered probable. Refer to Note 12
, Commitments and Contingencies.
Self-Insurance Programs
—The Company utilizes a self-insurance plan for health, general liability, and workers' compensation coverage. Predetermined loss limits have been arranged with insurance companies to limit the Company's per occurrence cash outlay. Accrued liabilities and accrued payroll and payroll-related liabilities include the estimated cost to settle reported claims and incurred but unreported claims.
Pre-opening Costs
—Pre-opening costs are expensed as incurred. Pre-opening costs include rental expenses through the date of opening for each restaurant, travel expenses, wages and benefits for the training and opening teams, and food, beverage and other restaurant opening costs incurred prior to a restaurant opening for business.
Income Taxes
—Deferred tax liabilities are recognized for the estimated effects of all taxable temporary differences, and deferred tax assets are recognized for the estimated effects of all deductible temporary differences and net operating losses, if any, and tax credit carryforwards. Measurement of the Company's current and deferred tax liabilities and assets is based on provisions of enacted tax laws.
Earnings Per Share
—Basic earnings per share amounts are calculated by dividing net income by the weighted average number of common shares outstanding during the year. Diluted earnings per share amounts are calculated based upon the weighted average number of common and potentially dilutive common shares outstanding during the year. Potentially dilutive shares are excluded from the computation in periods in which they have an anti-dilutive effect. Diluted earnings per share reflect the potential dilution that could occur if holders of options exercised their holdings into common stock. During fiscal years
2013
,
2012
and
2011
, a total of
2,000
,
305,000
, and
226,000
weighted average stock options outstanding were not included in the computation of diluted earnings per share because to do so would have been anti-dilutive for the periods presented. The Company uses the treasury stock method to calculate the impact of outstanding stock options.
The computations for basic and diluted earnings per share for fiscal year ended
December 29, 2013
,
December 30, 2012
and
December 25, 2011
are as follows (in thousands, except per share data):
|
2013
|
2012
|
2011
|
||||||||||
|
Net income
|
$
|
32,239
|
|
$
|
28,331
|
|
$
|
20,577
|
|
|||
|
Shares:
|
||||||||||||
|
Basic weighted average shares outstanding
|
14,225
|
|
14,411
|
|
15,122
|
|
||||||
|
Dilutive effect of stock options and awards
|
285
|
|
258
|
|
235
|
|
||||||
|
Diluted weighted average shares outstanding
|
14,510
|
|
14,669
|
|
15,357
|
|
||||||
|
Earnings per share:
|
|
|
|
|||||||||
|
Basic
|
$
|
2.27
|
|
$
|
1.97
|
|
$
|
1.36
|
|
|||
|
Diluted
|
$
|
2.22
|
|
$
|
1.93
|
|
$
|
1.34
|
|
|||
Comprehensive Income (loss)
—Comprehensive income (loss) consists of the net income or loss and other gains and losses affecting stockholders' equity that, under U.S. GAAP, are excluded from net income. Other comprehensive loss as presented in the consolidated statements of stockholders' equity for fiscal years
2013
and
2011
consisted of the unrealized loss, net of tax, on the Company's current cash flow hedge which will expire in June 2015. Other comprehensive income as presented in the consolidated statements of stockholders' equity for fiscal year
2012
consisted of the unrealized gain, net of tax, on the Company's current cash flow hedge. See Note 8,
Derivative and Other Comprehensive Income.
Stock-Based Compensation
—The Company maintains several equity incentive plans under which it may grant stock options, stock appreciation rights, restricted stock, stock variable compensation or other forms of awards granted or denominated in the Company's common stock or units of the Company's common stock, as well as cash variable compensation awards to employees, non-employees, directors and consultants. The Company also maintains an employee stock purchase plan. See Note 15,
Stock Incentive Plans
, for additional details.
Deferred Compensation (Income) Expense
—The Company has assets and liabilities related to a deferred compensation plan. In fiscal years
2012
and
2011
, the Company purchased Company-owned whole-life insurance contracts on certain team members to offset the deferred compensation plan obligation. During the third quarter fiscal year
2013
, the Company liquidated these insurance policies and placed the assets of the deferred compensation plan in a rabbi trust. Assets of the rabbi trust are invested in certain mutual funds that cover an investment spectrum range from equities to money market instruments. Increases in the market value of the investments held in the trust result in the recognition of deferred compensation
46
RED ROBIN GOURMET BURGERS, INC.
NOTES TO CONSOLIDATED FINANCIAL STATEMENTS (Continued)
expense reported in Selling, general and administrative expenses and recognition of investment gain reported in Interest income and other, net, in the consolidated statements of income. Decreases in the market value of the investments held in the trust result in the recognition of a reduction to deferred compensation expense and recognition of investment loss reported in Interest income and other, net, in the consolidated statements of income. We recognized deferred compensation expense and investment income of
$0.2 million
in fiscal year
2013
. See Note 16,
Employee Benefit Programs
, for additional details.
2. Recent Accounting Pronouncements
In July 2013, the Financial Accounting Standards Board (“FASB”) issued
Presentation of an Unrecognized Tax Benefit When a Net Operating Loss Carryforward, a Similar Tax Loss, or a Tax Credit Carryforward Exists
, which requires entities to present its unrecognized tax benefits net of its deferred tax assets when settlement in this manner is available under the tax law, which would be based on facts and circumstances as of the balance sheet reporting date and would not consider future events. Gross presentation in the notes to the financial statements will still be required. This update does not require any new recurring disclosures and is effective for annual and interim periods beginning after December 15, 2013, which will require us to adopt these provisions in the first quarter of fiscal 2014. We do not expect the adoption of this guidance will have a material impact on our financial statements.
In February 2013, the FASB issued
Reporting of Amounts Reclassified Out of Accumulated Other Comprehensive Income,
which requires entities to present the effects on the line items of net income of significant amounts reclassified out of accumulated other comprehensive income, but only if the item reclassified is required under GAAP to be reclassified to net income in its entirety in the same reporting period. The guidance is effective for fiscal years beginning after December 15, 2012. The adoption of this guidance did not have a significant impact on the Company’s consolidated financial statements.
In January 2013, the FASB issued
Clarifying the Scope of Disclosures about Offsetting Assets and Liabilities
, which clarifies the scope of transactions that are subject to the disclosures about offsetting and will require disclosure of information about the effect or potential effect of financial instrument netting arrangements on financial position. Entities will be required to present both net (offset amounts) and gross information in the notes to the financial statements for relevant assets and liabilities that are offset. This guidance is effective for fiscal years beginning on or after January 1, 2013, and interim periods within those annual periods. The adoption of this guidance did not have a significant impact on the Company’s consolidated financial statements.
3. Restaurant Impairment and Restaurant Closures
Restaurant Impairment
During fiscal year
2013
, the Company determined that
four
Company-owned restaurants were impaired. The Company recognized a non-cash pre-tax impairment charge of
$1.5 million
resulting from the continuing and projected future results of these restaurants, primarily through projected cash flows. Each restaurant's past and present operating performance were reviewed combined with projected future results, primarily through projected undiscounted cash flows, which indicated possible impairment. The Company compared the carrying amount of each restaurant's assets to its fair value as estimated by management. The fair value of the long-lived assets is typically determined using a discounted cash flow projection model to estimate expected future cash flows. The discount factor is determined using external information regarding the risk-free rate of return, industry beta factors, and premium adjustments. These factors are combined with internal information such as the Company's average cost of debt and effective tax rate to determine a weighted average cost of capital which is applied to the undiscounted cash flows. In certain cases, management uses market information, when available, to estimate the fair value of a restaurant. The impairment charges represent the excess of each restaurant's carrying amount over its estimated fair value. There were no restaurant impairments during fiscal year
2012
. During fiscal year
2011
, the Company determined that the long lived assets of
three
Company-owned restaurants were impaired, and recognized a non-cash pre-tax impairment charge of
$4.3 million
resulting from the continuing and projected losses of these restaurants.
Restaurant Closures
The Company did not close any restaurants in fiscal years
2013
or
2011
. In fiscal year
2012
,
one
restaurant operating below acceptable profitability levels was closed and
two
restaurants were closed at the end of their respective lease terms.
The Company evaluates restaurants that are sold or closed and allocates goodwill based on the relative fair value of the disposal restaurants to the Company's reporting unit. Since restaurant operations are typically valued based on cash flow from operations, the Company compares the historical cash flow from the closed restaurants to the cash flow from the reporting unit to determine the relative value. The Company allocates goodwill to disposed restaurants, if necessary. No goodwill was
47
RED ROBIN GOURMET BURGERS, INC.
NOTES TO CONSOLIDATED FINANCIAL STATEMENTS (Continued)
allocated to the restaurants closed in fiscal year
2012
, because those restaurants had projected negative cash flow and consequently did not have positive fair value.
4. Property and Equipment
Property and equipment consist of the following at
December 29, 2013
, and
December 30, 2012
, (in thousands):
|
2013
|
2012
|
|||||||
|
Land
|
$
|
33,896
|
|
$
|
33,896
|
|
||
|
Buildings
|
79,698
|
|
79,918
|
|
||||
|
Leasehold improvements
|
498,097
|
|
453,761
|
|
||||
|
Furniture, fixtures and equipment
|
257,524
|
|
226,509
|
|
||||
|
Restaurant property leased to others
|
4,554
|
|
4,554
|
|
||||
|
Construction in progress
|
18,178
|
|
18,044
|
|
||||
|
891,947
|
|
816,682
|
|
|||||
|
Accumulated depreciation and amortization
|
(447,220
|
)
|
(403,424
|
)
|
||||
|
Property and equipment, net
|
$
|
444,727
|
|
$
|
413,258
|
|
||
Depreciation and amortization expense on property and equipment, including assets under capital lease, was
$54.5 million
in fiscal year
2013
,
$50.9 million
in fiscal year
2012
and
$50.7 million
in fiscal year
2011
.
5. Goodwill and Intangible Assets
The following table presents goodwill as of
December 29, 2013
, and
December 30, 2012
, (in thousands).
|
2013
|
2012
|
|||||||
|
Balance at beginning of year
|
$
|
62,525
|
|
$
|
61,769
|
|
||
|
Acquisitions
|
—
|
|
756
|
|
||||
|
Balance at end of year
|
$
|
62,525
|
|
$
|
62,525
|
|
||
The Company has had no goodwill impairment losses in the periods presented in the above table or any prior periods.
The following table presents intangible assets subject to amortization as of
December 29, 2013
, and
December 30, 2012
, (in thousands):
|
2013
|
2012
|
|||||||||||||||||||||||
|
Gross
Carrying
Amount
|
Accumulated
Amortization
|
Net
Carrying
Amount
|
Gross
Carrying
Amount
|
Accumulated
Amortization
|
Net
Carrying
Amount
|
|||||||||||||||||||
|
Intangible assets subject to amortization:
|
||||||||||||||||||||||||
|
Franchise rights
|
$
|
43,330
|
|
$
|
(17,622
|
)
|
$
|
25,708
|
|
$
|
43,519
|
|
$
|
(15,342
|
)
|
$
|
28,177
|
|
||||||
|
Leasehold interests
|
12,476
|
|
(4,875
|
)
|
7,601
|
|
12,744
|
|
(4,313
|
)
|
8,431
|
|
||||||||||||
|
Liquor licenses
|
9,924
|
|
(9,278
|
)
|
646
|
|
9,095
|
|
(8,500
|
)
|
595
|
|
||||||||||||
|
$
|
65,730
|
|
$
|
(31,775
|
)
|
$
|
33,955
|
|
$
|
65,358
|
|
$
|
(28,155
|
)
|
$
|
37,203
|
|
|||||||
|
Indefinite-lived intangible assets:
|
||||||||||||||||||||||||
|
Liquor licenses
|
$
|
2,845
|
|
$
|
—
|
|
$
|
2,845
|
|
$
|
—
|
|
$
|
—
|
|
$
|
—
|
|
||||||
|
Intangible assets, net
|
$
|
68,575
|
|
$
|
(31,775
|
)
|
$
|
36,800
|
|
$
|
65,358
|
|
$
|
(28,155
|
)
|
$
|
37,203
|
|
||||||
In fiscal year
2013
the Company purchased several transferable liquor licenses through open markets in jurisdictions with a limited number of authorized liquor licenses. The total costs were capitalized as indefinite-lived intangible assets and are not subject to amortization. Non-amortizing intangible assets are required to be evaluated for impairment at least annually or more frequently if indicators of impairment exist. No impairment charges were recorded related to indefinite-lived intangibles in fiscal years
2013
,
2012
or
2011
.
There were insignificant impairments of franchise rights and leasehold interests related to the
four
restaurants impaired in fiscal year
2013
and insignificant impairments of liquor licenses subject to amortization related to the
three
restaurants impaired
48
RED ROBIN GOURMET BURGERS, INC.
NOTES TO CONSOLIDATED FINANCIAL STATEMENTS (Continued)
in fiscal year
2011
, which are discussed in Note 3,
Restaurant Impairment and Restaurant Closures.
There were no other impairments of intangible assets subject to amortization in fiscal years
2013
and
2011
and no impairments to intangible assets subject to amortization in fiscal year
2012
. The aggregate amortization expense related to intangible assets subject to amortization for fiscal years
2013
,
2012
and
2011
was
$3.7 million
,
$4.6 million
and
$4.6 million
.
The estimated aggregate future amortization expense as of
December 29, 2013
is as follows, (in thousands):
|
2014
|
$
|
3,292
|
|
|
2015
|
3,163
|
|
|
|
2016
|
2,990
|
|
|
|
2017
|
2,939
|
|
|
|
2018
|
2,798
|
|
|
|
Thereafter
|
18,773
|
|
|
|
$
|
33,955
|
|
|
6. Accrued Payroll and Payroll-related Liabilities and Accrued Liabilities
Accrued payroll and payroll-related liabilities consist of the following at
December 29, 2013
, and
December 30, 2012
, (in thousands):
|
2013
|
2012
|
|||||||
|
Payroll
|
$
|
8,498
|
|
$
|
3,713
|
|
||
|
Corporate and restaurant variable compensation
|
17,893
|
|
10,503
|
|
||||
|
Workers compensation insurance
|
6,020
|
|
6,831
|
|
||||
|
Accrued vacation
|
5,256
|
|
5,032
|
|
||||
|
Other
|
8,252
|
|
5,397
|
|
||||
|
$
|
45,919
|
|
$
|
31,476
|
|
|||
Accrued liabilities consist of the following at
December 29, 2013
, and
December 30, 2012
, (in thousands):
|
2013
|
2012
|
|||||||
|
State and city sales taxes
|
$
|
5,965
|
|
$
|
6,919
|
|
||
|
Real estate, personal property, state income and other taxes payable
|
2,360
|
|
2,767
|
|
||||
|
General liability insurance
|
3,996
|
|
2,815
|
|
||||
|
Utilities
|
2,177
|
|
1,874
|
|
||||
|
Other
|
9,130
|
|
8,526
|
|
||||
|
$
|
23,628
|
|
$
|
22,901
|
|
|||
7. Borrowings
Borrowings as of
December 29, 2013
, and
December 30, 2012
, are summarized below (in thousands):
|
2013
|
2012
|
|||||||||||||
|
Borrowings
|
Weighted
Average
Interest Rate
|
Borrowings
|
Weighted
Average
Interest Rate
|
|||||||||||
|
Revolving credit facility and other long-term debt
|
$
|
79,375
|
|
1.73
|
%
|
$
|
125,000
|
|
2.38
|
%
|
||||
|
Capital lease obligations
|
9,339
|
|
5.43
|
%
|
9,995
|
|
5.59
|
%
|
||||||
|
Total debt and capital lease obligations
|
88,714
|
|
|
|
134,995
|
|
|
|
||||||
|
Less: Current portion
|
(826
|
)
|
|
|
(784
|
)
|
|
|
||||||
|
Long-term debt and capital lease obligations
|
$
|
87,888
|
|
|
|
$
|
134,211
|
|
|
|
||||
49
RED ROBIN GOURMET BURGERS, INC.
NOTES TO CONSOLIDATED FINANCIAL STATEMENTS (Continued)
Maturities of long-term debt and capital lease obligations as of
December 29, 2013
are as follows (in thousands):
|
2014
|
$
|
826
|
|
|
2015
|
576
|
|
|
|
2016
|
535
|
|
|
|
2017
|
79,939
|
|
|
|
2018
|
598
|
|
|
|
Thereafter
|
6,240
|
|
|
|
$
|
88,714
|
|
|
On December 14, 2012, the Company terminated its previous credit facility ("Previous Facility") and entered into a new credit facility ("New Credit Facility") with a consortium of banks. The New Credit Facility provides for a
$225 million
revolving line of credit with a sublimit for the issuance of up to
$25 million
in letters of credits and swingline loans up to
$15 million
, and includes an option to increase the amount available under the credit facility up to an additional
$100 million
in the aggregate, subject to lenders' participation. Borrowings under the New Credit Facility are subject to rates based on LIBOR plus a spread based on leverage or a base rate plus a spread based on leverage (base rate is the highest of (a) the Prime Rate, (b) the Federal Funds Rate plus
0.50%
and (c) LIBOR for an Interest Period of one month plus
1%
). This
$225 million
revolving line of credit matures on December 14, 2017. Borrowings under the New Credit Facility are secured by first priority liens and security interests in substantially all of the Company's assets, including the capital stock of certain Company subsidiaries, and are available for financing activities including restaurant construction costs, working capital and general corporate purposes, including, among other uses, to refinance certain indebtedness, permitted acquisitions and redemption of capital stock. As of
December 29, 2013
and
December 30, 2012
, the amounts outstanding under the New Credit Facility were
$78.5 million
and
$125.0 million
, in addition to amounts issued under letters of credit of
$8.1 million
and
$6.8 million
, which reduce the amount available under the credit facility but are not recorded as debt.
Loan origination costs associated with the New Credit Facility are included as deferred costs in Other assets, net in the accompanying consolidated balance sheets. Unamortized debt issuance costs were
$1.4 million
and
$1.8 million
as of
December 29, 2013
and
December 30, 2012
. In fiscal year
2012
, the Company recorded a non-cash, pre-tax charge of approximately
$2.9 million
, comprised of a write-off of unamortized fees from the Previous Facility of
$1.7 million
and a charge related to the de-designation of an interest rate swap of
$1.2 million
.
The Company has a pay fixed/receive variable interest rate swap agreement with Rabobank International, Utrecht ("Rabobank") to hedge the floating interest rate on its credit facilities. The notional amount hedged pursuant to the agreement as of
December 29, 2013
and
December 30, 2012
was
$61.9 million
and
$68.4 million
. On December 14, 2012, at the time of entering into the New Credit Facility, the Company re-designated the swap to the New Credit Facility's
$225 million
revolver. Refer to Note 8,
Derivative and Other Comprehensive Income.
The Company is subject to a number of customary covenants under its New Credit Facility, including limitations on additional borrowings, acquisitions, capital expenditures, share repurchases, lease commitments and dividend payments, and requirements to maintain certain financial ratios. The Company was in compliance with such covenants as of
December 29, 2013
.
8. Derivative and Other Comprehensive Income
The Company enters into derivative instruments for risk management purposes only, including a derivative designated as a cash flow hedge under guidance for derivative instruments and hedging activities. The Company uses interest rate-related derivative instruments to manage its exposure to fluctuations in interest rates. By using these instruments, the Company exposes itself, from time to time, to both credit and market risk. Credit risk is the failure of either party to the contract to perform under the terms of the derivative contract. When the fair value of a derivative contract is positive, the counterparty owes the Company, creating credit risk for the Company. The Company minimizes credit risk by entering into transactions with high-quality counterparties whose credit ratings are evaluated on a quarterly basis. Market risk, as it relates to the Company's interest-rate derivative, is the adverse effect on the value of a financial instrument resulting from changes in interest rates. The Company minimizes market risk by establishing and monitoring parameters that limit the types and degree of market risk that the Company accepts.
The Company had
one
interest rate swap at
December 29, 2013
and
December 30, 2012
and its counterparty is Rabobank International, Utrecht ("Rabobank"). The Company entered into this variable-to-fixed interest rate swap agreement with Rabobank in August 2011 to hedge the floating interest rate on a portion of the term loan under the Previous Facility. The
50
RED ROBIN GOURMET BURGERS, INC.
NOTES TO CONSOLIDATED FINANCIAL STATEMENTS (Continued)
interest rate swap was effective August 5,
2011
with an initial notional amount of
$74.1 million
. In accordance with its original terms, the notional amount of the interest rate swap amortizes over time from
$74.1 million
at inception to
$50.6 million
at its maturity on June 30, 2015. The remaining notional amount as of
December 29, 2013
and
December 30, 2012
was
$61.9 million
and
$68.4 million
Under the terms of the interest rate swap, the quarterly cash payment or receipt is equal to the net of (1) the fixed interest rate of
1.135%
paid by the Company and (2) the 3 month LIBOR rate for the applicable interest period received by the Company multiplied by the remaining notional amount as of the payment date. Concurrent with the December 14, 2012 refinancing of the Previous Facility (See Note 7
Borrowings
), the Company de-designated the original hedging relationship for this interest rate swap and reclassified the
$1.2 million
deferred losses in Accumulated other comprehensive loss into earnings. The Company consequently re-designated the interest rate swap on the New Credit Facility's
$225 million
revolving line.
Changes in fair value of the interest rate swap are recorded, net of tax, as a component of accumulated other comprehensive income, in the accompanying consolidated balance sheets (See Note 9
Fair Value Measurements
for information on the fair value of the interest rate swap). The Company reclassifies the effective gain or loss from accumulated other comprehensive income, net of tax, to interest expense on the Company's consolidated statements of income as the interest expense is recognized on the related debt. The ineffective portion of the change in fair value of the interest rate swap, if any, is recognized directly in earnings in interest expense. Ineffectiveness from the Company's interest rate swap occurs because the fair value was not equal to zero when it was re-designated in December 2012. The following table presents the impact of the interest rate swap designated as a cash flow hedge as of
December 29, 2013
(in thousands):
|
Derivative in cash flow hedging relationship
|
Amount of loss recognized in OCI on derivative (effective portion)
|
Location of loss reclassified from AOCI into income (effective portion)
|
Amount of loss reclassified from AOCI into income (effective portion)
|
Location of loss recognized in income on derivative (ineffective portion and amount excluded from effectiveness testing)
|
Amount of loss recognized in income on derivative (ineffective portion and amount excluded from effectiveness testing)
|
|||||||||||
|
Interest rate swap
|
$
|
(123
|
)
|
Interest expense, net and other
|
$
|
(80
|
)
|
Interest expense, net and other
|
$
|
(5
|
)
|
|||||
The following table summarizes the fair value and presentation of the interest rate swap in the accompanying consolidated balance sheets as hedging instruments as of
December 29, 2013
and
December 30, 2012
(in thousands):
|
Derivative Liability
|
||||||||
|
Balance Sheet Location
|
Fair Value at
December 29, 2013
|
Fair Value at
December 30, 2012
|
||||||
|
Accrued liabilities
|
$
|
516
|
|
$
|
539
|
|
||
|
Other non-current liabilities
|
271
|
|
677
|
|
||||
|
Total derivatives
|
$
|
787
|
|
$
|
1,216
|
|
||
The components of accumulated other comprehensive income related to the interest rate swap being used to hedge cash flows as of
December 29, 2013
and
December 30, 2012
were (in thousands):
|
December 29, 2013
|
December 30, 2012
|
|||||||
|
Unrealized (loss) gain related to cash flow hedges, pretax
|
$
|
(43
|
)
|
$
|
9
|
|
||
|
Tax effect
|
13
|
|
(4
|
)
|
||||
|
Accumulated other comprehensive (loss) income, net
|
$
|
(30
|
)
|
$
|
5
|
|
||
The interest rate swap was highly effective during fiscal year
2013
. Amounts reclassified from accumulated other comprehensive loss into interest expense represent payments made to the counterparty for the effective portion of the interest rate swap. The Company expects the swap to continue to be highly effective during the next twelve months. Approximately
$58,000
of the deferred losses included in accumulated other comprehensive loss on the accompanying consolidated balance sheets at
December 29, 2013
is expected to be reclassified into earnings during the next twelve months. Additionally, the Company had no obligations at
December 29, 2013
to post collateral under the terms of the Interest Rate Swap Agreement. If the Company had breached any of its provisions at
December 29, 2013
, it could have been required to settle its obligations on the interest rate swap at a termination value of
$0.8 million
.
51
9. Fair Value Measurements
Fair value measurements are made under a three-tier fair value hierarchy, which prioritizes the inputs used in the measuring of fair value:
|
Level 1:
|
Observable inputs that reflect unadjusted quoted prices in active markets that are accessible at the measurement date for identical, unrestricted assets or liabilities.
|
|
Level 2:
|
Inputs other than quoted prices included in Level 1 that are observable for the asset or liability, either directly or indirectly.
|
|
Level 3:
|
Inputs that are generally unobservable. These inputs may be used with internally developed methodologies that result in management's best estimate of fair value.
|
Assets and Liabilities Measured at Fair Value on a Recurring Basis
The carrying amounts of the Company's cash and cash equivalents, accounts receivables and accounts payables approximate fair value due to the short term nature or maturity of the instruments.
The derivative liability associated with the interest rate swap is considered to be a Level 2 instrument. The interest rate swap is a standard cash flow hedge whose fair value is estimated using industry-standard valuation models. Such models project future cash flows and discount the future amounts to a present value using market-based observable inputs, including interest rate curves. See Note 8,
Derivative and Other Comprehensive Income
, for the discussion of the derivative liability.
The Company has assets and liabilities related to a deferred compensation plan. See Note 16,
Employee Benefit Programs.
At the end of fiscal
2013
, the assets of the deferred compensation plan are held in a rabbi trust and invested in certain mutual funds that cover an investment spectrum range from equities to money market instruments. These investments are valued using Level 1 inputs and the fair values are based on quoted market prices for identical assets. The value of the deferred compensation plan liability is dependent upon the fair values of the assets held in the rabbi trust and therefore is not measured at fair value. At the end of fiscal
2012
, the Company held Company-owned whole-life insurance contracts on certain team members to offset the deferred compensation plan obligation. The carrying value of both the liability for the deferred compensation plan and associated life insurance policy were equal to their fair value. These agreements were valued using Level 2 inputs. The deferred compensation plan assets are included in Other assets, net and the deferred compensation plan liability is included in Other non-current liability in the accompanying consolidated balance sheets.
As of
December 29, 2013
, the Company had no financial assets or liabilities that were measured using Level 3 inputs. The Company also had no non-financial assets or liabilities that were required to be measured on a recurring basis.
The following tables present the Company's assets and liabilities measured at fair value on a recurring basis for the fiscal years ended
December 29, 2013
and
December 30, 2012
(in thousands):
|
2013
|
Level 1
|
Level 2
|
Level 3
|
|||||||||||||
|
Assets:
|
|
|
|
|
||||||||||||
|
Investments held in rabbi trust
|
$
|
3,769
|
|
$
|
3,769
|
|
$
|
—
|
|
$
|
—
|
|
||||
|
Total assets measured at fair value
|
$
|
3,769
|
|
$
|
3,769
|
|
$
|
—
|
|
$
|
—
|
|
||||
|
Liabilities:
|
|
|
|
|
||||||||||||
|
Derivative—interest rate swap
|
$
|
787
|
|
$
|
—
|
|
$
|
787
|
|
$
|
—
|
|
||||
|
Total liabilities measured at fair value
|
$
|
787
|
|
$
|
—
|
|
$
|
787
|
|
$
|
—
|
|
||||
|
2012
|
Level 1
|
Level 2
|
Level 3
|
|||||||||||||
|
Assets:
|
|
|
|
|
||||||||||||
|
Life insurance policy
|
$
|
2,920
|
|
$
|
—
|
|
$
|
2,920
|
|
$
|
—
|
|
||||
|
Total assets measured at fair value
|
$
|
2,920
|
|
$
|
—
|
|
$
|
2,920
|
|
$
|
—
|
|
||||
|
Liabilities:
|
|
|
|
|
||||||||||||
|
Derivative—interest rate swap
|
$
|
1,216
|
|
$
|
—
|
|
$
|
1,216
|
|
$
|
—
|
|
||||
|
Deferred compensation plan
|
2,974
|
|
—
|
|
2,974
|
|
—
|
|
||||||||
|
Total liabilities measured at fair value
|
$
|
4,190
|
|
$
|
—
|
|
$
|
4,190
|
|
$
|
—
|
|
||||
52
Disclosures of Fair Value of Other Assets and Liabilities
The Company's liabilities under its credit facility and capital leases are carried at historical cost in the accompanying consolidated balance sheets. For disclosure purposes, the Company estimated the fair value of the credit facility and capital lease obligations using discounted cash flow analysis based on market rates obtained from independent third parties for similar types of debt. Both the credit facility and the Company's capital lease obligations are considered to be Level 2 instruments. The carrying value of the Company's credit facility as of
December 29, 2013
and
December 30, 2012
was
$78.5 million
and
$125.0 million
. The fair value of the Company's credit facility at the end of fiscal years
2013
and
2012
was approximately
$78.4 million
and
$124.4 million
. There were
$9.3 million
of outstanding borrowings recorded for the Company's capital leases as of
December 29, 2013
, which have an estimated fair value of
$10.9 million
. At
December 30, 2012
, the carrying amount of the Company's capital lease obligations was
$10.0 million
, and the fair value was
$11.8 million
.
Asset Impairment
The Company recorded impairment charges for
four
and
three
of its restaurants in
2013
and
2011
. These are considered to be assets that are measured at fair value on a nonrecurring basis. The inputs used for the fair value measurement of the restaurants are considered Level 3. For further information refer to Note 3,
Restaurant Impairment and Restaurant Closures
.
10. Supplemental Disclosures to Consolidated Statements of Cash Flows
|
(In thousands)
|
2013
|
2012
|
2011
|
|||||||||
|
Cash paid during the year for:
|
||||||||||||
|
Income taxes
|
$
|
7,205
|
|
$
|
5,871
|
|
$
|
1,698
|
|
|||
|
Interest, net of amounts capitalized
|
2,342
|
|
5,531
|
|
4,953
|
|
||||||
|
Non-cash investing and financing activities:
|
||||||||||||
|
Change in construction related payables
|
9,988
|
|
1,366
|
|
385
|
|
||||||
|
Capital lease obligations incurred for real estate and equipment purchases
|
126
|
|
113
|
|
—
|
|
||||||
|
Note entered for liquor license purchase
|
875
|
|
—
|
|
—
|
|
||||||
11. Income Taxes
The provision (benefit) for income taxes for fiscal year ended
December 29, 2013
,
December 30, 2012
and
December 25, 2011
consist of the following (in thousands):
|
2013
|
2012
|
2011
|
||||||||||
|
Current:
|
||||||||||||
|
Federal
|
$
|
4,667
|
|
$
|
3,977
|
|
$
|
2,135
|
|
|||
|
State
|
2,525
|
|
2,703
|
|
1,832
|
|
||||||
|
Deferred:
|
||||||||||||
|
Federal
|
2,755
|
|
2,115
|
|
(1,961
|
)
|
||||||
|
State
|
(937
|
)
|
(269
|
)
|
(495
|
)
|
||||||
|
$
|
9,010
|
|
$
|
8,526
|
|
$
|
1,511
|
|
||||
The reconciliation of income tax provision that would result from applying the federal statutory rate to income tax provision as shown in the accompanying consolidated statements of income for fiscal year ended
December 29, 2013
,
December 30, 2012
and
December 25, 2011
are as follows:
|
2013
|
2012
|
2011
|
|||||||
|
Tax provision at U.S. federal statutory rate
|
35.0
|
%
|
35.0
|
%
|
35.0
|
%
|
|||
|
State income taxes
|
2.5
|
|
4.1
|
|
4.0
|
|
|||
|
FICA tip tax credits
|
(14.8
|
)
|
(15.9
|
)
|
(24.9
|
)
|
|||
|
HIRE act tax credit
|
—
|
|
—
|
|
(7.6
|
)
|
|||
|
Other tax credits
|
(2.5
|
)
|
—
|
|
—
|
|
|||
|
Other
|
1.6
|
|
(0.1
|
)
|
0.3
|
|
|||
|
Effective tax rate
|
21.8
|
%
|
23.1
|
%
|
6.8
|
%
|
|||
53
RED ROBIN GOURMET BURGERS, INC.
NOTES TO CONSOLIDATED FINANCIAL STATEMENTS (Continued)
The decrease in the Company's effective tax rate in fiscal year
2013
is primarily attributable to the increase in current year general business credits as well as an increase in state income tax credits. The increase in the Company's effective tax rate in fiscal year
2012
is primarily attributable to the increase in earnings before income taxes.
The Company's federal and state deferred taxes at
December 29, 2013
and
December 30, 2012
are as follows (in thousands):
|
2013
|
2012
|
|||||||
|
Current deferred tax assets and (liabilities), net:
|
||||||||
|
Accrued compensation and related costs
|
$
|
8,966
|
|
$
|
8,865
|
|
||
|
Advanced payments
|
1,754
|
|
1,083
|
|
||||
|
General business and other tax credits
|
—
|
|
361
|
|
||||
|
Interest rate swap
|
24
|
|
(2
|
)
|
||||
|
Other current deferred tax assets
|
2,525
|
|
1,724
|
|
||||
|
Other current deferred tax liabilities
|
(180
|
)
|
(1,188
|
)
|
||||
|
Prepaid expenses
|
(3,877
|
)
|
(2,823
|
)
|
||||
|
Supplies inventory
|
(6,260
|
)
|
(5,010
|
)
|
||||
|
Current deferred tax asset, net
|
2,952
|
|
3,010
|
|
||||
|
Non-current deferred tax assets and (liabilities), net:
|
||||||||
|
Deferred Rent
|
15,505
|
|
13,896
|
|
||||
|
Stock-based compensation
|
6,034
|
|
6,864
|
|
||||
|
General business and other tax credits
|
7,742
|
|
9,735
|
|
||||
|
Alternative minimum tax credits
|
1,262
|
|
1,262
|
|
||||
|
Accrued compensation and related costs
|
1,241
|
|
1,016
|
|
||||
|
Other non-current deferred tax assets
|
631
|
|
666
|
|
||||
|
Other non-current deferred tax liabilities
|
(1,056
|
)
|
(455
|
)
|
||||
|
Goodwill
|
(8,876
|
)
|
(7,335
|
)
|
||||
|
Property and equipment
|
(26,640
|
)
|
(31,547
|
)
|
||||
|
Franchise rights
|
1,440
|
|
1,163
|
|
||||
|
Interest rate swap
|
(10
|
)
|
(3
|
)
|
||||
|
Subtotal
|
(2,727
|
)
|
(4,738
|
)
|
||||
|
Valuation Allowance
|
(290
|
)
|
—
|
|
||||
|
Non-current deferred tax liability, net, included in other non-current liabilities
|
(3,017
|
)
|
(4,738
|
)
|
||||
|
Net deferred tax liability
|
$
|
(65
|
)
|
$
|
(1,728
|
)
|
||
Realization of net deferred tax assets is dependent upon profitable operations and future reversals of existing taxable temporary differences. Based on the Company's evaluation of it deferred tax assets, as of
December 29, 2013
, a valuation allowance of approximately
$0.3 million
has been recorded against the deferred tax asset for state income tax credits in order to measure only the portion of the deferred tax assets that more likely than not will be realized. The amount of the deferred tax assets considered realizable, however, could be adjusted if estimates of future taxable income during the carry forward period are increased or reduced or if there are differences in the timing or amount of future reversals of existing taxable temporary differences.
The Company has federal alternative minimum tax credits of
$1.3 million
available with no expiration date. The Company also has general business and other tax credits totaling
$7.7 million
available to offset future taxes which expire through 2033.
Pursuant to the guidance for uncertain tax positions, a taxpayer must be able to more likely than not sustain a position to recognize a tax benefit, and the measurement of the benefit is calculated as the largest amount that is more than 50 percent likely to be realized upon resolution of the benefit. The Company has analyzed filing positions in all of the federal and state jurisdictions where it is required to file income tax returns, as well as all open tax years in these jurisdictions. The only periods subject to examination for the Company's federal and state returns are the 2009 through
2013
tax years.
54
RED ROBIN GOURMET BURGERS, INC.
NOTES TO CONSOLIDATED FINANCIAL STATEMENTS (Continued)
The following table summarizes the Company's unrecognized tax benefits at
December 29, 2013
and
December 30, 2012
(in thousands):
|
2013
|
2012
|
|||||||
|
Beginning of year
|
$
|
335
|
|
$
|
212
|
|
||
|
Increase due to current year tax positions
|
140
|
|
168
|
|
||||
|
Decrease due to current year tax positions
|
—
|
|
(1
|
)
|
||||
|
Settlements
|
(19
|
)
|
(1
|
)
|
||||
|
Reductions related to lapses
|
(55
|
)
|
(43
|
)
|
||||
|
End of year
|
$
|
401
|
|
$
|
335
|
|
||
The total amount of unrecognized tax benefits that, if recognized, would affect the effective tax rate is approximately
$0.4 million
. The Company does not anticipate significant changes in the aggregate amount of unrecognized tax benefits within the next twelve months, other than nominal tax settlements.
The Company's policy for recording interest and penalties associated with audits is to record such items as a component of income before taxes. Penalties are recorded in Other (gains) losses, net, and interest paid or received is recorded in interest expense in the consolidated statements of income. The Company recorded nominal interest expense on the identified tax liabilities in fiscal years
2013
,
2012
and
2011
, and no penalties were recorded in those fiscal years.
12. Commitments and Contingencies
Commitments
Leasing Activities
—The Company leases land, buildings, and equipment used in its operations under operating leases. The Company's operating leases have remaining non-cancelable terms ranging from less than
one
year to more than
15
years. These leases generally contain renewal options which permit the Company to renew the leases at defined contractual rates or prevailing market rates. Certain equipment leases also include options to purchase equipment at the end of the lease term. Certain leases provide for contingent rents, which are determined as a percentage of adjusted restaurant sales in excess of specified levels. The Company records a contingent rent liability and the corresponding rent expense when specified levels have been achieved or when management determines that achieving the specified levels during the fiscal year is probable. Certain lease agreements also require the Company to pay maintenance, insurance, and property tax costs. Rental expense related to land, building, and equipment leases for the fiscal year ended
December 29, 2013
,
December 30, 2012
and
December 25, 2011
are as follows (in thousands):
|
2013
|
2012
|
2011
|
||||||||||
|
Minimum rent
|
$
|
49,206
|
|
$
|
47,287
|
|
$
|
43,756
|
|
|||
|
Contingent rent
|
2,164
|
|
1,861
|
|
1,821
|
|
||||||
|
Equipment rent under operating leases
|
990
|
|
788
|
|
748
|
|
||||||
|
$
|
52,360
|
|
$
|
49,936
|
|
$
|
46,325
|
|
||||
The Company leases certain of its owned land, buildings, and equipment to outside parties under non-cancelable operating leases. Cost of the leased land, buildings and equipment at the end of fiscal years
2013
and
2012
was
$4.6 million
in both periods, and related accumulated depreciation was
$2.7 million
and
$2.6 million
, respectively. Rental income was immaterial for fiscal years
2013
,
2012
and
2011
.
55
RED ROBIN GOURMET BURGERS, INC.
NOTES TO CONSOLIDATED FINANCIAL STATEMENTS (Continued)
Future minimum lease commitments and minimum rental income under all leases as of
December 29, 2013
are as follows (in thousands):
|
Capital
Leases
|
Operating
Leases
|
Rental
Income
|
||||||||||
|
2014
|
$
|
1,308
|
|
$
|
52,595
|
|
$
|
150
|
|
|||
|
2015
|
984
|
|
51,028
|
|
150
|
|
||||||
|
2016
|
906
|
|
48,208
|
|
38
|
|
||||||
|
2017
|
900
|
|
45,128
|
|
|
|
||||||
|
2018
|
900
|
|
40,407
|
|
|
|
||||||
|
Thereafter
|
7,450
|
|
153,513
|
|
|
|
||||||
|
Total
|
12,448
|
|
$
|
390,879
|
|
$
|
338
|
|
||||
|
Less amount representing interest
|
(3,109
|
)
|
|
|
|
|
||||||
|
Present value of future minimum lease payments
|
9,339
|
|
|
|
|
|
||||||
|
Less current portion
|
(826
|
)
|
|
|
|
|
||||||
|
Long-term capital lease obligations
|
$
|
8,513
|
|
|
|
|
|
|||||
At the end of fiscal years
2013
and
2012
, property and equipment included
$20.0 million
and
$20.3 million
of assets under capital lease, respectively, and
$8.6 million
and
$7.3 million
of related accumulated depreciation, respectively.
Contingencies
In the normal course of business, there are various claims in process, matters in litigation, and other contingencies. These include claims resulting from "slip and fall" accidents, employment related claims and claims alleging illness, injury or other food quality, health or operational issues. To date, no claims of these types of litigation, certain of which are covered by insurance policies, have had a material effect on the Company. While it is not possible to predict the outcome of these other suits, legal proceedings and claims with certainty, management is of the opinion that adequate provision for potential losses associated with these other matters has been made in the financial statements and that the ultimate resolution of these other matters will not have a material effect on the Company's financial position and results of operations.
13. Franchise Operations
Results of franchise operations included in the consolidated statements of income for the fiscal year ended
December 29, 2013
,
December 30, 2012
and
December 25, 2011
consist of the following (in thousands):
|
2013
|
2012
|
2011
|
|||||||||
|
Franchise royalties and fees:
|
|||||||||||
|
Royalty income
|
$
|
14,315
|
|
$
|
14,440
|
|
$
|
13,863
|
|
||
|
Franchise fees
|
63
|
|
61
|
|
288
|
|
|||||
|
Total franchise royalties and fees
|
$
|
14,378
|
|
$
|
14,501
|
|
$
|
14,151
|
|
||
The Company provides management expertise, training, pre-opening assistance, and restaurant operating assistance in exchange for area development fees, franchise fees, license fees, and royalties of
3%
to
4%
of the franchised restaurant sales pursuant to the franchise agreements. Franchise fee revenue is recognized when all material obligations and initial services to be provided by the Company have been performed, generally upon the opening of the new restaurant. Until earned, these fees are accounted for as deferred revenue. Area development fees are dependent upon the number of restaurants in the territory as well as the Company's obligations under the area franchise agreement. Consequently, as the Company's obligations are met, area development fees are recognized proportionately with the opening of each new restaurant. Royalties are accrued as earned and are calculated each period based on the franchisee's reported adjusted sales.
56
RED ROBIN GOURMET BURGERS, INC.
NOTES TO CONSOLIDATED FINANCIAL STATEMENTS (Continued)
14. Stockholders' Equity
On November 15, 2012, the Company's board of directors authorized a repurchase of up to
$50 million
of the Company's common stock. This authorization became effective on January 1, 2013, and will terminate upon completing the repurchase of
$50 million
of common stock unless earlier terminated by the Company's board of directors. Purchases under the repurchase program may be made in open market or privately negotiated transactions. Purchases may be made from time to time at the Company's discretion and the timing and amount of any share repurchases will be determined based on share price, market conditions, legal requirements and other factors. The repurchase program does not obligate the Company to acquire any particular amount of common stock, and it may be suspended or discontinued at any time. In fiscal year
2013
, the Company purchased
68,816
shares with an average purchase price of
$72.71
per share for a total of
$5.0 million
.
On August 12, 2010, the Company's board of directors authorized a repurchase of up to
$50.0 million
of the Company's common stock, which was set to expire on December 31, 2011. On October 26, 2011, the Company's board of directors authorized a repurchase of up to
$50.0 million
of the Company's common stock. This authorization expired on December 31, 2012. In fiscal year
2012
, the Company purchased
895,000
shares with an average purchase price of
$29.73
per share for a total of
$24.3 million
. In fiscal year
2011
, the Company purchased
1.2 million
shares, with an average purchase price of
$27.56
per share for a total of
$33.0 million
.
15. Stock Incentive Plans
In 2007, the Company's stockholders approved the 2007 Performance Incentive Plan which was amended and restated in 2008 and amended and restated again in 2011 (the "2007 Stock Plan"). The 2007 Stock Plan authorizes the issuance of stock options, stock appreciation rights (SARs), restricted stock, stock variable compensation and other forms of awards granted or denominated in the Company's common stock or units of the Company's common stock, as well as cash variable compensation awards pursuant to the plan. Persons eligible to receive awards under the 2007 Stock Plan include officers and employees of the Company and any of the Company's subsidiaries, directors of the Company, and certain consultants and advisors to the Company or any of its subsidiaries. The maximum number of shares of the Company's common stock that may be issued or transferred pursuant to awards under the 2007 Stock Plan is
2,074,600
shares. Vesting of the awards under the 2007 Stock Plan is determined at the date of grant by the plan administrator. Each award granted under the 2007 Stock Plan fully vests, becomes exercisable and/or payable, as applicable, upon a change in control event. However, unless the individual award agreement provides otherwise, with respect to executive and certain other high level officers of the Company, upon the occurrence of a change in control, no award will vest unless such officers' employment with the Company is terminated by the Company without cause during the
two
-year period following such change in control event. Each award expires on such date as shall be determined at the date of grant, however, the maximum term of options, SARs and other rights to acquire common stock under the plan is
ten
years after the initial date of the award, subject to provisions for further deferred payment in certain circumstances. The 2007 Stock Plan terminates on April 4, 2021, unless terminated earlier by the Company's board of directors. As of
December 29, 2013
, options to acquire a total of
466,234
shares of the Company's common stock remained outstanding under this plan of which
216,101
were vested.
The Company has
four
other stock-based compensation plans: the 1996 Stock Option Plan (the 1996 Stock Plan), the 2000 Management Performance Common Stock Option Plan (the 2000 Stock Plan), the 2002 Incentive Stock Option Plan (2002 Stock Plan) and the 2004 Performance Incentive Plan (the 2004 Stock Plan). No further grants can be made under these plans. In general, options granted under these plans were issued at the estimated fair market value at the date of grant. Vesting of awards under these plans were generally time based over a period of
one
to
four
years; however, in some cases, options under these plans vested based on the attainment of certain financial results. As of
December 29, 2013
, options to acquire a total of
24,563
of the Company's common stock remain outstanding under these plans of which all are fully vested. Options granted under these plans expire within
ten years
from the date of grant. Canceled options revert back to the 2007 Stock Plan for potential reissuance.
Total stock-based compensation costs recognized in fiscal years
2013
,
2012
, and
2011
were
$3.8 million
,
$3.8 million
and
$3.3 million
, with related income tax benefits of
$1.5 million
,
$1.5 million
and
$1.3 million
. As of
December 29, 2013
, there was
$3.8 million
of total unrecognized compensation cost, excluding estimated forfeitures, which is expected to be recognized over the weighted average remaining vesting period of approximately
1.25
years for stock options and
1.2
years for the restricted stock units. As of
December 29, 2013
, all performance-based stock units and restricted stocks were vested.
57
RED ROBIN GOURMET BURGERS, INC.
NOTES TO CONSOLIDATED FINANCIAL STATEMENTS (Continued)
Stock Options
The tables below summarize the status of the Company's stock option plans (in thousands, except per share data and exercise price):
|
Stock Options
|
|||||||
|
Shares
|
Weighted Average Exercise Price
|
||||||
|
Outstanding, December 30, 2012
|
705
|
|
$
|
27.35
|
|
||
|
Granted
|
129
|
|
42.69
|
|
|||
|
Cancelled
|
(51
|
)
|
31.21
|
|
|||
|
Exercised
|
(292
|
)
|
25.99
|
|
|||
|
Outstanding, December 29, 2013
|
491
|
|
$
|
31.78
|
|
||
|
Shares
|
Weighted
Average
Exercise
Price
|
Weighted
Average
Remaining
Years of
Contractual
Life
|
Aggregate
Intrinsic Value
|
||||||||||
|
Outstanding as of December 29, 2013
|
491
|
|
$
|
31.78
|
|
6.76
|
$
|
21,313
|
|
||||
|
Vested and expected to vest as of December 29, 2013
(1)
|
447
|
|
$
|
31.05
|
|
6.58
|
$
|
19,752
|
|
||||
|
Exercisable as of December 29, 2013
|
241
|
|
$
|
26.27
|
|
5.23
|
$
|
11,780
|
|
||||
___________________________________
|
(1)
|
The expected to vest options are the result of applying the pre-vesting forfeiture rate assumption to total outstanding options.
|
The estimated fair value of each option granted is calculated using the Black-Scholes multiple option-pricing model. The average assumptions used in the model for the fiscal year ended
December 29, 2013
,
December 30, 2012
and
December 25, 2011
were as follows:
|
2013
|
2012
|
2011
|
||||||||||
|
Risk-free interest rate
|
0.7
|
|
%
|
0.7
|
|
%
|
1.2
|
|
%
|
|||
|
Expected years until exercise
|
4.2
|
|
4.1
|
|
3.5
|
|
||||||
|
Expected stock volatility
|
44.4
|
|
%
|
52.8
|
|
%
|
60.3
|
|
%
|
|||
|
Dividend yield
|
—
|
|
%
|
—
|
|
%
|
—
|
|
%
|
|||
|
Weighted average Black-Scholes fair value per share at date of grant
|
$
|
15.19
|
|
$
|
14.60
|
|
$
|
14.21
|
|
|||
|
Total intrinsic value of options exercised (in thousands)
|
$
|
8,263
|
|
$
|
1,477
|
|
$
|
657
|
|
|||
The risk-free interest rate was based on the rate for zero coupon U.S. Government issues with a remaining term similar to the expected life. The expected life of the options represents the period of time the options are expected to be outstanding and is based on historical trends and team member exercise patterns. The expected stock price volatility represents an average of the Company's historical volatility measured over a period approximating the expected life. The dividend yield assumption is based on the Company's history and expectations of dividend payouts.
Restricted Stock
During the fiscal years ended
December 29, 2013
and
December 30, 2012
, the Company did not issue restricted stock as permitted under the 2007 Stock Plan. In the past, the Company has granted restricted stock to its directors, executive officers and other key employees. The restricted shares granted to directors were generally subject to a
three
year vesting requirement. The restricted shares granted to executive officers and other key employees were generally subject to a
four
year graded vesting requirement. The fair value of the non-vested common shares is based on the grant date market value of the common shares.
58
RED ROBIN GOURMET BURGERS, INC.
NOTES TO CONSOLIDATED FINANCIAL STATEMENTS (Continued)
The table below summarizes the status of the Company's non-vested shares under the 2007 Stock Plan (in thousands, except per share data and grant-date fair value):
|
Restricted Stock
|
|||||||
|
Shares
|
Weighted Average Grant-Date Fair Value (per share)
|
||||||
|
Non-vested outstanding, December 30, 2012
|
4
|
|
$
|
14.93
|
|
||
|
Granted
|
—
|
|
—
|
|
|||
|
Cancelled
|
—
|
|
—
|
|
|||
|
Vested
|
(4
|
)
|
14.93
|
|
|||
|
Non-vested outstanding, December 29, 2013
|
—
|
|
$
|
—
|
|
||
Time-Based RSUs
During fiscal years
2013
and
2012
, the Company issued time-based restricted stock units (RSUs) to certain employees as permitted under the 2007 Stock Plan. The Company can grant RSUs to its directors, executive officers and other key employees. The RSUs vest in equal installments over
four
years and upon vesting,
one
share of the Company's common stock is issued for each RSU. The fair value of each RSU granted is equal to the market price of the Company's stock at the date of grant.
The table below summarizes the status of the Company's time-based RSUs under the 2007 Stock Plan (shares in thousands):
|
Restricted Stock Units
|
|||||||
|
Shares
|
Weighted Average Grant-Date Fair Value (per share)
|
||||||
|
Outstanding, December 30, 2012
|
180
|
|
$
|
28.52
|
|
||
|
Granted
|
49
|
|
46.58
|
|
|||
|
Cancelled
|
(10
|
)
|
33.04
|
|
|||
|
Vested
|
(80
|
)
|
45.73
|
|
|||
|
Outstanding, December 29, 2013
|
139
|
|
$
|
46.81
|
|
||
Performance-Based RSUs
In March and September
2010
, the Company granted performance-based restricted stock units ("PSUs") to executives and other key employees. These PSUs were subject to company performance metrics based on Total Shareholder Return and measured the overall stock price performance of the Company relative to the stock price performance of a selected industry peer group, thus resulting in a market condition. The fair value of the PSUs was calculated using the Monte Carlo valuation method. This method utilizes multiple input variables to determine the probability of the Company achieving the market condition and the fair value of the awards. These awards had a
three
-year performance period and were classified as equity as each unit was convertible into
one
share of the Company's common stock upon vesting. Compensation expense was recognized on a straight-line basis over the requisite service period (or to an employee's eligible retirement date, if earlier).
There were no PSUs awarded in fiscal
2012
and
2011
. At the end of fiscal year
2012
, the Company had
35,000
PSUs outstanding. During fiscal year
2013
, the Company awarded an additional
31,000
PSUs based on achievement of the performance metrics during the fiscal year
2010
to fiscal year
2013
performance period. As of
December 29, 2013
, all PSUs were vested.
Long-Term Cash Incentive Plan
In fiscal year
2011
, the Company began a long-term cash incentive program. The long-term cash incentive plan is based on operational metrics with a
three
-year performance period. The awards cliff vest at the end of each
three
-year performance cycle. In fiscal years
2013
,
2012
and
2011
, the Company recorded approximately
$4.2 million
,
$1.5 million
and
$0.4 million
related to this program, in Selling, General and Administrative expense. At
December 29, 2013
and
December 30, 2012
,
$6.4 million
and
$1.9 million
long-term cash incentive plan liability were included in Accrued payroll and payroll-related liabilities in the accompanying consolidated balance sheets.
59
RED ROBIN GOURMET BURGERS, INC.
NOTES TO CONSOLIDATED FINANCIAL STATEMENTS (Continued)
16. Employee Benefit Programs
Employee Deferred Compensation Plan
—In 2003, the Company adopted a deferred compensation plan that permits key employees and other members of management not eligible to participate in the Employee Defined Contribution Plan to defer portions of their compensation. The Company pays all administrative expenses of the plan. Under this plan, eligible team members may elect to defer up to
75%
of their base salary and up to
100%
of variable compensation and commissions each plan year. At the end of fiscal year
2012
, a liability for participant contributions and investment income thereon of
$3.0 million
was included in other non-current liabilities. To offset its obligation, the Company's plan administrator purchased Company-owned whole-life insurance contracts on certain team members. The cash surrender value of these policies at the end of fiscal years
2012
of
$2.9 million
was included in Other assets, net on the accompanying consolidated balance sheet.
During fiscal year
2013
, the Company liquidated these insurance policies and invested the deferred compensation plan assets through a rabbi trust. Assets in the rabbi trust are invested in certain mutual funds that cover an investment spectrum ranging from equities to money market instruments and are available to satisfy the claims of the Company's creditors in the event of bankruptcy or insolvency. These mutual funds have published market prices and are reported at fair value. See Note 9.
Fair Value Measurement
. Changes in the market value of the investments held in the trust result in the recognition of a corresponding gain or loss reported in Interest income and other, net in the consolidated statements of income. A corresponding change in the liability associated with the deferred compensation plan results in an offsetting deferred compensation expense, or reduction of expense, reported in Selling, general and administrative expenses in the consolidated statements of income. The Company recognized deferred compensation expense of
$0.2 million
in fiscal year
2013
. At
December 29, 2013
,
$3.8 million
of deferred compensation assets is included in Other assets, net and
$3.8 million
of deferred compensation plan liability is included in Other non-current liability in the accompanying consolidated balance sheets.
Employee Stock Purchase Plan
—In 2002, the Company adopted an Employee Stock Purchase Plan under which eligible team members may voluntarily contribute up to
15%
of their salary, subject to limitations, to purchase common stock at a price equal to
85%
of the fair market value of a share of the Company's common stock on the first day of each offering period or
85%
of the fair market value of a share of the Company's common stock on the last day of each offering period, whichever amount is less. In general, all of the Company's officers and team members who have been employed by the Company for at least
one year
and who are regularly scheduled to work more than
20 hours
per week are eligible to participate in this plan which operates in successive
six
month periods commencing on each January 1 and July 1 of each fiscal year. A total of
300,000
shares of common stock are available for issuance under this plan. The Company has issued a total of
228,038
shares under this plan, including
21,364
shares that were issued in fiscal year
2013
. A total of
71,962
shares remain available for future issuance. For fiscal year
2013
, in accordance with the guidance for accounting for stock compensation, the Company estimated the fair value of the stock purchase plan using the Black-Scholes multiple-option pricing model. The average assumptions used in the model included a
0.14%
risk-free interest rate;
0.5
year expected life; expected volatility of
42.30%
; and a
0%
dividend yield. The weighted average fair value per share at grant date was
$11.51
. For the fiscal year
2012
, the average assumptions used in the model included a
0.17%
risk-free interest rate;
0.5
year expected life; expected volatility of
48.5%
; and a
0%
dividend yield. The weighted average fair value per share at grant date was
$7.77
. The Company recognized
$0.2 million
compensation expense related to this plan in both fiscal years
2013
and
2012
.
Employee Defined Contribution Plan
—The Company maintains a 401(k) Savings Plan ("401K Plan") which covers eligible team members who have satisfied the service requirements and reached
21
years of age. The 401K Plan, which qualifies under Section 401(k) of the Internal Revenue Code, allows team members to defer specified percentages of their compensation on a pre-tax basis. The Company may make matching contributions in an amount determined by the board of directors. In addition, the Company may contribute each period, at its discretion, an additional amount from profits. In 2006, the board of directors authorized matching contributions equal to
25%
of the first
4%
of compensation that is deferred by the participant. The Company recognized matching contribution expense of
$0.3 million
in each of fiscal years
2013
,
2012
and 2011.
60
17. Related Party Transactions
The former president and majority owner of one of the Company's former franchises served on the Company's board of directors from 2009 until his retirement in May 2013. The Company purchased
13
Red Robin® restaurants in Washington from this former franchisee in 2006. The retired board member is a principal of and holds, directly or indirectly, interests of between
45%
and
100%
in each of
three
privately-held entities that hold the leases for
three
of the acquired Washington restaurants. These leases were assumed by the Company in connection with the acquisition. Under these leases, the Company recognized rent and other related payments in the amounts of
$1.3 million
,
$1.2 million
and
$1.1 million
for the fiscal years
2013
,
2012
and
2011
. Future minimum lease commitments under these leases are
$3.5 million
at the end of fiscal
2013
.
18. Quarterly Results of Operations (unaudited)
The following tables summarize the unaudited consolidated quarterly financial information for fiscal years
2013
and
2012
(in thousands, except per share data):
|
Q1
(16 weeks) |
Q2
(12 weeks) |
Q3
(12 weeks) |
Q4
(1)
(12 weeks)
|
2013
(52 weeks) |
||||||||||||||||
|
Total revenues
|
$
|
306,349
|
|
$
|
238,299
|
|
$
|
230,673
|
|
$
|
241,926
|
|
$
|
1,017,247
|
|
|||||
|
Income from operations
|
$
|
13,546
|
|
$
|
15,389
|
|
$
|
6,802
|
|
$
|
8,077
|
|
$
|
43,814
|
|
|||||
|
Net income
|
$
|
9,480
|
|
$
|
11,139
|
|
$
|
4,661
|
|
$
|
6,959
|
|
$
|
32,239
|
|
|||||
|
Basic earnings per share
|
$
|
0.67
|
|
$
|
0.78
|
|
$
|
0.33
|
|
$
|
0.49
|
|
$
|
2.27
|
|
|||||
|
Diluted earnings per share
|
$
|
0.66
|
|
$
|
0.77
|
|
$
|
0.32
|
|
$
|
0.48
|
|
$
|
2.22
|
|
|||||
|
Q1
(16 weeks) |
Q2
(12 weeks) |
Q3
(12 weeks) |
Q4
(13 weeks) |
2012
(53 weeks) |
||||||||||||||||
|
Total revenues
|
$
|
299,459
|
|
$
|
223,677
|
|
$
|
213,317
|
|
$
|
240,679
|
|
$
|
977,132
|
|
|||||
|
Income from operations
|
$
|
15,747
|
|
$
|
11,423
|
|
$
|
5,836
|
|
$
|
12,203
|
|
$
|
45,209
|
|
|||||
|
Net income
|
$
|
10,558
|
|
$
|
7,748
|
|
$
|
3,533
|
|
$
|
6,492
|
|
$
|
28,331
|
|
|||||
|
Basic earnings per share
|
$
|
0.72
|
|
$
|
0.53
|
|
$
|
0.25
|
|
$
|
0.46
|
|
$
|
1.97
|
|
|||||
|
Diluted earnings per share
|
$
|
0.71
|
|
$
|
0.52
|
|
$
|
0.24
|
|
$
|
0.45
|
|
$
|
1.93
|
|
|||||
___________________________________
|
(1)
|
During the fourth quarter of fiscal 2013, it was determined that
four
Company-owned restaurants were impaired. The Company recognized a pre-tax non-cash impairment charge of
$1.5 million
for these restaurants.
|
19. Subsequent Events
The Company has evaluated subsequent events and found there to be no events requiring recognition or disclosure through the date of issuance of this report.
61
None.
Disclosure Controls and Procedures
Our management evaluated, with the participation of our Chief Executive Officer and Chief Financial Officer, the effectiveness of our disclosure controls and procedures as of the end of the period covered by this Annual Report on Form 10-K. Based on this evaluation, our Chief Executive Officer and Chief Financial Officer have concluded that our disclosure controls and procedures (as defined in Rules 13a-15(e) and 15d-15(e) under the Exchange Act), as of the end of such period, are effective.
Changes in Internal Control Over Financial Reporting
During the first quarter of fiscal year
2013
, the Company completed the first phase of its new Enterprise Resource Planning (“ERP”) system implementation, including the general ledger, accounts receivable, accounts payable and project modules, as part of a multi-year plan to integrate and upgrade our operational and financial systems and processes. The system is expected to replace additional legacy systems and integrate with the core financial systems.
The implementation of this new ERP system results in changes to certain of the Company’s processes and procedures for internal control over financial reporting. The Company has conducted, and through the remaining phases of implementation will continue to conduct, extensive pre-implementation and post-implementation monitoring, testing and process modifications to ensure the effectiveness of internal controls over financial reporting.
There were no other changes in the Company’s internal control over financial reporting that occurred during the Company’s most recent fiscal quarter that has materially affected, or is reasonably likely to materially affect, the Company’s internal control over financial reporting.
Management Report on Internal Control Over Financial Reporting
Management of the Company is responsible for establishing and maintaining adequate internal control over financial reporting as defined in Rule 13a-15(f) or 15d-15(f) promulgated under the Exchange Act. Those rules define internal control over financial reporting as a process designed to provide reasonable assurance regarding the reliability of financial reporting and the preparation of financial statements for external purposes in accordance with generally accepted accounting principles and includes those policies and procedures that:
|
•
|
Pertain to the maintenance of records that in reasonable detail accurately and fairly reflect the transactions and dispositions of the assets of the company;
|
|
•
|
Provide reasonable assurance that transactions are recorded as necessary to permit preparation of financial statements in accordance with generally accepted accounting principles, and the receipts and expenditures of the company are being made only in accordance with authorizations of management and directors of the company; and
|
|
•
|
Provide reasonable assurance regarding prevention or timely detection of unauthorized acquisitions, use or disposition of the company's assets that could have a material effect on the financial statements.
|
Because of its inherent limitations, internal controls over financial reporting may not prevent or detect misstatements. Projections of any evaluation of effectiveness to future periods are subject to the risk that controls may become inadequate because of changes in conditions, or that the degree of compliance with the policies or procedures may deteriorate.
Management assessed the effectiveness of the Company's internal control over financial reporting as of
December 29, 2013
. In making this assessment, the Company's management used the criteria established in Internal Control—Integrated Framework issued by the Committee of Sponsoring Organizations of the Treadway Commission (COSO).
Based on our assessment and those criteria, management believes that, as of
December 29, 2013
, the Company's internal control over financial reporting is effective.
Deloitte & Touche LLP, an independent registered public accounting firm, has issued an attestation report on the Company's internal control over financial reporting included herein.
62
REPORT OF INDEPENDENT REGISTERED PUBLIC ACCOUNTING FIRM
To the Board of Directors and Stockholders of
Red Robin Gourmet Burgers, Inc.
Greenwood Village, Colorado
We
have audited the internal control over financial reporting of Red Robin Gourmet Burgers, Inc. and subsidiaries (the "Company") as of December 29, 2013, based on criteria established in
Internal Control - Integrated Framework (1992)
issued by the Committee of Sponsoring Organizations of the Treadway Commission. The Company's management is responsible for maintaining effective internal control over financial reporting and for its assessment of the effectiveness of internal control over financial reporting, included in the accompanying “Management Report on Internal Control over Financial Reporting”. Our responsibility is to express an opinion on the Company's internal control over financial reporting based on our audit.
We
conducted our audit in accordance with the standards of the Public Company Accounting Oversight Board (United States). Those standards require that we plan and perform the audit to obtain reasonable assurance about whether effective internal control over financial reporting was maintained in all material respects. Our audit included obtaining an understanding of internal control over financial reporting, assessing the risk that a material weakness exists, testing and evaluating the design and operating effectiveness of internal control based on the assessed risk, and performing such other procedures as we considered necessary in the circumstances. We believe that our audit provides a reasonable basis for our opinion.
A
company's internal control over financial reporting is a process designed by, or under the supervision of, the company's principal executive and principal financial officers, or persons performing similar functions, and effected by the company's board of directors, management, and other personnel to provide reasonable assurance regarding the reliability of financial reporting and the preparation of financial statements for external purposes in accordance with generally accepted accounting principles. A company's internal control over financial reporting includes those policies and procedures that (1) pertain to the maintenance of records that, in reasonable detail, accurately and fairly reflect the transactions and dispositions of the assets of the company; (2) provide reasonable assurance that transactions are recorded as necessary to permit preparation of financial statements in accordance with generally accepted accounting principles, and that receipts and expenditures of the company are being made only in accordance with authorizations of management and directors of the company; and (3) provide reasonable assurance regarding prevention or timely detection of unauthorized acquisition, use, or disposition of the company's assets that could have a material effect on the financial statements.
Because
of the inherent limitations of internal control over financial reporting, including the possibility of collusion or improper management override of controls, material misstatements due to error or fraud may not be prevented or detected on a timely basis. Also, projections of any evaluation of the effectiveness of the internal control over financial reporting to future periods are subject to the risk that the controls may become inadequate because of changes in conditions, or that the degree of compliance with the policies or procedures may deteriorate.
In
our opinion, the Company maintained, in all material respects, effective internal control over financial reporting as of December 29, 2013, based on the criteria established in
Internal Control - Integrated Framework (1992)
issued by the Committee of Sponsoring Organizations of the Treadway Commission.
We
have also audited, in accordance with the standards of the Public Company Accounting Oversight Board (United States), the consolidated financial statements as of and for the year ended December 29, 2013 of the Company and our report dated February 24, 2014 expressed an unqualified opinion on those financial statements.
/s/ DELOITTE & TOUCHE LLP
Denv
er, Colorado
February 24, 2014
63
None.
Our board of directors has adopted codes of ethics that apply to all of our directors, officers and employees, including our chief executive officer, chief financial officer and all of the finance team. The full text of our codes of ethics can be found on the investor relations page of our website at
www.redrobin.com
. We intend to disclose any changes in or waivers from the codes of ethics by posting such information on our corporate website or by filing a Current Report on Form 8-K.
Information relating to this item will be included in an amendment to this report or in the proxy statement for our 2014 annual stockholders' meeting and is incorporated by reference in this report. Certain information concerning our executive officers is included in Item 1 of Part I of this report and is hereby incorporated by reference.
Information relating to this item will be included in an amendment to this report or in the proxy statement for our 2014 annual stockholders' meeting and is hereby incorporated by reference in this report.
Information relating to this item will be included in an amendment to this report or in the proxy statement for our 2014 annual stockholders' meeting and is hereby incorporated by reference in this report.
Information relating to this item will be included in an amendment to this report or in the proxy statement for our 2014 annual stockholders' meeting and is hereby incorporated by reference in this report.
Information relating to this item will be included in an amendment to this report or in the proxy statement for our 2014 annual stockholders' meeting and is hereby incorporated by reference in this report.
64
|
(a)
|
Exhibits and Financial Statement Schedules
|
|
(1)
|
Our Consolidated Financial Statements and Notes thereto are included in Item 8 of this Annual Report on Form 10-K. See "Index to Financial Statements and Supplementary Data-Red Robin Gourmet Burgers, Inc. - Index" for more detail.
|
|
(2)
|
All financial schedules have been omitted either because they are not applicable or because the required information is provided in our Consolidated Financial Statements and Notes thereto, included in Item 8 of this Annual Report on Form 10-K.
|
|
(3)
|
Index to Exhibits
|
|
Exhibit
Number
|
Description
|
||
|
(3.1
|
)
|
Restated Certificate of Incorporation dated May 24, 2012. Incorporated by reference to Exhibit 3.1 to our Quarterly Report on Form 10-Q filed on August 10, 2012.
|
|
|
(3.2
|
)
|
Fourth Amended and Restated Bylaws dated May 24, 2012. Incorporated by reference to Exhibit 3.2 to our Quarterly Report on Form 10-Q filed on August 10, 2012.
|
|
|
(3.3
|
)
|
Amendment No. 1 dated February 13, 2013 to Fourth Amended and Restated Bylaws dated May 24, 2012. Incorporated by reference to Exhibit 3.1 to our Current Report on Form 8-K filed on February 19, 2013.
|
|
|
(4.1
|
)
|
Specimen stock certificate. Incorporated by reference to Exhibit 4.1 to Amendment No. 1 of our Registration Statement on Form S-1 filed on June 10, 2002 (Registration No. 333-87044).
|
|
|
(10.1)*
|
|
Red Robin Gourmet Burgers, Inc. 2000 Management Performance Common Stock Option Plan. Incorporated by reference to Exhibit 10.3 to Amendment No. 1 of our Registration Statement on Form S-1 filed on June 10, 2002 (Registration No. 333-87044).
|
|
|
(10.2)*
|
|
Red Robin Gourmet Burgers, Inc. 2002 Stock Incentive Plan. Incorporated by reference to Exhibit 10.4 to Amendment No. 4 of our Registration Statement on Form S-1 filed on July 17, 2002 (Registration No. 333-87044).
|
|
|
(10.3)*
|
|
Red Robin Gourmet Burgers, Inc. 2004 Performance Incentive Plan. Incorporated by reference to Exhibit 10.17 to our Annual Report on Form 10-K filed on April 6, 2005.
|
|
|
(10.4)*
|
|
Form of Red Robin Gourmet Burgers, Inc. 2004 Performance Incentive Plan Incentive Stock Option Agreement. Incorporated by reference to Exhibit 10.12 to our Quarterly Report on Form 10-Q filed on November 4, 2005.
|
|
|
(10.5)*
|
|
Form of Red Robin Gourmet Burgers, Inc. 2004 Performance Incentive Plan Nonqualified Stock Option Agreement. Incorporated by reference to Exhibit 10.11 to our Quarterly Report on Form 10-Q filed on November 4, 2005.
|
|
|
(10.6)*
|
|
Red Robin Gourmet Burgers, Inc. Second Amended and Restated 2007 Performance Incentive Plan. Incorporated by reference to Appendix A to our Definitive Proxy Statement filed on April 21, 2011.
|
|
|
(10.7)*
|
|
Form of Red Robin Gourmet Burgers, Inc. 2007 Performance Incentive Plan Nonqualified Stock Option Agreement. Incorporated by reference to Exhibit 10.7 to our Annual Report on Form 10-K filed on February 23, 2012.
|
|
|
(10.8)*
|
|
Form of Red Robin Gourmet Burgers, Inc. 2007 Performance Incentive Plan Restricted Stock Award Agreement. Incorporated by reference to Exhibit 10.1 to our Quarterly Report on Form 10-Q filed on May 22, 2009.
|
|
|
(10.9)*
|
|
Form of Red Robin Gourmet Burgers, Inc. 2007 Performance Incentive Plan Restricted Stock Unit Award Agreement. Incorporated by reference to Exhibit 10.2 to our Quarterly Report on Form 10-Q filed on May 22, 2009.
|
|
65
|
Exhibit
Number
|
Description
|
||
|
(10.10)*
|
|
Form of Red Robin Gourmet Burgers, Inc. 2007 Performance Incentive Plan Performance-Based Restricted Stock Unit Grant Agreement. Incorporated by reference to Exhibit 10.2 to our Quarterly Report on Form 10-Q filed on May 21, 2010.
|
|
|
(10.11)*
|
|
Form of Red Robin Gourmet Burgers, Inc. Restricted Stock Unit Grant Agreement for Non-Employee Directors. Incorporated by reference to Exhibit 10.1 to our Quarterly Report on Form 10-Q filed on August 13, 2010.
|
|
|
(10.12)*
|
|
Form of Red Robin Gourmet Burgers, Inc. 2007 Performance Incentive Plan Outside Director Stock Option Agreement. Incorporated by reference to Exhibit 10.1 to our Quarterly Report on Form 10-Q filed on May 21, 2010.
|
|
|
(10.13)*
|
|
Form of Red Robin Gourmet Burgers, Inc. Performance Based Cash Award Agreement. Incorporated by reference to Exhibit 10.5 to our Quarterly Report on Form 10-Q filed on November 4, 2011.
|
|
|
(10.14)*
|
|
Red Robin Gourmet Burgers, Inc. Employee Stock Purchase Plan. Incorporated by reference to Exhibit 10.5 to Amendment No. 4 of our Registration Statement on Form S-1 filed on July 17, 2002 (Registration No. 333-87044).
|
|
|
(10.15)*
|
|
First Amendment to Red Robin Gourmet Burgers, Inc. Employee Stock Purchase Plan dated August 4, 2009. Incorporated by reference to Exhibit 10.1 to our Current Report on Form 8-K filed on August 7, 2009.
|
|
|
(10.16)*
|
|
Second Amendment to Red Robin Gourmet Burgers, Inc. Employee Stock Purchase Plan dated December 21, 2009. Incorporated by reference to Exhibit 10.1 to our Current Report on Form 8-K filed on December 24, 2009.
|
|
|
(10.17)*
|
|
Red Robin Gourmet Burgers, Inc. Deferred Compensation Plan, dated January 1, 2003. Incorporated by reference to Exhibit 10.28 to our Annual Report on Form 10-K filed on March 12, 2004.
|
|
|
(10.18)*
|
|
First Amendment to the Red Robin Gourmet Burgers, Inc. Deferred Compensation Plan, dated October 28, 2013. Incorporated by reference to Exhibit 10.2 to our Quarterly Report on Form 10-Q filed on November 8, 2013.
|
|
|
(10.19)
|
|
Form of Indemnification Agreement entered into by and between Red Robin Gourmet Burgers, Inc. and each of our directors and certain executive officers. Incorporated by reference to Exhibit 10.20 to Amendment No. 3 of our Registration Statement on Form S-1 filed on July 12, 2002 (Registration No. 333-87044).
|
|
|
(10.20)*
|
|
Change in Control Agreement between Red Robin Gourmet Burgers, Inc. and Eric C. Houseman dated March 10, 2008. Incorporated by reference to Exhibit 10.2 to our Current Report on Form 8-K filed on March 14, 2008.
|
|
|
(10.21)*
|
|
Form of Change in Control Agreement between Red Robin Gourmet Burgers, Inc. and certain executive officers dated March 10, 2008. Incorporated by reference to Exhibit 10.3 to our Current Report on Form 8-K filed on March 14, 2008.
|
|
|
(10.22)*
|
|
Employment Agreement by and between Red Robin Gourmet Burgers, Inc. and Stephen E. Carley, dated August 11, 2010. Incorporated by reference to Exhibit 10.1 to our Current Report on Form 8-K filed on August 12, 2010.
|
|
|
(10.23)*
|
|
Employment Agreement by and between Red Robin Gourmet Burgers, Inc. and Denny Marie Post, dated August 1, 2011. Incorporated by reference to Exhibit 10.3 to the Company's Quarterly Report on Form 10-Q filed on August 12, 2011.
|
|
|
(10.24)*
|
|
Employment Agreement by and between Red Robin Gourmet Burgers, Inc. and Stuart B. Brown, dated August 10, 2011. Incorporated by reference to Exhibit 10.2 to the Company's Quarterly Report on Form 10-Q filed on November 4, 2011.
|
|
|
(10.25)*
|
|
Employment Agreement by and between Red Robin Gourmet Burgers, Inc. and Michael L. Kaplan, dated September 30, 2013. Incorporated by reference to Exhibit 10.1 to our Quarterly Report on form 10-Q filed on November 8, 2013.
|
|
|
(10.26
|
)
|
Credit Agreement, dated December 14, 2012. Incorporated by reference to Exhibit 10.1 to our Current Report on Form 8-K filed on December 17, 2012.
|
|
|
(10.27
|
)
|
Security Agreement, dated December 14, 2012. Incorporated by reference to Exhibit 10.2 to our Current Report on Form 8-K filed on December 17, 2012.
|
|
66
|
Exhibit
Number
|
Description
|
||
|
(21.1
|
)
|
List of Subsidiaries. Incorporated by reference to Exhibit 21.1 to our Annual Report on Form 10-K filed on February 25, 2010.
|
|
|
23.1
|
|
Consent of Deloitte & Touche LLP, Independent Registered Public Accounting Firm.
|
|
|
31.1
|
|
Rule 13a-14(a)/15d-14(a) Certification of Chief Executive Officer.
|
|
|
31.2
|
|
Rule 13a-14(a)/15d-14(a) Certification of Chief Financial Officer.
|
|
|
32.1
|
|
Section 1350 Certifications of Chief Executive Officer and Chief Financial Officer.
|
|
|
Exhibit
Number
|
Description
|
||
|
101
|
|
The following financial information from the Annual Report on Form 10-K of Red Robin Gourmet Burgers, Inc. for the year ended December 29, 2013, formatted in XBRL (eXtensible Business Reporting Language): (i) Consolidated Balance Sheets at December 29, 2013 and December 30, 2012; (ii) Consolidated Statements of Income for the years ended December 29, 2013, December 30, 2012 and December 25, 2011; (iii) Consolidated Statements of Stockholders' Equity for the years ended December 29, 2013, December 30, 2012 and December 25, 2011; (iv) Consolidated Statements of Cash Flows for the years ended December 29, 2013 and December 30, 2012; and (v) the Notes to Consolidated Financial Statements.
|
|
___________________________________
|
( )
|
Exhibits previously filed in the Company's periodic filings as specifically noted.
|
|
*
|
Executive compensation plans and arrangements.
|
67
SIGNATURES
Pursuant to the requirements of Section 13 or 15(d) of the Securities and Exchange Act of 1934, the registrant has duly caused this report to be signed on its behalf by the undersigned, thereunto duly authorized.
|
RED ROBIN GOURMET BURGERS, INC.
(Registrant)
|
||||
|
February 24, 2014
|
By:
|
/s/ STEPHEN E. CARLEY
|
||
|
(Date)
|
Stephen E. Carley
(Chief Executive Officer)
|
|||
Pursuant to the requirements of the Securities Act of 1934, this report has been signed below by the following persons on behalf of the registrant and in the capacities and on the dates indicated.
|
Signature
|
|
Title
|
|
Date
|
|
|
|
|
|
|
|
/s/ STEPHEN E. CARLEY
|
|
Chief Executive Officer (Principal Executive Officer and Director)
|
|
February 24, 2014
|
|
Stephen E. Carley
|
||||
|
/s/ STUART B. BROWN
|
|
Chief Financial Officer (Principal Financial Officer)
|
|
February 24, 2014
|
|
Stuart B. Brown
|
||||
|
/s/ TERRY D. HARRYMAN
|
|
Chief Accounting Officer (Principal Accounting Officer)
|
|
February 24, 2014
|
|
Terry D. Harryman
|
||||
|
/s/ PATTYE L. MOORE
|
|
Chairperson of the Board
|
|
February 24, 2014
|
|
Pattye L. Moore
|
||||
|
/s/ ROBERT B. AIKEN
|
|
Director
|
|
February 24, 2014
|
|
Robert B. Aiken
|
||||
|
/s/ LLOYD L. HILL
|
|
Director
|
|
February 24, 2014
|
|
Lloyd L. Hill
|
||||
|
/s/ RICHARD J. HOWELL
|
|
Director
|
|
February 24, 2014
|
|
Richard J. Howell
|
||||
|
/s/ GLENN B. KAUFMAN
|
|
Director
|
|
February 24, 2014
|
|
Glenn B. Kaufman
|
||||
|
/s/ STUART I. ORAN
|
|
Director
|
|
February 24, 2014
|
|
Stuart I. Oran
|
||||
|
/s/ JAMES T. ROTHE
|
|
Director
|
|
February 24, 2014
|
|
James T. Rothe
|
||||
68
QuickLinks
69
TABLE OF CONTENTS
Part IItem 1. BusinessItem 1A. Risk FactorsItem 1B. Unresolved Staff CommentsItem 2. PropertiesItem 3. Legal ProceedingsItem 4. Mine Safety DisclosuresPart IIItem 5. Market For The Registrant's Common Equity, Related Stockholder Matters and Issuer Purchases Of Equity SecuritiesItem 6. Selected Financial DataItem 7. Management's Discussion and Analysis Of Financial Condition and Results Of OperationsItem 7A. Quantitative and Qualitative Disclosures About Market RiskItem 8. Financial Statements and Supplementary DataItem 9. Changes in and Disagreements with Accountants on Accounting and Financial DisclosureItem 9A. Controls and ProceduresItem 9B. Other InformationPart IIIItem 10. Directors, Executive Officers and Corporate GovernanceItem 11. Executive CompensationItem 12. Security Ownership Of Certain Beneficial Owners and Management and Related Stockholder MattersItem 13. Certain Relationships and Related Transactions, and Director IndependenceItem 14. Principal Accounting Fees and ServicesPart IVItem 15. Exhibits, Financial Statement Schedules