REPUBLIC SERVICES, INC.
10-Ks and 10-Qs
|
|
|
|
|
|
|
|
|
|
|
|
|
|
|
|
|
|
|
|
|
|
|
|
|
|
|
|
|
|
|
|
|
|
|
|
|
|
|
|
|
|
|
|
|
|
|
|
|
|
|
|
|
|
|
|
UNITED STATES SECURITIES AND EXCHANGE COMMISSION
Washington, D.C. 20549
Form 10-K
(Mark One)
þ
ANNUAL REPORT PURSUANT TO SECTION 13 OR 15(d) OF THE SECURITIES EXCHANGE ACT OF 1934
For the fiscal year ended
December 31, 2014
OR
¨
TRANSITION REPORT PURSUANT TO SECTION 13 OR 15(d) OF THE SECURITIES EXCHANGE ACT OF 1934
For the transition period from
to
Commission file number: 1-14267
REPUBLIC SERVICES, INC.
(Exact Name of Registrant as Specified in its Charter)
|
Delaware
|
65-0716904
|
|
(State or Other Jurisdiction of Incorporation or Organization)
|
(IRS Employer Identification No.)
|
|
18500 North Allied Way
Phoenix, Arizona
|
85054
(Zip Code)
|
|
(Address of Principal Executive Offices)
|
|
Securities registered pursuant to Section 12(b) of the Act:
|
Title of Each Class
|
Name of Each Exchange on which Registered
|
|
Common Stock, par value $.01 per share
|
The New York Stock Exchange
|
Securities registered pursuant to Section 12(g) of the Act:
None
Indicate by check mark if the registrant is a well-known seasoned issuer, as defined in Rule 405 of the Securities Act. Yes
þ
No
¨
Indicate by check mark if the registrant is not required to file reports pursuant to Section 13 or Section 15(d) of the Act. Yes
¨
No
þ
Indicate by check mark whether the registrant: (1) has filed all reports required to be filed by Section 13 or 15(d) of the Securities Exchange Act of 1934 during the preceding 12 months (or for such shorter period that the registrant was required to file such reports), and (2) has been subject to such filing requirements for the past 90 days. Yes
þ
No
¨
Indicate by check mark whether the registrant has submitted electronically and posted on its corporate Website, if any, every Interactive Data File required to be submitted and posted pursuant to Rule 405 of Regulation S-T (§232.405 of this chapter) during the preceding 12 months (or for such shorter period that the registrant was required to submit and post such files) Yes
þ
No
¨
Indicate by check mark if disclosure of delinquent filers pursuant to Item 405 of Regulation S-K (§229.405 of this chapter) is not contained herein, and will not be contained, to the best of registrant’s knowledge, in definitive proxy or information statements incorporated by reference in Part III of this Form 10-K or any amendment to this Form 10-K.
þ
Indicate by check mark whether the registrant is a large accelerated filer, an accelerated filer, a non-accelerated filer, or a smaller reporting company. See the definitions of “large accelerated filer,” “accelerated filer” and “smaller reporting company” in Rule 12b-2 of the Exchange Act. (Check one):
|
Large accelerated filer
þ
|
Accelerated filer
o
|
Non-accelerated filer
o
|
Smaller reporting company
o
|
|||
|
(Do not check if a smaller reporting company)
|
||||||
Indicate by check mark whether the registrant is a shell company (as defined in Rule 12b-2 of the Exchange Act). Yes
¨
No
þ
As of June 30, 2014, the aggregate market value of the shares of the Common Stock held by non-affiliates of the registrant was
$13.5 billion
.
As of
February 10, 2015
, the registrant had outstanding
353,059,223
shares of Common Stock (excluding treasury shares of 61,774,399).
DOCUMENTS INCORPORATED BY REFERENCE
Portions of the Registrant’s Proxy Statement relative to the
2015
Annual Meeting of Shareholders are incorporated by reference in Part III hereof.
TABLE OF CONTENTS
|
Item 1.
|
||
|
Item 1A.
|
||
|
Item 1B.
|
||
|
Item 2.
|
||
|
Item 3.
|
||
|
Item 4.
|
||
|
Item 5.
|
||
|
Item 6.
|
||
|
Item 7.
|
||
|
Item 7A.
|
||
|
Item 8.
|
||
|
Item 9.
|
||
|
Item 9A.
|
||
|
Item 9B.
|
||
|
Item 10.
|
||
|
Item 11.
|
||
|
Item 12.
|
||
|
Item 13.
|
||
|
Item 14.
|
||
|
Item 15.
|
||
Unless the context requires otherwise, all references in this Form 10-K to “Republic,” “the Company,” “we,” “us” and “our” refer to Republic Services, Inc. and its consolidated subsidiaries.
|
ITEM 1.
|
BUSINESS
|
Overview
We are the second largest provider of services in the domestic non-hazardous solid waste services industry, as measured by revenue. As of December 31, 2014, we operate in
39
states and Puerto Rico. We provide non-hazardous solid waste collection services for commercial, industrial, municipal and residential customers through
340
collection operations. We own or operate
198
transfer stations,
189
active solid waste landfills and
60
recycling centers. We also operate
72
landfill gas and renewable energy projects. We were incorporated as a Delaware corporation in 1996.
Based on an industry trade publication, the United States non-hazardous solid waste services industry generates annual revenue of approximately $55 billion, of which approximately 45% is recognized by publicly owned waste companies. Industry data also indicates that the non-hazardous solid waste services industry in the United States remains fragmented as privately held companies and municipal and other local governmental authorities generate approximately 35% and 20%, respectively, of total industry revenue. We believe growth in the solid waste industry historically has been linked primarily to growth in the overall economy, including the level of new household and business formation and changes in residential and commercial construction activity.
Our operations are national in scope, but the physical collection and disposal of waste is very much a local business and the dynamics and opportunities differ in each of our markets. By combining local operating management with standardized business practices, we drive greater overall operating efficiency across the company while maintaining day-to-day operating decisions at the local level, closest to the customer.
We manage and evaluate our operations through three geographic operating regions that are also our reportable segments: East, Central and West. Each region is organized into several areas and each area contains multiple business units or operating locations. Each of our regions and all of our operating areas provide collection, transfer, recycling and landfill services. We believe this structure facilitates integrating our operations within each region, which is a critical component of our operating strategy. It also allows us to maximize the growth opportunities in each of our markets and to operate the business efficiently, while minimizing administrative overhead costs and maintaining effective controls and standards over operational and administrative matters, including financial reporting. See Note 14,
Segment Reporting
, to our consolidated financial statements in Item 8 of this Form 10-K for further discussion of our operating segments.
Our Core Priorities
Commitment to Safety
Republic is dedicated to the safety of our employees, customers and the communities we serve. Due to the nature of our industry, we prioritize safety above all else and we recognize and reward employees for outstanding safety records. Over the past 7 years our safety performance (based on OSHA recordable rates) has been 42% better than the industry average. Our
Think, Choose, Live
slogan encapsulates our everyday safety messaging to our employees to:
Think
about what you are doing,
Choose
the safe answer, and
Live
to go home to your family. With the phrase printed on numerous items, including hard hats and equipment our employees touch, there are constant reminders for employees to go home in the same condition that they came to work. Our goal is to ensure every one of our employees returns home safely each night.
We are proud of our two safety incentive programs: Dedicated to Safety and Dedicated to Excellence. For Dedicated to Safety, employees must meet all safety requirements for the year, including no preventable accidents and no safety warnings. For Dedicated to Excellence, employees must earn the Dedicated to Safety Award and meet additional criteria for customer service, attendance and other performance metrics. During 2014, approximately 12,000 of our employees earned the Dedicated to Safety Award and almost 6,000 earned the Dedicated to Excellence recognition. Further, our industry-leading safety training program, Focus 6, provides employees with tips and techniques to prevent the six most common types of serious accidents: backing, intersections, push-pull-lift, rear collisions, rollover, and pedestrian.
We take pride in recognizing employees who demonstrate a relentless commitment to safety. Employees with the best driving records are eligible for the industry’s most prestigious award, National Waste & Recycling Association’s Driver of the Year. Since 2009, Republic drivers have won Driver of the Year for the large truck category 10 out of 12 times. In 2014, Republic swept the category with all three winners: Large Residential, Large Industrial and Large Commercial.
2
Commitment to Compliance
We also are dedicated to compliance. Compliance with laws and our policies and procedures is essential to our efforts to gain and keep the confidence and support of customers, regulatory and other governmental agencies, suppliers and the public. Most important, compliance is simply the right thing to do and is a critical part of the way we do business. Thus, we require all of our employees and independent contractors to comply with all applicable laws and rules, our Compliance Program and our Code of Business Ethics and Conduct. We also require them to report any violation or illegal activity to us so that we may deal with it appropriately.
Environmental and Social
Republic has made, and continues to make, significant investments in high-impact areas of our business to provide meaningful improvements in environmental and social conditions, and we publicly report on our efforts in these areas.
Environmental.
In 2014, we participated in the Carbon Disclosure Project (CDP) S&P 500 Climate Change Report. The report represents the progress companies achieve in reducing emissions, responding to climate-related risks and opportunities, and mobilizing influence to manage climate change. For our first year, which creates a baseline for future submissions, we earned a disclosure score of 93 out of 100, which reflects our strong commitment to transparency, thoroughness and responsibility, and a C band in performance, which we see as a strong starting point for a first-year responder. We also recently released a Sustainability Report, which modeled the CDP protocol. Our Sustainability Report, which is available on our website at www.republicservices.com, reflects our work in Republic’s five pillars of sustainability: Operations, Materials Management, Communities, Safety and People.
With approximately 16,000 trucks on the road, Republic operates the 8th largest vocational fleet in the country. Approximately 2,200 of our vehicles are powered by compressed natural gas (CNG) at our 36 natural gas fueling stations nationwide. Roughly 35% of the vehicles we bought in 2014 are powered by this domestic fuel source. We believe using CNG vehicles provides us a competitive advantage while reducing the amount of fuel required for our operations, improving air emissions, and significantly reducing vehicle noise profiles. Our CNG fleet has carbon emission reduction benefits equal to removing nearly 13,000 taxis from the roads.
Republic has
60
recycling centers across the nation. We collected nearly 5 million tons of recyclable materials in 2014, enabling discarded items to be regenerated into newspaper, cardboard, glass and plastic bottles, tissue, paper towels, and metal cans. Recycling this quantity of material saves 15 million tons of carbon dioxide equivalent (CO2e), which is nearly as much as our entire carbon footprint.
Republic is equally committed to harnessing landfill gas, the natural byproduct of decomposing waste, and converting it into energy. We operate
72
landfill gas and renewable energy projects across the country. Annually, these projects generate enough electricity to power approximately 400,000 households, meeting the needs of a community the size of Austin, Texas. In addition, the carbon emission reductions benefit from our current landfill gas and renewable energy projects is equal to removing more than 4 million cars from the roads.
Social.
We believe there is no better way to protect our planet than to recruit and hire the heroes who have protected our country. We actively recruit and hire veterans - those transitioning from military life as well as those long discharged from active duty. We value the skills, experience and operational excellence they bring to our organization, as well as their commitment to a better tomorrow. Historically, we have had great success hiring veterans. In 2012, for example, 33% of general managers, 20% of operations managers, and 38% of maintenance managers that we hired self-identified as having served in the U.S. Coast Guard, Army, Navy, Marines or Air Force.
Customer Experience
We strive to provide the highest level of customer service. This means placing the focus squarely on our customers by listening and responding as well as anticipating their wants and needs. We then determine how to best meet our customers' expectations by delivering and implementing superior, customized solutions. We frequently visit customers to ensure customer service and satisfaction, and confirm their expectations are being met. We also have municipal marketing representatives who are responsible for working with municipalities or communities to which we provide residential service.
The expanded use of technology is one of the ways in which we intend to continue to meet our customers’ expectations. We desire to make it easy and seamless for our customers to do business with us. For example, our technology allows more customers to access information and perform functions, such as changing or making service requests and interacting with customer service representatives, online. By increasing the ease of use and functionality of our web-based market presence, we believe we enhance customer satisfaction and retention while we lower our costs.
3
Commitment to People
Training and developing our people is a priority. We aspire to be a company where the best people want to work and are committed to doing their best work every day. We work to create and maintain an environment that attracts, develops and retains people who assure our success with customers, differentiate us from our competitors and allow us to be an employer of choice for top talent. As of December 31, 2014, we employed approximately 31,000 full-time employees, approximately
27%
of whom were covered by collective bargaining agreements.
Creating Shareholder Value
We are committed to creating long-term shareholder value by generating consistent earnings and cash flow growth, while continually improving returns on invested capital. Our incentive compensation programs are aligned with these objectives at all levels of management. We value regular communication and interaction with our shareholders, and regularly participate in investor meetings and conferences.
Management Team
We believe we have one of the most experienced management teams in the solid waste industry.
Donald W. Slager
became our Chief Executive Officer (CEO) and remained our President on January 1, 2011, after having served as our President and Chief Operating Officer (COO) from the Allied Waste Industries, Inc. (Allied) acquisition in December 2008 until then. In addition to his duties as CEO, Mr. Slager resumed the role of principal operating executive from November 2011 until August 2012 and beginning October 2013 to June 2014. Prior to the Allied acquisition, Mr. Slager worked for Allied from 1992 through 2008 and served in various management positions, including President and COO from 2004 through 2008 and Executive Vice President and COO from 2003 to 2004. From 2001 to 2003, Mr. Slager served as Senior Vice President, Operations. Mr. Slager held various management positions at Allied from 1992 to 2003, and was previously General Manager at National Waste Services, where he served in various management positions since 1985. Mr. Slager has over 34 years of experience in the solid waste industry. Mr. Slager has been a member of our Board of Directors since June 24, 2010.
Jeffrey A. Hughes
was named Executive Vice President, Chief Administrative Officer (previously called Executive Vice President, Human Resources) in December 2008. Before that, Mr. Hughes served as Senior Vice President, Eastern Region Operations for Allied from 2004 until the Allied acquisition in December 2008. Mr. Hughes served as Assistant Vice President of Operations Support for Allied from 1999 to 2004 and as a District Manager for Allied from 1988 to 1999. Mr. Hughes has over 27 years of experience in the solid waste industry.
Robert A. Maruster
was elected Executive Vice President - COO, in June 2014. Mr. Maruster has years of broad-based operational experience in the airline industry. He joined Republic from JetBlue Airways Corporation, where he was its COO/Executive Vice President from 2009 to April 2014. Prior to that, Mr. Maruster served JetBlue as its Senior Vice President, Customer Service and Vice President, Operational Planning. Before joining JetBlue in 2005, he served for 12 years in various management roles for Delta Air Lines, culminating in his role running the Atlanta Hub as Vice President, Operations and Customer Service.
Michael P. Rissman
has served as our Executive Vice President, Chief Legal Officer and Corporate Secretary (previously called Executive Vice President, General Counsel and Corporate Secretary) since August 2009. Previously, Mr. Rissman had served as acting General Counsel and Corporate Secretary from March 2009. Mr. Rissman joined Allied as Vice President and Deputy General Counsel in July 2007 and continued in the same positions at Republic following the Allied acquisition in December 2008. Prior to joining Allied, Mr. Rissman was a partner at Mayer Brown LLP in Chicago, where he worked from 1990 until coming to Allied.
Charles F. Serianni
was appointed Executive Vice President - Chief Financial Officer, in August 2014. Mr. Serianni is a seasoned senior executive with 30 years of experience in a variety of progressively more responsible roles. He was named Vice President, Region Controller for the Company's West Region in July 2013. Before that, Mr. Serianni served as our Assistant Controller starting in June 1998 and progressed to Senior Vice President, Chief Accounting Officer in December 2008. He served as the Accounting Operations Director for Republic Industries, Inc. (AutoNation) from February 1997 to June 1998. Before that, Mr. Serianni served as the Accounting Operations Director for Sunglass Hut International, Inc. from May 1993 to February 1997, and as the Manager, Accounting and Auditing Services for Deloitte & Touche from September 1984 to May 1993.
Our local management teams have extensive industry experience in growing, operating and managing solid waste companies and have substantial experience in their local geographic markets. This allows us to quickly respond to and meet our customers’ needs and stay in touch with local businesses and municipalities. Each regional management team includes a region
4
president, vice president, vice president-controller, vice president of human resources, vice president of sales, vice president of operations support, director of safety, director of engineering and environmental management, and director of market planning and development. We believe our strong regional management teams allow us to effectively and efficiently drive our initiatives and help ensure consistency throughout the organization. Our regional management teams and area presidents have extensive authority, responsibility and autonomy for operations within their respective geographic markets. As a result of retaining experienced managers with extensive knowledge of, and involvement in, their local communities, we are proactive in anticipating customers’ needs and adjusting to changes in our markets. We also seek to implement the best practices of our various regions, areas and business units throughout our operations to continue improving our operations and our operating margins.
Integrated Operations
We believe we have created a company with a strong, national operating platform that allows us to compete more effectively and efficiently in the local markets in which we operate. We seek to achieve a high rate of internalization by controlling waste streams from the point of collection through processing or disposal. During the year ended December 31, 2014, approximately
68%
of the total waste volume we collected was disposed at landfills we own or operate (internalization). Our fully integrated markets generally have a lower cost of operations and more favorable cash flows than our non-integrated markets. Through acquisitions, landfill operating agreements and other market development activities, we create market-specific, integrated operations typically consisting of one or more collection operations, transfer stations and landfills. We also operate recycling centers in markets where diversion of waste is a priority and it is profitable to do so.
Growth Initiatives
Our growth initiatives are designed to deliver total waste stream solutions to our customers while creating sustainable economic value for our shareholders. We believe focusing on the following growth initiatives will improve profitability and generate value for our shareholders:
Internal Growth
Within our markets, our goal is to deliver sustainable, long-term profitable growth while efficiently operating our assets to generate attractive rates of return. We allocate capital to businesses, markets and development projects both to support growth and to achieve acceptable rates of return. The key components of our internal growth strategy are:
Price Growth.
We seek to secure price increases necessary to offset increased costs, to improve our operating margins and to obtain adequate returns on our substantial investments in vehicles, equipment, landfills, transfer stations and recycling centers.
Volume Growth.
We believe waste volumes are driven by population growth, household formation and new business formation. Volume growth through increases in our customer base and service offerings is the most capital efficient method to grow our business. We seek to obtain long-term contracts for collecting solid waste under residential collection contracts with municipalities, exclusive franchise agreements, and commercial and industrial contracts. By obtaining such long-term agreements, we can grow our contracted revenue base at the same rate as the underlying population growth in these markets. In addition, by securing a base of long-term recurring revenue, we are better able to protect our market position from competition. We work to increase volumes while ensuring that prices charged for services provide an appropriate return on our capital investment.
Sales and Marketing Activities and National Accounts.
We manage our sales and marketing activities to enable us to capitalize on our leading position in many of the markets in which we operate. While most of our marketing activity is local in nature, we also employ a National Accounts selling organization in response to the needs of national and regional customers. The National Accounts team is designed to provide the best total solution to our customers’ evolving waste management needs in an environmentally responsible manner. We partner with national clients to reach their sustainability goals, optimize waste streams, balance equipment and service intervals, and provide customized reporting. The National Accounts team centralizes certain services like customer support and billing to effectively manage customer needs, while helping minimize costs. With our extended geographic reach, this team effectively serves our customers nationwide.
Acquisitions and Public-Private Partnerships
Our acquisition growth strategy focuses primarily on acquiring privately held solid waste and recycling companies that complement our existing business platform. We believe our ability to acquire privately held companies is enhanced by increasing competition in the solid waste industry, increasing capital requirements due to changes in solid waste regulatory requirements, and the limited number of exit strategies for privately held companies. We also will continue to evaluate opportunities to acquire operations and facilities that are being divested by other publicly owned waste companies. Generally, we expect to maintain a steady pace of tuck-in acquisition investment of approximately $100 million annually. Given our free
5
cash flow, availability under our credit facilities and our ability to access the public capital markets, we also have the flexibility to make additional acquisitions that will complement our existing business platform or larger acquisitions if the right opportunities present themselves.
We also focus on the waste and recycling operations and facilities of municipal and other local governmental authorities for growth opportunities. We believe our ability to acquire operations and facilities from municipalities that are privatizing is growing, as they increasingly seek to raise capital and reduce risk.
The consolidation of acquired businesses into existing operations, whether through acquisitions or public-private partnerships, reduces costs by decreasing capital and expenses used for truck routing, personnel, equipment and vehicle maintenance, inventories and back-office administration.
Expansion of Recycling Capabilities
Based on an industry trade publication, we believe approximately 34% of municipal solid waste is recycled. Communities have increasingly committed to their residents to enhance and expand their recycling programs. We continue to focus on innovative waste disposal processes and programs to help our customers achieve their goals related to sustainability and environmentally sound waste practices. We currently own or operate
60
recycling centers. During 2014, we invested approximately $20 million to develop and upgrade our recycling centers. We will continue to look for opportunities to expand our recycling capabilities in markets where these services are desired and provide an appropriate return on our investment.
Development Activities
We seek to identify opportunities to further our position as an integrated service provider in markets where we are not fully integrated. Where appropriate, we obtain permits to build transfer stations, recycling centers and landfills that would vertically integrate our waste services or expand the service areas for our existing disposal sites. Development projects, while generally less capital intensive than acquisitions, typically require extensive permitting efforts that can take years to complete with no assurance of success. We undertake development projects when we believe there is a reasonable probability of success and where reasonably priced acquisition opportunities are not available.
We continuously evaluate our existing operating assets and their deployment within each market to determine if we have optimized our position and to ensure appropriate return on investment of capital. Where operations are not generating acceptable returns, we examine opportunities to achieve greater efficiencies and returns through integrating additional assets. If such enhancements are not possible, we may ultimately decide to divest the existing assets and reallocate resources to other markets.
Cost Control Initiatives
Our cost control initiatives are designed to deliver the best service possible to our customers in the most efficient, productive and environmentally sound way possible.
Fleet Automation
Approximately 69% of our residential routes have been converted to automated single driver trucks. By converting our residential routes to automated service, we reduce labor costs, improve driver productivity and create a safer work environment for our employees. Additionally, communities using automated vehicles have higher participation rates in recycling programs, thereby complementing our initiative to expand our recycling capabilities.
Fleet Conversion to Compressed Natural Gas (CNG)
Approximately 14% of our fleet operates on natural gas. We expect to continue our gradual fleet conversion to CNG, our preferred alternative fuel technology, as part of our ordinary annual fleet replacement process. We believe a gradual fleet conversion is most prudent to realize the full value of our previous fleet investments. Approximately 35% of our replacement vehicle purchases during 2014 were CNG vehicles. We believe using CNG vehicles provides us a competitive advantage in communities with strict clean emission objectives or initiatives that focus on protecting the environment. Although upfront costs are higher, we expect that using natural gas will reduce our overall fleet operating costs through lower fuel expenses. During 2014, we added 7 CNG fueling stations to our operations to bring our total CNG fueling stations that we operate to 36.
6
Standardized Maintenance
Based on an industry trade publication, we operate the eighth largest vocational fleet in the United States. As of December 31, 2014, our average fleet age in years, by line of business, was as follows:
|
Approximate Number of Vehicles
|
Approximate Average Age
|
||||
|
Residential
|
7,600
|
|
7
|
||
|
Commercial
|
4,300
|
|
7
|
||
|
Industrial
|
3,900
|
|
9
|
||
|
Total
|
15,800
|
|
7.5
|
||
Through standardization of core functions, we believe we can minimize variability in our maintenance processes resulting in higher vehicle quality while extending the service life of our fleet. We believe operating a more reliable, safer and efficient fleet will lower our operating costs. We have implemented standardized maintenance programs for approximately 60% of our fleet maintenance operations as of December 31, 2014.
Cash Utilization Strategy
Key components of our cash utilization strategy include increasing free cash flow and improving our return on invested capital. Our definition of free cash flow, which is not a measure determined in accordance with United States generally accepted accounting principles (U.S. GAAP), is cash provided by operating activities less purchases of property and equipment, plus proceeds from sales of property and equipment as presented in our consolidated statements of cash flows. For a discussion and reconciliation of free cash flow, you should read the "Free Cash Flow" section of our
Management's Discussion and Analysis of Financial Condition and Results of Operations
contained in Item 7 of this Form 10-K.
We believe free cash flow drives shareholder value and provides useful information regarding the recurring cash provided by our operations. Free cash flow also demonstrates our ability to execute our cash utilization strategy, which includes investments in acquisitions and returning a majority of free cash flow to our shareholders through dividends and share repurchases. We are committed to an efficient capital structure and maintaining our investment grade credit ratings.
We manage our free cash flow by ensuring that capital expenditures and operating asset levels are appropriate in light of our existing business and growth opportunities, and by closely managing our working capital, which consists primarily of accounts receivable, accounts payable, and accrued landfill and environmental costs.
Dividends
In July 2003, our board of directors initiated a quarterly cash dividend of $0.04 per share. Our quarterly dividend has increased from time to time thereafter, the latest increase occurring in July 2014 to $0.28 per share, representing a 7.7% increase over that of the prior year. Over the last 5 years, our dividend has increased at a compounded annual growth rate of 8.1%. We expect to continue paying quarterly cash dividends and may consider additional dividend increases if we believe they will enhance shareholder value.
Share Repurchases
In October 2013, our board of directors added $650 million to the existing share repurchase authorization originally approved in November 2010. From November 2010 to December 31, 2014, we used $
1,439.5 million
to repurchase
46.6 million
shares of our common stock at a weighted average cost per share of
$30.88
. As of December 31, 2014, there were $360.2 million remaining under our share repurchase authorization. During 2015, we expect to use our remaining authorization to repurchase more of our outstanding common stock.
7
Strong Capital Structure
Since our merger with Allied on December 5, 2008, we have refinanced $5,288.2 million in senior notes and $1,260.1 million in tax-exempt financings. This reduced the average coupon rate on our senior notes and tax-exempt financings, on a weighted average basis, by more than 175 basis points while extending our debt maturities and giving greater stability to our capital structure. Our debt maturity and revolver capacity profile is as follows (dollars in millions):
|
2015
|
2016
|
2017
|
2018
|
2019
|
Thereafter
|
||||||||||||||||||
|
Credit facilities
|
$
|
—
|
|
$
|
—
|
|
$
|
1,000.0
|
|
$
|
—
|
|
$
|
1,250.0
|
|
$
|
—
|
|
|||||
|
Senior notes
|
—
|
|
—
|
|
—
|
|
700.0
|
|
650.0
|
|
4,375.7
|
|
|||||||||||
|
Debentures
|
—
|
|
—
|
|
—
|
|
—
|
|
—
|
|
200.6
|
|
|||||||||||
|
Tax-exempt financings
|
4.7
|
|
—
|
|
—
|
|
—
|
|
35.0
|
|
1,044.1
|
|
|||||||||||
|
Total
|
$
|
4.7
|
|
$
|
—
|
|
$
|
1,000.0
|
|
$
|
700.0
|
|
$
|
1,935.0
|
|
$
|
5,620.4
|
|
|||||
A key component of our financial strategy includes maintaining investment grade ratings on our senior debt, which was rated BBB+ by Standard & Poor’s Ratings Services, BBB by Fitch Ratings, Inc. and Baa3 by Moody’s Investors Service, Inc. as of December 31, 2014. Such ratings have allowed us, and should continue to allow us, to readily access capital markets at competitive rates.
Operations
Our operations primarily consist of providing collection, transfer and disposal of non-hazardous solid waste and recovering and recycling certain materials.
Collection Services.
We provide solid waste collection services to commercial, industrial, municipal and residential customers through
340
collection operations. In 2014,
77%
of our revenue was derived from collection services. Within the collection line of business,
25%
of our revenue is from services provided to municipal and residential customers,
31%
is from services provided to commercial customers and
21%
is from services provided to industrial (both permanent and temporary) and other customers.
Our residential collection operations involve the curbside collection of refuse from small containers into collection vehicles for transport to transfer stations, or directly to landfills or recycling centers. We typically perform residential solid waste collection services under contracts with municipalities, which we generally secure by competitive bid and which give us exclusive rights to service all or a portion of the homes in the respective municipalities. These contracts or franchises usually range in duration from one to five years, although some of our exclusive franchises are for significantly longer periods. We also perform residential solid waste collection services on a subscription basis, in which individual households contract directly with us. The fees received for subscription residential collection are based primarily on market factors, frequency and type of service, the distance to the disposal facility and the cost of disposal. In general, subscription residential collection fees are paid quarterly in advance by the residential customers receiving the service.
In our commercial and industrial collection operations, we supply our customers with waste containers of varying sizes. We also rent compactors to large waste generators. We typically perform commercial collection services under one- to three-year service agreements, and fees are determined based on a number of factors including the market, collection frequency, type of equipment furnished, type and volume or weight of the waste collected, transportation costs, and the cost of disposal.
We also provide waste collection services to industrial and construction facilities on a contractual basis with terms ranging from a single pickup to one year or longer. Our construction services are provided to the commercial construction and home building sectors. We collect the containers or compacted waste and transport the waste to either a transfer station or directly to a landfill for disposal.
We also provide recycling services based on our collection customers' requirements to complete our service offerings.
Transfer Services.
We own or operate
198
transfer stations. Revenue at our transfer stations is primarily generated by charging tipping or disposal fees, which accounted for approximately
5%
of our revenue during 2014. Our collection operations deposit waste at these transfer stations, as do other private and municipal haulers, for compaction and transfer to disposal sites or recycling centers. Transfer stations provide collection operations with a cost effective means to consolidate waste and reduce transportation costs while providing our landfills with an additional "gate" to extend their geographic reach.
8
When our own collection operations use our transfer stations, this improves internalization by allowing us to retain fees we would otherwise pay to third-party disposal sites. It also allows us to manage costs associated with waste disposal because: (1) transfer trucks have larger capacities than collection trucks, allowing us to deliver more waste to the landfill in each trip; (2) waste is accumulated and compacted at strategically located transfer stations to increase efficiency; and (3) we can retain volume by managing the waste to one of our own landfills rather than to a competitor’s.
Landfill Services.
We own or operate
189
active landfills. We charge tipping fees to third parties, which accounted for approximately
12%
of our revenue during 2014. As of December 31, 2014, we had approximately
37,000
permitted acres and total available permitted and probable expansion disposal capacity of
4.8 billion
in-place cubic yards. The in-place capacity of our landfills is subject to change based on engineering factors, requirements of regulatory authorities, our ability to continue to operate our landfills in compliance with applicable regulations, and our ability to successfully renew operating permits and obtain expansion permits at our sites. Some of our landfills accept non-hazardous special waste, including utility ash, asbestos and contaminated soils.
Most of our active landfill sites have the potential for expanded disposal capacity beyond the currently permitted acreage. We monitor the availability of permitted disposal capacity at each of our landfills and evaluate whether to pursue an expansion at a given landfill based on estimated future waste volumes and prices, market needs, remaining capacity and the likelihood of obtaining an expansion. To satisfy future disposal demand, we are currently seeking to expand permitted capacity at certain of our landfills; however, we cannot assure you that all proposed or future expansions will be permitted as designed.
We also have responsibility for
125
closed landfills, for which we have associated closure and post-closure obligations.
Recycling Services.
We own or operate
60
recycling centers. These facilities generate revenue through the processing and sale of old corrugated cardboard (OCC), old newspaper (ONP), aluminum, glass and other materials, which accounted for approximately
4%
of our revenue during 2014. Approximately 70% of our recycling center volume relates to OCC, ONP and other mixed paper. Of the 4.9 million tons we sold during 2014, 2.3 million moved through our recycling centers and 2.6 million we collected and delivered to third parties.
Changing market demand for recycled commodities causes volatility in commodity prices. At current volumes and mix of materials, we believe a $10 per ton change in the price of recycled commodities will change annual revenue and operating income by approximately
$28 million
and
$16 million
, respectively.
In certain instances we issue recycling rebates to municipalities or large industrial customers, which can be based on the price we receive upon the final sale of recycled commodities, a fixed contractual rate or other measures. We also receive rebates when we dispose of recycled commodities at third-party facilities.
As consumer demand for recycling services has increased, we have met that demand by integrating recycling components to each of our collection service offerings. Our goal is to provide a complete waste stream management solution to our customers in an environmentally sustainable way.
We continue to invest in proven technologies to control costs and to simplify and streamline recycling for our customers. For example, advanced sorting equipment, such as disk screens, magnets and optical sorters, identifies and separates different kinds of paper, metals, plastics and other materials to increase efficiency and maximize our recycling efforts.
Other Services.
Other revenue consists primarily of National Accounts revenue generated from nationwide contracts in markets outside our operating areas where the associated waste handling services are subcontracted to local operators. Consequently, substantially all of this revenue is offset with related subcontract costs, which are recorded in cost of operations.
Competition
We operate in a competitive industry. Competition in the non-hazardous solid waste industry comes from a few other large, national publicly-owned companies, several regional publicly- and privately-owned solid waste companies, and thousands of small privately-owned companies. In any given market, competitors may have larger operations and greater resources. In addition, we compete with municipalities that maintain waste collection or disposal operations. These municipalities may have financial advantages due to the availability of tax revenue and tax-exempt financing.
We compete for collection accounts primarily on the basis of price and the quality of our services. From time to time, our competitors reduce the price of their services in an effort to expand market share or to win a competitively bid municipal contract. Our ability to maintain and increase prices in certain markets may be impacted by our competitors’ pricing policies. This may have an impact on our future revenue and profitability.
9
Seasonality and Severe Weather
Our operating revenues tend to be somewhat higher in the summer months, primarily due to higher volumes of construction and demolition waste. The volumes of industrial and residential waste in certain regions also tend to increase during the summer months. Our second and third quarter revenues and results of operations typically reflect this seasonality.
Our operations can be adversely affected by periods of inclement or severe weather, which could increase the volume of waste collected under our existing contracts (without corresponding compensation), delay the collection and disposal of waste, reduce the volume of waste delivered to our disposal sites, or delay the construction or expansion of our landfill sites and other facilities. Our operations also can be favorably affected by severe weather, which could increase the volume of waste in situations where we are able to charge for our additional services.
Regulation
Our facilities and operations are subject to a variety of federal, state and local requirements that regulate, among other things, the environment, public health, safety, zoning and land use. Operating and other permits, licenses and other approvals generally are required for landfills and transfer stations, certain solid waste collection vehicles, fuel storage tanks and other facilities that we own or operate. These permits are subject to denial, revocation, modification and renewal in certain circumstances. Federal, state and local laws and regulations vary, but generally govern wastewater or storm water discharges, air emissions, the handling, transportation, treatment, storage and disposal of hazardous and non-hazardous waste, and the remediation of contamination associated with the release or threatened release of hazardous substances. These laws and regulations provide governmental authorities with strict powers of enforcement, which include the ability to revoke or decline to renew any of our operating permits, obtain injunctions, or impose fines or penalties in the event of violations, including criminal penalties. The U.S. Environmental Protection Agency (EPA) and various other federal, state and local authorities administer these regulations.
We strive to conduct our operations in compliance with applicable laws, regulations and permits. However, from time to time we have been issued citations or notices from governmental authorities that have resulted in the need to expend funds for remedial work and related activities at various landfills and other facilities or in the need to expend funds for fines, penalties or settlements. We cannot assure you that citations and notices will not be issued in the future despite our strong regulatory compliance efforts. We have established final capping, closure, post-closure and remediation reserves that we believe, based on currently available information, will be adequate to cover our current estimates of regulatory costs; however, we cannot assure you that actual costs will not exceed our reserves.
Federal Regulation.
The following summarizes the primary federal environmental and occupational health and safety-related statutes that affect our facilities and operations:
|
•
|
The Solid Waste Disposal Act, including the Resource Conservation and Recovery Act
(RCRA). RCRA establishes a framework for regulating the handling, transportation, treatment, storage and disposal of hazardous and non-hazardous solid waste, and requires states to develop programs to ensure the safe disposal of solid waste in sanitary landfills.
|
Subtitle D of RCRA establishes a framework for regulating the disposal of municipal solid waste. Regulations under Subtitle D currently include minimum comprehensive solid waste management criteria and guidelines, including location restrictions, facility design and operating criteria, final capping, closure and post-closure requirements, financial assurance standards, groundwater monitoring requirements and corrective action standards. All of the states in which we operate have implemented permit programs pursuant to RCRA and Subtitle D. These state permit programs may include landfill requirements that are more stringent than those of Subtitle D. Our failure to comply with any of these environmental requirements at any of our locations may lead to temporary or permanent loss of an operating permit, which would result in costs in connection with securing new permits and reduced revenue from lost operational time.
All of our planned landfill expansions and new landfill development projects have been engineered to meet or exceed Subtitle D requirements. Operating and design criteria for existing operations have been modified to comply with these regulations. Compliance with Subtitle D regulations has resulted in increased costs and may in the future require substantial additional expenditures in addition to other costs normally associated with our waste management activities.
|
•
|
The Comprehensive Environmental Response, Compensation and Liability Act of 1980
(CERCLA). CERCLA, among other things, provides for the cleanup of sites from which there is a release or threatened release of a hazardous substance into the environment. CERCLA may impose strict joint and several liability for the costs of cleanup and for damages to natural resources upon current owners and operators of a site, parties who were owners or operators of a site at the time the hazardous substances were disposed of, parties who transported the hazardous substances to a site, and parties who arranged for the disposal of the hazardous substances at a site. Under the authority of CERCLA and
|
10
its implementing regulations, detailed requirements apply to the manner and degree of investigation and remediation of facilities and sites where hazardous substances have been or are threatened to be released into the environment. Liability under CERCLA is not dependent on the existence or disposal of only “hazardous wastes,” but also can be based upon the existence of small quantities of more than 700 “substances” characterized by the EPA as “hazardous,” many of which are found in common household waste. Among other things, CERCLA authorizes the federal government to investigate and remediate sites at which hazardous substances have been or are threatened to be released into the environment, or to order persons potentially liable for the cleanup of the hazardous substances to do so themselves. In addition, the EPA has established a National Priorities List of sites at which hazardous substances have been, or are threatened to be, released and which require investigation or cleanup.
CERCLA liability is strict liability. It can be founded upon the release or threatened release, even as a result of unintentional, non-negligent or lawful action, of hazardous substances, including very small quantities of such substances. Thus, even if we have never knowingly transported or received hazardous substances, it is likely that hazardous substances have been deposited or “released” at landfills or other facilities that we presently or historically have owned or operated, or at properties owned by third parties to which we have transported waste. Therefore, we could be liable under CERCLA for the cost of cleaning up such hazardous substances at such sites and for damages to natural resources, even if those substances were deposited at our facilities before we acquired or operated them. The costs of a CERCLA cleanup can be very expensive and can include the costs of disposing of hazardous substances at appropriately-licensed facilities. Given the difficulty of obtaining insurance for environmental impairment liability, any such liability could have a material impact on our business, financial condition, results of operations and cash flows.
|
•
|
The Federal Water Pollution Control Act of 1972
(the Clean Water Act). This act regulates the discharge of pollutants from a variety of sources, including solid waste disposal sites, into streams, rivers and other waters of the United States. Runoff from our landfills and transfer stations that is discharged into surface waters through discrete conveyances must be covered by discharge permits that generally require us to conduct sampling and monitoring, and, under certain circumstances, to reduce the quantity of pollutants in those discharges. Storm water discharge regulations under the Clean Water Act require a permit for certain construction activities and for runoff from industrial operations and facilities, which may affect our operations. If a landfill or transfer station discharges wastewater through a sewage system to a publicly owned treatment works, the facility must comply with discharge limits imposed by that treatment works. In addition, states may adopt groundwater protection programs under the Clean Water Act or the Safe Drinking Water Act that could affect the manner in which our landfills monitor and control their waste management activities. Furthermore, if development at any of our facilities alters or affects wetlands, we may be required to secure permits before such development starts. In these situations, permitting agencies may require mitigation of wetland impacts.
|
|
•
|
The Clean Air Act.
The Clean Air Act imposes limitations on emissions from various sources, including landfills. In March 1996, the EPA promulgated regulations that require large municipal solid waste landfills to install landfill gas monitoring systems. These regulations apply to landfills that commenced construction, reconstruction or modification on or after May 30, 1991, and, principally, to landfills that can accommodate 2.5 million cubic meters or more of municipal solid waste. The regulations apply whether the landfills are active or closed. The date by which each affected landfill must have a gas collection and control system installed and made operational varies depending on calculated emission rates at the landfill. On July 17, 2014, the EPA proposed updates to its regulations that would require large landfills that commenced construction, reconstruction, or modification on or after July 17, 2014 to capture additional landfill gas to reduce emissions of methane and certain non-methane gases, which are recognized as greenhouse gases. That same day, the EPA also issued an Advance Notice of Proposed Rulemaking seeking input on whether and how to update emissions limits for existing landfills to further reduce their emissions of methane and non-methane greenhouse gases. These and other efforts to curtail the emission of greenhouse gases and to ameliorate the effect of climate change may require our landfills to deploy more stringent emission controls and monitoring systems, with resulting capital or operating costs. Many state regulatory agencies also currently require monitoring systems for the collection and control of certain landfill gas. Certain of these state agencies are also implementing greenhouse gas control regulations that would also apply to landfill gas emissions. See Item 1A,
Risk Factors
– “
Regulation of greenhouse gas emissions could impose costs on our operations, the magnitude of which we cannot yet estimate
,” in this Form 10-K.
|
In addition, our vehicle fleet also may become subject to higher efficiency standards or other carbon-emission restrictions. Over the past two years, the EPA and the National Highway Traffic Safety Administration (NHTSA) have adopted regulations mandating the reduction of vehicle tail pipe emissions as a means of reducing greenhouse gas emissions. The regulations take the form of fuel economy standards. The EPA and the NHTSA have developed fuel economy standards in two vehicle categories: (1) conventional automobiles and light-duty trucks; and (2) heavy-duty trucks, including solid waste collection vehicles and tractor trailers. We own and operate vehicles in both categories.
11
For conventional automobiles and light-duty trucks, in May 2010 the EPA and the NHTSA finalized fuel economy standards for model years 2012 through 2016. In October 2011, the EPA and the NHTSA initiated a second round of rulemaking for conventional automobiles and pick-up trucks in model years 2017 through 2025. In August 2011, the EPA and the NHTSA finalized standards for heavy-duty trucks, including solid waste collection vehicles and tractor trailers, for model years 2014 through 2018. In issuing the fuel economy standards for heavy-duty trucks and tractor trailers, the government estimated the standards would increase the cost of the average tractor-trailer by approximately $6,200, but that the vehicle would save fuel costs over its operating life.
|
•
|
The Occupational Safety and Health Act of 1970
(OSHA). This act authorizes the Occupational Safety and Health Administration of the U.S. Department of Labor to promulgate occupational safety and health standards. A number of these standards, including standards for notices of hazardous chemicals and the handling of asbestos, apply to our facilities and operations.
|
State and Local Regulation.
Each state in which we operate has its own laws and regulations governing solid waste disposal, water and air pollution, and, in most cases, releases and cleanup of hazardous substances and liabilities for such matters. States also have adopted regulations governing the design, operation, maintenance and closure of landfills and transfer stations. Some counties, municipalities and other local governments have adopted similar laws and regulations. In addition, our operations may be affected by the trend in many states toward requiring solid waste reduction and recycling programs. For example, several states have enacted laws that require counties or municipalities to adopt comprehensive plans to reduce, through solid waste planning, composting, recycling or other programs, the volume of solid waste deposited in landfills. Additionally, laws and regulations restricting the disposal of certain waste in solid waste landfills, including yard waste, newspapers, beverage containers, unshredded tires, lead-acid batteries, electronic wastes and household appliances, have been adopted in several states and are being considered in others. Legislative and regulatory measures to mandate or encourage waste reduction at the source and waste recycling also have been considered, or are under consideration by, the U.S. Congress and the EPA.
To construct, operate and expand a landfill, we must obtain one or more construction or operating permits, as well as zoning and land use approvals. These permits and approvals may be burdensome to obtain and to comply with, are often opposed by neighboring landowners and citizens’ groups, may be subject to periodic renewal, and are subject to denial, modification, non-renewal and revocation by the issuing agency. Significant compliance disclosure obligations often accompany these processes. In connection with our acquisition of existing landfills, we may be required to spend considerable time, effort and money to bring the acquired facilities into compliance with applicable requirements and to obtain the permits and approvals necessary to increase their capacity.
Other Regulations.
Many of our facilities own and operate underground storage tanks that are generally used to store petroleum-based products. These tanks are subject to federal, state and local laws and regulations that mandate their periodic testing, upgrading, closure and removal. In the event of leaks or releases from these tanks, these regulations require that polluted groundwater and soils be remediated. We believe that all of our underground storage tanks meet all applicable regulations. If underground storage tanks we own or operate leak, we could be liable for response costs and, if the leakage migrates onto the property of others, we could be liable for damages to third parties. We are unaware of facts indicating that issues of compliance with regulations related to underground storage tanks will have a material adverse effect on our consolidated financial condition, results of operations or cash flows.
With regard to our solid waste transportation operations, we are subject to the jurisdiction of the Surface Transportation Board and are regulated by the Federal Highway Administration, Office of Motor Carriers, and by regulatory agencies in states that regulate such matters. Various state and local government authorities have adopted, or are considering adopting, laws and regulations that would restrict the transportation of solid waste across state, county, or other jurisdictional lines. In 1978, the U.S. Supreme Court ruled that a law that restricts the importation of out-of-state solid waste is unconstitutional; however, states have attempted to distinguish proposed laws from those involved in and implicated by that ruling. In 1994, the U.S. Supreme Court ruled that a flow control law, which attempted to restrict solid waste from leaving its place of generation, imposes an impermissible burden upon interstate commerce and is unconstitutional. In 2007, however, the U.S. Supreme Court upheld the right of a local government to direct the flow of solid waste to a publicly-owned and publicly-operated waste facility. A number of county and other local jurisdictions have enacted ordinances or other regulations restricting the free movement of solid waste across jurisdictional boundaries. Other governments may enact similar regulations in the future. These regulations may cause a decline in volumes of waste delivered to our landfills or transfer stations and may increase our costs of disposal, thereby adversely affecting our operations and our financial results.
Liabilities Established for Landfill and Environmental Costs.
We have established reserves for landfill and environmental costs, which include landfill site final capping, closure and post-closure costs. We periodically reassess such costs based on various methods and assumptions regarding landfill airspace and the technical requirements of Subtitle D of RCRA, and we adjust our rates used to expense final capping, closure and post-closure costs accordingly. Based on current information and
12
regulatory requirements, we believe that our recorded reserves for such landfill and environmental expenditures are adequate; however, environmental laws may change, and we cannot assure you that our recorded reserves will be adequate to cover requirements under existing or new environmental laws and regulations, future changes or interpretations of existing laws and regulations, or adverse environmental conditions previously unknown to us. Refer to the
"Contractual Obligations"
section of our
Management’s Discussion and Analysis of Financial Condition and Results of Operations
contained in Item 7 of this Form 10-K for further information.
Liability Insurance and Bonding
The nature of our business exposes us to the possible risk of liabilities arising out of our operations, including damages to the environment, property, employees or the general public. Although we focus on operating safely and prudently, we occasionally receive claims, alleging damages, negligence or other wrongdoing in the planning or performance of work, which resulted in harm to the environment, property, employees or the general public. These liabilities can be significant. We also could be subject to fines and civil and criminal penalties in connection with alleged violations of regulatory requirements. We maintain various policies of insurance that, subject to limitations, exclusions, or deductibles, provide coverage for these types of claims. While we believe the amount of insurance is appropriate for our type of business, we can neither assure you that such insurance would be adequate, in scope or amount, in the event of a major loss, nor that we will not be exposed to uninsured liabilities that could have a material adverse effect on our consolidated financial condition, results of operations or cash flows. We also cannot assure you that we would continue to maintain the insurance should market conditions in the insurance industry make such coverage cost prohibitive.
Accruals for deductibles are based on claims filed and actuarial estimates of claims development and claims incurred but not reported. Due to the variable condition of the insurance market, we have experienced, and may experience in the future, increased deductible retention levels and increased premiums. As we assume more risk through higher retention levels, we may experience more variability in our insurance reserves and expense.
In the normal course of business, we also purchase surety bonds, insurance policies, letters of credit, or marketable securities deposits in connection with municipal residential collection contracts, financial assurance for closure and post-closure of landfills, environmental remediation, environmental permits, and business licenses and permits as a financial guarantee of our performance.
Availability of Reports and Other Information
Our corporate website is
www.republicservices.com
. We make available on that website, free of charge, access to our Annual Reports on Form 10-K, Quarterly Reports on Form 10-Q, Current Reports on Form 8-K, Proxy Statements on Schedule 14A, and amendments to those materials filed or furnished with the Securities and Exchange Commission (SEC) pursuant to Section 13(a) or 15(d) of the Securities Exchange Act of 1934. We make such materials available as soon as reasonably practicable after we electronically submit them to the SEC. Our corporate website also contains our Certificate of Incorporation, Bylaws, Corporate Governance Guidelines, Code of Ethics, Political Contributions Policy, and Charters of the Nominating and Corporate Governance Committee, Audit Committee and Management Development and Compensation Committee of the board of directors. In addition, the SEC website is
www.sec.gov
. The SEC makes available on that website, free of charge, reports, proxy and information statements, and other information regarding issuers, such as us, that file electronically with the SEC. Information on our website or the SEC website is not part of this Form 10-K. We intend to satisfy the disclosure requirements under Item 5.05 of Form 8-K and applicable New York Stock Exchange (NYSE) rules regarding amendments to or waivers of our Code of Ethics by posting this information on our website at
www.republicservices.com
.
|
ITEM 1A.
|
RISK FACTORS
|
This Form 10-K contains certain forward-looking information about us that is intended to be covered by the safe harbor for “forward-looking statements” provided by the Private Securities Litigation Reform Act of 1995. Forward-looking statements are statements that are not historical facts. Words such as “guidance,” “expect,” “will,” “may,” “anticipate,” “plan,” “estimate,” “project,” “intend,” “should,” “can,” “likely,” “could,” “outlook,” “believe” and similar expressions are intended to identify forward-looking statements. These statements include statements about our plans, strategies and prospects. Forward-looking statements are not guarantees of performance. These statements are based upon our management's current beliefs and expectations and are subject to risk and uncertainties, including the risks set forth below in these Risk Factors, which could cause actual results to differ materially from those expressed in, or implied or projected by, the forward-looking information and statements. Although we believe that the expectations reflected in the forward-looking statements are reasonable, we cannot assure you that the expectations will prove to be correct. Accordingly, you should not place undue reliance on the forward-looking statements, which speak only as of the date of this Form 10-K. Except to the extent required by applicable law or regulation, we undertake no obligation to update or publish revised forward-looking statements to reflect events or circumstances after the date of this Form 10-K or to reflect the occurrence of unanticipated events.
13
We have substantial indebtedness, which may limit our financial flexibility.
As of December 31, 2014, we had approximately $7 billion in principal value of debt and capital leases outstanding. This amount of indebtedness and our debt service requirements may limit our financial flexibility to access additional capital and make capital expenditures and other investments in our business, to withstand economic downturns and interest rate increases, to plan for or react to changes in our business and our industry, and to comply with the financial and other covenants of our debt instruments. Further, our ability to comply with these financial and other covenants may be affected by changes in economic or business conditions or other events that are beyond our control. If we do not comply with these covenants, we may be required to take actions such as reducing or delaying capital expenditures, reducing or eliminating dividends or stock repurchases, selling assets, restructuring or refinancing all or part of our existing debt, or seeking additional equity capital.
General economic conditions can directly and adversely affect our operating results.
Our business is directly affected by changes in national and general economic factors and overall economic activity that are outside of our control, including consumer confidence and interest rates. A weak economy generally results in decreases in volumes of waste generated, which adversely affects our revenues. In addition, we have a relatively high fixed-cost structure, which is difficult to adjust quickly to match declining waste volume levels. Consumer uncertainty and the loss of consumer confidence may decrease overall economic activity and thereby limit the amount of services we provide. Additionally, the decline in waste volumes may result in increased competitive pricing pressure and increased customer turnover, resulting in lower revenue and increased operating costs. We cannot assure you that worsening economic conditions would not have a significant adverse impact on our consolidated financial condition, results of operations or cash flows. Further, recovery in the solid waste industry historically has lagged behind recovery in the general economy. Accordingly, we cannot assure you that an improvement in general economic conditions will result in an immediate, or any, improvement in our consolidated financial condition, results of operations or cash flows.
Weakness in the U.S. economy may expose us to credit risk for amounts due from governmental agencies, large national accounts, industrial customers and others.
Weakness in the U.S. economy reduces the amount of taxes collected by various governmental agencies. We provide services to a number of these agencies, including numerous municipalities. These governmental agencies may suffer financial difficulties resulting from a decrease in tax revenue and may ultimately be unable or unwilling to pay amounts owed to us. In addition, weakness in the economy may cause other customers, including our large national accounts or industrial clients, to suffer financial difficulties and ultimately to be unable or unwilling to pay amounts owed to us. This could negatively impact our consolidated financial condition, results of operations and cash flows.
The waste industry is highly competitive and includes competitors that may have greater financial and operational resources, flexibility to reduce prices or other competitive advantages that could make it difficult for us to compete effectively.
We principally compete with large national waste management companies, numerous municipalities, and numerous regional and local companies. Competition for collection accounts is primarily based on price and the quality of services. Competition for disposal business is primarily based on price, geographic location and quality of operations. One of our competitors may have greater financial and operational resources than we do. Further, many counties and municipalities that operate their own waste collection and disposal facilities have the benefits of tax revenue or tax-exempt financing. Our ability to obtain solid waste volume for our landfills also may be limited by the fact that some major collection operations also own or operate landfills to which they send their waste. In certain markets in which we do not own or operate a landfill, from time to time our collection operations may have difficulty competing effectively. If we were to lose market share or if we were to lower prices to address competitive issues, it could negatively impact our consolidated financial condition, results of operations and cash flows.
Price increases may not be adequate to offset the impact of increased costs and may cause us to lose volume.
We seek to secure price increases necessary to offset higher costs, to maintain or improve operating margins, and to obtain adequate returns on our substantial investments in assets such as our landfills. From time to time, our competitors reduce their prices in an effort to expand their market share. Contractual, general economic or market-specific conditions also may limit our ability to raise prices. For example, many of our contracts have price adjustment provisions that are tied to an index such as the consumer price index. Particularly in a weak U.S. economy such as the current one, our costs may increase in excess of the increase, if any, in the consumer price index. This may continue to be the case even when the U.S. economy recovers because a recovery in the solid waste industry historically has lagged behind a recovery in the general economy. As a result, we may be unable to offset increases in costs, improve our operating margins and obtain adequate investment returns through price increases. Price increases also might cause us to lose volume to lower-cost competitors.
14
Increases in the cost of fuel or petrochemicals would increase our operating expenses, and we cannot assure you that we would be able to recover such cost increases from our customers.
We depend on fuel purchased in the open market to operate our collection and transfer trucks and other equipment used for collection, transfer and disposal. Fuel prices are unpredictable and fluctuate significantly based on events beyond our control, including geopolitical developments, actions by the Organization of the Petroleum Exporting Countries and other oil and gas producers, supply and demand for oil and gas, war, terrorism and unrest in oil-producing countries, adverse weather and regional production patterns. Due to contractual or market factors, we may not be able to offset such volatility through fuel recovery fees. Our fuel costs were
$500.0 million
in 2014, or
5.7
% of revenue, compared to $516.7 million in 2013, or 6.1% of our revenue.
To manage our exposure to volatility in fuel prices, we have entered into multiple swap agreements whereby we receive or make payments to counter-parties should the price of fuel vary from a specified amount. During 2014, approximately
20%
of our fuel volume purchases were hedged with swap agreements. Additionally, we are able to collect fuel recovery fees from some customers. For 2014, we were able to recover approximately
78%
of our fuel costs with fuel recovery fees. At current consumption levels, a twenty-cent per gallon change in the price of diesel fuel changes our fuel costs by approximately
$26 million
on an annual basis. Offsetting these changes in fuel expense would be changes in our fuel recovery fee charged to our customers. At current participation rates, we believe a twenty-cent per gallon change in the price of diesel fuel changes our fuel recovery fee by approximately
$25 million
. Accordingly, a substantial rise or drop in fuel costs could result in a material impact to our revenue and cost of operations.
Over the last several years, regulations have been adopted mandating changes in the composition of fuels for motor vehicles. The renewable fuel standards that the EPA sets annually affect the type of fuel our motor vehicle fleet uses. Pursuant to the Energy Independence and Security Act of 2007, the EPA establishes annual renewable fuel volume requirements for four different categories of renewable fuels (renewable fuel, advanced biofuel, cellulosic biofuel, and biomass-based diesel). These volume requirements set standards for the proportion of refiners' or importers' total fuel volume that must contain renewable fuels (as designated by regulation). The total volume metrics for each year vary based upon a number of factors (e.g., the availability of such fuels), and it is difficult to predict the ultimate quantity that the EPA will eventually mandate for 2015 and beyond. These regulations are one of many factors that may affect the cost of the fuel we use.
Our operations also require the use of products (such as liners at our landfills) whose costs may vary with the price of petrochemicals. An increase in the price of petrochemicals could increase the cost of those products, which would increase our operating and capital costs. Petrochemical prices, and hence our operating and capital costs, may be further affected by regulatory efforts to reduce greenhouse gases from the industries that produce such petrochemicals. We are also susceptible to increases in indirect fuel recovery fees from our vendors.
Fluctuations in prices for recycled commodities that we sell to customers may adversely affect our consolidated financial condition, results of operations and cash flows.
We purchase or collect and process recyclable materials such as paper, cardboard, plastics, aluminum and other metals for sale to third parties. Our results of operations may be affected by changing prices or market requirements for recyclable materials. The resale and purchase prices of, and market demand for, recyclable materials are volatile due to changes in economic conditions and numerous other factors beyond our control. These fluctuations may affect our consolidated financial condition, results of operations and cash flows.
To manage our exposure to fluctuations in prices for recycled commodities, we have entered into multiple hedging arrangements whereby we receive or make payments to counter-parties should the price of recycled commodities vary from a specified amount or range. During 2014, approximately
6%
of our tonnage sold was hedged with such arrangements. At current volumes and mix of materials, we believe a $10 per ton change in the price of recycled commodities will change annual revenue and operating income by approximately
$28 million
and
$16 million
, respectively, on an annual basis. Accordingly, a substantial rise or drop in recycled commodity prices could result in a material impact to our revenue and cost of operations.
15
Adverse weather conditions, including those brought about by climate change, may limit our operations and increase the costs of collection and disposal.
Our collection and landfill operations could be adversely impacted by extended periods of inclement weather, or by increased severity of weather and climate extremes resulting from climate change, some of which we may already be experiencing. Recent studies suggest that global warming is occurring faster than previously projected, with the EPA projecting a 4° to 11° Fahrenheit temperature increase in the United States by the end of the century. In addition to sea level rise, this temperature increase is expected to result in more severe droughts, floods, and other extreme weather events. Any of these factors could increase the volume of waste collected under our existing contracts (without corresponding compensation), interfere with collection and landfill operations, delay the development of landfill capacity or reduce the volume of waste generated by our customers. In addition, adverse weather conditions may result in the temporary suspension of our operations, which can significantly affect our operating results in the affected regions during those periods.
We may be unable to maintain our credit ratings or execute our financial strategy.
Our ability to execute our financial strategy depends in part on our ability to maintain investment grade ratings on our debt. The credit rating process is contingent upon a number of factors, many of which are beyond our control. We cannot assure you that we will be able to maintain our investment grade ratings in the future. If we were unable to do so, our interest expense would increase and our ability to obtain financing on favorable terms may be adversely affected.
Our financial strategy also depends on our ability to generate sufficient cash flow to reinvest in our existing business, fund internal growth, acquire other solid waste businesses, pay dividends, repurchase stock, and take other actions to enhance shareholder value. We cannot assure you that we will succeed in executing our broad-based pricing initiatives, that we will generate sufficient cash flow to execute our financial strategy, that we will be able to pay cash dividends at our present rate, or increase them, or that we will be able to continue our share repurchase program.
The solid waste industry is a capital-intensive industry and our capital expenditures may exceed current expectations, which could require us to obtain additional funding for our operations or impair our ability to grow our business.
Our ability to remain competitive and to grow our business largely depends on our cash flow from operations and access to capital. If our capital efficiency programs cannot offset the impact of inflation and business growth, it may be necessary to increase the amount we spend. Additionally, if we make acquisitions or further expand our operations, the amount we spend on capital, capping, closure, post-closure, environmental remediation and other items will increase. Our cash needs also will increase if the expenditures for capping, closure, post-closure and remediation activities increase above our current estimates, which may occur over a long period due to changes in federal, state or local government requirements and other factors beyond our control. Increases in expenditures would negatively impact our cash flows.
We may be unable to obtain or maintain required permits or to expand existing permitted capacity of our landfills, which could decrease our revenue and increase our costs.
We cannot assure you that we will be able to obtain or maintain the permits we require to operate because permits to operate new landfills and transfer stations, or to expand the permitted capacity of existing landfills, have become more difficult and expensive to obtain and maintain. Permits often take years to obtain as a result of numerous hearings and compliance requirements with regard to zoning, environmental and other regulations. These permits are also often subject to resistance from citizen or other groups and other political pressures. Local communities and citizen groups, adjacent landowners or governmental agencies may oppose the issuance of a permit or approval we may need, allege violations of the permits under which we currently operate or laws or regulations to which we are subject, or seek to impose liability on us for environmental damage. Responding to these challenges has at times increased our costs and extended the time associated with establishing new landfills and transfer stations and expanding existing landfills. In addition, failure to receive regulatory and zoning approval may prohibit us from establishing new landfills or transfer stations or expanding existing landfills. Our failure to obtain the required permits to operate our landfills and transfer stations could have a material adverse impact on our consolidated financial condition, results of operations and cash flows. In addition, we may have to dispose collected waste at landfills operated by our competitors or haul the waste long distances at a higher cost to one of our other landfills, either of which could significantly increase our waste disposal costs.
16
If we do not appropriately estimate landfill capping, closure and post-closure costs, our financial condition and results of operations may be adversely affected.
A landfill must be closed and capped, and post-closure maintenance commenced, once the landfill's permitted capacity is reached and additional capacity is not authorized. We have significant financial obligations relating to capping, closure and post-closure costs at our existing owned or operated landfills, and will have material financial obligations with respect to any future owned or operated landfills. We establish accruals for the estimated costs associated with capping, closure and post-closure financial obligations. We could underestimate such costs, and our financial obligations for capping, closure or post-closure costs could exceed the amounts accrued or amounts otherwise receivable pursuant to trust funds established for this purpose. Additionally, if a landfill must be closed earlier than expected or its remaining airspace is reduced for any other reason, the accruals for capping, closure and post-closure could be required to be accelerated. If our capping, closure or post-closure costs exceed the amounts accrued, or if such accruals are required to be accelerated, this could have a material adverse impact on our consolidated financial condition, results of operations and cash flows.
Alternatives to landfill disposal could reduce our disposal volumes and cause our revenues and operating results to decline.
Most of the states in which we operate landfills require counties and municipalities to formulate comprehensive plans to reduce the volume of solid waste deposited in landfills through waste planning, composting, recycling or other programs. Some state and local governments mandate waste reduction at the source and prohibit the disposal of certain types of wastes, such as yard waste, at landfills. Further, many of our customers voluntarily are diverting waste to alternatives to landfill disposal, such as recycling and composting, while also working to reduce the amount of waste they generate. Many of the largest companies in the U.S. are setting zero-waste goals in which they strive to send no waste to landfills. Although such actions help to protect our environment, they have reduced, and will in the future reduce, the volume of waste going to landfills and may affect the prices that we can charge for landfill disposal. Accordingly, we cannot assure you that we will be able to operate our landfills at their current volumes or charge current prices for landfill disposal services due to possible decreases in demand for such services. If we cannot expand our service offerings and grow lines of business to service waste streams that do not go to landfills and to provide services for customers that wish to reduce waste entirely, this could have a negative impact on our consolidated financial condition, results of operations and cash flows. Further, even if we can develop such service offerings and lines of business, disposal alternatives nonetheless could have a negative impact on our consolidated financial condition, results of operations and cash flows.
The possibility of landfill and transfer station site development projects, or expansion projects not being completed or certain other events could result in material charges to income.
In accordance with U.S. GAAP, we capitalize certain expenditures relating to development, expansion and other projects. If a facility or operation is permanently shut down or determined to be impaired, or a development, expansion or other project is not completed or is determined to be impaired, we will charge against earnings any unamortized capitalized expenditures relating to such facility or project that we are unable to recover through sale, transfer or otherwise. We also carry a significant amount of goodwill on our consolidated balance sheets, which we must assess for impairment annually, and more frequently in the case of certain triggering events. We may incur charges against earnings in accordance with this policy, or other events may cause impairments. Such charges could have a material adverse impact on our results of operations.
We are subject to costly environmental regulations and flow-control regulations that may affect our operating margins, restrict our operations and subject us to additional liability.
Complying with laws and regulations governing the collection, treatment, storage, transfer and disposal of solid and hazardous wastes and materials, air quality and emissions of greenhouse gases, water quality and the remediation of contamination associated with the release of hazardous substances is costly. Laws and regulations often require us to enhance or replace our equipment and to modify landfill operations or initiate final closure of a landfill. We cannot assure you that we will be able to implement price increases sufficient to offset the costs of complying with these laws and regulations. In addition, environmental regulatory changes could accelerate or increase expenditures for capping, closure and post-closure, and environmental and remediation activities at solid waste facilities and obligate us to spend sums in addition to those presently accrued for such purposes.
Our collection, transfer, and landfill operations are and will continue to be affected by state or local laws or regulations that restrict the transportation of solid waste across state, county or other jurisdictional lines or that direct the flow of waste to a specified facility or facilities. Such laws and regulations could negatively affect our operations, resulting in declines in landfill volumes and increased costs of alternate disposal.
In addition to the costs of complying with environmental regulations, we incur costs to defend against litigation brought by government agencies and private parties who allege we are in violation of our permits and applicable environmental laws and
17
regulations, or who assert claims alleging nuisance, environmental damage, personal injury or property damage. As a result, we may be required to pay fines or implement corrective measures, or we may have our permits and licenses modified or revoked. A significant judgment against us, the loss of a significant permit or license, or the imposition of a significant fine could have a material adverse impact on our consolidated financial condition, results of operations and cash flows. We establish accruals for our estimates of the costs associated with our environmental obligations. We could underestimate such accruals and remediation costs could exceed amounts accrued. Such shortfalls could result in significant unanticipated charges to income.
Regulation of greenhouse gas emissions could impose costs on our operations, the magnitude of which we cannot yet estimate.
Efforts to curtail the emission of greenhouse gases and to ameliorate the effects of climate change continue to progress. Our landfill operations emit anthropogenic methane, identified as a greenhouse gas, and our vehicle fleet emits, among other things, carbon dioxide, which also is a greenhouse gas. Conventional wisdom still suggests that passage of comprehensive, federal climate change legislation is highly unlikely. Nonetheless, should comprehensive federal climate change legislation be enacted, we expect it to impose costs on our operations, the materiality of which we cannot predict.
Absent comprehensive federal legislation to control greenhouse gas emissions, the EPA is moving ahead administratively under its existing Clean Air Act authority. The EPA is compelled to issue rules by the U.S. Supreme Court's April 2007
Massachusetts v. EPA
ruling that greenhouse gases are “pollutants” for purposes of the Clean Air Act and the EPA's December 2009 finding that continued emissions of greenhouse gases endanger human health and welfare. With respect to our light- and heavy-duty vehicle fleet, the EPA has since finalized regulations limiting greenhouse gas emissions and increasing fuel economy standards. the EPA and the NHTSA have finalized such regulations applicable to heavy-duty vehicles through model-year 2018 and to light-duty vehicles through model-year 2025. We cannot assure you that federal efforts to curtail greenhouse gas emissions and to increase the fuel efficiency of light-duty and heavy-duty vehicles will not have a material effect on our consolidated financial condition, results of operations or cash flows.
As it relates to stationary sources of greenhouse gases, in May 2010 the EPA finalized the Prevention of Significant Deterioration and Title V Greenhouse Gas Tailoring Rule (Tailoring Rule). The Tailoring Rule sets levels of greenhouse gas emissions at new or modified stationary emission sources that trigger permit and control obligations based upon such sources' total greenhouse gas emissions. Recent efforts to challenge the Tailoring Rule before the U.S. Court of the Appeals for the District of Columbia (the DC Circuit) have failed. Most recently, a federal appellate court decision has called into question certain regulatory deferrals that had been established for biogenic carbon dioxide emissions, including those from landfills. The D.C. Circuit struck down the EPA’s July 2011 rule deferring the application of the Tailoring Rule to biogenic carbon emissions. Subsequently, on July 17, 2014, the EPA proposed updates to its regulations that would require large landfills that commenced construction, reconstruction, or modification on or after July 17, 2014 to capture additional landfill gas to reduce emissions of methane and certain non-methane gases, which are recognized as greenhouse gases. That same day, the EPA also issued an Advance Notice of Proposed Rulemaking seeking input on whether and how to update emissions limits for existing landfills to further reduce their emissions of methane and non-methane greenhouse gases. These regulations, if finally adopted, may require our landfills to deploy more stringent emission controls and monitoring systems, with resulting capital or operating costs. We cannot assure you that the application of these or other greenhouse gas regulations to our landfills will not have a material effect on our landfill operations or on our consolidated financial condition, results of operations or cash flows.
We may have environmental liabilities that are not covered by our insurance. Changes in insurance markets also may impact our financial results.
We may incur liabilities for the deterioration of the environment arising from our operations or properties. We maintain high deductibles for our environmental liability insurance coverage. If we were to incur substantial liability for environmental damage, our insurance coverage may be inadequate to cover such liability. This could have a material adverse impact on our consolidated financial condition, results of operations and cash flows.
Also, due to the variable condition of the insurance market, we may experience future increases in insurance levels as a result of increased retention levels and increased premiums. As we assume more risk for insurance through higher retention levels, we may experience more variability in our insurance reserves and expense.
18
Despite our efforts, we may incur additional liability under environmental laws in excess of amounts presently known and accrued.
We are a potentially responsible party at many sites under CERCLA, which provides for the remediation of contaminated facilities and imposes strict, joint and several liability for the cost of remediation on current owners and operators of a facility at which there has been a release or a threatened release of a “hazardous substance.” CERCLA liability also extends to parties who were site owners and operators at the time hazardous substances were disposed, and on persons who arrange for the disposal of such substances at the facility (i.e., generators of the waste and transporters who selected the disposal site). Hundreds of substances are defined as “hazardous” under CERCLA and their presence, even in minute amounts, can result in substantial liability.
Notwithstanding our efforts to comply with applicable environmental laws, we may have additional liability under environmental laws in excess of our current reserves because, among other things, hazardous substances may be present in waste collected by us or disposed of in our landfills (or in waste collected, transported or disposed of in the past by companies we have acquired), environmental laws may change, or there may be adverse environmental conditions that develop or were otherwise previously unknown to us. For example, during 2012 through 2014, we recorded an aggregate of $393.4 million in charges relating to environmental remediation at our closed landfill in Bridgeton, Missouri. Actual costs for liabilities at Bridgeton or other sites could be significantly greater than amounts we have accrued for these purposes. Environmental liabilities in excess of our current reserves could have a material adverse impact on our consolidated financial position, results of operations and cash flows.
Currently pending or future litigation or governmental proceedings could result in material adverse consequences, including judgments or settlements.
We are and will continue to be involved in lawsuits, regulatory inquiries, and governmental and other legal proceedings arising out of the ordinary course of our business. Many of these matters raise complicated factual and legal issues and are subject to uncertainties. The timing of the final resolutions to lawsuits, regulatory inquiries, and governmental and other legal proceedings is uncertain. Further, the possible outcomes or resolutions to these matters could include adverse judgments or settlements, either of which could require substantial payments and adversely affect our consolidated financial condition, results of operations and cash flows.
We may be unable to manage our growth effectively.
Our growth strategy places significant demands on our financial, operational and management resources. To continue our growth, we may need to add administrative and other personnel, and may need to make additional investments in operations and systems. We cannot assure you that we will be able to find and train qualified personnel, or do so on a timely basis, or to expand our operations and systems to the extent, and in the time, required.
We may be unable to execute our acquisition growth strategy.
Our ability to execute our growth strategy depends in part on our ability to identify and acquire desirable acquisition candidates and on our ability to successfully integrate acquired operations into our business. The integration of our operations with those of acquired companies may present significant challenges to our management. In addition, competition for acquisition candidates may prevent us from acquiring certain acquisition candidates. Thus, we cannot assure you that:
|
•
|
desirable acquisition candidates exist or will be identified;
|
|
•
|
we will be able to acquire any of the candidates identified;
|
|
•
|
we will effectively integrate and manage companies we acquire; or
|
|
•
|
any acquisitions will be profitable or accretive to our earnings.
|
If any of these factors force us to alter our growth strategy, our growth prospects could be adversely affected.
Businesses we acquire may have undisclosed liabilities.
Our due diligence investigations of acquisition candidates may fail to discover certain undisclosed liabilities. If we acquire a company having undisclosed liabilities such as environmental, remediation or contractual liabilities, as a successor owner we may be responsible for such undisclosed liabilities. We try to minimize our exposure to such liabilities by conducting due diligence, by obtaining indemnification from each seller of the acquired companies, by deferring payment of a portion of the purchase price as security for the indemnification and by acquiring only specified assets. However, we cannot assure you that we will be able to obtain indemnification or that any indemnification obtained will be enforceable, collectible or sufficient in amount, scope or duration to fully offset any undisclosed liabilities arising from our acquisitions.
19
Our consolidated financial statements are based on estimates and assumptions that may differ from actual results.
Our consolidated financial statements have been prepared in accordance with U.S. GAAP and necessarily include amounts based on management's estimates. Actual results may differ from these amounts. Significant items requiring management to make subjective or complex judgments about matters that are inherently uncertain include the recoverability of long-lived assets, the depletion and amortization of landfill development costs, accruals for final capping, closure and post-closure costs, valuation allowances for accounts receivable and deferred tax assets, liabilities for potential litigation, claims and assessments, and liabilities for environmental remediation, multiemployer pension plans, employee benefit plans, deferred taxes, uncertain tax positions, insurance and our estimates of the fair values of assets acquired and liabilities assumed in any acquisition. We cannot assure you that the liabilities recorded for items such as these will be adequate to cover the costs we ultimately will face.
The introduction of new accounting rules, laws or regulations could adversely impact our reported results of operations.
Complying with new accounting rules, laws or regulations could adversely impact our results of operations or cause unanticipated fluctuations in our results of operations or financial conditions in future periods.
We may be subject to workforce influences, including work stoppages, which could increase our operating costs and disrupt our operations.
As of December 31, 2014, approximately
27%
of our workforce was represented by various local labor unions. If our unionized workers were to engage in strikes, work stoppages or other slowdowns, we could experience a significant disruption of our operations and an increase in our operating costs, which could have an adverse impact on our consolidated financial condition, results of operations and cash flows. Additional groups of employees may seek union representation in the future and, if successful, the negotiation of collective bargaining agreements could divert management's attention and result in increased operating costs. If a greater percentage of our workforce becomes unionized, our consolidated financial condition, results of operations and cash flows could be adversely impacted due to the potential for increased operating costs.
Our obligation to fund multiemployer pension plans to which we contribute, or our withdrawal from such plans, may have an adverse impact on us.
We contribute to
27
multiemployer pension plans under collective bargaining agreements (CBAs) covering union-represented employees. Approximately
20%
of our total current employees participate in such multiemployer plans. We do not administer these plans and generally are not represented on the boards of trustees of these plans. The Pension Protection Act enacted in 2006 (the PPA) requires under-funded pension plans to improve their funding ratios. Based on the information available to us, we believe that some of the multiemployer plans to which we contribute are either “critical” or “endangered” as those terms are defined in the PPA. Except as discussed in Note 11,
Employee Benefit Plans,
to our consolidated financial statements in Item 8 of this Form 10-K, we cannot determine at this time the amount of additional funding, if any, we may be required to make to these plans and, therefore, have not recorded any related liabilities. However, plan assessments could have an adverse impact on our results of operations or cash flows for a given period.
Further, under current law, upon the termination of a multiemployer pension plan, or in the event of a withdrawal by us (which we consider from time to time) or a mass withdrawal of contributing employers (each, a Withdrawal Event), we would be required to make payments to the plan for our proportionate share of the plan's unfunded vested liabilities. We cannot assure you that there will not be a Withdrawal Event with respect to any of the multiemployer pension plans to which we contribute or that, in the event of such a Withdrawal Event, the amounts we would be required to contribute would not have a material adverse impact on our consolidated financial condition, results of operations and cash flows.
For additional discussion and detail regarding multiemployer pension plans see, Note 11,
Employee Benefit Plans,
to our consolidated financial statements in Item 8 of this Form 10-K.
The costs of providing for pension benefits and related funding requirements are subject to changes in pension fund values and fluctuating actuarial assumptions, and may have a material adverse impact on our results of operations and cash flows.
We sponsor a defined benefit pension plan that is funded with trustee assets invested in a diversified portfolio of debt and equity securities. Our costs for providing such benefits and related funding requirements are subject to changes in the market value of plan assets. Our pension expenses and related funding requirements are also subject to various actuarial calculations and assumptions, which may differ materially from actual results due to changing market and economic conditions, interest rates and other factors. A significant increase in our pension obligations and funding requirements could have a material adverse impact on our consolidated financial condition, results of operations and cash flows.
20
The loss of key personnel could have a material adverse effect on our consolidated financial condition, results of operations, cash flows and growth prospects.
Our future success depends on the continued contributions of several key employees and officers. The loss of the services of key employees and officers, whether such loss is through resignation or other causes, or the inability to attract additional qualified personnel, could have a material adverse effect on our financial condition, results of operations, cash flows and growth prospects.
A cyber security incident could negatively impact our business and our relationships with customers.
We use computers in substantially all aspects of our business operations. We also use mobile devices, social networking and other online activities to connect with our employees and our customers. Such uses give rise to cyber security risks, including security breach, espionage, system disruption, theft and inadvertent release of information. Our business involves the storage and transmission of numerous classes of sensitive and/or confidential information and intellectual property, including customers’ personal information, private information about employees, and financial and strategic information about the Company and its business partners. We also rely on a Payment Card Industry compliant third party to protect our customers’ credit card information. While the Company pursues its strategy to grow through acquisitions and to pursue new initiatives that improve our operations and cost structure, the Company is also expanding and improving its information technologies, resulting in a larger technological presence and corresponding exposure to cyber security risk. If we fail to assess and identify cyber security risks associated with acquisitions and new initiatives, we may become increasingly vulnerable to such risks. Additionally, while we have implemented measures to prevent security breaches and cyber incidents, our preventive measures and incident response efforts may not be entirely effective. The theft, destruction, loss, misappropriation, or release of sensitive and/or confidential information or intellectual property, or interference with our information technology systems or the technology systems of third parties on which we rely, could result in business disruption, negative publicity, brand damage, violation of privacy laws, loss of customers, potential liability and competitive disadvantage.
|
ITEM 1B.
|
UNRESOLVED STAFF COMMENTS
|
None.
|
ITEM 2.
|
PROPERTIES
|
Our corporate office is located at 18500 North Allied Way, Phoenix, Arizona 85054, where we currently lease approximately 145,000 square feet of office space. We also maintain regional administrative offices in all of our regions.
Our principal property and equipment consists of land, landfills, buildings, vehicles and equipment. We own or lease real property in the states in which we conduct operations. As of
December 31, 2014
, we owned or operated
340
collection operations,
198
transfer stations,
189
active solid waste landfills and
60
recycling centers in
39
states and Puerto Rico. In aggregate, our active solid waste landfills total approximately 105,000 acres, including approximately
37,000
permitted acres. We also own or have responsibilities for
125
closed landfills. We believe that our property and equipment are adequate for our current needs.
|
ITEM 3.
|
LEGAL PROCEEDINGS
|
General Legal Proceedings
We are subject to extensive and evolving laws and regulations and have implemented safeguards to respond to regulatory requirements. In the normal course of our business, we become involved in legal proceedings. Some may result in fines, penalties or judgments against us, which may impact earnings and cash flows for a particular period. Although we cannot predict the ultimate outcome of any legal matter with certainty, we do not believe the outcome of any of our pending legal proceedings will have a material adverse impact on our consolidated financial position, results of operations or cash flows.
As used herein, the term
legal proceedings
refers to litigation and similar claims against us and our subsidiaries, excluding: (1) ordinary course accidents, general commercial liability and workers compensation claims, which are covered by insurance programs, subject to customary deductibles, and which, together with self-insured employee health care costs, are discussed in Note 7,
Other Liabilities,
to our consolidated financial statements in Item 8 of this Form 10-K; and (2) environmental remediation liabilities, which are discussed in Note 8,
Landfill and Environmental Costs,
to our consolidated financial statements in Item 8 of this Form 10-K
.
21
We accrue for legal proceedings when losses become probable and reasonably estimable. We have recorded an aggregate accrual of approximately
$68 million
relating to our outstanding legal proceedings as of December 31, 2014. As of the end of each applicable reporting period, we review each of our legal proceedings and, where it is probable that a liability has been incurred, we accrue for all probable and reasonably estimable losses. Where we are able to reasonably estimate a range of losses we may incur with respect to such a matter, we record an accrual for the amount within the range that constitutes our best estimate. If we are able to reasonably estimate a range but no amount within the range appears to be a better estimate than any other, we use the amount that is the low end of such range. If we had used the high ends of such ranges, our aggregate potential liability would be approximately
$74 million
higher than the amount recorded as of December 31, 2014.
Legal Proceedings over Certain Environmental Matters Involving Governmental Authorities with Possible Sanctions of $100,000 or More
Item 103 of the SEC's Regulation S-K requires disclosure of certain environmental matters when a governmental authority is a party to the proceedings and the proceedings involve potential monetary sanctions unless we reasonably believe the monetary sanctions will not equal or exceed $100,000. We are disclosing the following matters in accordance with that requirement:
Bridgeton Landfill Matters - Regulatory
On July 23, 2012, the Missouri Department of Natural Resources (MDNR) issued a notice of violation (NOV) to the closed Bridgeton Landfill in Bridgeton, Missouri after it determined that a sub-surface smoldering event (SSE) was occurring at the landfill. The NOV specified required actions intended to prevent the spread of the SSE, offsite odors, and environmental pollution. On March 27, 2013, the Missouri Attorney General's Office, on behalf of MDNR, sued Republic Services, Inc., and our subsidiaries Allied Services, LLC, and Bridgeton Landfill, LLC in the Circuit Court of St. Louis County in connection with odors and leachate from the landfill. The action alleges, among other things, violations of the Missouri Solid Waste Management, Hazardous Waste Management, Clean Water, and Air Conservation Laws, and claims for nuisance, civil penalties, costs, and natural resource damages. The suit seeks a preliminary and permanent injunction requiring us to take measures to remedy the alleged resulting nuisance and other relief. On May 13, 2013, the court entered a stipulated preliminary injunction under which, the Bridgeton Landfill, LLC agreed, among other things, to continue remedial work plans previously approved by MDNR and to continue reporting to MDNR. On June 19, 2014, the court entered an agreed amendment to the injunction providing for increased frequency in some carbon monoxide monitoring, three new rounds of air sampling, implementation of an Odor Management Plan, and cost reimbursement to MDNR.
Sunshine Canyon Landfill Matter
The Sunshine Canyon Landfill, in Sylmar, California, entered into settlement agreements with the South Coast Air Quality Management District (SCAQMD) in 2012 and 2013. The settlement agreements resolved claims for excess emission charges, civil penalties, and investigative and administrative costs relating to odor-related and surface emissions NOVs received from SCAQMD. Since the period covered by the 2013 settlement agreement, Sunshine Canyon has received an additional 52 NOVs from SCAQMD for odors and excess surface emissions.
|
ITEM 4.
|
MINE SAFETY DISCLOSURES
|
None.
22
|
ITEM 5.
|
MARKET FOR REGISTRANT'S COMMON EQUITY, RELATED STOCKHOLDER MATTERS AND ISSUER PURCHASES OF EQUITY SECURITIES
|
Market Information, Holders and Dividends
The principal market for our common stock is the New York Stock Exchange, and it is traded under the symbol RSG. The following table sets forth the range of the high and low sale prices per share of our common stock on the New York Stock Exchange and the cash dividends declared per share of common stock for the periods indicated:
|
High
|
Low
|
Dividends
Declared
|
|||||||||
|
Year Ended December 31, 2014:
|
|||||||||||
|
First quarter
|
$
|
34.65
|
|
$
|
31.42
|
|
$
|
0.260
|
|
||
|
Second quarter
|
38.13
|
|
33.99
|
|
0.260
|
|
|||||
|
Third quarter
|
39.66
|
|
36.72
|
|
0.280
|
|
|||||
|
Fourth quarter
|
41.12
|
|
37.18
|
|
0.280
|
|
|||||
|
Year Ended December 31, 2013:
|
|||||||||||
|
First quarter
|
$
|
33.01
|
|
$
|
29.34
|
|
$
|
0.235
|
|
||
|
Second quarter
|
35.28
|
|
32.07
|
|
0.235
|
|
|||||
|
Third quarter
|
35.61
|
|
31.94
|
|
0.260
|
|
|||||
|
Fourth quarter
|
35.29
|
|
32.29
|
|
0.260
|
|
|||||
There were 710 holders of record of our common stock at
February 10, 2015
, which does not include beneficial owners for whom Cede & Co. or others act as nominees.
In February 2015, our board of directors declared a regular quarterly dividend of $0.28 per share for shareholders of record on April 1, 2015. We expect to continue to pay quarterly cash dividends, and we may consider increasing our dividends if we believe it will enhance shareholder value.
We have the ability under our credit facilities to pay dividends and repurchase our common stock if we are in compliance with the financial covenants in our credit facilities. As of
December 31, 2014
, we were in compliance with those financial covenants.
Issuer Purchases of Equity Securities
The following table provides information relating to our purchases of shares of our common stock during the three months ended
December 31, 2014
:
|
Total Number of
Shares (or Units) Purchased (a)
|
Average Price Paid
per Share (a)
|
Total Number of Shares
Shares Purchased as
Part of Publicly
Announced Program (b)
|
Approximate Dollar
Value of Shares that
May Yet Be Purchased
Under the Program (c)
|
||||||||||
|
October 2014
|
40,000
|
|
$
|
38.89
|
|
40,000
|
|
$
|
481,745,126
|
|
|||
|
November 2014
|
2,650,000
|
|
39.18
|
|
2,650,000
|
|
377,928,196
|
|
|||||
|
December 2014
|
450,000
|
|
39.29
|
|
450,000
|
|
360,247,375
|
|
|||||
|
3,140,000
|
|
3,140,000
|
|
||||||||||
|
(a)
|
In October 2013, our board of directors added $650 million to the share repurchase authorization originally approved by the board of directors in November 2010. The program extends through December 31, 2015. Share repurchases under the program may be made through open market purchases or privately negotiated transactions in accordance with applicable federal securities laws. While the board of directors has approved the program, the timing of any purchases, the prices and the number of shares of common stock to be purchased will be determined by our management, at its discretion, and will depend upon market conditions and other factors. The share repurchase program may be extended, suspended or discontinued at any time.
|
23
|
(b)
|
The total number of shares purchased as part of the publicly announced program were all purchased pursuant to the October 2013 authorization.
|
|
(c)
|
Shares that may be purchased under the program exclude shares of common stock that may be surrendered to satisfy statutory minimum tax withholding obligations in connection with the vesting of restricted stock issued to employees.
|
Recent Sales of Unregistered Securities
There were no sales of unregistered securities during the three months ended
December 31, 2014
.
Performance Graph
The following graph compares the performance of our common stock to the Standard & Poor’s 500 Stock Index (S&P 500 Index) and the Dow Jones Waste & Disposal Services Index (DJ W&DS Index). The graph covers the period from December 31, 2009 to
December 31, 2014
and assumes that the value of the investment in our common stock and in each index was $100 as of December 31, 2009 and that all dividends were reinvested.
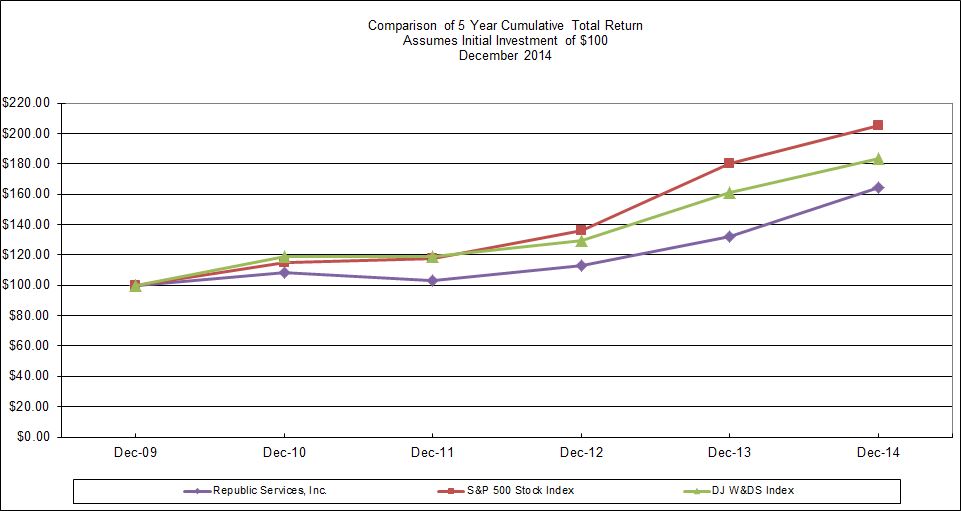
|
|
Indexed Returns for the Years Ended December 31,
|
||||||||||||||||||||||
|
|
2009
|
2010
|
2011
|
2012
|
2013
|
2014
|
|||||||||||||||||
|
Republic Services, Inc.
|
$
|
100.00
|
|
$
|
108.27
|
|
$
|
102.81
|
|
$
|
113.11
|
|
$
|
131.91
|
|
$
|
164.55
|
|
|||||
|
S&P 500 Index
|
100.00
|
|
115.06
|
|
117.49
|
|
136.30
|
|
180.44
|
|
205.14
|
|
|||||||||||
|
DJ W&DS Index
|
100.00
|
|
118.78
|
|
118.99
|
|
129.11
|
|
161.31
|
|
183.49
|
|
|||||||||||
|
ITEM 6.
|
SELECTED FINANCIAL DATA
|
You should read the following Selected Financial Data in conjunction with Item 8,
Financial Statements and Supplementary Data
, which includes our consolidated financial statements and notes thereto as of December 31, 2014 and 2013 and for each of the three years in the period ended December 31, 2014 and Item 7,
Management’s Discussion and Analysis of Financial Condition and Results of Operations,
in this Form 10-K.
24
See Notes 1, 2, 3, 8, 9, 10 and 12 to our consolidated financial statements in Item 8,
Financial Statements and Supplementary Data
, of this Form 10-K for a discussion of basis of presentation, significant accounting policies, business acquisitions and divestitures, landfill and environmental costs, debt, income taxes and stockholders’ equity and their effect on comparability of year-to-year data. These historical results are not necessarily indicative of the results to be expected in the future. Amounts are in millions, except per share data.
|
|
Years Ended December 31,
|
||||||||||||||||||
|
|
2014
|
2013
|
2012
|
2011
|
2010
|
||||||||||||||
|
Statement of Operations Data:
|
|||||||||||||||||||
|
Revenue
|
$
|
8,788.3
|
|
$
|
8,417.2
|
|
$
|
8,118.3
|
|
$
|
8,192.9
|
|
$
|
8,106.6
|
|
||||
|
Expenses:
|
|||||||||||||||||||
|
Cost of operations
|
5,628.1
|
|
5,234.7
|
|
5,005.7
|
|
4,865.1
|
|
4,764.8
|
|
|||||||||
|
Depreciation, amortization and depletion
|
906.9
|
|
877.4
|
|
848.5
|
|
843.6
|
|
833.7
|
|
|||||||||
|
Accretion
|
78.0
|
|
76.6
|
|
78.4
|
|
78.0
|
|
80.5
|
|
|||||||||
|
Selling, general and administrative
|
918.9
|
|
853.8
|
|
820.9
|
|
825.4
|
|
858.0
|
|
|||||||||
|
Negotiation and withdrawal costs - Central States Pension and Other Funds
|
1.5
|
|
157.7
|
|
35.8
|
|
—
|
|
—
|
|
|||||||||
|
Loss (gain) on disposition of assets and impairments, net
|
20.0
|
|
(1.9
|
)
|
(2.7
|
)
|
28.1
|
|
19.1
|
|
|||||||||
|
Restructuring charges
|
1.8
|
|
8.6
|
|
11.1
|
|
—
|
|
11.4
|
|
|||||||||
|
Operating income
|
1,233.1
|
|
1,210.3
|
|
1,320.6
|
|
1,552.7
|
|
1,539.1
|
|
|||||||||
|
Interest expense
|
(348.7
|
)
|
(360.0
|
)
|
(388.5
|
)
|
(440.2
|
)
|
(507.4
|
)
|
|||||||||
|
Loss on extinguishment of debt
|
(1.4
|
)
|
(2.1
|
)
|
(112.6
|
)
|
(210.8
|
)
|
(160.8
|
)
|
|||||||||
|
Interest income
|
0.6
|
|
0.7
|
|
1.0
|
|
0.3
|
|
0.7
|
|
|||||||||
|
Other income, net
|
1.7
|
|
2.3
|
|
3.4
|
|
4.3
|
|
5.4
|
|
|||||||||
|
Income before income taxes
|
885.3
|
|
851.2
|
|
823.9
|
|
906.3
|
|
877.0
|
|
|||||||||
|
Provision for income taxes
|
337.4
|
|
262.1
|
|
251.8
|
|
317.4
|
|
369.5
|
|
|||||||||
|
Net income
|
547.9
|
|
589.1
|
|
572.1
|
|
588.9
|
|
507.5
|
|
|||||||||
|
Net (income) loss attributable to noncontrolling interests
|
(0.3
|
)
|
(0.2
|
)
|
(0.3
|
)
|
0.3
|
|
(1.0
|
)
|
|||||||||
|
Net income attributable to Republic Services, Inc.
|
$
|
547.6
|
|
$
|
588.9
|
|
$
|
571.8
|
|
$
|
589.2
|
|
$
|
506.5
|
|
||||
|
Basic earnings per share attributable to Republic Services, Inc. stockholders:
|
|||||||||||||||||||
|
Basic earnings per share
|
$
|
1.54
|
|
$
|
1.63
|
|
$
|
1.56
|
|
$
|
1.57
|
|
$
|
1.32
|
|
||||
|
Weighted average common shares outstanding
|
356.7
|
|
362.1
|
|
366.9
|
|
376.0
|
|
383.0
|
|
|||||||||
|
Diluted earnings per share attributable to Republic Services, Inc. stockholders:
|
|||||||||||||||||||
|
Diluted earnings per share
|
$
|
1.53
|
|
$
|
1.62
|
|
$
|
1.55
|
|
$
|
1.56
|
|
$
|
1.32
|
|
||||
|
Weighted average common and common equivalent shares outstanding
|
358.1
|
|
363.4
|
|
368.0
|
|
377.6
|
|
385.1
|
|
|||||||||
|
Cash dividends per common share
|
$
|
1.08
|
|
$
|
0.99
|
|
$
|
0.91
|
|
$
|
0.84
|
|
$
|
0.78
|
|
||||
|
Other Operating Data:
|
|||||||||||||||||||
|
Cash provided by operating activities
|
$
|
1,529.8
|
|
$
|
1,548.2
|
|
$
|
1,513.8
|
|
$
|
1,766.7
|
|
$
|
1,433.7
|
|
||||
|
Purchases of property and equipment
|
862.5
|
|
880.8
|
|
903.5
|
|
936.5
|
|
794.7
|
|
|||||||||
|
Proceeds from sales of property and equipment
|
35.7
|
|
23.9
|
|
28.7
|
|
34.6
|
|
37.4
|
|
|||||||||
|
Balance Sheet Data:
|
|||||||||||||||||||
|
Cash and cash equivalents
|
$
|
75.2
|
|
$
|
213.3
|
|
$
|
67.6
|
|
$
|
66.3
|
|
$
|
88.3
|
|
||||
|
Restricted cash and marketable securities
|
115.6
|
|
169.7
|
|
164.2
|
|
189.6
|
|
172.8
|
|
|||||||||
|
Total assets
|
20,094.0
|
|
19,949.2
|
|
19,616.9
|
|
19,551.5
|
|
19,461.9
|
|
|||||||||
|
Total debt
|
7,061.2
|
|
7,018.1
|
|
7,070.5
|
|
6,921.8
|
|
6,743.6
|
|
|||||||||
|
Total stockholders' equity
|
7,747.8
|
|
7,906.1
|
|
7,705.7
|
|
7,683.4
|
|
7,848.9
|
|
|||||||||
25
You should read the following discussion in conjunction with our audited consolidated financial statements and the notes thereto included elsewhere in Item 8 of this Form 10-K. This discussion may contain forward-looking statements that anticipate results that are subject to uncertainty. We discuss in more detail various factors that could cause actual results to differ from expectations in Item 1A, Risk Factors in this Form 10-K.
Overview
We are the second largest provider of services in the domestic non-hazardous solid waste industry, as measured by revenue. As of December 31, 2014, we operate in
39
states and Puerto Rico. We provide non-hazardous solid waste collection services for commercial, industrial, municipal and residential customers through
340
collection operations. We own or operate
198
transfer stations,
189
active solid waste landfills and
60
recycling centers. We also operate
72
landfill gas and renewable energy projects.
Revenue for the year ended
December 31, 2014
increased by
4.4%
to
$8,788.3 million
compared to
$8,417.2 million
in
2013
. This change in revenue is due to increases in average yield of
1.4%
, fuel recovery fees of
0.1%
, volume of
2.0%
, recycled commodities of
0.1%
and acquisitions, net of divestitures of
0.8%
.
The following table summarizes our revenue, costs and expenses for the years ended
December 31, 2014
,
2013
and
2012
(in millions of dollars and as a percentage of revenue):
|
|
2014
|
2013
|
2012
|
|||||||||||||||||
|
Revenue
|
$
|
8,788.3
|
|
100.0
|
%
|
$
|
8,417.2
|
|
100.0
|
%
|
$
|
8,118.3
|
|
100.0
|
%
|
|||||
|
Expenses:
|
||||||||||||||||||||
|
Cost of operations
|
5,628.1
|
|
64.0
|
|
5,234.7
|
|
62.2
|
|
5,005.7
|
|
61.7
|
|
||||||||
|
Depreciation, amortization and depletion of property and equipment
|
838.5
|
|
9.6
|
|
806.7
|
|
9.6
|
|
778.4
|
|
9.6
|
|
||||||||
|
Amortization of other intangible assets and other assets
|
68.4
|
|
0.8
|
|
70.7
|
|
0.8
|
|
70.1
|
|
0.9
|
|
||||||||
|
Accretion
|
78.0
|
|
0.9
|
|
76.6
|
|
0.9
|
|
78.4
|
|
1.0
|
|
||||||||
|
Selling, general and administrative
|
918.9
|
|
10.5
|
|
853.8
|
|
10.1
|
|
820.9
|
|
10.1
|
|
||||||||
|
Negotiation and withdrawal costs - Central States Pension and Other Funds
|
1.5
|
|
—
|
|
157.7
|
|
1.9
|
|
35.8
|
|
0.4
|
|
||||||||
|
Loss (gain) on disposition of assets and impairments, net
|
20.0
|
|
0.2
|
|
(1.9
|
)
|
—
|
|
(2.7
|
)
|
—
|
|
||||||||
|
Restructuring charges
|
1.8
|
|
—
|
|
8.6
|
|
0.1
|
|
11.1
|
|
0.1
|
|
||||||||
|
Operating income
|
$
|
1,233.1
|
|
14.0
|
%
|
$
|
1,210.3
|
|
14.4
|
%
|
$
|
1,320.6
|
|
16.2
|
%
|
|||||
Our pre-tax income was
$885.3 million
,
$851.2 million
and
$823.9 million
for the years ended
December 31, 2014
,
2013
and
2012
, respectively. Our net income attributable to Republic Services, Inc. was
$547.6 million
, or
$1.53
per diluted share for the year ended
December 31, 2014
, compared to
$588.9 million
, or
$1.62
per diluted share, for the year ended
December 31, 2013
, and
$571.8 million
, or
$1.55
per diluted share, for the year ended
December 31, 2012
.
During each of the three years ended
December 31, 2014
,
2013
and
2012
, we recorded a number of charges and other expenses and benefits that impacted our pre-tax income, net income attributable to Republic Services, Inc. (Net Income – Republic) and diluted earnings per share as noted in the following table (in millions, except per share data). Additionally, see our “
Cost of Operations
,” “
Selling, General and Administrative Expenses
” and “
Income Taxes
” discussions contained in the Results of Operations section of this Management’s Discussion and Analysis of Financial Condition and Results of Operations for a discussion of other items that impacted our earnings.
26
|
|
Year Ended December 31, 2014
|
Year Ended December 31, 2013
|
Year Ended December 31, 2012
|
||||||||||||||||||||||||||||||||
|
|
Pre-tax
Income |
Net
Income - Republic |
Diluted
Earnings per Share |
Pre-tax
Income |
Net
Income - Republic |
Diluted
Earnings per Share |
Pre-tax
Income
|
Net
Income -
Republic
|
Diluted
Earnings
per
Share
|
||||||||||||||||||||||||||
|
As reported
|
$
|
885.3
|
|
$
|
547.6
|
|
$
|
1.53
|
|
$
|
851.2
|
|
$
|
588.9
|
|
$
|
1.62
|
|
$
|
823.9
|
|
$
|
571.8
|
|
$
|
1.55
|
|
||||||||
|
Negotiation and withdrawal costs - Central States Pension and Other Funds
(1)
|
1.5
|
|
0.9
|
|
0.00
|
|
157.7
|
|
98.3
|
|
0.27
|
|
35.8
|
|
21.6
|
|
0.06
|
|
|||||||||||||||||
|
Restructuring charges
(1)
|
1.8
|
|
1.0
|
|
0.00
|
|
8.6
|
|
5.6
|
|
0.02
|
|
11.1
|
|
6.6
|
|
0.02
|
|
|||||||||||||||||
|
Loss on extinguishment of debt
(1)
|
1.4
|
|
0.9
|
|
0.00
|
|
2.1
|
|
1.3
|
|
—
|
|
112.6
|
|
68.6
|
|
0.18
|
|
|||||||||||||||||
|
Bridgeton remediation and other
|
227.1
|
|
137.6
|
|
0.38
|
|
108.7
|
|
65.6
|
|
0.18
|
|
74.1
|
|
44.7
|
|
0.12
|
|
|||||||||||||||||
|
Tax valuation allowance adjustment
|
—
|
|
—
|
|
—
|
|
—
|
|
(43.5
|
)
|
(0.12
|
)
|
—
|
|
—
|
|
—
|
|
|||||||||||||||||
|
Loss (gain) on disposition of assets and impairments, net
|
20.0
|
|
12.6
|
|
0.04
|
|
(1.9
|
)
|
(0.9
|
)
|
—
|
|
(5.3
|
)
|
(5.2
|
)
|
(0.01
|
)
|
|||||||||||||||||
|
Total adjustments
|
251.8
|
|
153.0
|
|
0.43
|
|
275.2
|
|
126.4
|
|
0.35
|
|
228.3
|
|
136.3
|
|
0.37
|
|
|||||||||||||||||
|
As adjusted
|
$
|
1,137.1
|
|
$
|
700.6
|
|
$
|
1.96
|
|
$
|
1,126.4
|
|
$
|
715.3
|
|
$
|
1.97
|
|
$
|
1,052.2
|
|
$
|
708.1
|
|
$
|
1.92
|
|
||||||||
(1) The aggregate impact of these items noted to adjusted diluted earnings per share totals to $0.01 for the year ended December 31, 2014.
We believe that presenting adjusted pre-tax income, adjusted net income attributable to Republic Services, Inc., and adjusted diluted earnings per share, which are not measures determined in accordance with accounting principles generally accepted in the United States (U.S. GAAP), provides an understanding of operational activities before the financial impact of certain items. We use these measures, and believe investors will find them helpful, in understanding the ongoing performance of our operations separate from items that have a disproportionate impact on our results for a particular period. We have incurred comparable charges and costs in prior periods, and similar types of adjustments can reasonably be expected to be recorded in future periods. In the case of the Bridgeton remediation charges, we are adjusting such amounts due to their significant effect on our operating results; however, in the ordinary course of our business, we often incur remediation adjustments that we do not adjust from our operating results. Our definition of adjusted pre-tax income, adjusted net income attributable to Republic Services Inc., and adjusted diluted earnings per share may not be comparable to similarly titled measures presented by other companies.
Negotiation and withdrawal costs - Central States Pension and Other Funds.
During the year ended
December 31, 2014
, we recorded charges to earnings of $
1.5 million
, primarily related to costs associated with our 2013 withdrawal from the Central States, Southeast and Southwest Areas Pension Fund (the Fund). During the years ended
December 31, 2013
and
2012
, we recorded charges to earnings of $
157.7 million
and
$35.8 million
, respectively, primarily related to our negotiation and withdrawal liability from the Fund.
Restructuring charges.
During the fourth quarter of 2012, we announced a restructuring of our field and corporate operations to create a more efficient and competitive company. These changes included consolidating our field regions from four to three and our areas from 28 to 20, relocating office space, and reducing administrative staffing levels. During the year ended
December 31, 2014
, we incurred costs of
$1.8 million
due to a change in estimate of amounts recoverable from sublet income associated with abandoned office space with non-cancellable lease terms. During the years ended
December 31, 2013
and
2012
, we incurred $
8.6 million
and
$11.1 million
, respectively, of restructuring charges, which consisted of severance and other employee termination benefits, relocation benefits, and the closure of offices with lease agreements with non-cancelable terms.
Loss on extinguishment of debt.
We refinanced our credit facilities and certain of our tax-exempt financings in 2014, resulting in non-cash charges for deferred issuance costs of
$1.4 million
. During the years ended
December 31, 2013
and
2012
, we completed various refinancing transactions that resulted in cash paid for premiums and professional fees to repurchase outstanding debt, as well as non-cash charges for unamortized debt discounts and deferred issuance costs. For a more detailed discussion of the components of these costs and the debt series to which they relate, see our “
Loss on Extinguishment of Debt
” discussion contained in the Results of Operations section of this Management's Discussion and Analysis of Financial Condition and Results of Operations.
27
Bridgeton remediation and other.
During 2014, we updated our cost and timeline estimates to build and operate a leachate management facility and related infrastructure, manage the remediation area and monitor the site. Accordingly, we recorded environmental remediation charges of $210.6 million. Additionally, we recorded certain remediation charges for the superfund site and ongoing litigation costs. During the years ended
December 31, 2013
and
2012
, we recorded environmental remediation charges in the amount of
$108.7 million
and
$74.1 million
, respectively, to manage the remediation area and monitor the site.
Tax valuation allowance adjustment.
During the fourth quarter of 2013, we reduced our valuation allowance related to certain deferred tax assets for state net operating loss carryforwards due to our determination that it is more likely than not that a portion of these carryforwards would be utilized in future years.
Loss (gain) on disposition of assets and impairments, net.
During 2014, we recorded a charge to earnings of
$20.0 million
primarily related to costs associated with one of our divested landfills, of which $14.1 million relates to closure and post-closure costs and $5.9 million relates to remediation expenditures. During each of the years ended December 31, 2013 and 2012, we recorded a net gain on disposition of assets of and impairments related to certain divestitures. For a more detailed discussion of the components of this, see our “
Loss (gain) on Disposition of Assets and Impairments, Net
” discussion contained in the Results of Operations section of this Management’s Discussion and Analysis of Financial Condition and Results of Operations.
Recent Developments
In February 2015, we acquired all the equity of Tervita, LLC (Tervita) in exchange for a cash payment of approximately $485 million. Tervita is an environmental solutions provider serving oil and natural gas producers in the United States. Tervita provides oilfield waste services to its diverse customer base and operates three types of waste management and disposal facilities: treatment, recovery and disposal facilities; engineered landfills; and salt water disposal injection wells. Additionally, Tervita provides closed loop solids control systems and transportation services. While we have available cash on hand and capacity under our Credit Facilities, we are evaluating opportunities to finance the acquisition on a longer term basis.
2015 Guidance
In 2015, we will continue to focus on managing the controllable aspects of our business by enhancing the quality of our revenue, investing in profitable growth opportunities, and reducing costs. Our team remains focused on executing our strategy to deliver consistent earnings and free cash flow growth, and improve return on invested capital. We are committed to an efficient capital structure, maintaining our investment grade credit ratings, and increasing cash returns to our shareholders.
Our guidance is based on current economic conditions and does not assume any significant changes in the overall economy in 2015. The guidance includes the expected financial impact from the acquisition of Tervita, LLC in February 2015. Specific guidance follows:
Revenue
We expect 2015 revenue to increase by approximately 4.0% to 5.0% comprised of the following:
|
|
Increase
(Decrease)
|
|
|
Average yield
|
1.5
|
%
|
|
Volume
|
1.5 to 2.0
|
|
|
Fuel recovery fees
|
(1.0)
|
|
|
Recycled commodities
|
(0.5) to (1.0)
|
|
|
Solid waste acquisitions
|
1.5
|
|
|
E&P acquisition
|
1.5
|
|
|
Total change
|
4.0 to 5.0%
|
|
Changes in price are restricted on approximately 50% of our annual service revenue. Of these restricted pricing arrangements:
|
•
|
approximately 60% of the revenue has price changes based on fluctuations in a specific index (primarily the consumer price index) as defined in the contract;
|
|
•
|
approximately 20% of the revenue has fixed price increases based on stated contract terms; and
|
28
|
•
|
approximately 20% of the revenue has price changes based on a cost plus a specific profit margin or other measurement.
|
The consumer price index varies from a single historical stated period of time or an average of trailing historical rates over a stated period of time. In addition, the initial impact of pricing resets typically lags 6 to 12 months from the end of the index measurement period to the date the revised pricing goes into effect. As a result, current changes in a specific index may not manifest themselves in our reported pricing for several quarters into the future.
Diluted Earnings per Share
We expect 2015 diluted earnings per share to be in the range of $1.98 to $2.04.
Property and Equipment, Net
In 2015, we anticipate receiving approximately $885 million of property and equipment, net of proceeds from sales of property and equipment, as follows:
|
Trucks and equipment
|
$
|
350
|
|
|
Landfill
|
290
|
|
|
|
Containers
|
145
|
|
|
|
Facilities and other
|
125
|
|
|
|
Property and equipment received during 2015
|
910
|
|
|
|
Proceeds from sales of property and equipment
|
(25
|
)
|
|
|
Property and equipment received, net of proceeds, during 2015
|
$
|
885
|
|
Results of Operations
Revenue
We generate revenue primarily from our solid waste collection operations. Our remaining revenue is from other services, including transfer station services, landfill disposal and recycling. Our residential and commercial collection operations in some markets are based on long-term contracts with municipalities. Certain of our municipal contracts have annual price escalation clauses that are tied to changes in an underlying base index such as the consumer price index. We generally provide commercial and industrial collection services to customers under contracts with terms up to three years. Our transfer stations, landfills and, to a lesser extent, our recycling facilities generate revenue from disposal or tipping fees charged to third parties. In general, we integrate our recycling operations with our collection operations and obtain revenue from the sale of recycled commodities. Other non-core revenue consists primarily of revenue from National Accounts, which represents the portion of revenue generated from nationwide contracts in markets outside our operating areas where the associated waste handling services are subcontracted to local operators. Consequently, substantially all of this revenue is offset with related subcontract costs, which are recorded in cost of operations.
29
The following table reflects our revenue by service line for the years ended
December 31, 2014
,
2013
and
2012
(in millions of dollars and as a percentage of revenue):
|
|
2014
|
2013
|
2012
|
|||||||||||||||||
|
Collection:
|
||||||||||||||||||||
|
Residential
|
$
|
2,193.6
|
|
25.0
|
%
|
$
|
2,175.5
|
|
25.8
|
%
|
$
|
2,155.7
|
|
26.6
|
%
|
|||||
|
Commercial
|
2,723.3
|
|
31.0
|
|
2,616.9
|
|
31.1
|
|
2,523.2
|
|
31.1
|
|
||||||||
|
Industrial
|
1,784.0
|
|
20.3
|
|
1,639.4
|
|
19.5
|
|
1,544.2
|
|
19.0
|
|
||||||||
|
Other
|
37.2
|
|
0.4
|
|
34.7
|
|
0.4
|
|
33.4
|
|
0.4
|
|
||||||||
|
Total collection
|
6,738.1
|
|
76.7
|
|
6,466.5
|
|
76.8
|
|
6,256.5
|
|
77.1
|
|
||||||||
|
Transfer
|
1,062.6
|
|
1,021.8
|
|
964.5
|
|
||||||||||||||
|
Less: intercompany
|
(654.4
|
)
|
(615.2
|
)
|
(575.3
|
)
|
||||||||||||||
|
Transfer, net
|
408.2
|
|
4.6
|
|
406.6
|
|
4.8
|
|
389.2
|
|
4.8
|
|
||||||||
|
Landfill
|
2,014.5
|
|
1,927.2
|
|
1,863.3
|
|
||||||||||||||
|
Less: intercompany
|
(928.1
|
)
|
(902.2
|
)
|
(862.5
|
)
|
||||||||||||||
|
Landfill, net
|
1,086.4
|
|
12.4
|
|
1,025.0
|
|
12.2
|
|
1,000.8
|
|
12.3
|
|
||||||||
|
Sale of recycled commodities
|
390.8
|
|
4.4
|
|
374.6
|
|
4.5
|
|
349.0
|
|
4.3
|
|
||||||||
|
Other non-core
|
164.8
|
|
1.9
|
|
144.5
|
|
1.7
|
|
122.8
|
|
1.5
|
|
||||||||
|
Other
|
555.6
|
|
6.3
|
|
519.1
|
|
6.2
|
|
471.8
|
|
5.8
|
|
||||||||
|
Total revenue
|
$
|
8,788.3
|
|
100.0
|
%
|
$
|
8,417.2
|
|
100.0
|
%
|
$
|
8,118.3
|
|
100.0
|
%
|
|||||
The following table reflects changes in our revenue for the years ended
December 31, 2014
,
2013
and
2012
:
|
2014
|
2013
|
2012
|
||||||
|
Average yield
|
1.4
|
%
|
1.3
|
%
|
0.8
|
%
|
||
|
Fuel recovery fees
|
0.1
|
|
0.3
|
|
0.1
|
|
||
|
Total price
|
1.5
|
|
1.6
|
|
0.9
|
|
||
|
Volume
|
2.0
|
|
1.3
|
|
(1.0
|
)
|
||
|
Recycled commodities
|
0.1
|
|
0.3
|
|
(1.2
|
)
|
||
|
Total internal growth
|
3.6
|
|
3.2
|
|
(1.3
|
)
|
||
|
Acquisitions / divestitures, net
|
0.8
|
|
0.5
|
|
0.4
|
|
||
|
Total
|
4.4
|
%
|
3.7
|
%
|
(0.9
|
)%
|
||
|
Core price
|
3.1
|
%
|
3.3
|
%
|
2.8
|
%
|
||
Revenue –
2014
compared to
2013
During the year ended
December 31, 2014
, we experienced the following changes in our revenue as compared to
2013
:
|
•
|
Average yield increased revenue by
1.4%
due to positive pricing in all lines of business.
|
|
•
|
The fuel recovery fee program, which mitigates our exposure to increases in fuel prices, generated
0.1%
of the total revenue growth. These fees fluctuate with the price of fuel and, consequently, any increase in fuel prices would result in an increase in our revenue. Higher fuel recovery fees for
2014
resulted primarily from an increase in the fuel recovery rates charged. During
2014
, we were able to recover approximately
78%
of our direct fuel expenses with fuel recovery fees, compared to approximately 74% during
2013
.
|
|
•
|
Volume increased revenue by
2.0%
, primarily due to volume increases in our industrial and commercial collection and landfill lines of business due to improving business activity and new National Accounts contracts, partially offset by declines in our residential collection line and our transfer station lines of business. Volume increases in our landfill line of business were primarily attributable to increased special waste volumes.
|
|
•
|
Recycled commodities increased revenue by
0.1%
, primarily due to the mix of materials and increased production volumes, offset by lower commodity prices. The average price for old corrugated cardboard for
2014
was $116 per ton compared to $128 per ton for
2013
. The average price of old newspaper for
2014
was $89 per ton compared to
|
30
$93 per ton for
2013
. Our recycled commodity volume for
2014
of 2.3 million tons sold was approximately 4% higher than the volume in
2013
as a result of our continued investment in recycling centers along with increases in brokering of recycled commodity volumes on behalf of our National Accounts customers.
Changing market demand for recycled commodities causes volatility in commodity prices. At current volumes and mix of materials, we believe a $10 per ton change in the price of recycled commodities will change annual revenue and operating income by approximately
$28 million
and
$16 million
, respectively.
Revenue –
2013
compared to
2012
During the year ended
December 31, 2013
, we experienced the following changes in our revenue as compared to
2012
:
|
•
|
Average yield increased revenue by 1.3% due to positive pricing in all lines of business.
|
|
•
|
The fuel recovery fee program generated 0.3% of the total revenue growth. Higher fuel recovery fees for 2013 as compared to 2012 resulted primarily from an increase in the fuel recovery rates charged. During 2013, we were able to recover approximately
74%
of our direct fuel expenses with fuel recovery fees, compared to 67% during 2012.
|
|
•
|
Volume increased revenue by 1.3%, primarily due to higher volumes in commercial and industrial collection, disposal and non-core lines of business, partially offset by lower volumes in our residential collection line of business. Volume increases in our landfill line of business were primarily attributable to construction and special waste volumes, offset by decreases in municipal solid waste.
|
|
•
|
Recycled commodities increased revenue by 0.3%, primarily due to the change in the market price of materials as well as increased production volumes. The average price for old corrugated cardboard was $128 per ton for 2013 compared to $124 per ton for 2012. The average price of old newspaper was $93 per ton for 2013 compared to $105 per ton for 2012. Our recycled commodity volume for 2013 of 2.2 million tons sold was 9% higher than the volume in 2012 as a result of our investment in recycling centers along with higher organic volumes.
|
Cost of Operations
Cost of operations includes labor and related benefits, which consists of salaries and wages, health and welfare benefits, incentive compensation and payroll taxes. It also includes transfer and disposal costs representing tipping fees paid to third party disposal facilities and transfer stations; maintenance and repairs relating to our vehicles, equipment and containers, including related labor and benefit costs; transportation and subcontractor costs, which include costs for independent haulers that transport our waste to disposal facilities and costs for local operators who provide waste handling services associated with our National Accounts in markets outside our standard operating areas; fuel, which includes the direct cost of fuel used by our vehicles, net of fuel tax credits; disposal franchise fees and taxes, consisting of landfill taxes, municipal franchise fees, host community fees and royalties; landfill operating costs, which includes financial assurance, leachate disposal, remediation charges and other landfill maintenance costs; risk management, which includes casualty insurance premiums and claims; cost of goods sold, which includes material costs paid to suppliers associated with recycled commodities; and other, which includes expenses such as facility operating costs, equipment rent and gains or losses on sale of assets used in our operations.
31
The following table summarizes the major components of our cost of operations for the years ended
December 31, 2014
,
2013
and
2012
(in millions of dollars and as a percentage of revenue):
|
|
2014
|
2013
|
2012
|
|||||||||||||||||
|
Labor and related benefits
|
$
|
1,724.1
|
|
19.6
|
%
|
$
|
1,651.6
|
|
19.6
|
%
|
$
|
1,573.9
|
|
19.4
|
%
|
|||||
|
Transfer and disposal costs
|
680.8
|
|
7.7
|
|
637.0
|
|
7.6
|
|
616.4
|
|
7.6
|
|
||||||||
|
Maintenance and repairs
|
786.7
|
|
8.9
|
|
736.0
|
|
8.7
|
|
682.7
|
|
8.4
|
|
||||||||
|
Transportation and subcontract costs
|
500.0
|
|
5.7
|
|
469.1
|
|
5.6
|
|
431.9
|
|
5.3
|
|
||||||||
|
Fuel
|
500.0
|
|
5.7
|
|
516.7
|
|
6.1
|
|
530.1
|
|
6.5
|
|
||||||||
|
Franchise fees and taxes
|
427.7
|
|
4.9
|
|
412.5
|
|
4.9
|
|
401.9
|
|
5.0
|
|
||||||||
|
Landfill operating costs
|
145.1
|
|
1.6
|
|
116.4
|
|
1.4
|
|
124.0
|
|
1.5
|
|
||||||||
|
Risk management
|
179.4
|
|
2.0
|
|
158.7
|
|
1.9
|
|
177.3
|
|
2.2
|
|
||||||||
|
Cost of goods sold
|
160.4
|
|
1.8
|
|
132.8
|
|
1.6
|
|
114.6
|
|
1.4
|
|
||||||||
|
Other
|
306.8
|
|
3.6
|
|
295.2
|
|
3.5
|
|
278.8
|
|
3.4
|
|
||||||||
|
Subtotal
|
5,411.0
|
|
61.5
|
|
5,126.0
|
|
60.9
|
|
4,931.6
|
|
60.7
|
|
||||||||
|
Bridgeton remediation
|
217.1
|
|
2.5
|
|
108.7
|
|
1.3
|
|
74.1
|
|
1.0
|
|
||||||||
|
Total cost of operations
|
$
|
5,628.1
|
|
64.0
|
%
|
$
|
5,234.7
|
|
62.2
|
%
|
$
|
5,005.7
|
|
61.7
|
%
|
|||||
These cost categories may change from time to time and may not be comparable to similarly titled categories used by other companies. As such, you should take care when comparing our cost of operations by cost component to that of other companies.
Cost of Operations -
2014
compared to
2013
Our cost of operations increased $393.4 million or, as a percentage of revenue, 1.8% for the year ended
December 31, 2014
compared to
2013
, primarily as a result of the following:
|
•
|
Labor and related benefits increased due to increased hourly and salaried wages as a result of merit increases and higher collection volumes. The Central and East Regions experienced unfavorable weather conditions during the first quarter of 2014, which contributed to increases in labor expense, resulting from lower labor productivity.
|
|
•
|
Transfer and disposal costs increased primarily due to higher collection volumes. During each of
2014
and
2013
, approximately
68%
of the total waste volume we collected was disposed at landfill sites that we own or operate (internalization).
|
|
•
|
Maintenance and repairs expense increased due to higher collection volume, cost of parts, internal labor, third party truck repairs, vehicle complexity and costs associated with our fleet maintenance initiative.
|
|
•
|
Transportation and subcontract costs increased primarily due to new National Accounts contracts and subcontracted work resulting from growth in landfill special waste volume.
|
|
•
|
Our fuel costs decreased due to our continued conversion to lower cost CNG, lower prices of diesel fuel, and higher alternative fuel tax credits recognized in 2014. The national average fuel cost per gallon for 2014 was $3.83 compared to $3.92 for 2013, a decrease of $0.09 or approximately 2%.
|
At current consumption levels, we believe a twenty-cent per gallon change in the price of diesel fuel would change our fuel costs by approximately
$26 million
per year. Offsetting these changes in fuel expense would be changes in our fuel recovery fee charged to our customers. At current participation rates, we believe a twenty-cent per gallon change in the price of diesel fuel changes our fuel recovery fee by approximately
$25 million
per year.
|
•
|
Franchise fees and taxes increased due primarily to volume increases in our landfill line of business.
|
|
•
|
Landfill operating expenses increased due to volume increases in our landfill line of business. Additionally, during 2013, we recorded favorable remediation adjustments of $17.1 million, of which $15.0 million relates to changes in the estimated timing of payments for our remediation obligations, which did not recur in 2014.
|
|
•
|
Risk management expenses increased primarily due to unfavorable actuarial development in our vehicle liability program in 2014, compared to favorable actuarial development in our workers' compensation, vehicle liability and general liability insurance programs in 2013. During 2014, we continued to see favorable development in our workers' compensation program.
|
32
|
•
|
Cost of goods sold relates to rebates paid for volumes delivered to our recycling facilities. Cost of goods sold in aggregate dollars increased primarily due to an increase in brokering and production of recycled commodity volumes.
|
|
•
|
Other expenses increased primarily due to higher facility operating costs, including property taxes related to infrastructure investments. Other expenses also increased due to higher utility costs associated with the unfavorable weather conditions experienced in our Central and East Regions during the first quarter of 2014, as well as $4.8 million of 2012 alternative fuel tax credits recognized during the first quarter of 2013, which did not recur in 2014.
|
|
•
|
During 2014, we updated our cost and timeline estimates to build and operate a leachate management facility and related infrastructure, manage the remediation area and monitor our closed Bridgeton Landfill in Missouri. Accordingly, we recorded environmental remediation charges of $210.6 million. Additionally, we recorded certain remediation charges for the superfund site. During 2013, we recorded environmental remediation charges in the amount of
$108.7 million
to manage the remediation area and monitor the site.
|
Cost of Operations –
2013
compared to
2012
Our cost of operations increased $229.0 million or, as a percentage of revenue, an increase of 0.5% for the year ended December 31, 2013 compared to 2012, primarily as a result of the following:
|
•
|
Labor and related benefits increased due to increased hourly and salaried wages as a result of merit increases, health care costs and collection volumes.
|
|
•
|
Transfer and disposal costs increased primarily due to higher prices and volumes disposed at third party sites. During 2013, approximately 68% of the total waste volume we collected was disposed at landfill sites that we own or operate (internalization) compared to 67% for 2012.
|
|
•
|
Maintenance and repairs expense increased due to higher collection volume, cost of parts, internal labor, third party truck repairs and costs associated with our fleet maintenance initiative. Container and compactor maintenance had an unfavorable impact on maintenance and repairs expense due primarily to increased container repairs resulting from unit growth in our commercial and industrial lines of business.
|
|
•
|
Subcontract costs increased primarily due to new National Accounts contracts and subcontracted work. Transportation costs increased due to an increase in transfer station volumes and increased fuel surcharges.
|
|
•
|
Our fuel costs in aggregate dollars and as a percentage of revenue decreased $13.4 million and 0.4%, respectively, due to our continued conversion to lower cost CNG and alternative fuel tax credits. Average fuel costs per gallon for 2013 were $3.92 compared to $3.97 for 2012, a decrease of 1%.
|
|
•
|
Franchise fees and taxes increased due to increased collection revenue in franchised markets as well as increased host fees and taxes due to increased landfill volumes.
|
|
•
|
Landfill operating expenses in aggregate dollars and as a percentage of revenue decreased $7.6 million and 0.1%, respectively, primarily due to net favorable remediation adjustments of $17.1 million, of which $15.0 million relates to changes in the estimated timing of payments for our remediation obligations, offset by increased leachate management expenses of $9.1 million.
|
|
•
|
Risk management expenses decreased primarily due to favorable actuarial development, primarily in our auto liability insurance reserves.
|
|
•
|
Cost of goods sold in aggregate dollars and as a percentage of revenue increased $18.2 million and 0.2%, respectively, primarily due to an increase in both the volume of commodities sold and the average cost per ton for commodities.
|
|
•
|
Included in other cost of operations is occupancy and facility costs, which increased $7.5 million primarily due to increased facility maintenance expense.
|
|
•
|
We recorded environmental remediation charges at our closed Bridgeton Landfill in Missouri of $108.7 million in June 2013 and $74.1 million during 2012 to manage the remediation area and monitor the site.
|
33
Depreciation, Amortization and Depletion of Property and Equipment
The following table summarizes depreciation, amortization and depletion of property and equipment for the years ended
December 31, 2014
,
2013
and
2012
(in millions of dollars and as a percentage of revenue):
|
|
2014
|
2013
|
2012
|
|||||||||||||||||
|
Depreciation and amortization of property
and equipment
|
$
|
575.5
|
|
6.6
|
%
|
$
|
544.8
|
|
6.5
|
%
|
$
|
520.8
|
|
6.4
|
%
|
|||||
|
Landfill depletion and amortization
|
263.0
|
|
3.0
|
|
261.9
|
|
3.1
|
|
257.6
|
|
3.2
|
|
||||||||
|
Depreciation, amortization and depletion
expense
|
$
|
838.5
|
|
9.6
|
%
|
$
|
806.7
|
|
9.6
|
%
|
$
|
778.4
|
|
9.6
|
%
|
|||||
Depreciation, Amortization and Depletion of Property and Equipment -
2014
compared to
2013
Depreciation and amortization of property and equipment in aggregate dollars increased primarily due to higher acquisition costs of replacement vehicles and an increased number of CNG vehicles in our fleet, which are more expensive to purchase than diesel vehicles. In addition, we made increased investments in new and upgraded recycling infrastructure projects that became operational over the past several quarters.
Landfill depletion and amortization expense in aggregate dollars increased primarily due to increased landfill disposal volumes and an overall increase in our average depletion rate. Offsetting these increases were favorable amortization adjustments of $13.3 million that were recognized in 2014 relative to asset retirement obligations, compared to favorable amortization adjustments of $0.3 million in 2013. Included in these favorable adjustments are increases in deemed probable expansion airspace at certain of our active solid waste landfills.
Depreciation, Amortization and Depletion of Property and Equipment -
2013
compared to
2012
Depreciation and amortization of property and equipment in aggregate dollars increased $24.0 million, primarily due to higher costs of residential side loaders for automating our residential collection routes and an increased number of CNG vehicles. In addition, we made increased investments in new and upgraded recycling infrastructure projects that became operational over the past several quarters.
Landfill depletion and amortization expense in aggregate dollars increased $4.3 million, primarily due to increased landfill disposal volumes, as well as an overall increase in our average depletion rate. Offsetting these increases were favorable amortization adjustments of $0.3 million that were recognized in 2013 related to asset retirement obligations, compared to net unfavorable adjustments of $4.9 million in 2012. Landfill depletion and amortization as a percentage of revenue remained relatively consistent at 3.1% for 2013 and 3.2% for 2012.
Amortization of Other Intangible Assets and Other Assets
Expenses for amortization of other intangible assets and other assets were
$68.4 million
,
$70.7 million
and
$70.1 million
for the years ended December 31,
2014
,
2013
and
2012
, respectively, or,
0.8%
,
0.8%
and
0.9%
of revenue, for
2014
,
2013
and
2012
, respectively. Our other intangible assets and other assets primarily relate to customer relationships, franchise agreements, other municipal agreements, favorable lease assets and, to a lesser extent, non-compete agreements and trade names. The decline in amortization is the result of certain intangible assets now being fully amortized, partially offset by assets acquired in the acquisitions of various solid waste businesses throughout the year.
Accretion Expense
Accretion expense was
$78.0 million
,
$76.6 million
and
$78.4 million
, or,
0.9%
,
0.9%
and
1.0%
of revenue, for the years ended December 31,
2014
,
2013
and
2012
, respectively. Accretion expense has remained relatively unchanged as our asset retirement obligations remained relatively consistent period over period.
Selling, General and Administrative Expenses
Selling, general and administrative expenses include salaries, health and welfare benefits, and incentive compensation for corporate and field general management, field support functions, sales force, accounting and finance, legal, management information systems, and clerical and administrative departments. Other expenses include rent and office costs, fees for professional services provided by third parties, legal settlements, marketing, investor and community relations services,
34
directors’ and officers’ insurance, general employee relocation, travel, entertainment and bank charges. Restructuring charges are excluded from selling, general and administrative expenses and are discussed separately.
The following table summarizes our selling, general and administrative expenses for the years ended
December 31, 2014
,
2013
and
2012
(in millions of dollars and as a percentage of revenue):
|
|
2014
|
2013
|
2012
|
|||||||||||||||||
|
Salaries
|
$
|
579.8
|
|
6.6
|
%
|
$
|
545.4
|
|
6.5
|
%
|
$
|
539.4
|
|
6.6
|
%
|
|||||
|
Provision for doubtful accounts
|
22.6
|
|
0.3
|
|
16.1
|
|
0.2
|
|
29.7
|
|
0.4
|
|
||||||||
|
Other
|
316.5
|
|
3.6
|
|
292.3
|
|
3.4
|
|
251.8
|
|
3.1
|
|
||||||||
|
Total selling, general and administrative expenses
|
$
|
918.9
|
|
10.5
|
%
|
$
|
853.8
|
|
10.1
|
%
|
$
|
820.9
|
|
10.1
|
%
|
|||||
These cost categories may change from time to time and may not be comparable to similarly titled categories used by other companies. As such, you should take care when comparing our selling, general and administrative expenses by cost component to those of other companies.
Selling, General and Administrative Expenses –
2014
compared to
2013
Salaries increased primarily due to higher wages resulting from merit increases, increased headcount and management incentive pay.
Provision for doubtful accounts increased primarily due to a net favorable adjustment, recorded in our corporate segment in 2013, of $8.3 million resulting from a change in our estimated future bad debts.
Other selling, general and administrative expenses increased primarily due to costs associated with strategic growth initiatives as well as costs incurred with the acquisition of various solid waste businesses.
Selling, General and Administrative Expenses –
2013
compared to
2012
Salaries increased $6.0 million, but remained relatively consistent as a percentage of revenue at 6.5% and 6.6% for 2013 and 2012, respectively. During 2013, we recorded severance costs due to management departures, and higher salaries, payroll taxes and benefits resulting from merit increases and management incentive pay, partially offset by lower salaries expense in connection with the reorganization.
Provision for doubtful accounts decreased $13.6 million and 0.2% of revenue, primarily due to a net favorable adjustment, recorded in our corporate segment, of $8.3 million resulting from a change in our estimated future bad debts.
Other selling, general and administrative expenses in aggregate dollars and as a percentage of revenue increased $40.5 million and 0.3%, respectively. These increases are primarily related to charges for legal settlements of $29.6 million for 2013, which relate to legal matters occurring in the ordinary course of business, as compared to net favorable legal settlement adjustments of $3.7 million for 2012.
Negotiation and Withdrawal Costs - Central States Pension and Other Funds
During the year ended
December 31, 2014
, we recorded charges to earnings of $
1.5 million
, primarily related to costs associated with our 2013 withdrawal from the Fund. During the years ended
December 31, 2013
and
2012
, we recorded charges to earnings of $
157.7 million
and
$35.8 million
, respectively, primarily related to our negotiation and withdrawal liability from the Fund.
For additional discussion and detail regarding our obligations to the Fund, see our
Central States, Southeast and Southwest Areas Pension Fund
discussion in Note 11,
Employee Benefit Plans
, to our consolidated financial statements in Item 8 of this Form 10-K.
35
Loss (Gain) on Disposition of Assets and Impairments, Net
During 2014, we recorded a charge to earnings of $20.0 million primarily related to costs associated with one of our divested landfills, of which $14.1 million relates to closure and post-closure costs and $5.9 million relates to remediation expenditures.
During 2013, we recorded a net gain on disposition of assets and impairments of $1.9 million, primarily related to the contingent sales price of $1.0 million received in connection with a 2011 business divestiture in our West Region.
During 2012, we recorded a net gain on disposition of assets and impairments of $2.7 million, primarily due to a $5.5 million net gain on a divestiture of a collection business in our East Region and a sale of certain assets associated with our rail logistics business.
Restructuring Charges
During the fourth quarter of 2012, we announced a restructuring of our field and corporate operations to create a more efficient and competitive company. These changes included consolidating our field regions from four to three and our areas from 28 to 20, relocating office space, and reducing administrative staffing levels. During
2014
, we incurred costs of $1.8 million due to a change in estimate of amounts recoverable from sublet income associated with abandoned office space with non-cancellable lease terms. During
2013
and 2012, we incurred $8.6 million and $11.1 million of restructuring charges, respectively, which consisted of severance and other employee termination benefits, relocation benefits, and the closure of offices with lease agreements with non-cancelable terms.
Interest Expense
The following table provides the components of interest expense, including accretion of debt discounts and accretion of discounts primarily associated with environmental and risk insurance liabilities assumed in the Allied acquisition (in millions of dollars):
|
2014
|
2013
|
2012
|
|||||||||
|
Interest expense on debt and capital lease obligations
|
$
|
310.3
|
|
$
|
319.8
|
|
$
|
338.5
|
|
||
|
Accretion of debt discounts
|
6.6
|
|
6.9
|
|
12.2
|
|
|||||
|
Accretion of remediation reserves and other
|
38.2
|
|
40.6
|
|
46.2
|
|
|||||
|
Less: capitalized interest
|
(6.4
|
)
|
(7.3
|
)
|
(8.4
|
)
|
|||||
|
Total interest expense
|
$
|
348.7
|
|
$
|
360.0
|
|
$
|
388.5
|
|
||
During the second half of 2013, we entered into various interest rate swap agreements relative to our 4.750% fixed rate senior notes due in May 2023. These swap agreements, which were designated as fair value hedges, have a total notional value of $300.0 million and resulted in a
$7.7 million
reduction in interest expense during
2014
, compared to a
$2.0 million
reduction in interest expense during 2013. Additionally, there were lower variable rates on our tax-exempt financings, which also contributed to the reduction in interest expense during 2014. During
2014
,
2013
and
2012
, cash paid for interest was
$320.2 million
,
$324.0 million
and
$341.0 million
, respectively.
36
The following table summarizes the refinancing transactions that resulted in cash paid for premiums and professional fees to
repurchase outstanding debt, as well as non-cash charges for unamortized debt discounts and deferred issuance costs for the years ended
December 31, 2014
,
2013
and
2012
(in millions of dollars):
|
Principal
Repaid
|
Cash Paid on
Loss on
Extinguishment
of Debt
|
Non-cash Loss
on
Extinguishment
of Debt
|
Total Loss on
Extinguishment
of Debt
|
||||||||||||
|
2014:
|
|||||||||||||||
|
Amendments to credit facilities
|
$
|
—
|
|
$
|
—
|
|
$
|
0.7
|
|
$
|
0.7
|
|
|||
|
Tax-exempt financings
|
42.5
|
|
—
|
|
0.7
|
|
0.7
|
|
|||||||
|
Loss on extinguishment of debt for the year ended
December 31, 2014
|
$
|
—
|
|
$
|
1.4
|
|
$
|
1.4
|
|
||||||
|
2013:
|
|||||||||||||||
|
Tax-exempt financings
|
$
|
189.1
|
|
$
|
—
|
|
$
|
2.1
|
|
$
|
2.1
|
|
|||
|
Loss on extinguishment of debt for the year ended
December 31, 2013
|
$
|
—
|
|
$
|
2.1
|
|
$
|
2.1
|
|
||||||
|
2012:
|
|||||||||||||||
|
Amendments to credit facilities
|
$
|
—
|
|
$
|
—
|
|
$
|
1.5
|
|
$
|
1.5
|
|
|||
|
$750.0 million 6.875% senior notes due June 2017
|
750.0
|
|
25.8
|
|
71.0
|
|
96.8
|
|
|||||||
|
Tax-exempt financings
|
94.0
|
|
—
|
|
14.2
|
|
14.2
|
|
|||||||
|
Ineffective portion of interest rate lock settlements
|
—
|
|
0.1
|
|
—
|
|
0.1
|
|
|||||||
|
Loss on extinguishment of debt for the year ended
December 31, 2012
|
$
|
25.9
|
|
$
|
86.7
|
|
$
|
112.6
|
|
||||||
Income Taxes
Our provision for income taxes was $337.4 million, $262.1 million and $251.8 million for the years ended December 31, 2014, 2013 and 2012, respectively. Our effective income tax rate was 38.1%, 30.8% and 30.6% for 2014, 2013 and 2012, respectively. Our 2014 effective tax rate was favorably impacted by the realization of tax credits and lower state rates due to changes in estimates of approximately $5.1 million. Our 2013 effective tax rate was favorably impacted by approximately $42 million for adjustments to our valuation allowance, primarily due to the determination it was more likely than not the Company would be able to realize certain state loss carryforwards. In addition, our 2013 effective tax rate was favorably impacted by approximately $14 million due to a settlement for tax years 2009 to 2010 with the Internal Revenue Service (IRS) appeals division and the Joint Committee of Taxation. Lastly, our 2013 effective tax rate was favorably impacted by the realization of tax credits and lower state rates due to changes in estimates of approximately $9.6 million.
Our 2012 effective tax rate was favorably impacted by the settlement with the IRS appeals division for tax years 2004 to 2008. This settlement benefited our 2012 tax provision by approximately $35 million. The 2012 effective tax rate was also favorably impacted by the realization of tax credits and lower state rates due to changes in estimates of $16.0 million.
We made income tax payments (net of refunds received) of approximately $382 million, $288 million and $185 million for 2014, 2013 and 2012, respectively. Cash paid for income taxes increased over the periods primarily due to higher expected taxable income and the related deductible timing differences associated with certain remediation charges.
Income taxes paid in 2014 reflect the favorable tax depreciation provisions of the Tax Increase Protection Act of 2014, signed into law on December 16, 2014. This legislation extended 50% bonus depreciation for property placed in service during 2014.
Income taxes paid in 2013 reflect the favorable tax depreciation provisions of the American Tax Relief Act of 2012 signed into law on January 2, 2013. This legislation extended 50% bonus depreciation for property placed in service during 2013. Income taxes paid in 2012 reflect the favorable tax depreciation provisions of the Tax Relief, Unemployment Insurance Reauthorization, and Job Creation Act of 2010 (Tax Relief Act). The Tax Relief Act included 50% bonus depreciation for property placed in service in 2012.
For additional discussion and detail regarding our income taxes, see Note 10,
Income Taxes
, to our consolidated financial statements in Item 8 of this Form 10-K.
37
Reportable Segments
We manage and evaluate our operations through three regions: East, Central and West. These three regions are presented below as our reportable segments, which provide integrated waste management services consisting of collection, transfer, recycling and disposal of domestic non-hazardous solid waste. Summarized financial information concerning our reportable segments for the years ended
December 31, 2014
,
2013
and
2012
is shown in the following table (in millions of dollars and as a percentage of revenue):
|
Net
Revenue
|
Depreciation, Amortization, Depletion and
Accretion Before
Adjustments for
Asset Retirement
Obligations
|
Adjustments to Amortization
Expense
for Asset
Retirement
Obligations
|
Depreciation,
Amortization,
Depletion and
Accretion
|
(Loss) Gain on
Disposition of
Assets and Impairments, Net
|
Operating
Income
(Loss)
|
Operating
Margin
|
||||||||||||||||||||
|
2014:
|
||||||||||||||||||||||||||
|
East
|
$
|
2,498.1
|
|
$
|
269.4
|
|
$
|
(3.2
|
)
|
$
|
266.2
|
|
$
|
—
|
|
$
|
429.6
|
|
17.2
|
%
|
||||||
|
Central
|
2,622.4
|
|
324.7
|
|
(6.1
|
)
|
318.6
|
|
—
|
|
503.6
|
|
19.2
|
|
||||||||||||
|
West
|
3,489.4
|
|
360.7
|
|
(5.6
|
)
|
355.1
|
|
—
|
|
825.7
|
|
23.7
|
|
||||||||||||
|
Corporate entities
|
178.4
|
|
43.4
|
|
1.6
|
|
45.0
|
|
(20.0
|
)
|
(525.8
|
)
|
||||||||||||||
|
Total
|
$
|
8,788.3
|
|
$
|
998.2
|
|
$
|
(13.3
|
)
|
$
|
984.9
|
|
$
|
(20.0
|
)
|
$
|
1,233.1
|
|
14.0
|
%
|
||||||
|
2013:
|
||||||||||||||||||||||||||
|
East
|
$
|
2,456.0
|
|
$
|
252.9
|
|
$
|
4.7
|
|
$
|
257.6
|
|
$
|
—
|
|
$
|
451.0
|
|
18.4
|
%
|
||||||
|
Central
|
2,512.1
|
|
307.4
|
|
(2.8
|
)
|
304.6
|
|
—
|
|
494.5
|
|
19.7
|
|
||||||||||||
|
West
|
3,324.4
|
|
345.8
|
|
(3.0
|
)
|
342.8
|
|
1.9
|
|
766.6
|
|
23.1
|
|
||||||||||||
|
Corporate entities
|
124.7
|
|
48.2
|
|
0.8
|
|
49.0
|
|
—
|
|
(501.8
|
)
|
||||||||||||||
|
Total
|
$
|
8,417.2
|
|
$
|
954.3
|
|
$
|
(0.3
|
)
|
$
|
954.0
|
|
$
|
1.9
|
|
$
|
1,210.3
|
|
14.4
|
%
|
||||||
|
2012:
|
||||||||||||||||||||||||||
|
East
|
$
|
2,445.8
|
|
$
|
247.6
|
|
$
|
(3.0
|
)
|
$
|
244.6
|
|
$
|
5.3
|
|
$
|
474.6
|
|
19.4
|
%
|
||||||
|
Central
|
2,424.8
|
|
289.6
|
|
(4.6
|
)
|
285.0
|
|
(0.3
|
)
|
474.5
|
|
19.6
|
|
||||||||||||
|
West
|
3,158.0
|
|
333.5
|
|
(0.8
|
)
|
332.7
|
|
0.1
|
|
685.9
|
|
21.7
|
|
||||||||||||
|
Corporate entities
|
89.7
|
|
51.3
|
|
13.3
|
|
64.6
|
|
(2.4
|
)
|
(314.4
|
)
|
||||||||||||||
|
Total
|
$
|
8,118.3
|
|
$
|
922.0
|
|
$
|
4.9
|
|
$
|
926.9
|
|
$
|
2.7
|
|
$
|
1,320.6
|
|
16.3
|
%
|
||||||
Corporate entities include legal, tax, treasury, information technology, risk management, human resources, corporate accounts, closed landfills and other administrative functions. National Accounts revenue included in corporate entities represents the portion of revenue generated from nationwide contracts in markets outside our operating areas where the associated waste handling services are subcontracted to local operators. Consequently, substantially all of this revenue is offset with related subcontract costs, which are recorded in cost of operations.
Significant changes in the revenue and operating margins of our reportable segments for
2014
compared to
2013
and
2013
compared to
2012
are discussed in the following paragraphs.
2014
compared to
2013
East Region
Revenue for 2014 increased 1.7% from 2013, due primarily to increases in average yield in all lines of business, except for landfill construction and demolition. Volumes increased in our commercial and industrial collection, transfer station, and landfill special waste and construction and demolition lines of business but were partially offset by the decline in volume in our residential collection line of business. These increases were also partially offset by lower recycled commodity revenue.
Operating income in our East Region decreased from
$451.0 million
for 2013, or an
18.4%
operating margin, to
$429.6 million
for 2014, or a
17.2%
operating margin. The following cost categories impacted operating income:
|
•
|
Cost of operations unfavorably impacted operating income margin primarily due to higher repair and maintenance costs, increased labor and benefits and utility costs resulting largely from unfavorable weather conditions during the first quarter of 2014. These unfavorable items were partially offset by lower cost of goods sold and decreased fuel costs due to lower diesel fuel prices.
|
38
|
•
|
Depreciation and amortization of property and equipment unfavorably impacted operating income margin due to higher acquisition costs of replacement vehicles. Landfill depletion and amortization also unfavorably impacted operating income margin due to an overall increase in the average depletion rate, partially offset by favorable adjustments for asset retirement obligations of
$3.2 million
, compared to net unfavorable adjustments of
$4.7 million
in 2013.
|
|
•
|
Selling, general and administrative expenses unfavorably impacted operating income primarily due to $10.6 million of legal settlement charges from matters occurring in the ordinary course of business, compared to $3.1 million of legal settlement charges in 2013 .
|
Central Region
Revenue for 2014 increased 4.4% from 2013 primarily due to average yield increases in our commercial and industrial collection and transfer station lines of business, as well as volume increases in all collection and landfill lines of business, except for construction and demolition. These increases were partially offset by lowered recycled commodity revenue and a decrease in volume in our transfer station line of business.
Operating income increased and operating margin decreased in our Central Region from
$494.5 million
for 2013, or a
19.7%
operating margin, to
$503.6 million
for 2014, or a
19.2%
operating margin. The following cost categories impacted operating income:
|
•
|
Cost of operations favorably impacted operating income margin due primarily to decreased fuel costs resulting from lower diesel fuel prices, partially offset by higher repair and maintenance costs and cost of goods sold.
|
•
For 2014, the depreciation and amortization of property and equipment margin impact was flat.
|
•
|
Selling, general and administrative expenses unfavorably impacted operating income margin primarily due to $0.5 million of legal settlement charges, compared to favorable legal settlements recorded during 2013 of $16.7 million, which resulted from legal matters occurring in the ordinary course of business.
|
West Region
Revenue for 2014 increased 5.0% from 2013 due to increases in average yield in all core lines of business, and increases in volume in our collection and landfill lines of business. Volume increases in our landfill line of business were primarily attributable to increased special waste volumes.
Operating income in our West Region increased from
$766.6 million
for 2013, or a
23.1%
operating margin, to
$825.7 million
for 2014, or a
23.7%
operating margin, primarily as a result of increased revenue and the following:
|
•
|
Cost of operations favorably impacted operating income margin due primarily to decreased fuel costs resulting from lower diesel fuel prices, partially offset by higher cost of goods sold.
|
|
•
|
Landfill depletion was favorably impacted by the amortization adjustments of $5.6 million due primarily to an increase in deemed probable airspace expansion at one of our active solid waste landfills in 2014. Partially offsetting this favorable impact was higher depletion rates resulting from the acquisition of the San Angelo Landfill in the third quarter of 2014.
|
|
•
|
Selling, general and administrative expenses favorably impacted operating income margin during 2014 due to $7.6 million of legal settlement charges incurred, compared to $13.8 million of legal settlement charges incurred during 2013, from matters occurring in the ordinary course of business.
|
|
•
|
Gain on disposition of assets and impairments, net unfavorably impacted operating income margin during 2014 primarily due to contingent sale price of $1.0 million received in 2013 on a 2011 business divestiture.
|
Corporate Entities
Operating loss in our corporate region increased from
$501.8 million
for 2013 to
$525.8 million
for 2014. The increase in operating loss primarily relates to unfavorable remediation and litigation adjustments in 2014 of $227.1 million recorded at our closed Bridgeton Landfill in Missouri, compared to $108.7 million recorded in 2013. Additionally, during 2013, we recorded a net favorable adjustment of $8.3 million resulting from a change in our estimated future bad debts, favorable remediation adjustments of $17.1 million relating to changes in the estimated timing of payments for our remediation obligations and a favorable remediation adjustment for a closed landfill site of $12.1 million, which did not recur in 2014. Partially offsetting this increase in operating loss was a charge to earnings of $140.7 million in 2013 for our partial withdrawal liability from the Fund and Puerto Rico multiemployer pension plans, which also did not recur in 2014.
39
2013
compared to
2012
East Region
Revenue for 2013 increased 0.4% from 2012, primarily due to average yield and volume increases in our commercial and industrial collection lines of business and an average yield increase in our landfill line of business. These increases were partially offset by declines in volume in our residential collection, landfill and transfer station lines of business. The volume declines in our residential collection line of business were primarily due to the loss of certain municipal contracts, and the volume decreases in our disposal lines of business were primarily related to the loss of certain disposal contracts.
Operating income in our East Region decreased from $474.6 million for 2012, or a 19.4% operating margin, to $451.0 million for 2013, or an 18.4% operating margin, primarily as a result of the following:
|
•
|
Cost of operations unfavorably impacted operating income during 2013 compared to 2012, primarily due to higher labor and benefits and repair and maintenance costs. These unfavorable items were partially offset by lower fuel expenses due to lower prices of diesel fuel and reduced risk management expenses. Cost of goods sold increased for 2013 from 2012 primarily due to a higher volume of commodities sold.
|
|
•
|
Depreciation, amortization, depletion and accretion unfavorably impacted operating income during 2013 compared to 2012 primarily due to unfavorable adjustments for asset retirement obligations of $4.7 million in 2013 compared to net favorable adjustments of $3.0 million in 2012.
|
|
•
|
Selling, general and administrative expenses favorably impacted operating income, primarily due to higher provisions for doubtful accounts in 2012 compared to 2013.
|
|
•
|
Net gains on disposition of assets and impairments unfavorably impacted operating income during 2013 compared to 2012, primarily as a result of a $5.5 million net gain on the divestiture of a collection business and the sale of certain assets associated with our rail logistics business in 2012.
|
Central Region
Revenue for 2013 increased 3.6% from 2012, primarily due to average yield and volume increases in our commercial and industrial collection lines of business, increased volumes in our residential collection line of business, increased municipal solid waste landfill volume and increased average yield for our disposal lines of business. These increases were partially offset by declines in transfer station volumes.
Operating income in our Central Region increased from $474.5 million for 2012, or a 19.6% operating margin, to $494.5 million for 2013, or a 19.7% operating margin, primarily as a result of the following:
|
•
|
Cost of operations unfavorably impacted operating income due to higher labor and benefits, repair and maintenance, and cost of goods sold. Cost of goods sold increased for 2013 from 2012 primarily due to a higher volume of commodities sold.
|
|
•
|
Selling, general and administrative expenses favorably impacted operating income for 2013 compared to 2012, primarily due to lower legal settlement and legal fee expenses, offset by increased provisions for doubtful accounts.
|
West Region
Revenue for 2013 increased 5.3% from 2012, primarily due to increases in average yield and volume in substantially all core lines of business. Volume increases in the landfill line of business were primarily due to increased special waste event work.
Operating income in our West Region increased from $685.9 million for 2012, or a 21.7% operating margin, to $766.6 million for 2013, or a 23.1% operating margin, primarily as a result of the following:
|
•
|
Cost of operations favorably impacted operating income margin primarily due to lower fuel costs, which were primarily driven by increased usage of CNG and alternative fuel credits, offset by other operating cost increases.
|
|
•
|
During 2013, we recorded a net gain on disposition of assets and impairments of $1.9 million, primarily related to contingent sale price of $1.0 million received during the first quarter of 2013 in connection with a 2011 business divestiture and the disposal of a business in one market, which resulted in a gain of $0.9 million and proceeds of $1.7 million.
|
40
Corporate Entities
During 2013, the corporate entities had operating loss of $501.8 million compared to $314.4 million for 2012. Operating loss for 2013 was adversely impacted by a $108.7 million charge recorded in connection with remediation at our closed Bridgeton Landfill in Missouri, as compared to $74.1 million of charges recorded in 2012, a charge to earnings of $140.7 million during 2013 for our withdrawal liability from the Fund and Puerto Rico multiemployer pension plans, as compared to $30.7 million of charges recorded in 2012, and certain legal settlement charges in 2013 of $31.3 million.
Landfill and Environmental Matters
Our landfill costs include daily operating expenses, costs of capital for cell development, costs for final capping, closure and post-closure, and the legal and administrative costs of ongoing environmental compliance. Daily operating expenses include leachate treatment and disposal, methane gas and groundwater monitoring and system maintenance, interim cap maintenance, and costs associated with applying daily cover materials. We expense all indirect landfill development costs as they are incurred. We use life cycle accounting and the units-of-consumption method to recognize certain direct landfill costs related to landfill development. In life cycle accounting, certain direct costs are capitalized and charged to depletion expense based on the consumption of cubic yards of available airspace. These costs include all costs to acquire and construct a site, including excavation, natural and synthetic liners, construction of leachate collection systems, installation of methane gas collection and monitoring systems, installation of groundwater monitoring wells, and other costs associated with acquiring and developing the site. Obligations associated with final capping, closure and post-closure are capitalized and amortized on a units-of-consumption basis as airspace is consumed.
Cost and airspace estimates are developed at least annually by engineers. Our operating and accounting personnel use these estimates to adjust the rates we use to expense capitalized costs. Changes in these estimates primarily relate to changes in costs, available airspace, inflation and applicable regulations. Changes in available airspace include changes in engineering estimates, changes in design and changes due to the addition of airspace lying in expansion areas that we believe have a probable likelihood of being permitted.
41
Available Airspace
|
Balance
as of
December 31,
2013
|
New
Expansions
Undertaken
|
Landfills
Acquired,
Net of
Divestitures
|
Permits
Granted,
Net of
Closures
|
Airspace
Consumed
|
Changes
in
Engineering
Estimates
|
Balance
as of
December 31,
2014
|
||||||||||||||
|
Cubic yards (in millions):
|
||||||||||||||||||||
|
Permitted airspace
|
4,650.6
|
|
—
|
|
—
|
|
79.8
|
|
(74.6
|
)
|
(71.7
|
)
|
4,584.1
|
|
||||||
|
Probable expansion airspace
|
222.9
|
|
66.5
|
|
—
|
|
(59.4
|
)
|
—
|
|
31.7
|
|
261.7
|
|
||||||
|
Total cubic yards (in millions)
|
4,873.5
|
|
66.5
|
|
—
|
|
20.4
|
|
(74.6
|
)
|
(40.0
|
)
|
4,845.8
|
|
||||||
|
Number of sites:
|
||||||||||||||||||||
|
Permitted airspace
|
190
|
|
(1
|
)
|
189
|
|
||||||||||||||
|
Probable expansion airspace
|
9
|
|
4
|
|
(3
|
)
|
10
|
|
||||||||||||
|
Balance
as of
December 31,
2012
|
New
Expansions
Undertaken
|
Landfills
Acquired,
Net of
Divestitures
|
Permits
Granted,
Net of
Closures
|
Airspace
Consumed
|
Changes
in
Engineering
Estimates
|
Balance
as of
December 31,
2013
|
||||||||||||||
|
Cubic yards (in millions):
|
||||||||||||||||||||
|
Permitted airspace
|
4,562.5
|
|
—
|
|
—
|
|
164.4
|
|
(73.3
|
)
|
(3.0
|
)
|
4,650.6
|
|
||||||
|
Probable expansion airspace
|
260.4
|
|
18.6
|
|
—
|
|
(51.1
|
)
|
—
|
|
(5.0
|
)
|
222.9
|
|
||||||
|
Total cubic yards (in millions)
|
4,822.9
|
|
18.6
|
|
—
|
|
113.3
|
|
(73.3
|
)
|
(8.0
|
)
|
4,873.5
|
|
||||||
|
Number of sites:
|
||||||||||||||||||||
|
Permitted airspace
|
191
|
|
(1
|
)
|
190
|
|
||||||||||||||
|
Probable expansion airspace
|
10
|
|
1
|
|
(2
|
)
|
9
|
|
||||||||||||
|
Balance
as of
December 31,
2011
|
New
Expansions
Undertaken
|
Landfills
Acquired,
Net of
Divestitures
|
Permits
Granted,
Net of
Closures
|
Airspace
Consumed
|
Changes
in
Engineering
Estimates
|
Balance
as of
December 31,
2012
|
||||||||||||||
|
Cubic yards (in millions):
|
||||||||||||||||||||
|
Permitted airspace
|
4,621.8
|
|
—
|
|
—
|
|
25.3
|
|
(73.6
|
)
|
(11.0
|
)
|
4,562.5
|
|
||||||
|
Probable expansion airspace
|
166.5
|
|
113.1
|
|
—
|
|
(19.2
|
)
|
—
|
|
—
|
|
260.4
|
|
||||||
|
Total cubic yards (in millions)
|
4,788.3
|
|
113.1
|
|
—
|
|
6.1
|
|
(73.6
|
)
|
(11.0
|
)
|
4,822.9
|
|
||||||
|
Number of sites:
|
||||||||||||||||||||
|
Permitted airspace
|
191
|
|
191
|
|
||||||||||||||||
|
Probable expansion airspace
|
8
|
|
4
|
|
(2
|
)
|
10
|
|
||||||||||||
Changes in engineering estimates typically include modifications to the available disposal capacity of a landfill based on a refinement of the capacity calculations resulting from updated information.
As of
December 31, 2014
, we owned or operated
189
active solid waste landfills with total available disposal capacity estimated to be
4,845.8 million
in-place cubic yards. Total available disposal capacity represents the sum of estimated permitted airspace plus an estimate of probable expansion airspace. Engineers develop these estimates at least annually using information provided by annual aerial surveys. As of
December 31, 2014
, total available disposal capacity is estimated to be
4,584.1 million
in-place cubic yards of permitted airspace plus
261.7 million
in-place cubic yards of probable expansion airspace. Before airspace included in an expansion area is determined to be probable expansion airspace and, therefore, included in our calculation of total available disposal capacity, it must meet all of our expansion criteria. See Note 2,
Summary of Significant Accounting Policies,
and Note 8,
Landfill and Environmental Costs
, to our consolidated financial statements in Item 8 of this Form 10-K for further information. Also see our
"Critical Accounting Judgments and Estimates"
section of this Management's Discussion and Analysis of Financial Condition and Results of Operations.
As of
December 31, 2014
,
ten
of our landfills met all of our criteria for including their probable expansion airspace in their total available disposal capacity. At projected annual volumes, these
ten
landfills have an estimated remaining average site life of 49 years, including probable expansion airspace. The average estimated remaining life of all of our landfills is 66 years. We have
42
other expansion opportunities that are not included in our total available airspace because they do not meet all of our criteria for treatment as probable expansion airspace.
The following table reflects the estimated operating lives of our active landfill sites based on available and probable disposal capacity using current annual volumes as of
December 31, 2014
:
|
Number
of Sites
without
Probable
Expansion
Airspace
|
Number
of Sites
with
Probable
Expansion
Airspace
|
Total
Sites
|
Percent
of
Total
|
||||||||
|
0 to 5 years
|
15
|
|
—
|
|
15
|
|
7.9
|
%
|
|||
|
6 to 10 years
|
18
|
|
—
|
|
18
|
|
9.5
|
|
|||
|
11 to 20 years
|
32
|
|
1
|
|
33
|
|
17.5
|
|
|||
|
21 to 40 years
|
42
|
|
3
|
|
45
|
|
23.8
|
|
|||
|
41+ years
|
72
|
|
6
|
|
78
|
|
41.3
|
|
|||
|
Total
|
179
|
|
10
|
|
189
|
|
100.0
|
%
|
|||
Final Capping, Closure and Post-Closure Costs
As of
December 31, 2014
, accrued final capping, closure and post-closure costs were
$1,144.3 million
, of which
$87.9 million
are current and
$1,056.4 million
are long-term as reflected in our consolidated balance sheets in accrued landfill and environmental costs included in Item 8 of this Form 10-K.
Remediation and Other Charges for Landfill Matters
The following is a discussion of certain of our significant remediation matters:
Bridgeton Landfill.
As of December 31, 2014, the remediation liability recorded for our closed Bridgeton Landfill in Missouri was
$240.3 million
, of which
$30 million
is expected to be paid during 2015. During the year ended December 31, 2014, we paid
$64.3 million
related to construction of a leachate management facility and related infrastructure, as well as management and monitoring of the remediation area. During the three months ended March 31, 2014, we recorded a charge to earnings of
$36.1 million
, primarily related to the design and construction of a leachate management facility. As the nature and extent of our leachate remediation efforts continued to change, it became necessary to upgrade treatment facility design features and infrastructure. In the third quarter of 2014, we completed construction of the leachate management facility, but it was not functioning at full capacity and was still in a testing mode. In the fourth quarter of 2014, we updated our cost and timeline estimates to operate the leachate management facility, manage the remediation area and monitor the site. Accordingly, we recorded an environmental remediation charge of
$174.5 million
. We expect the facility will function at full capacity in the first half of 2015. We continue to work with state and federal regulatory agencies on our remediation efforts. From time to time, this may require us to modify our future operating timeline and procedures, which could result in changes to our expected liability. We believe the remaining reasonably possible high end of our range would be approximately
$160 million
higher than the amount recorded as of
December 31, 2014
.
Congress Landfill.
In August 2010, Congress Development Company agreed with the State of Illinois to have a Final Consent Order (Final Order) entered by the Circuit Court of Illinois, Cook County. Pursuant to the Final Order, we have agreed to continue to implement certain remedial activities at the Congress Landfill. The remediation liability recorded as of
December 31, 2014
is
$83.4 million
, of which
$5.0 million
is expected to be paid during 2015. We believe the remaining reasonably possible high end of our range would be approximately
$70 million
higher than the amount recorded as of
December 31, 2014
.
It is reasonably possible that we will need to adjust the liabilities noted above to reflect the effects of new or additional information, to the extent that such information impacts the costs, timing or duration of the required actions. Future changes in our estimates of the costs, timing or duration of the required actions could have a material adverse effect on our consolidated financial position, results of operations or cash flows.
43
Investment in Landfills
The following tables reflect changes in our investment in landfills for the years ended December 31, 2014, 2013 and 2012 and the future expected investment as of December 31, 2014 (in millions):
|
Balance
as of
December 31,
2013
|
Capital
Additions
|
Retirements
|
Acquisitions
Net of
Divestitures
|
Non-cash
Additions
for Asset
Retirement
Obligations
|
Additions
Charged
to
Expense
|
Impairments,
Transfers
and
Other
Adjustments
|
Adjustments
for
Asset
Retirement
Obligations
|
Balance
as of
December 31,
2014
|
|||||||||||||||||||||||||||
|
Non-depletable landfill land
|
$
|
164.2
|
|
$
|
—
|
|
$
|
(2.0
|
)
|
$
|
—
|
|
$
|
—
|
|
$
|
—
|
|
$
|
—
|
|
$
|
—
|
|
$
|
162.2
|
|
||||||||
|
Landfill development costs
|
5,392.7
|
|
4.9
|
|
(0.3
|
)
|
26.6
|
|
38.6
|
|
—
|
|
195.0
|
|
(12.2
|
)
|
5,645.3
|
|
|||||||||||||||||
|
Construction-in-progress -landfill
|
72.5
|
|
261.5
|
|
—
|
|
—
|
|
—
|
|
—
|
|
(193.2
|
)
|
—
|
|
140.8
|
|
|||||||||||||||||
|
Accumulated depletion and amortization
|
(2,160.2
|
)
|
—
|
|
0.1
|
|
—
|
|
—
|
|
(276.5
|
)
|
—
|
|
(0.8
|
)
|
(2,437.4
|
)
|
|||||||||||||||||
|
Net investment in landfill land and development costs
|
$
|
3,469.2
|
|
$
|
266.4
|
|
$
|
(2.2
|
)
|
$
|
26.6
|
|
$
|
38.6
|
|
$
|
(276.5
|
)
|
$
|
1.8
|
|
$
|
(13.0
|
)
|
$
|
3,510.9
|
|
||||||||
|
Balance
as of
December 31,
2012
|
Capital
Additions
|
Retirements
|
Acquisitions
Net of
Divestitures
|
Non-cash
Additions
for Asset
Retirement
Obligations
|
Additions
Charged
to
Expense
|
Impairments,
Transfers
and
Other
Adjustments
|
Adjustments
for
Asset
Retirement
Obligations
|
Balance
as of
December 31,
2013
|
|||||||||||||||||||||||||||
|
Non-depletable landfill land
|
$
|
166.0
|
|
$
|
2.3
|
|
$
|
(4.3
|
)
|
$
|
—
|
|
$
|
—
|
|
$
|
—
|
|
$
|
0.2
|
|
$
|
—
|
|
$
|
164.2
|
|
||||||||
|
Landfill development costs
|
5,018.0
|
|
2.6
|
|
—
|
|
—
|
|
36.5
|
|
—
|
|
323.6
|
|
12.0
|
|
5,392.7
|
|
|||||||||||||||||
|
Construction-in-progress -landfill
|
134.5
|
|
259.5
|
|
—
|
|
—
|
|
—
|
|
—
|
|
(321.5
|
)
|
—
|
|
72.5
|
|
|||||||||||||||||
|
Accumulated depletion and amortization
|
(1,896.4
|
)
|
—
|
|
—
|
|
—
|
|
—
|
|
(262.2
|
)
|
(1.9
|
)
|
0.3
|
|
(2,160.2
|
)
|
|||||||||||||||||
|
Net investment in landfill land and development costs
|
$
|
3,422.1
|
|
$
|
264.4
|
|
$
|
(4.3
|
)
|
$
|
—
|
|
$
|
36.5
|
|
$
|
(262.2
|
)
|
$
|
0.4
|
|
$
|
12.3
|
|
$
|
3,469.2
|
|
||||||||
44
|
Balance
as of
December 31,
2011
|
Capital
Additions
|
Retirements
|
Acquisitions
Net of
Divestitures
|
Non-cash
Additions
for Asset
Retirement
Obligations
|
Additions
Charged
to
Expense
|
Impairments,
Transfers
and
Other
Adjustments
|
Adjustments
for
Asset
Retirement
Obligations
|
Balance
as of
December 31,
2012
|
|||||||||||||||||||||||||||
|
Non-depletable landfill land
|
$
|
161.8
|
|
$
|
3.3
|
|
$
|
(0.3
|
)
|
$
|
—
|
|
$
|
—
|
|
$
|
—
|
|
$
|
1.2
|
|
$
|
—
|
|
$
|
166.0
|
|
||||||||
|
Landfill development costs
|
4,763.3
|
|
8.0
|
|
—
|
|
(0.3
|
)
|
33.8
|
|
—
|
|
217.8
|
|
(4.6
|
)
|
5,018.0
|
|
|||||||||||||||||
|
Construction-in-progress -landfill
|
187.3
|
|
263.2
|
|
—
|
|
—
|
|
—
|
|
—
|
|
(316.0
|
)
|
—
|
|
134.5
|
|
|||||||||||||||||
|
Accumulated depletion and amortization
|
(1,735.7
|
)
|
—
|
|
—
|
|
0.3
|
|
—
|
|
(252.7
|
)
|
96.4
|
|
(4.7
|
)
|
(1,896.4
|
)
|
|||||||||||||||||
|
Net investment in landfill land and development costs
|
$
|
3,376.7
|
|
$
|
274.5
|
|
$
|
(0.3
|
)
|
$
|
—
|
|
$
|
33.8
|
|
$
|
(252.7
|
)
|
$
|
(0.6
|
)
|
$
|
(9.3
|
)
|
$
|
3,422.1
|
|
||||||||
|
Balance
as of
December 31,
2014
|
Expected
Future
Investment
|
Total
Expected
Investment
|
|||||||||
|
Non-depletable landfill land
|
$
|
162.2
|
|
$
|
—
|
|
$
|
162.2
|
|
||
|
Landfill development costs
|
5,645.3
|
|
7,734.0
|
|
13,379.3
|
|
|||||
|
Construction-in-progress - landfill
|
140.8
|
|
—
|
|
140.8
|
|
|||||
|
Accumulated depletion and amortization
|
(2,437.4
|
)
|
—
|
|
(2,437.4
|
)
|
|||||
|
Net investment in landfill land and development costs
|
$
|
3,510.9
|
|
$
|
7,734.0
|
|
$
|
11,244.9
|
|
||
The following table reflects our net investment in our landfills, excluding non-depletable land, and our depletion, amortization and accretion expense for the years ended December 31, 2014, 2013 and 2012:
|
2014
|
2013
|
2012
|
|||||||||
|
Number of landfills owned or operated
|
189
|
|
190
|
|
191
|
|
|||||
|
Net investment, excluding non-depletable land (in millions)
|
$
|
3,348.7
|
|
$
|
3,305.0
|
|
$
|
3,256.1
|
|
||
|
Total estimated available disposal capacity (in millions of cubic yards)
|
4,845.8
|
|
4,873.5
|
|
4,822.9
|
|
|||||
|
Net investment per cubic yard
|
$
|
0.69
|
|
$
|
0.68
|
|
$
|
0.68
|
|
||
|
Landfill depletion and amortization expense (in millions)
|
$
|
263.0
|
|
$
|
261.9
|
|
$
|
257.6
|
|
||
|
Accretion expense (in millions)
|
78.0
|
|
76.6
|
|
78.4
|
|
|||||
|
341.0
|
|
338.5
|
|
336.0
|
|
||||||
|
Airspace consumed (in millions of cubic yards)
|
74.6
|
|
73.3
|
|
73.6
|
|
|||||
|
Depletion, amortization and accretion expense per cubic yard of airspace consumed
|
$
|
4.57
|
|
$
|
4.62
|
|
$
|
4.57
|
|
||
During 2014 and 2013, our average compaction rate was approximately 2,000 pounds per cubic yard based on a three-year historical moving average.
As of December 31, 2014, we expect to spend an estimated additional $
7.7 billion
on existing landfills, primarily related to cell construction and environmental structures, over their remaining lives. Our total expected investment, excluding non-depletable land, estimated to be $
11.1 billion
, or $
2.29
per cubic yard, is used in determining our depletion and amortization expense based on airspace consumed using the units-of-consumption method.
45
Property and Equipment
The following tables reflect the activity in our property and equipment accounts for the years ended December 31, 2014, 2013 and 2012 (in millions of dollars):
|
|
Gross Property and Equipment
|
||||||||||||||||||||||||||||||
|
|
Balance
as of
December 31,
2013
|
Capital
Additions
|
Retirements
|
Acquisitions,
Net of
Divestitures
|
Non-Cash
Additions
for Asset
Retirement
Obligations
|
Adjustments
for
Asset
Retirement
Obligations
|
Impairments,
Transfers
and
Other
Adjustments
|
Balance
as of
December 31,
2014
|
|||||||||||||||||||||||
|
Land
|
$
|
377.6
|
|
$
|
0.7
|
|
$
|
(2.8
|
)
|
$
|
25.7
|
|
$
|
—
|
|
$
|
—
|
|
$
|
0.1
|
|
$
|
401.3
|
|
|||||||
|
Non-depletable landfill land
|
164.2
|
|
—
|
|
(2.0
|
)
|
—
|
|
—
|
|
—
|
|
—
|
|
162.2
|
|
|||||||||||||||
|
Landfill development costs
|
5,392.7
|
|
4.9
|
|
(0.3
|
)
|
26.6
|
|
38.6
|
|
(12.2
|
)
|
195.0
|
|
5,645.3
|
|
|||||||||||||||
|
Vehicles and equipment
|
5,403.7
|
|
530.4
|
|
(155.3
|
)
|
39.1
|
|
—
|
|
—
|
|
16.2
|
|
5,834.1
|
|
|||||||||||||||
|
Buildings and improvements
|
935.6
|
|
28.9
|
|
(3.3
|
)
|
11.3
|
|
—
|
|
—
|
|
29.8
|
|
1,002.3
|
|
|||||||||||||||
|
Construction-in-progress -
landfill
|
72.5
|
|
261.5
|
|
—
|
|
—
|
|
—
|
|
—
|
|
(193.2
|
)
|
140.8
|
|
|||||||||||||||
|
Construction-in-progress -
other
|
13.3
|
|
48.7
|
|
—
|
|
—
|
|
—
|
|
—
|
|
(51.9
|
)
|
10.1
|
|
|||||||||||||||
|
Total
|
$
|
12,359.6
|
|
$
|
875.1
|
|
$
|
(163.7
|
)
|
$
|
102.7
|
|
$
|
38.6
|
|
$
|
(12.2
|
)
|
$
|
(4.0
|
)
|
$
|
13,196.1
|
|
|||||||
|
|
Accumulated Depreciation, Amortization and Depletion
|
||||||||||||||||||||||||||
|
|
Balance
as of
December 31,
2013
|
Additions
Charged
to
Expense
|
Retirements
|
Acquisitions,
Net of
Divestitures
|
Adjustments
for
Asset
Retirement
Obligations
|
Impairments,
Transfers
and
Other
Adjustments
|
Balance
as of
December 31,
2014
|
||||||||||||||||||||
|
Landfill development costs
|
$
|
(2,160.2
|
)
|
$
|
(276.5
|
)
|
$
|
0.1
|
|
$
|
—
|
|
$
|
(0.8
|
)
|
$
|
—
|
|
$
|
(2,437.4
|
)
|
||||||
|
Vehicles and equipment
|
(2,883.8
|
)
|
(535.0
|
)
|
145.4
|
|
—
|
|
—
|
|
0.1
|
|
(3,273.3
|
)
|
|||||||||||||
|
Buildings and improvements
|
(278.8
|
)
|
(42.6
|
)
|
1.1
|
|
—
|
|
—
|
|
0.2
|
|
(320.1
|
)
|
|||||||||||||
|
Total
|
$
|
(5,322.8
|
)
|
$
|
(854.1
|
)
|
$
|
146.6
|
|
$
|
—
|
|
$
|
(0.8
|
)
|
$
|
0.3
|
|
$
|
(6,030.8
|
)
|
||||||
|
|
Gross Property and Equipment
|
||||||||||||||||||||||||||||||
|
|
Balance
as of
December 31,
2012
|
Capital
Additions
|
Retirements
|
Acquisitions,
Net of
Divestitures
|
Non-Cash
Additions
for Asset
Retirement
Obligations
|
Adjustments
for
Asset
Retirement
Obligations
|
Impairments,
Transfers
and
Other
Adjustments
|
Balance
as of
December 31,
2013
|
|||||||||||||||||||||||
|
Land
|
$
|
376.9
|
|
$
|
0.1
|
|
$
|
(1.1
|
)
|
$
|
—
|
|
$
|
—
|
|
$
|
—
|
|
$
|
1.7
|
|
$
|
377.6
|
|
|||||||
|
Non-depletable landfill land
|
166.0
|
|
2.3
|
|
(4.3
|
)
|
—
|
|
—
|
|
—
|
|
0.2
|
|
164.2
|
|
|||||||||||||||
|
Landfill development costs
|
5,018.0
|
|
2.6
|
|
—
|
|
—
|
|
36.5
|
|
12.0
|
|
323.6
|
|
5,392.7
|
|
|||||||||||||||
|
Vehicles and equipment
|
4,946.4
|
|
546.9
|
|
(144.6
|
)
|
18.0
|
|
—
|
|
—
|
|
37.0
|
|
5,403.7
|
|
|||||||||||||||
|
Buildings and improvements
|
864.2
|
|
28.9
|
|
(2.0
|
)
|
0.1
|
|
—
|
|
—
|
|
44.4
|
|
935.6
|
|
|||||||||||||||
|
Construction-in-progress -
landfill
|
134.5
|
|
259.5
|
|
—
|
|
—
|
|
—
|
|
—
|
|
(321.5
|
)
|
72.5
|
|
|||||||||||||||
|
Construction-in-progress -
other
|
53.3
|
|
42.3
|
|
—
|
|
—
|
|
—
|
|
—
|
|
(82.3
|
)
|
13.3
|
|
|||||||||||||||
|
Total
|
$
|
11,559.3
|
|
$
|
882.6
|
|
$
|
(152.0
|
)
|
$
|
18.1
|
|
$
|
36.5
|
|
$
|
12.0
|
|
$
|
3.1
|
|
$
|
12,359.6
|
|
|||||||
|
|
Accumulated Depreciation, Amortization and Depletion
|
||||||||||||||||||||||||||
|
|
Balance
as of
December 31,
2012
|
Additions
Charged
to
Expense
|
Retirements
|
Acquisitions,
Net of
Divestitures
|
Adjustments
for
Asset
Retirement
Obligations
|
Impairments,
Transfers
and
Other
Adjustments
|
Balance
as of
December 31,
2013
|
||||||||||||||||||||
|
Landfill development costs
|
$
|
(1,896.4
|
)
|
$
|
(262.2
|
)
|
$
|
—
|
|
$
|
—
|
|
$
|
0.3
|
|
$
|
(1.9
|
)
|
$
|
(2,160.2
|
)
|
||||||
|
Vehicles and equipment
|
(2,512.3
|
)
|
(507.7
|
)
|
135.8
|
|
—
|
|
—
|
|
0.4
|
|
(2,883.8
|
)
|
|||||||||||||
|
Buildings and improvements
|
(240.3
|
)
|
(39.7
|
)
|
1.5
|
|
—
|
|
—
|
|
(0.3
|
)
|
(278.8
|
)
|
|||||||||||||
|
Total
|
$
|
(4,649.0
|
)
|
$
|
(809.6
|
)
|
$
|
137.3
|
|
$
|
—
|
|
$
|
0.3
|
|
$
|
(1.8
|
)
|
$
|
(5,322.8
|
)
|
||||||
46
|
|
Gross Property and Equipment
|
||||||||||||||||||||||||||||||
|
|
Balance
as of
December 31,
2011
|
Capital
Additions
|
Retirements
|
Acquisitions,
Net of
Divestitures
|
Non-Cash
Additions
for Asset
Retirement
Obligations
|
Adjustments
for
Asset
Retirement
Obligations
|
Impairments,
Transfers
and
Other
Adjustments
|
Balance
as of
December 31,
2012
|
|||||||||||||||||||||||
|
Land
|
$
|
375.1
|
|
$
|
—
|
|
$
|
(1.9
|
)
|
$
|
3.7
|
|
$
|
—
|
|
$
|
—
|
|
$
|
—
|
|
$
|
376.9
|
|
|||||||
|
Non-depletable landfill land
|
161.8
|
|
3.3
|
|
(0.3
|
)
|
—
|
|
—
|
|
—
|
|
1.2
|
|
166.0
|
|
|||||||||||||||
|
Landfill development costs
|
4,763.3
|
|
8.0
|
|
—
|
|
(0.3
|
)
|
33.8
|
|
(4.6
|
)
|
217.8
|
|
5,018.0
|
|
|||||||||||||||
|
Vehicles and equipment
|
4,515.1
|
|
478.1
|
|
(98.7
|
)
|
12.5
|
|
—
|
|
—
|
|
39.4
|
|
4,946.4
|
|
|||||||||||||||
|
Buildings and improvements
|
802.8
|
|
30.7
|
|
(14.3
|
)
|
7.4
|
|
—
|
|
—
|
|
37.6
|
|
864.2
|
|
|||||||||||||||
|
Construction-in-progress -
landfill
|
187.3
|
|
263.2
|
|
—
|
|
—
|
|
—
|
|
—
|
|
(316.0
|
)
|
134.5
|
|
|||||||||||||||
|
Construction-in-progress -
other
|
47.3
|
|
83.4
|
|
—
|
|
—
|
|
—
|
|
—
|
|
(77.4
|
)
|
53.3
|
|
|||||||||||||||
|
Total
|
$
|
10,852.7
|
|
$
|
866.7
|
|
$
|
(115.2
|
)
|
$
|
23.3
|
|
$
|
33.8
|
|
$
|
(4.6
|
)
|
$
|
(97.4
|
)
|
$
|
11,559.3
|
|
|||||||
|
|
Accumulated Depreciation, Amortization and Depletion
|
||||||||||||||||||||||||||
|
|
Balance
as of
December 31,
2011
|
Additions
Charged
to
Expense
|
Retirements
|
Acquisitions,
Net of
Divestitures
|
Adjustments
for
Asset
Retirement
Obligations
|
Impairments,
Transfers
and
Other
Adjustments
|
Balance
as of
December 31,
2012
|
||||||||||||||||||||
|
Landfill development costs
|
$
|
(1,735.7
|
)
|
$
|
(252.7
|
)
|
$
|
—
|
|
$
|
0.3
|
|
$
|
(4.7
|
)
|
$
|
96.4
|
|
$
|
(1,896.4
|
)
|
||||||
|
Vehicles and equipment
|
(2,119.1
|
)
|
(486.6
|
)
|
91.6
|
|
1.5
|
|
—
|
|
0.3
|
|
(2,512.3
|
)
|
|||||||||||||
|
Buildings and improvements
|
(205.6
|
)
|
(37.0
|
)
|
2.2
|
|
0.3
|
|
—
|
|
(0.2
|
)
|
(240.3
|
)
|
|||||||||||||
|
Total
|
$
|
(4,060.4
|
)
|
$
|
(776.3
|
)
|
$
|
93.8
|
|
$
|
2.1
|
|
$
|
(4.7
|
)
|
$
|
96.5
|
|
$
|
(4,649.0
|
)
|
||||||
Liquidity and Capital Resources
The major components of changes in cash flows for 2014, 2013 and 2012 are discussed below. The following table summarizes our cash flow from operating activities, investing activities and financing activities for the years ended
December 31, 2014
,
2013
and
2012
(in millions of dollars):
|
2014
|
2013
|
2012
|
|||||||||
|
Net cash provided by operating activities
|
$
|
1,529.8
|
|
$
|
1,548.2
|
|
$
|
1,513.8
|
|
||
|
Net cash used in investing activities
|
(959.8
|
)
|
(933.9
|
)
|
(937.5
|
)
|
|||||
|
Net cash used in financing activities
|
(708.1
|
)
|
(468.6
|
)
|
(575.0
|
)
|
|||||
Cash Flows Provided by Operating Activities
The most significant items affecting the comparison of our operating cash flows for
2014
and
2013
are summarized below:
Changes in assets and liabilities, net of effects of business acquisitions and divestitures, decreased our cash flow from operations by
$295.6 million
in 2014 compared to a decrease of $256.6 million in 2013, primarily as a result of the following:
|
•
|
Our accounts receivable, exclusive of the change in allowance for doubtful accounts and customer credits, increased $54.3 million during 2014 due to the timing of billings, net of collections, compared to a $61.6 million increase in 2013. As of December 31, 2014 and 2013, our days sales outstanding was 38 days, or 25 and 26, respectively, net of deferred revenue.
|
|
•
|
Our prepaid expenses and other assets increased $41.3 million during 2014, which is primarily due to the timing of withdrawals to fund payroll, compared to an $11.4 million increase in 2013.
|
|
•
|
Cash paid for income taxes was approximately
$382 million
and $288 million for 2014 and 2013, respectively. The increase was primarily due to higher expected taxable income and the related deductible timing differences associated with certain remediation charges.
|
|
•
|
Our accounts payable increased $3.3 million and $37.9 million during 2014 and 2013, respectively, due to the timing of payments.
|
47
|
•
|
Cash paid for restructuring expenditures was $14.5 million lower during 2014 compared to 2013 due to the expiration of severance and other employee termination benefits, relocation benefits and the closure of offices with lease agreements with non-cancelable terms associated with our restructuring activities during the fourth quarter of 2012.
|
|
•
|
Cash paid for capping, closure and post-closure obligations was
$31.0 million
lower during 2014 compared to 2013 primarily due to a $17.8 million payment to settle our post-closure liability for one of our divested closed landfill sites in 2013.
|
|
•
|
Cash paid for remediation obligations was
$23.1 million
lower during 2014 compared to 2013 primarily due to remediation activity at our closed Bridgeton Landfill in Missouri.
|
|
•
|
Our other liabilities decreased $48.0 million during 2014, which is primarily due to the timing of payment for certain tax related accruals and other accrued expenses, as compared to a $2.4 million increase in 2013.
|
The most significant items affecting the comparison of our operating cash flows for
2013
and
2012
are summarized below:
Changes in assets and liabilities, net of effects of business acquisitions and divestitures, decreased our cash flow from operations by $256.6 million in 2013 compared to a decrease of $377.0 million in 2012, primarily as a result of the following:
|
•
|
Our accounts receivable, exclusive of the change in allowance for doubtful accounts and customer credits, increased $61.6 million during 2013 due to the timing of billings, net of collections, as compared to a $37.2 million increase in 2012. As of December 31, 2013 and 2012, the number of days our sales were outstanding were 38 days, or 25 net of deferred revenue.
|
|
•
|
Cash paid for income taxes was $288 million and $185 million for 2013 and 2012, respectively.
|
|
•
|
Our accounts payable increased $37.9 million during 2013 due to the timing of payments, as compared to a $49.6 million decrease in 2012.
|
|
•
|
We paid $15.8 million during 2013 related to a restructuring announced during the fourth quarter of 2012. During 2012, we paid synergy incentive plan bonuses of $68.1 million. We also paid $2.2 million during 2012 in connection with the restructuring announced in the fourth quarter of 2012.
|
|
•
|
Cash paid for capping, closure and post-closure obligations was $8.0 million higher during 2013 compared to 2012, primarily due to a $17.8 million payment to settle our post-closure liability for one of our closed landfill sites.
|
|
•
|
Cash paid for remediation obligations was $49.4 million higher during 2013 compared to 2012, primarily due to remediation work performed at our closed Bridgeton Landfill in Missouri.
|
|
•
|
Our other liabilities increased $16.9 million during 2013, which is primarily due to the timing of payment for certain payroll related accruals and other accrued expenses, as compared to a $55.3 million decrease in 2012.
|
Cash Flows Used in Investing Activities
The most significant items affecting the comparison of our cash flows used in investing activities are summarized below:
|
•
|
Capital expenditures during 2014 were
$862.5 million
compared with $880.8 million for 2013 and $903.5 million for 2012. Property and equipment received during 2014, 2013 and 2012 was
$872.9 million
, $879.8 million and $866.7 million, respectively.
|
|
•
|
Proceeds from sales of property and equipment during 2014 were
$35.7 million
compared to $23.9 million for 2013 and $28.7 million for 2012.
|
|
•
|
During 2014, we paid
$195.7 million
for acquisitions of collection, landfill, transfer station and recycling businesses in all three regions. During 2013, we paid $68.7 million for acquisitions of collection businesses in all three regions. During 2012, we paid $95.3 million for acquisitions of collection, recycling and transfer station businesses in all three regions. In addition, during 2014, 2013 and 2012, we paid $8.0 million, $4.9 million and $0.2 million, respectively, in relation to holdback liabilities resulting from acquisitions.
|
|
•
|
Decreases (increases) in our restricted cash and marketable securities balances were
$70.8 million
, $(5.5) million and $23.2 million for 2014, 2013 and 2012, respectively. Changes in restricted cash and marketable securities are primarily related to the issuance of tax-exempt bonds for our capital needs, collateral for certain of our obligations and amounts held in trust as a guarantee of performance. Funds received from issuances of tax-exempt bonds are deposited directly into trust accounts by the bonding authority at the time of issuance. The decrease of
$70.8 million
during 2014 was due to a release of restricted investments related to a change in certain of our closure and post-closure obligation requirements and a release of restricted investments related to our insurance programs. The increase of $5.5
|
48
million during 2013 is primarily due to investments in restricted cash related to our insurance program. We received $50.0 million, $25.0 million and $24.7 million in connection with an issuance of tax-exempt bonds during 2014, 2013 and 2012, respectively. Reimbursements from the trust for qualifying expenditures or for repayments of the related tax-exempt bonds are presented as cash provided by investing activities in our consolidated statements of cash flows. Such reimbursements amounted to $51.1 million, $27.8 million and $22.4 million during 2014, 2013 and 2012, respectively. During 2012, we paid $29.5 million to settle a legal matter that was funded through a restricted escrow account in 2011.
We intend to finance capital expenditures and acquisitions through cash on hand, restricted cash held for capital expenditures, cash flows from operations, our revolving credit facilities, and tax-exempt bonds and other financings. We expect to use primarily cash for consideration paid for future business acquisitions.
Cash Flows Used in Financing Activities
The most significant items affecting the comparison of our cash flows used in financing activities are summarized below:
|
•
|
Payments of notes payable and long-term debt, net of proceeds were
$15.1 million
during 2014 compared to net payments of $58.9 million during 2013 and net proceeds of $50.8 million during 2012. For a more detailed discussion, see the
"Financial Condition"
section of this Management’s Discussion and Analysis of Financial Condition and Results of Operations.
|
|
•
|
Cash premiums and fees paid in connection with the issuance of our debt and to settle certain hedging relationships were
$4.0 million
, $1.6 million and $43.3 million for 2014, 2013 and 2012, respectively. For a more detailed discussion, see our
"Financial Condition"
section of this Management’s Discussion and Analysis of Financial Condition and Results of Operations.
|
|
•
|
In October 2013, our board of directors added $650.0 million to the existing share repurchase authorization originally approved in November 2010. As of December 31, 2014, there were $360.2 million remaining under our share repurchase authorization. From November 2010 to December 31, 2014, we repurchased
46.6 million
shares of our stock for $
1,439.5 million
at a weighted average cost per share of
$30.88
. During 2014, we repurchased
11.1 million
shares of our stock for
$400.4 million
. During 2013, we repurchased 6.5 million shares for $213.6 million. During 2012, we repurchased 11.8 million shares for $324.7 million. During 2015, we expect to use our remaining authorization to repurchase more of our outstanding common stock.
|
|
•
|
In July 2014, our board of directors approved an increase to our quarterly dividend to $0.28 per share. Prior to this increase, the board of directors approved an increase in the quarterly dividend to $0.26 per share and $0.235 per share in July 2013 and July 2012, respectively. Dividends paid were
$378.6 million
, $348.5 million and $329.1 million for 2014, 2013 and 2012, respectively.
|
Financial Condition
Cash and Cash Equivalents
As of December 31, 2014, we had $
75.2 million
of cash and cash equivalents and $
115.6 million
of restricted cash deposits and restricted marketable securities, including
$20.9 million
of restricted cash and marketable securities held for capital expenditures under certain debt facilities, $16.8 million pursuant to a holdback arrangement,
$26.7 million
of restricted cash and marketable securities pledged to regulatory agencies and governmental entities as financial guarantees of our performance related to our final capping, closure and post-closure obligations at our landfills and
$50.4 million
of restricted cash and marketable securities related to our insurance obligations.
We intend to use excess cash on hand and cash from operating activities to fund capital expenditures, acquisitions, dividend payments, share repurchases and debt repayments. Debt repayments may include purchases of our outstanding indebtedness in the secondary market or otherwise. We believe that our excess cash, cash from operating activities and our availability to draw from our credit facilities provide us with sufficient financial resources to meet our anticipated capital requirements and maturing obligations as they come due.
In the future we may choose to voluntarily retire certain portions of our outstanding debt before their maturity dates using cash from operations or additional borrowings. We also may explore opportunities in the capital markets to fund redemptions should market conditions be favorable. Early extinguishment of debt will result in an impairment charge in the period in which the debt is repaid. The loss on early extinguishment of debt relates to premiums paid to effectuate the repurchase and the relative portion of unamortized note discounts and debt issue costs.
49
Credit Facilities
In June 2014, we entered into a $1.25 billion unsecured revolving credit facility (the Replacement Credit Facility), which replaced our $1.0 billion credit facility maturing in April 2016. The Replacement Credit Facility matures in June 2019 and includes a feature that allows us to increase availability, at our option, by an aggregate amount up to $500.0 million through increased commitments from existing lenders or the addition of new lenders. At our option, borrowings under the Replacement Credit Facility bear interest at a Base Rate, or a Eurodollar Rate, plus an applicable margin based on our Debt Ratings (all as defined in the agreements).
Contemporaneous with the execution of the Replacement Credit Facility, we entered into Amendment No. 3 to our existing $1.25 billion unsecured credit facility (the Existing Credit Facility and, together with the Replacement Credit Facility, the Credit Facilities), to reduce the commitments under the Existing Credit Facility to $1.0 billion and conform certain terms of the Existing Credit Facility with those of the Replacement Credit Facility. Amendment No. 3 does not extend the maturity date of the Existing Credit Facility, which matures in May 2017. The Existing Credit Facility also maintains the feature that allows us to increase availability, at our option, by an aggregate amount of up to $500.0 million, through increased commitments from existing lenders or the addition of new lenders.
The credit agreements require us to comply with certain financial and other covenants. We may pay dividends and repurchase common stock if we are in compliance with these covenants. Compliance with covenants is a condition for any incremental borrowings under our Credit Facilities and failure to meet these covenants would enable the lenders to require repayment of any outstanding loans (which would adversely affect our liquidity). As of December 31, 2014, our EBITDA to interest ratio was 6.37 compared to the 3.00 minimum required by the covenants, and our total debt to EBITDA ratio was 3.16 compared to the 3.75 maximum allowed by the covenants. In connection with entering into the Replacement Credit Facility and Amendment No. 3 to the Existing Credit Facility, our maximum total debt to EBITDA ratio was increased to 3.75 for each fiscal quarter ending before and including December 31, 2015, and 3.50 for each fiscal quarter ending thereafter. As of
December 31, 2014
, we were in compliance with the covenants under our Credit Facilities, and we expect to be in compliance throughout 2015.
EBITDA, which is a non-U.S. GAAP measure, is calculated as defined in our Credit Facility agreements. In this context, EBITDA is used solely to provide information regarding the extent to which we are in compliance with debt covenants and is not comparable to EBITDA used by other companies or used by us for other purposes.
Availability under our Credit Facilities totaled
$1,615.4 million
and
$1,527.9 million
as of December 31, 2014 and 2013, respectively, and can be used for working capital, capital expenditures, letters of credit and other general corporate purposes. As of
December 31, 2014
and 2013, we had no borrowings under our Credit Facilities. We had
$615.1 million
and $
722.1 million
of letters of credit outstanding under our Credit Facilities as of
December 31, 2014
and
2013
, respectively.
We have a
$125.0 million
unsecured credit facility agreement (the Uncommitted Credit Facility) bearing interest at LIBOR, plus an applicable margin. Our Uncommitted Credit Facility is subject to facility fees defined in the agreement, regardless of usage. We can use borrowings under the Uncommitted Credit Facility for working capital and other general corporate purposes. The agreements governing our Uncommitted Credit Facility require us to comply with covenants. The Uncommitted Credit Facility may be terminated by either party at any time. As of
December 31, 2014
and
2013
, we had no borrowings under our Uncommitted Credit Facility. The Uncommitted Credit Facility may be terminated at any time by either party.
In January 2015, we entered into a
$20.0 million
uncommitted credit facility agreement (the Puerto Rico Facility) that matures in 2016 and bears interest at LIBOR plus an applicable margin. We can use borrowings under the Puerto Rico Facility for working capital and other general corporate purposes.
Senior Notes and Debentures
As of
December 31, 2014
and
2013
, we had $5,863.6 million and $5,844.4 million, respectively, of unsecured senior notes and debentures outstanding with maturities ranging from 2018 to 2041.
Interest Rate Swap Agreements
During the second half of 2013, we entered into various interest rate swap agreements relative to our 4.750% fixed rate senior notes due in May 2023. These transactions were entered into to reduce overall borrowing costs and rebalance our debt portfolio's ratio of fixed to floating interest rates. As of
December 31, 2014
, our outstanding swap agreements have a total notional value of $300.0 million and require us to pay interest at floating rates based on changes in LIBOR, and receive interest at a fixed rate of 4.750%. For the years ended
December 31, 2014
and
2013
, we recognized
$7.7 million
and
$2.0 million
, respectively, as offsetting benefits to our interest expense from these swap agreements, which mature in May 2023.
50
Tax-Exempt Financings
As of
December 31, 2014
and
2013
, we had
$1,083.8 million
and $1,087.7 million, respectively, of fixed and variable rate tax-exempt financings outstanding with maturities ranging from 2015 to 2044. Approximately 90% of our tax-exempt financings are remarketed quarterly by remarketing agents to effectively maintain a variable yield. The holders of the bonds can put them back to the remarketing agents at the end of each interest period. To date, the remarketing agents have been able to remarket our variable rate unsecured tax-exempt bonds. These bonds have been classified as long-term because of our ability and intent to refinance them using availability under our Credit Facilities, if necessary.
As of
December 31, 2014
, we had
$115.6 million
of restricted cash and marketable securities, of which
$20.9 million
represented proceeds from the issuance of tax-exempt bonds and other tax-exempt financings and will be used to fund capital expenditures under the terms of the agreements. Restricted cash and marketable securities also include amounts held in trust as a financial guarantee of our performance.
Fuel Hedges
We use derivative instruments designated as cash flow hedges to manage our exposure to changes in diesel fuel prices. We have entered into multiple agreements related to forecasted diesel fuel purchases. The agreements qualified for, and were designated as, effective hedges of changes in the prices of forecasted diesel fuel purchases (fuel hedges). For a summary of our outstanding fuel hedges as of
December 31, 2014
, see Note 16,
Financial Instruments
, to our consolidated financial statements in Item 8 of this Form 10-K.
The aggregate fair values of our outstanding fuel hedges as of
December 31, 2014
and
2013
were current liabilities of
$34.4 million
and
$0.1 million
, respectively, and current assets of
$6.7 million
as of
December 31, 2013
, and have been recorded in other accrued liabilities and prepaid expenses and other current assets in our consolidated balance sheets, respectively.
The effective portions of the changes in fair values as of
December 31, 2014
and
2013
, net of tax, of $20.3 million and $3.9 million, respectively, have been recorded in stockholders’ equity as components of accumulated other comprehensive income.
During
2014
, approximately
20%
of our fuel volume purchases were hedged with swap agreements and we were able to recover approximately
78%
of our fuel costs with fuel recovery fees from customers. During
2013
, approximately 19% of our fuel volume purchases were hedged with swap agreements and we were able to recover approximately 74% of our fuel costs with fuel recovery fees from certain of our customers.
Recycling Commodity Hedges
Revenue from the sale of recycled commodities is primarily from sales of old corrugated cardboard and old newspaper. We use derivative instruments such as swaps and costless collars designated as cash flow hedges to manage our exposure to changes in prices of these commodities. We have entered into multiple agreements related to forecasted old corrugated cardboard and old newspaper sales. These agreements qualified for, and were designated as, effective hedges of changes in the prices of certain forecasted recycling commodity sales (recycling commodity hedges). For a discussion of our outstanding recycling commodity hedges as of
December 31, 2013
, see Note 16,
Financial Instruments,
to our consolidated financial statements in Item 8 of this Form 10-K.
We had no outstanding recycling commodity hedges as of
December 31, 2014
. The aggregate fair values of the outstanding recycling commodity hedges as of December 31,
2013
were current assets of
$0.3 million
and current liabilities of
$0.6 million
, and have been recorded in other current assets and other accrued liabilities in our consolidated balance sheets, respectively.
The effective portion of the change in fair value of our recycling commodity hedges as of
December 31, 2013
, net of tax, of $0.2 million has been recorded in stockholders’ equity as a component of accumulated other comprehensive income.
For
2014
and
2013
, approximately
6%
and 24% of our sales volume of commodities were subject to cash flow hedges, respectively.
51
Contractual Obligations
The following table summarizes our contractual obligations as of
December 31, 2014
(in millions):
|
Year Ending
December 31,
|
Operating
Leases
|
Maturities of
Notes Payable,
Capital Leases
and Other Long-
Term Debt
|
Scheduled Interest Payment Obligations
|
Final Capping,
Closure and
Post-Closure
|
Remediation
|
Unconditional
Purchase
Commitments
|
Total
|
|||||||||||||||||||||
|
2015
|
$
|
24.4
|
|
$
|
9.5
|
|
$
|
305.3
|
|
$
|
87.9
|
|
$
|
76.4
|
|
$
|
236.4
|
|
$
|
739.9
|
|
|||||||
|
2016
|
20.5
|
|
4.5
|
|
305.1
|
|
121.5
|
|
76.6
|
|
76.3
|
|
604.5
|
|
||||||||||||||
|
2017
|
19.4
|
|
4.9
|
|
304.9
|
|
88.7
|
|
55.5
|
|
71.5
|
|
544.9
|
|
||||||||||||||
|
2018
|
16.8
|
|
705.5
|
|
291.4
|
|
78.0
|
|
56.0
|
|
38.7
|
|
1,186.4
|
|
||||||||||||||
|
2019
|
13.2
|
|
689.7
|
|
277.9
|
|
92.2
|
|
43.9
|
|
34.1
|
|
1,151.0
|
|
||||||||||||||
|
Thereafter
|
56.5
|
|
5,709.8
|
|
2,377.0
|
|
5,224.6
|
|
406.2
|
|
494.4
|
|
14,268.5
|
|
||||||||||||||
|
Total
|
$
|
150.8
|
|
$
|
7,123.9
|
|
$
|
3,861.6
|
|
$
|
5,692.9
|
|
$
|
714.6
|
|
$
|
951.4
|
|
$
|
18,495.2
|
|
|||||||
Scheduled interest payment obligations in the above table were calculated using stated coupon rates for fixed rate debt and interest rates applicable as of
December 31, 2014
for variable rate debt. The impact of our outstanding interest rate swaps on the interest payments of our 4.750% fixed rate senior notes is also included based on the floating rates in effect as of
December 31, 2014
.
The present value of capital lease obligations is included in our consolidated balance sheets.
The estimated remaining final capping, closure and post-closure and remediation expenditures presented above are not inflated or discounted and reflect the estimated future payments for liabilities incurred and recorded as of
December 31, 2014
.
Unconditional purchase commitments consist primarily of (1) disposal related agreements that include fixed or minimum royalty payments, host agreements and take-or-pay and put-or-pay agreements and (2) other obligations including committed capital expenditures and consulting service agreements.
Debt Covenants
Our Credit Facilities contain financial covenants. We can pay dividends and repurchase common stock if we are in compliance with these covenants. As of
December 31, 2014
, we were in compliance with all financial and other covenants under our Credit Facilities. We were also in compliance with the non-financial covenants in the indentures relating to our senior notes as of
December 31, 2014
. We expect to be in compliance with our covenants during
2015
.
Failure to comply with the financial and other covenants under our Credit Facilities, as well as the occurrence of certain material adverse events, would constitute defaults and would allow the lenders under our Credit Facilities to accelerate the maturity of all indebtedness under the related agreements. This could also have an adverse impact on the availability of financial assurances. In addition, maturity acceleration on our Credit Facilities constitutes an event of default under our other debt instruments, including our senior notes, and, therefore, our senior notes would also be subject to acceleration of maturity. If such acceleration were to occur, we would not have sufficient liquidity available to repay the indebtedness. We would likely have to seek an amendment under our Credit Facilities for relief from the financial covenants or repay the debt with proceeds from the issuance of new debt or equity, or asset sales, if necessary. We may be unable to amend our Credit Facilities or raise sufficient capital to repay such obligations in the event the maturities are accelerated.
Financial Assurance
We must provide financial assurance to governmental agencies and a variety of other entities under applicable environmental regulations relating to our landfill operations for capping, closure and post-closure costs, and related to our performance under certain collection, landfill and transfer station contracts. We satisfy these financial assurance requirements by providing surety bonds, letters of credit, or insurance policies (Financial Assurance Instruments), or trust deposits, which are included in restricted cash and marketable securities and other assets in our consolidated balance sheets. The amount of the financial assurance requirements for capping, closure and post-closure costs is determined by applicable state environmental regulations. The financial assurance requirements for capping, closure and post-closure costs may be associated with a portion of the landfill or the entire landfill. Generally, states require a third-party engineering specialist to determine the estimated capping, closure and post-closure costs that are used to determine the required amount of financial assurance for a landfill. The amount of
52
financial assurance required can, and generally will, differ from the obligation determined and recorded under U.S. GAAP. The amount of the financial assurance requirements related to contract performance varies by contract. Additionally, we must provide financial assurance for our insurance program and collateral for certain performance obligations. We do not expect a material increase in financial assurance requirements during
2015
, although the mix of Financial Assurance Instruments may change.
These Financial Assurance Instruments are issued in the normal course of business and are not considered indebtedness. Because we currently have no liability for the Financial Assurance Instruments, they are not reflected in our consolidated balance sheets; however, we record capping, closure and post-closure liabilities and insurance liabilities as they are incurred. The underlying obligations of the Financial Assurance Instruments, in excess of those already reflected in our consolidated balance sheets, would be recorded if it is probable that we would be unable to fulfill our related obligations. We do not expect this to occur.
Off-Balance Sheet Arrangements
We have no off-balance sheet debt or similar obligations, other than operating leases and financial assurances, which are not classified as debt. We have no transactions or obligations with related parties that are not disclosed, consolidated into or reflected in our reported financial position or results of operations. We have not guaranteed any third-party debt.
Free Cash Flow
We define free cash flow, which is not a measure determined in accordance with U.S. GAAP, as cash provided by operating activities less purchases of property and equipment, plus proceeds from sales of property and equipment, as presented in our consolidated statements of cash flows.
The following table calculates our free cash flow for the years ended
December 31, 2014
,
2013
and
2012
(in millions of dollars):
|
2014
|
2013
|
2012
|
|||||||||
|
Cash provided by operating activities
|
$
|
1,529.8
|
|
$
|
1,548.2
|
|
$
|
1,513.8
|
|
||
|
Purchases of property and equipment
|
(862.5
|
)
|
(880.8
|
)
|
(903.5
|
)
|
|||||
|
Proceeds from sales of property and equipment
|
35.7
|
|
23.9
|
|
28.7
|
|
|||||
|
Free cash flow
|
$
|
703.0
|
|
$
|
691.3
|
|
$
|
639.0
|
|
||
For a discussion of the changes in the components of free cash flow, you should read our discussion regarding
Cash Flows Provided By Operating Activities and Cash Flows Used In Investing Activities
contained elsewhere in this Management's Discussion and Analysis of Financial Condition and Results of Operations.
Purchases of property and equipment as reflected in our consolidated statements of cash flows and as presented in the free cash flow table above represent amounts paid during the period for such expenditures. The following table reconciles property and equipment reflected in the consolidated statements of cash flows to property and equipment received for the years ended
December 31, 2014
,
2013
and
2012
as follows (in millions of dollars):
|
2014
|
2013
|
2012
|
|||||||||
|
Purchases of property and equipment per the consolidated statements of cash
flows
|
$
|
862.5
|
|
$
|
880.8
|
|
$
|
903.5
|
|
||
|
Adjustments for property and equipment received during the prior period but
paid for in the following period, net
|
10.4
|
|
(1.0
|
)
|
(36.8
|
)
|
|||||
|
Property and equipment received during the period
|
$
|
872.9
|
|
$
|
879.8
|
|
$
|
866.7
|
|
||
The adjustments noted above do not affect our net change in cash and cash equivalents as reflected in our consolidated statements of cash flows.
We believe that presenting free cash flow provides useful information regarding our recurring cash provided by operating activities after expenditures for property and equipment received, plus proceeds from sales of property and equipment. It also demonstrates our ability to execute our financial strategy, which includes reinvesting in existing capital assets to ensure a high level of customer service, investing in capital assets to facilitate growth in our customer base and services provided, maintaining our investment grade credit rating and minimizing debt, paying cash dividends and repurchasing common stock, and maintaining and improving our market position through business optimization. In addition, free cash flow is a key metric
53
used to determine compensation. The presentation of free cash flow has material limitations. Free cash flow does not represent our cash flow available for discretionary expenditures because it excludes certain expenditures that are required or that we have committed to such as debt service requirements and dividend payments. Our definition of free cash flow may not be comparable to similarly titled measures presented by other companies.
Contingencies
For a description of our commitments and contingencies, see Note 8,
Landfill and Environmental Costs
, Note 10,
Income Taxes,
and Note 17,
Commitments and Contingencies
, to our consolidated financial statements in Item 8 of this Form 10-K.
Critical Accounting Judgments and Estimates
Our consolidated financial statements have been prepared in accordance with U.S. GAAP and necessarily include certain estimates and judgments made by management. The following is a list of accounting policies that we believe are the most critical in understanding our consolidated financial position, results of operations and cash flows and that may require management to make subjective or complex judgments about matters that are inherently uncertain. Such critical accounting policies, estimates and judgments are applicable to all of our operating segments.
We have noted examples of the residual accounting and business risks inherent in the accounting for these areas. Residual accounting and business risks are defined as the inherent risks that we face after the application of our policies and processes that are generally outside of our control or ability to forecast.
Landfill Accounting
Landfill operating costs are treated as period expenses and are not discussed further in this section.
Our landfill assets and liabilities fall into the following two categories, each of which requires accounting judgments and estimates:
|
•
|
Landfill development costs that are capitalized as an asset.
|
|
•
|
Landfill retirement obligations relating to our capping, closure and post-closure liabilities that result in a corresponding landfill retirement asset.
|
Landfill Development Costs
We use life-cycle accounting and the units-of-consumption method to recognize landfill development costs over the life of the site. In life-cycle accounting, all costs to acquire and construct a site are capitalized, and charged to expense based on the consumption of cubic yards of available airspace. Obligations associated with final capping, closure and post-closure are also capitalized, and amortized on a units-of-consumption basis as airspace is consumed. Cost and airspace estimates are developed at least annually by engineers.
Site permits.
To develop, construct and operate a landfill, we must obtain permits from various regulatory agencies at the local, state and federal levels. The permitting process requires an initial site study to determine whether the location is feasible for landfill operations. The initial studies are reviewed by our environmental management group and then submitted to the regulatory agencies for approval. During the development stage we capitalize certain costs that we incur after site selection but before the receipt of all required permits if we believe that it is probable that the site will be permitted.
Residual risks:
|
•
|
Changes in legislative or regulatory requirements may cause changes to the landfill site permitting process. These changes could make it more difficult and costly to obtain and maintain a landfill permit.
|
|
•
|
Studies performed could be inaccurate, which could result in the denial or revocation of a permit and changes to accounting assumptions. Conditions could exist that were not identified in the study, which may make the location not feasible for a landfill and could result in the denial of a permit. Denial or revocation of a permit could impair the recorded value of the landfill asset.
|
|
•
|
Actions by neighboring parties, private citizen groups or others to oppose our efforts to obtain, maintain or expand permits could result in denial, revocation or suspension of a permit, which could adversely impact the economic viability of the landfill and could impair the recorded value of the landfill. As a result of opposition to our obtaining a permit, improved technical information as a project progresses, or changes in the anticipated economics associated with a project, we may decide to reduce the scope of, or abandon a project, which could result in an asset impairment.
|
54
Technical landfill design.
Upon receipt of initial regulatory approval, technical landfill designs are prepared. The technical designs, which include the detailed specifications to develop and construct all components of the landfill including the types and quantities of materials that will be required, are reviewed by our environmental management group. The technical designs are submitted to the regulatory agencies for approval. Upon approval of the technical designs, the regulatory agencies issue permits to develop and operate the landfill.
Residual risks:
|
•
|
Changes in legislative or regulatory requirements may require changes in the landfill technical designs. These changes could make it more difficult and costly to meet new design standards.
|
|
•
|
Technical design requirements, as approved, may need modifications at some future point in time.
|
|
•
|
Technical designs could be inaccurate and could result in increased construction costs, difficulty in obtaining a permit or the use of rates to recognize the amortization of landfill development costs and asset retirement obligations that are not appropriate.
|
Permitted and probable landfill disposal capacity.
Included in the technical designs are factors that determine the ultimate disposal capacity of the landfill. These factors include the area over which the landfill will be developed, such as the depth of excavation, the height of the landfill elevation and the angle of the side-slope construction. The disposal capacity of the landfill is calculated in cubic yards. This measurement of volume is then converted to a disposal capacity expressed in tons based on a site-specific expected density to be achieved over the remaining operating life of the landfill.
Residual risks:
|
•
|
Estimates of future disposal capacity may change as a result of changes in legislative or regulatory design requirements.
|
|
•
|
The density of waste may vary due to variations in operating conditions, including waste compaction practices, site design, climate and the nature of the waste.
|
|
•
|
Capacity is defined in cubic yards but waste received is measured in tons. The number of tons per cubic yard varies by type of waste and our rate of compaction.
|
Development costs.
The types of costs that are detailed in the technical design specifications generally include excavation, natural and synthetic liners, construction of leachate collection systems, installation of methane gas collection systems and monitoring probes, installation of groundwater monitoring wells, construction of leachate management facilities and other costs associated with the development of the site. We review the adequacy of our cost estimates on an annual basis by comparing estimated costs with third-party bids or contractual arrangements, reviewing the changes in year over year cost estimates for reasonableness, and comparing our resulting development cost per acre with prior period costs. These development costs, together with any costs incurred to acquire, design and permit the landfill, including capitalized interest, are recorded to the landfill asset on the balance sheet as incurred.
Residual risk:
|
•
|
Actual future costs of construction materials and third-party labor could differ from the costs we have estimated because of the level of demand and the availability of the required materials and labor. Technical designs could be altered due to unexpected operating conditions, regulatory changes or legislative changes.
|
Landfill development asset amortization.
To match the expense related to the landfill asset with the revenue generated by the landfill operations, we amortize the landfill development asset over its operating life on a per-ton basis as waste is accepted at the landfill. The landfill asset is fully amortized at the end of a landfill’s operating life. The per-ton rate is calculated by dividing the sum of the landfill development asset net book value plus estimated future development costs (as described above) for the landfill, by the landfill’s estimated remaining disposal capacity. The expected future development costs are not inflated or discounted, but rather expressed in nominal dollars. This rate is applied to each ton accepted at the landfill to arrive at amortization expense for the period.
Amortization rates are influenced by the original cost basis of the landfill, including acquisition costs, which in turn is determined by geographic location and market values. We secure significant landfill assets through business acquisitions and value them at the time of acquisition based on fair value. Amortization rates are also influenced by site-specific engineering and cost factors.
55
Residual risk:
|
•
|
Changes in our future development cost estimates or our disposal capacity will normally result in a change in our amortization rates and will impact amortization expense prospectively. An unexpected significant increase in estimated costs or reduction in disposal capacity could affect the ongoing economic viability of the landfill and result in asset impairment.
|
On at least an annual basis, we update the estimates of future development costs and remaining disposal capacity for each landfill. These costs and disposal capacity estimates are reviewed and approved by senior operations management annually. Changes in cost estimates and disposal capacity are reflected prospectively in the landfill amortization rates that are updated annually.
Landfill Asset Retirement Obligations
We have two types of retirement obligations related to landfills: (1) capping and (2) closure and post-closure.
Obligations associated with final capping activities that occur during the operating life of the landfill are recognized on a units-of-consumption basis as airspace is consumed within each discrete capping event. Obligations related to closure and post-closure activities that occur after the landfill has ceased operations are recognized on a units-of-consumption basis as airspace is consumed throughout the entire life of the landfill. Landfill retirement obligations are capitalized as the related liabilities are recognized and amortized using the units-of-consumption method over the airspace consumed within the capping event or the airspace consumed within the entire landfill, depending on the nature of the obligation. All obligations are initially measured at estimated fair value. Fair value is calculated on a present value basis using an inflation rate and our credit-adjusted, risk-free rate in effect at the time the liabilities were incurred. Future costs for final capping, closure and post-closure are developed at least annually by engineers, and are inflated to future value using estimated future payment dates and inflation rate projections.
Landfill capping.
As individual areas within each landfill reach capacity, we must cap and close the areas in accordance with the landfill site permit. These requirements are detailed in the technical design of the landfill site process previously described.
Closure and post-closure.
Closure costs are costs incurred after a landfill stops receiving waste, but prior to being certified as closed. After the entire landfill has reached capacity and is certified closed, we must continue to maintain and monitor the site for a post-closure period, which generally extends for 30 years. Costs associated with closure and post-closure requirements generally include maintenance of the site, the monitoring of methane gas collection systems and groundwater systems, and other activities that occur after the site has ceased accepting waste. Costs associated with post-closure monitoring generally include groundwater sampling, analysis and statistical reports, third-party labor associated with gas system operations and maintenance, transportation and disposal of leachate, and erosion control costs related to the final cap.
Landfill retirement obligation liabilities and assets.
Estimates of the total future costs required to cap, close and monitor each landfill as specified by the landfill permit are updated annually. The estimates include inflation, the specific timing of future cash outflows, and the anticipated waste flow into the capping events. Our cost estimates are inflated to the period of performance using an estimate of inflation, which is updated annually and is based upon the ten year average consumer price index (2.3% in 2014, and 2.5% in both 2013 and 2012).
The present value of the remaining capping costs for specific capping events and the remaining closure and post-closure costs for each landfill are recorded as incurred on a per-ton basis. These liabilities are incurred as disposal capacity is consumed at the landfill.
Capping, closure and post-closure liabilities are recorded in layers and discounted using our credit-adjusted risk-free rate in effect at the time the obligation is incurred (4.5% in 2014, 5.0% in 2013 and 4.75% in 2012).
Retirement obligations are increased each year to reflect the passage of time by accreting the balance at the weighted average credit-adjusted risk-free rate that was used to calculate each layer of the recorded liabilities. This accretion is charged to operating expenses. Actual cash expenditures reduce the asset retirement obligation liabilities as they are made.
Corresponding retirement obligation assets are recorded for the same value as the additions to the capping, closure and post-closure liabilities. The retirement obligation assets are amortized to expense on a per-ton basis as disposal capacity is consumed. The per-ton rate is calculated by dividing the sum of each of the recorded retirement obligation asset’s net book value and expected future additions to the retirement obligation asset by the remaining disposal capacity. A per-ton rate is determined for each separate capping event based on the disposal capacity relating to that event. Closure and post-closure per-ton rates are based on the total disposal capacity of the landfill.
56
Residual risks:
|
•
|
Changes in legislative or regulatory requirements, including changes in capping, closure activities or post-closure monitoring activities, types and quantities of materials used, or term of post-closure care, could cause changes in our cost estimates.
|
|
•
|
Changes in the landfill retirement obligation due to changes in the anticipated waste flow, changes in airspace compaction estimates or changes in the timing of expenditures for closed landfills and fully incurred but unpaid capping events are recorded in results of operations prospectively. This could result in unanticipated increases or decreases in expense.
|
|
•
|
Actual timing of disposal capacity utilization could differ from projected timing, causing differences in timing of when amortization and accretion expense is recognized for capping, closure and post-closure liabilities.
|
|
•
|
Changes in inflation rates could impact our actual future costs and our total liabilities.
|
|
•
|
Changes in our capital structure or market conditions could result in changes to the credit-adjusted risk-free rate used to discount the liabilities, which could cause changes in future recorded liabilities, assets and expense.
|
|
•
|
Amortization rates could change in the future based on the evaluation of new facts and circumstances relating to landfill capping design, post-closure monitoring requirements, or the inflation or discount rate.
|
On an annual basis, we update our estimates of future capping, closure and post-closure costs and of future disposal capacity for each landfill. Revisions in estimates of our costs or timing of expenditures are recognized immediately as increases or decreases to the capping, closure and post-closure liabilities and the corresponding retirement obligation assets. Changes in the assets result in changes to the amortization rates which are applied prospectively, except for fully incurred capping events and closed landfills, where the changes are recorded immediately in results of operations since the associated disposal capacity has already been consumed.
Permitted and probable disposal capacity.
Disposal capacity is determined by the specifications detailed in the landfill permit. We classify this disposal capacity as permitted. We also include probable expansion disposal capacity in our remaining disposal capacity estimates, thus including additional disposal capacity being sought through means of a permit expansion. Probable expansion disposal capacity has not yet received final approval from the applicable regulatory agencies, but we have determined that certain critical criteria have been met and that the successful completion of the expansion is probable. We have developed six criteria that must be met before an expansion area is designated as probable expansion airspace. We believe that satisfying all of these criteria demonstrates a high likelihood that expansion airspace that is incorporated in our landfill costing will be permitted. However, because some of these criteria are judgmental, they may exclude expansion airspace that will eventually be permitted or include expansion airspace that will not be permitted. In either of these scenarios, our amortization, depletion and accretion expense could change significantly. Our internal criteria to classify disposal capacity as probable expansion airspace are as follows:
|
•
|
We own the land associated with the expansion airspace or control it pursuant to an option agreement;
|
|
•
|
We are committed to supporting the expansion project financially and with appropriate resources;
|
|
•
|
There are no identified fatal flaws or impediments associated with the project, including political impediments;
|
|
•
|
Progress is being made on the project;
|
|
•
|
The expansion is attainable within a reasonable time frame; and
|
|
•
|
We believe it is likely we will receive the expansion permit.
|
After successfully meeting these criteria, the disposal capacity that will result from the planned expansion is included in our remaining disposal capacity estimates. Additionally, for purposes of calculating landfill amortization and capping, closure and post-closure rates, we include the incremental costs to develop, construct, close and monitor the related probable expansion disposal capacity.
Residual risk:
|
•
|
We may be unsuccessful in obtaining permits for probable expansion disposal capacity because of the failure to obtain the final local, state or federal permits or due to other unknown reasons. If we are unsuccessful in obtaining permits for probable expansion disposal capacity, or the disposal capacity for which we obtain approvals is less than what was estimated, both our estimated total costs and disposal capacity will be reduced, which generally increases the rates we charge for landfill amortization and capping, closure and post-closure accruals. An unexpected decrease in disposal capacity could also cause an asset impairment.
|
57
Environmental Liabilities
We are subject to an array of laws and regulations relating to the protection of the environment, and we remediate sites in the ordinary course of our business. Under current laws and regulations, we may be responsible for environmental remediation at sites that we either own or operate, including sites that we have acquired, or sites where we have (or a company that we have acquired has) delivered waste. Our environmental remediation liabilities primarily include costs associated with remediating groundwater, surface water and soil contamination, as well as controlling and containing methane gas migration and the related legal costs. To estimate our ultimate liability at these sites, we evaluate several factors, including the nature and extent of contamination at each identified site, the required remediation methods, timing of expenditures, the apportionment of responsibility among the potentially responsible parties and the financial viability of those parties. We accrue for costs associated with environmental remediation obligations when such costs are probable and reasonably estimable in accordance with accounting for loss contingencies. We periodically review the status of all environmental matters and update our estimates of the likelihood of and future expenditures for remediation as necessary. Changes in the liabilities resulting from these reviews are recognized currently in earnings in the period in which the adjustment is known. Adjustments to estimates are reasonably possible in the near term and may result in changes to recorded amounts. With the exception of those obligations assumed in the acquisition of Allied, environmental obligations are recorded on an undiscounted basis. Environmental obligations assumed in the acquisition of Allied, which were initially estimated on a discounted basis, are accreted to full value over time through charges to interest expense. Adjustments arising from changes in amounts and timing of estimated costs and settlements may result in increases or decreases in these obligations and are calculated on a discounted basis as they were initially estimated on a discounted basis. These adjustments are charged to operating income when they are known. We perform a comprehensive review of our environmental obligations annually and also review changes in facts and circumstances associated with these obligations at least quarterly. We have not reduced the liabilities we have recorded for recoveries from other potentially responsible parties or insurance companies.
Residual risks:
|
•
|
We cannot determine with precision the ultimate amounts of our environmental remediation liabilities. Our estimates of these liabilities require assumptions about uncertain future events. Thus, our estimates could change substantially as additional information becomes available regarding the nature or extent of contamination, the required remediation methods, timing of expenditures, the final apportionment of responsibility among the potentially responsible parties identified, the financial viability of those parties, and the actions of governmental agencies or private parties with interests in the matter. The actual environmental costs may exceed our current and future accruals for these costs, and any such adjustments could be material.
|
|
•
|
Actual amounts could differ from the estimated liabilities as a result of changes in estimated future litigation costs to pursue the matter to ultimate resolution.
|
|
•
|
An unanticipated environmental liability that arises could result in a material charge to our consolidated statement of income.
|
Insurance Reserves and Related Costs
Our insurance programs for workers' compensation, commercial general and auto liability, environmental and remediation liability, and employee-related health care benefits are subject to high deductible insurance policies. Accruals for insurance or deductible reserves are based on claims filed and estimates of claims incurred but not reported. We maintain high deductibles for commercial general liability, automobile liability and workers’ compensation coverage, ranging from $3.0 million to $5.0 million.
Residual risks:
|
•
|
Incident rates, including frequency and severity, and other actuarial assumptions could change causing our current and future actuarially determined obligations to change, which would be reflected in our consolidated statement of income in the period in which such adjustment is known.
|
|
•
|
Recorded reserves may not be adequate to cover the future payment of claims. Adjustments, if any, to estimates recorded resulting from ultimate claim payments would be reflected in the consolidated statements of income in the periods in which such adjustments are known.
|
|
•
|
The settlement costs to discharge our obligations, including legal and health care costs, could increase or decrease causing current estimates of our insurance reserves to change.
|
58
Loss Contingencies
We are subject to various legal proceedings, claims and regulatory matters, the outcomes of which are subject to significant uncertainty. We determine whether to disclose material loss contingencies or accrue for loss contingencies based on an assessment of whether the risk of loss is remote, reasonably possible or probable, and whether it can be reasonably estimated. We analyze our litigation and regulatory matters based on available information to assess the potential liabilities. Management develops its assessment based on an analysis of possible outcomes under various strategies. We record and disclose loss contingencies pursuant to the applicable accounting guidance for such matter.
We record losses related to contingencies in cost of operations or selling, general and administrative expenses, depending on the nature of the underlying transaction leading to the loss contingency.
Residual risks:
|
•
|
Actual costs may vary from our estimates for a variety of reasons, including differing interpretations of laws, opinions on culpability and assessments of the amount of damages.
|
|
•
|
Loss contingency assumptions involve judgments that are inherently subjective and generally involve matters that are by their nature complex and unpredictable. If a loss contingency results in an adverse judgment or is settled for a significant amount, it could have a material adverse impact on our consolidated financial position, results of operations or cash flows in the period in which such judgment or settlement occurs.
|
|
•
|
New claims may be asserted that are not included in our loss contingencies.
|
Asset Impairment
Valuation methodology.
We evaluate our long-lived assets (other than goodwill) for impairment whenever events or changes in circumstances indicate the carrying amount of the asset or asset group may not be recoverable based on projected cash flows anticipated to be generated from the ongoing operation of those assets or we intend to sell or otherwise dispose of the assets.
Residual risk:
|
•
|
If events or changes in circumstances occur, including reductions in anticipated cash flows generated by our operations or determinations to divest assets, certain assets could be impaired, which would result in a non-cash charge to earnings.
|
Evaluation criteria.
We test long-lived assets for impairment whenever events or changes in circumstances indicate that the carrying amounts of the assets may not be recoverable. Examples of such events could include a significant adverse change in the extent or manner in which we use a long-lived asset, a change in its physical condition, or new circumstances that could cause an expectation that it is more likely than not that we would sell or otherwise dispose of a long-lived asset significantly before the end of its previously estimated useful life.
Residual risk:
|
•
|
Our most significant asset impairment exposure, other than goodwill (which is discussed below), relates to our landfills. A significant reduction in our estimated disposal capacity as a result of unanticipated events such as regulatory developments, revocation of an existing permit or denial of an expansion permit, or changes in our assumptions used to calculate disposal capacity, could trigger an impairment charge.
|
Recognition criteria.
If such circumstances arise, we recognize impairment for the difference between the carrying amount and fair value of the asset if the net book value of the asset exceeds the sum of the estimated undiscounted cash flows expected to result from its use and eventual disposition. We generally use the present value of the expected cash flows from that asset to determine fair value.
Goodwill Recoverability
We annually test goodwill for impairment at December 31 or when an indicator of impairment exists. We test goodwill for impairment using the two-step process. The first step is a screen for potential impairment, while the second step measures the amount of the impairment, if any. The first step of the goodwill impairment test compares the fair value of a reporting unit with its carrying amount, including goodwill.
We have defined our reporting units to be consistent with our operating segments: East, Central and West. In determining fair value, we primarily use discounted future cash flows and operating results based on a comparative multiple of earnings or revenues.
59
Significant estimates used in our fair value calculation using discounted future cash flows include: (1) estimates of future revenue and expense growth by reporting unit, which we estimate to range from
3%
to
5%
; (2) future estimated effective tax rates, which we estimate to be
40%
; (3) future estimated capital expenditures as well as future required investments in working capital; (4) estimated discount rates, which we estimate to range between
7%
and
8%
; and (5) the future terminal value of the reporting unit, which is based on its ability to exist into perpetuity. Significant estimates used in the fair value calculation using market value multiples include: (a) estimated future growth potential of the reporting unit; (b) estimated multiples of revenue or earnings a willing buyer is likely to pay; and (c) estimated control premium a willing buyer is likely to pay.
In addition, we evaluate a reporting unit for impairment if events or circumstances change between annual tests, indicating a possible impairment. Examples of such events or circumstances include: (1) a significant adverse change in legal factors or in the business climate; (2) an adverse action or assessment by a regulator; (3) a more likely than not expectation that a reporting unit or a significant portion thereof will be sold; (4) continued or sustained losses at a reporting unit; (5) a significant decline in our market capitalization as compared to our book value; or (6) the testing for recoverability of a significant asset group within the reporting unit.
We assign assets and liabilities from our corporate operating segment to our three reporting units to the extent that such assets or liabilities relate to the cash flows of the reporting unit and would be included in determining the reporting unit’s fair value.
In preparing our annual test for impairment as of
December 31, 2014
, we determined that our indicated fair value of total invested capital exceeded our total market capitalization. We believe one of the primary reconciling differences between the indicated fair value of total invested capital and our total market capitalization is due to a control premium. We believe the control premium represents the value a market participant could extract as savings and/or synergies by obtaining control.
As of
December 31, 2014
, we determined that the indicated fair value of our reporting units exceeded their carrying value by approximately
50%
on average and, therefore, we noted no indicators of impairment at our reporting units.
Our operating segments, which also represent our reporting units, are comprised of several vertically integrated businesses. When an individual business within an integrated operating segment is divested, goodwill is allocated to that business based on its fair value relative to the fair value of its operating segment.
Residual risks:
|
•
|
Future events could cause us to conclude that impairment indicators exist and that goodwill associated with acquired businesses is impaired.
|
|
•
|
The valuation of identifiable goodwill requires significant estimates and judgment about future performance, cash flows and fair value. Our future results could be affected if these current estimates of future performance and fair value change. For example, a reduction in long-term growth assumptions could reduce the estimated fair value of the operating segments to below their carrying values, which could trigger an impairment charge. Similarly, an increase in our discount rate could trigger an impairment charge. Any resulting impairment charge could have a material adverse impact on our financial condition and results of operations.
|
Income Taxes
Deferred tax assets and liabilities are determined based on differences between the financial reporting and income tax bases of assets (other than non-deductible goodwill) and liabilities. Deferred tax assets and liabilities are measured using the income tax rate in effect during the year in which the differences are expected to reverse.
We record net deferred tax assets to the extent we believe these assets will more likely than not be realized. In making this determination, we consider all available positive and negative evidence, including scheduled reversals of deferred tax liabilities, projected future taxable income, tax planning strategies and recent financial operations. In the event we determine that we would be able to realize our deferred income tax assets in the future in excess of their net recorded amount, we will make an adjustment to the valuation allowance which would reduce our provision for income taxes.
Our income tax expense, deferred tax assets and liabilities and reserves for unrecognized tax benefits reflect management’s best assessment of estimated future taxes to be paid. We are subject to U.S. federal income taxes and to the income taxes of numerous states and Puerto Rico. Significant judgments and estimates are required in determining the combined income tax expense.
Regarding the accounting for uncertainty in income taxes recognized in the financial statements, we record a tax benefit from an uncertain tax position when it is more likely than not that the position will be sustained upon examination, including resolutions of any related appeals or litigation processes, based on the technical merits. We recognize interest and penalties
60
related to uncertain tax positions within the provision for income taxes in our consolidated statements of income. Accrued interest and penalties are included within other accrued liabilities and deferred income taxes and other long-term tax liabilities in our consolidated balance sheets.
Residual risks:
|
•
|
Income tax assets and liabilities established in purchase accounting for acquisitions are based on assumptions that could differ from the ultimate outcome of the tax matters. Such adjustments would be charged or credited to earnings, unless they meet certain remeasurement criteria and are allowed to be adjusted to goodwill.
|
|
•
|
Changes in the estimated realizability of deferred tax assets could result in adjustments to our provision for income taxes.
|
|
•
|
Valuation allowances for deferred tax assets and the realizability of net operating loss carryforwards for tax purposes are based on our judgment. If our judgments and estimates concerning valuation allowances and the realizability of net operating loss carryforwards are incorrect, our provision for income taxes would change.
|
|
•
|
We are regularly under examination or administrative review by various taxing authorities. The Internal Revenue Code and income tax regulations are a complex set of rules that we must interpret and apply. Positions taken in tax years under examination or subsequent years are subject to challenge. Accordingly, we may have exposure for additional tax liabilities arising from these audits if any positions taken by us or by companies we have acquired are disallowed by the taxing authorities.
|
|
•
|
We adjust our liabilities for uncertain tax positions when our judgment changes as a result of the evaluation of new information not previously available. Due to the complexity of some of these uncertainties, their ultimate resolution may result in payments that are materially different from our current estimates of the tax liabilities. These differences will be reflected as increases or decreases to our provision for income taxes in the period in which they are determined.
|
Defined Benefit Pension Plans
We currently have one qualified defined benefit pension plan, the BFI Retirement Plan (the Plan). The Plan covers certain employees in the United States, including some employees subject to collective bargaining agreements. The Plan’s benefit formula is based on a percentage of compensation as defined in the Plan document. The benefits of approximately 97% of the current plan participants were frozen upon Allied’s acquisition of BFI in 1999.
Our pension contributions are made in accordance with funding standards established by the Employee Retirement Income Security Act of 1974 and the Internal Revenue Code, as amended by the Pension Protection Act of 2006.
The Plan’s assets are invested as determined by our Employee Benefits Committee. As of December 31, 2014, the plan assets were invested in fixed income funds, equity funds and cash. The Employee Benefits Committee annually reviews and adjusts the plan’s asset allocation as deemed necessary. As of
December 31, 2014
, the Plan was underfunded by $4.2 million, compared to overfunded by $8.1 million as of
December 31, 2013
.
Residual risk:
|
•
|
Changes in the plan’s investment mix and performance of the equity and bond markets and fund managers could impact the amount of pension income or expense recorded, the funded status of the plan and the need for future cash contributions.
|
Assumptions.
The benefit obligation and associated income or expense related to the Plan are determined based on assumptions concerning items such as discount rates, expected rates of return and average rates of compensation increases. Our assumptions are reviewed annually and adjusted as deemed necessary.
We determine the discount rate based on a model that matches the timing and amount of expected benefit payments to maturities of high quality bonds priced as of the Plan measurement date. Where that timing does not correspond to a published high-quality bond rate, our model uses an expected yield curve to determine an appropriate current discount rate. The yield on the bonds is used to derive a discount rate for the liability. If the discount rate were to increase by 1%, our benefit obligation would decrease by approximately $23 million. If the discount rate were to decrease by 1%, our benefit obligation would increase by approximately $27 million.
In developing our expected rate of return assumption, we evaluate long-term expected and historical returns on the Plan assets, giving consideration to our asset mix and the anticipated duration of the Plan obligations. The average rate of compensation
61
increase reflects our expectations of average pay increases over the periods benefits are earned. There are no participants in the Plan that continue to earn service benefits.
Residual risks:
|
•
|
Our assumed discount rate is sensitive to changes in market-based interest rates. A decrease in the discount rate will increase our related benefit plan obligation.
|
|
•
|
Our annual pension expense would be impacted if the actual return on plan assets were to vary from the expected return.
|
New Accounting Standards
For a description of new accounting standards that may affect us, see Note 2,
Summary of Significant Accounting Policies
, to our consolidated financial statements in Item 8 of this Form 10-K.
62
|
ITEM 7A.
|
QUANTITATIVE AND QUALITATIVE DISCLOSURES ABOUT MARKET RISK
|
Interest Rate Risk
Our major market risk exposure of our financial instruments is changing interest rates in the United States and fluctuations in LIBOR. We intend to manage interest rate risk through the use of a combination of fixed and floating rate debt. The carrying value of our variable rate debt approximates fair value because interest rates are variable and, accordingly, approximates current market rates for instruments with similar risk and maturities. The fair value of our debt is determined as of the balance sheet date and is subject to change. The table below provides information about certain of our market-sensitive financial instruments and constitutes a “forward-looking statement.”
|
|
Expected Maturity Date
|
|
|
||||||||||||||||||||||||||||
|
|
2015
|
2016
|
2017
|
2018
|
2019
|
Thereafter
|
Total
|
Fair Value
as of
December 31,
2014
|
|||||||||||||||||||||||
|
Fixed rate debt:
|
|||||||||||||||||||||||||||||||
|
Amount outstanding (in millions)
|
$
|
4.8
|
|
$
|
4.5
|
|
$
|
4.9
|
|
$
|
705.5
|
|
$
|
654.7
|
|
$
|
4,777.4
|
|
$
|
6,151.8
|
|
$
|
7,005.8
|
|
|||||||
|
Average interest rates
|
7.4
|
%
|
7.4
|
%
|
7.4
|
%
|
3.8
|
%
|
5.5
|
%
|
5.2
|
%
|
5.1
|
%
|
|||||||||||||||||
|
Variable rate debt:
|
|||||||||||||||||||||||||||||||
|
Amount outstanding (in millions)
|
$
|
4.7
|
|
$
|
—
|
|
$
|
—
|
|
$
|
—
|
|
$
|
35.0
|
|
$
|
932.4
|
|
$
|
972.1
|
|
$
|
972.1
|
|
|||||||
|
Average interest rates
|
0.4
|
%
|
—
|
%
|
—
|
%
|
—
|
%
|
0.4
|
%
|
0.4
|
%
|
0.4
|
%
|
|||||||||||||||||
The fixed and variable rate debt amounts above exclude the remaining non-cash discounts, premiums and adjustments to fair value recorded in purchase accounting totaling
$62.7 million
. Additionally, during the second half of 2013, we entered into various interest rate swap agreements relative to our 4.750% fixed rate senior notes due in May 2023. The goal was to reduce overall borrowing costs and rebalance our debt portfolio's ratio of fixed to floating interest rates. These swap agreements, which were designated as fair value hedges, have a total notional value of $300.0 million as of
December 31, 2014
. Our interest rate swap contracts have been authorized pursuant to our policies and procedures. We do not use financial instruments for trading purposes and are not a party to any leveraged derivatives.
Fuel Price Risk
Fuel costs represent a significant operating expense. When economically practical, we may enter into new fuel hedges, renew contracts, or engage in other strategies to mitigate market risk. Where appropriate, we have implemented a fuel recovery fee that is designed to recover our fuel costs. While we charge these fees to a majority of our customers, we are unable to charge such fees to all customers. Consequently, an increase in fuel costs results in (1) an increase in our cost of operations, (2) a smaller increase in our revenue (from the fuel recovery fee) and (3) a decrease in our operating margin percentage. Conversely, a decrease in fuel costs results in (1) a decrease in our cost of operations, (2) a smaller decrease in our revenue and (3) an increase in our operating margin percentage.
At current consumption levels, we believe a twenty-cent per gallon change in the price of diesel fuel changes our fuel costs by approximately
$26 million
per year. Offsetting these changes in fuel expense would be changes in our fuel recovery fee charged to our customers. At current participation rates, we believe a twenty-cent per gallon change in the price of diesel fuel changes our fuel recovery fee by approximately
$25 million
per year.
Our operations also require the use of certain petrochemical-based products (such as liners at our landfills) whose costs may vary with the price of petrochemicals. An increase in the price of petrochemicals could increase the cost of those products, which would increase our operating and capital costs. We also are susceptible to increases in indirect fuel recovery fees from our vendors.
Our fuel costs were
$500.0 million
in 2014, or
5.7
% of revenue, compared to $516.7 million in 2013, or 6.1% of revenue, and $530.1 million in 2012, or 6.5% of revenue.
63
Commodities Prices
We market recycled products such as cardboard and newspaper from our recycling centers. Market demand for recyclable materials causes volatility in commodity prices. At current volumes and mix of materials, we believe a $10 per ton change in the price of recyclable materials will change annual revenue and operating income by approximately
$28 million
and
$16 million
, respectively.
Revenue from sales of these products in
2014
,
2013
and
2012
was approximately
$390.8 million
,
$374.6 million
and
$349.0 million
, respectively.
64
|
ITEM 8.
|
FINANCIAL STATEMENTS AND SUPPLEMENTARY DATA
|
65
REPORT OF INDEPENDENT REGISTERED PUBLIC ACCOUNTING FIRM
The Board of Directors and Stockholders of Republic Services, Inc.:
We have audited the accompanying consolidated balance sheets of Republic Services, Inc. as of December 31, 2014 and 2013, and the related consolidated statements of income, comprehensive income, stockholders’ equity and cash flows for each of the three years in the period ended December 31, 2014. These financial statements are the responsibility of Republic Services, Inc.'s management. Our responsibility is to express an opinion on these financial statements based on our audits.
We conducted our audits in accordance with the standards of the Public Company Accounting Oversight Board (United States). Those standards require that we plan and perform the audit to obtain reasonable assurance about whether the financial statements are free of material misstatement. An audit includes examining, on a test basis, evidence supporting the amounts and disclosures in the financial statements. An audit also includes assessing the accounting principles used and significant estimates made by management, as well as evaluating the overall financial statement presentation. We believe that our audits provide a reasonable basis for our opinion.
In our opinion, the financial statements referred to above present fairly, in all material respects, the consolidated financial position of Republic Services, Inc. at December 31, 2014 and 2013, and the consolidated results of its operations and its cash flows for each of the three years in the period ended December 31, 2014, in conformity with U.S. generally accepted accounting principles.
We also have audited, in accordance with the standards of the Public Company Accounting Oversight Board (United States), Republic Services, Inc.’s internal control over financial reporting as of December 31, 2014, based on criteria established in Internal Control - Integrated Framework issued by the Committee of Sponsoring Organizations of the Treadway Commission (2013 framework) and our report dated February 23, 2015 expressed an unqualified opinion thereon.
/s/ Ernst & Young LLP
Phoenix, Arizona
February 23, 2015
66
REPORT OF INDEPENDENT REGISTERED PUBLIC ACCOUNTING FIRM
ON INTERNAL CONTROL OVER FINANCIAL REPORTING
The Board of Directors and Stockholders of Republic Services, Inc.:
We have audited Republic Services, Inc.’s internal control over financial reporting as of December 31, 2014, based on criteria established in Internal Control - Integrated Framework issued by the Committee of Sponsoring Organizations of the Treadway Commission (2013 framework) (the COSO criteria). Republic Services, Inc.’s management is responsible for maintaining effective internal control over financial reporting, and for its assessment of the effectiveness of internal control over financial reporting included in the accompanying Report of Management on Republic Services, Inc.’s Internal Control over Financial Reporting. Our responsibility is to express an opinion on Republic Services, Inc.'s internal control over financial reporting based on our audit.
We conducted our audit in accordance with the standards of the Public Company Accounting Oversight Board (United States). Those standards require that we plan and perform the audit to obtain reasonable assurance about whether effective internal control over financial reporting was maintained in all material respects. Our audit included obtaining an understanding of internal control over financial reporting, assessing the risk that a material weakness exists, testing and evaluating the design and operating effectiveness of internal control based on the assessed risk, and performing such other procedures as we considered necessary in the circumstances. We believe that our audit provides a reasonable basis for our opinion.
A company’s internal control over financial reporting is a process designed to provide reasonable assurance regarding the reliability of financial reporting and the preparation of financial statements for external purposes in accordance with generally accepted accounting principles. A company’s internal control over financial reporting includes those policies and procedures that (1) pertain to the maintenance of records that, in reasonable detail, accurately and fairly reflect the transactions and dispositions of the assets of the company; (2) provide reasonable assurance that transactions are recorded as necessary to permit preparation of financial statements in accordance with generally accepted accounting principles, and that receipts and expenditures of the company are being made only in accordance with authorizations of management and directors of the company; and (3) provide reasonable assurance regarding prevention or timely detection of unauthorized acquisition, use, or disposition of the company’s assets that could have a material effect on the financial statements.
Because of its inherent limitations, internal control over financial reporting may not prevent or detect misstatements. Also, projections of any evaluation of effectiveness to future periods are subject to the risk that controls may become inadequate because of changes in conditions, or that the degree of compliance with the policies or procedures may deteriorate.
In our opinion, Republic Services, Inc. maintained, in all material respects, effective internal control over financial reporting as of December 31, 2014, based on the COSO criteria.
We also have audited, in accordance with the standards of the Public Company Accounting Oversight Board (United States), the consolidated balance sheets of Republic Services, Inc. as of December 31, 2014 and 2013, and the related consolidated statements of income, comprehensive income, stockholders’ equity and cash flows for each of the three years in the period ended December 31, 2014 of Republic Services, Inc. and our report dated February 23, 2015 expressed an unqualified opinion thereon.
/s/ Ernst & Young LLP
Phoenix, Arizona
February 23, 2015
67
REPUBLIC SERVICES, INC.
(in millions, except per share data)
|
December 31, 2014
|
December 31, 2013
|
||||||
|
ASSETS
|
|||||||
|
Current assets:
|
|||||||
|
Cash and cash equivalents
|
$
|
75.2
|
|
$
|
213.3
|
|
|
|
Accounts receivable, less allowance for doubtful accounts and other of $38.9 and $38.3, respectively
|
930.4
|
|
890.7
|
|
|||
|
Prepaid expenses and other current assets
|
263.4
|
|
200.3
|
|
|||
|
Deferred tax assets
|
122.0
|
|
117.6
|
|
|||
|
Total current assets
|
1,391.0
|
|
1,421.9
|
|
|||
|
Restricted cash and marketable securities
|
115.6
|
|
169.7
|
|
|||
|
Property and equipment, net
|
7,165.3
|
|
7,036.8
|
|
|||
|
Goodwill
|
10,830.9
|
|
10,724.1
|
|
|||
|
Other intangible assets, net
|
298.9
|
|
315.8
|
|
|||
|
Other assets
|
292.3
|
|
280.9
|
|
|||
|
Total assets
|
$
|
20,094.0
|
|
$
|
19,949.2
|
|
|
|
LIABILITIES AND STOCKHOLDERS’ EQUITY
|
|||||||
|
Current liabilities:
|
|||||||
|
Accounts payable
|
$
|
527.3
|
|
$
|
511.4
|
|
|
|
Notes payable and current maturities of long-term debt
|
10.4
|
|
15.7
|
|
|||
|
Deferred revenue
|
306.3
|
|
301.8
|
|
|||
|
Accrued landfill and environmental costs, current portion
|
164.3
|
|
178.7
|
|
|||
|
Accrued interest
|
67.0
|
|
68.2
|
|
|||
|
Other accrued liabilities
|
750.7
|
|
641.3
|
|
|||
|
Total current liabilities
|
1,826.0
|
|
1,717.1
|
|
|||
|
Long-term debt, net of current maturities
|
7,050.8
|
|
7,002.4
|
|
|||
|
Accrued landfill and environmental costs, net of current portion
|
1,677.5
|
|
1,464.3
|
|
|||
|
Deferred income taxes and other long-term tax liabilities
|
1,149.0
|
|
1,185.4
|
|
|||
|
Insurance reserves, net of current portion
|
298.0
|
|
294.9
|
|
|||
|
Other long-term liabilities
|
344.9
|
|
379.0
|
|
|||
|
Commitments and contingencies
|
|
|
|
|
|||
|
Stockholders’ equity:
|
|||||||
|
Preferred stock, par value $0.01 per share; 50 shares authorized; none issued
|
—
|
|
—
|
|
|||
|
Common stock, par value $0.01 per share; 750 shares authorized; 414.4 and 411.0 issued
including shares held in treasury, respectively
|
4.1
|
|
4.1
|
|
|||
|
Additional paid-in capital
|
6,876.9
|
|
6,764.9
|
|
|||
|
Retained earnings
|
2,795.0
|
|
2,632.7
|
|
|||
|
Treasury stock, at cost (61.7 and 50.6 shares, respectively)
|
(1,901.8
|
)
|
(1,501.2
|
)
|
|||
|
Accumulated other comprehensive (loss) income, net of tax
|
(28.9
|
)
|
3.0
|
|
|||
|
Total Republic Services, Inc. stockholders’ equity
|
7,745.3
|
|
7,903.5
|
|
|||
|
Noncontrolling interests
|
2.5
|
|
2.6
|
|
|||
|
Total stockholders’ equity
|
7,747.8
|
|
7,906.1
|
|
|||
|
Total liabilities and stockholders’ equity
|
$
|
20,094.0
|
|
$
|
19,949.2
|
|
|
The accompanying notes are an integral part of these financial statements.
68
REPUBLIC SERVICES, INC.
(in millions, except per share data)
|
|
Years Ended December 31,
|
||||||||||
|
|
2014
|
2013
|
2012
|
||||||||
|
Revenue
|
$
|
8,788.3
|
|
$
|
8,417.2
|
|
$
|
8,118.3
|
|
||
|
Expenses:
|
|
||||||||||
|
Cost of operations
|
5,628.1
|
|
5,234.7
|
|
5,005.7
|
|
|||||
|
Depreciation, amortization and depletion
|
906.9
|
|
877.4
|
|
848.5
|
|
|||||
|
Accretion
|
78.0
|
|
76.6
|
|
78.4
|
|
|||||
|
Selling, general and administrative
|
918.9
|
|
853.8
|
|
820.9
|
|
|||||
|
Negotiation and withdrawal costs - Central States Pension and Other Funds
|
1.5
|
|
157.7
|
|
35.8
|
|
|||||
|
Loss (gain) on disposition of assets and impairments, net
|
20.0
|
|
(1.9
|
)
|
(2.7
|
)
|
|||||
|
Restructuring charges
|
1.8
|
|
8.6
|
|
11.1
|
|
|||||
|
Operating income
|
1,233.1
|
|
1,210.3
|
|
1,320.6
|
|
|||||
|
Interest expense
|
(348.7
|
)
|
(360.0
|
)
|
(388.5
|
)
|
|||||
|
Loss on extinguishment of debt
|
(1.4
|
)
|
(2.1
|
)
|
(112.6
|
)
|
|||||
|
Interest income
|
0.6
|
|
0.7
|
|
1.0
|
|
|||||
|
Other income, net
|
1.7
|
|
2.3
|
|
3.4
|
|
|||||
|
Income before income taxes
|
885.3
|
|
851.2
|
|
823.9
|
|
|||||
|
Provision for income taxes
|
337.4
|
|
262.1
|
|
251.8
|
|
|||||
|
Net income
|
547.9
|
|
589.1
|
|
572.1
|
|
|||||
|
Net income attributable to noncontrolling interests
|
(0.3
|
)
|
(0.2
|
)
|
(0.3
|
)
|
|||||
|
Net income attributable to Republic Services, Inc.
|
$
|
547.6
|
|
$
|
588.9
|
|
$
|
571.8
|
|
||
|
Basic earnings per share attributable to Republic Services, Inc. stockholders:
|
|||||||||||
|
Basic earnings per share
|
$
|
1.54
|
|
$
|
1.63
|
|
$
|
1.56
|
|
||
|
Weighted average common shares outstanding
|
356.7
|
|
362.1
|
|
366.9
|
|
|||||
|
Diluted earnings per share attributable to Republic Services, Inc. stockholders:
|
|||||||||||
|
Diluted earnings per share
|
$
|
1.53
|
|
$
|
1.62
|
|
$
|
1.55
|
|
||
|
Weighted average common and common equivalent shares outstanding
|
358.1
|
|
363.4
|
|
368.0
|
|
|||||
|
Cash dividends per common share
|
$
|
1.08
|
|
$
|
0.99
|
|
$
|
0.91
|
|
||
The accompanying notes are an integral part of these financial statements.
69
REPUBLIC SERVICES, INC.
CONSOLIDATED STATEMENTS OF COMPREHENSIVE INCOME
(in millions)
|
|
Years Ended December 31,
|
||||||||||
|
|
2014
|
2013
|
2012
|
||||||||
|
Net income
|
$
|
547.9
|
|
$
|
589.1
|
|
$
|
572.1
|
|
||
|
Other comprehensive (loss) income, net of tax
|
|||||||||||
|
Hedging activity:
|
|||||||||||
|
Settlements
|
0.3
|
|
1.7
|
|
0.9
|
|
|||||
|
Realized loss (gain) reclassified into earnings
|
1.2
|
|
(0.2
|
)
|
(2.3
|
)
|
|||||
|
Unrealized (loss) gain
|
(24.1
|
)
|
2.3
|
|
2.8
|
|
|||||
|
Pension activity:
|
|||||||||||
|
Change in funded status of pension plan obligations
|
(9.3
|
)
|
7.1
|
|
15.6
|
|
|||||
|
Gain related to pension settlement reclassified to earnings
|
—
|
|
(2.1
|
)
|
(1.3
|
)
|
|||||
|
Other comprehensive (loss) income, net of tax
|
(31.9
|
)
|
8.8
|
|
15.7
|
|
|||||
|
Comprehensive income
|
516.0
|
|
597.9
|
|
587.8
|
|
|||||
|
Comprehensive income attributable to noncontrolling interests
|
(0.3
|
)
|
(0.2
|
)
|
(0.3
|
)
|
|||||
|
Comprehensive income attributable to Republic Services, Inc.
|
$
|
515.7
|
|
$
|
597.7
|
|
$
|
587.5
|
|
||
The accompanying notes are an integral part of these financial statements.
70
REPUBLIC SERVICES, INC.
CONSOLIDATED STATEMENT OF STOCKHOLDERS’ EQUITY
(in millions)
|
|
Republic Services, Inc. Stockholders’ Equity
|
|
||||||||||||||||||||||||||||||
|
Common Stock
|
Additional
Paid-In Capital
|
Retained Earnings
|
Treasury
Stock
|
Accumulated
Other Comprehensive (Loss) Income, Net of Tax
|
Noncontrolling Interests
|
Total
|
||||||||||||||||||||||||||
|
|
Shares
|
Amount
|
Shares
|
Amount
|
||||||||||||||||||||||||||||
|
Balance as of December 31, 2011
|
402.1
|
|
$
|
4.0
|
|
$
|
6,495.6
|
|
$
|
2,164.7
|
|
(32.2
|
)
|
$
|
(961.5
|
)
|
$
|
(21.5
|
)
|
$
|
2.1
|
|
$
|
7,683.4
|
|
|||||||
|
Net income
|
—
|
|
—
|
|
—
|
|
571.8
|
|
—
|
|
—
|
|
—
|
|
0.3
|
|
572.1
|
|
||||||||||||||
|
Change in the value of derivative instruments, net of tax of $13.4
|
—
|
|
—
|
|
—
|
|
—
|
|
—
|
|
—
|
|
1.4
|
|
—
|
|
1.4
|
|
||||||||||||||
|
Employee benefit plan liability adjustments, net of tax of $17.1
|
—
|
|
—
|
|
—
|
|
—
|
|
—
|
|
—
|
|
14.3
|
|
—
|
|
14.3
|
|
||||||||||||||
|
Cash dividends declared
|
—
|
|
—
|
|
—
|
|
(332.5
|
)
|
—
|
|
—
|
|
—
|
|
—
|
|
(332.5
|
)
|
||||||||||||||
|
Issuances of common stock
|
3.1
|
|
0.1
|
|
72.3
|
|
—
|
|
—
|
|
—
|
|
—
|
|
—
|
|
72.4
|
|
||||||||||||||
|
Stock-based compensation
|
—
|
|
—
|
|
21.0
|
|
(0.8
|
)
|
—
|
|
—
|
|
—
|
|
—
|
|
20.2
|
|
||||||||||||||
|
Purchase of common stock for treasury
|
—
|
|
—
|
|
—
|
|
—
|
|
(11.9
|
)
|
(325.6
|
)
|
—
|
|
—
|
|
(325.6
|
)
|
||||||||||||||
|
Balance as of December 31, 2012
|
405.2
|
|
4.1
|
|
6,588.9
|
|
2,403.2
|
|
(44.1
|
)
|
(1,287.1
|
)
|
(5.8
|
)
|
2.4
|
|
7,705.7
|
|
||||||||||||||
|
Net income
|
—
|
|
—
|
|
—
|
|
588.9
|
|
—
|
|
—
|
|
—
|
|
0.2
|
|
589.1
|
|
||||||||||||||
|
Change in the value of derivative instruments, net of tax of $1.0
|
—
|
|
—
|
|
—
|
|
—
|
|
—
|
|
—
|
|
3.8
|
|
—
|
|
3.8
|
|
||||||||||||||
|
Employee benefit plan liability adjustments, net of tax of $12.2
|
—
|
|
—
|
|
—
|
|
—
|
|
—
|
|
—
|
|
5.0
|
|
—
|
|
5.0
|
|
||||||||||||||
|
Cash dividends declared
|
—
|
|
—
|
|
—
|
|
(357.3
|
)
|
—
|
|
—
|
|
—
|
|
—
|
|
(357.3
|
)
|
||||||||||||||
|
Issuances of common stock
|
5.8
|
|
—
|
|
158.8
|
|
—
|
|
—
|
|
—
|
|
—
|
|
—
|
|
158.8
|
|
||||||||||||||
|
Stock-based compensation
|
—
|
|
—
|
|
17.2
|
|
(2.1
|
)
|
—
|
|
—
|
|
—
|
|
—
|
|
15.1
|
|
||||||||||||||
|
Purchase of common stock for treasury
|
—
|
|
—
|
|
—
|
|
—
|
|
(6.5
|
)
|
(214.1
|
)
|
—
|
|
—
|
|
(214.1
|
)
|
||||||||||||||
|
Balance as of December 31, 2013
|
411.0
|
|
4.1
|
|
6,764.9
|
|
2,632.7
|
|
(50.6
|
)
|
(1,501.2
|
)
|
3.0
|
|
2.6
|
|
7,906.1
|
|
||||||||||||||
|
Net income
|
—
|
|
—
|
|
—
|
|
547.6
|
|
—
|
|
—
|
|
—
|
|
0.3
|
|
547.9
|
|
||||||||||||||
|
Change in the value of derivative instruments, net of tax of $15.1
|
—
|
|
—
|
|
—
|
|
—
|
|
—
|
|
—
|
|
(22.6
|
)
|
—
|
|
(22.6
|
)
|
||||||||||||||
|
Employee benefit plan liability adjustments, net of tax of $6.3
|
—
|
|
—
|
|
—
|
|
—
|
|
—
|
|
—
|
|
(9.3
|
)
|
—
|
|
(9.3
|
)
|
||||||||||||||
|
Cash dividends declared
|
—
|
|
—
|
|
—
|
|
(383.6
|
)
|
—
|
|
—
|
|
—
|
|
—
|
|
(383.6
|
)
|
||||||||||||||
|
Issuances of common stock
|
3.4
|
|
—
|
|
92.9
|
|
—
|
|
—
|
|
—
|
|
—
|
|
—
|
|
92.9
|
|
||||||||||||||
|
Stock-based compensation
|
—
|
|
—
|
|
19.1
|
|
(1.7
|
)
|
—
|
|
—
|
|
—
|
|
—
|
|
17.4
|
|
||||||||||||||
|
Purchase of common stock for treasury
|
—
|
|
—
|
|
—
|
|
—
|
|
(11.1
|
)
|
(400.6
|
)
|
—
|
|
—
|
|
(400.6
|
)
|
||||||||||||||
|
Distributions paid to noncontrolling interests
|
—
|
|
—
|
|
—
|
|
—
|
|
—
|
|
—
|
|
—
|
|
(0.4
|
)
|
(0.4
|
)
|
||||||||||||||
|
Balance as of December 31, 2014
|
414.4
|
|
$
|
4.1
|
|
$
|
6,876.9
|
|
$
|
2,795.0
|
|
(61.7
|
)
|
$
|
(1,901.8
|
)
|
$
|
(28.9
|
)
|
$
|
2.5
|
|
$
|
7,747.8
|
|
|||||||
The accompanying notes are an integral part of these financial statements.
71
REPUBLIC SERVICES, INC.
(in millions)
|
|
Years Ended December 31,
|
||||||||||
|
|
2014
|
2013
|
2012
|
||||||||
|
Cash provided by operating activities:
|
|||||||||||
|
Net income
|
$
|
547.9
|
|
$
|
589.1
|
|
$
|
572.1
|
|
||
|
Adjustments to reconcile net income to cash provided by operating activities:
|
|||||||||||
|
Depreciation, amortization, depletion and accretion
|
984.9
|
|
954.0
|
|
926.9
|
|
|||||
|
Non-cash interest expense
|
44.8
|
|
47.5
|
|
58.4
|
|
|||||
|
Restructuring related charges
|
1.8
|
|
8.6
|
|
11.1
|
|
|||||
|
Stock-based compensation
|
17.4
|
|
19.2
|
|
21.2
|
|
|||||
|
Deferred tax (benefit) provision
|
(9.0
|
)
|
(38.5
|
)
|
83.9
|
|
|||||
|
Provision for doubtful accounts, net of adjustments
|
22.6
|
|
16.1
|
|
29.7
|
|
|||||
|
Loss on extinguishment of debt
|
1.4
|
|
2.1
|
|
112.6
|
|
|||||
|
Gain on disposition of assets, net and asset impairments
|
(14.7
|
)
|
(11.0
|
)
|
(14.1
|
)
|
|||||
|
Withdrawal liability - Central States Pension Fund and Other Funds
|
—
|
|
140.7
|
|
30.7
|
|
|||||
|
Environmental adjustments
|
233.2
|
|
83.7
|
|
62.4
|
|
|||||
|
Excess income tax benefit from stock option exercises and other non-cash items
|
(4.9
|
)
|
(6.7
|
)
|
(4.1
|
)
|
|||||
|
Change in assets and liabilities, net of effects from business acquisitions and divestitures:
|
|||||||||||
|
Accounts receivable
|
(54.3
|
)
|
(61.6
|
)
|
(37.2
|
)
|
|||||
|
Prepaid expenses and other assets
|
(41.3
|
)
|
(11.4
|
)
|
(13.9
|
)
|
|||||
|
Accounts payable
|
3.3
|
|
37.9
|
|
(49.6
|
)
|
|||||
|
Restructuring and synergy related expenditures
|
(1.3
|
)
|
(15.8
|
)
|
(70.3
|
)
|
|||||
|
Capping, closure and post-closure expenditures
|
(54.6
|
)
|
(85.6
|
)
|
(77.6
|
)
|
|||||
|
Remediation expenditures
|
(99.4
|
)
|
(122.5
|
)
|
(73.1
|
)
|
|||||
|
Other liabilities
|
(48.0
|
)
|
2.4
|
|
(55.3
|
)
|
|||||
|
Cash provided by operating activities
|
1,529.8
|
|
1,548.2
|
|
1,513.8
|
|
|||||
|
Cash used in investing activities:
|
|||||||||||
|
Purchases of property and equipment
|
(862.5
|
)
|
(880.8
|
)
|
(903.5
|
)
|
|||||
|
Proceeds from sales of property and equipment
|
35.7
|
|
23.9
|
|
28.7
|
|
|||||
|
Cash used in business acquisitions and development projects, net of cash acquired
|
(195.7
|
)
|
(68.7
|
)
|
(95.3
|
)
|
|||||
|
Cash proceeds from divestitures, net of cash divested
|
—
|
|
2.7
|
|
9.6
|
|
|||||
|
Change in restricted cash and marketable securities
|
70.8
|
|
(5.5
|
)
|
23.2
|
|
|||||
|
Other
|
(8.1
|
)
|
(5.5
|
)
|
(0.2
|
)
|
|||||
|
Cash used in investing activities
|
(959.8
|
)
|
(933.9
|
)
|
(937.5
|
)
|
|||||
|
Cash used in financing activities:
|
|||||||||||
|
Proceeds from notes payable and long-term debt
|
1,383.3
|
|
1,219.2
|
|
2,771.4
|
|
|||||
|
Proceeds from issuance of senior notes, net of discount
|
—
|
|
—
|
|
847.6
|
|
|||||
|
Payments of notes payable and long-term debt
|
(1,398.4
|
)
|
(1,278.1
|
)
|
(3,568.2
|
)
|
|||||
|
Premiums paid on extinguishment of debt
|
—
|
|
—
|
|
(25.8
|
)
|
|||||
|
Fees paid to issue and retire senior notes and certain hedging relationships
|
(4.0
|
)
|
(1.6
|
)
|
(17.5
|
)
|
|||||
|
Issuances of common stock
|
88.6
|
|
150.8
|
|
70.4
|
|
|||||
|
Excess income tax benefit from stock option exercises
|
4.3
|
|
3.8
|
|
1.9
|
|
|||||
|
Purchases of common stock for treasury
|
(400.6
|
)
|
(214.1
|
)
|
(325.6
|
)
|
|||||
|
Cash dividends paid
|
(378.6
|
)
|
(348.5
|
)
|
(329.1
|
)
|
|||||
|
Distributions paid to noncontrolling interests
|
(0.4
|
)
|
(0.2
|
)
|
—
|
|
|||||
|
Other
|
(2.3
|
)
|
0.1
|
|
(0.1
|
)
|
|||||
|
Cash used in financing activities
|
(708.1
|
)
|
(468.6
|
)
|
(575.0
|
)
|
|||||
|
(Decrease) increase in cash and cash equivalents
|
(138.1
|
)
|
145.7
|
|
1.3
|
|
|||||
|
Cash and cash equivalents at beginning of year
|
213.3
|
|
67.6
|
|
66.3
|
|
|||||
|
Cash and cash equivalents at end of year
|
$
|
75.2
|
|
$
|
213.3
|
|
$
|
67.6
|
|
||
The accompanying notes are an integral part of these financial statements.
72
REPUBLIC SERVICES, INC.
NOTES TO CONSOLIDATED FINANCIAL STATEMENTS
1. BASIS OF PRESENTATION
Republic Services, Inc., a Delaware corporation, and its consolidated subsidiaries (also referred to collectively as Republic, the Company, we, us, or our) is the second largest provider of non-hazardous solid waste collection, transfer, recycling and disposal services in the United States, as measured by revenue. We manage and evaluate our operations through
three
geographic regions – East, Central and West, which we have identified as our reportable segments.
The consolidated financial statements include the accounts of Republic and its wholly owned and majority owned subsidiaries in accordance with accounting principles generally accepted in the United States of America (U.S. GAAP). We account for investments in entities in which we do not have a controlling financial interest under either the equity method or cost method of accounting, as appropriate. All material intercompany accounts and transactions have been eliminated in consolidation.
For comparative purposes, certain prior year amounts have been reclassified to conform to the current year presentation. All dollar amounts in tabular presentations are in millions, except per share amounts and unless otherwise noted.
|
2.
|
SUMMARY OF SIGNIFICANT ACCOUNTING POLICIES
|
Management’s Estimates and Assumptions
In preparing our financial statements, we make numerous estimates and assumptions that affect the amounts reported in these financial statements and accompanying notes. We must make these estimates and assumptions because certain information we use is dependent on future events, cannot be calculated with a high degree of precision from data available or simply cannot be readily calculated based on generally accepted methodologies. In preparing our financial statements, the more critical and subjective areas that deal with the greatest amount of uncertainty relate to our accounting for our long-lived assets, including recoverability, landfill development costs, and final capping, closure and post-closure costs; our valuation allowances for accounts receivable and deferred tax assets; our liabilities for potential litigation, claims and assessments; our liabilities for environmental remediation, multiemployer pension plans, employee benefit plans, deferred taxes, uncertain tax positions, and insurance reserves; and our estimates of the fair values of assets acquired and liabilities assumed in any acquisition. Each of these items is discussed in more detail elsewhere in these Notes to Consolidated Financial Statements. Our actual results may differ significantly from our estimates.
Cash and Cash Equivalents
We consider liquid investments with a maturity at the date of acquisition of three months or less to be cash equivalents.
We may have net book credit balances in our primary disbursement accounts at the end of a reporting period. We classify such credit balances as accounts payable in our consolidated balance sheets as checks presented for payment to these accounts are not payable by our banks under overdraft arrangements, and, therefore, do not represent short-term borrowings. As of
December 31, 2014
and
2013
, there were net book credit balances of
$36.4 million
and
$39.6 million
in our primary disbursement accounts that were classified as accounts payable on our consolidated balance sheets.
Concentration of Credit Risk
Financial instruments that potentially subject us to concentrations of credit risk consist of cash and cash equivalents, trade accounts receivable and derivative instruments. We place our cash and cash equivalents with high quality financial institutions. Such balances may be in excess of FDIC insured limits. To manage the related credit exposure, we continually monitor the credit worthiness of the financial institutions where we have deposits. Concentrations of credit risk with respect to trade accounts receivable are limited due to the wide variety of customers and markets in which we provide services, as well as the dispersion of our operations across many geographic areas. We provide services to commercial, industrial, municipal and residential customers in the United States and Puerto Rico. We perform ongoing credit evaluations of our customers, but generally do not require collateral to support customer receivables. We establish an allowance for doubtful accounts based on various factors including the credit risk of specific customers, age of receivables outstanding, historical trends, economic conditions and other information.
73
Accounts Receivable, Net
Accounts receivable represent receivables from customers for collection, transfer, recycling, disposal and other services. Our receivables are recorded when billed or when the related revenue is earned, if earlier, and represent claims against third parties that will be settled in cash. The carrying value of our receivables, net of the allowance for doubtful accounts and customer credits, represents their estimated net realizable value. Provisions for doubtful accounts are evaluated on a monthly basis and are recorded based on our historical collection experience, the age of the receivables, specific customer information and economic conditions. We also review outstanding balances on an account-specific basis. In general, reserves are provided for accounts receivable in excess of 90 days outstanding. Past due receivable balances are written-off when our collection efforts have been unsuccessful in collecting amounts due.
The following table reflects the activity in our allowance for doubtful accounts for the years ended December 31:
|
2014
|
2013
|
2012
|
|||||||||
|
Balance at beginning of year
|
$
|
38.3
|
|
$
|
45.3
|
|
$
|
48.1
|
|
||
|
Additions charged to expense
|
22.6
|
|
16.1
|
|
29.7
|
|
|||||
|
Accounts written-off
|
(22.0
|
)
|
(23.1
|
)
|
(32.5
|
)
|
|||||
|
Balance at end of year
|
$
|
38.9
|
|
$
|
38.3
|
|
$
|
45.3
|
|
||
Restricted Cash and Marketable Securities
As of
December 31, 2014
, we had
$115.6 million
of restricted cash and marketable securities. We obtain funds through the issuance of tax-exempt bonds for the purpose of financing qualifying expenditures at our landfills, transfer stations, collection and recycling centers. The funds are deposited directly into trust accounts by the bonding authorities at the time of issuance. As the use of these funds is contractually restricted, and we do not have the ability to use these funds for general operating purposes, they are classified as restricted cash and marketable securities in our consolidated balance sheets.
In the normal course of business, we may be required to provide financial assurance to governmental agencies and a variety of other entities in connection with municipal residential collection contracts, closure or post-closure of landfills, environmental remediation, environmental permits, and business licenses and permits as a financial guarantee of our performance. At several of our landfills, we satisfy financial assurance requirements by depositing cash into restricted trust funds or escrow accounts.
Property and Equipment
We record property and equipment at cost. Expenditures for major additions and improvements to facilities are capitalized, while maintenance and repairs are charged to expense as incurred. When property is retired or otherwise disposed, the related cost and accumulated depreciation are removed from the accounts and any resulting gain or loss is reflected in the consolidated statements of income.
We revise the estimated useful lives of property and equipment acquired through business acquisitions to conform with our policies. We depreciate assets over their estimated useful lives using the straight-line method. We assume no salvage value for our depreciable property and equipment. The estimated useful lives of our property and equipment are as follows:
|
|
|
|
Buildings and improvements
|
7 - 40 years
|
|
Vehicles
|
5 - 12 years
|
|
Landfill equipment
|
5 - 7 years
|
|
Other equipment
|
3 - 15 years
|
|
Furniture and fixtures
|
10 years
|
Landfill development costs are also included in property and equipment. Landfill development costs include direct costs incurred to obtain landfill permits and direct costs incurred to acquire, construct and develop sites, as well as final capping, closure and post-closure assets. These costs are amortized or depleted based on consumed airspace. All indirect landfill development costs are expensed as incurred. For additional information, see Note 8,
Landfill and Environmental Costs.
74
Capitalized Interest
We capitalize interest on landfill cell construction and other construction projects if they meet the following criteria:
|
•
|
Total construction costs are
$50,000
or greater;
|
|
•
|
The construction phase is
one
month or longer; and
|
|
•
|
The assets have a useful life of
one
year or longer.
|
Interest is capitalized on qualified assets while they undergo activities to ready them for their intended use. Capitalization of interest ceases once an asset is placed into service or if construction activity is suspended for more than a brief period of time. Our interest capitalization rate is based on our weighted average cost of indebtedness. Interest capitalized was
$6.4 million
,
$7.3 million
and
$8.4 million
for the years ended
December 31, 2014
,
2013
and
2012
, respectively.
Fair Value of Financial Instruments
Our financial instruments include cash and cash equivalents, restricted cash and marketable securities, fuel, commodity and interest rate hedges, long-term debt and assets in our defined benefit pension plan. Accounting standards include disclosure requirements around fair values used for certain financial instruments and establish a fair value hierarchy. The hierarchy prioritizes valuation inputs into three levels based on the extent to which inputs used in measuring fair value are observable in the market. Each fair value measurement is reported in one of three levels:
|
•
|
Level 1 – inputs are based upon unadjusted quoted prices for identical instruments traded in active markets.
|
|
•
|
Level 2 – inputs are based upon quoted prices for similar instruments in active markets, quoted prices for identical or similar instruments in markets that are not active, and model-based valuation techniques for which all significant assumptions are observable in the market or can be corroborated by observable market data for substantially the full term of the assets or liabilities.
|
|
•
|
Level 3 – inputs are generally unobservable and typically reflect management’s estimates of assumptions that market participants would use in pricing the asset or liability. The fair values are therefore determined using model-based techniques that include option pricing models, discounted cash flow models, and similar techniques.
|
See Note 11,
Employee Benefit Plans,
and Note 16,
Financial Instruments
, for fair value disclosures related to our defined benefit pension plan investments and financial instruments, respectively.
Investments Other Than Derivatives
Investments other than derivatives primarily include money market funds, common stock, mutual funds, real estate investment trusts, U.S. government and agency securities, municipal and corporate bonds, foreign government and corporate bonds. In general, and where applicable, we use quoted prices in active markets for identical assets or liabilities to determine fair value. This pricing methodology applies to our Level 1 investments, such as money market funds, common stock and certain mutual funds. If quoted prices in active markets for identical assets or liabilities are not available to determine fair value, then we use quoted prices for similar assets and liabilities or inputs other than the quoted prices that are observable either directly or indirectly. These investments are included in Level 2 and consist primarily of corporate bonds, foreign government bonds, real estate investment trusts and certain agency securities.
Derivative Financial Instruments
We use derivative financial instruments to manage our risk associated with changing interest rates and changing prices for commodities we frequently purchase or sell by creating offsetting market exposures. We use interest rate swap agreements to manage risk associated with fluctuations in interest rates. We have entered into multiple agreements designated as cash flow hedges to mitigate some of our exposure to changes in diesel fuel prices and prices of certain recycling commodities.
All derivatives are measured at fair value and recognized in the balance sheet as assets or liabilities, as appropriate. For derivatives designated as cash flow hedges, changes in fair value of the effective portions of derivative instruments are reported in stockholders’ equity as components of other comprehensive income until the forecasted transaction occurs or is not probable of occurring. When the forecasted transaction occurs or is not probable of occurring, the realized net gain or loss is then recognized in the consolidated statements of income. Changes in fair value of the ineffective portions of derivative instruments are recognized currently in earnings.
The fair values of our diesel fuel and recycling commodity hedges are determined using standard valuation models with assumptions about prices and other relevant information based on those observed in the underlying markets (Level 2 in the fair
75
value hierarchy). The estimated fair values of derivatives used to hedge risks fluctuate over time and should be viewed in relation to the underlying hedged transactions.
Landfill and Environmental Costs
Life Cycle Accounting
We use life-cycle accounting and the units-of-consumption method to recognize certain landfill costs over the life of the site. In life cycle accounting, all costs to acquire and construct a site are capitalized, and charged to expense based on the consumption of cubic yards of available airspace.
Costs and airspace estimates are developed at least annually by engineers. We use these estimates to adjust the rates we use to deplete capitalized costs. Changes in these estimates primarily relate to changes in available airspace, inflation and applicable regulations. Changes in available airspace include, but are not limited to, changes due to the addition of airspace lying in probable expansion areas, airspace consumed and changes in engineering estimates.
Probable Expansion Airspace
We classify landfill disposal capacity as either permitted (having received the final permit from the applicable regulatory agency) or as probable expansion airspace. Before airspace included in an expansion area is determined to be probable expansion airspace and, therefore, is included in our calculation of total available disposal capacity, all of the following criteria must be met:
|
•
|
We own the land associated with the expansion airspace or control it pursuant to an option agreement;
|
|
•
|
We are committed to supporting the expansion project financially and with appropriate resources;
|
|
•
|
There are no identified fatal flaws or impediments associated with the project, including political impediments;
|
|
•
|
Progress is being made on the project;
|
|
•
|
The expansion is attainable within a reasonable time frame; and
|
|
•
|
We believe it is likely the expansion permit will be received.
|
Upon meeting our expansion criteria, the rates used at each applicable landfill to expense costs to acquire, construct, cap, close and maintain a site during the post-closure period are adjusted to include both the probable expansion airspace and the additional costs to be capitalized or accrued associated with that expansion airspace.
We have identified three steps that landfills generally follow to obtain expansion permits. These steps are as follows:
|
•
|
Obtaining approval from local authorities;
|
|
•
|
Submitting a permit application to state authorities; and
|
|
•
|
Obtaining permit approval from state authorities.
|
We continually monitor our progress toward obtaining permits for each of our sites with probable airspace. If we determine that a landfill expansion area no longer meets our criteria, the probable expansion airspace is removed from the landfill’s total available capacity and the rates used at the landfill to deplete costs to acquire, construct, cap, close and maintain a site during the post-closure period are adjusted accordingly. In addition, any amounts capitalized for the probable expansion airspace are charged to expense in the period in which it is determined that the criteria are no longer met.
Capitalized Landfill Costs
Capitalized landfill costs include expenditures for land, permitting, cell construction and environmental structures. Capitalized permitting and cell construction costs are limited to direct costs relating to these activities, including legal, engineering and construction costs associated with excavation, natural and synthetic liners, construction of leachate collection systems, installation of methane gas collection and monitoring systems, installation of groundwater monitoring wells and other costs associated with the development of the site. Interest is capitalized on landfill construction projects while the assets are undergoing activities to ready them for their intended use. Capitalized landfill costs also include final capping, closure and post-closure assets and are depleted as airspace is consumed using the units-of-consumption method.
Costs related to acquiring land, excluding the estimated residual value of unpermitted, non-buffer land, and costs related to permitting and cell construction are depleted as airspace is consumed using the units-of-consumption method.
Capitalized landfill costs also may include an allocation of purchase price paid for landfills. For landfills purchased as part of a group of assets, the purchase price assigned to the landfill is determined based on the estimated fair value of the landfill relative
76
to the fair value of other assets within the acquired group. If the landfill meets our expansion criteria, the purchase price is further allocated between permitted airspace and expansion airspace based on the respective ratios to total available airspace. Landfill purchase price is amortized using the units-of-consumption method over the total available airspace, including probable expansion airspace, where appropriate.
Final Capping, Closure and Post-Closure Costs
Final capping
We have future obligations for final capping, closure and post-closure costs with respect to the landfills we own or operate as set forth in applicable landfill permits. The permit requirements are based on the Subtitle C and Subtitle D regulations of the Resource Conservation and Recovery Act, as implemented and applied on a state-by-state basis. We define final capping as activities required to permanently cover a portion of a landfill that has been completely filled with waste. Final capping typically includes installing flexible membrane and geosynthetic clay liners, drainage and compact soil layers, and topsoil, and is constructed over an area of the landfill where total airspace capacity has been consumed and waste disposal operations have ceased. These final capping activities occur in phases as needed throughout the operating life of a landfill as specific areas are filled to capacity and the final elevation for that specific area is reached in accordance with the provisions of the operating permit. We consider final capping events to be discrete activities that are recognized as asset retirement obligations separately from other closure and post-closure obligations. As a result, we use a separate rate per ton for recognizing the principal amount of the liability and related asset associated with each capping event. We amortize the asset recorded pursuant to this approach as waste volume related to the capacity covered by the capping event is placed into the landfill based on the consumption of cubic yards of available airspace.
Closure and post-closure
Closure and post-closure activities occur after the entire landfill ceases to accept waste and closes. These activities involve methane gas control, leachate management and groundwater monitoring, surface water monitoring and control, and other operational and maintenance activities that occur after the site ceases to accept waste. Obligations associated with monitoring and controlling methane gas migration and emissions are set forth in applicable landfill permits and these requirements are based on the provisions of the Clean Air Act. The post-closure period generally runs for
30
years after final site closure for municipal solid waste landfills and a shorter period for construction and demolition landfills and inert landfills. We recognize asset retirement obligations and the related amortization expense for closure and post-closure (excluding obligations for final capping) using the units-of-consumption method over the total remaining capacity of the landfill, including probable expansion airspace.
Estimated future expenditures
Estimates of future expenditures for final capping, closure and post-closure are developed at least annually by engineers. Management reviews these estimates and our operating and accounting personnel use them to adjust the rates used to capitalize and amortize these costs. These estimates involve projections of costs that will be incurred during the remaining life of the landfill for final capping activities, after the landfill ceases operations and during the legally required post-closure monitoring period. We currently retain post-closure responsibility for
125
closed landfills.
Fair value measurements
In general, we engage third parties to perform most of our final capping, closure and post-closure activities. Accordingly, the fair value of these activities is based on quoted and actual prices paid for similar work. We also perform some of our final capping, closure and post-closure activities using internal resources. Where we expect internal resources to be used to fulfill an asset retirement obligation, we add a profit margin to the estimated cost of such services to better reflect their fair value. If we perform these services internally, the added profit margin is recognized as a component of operating income in the period the obligation is settled.
Our estimates of costs to discharge asset retirement obligations for landfills are developed in today’s dollars. These costs are inflated each year to reflect a normal escalation of prices up to the year they are expected to be paid. We use a
2.3%
inflation rate, which is based on the
ten
-year historical moving average increase of the U.S. Consumer Price Index, and is the rate used by most waste industry participants.
These estimated costs are then discounted to their present values using a credit-adjusted, risk-free interest rate. In general, the credit-adjusted, risk-free interest rate we used for liability recognition was
4.50%
and
5.00%
for the years ended
December 31, 2014
and
2013
, respectively, which was based on the estimated all-in yield we would have needed to offer to sell
thirty
-year
77
debt in the public market. However, as part of the initial application of purchase accounting, our capping, closure and post-closure obligations acquired from Allied Waste Industries, Inc. (Allied) were recorded at their fair values as of the acquisition date, and were discounted using a rate of
9.75%
due to market conditions at the time of the acquisition.
Changes in assets retirement obligations
A liability for an asset retirement obligation is recognized in the period in which it is incurred and is initially measured at fair value. The offset to the liability is capitalized as part of the carrying amount of the related long-lived asset. Changes in the liabilities due to revisions to estimated future cash flows are recognized by increasing or decreasing the liabilities with the offsets adjusting the carrying amounts of the related long-lived assets, and may also require immediate adjustments to amortization expense in the consolidated statement of income. Upward revisions in the amount of undiscounted estimated cash flows used to record a liability are discounted using the credit-adjusted, risk-free interest rate in effect at the time of the change. Downward revisions in the amount of undiscounted estimated cash flows used to record a liability are discounted using the credit-adjusted, risk-free rate that existed when the original liability was recognized.
Changes in asset retirement obligations due to the passage of time are measured by recognizing accretion expense in a manner that results in a constant effective interest rate being applied to the average carrying amount of the liability. The effective interest rate used to calculate accretion expense is our credit-adjusted, risk-free interest rate in effect at the time the liabilities were recorded.
We review our calculations with respect to landfill asset retirement obligations at least annually. If there is a significant change in the facts and circumstances related to a landfill during the year, we will review our calculations for the landfill as soon as practical after the change has occurred.
Landfill operating expenses
Costs associated with daily maintenance activities and environmental compliance during the operating life of the landfill are expensed as incurred. These costs include, among other things, leachate treatment and disposal, methane gas and groundwater monitoring and systems maintenance, interim cap maintenance, costs associated with the application of daily cover materials, and the legal and administrative costs of ongoing environmental compliance.
Environmental Liabilities
We are subject to an array of laws and regulations relating to the protection of the environment, and we remediate sites in the ordinary course of our business. Under current laws and regulations, we may be responsible for environmental remediation at sites that we either own or operate, including sites that we have acquired, or sites where we have (or a company that we have acquired has) delivered waste. Our environmental remediation liabilities primarily include costs associated with remediating groundwater, surface water and soil contamination, as well as controlling and containing methane gas migration and the related legal costs. To estimate our ultimate liability at these sites, we evaluate several factors, including the nature and extent of contamination at each identified site, the required remediation methods, timing of expenditures, the apportionment of responsibility among the potentially responsible parties and the financial viability of those parties. We accrue for costs associated with environmental remediation obligations when such costs are probable and reasonably estimable in accordance with accounting for loss contingencies. We periodically review the status of all environmental matters and update our estimates of the likelihood of and future expenditures for remediation as necessary. Changes in the liabilities resulting from these reviews are recognized currently in earnings in the period in which the adjustment is known. Adjustments to estimates are reasonably possible in the near term and may result in changes to recorded amounts. With the exception of those obligations assumed in the acquisition of Allied, environmental obligations are recorded on an undiscounted basis. Environmental obligations assumed in the acquisition of Allied, which were initially estimated on a discounted basis, are accreted to full value over time through charges to interest expense. Adjustments arising from changes in amounts and timing of estimated costs and settlements may result in increases or decreases in these obligations and are calculated on a discounted basis as they were initially estimated on a discounted basis. These adjustments are charged to operating income when they are known. We perform a comprehensive review of our environmental obligations annually and also review changes in facts and circumstances associated with these obligations at least quarterly. We have not reduced the liabilities we have recorded for recoveries from other potentially responsible parties or insurance companies.
78
Business Combinations
We acquire businesses in the waste industry, including non-hazardous waste collection, transfer, recycling and disposal operations, as part of our growth strategy. Businesses are included in the consolidated financial statements from the date of acquisition.
We recognize, separately from goodwill, the identifiable assets acquired and liabilities assumed at their estimated acquisition-date fair values. We measure and recognize goodwill as of the acquisition date as the excess of: (1) the aggregate of the fair value of consideration transferred, the fair value of any noncontrolling interest in the acquiree (if any) and the acquisition date fair value of our previously held equity interest in the acquiree (if any), over (2) the fair value of assets acquired and liabilities assumed. If information about facts and circumstances existing as of the acquisition date is incomplete by the end of the reporting period in which a business combination occurs, we report provisional amounts for the items for which the accounting is incomplete. The measurement or allocation period ends once we receive the information we are seeking; however, this period will not exceed one year from the acquisition date. Any material adjustments recognized during the measurement period will be reflected retrospectively in the consolidated financial statements of the subsequent period. We recognize third-party transaction related costs as expense currently in the period in which they are incurred.
Goodwill and Other Intangible Assets
We annually test goodwill for impairment at December 31, or when an indicator of impairment exists. We test goodwill for impairment using the two-step process. The first step is a screen for potential impairment, while the second step measures the amount of the impairment, if any. The first step of the goodwill impairment test compares the fair value of a reporting unit with its carrying amount, including goodwill.
We have defined our reporting units to be consistent with our operating segments: East, Central and West. In determining fair value, we primarily use discounted future cash flows and operating results based on a comparative multiple of earnings or revenues.
Significant estimates used in our fair value calculation using discounted future cash flows include: (1) estimates of future revenue and expense growth by reporting unit, which we estimate to range from
3%
to
5%
annually; (2) future estimated effective tax rates, which we estimate to be
40%
; (3) future estimated capital expenditures and future required investments in working capital; (4) estimated discount rates, which we estimate to range between
7%
and
8%
; and (5) the future terminal value of the reporting unit, which is based on its ability to exist into perpetuity. Significant estimates used in the fair value calculation utilizing market value multiples include: (a) estimated future growth potential of the reporting unit; (b) estimated multiples of revenue or earnings a willing buyer is likely to pay; and (c) estimated control premium a willing buyer is likely to pay.
In addition, we evaluate a reporting unit for impairment if events or circumstances change between annual tests, indicating a possible impairment. Examples of such events or circumstances include: (1) a significant adverse change in legal factors or in the business climate; (2) an adverse action or assessment by a regulator; (3) a more likely than not expectation that a reporting unit or a significant portion thereof will be sold; (4) continued or sustained losses at a reporting unit; (5) a significant decline in our market capitalization as compared to our book value; or (6) the testing for recoverability of a significant asset group within the reporting unit.
We assign assets and liabilities from our corporate operating segment to our three reporting units to the extent that such assets or liabilities relate to the cash flows of the reporting unit and would be included in determining the reporting unit’s fair value.
In preparing our annual test for impairment as of
December 31, 2014
, we determined that our indicated fair value of total invested capital exceeded our total market capitalization. We believe one of the primary reconciling differences between the indicated fair value of total invested capital and our total market capitalization is due to a control premium. We believe the control premium represents the value a market participant could extract as savings or synergies by obtaining control.
As of
December 31, 2014
, we determined that the indicated fair value of our reporting units exceeded their carrying value by approximately
50%
on average and, therefore, we noted no indicators of impairment at our reporting units.
Our operating segments, which also represent our reporting units, are comprised of several vertically integrated businesses. When an individual business within an integrated operating segment is divested, goodwill is allocated to that business based on its fair value relative to the fair value of its operating segment.
Other intangible assets include values assigned to customer relationships, franchise agreements, other municipal agreements and non-compete agreements, and are amortized generally on a straight-line basis over periods ranging from
1
to
21 years
.
79
Asset Impairments
We continually consider whether events or changes in circumstances have occurred that may warrant revision of the estimated useful lives of our long-lived assets (other than goodwill) or whether the remaining balances of those assets should be evaluated for possible impairment. Long-lived assets include, for example, capitalized landfill costs, other property and equipment, and identifiable intangible assets. Events or changes in circumstances that may indicate that an asset may be impaired include the following:
|
•
|
A significant decrease in the market price of an asset or asset group;
|
|
•
|
A significant adverse change in the extent or manner in which an asset or asset group is being used or in its physical condition;
|
|
•
|
A significant adverse change in legal factors or in the business climate that could affect the value of an asset or asset group, including an adverse action or assessment by a regulator;
|
|
•
|
An accumulation of costs significantly in excess of the amount originally expected for the acquisition or construction of a long-lived asset;
|
|
•
|
A current period operating or cash flow loss combined with a history of operating or cash flow losses or a projection or forecast that demonstrates continuing losses associated with the use of a long-lived asset or asset group;
|
|
•
|
A current expectation that, more likely than not, a long-lived asset or asset group will be sold or otherwise disposed of significantly before the end of its previously estimated useful life; or
|
|
•
|
An impairment of goodwill at a reporting unit.
|
There are certain indicators listed above that require significant judgment and understanding of the waste industry when applied to landfill development or expansion. For example, a regulator may initially deny a landfill expansion permit application though the expansion permit is ultimately granted. In addition, management may periodically divert waste from one landfill to another to conserve remaining permitted landfill airspace. Therefore, certain events could occur in the ordinary course of business and not necessarily be considered indicators of impairment due to the unique nature of the waste industry.
If indicators of impairment exist, the asset or asset group is reviewed to determine whether its recoverability is impaired. We assess the recoverability of the asset or asset group by comparing its carrying value to an estimate (or estimates) of its undiscounted future cash flows over its remaining life. If the estimated undiscounted cash flows are not sufficient to recover the carrying value of the asset or asset group, we measure an impairment loss as the amount by which the carrying amount of the asset exceeds its fair value. The loss is recorded in the consolidated statement of income in the period in which such impairment is identified. Estimating future cash flows requires significant judgment, and our projections of future cash flows and remaining useful lives may vary materially from actual results.
Insurance Reserves
Our insurance programs for workers' compensation, commercial general and auto liability, environmental and remediation liability, and employee-related health care benefits are subject to high deductible insurance policies. Accruals for insurance reserves are based on claims filed and estimates of claims incurred but not reported. We consider our past claims experience, including both frequency and settlement amount of claims, in determining these estimates. It is possible that recorded reserves may not be adequate to cover the future payment of claims. Adjustments, if any, to estimates recorded resulting from ultimate claim payments will be reflected in the consolidated statements of income in the periods in which such adjustments are known. In general, our insurance reserves are recorded on an undiscounted basis; however, the insurance liabilities we acquired in the Allied acquisition have been recorded at estimated fair value, and therefore have been discounted to present value based on our estimate of the timing of the related cash flows.
80
Costs Associated with Exit Activities
We record costs associated with exit activities such as employee termination benefits that represent a one-time benefit when management approves and commits to a plan of termination, and communicates the termination arrangement to the employees, or over the future service period, if any. Other costs associated with exit activities may include contract termination costs, including costs related to leased facilities to be abandoned or subleased, and facility and employee relocation costs.
Contingent Liabilities
We are subject to various legal proceedings, claims and regulatory matters, the outcomes of which are subject to significant uncertainty. In general, we determine whether to disclose or accrue for loss contingencies based on an assessment of whether the risk of loss is remote, reasonably possible or probable, and whether it can be reasonably estimated. We assess our potential liability relating to litigation and regulatory matters based on information available to us. Management develops its assessment based on an analysis of possible outcomes under various strategies. We accrue for loss contingencies when such amounts are probable and reasonably estimable. If a contingent liability is only reasonably possible, we disclose the potential range of the loss, if estimable. Contingent liabilities recorded in purchase accounting are recorded at their fair values. These fair values may be different from the values we would have otherwise recorded, had the contingent liability not been assumed as part of an acquisition of a business.
Accumulated Other Comprehensive Income
Accumulated other comprehensive income is a component of stockholders’ equity and includes the effective portion of the net changes in fair value of our cash flow hedges that consist of prices for diesel fuel and recycled commodities, net of tax, settlement and amortization of our interest rate locks and certain adjustments to liabilities associated with our employee defined benefit pension plan liabilities, net of tax.
Revenue Recognition
We generally provide services under contracts with municipalities or individual customers. Municipal and commercial contracts are generally long-term and often have renewal options. Advance billings are recorded as deferred revenue, and revenue is recognized over the period services are provided.
We recognize revenue when all four of the following criteria are met:
|
•
|
Persuasive evidence of an arrangement exists such as a service agreement with a municipality, a hauling customer or a disposal customer;
|
|
•
|
Services have been performed such as the collection and hauling of waste or the disposal of waste at a disposal facility we own or operate;
|
|
•
|
The price of the services provided to the customer is fixed or determinable; and
|
|
•
|
Collectibility is reasonably assured.
|
Income Taxes
We are subject to income taxes in the United States and Puerto Rico. We record deferred income taxes to reflect the effects of temporary differences between the carrying amounts of assets and liabilities and their tax bases using enacted tax rates that we expect to be in effect when the taxes are actually paid or recovered.
We record net deferred tax assets to the extent we believe these assets will more likely than not be realized. In making these determinations, we consider all available positive and negative evidence, including scheduled reversals of deferred tax liabilities, tax planning strategies, projected future taxable income and recent financial operating results. If we determine that we would be able to realize a deferred income tax asset in the future in excess of its net recorded amount, we would make an adjustment to the valuation allowance, which would reduce the provision for income taxes.
A tax benefit from an uncertain tax position may be recognized when it is more likely than not that the position will be sustained upon examination, including resolutions of any related appeals or litigation processes, based on the technical merits. Income tax positions must meet a more-likely-than-not recognition threshold at the effective date to be recognized.
We recognize interest and penalties related to uncertain tax positions in the provision for income taxes in the accompanying consolidated statements of income. Accrued interest and penalties are included in other accrued liabilities, and deferred income taxes and other long-term tax liabilities, in the consolidated balance sheets.
81
Defined Benefit Pension Plan
We currently have
one
qualified defined benefit pension plan, the BFI Retirement Plan (the Plan). The Plan covers certain current and former employees of Allied in the United States, including some employees subject to collective bargaining agreements. The Plan’s benefit formula is based on a percentage of compensation as defined in the Plan document. However, the benefits of approximately
97%
of the current plan participants were frozen upon Allied’s acquisition of BFI in 1999.
Our pension contributions are made in accordance with funding standards established by the Employee Retirement Income Security Act of 1974 and the Internal Revenue Code, as amended by the Pension Protection Act of 2006. The Plan’s assets have been invested as determined by our Employee Benefits Committee. We annually review and adjust the Plan’s asset allocation as deemed necessary.
The benefit obligation and associated income or expense related to the Plan are determined using annually established assumptions for discount rates, expected rates of return and average rates for compensation increases. We determine the discount rate based on a model that matches the timing and amount of expected benefit payments to maturities of high quality bonds priced as of the pension plan measurement date. When that timing does not correspond to a published high-quality bond rate, our model uses an expected yield curve to determine an appropriate current discount rate. The yields on the bonds are used to derive a discount rate for the liability. In developing our expected rate of return assumption, we evaluate long-term expected and historical actual returns on the plan assets, giving consideration to our asset mix and the anticipated duration of our plan obligations. The average rate of compensation increase reflects our expectations of average pay increases over the period benefits are earned. Our assumptions are reviewed annually and adjusted as deemed necessary.
Equity-Based Compensation Plans
We recognize equity-based compensation expense on the estimated grant-date fair value of stock options and similar equity instruments issued as compensation to employees over the requisite service periods.
Cash flows resulting from tax benefits related to tax deductions in excess of those recorded for compensation expense, resulting from the exercise of stock options, are classified as cash flows from financing activities. All other tax benefits related to stock options have been presented as a component of cash flows from operating activities.
We recognize compensation expense on a straight-line basis over the requisite service period for each separately vesting portion of the award, or to the employee’s retirement-eligible date, if earlier.
The fair value of each option on the date of grant is estimated using a lattice binomial option-pricing model based on certain valuation assumptions. Expected volatility is based on the weighted average of the most recent one year volatility and a historical rolling average volatility of our stock over the expected life of the option. The risk-free interest rates are based on the published U.S. Treasury yield curve in effect at the time of the grant for instruments with a similar life. The dividend yield reflects our dividend yield at the date of grant. The expected life represents the period that the stock options are expected to be outstanding, taking into consideration the contractual terms of the options and our employees’ historical exercise and post-vesting employment termination behavior, weighted to reflect the job level demographic profile of the employees receiving the option grants. The estimated forfeiture rate used to record compensation expense is based on historical forfeitures and is adjusted periodically based on actual results.
Leases
We lease property and equipment in the ordinary course of our business. Our most significant lease obligations are for property and equipment specific to our industry, including real property operated as a landfill or transfer station and operating equipment. Our leases have varying terms. Some may include renewal or purchase options, escalation clauses, restrictions, penalties or other obligations that we consider in determining minimum lease payments. Leases are classified as either operating leases or capital leases, as appropriate.
Operating Leases
Many of our leases are operating leases. This classification generally can be attributed to either (1) relatively low fixed minimum lease payments (including, for example, real property lease payments that are not fixed and vary based on the volume of waste we receive or process), or (2) minimum lease terms that are much shorter than the assets’ economic useful lives. We expect that, in the normal course of business, our operating leases will be renewed, replaced by other leases, or replaced with fixed asset expenditures.
82
Capital Leases
We capitalize assets acquired under capital leases at the inception of each lease and amortize them to depreciation expense over the lesser of the useful life of the asset or the lease term on either a straight-line or a units-of-consumption basis, depending on the asset leased. We record the present value of the related lease payments as a debt obligation. Our capital lease liability relates primarily to certain long-term landfill operating agreements that require minimum lease payments with offsetting capital lease assets recorded as part of the landfill development costs.
Related Party Transactions
It is our policy that transactions with related parties must be on terms that, on the whole, are no less favorable than those that would be available from unaffiliated parties.
New Accounting Pronouncements
In May 2014, the Financial Accounting Standards Board amended the Accounting Standards Codification and created Topic 606, Revenue from Contracts with Customers, to clarify the principles for recognizing revenue. This guidance requires that an entity recognize revenue to depict the transfer of promised goods or services to customers at an amount that reflects the consideration to which the entity expects to be entitled in exchange for those goods or services. This guidance will be effective for Republic beginning January 1, 2017 and must be adopted using either a full retrospective approach for all periods presented in the period of adoption or a modified retrospective approach. Early adoption is not permitted. We are currently assessing the method of adoption and the potential impact this guidance may have on our consolidated financial position, results of operations or cash flows.
3.
BUSINESS ACQUISITIONS
We acquired various solid waste businesses during the years ended
December 31, 2014
and
2013
. The purchase price paid for these acquisitions and the allocations of the purchase price follow:
|
2014
|
2013
|
||||||
|
Purchase price:
|
|||||||
|
Cash used in acquisitions, net of cash acquired
|
$
|
195.7
|
|
$
|
68.7
|
|
|
|
Holdbacks
|
25.4
|
|
8.4
|
|
|||
|
Fair value, future guaranteed payments
|
6.8
|
|
—
|
|
|||
|
Fair value, future minimum lease payments
|
25.2
|
|
—
|
|
|||
|
Total
|
$
|
253.1
|
|
$
|
77.1
|
|
|
|
Allocated as follows:
|
|||||||
|
Accounts receivable
|
8.5
|
|
0.8
|
|
|||
|
Restricted cash
|
16.8
|
|
—
|
|
|||
|
Landfill airspace
|
26.6
|
|
—
|
|
|||
|
Property and equipment
|
76.1
|
|
18.2
|
|
|||
|
Other assets
|
5.6
|
|
0.2
|
|
|||
|
Future service obligations
|
(11.0
|
)
|
—
|
|
|||
|
Closure and post-closure liabilities
|
(3.2
|
)
|
—
|
|
|||
|
Other liabilities
|
(21.8
|
)
|
(4.3
|
)
|
|||
|
Fair value of tangible assets acquired and liabilities assumed
|
97.6
|
|
14.9
|
|
|||
|
Excess purchase price to be allocated
|
$
|
155.5
|
|
$
|
62.2
|
|
|
|
Excess purchase price to be allocated as follows:
|
|||||||
|
Other intangible assets
|
$
|
46.8
|
|
$
|
23.2
|
|
|
|
Goodwill
|
108.7
|
|
39.0
|
|
|||
|
Total allocated
|
$
|
155.5
|
|
$
|
62.2
|
|
|
The purchase price allocations are preliminary and are based on information existing at the acquisition dates. Accordingly, the purchase price allocations are subject to change. Substantially all of the goodwill and intangible assets recorded for these
83
acquisitions are deductible for tax purposes. These acquisitions are not material to the Company's results of operations, individually or in the aggregate. As a result, no pro forma financial information is provided.
In August 2014, we entered into a life-of-site operating agreement for the City of San Angelo Landfill located in Texas, which we have accounted for as the acquisition of a business. Previously, we operated the site on behalf of the City of San Angelo under an agreement that expired in July 2014. Consideration transferred included cash of
$10.3 million
, of which
$9.6 million
has been paid, and future guaranteed payments of
$6.8 million
. We assumed future service obligations of
$11.0 million
and closure and post-closure obligations of
$3.2 million
. We allocated
$26.6 million
of purchase price to landfill airspace and no purchase price was allocated to goodwill.
In October 2014, we acquired all of the shares of Rainbow Disposal Co., Inc. (Rainbow) for
$112.0 million
cash, of which
$16.8 million
of the funds were placed into an escrow account pursuant to a holdback arrangement and classified as restricted cash. We also assumed a capital lease agreement with a fair value of
$25.2 million
for operational facilities in Southern California, and entered into agreements not to compete, along with other restrictive covenants, with key executives. We allocated
$53.5 million
of the purchase price to property and equipment,
$34.8 million
to intangible assets, and we assumed
$18.9 million
of liabilities. Approximately
$66 million
of the remaining purchase price was allocated to goodwill and represents the future economic benefits expected to arise from other assets acquired that could not be individually identified and separately recognized. The goodwill has been assigned to our West Region as it is expected to benefit from the synergies of the transaction. Rainbow's operations in Southern California include hauling routes, a recycling facility, a transfer station, a compressed natural gas (CNG) refueling station, and a CNG-powered vehicle fleet. The acquisition is not material to the Company's results of operations.
In February 2015, we acquired all the equity of Tervita, LLC (Tervita) in exchange for a cash payment of approximately
$485 million
. Tervita is an environmental solutions provider serving oil and natural gas producers in the United States. Tervita provides oilfield waste services to its diverse customer base and operates three types of waste management and disposal facilities: treatment, recovery and disposal facilities; engineered landfills and salt water disposal injection wells. Additionally, Tervita provides closed loop solids control systems and transportation services.
4. PROPERTY AND EQUIPMENT, NET
A summary of property and equipment as of December 31 follows:
|
2014
|
2013
|
||||||
|
Land
|
$
|
401.3
|
|
$
|
377.6
|
|
|
|
Non-depletable landfill land
|
162.2
|
|
164.2
|
|
|||
|
Landfill development costs
|
5,645.3
|
|
5,392.7
|
|
|||
|
Vehicles and equipment
|
5,834.1
|
|
5,403.7
|
|
|||
|
Buildings and improvements
|
1,002.3
|
|
935.6
|
|
|||
|
Construction-in-progress - landfill
|
140.8
|
|
72.5
|
|
|||
|
Construction-in-progress - other
|
10.1
|
|
13.3
|
|
|||
|
$
|
13,196.1
|
|
$
|
12,359.6
|
|
||
|
Less: accumulated depreciation, depletion and amortization
|
|||||||
|
Landfill development costs
|
$
|
(2,437.4
|
)
|
$
|
(2,160.2
|
)
|
|
|
Vehicles and equipment
|
(3,273.3
|
)
|
(2,883.8
|
)
|
|||
|
Buildings and improvements
|
(320.1
|
)
|
(278.8
|
)
|
|||
|
(6,030.8
|
)
|
(5,322.8
|
)
|
||||
|
Property and equipment, net
|
$
|
7,165.3
|
|
$
|
7,036.8
|
|
|
Depreciation, amortization and depletion of property and equipment was
$838.5 million
,
$806.7 million
and
$778.4 million
for the years ended
December 31, 2014
,
2013
and
2012
, respectively.
84
5. GOODWILL AND OTHER INTANGIBLE ASSETS, NET
Goodwill
A summary of the activity and balances in goodwill accounts by reporting segment follows:
|
Balance as of December 31, 2013
|
Acquisitions
|
Divestitures
|
Adjustments
to
Acquisitions
|
Balance as of December 31, 2014
|
|||||||||||||||
|
East
|
$
|
3,020.2
|
|
$
|
26.0
|
|
$
|
—
|
|
$
|
(0.2
|
)
|
$
|
3,046.0
|
|
||||
|
Central
|
3,264.8
|
|
15.4
|
|
—
|
|
(1.2
|
)
|
3,279.0
|
|
|||||||||
|
West
|
4,439.1
|
|
67.3
|
|
—
|
|
(0.5
|
)
|
4,505.9
|
|
|||||||||
|
Total
|
$
|
10,724.1
|
|
$
|
108.7
|
|
$
|
—
|
|
$
|
(1.9
|
)
|
$
|
10,830.9
|
|
||||
|
|
Balance as of December 31, 2012
|
Acquisitions
|
Divestitures
|
Adjustments
to
Acquisitions
|
Balance as of December 31, 2013
|
||||||||||||||
|
East
|
$
|
3,014.9
|
|
$
|
7.0
|
|
$
|
—
|
|
$
|
(1.7
|
)
|
$
|
3,020.2
|
|
||||
|
Central
|
3,242.7
|
|
23.2
|
|
—
|
|
(1.1
|
)
|
3,264.8
|
|
|||||||||
|
West
|
4,432.4
|
|
8.8
|
|
(0.7
|
)
|
(1.4
|
)
|
4,439.1
|
|
|||||||||
|
Total
|
$
|
10,690.0
|
|
$
|
39.0
|
|
$
|
(0.7
|
)
|
$
|
(4.2
|
)
|
$
|
10,724.1
|
|
||||
Adjustments to acquisitions for the years ended
December 31, 2014
and
2013
primarily related to deferred tax asset adjustments resulting from the exercise of legacy Allied stock options, which were recorded to goodwill in purchase accounting.
Other Intangible Assets, Net
Other intangible assets, net, include values assigned to customer relationships, franchise agreements, other municipal agreements and non-compete agreements, and are amortized over periods ranging from
1
to
21
years. A summary of the activity and balances in other intangible assets accounts by intangible asset type follows:
|
|
Gross Intangible Assets
|
Accumulated Amortization
|
Other Intangible Assets, Net as of December 31, 2014
|
||||||||||||||||||||||||||||
|
|
Balance as of December 31, 2013
|
Acquisitions and Other Additions
|
Adjustments to Acquisitions/Divestitures
|
Balance as of December 31, 2014
|
Balance as of December 31, 2013
|
Additions
Charged
to Expense
|
Balance as of December 31, 2014
|
||||||||||||||||||||||||
|
Customer
relationships,
franchise and
other
municipal
agreements
|
$
|
598.9
|
|
$
|
42.3
|
|
$
|
—
|
|
$
|
641.2
|
|
$
|
(309.7
|
)
|
$
|
(59.4
|
)
|
$
|
(369.1
|
)
|
$
|
272.1
|
|
|||||||
|
Non-compete
agreements
|
23.6
|
|
3.2
|
|
—
|
|
26.8
|
|
(14.8
|
)
|
(3.4
|
)
|
(18.2
|
)
|
8.6
|
|
|||||||||||||||
|
Other intangible
assets
|
63.9
|
|
1.3
|
|
—
|
|
65.2
|
|
(46.1
|
)
|
(0.9
|
)
|
(47.0
|
)
|
18.2
|
|
|||||||||||||||
|
Total
|
$
|
686.4
|
|
$
|
46.8
|
|
$
|
—
|
|
$
|
733.2
|
|
$
|
(370.6
|
)
|
$
|
(63.7
|
)
|
$
|
(434.3
|
)
|
$
|
298.9
|
|
|||||||
85
|
|
Gross Intangible Assets
|
Accumulated Amortization
|
Other Intangible Assets, Net as of December 31, 2013
|
||||||||||||||||||||||||||||
|
|
Balance as of December 31, 2012
|
Acquisitions and Other Additions
|
Adjustments to Acquisitions/Divestitures
|
Balance as of December 31, 2013
|
Balance as of December 31, 2012
|
Additions
Charged
to Expense
|
Balance as of December 31, 2013
|
||||||||||||||||||||||||
|
Customer
relationships,
franchise and
other
municipal
agreements
|
$
|
579.0
|
|
$
|
19.9
|
|
$
|
—
|
|
$
|
598.9
|
|
$
|
(252.4
|
)
|
$
|
(57.3
|
)
|
$
|
(309.7
|
)
|
$
|
289.2
|
|
|||||||
|
Non-compete
agreements
|
20.4
|
|
3.2
|
|
—
|
|
23.6
|
|
(12.0
|
)
|
(2.8
|
)
|
(14.8
|
)
|
8.8
|
|
|||||||||||||||
|
Other intangible
assets
|
63.5
|
|
0.6
|
|
(0.2
|
)
|
63.9
|
|
(45.3
|
)
|
(0.8
|
)
|
(46.1
|
)
|
17.8
|
|
|||||||||||||||
|
Total
|
$
|
662.9
|
|
$
|
23.7
|
|
$
|
(0.2
|
)
|
$
|
686.4
|
|
$
|
(309.7
|
)
|
$
|
(60.9
|
)
|
$
|
(370.6
|
)
|
$
|
315.8
|
|
|||||||
Based on the amortizable intangible assets recorded in the consolidated balance sheet as of
December 31, 2014
, amortization expense for each of the next five years is estimated as follows:
|
2015
|
$
|
65.8
|
|
|
2016
|
64.3
|
|
|
|
2017
|
62.5
|
|
|
|
2018
|
50.0
|
|
|
|
2019
|
7.6
|
|
|
|
6.
|
OTHER ASSETS
|
Prepaid Expenses and Other Current Assets
A summary of prepaid expenses and other current assets as of December 31 follows:
|
2014
|
2013
|
||||||
|
Inventories
|
$
|
35.9
|
|
$
|
37.8
|
|
|
|
Prepaid expenses
|
55.0
|
|
59.0
|
|
|||
|
Other non-trade receivables
|
57.0
|
|
23.4
|
|
|||
|
Reinsurance receivable
|
12.4
|
|
14.8
|
|
|||
|
Income tax receivable
|
101.6
|
|
55.3
|
|
|||
|
Commodity and fuel hedge assets
|
—
|
|
7.0
|
|
|||
|
Other current assets
|
1.5
|
|
3.0
|
|
|||
|
Total
|
$
|
263.4
|
|
$
|
200.3
|
|
|
Other Assets
A summary of other assets as of December 31 follows:
|
2014
|
2013
|
||||||
|
Deferred financing costs
|
$
|
47.2
|
|
$
|
51.4
|
|
|
|
Deferred compensation plan
|
77.1
|
|
65.1
|
|
|||
|
Notes and other receivables
|
38.9
|
|
19.5
|
|
|||
|
Reinsurance receivable
|
48.4
|
|
46.9
|
|
|||
|
Other
|
80.7
|
|
98.0
|
|
|||
|
Total
|
$
|
292.3
|
|
$
|
280.9
|
|
|
Notes and other receivables includes the fair value of interest rate swaps of
$14.1 million
as of
December 31, 2014
.
86
|
7.
|
OTHER LIABILITIES
|
Other Accrued Liabilities
A summary of other accrued liabilities as of December 31 follows:
|
2014
|
2013
|
||||||
|
Accrued payroll and benefits
|
$
|
180.2
|
|
$
|
172.7
|
|
|
|
Accrued fees and taxes
|
125.6
|
|
121.3
|
|
|||
|
Insurance reserves, current portion
|
118.6
|
|
136.6
|
|
|||
|
Ceded insurance reserves, current portion
|
12.4
|
|
14.8
|
|
|||
|
Accrued dividends
|
98.7
|
|
93.7
|
|
|||
|
Current tax liabilities
|
16.3
|
|
—
|
|
|||
|
Commodity and fuel hedge liabilities
|
35.3
|
|
0.7
|
|
|||
|
Accrued professional fees and legal settlement reserves
|
61.2
|
|
28.3
|
|
|||
|
Withdrawal liability - Central States Pension and Other Funds
|
15.9
|
|
—
|
|
|||
|
Other
|
86.5
|
|
73.2
|
|
|||
|
Total
|
$
|
750.7
|
|
$
|
641.3
|
|
|
Other Long-Term Liabilities
A summary of other long-term liabilities as of December 31 follows:
|
2014
|
2013
|
||||||
|
Deferred compensation plan
|
$
|
76.3
|
|
$
|
67.0
|
|
|
|
Pension and other post-retirement liabilities
|
11.0
|
|
6.5
|
|
|||
|
Legal settlement reserves
|
10.8
|
|
27.3
|
|
|||
|
Ceded insurance reserves
|
48.4
|
|
46.9
|
|
|||
|
Withdrawal liability - Central States Pension and Other Funds
|
139.6
|
|
171.4
|
|
|||
|
Other
|
58.8
|
|
59.9
|
|
|||
|
Total
|
$
|
344.9
|
|
$
|
379.0
|
|
|
Other long-term liabilities includes the fair value of interest rate swaps of
$4.4 million
as of December 31, 2013.
87
Insurance Reserves
Our liabilities for unpaid and incurred but not reported claims as of
December 31, 2014
and
2013
(which include claims for workers’ compensation, commercial general and auto liability, and employee-related health care benefits) were
$416.6 million
and
$431.5 million
, respectively, under our risk management program and are included in other accrued liabilities and insurance reserves, net of current portion, in our consolidated balance sheets. While the ultimate amount of claims incurred depends on future developments, we believe the recorded reserves are adequate to cover the future payment of claims; however, it is possible that these recorded reserves may not be adequate to cover the future payment of claims. Adjustments, if any, to estimates recorded resulting from ultimate claim payments will be reflected in our consolidated statements of income in the periods in which such adjustments are known. The following table summarizes the activity in our insurance reserves for the years ended December 31:
|
2014
|
2013
|
2012
|
|||||||||
|
Balance at beginning of year
|
$
|
431.5
|
|
$
|
426.4
|
|
$
|
418.3
|
|
||
|
Additions charged to expense
|
354.8
|
|
379.1
|
|
385.5
|
|
|||||
|
Payments
|
(372.2
|
)
|
(377.2
|
)
|
(381.6
|
)
|
|||||
|
Accretion expense
|
2.5
|
|
3.2
|
|
4.2
|
|
|||||
|
Balance at end of year
|
416.6
|
|
431.5
|
|
426.4
|
|
|||||
|
Less: current portion
|
(118.6
|
)
|
(136.6
|
)
|
(135.5
|
)
|
|||||
|
Long-term portion
|
$
|
298.0
|
|
$
|
294.9
|
|
$
|
290.9
|
|
||
|
8.
|
LANDFILL AND ENVIRONMENTAL COSTS
|
As of
December 31, 2014
, we owned or operated
189
active solid waste landfills with total available disposal capacity of approximately
4.8 billion
in-place cubic yards. Additionally, we currently have post-closure responsibility for
125
closed landfills.
A summary of our accrued landfill and environmental liabilities as of December 31 follows:
|
2014
|
2013
|
||||||
|
Landfill final capping, closure and post-closure liabilities
|
$
|
1,144.3
|
|
$
|
1,091.3
|
|
|
|
Environmental remediation
|
697.5
|
|
551.7
|
|
|||
|
Total accrued landfill and environmental costs
|
1,841.8
|
|
1,643.0
|
|
|||
|
Less: current portion
|
(164.3
|
)
|
(178.7
|
)
|
|||
|
Long-term portion
|
$
|
1,677.5
|
|
$
|
1,464.3
|
|
|
Final Capping, Closure and Post-Closure Costs
The following table summarizes the activity in our asset retirement obligation liabilities, which include liabilities for final capping, closure and post-closure, for the years ended December 31:
|
2014
|
2013
|
2012
|
|||||||||
|
Asset retirement obligation liabilities, beginning of year
|
$
|
1,091.3
|
|
$
|
1,052.4
|
|
$
|
1,037.0
|
|
||
|
Non-cash additions
|
38.6
|
|
36.5
|
|
33.8
|
|
|||||
|
Acquisitions and other adjustments
|
3.8
|
|
(0.6
|
)
|
(14.6
|
)
|
|||||
|
Asset retirement obligation adjustments
|
(12.8
|
)
|
12.0
|
|
(4.6
|
)
|
|||||
|
Payments
|
(54.6
|
)
|
(85.6
|
)
|
(77.6
|
)
|
|||||
|
Accretion expense
|
78.0
|
|
76.6
|
|
78.4
|
|
|||||
|
Asset retirement obligation liabilities, end of year
|
1,144.3
|
|
1,091.3
|
|
1,052.4
|
|
|||||
|
Less: current portion
|
(87.9
|
)
|
(93.6
|
)
|
(110.4
|
)
|
|||||
|
Long-term portion
|
$
|
1,056.4
|
|
$
|
997.7
|
|
$
|
942.0
|
|
||
88
We review our landfill asset retirement obligations annually. As a result, we recorded a net (decrease) increase in amortization expense of
$(13.4) million
,
$(0.3) million
and
$4.9 million
for
2014
,
2013
and
2012
, respectively, primarily related to changes in estimates and assumptions concerning the anticipated waste flow, cost and timing of future final capping, closure and post-closure activities.
The fair value of assets that are legally restricted for purposes of settling final capping, closure and post-closure obligations was approximately
$26.7 million
as of
December 31, 2014
and is included in restricted cash and marketable securities in our consolidated balance sheet.
The expected future payments for final capping, closure and post-closure as of
December 31, 2014
follows:
|
2015
|
$
|
87.9
|
|
|
2016
|
121.5
|
|
|
|
2017
|
88.7
|
|
|
|
2018
|
78.0
|
|
|
|
2019
|
92.2
|
|
|
|
Thereafter
|
5,224.6
|
|
|
|
$
|
5,692.9
|
|
|
The estimated remaining final capping, closure and post-closure expenditures presented above are not inflated and not discounted and reflect the estimated future payments for liabilities incurred and recorded as of
December 31, 2014
and for liabilities yet to be incurred over the remaining life of our landfills.
Environmental Remediation Liabilities
We accrue for remediation costs when they become probable and can be reasonably estimated. There can sometimes be a range of reasonable estimates of the costs associated with remediation of a site. In these cases, we use the amount within the range that constitutes our best estimate. If no amount within the range appears to be a better estimate than any other, we use the amount that is at the low end of such range. It is reasonably possible that we will need to adjust the liabilities recorded for remediation to reflect the effects of new or additional information, to the extent such information impacts the costs, timing or duration of the required actions. If we used the reasonably possible high ends of our ranges, our aggregate potential remediation liability as of
December 31, 2014
would be approximately
$360 million
higher than the amounts recorded. Future changes in our estimates of the cost, timing or duration of the required actions could have a material adverse effect on our consolidated financial position, results of operations or cash flows.
The following table summarizes the activity in our environmental remediation liabilities for the years ended December 31:
|
2014
|
2013
|
2012
|
|||||||||
|
Environmental remediation liabilities, beginning of year
|
$
|
551.7
|
|
$
|
563.7
|
|
$
|
543.7
|
|
||
|
Net additions charged to expense
|
219.1
|
|
83.7
|
|
62.4
|
|
|||||
|
Payments
|
(99.4
|
)
|
(122.5
|
)
|
(73.1
|
)
|
|||||
|
Accretion expense (non-cash interest expense)
|
25.3
|
|
26.8
|
|
30.7
|
|
|||||
|
Acquisitions and other
|
0.8
|
|
—
|
|
—
|
|
|||||
|
Environmental remediation liabilities, end of year
|
697.5
|
|
551.7
|
|
563.7
|
|
|||||
|
Less: current portion
|
(76.4
|
)
|
(85.1
|
)
|
(85.1
|
)
|
|||||
|
Long-term portion
|
$
|
621.1
|
|
$
|
466.6
|
|
$
|
478.6
|
|
||
89
The expected undiscounted future payments for remediation costs as of
December 31, 2014
follows:
|
2015
|
$
|
76.4
|
|
|
2016
|
76.6
|
|
|
|
2017
|
55.5
|
|
|
|
2018
|
56.0
|
|
|
|
2019
|
43.9
|
|
|
|
Thereafter
|
406.2
|
|
|
|
$
|
714.6
|
|
|
The following is a discussion of certain of our significant remediation matters:
Bridgeton Landfill.
As of December 31, 2014, the remediation liability recorded for our closed Bridgeton Landfill in Missouri was
$240.3 million
, of which
$30 million
is expected to be paid during 2015. During the year ended December 31, 2014, we paid
$64.3 million
related to construction of a leachate management facility and related infrastructure, as well as management and monitoring of the remediation area. During the three months ended March 31, 2014, we recorded a charge to earnings of
$36.1 million
, primarily related to the design and construction of a leachate management facility. As the nature and extent of our leachate remediation efforts continued to change, it became necessary to upgrade treatment facility design features and infrastructure. In the third quarter of 2014, we completed construction of the leachate management facility, but it was not functioning at full capacity and was still in a testing mode. In the fourth quarter of 2014, we updated our cost and timeline estimates to operate the leachate management facility, manage the remediation area and monitor the site. Accordingly, we recorded an environmental remediation charge of
$174.5 million
. We expect the facility will function at full capacity in the first half of 2015. We continue to work with state and federal regulatory agencies on our remediation efforts. From time to time, this may require us to modify our future operating timeline and procedures, which could result in changes to our expected liability. We believe the remaining reasonably possible high end of our range would be approximately
$160 million
higher than the amount recorded as of
December 31, 2014
.
Congress Landfill.
In August 2010, Congress Development Company agreed with the State of Illinois to have a Final Consent Order (Final Order) entered by the Circuit Court of Illinois, Cook County. Pursuant to the Final Order, we have agreed to continue to implement certain remedial activities at the Congress Landfill. The remediation liability recorded as of
December 31, 2014
is
$83.4 million
, of which
$5.0 million
is expected to be paid during 2015. We believe the remaining reasonably possible high end of our range would be approximately
$70 million
higher than the amount recorded as of
December 31, 2014
.
It is reasonably possible that we will need to adjust the liabilities noted above to reflect the effects of new or additional information, to the extent that such information impacts the costs, timing or duration of the required actions. Future changes in our estimates of the costs, timing or duration of the required actions could have a material adverse effect on our consolidated financial position, results of operations or cash flows.
90
9. DEBT
The carrying value of our notes payable, capital leases and long-term debt as of
December 31, 2014
and
2013
is listed in the following table in millions, and is adjusted for the fair value of interest rate swaps, unamortized discounts and the unamortized portion of adjustments to fair value recorded in purchase accounting. Original issue discounts and adjustments to fair value recorded in purchase accounting are amortized to interest expense over the term of the applicable instrument using the effective interest method.
|
|
|
2014
|
2013
|
|||||||||||||||||||||||
|
Maturity
|
Interest Rate
|
Principal
|
Adjustments
|
Carry Value
|
Principal
|
Adjustments
|
Carry Value
|
|||||||||||||||||||
|
Credit facilities:
|
||||||||||||||||||||||||||
|
Uncommitted facility
|
Variable
|
$
|
—
|
|
$
|
—
|
|
$
|
—
|
|
$
|
—
|
|
$
|
—
|
|
$
|
—
|
|
|||||||
|
June 2019
|
Variable
|
—
|
|
—
|
|
—
|
|
—
|
|
—
|
|
—
|
|
|||||||||||||
|
May 2017
|
Variable
|
—
|
|
—
|
|
—
|
|
—
|
|
—
|
|
—
|
|
|||||||||||||
|
Senior notes:
|
||||||||||||||||||||||||||
|
May 2018
|
3.800
|
700.0
|
|
(0.1
|
)
|
699.9
|
|
700.0
|
|
(0.1
|
)
|
699.9
|
|
|||||||||||||
|
September 2019
|
5.500
|
650.0
|
|
(2.5
|
)
|
647.5
|
|
650.0
|
|
(2.9
|
)
|
647.1
|
|
|||||||||||||
|
March 2020
|
5.000
|
850.0
|
|
(0.1
|
)
|
849.9
|
|
850.0
|
|
(0.1
|
)
|
849.9
|
|
|||||||||||||
|
November 2021
|
5.250
|
600.0
|
|
—
|
|
600.0
|
|
600.0
|
|
—
|
|
600.0
|
|
|||||||||||||
|
June 2022
|
3.550
|
850.0
|
|
(1.8
|
)
|
848.2
|
|
850.0
|
|
(2.0
|
)
|
848.0
|
|
|||||||||||||
|
May 2023
|
4.750
|
550.0
|
|
11.5
|
|
561.5
|
|
550.0
|
|
(5.7
|
)
|
544.3
|
|
|||||||||||||
|
March 2035
|
6.086
|
275.7
|
|
(23.9
|
)
|
251.8
|
|
275.7
|
|
(24.5
|
)
|
251.2
|
|
|||||||||||||
|
March 2040
|
6.200
|
650.0
|
|
(0.5
|
)
|
649.5
|
|
650.0
|
|
(0.5
|
)
|
649.5
|
|
|||||||||||||
|
May 2041
|
5.700
|
600.0
|
|
(3.2
|
)
|
596.8
|
|
600.0
|
|
(3.3
|
)
|
596.7
|
|
|||||||||||||
|
Debentures:
|
||||||||||||||||||||||||||
|
May 2021
|
9.250
|
35.3
|
|
(1.6
|
)
|
33.7
|
|
35.3
|
|
(1.7
|
)
|
33.6
|
|
|||||||||||||
|
September 2035
|
7.400
|
165.3
|
|
(40.5
|
)
|
124.8
|
|
165.2
|
|
(41.0
|
)
|
124.2
|
|
|||||||||||||
|
Tax-exempt:
|
||||||||||||||||||||||||||
|
2015 - 2044
|
0.300 - 5.625
|
1,083.8
|
|
—
|
|
1,083.8
|
|
1,087.7
|
|
—
|
|
1,087.7
|
|
|||||||||||||
|
Other:
|
||||||||||||||||||||||||||
|
2015 - 2046
|
5.000 - 12.203
|
113.8
|
|
—
|
|
113.8
|
|
86.0
|
|
—
|
|
86.0
|
|
|||||||||||||
|
Total Debt
|
$
|
7,123.9
|
|
$
|
(62.7
|
)
|
7,061.2
|
|
$
|
7,099.9
|
|
$
|
(81.8
|
)
|
7,018.1
|
|
||||||||||
|
Less: current portion
|
(10.4
|
)
|
(15.7
|
)
|
||||||||||||||||||||||
|
Long-term portion
|
$
|
7,050.8
|
|
$
|
7,002.4
|
|
||||||||||||||||||||
Loss on Extinguishment of Debt
During
2014
,
2013
and
2012
, we completed financing transactions that resulted in cash paid for premiums and professional fees to repurchase debt, as well as non-cash charges for unamortized debt discounts and deferred issuance costs.
91
The following table summarizes the loss on extinguishment of debt for the years ended
December 31, 2014
,
2013
and
2012
:
|
Principal
Repaid
|
Cash Paid on
Loss on
Extinguishment
of Debt
|
Non-cash
Loss on
Extinguishment
of Debt
|
Total Loss on
Extinguishment
of Debt
|
|||||||||||||
|
2014
|
||||||||||||||||
|
Amendments to credit facilities
|
$
|
—
|
|
$
|
—
|
|
$
|
0.7
|
|
$
|
0.7
|
|
||||
|
Tax-exempt financings
|
42.5
|
|
—
|
|
0.7
|
|
0.7
|
|
||||||||
|
Loss on extinguishment of debt for the year ended
December 31, 2014
|
$
|
—
|
|
$
|
1.4
|
|
$
|
1.4
|
|
|||||||
|
2013
|
||||||||||||||||
|
Tax-exempt financings
|
$
|
189.1
|
|
$
|
—
|
|
$
|
2.1
|
|
$
|
2.1
|
|
||||
|
Loss on extinguishment of debt for the year ended
December 31, 2013
|
$
|
—
|
|
$
|
2.1
|
|
$
|
2.1
|
|
|||||||
|
2012
|
||||||||||||||||
|
Amendments to credit facilities
|
$
|
—
|
|
$
|
—
|
|
$
|
1.5
|
|
$
|
1.5
|
|
||||
|
$750.0 million 6.875% senior notes due June 2017
|
750.0
|
|
25.8
|
|
71.0
|
|
96.8
|
|
||||||||
|
Tax-exempt financings
|
94.0
|
|
—
|
|
14.2
|
|
14.2
|
|
||||||||
|
Ineffective portion of interest rate lock settlements
|
—
|
|
0.1
|
|
—
|
|
0.1
|
|
||||||||
|
Loss on extinguishment of debt for the year ended
December 31, 2012
|
$
|
25.9
|
|
$
|
86.7
|
|
$
|
112.6
|
|
|||||||
Credit Facilities
In June 2014, we entered into a
$1.25 billion
unsecured revolving credit facility (the Replacement Credit Facility), which replaced our
$1.0 billion
credit facility maturing in April 2016. The Replacement Credit Facility matures in June 2019 and includes a feature that allows us to increase availability, at our option, by an aggregate amount up to
$500.0 million
through increased commitments from existing lenders or the addition of new lenders. At our option, borrowings under the Replacement Credit Facility bear interest at a Base Rate, or a Eurodollar Rate, plus an applicable margin based on our Debt Ratings (all as defined in the agreements).
Contemporaneous with the execution of the Replacement Credit Facility, we entered into Amendment No. 3 to our existing
$1.25 billion
unsecured credit facility (the Existing Credit Facility and, together with the Replacement Credit Facility, the Credit Facilities), to reduce the commitments under the Existing Credit Facility to
$1.0 billion
and conform certain terms of the Existing Credit Facility with those of the Replacement Credit Facility. Amendment No. 3 does not extend the maturity date of the Existing Credit Facility, which matures in May 2017. The Existing Credit Facility also maintains the feature that allows us to increase availability, at our option, by an aggregate amount of up to
$500.0 million
, through increased commitments from existing lenders or the addition of new lenders.
Our Credit Facilities are subject to facility fees based on applicable rates defined in the agreements and the aggregate commitments, regardless of usage. Availability under our Credit Facilities totaled
$1,615.4 million
and
$1,527.9 million
as of
December 31, 2014
and
2013
, respectively, and can be used for working capital, capital expenditures, letters of credit and other general corporate purposes. The credit agreements require us to comply with financial and other covenants. We may pay dividends and repurchase common stock if we are in compliance with these covenants. As of
December 31, 2014
and
2013
, we had no borrowings under our Credit Facilities. We had
$615.1 million
and
$722.1 million
of letters of credit outstanding under our Credit Facilities, as of
December 31, 2014
and
2013
, respectively.
We have a
$125.0 million
unsecured credit facility agreement (the Uncommitted Credit Facility) bearing interest at LIBOR, plus an applicable margin. Our Uncommitted Credit Facility is subject to facility fees defined in the agreement, regardless of usage. We can use borrowings under the Uncommitted Credit Facility for working capital and other general corporate purposes. The agreements governing our Uncommitted Credit Facility require us to comply with covenants. The Uncommitted Credit Facility may be terminated by either party at any time. As of
December 31, 2014
and
2013
, we had no borrowings under our Uncommitted Credit Facility.
92
In January 2015, we entered into a
$20.0 million
uncommitted credit facility agreement (the Puerto Rico Facility) that matures in 2016 and bears interest at LIBOR plus an applicable margin. We can use borrowings under the Puerto Rico Facility for working capital and other general corporate purposes.
Senior Notes and Debentures
Our senior notes are general senior unsecured obligations. Interest is payable semi-annually. These senior notes have a make-whole provision that is exercisable at any time prior to the respective maturity dates per the debt table above at a stated redemption price.
Tax-Exempt Financings
As of
December 31, 2014
and
2013
, we had
$1,083.8 million
and
$1,087.7 million
, respectively, of fixed and variable rate tax-exempt financings outstanding with maturities ranging from
2015
to
2044
. Approximately
90%
of our tax-exempt financings are remarketed quarterly by remarketing agents to effectively maintain a variable yield. The holders of the bonds can put them back to the remarketing agents at the end of each interest period. To date, the remarketing agents have been able to remarket our variable rate unsecured tax-exempt bonds. These bonds have been classified as long-term because of our ability and intent to refinance them using availability under our Credit Facilities, if necessary.
As of
December 31, 2014
, we had
$115.6 million
of restricted cash and marketable securities, of which
$20.9 million
represented proceeds from the issuance of tax-exempt bonds and other tax-exempt financings and will be used to fund capital expenditures under the terms of the agreements. Restricted cash and marketable securities also include amounts held in trust as a financial guarantee of our performance.
Other Debt
Other debt primarily includes capital lease liabilities of
$113.8 million
and
$85.9 million
as of
December 31, 2014
and
2013
, respectively, with maturities ranging from
2015
to
2046
.
Future Maturities of Debt
Aggregate principal maturities of notes payable, capital leases and other long-term debt as of
December 31, 2014
follows:
|
2015
|
$
|
9.5
|
|
|
2016
|
4.5
|
|
|
|
2017
|
4.9
|
|
|
|
2018
|
705.5
|
|
|
|
2019
|
689.7
|
|
|
|
Thereafter
|
5,709.8
|
|
|
|
$
|
7,123.9
|
|
|
Interest Expense and Interest Paid
Interest paid was
$320.2 million
,
$324.0 million
and
$341.0 million
for the years ended
December 31, 2014
,
2013
and
2012
, respectively. The components of interest expense follows:
|
2014
|
2013
|
2012
|
|||||||||
|
Interest expense on debt and capital lease obligations
|
$
|
310.3
|
|
$
|
319.8
|
|
$
|
338.5
|
|
||
|
Accretion of debt discounts
|
6.6
|
|
6.9
|
|
12.2
|
|
|||||
|
Accretion of remediation reserves and other
|
38.2
|
|
40.6
|
|
46.2
|
|
|||||
|
Less: capitalized interest
|
(6.4
|
)
|
(7.3
|
)
|
(8.4
|
)
|
|||||
|
Total interest expense
|
$
|
348.7
|
|
$
|
360.0
|
|
$
|
388.5
|
|
||
Interest Rate Swap and Lock Agreements
Our ability to obtain financing through the capital markets is a key component of our financial strategy. Historically, we have managed risk associated with executing this strategy, particularly as it relates to fluctuations in interest rates, by using a combination of fixed and floating rate debt. From time to time, we have also entered into interest rate swap and lock
93
agreements to manage risks associated with interest rates, either to effectively convert specific fixed rate debt to a floating rate (fair value hedges), or to lock interest rates in anticipation of future debt issuances (cash flow hedges).
Fair Value Hedges
During the second half of 2013, we entered into various interest rate swap agreements relative to our
4.750%
fixed rate senior notes due in May 2023. The goal was to reduce overall borrowing costs and rebalance our debt portfolio's ratio of fixed to floating interest rates. As of
December 31, 2014
, these swap agreements have a total notional value of
$300.0 million
and mature in May 2023, which is identical to the maturity of the hedged senior notes. We pay interest at floating rates based on changes in LIBOR and receive interest at a fixed rate of
4.750%
. These transactions were designated as fair value hedges because the swaps hedge against the changes in fair value of the fixed rate senior notes resulting from changes in interest rates. The majority of these interest rate swaps do not contain credit-risk-related contingent features and we believe our exposure to such features, where applicable, is minimal.
As of
December 31, 2014
, the interest rate swap agreements are reflected at their fair value of
$14.1 million
and are included in other assets. As of
December 31, 2013
, the interest rate swap agreements are reflected at their fair value of
$4.4 million
and are included in other long-term liabilities. To the extent they are effective, these interest rate swap agreements are included as an adjustment to long-term debt in our consolidated balance sheets. We recognized net interest income of
$7.7 million
and
$2.0 million
during the years ended
December 31, 2014
and
2013
, respectively, related to net swap settlements for these interest rate swap agreements, which is included as an offset to interest expense in our consolidated statements of income.
For the years ended
December 31, 2014
and
2013
, we recognized a loss of
$12.6 million
and a gain of
$4.5 million
on the change in fair value of the hedged senior notes attributable to changes in the benchmark interest rate, with an offsetting gain of
$14.1 million
and loss of
$4.4 million
on the related interest rate swaps, respectively. The difference of these fair value changes represents hedge ineffectiveness, which is recorded directly in earnings as other income, net.
Cash Flow Hedges
As of
December 31, 2014
and
2013
, no interest rate lock cash flow hedges were outstanding. The effective portion of our historical interest rate locks, recorded as a component of accumulated other comprehensive income, was
$21.6 million
and
$23.0 million
as of
December 31, 2014
and
2013
, respectively. The effective portion of the interest rate locks is amortized as an adjustment to interest expense over the life of the issued debt using the effective interest method. We expect to amortize
$2.7 million
over the next twelve months as a yield adjustment of our senior notes.
The effective portion of the interest rate locks amortized as a net increase to interest expense during the years ended
December 31, 2014
,
2013
and
2012
was
$2.7 million
,
$2.7 million
and
$2.2 million
, respectively.
10. INCOME TAXES
The components of the provision for income taxes for the years ended December 31 follows:
|
2014
|
2013
|
2012
|
|||||||||
|
Current:
|
|||||||||||
|
Federal
|
$
|
328.1
|
|
$
|
289.6
|
|
$
|
228.7
|
|
||
|
State
|
39.7
|
|
35.3
|
|
29.2
|
|
|||||
|
Deferred:
|
|||||||||||
|
Federal
|
(13.3
|
)
|
16.3
|
|
83.0
|
|
|||||
|
State
|
7.5
|
|
(12.5
|
)
|
0.9
|
|
|||||
|
State deferred benefit - change in valuation allowance
|
(3.2
|
)
|
(42.3
|
)
|
—
|
|
|||||
|
Uncertain tax positions and interest, and other
|
(21.4
|
)
|
(24.3
|
)
|
(90.0
|
)
|
|||||
|
Provision for income taxes
|
$
|
337.4
|
|
$
|
262.1
|
|
$
|
251.8
|
|
||
94
The reconciliations of the statutory federal income tax rate to our effective tax rate for the years ended December 31 follows:
|
2014
|
2013
|
2012
|
||||||
|
Federal statutory rate
|
35.0
|
%
|
35.0
|
%
|
35.0
|
%
|
||
|
State income taxes, net of federal benefit
|
3.0
|
|
3.1
|
|
2.5
|
|
||
|
Change in valuation allowance
|
(0.4
|
)
|
(5.0
|
)
|
—
|
|
||
|
Non-deductible expenses
|
0.9
|
|
1.0
|
|
1.1
|
|
||
|
Uncertain tax position taxes and interest
|
(0.4
|
)
|
(1.8
|
)
|
(4.7
|
)
|
||
|
Other, net
|
—
|
|
(1.5
|
)
|
(3.3
|
)
|
||
|
Effective income tax rate
|
38.1
|
%
|
30.8
|
%
|
30.6
|
%
|
||
Our 2014 effective tax rate was favorably impacted by the realization of tax credits and lower state rates due to changes in estimates of approximately
$5.1 million
.
Our 2013 effective tax rate was favorably impacted by approximately
$42 million
for adjustments to our valuation allowance, primarily due to the determination it was more likely than not the Company would be able to realize certain state loss carryforwards. In addition, our 2013 effective tax rate was favorably impacted by approximately
$14 million
due to a settlement for tax years 2009 to 2010 with the Internal Revenue Service (IRS) appeals division and the Joint Committee of Taxation. Lastly, our 2013 effective tax rate was favorably impacted by the realization of tax credits and lower state rates due to changes in estimates of approximately
$9.6 million
.
Our 2012 effective tax rate was favorably impacted by the settlement with the IRS appeals division for tax years 2004 to 2008. This settlement benefited our 2012 tax provision by approximately
$35 million
. The 2012 effective tax rate was also favorably impacted by the realization of tax credits and lower state rates due to changes in estimates of approximately
$16 million
.
The components of the net deferred income tax asset and liability as of December 31 follows:
|
2014
|
2013
|
||||||
|
Deferred tax liabilities relating to:
|
|||||||
|
Differences between book and tax basis of property
|
$
|
(982.6
|
)
|
$
|
(983.6
|
)
|
|
|
Difference between book and tax basis of intangible assets
|
(704.8
|
)
|
(692.5
|
)
|
|||
|
Basis difference due to redemption of partnership interests
|
(129.1
|
)
|
(128.5
|
)
|
|||
|
Total liabilities
|
$
|
(1,816.5
|
)
|
$
|
(1,804.6
|
)
|
|
|
Deferred tax assets relating to:
|
|||||||
|
Environmental reserves
|
$
|
438.6
|
|
$
|
356.0
|
|
|
|
Accruals not currently deductible
|
207.9
|
|
244.2
|
|
|||
|
State net operating loss carryforwards
|
124.9
|
|
126.4
|
|
|||
|
Difference between book and tax basis of other assets
|
113.0
|
|
111.4
|
|
|||
|
Deferred taxes on uncertain tax positions
|
14.7
|
|
16.4
|
|
|||
|
Other
|
0.4
|
|
5.5
|
|
|||
|
Total assets
|
899.5
|
|
859.9
|
|
|||
|
Valuation allowance
|
(73.9
|
)
|
(76.9
|
)
|
|||
|
Net deferred tax asset
|
825.6
|
|
783.0
|
|
|||
|
Net deferred tax liabilities
|
$
|
(990.9
|
)
|
$
|
(1,021.6
|
)
|
|
95
Changes in the deferred tax valuation allowance for the years ended December 31 follows:
|
2014
|
2013
|
2012
|
|||||||||
|
Valuation allowance, beginning of year
|
$
|
76.9
|
|
$
|
124.8
|
|
$
|
118.1
|
|
||
|
Additions charged to income
|
0.2
|
|
0.1
|
|
1.9
|
|
|||||
|
Realized deferred tax assets
|
(3.2
|
)
|
(42.3
|
)
|
(3.2
|
)
|
|||||
|
Expirations of state net operating losses
|
—
|
|
—
|
|
(0.3
|
)
|
|||||
|
Other, net
|
—
|
|
(5.7
|
)
|
8.3
|
|
|||||
|
Valuation allowance, end of year
|
$
|
73.9
|
|
$
|
76.9
|
|
$
|
124.8
|
|
||
In assessing the realizability of deferred tax assets, we consider whether it is more likely than not that some or all of the deferred tax assets will not be realized after initial recognition. We also provide valuation allowances, as needed, to offset portions of deferred tax assets due to uncertainty surrounding the future realization of such deferred tax assets. We adjust the valuation allowance in the period management determines it is more likely than not that deferred tax assets will or will not be realized.
During the year ended December 31, 2013, we determined that it is more likely than not that we would realize a portion of our deferred tax asset related to certain state loss carryforwards. Most of these loss carryforwards were attributable to a specific subsidiary for which we had historically provided a valuation allowance due to uncertainty surrounding the future utilization of these carryforwards in the taxing jurisdictions where the loss carryforwards existed. Evaluating both positive and negative evidence, and most notably, the exit by the specific subsidiary from a cumulative loss position, we determined it was more likely than not that a portion of these loss carryforwards would be realized. This resulted in a reduction to our valuation allowance of approximately
$44 million
for the year ended December 31, 2013.
Substantially all of our valuation allowance is associated with state loss carryforwards. The realization of our deferred tax asset for state loss carryforwards ultimately depends upon the existence of sufficient taxable income in the appropriate state taxing jurisdictions in future periods. We continue to regularly monitor both positive and negative evidence in determining the ongoing need for a valuation allowance.
We have state net operating loss carryforwards with an estimated tax effect of
$124.9 million
available as of December 31, 2014. These state net operating loss carryforwards expire at various times between 2015 and 2033. We believe that it is more likely than not that the benefit from some of our state net operating loss carryforwards will not be realized due to limitations on these loss carryforwards in certain states. In recognition of this risk, as of December 31, 2014, we have provided a valuation allowance of
$70.9 million
. Also as of December 31, 2014, we have provided a valuation allowance of
$3.0 million
for certain other deferred tax assets.
Deferred income taxes have not been provided on the undistributed earnings of our Puerto Rican subsidiaries of approximately
$49 million
as of December 31, 2014 as such earnings are considered to be permanently reinvested. This amount would become taxable upon a repatriation of assets or a sale or liquidation of the subsidiaries, If such an event were to occur, we would incur approximately
$17 million
of federal income taxes.
We made income tax payments (net of refunds received) of approximately
$382 million
,
$288 million
and
$185 million
for
2014
,
2013
and
2012
, respectively. Cash paid for income taxes increased over the periods primarily due to higher expected taxable income and the related deductible timing differences associated with certain remediation charges.
Income taxes paid in 2014 reflect the favorable tax depreciation provisions of the Tax Increase Protection Act of 2014, signed into law on December 16, 2014. This legislation extended
50%
bonus depreciation for property placed in service during 2014.
Income taxes paid in 2013 reflect the favorable tax depreciation provisions of the American Tax Relief Act of 2012 signed into law on January 2, 2013. This legislation extended
50%
bonus depreciation for property placed in service during 2013. Income taxes paid in 2012 reflect the favorable tax depreciation provisions of the Tax Relief, Unemployment Insurance Reauthorization, and Job Creation Act of 2010 (Tax Relief Act). The Tax Relief Act included
50%
bonus depreciation for property placed in service in 2012.
We and our subsidiaries are subject to income tax in the United States and Puerto Rico, as well as income tax in multiple state jurisdictions. Our compliance with income tax rules and regulations is periodically audited by tax authorities. These authorities may challenge the positions taken in our tax filings. Thus, to provide for certain potential tax exposures, we maintain liabilities for uncertain tax positions for our estimate of the final outcome of the examinations. Our federal statute of limitations is closed
96
for all years prior to 2011. We are currently under state examination or administrative review in various jurisdictions for tax years 2003 to 2013.
The following table summarizes the activity in our gross unrecognized tax benefits for the years ended December 31:
|
2014
|
2013
|
2012
|
|||||||||
|
Balance at beginning of year
|
$
|
72.0
|
|
$
|
84.7
|
|
$
|
54.3
|
|
||
|
Additions based on tax positions related to current year
|
0.8
|
|
0.3
|
|
0.9
|
|
|||||
|
Additions for tax positions of prior years
|
5.0
|
|
11.4
|
|
64.0
|
|
|||||
|
Reductions for tax positions of prior years
|
(6.0
|
)
|
(2.4
|
)
|
—
|
|
|||||
|
Reductions for tax positions resulting from lapse of statute of limitations
|
(0.2
|
)
|
(1.3
|
)
|
(7.3
|
)
|
|||||
|
Settlements
|
(1.5
|
)
|
(20.7
|
)
|
(27.2
|
)
|
|||||
|
Balance at end of year
|
$
|
70.1
|
|
$
|
72.0
|
|
$
|
84.7
|
|
||
During 2014, the resolution of tax matters in various jurisdictions reduced our gross unrecognized tax benefits by
$1.5 million
. During 2013, we settled with the IRS appeals division and the Joint Committee on Taxation our 2009 and 2010 tax years. The resolution of these tax periods in addition to various state tax resolutions during the year reduced our gross unrecognized tax benefits by
$20.7 million
. During 2012, we settled with the IRS appeals division our 2004 to 2008 tax years. The resolution of these tax periods reduced our gross unrecognized tax benefits by
$27.2 million
.
Included in our gross unrecognized tax benefits as of
December 31, 2014
and
2013
are
$45.6 million
and
$46.8 million
of unrecognized tax benefits (net of the federal benefit on state issues) that, if recognized, would affect our effective income tax rate in future periods.
We recognize interest and penalties as incurred within the provision for income taxes in our consolidated statements of income. Related to the unrecognized tax benefits previously noted, we recorded interest expense of approximately
$1.5 million
during
2014
and, in total as of
December 31, 2014
, have recognized a liability for penalties of
$0.5 million
and interest of
$18.7 million
.
During
2013
, we accrued interest of approximately
$1.2 million
and, in total as of
December 31, 2013
, had recognized a liability for penalties of
$0.5 million
and interest of
$17.0 million
. During
2012
, we accrued interest of approximately
$1.0 million
and, in total as of
December 31, 2012
, had recognized a liability for penalties of
$0.7 million
and interest of
$18.9 million
.
Gross unrecognized tax benefits that we expect to settle in the following twelve months are in the range of
$5 million
to
$15 million
; however, it is reasonably possible that the amount of unrecognized tax benefits may either increase or decrease in the next twelve months.
We are under state examination in various jurisdictions for various tax years. These state audits are ongoing.
We believe the liabilities for uncertain tax positions recorded are adequate; however, a significant assessment against us in excess of the liabilities recorded could have a material adverse effect on our consolidated financial position, results of operations or cash flows.
|
11.
|
EMPLOYEE BENEFIT PLANS
|
Stock-Based Compensation
In July 1998, we adopted the 1998 Stock Incentive Plan (1998 Plan) to provide for grants of options to purchase shares of common stock, restricted stock and other equity based compensation to our employees and non-employee directors who are eligible to participate in the 1998 Plan. The 1998 Plan expired on June 30, 2008 and no further awards will be made. In February 2007, our board of directors approved the 2007 Stock Incentive Plan (2007 Plan), and in May 2007 our shareholders ratified the 2007 Plan. In March 2011, our board of directors approved the Amended and Restated 2007 Stock Incentive Plan, and in May 2011 our shareholders ratified the Amended and Restated 2007 Stock Incentive Plan. In March 2013, our board of directors approved the Republic Services, Inc. Amended and Restated 2007 Stock Incentive Plan (the Amended and Restated Plan), and in May 2013 our shareholders ratified the Amended and Restated Plan. We currently have approximately
16.3 million
shares of common stock reserved for future grants under the Amended and Restated Plan.
97
Options granted under the 1998 Plan, the 2007 Plan and the Amended and Restated Plan are non-qualified and are granted at a price equal to the fair market value of our common stock at the date of grant. Generally, options granted have a term of
seven
to
ten
years from the date of grant, and vest in increments of
25%
per year over a period of
four
years beginning on the first anniversary date of the grant. Options granted to non-employee directors have a term of
ten
years and are fully vested at the grant date.
In December 2008, the board of directors amended and restated the Republic Services, Inc. 2006 Incentive Stock Plan (formerly known as the Allied Waste Industries, Inc. 2006 Incentive Stock Plan (the 2006 Plan)). Allied’s shareholders approved the 2006 Plan in May 2006. The 2006 Plan was amended and restated in December 2008 to reflect Republic as the new sponsor of the Plan, and that any references to shares of common stock are to shares of common stock of Republic, and to adjust outstanding awards and the number of shares available under the Plan to reflect the Allied acquisition. The 2006 Plan, as amended and restated, provided for the grant of non-qualified stock options, incentive stock options, shares of restricted stock, shares of phantom stock, stock bonuses, restricted stock units, stock appreciation rights, performance awards, dividend equivalents, cash awards, or other stock-based awards. Awards granted under the 2006 Plan prior to December 5, 2008 became fully vested and nonforfeitable upon the closing of the Allied acquisition. No further awards will be made under the 2006 Plan.
Stock Options
We use a lattice binomial option-pricing model to value our stock option grants. We recognize compensation expense on a straight-line basis over the requisite service period for each separately vesting portion of the award, or to the employee’s retirement eligible date, if earlier. Expected volatility is based on the weighted average of the most recent one year volatility and a historical rolling average volatility of our stock over the expected life of the option. The risk-free interest rate is based on Federal Reserve rates in effect for bonds with maturity dates equal to the expected term of the option. We use historical data to estimate future option exercises, forfeitures (at
3.0%
for each of the periods presented) and expected life of the options. When appropriate, separate groups of employees that have similar historical exercise behavior are considered separately for valuation purposes. The weighted-average estimated fair values of stock options granted during the years ended
December 31, 2014
,
2013
and
2012
were
$5.74
,
$5.27
and
$4.77
per option, respectively, which were calculated using the following weighted-average assumptions:
|
2014
|
2013
|
2012
|
||||||
|
Expected volatility
|
27.5
|
%
|
28.9
|
%
|
27.8
|
%
|
||
|
Risk-free interest rate
|
1.4
|
%
|
0.7
|
%
|
0.8
|
%
|
||
|
Dividend yield
|
3.2
|
%
|
3.2
|
%
|
3.2
|
%
|
||
|
Expected life (in years)
|
4.6
|
|
4.5
|
|
4.5
|
|
||
|
Contractual life (in years)
|
7.0
|
|
7.0
|
|
7.0
|
|
||
98
The following table summarizes stock option activity for the years ended
December 31, 2014
,
2013
and
2012
:
|
Number of
Shares (in millions)
|
Weighted Average
Exercise
Price per Share
|
Weighted Average
Remaining
Contractual Term
(years)
|
Aggregate
Intrinsic
Value
(in millions)
|
|||||||||
|
Outstanding as of December 31, 2011
|
14.3
|
|
$
|
26.13
|
|
|||||||
|
Granted
|
3.1
|
|
29.63
|
|
||||||||
|
Exercised
|
(2.9
|
)
|
29.32
|
|
$
|
18.8
|
|
|||||
|
Forfeited or expired
|
(0.8
|
)
|
28.80
|
|
||||||||
|
Outstanding as of December 31, 2012
|
13.7
|
|
27.51
|
|
||||||||
|
Granted
|
3.0
|
|
31.21
|
|
||||||||
|
Exercised
|
(5.5
|
)
|
26.48
|
|
$
|
36.0
|
|
|||||
|
Forfeited or expired
|
(0.7
|
)
|
30.02
|
|
||||||||
|
Outstanding as of December 31, 2013
|
10.5
|
|
28.91
|
|
||||||||
|
Granted
|
0.5
|
|
33.76
|
|
||||||||
|
Exercised
|
(3.0
|
)
|
27.98
|
|
$
|
24.5
|
|
|||||
|
Forfeited or expired
|
(0.4
|
)
|
31.02
|
|
||||||||
|
Outstanding as of December 31, 2014
|
7.6
|
|
$
|
29.49
|
|
3.8
|
$
|
79.8
|
|
|||
|
Exercisable as of December 31, 2014
|
3.7
|
|
$
|
28.14
|
|
2.9
|
$
|
44.9
|
|
|||
During the years ended December 31,
2014
,
2013
and
2012
, compensation expense for stock options was
$6.3 million
,
$12.9 million
and
$13.2 million
, respectively.
As of
December 31, 2014
, total unrecognized compensation expense related to outstanding stock options was
$4.3 million
, which will be recognized over a weighted average period of
1.6 years
. The total fair value of stock options that vested in
2014
,
2013
and
2012
was
$12.5 million
,
$10.8 million
and
$10.9 million
, respectively.
We classified excess tax benefits of
$4.3 million
,
$3.8 million
and
$1.9 million
as cash flows from financing activities for
2014
,
2013
and
2012
, respectively. All other tax benefits related to stock options have been presented as a component of cash flows from operating activities.
99
Other Stock Awards
The following table summarizes restricted stock unit and restricted stock activity for the years ended
December 31, 2014
,
2013
and
2012
:
|
Number of
Restricted Stock
Units and Shares of
Restricted Stock
(in thousands)
|
Weighted-Average
Grant Date Fair
Value per Share
|
Weighted-Average
Remaining
Contractual Term
(years)
|
Aggregate
Intrinsic
Value
(in millions)
|
|||||||||
|
Unissued as of December 31, 2011
|
770.0
|
|
$
|
27.17
|
|
|||||||
|
Granted
|
303.8
|
|
27.76
|
|
||||||||
|
Vested and issued
|
(167.2
|
)
|
26.35
|
|
||||||||
|
Forfeited
|
(1.3
|
)
|
29.79
|
|
||||||||
|
Unissued as of December 31, 2012
|
905.3
|
|
27.51
|
|
||||||||
|
Granted
|
361.8
|
|
30.16
|
|
||||||||
|
Vested and issued
|
(243.0
|
)
|
28.16
|
|
||||||||
|
Forfeited
|
(27.1
|
)
|
30.66
|
|
||||||||
|
Unissued as of December 31, 2013
|
997.0
|
|
28.48
|
|
||||||||
|
Granted
|
784.9
|
|
33.38
|
|
||||||||
|
Vested and issued
|
(258.4
|
)
|
28.07
|
|
||||||||
|
Forfeited
|
(67.3
|
)
|
33.14
|
|
||||||||
|
Unissued as of December 31, 2014
|
1,456.2
|
|
$
|
24.07
|
|
1.0
|
$
|
58.6
|
|
|||
|
Vested and unissued as of December 31, 2014
|
575.6
|
|
$
|
39.75
|
|
|||||||
During
2014
, we awarded our non-employee directors
86,425
restricted stock units, which vested immediately. During
2014
, we awarded
657,476
restricted stock units to executives and employees that vest in
four
equal annual installments beginning on the anniversary date of the original grant or cliff vest after four years. In addition,
41,032
restricted stock units were earned as dividend equivalents. The restricted stock units do not carry any voting or dividend rights, except the right to receive additional restricted stock units in lieu of dividends.
During 2013, we awarded our non-employee directors
72,842
restricted stock units, which vested immediately. During 2013, we awarded
258,944
restricted stock units to executives and employees that vest in
four
equal annual installments beginning on the anniversary date of the original grant. In addition,
30,009
restricted stock units were earned as dividend equivalents.
During 2012, we awarded our non-employee directors
75,000
restricted stock units, which vested immediately. During 2012, we awarded
179,201
restricted stock units to executives that vest in
four
equal annual installments beginning on the anniversary date of the original grant. In addition,
26,747
restricted stock units were earned as dividend equivalents. Also, we granted
22,805
shares of restricted stock to an executive that vested upon his retirement in January 2013.
The fair value of restricted stock units and restricted stock is based on the closing market price on the date of the grant. The compensation expense related to restricted stock units and restricted stock is amortized ratably over the vesting period, or to the employee's retirement eligible date, if earlier.
During
2014
,
2013
and
2012
, compensation expense related to restricted stock units and restricted shares totaled
$11.1 million
,
$6.3 million
and
$8.0 million
, respectively. As of
December 31, 2014
, total unrecognized compensation expense related to outstanding restricted stock units was
$19.5 million
, which will be recognized over a weighted average period of
2.9 years
.
Defined Benefit Pension Plan
We currently have one qualified defined benefit pension plan, the BFI Retirement Plan (the Plan). The Plan covers certain employees in the United States, including some employees subject to collective bargaining agreements.
100
The Plan benefits are frozen. Interest credits continue to be earned by participants in the Plan, and participants whose collective bargaining agreements provide for additional benefit accruals under the Plan continue to receive those credits in accordance with the terms of their bargaining agreements. The Plan was converted from a traditional defined benefit plan to a cash balance plan in 1993.
Prior to the conversion to the cash balance design, benefits payable as a single life annuity under the Plan were based on the participant’s highest
five
years of earnings out of the last
ten
years of service. Upon conversion to the cash balance plan, the existing accrued benefits were converted to a lump-sum value using the actuarial assumptions in effect at the time. Participants’ cash balance accounts are increased until retirement by certain benefit and interest credits under the terms of their bargaining agreements. Participants may elect early retirement with the attainment of age
55
and completion of
ten
years of credited service at reduced benefits. Participants with
35 years
of service may retire at age
62
without any reduction in benefits.
Our pension contributions are made in accordance with funding standards established by the Employee Retirement Income Security Act of 1974 and the Internal Revenue Code, as amended by the Pension Protection Act enacted in 2006 (the PPA).
No
contributions were made in
2014
or
2013
.
We must separately recognize the overfunded or underfunded status of our pension plan as an asset or liability. The funded status represents the difference between the projected benefit obligation (PBO) and the fair value of the plan assets. The PBO is the present value of benefits earned to date by plan participants, including the effect of assumed future salary increases, if any. The PBO is equal to the accumulated benefit obligation (ABO) as the present value of these liabilities is not affected by assumed future salary increases. We use a measurement date that coincides with our year end of December 31.
The following table presents the ABO and reconciliations of the changes in the PBO, the plan assets and the accounting funded status of our defined benefit pension plan for the years ended December 31:
|
|
Defined Benefit
Pension Plan
|
||||||
|
|
2014
|
2013
|
|||||
|
Accumulated benefit obligation
|
$
|
276.8
|
|
$
|
261.7
|
|
|
|
Change in projected benefit obligation:
|
|||||||
|
Projected benefit obligation at beginning of year
|
$
|
261.7
|
|
$
|
301.4
|
|
|
|
Interest cost
|
11.3
|
|
11.0
|
|
|||
|
Actuarial loss (gain)
|
24.7
|
|
(14.9
|
)
|
|||
|
Benefits paid
|
(20.9
|
)
|
(35.8
|
)
|
|||
|
Projected benefit obligation at end of year
|
$
|
276.8
|
|
$
|
261.7
|
|
|
|
Change in plan assets:
|
|||||||
|
Fair value of plan assets at beginning of year
|
$
|
269.8
|
|
$
|
295.3
|
|
|
|
Actual return on plan assets
|
26.5
|
|
13.2
|
|
|||
|
Estimated expenses
|
(2.8
|
)
|
(2.9
|
)
|
|||
|
Benefits paid
|
(20.9
|
)
|
(35.8
|
)
|
|||
|
Fair value of plan assets at end of year
|
$
|
272.6
|
|
$
|
269.8
|
|
|
|
Funded (underfunded) status
|
$
|
(4.2
|
)
|
$
|
8.1
|
|
|
|
Amounts recognized in the statement of financial position consist of:
|
|||||||
|
Noncurrent (liabilities) and assets
|
$
|
(4.2
|
)
|
$
|
8.1
|
|
|
|
Net amount recognized
|
$
|
(4.2
|
)
|
$
|
8.1
|
|
|
|
Weighted average assumptions used to determine benefit obligations:
|
|||||||
|
Discount rate
|
3.70
|
%
|
4.50
|
%
|
|||
|
Rate of compensation increase
|
N/A
|
|
N/A
|
|
|||
The amounts included in accumulated other comprehensive income on the consolidated statement of financial position that have not yet been recognized as components of net periodic benefit cost as of
December 31, 2014
and
2013
were
$19.9 million
and
$35.5 million
, respectively.
101
The components of the net periodic benefit cost for the years ended December 31 are summarized below:
|
2014
|
2013
|
2012
|
|||||||||
|
Components of net periodic benefit cost:
|
|||||||||||
|
Service cost
|
$
|
2.8
|
|
$
|
2.9
|
|
$
|
3.0
|
|
||
|
Interest cost
|
11.3
|
|
11.0
|
|
13.1
|
|
|||||
|
Expected return on plan assets
|
(16.4
|
)
|
(16.2
|
)
|
(18.9
|
)
|
|||||
|
Recognized net actuarial gain
|
(1.0
|
)
|
(0.2
|
)
|
—
|
|
|||||
|
Amortization of prior service cost
|
0.1
|
|
0.1
|
|
0.1
|
|
|||||
|
Settlement income
|
—
|
|
(3.5
|
)
|
(2.2
|
)
|
|||||
|
Net periodic benefit cost
|
$
|
(3.2
|
)
|
$
|
(5.9
|
)
|
$
|
(4.9
|
)
|
||
|
Weighted average assumptions used to determine net periodic benefit cost:
|
|||||||||||
|
Discount rate
|
4.50
|
%
|
3.90
|
%
|
3.60
|
%
|
|||||
|
Expected return on plan assets
|
6.35
|
%
|
6.00
|
%
|
6.50
|
%
|
|||||
|
Rate of compensation increase
|
N/A
|
|
N/A
|
|
N/A
|
|
|||||
We determine the discount rate used in the measurement of our obligations based on a model that matches the timing and amount of expected benefit payments to maturities of high quality bonds priced as of the pension plan measurement date. When that timing does not correspond to a published high-quality bond rate, our model uses an expected yield curve to determine an appropriate current discount rate. The yields on the bonds are used to derive a discount rate for the liability. The term of our obligation, based on the expected retirement dates of our workforce, is approximately
ten
years.
In developing our expected rate of return assumption, we have evaluated the actual historical performance and long-term return projections of the Plan assets, which give consideration to the asset mix and the anticipated timing of the pension plan outflows. We employ a total return investment approach whereby a mix of equity and fixed income investments are used to maximize the long-term return of plan assets for what we consider a prudent level of risk. The intent of this strategy is to minimize plan expenses by outperforming plan liabilities over the long run. Risk tolerance is established through careful consideration of plan liabilities, plan funded status and our financial condition. The investment portfolio contains a diversified blend of equity and fixed income investments. Furthermore, equity investments are diversified across U.S. and non-U.S. stocks as well as growth, value, and small and large capitalizations. Derivatives may be used to gain market exposure in an efficient and timely manner; however, derivatives may not be used to leverage the portfolio beyond the market value of the underlying investments. Investment risk is measured and monitored on an ongoing basis through annual liability measurements, periodic asset and liability studies, and quarterly investment portfolio reviews.
The following table summarizes our target asset allocation for
2014
and actual asset allocation as of
December 31, 2014
and
2013
for our defined benefit pension plan:
|
Target
Asset
Allocation
|
2014
Actual
Asset
Allocation
|
2013
Actual
Asset
Allocation
|
||||||
|
Debt securities
|
70
|
%
|
70
|
%
|
70
|
%
|
||
|
Equity securities
|
30
|
|
30
|
|
30
|
|
||
|
Total
|
100
|
%
|
100
|
%
|
100
|
%
|
||
For
2015
, the investment strategy for pension plan assets is to maintain a broadly diversified portfolio designed to achieve our target of an average long-term rate of return of
6.35%
. While we believe we can achieve a long-term average return of
6.35%
, we cannot be certain that the portfolio will perform to our expectations. Assets are strategically allocated among debt and equity portfolios to achieve a diversification level that reduces fluctuations in investment returns. Asset allocation target ranges and strategies are reviewed periodically with the assistance of an independent external consulting firm.
102
The pension assets are measured at fair value. The following table summarizes, by level, within the fair value hierarchy, the investments of the Plan at fair value as of
December 31, 2014
and
2013
:
|
|
|
Fair Value Measurements Using
|
|||||||||||||
|
|
Total as of December 31, 2014
|
Quoted
Prices in
Active
Markets
(Level 1)
|
Significant
Other
Observable
Inputs
(Level 2)
|
Significant
Unobservable
Inputs
(Level 3)
|
|||||||||||
|
Money market accounts
|
$
|
6.2
|
|
$
|
6.2
|
|
$
|
—
|
|
$
|
—
|
|
|||
|
Mutual funds
|
266.0
|
|
—
|
|
266.0
|
|
—
|
|
|||||||
|
Limited partnerships
|
0.4
|
|
—
|
|
—
|
|
0.4
|
|
|||||||
|
Total assets
|
$
|
272.6
|
|
$
|
6.2
|
|
$
|
266.0
|
|
$
|
0.4
|
|
|||
|
|
|
Fair Value Measurements Using
|
|||||||||||||
|
|
Total as of December 31, 2013
|
Quoted
Prices in
Active
Markets
(Level 1)
|
Significant
Other
Observable
Inputs
(Level 2)
|
Significant
Unobservable
Inputs
(Level 3)
|
|||||||||||
|
Money market accounts
|
$
|
5.1
|
|
$
|
5.1
|
|
$
|
—
|
|
$
|
—
|
|
|||
|
Common stock
|
13.5
|
|
13.5
|
|
—
|
|
—
|
|
|||||||
|
Mutual funds and real estate investment trusts
|
170.7
|
|
128.5
|
|
42.2
|
|
—
|
|
|||||||
|
Bonds
|
80.1
|
|
—
|
|
80.1
|
|
—
|
|
|||||||
|
Limited partnerships
|
0.4
|
|
—
|
|
—
|
|
0.4
|
|
|||||||
|
Total assets
|
$
|
269.8
|
|
$
|
147.1
|
|
$
|
122.3
|
|
$
|
0.4
|
|
|||
Estimated future benefit payments for the next ten years under the Plan follows:
|
2015
|
$
|
18.5
|
|
|
2016
|
18.9
|
|
|
|
2017
|
18.8
|
|
|
|
2018
|
18.2
|
|
|
|
2019
|
18.4
|
|
|
|
2020 through 2024
|
87.3
|
|
|
Collective Bargaining Agreements
As of
December 31, 2014
, approximately
27%
of our workforce was represented by various labor unions, and approximately
5%
of our workforce was covered by collective bargaining agreements that are set to expire during 2015.
Multiemployer Pension Plans
We contribute to
27
multiemployer pension plans under collective bargaining agreements (CBAs) covering union-represented employees. Approximately
20%
of our total current employees are participants in such multiemployer plans. These plans generally provide retirement benefits to participants based on their service to contributing employers. We do not administer these plans. In general, these plans are managed by a board of trustees with the unions appointing certain trustees and other contributing employers of the plan appointing certain members. We generally are not represented on the board of trustees.
103
Based on the information available to us, we believe that some of the multiemployer plans to which we contribute are either “critical” or “endangered” as those terms are defined in the PPA. The PPA requires underfunded pension plans to improve their funding ratios within prescribed intervals based on the level of their underfunding. Until the plan trustees develop the funding improvement plans or rehabilitation plans as required by the PPA, we cannot determine the amount of assessments we may be subject to, if any. Accordingly, we cannot determine at this time the impact that the PPA may have on our consolidated financial position, results of operations or cash flows.
Furthermore, under current law regarding multiemployer benefit plans, a plan’s termination, our voluntary withdrawal (which we consider from time to time), or the mass withdrawal of all contributing employers from any under-funded multiemployer pension plan would require us to make payments to the plan for our proportionate share of the multiemployer plan’s unfunded vested liabilities. It is possible that there may be a mass withdrawal of employers contributing to these plans or plans may terminate in the near future. We could have adjustments to our estimates for these matters in the near term that could have a material effect on our consolidated financial position, results of operations or cash flows.
Republic’s participation in individually significant multiemployer pension plans for the year ended
December 31, 2014
is outlined in the table below. Only with respect to multiemployer pension plans, we considered contributions in excess of
$3.0 million
in any period disclosed to be individually significant. The most recent PPA zone status available in
2014
and
2013
is for the plans’ year ended September 30 or
December 31, 2013
and
2012
, respectively. The status is based on information that Republic received from the plans and is certified by the plans’ actuary. Among other factors, plans in the “critical” red zone are generally less than
65%
funded, plans in the “endangered” yellow zone are less than
80%
funded, and plans in the “safe” green zone are at least
80%
funded. The last column lists the expiration dates of the collective-bargaining agreements (CBA) to which the plans are subject. There have been no significant changes that affect the comparability of the
2014
,
2013
and
2012
contributions.
|
|
|
Pension Protection
Act Zone Status
|
Funding
Improvement
or Rehabilitation
Plan Status
Pending /
|
Republic
Contributions to Plan
|
Surcharge
|
Expiration
|
|||||||||||||||||
|
Legal Plan Name
|
EIN
|
2013
|
2012
|
Implemented
|
2014
|
2013
|
2012
|
Imposed
|
of CBA
|
||||||||||||||
|
Central States, Southeast
and Southwest Areas
Pension Fund
|
36-6044243
|
Critical
|
Critical
|
Implemented
|
$
|
—
|
|
$
|
1.8
|
|
$
|
3.5
|
|
No
|
N/A
|
||||||||
|
Local 731 Private
Scavengers and Garage
Attendants Pension
Trust Fund
|
36-6513567
|
Critical
|
Critical
|
Implemented
|
9.2
|
|
6.9
|
|
6.3
|
|
No
|
10/01/13 -
9/30/18
|
|||||||||||
|
Western Conference of
Teamsters Pension Plan
|
91-6145047
|
Safe
|
Safe
|
No
|
25.1
|
|
25.3
|
|
26.7
|
|
No
|
12/31/09 -
12/31/18
|
|||||||||||
|
Individually significant
plans
|
34.3
|
|
34.0
|
|
36.5
|
|
|||||||||||||||||
|
All other plans
|
N/A
|
N/A
|
N/A
|
N/A
|
12.5
|
|
9.8
|
|
9.0
|
|
N/A
|
||||||||||||
|
Total
|
$
|
46.8
|
|
$
|
43.8
|
|
$
|
45.5
|
|
||||||||||||||
We are listed in the Form 5500 for Local 731 Private Scavengers and Garage Attendants Pension Trust Fund as providing more than
5%
of the total contributions. At the date these financial statements were issued, Forms 5500 were not available for the plan years ending September 30, 2014 or December 31, 2014.
Central States, Southeast and Southwest Areas Pension Fund
Before September 30, 2013, we had CBAs with local bargaining units of the Teamsters under which we contributed to the Central States, Southeast and Southwest Areas Pension Fund (the Fund). These CBAs were under negotiation during 2012 and 2013. As part of our CBA negotiations, we partially withdrew from participation in the Fund in 2012 and completely withdrew from the Fund in 2013. Accordingly, we will be required to make payments to the Fund for our allocated share of its unfunded vested liabilities.
As of
December 31, 2014
, our estimated liability recorded for our withdrawal from the Fund was
$153.4 million
. We anticipate that this liability will be due in installments over a period of 20 years. Our estimated withdrawal liability is based on information provided to us by the Fund, our actuarial calculations and a number of other variable factors, including the number of 2013 contribution based units. As we obtain updated information from the Fund, the factors used in deriving our estimated withdrawal liability are subject to change. Future changes in our estimated withdrawal liability or timing of payments could
104
have a material adverse effect on our consolidated financial position, results of operations and cash flows.
In April 2014, we submitted to the Fund a request for review and an information request for supporting documentation surrounding the Fund’s calculation and assessment of withdrawal liability. To date the Fund has not responded to our request. In September 2014, we submitted a formal demand for arbitration. The dispute is in arbitration with a hearing date set for July 2016. We cannot predict the outcome of arbitration or any additional future proceedings. Should the Fund’s assessment of withdrawal liability be upheld, we could owe an additional
$67 million
in cash payments over the 20-year payment period. The pendency of arbitration does not relieve us of our obligation to make progress payments while we dispute the amounts. During the year ended December 31, 2014, we made twelve progress payments associated with the Fund's assessed withdrawal liability totaling
$15.9 million
.
Defined Contribution Plan
We maintain the Republic Services 401(k) Plan (401(k) Plan), which is a defined contribution plan covering all eligible employees. Under the provisions of the 401(k) Plan, participants may direct us to defer a portion of their compensation to the 401(k) Plan, subject to Internal Revenue Code limitations. We provide for an employer matching contribution equal to
100%
of the first
3%
of eligible compensation and
50%
of the next
2%
of eligible compensation contributed by each employee, which is funded in cash. All contributions vest immediately.
Total expense recorded for matching 401(k) contributions in
2014
,
2013
and
2012
was
$32.1 million
,
$30.1 million
and
$28.7 million
, respectively.
Deferred Compensation Plan
We provide eligible employees, officers and directors of Republic with the opportunity to voluntarily defer base salary, bonus payments, long-term incentive awards and other compensation, as applicable, on a pre-tax basis through Republic Services, Inc. Deferred Compensation Plan (the DCP). The DCP is a nonqualified deferred compensation plan that conforms to Section 409A of the Internal Revenue Code. Eligible participants can defer up to
80%
of base salary and up to
100%
of bonus, long-term compensation and directors’ fees. Under the DCP, some participants also are eligible for matching contributions. The matching contribution under the DCP is equal to the lesser of
2%
of the participant’s compensation over established 401(k) limits or
50%
of the amount the participant has deferred. The DCP participants have no ownership or security interest in any of the amounts deferred or the measurement funds under the DCP. The right of each participant in the DCP is solely that of a general, unsecured creditor of Republic with respect to his or her own interest under the DCP. Deferred amounts may be subject to forfeiture and are deemed invested among investment funds offered under the DCP, as directed by each participant. Payments of deferred amounts are payable following separation from service or at a date or dates elected by the participant at the time the deferral is elected. Payments of deferred amounts are generally made in either a lump sum or in annual installments over a period not exceeding
15 years
.
Republic invested in corporate-owned life insurance policies to satisfy future obligations under the DCP. These corporate-owned life insurance policies are held in a Rabbi Trust and are recorded at the amount that can be realized under insurance contracts at the balance sheet date, which is the cash surrender value adjusted for other charges or other amounts due that are probable at settlement. The aggregate cash surrender value of these life insurance policies was $
77.1 million
and
$65.1 million
as of
December 31, 2014
and
2013
, respectively, and is classified in other assets in our consolidated balance sheets. The DCP liability was
$76.3 million
and
$67.0 million
as of
December 31, 2014
and
2013
, respectively, and is classified in other long-term liabilities in our consolidated balance sheets.
Employee Stock Purchase Plan
Employees of Republic are eligible to participate in an employee stock purchase plan. The plan allows participants to purchase our common stock for
95%
of its quoted market price on the last day of each calendar quarter. For the years ended
December 31, 2014
,
2013
and
2012
, issuances under this plan totaled
139,941
shares,
142,217
shares and
169,624
shares, respectively. As of
December 31, 2014
, shares reserved for issuance to employees under this plan totaled
0.7 million
and Republic held employee contributions of approximately
$1.2 million
for the purchase of common stock.
105
|
12.
|
STOCKHOLDERS' EQUITY
|
Our share repurchase program has been in effect since November 2010. From November 2010 to
December 31, 2014
, we repurchased
46.6 million
shares of our stock for $
1,439.5 million
at a weighted average cost per share of
$30.88
. During
2014
, we repurchased
11.1 million
shares of our stock for
$400.4 million
at a weighted average cost per share of
$35.92
. During
2013
, we repurchased
6.5 million
shares for
$213.6 million
at a weighted average cost per share of
$32.92
. During
2012
, we repurchased
11.8 million
shares for
$324.7 million
at a weighted average cost per share of
$27.44
.
In October 2014, our board of directors approved a quarterly dividend of
$0.28
per share. Cash dividends declared were
$383.6 million
,
$357.3 million
and
$332.5 million
for the years ended
December 31, 2014
,
2013
and
2012
, respectively. As of
December 31, 2014
, we recorded a quarterly dividend payable of $
98.7 million
to shareholders of record at the close of business on January 2, 2015.
|
13.
|
EARNINGS PER SHARE
|
Basic earnings per share is computed by dividing net income attributable to Republic Services, Inc. by the weighted average number of common shares (including restricted stock and vested but unissued restricted stock units) outstanding during the period. Diluted earnings per share is based on the combined weighted average number of common shares and common share equivalents outstanding, which include, where appropriate, the assumed exercise of employee stock options, unvested restricted stock awards and unvested restricted stock units. In computing diluted earnings per share, we use the treasury stock method.
Earnings per share for the years ended December 31 are calculated as follows (in thousands, except per share amounts):
|
2014
|
2013
|
2012
|
|||||||||
|
Basic earnings per share:
|
|||||||||||
|
Net income attributable to Republic Services, Inc.
|
$
|
547,600
|
|
$
|
588,900
|
|
$
|
571,800
|
|
||
|
Weighted average common shares outstanding
|
356,673
|
|
362,054
|
|
366,883
|
|
|||||
|
Basic earnings per share
|
$
|
1.54
|
|
$
|
1.63
|
|
$
|
1.56
|
|
||
|
Diluted earnings per share:
|
|||||||||||
|
Net income attributable to Republic Services, Inc.
|
$
|
547,600
|
|
$
|
588,900
|
|
$
|
571,800
|
|
||
|
Weighted average common shares outstanding
|
356,673
|
|
362,054
|
|
366,883
|
|
|||||
|
Effect of dilutive securities:
|
|||||||||||
|
Options to purchase common stock
|
1,350
|
|
1,332
|
|
1,008
|
|
|||||
|
Unvested restricted stock awards
|
84
|
|
36
|
|
129
|
|
|||||
|
Weighted average common and common equivalent shares outstanding
|
358,107
|
|
363,422
|
|
368,020
|
|
|||||
|
Diluted earnings per share
|
$
|
1.53
|
|
$
|
1.62
|
|
$
|
1.55
|
|
||
|
Antidilutive securities not included in the diluted earnings per share calculations:
|
|||||||||||
|
Options to purchase common stock
|
274
|
|
1,658
|
|
7,876
|
|
|||||
106
14. SEGMENT REPORTING
We manage and evaluate our operations through three regions: East, Central and West. These
three
regions are presented below as our reportable segments, which provide integrated waste management services consisting of collection, transfer, recycling and disposal of domestic non-hazardous solid waste. The historical results, discussion and presentation of our reportable segments as set forth in our consolidated financial statements for all periods presented reflect the impact of the restructuring of our operations in the fourth quarter of 2012.
Summarized financial information concerning our reportable segments for the years ended
December 31, 2014
,
2013
and
2012
follows:
|
Gross
Revenue
|
Intercompany
Revenue
|
Net
Revenue
|
Depreciation,
Amortization,
Depletion and
Accretion
|
Operating
Income
(Loss)
|
Capital
Expenditures
|
Total Assets
|
|||||||||||||||||||||
|
2014:
|
|||||||||||||||||||||||||||
|
East
|
$
|
2,902.8
|
|
$
|
(404.7
|
)
|
$
|
2,498.1
|
|
$
|
266.2
|
|
$
|
429.6
|
|
$
|
235.5
|
|
$
|
4,538.4
|
|
||||||
|
Central
|
3,238.6
|
|
(616.2
|
)
|
2,622.4
|
|
318.6
|
|
503.6
|
|
270.9
|
|
5,775.7
|
|
|||||||||||||
|
West
|
4,276.8
|
|
(787.4
|
)
|
3,489.4
|
|
355.1
|
|
825.7
|
|
298.7
|
|
8,413.7
|
|
|||||||||||||
|
Corporate entities
|
192.8
|
|
(14.4
|
)
|
178.4
|
|
45.0
|
|
(525.8
|
)
|
57.4
|
|
1,366.2
|
|
|||||||||||||
|
Total
|
$
|
10,611.0
|
|
$
|
(1,822.7
|
)
|
$
|
8,788.3
|
|
$
|
984.9
|
|
$
|
1,233.1
|
|
$
|
862.5
|
|
$
|
20,094.0
|
|
||||||
|
2013:
|
|||||||||||||||||||||||||||
|
East
|
$
|
2,857.4
|
|
$
|
(401.4
|
)
|
$
|
2,456.0
|
|
$
|
257.6
|
|
$
|
451.0
|
|
$
|
260.7
|
|
$
|
4,972.3
|
|
||||||
|
Central
|
3,098.5
|
|
(586.4
|
)
|
2,512.1
|
|
304.6
|
|
494.5
|
|
297.5
|
|
5,794.7
|
|
|||||||||||||
|
West
|
4,049.8
|
|
(725.4
|
)
|
3,324.4
|
|
342.8
|
|
766.6
|
|
303.4
|
|
8,274.9
|
|
|||||||||||||
|
Corporate entities
|
139.0
|
|
(14.3
|
)
|
124.7
|
|
49.0
|
|
(501.8
|
)
|
19.2
|
|
907.3
|
|
|||||||||||||
|
Total
|
$
|
10,144.7
|
|
$
|
(1,727.5
|
)
|
$
|
8,417.2
|
|
$
|
954.0
|
|
$
|
1,210.3
|
|
$
|
880.8
|
|
$
|
19,949.2
|
|
||||||
|
2012:
|
|||||||||||||||||||||||||||
|
East
|
$
|
2,838.7
|
|
$
|
(392.9
|
)
|
$
|
2,445.8
|
|
$
|
244.6
|
|
$
|
474.6
|
|
$
|
223.2
|
|
$
|
4,916.6
|
|
||||||
|
Central
|
2,969.3
|
|
(544.5
|
)
|
2,424.8
|
|
285.0
|
|
474.5
|
|
296.8
|
|
5,668.4
|
|
|||||||||||||
|
West
|
3,819.8
|
|
(661.8
|
)
|
3,158.0
|
|
332.7
|
|
685.9
|
|
357.4
|
|
8,226.1
|
|
|||||||||||||
|
Corporate entities
|
103.7
|
|
(14.0
|
)
|
89.7
|
|
64.6
|
|
(314.4
|
)
|
26.1
|
|
805.8
|
|
|||||||||||||
|
Total
|
$
|
9,731.5
|
|
$
|
(1,613.2
|
)
|
$
|
8,118.3
|
|
$
|
926.9
|
|
$
|
1,320.6
|
|
$
|
903.5
|
|
$
|
19,616.9
|
|
||||||
Intercompany revenue reflects transactions within and between segments that generally are made on a basis intended to reflect the market value of such services. Capital expenditures for corporate entities primarily include vehicle inventory acquired but not yet assigned to operating locations and facilities. Corporate functions include legal, tax, treasury, information technology, risk management, human resources, corporate accounts, closed landfills and other administrative functions. During the years ended December 31, 2014, 2013 and 2012, environmental remediation charges were incurred at our closed Bridgeton Landfill in Missouri. See Note 8,
Landfill and Environmental Costs
. During 2014, 2013 and 2012, we recorded charges related to our withdrawal from the Central States, Southeast and Southwest Areas Pension Fund. See Note 11,
Employee Benefit Plans
, for a summary of our withdrawal and the related estimated withdrawal liability. During 2014, 2013 and 2012, we completed various refinancing transactions that resulted in cash paid for premiums and professional fees to repurchase outstanding debt, as well as non-cash charges for unamortized debt discounts and deferred issuance costs. See Note 9,
Debt
.
107
The following table shows our total reported revenue by service line for the years ended December 31 (in millions and as a percentage of revenue).
|
|
2014
|
2013
|
2012
|
|||||||||||||||||
|
Collection:
|
||||||||||||||||||||
|
Residential
|
$
|
2,193.6
|
|
25.0
|
%
|
$
|
2,175.5
|
|
25.8
|
%
|
$
|
2,155.7
|
|
26.6
|
%
|
|||||
|
Commercial
|
2,723.3
|
|
31.0
|
|
2,616.9
|
|
31.1
|
|
2,523.2
|
|
31.1
|
|
||||||||
|
Industrial
|
1,784.0
|
|
20.3
|
|
1,639.4
|
|
19.5
|
|
1,544.2
|
|
19.0
|
|
||||||||
|
Other
|
37.2
|
|
0.4
|
|
34.7
|
|
0.4
|
|
33.4
|
|
0.4
|
|
||||||||
|
Total collection
|
6,738.1
|
|
76.7
|
|
6,466.5
|
|
76.8
|
|
6,256.5
|
|
77.1
|
|
||||||||
|
Transfer
|
1,062.6
|
|
1,021.8
|
|
964.5
|
|
||||||||||||||
|
Less: intercompany
|
(654.4
|
)
|
(615.2
|
)
|
(575.3
|
)
|
||||||||||||||
|
Transfer, net
|
408.2
|
|
4.6
|
|
406.6
|
|
4.8
|
|
389.2
|
|
4.8
|
|
||||||||
|
Landfill
|
2,014.5
|
|
1,927.2
|
|
1,863.3
|
|
||||||||||||||
|
Less: intercompany
|
(928.1
|
)
|
(902.2
|
)
|
(862.5
|
)
|
||||||||||||||
|
Landfill, net
|
1,086.4
|
|
12.4
|
|
1,025.0
|
|
12.2
|
|
1,000.8
|
|
12.3
|
|
||||||||
|
Sale of recycled commodities
|
390.8
|
|
4.4
|
|
374.6
|
|
4.5
|
|
349.0
|
|
4.3
|
|
||||||||
|
Other non-core
|
164.8
|
|
1.9
|
|
144.5
|
|
1.7
|
|
122.8
|
|
1.5
|
|
||||||||
|
Other
|
555.6
|
|
6.3
|
|
519.1
|
|
6.2
|
|
471.8
|
|
5.8
|
|
||||||||
|
Total revenue
|
$
|
8,788.3
|
|
100.0
|
%
|
$
|
8,417.2
|
|
100.0
|
%
|
$
|
8,118.3
|
|
100.0
|
%
|
|||||
Other revenue consists primarily of revenue from National Accounts, which represents the portion of revenue generated from nationwide contracts in markets outside our operating areas where the associated waste handling services are subcontracted to local operators. Consequently, substantially all of this revenue is offset with related subcontract costs, which are recorded in cost of operations.
15. CHANGES IN ACCUMULATED OTHER COMPREHENSIVE LOSS (INCOME) BY COMPONENT
A summary of changes in accumulated other comprehensive loss (income), net of tax, by component, for the years ended
December 31, 2014
,
2013
and
2012
follows:
|
Gains and Losses on Cash Flow Hedges
|
Defined Benefit Pension Items
|
Total
|
|||||||||
|
Balance as of December 31, 2011
|
$
|
24.5
|
|
$
|
(3.0
|
)
|
$
|
21.5
|
|
||
|
Other comprehensive income before reclassifications
|
(3.7
|
)
|
(15.6
|
)
|
(19.3
|
)
|
|||||
|
Amounts reclassified from accumulated other
comprehensive income
|
2.3
|
|
1.3
|
|
3.6
|
|
|||||
|
Net current-period other comprehensive income
|
(1.4
|
)
|
(14.3
|
)
|
(15.7
|
)
|
|||||
|
Balance as of December 31, 2012
|
23.1
|
|
(17.3
|
)
|
5.8
|
|
|||||
|
Other comprehensive income before reclassifications
|
(4.0
|
)
|
(7.1
|
)
|
(11.1
|
)
|
|||||
|
Amounts reclassified from accumulated other
comprehensive income |
0.2
|
|
2.1
|
|
2.3
|
|
|||||
|
Net current-period other comprehensive income
|
(3.8
|
)
|
(5.0
|
)
|
(8.8
|
)
|
|||||
|
Balance as of December 31, 2013
|
19.3
|
|
(22.3
|
)
|
(3.0
|
)
|
|||||
|
Other comprehensive loss before reclassifications
|
23.8
|
|
9.3
|
|
33.1
|
|
|||||
|
Amounts reclassified from accumulated other
comprehensive income
|
(1.2
|
)
|
—
|
|
(1.2
|
)
|
|||||
|
Net current-period other comprehensive loss
|
22.6
|
|
9.3
|
|
31.9
|
|
|||||
|
Balance as of December 31, 2014
|
$
|
41.9
|
|
$
|
(13.0
|
)
|
$
|
28.9
|
|
||
108
A summary of reclassifications out of accumulated other comprehensive loss (income) for the years ended
December 31, 2014
,
2013
and
2012
follows:
|
2014
|
2013
|
2012
|
|||||||||||||
|
Details about Accumulated Other Comprehensive Loss (Income) Components
|
Amount Reclassified from Accumulated Other Comprehensive Loss (Income)
|
Affected Line Item in the Statement Where Net Income is Presented
|
|||||||||||||
|
Gain (loss) on cash flow hedges:
|
|||||||||||||||
|
Recycling commodity hedges
|
$
|
—
|
|
$
|
0.2
|
|
$
|
3.3
|
|
Revenue
|
|||||
|
Fuel hedges
|
0.7
|
|
2.9
|
|
2.8
|
|
Cost of operations
|
||||||||
|
Interest rate contracts
|
(2.7
|
)
|
(2.7
|
)
|
(2.2
|
)
|
Interest expense
|
||||||||
|
(2.0
|
)
|
0.4
|
|
3.9
|
|
Total before tax
|
|||||||||
|
0.8
|
|
(0.2
|
)
|
(1.6
|
)
|
Tax benefit (expense)
|
|||||||||
|
(1.2
|
)
|
0.2
|
|
2.3
|
|
Net of tax
|
|||||||||
|
Pension gains:
|
|||||||||||||||
|
Pension settlement
|
$
|
—
|
|
$
|
3.5
|
|
$
|
2.2
|
|
Selling, general and administrative
|
|||||
|
—
|
|
(1.4
|
)
|
(0.9
|
)
|
Tax expense
|
|||||||||
|
—
|
|
2.1
|
|
1.3
|
|
Net of tax
|
|||||||||
|
Total (loss) gain reclassified into earnings
|
$
|
(1.2
|
)
|
$
|
2.3
|
|
$
|
3.6
|
|
||||||
|
16.
|
FINANCIAL INSTRUMENTS
|
Fuel Hedges
We have entered into multiple swap agreements designated as cash flow hedges to mitigate some of our exposure related to changes in diesel fuel prices. These swaps qualified for, and were designated as, effective hedges of changes in the prices of forecasted diesel fuel purchases (fuel hedges).
The following table summarizes our outstanding fuel hedges as of
December 31, 2014
:
|
Year
|
Gallons Hedged
|
Weighted Average Contract
Price per Gallon
|
||
|
2015
|
27,000,000
|
$3.76
|
||
|
2016
|
24,120,000
|
3.64
|
||
If the national U.S. on-highway average price for a gallon of diesel fuel as published by the Department of Energy exceeds the contract price per gallon, we receive the difference between the average price and the contract price (multiplied by the notional gallons) from the counterparty. If the average price is less than the contract price per gallon, we pay the difference to the counterparty.
The fair values of our fuel hedges are determined using standard option valuation models with assumptions about commodity prices based on those observed in underlying markets (Level 2 in the fair value hierarchy). The aggregate fair values of our outstanding fuel hedges as of
December 31, 2014
and
2013
were current liabilities of
$34.4 million
and
$0.1 million
, respectively, and current assets of
$6.7 million
as of
December 31, 2013
, and have been recorded in other accrued liabilities and prepaid expenses and other current assets in our consolidated balance sheets, respectively. The ineffective portions of the changes in fair values resulted in losses of
$0.5 million
for the year ended
December 31, 2014
and gains of less than
$0.1 million
for each of the years ended
December 31, 2013
and
2012
, and have been recorded in other income, net in our consolidated statements of income.
Total (loss) gain recognized in other comprehensive income for fuel hedges (the effective portion) were
$(24.2) million
,
$2.4 million
and
$3.4 million
, for the years ended
December 31, 2014
,
2013
and 2012, respectively.
109
Recycling Commodity Hedges
We had no outstanding recycling commodity hedges as of
December 31, 2014
. The aggregate fair values of the outstanding recycling commodity hedges as of
December 31, 2013
were current assets of
$0.3 million
and current liabilities of
$0.6 million
, and have been recorded in prepaid expenses and other current assets and other accrued liabilities in our consolidated balance sheets, respectively. The agreements qualified for, and were designated as, effective hedges of changes in the prices of certain forecasted recycling commodity sales (commodity hedges). No amounts were recognized in other income, net in our consolidated statements of income for the ineffectiveness portion of the changes in fair values during the years ended
December 31, 2014
,
2013
and
2012
. Total gain (loss) recognized in other comprehensive income for recycling commodity hedges (the effective portion) were
$0.1 million
,
$(0.1) million
and
$(0.6) million
for the years ended
December 31, 2014
,
2013
and 2012, respectively.
Fair Value Measurements
In measuring fair values of assets and liabilities, we use valuation techniques that maximize the use of observable inputs (Level 1) and minimize the use of unobservable inputs (Level 3). We also use market data or assumptions that we believe market participants would use in pricing an asset or liability, including assumptions about risk when appropriate.
The carrying value for certain of our financial instruments, including cash, accounts receivable, accounts payable and certain other accrued liabilities, approximates fair value because of their short-term nature.
As of
December 31, 2014
and
2013
, our assets and liabilities that are measured at fair value on a recurring basis include the following:
|
December 31, 2014
|
|||||||||||||||||||
|
|
Fair Value
|
||||||||||||||||||
|
|
Carrying Amount
|
Total
|
Quoted
Prices in
Active
Markets
(Level 1)
|
Significant
Other
Observable
Inputs
(Level 2)
|
Significant
Unobservable
Inputs
(Level 3)
|
||||||||||||||
|
Assets:
|
|||||||||||||||||||
|
Money market mutual funds
|
$
|
59.7
|
|
$
|
59.7
|
|
$
|
59.7
|
|
$
|
—
|
|
$
|
—
|
|
||||
|
Bonds - restricted cash and marketable securities and other assets
|
56.8
|
|
56.8
|
|
—
|
|
56.8
|
|
—
|
|
|||||||||
|
Interest rate swaps - other assets
|
14.1
|
|
14.1
|
|
—
|
|
14.1
|
|
—
|
|
|||||||||
|
Total assets
|
$
|
130.6
|
|
$
|
130.6
|
|
$
|
59.7
|
|
$
|
70.9
|
|
$
|
—
|
|
||||
|
Liabilities:
|
|||||||||||||||||||
|
Fuel hedges - other accrued liabilities
|
$
|
34.4
|
|
$
|
34.4
|
|
$
|
—
|
|
$
|
34.4
|
|
$
|
—
|
|
||||
|
Total debt
|
7,061.2
|
|
7,977.9
|
|
—
|
|
7,977.9
|
|
—
|
|
|||||||||
|
Total liabilities
|
$
|
7,095.6
|
|
$
|
8,012.3
|
|
$
|
—
|
|
$
|
8,012.3
|
|
$
|
—
|
|
||||
110
|
December 31, 2013
|
|||||||||||||||||||
|
|
Fair Value
|
||||||||||||||||||
|
|
Carrying Amount
|
Total
|
Quoted
Prices in
Active
Markets
(Level 1)
|
Significant
Other
Observable
Inputs
(Level 2)
|
Significant
Unobservable
Inputs
(Level 3)
|
||||||||||||||
|
Assets:
|
|||||||||||||||||||
|
Money market mutual funds
|
$
|
176.0
|
|
$
|
176.0
|
|
$
|
176.0
|
|
$
|
—
|
|
$
|
—
|
|
||||
|
Bonds - restricted cash and marketable securities
|
36.6
|
|
36.6
|
|
—
|
|
36.6
|
|
—
|
|
|||||||||
|
Fuel hedges - other current assets
|
6.7
|
|
6.7
|
|
—
|
|
6.7
|
|
—
|
|
|||||||||
|
Commodity hedges - other current assets
|
0.3
|
|
0.3
|
|
—
|
|
0.3
|
|
—
|
|
|||||||||
|
Total assets
|
$
|
219.6
|
|
$
|
219.6
|
|
$
|
176.0
|
|
$
|
43.6
|
|
$
|
—
|
|
||||
|
Liabilities:
|
|||||||||||||||||||
|
Fuel hedges - other accrued liabilities
|
$
|
0.1
|
|
$
|
0.1
|
|
$
|
—
|
|
$
|
0.1
|
|
$
|
—
|
|
||||
|
Commodity hedges - other accrued liabilities
|
0.6
|
|
0.6
|
|
—
|
|
0.6
|
|
—
|
|
|||||||||
|
Interest rate swaps - other liabilities
|
4.4
|
|
4.4
|
|
—
|
|
4.4
|
|
—
|
|
|||||||||
|
Total debt
|
7,018.1
|
|
7,538.1
|
|
—
|
|
7,538.1
|
|
—
|
|
|||||||||
|
Total liabilities
|
$
|
7,023.2
|
|
$
|
7,543.2
|
|
$
|
—
|
|
$
|
7,543.2
|
|
$
|
—
|
|
||||
The fair value of our fixed rate senior notes and debentures was
$6.8 billion
and
$6.4 billion
as of
December 31, 2014
and
2013
, respectively. The carrying value of these notes and debentures was
$5.9 billion
and
$5.8 billion
as of
December 31, 2014
and
2013
, respectively. The carrying amounts of our remaining notes payable and tax-exempt financings approximate fair value because interest rates are variable and, accordingly, approximate current market rates for instruments with similar risk and maturities. See Note 9,
Debt,
for further information related to our debt.
|
17.
|
COMMITMENTS AND CONTINGENCIES
|
Legal Proceedings
We are subject to extensive and evolving laws and regulations and have implemented safeguards to respond to regulatory requirements. In the normal course of our business, we become involved in legal proceedings. Some may result in fines, penalties or judgments against us, which may impact earnings and cash flows for a particular period. Although we cannot predict the ultimate outcome of any legal matter with certainty, we do not believe the outcome of any of our pending legal proceedings will have a material adverse impact on our consolidated financial position, results of operations or cash flows.
As used herein, the term
legal proceedings
refers to litigation and similar claims against us and our subsidiaries, excluding: (1) ordinary course accidents, general commercial liability and workers compensation claims, which are covered by insurance programs, subject to customary deductibles, and which, together with self-insured employee health care costs, are discussed in Note 7,
Other Liabilities
; and (2) environmental remediation liabilities, which are discussed in Note 8,
Landfill and Environmental Costs.
We accrue for legal proceedings when losses become probable and reasonably estimable. We have recorded an aggregate accrual of approximately
$68 million
relating to our outstanding legal proceedings as of
December 31, 2014
. As of the end of each applicable reporting period, we review each of our legal proceedings and, where it is probable that a liability has been incurred, we accrue for all probable and reasonably estimable losses. Where we can reasonably estimate a range of losses we may incur regarding such a matter, we record an accrual for the amount within the range that constitutes our best estimate. If we can reasonably estimate a range but no amount within the range appears to be a better estimate than any other, we use the amount that is the low end of such range. If we used the high ends of such ranges, our aggregate potential liability would be approximately
$74 million
higher than the amount recorded as of
December 31, 2014
.
111
Lease Commitments
We and our subsidiaries lease real property, equipment and software under various operating leases with remaining terms from
one
month to
30
years. Rent expense during the years ended
December 31, 2014
,
2013
and
2012
was
$49.1 million
,
$47.8 million
and
$46.0 million
, respectively.
Future minimum lease obligations under non-cancelable operating leases with initial terms in excess of one year as of
December 31, 2014
are as follows:
|
2015
|
$
|
24.4
|
|
|
2016
|
20.5
|
|
|
|
2017
|
19.4
|
|
|
|
2018
|
16.8
|
|
|
|
2019
|
13.2
|
|
|
|
Thereafter
|
56.5
|
|
|
|
$
|
150.8
|
|
|
Unconditional Purchase Commitments
Royalties
We have entered into agreements to pay royalties to prior landowners, lessors or host communities, based on waste tonnage disposed at specified landfills. These royalties are generally payable quarterly and amounts incurred, but not paid, are accrued in our consolidated balance sheets. Royalties are accrued as tonnage is disposed of in the landfills.
Disposal Agreements
We have several agreements expiring at various dates through 2033 that require us to dispose of a minimum number of tons at third-party disposal facilities. Under these put-or-pay agreements, we must pay for agreed-upon minimum volumes regardless of the actual number of tons placed at the facilities.
Future minimum payments under unconditional purchase commitments, consisting primarily of (1) disposal related agreements, which include fixed or minimum royalty payments, host agreements, and take-or-pay and put-or-pay agreements, and (2) other obligations including committed capital expenditures and consulting service agreements as of
December 31, 2014
are as follows:
|
2015
|
$
|
236.4
|
|
|
2016
|
76.3
|
|
|
|
2017
|
71.5
|
|
|
|
2018
|
38.7
|
|
|
|
2019
|
34.1
|
|
|
|
Thereafter
|
494.4
|
|
|
|
$
|
951.4
|
|
|
Restricted Cash and Other Financial Guarantees
We must provide financial assurance to governmental agencies and a variety of other entities under applicable environmental regulations relating to our landfill operations for capping, closure and post-closure costs, and our performance under certain collection, landfill and transfer station contracts. We satisfy our financial assurance requirements by providing surety bonds, letters of credit, insurance policies or trust deposits. The amount of the financial assurance requirements for capping, closure and post-closure costs is determined by applicable state environmental regulations, which vary by state. The financial assurance requirements for capping, closure and post-closure costs can either be for costs associated with a portion of the landfill or the entire landfill. Generally, states will require a third-party engineering specialist to determine the estimated capping, closure and post-closure costs that are used to determine the required amount of financial assurance for a landfill. The amount of financial assurance required can, and generally will, differ from the obligation determined and recorded under U.S.
112
GAAP. The amount of the financial assurance requirements related to contract performance varies by contract. Additionally, we are required to provide financial assurance for our insurance program and collateral for certain performance obligations.
We had the following financial instruments and collateral in place to secure our financial assurances as of December 31:
|
2014
|
2013
|
||||||
|
Letters of credit
|
$
|
659.9
|
|
$
|
782.7
|
|
|
|
Surety bonds
|
2,952.7
|
|
2,819.9
|
|
|||
The outstanding letters of credit used
$615.1 million
and
$722.1 million
as of
December 31, 2014
and
2013
, respectively, of availability under our Credit Facilities. Surety bonds subject to expiration will expire on various dates through 2021.
These financial instruments are issued in the normal course of business and are not debt. Because we currently have no liability for this financial assurance, it is not reflected in our consolidated balance sheets. However, we have recorded capping, closure and post-closure obligations and insurance reserves as they are incurred. The underlying financial assurance obligations, in excess of those already reflected in our consolidated balance sheets, would be recorded if it is probable that we would be unable to fulfill our related obligations. We do not expect this to occur.
Our restricted cash and marketable securities include, among other things, restricted cash and marketable securities held for capital expenditures under certain debt facilities, restricted cash pursuant to a holdback arrangement, and restricted cash and marketable securities pledged to regulatory agencies and governmental entities as financial guarantees of our performance related to our final capping, closure and post-closure obligations at our landfills.
The following table summarizes our restricted cash and marketable securities as of December 31:
|
2014
|
2013
|
||||||
|
Financing proceeds
|
$
|
37.7
|
|
$
|
21.9
|
|
|
|
Capping, closure and post-closure obligations
|
26.7
|
|
56.0
|
|
|||
|
Insurance
|
50.4
|
|
88.4
|
|
|||
|
Other
|
0.8
|
|
3.4
|
|
|||
|
Total restricted cash and marketable securities
|
$
|
115.6
|
|
$
|
169.7
|
|
|
We own a
19.9%
interest in a company that, among other activities, issues financial surety bonds to secure capping, closure and post-closure obligations for companies operating in the solid waste industry. We account for this investment under the cost method of accounting. There have been no identified events or changes in circumstances that may have a significant adverse effect on the recoverability of this investment. This investee company and the parent company of the investee had written surety bonds for us relating primarily to our landfill operations for capping, closure and post-closure, of which
$1,203.6 million
was outstanding as of
December 31, 2014
. Our reimbursement obligations under these bonds are secured by an indemnity agreement with the investee and letters of credit totaling
$15.8 million
as of
December 31, 2013
. There were
no
letters of credit outstanding as of
December 31, 2014
.
Off-Balance Sheet Arrangements
We have no off-balance sheet debt or similar obligations, other than operating leases and the financial assurances discussed above, which are not classified as debt. We have no transactions or obligations with related parties that are not disclosed, consolidated into or reflected in our reported financial position or results of operations. We have not guaranteed any third-party debt.
Guarantees
We enter into contracts in the normal course of business that include indemnification clauses. Indemnifications relating to known liabilities are recorded in the consolidated financial statements based on our best estimate of required future payments. Certain of these indemnifications relate to contingent events or occurrences, such as the imposition of additional taxes due to a change in the tax law or adverse interpretation of the tax law, and indemnifications made in divestiture agreements where we indemnify the buyer for liabilities that relate to our activities prior to the divestiture and that may become known in the future. We do not believe that these contingent obligations will have a material effect on our consolidated financial position, results of operations or cash flows.
113
We have entered into agreements with property owners to guarantee the value of property that is adjacent to certain of our landfills. These agreements have varying terms. We do not believe that these contingent obligations will have a material effect on our consolidated financial position, results of operations or cash flows.
Other Matters
Our business activities are conducted in the context of a developing and changing statutory and regulatory framework. Governmental regulation of the waste management industry requires us to obtain and retain numerous governmental permits to conduct various aspects of our operations. These permits are subject to revocation, modification or denial. The costs and other capital expenditures that may be required to obtain or retain the applicable permits or comply with applicable regulations could be significant. Any revocation, modification or denial of permits could have a material adverse effect on us.
18. SELECTED QUARTERLY FINANCIAL DATA (unaudited)
The following tables summarize our unaudited consolidated quarterly results of operations as reported for
2014
and
2013
:
|
First
Quarter
|
Second
Quarter
|
Third
Quarter
|
Fourth
Quarter
|
||||||||||||
|
2014:
|
|||||||||||||||
|
Revenue
|
$
|
2,073.7
|
|
$
|
2,225.3
|
|
$
|
2,264.1
|
|
$
|
2,225.2
|
|
|||
|
Operating income
|
306.1
|
|
378.3
|
|
382.4
|
|
166.4
|
|
|||||||
|
Net income
|
132.6
|
|
179.0
|
|
185.8
|
|
50.5
|
|
|||||||
|
Net income attributable to Republic Services, Inc.
|
132.5
|
|
179.0
|
|
185.8
|
|
50.3
|
|
|||||||
|
Diluted earnings per common share
|
0.37
|
|
0.50
|
|
0.52
|
|
0.14
|
|
|||||||
|
2013:
|
|||||||||||||||
|
Revenue
|
$
|
1,998.6
|
|
$
|
2,111.7
|
|
$
|
2,165.4
|
|
$
|
2,141.5
|
|
|||
|
Operating income
|
274.2
|
|
181.2
|
|
352.3
|
|
402.6
|
|
|||||||
|
Net income
|
124.9
|
|
56.4
|
|
171.1
|
|
236.7
|
|
|||||||
|
Net income attributable to Republic Services, Inc.
|
124.6
|
|
56.3
|
|
171.4
|
|
236.6
|
|
|||||||
|
Diluted earnings per common share
|
0.34
|
|
0.15
|
|
0.47
|
|
0.65
|
|
|||||||
During the years ended December 31, 2014 and 2013, environmental remediation charges were incurred at our closed Bridgeton Landfill in Missouri, of which
$36.1 million
was recorded during the first quarter of 2014,
$174.5 million
was recorded during the fourth quarter of 2014, and
$108.7 million
was recorded during the second quarter of 2013. See Note 8,
Landfill and Environmental Costs
, for a summary of these charges. During 2013, we recorded charges related to our withdrawal from the Central States, Southeast and Southwest Areas Pension Fund, of which
$57.9 million
was recorded during the first quarter of 2013,
$42.0 million
was recorded during the second quarter of 2013, and
$38.7 million
was recorded during the third quarter of 2013. During the fourth quarter of 2013, we reduced our valuation allowance related to certain deferred tax assets for state net operating loss carryforwards. See Note 10,
Income Taxes
, for a summary regarding this valuation allowance adjustment.
114
|
ITEM 9.
|
CHANGES IN AND DISAGREEMENTS WITH ACCOUNTANTS ON ACCOUNTING AND FINANCIAL DISCLOSURE
|
None.
|
ITEM 9A.
|
CONTROLS AND PROCEDURES
|
REPORT OF MANAGEMENT ON REPUBLIC SERVICES, INC.’S INTERNAL CONTROL OVER FINANCIAL REPORTING
We, as members of management of Republic Services, Inc., are responsible for establishing and maintaining adequate internal control over financial reporting, as such term is defined in Exchange Act Rule 13a-15(f). Internal control over financial reporting is a process designed to provide reasonable assurance regarding the reliability of financial reporting and the preparation of financial statements for external purposes in accordance with generally accepted accounting principles. Internal control over financial reporting includes those policies and procedures that (1) pertain to the maintenance of records that, in reasonable detail, accurately and fairly reflect transactions and dispositions of our assets; (2) provide reasonable assurance that transactions are recorded as necessary to permit preparation of financial statements in accordance with generally accepted accounting principles, and that our receipts and expenditures are being made only in accordance with authorizations of our management and directors; and (3) provide reasonable assurance regarding prevention or timely detection of unauthorized acquisition, use, or disposition of our assets that could have a material effect on the financial statements.
Because of its inherent limitations, our internal control systems and procedures may not prevent or detect misstatements. An internal control system, no matter how well conceived and operated, can provide only reasonable, not absolute, assurance that the objectives of the control system are met. Because of the inherent limitations in all control systems, no evaluation of controls can provide absolute assurance that all control issues and instances of fraud, if any, have been detected. Also, projections of any evaluation of effectiveness to future periods are subject to the risks that controls may become inadequate because of changes in conditions, or that the degree of compliance with the policies and procedures may deteriorate.
We, under the supervision of and with the participation of our management, including the Chief Executive Officer, Chief Financial Officer and Chief Accounting Officer, assessed the effectiveness of our internal control over financial reporting as of December 31, 2014, based on criteria for effective internal control over financial reporting described in “Internal Control — Integrated Framework (2013)” issued by the Committee of Sponsoring Organizations of the Treadway Commission. Based on this assessment, we concluded that we maintained effective internal control over financial reporting as of December 31, 2014, based on the specified criteria.
Our internal control over financial reporting has been audited by Ernst & Young LLP, an independent registered public accounting firm, as stated in their attestation report which is included herein.
Disclosure Controls and Procedures
We carried out an evaluation, under the supervision and with the participation of our management, including our Chief Executive Officer and Chief Financial Officer, of the effectiveness of our disclosure controls and procedures (as defined in Exchange Act Rules 13a-15(e), and 15d-15(e)) as of the end of the period covered by this Annual Report. Based upon that evaluation, our Chief Executive Officer and Chief Financial Officer concluded that our disclosure controls and procedures were effective as of the end of the period covered by this Annual Report.
Changes in Internal Control Over Financial Reporting
Based on an evaluation, under the supervision and with the participation of our management, including our Chief Executive Officer and Chief Financial Officer, there has been no change in our internal control over financial reporting during our last fiscal quarter identified in connection with that evaluation, that has materially affected, or is reasonably likely to materially affect, our internal control over financial reporting.
|
ITEM 9B.
|
OTHER INFORMATION
|
None.
115
|
ITEM 10.
|
DIRECTORS, EXECUTIVE OFFICERS AND CORPORATE GOVERNANCE
|
Information required by this item is incorporated by reference to the material appearing under the headings “Election of Directors,” “Biographical Information Regarding Directors/Nominees and Executive Officers,” “Board of Directors and Corporate Governance Matters,” “Section 16(a) Beneficial Ownership Reporting Compliance” and “Executive Officers” in the Proxy Statement for the 2015 Annual Meeting of Shareholders.
|
ITEM 11.
|
EXECUTIVE COMPENSATION
|
Information required by this item is incorporated by reference to the material appearing under the headings “Executive Compensation” and “Director Compensation” in the Proxy Statement for the 2015 Annual Meeting of Shareholders.
ITEM 12.
SECURITY OWNERSHIP OF CERTAIN BENEFICIAL OWNERS AND MANAGEMENT AND RELATED STOCKHOLDER MATTERS
Information required by this item is incorporated by reference to the material appearing under the headings “Security Ownership of Five Percent Stockholders” and “Security Ownership of the Board of Directors and Management” in the Proxy Statement for the 2015 Annual Meeting of Shareholders.
The following table sets forth certain information regarding equity compensation plans as of
December 31, 2014
(number of securities in millions):
|
Plan Category
|
Number of
Securities
to be
Issued Upon
Exercise of
Outstanding
Options
and Rights (b)
|
Weighted
Average
Exercised Price of
Outstanding
Options
and Rights (c)
|
Number of
Securities
Remaining
Available
for Future Issuance
Under Equity
Compensation
Plans (excluding
securities
reflected in
the first column) (d)
|
||||||
|
Equity compensation plans approved by security holders (a)
|
9.1
|
|
$
|
29.53
|
|
17.0
|
|
||
|
Equity compensation plans not approved by security holders
|
—
|
|
—
|
|
—
|
|
|||
|
Total
|
9.1
|
|
$
|
29.53
|
|
17.0
|
|
||
|
(a)
|
Includes our 1998 Stock Incentive Plan, 2006 Incentive Stock Plan, Amended and Restated 2007 Stock Incentive Plan, and our 2009 Employee Stock Purchase Plan (ESPP).
|
|
(b)
|
Includes
7.6 million
stock options,
1.5 million
shares underlying restricted stock units, and less than 0.1 million shares underlying purchase rights that accrue under the ESPP.
|
|
(c)
|
Excludes restricted stock units as these awards do not have exercise prices.
|
|
(d)
|
The shares remaining available for future issuances include
16.3 million
shares under our 2007 Stock Incentive Plan and
0.7 million
shares under our ESPP.
|
ITEM 13.
CERTAIN RELATIONSHIPS AND RELATED TRANSACTIONS, AND DIRECTOR INDEPENDENCE
Information required by this item is incorporated by reference to the material appearing under the heading “Board of Directors and Corporate Governance Matters” in the Proxy Statement for the 2015 Annual Meeting of Shareholders.
|
ITEM 14.
|
PRINCIPAL ACCOUNTING FEES AND SERVICES
|
Information required by this item is incorporated by reference to the material appearing under the heading “Audit and Related Fees” in the Proxy Statement for the 2015 Annual Meeting of Shareholders.
116
|
ITEM 15.
|
EXHIBITS, FINANCIAL STATEMENT SCHEDULES
|
(a) The following documents are filed as part of this report:
1. Financial Statements
Our consolidated financial statements are set forth under Item 8 of this Form 10-K.
2. Financial Statement Schedules
All schedules are omitted as the required information is not applicable or the information is presented in the consolidated financial statements and notes thereto in Item 8.
3. Exhibits
The following exhibits are filed herewith or are incorporated by reference to exhibits previously filed with the Commission, as indicated in the description of each, File No. 1-14267 in the case of Republic and File No. 1-14705 and No. 0-19285 in the case of Allied.
|
Exhibit
Number
|
Description
|
|
|
3.1
|
Amended and Restated Certificate of Incorporation (incorporated by reference to Exhibit 3.1 of the Company’s Quarterly Report on Form 10-Q for the period ended June 30, 1998).
|
|
|
3.2
|
Certificate of Amendment to Amended and Restated Certificate of Incorporation of Republic Services, Inc. (incorporated by reference to Exhibit 4.2 of the Company’s Registration Statement on Form S-8, Registration No. 333-81801, filed with the Commission on June 29, 1999).
|
|
|
3.3
|
Amended and Restated Bylaws of Republic Services, Inc. (incorporated by reference to Exhibit 3.1 of the Company’s Quarterly Report on Form 10-Q for the quarter ended June 30, 2014).
|
|
|
4.1
|
Republic Services, Inc. Common Stock Certificate (incorporated by reference to Exhibit 4.4 of the Company’s Registration Statement on Form S-8, Registration No. 333-81801, filed with the Commission on June 29, 1999).
|
|
|
4.2
|
Second Supplemental Indenture, dated as of March 21, 2005 by Republic Services, Inc. to The Bank of New York, as trustee, including the form of 6.086% Note due March 15, 2035 (incorporated by reference to Exhibit 4.1 of the Company’s Quarterly Report on Form 10-Q for the quarter ended March 31, 2005).
|
|
|
4.3
|
Indenture, dated as of September 8, 2009, by and between Republic Services, Inc. and The Bank of New York Mellon Trust Company, N.A., as trustee (incorporated by reference to Exhibit 4.1 of the Company’s Current Report on Form 8-K dated September 9, 2009).
|
|
|
4.4
|
First Supplemental Indenture, dated as of September 8, 2009, to the Indenture dated as of September 8, 2009, by and among Republic Services, Inc., the guarantors named therein and The Bank of New York Mellon Trust Company, N.A., as trustee, including the form of 5.500% Notes due 2019 (incorporated by reference to Exhibit 4.2 of the Company’s Current Report on Form 8-K dated September 9, 2009).
|
|
|
4.5
|
Second Supplemental Indenture, dated as of May 9, 2011, to the Indenture dated as of September 8, 2009, by and among Republic Services, Inc., the guarantors named therein and The Bank of New York Mellon Trust Company, N.A., as trustee, including the form of 3.800% Notes due 2018 (incorporated by reference to Exhibit 4.1 of the Company’s Current Report on Form 8-K dated May 9, 2011).
|
|
|
4.6
|
Third Supplemental Indenture, dated as of May 9, 2011, to the Indenture dated as of September 8, 2009, by and among Republic Services, Inc., the guarantors named therein and The Bank of New York Mellon Trust Company, N.A., as trustee, including the form of 4.750% Notes due 2023 (incorporated by reference to Exhibit 4.2 of the Company’s Current Report on Form 8-K dated May 9, 2011).
|
|
|
4.7
|
Fourth Supplemental Indenture, dated as of May 9, 2011, to the Indenture dated as of September 8, 2009, by and among Republic Services, Inc., the guarantors named therein and The Bank of New York Mellon Trust Company, N.A., as trustee, including the form of 5.700% Notes due 2041 (incorporated by reference to Exhibit 4.3 of the Company’s Current Report on Form 8-K dated May 9, 2011).
|
|
|
4.8
|
Indenture, dated as of November 25, 2009, by and between Republic Services, Inc. and U.S. Bank National Association, as trustee (incorporated by reference to Exhibit 4.1 of the Company’s Current Report on Form 8-K dated November 25, 2009).
|
|
117
|
Exhibit
Number
|
Description
|
|
|
4.9
|
First Supplemental Indenture, dated as of November 25, 2009, to the Indenture dated as of November 25, 2009, by and among Republic Services, Inc., the guarantors named therein and U.S. Bank National Association, as trustee, including the form of 5.25% Notes due 2021 (incorporated by reference to Exhibit 4.2 of the Company’s Current Report on Form 8-K dated November 25, 2009).
|
|
|
4.10
|
Second Supplemental Indenture, dated as of March 4, 2010, to the Indenture dated as of November 25, 2009, by and among Republic Services, Inc., the guarantors named therein and U.S. Bank National Association, as trustee, including the form of 5.00% Notes due 2020 (incorporated by reference to Exhibit 4.1 of the Company’s Current Report on Form 8-K dated March 4, 2010).
|
|
|
4.11
|
Third Supplemental Indenture, dated as of March 4, 2010, to the Indenture dated as of November 25, 2009, by and among Republic Services, Inc., the guarantors named therein and U.S. Bank National Association, as trustee, including the form of 6.20% Notes due 2040 (incorporated by reference to Exhibit 4.2 of the Company’s Current Report on Form 8-K dated March 4, 2010).
|
|
|
4.12
|
Indenture, dated as of May 21, 2012, by and between Republic Services, Inc. and Wells Fargo Bank, National Association, as trustee (incorporated by reference to Exhibit 4.1 of the Company’s Current Report on Form 8-K dated May 21, 2012).
|
|
|
4.13
|
First Supplemental Indenture, dated as of May 21, 2012, to the Indenture dated as of May 21, 2012, by and among Republic Services, Inc., the guarantors named therein and Wells Fargo Bank, National Association, including the form of 3.55% Notes due 2022 (incorporated by reference to Exhibit 4.2 of the Company’s Current Report on Form 8-K dated May 21, 2012).
|
|
|
4.14
|
Amended and Restated Credit Agreement, dated as of May 8, 2012, by and among Republic Services, Inc., as borrower, Bank of America N.A., as administrative agent, swing line lender and L/C issuer and the other lenders party thereto (incorporated by reference to Exhibit 4.1 of the Company’s Current Report on Form 8-K dated May 8, 2012).
|
|
|
4.15
|
Amendment No. 1, dated as of October 29, 2012, to the Amended and Restated Credit Agreement, dated as of May 8, 2012, by and among Republic Services, Inc., Bank of America, N.A., as administrative agent, and the other lenders party thereto (incorporated by reference to Exhibit 4.1 of the Company’s Quarterly Report on Form 10-Q for the quarter ended September 30, 2012).
|
|
|
4.16
|
Amendment No. 2, dated as of July 24, 2013, to the Amended and Restated Credit Agreement, dated as of May 8, 2012, by and among Republic Services, Inc., Bank of America, N.A., as administrative agent, and the other lenders party thereto (incorporated by reference to Exhibit 4.1 of the Company’s Quarterly Report on Form 10-Q for the quarter ended June 30, 2013).
|
|
|
4.17
|
Restated Indenture, dated as of September 1, 1991, by and between Browning-Ferris Industries, Inc. and First City, Texas-Houston, National Association, as trustee (incorporated by reference to Exhibit 4.22 of Allied’s Registration Statement on Form S-4 (No. 333-61744)).
|
|
|
4.18
|
First Supplemental Indenture, dated as of July 30, 1999, to the Indenture dated as of September 1, 1991, by and among Allied Waste Industries, Inc., Allied Waste North America, Inc., Browning-Ferris Industries, Inc. and Chase Bank of Texas, National Association, as trustee (incorporated by reference to Exhibit 4.23 of Allied’s Registration Statement on Form S-4 (No. 333-61744)).
|
|
|
4.19
|
First [sic] Supplemental Indenture, dated as of December 31, 2004, to the Indenture dated as of September 1, 1991, by and among Browning-Ferris Industries, Inc., BBCO, Inc. and JP Morgan Chase Bank, National Association as trustee (incorporated by reference to Exhibit 4.33 of Allied’s Annual Report on Form 10-K for the year ended December 31, 2004).
|
|
|
4.20
|
Third Supplemental Indenture, dated as of December 5, 2008, to the Indenture dated as of September 1, 1991, by and among Allied Waste Industries, Inc., Allied Waste North America, Inc., Browning-Ferris Industries, LLC (successor to Browning-Ferris Industries, Inc.), BBCO, Inc., Republic Services, Inc., the guarantors party thereto and The Bank of New York Mellon Trust Company, N.A., as trustee (incorporated by reference to Exhibit 4.1 of the Company’s Current Report on Form 8-K dated December 10, 2008).
|
|
|
4.21
|
Credit Agreement, dated as of June 30, 2014, by and among Republic Services, Inc., as Borrower, Bank of America, N.A., as Administrative Agent, Swing Line Lender and L/C Issuer, and the other lenders party thereto (incorporated by reference to Exhibit 4.1 of the Company's Current Report on Form 8-K dated July 2, 2014).
|
|
|
4.22
|
Amendment No. 3 to Amended and Restated Credit Agreement, dated as of June 30, 2014, by and among
Republic Services, Inc., as Borrower, Bank of America, N.A., as Administrative Agent, and each of the
lenders party thereto (incorporated by reference to Exhibit 4.2 of the Company's Current Report on Form 8-K dated July 2, 2014).
|
|
|
4.23
|
The Company is a party to other agreements for unregistered long-term debt securities, which do not exceed 10% of the Company’s total assets. The Company agrees to furnish a copy of such agreements to the Commission upon request.
|
|
118
|
Exhibit
Number
|
Description
|
|
|
10.1+
|
Republic Services, Inc. 1998 Stock Incentive Plan, as amended and restated March 6, 2002 (incorporated by reference to Exhibit 10.1 of the Company’s Quarterly Report on Form 10-Q for the period ended March 31, 2002).
|
|
|
10.2+
|
Form of Stock Option Agreement under the Republic Services, Inc. 1998 Stock Incentive Plan (incorporated by reference to Exhibit 10.2 of the Company’s Annual Report on Form 10-K for the year ended December 31, 2008).
|
|
|
10.3+
|
Form of Director Stock Option Agreement under the Republic Services, Inc. 1998 Stock Incentive Plan (incorporated by reference to Exhibit 10.3 of the Company’s Annual Report on Form 10-K for the year ended December 31, 2008).
|
|
|
10.4+
|
Form of Non-Employee Director Stock Unit Agreement under the Republic Services, Inc. 1998 Stock Incentive Plan (incorporated by reference to Exhibit 10.6 of the Company’s Annual Report on Form 10-K for the year ended December 31, 2008).
|
|
|
10.5+
|
Republic Services, Inc. 1998 Stock Incentive Plan, as amended and restated March 6, 2002 (incorporated by reference to Exhibit 10.1 of the Company’s Quarterly Report on Form 10-Q for the period ended March 31, 2002).
|
|
|
10.6+
|
Form of Stock Option Agreement under the Republic Services, Inc. 1998 Stock Incentive Plan (incorporated by reference to Exhibit 10.2 of the Company’s Annual Report on Form 10-K for the year ended December 31, 2008).
|
|
|
10.7+
|
Form of Director Stock Option Agreement under the Republic Services, Inc. 1998 Stock Incentive Plan (incorporated by reference to Exhibit 10.3 of the Company’s Annual Report on Form 10-K for the year ended December 31, 2008).
|
|
|
10.8+
|
Form of Non-Employee Director Stock Unit Agreement under the Republic Services, Inc. 1998 Stock Incentive Plan (incorporated by reference to Exhibit 10.6 of the Company’s Annual Report on Form 10-K for the year ended December 31, 2008).
|
|
|
10.9+
|
Republic Services, Inc. 2007 Stock Incentive Plan (incorporated by reference to Exhibit 10.1 of the Company’s Quarterly Report on Form 10-Q for the period ended June 30, 2007).
|
|
|
10.10+
|
Amendment to the Republic Services, Inc. 2007 Stock Incentive Plan (incorporated by reference to Exhibit 10.8 of the Company’s Annual Report on Form 10-K for the year ended December 31, 2008).
|
|
|
10.11+
|
Republic Services, Inc. Amended and Restated 2007 Stock Incentive Plan effective May 12, 2011 (incorporated by reference to Appendix A of the Company’s Proxy Statement on Schedule 14A filed on April 1, 2011).
|
|
|
10.12+
|
Form of Stock Option Agreement under the Republic Services, Inc. 2007 Stock Incentive Plan (for awards prior to October 28, 2011) (incorporated by reference to Exhibit 10.9 of the Company’s Annual Report on Form 10-K for the year ended December 31, 2008).
|
|
|
10.13+
|
Form of Restricted Stock Agreement under the Republic Services, Inc. 2007 Stock Incentive Plan (for awards prior to October 28, 2011) (incorporated by reference to Exhibit 10.10 of the Company’s Annual Report on Form 10-K for the year ended December 31, 2008).
|
|
|
10.14+
|
Form of Restricted Stock Unit Award Agreement under the Republic Services, Inc. 2007 Stock Incentive Plan (for awards prior to December 27, 2011) (incorporated by reference to Exhibit 10.1 of the Company’s Current Report on Form 8-K dated January 4, 2010).
|
|
|
10.15+
|
Form of Non-NEO Stock Option Agreement under the Republic Services, Inc. Amended and Restated 2007 Stock Incentive Plan (for awards on or after October 28, 2011) (incorporated by reference to Exhibit 10.1 of the Company’s Quarterly Report on Form 10-Q for the quarter ended September 30, 2011).
|
|
|
10.16+
|
Form of NEO Stock Option Agreement under the Republic Services, Inc. 2007 Amended and Restated Stock Incentive Plan (for awards on or after October 28, 2011) (incorporated by reference to Exhibit 10.2 of the Company’s Quarterly Report on Form 10-Q for the quarter ended September 30, 2011).
|
|
|
10.17+
|
Form of Non-NEO Restricted Stock Agreement under the Republic Services, Inc. Amended and Restated 2007 Stock Incentive Plan (for awards on or after October 28, 2011) (incorporated by reference to Exhibit 10.3 of the Company’s Quarterly Report on Form 10-Q for the quarter ended September 30, 2011).
|
|
|
10.18+
|
Form of NEO Restricted Stock Agreement under the Republic Services, Inc. Amended and Restated 2007 Stock Incentive Plan (for awards on or after October 28, 2011) (incorporated by reference to Exhibit 10.4 of the Company’s Quarterly Report on Form 10-Q for the quarter ended September 30, 2011).
|
|
|
10.19+
|
Form of Employee Restricted Stock Unit Agreement under the Republic Services, Inc. Amended and Restated 2007 Stock Incentive Plan (for awards on or after December 27, 2011) (incorporated by reference to Exhibit 10.1 of the Company’s Current Report on Form 8-K dated December 27, 2011).
|
|
119
|
Exhibit
Number
|
Description
|
|
|
10.20+
|
Form of Non-Employee Director Restricted Stock Unit Agreement (annual vesting) under the Republic Services, Inc. Amended and Restated 2007 Stock Incentive Plan (for awards on or after December 27, 2011) (incorporated by reference to Exhibit 10.2 of the Company’s Current Report on Form 8-K dated December 27, 2011).
|
|
|
10.21+
|
Form of Non-Employee Director Restricted Stock Unit Agreement (3 year vesting) under the Republic Services, Inc. Amended and Restated 2007 Stock Incentive Plan (for awards on or after December 27, 2011) (incorporated by reference to Exhibit 10.3 of the Company’s Current Report on Form 8-K dated December 27, 2011).
|
|
|
10.22+
|
Republic Services, Inc. Deferred Compensation Plan, as amended and restated effective January 1, 2010 (incorporated by reference to Exhibit 4.4 of the Company’s Registration Statement on Form S-8, Registration No. 333-170174, filed with the Commission on October 27, 2010).
|
|
|
10.23+
|
Amendment No. 1 to Republic Services, Inc. Deferred Compensation Plan, effective January 6, 2011 (incorporated by reference to Exhibit 10.17 of the Company’s Annual Report on Form 10-K for the year ended December 31, 2010).
|
|
|
10.24+
|
Republic Services, Inc. Amended and Restated Executive Incentive Plan, effective February 4, 2014 (incorporated by reference to Appendix A of the Company’s Proxy Statement on Schedule 14A filed on March 26, 2014).
|
|
|
10.25+
|
Employment Agreement, effective as of October 29, 2013, by and between Republic Services, Inc. and Donald W. Slager (incorporated by reference to Exhibit 10.1 of the Company’s Quarterly Report on Form 10-Q for the quarter ended September 30, 2013).
|
|
|
10.26+
|
Retirement Agreement, dated June 22, 2012, by and between Tod C. Holmes and Republic Services, Inc. (incorporated by reference to Exhibit 10.60 of the Company’s Annual Report on Form 10-K for the year ended December 31, 2012).
|
|
|
10.27+
|
Offer Letter, dated December 12, 2012, by and between Glenn A. Culpepper and Republic Services, Inc. (incorporated by reference to Exhibit 10.1 of the Company's Current Report on Form 8-K dated December 18, 2012).
|
|
|
10.28+
|
Employment Agreement, dated December 5, 2008, between Michael Rissman and Republic Services, Inc. (now superseded) (incorporated by reference to Exhibit 10.1 of Republic’s Current Report on Form 8-K filed on February 12, 2010).
|
|
|
10.29+
|
Memorandum dated February 9, 2010, terminating Employment Agreement, dated December 5, 2008, between Michael Rissman and Republic Services, Inc.( incorporated by reference to Exhibit 10.2 of Republic’s Current Report on Form 8-K filed on February 12, 2010).
|
|
|
10.30+
|
Offer Letter dated August 17, 2009 to Michael Rissman from Republic Services, Inc. regarding general counsel position (incorporated by reference to Exhibit 10.3 of Republic’s Current Report on Form 8-K filed on February 12, 2010).
|
|
|
10.31+
|
Non-Competition, Non-Solicitation, Confidentiality and Arbitration Agreement, effective as of October 30, 2013, by and between Republic Services, Inc. and Michael Rissman (incorporated by reference to Exhibit 10.2 of the Company’s Quarterly Report on Form 10-Q for the quarter ended September 30, 2013).
|
|
|
10.32+
|
Amended and Restated Employment Agreement, effective December 8, 2008, by and between Jeffrey A. Hughes and Republic Services, Inc. (incorporated by reference to Exhibit 10.61 of the Company’s Annual Report on Form 10-K for the year ended December 31, 2012).
|
|
|
10.33+
|
Allied Waste Industries, Inc. 2006 Incentive Stock Plan (incorporated by reference to Exhibit 10.2 of Allied’s Quarterly Report on Form 10-Q for the period ended June 30, 2006).
|
|
|
10.34+
|
First Amendment to the Allied Waste Industries, Inc. 2006 Incentive Stock Plan, dated as of July 27, 2006 (incorporated by reference to Exhibit 10.1 of Allied’s Quarterly Report on Form 10-Q for the period ended September 30, 2006).
|
|
|
10.35+
|
Amended and Restated Allied Waste Industries, Inc. 2006 Incentive Stock Plan, dated as of July 27, 2006 (incorporated by reference to Exhibit 10.2 of Allied’s Quarterly Report on Form 10-Q for the period ended September 30, 2006).
|
|
|
10.36+
|
First Amendment, dated as of December 5, 2006, to the Amended and Restated Allied Waste Industries, Inc. 2006 Incentive Stock Plan, dated as of July 27, 2006 (incorporated by reference to Exhibit 10.47 of Allied’s Annual Report on Form 10-K for the year ended December 31, 2006).
|
|
|
10.37+
|
Amended and Restated Allied Waste Industries, Inc. 2006 Incentive Stock Plan, effective October 24, 2007 (incorporated by reference to Exhibit 10.122 of Allied’s Annual Report on Form 10-K for the year ended December 31, 2007).
|
|
120
|
Exhibit
Number
|
Description
|
|
|
10.38+
|
Republic Services, Inc. 2006 Incentive Stock Plan (f/k/a Amended and Restated Allied Waste Industries, Inc. 2006 Incentive Stock Plan), as amended and restated effective December 5, 2008 (incorporated by reference to Exhibit 10.51 of the Company’s Annual Report on Form 10-K for the year ended December 31, 2008).
|
|
|
10.39+
|
Form of Nonqualified Stock Option Agreement under the Allied Waste Industries, Inc. 2006 Incentive Stock Plan (incorporated by reference to Exhibit 10.3 of Allied’s Quarterly Report on Form 10-Q for the period ended September 30, 2006).
|
|
|
10.40+
|
Form of Indemnity Agreement between Allied Waste Industries, Inc. and legacy Allied directors (incorporated by reference to Exhibit 10.19 of Allied’s Quarterly Report on Form 10-Q for the quarter ended March 31, 2004).
|
|
|
10.41+
|
Republic Services, Inc. Executive Separation Policy, as amended as of March 29, 2012 (incorporated by reference to Exhibit 10.2 of the Company’s Quarterly Report on Form 10-Q for the quarter ended March 31, 2012).
|
|
|
10.42+
|
Amendment No. 2 to Republic Services, Inc. Deferred Compensation Plan, effective February 7, 2012 (incorporated by reference to Exhibit 10.3 of the Company’s Quarterly Report on Form 10-Q for the quarter ended March 31, 2012).
|
|
|
10.43+
|
Republic Services, Inc. Amended and Restated 2007 Stock Incentive Plan effective May 9, 2013(incorporated by reference to Exhibit 10.1 of the Company’s Quarterly Report on Form 10-Q for the quarter ended June 30, 2013).
|
|
|
10.44+
|
Amendment No. 3 to Republic Services, Inc. Deferred Compensation Plan, effective October 29, 2013 (incorporated by reference to Exhibit 10.3 of the Company’s Quarterly Report on Form 10-Q for the quarter ended September 30, 2013).
|
|
|
10.45+
|
Offer Letter, dated May 23, 2014, by and between Robert Maruster and Republic Services, Inc. (incorporated by reference to Exhibit 10.1 of the Company's Current Report on Form 8-K dated June 2, 2014).
|
|
|
10.46+
|
Form of Employee Restricted Stock Unit Agreement, dated May 23, 2014, by and between Robert Maruster and Republic Services, Inc. (incorporated by reference to Exhibit 10.2 of the Company's Current Report on Form 8-K dated June 2, 2014).
|
|
|
10.47+
|
Offer Letter, dated August 22, 2014, by and between Charles F. Serianni and Republic Services, Inc. (incorporated by reference to Exhibit 10.1 of the Company's Current Report on Form 8-K dated August 25, 2014).
|
|
|
10.48+
|
Separation agreement, entered into October 7, 2014, by and between Glenn A. Culpepper and Republic Services, Inc. (incorporated by reference to Exhibit 10.1 of the Company's Current Report on Form 8-K dated October 8, 2014).
|
|
|
10.49+
|
Clawback Policy, dated October 29, 2014 (incorporated by reference to Exhibit 10.1 of the Company's Current Report on Form 8-K dated October 30, 2014).
|
|
|
10.50+
|
First Amendment to the Employment Agreement, dated December 23, 2014, by and between Donald W. Slager and Republic Services, Inc. (incorporated by reference to Exhibit 10.1 of the Company’s Current Report on Form 8-K dated December 24, 2014).
|
|
|
10.51+
|
Form of Performance Share Agreement, adopted January 7, 2015 (incorporated by reference to Exhibit 10.1 of the Company's Current Report on Form 8-K dated January 9, 2015).
|
|
|
10.52+
|
Form of Employee Restricted Stock Unit Agreement - Senior Executive, adopted January 7, 2015 (incorporated by reference to Exhibit 10.2 of the Company's Current Report on Form 8-K dated January 9, 2015).
|
|
|
10.53+*
|
Amendment No. 4 to Republic Services, Inc. Deferred Compensation Plan, effective February 10, 2015.
|
|
|
21.1*
|
Subsidiaries of the Company.
|
|
|
23.1*
|
Consent of Ernst & Young LLP.
|
|
|
31.1*
|
Rule 13a-14(a)/15d-14(a) Certification of Chief Executive Officer.
|
|
|
31.2*
|
Rule 13a-14(a)/15d-14(a) Certification of Chief Financial Officer.
|
|
|
32.1*
|
Section 1350 Certification of Chief Executive Officer.
|
|
|
32.2*
|
Section 1350 Certification of Chief Financial Officer.
|
|
|
101.INS*
|
XBRL Instance Document
|
|
|
101.SCH*
|
XBRL Taxonomy Extension Schema Document
|
|
|
101.CAL*
|
XBRL Taxonomy Extension Calculation Linkbase Document
|
|
|
101.LAB*
|
XBRL Taxonomy Extension Labels Linkbase Document
|
|
121
|
Exhibit
Number
|
Description
|
|
|
101.PRE*
|
XBRL Taxonomy Extension Presentation Linkbase Document
|
|
|
101.DEF*
|
XBRL Taxonomy Extension Definition Linkbase Document
|
|
* Filed herewith
** This exhibit is being furnished rather than filed, and shall not be deemed incorporated by reference into any filing, in accordance with Item 601 of Regulation S-K.
+ Indicates a management or compensatory plan or arrangement.
122
Signatures
Pursuant to the requirements of Sections 13 or 15(d) of the Securities Exchange Act of 1934, the Registrant, has duly caused this report to be signed on its behalf by the undersigned, thereunto duly authorized.
|
Date:
|
February 23, 2015
|
REPUBLIC SERVICES, INC.
|
|||
|
By:
|
/s/ D
ONALD
W. S
LAGER
|
||||
|
Donald W. Slager
|
|||||
|
President and
Chief Executive Officer
(Principal Executive Officer)
|
|||||
Pursuant to the requirements of the Securities Exchange Act of 1934, this report has been signed below by the following persons on behalf of the Registrant and in the capacities and on the dates indicated.
|
Signature
|
Title
|
Date
|
||
|
/s/ D
ONALD
W. S
LAGER
|
President, Chief Executive Officer
and Director
(Principal Executive Officer)
|
February 23, 2015
|
||
|
Donald W. Slager
|
||||
|
/s/ C
HARLES
F. S
ERIANNI
|
Executive Vice President and
Chief Financial Officer
(Principal Financial Officer)
|
February 23, 2015
|
||
|
Charles F. Serianni
|
||||
|
/s/ B
RIAN
A. G
OEBEL
|
Vice President and
Chief Accounting Officer
(Principal Accounting Officer)
|
February 23, 2015
|
||
|
Brian A. Goebel
|
||||
|
/s/ R
AMON
A. R
ODRIGUEZ
|
Chairman of the Board of Directors
|
February 23, 2015
|
||
|
Ramon A. Rodriguez
|
||||
|
/s/ T
OMAGO
C
OLLINS
|
Director
|
February 23, 2015
|
||
|
Tomago Collins
|
||||
|
/s/ J
AMES
W. C
ROWNOVER
|
Director
|
February 23, 2015
|
||
|
James W. Crownover
|
||||
|
/s/ A
NN
E. D
UNWOODY
|
Director
|
February 23, 2015
|
||
|
Ann E. Dunwoody
|
||||
|
/s/ W
ILLIAM
J. F
LYNN
|
Director
|
February 23, 2015
|
||
|
William J. Flynn
|
||||
|
/s/ M
ANUEL
K
ADRE
|
Director
|
February 23, 2015
|
||
|
Manuel Kadre
|
||||
123
|
/s/ M
ICHAEL
L
ARSON
|
Director
|
February 23, 2015
|
||
|
Michael Larson
|
||||
|
/s/ W. L
EE
N
UTTER
|
Director
|
February 23, 2015
|
||
|
W. Lee Nutter
|
||||
|
/s/ A
LLAN
C. S
ORENSEN
|
Director
|
February 23, 2015
|
||
|
Allan C. Sorensen
|
||||
|
/s/ J
OHN
M. T
RANI
|
Director
|
February 23, 2015
|
||
|
John M. Trani
|
||||
124
TABLE OF CONTENTS
Part IItem 1. BusinessItem 1A. Risk FactorsItem 1B. Unresolved Staff CommentsItem 2. PropertiesItem 3. Legal ProceedingsItem 4. Mine Safety DisclosuresPart IIItem 5. Market For Registrant's Common Equity, Related Stockholder Matters and Issuer Purchases Of Equity SecuritiesItem 6. Selected Financial DataItem 7. Management S Discussion and Analysis Of Financial Condition and Results Of OperationsItem 7A. Quantitative and Qualitative Disclosures About Market RiskItem 8. Financial Statements and Supplementary DataItem 9. Changes in and Disagreements with Accountants on Accounting and Financial DisclosureItem 9A. Controls and ProceduresItem 9B. Other InformationPart IIIItem 10. Directors, Executive Officers and Corporate GovernanceItem 11. Executive CompensationItem 12. Security Ownership Of Certain Beneficial Owners and Management and Related Stockholder MattersItem 13. Certain Relationships and Related Transactions, and Director IndependenceItem 14. Principal Accounting Fees and ServicesPart IVItem 15. Exhibits, Financial Statement Schedules