RESTAURANT BRANDS INTERNATIONAL LIMITED PARTNERSHIP
10-Ks and 10-Qs
|
|
|
|
|
|
|
|
|
|
|
|
|
|
|
|
|
|
|
|
|
|
|
|
|
|
|
|
|
|
|
|
|
|
|
|
|
|
|
|
|
UNITED STATES
SECURITIES AND EXCHANGE COMMISSION
Washington, D.C. 20549
Form 10-K
(Mark One)
|
☒
|
ANNUAL REPORT PURSUANT TO SECTION 13 or 15(d) OF THE SECURITIES EXCHANGE ACT OF 1934
|
For the fiscal year ended
December 31, 2018
or
|
☐
|
TRANSITION REPORT PURSUANT TO SECTION 13 OR 15(d) OF THE SECURITIES EXCHANGE ACT OF 1934
|
For the transition period from
to
Commission file number: 001-36787
RESTAURANT BRANDS INTERNATIONAL LIMITED PARTNERSHIP
(Exact name of Registrant as Specified in Its Charter)
|
Canada
|
98-1206431
|
|
(State or Other Jurisdiction of
Incorporation or Organization)
|
(I.R.S. Employer
Identification No.)
|
|
130 King Street West, Suite 300
Toronto, Ontario
|
M5X 1E1
|
|
(Address of Principal Executive Offices)
|
(Zip Code)
|
(905) 845-6511
Registrant’s telephone number, including area code
Securities registered pursuant to Section 12(b) of the Act:
|
Title of each class
|
Name of each exchange on which registered
|
|
Class B Exchangeable Limited Partnership Units
|
Toronto Stock Exchange
|
Securities registered pursuant to Section 12(g) of the Act:
None
Indicate by check mark if the Registrant is a well-known seasoned issuer, as defined in Rule 405 of the Securities Act. Yes ☒ No ☐
Indicate by check mark if the Registrant is not required to file reports pursuant to Section 13 or Section 15(d) of the Act. Yes ☐ No ☒
Indicate by check mark whether the Registrant (1) has filed all reports required to be filed by Section 13 or 15(d) of the Securities Exchange Act of 1934 during the preceding 12 months (or for such shorter period that the registrant was required to file such reports), and (2) has been subject to such filing requirements for the past 90 days. Yes ☒ No ☐
Indicate by check mark whether the registrant has submitted electronically every Interactive Data File required to be submitted pursuant to Rule 405 of Regulation S-T (§ 232.405 of this chapter) during the preceding 12 months (or for such shorter period that the registrant was required to submit such files). Yes ☒ No ☐
Indicate by check mark if disclosure of delinquent filers pursuant to Item 405 of Regulation S-K (§ 229.405 of this chapter) is not contained herein, and will not be contained, to the best of Registrant’s knowledge, in definitive proxy or information statements incorporated by reference in Part III of this Form 10-K or any amendment to this Form 10-K. ☒
Indicate by check mark whether the registrant is a large accelerated filer, an accelerated filer, a non-accelerated filer, a smaller reporting company, or an emerging growth company. See the definitions of “large accelerated filer,” “accelerated filer,” “smaller reporting company” and “emerging growth company” in Rule 12b-2 of the Exchange Act.
|
Large accelerated filer
|
|
☒
|
|
Accelerated filer
|
|
☐
|
|
Non-accelerated filer
|
|
☐
|
|
Smaller reporting company
|
|
☐
|
|
Emerging growth company
|
☐
|
|||||
If an emerging growth company, indicate by checkmark if the registrant has elected not to use the extended transition period for complying with any new or revised financial accounting standards provided pursuant to Section 13(a) of the Exchange Act. ☐
Indicate by check mark whether the Registrant is a shell company (as defined in Rule 12b-2 of the Exchange Act). Yes ☐ No ☒
The aggregate market value of Class B exchangeable limited partnership units held by non-affiliates of the registrant on June 30, 2018, computed by reference to the closing price for such units on the Toronto Stock Exchange on such date, was C$825,283,770.
The number of the registrant’s Class B exchangeable limited partnership units and Class A common units outstanding as of
February 11, 2019
was
207,510,471
units and
202,006,067
units, respectively.
DOCUMENTS INCORPORATED BY REFERENCE:
Portions of the definitive proxy statement of Restaurant Brands International Inc., the registrant’s general partner, for the
2019
Annual and Special Meeting of Shareholders of Restaurant Brands International Inc., which is to be filed no later than 120 days after
December 31, 2018
, are incorporated by reference into Part III of this Form 10-K.
RESTAURANT BRANDS INTERNATIONAL LIMITED PARTNERSHIP
2018 FORM 10-K ANNUAL REPORT
TABLE OF CONTENTS
|
|
Page
|
|
|
Item 1.
|
||
|
Item 1A.
|
||
|
Item 1B.
|
||
|
Item 2.
|
||
|
Item 3.
|
||
|
Item 4.
|
||
|
Item 5.
|
||
|
Item 6.
|
||
|
Item 7.
|
||
|
Item 7A.
|
||
|
Item 8.
|
||
|
Item 9.
|
||
|
Item 9A.
|
||
|
Item 10.
|
||
|
Item 11.
|
||
|
Item 12.
|
||
|
Item 13.
|
||
|
Item 14.
|
||
|
Item 15.
|
||
|
Item 16.
|
||
Tim Hortons® and Timbits® are trademarks of Tim Hortons Canadian IP Holdings Corporation. Burger King® and BK® are trademarks of Burger King Corporation. Popeyes®, Popeyes Louisiana Kitchen® and Popeyes Chicken & Biscuits® are trademarks of Popeyes Louisiana Kitchen, Inc. Unless the context otherwise requires, all references to “we”, “us”, “our” and “Partnership” refer to Restaurant Brands International Limited Partnership and its subsidiaries.
2
Explanatory Note
We are a subsidiary of Restaurant Brands International Inc. (“RBI”) and the indirect parent of The TDL Group Corp. (“Tim Hortons”), Burger King Worldwide, Inc. (“Burger King”) and Popeyes Louisiana Kitchen, Inc. (“Popeyes”). RBI is our sole general partner and owns all of our outstanding Class A common units (“Class A common units”). RBI has the exclusive right, power and authority to manage, control, administer and operate the business and affairs and to make decisions regarding the undertaking and business of Restaurant Brands International Limited Partnership (“Partnership”) in accordance with the partnership agreement of Partnership (the “partnership agreement”) and applicable laws. There is no board of directors of Partnership. RBI has established a conflicts committee composed entirely of “independent directors” (as such term is defined in the partnership agreement) in order to consent to, approve or direct various enumerated actions on behalf of RBI (in its capacity as our general partner) in accordance with the terms of the partnership agreement.
Pursuant to Rule 12g-3(a) under the Securities Exchange Act of 1934, as amended (the “Exchange Act”), Partnership is a successor issuer to Burger King. The Class B exchangeable limited partnership units of Partnership (the“Partnership exchangeable units”) are deemed to be registered under Section 12(b) of the Exchange Act, and we are subject to the informational requirements of the Exchange Act and the rules and regulations promulgated thereunder. The Partnership exchangeable units trade on the Toronto Stock Exchange under the ticker symbol “QSP”. RBI’s common shares trade on the New York Stock Exchange and the Toronto Stock Exchange under the ticker symbol “QSR”.
We are a reporting issuer in each of the provinces and territories of Canada and, as a result, are subject to Canadian continuous disclosure and other reporting obligations under applicable Canadian securities laws. Pursuant to an application for exemptive relief made in accordance with National Policy 11-203 – Process for Exemptive Relief Applications in Multiple Jurisdictions, we have received exemptive relief dated October 31, 2014 from the Canadian securities regulators. This exemptive relief exempts us from the continuous disclosure requirements of NI 51-102, effectively allowing us to satisfy our Canadian continuous disclosure obligations by relying on the Canadian continuous disclosure documents filed by RBI, for so long as certain conditions are satisfied. Among these conditions is a requirement that we concurrently send to all holders of Partnership exchangeable units all disclosure materials that RBI sends to its shareholders and a requirement that we separately report all material changes in respect of Partnership that are not also material changes in respect of RBI.
All references to “$” or “dollars” in this report are to the currency of the United States unless otherwise indicated. All references to “Canadian dollars” or “C$” are to the currency of Canada unless otherwise indicated.
3
Part I
Item 1.
Business
Company Overview
We are a limited partnership originally formed to serve as the indirect holding company for Tim Hortons and its consolidated subsidiaries and Burger King and its consolidated subsidiaries, and, since our acquisition of Popeyes in March 2017, Popeyes and its consolidated subsidiaries. We were formed on August 25, 2014 as a general partnership and registered on October 27, 2014 as a limited partnership in accordance with the laws of the Province of Ontario generally, and the
Ontario Limited Partnerships Act
specifically. We are a subsidiary of RBI, our sole general partner. We are one of the world’s largest quick service restaurant (“QSR”) companies with more than
$30 billion
in system-wide sales and over
25,000
restaurants in more than
100
countries and U.S. territories as of
December 31, 2018
. Our
Tim Hortons
®,
Burger King
® and
Popeyes
® brands have similar franchise business models with complementary daypart mixes and product platforms. Our three iconic brands are managed independently while benefiting from global scale and sharing of best practices. As of
December 31, 2018
, approximately 100% of total restaurants for each of our brands was franchised.
Our business generates revenue from the following sources: (i) franchise revenues, consisting primarily of royalties based on a percentage of sales reported by franchise restaurants and franchise fees paid by franchisees; (ii) property revenues from properties we lease or sublease to franchisees; and (iii) sales at restaurants owned by us (“Company restaurants”). In addition, our Tim Hortons business generates revenue from sales to franchisees related to our supply chain operations, including manufacturing, procurement, warehousing and distribution, as well as sales to retailers.
Our
Tim Hortons®
Brand
Founded in 1964, Tim Hortons (“TH”) is one of the largest donut/coffee/tea restaurant chains in North America and the largest in Canada as measured by total number of restaurants. As of
December 31, 2018
, we owned or franchised a total of
4,846
TH restaurants. TH restaurants are quick service restaurants with a menu that includes premium blend coffee, tea, espresso-based hot and cold specialty drinks, fresh baked goods, including donuts,
Timbits
®, bagels, muffins, cookies and pastries, grilled paninis, classic sandwiches, wraps, soups and more.
Our
Burger King®
Brand
Founded in 1954, Burger King (“BK”) is the world’s second largest fast food hamburger restaurant (“FFHR”) chain as measured by total number of restaurants. As of
December 31, 2018
, we owned or franchised a total of
17,796
BK restaurants in more than
100
countries and U.S. territories. BK restaurants are quick service restaurants that feature flame-grilled hamburgers, chicken and other specialty sandwiches, french fries, soft drinks and other affordably-priced food items.
Our
Popeyes®
Brand
Founded in 1972, Popeyes (“PLK”) is the world’s second largest quick service chicken concept as measured by total number of restaurants. As of
December 31, 2018
, we owned or franchised a total of
3,102
PLK restaurants. PLK restaurants are quick service restaurants that distinguish themselves with a unique “Louisiana” style menu featuring spicy chicken, chicken tenders, fried shrimp and other seafood, red beans and rice and other regional items.
Our Business Strategy
We believe that we have created a financially strong company built upon a foundation of three thriving, independent brands with significant global growth potential and the opportunity to be one of the most efficient franchised QSR operators in the world through our focus on the following strategies:
|
•
|
accelerating net restaurant growth;
|
|
•
|
enhancing guest service and experience at our restaurants through comprehensive training, improved restaurant operations, reimaged restaurants and appealing menu options;
|
|
•
|
increasing restaurant sales and profitability which are critical to the success of our franchise partners and our ability to grow our brands around the world;
|
|
•
|
utilizing technological and digital initiatives to interact with our guests and modernize the operations of our restaurants;
|
|
•
|
efficiently managing costs and sharing best practices; and
|
|
•
|
preserving the rich heritage of each of our brands by managing them and their respective franchisee relationships independently and continuing to play a prominent role in local communities.
|
4
Operating Segments
Our business consists of three operating segments, which are also our reportable segments: (1) TH; (2) BK; and (3) PLK. Additional financial information about our reportable segments can be found in “Management’s Discussion and Analysis of Financial Condition and Results of Operations.”
Restaurant Development
As part of our development approach for our brands in the U.S., we have granted limited development rights in specific areas to franchisees in connection with area development agreements. We expect to enter into similar arrangements in 2019 and beyond. In Canada, we have not granted exclusive or protected areas to any BK or TH franchisees, with limited exceptions.
As part of our international growth strategy for all of our brands, we have established master franchise and development agreements in a number of markets. For BK and TH, we have also created strategic master franchise joint ventures in which we received a meaningful minority equity stake in each joint venture. We will continue to evaluate opportunities to accelerate international development of all three of our brands, including through the establishment of master franchises with exclusive development rights and joint ventures with new and existing franchisees.
Advertising and Promotions
In general, franchisees fund substantially all of the marketing programs for each of our brands by making contributions ranging from 2.0% to 5.0% of gross sales to advertising funds managed by us or by the franchisees. Advertising contributions are used to pay for expenses relating to marketing, advertising and promotion, including market research, production, advertising costs, sales promotions, social media campaigns, technology initiatives and other support functions for the respective brands.
We manage the advertising funds for each of our brands in the U.S. and Canada, as well as in certain other markets for BK. However, in many international markets, including the markets managed by master franchisees, franchisees make contributions into franchisee-managed advertising funds. As part of our global marketing strategy, we provide franchisees with advertising support and guidance in order to deliver a consistent global brand message.
Product Development
New product development is a key driver of the long-term success of our brands. We believe the development of new products can drive traffic by expanding our customer base, allowing restaurants to expand into new dayparts, and continuing to build brand leadership in food quality and taste. Based on guest feedback, we drive product innovation in order to satisfy the needs of our guests around the world. This strategy will continue to be a focus in 2019 and beyond.
Operations Support
Our operations strategy is designed to deliver best-in-class restaurant operations by our franchisees and to improve friendliness, cleanliness, speed of service and overall guest satisfaction. Each of our brands has uniform operating standards and specifications relating to product quality, cleanliness and maintenance of the premises. In addition, our restaurants are required to be operated in accordance with quality assurance and health standards that each brand has established, as well as standards set by applicable governmental laws and regulations. Each franchisee typically participates in initial and ongoing training programs to learn all aspects of operating a restaurant in accordance with each brand’s operating standards.
Manufacturing, Supply and Distribution
In general, we approve the manufacturers of the food, packaging, equipment and other products used in restaurants for each of our brands. We have a comprehensive supplier approval process, which requires all products to pass our quality standards and the supplier’s manufacturing process and facilities to pass on-site food safety inspections. Our franchisees are required to purchase substantially all food and other products from approved suppliers and distributors.
TH products are sourced from a combination of third-party suppliers and our own manufacturing facilities. To protect our proprietary blends, we operate two coffee roasting facilities in Ancaster, Ontario and Rochester, New York, where we blend all of the coffee for our TH restaurants and, where practical, for our take home, packaged coffee. Our fondant and fills manufacturing facility in Oakville, Ontario produces, and is the primary supplier of, the ready-to-use glaze, fondants, fills and syrups which are used in a number of TH products. As of
December 31, 2018
, we have only one or a few suppliers to service each category of products sold at our system restaurants.
We sell most raw materials and supplies, including coffee, sugar, paper goods and other restaurant supplies, to TH restaurants in Canada and the U.S. We purchase those raw materials from multiple suppliers and generally have alternative sources of supply for each. While we have multiple suppliers for coffee from various coffee-producing regions, the available supply and price for high-
5
quality coffee beans can fluctuate dramatically. Accordingly, we monitor world market conditions for green (unroasted) coffee and contract for future supply volumes to obtain expected requirements of high-quality coffee beans at acceptable prices.
Our TH business has significant supply chain operations, including procurement, warehousing and distribution, to supply paper and dry goods to a substantial majority of our Canadian restaurants, and procure and supply frozen baked goods and some refrigerated products to most of our Ontario and Quebec restaurants. We act as a distributor to TH restaurants in Canada through five distribution centers located in Canada. In 2018, we announced plans to build two new warehouses in Western Canada and to renovate an existing warehouse in Eastern Canada to facilitate the supply of frozen and refrigerated products in those markets. We expect to complete these projects in 2020. We own or lease a significant number of trucks and trailers that regularly deliver to most of our Canadian restaurants. In the U.S., we supply similar products to system restaurants through third-party distributors.
All of the products used in our BK and PLK restaurants are sourced from third-party suppliers. In the U.S. and Canada, there is a purchasing cooperative for each brand that negotiates the purchase terms for most equipment, food, beverages (other than branded soft drinks which we negotiate separately under long-term agreements) and other products used in BK and PLK restaurants. The purchasing agent is also authorized to purchase and manage distribution services on behalf of most of the BK and PLK restaurants in the U.S. and Canada. PLK also utilizes exclusive suppliers for certain of its proprietary products. As of
December 31, 2018
, four distributors serviced approximately 87% of BK restaurants in the U.S. and five distributors serviced approximately 85% of PLK restaurants in the U.S.
In 2000, Burger King Corporation entered into long-term exclusive contracts with The Coca-Cola Company and Dr Pepper/Snapple, Inc. to supply BK restaurants with their products and which obligate restaurants in the U.S. to purchase a specified number of gallons of soft drink syrup. These volume commitments are not subject to any time limit. As of
December 31, 2018
, we estimate that it will take approximately
7
years to complete the Coca-Cola purchase commitment and approximately
11
years to complete the Dr Pepper/Snapple, Inc. purchase commitment. If these agreements were terminated, we would be obligated to pay an aggregate amount equal to approximately
$413 million
as of
December 31, 2018
based on an amount per gallon for each gallon of soft drink syrup remaining in the purchase commitments, interest and certain other costs. We have also entered into long-term beverage supply arrangements with certain major beverage vendors for the TH and PLK brands in the U.S. and Canada.
Franchise Agreements and Other Arrangements
General.
We grant franchisees the right to operate restaurants using our trademarks, trade dress and other intellectual property, uniform operating procedures, consistent quality of products and services and standard procedures for inventory control and management. For each franchise restaurant, we generally enter into a franchise agreement covering a standard set of terms and conditions. Recurring fees consist of periodic royalty and advertising payments. Franchisees report gross sales on a monthly or weekly basis and pay royalties based on gross sales.
Franchise agreements are generally not assignable without our consent. Our TH franchise agreements grant us the right to reacquire a restaurant under certain circumstances, and our BK and PLK
franchise agreements generally have a right of first refusal if a franchisee proposes to sell a restaurant. Defaults (including non-payment of royalties or advertising contributions, or failure to operate in compliance with our standards) can lead to termination of the franchise agreement
.
U.S. and Canada.
TH franchisees in the U.S. and Canada operate under several types of license agreements, with a typical term for a standard restaurant of 10 years plus renewal period(s) of 10 years in the aggregate for Canada and a typical term of 20 years for the U.S. TH franchisees who lease land and/or buildings from us typically pay a royalty of 3.0% to 4.5% of weekly restaurant gross sales. Our license agreements contemplate a one-time franchise fee which must be paid in full before the restaurant opens for business and upon the grant of an additional term. Under a separate lease or sublease, TH franchisees typically pay monthly rent based on the greater of a fixed monthly payment and contingent rental payments based on a percentage (usually 8.5% to 10.0%) of monthly gross sales or flow through monthly rent based on the terms of an underlying lease. Where the franchisee owns the premises, leases it from a third party or enters into a flow through lease with TH, the royalty is typically increased. In addition, the royalty rates under license agreements entered into in connection with non-standard restaurants, including self-serve kiosks and strategic alliances with third parties, may vary from those described above and are negotiated on a case-by-case basis.
The typical BK and PLK franchise agreement in the U.S. and Canada has a 20-year term and contemplates a one-time franchise fee. Subject to the incentive programs described below, most new BK franchise restaurants in the U.S. and Canada pay a royalty on gross sales of 4.5% and most PLK restaurants in the U.S. and Canada pay a royalty on gross sales of 5.0%. BK franchise agreements typically provide for a 20-year renewal term, and PLK franchise agreements typically provide for two 10-year renewal terms.
In an effort to improve the image of our BK restaurants in the U.S., we offered U.S. franchisees reduced up-front franchise fees and limited-term royalty and advertising fund rate reductions to remodel restaurants to our modern image during 2016, 2017 and 2018 and we plan to continue to offer remodel incentives to U.S. franchisees during 2019. These limited-term incentive programs are expected to negatively impact our effective royalty rate until 2027. However, we expect this impact to be partially mitigated as incentive programs granted in prior years will expire and we will also be entering into new franchise agreements for BK restaurants in
6
the U.S. with a 4.5% royalty rate. For PLK, we offered development incentive programs in 2017 pursuant to which we reduced or waived franchise fees and royalty payments to encourage our PLK franchisees to develop and open new restaurants. Most of these programs were discontinued in 2018.
International.
Historically, we entered into franchise agreements for each BK restaurant in our international markets with up-front franchise fees and monthly royalties and advertising contributions typically of up to 5.0% of gross sales. However, as part of the international growth strategy for each of our brands, we have entered into master franchise agreements or development agreements that grant franchisees exclusive or non-exclusive development rights and, in some cases, require them to provide support services to other franchisees in their markets. In 2018, we entered into master franchise agreements for the TH brand in China, for the PLK brand in Brazil and the Philippines, and for the BK brand in the Netherlands. The up-front franchise fees and royalty rate paid by master franchisees or exclusive developers vary from country to country, depending on the facts and circumstances of each market. We expect to continue implementing similar arrangements for our brands in 2019 and beyond.
Franchise Restaurant Leases.
We leased or subleased
3,571
properties to TH franchisees,
1,634
properties to BK franchisees, and
79
properties to PLK franchisees as of
December 31, 2018
pursuant to separate lease agreements with these franchisees. For properties that we lease from third-party landlords and sublease to franchisees, our leases generally provide for fixed rental payments and may provide for contingent rental payments based on a restaurant’s annual gross sales. Franchisees who lease land only or land and building from us do so on a “triple net” basis. Under these triple net leases, the franchisee is obligated to pay all costs and expenses, including all real property taxes and assessments, repairs and maintenance and insurance.
Intellectual Property
We own valuable intellectual property relating to our brands, including trademarks, service marks, patents, copyrights, trade secrets and other proprietary information, some of which are of material importance to our TH, BK and PLK businesses. We have established the standards and specifications for most of the goods and services used in the development, improvement and operation of our restaurants. These proprietary standards, specifications and restaurant operating procedures are our trade secrets. Additionally, we own certain patents of varying duration relating to equipment used in BK and TH restaurants.
Competition
Each of our brands competes in the U.S., Canada and internationally with many well-established food service companies on the basis of product choice, quality, affordability, service and location. With few barriers to entry to the restaurant industry, our competitors include a variety of independent local operators, in addition to well-capitalized regional, national and international restaurant chains and franchises, and new competitors may emerge at any time. We also compete for consumer dining dollars with national, regional and local (i) quick service restaurants that offer alternative menus, (ii) casual and “fast casual” restaurant chains and (iii) convenience stores and grocery stores. Furthermore, delivery aggregators and other food delivery services provide consumers with convenient access to a broad range of competing restaurant chains and food retailers, particularly in urban areas.
Government Regulations and Affairs
General.
We and our franchisees are subject to various laws and regulations including (i) licensing and regulation relating to health, food preparation, sanitation and safety standards and, for our distribution business, traffic and transportation regulations; (ii) information security, privacy and consumer protection laws; and (iii) other laws regulating the design, accessibility and operation of facilities, such as the
Americans with Disabilities Act
of 1990, the
Accessibility for Ontarians with Disabilities Act
and similar Canadian federal and provincial legislation that can have a significant impact on our franchisees and our performance. These regulations include food safety regulations, including supervision by the U.S. Food and Drug Administration and its international equivalents, which govern the manufacture, labeling, packaging and safety of food. In addition, we are or may become subject to legislation or regulation seeking to tax and/or regulate high-fat, high-calorie and high-sodium foods, particularly in Canada, the U.S., the United Kingdom and Spain. Certain countries, provinces, states and municipalities have approved menu labeling legislation that requires restaurant chains to provide caloric information on menu boards, and menu labeling legislation has also been adopted on the U.S. federal level as well as in Ontario.
U.S. and Canada.
Our restaurants must comply with licensing requirements and regulations by a number of governmental authorities, which include zoning, health, safety, sanitation, building and fire agencies in the jurisdiction in which the restaurant is located. We and our franchisees are also subject to various employment laws, including laws governing union organizing, working conditions, work authorization requirements, health insurance, overtime and wages. In addition, we and our U.S. franchisees are subject to the
Patient Protection and Affordable Care Act
.
We are subject to federal franchising laws adopted by the U.S. Federal Trade Commission (the “FTC”) and state and provincial franchising laws. Much of the legislation and rules adopted have been aimed at providing detailed disclosure to a prospective franchisee, duties of good faith as between the franchisor and the franchisee, and/or periodic registration by the franchisor with
7
applicable regulatory agencies. Additionally, some U.S. states have enacted or are considering enacting legislation that governs the termination or non-renewal of a franchise agreement and other aspects of the franchise relationship.
International.
Internationally, we and our franchisees are subject to national and local laws and regulations that often are similar to those affecting us and our franchisees in the U.S. and Canada. We and our franchisees are also subject to a variety of tariffs and regulations on imported commodities and equipment, and laws regulating foreign investment.
Environmental Matters
Various laws concerning the handling, storage and disposal of hazardous materials and restaurant waste and the operation of restaurants in environmentally sensitive locations may impact aspects of our operations and the operations of our franchisees; however, we do not believe that compliance with applicable environmental regulations will have a material effect on our capital expenditures, financial condition, results of operations, or competitive position. Increased focus by U.S., Canadian and international governmental authorities on environmental matters is likely to lead to new governmental initiatives, particularly in the area of climate change. While we cannot predict the precise nature of these initiatives, we expect that they may impact our business both directly and indirectly. There is a possibility that government initiatives, or actual or perceived effect of changes in weather patterns, climate or water resources could have a direct impact on the operations of our brands in ways that we cannot predict at this time.
Seasonal Operations
Our restaurant sales are typically higher in the spring and summer months when the weather is warmer and typically lowest during the winter months. Furthermore, adverse weather conditions can have material adverse effects on restaurant sales. The timing of holidays may also impact restaurant sales. Because our businesses are moderately seasonal, results for any one quarter are not necessarily indicative of the results that may be achieved for any other quarter or for the full fiscal year.
Our Employees
As of
December 31, 2018
, we had approximately
6,000
employees in our restaurant support centers, regional offices, distribution centers, manufacturing facilities, field operations and Company restaurants. Our franchisees are independent business owners so their employees are not our employees and therefore are not included in our employee count.
Available Information
We make available free of charge on or through the Investor Relations section of our internet website at
www.rbi.com
, all materials that we file electronically with the Securities and Exchange Commission (the “SEC”), including this annual report on Form 10-K, quarterly reports on Form 10-Q, current reports on Form 8-K and any amendments to those reports as soon as reasonably practicable after electronically filing or furnishing such material with the SEC and with the Canadian Securities Administrators. This information is also available at www.sec.gov, an internet site maintained by the SEC that contains reports, proxy and information statements and other information regarding issuers that file electronically with the SEC, and on the System for Electronic Document Analysis and Retrieval (“SEDAR”) at www.sedar.com, a website maintained by the Canadian Securities Administrators. The references to our website address, the SEC’s website address and the website maintained by the Canadian Securities Administrators do not constitute incorporation by reference of the information contained in these websites and should be not considered part of this document.
A copy of our Corporate Governance Guidelines, Code of Business Ethics and Conduct for Non-Restaurant Employees, Code of Ethics for Executive Officers, Code of Conduct for Directors and the Charters of the Audit Committee, Compensation Committee, Nominating and Corporate Governance Committee, Conflicts Committee and Operations and Strategy Committee of the board of directors of RBI are posted in the Investor Relations section of RBI’s website at
www.rbi.com
.
Our principal executive offices are located at 130 King Street West, Suite 300, Toronto, Ontario M5X 1E1, Canada. Our telephone number is (905) 845-6511.
8
Item 1A.
Risk Factors
Risks Related to Our Business
We face intense competition in our markets, which could negatively impact our business.
The restaurant industry is intensely competitive and we compete with many well-established food service companies on the basis of product choice, quality, affordability, service and location. With few barriers to entry, our competitors include a variety of independent local operators, in addition to well-capitalized regional, national and international restaurant chains and franchises, and new competitors may emerge at any time. Furthermore, delivery aggregators and food delivery services provide consumers with convenient access to a broad range of competing restaurant chains and food retailers, particularly in urbanized areas. Each of our brands also competes for qualified franchisees, suitable restaurant locations and management and personnel.
Our ability to compete will depend on the success of our plans to improve existing products, to develop and roll-out new products, to effectively respond to consumer preferences and to manage the complexity of restaurant operations as well as the impact of our competitors’ actions. In addition, our long-term success will depend on our ability to strengthen our customers' digital experience through expanded mobile ordering, delivery and social interaction. Some of our competitors have substantially greater financial resources, higher revenues and greater economies of scale than we do. These advantages may allow them to implement their operational strategies more quickly or effectively than we can or benefit from changes in technologies, which could harm our competitive position. These competitive advantages may be exacerbated in a difficult economy, thereby permitting our competitors to gain market share. There can be no assurance that we will be able to successfully respond to changing consumer preferences, including with respect to new technologies and alternative methods of delivery. If we are unable to maintain our competitive position, we could experience lower demand for products, downward pressure on prices, reduced margins, an inability to take advantage of new business opportunities, a loss of market share, reduced franchisee profitability and an inability to attract qualified franchisees in the future.
Our success depends on the value of our brands and the failure to preserve their value and relevance could have a negative impact on our financial results.
We depend in large part on the value of the TH, BK and PLK brands. To be successful in the future, we must preserve, enhance and leverage the value of our brands. Brand value is based in part on consumer tastes, preferences and perceptions on a variety of factors, including the nutritional content, methods of production and preparation of our products and our business practices. Consumer acceptance of our products may be influenced by or subject to change for a variety of reasons. For example, adverse publicity associated with nutritional, health and other scientific studies and conclusions, which constantly evolve and often have contradictory implications, may drive popular opinion against quick service restaurants in general, which may impact the demand for our products. Moreover, health campaigns against products we offer in favor of foods that are perceived as healthier may affect consumer perception of our product offerings and impact the value of our brands.
In addition, adverse publicity related to litigation, regulation (including initiatives intended to drive consumer behavior) or incidents involving us, our franchisees, competitors or suppliers may impact the value of our brands by discouraging customers from buying our products. Perceptions may also be affected by activist campaigns to promote adverse perceptions of the quick service restaurant industry or our brands and/or our operations, suppliers, franchisees or other partners such as campaigns aimed at sustainability or living-wage opinions. Consumer demand for our products and our brand equity could diminish if we, our employees or our franchisees or other business partners fail to preserve the quality of our products, act or are perceived to act as unethical, illegal, racially-biased or in a socially irresponsible manner, including with respect to the sourcing, content or sale of our products or the use of consumer data for general or direct marketing or other purposes, fail to comply with laws and regulations, publicly take controversial positions or actions or fail to deliver a consistently positive consumer experience in each of our markets. If we are unsuccessful in addressing consumer adverse perceptions, our brands and our financial results may suffer.
Economic conditions have adversely affected, and may continue to adversely affect, consumer discretionary spending which could negatively impact our business and operating results.
We believe that our restaurant sales, guest traffic and profitability are strongly correlated to consumer discretionary spending, which is influenced by general economic conditions, unemployment levels, the availability of discretionary income and, ultimately, consumer confidence. A protracted economic slowdown, increased unemployment and underemployment of our customer base, decreased salaries and wage rates, inflation, rising interest rates or other industry-wide cost pressures adversely affect consumer behavior by weakening consumer confidence and decreasing consumer spending for restaurant dining occasions. There can be no assurance that governmental or other responses to economic challenges will restore or maintain consumer confidence. As a result of
9
these factors, during recessionary periods we and our franchisees may experience reduced sales and profitability, which may cause our business and operating results to suffer.
Our substantial leverage and obligations to service our debt could adversely affect our business.
As of
December 31, 2018
, we had aggregate outstanding indebtedness of
$12,038 million
, including a senior secured term loan facility in an aggregate principal amount of
$6,338 million
, senior secured first lien notes in an aggregate principal amount of
$2,750 million
and senior secured second lien notes in an aggregate principal amount of
$2,800 million
. Subject to restrictions set forth in these instruments, we may also incur significant additional indebtedness in the future, some of which may be secured debt. This may have the effect of increasing our total leverage.
Our substantial leverage could have important potential consequences, including, but not limited to:
|
•
|
increasing our vulnerability to, and reducing our flexibility to respond to, changes in our business and general adverse economic and industry conditions;
|
|
•
|
requiring the dedication of a substantial portion of our cash flow from operations to our debt service, thereby reducing the availability of such cash flow to fund working capital, capital expenditures, acquisitions, joint ventures, product research, distributions, share repurchases or other corporate purposes;
|
|
•
|
increasing our vulnerability to a downgrade of our credit rating, which could adversely affect our cost of funds, liquidity and access to capital markets;
|
|
•
|
placing us at a competitive disadvantage as compared to certain of our competitors who are not as highly leveraged;
|
|
•
|
restricting us from making strategic acquisitions or causing us to make non-strategic divestitures;
|
|
•
|
exposing us to the risk of increased interest rates as borrowings under our credit facilities are subject to variable rates of interest;
|
|
•
|
making it more difficult for us to repay, refinance or satisfy our obligations with respect to our debt;
|
|
•
|
limiting our ability to borrow additional funds in the future and increasing the cost of any such borrowing; and
|
|
•
|
exposing us to risks related to fluctuations in foreign currency as we earn profits in a variety of currencies around the world and substantially all of our debt is denominated in U.S. dollars.
|
There is no assurance that we will generate cash flow from operations or that future debt or equity financings will be available to us to enable us to pay our indebtedness or to fund other needs. As a result, we may need to refinance all or a portion of our indebtedness on or before maturity. There is no assurance that we will be able to refinance any of our indebtedness on favorable terms, or at all. An inability to generate sufficient cash flow or refinance our indebtedness on favorable terms could have a material adverse effect on our financial condition.
The terms of our indebtedness limit our ability to take certain actions and perform certain corporate functions, and could have the effect of delaying or preventing a future change of control.
The terms of our indebtedness include a number of restrictive covenants that, among other things, limit our ability to:
|
•
|
incur additional indebtedness or guarantee or prepay indebtedness;
|
|
•
|
pay dividends on, repurchase or make distributions in respect of capital stock;
|
|
•
|
make investments or acquisitions;
|
|
•
|
create liens or use assets as security in other transactions;
|
|
•
|
consolidate, merge, sell or otherwise dispose of substantially all of our or our subsidiaries’ assets;
|
|
•
|
make intercompany transactions; and
|
|
•
|
enter into transactions with affiliates.
|
These limitations may hinder our ability to finance future operations and capital needs and our ability to pursue business opportunities and activities that may be in our interest. In addition, our ability to comply with these covenants and restrictions may be affected by events beyond our control.
A breach of the covenants under our indebtedness could result in an event of default under the applicable agreement. In the event of default, our debt holders may accelerate repayment of such debt, which may result in the acceleration of the repayment of any other debt to which a cross-acceleration or cross-default provision applies. In addition, default under our senior secured credit facilities would also permit the lenders thereunder to terminate all other commitments to extend additional credit under the senior secured credit facilities. Similarly, in the event of a change of control, pursuant to the terms of our indebtedness, we may be required to repay our
10
credit facilities, or offer to repurchase the senior secured first lien and second lien notes. In addition, our future indebtedness may also be subject to mandatory repurchase or repayment upon a future change of control. Such current and future terms could have the effect of delaying or preventing a future change of control or may discourage a potential acquirer from proposing or completing a transaction that may otherwise have presented a premium to our unitholders.
In the event of either a default or change of control, we may not have sufficient resources to repurchase, repay or redeem our obligations, as applicable. Moreover, third-party financing may be required in order to provide the funds necessary for us to satisfy these obligations, and we may not be able to obtain such additional financing on terms favorable to us or at all. Furthermore, if we were unable to repay the amounts due under our secured indebtedness, the holders of such indebtedness could proceed against the collateral that secures such indebtedness. In the event our creditors accelerate the repayment of our secured indebtedness, we and our subsidiaries may not have sufficient assets to repay that indebtedness.
Our fully franchised business model presents a number of disadvantages and risks.
Substantially all of our restaurants are owned and operated by franchisees. Under our fully franchised business model, our future prospects depend on (i) our ability to attract new franchisees for each of our brands that meet our criteria and (ii) the willingness and ability of franchisees to open restaurants in existing and new markets. There can be no assurance that we will be able to identify franchisees who meet our criteria, or if we identify such franchisees, that they will successfully implement their expansion plans.
Our fully franchised business model presents a number of other drawbacks, such as limited influence over franchisees, limited ability to facilitate changes in restaurant ownership, limitations on enforcement of franchise obligations due to bankruptcy or insolvency proceedings and reliance on franchisees to participate in our strategic initiatives. While we can mandate certain strategic initiatives through enforcement of our franchise agreements, we will need the active support of our franchisees if the implementation of these initiatives is to be successful. The failure of these franchisees to support our marketing programs and strategic initiatives could adversely affect our ability to implement our business strategy and could materially harm our business, results of operations and financial condition.
Our principal competitors that have a significantly higher percentage of company-operated restaurants than we do may have greater influence over their respective restaurant systems and greater ability to implement operational initiatives and business strategies, including their marketing and advertising programs.
The ability of our franchisees and prospective franchisees to obtain financing for development of new restaurants or reinvestment in existing restaurants depends in part upon financial and economic conditions which are beyond their control. If our franchisees are unable to obtain financing on acceptable terms to develop new restaurants or reinvest in existing restaurants, our business and financial results could be adversely affected.
Our franchisees are also dependent upon their ability to attract and retain qualified employees in an intensely competitive employee market. The inability of our franchisees to recruit and retain qualified individuals may delay the planned openings of new restaurants by our franchisees and could adversely impact existing franchise restaurants, which could slow our growth. Moreover, we may also face liability for employment-related claims of our franchisees’ employees based on theories of joint employer liability with our franchisees or other theories of vicarious liability, which could materially harm our results of operations and financial condition.
Our operating results are closely tied to the success of our franchisees, who are independent operators, and we have limited influence over their restaurant operations.
We generate revenues in the form of royalties, fees and other amounts from our franchisees. As a result, our operating results are closely tied to the success of our franchisees. However, our franchisees are independent operators and we cannot control many factors that impact the profitability of their restaurants. If sales trends or economic conditions worsen for franchisees, their financial results may deteriorate, which could result in, among other things, restaurant closures, delayed or reduced payments to us of royalties, advertising contributions, rents and, in the case of the TH brand, delayed or reduced payments for products and supplies, and an inability for such franchisees to obtain financing to fund development, restaurant remodels or equipment initiatives on acceptable terms or at all. Furthermore, franchisees may not be willing or able to renew their franchise agreements with us due to low sales volumes, or high real estate costs, or may be unable to renew due to the failure to secure lease renewals. If our franchisees fail to renew their franchise agreements, our royalty revenues may decrease which in turn could materially and adversely affect our business and operating results.
Under our franchise agreements, we can, among other things, establish operating procedures and approve suppliers, distributors and products. However, franchisees may not successfully operate restaurants in a manner consistent with our standards and requirements or standards set by applicable law, including sanitation and pest control standards. Any operational shortcoming of a franchise restaurant is likely to be attributed by guests to the entire brand, thus damaging the brand’s reputation and potentially
11
affecting our revenues and profitability. We may not be able to identify problems and take effective action quickly enough and, as a result, our image and reputation may suffer, and our franchise revenues and results of operations could decline.
Our operating results depend on the effectiveness of our marketing and advertising programs and the successful development and launch of new products.
Our revenues are heavily influenced by brand marketing and advertising and by our ability to develop and launch new and innovative products. Our marketing and advertising programs may not be successful or we may fail to develop commercially successful new products, which may lead us to fail to attract new guests and retain existing guests, which, in turn, could materially and adversely affect our results of operations. Moreover, because franchisees contribute to advertising funds based on a percentage of gross sales at their franchise restaurants, advertising fund expenditures are dependent upon sales volumes at system-wide restaurants. If system-wide sales decline, there will be a reduced amount available for our marketing and advertising programs. Furthermore, to the extent that we use value offerings in our marketing and advertising programs to drive traffic, the low price offerings may condition our guests to resist higher prices in a more favorable economic environment.
In addition, we continue to focus on restaurant modernization and technology and digital engagement in order to transform the restaurant experience. As part of these initiatives we are seeking to improve our service model and strengthen relationships with customers, digital channels, loyalty initiatives, mobile ordering and payment systems and delivery initiatives. These initiatives may not have the anticipated impact on our franchise sales and therefore we may not fully realize the intended benefits of these significant investments.
Our future growth and profitability will depend on our ability to successfully accelerate international development with strategic partners and joint ventures.
We believe that the future growth and profitability of each of our brands will depend on our ability to successfully accelerate international development with strategic partners and joint ventures in new and existing international markets. New markets may have different competitive conditions, consumer tastes and discretionary spending patterns than our existing markets. As a result, new restaurants in those markets may have lower average restaurant sales than restaurants in existing markets and may take longer than expected to reach target sales and profit levels (or may never do so). We will need to build brand awareness in those new markets we enter through advertising and promotional activity, and those activities may not promote our brands as effectively as intended, if at all.
We have adopted a master franchise development model for all of our brands, which in markets with strong growth potential may include participating in strategic joint ventures, to accelerate international growth. These new arrangements may give our joint venture and/or master franchise partners the exclusive right to develop and manage our restaurants in a specific country or countries. A joint venture partnership involves special risks, including the following: our joint venture partners may have economic, business or legal interests or goals that are inconsistent with those of the joint venture or us, or our joint venture partners may be unable to meet their economic or other obligations and we may be required to fulfill those obligations alone. Our master franchise arrangements present similar risks and uncertainties. We cannot control the actions of our joint venture partners or master franchisees, including any nonperformance, default or bankruptcy of joint venture partners or master franchisees. In addition, the termination of an arrangement with a master franchisee or a lack of expansion by certain master franchisees could result in the delay or discontinuation of the development of franchise restaurants, or an interruption in the operation of our brand in a particular market or markets. We may not be able to find another operator to resume development activities in such market or markets. Any such delay, discontinuation or interruption could materially and adversely affect our business and operating results.
If we are unable to effectively manage our growth, it could adversely affect our business and operating results.
We are the indirect holding company for TH, BK, and PLK and their respective consolidated subsidiaries with over
25,000
restaurants, of which approximately 100% are franchised restaurants. In addition, our growth strategy includes strategic expansion in existing and new markets, and contemplates a significant acceleration in the growth in the number of new restaurants. As our franchisees are independent third parties, we have expended and may need to continue to expend substantial financial and managerial resources to enhance our existing restaurant management systems, financial and management controls, information systems and personnel to accurately capture and reflect the financial and operational activities at our franchise restaurants. On occasion we have encountered, and may in the future encounter, challenges in receiving these results from our franchisees in a consistent and timely manner. If we are not able to effectively manage the management and information demands associated with the significant growth of our franchise system, then our business and operating results could be negatively impacted.
Sub-franchisees could take actions that could harm our business and that of our master franchisees.
Our business model contemplates us entering into agreements with master franchisees that permit them to develop and operate restaurants in defined geographic areas. As permitted by certain of these agreements, master franchisees may elect to license sub-
12
franchisees to develop and operate TH, BK, or PLK restaurants, as applicable in the geographic area covered by the agreement. These agreements contractually obligate our master franchisees to operate their restaurants in accordance with specified operations, safety and health standards and also require that any sub-franchise agreement contain similar requirements. However, we are not party to the agreements with the sub-franchisees and are dependent upon our master franchisees to enforce these standards with respect to sub-franchised restaurants. As a result, the ultimate success and quality of any sub-franchised restaurant rests with the master franchisee and the sub-franchisee. If sub-franchisees do not successfully operate their restaurants in a manner consistent with required standards, franchise fees and royalty income ultimately paid to us could be adversely affected, and our brand image and reputation may be harmed, which could materially and adversely affect our business and operating results.
Our international operations subject us to additional risks and costs and may cause our profitability to decline.
Our operations outside of the U.S. and Canada are exposed to risks inherent in foreign operations. These risks, which can vary substantially by market, are described in many of the risk factors discussed in this section and include the following:
|
•
|
governmental laws, regulations and policies adopted to manage national economic conditions, such as increases in taxes, austerity measures that impact consumer spending, monetary policies that may impact inflation rates and currency fluctuations;
|
|
•
|
the imposition of import restrictions or controls;
|
|
•
|
the risk of markets in which we have granted exclusive development and subfranchising rights;
|
|
•
|
the effects of legal and regulatory changes and the burdens and costs of our compliance with a variety of foreign laws;
|
|
•
|
changes in the laws and policies that govern foreign investment and trade in the countries in which we operate;
|
|
•
|
compliance with U.S., Canadian and other foreign anti-corruption and anti-bribery laws, including compliance by our employees, contractors, licensees or agents and those of our strategic partners and joint ventures;
|
|
•
|
risks and costs associated with political and economic instability, corruption, anti-American sentiment and social and ethnic unrest in the countries in which we operate;
|
|
•
|
the risks of operating in developing or emerging markets in which there are significant uncertainties regarding the interpretation, application and enforceability of laws and regulations and the enforceability of contract rights and intellectual property rights;
|
|
•
|
risks arising from the significant and rapid fluctuations in currency exchange markets and the decisions and positions that we take to hedge such volatility;
|
|
•
|
changing labor conditions and difficulties experienced by our franchisees in staffing their international operations;
|
|
•
|
the impact of labor costs on our franchisees’ margins given our labor-intensive business model and the long-term trend toward higher wages in both mature and developing markets and the potential impact of union organizing efforts on day-to-day operations of our franchisees’ restaurants; and
|
|
•
|
the effects of increases in the taxes we pay and other changes in applicable tax laws.
|
These factors may increase in importance as we expect franchisees of each of our brands to open new restaurants in international markets as part of our growth strategy.
Our operations are subject to fluctuations in foreign currency exchange and interest rates.
We report our results in U.S. dollars, which is our reporting currency. The operations of TH, BK, and PLK that are denominated in currencies other than the U.S. dollar are translated to U.S. dollars for our financial reporting purposes, and are therefore impacted by fluctuations in currency exchange rates and changes in currency regulations. In addition, fluctuations in interest rates may affect our combined business. Although we attempt to minimize these risks through geographic diversification and the utilization of derivative financial instruments, our risk management strategies may not be effective and our results of operations could be adversely affected.
Increases in food and commodity costs or shortages or interruptions in the supply or delivery of our food could harm our operating results and the results of our franchisees.
Our profitability and the profitability of our franchisees will depend in part on our ability to anticipate and react to changes in food and commodity and supply costs. With respect to our TH business, volatility in connection with certain key commodities that we purchase in the ordinary course of business can impact our revenues, costs and margins. If commodity prices rise, franchisees may experience reduced sales due to decreased consumer demand at retail prices that have been raised to offset increased commodity prices, which may reduce franchisee profitability. In addition, the markets for beef and chicken are subject to significant price fluctuations due to seasonal shifts, climate conditions, the cost of grain, disease, industry demand, international commodity markets,
13
food safety concerns, product recalls, government regulation and other factors, all of which are beyond our control and, in many instances unpredictable. Such increases in commodity costs may materially and adversely affect our business and operating results.
We and our franchisees are dependent on frequent deliveries of fresh food products that meet our specifications. Shortages or interruptions in the supply of fresh food products caused by unanticipated demand, natural disasters, problems in production or distribution, inclement weather or other conditions could adversely affect the availability, quality and cost of ingredients, which would adversely affect our operating results.
Our vertically integrated supply chain operations subject us to additional risks and may cause our profitability to decline.
We operate a vertically integrated supply chain for our TH business in which we manufacture, warehouse, and distribute certain food and restaurant supplies to our franchise and Company restaurants. There are certain risks associated with this vertical integration growth strategy, including:
|
•
|
delays and/or difficulties associated with, or liabilities arising from, owning a manufacturing, warehouse and distribution business;
|
|
•
|
maintenance, operations and/or management of the facilities, equipment, employees and inventories;
|
|
•
|
limitations on the flexibility of controlling capital expenditures and overhead;
|
|
•
|
the need for skills and techniques that are outside our traditional core expertise;
|
|
•
|
increased transportation, shipping, food and other supply costs;
|
|
•
|
inclement weather or extreme weather events;
|
|
•
|
shortages or interruptions in the availability or supply of high-quality coffee beans, perishable food products and/or their ingredients;
|
|
•
|
variations in the quality of food and beverage products and/or their ingredients; and
|
|
•
|
political, physical, environmental, labor, or technological disruptions in our or our suppliers’ manufacturing and/or warehousing plants, facilities, or equipment.
|
If we do not adequately address the challenges related to these vertically integrated operations or the overall level of utilization or production decreases for any reason, our results of operations and financial condition may be adversely impacted. Moreover, shortages or interruptions in the availability and delivery of food, beverages and other suppliers to our restaurants may increase costs or reduce revenues. As of
December 31, 2018
, we have only one or a few suppliers to service each category of products sold at our TH and PLK restaurants, and the loss of any one of these suppliers would likely adversely affect our business.
Our success is dependent on securing desirable restaurant locations for each of our brands, and competition for these locations may impact our ability to effectively grow our restaurant portfolios.
The success of any restaurant depends in substantial part on its location. There can be no assurance that the current locations of our restaurants will continue to be attractive as demographic patterns change. Neighborhood or economic conditions where restaurants are located could decline in the future, thus resulting in potentially reduced sales in those locations. Competition for restaurant locations can also be intense and there may be delay or cancellation of new site developments by developers and landlords, which may be exacerbated by factors related to the commercial real estate or credit markets. If franchisees cannot obtain desirable locations for their restaurants at reasonable prices due to, among other things, higher than anticipated acquisition, construction and/or development costs of new restaurants, difficulty negotiating leases with acceptable terms, onerous land use or zoning restrictions, or challenges in securing required governmental permits, then their ability to execute their respective growth strategies may be adversely affected.
The market for retail real estate is highly competitive. Based on their size advantage and/or their greater financial resources, some of our competitors may have the ability to negotiate more favorable lease terms than we can and some landlords and developers may offer priority or grant exclusivity to some of our competitors for desirable locations. As a result, we or our franchisees may not be able to obtain new leases or renew existing leases on acceptable terms, if at all, which could adversely affect our sales and brand-building initiatives.
Our ownership and leasing of significant amounts of real estate exposes us to possible liabilities, losses, and risks.
Many of our system restaurants are located on leased premises. As leases underlying our Company and franchise restaurants expire, we or our franchisees may be unable to negotiate a new lease or lease extension, either on commercially acceptable terms or at all, which could cause us or our franchisees to close restaurants in desirable locations. As a result, our sales and our brand-building initiatives could be adversely affected. Furthermore, in general, we cannot cancel existing leases; therefore, if an existing or future restaurant is not profitable, and we decide to close it, we may nonetheless be committed to perform our obligations under the
14
applicable lease. In addition, the value of our owned real estate assets could decrease, and/or our costs could increase, because of changes in the investment climate for real estate, demographic trends, demand for restaurant sites and other retail properties, and exposure to or liability associated with environmental contamination and reclamation.
Typically the costs of insurance, taxes, maintenance, utilities, and other property-related costs due under a prime lease with a third-party landlord are passed through to the franchisee under our sublease. If a franchisee fails to perform the obligations passed through under the sublease, we will be required to perform these obligations resulting in an increase in our leasing and operational costs and expenses. In addition, the rent a franchisee pays us under the sublease may be based on a percentage of gross sales. If gross sales at a certain restaurant are less than we project we may pay more rent to a third-party landlord under the prime lease than we receive from the franchisee under the sublease. These events could result in an inability to fully recover from the franchisee expenses incurred on leased properties, resulting in increased leasing and operational costs to us.
Food safety concerns and concerns about the health risk of fast food may have an adverse effect on our business.
Food safety is a top priority for us and we dedicate substantial resources to ensure that our customers enjoy safe, high-quality food products. However, food-borne illnesses and other food safety issues have occurred in the food industry in the past and could occur in the future. Furthermore, our reliance on third-party food suppliers and distributors increases the risk that food-borne illness incidents could be caused by factors outside of our control and that multiple locations would be affected rather than a single restaurant. Any report or publicity, including through social media, linking us or one of our franchisees or suppliers to instances of food-borne illness or other food safety issues, including food tampering, adulteration or contamination, could adversely affect our brands and reputation as well as our revenues and profits. Such occurrence at restaurants of competitors could adversely affect restaurant sales as a result of negative publicity about the foodservice industry generally. The occurrence of food-borne illnesses or food safety issues could also adversely affect the price and availability of affected ingredients, which could result in disruptions in our supply chain, significantly increase our costs and/or lower margins for us and our franchisees.
Some of our products contain caffeine, dairy products, fats, sugar and other compounds and allergens, the health effects of which are the subject of public scrutiny, including suggesting that excessive consumption of caffeine, beef, sugar and other compounds can lead to a variety or adverse health effects. Particularly in the U.S., there is increasing consumer awareness of the health risks, including obesity, as well as increased consumer litigation based on alleged adverse health impacts of consumption of various food products. An unfavorable report on the health effects of caffeine or other compounds present in our products, or negative publicity or litigation arising from other health risks such as obesity, could significantly reduce the demand for our beverages and food products. A decrease in customer traffic as a result of these health concerns or negative publicity could materially and adversely affect our brands and our business.
Our results can be adversely affected by unforeseen events, such as adverse weather conditions, natural disasters, terrorist attacks or threats or catastrophic events.
Unforeseen events, such as adverse weather conditions, natural disasters or catastrophic events, can adversely impact restaurant sales. Natural disasters such as earthquakes, hurricanes, and severe adverse weather conditions and health pandemics whether occurring in Canada, the United States or abroad, can keep customers in the affected area from dining out and result in lost opportunities for our restaurants. Furthermore, we cannot predict the effects that actual or threatened armed conflicts, terrorist attacks, efforts to combat terrorism or heightened security requirements will have on our future operations. Because a significant portion of our restaurant operating costs are fixed or semi-fixed in nature, the loss of sales during these periods hurts our and our franchisees' operating margins and can result in restaurant operating losses.
The loss of key management personnel or our inability to attract and retain new qualified personnel could hurt our business and inhibit our ability to operate and grow successfully.
We are dependent on the efforts and abilities of our senior management, including the executives managing each of our brands, and our success will also depend on our ability to attract and retain additional qualified employees. Failure to attract personnel sufficiently qualified to execute our strategy, or to retain existing key personnel, could have a material adverse effect on our business.
U.S. federal income tax reform could adversely affect us.
On December 22, 2017, the U.S. government enacted comprehensive tax legislation commonly referred to as the Tax Cuts and Jobs Act (the “Tax Act”). This new legislation significantly modifies the Internal Revenue Code of 1986, as amended (the “Code”). Among other things, it reduces the U.S. federal corporate tax rate and puts into effect the migration from a “worldwide” system of taxation to a modified territorial system (including providing for a 100% dividends received deduction in respect of non-U.S. source income received by certain U.S. recipients from certain non-U.S. corporations). The Tax Act also puts in place a number of provisions that may adversely impact us, including (i) a provision designed to tax currently global intangible low-taxed income (GILTI)
15
(effectively, non-U.S. income in excess of a deemed return on tangible assets of non-U.S. corporations), with (subject to certain limitations) a potential offset by foreign tax credits (ii) a base erosion anti-abuse tax (BEAT) that eliminates the deduction of certain base-erosion payments made to related non-U.S. corporations and imposes a minimum tax if greater than regular tax, (iii) significant additional limitations on the deductibility of interest, (iv) a one-time transition tax on certain unrepatriated earnings of non-U.S. subsidiaries that may, if elected, be paid over eight years, (v) limitations on the deductibility of certain executive compensation and (vi) limitations on the utilization of foreign tax credits to reduce the U.S. income tax liability. The provisions of the Tax Act are complex and likely will be the subject of additional regulatory and administrative guidance, which may adversely affect us. Accordingly, our effective tax rate and results of operations could be adversely impacted.
Unanticipated tax liabilities could adversely affect the taxes we pay and our profitability.
We are subject to income and other taxes in Canada, the United States, and numerous foreign jurisdictions. A taxation authority may disagree with certain of our views, including, for example, the allocation of profits by tax jurisdiction, and the deductibility of our interest expense, and may take the position that material income tax liabilities, interest, penalties, or other amounts are payable by us, in which case, we expect to contest such assessment. Contesting such an assessment may be lengthy and costly and if we were unsuccessful, the implications could be materially adverse to us and affect our effective income tax rate or operating income.
From time to time, we are subject to additional state and local income tax audits, international income tax audits and sales, franchise and value-added tax audits. Although we believe our tax estimates are reasonable, the final determination of tax audits and any related litigation could be materially different from our historical income tax provisions and accruals. There can be no assurance that the Canada Revenue Agency (the “CRA”), the U.S. Internal Revenue Service (the “IRS”) and/or foreign tax authorities will agree with our interpretation of the tax aspects of reorganizations, initiatives, transactions, or any related matters associated therewith that we have undertaken.
The results of a tax audit or related litigation could result in us not being in a position to take advantage of the effective income tax rates and the level of benefits that we anticipated to achieve as a result of corporate reorganizations, initiatives and transactions, and the implications could have a material adverse effect on our effective income tax rate, income tax provision, net income (loss) or cash flows in the period or periods for which that determination is made.
Partnership and RBI may be treated as U.S. corporations for U.S. federal income tax purposes, which could subject us and RBI to substantial additional U.S. taxes.
As Canadian entities, RBI and Partnership generally would be classified as foreign entities (and, therefore, non-U.S. tax residents) under general rules of U.S. federal income taxation. Section 7874 of the Code, however, contains rules that result in a non-U.S. corporation being taxed as a U.S. corporation for U.S. federal income tax purposes, unless certain tests, applied at the time of the acquisition, regarding ownership of such entities (as relevant here, ownership by former Burger King shareholders) or level of business activities (as relevant here, business activities in Canada by us and our affiliates, including RBI), were satisfied at such time. The U.S. Treasury Regulations apply these same rules to non-U.S. publicly traded partnerships, such as Partnership. These statutory and regulatory rules are relatively new, their application is complex and there is little guidance regarding their application.
If it were determined that we and/or RBI should be taxed as U.S. corporations for U.S. federal income tax purposes, we and RBI could be liable for substantial additional U.S. federal income tax. For Canadian tax purposes, we and RBI are expected, regardless of any application of Section 7874 of the Code, to be treated as a Canadian resident partnership and company, respectively. Consequently, if we and/or RBI did not satisfy either of the applicable tests, we might be liable for both Canadian and U.S. taxes, which could have a material adverse effect on our financial condition and results of operations.
Future changes to U.S. and non-U.S. tax laws could materially affect Partnership and/or RBI, including their status as foreign entities for U.S. federal income tax purposes, and adversely affect their anticipated financial positions and results.
Changes to the rules in sections 385 and 7874 of the Code or the Treasury Regulations promulgated thereunder, or other changes in law, could adversely affect our and/or Partnership’s status as a non-U.S. entity for U.S. federal income tax purposes, our effective income tax rate or future planning based on current law, and any such changes could have prospective or retroactive application to us and/or Partnership. It is presently uncertain whether any such legislative proposals will be enacted into law and, if so, what impact such legislation would have on us. The timing and substance of any such further action is presently uncertain. Any such change of law or regulatory action which could apply retroactively or prospectively, could adversely impact our tax position as well as our financial position and results in a material manner. The precise scope and application of any such regulatory proposals will not be clear until proposed Treasury Regulations are actually issued, and, accordingly, until such regulations are promulgated and fully understood, we cannot be certain that there will be no such impact. In addition, we would be impacted by any changes in tax law in response to corporate tax reforms and other policy initiatives in the U.S. and elsewhere.
16
Moreover, the U.S. Congress, the Organization for Economic Co-operation and Development and other government agencies in jurisdictions where Partnership and/or RBI and its affiliates do business have had an extended focus on issues related to the taxation of multinational corporations. In particular, specific attention has been paid to “base erosion and profit shifting”, where payments are made between affiliates from a jurisdiction with high tax rates to a jurisdiction with lower tax rates. As a result, the tax laws in the countries in which we do business could change on a prospective or retroactive basis, and any such change could adversely affect us.
We may not be able to adequately protect our intellectual property, which could harm the value of our brands and branded products and adversely affect our business.
We depend in large part on the value of our brands, which represent approximately
48%
of the total assets on our balance sheet as of
December 31, 2018
. We believe that our brands are very important to our success and our competitive position. We rely on a combination of trademarks, copyrights, service marks, trade secrets, patents and other intellectual property rights to protect our brands and the respective branded products. The success of our business depends on our continued ability to use our existing trademarks and service marks in order to increase brand awareness and further develop our branded products in both domestic and international markets. We have registered certain trademarks and have other trademark registrations pending in the U.S., Canada and foreign jurisdictions. Not all of the trademarks that our brands currently use have been registered in all of the countries in which we do business, and they may never be registered in all of these countries. We may not be able to adequately protect our trademarks, and our use of these trademarks may result in liability for trademark infringement, trademark dilution or unfair competition. The steps we have taken to protect our intellectual property in Canada, the U.S. and in foreign countries may not be adequate and our proprietary rights could be challenged, circumvented, infringed or invalidated. In addition, the laws of some foreign countries do not protect intellectual property rights to the same extent as the laws of Canada and the U.S.
We may not be able to prevent third parties from infringing on our intellectual property rights, and we may, from time to time, be required to institute litigation to enforce our trademarks or other intellectual property rights or to protect our trade secrets. Further, third parties may assert or prosecute infringement claims against us and we may or may not be able to successfully defend these claims. Any such litigation could result in substantial costs and diversion of resources and could negatively affect our revenue, profitability and prospects regardless of whether we are able to successfully enforce our rights.
We have been, and in the future may be, subject to litigation that could have an adverse effect on our business.
We may from time to time, in the ordinary course of business, be subject to litigation relating to matters including, but not limited to, disputes with franchisees, suppliers, employees, team members, and customers, as well as disputes over our intellectual property. For example, there have recently been multiple class action lawsuits filed against us regarding the no-poaching provision of our BK franchise agreements in the U.S. Active and potential disputes with franchisees could damage our brand reputation and our relationships with our broader franchise base.
Such litigation may be expensive to defend, harm our reputation and divert resources away from our operations and negatively impact our reported earnings. Furthermore, legal proceedings against a franchisee or its affiliates by third parties, whether in the ordinary course of business or otherwise, may include claims against us by virtue of our relationship with the franchisee.
We, or our business partners, may become subject to claims for infringement of intellectual property rights and we may be required to indemnify or defend our business partners from such claims. Should management’s evaluation of our current exposure to legal matters pending against us prove incorrect and such claims are successful, our exposure could exceed expectations and have a material adverse effect on our business, financial condition and results of operations. Although some losses may be covered by insurance, if there are significant losses that are not covered, or there is a delay in receiving insurance proceeds, or the proceeds are insufficient to offset our losses fully, our financial condition or results of operations may be adversely affected.
Changes in regulations may adversely affect restaurant operations and our financial results.
Our franchise and Company restaurants are subject to licensing and regulation by health, sanitation, safety and other agencies in the state, province and/or municipality in which the restaurant is located. Federal, state, provincial and local government authorities may enact laws, rules or regulations that impact restaurant operations and the cost of conducting those operations. In many of our markets, including Canada, the U.S. and Europe, we and our franchisees are subject to increasing regulation regarding our operations which may significantly increase the cost of doing business. In developing markets, we face the risks associated with new and untested laws and judicial systems. If we fail to comply with existing or future laws, we may be subject to governmental fines and sanctions.
We are subject to various provincial, state and foreign laws that govern the offer and sale of a franchise, including in the U.S., to a Federal Trade Commission (“FTC”) rule. Various provincial, state and foreign laws regulate certain aspects of the franchise relationship, including terminations and the refusal to renew franchises. The failure to comply with these laws and regulations in any jurisdiction or to obtain required government approvals could result in a ban or temporary suspension on future franchise sales, fines
17
and penalties or require us to make offers of rescission or restitution, any of which could adversely affect our business and operating results. We could also face lawsuits by franchisees based upon alleged violations of these laws.
Additionally, we, our franchisees and our supply chain are subject to risks and costs arising from the effects of climate change, greenhouse gases, and diminishing energy and water resources. These risks include the increased public focus, including by governmental and nongovernmental organizations, on these and other environmental sustainability matters, such as packaging and waste, animal health and welfare, deforestation and land use. These risks also include the increased pressure to make commitments, set targets or establish additional goals and take actions to meet them. These risks could expose us to market, operational and execution costs or risks. If we are unable to effectively manage the risks associated with our complex regulatory environment, it could have a material adverse effect on our business and financial condition.
The personal information that we collect may be vulnerable to breach, theft or loss that could adversely affect our reputation, results of operation and financial condition.
In the ordinary course of our business, we collect, process, transmit and retain personal information regarding our employees and their families, our franchisees, vendors and consumers, which can include social security numbers, social insurance numbers, banking and tax identification information, health care information and credit card information and our franchisees collect similar information. Some of this personal information is held and managed by our franchisees and certain of our vendors. A third-party may be able to circumvent the security and business controls we use to limit access and use of personal information, which could result in a breach of employee, consumer or franchisee privacy. A major breach, theft or loss of personal information regarding our employees and their families, our franchisees, vendors or consumers that is held by us or our vendors could result in substantial fines, penalties, indemnification claims and potential litigation against us which could negatively impact our results of operations and financial condition. For example, the European Union adopted a new regulation that became effective in May 2018, called the General Data Protection Regulation (“GDPR”), which requires companies to meet certain requirements regarding the handling of personal data. Failure to meet GDPR requirements could result in penalties of up to 4% of worldwide revenue. As a result of legislative and regulatory rules, we may be required to notify the owners of the personal information of any data breaches, which could harm our reputation and financial results, as well as subject us to litigation or actions by regulatory authorities. Furthermore, media or other reports of existing or perceived security vulnerabilities in our systems or those of our franchisees or vendors, even if no breach has been attempted or has occurred, can adversely impact our brand and reputation, and thereby materially impact our business.
Significant capital investments and other expenditures could be required to remedy a breach and prevent future problems, including costs associated with additional security technologies, personnel, experts and credit monitoring services for those whose data has been breached. These costs, which could be material, could adversely impact our results of operations during the period in which they are incurred. The techniques and sophistication used to conduct cyber-attacks and breaches, as well as the sources and targets of these attacks, change frequently and are often not recognized until such attacks are launched or have been in place for a period of time. Accordingly, our expenditures to prevent future cyber-attacks or breaches may not be successful.
Information technology system failures or interruptions or breaches of our network security may interrupt our operations, subject us to increased operating costs and expose us to litigation.
As our reliance on technology has increased, so have the risks posed to our systems. We rely heavily on our computer systems and network infrastructure across operations including, but not limited to, point-of-sale processing at our restaurants, as well as the systems of our third party vendors to whom we outsource certain administrative functions. Despite our implementation of security measures, all of our technology systems are vulnerable to damage, disruption or failures due to physical theft, fire, power loss, telecommunications failure or other catastrophic events, as well as from problems with transitioning to upgraded or replacement systems, internal and external security breaches, denial of service attacks, viruses, worms and other disruptive problems caused by hackers. If any of our technology systems were to fail, and we were unable to recover in a timely way, we could experience an interruption in our operations. Furthermore, if unauthorized access to or use of our systems were to occur, data related to our proprietary information could be compromised. The occurrence of any of these incidents could have a material adverse effect on our future financial condition and results of operations. To the extent that some of our worldwide reporting systems require or rely on manual processes, it could increase the risk of a breach due to human error.
In addition, we receive and maintain certain personal information about our customers, franchisees and employees, and our franchisees receive and maintain similar information. For example, in connection with credit card transactions, we and our franchisees collect and transmit confidential credit card information by way of retail networks. We also maintain important internal data, such as personally identifiable information about our employees and franchisees and information relating to our operation. Our use of personally identifiable information is regulated by applicable laws and regulations. If our security and information systems or those of our franchisees are compromised or our business associates fail to comply with these laws and regulations and this information is obtained by unauthorized persons or used inappropriately, it could adversely affect our reputation, as well as our restaurant operations
18
and results of operations and financial condition. As privacy and information security laws and regulations change, we may incur additional costs to ensure that we remain in compliance.
Further, the standards for systems currently used for transmission and approval of electronic payment transactions, and the technology utilized in electronic payment themselves, all of which can put electronic payment data at risk, are determined and controlled by the payment card industry, not by us. If someone is able to circumvent our data security measures or that of third parties with whom we do business, including our franchisees, he or she could destroy or steal valuable information or disrupt our operations. Any security breach could expose us to risks of data loss, litigation, liability, and could seriously disrupt our operations. Any resulting negative publicity could significantly harm our reputation and could materially and adversely affect our business and operating results.
Finally, a number of our systems and processes are not fully integrated worldwide and, as a result, require us to manually estimate and consolidate certain information that we use to manage our business. To the extent that we are not able to obtain transparency into our operations from our systems, it could impair the ability of our management to react quickly to changes in the business or economic environment.
We outsource certain aspects of our business to third-party vendors which subjects us to risks, including disruptions in our business and increased costs.
We have outsourced certain administrative functions for our business to third-party service providers. We also outsource certain information technology support services and benefit plan administration. In the future, we may outsource other functions to achieve cost savings and efficiencies. If the service providers to which we outsource these functions do not perform effectively, we may not be able to achieve the expected cost savings and may have to incur additional costs in connection with such failure to perform. Depending on the function involved, such failures may also lead to business disruption, transaction errors, processing inefficiencies, the loss of sales and customers, the loss of or damage to intellectual property through security breach, and the loss of sensitive data through security breach or otherwise. Any such damage or interruption could have a material adverse effect on our business, cause us to face significant fines, customer notice obligations or costly litigation, harm our reputation with our customers or prevent us from paying our collective suppliers or employees or receiving payments on a timely basis.
Canadian legislation contains provisions that may have the effect of delaying or preventing a change in control.
We and RBI are Canadian entities.
The Investment Canada Act
requires that a “non-Canadian,” as defined therein, file an application for review with the Minister responsible for the
Investment Canada Act
and obtain approval of the Minister prior to acquiring control of a Canadian business, where prescribed financial thresholds are exceeded. This may discourage a potential acquirer from proposing or completing a transaction that may otherwise present a premium to RBI shareholders or holders of Partnership exchangeable units.
Risks Related to our Partnership Exchangeable Units
3G RBH owns approximately
41%
of the combined voting power with respect to RBI, and its interests may conflict with or differ from the interests of the other shareholders.
3G Restaurant Brands Holdings LP (“3G RBH”) currently owns approximately
92%
of the Partnership exchangeable units and approximately
41%
of the combined voting power with respect to RBI. The interests of 3G RBH and its principals may not always be aligned with the interests of the other holders of Partnership exchangeable units. So long as 3G RBH continues to directly or indirectly own a significant amount of the voting power of RBI, it will continue to be able to strongly influence or effectively control the business decisions of RBI and Partnership. 3G RBH and its principals may have interests that are different from those of the other holders of Partnership exchangeable units, and 3G RBH may exercise its voting and other rights in a manner that may be adverse to the interests of the other holders of Partnership exchangeable units.
In addition, this concentration of ownership could have the effect of delaying or preventing a change in control or otherwise discouraging a potential acquirer from attempting to obtain control of RBI or Partnership, which could cause the market price of RBI’s common shares or Partnership exchangeable units to decline or prevent the shareholders or unitholders from realizing a premium over the market price for their RBI common shares or Partnership exchangeable units.
3G RBH is affiliated with 3G Capital Partners, Ltd. a global investment firm (“3G Capital”). 3G Capital is in the business of making investments in companies and may from time to time in the future acquire or develop controlling interests in businesses engaged in the QSR industry that complement or directly or indirectly compete with certain portions of our business. In addition, 3G Capital may pursue acquisitions or opportunities that may be complementary to our business and, as a result, those acquisition opportunities may not be available to us.
19
The price of our Partnership exchangeable units or RBI common shares may be volatile or may decline regardless of our operating performance.
The market price of Partnership exchangeable units or RBI common shares may fluctuate materially from time to time in response to a number of factors, many of which we cannot control, including those described under “Risk Factors – Risks Related to Our Business”. In addition, the stock market in general has experienced extreme price and volume fluctuations that have often been unrelated or disproportionate to the operating performance of listed companies. These broad market and industry factors may materially harm the market price of Partnership exchangeable units or RBI common shares, regardless of our operating performance. In addition, the price of Partnership exchangeable units or RBI common shares may be dependent upon the valuations and recommendations of the analysts who cover our business, and if our results do not meet the analysts’ forecasts and expectations, the price of our Partnership exchangeable units or RBI common shares could decline as a result of analysts lowering their valuations and recommendations or otherwise. In the past, following periods of volatility in the market, securities class-action litigation has often been instituted against companies. Such litigation, if instituted against us, could result in substantial costs and diversion of management’s attention and resources, which could materially and adversely affect our business, financial condition, results of operations and growth prospects.
Future sales of Partnership exchangeable units or RBI common shares in the public market could cause volatility in the price of our Partnership exchangeable units or cause the price of our Partnership exchangeable units to fall.
Sales of a substantial number of Partnership exchangeable units or RBI common shares in the public market, or the perception that these sales might occur, could depress the market price of Partnership exchangeable units, and could impair our ability or the ability of RBI to raise capital through the sale of additional equity securities.
Certain holders of Partnership exchangeable units and RBI common shares have required and others may require us or RBI to register their Partnership exchangeable units or common shares, as applicable, for resale under the U.S. and Canadian securities laws under the terms of certain separate registration rights agreements between us and the holders of these securities. Registration of those units or shares would allow the holders thereof to immediately resell their Partnership exchangeable units or RBI common shares in the public market. Any such sales, or anticipation thereof, could cause the market price of our Partnership exchangeable units or RBI common shares to decline.
In addition, RBI has registered common shares that are reserved for issuance under the RBI incentive plans.
A shareholder’s percentage ownership in us may be diluted by future issuances of RBI common shares or Partnership exchangeable units, which could reduce the influence of our shareholders and unitholders over matters on which they are entitled to vote.
The board of directors of RBI has the authority, without action or vote of RBI’s shareholders or our unitholders, to issue an unlimited number of additional RBI common shares or Partnership exchangeable units. For example, RBI or Partnership, as applicable, may issue these securities in connection with investments and acquisitions. The number of RBI common shares or Partnership exchangeable units issued in connection with an investment or acquisition could constitute a material portion of the then-outstanding RBI common shares or Partnership exchangeable units, and could materially dilute the ownership of RBI shareholders or our unitholders. Issuances of RBI common shares or Partnership exchangeable units would reduce the influence of holders of RBI common shares and Partnership exchangeable units over matters on which they are entitled to vote.
There is no assurance that we will pay any distributions on our Partnership exchangeable units in the future.
Although the board of directors of RBI declared a cash dividend on the RBI common shares (requiring a corresponding distribution with respect to our Partnership exchangeable units) for each quarter of 2018 and for the first quarter of 2019, any future dividends on the RBI common shares and distributions on Partnership exchangeable units will be determined at the discretion of the board of directors of RBI and will depend upon results of operations, financial condition, contractual restrictions, including the terms of agreements governing our debt and any future indebtedness we may incur, restrictions imposed by applicable law and other factors that the board of directors of RBI deems relevant. Although RBI is targeting a total of $2.00 in declared dividends per RBI common share and distributions per Partnership exchangeable unit for 2019, there is no assurance that RBI will achieve its target total dividend for 2019 and satisfy our debt service and other obligations. Realization of a gain on an investment in RBI common shares and in Partnership exchangeable units will depend on the appreciation of the price of the RBI common shares or the Partnership exchangeable units, which may never occur.
20
An active trading market for Partnership exchangeable units may not be sustained.
Partnership exchangeable units are not listed on a national exchange in the United States. Although Partnership exchangeable units are listed on the Toronto Stock Exchange, an active public market for Partnership exchangeable units may not be sustained, and such market is not as liquid as for RBI common shares. If an active public market is not sustained, it may be difficult for investors who hold Partnership exchangeable units to sell their exchangeable units at a price that is attractive to them, or at all.
Partnership exchangeable units may not trade equally with RBI common shares.
Although now exchangeable, the Partnership exchangeable units and the RBI common shares are distinct securities. The Partnership exchangeable units and RBI common shares will at all times trade separately, and the public market for Partnership exchangeable units is not as liquid as for the RBI common shares. In addition, if a holder of Partnership exchangeable units exercises its exchange right, RBI, in its capacity as the general partner of Partnership and in its sole discretion, may cause Partnership to repurchase each Partnership exchangeable unit submitted for exchange in consideration for cash (in an amount determined in accordance with the terms of the partnership agreement) in lieu of exchanging for common shares. As such, Partnership exchangeable units may not trade equally with RBI common shares, and could trade at a discount to the market price of RBI common shares, which discount could possibly be material.
The exchange of Partnership exchangeable units into RBI common shares is subject to certain restrictions and the value of RBI common shares received in any exchange may fluctuate.
Beginning on December 12, 2015, holders of Partnership exchangeable units became entitled to require Partnership to exchange all or any portion of such holder’s Partnership exchangeable units for RBI common shares at a ratio of one RBI common share for each Partnership exchangeable unit, subject to the right of RBI, in its capacity as the general partner of Partnership and in its sole discretion, to cause Partnership to repurchase the Partnership exchangeable units for cash (in an amount determined in accordance with the terms of the partnership agreement) in lieu of exchanging for RBI common shares.
The RBI common shares for which Partnership exchangeable units may be exchanged may be subject to significant fluctuations in value for many reasons, including:
|
•
|
our operating and financial performance and prospects;
|
|
•
|
general market conditions;
|
|
•
|
the risks described in this report;
|
|
•
|
changes to the competitive landscape in the industries or markets in which we operate;
|
|
•
|
the arrival or departure of key personnel; and
|
|
•
|
speculation in the press or the investment community.
|
If a holder of Partnership exchangeable units elects to exchange his or her Partnership exchangeable units for RBI common shares, the exchange generally will be taxable for Canadian and U.S. federal income tax purposes.
In certain circumstances, a Limited Partner may lose its limited liability status.
The
Limited Partnerships Act
(Ontario) (the “Ontario Limited Partnerships Act”) provides that a limited partner benefits from limited liability unless, in addition to exercising rights and powers as a limited partner, such limited partner takes part in the control of the business of a limited partnership of which such limited partner is a partner. Subject to the provisions of the Ontario Limited Partnerships Act and of similar legislation in other jurisdictions of Canada, the liability of each limited partner for the debts, liabilities and obligations of Partnership will be limited to the limited partner’s capital contribution, plus the limited partner’s share of any undistributed income of Partnership. However, pursuant to the Ontario Limited Partnerships Act, where a limited partner has received the return of all or part of that limited partner’s capital contribution, the limited partner would be liable to Partnership or, where Partnership is dissolved, to its creditors, for any amount, not in excess of the amount of capital contribution returned with interest, necessary to discharge the liabilities of Partnership to all creditors who extended credit or whose claims otherwise arose before the return of the capital contribution. A limited partner holds as trustee for the limited partnership any money or other property that is paid or conveyed to the limited partner as a return of the limited partner’s contribution that is made contrary to the Ontario Limited Partnerships Act.
The limitation of liability conferred under the Ontario Limited Partnerships Act may be ineffective outside Ontario except to the extent it is given extra-territorial recognition or effect by the laws of other jurisdictions. There may also be requirements to be satisfied in each jurisdiction to maintain limited liability. If limited liability is lost, limited partners may be considered to be general partners (and therefore be subject to unlimited liability) in such jurisdiction by creditors and others having claims against Partnership.
21
Item 1B.
Unresolved Staff Comments
None.
Item 2.
Properties
Our corporate headquarters is located in Toronto, Ontario and consists of approximately 65,000 square feet which we lease. Our U.S. headquarters is located in Miami, Florida and consists of approximately 150,000 square feet which we lease. We also lease office property in Switzerland and Singapore. Related to the TH business, we own five distribution centers, two manufacturing plants and three offices throughout Canada. In addition, we lease two offices and one cross-docking facility in Canada and one manufacturing plant in the U.S. In 2018, we announced plans to build two new warehouses in Western Canada and to renovate an existing warehouse in Eastern Canada to facilitate the supply of frozen and refrigerated products in those markets. We expect to complete these projects in 2020.
As of
December 31, 2018
, our restaurant footprint was as follows:
|
TH
|
BK
|
PLK
|
Total
|
||||||||
|
Franchise Restaurants
(1)
|
|||||||||||
|
Sites owned by us and leased to franchisees
|
748
|
|
707
|
|
33
|
|
1,488
|
|
|||
|
Sites leased by us and subleased to franchisees
|
2,823
|
|
927
|
|
46
|
|
3,796
|
|
|||
|
Sites owned/leased directly by franchisees
|
1,268
|
|
16,112
|
|
2,982
|
|
20,362
|
|
|||
|
Total franchise restaurant sites
|
4,839
|
|
17,746
|
|
3,061
|
|
25,646
|
|
|||
|
Company Restaurants
|
|||||||||||
|
Sites owned by us
|
3
|
|
15
|
|
10
|
|
28
|
|
|||
|
Sites leased by us
|
4
|
|
35
|
|
31
|
|
70
|
|
|||
|
Total company restaurant sites
|
7
|
|
50
|
|
41
|
|
98
|
|
|||
|
Total system-wide restaurant sites
|
4,846
|
|
17,796
|
|
3,102
|
|
25,744
|
|
|||
(1) Includes VIE restaurants.
We believe that our existing headquarters and other leased and owned facilities are adequate to meet our current requirements.
Item 3.
Legal Proceedings
From time to time, we are involved in legal proceedings arising in the ordinary course of business relating to matters including, but not limited to, disputes with franchisees, suppliers, employees and customers, as well as disputes over our intellectual property.
On June 19, 2017, a claim was filed in the Ontario Superior Court of Justice against The TDL Group Corp, a subsidiary of RBI, RBI, the Tim Hortons Ad Fund and certain individual defendants. The plaintiff, a franchisee of two Tim Hortons restaurants, seeks to certify a class of all persons who have carried on business as a Tim Hortons franchisee in Canada at any time after December 15, 2014. The claim alleges various causes of action against the defendants in relation to the purported misuse of amounts paid by members of the proposed class to the Tim Hortons Canada advertising fund (the “Ad Fund”). The plaintiff seeks to have the Ad Fund franchisee contributions held in trust for the benefit of members of the proposed class, an accounting of the Ad Fund, as well as damages for breach of contract, breach of trust, breach of the statutory duty of fair dealing, and breach of fiduciary duties.
On October 6, 2017, a claim was filed in the Ontario Superior Court of Justice against the same defendants as named above. The plaintiffs, two franchisees of Tim Hortons restaurants, seek to certify a class of all persons who have carried on business as a Tim Hortons franchisee at any time after March 8, 2017. The claim alleges various causes of action against the defendants in relation to the purported adverse treatment of member and potential member franchisees of the Great White North Franchisee Association. The plaintiffs seek damages for, among other things, breach of contract, breach of the statutory duty of fair dealing, and breach of the franchisees’ statutory right of association.
In connection with these two lawsuits, the court granted our motion to strike the individuals named in the lawsuits, RBI and the Tim Hortons Ad Fund on October 22, 2018. The only defendant that remains in the lawsuits is The TDL Group Corp.
On July 24, 2018, a complaint for declaratory relief was filed against Tim Hortons USA, Inc. (“THUSA”) and Restaurant Brands International Limited Partnership in the Circuit Court of the 11th Judicial Circuit in Miami-Dade County, Florida by Great White North Franchisee Association - USA, Inc., on behalf of its members. The complaint alleges certain breaches of the franchise
22
agreements between THUSA and its franchisees and the implied covenant of good faith and fair dealing, as well as violations of the U.S. franchise rules and the Florida Deceptive and Unfair Trade Practices Act.
On October 5, 2018, a class action complaint was filed against Burger King Worldwide, Inc. (“BKW”) and Burger King Corporation (“BKC”) in the U.S. District Court for the Southern District of Florida by Jarvis Arrington, individually and on behalf of all others similarly situated. On October 18, 2018, a second class action complaint was filed against RBI, BKW and BKC in the U.S. District Court for the Southern District of Florida by Monique Michel, individually and on behalf of all others similarly situated. On October 31, 2018, a third class action complaint was filed against BKC and BKW in the U.S. District Court for the Southern District of Florida by Geneva Blanchard and Tiffany Miller, individually and on behalf of all others similarly situated. On November 2, 2018, a fourth class action complaint was filed against RBI, BKW and BKC in the U.S. District Court for the Southern District of Florida by Sandra Muster, individually and on behalf of all others similarly situated. These complaints allege that the defendants violated Section 1 of the Sherman Act by incorporating an employee no-solicitation and no-hiring clause in the standard form franchise agreement all Burger King franchisees are required to sign. Each plaintiff seeks injunctive relief and damages for himself or herself and other members of the class.
While we currently believe these claims are without merit, we are unable to predict the ultimate outcome of these cases.
Item 4.
Mine Safety Disclosures
Not applicable.
23
Part II
Item 5.
Market for Registrant’s Common Equity, Related Stockholder Matters and Issuer Purchases of Equity Securities
Market for Our Partnership Exchangeable Units
The Partnership exchangeable units trade on the Toronto Stock Exchange (“TSX”) under the ticker symbol “QSP”. RBI’s common shares trade on the New York Stock Exchange (“NYSE”) and TSX under the ticker symbol “QSR”. As of
February 11, 2019
, there were
48
holders of record of Partnership exchangeable units.
Dividend Policy
On
January 22, 2019
, the board of directors of RBI declared a cash dividend of
$0.50
per RBI common share for the first quarter of 2019. The dividend will be paid on
April 3, 2019
to common shareholders of record on
March 15, 2019
. Partnership will also make a distribution in respect of each Partnership exchangeable unit in the amount of
$0.50
per Partnership exchangeable unit, and the record date and payment date for distributions on Partnership exchangeable units are the same as the record date and payment date set forth above. To fund the RBI common share dividend, Partnership will also make a corresponding distribution in respect of the Class A common units (all of which are held by RBI) in an amount equal to the aggregate amount of dividends payable in respect of the RBI common shares.
RBI is targeting a total of $2.00 in declared dividends per common share and distributions in respect of each Partnership exchangeable unit for 2019.
We do not have a formal dividend policy. However, pursuant to the partnership agreement, RBI, as our general partner, must cause us to make distributions on our Class A common units and Partnership exchangeable units, when a dividend has been declared and is payable in respect of RBI common shares.
Issuer Purchases of Equity Securities
During 2018, we received exchange notices representing
10,185,333
Partnership exchangeable units, including
10,020,000
during the fourth quarter of 2018. Pursuant to the terms of the partnership agreement, we satisfied the exchange notices by repurchasing
10,000,000
Partnership exchangeable units for approximately
$561 million
in cash during the fourth quarter and full year of 2018 and exchanging the remaining Partnership exchangeable units for the same number of newly issued RBI common shares. During 2017 and 2016, we received exchange notices representing
9,286,480
and
6,744,244
Partnership exchangeable units, respectively. We satisfied the exchange notices by repurchasing
5,000,000
Partnership exchangeable units for approximately
$330 million
in cash during 2017 and exchanging the remaining Partnership exchangeable units for the same number of newly issued RBI common shares. There were no exchanges for cash in 2016. Pursuant to the terms of the partnership agreement, the purchase price for the Partnership exchangeable units was based on the weighted average trading price of RBI’s common shares on the NYSE for the 20 consecutive trading days ending on the last business day prior to the exchange date. Upon the exchange of Partnership exchangeable units, each such Partnership exchangeable unit was automatically deemed cancelled concurrently with such exchange.
24
Stock Performance Graph
The following graph depicts the total return to the holders of Partnership exchangeable units from December 31, 2014 through December 31, 2018, relative to the performance of the Standard & Poor’s/TSX Composite Index and the Standard & Poor’s/TSX Capped Consumer Discretionary Index, a peer group. December 15, 2014 was the first day of trading on the TSX of Partnership exchangeable units. The graph assumes an investment of $100 in Partnership exchangeable units and each index on December 31, 2014 and the reinvestment of distributions paid since that date. The price performance shown in the graph is not necessarily indicative of future price performance.
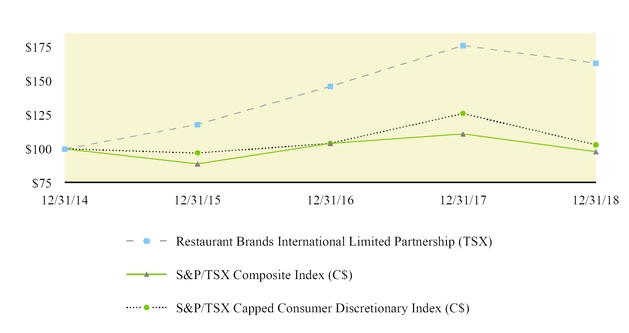
|
12/31/2014
|
12/31/2015
|
12/31/2016
|
12/31/2017
|
12/31/2018
|
|||||||||||||||
|
Restaurant Brands International Limited Partnership (TSX)
|
$
|
100
|
|
$
|
118
|
|
$
|
146
|
|
$
|
176
|
|
$
|
163
|
|
||||
|
S&P/TSX Composite Index (C$)
|
$
|
100
|
|
$
|
89
|
|
$
|
104
|
|
$
|
111
|
|
$
|
98
|
|
||||
|
S&P/TSX Capped Consumer Discretionary Index (C$)
|
$
|
100
|
|
$
|
97
|
|
$
|
104
|
|
$
|
126
|
|
$
|
103
|
|
||||
25
Item 6.
Selected Financial Data
Unless the context otherwise requires, all references to “Partnership”, “we”, “us” or “our” refer to Restaurant Brands International Limited Partnership and its subsidiaries, collectively.
All references to “$” or “dollars” in this report are to the currency of the United States unless otherwise indicated. All references to “Canadian dollars” or “C$” are to the currency of Canada unless otherwise indicated.
Selected Financial Data
The following tables present our selected historical consolidated financial data as of the dates and for each of the periods indicated. The selected historical financial data as of
December 31, 2018
and
December 31, 2017
and for
2018
,
2017
and
2016
have been derived from our audited consolidated financial statements and notes thereto included in this report. The selected historical financial data as of
December 31, 2016
,
December 31, 2015
and December 31, 2014 and for
2015
and
2014
have been derived from our audited consolidated financial statements and notes thereto, which are not included in this report.
The selected historical consolidated financial data presented below contain all normal recurring adjustments that, in the opinion of management, are necessary to present fairly our financial position and results of operations as of and for the periods presented. The selected historical consolidated financial data included below and elsewhere in this report are not necessarily indicative of future results. The information presented in this section should be read in conjunction with
“Management’s Discussion and Analysis of Financial Condition and Results of
Operations”
in Part II, Item 7 and “
Financial Statements and Supplementary
Data
” in Part II, Item 8 of this report.
|
2018
|
2017(a)
|
2016
|
2015
|
2014(b)
|
|||||||||||||||
|
|
(In millions, except per share data)
|
||||||||||||||||||
|
Statement of Operations Data:
|
|||||||||||||||||||
|
Revenues:
|
|||||||||||||||||||
|
Sales
|
$
|
2,355
|
|
$
|
2,390
|
|
$
|
2,205
|
|
$
|
2,169
|
|
$
|
167
|
|
||||
|
Franchise and property revenues
|
3,002
|
|
2,186
|
|
1,941
|
|
1,883
|
|
1,031
|
|
|||||||||
|
Total revenues
|
5,357
|
|
4,576
|
|
4,146
|
|
4,052
|
|
1,198
|
|
|||||||||
|
Income from operations (c)
|
1,917
|
|
1,735
|
|
1,667
|
|
1,192
|
|
181
|
|
|||||||||
|
Net income (loss) (c)
|
$
|
1,144
|
|
$
|
1,235
|
|
$
|
956
|
|
$
|
512
|
|
$
|
(269
|
)
|
||||
|
Earnings (loss) per unit/share - Basic:
|
|||||||||||||||||||
|
Class A common units
|
$
|
3.03
|
|
$
|
3.10
|
|
$
|
1.71
|
|
$
|
0.51
|
|
$
|
(1.63
|
)
|
||||
|
Partnership exchangeable units
|
$
|
2.46
|
|
$
|
2.59
|
|
$
|
1.48
|
|
$
|
0.51
|
|
$
|
(1.63
|
)
|
||||
|
Common shares
|
$
|
—
|
|
$
|
—
|
|
$
|
—
|
|
$
|
—
|
|
$
|
(0.20
|
)
|
||||
|
Earnings (loss) per unit/share - Diluted:
|
|||||||||||||||||||
|
Class A common units
|
$
|
3.03
|
|
$
|
3.10
|
|
$
|
1.71
|
|
$
|
0.51
|
|
$
|
(1.63
|
)
|
||||
|
Partnership exchangeable units
|
$
|
2.46
|
|
$
|
2.59
|
|
$
|
1.48
|
|
$
|
0.51
|
|
$
|
(1.63
|
)
|
||||
|
Common shares
|
$
|
—
|
|
$
|
—
|
|
$
|
—
|
|
$
|
—
|
|
$
|
(0.20
|
)
|
||||
|
Distributions/dividends per common unit/share
|
|||||||||||||||||||
|
Class A common units
|
$
|
2.23
|
|
$
|
0.92
|
|
$
|
0.72
|
|
$
|
0.44
|
|
$
|
—
|
|
||||
|
Partnership exchangeable units
|
$
|
1.80
|
|
$
|
0.78
|
|
$
|
0.62
|
|
$
|
0.44
|
|
$
|
—
|
|
||||
|
Common shares
|
$
|
—
|
|
$
|
—
|
|
$
|
—
|
|
$
|
—
|
|
$
|
0.30
|
|
||||
|
Other Financial Data:
|
|||||||||||||||||||
|
Net cash provided by (used for) operating activities
|
$
|
1,165
|
|
$
|
1,431
|
|
$
|
1,214
|
|
$
|
1,207
|
|
$
|
294
|
|
||||
|
Net cash provided by (used for) investing activities
|
(44
|
)
|
(858
|
)
|
27
|
|
(62
|
)
|
(7,791
|
)
|
|||||||||
|
Net cash provided by (used for) financing activities
|
(1,285
|
)
|
(936
|
)
|
(591
|
)
|
(2,115
|
)
|
8,566
|
|
|||||||||
26
|
|
December 31,
|
||||||||||||||||||
|
|
2018
|
2017(a)
|
2016
|
2015
|
2014(b)
|
||||||||||||||
|
|
(In millions)
|
||||||||||||||||||
|
Balance Sheet Data:
|
|||||||||||||||||||
|
Cash and cash equivalents
|
$
|
913
|
|
$
|
1,097
|
|
$
|
1,436
|
|
$
|
788
|
|
$
|
1,838
|
|
||||
|
Total assets
|
20,141
|
|
21,224
|
|
19,125
|
|
18,409
|
|
21,343
|
|
|||||||||
|
Total debt and capital lease obligations
|
12,140
|
|
12,123
|
|
8,723
|
|
8,722
|
|
10,199
|
|
|||||||||
|
Total liabilities
|
16,523
|
|
16,663
|
|
12,339
|
|
12,198
|
|
13,706
|
|
|||||||||
|
Partnership preferred units
|
—
|
|
—
|
|
3,297
|
|
3,297
|
|
3,297
|
|
|||||||||
|
Total equity
|
3,618
|
|
4,561
|
|
3,489
|
|
2,913
|
|
4,340
|
|
|||||||||
|
(a)
|
On March 27, 2017, we acquired PLK. Statement of operations data and other financial data includes PLK results from the acquisition date through December 31, 2017. Balance sheet data includes PLK data as of December 31, 2017.
|
|
(b)
|
On December 12, 2014, we acquired TH. Statement of operations data and other financial data include TH results from the acquisition date through December 28, 2014, the end of TH's 2014 fiscal year. Balance sheet data includes TH data as of December 28, 2014.
|
|
(c)
|
Amount includes
$10 million
of PLK Transaction costs,
$25 million
of Corporate restructuring and tax advisory fees and
$20 million
of Office centralization and relocation costs for
2018
. Amount includes $62 million of PLK Transaction costs and $2 million of Corporate restructuring and tax advisory fees for 2017. Amount includes $16 million of integration costs for 2016. Amount includes $117 million of TH transaction and restructuring costs and $1 million of acquisition accounting impact on cost of sales for 2015. Amount includes $125 million of TH transaction and restructuring costs, $12 million of acquisition accounting impact on cost of sales and $291 million of net losses on derivatives for 2014.
|
Operating Metrics
We evaluate our restaurants and assess our business based on the following operating metrics:
|
•
|
System-wide sales growth refers to the percentage change in sales at all franchise restaurants and Company restaurants in one period from the same period in the prior year.
|
|
•
|
Comparable sales refers to the percentage change in restaurant sales in one period from the same prior year period for restaurants that have been open for 13 months or longer for TH and BK and 17 months or longer for PLK.
|
|
•
|
System-wide sales growth and comparable sales are measured on a constant currency basis, which means the results exclude the effect of foreign currency translation (“FX Impact”). For system-wide sales growth and comparable sales, we calculate the FX Impact by translating prior year results at current year monthly average exchange rates.
|
|
•
|
Unless otherwise stated, system-wide sales growth, system-wide sales and comparable sales are presented on a system-wide basis, which means they include franchise restaurants and Company restaurants. System-wide results are driven by our franchise restaurants, as approximately 100% of system-wide restaurants are franchised for each of our brands. Franchise sales represent sales at all franchise restaurants and are revenues to our franchisees. We do not record franchise sales as revenues; however, our royalty revenues are calculated based on a percentage of franchise sales.
|
|
•
|
Net restaurant growth refers to the net increase in restaurant count (openings, net of closures) over a trailing twelve month period, divided by the restaurant count at the beginning of the trailing twelve month period.
|
27
The following table presents our operating metrics for each of the periods indicated, which have been derived from our internal records. The system-wide sales growth, system-wide sales, comparable sales and net restaurant growth presented for Popeyes are calculated using the historical information from Popeyes when it was under previous ownership for the periods prior to the acquisition date of March 27, 2017. Consequently, these metrics for Popeyes, as well as consolidated system-wide sales and consolidated net restaurant growth, may not necessarily reflect actual data as if Popeyes had been included in our results for the full year 2017 and 2016. We evaluate our restaurants and assess our business based on these operating metrics. These metrics may differ from those used by other companies in our industry who may define these metrics differently.
|
2018
|
2017
|
2016
|
|||||||||
|
System-wide sales growth
|
|||||||||||
|
Tim Hortons
|
2.4
|
%
|
3.0
|
%
|
5.2
|
%
|
|||||
|
Burger King
|
8.9
|
%
|
10.1
|
%
|
7.8
|
%
|
|||||
|
Popeyes (a)(b)
|
8.9
|
%
|
5.1
|
%
|
7.4
|
%
|
|||||
|
System-wide sales ($ in millions)
|
|||||||||||
|
Tim Hortons
|
$
|
6,869
|
|
$
|
6,717
|
|
$
|
6,405
|
|
||
|
Burger King
|
$
|
21,624
|
|
$
|
20,075
|
|
$
|
18,209
|
|
||
|
Popeyes (a)(b)
|
$
|
3,732
|
|
$
|
3,512
|
|
$
|
3,287
|
|
||
|
Consolidated
|
$
|
32,225
|
|
$
|
30,304
|
|
$
|
27,901
|
|
||
|
Comparable sales
|
|||||||||||
|
Tim Hortons
|
0.6
|
%
|
(0.1
|
)%
|
2.5
|
%
|
|||||
|
Burger King
|
2.0
|
%
|
3.1
|
%
|
2.3
|
%
|
|||||
|
Popeyes (a)(b)
|
1.6
|
%
|
(1.5
|
)%
|
1.7
|
%
|
|||||
|
Net restaurant growth
|
|||||||||||
|
Tim Hortons
|
2.1
|
%
|
2.9
|
%
|
4.5
|
%
|
|||||
|
Burger King
|
6.1
|
%
|
6.5
|
%
|
4.9
|
%
|
|||||
|
Popeyes (a)(c)
|
7.3
|
%
|
6.1
|
%
|
6.2
|
%
|
|||||
|
Consolidated
|
5.5
|
%
|
5.8
|
%
|
5.0
|
%
|
|||||
|
System Restaurant count
|
|||||||||||
|
Tim Hortons
|
4,846
|
|
4,748
|
|
4,613
|
|
|||||
|
Burger King
|
17,796
|
|
16,767
|
|
15,738
|
|
|||||
|
Popeyes (a)(c)
|
3,102
|
|
2,892
|
|
2,725
|
|
|||||
|
Consolidated
|
25,744
|
|
24,407
|
|
23,076
|
|
|||||
|
(a)
|
PLK 2016 annual figures are shown for informational purposes only.
|
|
(b)
|
For 2017, PLK comparable sales, system-wide sales growth and system-wide sales are for the period from December 26, 2016 through December 31, 2017. Comparable sales and system-wide sales growth are calculated using the same period in the prior year (December 26, 2015 through December 31, 2016). Results for 2016 are consistent with PLK's former fiscal calendar. Consequently, results for 2018 may not be comparable to those of 2017 and 2016.
|
|
(c)
|
For 2017, net restaurant growth is for the period from December 26, 2016 through December 31, 2017. Results for 2016 are consistent with PLK's former fiscal calendar. Restaurant count is as of December 31, 2018 for 2018, December 31, 2017 for 2017, and as of December 25, 2016 for 2016, inclusive of temporary closures.
|
28
Item 7.
Management’s Discussion and Analysis of Financial Condition and
Results of Operations
You should read the following discussion together with Part II, Item 6 “Selected Financial Data” of our Annual Report for the year ended
December 31, 2018
(our “Annual Report”) and our audited Consolidated Financial Statements and the related notes thereto included in Part II, Item 8 “Financial Statements and Supplementary Data” of our Annual Report.
The following discussion includes information regarding future financial performance and plans, targets, aspirations, expectations, and objectives of management, which constitute forward-looking statements within the meaning of the Private Securities Litigation Reform Act of 1995 and forward-looking information within the meaning of the Canadian securities laws as described in further detail under “Special Note Regarding Forward-Looking Statements” that is set forth below. Actual results may differ materially from the results discussed in the forward-looking statements because of a number of risks and uncertainties, including the matters discussed in the “Special Note Regarding Forward-Looking Statements” below. In addition, please refer to the risks set forth under the caption “Risk Factors” included in our Annual Report for a further description of risks and uncertainties affecting our business and financial results. Historical trends should not be taken as indicative of future operations and financial results. Other than as required under the U.S. Federal securities laws or the Canadian securities laws, we do not assume a duty to update these forward-looking statements, whether as a result of new information, subsequent events or circumstances, changes in expectations or otherwise.
We prepare our financial statements in accordance with accounting principles generally accepted in the United States (“U.S. GAAP” or “GAAP”). However, this Management’s Discussion and Analysis of Financial Condition and Results of Operations also contains certain non-GAAP financial measures to assist readers in understanding our performance. Non-GAAP financial measures either exclude or include amounts that are not reflected in the most directly comparable measure calculated and presented in accordance with GAAP. Where non-GAAP financial measures are used, we have provided the most directly comparable measures calculated and presented in accordance with U.S. GAAP, a reconciliation to GAAP measures and a discussion of the reasons why management believes this information is useful to it and may be useful to investors.
Unless the context otherwise requires, all references in this section to “Partnership,” “we,” “us,” or “our” are to Restaurant Brands International Limited Partnership and its subsidiaries, collectively.
Overview
We are a limited partnership originally formed to serve as the indirect holding company for Tim Hortons and its consolidated subsidiaries and for Burger King and its consolidated subsidiaries. On March 27, 2017, we acquired Popeyes Louisiana Kitchen, Inc. and its consolidated subsidiaries. We were formed on August 25, 2014 as a general partnership and registered on October 27, 2014 as a limited partnership in accordance with the laws of the Province of Ontario generally, and the
Ontario Limited Partnerships Act
specifically. We are a subsidiary of RBI, our sole general partner. We are one of the world’s largest quick service restaurant (“QSR”) companies with more than
$30 billion
in system-wide sales and over
25,000
restaurants in more than
100
countries and U.S. territories as of
December 31, 2018
. Our
Tim Hortons
®,
Burger King
®, and
Popeyes
® brands have similar franchise business models with complementary daypart mixes and product platforms. Our three iconic brands are managed independently while benefiting from global scale and sharing of best practices.
Tim Hortons restaurants are quick service restaurants with a menu that includes premium blend coffee, tea, espresso-based hot and cold specialty drinks, fresh baked goods, including donuts,
Timbits
®, bagels, muffins, cookies and pastries, grilled paninis, classic sandwiches, wraps, soups and more. Burger King restaurants are quick service restaurants that feature flame-grilled hamburgers, chicken and other specialty sandwiches, french fries, soft drinks and other affordably-priced food items. Popeyes restaurants are quick service restaurants featuring a unique “Louisiana” style menu that includes spicy chicken, chicken tenders, fried shrimp and other seafood, red beans and rice, and other regional items.
We have three operating and reportable segments: (1) Tim Hortons (“TH”); (2) Burger King (“BK”); and (3) Popeyes Louisiana Kitchen (“PLK”). Our business generates revenue from the following sources: (i) franchise revenues, consisting primarily of royalties based on a percentage of sales reported by franchise restaurants and franchise fees paid by franchisees; (ii) property revenues from properties we lease or sublease to franchisees; and (iii) sales at restaurants owned by us (“Company restaurants”). In addition, our Tim Hortons business generates revenue from sales to franchisees related to our supply chain operations, including manufacturing, procurement, warehousing and distribution, as well as sales to retailers.
29
Recent Events and Factors Affecting Comparability
Transition to New Revenue Recognition Accounting Standard
We transitioned to Accounting Standards Codification Topic 606,
Revenue from Contracts with Customers
(“ASC 606”), effective January 1, 2018 using the modified retrospective method. Our consolidated financial statements for 2018 reflect the application of ASC 606 guidance, while our consolidated financial statements for 2017 and 2016 were prepared under the guidance of previously applicable accounting standards.
The most significant effects of this transition that affect comparability of our results of operations between 2018 and previous periods include the following:
|
•
|
Franchise fee revenue for franchise agreements entered into subsequent to the acquisitions of BK in 2010, TH in 2014 and PLK in 2017 are deferred and amortized over the franchise agreement term beginning in 2018 compared to upfront recognition in 2017 and 2016 under previously applicable accounting standards. Franchise fees associated with acquired franchise agreements are not included in franchise fee revenue under ASC 606. Consequently, we expect the impact to be greater in those periods in which more openings occur.
|
|
•
|
Advertising fund contributions and advertising fund expenses are reflected on a gross basis in our 2018 statement of operations and there may be a difference in timing for recognition of advertising fund contributions and advertising fund expenses beginning in 2018. Under previously applicable accounting standards, our statement of operations did not reflect gross advertising fund contributions and advertising fund expenses and temporary net differences between contributions and expenses due to the timing of expenses were reflected as current assets or current liabilities on our consolidated balance sheet.
|
|
•
|
The portion of gift cards sold to customers which are never redeemed is commonly referred to as gift card breakage. Under ASC 606, we recognize gift card breakage income proportionately as each gift card is redeemed using an estimated breakage rate based on our historical experience. Under previously applicable accounting standards, we recognized gift card breakage income for each gift card’s remaining balance when redemption of that balance was deemed remote. This change impacts the timing of when gift card breakage income is recognized.
|
Please refer to Note 16,
Revenue Recognition
, to the accompanying audited consolidated financial statements for further details of the effects of this change in accounting principle.
Tax Reform
In December 2017, the U.S. government enacted comprehensive tax legislation commonly referred to as the Tax Cuts and Jobs Act (the “Tax Act”) that significantly revises the U.S. tax code generally effective January 1, 2018 by, among other changes, lowering the corporate income tax rate from 35% to 21%, limiting deductibility of interest expense and performance based incentive compensation and implementing a modified territorial tax system. As a Canadian entity, we generally would be classified as a foreign entity (and, therefore, a non-U.S. tax resident) under general rules of U.S. federal income taxation. However, we have subsidiaries subject to U.S. federal income taxation and therefore the Tax Act impacted our consolidated results of operations in 2017 and 2018, and is expected to continue to impact our consolidated results of operations in future periods.
The impacts to our consolidated statements of operations consist of the following (“Tax Act Impact”):
|
•
|
A provisional benefit of
$420 million
recorded in our provision from income taxes for 2017 and a favorable adjustment of
$9 million
recorded for 2018, as a result of the remeasurement of net deferred tax liabilities.
|
|
•
|
Provisional charges of
$103 million
recorded in 2017 and a favorable adjustment of
$3 million
recorded in 2018, related to certain deductions allowed to be carried forward before the Tax Act, which potentially may not be carried forward and deductible under the Tax Act.
|
|
•
|
A provisional estimate for a one-time transitional repatriation tax on unremitted foreign earnings (the “Transition Tax”) of
$119 million
recorded in 2017, most of which had been previously accrued with respect to certain undistributed foreign earnings, and a favorable adjustment of
$15 million
(primarily related to utilization of foreign tax credits) recorded in 2018.
|
In accordance with Staff Accounting Bulletin No. 118 issued by the staff of the Securities and Exchange Commission (the “SEC”), adjustments to provisional amounts were recorded as discrete items in the provision for income taxes in 2018, the period in which those adjustments became reasonably estimable, as described above.
30
We recorded
$25 million
during 2018 and
$2 million
during 2017 of costs associated with corporate restructuring initiatives and professional advisory and consulting services related to the interpretation and implementation of the Tax Act (“Corporate restructuring and tax advisory fees”). We expect to continue to incur additional Corporate restructuring and tax advisory fees related to the Tax Act in 2019.
Popeyes Acquisition and PLK Transaction Costs
As described in Note 3 to the accompanying consolidated financial statements, on March 27, 2017, we completed the acquisition of Popeyes for total consideration of
$1,655 million
(the “Popeyes Acquisition”). The consideration was funded through (1) cash on hand of approximately
$355 million
and (2)
$1,300 million
from incremental borrowings under our Term Loan Facility – see Note 9 to the accompanying consolidated financial statements included in Part II, Item 8 “Financial Statements and Supplementary Data” of our Annual Report. Our 2018 consolidated statements of operations includes PLK revenues and segment income for a full fiscal year. Our 2017 consolidated statements of operations includes PLK revenues and segment income from March 28, 2017 through December 31, 2017.
In connection with the Popeyes Acquisition, we incurred certain non-recurring fees and expenses (“PLK Transaction costs”) totaling
$10 million
during 2018 and
$62 million
during 2017 consisting primarily of professional fees and compensation related expenses, all of which are classified as selling, general and administrative expenses in the consolidated statements of operations. We do not expect to incur any additional PLK Transaction costs.
Office Centralization and Relocation Costs
In connection with the centralization and relocation of our Canadian and U.S. restaurant support centers to new offices in Toronto, Ontario, and Miami, Florida, respectively, we incurred certain non-operational expenses (“Office centralization and relocation costs”) totaling
$20 million
during 2018 consisting primarily of duplicate rent expense, moving costs, and relocation-driven compensation expenses, which are classified as selling, general and administrative expenses in the consolidated statement of operations.
Integration Costs
In connection with the implementation of initiatives to integrate the back-office processes of TH and BK to enhance efficiencies, we incurred
$16 million
related to these initiatives during 2016, primarily consisting of professional fees.
31
Results of Operations
Tabular amounts in millions of U.S. dollars unless noted otherwise. Segment income may not calculate exactly due to rounding.
|
|
|
|
|
2018 vs. 2017
|
2017 vs. 2016
|
||||||||||||||||||||||||||||||
|
Consolidated
|
2018
|
2017
|
2016
|
Variance
|
FX
Impact (a) |
Variance
Excluding FX Impact |
Variance
|
FX
Impact |
Variance
Excluding FX Impact |
||||||||||||||||||||||||||
|
|
|
|
|
Favorable / (Unfavorable)
|
|||||||||||||||||||||||||||||||
|
Revenues:
|
|||||||||||||||||||||||||||||||||||
|
Sales
|
$
|
2,355
|
|
$
|
2,390
|
|
$
|
2,205
|
|
$
|
(35
|
)
|
$
|
1
|
|
$
|
(36
|
)
|
$
|
185
|
|
$
|
40
|
|
$
|
145
|
|
||||||||
|
Franchise and property revenues
|
3,002
|
|
2,186
|
|
1,941
|
|
816
|
|
(10
|
)
|
826
|
|
245
|
|
18
|
|
227
|
|
|||||||||||||||||
|
Total revenues
|
5,357
|
|
4,576
|
|
4,146
|
|
781
|
|
(9
|
)
|
790
|
|
430
|
|
58
|
|
372
|
|
|||||||||||||||||
|
Operating costs and expenses:
|
|||||||||||||||||||||||||||||||||||
|
Cost of sales
|
1,818
|
|
1,850
|
|
1,727
|
|
32
|
|
—
|
|
32
|
|
(123
|
)
|
(31
|
)
|
(92
|
)
|
|||||||||||||||||
|
Franchise and property expenses
|
422
|
|
478
|
|
454
|
|
56
|
|
—
|
|
56
|
|
(24
|
)
|
(6
|
)
|
(18
|
)
|
|||||||||||||||||
|
Selling, general and administrative expenses
|
1,214
|
|
416
|
|
319
|
|
(798
|
)
|
—
|
|
(798
|
)
|
(97
|
)
|
(8
|
)
|
(89
|
)
|
|||||||||||||||||
|
(Income) loss from equity method investments
|
(22
|
)
|
(12
|
)
|
(20
|
)
|
10
|
|
—
|
|
10
|
|
(8
|
)
|
—
|
|
(8
|
)
|
|||||||||||||||||
|
Other operating expenses (income), net
|
8
|
|
109
|
|
(1
|
)
|
101
|
|
(5
|
)
|
106
|
|
(110
|
)
|
—
|
|
(110
|
)
|
|||||||||||||||||
|
Total operating costs and expenses
|
3,440
|
|
2,841
|
|
2,479
|
|
(599
|
)
|
(5
|
)
|
(594
|
)
|
(362
|
)
|
(45
|
)
|
(317
|
)
|
|||||||||||||||||
|
Income from operations
|
1,917
|
|
1,735
|
|
1,667
|
|
182
|
|
(14
|
)
|
196
|
|
68
|
|
13
|
|
55
|
|
|||||||||||||||||
|
Interest expense, net
|
535
|
|
512
|
|
467
|
|
(23
|
)
|
—
|
|
(23
|
)
|
(45
|
)
|
—
|
|
(45
|
)
|
|||||||||||||||||
|
Loss on early extinguishment of debt
|
—
|
|
122
|
|
—
|
|
122
|
|
—
|
|
122
|
|
(122
|
)
|
—
|
|
(122
|
)
|
|||||||||||||||||
|
Income before income taxes
|
1,382
|
|
1,101
|
|
1,200
|
|
281
|
|
(14
|
)
|
295
|
|
(99
|
)
|
13
|
|
(112
|
)
|
|||||||||||||||||
|
Income tax (benefit) expense
|
238
|
|
(134
|
)
|
244
|
|
(372
|
)
|
(12
|
)
|
(360
|
)
|
378
|
|
(1
|
)
|
379
|
|
|||||||||||||||||
|
Net income
|
$
|
1,144
|
|
$
|
1,235
|
|
$
|
956
|
|
$
|
(91
|
)
|
$
|
(26
|
)
|
$
|
(65
|
)
|
$
|
279
|
|
$
|
12
|
|
$
|
267
|
|
||||||||
|
(a)
|
We calculate the FX Impact by translating prior year results at current year monthly average exchange rates. We analyze these results on a constant currency basis as this helps identify underlying business trends, without distortion from the effects of currency movements.
|
32
|
|
|
|
|
2018 vs. 2017
|
2017 vs. 2016
|
||||||||||||||||||||||||||||||
|
TH Segment
|
2018
|
2017
|
2016
|
Variance
|
FX
Impact (a) |
Variance
Excluding FX Impact |
Variance
|
FX
Impact |
Variance
Excluding FX Impact |
||||||||||||||||||||||||||
|
|
|
|
|
Favorable / (Unfavorable)
|
|||||||||||||||||||||||||||||||
|
Revenues:
|
|||||||||||||||||||||||||||||||||||
|
Sales
|
$
|
2,201
|
|
$
|
2,229
|
|
$
|
2,112
|
|
$
|
(28
|
)
|
$
|
1
|
|
$
|
(29
|
)
|
$
|
117
|
|
$
|
39
|
|
$
|
78
|
|
||||||||
|
Franchise and property revenues
|
1,091
|
|
926
|
|
889
|
|
165
|
|
(2
|
)
|
167
|
|
37
|
|
17
|
|
20
|
|
|||||||||||||||||
|
Total revenues
|
3,292
|
|
3,155
|
|
3,001
|
|
137
|
|
(1
|
)
|
138
|
|
154
|
|
56
|
|
98
|
|
|||||||||||||||||
|
Cost of sales
|
1,688
|
|
1,707
|
|
1,647
|
|
19
|
|
—
|
|
19
|
|
(60
|
)
|
(30
|
)
|
(30
|
)
|
|||||||||||||||||
|
Franchise and property expenses
|
279
|
|
336
|
|
317
|
|
57
|
|
1
|
|
56
|
|
(19
|
)
|
(6
|
)
|
(13
|
)
|
|||||||||||||||||
|
Segment SG&A
|
314
|
|
91
|
|
79
|
|
(223
|
)
|
—
|
|
(223
|
)
|
(12
|
)
|
(1
|
)
|
(11
|
)
|
|||||||||||||||||
|
Segment depreciation and amortization (b)
|
102
|
|
103
|
|
102
|
|
1
|
|
1
|
|
—
|
|
(1
|
)
|
(1
|
)
|
—
|
|
|||||||||||||||||
|
Segment income (c)
|
1,127
|
|
1,136
|
|
1,072
|
|
(9
|
)
|
(1
|
)
|
(8
|
)
|
64
|
|
20
|
|
44
|
|
|||||||||||||||||
|
(b)
|
Segment depreciation and amortization consists of depreciation and amortization included in cost of sales and franchise and property expenses.
|
|
(c)
|
TH segment income includes
$15 million
,
$13 million
and
$12 million
of cash distributions received from equity method investments for
2018
,
2017
and
2016
, respectively.
|
|
|
|
|
|
2018 vs. 2017
|
2017 vs. 2016
|
||||||||||||||||||||||||||||||
|
BK Segment
|
2018
|
2017
|
2016
|
Variance
|
FX
Impact (a) |
Variance
Excluding FX Impact |
Variance
|
FX
Impact |
Variance
Excluding FX Impact |
||||||||||||||||||||||||||
|
|
|
|
|
Favorable / (Unfavorable)
|
|||||||||||||||||||||||||||||||
|
Revenues:
|
|||||||||||||||||||||||||||||||||||
|
Sales
|
$
|
75
|
|
$
|
94
|
|
$
|
93
|
|
$
|
(19
|
)
|
$
|
—
|
|
$
|
(19
|
)
|
$
|
1
|
|
$
|
1
|
|
$
|
—
|
|
||||||||
|
Franchise and property revenues
|
1,576
|
|
1,125
|
|
1,052
|
|
451
|
|
(7
|
)
|
458
|
|
73
|
|
1
|
|
72
|
|
|||||||||||||||||
|
Total revenues
|
1,651
|
|
1,219
|
|
1,145
|
|
432
|
|
(7
|
)
|
439
|
|
74
|
|
2
|
|
72
|
|
|||||||||||||||||
|
Cost of sales
|
67
|
|
86
|
|
80
|
|
19
|
|
—
|
|
19
|
|
(6
|
)
|
(1
|
)
|
(5
|
)
|
|||||||||||||||||
|
Franchise and property expenses
|
131
|
|
135
|
|
137
|
|
4
|
|
(1
|
)
|
5
|
|
2
|
|
—
|
|
2
|
|
|||||||||||||||||
|
Segment SG&A
|
577
|
|
143
|
|
160
|
|
(434
|
)
|
(2
|
)
|
(432
|
)
|
17
|
|
(1
|
)
|
18
|
|
|||||||||||||||||
|
Segment depreciation and amortization (b)
|
48
|
|
47
|
|
48
|
|
(1
|
)
|
(1
|
)
|
—
|
|
1
|
|
(1
|
)
|
2
|
|
|||||||||||||||||
|
Segment income (d)
|
928
|
|
903
|
|
816
|
|
25
|
|
(9
|
)
|
34
|
|
87
|
|
1
|
|
86
|
|
|||||||||||||||||
|
(d)
|
BK segment income includes
$5 million
and
$1 million
of cash distributions received from equity method investments for
2018
and
2017
, respectively.
|
|
2018 vs. 2017
|
|||||||||||||||||||||
|
PLK Segment
|
2018
|
2017(e)
|
Variance
|
FX
Impact (a) |
Variance
Excluding FX Impact |
||||||||||||||||
|
|
Favorable / (Unfavorable)
|
||||||||||||||||||||
|
Revenues:
|
|||||||||||||||||||||
|
Sales
|
$
|
79
|
|
$
|
67
|
|
$
|
12
|
|
$
|
—
|
|
$
|
12
|
|
||||||
|
Franchise and property revenues
|
335
|
|
135
|
|
200
|
|
(1
|
)
|
201
|
|
|||||||||||
|
Total revenues
|
414
|
|
202
|
|
212
|
|
(1
|
)
|
213
|
|
|||||||||||
|
Cost of sales
|
63
|
|
57
|
|
(6
|
)
|
—
|
|
(6
|
)
|
|||||||||||
|
Franchise and property expenses
|
12
|
|
7
|
|
(5
|
)
|
—
|
|
(5
|
)
|
|||||||||||
|
Segment SG&A
|
193
|
|
40
|
|
(153
|
)
|
—
|
|
(153
|
)
|
|||||||||||
|
Segment depreciation and amortization (b)
|
10
|
|
9
|
|
(1
|
)
|
—
|
|
(1
|
)
|
|||||||||||
|
Segment income
|
157
|
|
107
|
|
50
|
|
(1
|
)
|
51
|
|
|||||||||||
|
(e)
|
PLK revenues and segment income from the acquisition date of March 27, 2017 through December 31, 2017 are included in our consolidated statement of operations for 2017.
|
33
Comparable Sales
TH comparable sales were
0.6%
for 2018, including Canada comparable sales of
0.9%
. BK comparable sales were
2.0%
for 2018, including U.S. comparable sales of
1.4%
. PLK comparable sales were
1.6%
for 2018, including U.S. comparable sales of
0.9%
.
Sales and Cost of Sales
Sales include TH supply chain sales and sales from Company restaurants. TH supply chain sales represent sales of products, supplies and restaurant equipment, as well as sales to retailers. In periods prior to January 1, 2018, we classified revenues derived from sales of equipment packages at the establishment of a restaurant and in connection with renewal or renovation as franchise and property revenues. Sales from Company restaurants, including sales by our consolidated TH Restaurant VIEs, represent restaurant-level sales to our guests.
Cost of sales includes costs associated with the management of our TH supply chain, including cost of goods, direct labor and depreciation, as well as the cost of products sold to retailers. Cost of sales also includes food, paper and labor costs of Company restaurants. In periods prior to January 1, 2018, we classified costs related to sales of equipment packages at the establishment of a restaurant and in connection with renewal or renovation as franchise and property expenses.
During 2018, the decrease in sales was driven by a decrease of $29 million in our TH segment and a decrease of $19 million in our BK segment, partially offset by an increase of $12 million in our PLK segment, primarily as a result of including PLK for a full year in 2018 compared to nine months in 2017, and a favorable FX Impact of $1 million. The decrease in our TH segment was driven by a $48 million decrease in our TH Company restaurant revenue, primarily from the conversion of Restaurant VIEs to franchise restaurants, partially offset by a $19 million increase in supply chain sales. The increase in supply chain sales was primarily due to the reclassification of revenue from the sales of equipment packages from franchise and property revenues to sales beginning January 1, 2018, partially offset by the non-recurrence of the roll-out of espresso equipment and related espresso inventory in 2017. The decrease in our BK segment was due to Company restaurant refranchisings in prior periods.
During 2017, the increase in sales was driven by a $78 million increase in our TH segment, the inclusion of $67 million from our PLK segment, and a $40 million favorable FX Impact. The increase in our TH segment was driven by a $135 million increase in supply chain sales primarily reflecting growth in system-wide sales and the launch of our espresso-based beverage platform, partially offset by a $57 million decrease in our TH Company restaurant revenue, primarily from the conversion of Restaurant VIEs to franchise restaurants.
During 2018, the decrease in cost of sales was driven primarily by a decrease of $19 million in our TH segment and a decrease of $19 million in our BK segment, partially offset by an increase of $6 million in our PLK segment, primarily as a result of including PLK for a full year in 2018 compared to nine months in 2017. The decrease in our TH segment was primarily due to a decrease of $41 million in Company restaurant cost of sales, primarily from the conversion of Restaurant VIEs to franchise restaurants, partially offset by an increase of $22 million in supply chain cost of sales. The increase in supply chain cost of sales was primarily due to the reclassification of costs from the sales of equipment packages from franchise and property expenses to costs of sales beginning January 1, 2018, partially offset by a decrease in costs in connection with the non-recurrence of the roll-out of espresso equipment in 2017. The decrease in our BK segment was due to Company restaurant refranchisings in prior periods.
During 2017, the increase in cost of sales was driven primarily by the inclusion of $57 million from our PLK segment, a $30 million increase in our TH segment, a $5 million increase in our BK segment, and a $31 million unfavorable FX Impact. The increase in our TH segment was primarily due to an $80 million increase in supply chain cost of sales driven by the increase in supply chain sales described above, net of supply chain cost savings derived from effective cost management. This factor was partially offset by a $50 million decrease in Company restaurant cost of sales, primarily from the conversion of Restaurant VIEs to franchise restaurants.
34
Franchise and Property
Franchise and property revenues consist primarily of royalties earned on franchise sales, rents from real estate leased or subleased to franchisees, franchise fees, and other revenue. Franchise and property expenses consist primarily of depreciation of properties leased to franchisees, rental expense associated with properties subleased to franchisees, amortization of franchise agreements, and bad debt expense (recoveries). In periods prior to January 1, 2018, franchise and property revenues and franchise and property expenses included revenues and cost of sales, respectively, related to equipment packages sold at establishment of a restaurant and in connection with renewals or renovations.
During 2018, the increase in franchise and property revenues was driven by an increase of $458 million in our BK segment, an increase of $201 million in our PLK segment, and an increase of $167 million in our TH segment, partially offset by a $10 million unfavorable FX Impact. The increase in our BK, TH and PLK segments reflects the inclusion of advertising fund contributions from franchisees as a result of the application of ASC 606 beginning January 1, 2018, an increase in PLK franchise and property revenues as a result of including PLK for a full year in 2018 compared to nine months in 2017, and an increase in royalties driven by system-wide sales growth. These factors were partially offset by a decrease in franchise fees and other revenue, primarily due to the deferral of initial and renewal franchise fees as a result of the application of ASC 606 and for our TH segment, the reclassification of revenue from the sales of equipment packages from franchise and property revenues to sales beginning January 1, 2018.
During 2017, the increase in franchise and property revenues was driven by the inclusion of $135 million from our PLK segment, a $72 million increase in our BK segment, a $20 million increase in our TH segment, and an $18 million favorable FX Impact. The increase in our BK segment was primarily due to an increase in royalties, driven by system-wide sales growth. The increase in our TH segment was primarily due to an increase in royalties, driven by system-wide sales growth, and an increase in property revenues, driven by new leases and subleases associated with additional restaurants leased or subleased to franchisees as a result of converting Restaurant VIEs to franchise restaurants.
During 2018, the decrease in franchise and property expenses was driven by a decrease of $56 million in our TH segment and a decrease of $5 million in our BK segment, partially offset by an increase of $5 million in our PLK segment, primarily as a result of including PLK for a full year in 2018 compared to nine months in 2017. The decrease in our TH segment was primarily due to the reclassification of expenses from sales of equipment packages from franchise and property expenses to cost of sales beginning January 1, 2018.
During 2017, the increase in franchise and property expenses was driven by a $13 million increase in our TH segment, the inclusion of $7 million from our PLK segment, and a $6 million unfavorable FX Impact, partially offset by a $2 million decrease in our BK segment. The increase in our TH segment was primarily due to an increase in property expenses driven by new subleases associated with additional restaurants subleased to franchisees as a result of converting Restaurant VIEs to franchise restaurants.
Selling, General and Administrative Expenses
Our selling, general and administrative expenses were comprised of the following:
|
|
|
|
|
2018 vs. 2017
|
2017 vs. 2016
|
||||||||||||||||||||
|
|
2018
|
2017
|
2016
|
$
|
%
|
$
|
%
|
||||||||||||||||||
|
|
|
|
|
Favorable / (Unfavorable)
|
|||||||||||||||||||||
|
TH Segment SG&A
|
$
|
314
|
|
$
|
91
|
|
$
|
79
|
|
$
|
(223
|
)
|
NM
|
|
$
|
(12
|
)
|
(15.2
|
)%
|
||||||
|
BK Segment SG&A
|
577
|
|
143
|
|
160
|
|
(434
|
)
|
NM
|
|
17
|
|
10.6
|
%
|
|||||||||||
|
PLK Segment SG&A
|
193
|
|
40
|
|
—
|
|
(153
|
)
|
NM
|
|
(40
|
)
|
NM
|
|
|||||||||||
|
Share-based compensation and non-cash incentive compensation expense
|
55
|
|
55
|
|
42
|
|
—
|
|
—
|
%
|
(13
|
)
|
(31.0
|
)%
|
|||||||||||
|
Depreciation and amortization
|
20
|
|
23
|
|
22
|
|
3
|
|
13.0
|
%
|
(1
|
)
|
(4.5
|
)%
|
|||||||||||
|
PLK Transaction costs
|
10
|
|
62
|
|
—
|
|
52
|
|
83.9
|
%
|
(62
|
)
|
NM
|
|
|||||||||||
|
Corporate restructuring and tax advisory fees
|
25
|
|
2
|
|
—
|
|
(23
|
)
|
NM
|
|
(2
|
)
|
NM
|
|
|||||||||||
|
Office centralization and relocation costs
|
20
|
|
—
|
|
—
|
|
(20
|
)
|
NM
|
|
—
|
|
NM
|
|
|||||||||||
|
Integration costs
|
—
|
|
—
|
|
16
|
|
—
|
|
NM
|
|
16
|
|
NM
|
|
|||||||||||
|
Selling, general and administrative expenses
|
$
|
1,214
|
|
$
|
416
|
|
$
|
319
|
|
$
|
(798
|
)
|
NM
|
|
$
|
(97
|
)
|
(30.4
|
)%
|
||||||
NM – Not Meaningful
35
Upon our transition to ASC 606 on January 1, 2018, segment selling, general and administrative expenses (“Segment SG&A”) include segment selling expenses, which consist primarily of advertising fund expenses, and segment general and administrative expenses, which are comprised primarily of salary and employee-related costs for non-restaurant employees, professional fees, information technology systems, and general overhead for our corporate offices. Prior to our transition to ASC 606 on January 1, 2018, our statement of operations did not reflect advertising fund contributions or advertising fund expenses, since such amounts were netted under previously applicable accounting standards. Segment SG&A excludes share-based compensation and non-cash incentive compensation expense, depreciation and amortization, PLK Transaction costs, Corporate restructuring and tax advisory fees, Office centralization and relocation costs and Integration costs.
During 2018, TH, BK and PLK Segment SG&A increased primarily due to the inclusion of advertising fund expenses from the application of ASC 606 beginning January 1, 2018.
During 2017, TH Segment SG&A increased primarily due to an increase in salaries and benefits and an unfavorable FX Impact. During the same period, BK Segment SG&A decreased primarily due to a decrease in salaries and benefits, partially offset by an unfavorable FX Impact.
During 2017, the increase in share-based compensation and non-cash incentive compensation expense was due primarily to an increase of $4 million in equity award modifications and an increase due to additional equity awards granted during 2017.
(Income) Loss from Equity Method Investments
(Income) loss from equity method investments reflects our share of investee net income or loss, non-cash dilution gains or losses from changes in our ownership interests in equity method investees, and basis difference amortization.
The change in (income) loss from equity method investments during 2018 was primarily driven by the current year recognition of a $20 million non-cash dilution gain on the initial public offering by one of our equity method investees, partially offset by an increase in equity method investment net losses that we recognized during 2018.
The change in (income) loss from equity method investments during 2017 was primarily driven by the prior year recognition of a $12 million increase to the carrying value of our investment balance and a non-cash dilution gain included in (income) loss from equity method investments on the issuance of capital stock by one of our equity method investees, partially offset by improved results of our BK equity method investments in 2017.
Other Operating Expenses (Income), net
Our other operating expenses (income), net were comprised of the following:
|
2018
|
2017
|
2016
|
|||||||||
|
Net losses on disposal of assets, restaurant closures and refranchisings
|
$
|
19
|
|
$
|
29
|
|
$
|
18
|
|
||
|
Litigation settlements and reserves, net
|
11
|
|
2
|
|
1
|
|
|||||
|
Net losses (gains) on foreign exchange
|
(33
|
)
|
77
|
|
(20
|
)
|
|||||
|
Other, net
|
11
|
|
1
|
|
—
|
|
|||||
|
Other operating expenses (income), net
|
$
|
8
|
|
$
|
109
|
|
$
|
(1
|
)
|
||
Net losses (gains) on disposal of assets, restaurant closures, and refranchisings represent sales of properties and other costs related to restaurant closures and refranchisings. Gains and losses recognized in the current period may reflect certain costs related to closures and refranchisings that occurred in previous periods.
Litigation settlements and reserves, net primarily reflects accruals and proceeds received in connection with litigation matters.
Net losses (gains) on foreign exchange is primarily related to revaluation of foreign denominated assets and liabilities.
Other, net during 2018 is comprised primarily of a payment in connection with the settlement of certain provisions associated with the 2017 redemption of our preferred shares as a result of recently proposed Treasury regulations.
36
Interest Expense, net
|
2018
|
2017
|
2016
|
|||||||||
|
Interest expense, net
|
$
|
535
|
|
$
|
512
|
|
$
|
467
|
|
||
|
Weighted average interest rate on long-term debt
|
4.8
|
%
|
4.8
|
%
|
5.1
|
%
|
|||||
During 2018, interest expense, net increased primarily due to higher outstanding debt from the incurrence of incremental term loans and the issuance of senior notes during 2017, partially offset by a
$60 million
benefit during 2018 from our adoption of the new hedge accounting standard. Please refer to Note 2,
Significant Accounting Policies
-
New Accounting Pronouncements
, to the accompanying audited consolidated financial statements for further details of the effects of the adoption of the new hedge accounting standard. Subject to foreign exchange rate movements and other factors, we expect a benefit to continue during 2019.
During 2017, interest expense, net increased primarily due to higher outstanding debt from the incurrence of incremental term loans and the issuance of senior notes during 2017, partially offset by an increase in interest income and a lower weighted average interest rate.
Loss on Early Extinguishment of Debt
During 2017, we recorded a
$122 million
loss on early extinguishment of debt which primarily reflects the payment of premiums to fully redeem our second lien notes and the write-off of unamortized debt issuance costs and discounts in connection with the refinancing of our Term Loan Facility.
Income Tax Expense
The change in our effective income tax rate to
17.2%
in 2018 from
(12.1)%
in 2017 is primarily due to the impact of certain aspects of the Tax Act, realignment of certain intercompany financings and changes in foreign currency exchange rates, partially offset by the release of a valuation allowance related to use of capital losses.
The change in our effective income tax rate to
(12.1)%
in 2017 from
20.3%
in 2016 is primarily due to provisional amounts recorded in 2017 for the Tax Act Impact. Our effective income tax rate in 2017 also includes a benefit from stock option exercises as a result of the required adoption of a new share-based compensation accounting standard, as well as differing tax rules applicable to certain subsidiaries outside Canada. These factors were partially offset by a valuation allowance on foreign exchange capital losses.
Net Income
We reported net income of
$1,144 million
for 2018 compared to net income of
$1,235 million
for 2017. The decrease in net income is primarily due to a $372 million increase in income tax expense, a $23 million increase in interest expense, net, a $23 million increase in Corporate restructuring and tax advisory fees, the inclusion of $20 million of Office centralization and relocation costs, and a $9 million decrease in TH segment income. These factors were partially offset by the non-recurrence of $122 million of loss on early extinguishment of debt recognized in the prior period, a $101 million favorable change in results from other operating expenses (income), net, a $52 million decrease in PLK Transaction costs, a $50 million increase in PLK segment income, primarily as a result of including PLK for a full year in 2018 compared to nine months in 2017, and a $25 million increase in BK segment income.
Our net income increased to
$1,235 million
for 2017 compared to net income of
$956 million
for 2016, primarily as a result of a $134 million income tax benefit in 2017 compared to a $244 million income tax expense in 2016, a net change of $378 million. Additionally, segment income in TH and BK increased $151 million and 2017 includes $107 million of PLK segment income. These factors were partially offset by a $122 million loss on early extinguishment of debt, a $110 million increase in other operating expenses (income), net, $62 million of PLK Transaction costs, and a $45 million increase in interest expense, net.
Non-GAAP Reconciliations
The table below contains information regarding EBITDA and Adjusted EBITDA, which are non-GAAP measures. These non-GAAP measures do not have a standardized meaning under U.S. GAAP and may differ from similar captioned measures of other companies in our industry. We believe that these non-GAAP measures are useful to investors in assessing our operating performance, as it provides them with the same tools that management uses to evaluate our performance and is responsive to questions we receive from both investors and analysts. By disclosing these non-GAAP measures, we intend to provide investors with a consistent comparison of our operating results and trends for the periods presented. EBITDA is defined as earnings (net income or loss) before interest expense, net, loss on early extinguishment of debt, income tax (benefit) expense, and depreciation and amortization and is
37
used by management to measure operating performance of the business. Adjusted EBITDA is defined as EBITDA excluding the non-cash impact of share-based compensation and non-cash incentive compensation expense and (income) loss from equity method investments, net of cash distributions received from equity method investments, as well as other operating expenses (income), net. Other specifically identified costs associated with non-recurring projects are also excluded from Adjusted EBITDA, including PLK Transaction costs associated with the Popeyes Acquisition, Corporate restructuring and tax advisory fees related to the interpretation and implementation of the Tax Act, including Treasury regulations proposed in late 2018, non-operational Office centralization and relocation costs in connection with the centralization and relocation of our Canadian and U.S. restaurant support centers to new offices in Toronto, Ontario, and Miami, Florida, respectively, and Integration costs associated with the acquisition of Tim Hortons. Adjusted EBITDA is used by management to measure operating performance of the business, excluding these non-cash and other specifically identified items that management believes are not relevant to management’s assessment of operating performance or the performance of an acquired business. Adjusted EBITDA, as defined above, also represents our measure of segment income for each of our three operating segments.
|
2018
|
2017
|
2016
|
2018 vs. 2017
|
2017 vs. 2016
|
|||||||||||||||
|
|
|
|
|
Favorable / (Unfavorable)
|
|||||||||||||||
|
Segment income:
|
|||||||||||||||||||
|
TH
|
$
|
1,127
|
|
$
|
1,136
|
|
$
|
1,072
|
|
$
|
(9
|
)
|
$
|
64
|
|
||||
|
BK
|
928
|
|
903
|
|
816
|
|
25
|
|
87
|
|
|||||||||
|
PLK
|
157
|
|
107
|
|
—
|
|
50
|
|
107
|
|
|||||||||
|
Adjusted EBITDA
|
2,212
|
|
2,146
|
|
1,888
|
|
66
|
|
258
|
|
|||||||||
|
Share-based compensation and non-cash incentive compensation expense
|
55
|
|
55
|
|
42
|
|
—
|
|
(13
|
)
|
|||||||||
|
PLK Transaction costs
|
10
|
|
62
|
|
—
|
|
52
|
|
(62
|
)
|
|||||||||
|
Corporate restructuring and tax advisory fees
|
25
|
|
2
|
|
—
|
|
(23
|
)
|
(2
|
)
|
|||||||||
|
Office centralization and relocation costs
|
20
|
|
—
|
|
—
|
|
(20
|
)
|
—
|
|
|||||||||
|
Integration costs
|
—
|
|
—
|
|
16
|
|
—
|
|
16
|
|
|||||||||
|
Impact of equity method investments (a)
|
(3
|
)
|
1
|
|
(8
|
)
|
4
|
|
(9
|
)
|
|||||||||
|
Other operating expenses (income), net
|
8
|
|
109
|
|
(1
|
)
|
101
|
|
(110
|
)
|
|||||||||
|
EBITDA
|
2,097
|
|
1,917
|
|
1,839
|
|
180
|
|
78
|
|
|||||||||
|
Depreciation and amortization
|
180
|
|
182
|
|
172
|
|
2
|
|
(10
|
)
|
|||||||||
|
Income from operations
|
1,917
|
|
1,735
|
|
1,667
|
|
182
|
|
68
|
|
|||||||||
|
Interest expense, net
|
535
|
|
512
|
|
467
|
|
(23
|
)
|
(45
|
)
|
|||||||||
|
Loss on early extinguishment of debt
|
—
|
|
122
|
|
—
|
|
122
|
|
(122
|
)
|
|||||||||
|
Income tax (benefit) expense
|
238
|
|
(134
|
)
|
244
|
|
(372
|
)
|
378
|
|
|||||||||
|
Net income
|
$
|
1,144
|
|
$
|
1,235
|
|
$
|
956
|
|
$
|
(91
|
)
|
$
|
279
|
|
||||
|
(a)
|
Represents (i) (income) loss from equity method investments and (ii) cash distributions received from our equity method investments. Cash distributions received from our equity method investments are included in segment income.
|
Segment income is affected by the application of ASC 606 beginning January 1, 2018, including the deferral of initial and renewal franchise fees and the timing of advertising fund related revenues and expenses. See Note 19,
Segment Reporting and Geographical Information
, to the accompanying audited consolidated financial statements for 2018 segment income under Previous Standards. The increase in Adjusted EBITDA for 2018 reflects the increase in segment income in our BK and PLK segments, primarily as a result of including PLK for a full year in 2018 compared to nine months in 2017, partially offset by a decrease in our TH segment.
The increase in EBITDA for 2018 is primarily due to a decrease in other operating expenses (income), net, an increase in segment income in our BK and PLK segments, primarily as a result of including PLK for a full year in 2018 compared to nine months in 2017, a decrease in PLK Transaction costs, and favorable results from the impact of equity method investments in the current period, partially offset by the increase in Corporate restructuring and tax advisory fees, the inclusion of Office centralization and relocation costs and a decrease in segment income in our TH segment.
The increase in Adjusted EBITDA for 2017 reflects increases in segment income in our TH and BK segments and the inclusion of our PLK segment.
38
The increase in EBITDA for 2017 is primarily due to increases in segment income in our TH and BK segments, the inclusion of PLK segment income, and the non-recurrence of integration costs, partially offset by an increase in other operating expenses (income), net, PLK Transaction costs and Corporate restructuring and tax advisory fees recognized in the current period, an increase in share-based compensation and non-cash incentive compensation, and unfavorable results from the impact of equity method investments.
Liquidity and Capital Resources
Our primary sources of liquidity are cash on hand, cash generated by operations and borrowings available under our Revolving Credit Facility (as defined below). We have used, and may in the future use, our liquidity to make required interest and/or principal payments, to repurchase our common shares, to repurchase Class B exchangeable limited partnership units (“Partnership exchangeable units”), to voluntarily prepay and repurchase our or one of our affiliate’s outstanding debt, to fund our investing activities and to pay dividends on our common shares and make distributions on the Partnership exchangeable units. As a result of our borrowings, we are highly leveraged. Our liquidity requirements are significant, primarily due to debt service requirements.
At
December 31, 2018
, we had cash and cash equivalents of
$913 million
and working capital of
$92 million
. In addition, at
December 31, 2018
, we had borrowing availability of
$480 million
under our Revolving Credit Facility. Based on our current level of operations and available cash, we believe our cash flow from operations, combined with availability under our Revolving Credit Facility, will provide sufficient liquidity to fund our current obligations, debt service requirements and capital spending over the next twelve months.
During 2018, we received exchange notices representing
10,185,333
Partnership exchangeable units, including
10,020,000
received during the fourth quarter of 2018. Pursuant to the terms of the partnership agreement, we satisfied the exchange notices by repurchasing
10,000,000
Partnership exchangeable units for approximately
$561 million
in cash during the fourth quarter and full year of 2018 and exchanging the remaining Partnership exchangeable units for the same number of newly issued RBI common shares.
On August 2, 2016, the RBI board of directors approved a share repurchase authorization that allows us to purchase up to $300 million of RBI common shares through July 2021. Repurchases under this authorization will be made in the open market or through privately negotiated transactions. On August 7, 2018, RBI announced that the Toronto Stock Exchange (the “TSX”) had accepted the notice of RBI's intention to renew the normal course issuer bid. Under this normal course issuer bid, RBI is permitted to repurchase up to 24,087,172 RBI common shares for the one-year period commencing on August 8, 2018 and ending on August 7, 2019, or earlier if RBI completes the repurchases prior to such date. Share repurchases under the normal course issuer bid will be made through the facilities of the TSX, the New York Stock Exchange (the “NYSE”) and/or other exchanges and alternative Canadian or foreign trading systems, if eligible, or by such other means as may be permitted by the TSX and/or the NYSE under applicable law. Partnership unitholders and RBI shareholders may obtain a copy of the prior notice, free of charge, by contacting us. If RBI repurchases any RBI common shares, pursuant to the partnership agreement, Partnership will, immediately prior to such repurchase, make a distribution to RBI on its Class A common units in an amount sufficient for RBI to fund such repurchase. As of the date of this report, there have been no RBI common share repurchases under the normal course issuer bid.
Prior to the Tax Act, we provided deferred taxes on certain undistributed foreign earnings. Under our transition to a modified territorial tax system whereby all previously untaxed undistributed foreign earnings are subject to a transition tax charge at reduced rates and future repatriations of foreign earnings will generally be exempt from U.S. tax, we wrote off the existing deferred tax liability on undistributed foreign earnings and recorded the impact of the new transition tax charge on foreign earnings during the fourth quarter of 2017. We will continue to monitor available evidence and our plans for foreign earnings and expect to continue to provide any applicable deferred taxes based on the tax liability or withholding taxes that would be due upon repatriation of amounts not considered permanently reinvested.
39
Debt Instruments and Debt Service Requirements
As of
December 31, 2018
, our long-term debt consists primarily of borrowings under our Credit Facilities, amounts outstanding under our 2017 4.25% Senior Notes, 2015 4.625% Senior Notes and 2017 5.00% Senior Notes (each as defined below), and obligations under capital leases. For further information about our long-term debt, see Note 9 to the accompanying consolidated financial statements included in Part II, Item 8 “Financial Statements and Supplementary Data” of our Annual Report.
Credit Facilities
On October 2, 2018, two of our subsidiaries (the “Borrowers”) entered into a third amendment (the “Third Amendment”) to the credit agreement (the “Credit Agreement”) governing our senior secured term loan facility (the “Term Loan Facility”) and our senior secured revolving credit facility of up to $500 million of revolving extensions of credit outstanding at any time (including revolving loans, swingline loans and letters of credit) (the “Revolving Credit Facility”) and together with the Term Loan Facility, the “Credit Facilities”). The Third Amendment amended the Credit Agreement to (i) exclude from GAAP any applicable changes with respect to revenue recognition such that the revenue recognition standards from Accounting Standards Codification (“ASC”) Topic 605,
Revenue Recognition
and ASC Subtopic 952-605,
Franchisors - Revenue Recognition
, solely as it relates to initial and renewal franchise fees and upfront fees from development agreements and master franchise and development agreements, shall continue to apply; (ii) provide for mandatory prepayments equal to 50%, 25% and 0% of annual excess cash flow of the Borrowers and their subsidiaries if the first lien senior secured leverage ratio is above 4.00x, between 3.75x and 4.00x and below 3.75x, respectively (rather than above 3.75x, between 3.50x and 3.75x and below 3.50x, respectively); and (iii) allow for unlimited restricted payments when the total leverage ratio is not greater than 4.75x (rather than 4.50x).
As of
December 31, 2018
, there was
$6,338 million
outstanding principal amount under the Term Loan Facility with a weighted average interest rate of
4.77%
. Based on the amounts outstanding under the Term Loan Facility and LIBOR as of
December 31, 2018
, subject to a floor of 1.00%, required debt service for the next twelve months is estimated to be approximately
$287 million
in interest payments and
$65 million
in principal payments. In addition, based on LIBOR as of
December 31, 2018
, net cash settlements that we expect to pay on our $3,500 million interest rate swap are estimated to be approximately
$4 million
for the next twelve months. The Term Loan Facility matures on February 17, 2024, and we may prepay the Term Loan Facility in whole or in part at any time. Additionally, subject to certain exceptions, the Term Loan Facility may be subject to mandatory prepayments using (i) proceeds from non-ordinary course asset dispositions, (ii) proceeds from certain incurrences of debt or (iii) a portion of our annual excess cash flows based upon certain leverage ratios.
As of
December 31, 2018
, we had
no
amounts outstanding under the Revolving Credit Facility, had
$20 million
of letters of credit issued against the facility, and our borrowing availability was
$480 million
. Funds available under the Revolving Credit Facility may be used to repay other debt, finance debt or share repurchases, fund acquisitions or capital expenditures, and for other general corporate purposes. We have a
$125 million
letter of credit sublimit as part of the Revolving Credit Facility, which reduces our borrowing availability thereunder by the cumulative amount of outstanding letters of credit. We are also required to pay (i) letters of credit fees on the aggregate face amounts of outstanding letters of credit plus a fronting fee to the issuing bank and (ii) administration fees. Amounts drawn under each letter of credit bear interest ranging from 1.25% to 2.00%, depending on our leverage ratio. The Revolving Credit Facility matures on October 13, 2022, provided that if on October 15, 2021, more than an aggregate of $150 million of the 2015 4.625% Senior Notes (as defined below) are outstanding, then the maturity date of the Revolving Credit Facility will be October 15, 2021.
The interest rate applicable to borrowings under our Credit Facilities is, at our option, either (i) a base rate plus an applicable margin equal to 1.25% for the Term Loan Facility and ranging from 0.25% to 1.00%, depending on our leverage ratio, for the Revolving Credit Facility, or (ii) a Eurocurrency rate plus an applicable margin of 2.25% for the Term Loan Facility and ranging from 1.25% to 2.00%, depending on our leverage ratio, for the Revolving Credit Facility. Borrowings are subject to a floor of 2.00% for base rate borrowings and 1.00% for Eurocurrency rate borrowings. The unused portion of the Revolving Credit Facility is subject to a commitment fee of 0.25%. Obligations under the Credit Facilities are guaranteed on a senior secured basis, jointly and severally, by the direct parent company of one of the Borrowers and substantially all of its Canadian and U.S. subsidiaries, including Tim Hortons, Burger King, Popeyes and substantially all of their respective Canadian and U.S. subsidiaries (the “Credit Guarantors”). Amounts borrowed under the Credit Facilities are secured on a first priority basis by a perfected security interest in substantially all of the present and future property (subject to certain exceptions) of each Borrower and Credit Guarantor.
Senior Notes
In May 2017, the Borrowers entered into an indenture (the “2017 4.25% Senior Notes Indenture”) in connection with the issuance of $1,500 million of 4.25% first lien senior secured notes due May 15, 2024 (the “2017 4.25% Senior Notes”). No principal payments are due until maturity and interest is paid semi-annually.
40
During 2017, the Borrowers entered into an indenture (the “2017 5.00% Senior Notes Indenture”) in connection with the issuance in August 2017 and October 2017 of an aggregate of $2,800 million of 5.00% second lien senior secured notes due October 15, 2025 (the “2017 5.00% Senior Notes”). No principal payments are due until maturity and interest is paid semi-annually.
The Borrowers are also party to an indenture (the “2015 4.625% Senior Notes Indenture”) in connection with the issuance of $1,250 million of 4.625% first lien senior notes due January 15, 2022 (the “2015 4.625% Senior Notes”). No principal payments are due until maturity and interest is paid semi-annually.
The Borrowers may redeem a series of Senior Notes, in whole or in part, at any time prior to May 15, 2020 for the 2017 4.25% Senior Notes and October 15, 2020 for the 2017 5.00% Senior Notes, at a price equal to 100% of the principal amount redeemed plus a “make-whole” premium, plus accrued and unpaid interest, if any, to, but excluding, the redemption date. In addition, the Borrowers may redeem, in whole or in part, the 2015 4.625% Senior Notes at any time and the 2017 4.25% Senior Notes and 2017 5.00% Senior Notes on or after the applicable date noted above, at the redemption prices set forth in the applicable Senior Notes Indenture. The Senior Notes Indentures also contain optional redemption provisions related to tender offers, change of control and equity offerings, among others.
Based on the amounts outstanding at
December 31, 2018
, required debt service for the next twelve months on all of the Senior Notes outstanding is approximately
$262 million
in interest payments.
TH Facility
On October 11, 2018, one of our subsidiaries entered into a non-revolving delayed drawdown term credit facility in a total aggregate principal amount of C$100 million with a maturity date of October 4, 2025 (the “TH Facility”). The interest rate applicable to the TH Facility is the Canadian Bankers’ Acceptance rate plus an applicable margin equal to 1.40% or the Prime Rate plus an applicable margin equal to 0.40%, at our option. Obligations under the TH Facility are guaranteed by three of our subsidiaries, and amounts borrowed under the TH Facility are and will be secured by certain parcels of real estate. As of
December 31, 2018
, we had drawn down the entire C$100 million available under the TH Facility with a weighted average interest rate of 3.64%.
Restrictions and Covenants
Our Credit Facilities, 2017 4.25% Senior Notes Indenture, 2017 5.00% Senior Notes Indenture and 2015 4.625% Senior Notes Indenture contain a number of customary affirmative and negative covenants that, among other things, limit or restrict the ability of Partnership and certain of our subsidiaries to: incur additional indebtedness; incur liens; engage in mergers, consolidations, liquidations and dissolutions; sell assets; pay dividends and make other payments in respect of capital stock; make investments, loans and advances; pay or modify the terms of certain indebtedness; engage in certain transactions with affiliates. In addition, the Borrowers are not permitted to exceed a first lien senior secured leverage ratio of 6.50 to 1.00 when, as of the end of any fiscal quarter, the sum of (i) the amount of letters of credit outstanding exceeding $50 million (other than those that are cash collateralized); (ii) outstanding amounts under the Revolving Credit Facility and (iii) outstanding amounts of swing line loans, exceeds 30% of the commitments under the Revolving Credit Facility.
The restrictions under the Credit Facilities, the 2017 4.25% Senior Notes Indenture, 2017 5.00% Senior Notes Indenture and 2015 4.625% Senior Notes Indenture have resulted in substantially all of our consolidated assets being restricted.
As of
December 31, 2018
, we were in compliance with all debt covenants under the Credit Facilities, the TH Facility, the 2017 4.25% Senior Notes Indenture, 2017 5.00% Senior Notes Indenture and 2015 4.625% Senior Notes Indenture, and there were no limitations on our ability to draw on the remaining availability under our Revolving Credit Facility.
Cash Distributions
On
January 4, 2019
, RBI paid a dividend of
$0.45
per RBI common share and Partnership made a distribution on the same day to RBI as holder of Class A common units in the amount of the aggregate dividends paid by RBI on RBI common shares. On
January 4, 2019
, Partnership also made a distribution in respect of each Partnership exchangeable unit in the amount of
$0.45
per Partnership exchangeable unit.
On
January 22, 2019
, the board of directors of RBI declared a dividend of
$0.50
per common share for the first quarter of 2019, payable on
April 3, 2019
to RBI shareholders of record on
March 15, 2019
. Partnership will make a distribution to RBI as holder of Class A common units in the amount of the aggregate dividends declared and paid by RBI on RBI common shares. Pursuant to the terms of the partnership agreement, each Partnership exchangeable unit is entitled to distributions from Partnership in an amount equal to any dividends or distributions that have been declared and are payable in respect of an RBI common share. The record date and payment date for these distributions on the Partnership exchangeable units are to be the same as the relevant record date and payment date for the corresponding dividends on RBI common shares. Accordingly, Partnership will also make a distribution in respect of each
41
Partnership exchangeable unit in the amount of
$0.50
per Partnership exchangeable unit, and the record date and payment date for distributions on Partnership exchangeable units are the same as the record date and payment date set forth above.
RBI and Partnership are targeting a total of $2.00 in declared dividends per common share and distributions in respect of each Partnership exchangeable unit for 2019.
Because we are a holding company, our ability to pay cash distributions on our Partnership exchangeable units may be limited by restrictions under our debt agreements.
Outstanding Security Data
As of
February 11, 2019
, we had outstanding
202,006,067
Class A common units issued to RBI and
207,510,471
Partnership exchangeable units. One special voting share of RBI is held by a trustee, entitling the trustee to that number of votes on matters on which holders of RBI common shares are entitled to vote equal to the number of Partnership exchangeable units outstanding. The trustee is required to cast such votes in accordance with voting instructions provided by holders of Partnership exchangeable units. At any shareholder meeting of RBI, holders of RBI common shares vote together as a single class with the special voting share except as otherwise provided by law. For information on our share-based compensation and RBI’s outstanding equity awards, see Note 15 to the accompanying consolidated financial statements in Part II, Item 8 “Financial Statements and Supplementary Data” of our Annual Report.
Since December 12, 2015, the holders of Partnership exchangeable units have had the right to require Partnership to exchange all or any portion of such holder’s Partnership exchangeable units for RBI common shares at a ratio of one share for each Partnership exchangeable unit, subject to RBI’s right as the general partner of Partnership to determine to settle any such exchange for a cash payment in lieu of RBI common shares.
Comparative Cash Flows
Operating Activities
Cash provided by operating activities was
$1,165 million
in 2018, compared to
$1,431 million
in 2017. The decrease in cash provided by operating activities was driven by an increase in income tax payments, primarily due to the payment of accrued income taxes related to the December 2017 redemption of preferred shares, increases in interest payments and Corporate restructuring and tax advisory fees and Office centralization and relocation costs incurred in the current year. These factors were partially offset by an increase in PLK segment income, primarily as a result of including PLK for a full year in 2018 compared to nine months in 2017, an increase in BK segment income, a decrease in PLK Transaction costs and a decrease in cash used for working capital.
Cash provided by operating activities was
$1,431 million
in 2017, compared to
$1,214 million
in 2016. The increase in cash provided by operating activities was driven by the inclusion of PLK segment income and increases in TH and BK segment income, partially offset by PLK Transaction costs, increases in income tax payments and interest payments, and an increase in cash used by changes in working capital.
Investing Activities
Cash used for investing activities was
$44 million
in 2018, compared to
$858 million
in 2017. The change in investing activities was driven primarily by net cash used for the Popeyes Acquisition during 2017, partially offset by proceeds from the settlement of derivatives in 2017 and an increase in capital expenditures during 2018.
Cash used for investing activities was
$858 million
in 2017, compared to cash provided by investing activities of
$27 million
in 2016. The change in investing activities was driven primarily by net cash used for the Popeyes Acquisition partially offset by proceeds received from the settlement and termination of our previous cross-currency rate swaps.
Financing Activities
Cash used for financing activities was
$1,285 million
in 2018, compared to
$936 million
in 2017. The change in financing activities was driven primarily by an increase in distributions on common units and Partnership exchangeable units during 2018, an increase in payments in connection with the repurchase of Partnership exchangeable units, the 2018 distributions to RBI to fund payments related to the December 2017 redemption of Preferred Shares and a decrease in proceeds from the issuance of long-term debt. These factors were partially offset by non-recurring uses of cash for financing activities in 2017, including the distribution to RBI in connection with the redemption of the Preferred Shares, payment of financing costs, and distributions on preferred units, a decrease in debt repayments in 2018 and an increase in capital contribution from RBI in 2018.
42
Cash used for financing activities was
$936 million
in 2017, compared to
$591 million
in 2016. The change in financing activities was driven primarily by the distribution to RBI in connection with the redemption of the Preferred Shares, repurchases of Partnership exchangeable units, debt repayments, payment of financing costs and redemption premiums, and higher distribution payments, partially offset by proceeds from new borrowings.
Contractual Obligations and Commitments
Our significant contractual obligations and commitments as of
December 31, 2018
are shown in the following table.
|
|
Payment Due by Period
|
||||||||||||||||||
|
Contractual Obligations
|
Total
|
Less Than
1 Year |
1-3 Years
|
3-5 Years
|
More Than
5 Years |
||||||||||||||
|
|
(In millions)
|
||||||||||||||||||
|
Credit Facilities, including interest (a)
|
$
|
7,789
|
|
$
|
354
|
|
$
|
699
|
|
$
|
685
|
|
$
|
6,051
|
|
||||
|
Senior Notes, including interest
|
7,025
|
|
262
|
|
526
|
|
1,662
|
|
4,575
|
|
|||||||||
|
Other long-term debt
|
162
|
|
8
|
|
19
|
|
26
|
|
109
|
|
|||||||||
|
Operating lease obligations (b)
|
1,619
|
|
183
|
|
330
|
|
275
|
|
831
|
|
|||||||||
|
Purchase commitments (c)
|
697
|
|
589
|
|
105
|
|
2
|
|
1
|
|
|||||||||
|
Capital lease obligations
|
372
|
|
38
|
|
70
|
|
63
|
|
201
|
|
|||||||||
|
Total
|
$
|
17,664
|
|
$
|
1,434
|
|
$
|
1,749
|
|
$
|
2,713
|
|
$
|
11,768
|
|
||||
|
(a)
|
We have estimated our interest payments through the maturity of our Credit Facilities based on the three-month LIBOR as of
December 31, 2018
.
|
|
(b)
|
Operating lease payment obligations have not been reduced by the amount of payments due in the future under subleases.
|
|
(c)
|
Includes open purchase orders, as well as commitments to purchase certain food ingredients and advertising expenditures, and obligations related to information technology and service agreements.
|
We have not included in the contractual obligations table approximately
$492 million
of gross liabilities for unrecognized tax benefits relating to various tax positions we have taken. These liabilities may increase or decrease over time primarily as a result of tax examinations, and given the status of the examinations, we cannot reliably estimate the period of any cash settlement with the respective taxing authorities. For additional information on unrecognized tax benefits, see Note 11 to the accompanying consolidated financial statements included in Part II, Item 8 “Financial Statements and Supplementary Data” of our Annual Report.
Other Commercial Commitments and Off-Balance Sheet Arrangements
From time to time, we enter into agreements under which we guarantee loans made by third parties to qualified franchisees. As of
December 31, 2018
, there were
$55 million
of loans outstanding to Burger King franchisees that we had guaranteed under
six
such programs, with additional franchisee borrowing capacity of approximately
$300 million
remaining. Our maximum guarantee liability under these programs is limited to an aggregate of
$42 million
, assuming full utilization of all borrowing capacity. We record a liability in the period the loans are funded and the maximum term of the guarantee is approximately ten years. As of
December 31, 2018
, the liability reflecting the fair value of these guarantee obligations was
$1 million
. As of
December 31, 2018
, there were no significant guarantees in connection with Tim Hortons franchisee loans and no guarantees in connection with Popeyes franchisee loans. No significant payments have been made by us in connection with these guarantees through
December 31, 2018
.
Critical Accounting Policies and Estimates
This discussion and analysis of financial condition and results of operations is based on our audited consolidated financial statements, which have been prepared in accordance with U.S. GAAP. The preparation of these financial statements requires our management to make estimates and judgments that affect the reported amounts of assets, liabilities, revenues, and expenses, as well as related disclosures of contingent assets and liabilities. We evaluate our estimates on an ongoing basis and we base our estimates on historical experience and various other assumptions we deem reasonable to the situation. These estimates and assumptions form the basis for making judgments about the carrying values of assets and liabilities that are not readily apparent from other sources. As future events and their effects cannot be determined with precision, actual results could differ significantly from these estimates. Changes in our estimates could materially impact our results of operations and financial condition in any particular period.
We consider our critical accounting policies and estimates to be as follows based on the high degree of judgment or complexity in their application:
43
Goodwill and Intangible Assets Not Subject to Amortization
Goodwill represents the excess of the purchase price over the fair value of assets acquired and liabilities assumed in acquisitions. Our indefinite-lived intangible assets consist of the
Tim Hortons
brand, the
Burger King
brand, and the
Popeyes
brand (each a “Brand” and together, the “Brands”). Goodwill and the Brands are tested for impairment at least annually as of October 1 of each year and more often if an event occurs or circumstances change, which indicate impairment might exist. Our annual impairment tests of goodwill and the Brands may be completed through qualitative assessments. We may elect to bypass the qualitative assessment and proceed directly to a two-step quantitative impairment test, for any reporting unit or Brand, in any period. We can resume the qualitative assessment for any reporting unit or Brand in any subsequent period.
Under a qualitative approach, our impairment review for goodwill consists of an assessment of whether it is more-likely-than-not that a reporting unit’s fair value is less than its carrying amount. If we elect to bypass the qualitative assessment for any reporting units, or if a qualitative assessment indicates it is more-likely-than-not that the estimated carrying value of a reporting unit exceeds its fair value, we perform a two-step quantitative goodwill impairment test. The first step requires us to estimate the fair value of the reporting unit. If the fair value of the reporting unit is less than its carrying amount, the estimated fair value of the reporting unit is allocated to all its underlying assets and liabilities, including both recognized and unrecognized tangible and intangible assets, based on their fair value. If necessary, goodwill is then written down to its implied fair value. We use an income approach to estimate a reporting unit’s fair value, which discounts the reporting unit’s projected cash flows using a discount rate we determine. We make significant assumptions when estimating a reporting unit’s projected cash flows, including revenue, driven primarily by net restaurant growth, comparable sales growth and average royalty rates, general and administrative expenses, capital expenditures and income tax rates.
Under a qualitative approach, our impairment review for the Brands consists of an assessment of whether it is more-likely-than-not that a Brand’s fair value is less than its carrying amount. If we elect to bypass the qualitative assessment for any of our Brands, or if a qualitative assessment indicates it is more-likely-than-not that the estimated carrying value of a Brand exceeds its fair value, we estimate the fair value of the Brand and compare it to its carrying amount. If the carrying amount exceeds fair value, an impairment loss is recognized in an amount equal to that excess. We use an income approach to estimate a Brand’s fair value, which discounts the projected Brand-related cash flows using a discount rate we determine. We make significant assumptions when estimating Brand-related cash flows, including system-wide sales, driven by net restaurant growth and comparable sales growth, average royalty rates, brand maintenance costs and income tax rates.
We completed our impairment reviews for goodwill and the Brands as of October 1, 2018, 2017 and 2016 and no impairment resulted. The estimates and assumptions we use to estimate fair values when performing quantitative assessments are highly subjective judgments based on our experience and knowledge of our operations. Significant changes in the assumptions used in our analysis could result in an impairment charge related to goodwill or the Brands. Circumstances that could result in changes to future estimates and assumptions include, but are not limited to, expectations of lower system-wide sales growth, which can be caused by a variety of factors, increases in income tax rates and increases in discount rates. Based on the annual impairment tests performed in 2018, the fair values of all of our reporting units and Brands were substantially in excess of their carrying amounts.
Long-lived Assets
Long-lived assets (including intangible assets subject to amortization) are tested for impairment whenever events or changes in circumstances indicate that the carrying amount of an asset may not be recoverable. Long-lived assets are grouped for recognition and measurement of impairment at the lowest level for which identifiable cash flows are largely independent of the cash flows of other assets.
The impairment test for long-lived assets requires us to assess the recoverability of our long-lived assets by comparing their net carrying value to the sum of undiscounted estimated future cash flows directly associated with and arising from our use and eventual disposition of the assets. If the net carrying value of a group of long-lived assets exceeds the sum of related undiscounted estimated future cash flows, we would be required to record an impairment charge equal to the excess, if any, of net carrying value over fair value.
When assessing the recoverability of our long-lived assets, we make assumptions regarding estimated future cash flows and other factors. Some of these assumptions involve a high degree of judgment and also bear a significant impact on the assessment conclusions. Included among these assumptions are estimating undiscounted future cash flows, including the projection of rental income, capital requirements for maintaining property and residual values of asset groups. We formulate estimates from historical experience and assumptions of future performance, based on business plans and forecasts, recent economic and business trends, and competitive conditions. In the event that our estimates or related assumptions change in the future, we may be required to record an impairment charge.
44
Accounting for Income Taxes
We record income tax liabilities utilizing known obligations and estimates of potential obligations. A deferred tax asset or liability is recognized whenever there are future tax effects from existing temporary differences and operating loss and tax credit carry-forwards. When considered necessary, we record a valuation allowance to reduce deferred tax assets to the balance that is more-likely-than-not to be realized. We must make estimates and judgments on future taxable income, considering feasible tax planning strategies and taking into account existing facts and circumstances, to determine the proper valuation allowance. When we determine that deferred tax assets could be realized in greater or lesser amounts than recorded, the asset balance and income statement reflect the change in the period such determination is made. Due to changes in facts and circumstances and the estimates and judgments that are involved in determining the proper valuation allowance, differences between actual future events and prior estimates and judgments could result in adjustments to this valuation allowance.
During 2017, we recorded provisional estimates for the income tax effects of the Tax Act in accordance with SAB 118, which established a one-year measurement period where a provisional amount could be subject to adjustment. We finalized these provisional estimates during 2018 and reflected such refinements as discrete items along with the 2018 income tax effects of the Tax Act based on applicable regulations and guidance issued to date. Given the complexity of the changes in the tax law resulting from the Tax Act, additional regulations and guidance are expected to be issued by applicable authorities (e.g., Treasury, IRS, SEC, FASB, state taxing authorities) subsequent to the date of filing. Accordingly, it is possible that the 2018 amounts recorded may be impacted by such developments. Adjustments to the amounts recorded will be reflected as discrete items in the provision for income taxes in the period in which those adjustments become reasonably estimable.
We file income tax returns, including returns for our subsidiaries, with federal, provincial, state, local and foreign jurisdictions. We are subject to routine examination by taxing authorities in these jurisdictions. We apply a two-step approach to recognizing and measuring uncertain tax positions. The first step is to evaluate available evidence to determine if it appears more-likely-than-not that an uncertain tax position will be sustained on an audit by a taxing authority, based solely on the technical merits of the tax position. The second step is to measure the tax benefit as the largest amount that is more than 50% likely of being realized upon settling the uncertain tax position.
Although we believe we have adequately accounted for our uncertain tax positions, from time to time, audits result in proposed assessments where the ultimate resolution may result in us owing additional taxes. We adjust our uncertain tax positions in light of changing facts and circumstances, such as the completion of a tax audit, expiration of a statute of limitations, the refinement of an estimate, and interest accruals associated with uncertain tax positions until they are resolved. We believe that our tax positions comply with applicable tax law and that we have adequately provided for these matters. However, to the extent that the final tax outcome of these matters is different than the amounts recorded, such differences will impact the provision for income taxes in the period in which such determination is made.
In prior periods, we provided deferred taxes on certain undistributed foreign earnings. Under our transition to a modified territorial tax system whereby all previously untaxed undistributed foreign earnings are subject to a transition tax charge at reduced rates and future repatriations of foreign earnings will generally be exempt from U.S. tax, we wrote off the existing deferred tax liability on undistributed foreign earnings and recorded the impact of the new transition tax charge on foreign earnings. We will continue to monitor available evidence and our plans for foreign earnings and expect to continue to provide any applicable deferred taxes based on the tax liability or withholding taxes that would be due upon repatriation of amounts not considered permanently reinvested.
We use an estimate of the annual effective income tax rate at each interim period based on the facts and circumstances available at that time, while the actual effective income tax rate is calculated at year-end.
See Note 11 to the accompanying consolidated financial statements included in Part II, Item 8 “Financial Statements and Supplementary Data” of our Annual Report for additional information about accounting for income taxes.
New Accounting Pronouncements
See Note 2,
“Significant Accounting Policies – New Accounting Pronouncements,”
to the accompanying consolidated financial statements included in Part II, Item 8 “Financial Statements and Supplementary Data” of our Annual Report for a discussion of new accounting pronouncements.
45
Item 7A.
Quantitative and Qualitative Disclosures About Market Risk
Market Risk
We are exposed to market risks associated with currency exchange rates, interest rates, commodity prices and inflation. In the normal course of business and in accordance with our policies, we manage these risks through a variety of strategies, which may include the use of derivative financial instruments to hedge our underlying exposures. Our policies prohibit the use of derivative instruments for speculative purposes, and we have procedures in place to monitor and control their use.
Currency Exchange Risk
We report our results in U.S. dollars, which is our reporting currency. The operations of each of TH, BK, and PLK that are denominated in currencies other than the U.S. dollar are impacted by fluctuations in currency exchange rates and changes in currency regulations. The majority of TH’s operations, income, revenues, expenses and cash flows are denominated in Canadian dollars, which we translate to U.S. dollars for financial reporting purposes. Royalty payments from BK franchisees in our European markets and in certain other countries are denominated in currencies other than U.S. dollars. Furthermore, franchise royalties from each of TH’s, BK’s, and PLK's international franchisees are calculated based on local currency sales; consequently franchise revenues are still impacted by fluctuations in currency exchange rates. Each of their respective revenues and expenses are translated using the average rates during the period in which they are recognized and are impacted by changes in currency exchange rates.
We have numerous investments in our foreign subsidiaries, the net assets of which are exposed to volatility in foreign currency exchange rates. We have entered into cross-currency rate swaps to hedge a portion of our net investment in such foreign operations against adverse movements in foreign currency exchange rates. We designated cross-currency rate swaps with a notional value of $5,000 million between Canadian dollar and U.S. dollar and cross-currency rate swaps with a notional value of $1,600 million between the Euro and U.S. dollar, as net investment hedges of a portion of our equity in foreign operations in those currencies. The fair value of the cross-currency rate swaps is calculated each period with changes in the fair value of these instruments reported in AOCI to economically offset the change in the value of the net investment in these designated foreign operations driven by changes in foreign currency exchange rates. The net fair value of these derivative instruments was a liability of
$48 million
as of
December 31, 2018
. The net unrealized losses, net of tax, related to these derivative instruments included in AOCI totaled
$36 million
as of
December 31, 2018
. Such amounts will remain in AOCI until the complete or substantially complete liquidation of our investment in the underlying foreign operations.
We use forward currency contracts to manage the impact of foreign exchange fluctuations on U.S. dollar purchases and payments, such as coffee and certain intercompany purchases, made by our TH Canadian operations. However, for a variety of reasons, we do not hedge our revenue exposure in other currencies. Therefore, we are exposed to volatility in those other currencies, and this volatility may differ from period to period. As a result, the foreign currency impact on our operating results for one period may not be indicative of future results.
During 2018, income from operations would have decreased or increased approximately
$119 million
if all foreign currencies uniformly weakened or strengthened 10% relative to the U.S. dollar, holding other variables constant, including sales volumes. The effect of a uniform movement of all currencies by 10% is provided to illustrate a hypothetical scenario and related effect on operating income. Actual results will differ as foreign currencies may move in uniform or different directions and in different magnitudes.
Interest Rate Risk
We are exposed to changes in interest rates related to our Term Loan Facility and Revolving Credit Facility, which bear interest at LIBOR/EURIBOR plus a spread, subject to a LIBOR/EURIBOR floor. Generally, interest rate changes could impact the amount of our interest paid and, therefore, our future earnings and cash flows, assuming other factors are held constant. To mitigate the impact of changes in LIBOR/EURIBOR on interest expense for a portion of our variable rate debt, we have entered into interest rate swaps. We account for these derivatives as cash flow hedges, and as such, the unrealized changes in market value are recorded in AOCI and reclassified into earnings during the period in which the hedged forecasted transaction affects earnings. At
December 31, 2018
, we had a series of receive-variable, pay-fixed interest rate swaps to hedge the variability in the interest payments on $3,500 million of our Term Loan Facility through the expiration of the final swap on February 17, 2024. The notional value of the swaps is $3,500 million.
Based on the portion of our variable rate debt balance in excess of the notional amount of the interest rate swaps and LIBOR as of
December 31, 2018
, a hypothetical 1.00% increase in LIBOR would increase our annual interest expense by approximately
$28 million
.
46
Commodity Price Risk
We purchase certain products, which are subject to price volatility that is caused by weather, market conditions and other factors that are not considered predictable or within our control. However, in our TH business, we employ various purchasing and pricing contract techniques, such as setting fixed prices for periods of up to one year with suppliers, in an effort to minimize volatility of certain of these commodities. Given that we purchase a significant amount of green coffee, we typically have purchase commitments fixing the price for a minimum of six to twelve months depending upon prevailing market conditions. We also typically hedge against the risk of foreign exchange on green coffee prices.
We occasionally take forward pricing positions through our suppliers to manage commodity prices. As a result, we purchase commodities and other products at market prices, which fluctuate on a daily basis and may differ between different geographic regions, where local regulations may affect the volatility of commodity prices.
We do not make use of financial instruments to hedge commodity prices. As we make purchases beyond our current commitments, we may be subject to higher commodity prices depending upon prevailing market conditions at such time. Generally, increases and decreases in commodity costs are largely passed through to franchisee owners, resulting in higher or lower revenues and higher or lower costs of sales from our business. These changes may impact margins as many of these products are typically priced based on a fixed-dollar mark-up. We and our franchisees have some ability to increase product pricing to offset a rise in commodity prices, subject to acceptance by franchisees and guests.
Impact of Inflation
We believe that our results of operations are not materially impacted by moderate changes in the inflation rate. Inflation did not have a material impact on our operations in 2018, 2017 or 2016. However, severe increases in inflation could affect the global, Canadian and U.S. economies and could have an adverse impact on our business, financial condition and results of operations. If several of the various costs in our business experience inflation at the same time, such as commodity price increases beyond our ability to control and increased labor costs, we and our franchisees may not be able to adjust prices to sufficiently offset the effect of the various cost increases without negatively impacting consumer demand.
Disclosures Regarding Partnership Pursuant to Canadian Exemptive Relief
RBI is the sole general partner of Partnership. To address certain disclosure conditions to the exemptive relief that Partnership received from the Canadian securities regulatory authorities, RBI provides a summary of certain terms of the Partnership exchangeable units in its annual report on Form 10-K. The same summary is provided below. This summary is not complete and is qualified in its entirety by the complete text of the Amended and Restated Limited Partnership Agreement, dated December 11, 2014, between RBI, 8997896 Canada Inc. and each person who is admitted as a Limited Partner in accordance with the terms of the agreement (the “partnership agreement”) and the Voting Trust Agreement, dated December 12, 2014, between RBI, Partnership and Computershare Trust Company of Canada (the “voting trust agreement”), copies of which are available on SEDAR at www.sedar.com and at www.sec.gov.
The Partnership Exchangeable Units
The capital of Partnership consists of three classes of units: the Partnership Class A common units, the Partnership preferred units and the Partnership exchangeable units. The interest of RBI, as the sole general partner of Partnership, is represented by Class A common units and preferred units. The interests of the limited partners is represented by the Partnership exchangeable units.
Summary of Economic and Voting Rights
The Partnership exchangeable units are intended to provide economic rights that are substantially equivalent, and voting rights with respect to RBI that are equivalent, to the corresponding rights afforded to holders of RBI common shares. Under the terms of the partnership agreement, the rights, privileges, restrictions and conditions attaching to the Partnership exchangeable units include the following:
|
•
|
The Partnership exchangeable units are exchangeable at any time, at the option of the holder (the “exchange right”), on a one-for-one basis for common shares of RBI (the “exchanged shares”), subject to RBI’s right as the general partner (subject to the approval of the conflicts committee in certain circumstances) to determine to settle any such exchange for a cash payment in lieu of RBI common shares. If RBI elects to make a cash payment in lieu of issuing common shares, the amount of the cash payment will be the weighted average trading price of the common shares on the NYSE for the 20 consecutive trading days ending on the last business day prior to the exchange date (the “exchangeable units cash amount”). Written notice of the determination of the form of consideration shall be given to the holder of the Partnership exchangeable units exercising the exchange right no later than ten business days prior to the exchange date.
|
47
|
•
|
If a dividend or distribution has been declared and is payable in respect of a common share of RBI, Partnership will make a distribution in respect of each Partnership exchangeable unit in an amount equal to the dividend or distribution in respect of a common share. The record date and payment date for distributions on the Partnership exchangeable units will be the same as the relevant record date and payment date for the dividends or distributions on RBI common shares.
|
|
•
|
If RBI issues any common shares in the form of a dividend or distribution on the RBI common shares, Partnership will issue to each holder of Partnership exchangeable units, in respect of each exchangeable unit held by such holder, a number of Partnership exchangeable units equal to the number of common shares issued in respect of each common share.
|
|
•
|
If RBI issues or distributes rights, options or warrants or other securities or assets of RBI to all or substantially all of the holders of its common shares, Partnership is required to make a corresponding distribution to holders of the Partnership exchangeable units.
|
|
•
|
No subdivision or combination of RBI’s outstanding common shares is permitted unless a corresponding subdivision or combination of Partnership exchangeable units is made.
|
|
•
|
RBI and its board of directors are prohibited from proposing or recommending an offer for its common shares or for the Partnership exchangeable units unless the holders of the Partnership exchangeable units and the holders of common shares are entitled to participate to the same extent and on equitably equivalent basis.
|
|
•
|
Upon a dissolution and liquidation of Partnership, if Partnership exchangeable units remain outstanding and have not been exchanged for RBI common shares, then the distribution of the assets of Partnership between holders of RBI common shares and holders of Partnership exchangeable units will be made on a pro rata basis based on the numbers of common shares and Partnership exchangeable units outstanding. Assets distributable to holders of Partnership exchangeable units will be distributed directly to such holders. Assets distributable in respect of RBI common shares will be distributed to RBI. Prior to this pro rata distribution, Partnership is required to pay to RBI sufficient amounts to fund RBI’s expenses or other obligations (to the extent related to RBI’s role as the general partner or its business and affairs that are conducted through Partnership or its subsidiaries) to ensure that any property and cash distributed to RBI in respect of the common shares will be available for distribution to holders of common shares in an amount per share equal to distributions in respect of each Partnership exchangeable unit. The terms of the Partnership exchangeable units do not provide for an automatic exchange of Partnership exchangeable units into common shares upon a dissolution or liquidation of Partnership or RBI.
|
|
•
|
Approval of holders of the Partnership exchangeable units is required for an action (such as an amendment to the partnership agreement) that would affect the economic rights of a Partnership exchangeable unit relative to a common share of RBI.
|
|
•
|
The holders of Partnership exchangeable units are indirectly entitled to vote in respect of matters on which holders of RBI common shares are entitled to vote, including in respect of the election of RBI’s directors, through a special voting share of RBI. The special voting share is held by a trustee, entitling the trustee to that number of votes on matters on which holders of common shares are entitled to vote equal to the number of Partnership exchangeable units outstanding. The trustee is required to cast such votes in accordance with voting instructions provided by holders of Partnership exchangeable units. The trustee will exercise each vote attached to the special voting share only as directed by the relevant holder of Partnership exchangeable units and, in the absence of instructions from a holder of an exchangeable unit as to voting, will not exercise those votes. Except as otherwise required by the partnership agreement, voting trust agreement or applicable law, the holders of the Partnership exchangeable units are not directly entitled to receive notice of or to attend any meeting of the unitholders of Partnership or to vote at any such meeting.
|
Exercise of Optional Exchange Right
In order to exercise the exchange right referred to above, a holder of Partnership exchangeable units must deliver to Partnership’s transfer agent a duly executed exchange notice together with such additional documents and instruments as the transfer agent and Partnership may reasonably require. The exchange notice must (i) specify the number of Partnership exchangeable units in respect of which the holder is exercising the exchange right and (ii) state the business day on which the holder desires to have Partnership exchange the subject units, provided that the exchange date must not be less than 15 business days nor more than 30 business days after the date on which the exchange notice is received by Partnership. If no exchange date is specified in an exchange notice, the exchange date will be deemed to be the 15th business day after the date on which the exchange notice is received by Partnership. An exercise of the exchange right may be revoked by the exercising holder by notice in writing given to Partnership before the close of business on the fifth business day immediately preceding the exchange date. On the exchange date, Partnership will deliver or cause the transfer agent to deliver to the relevant holder, as applicable (i) the applicable number of exchanged shares, or (ii) a cheque representing the applicable exchangeable units cash amount, in each case, less any amounts withheld on account of tax.
48
Offers for Units or Shares
The partnership agreement contains provisions to the effect that if a take-over bid is made for all of the outstanding Partnership exchangeable units and not less than 90% of the Partnership exchangeable units (other than units of Partnership held at the date of the take-over bid by or on behalf of the offeror or its associates or associates) are taken up and paid for by the offeror, the offeror will be entitled to acquire the Partnership exchangeable units held by unitholders who did not accept the offer on the terms offered by the offeror. The partnership agreement further provides that for so long as Partnership exchangeable units remain outstanding, (i) RBI will not propose or recommend a formal bid for RBI common shares, and no such bid will be effected with the consent or approval of RBI’s board of directors, unless holders of Partnership exchangeable units are entitled to participate in the bid to the same extent and on an equitably equivalent basis as the holders of RBI’s common shares, and (ii) RBI will not propose or recommend a formal bid for Partnership exchangeable units, and no such bid will be effected with the consent or approval of RBI’s board of directors, unless holders of the RBI common shares are entitled to participate in the bid to the same extent and on an equitably equivalent basis as the holders of Partnership exchangeable units. Canadian securities regulatory authorities may intervene in the public interest (either on application by an interested party or by staff of a Canadian securities regulatory authority) to prevent an offer to holders of RBI common shares, Preferred Shares or Partnership exchangeable units being made or completed where such offer is abusive of the holders of one of those security classes that are not subject to that offer.
Merger, Sale or Other Disposition of Assets
As long as any Partnership exchangeable units are outstanding, RBI cannot consummate a transaction in which all or substantially all of its assets would become the property of any other person or entity. This does not apply to a transaction if such other person or entity becomes bound by the partnership agreement and assumes RBI’s obligations, as long as the transaction does not impair in any material respect the rights, duties, powers and authorities of other parties to the partnership agreement.
Mandatory Exchange
Partnership may cause a mandatory exchange of the outstanding Partnership exchangeable units into the RBI common shares in the event that (1) at any time there remain outstanding fewer than 5% of the number of Partnership exchangeable units outstanding as of the effective time of the Merger (other than Partnership exchangeable units held by RBI and its subsidiaries and as such number of Partnership exchangeable units may be adjusted in accordance with the partnership agreement); (2) any one of the following occurs: (i) any person, firm or corporation acquires directly or indirectly any voting security of RBI and immediately after such acquisition, the acquirer has voting securities representing more than 50% of the total voting power of all the then outstanding voting securities of RBI on a fully diluted basis, (ii) the shareholders of RBI shall approve a merger, consolidation, recapitalization or reorganization of RBI, other than any transaction which would result in the holders of outstanding voting securities of RBI immediately prior to such transaction having at least a majority of the total voting power represented by the voting securities of the surviving entity outstanding immediately after such transaction, with the voting power of each such continuing holder relative to other continuing holders not being altered substantially in the transaction; or (iii) the shareholders of RBI shall approve a plan of complete liquidation of RBI or an agreement for the sale or disposition of RBI of all or substantially all of RBI’s assets, provided that, in each case, RBI, in its capacity as the general partner of Partnership, determines, in good faith and in its sole discretion, that such transaction involves a bona fide third party and is not for the primary purpose of causing the exchange of the exchangeable units in connection with such transaction; or (3) a matter arises in respect of which applicable law provides holders of Partnership exchangeable units with a vote as holders of units of Partnership in order to approve or disapprove, as applicable, any change to, or in the rights of the holders of, the Partnership exchangeable units, where the approval or disapproval, as applicable, of such change would be required to maintain the economic equivalence of the Partnership exchangeable units and the RBI common shares, and the holders of the Partnership exchangeable units fail to take the necessary action at a meeting or other vote of holders of Partnership exchangeable units to approve or disapprove, as applicable, such matter in order to maintain economic equivalence of the Partnership exchangeable units and the RBI common shares.
49
Special Note Regarding Forward-Looking Statements
Certain information contained in our Annual Report, including information regarding future financial performance and plans, targets, aspirations, expectations, and objectives of management, constitute forward-looking statements within the meaning of the Private Securities Litigation Reform Act of 1995 and forward-looking information within the meaning of the Canadian securities laws. We refer to all of these as forward-looking statements. Forward-looking statements are forward-looking in nature and, accordingly, are subject to risks and uncertainties. These forward-looking statements can generally be identified by the use of words such as “believe”, “anticipate”, “expect”, “intend”, “estimate”, “plan”, “continue”, “will”, “may”, “could”, “would”, “target”, “potential” and other similar expressions and include, without limitation, statements regarding our expectations or beliefs regarding (i) our ability to become one of the most efficient franchised QSR operators in the world; (ii) the benefits of our fully franchised business model; (iii) the domestic and international growth opportunities for the Tim Hortons, Burger King and Popeyes brands, both in existing and new markets; (iv) our ability to accelerate international development through joint venture structures and master franchise and development agreements and the impact on future growth and profitability of our brands; (v) our continued use of joint ventures structures and master franchise and development agreements in connection with our domestic and international expansion; (vi) the impact of our strategies on the growth of our Tim Hortons, Burger King and Popeyes brands and our profitability; (vii) our commitment to technology and innovation; (viii) the correlation between our sales, guest traffic and profitability to consumer discretionary spending and the factors that influence spending; (ix) our ability to drive traffic, expand our customer base and allow restaurants to expand into new dayparts through new product innovation; (x) the benefits accrued from sharing and leveraging best practices among our Tim Hortons, Burger King and Popeyes brands; (xi) the drivers of the long-term success for and competitive position of each of our brands as well as increased sales and profitability of our franchisees; (xii) the impact of our cost management initiatives at each of our brands; (xiii) the continued use of certain franchise incentives and their impact on our financial results; (xiv) the impact of our modern image remodel initiative; (xv) our future financial obligations, including annual debt service requirements, capital expenditures and distributions, the source of liquidity needed to satisfy such obligations, and our ability to meet such obligations; (xvi) future PLK Transaction costs and Corporate restructuring and tax advisory fees; (xvii) our plans to build new warehouses and renovate existing warehouses and the anticipated timing for completion; (xviii) our exposure to changes in interest rates and foreign currency exchange rates and the impact of changes in interest rates and foreign currency exchange rates on the amount of our interest payments, future earnings and cash flows; (xix) our tax positions and their compliance with applicable tax laws; (xx) certain accounting matters, including the impact of changes in accounting standards and our transition to ASC 606; (xxi) certain tax matters, such as our estimates with respect to tax matters as a result of the Tax Act, including our effective tax rate for 2019 and the impacts of the Tax Act; (xxii) the impact of inflation on our results of operations; (xxiii) the impact of governmental regulation, both domestically and internationally, on our business and financial and operational results; (xxiv) the adequacy of our facilities to meet our current requirements; (xxv) our future financial and operational results; (xxvi) certain litigation matters; and (xxvii) our target total distributions for 2019.
These forward looking statements represent management’s expectations as of the date hereof. These forward-looking statements are based on certain assumptions and analyses that we made in light of our experience and our perception of historical trends, current conditions and expected future developments, as well as other factors we believe are appropriate in the circumstances. However, these forward-looking statements are subject to a number of risks and uncertainties and actual results may differ materially from those expressed or implied in such statements. Important factors that could cause actual results, level of activity, performance or achievements to differ materially from those expressed or implied by these forward-looking statements include, among other things, risks related to: (1) our substantial indebtedness, which could adversely affect our financial condition and prevent us from fulfilling our obligations; (2) global economic or other business conditions that may affect the desire or ability of our customers to purchase our products such as inflationary pressures, high unemployment levels, declines in median income growth, consumer confidence and consumer discretionary spending and changes in consumer perceptions of dietary health and food safety; (3) our relationship with, and the success of, our franchisees and risks related to our fully franchised business model; (4) the effectiveness of our marketing and advertising programs and franchisee support of these programs; (5) significant and rapid fluctuations in interest rates and in the currency exchange markets and the effectiveness of our hedging activity; (6) our ability to successfully implement our domestic and international growth strategy for each of our brands and risks related to our international operations; (7) our reliance on master franchisees and subfranchisees to accelerate restaurant growth; (8) the ability of the counterparties to our credit facilities’ and derivatives’ to fulfill their commitments and/or obligations; (9) changes in applicable tax laws or interpretations thereof; and risks related to the complexity of the Tax Act and our ability to accurately interpret and predict its impact on our financial condition and results.
Finally, our future results will depend upon various other risks and uncertainties, including, but not limited to, those detailed in the section entitled “Item 1A - Risk Factors” of our Annual Report as well as other materials that we from time to time file with, or furnish to, the SEC or file with Canadian securities regulatory authorities on SEDAR. All forward-looking statements attributable to us or persons acting on our behalf are expressly qualified in their entirety by the cautionary statements in this section and elsewhere in this annual report. Other than as required under securities laws, we do not assume a duty to update these forward-looking statements, whether as a result of new information, subsequent events or circumstances, changes in expectations or otherwise.
50
Item 8.
Financial Statements and Supplementary Data
RESTAURANT BRANDS INTERNATIONAL LIMITED PARTNERSHIP AND SUBSIDIARIES
INDEX TO CONSOLIDATED FINANCIAL STATEMENTS
|
|
Page
|
51
Management’s Report on Internal Control Over Financial Reporting
Management of Restaurant Brands International Inc. (“RBI”), the sole general partner of Restaurant Brands International Limited Partnership (the “Partnership”), is responsible for the preparation, integrity and fair presentation of the consolidated financial statements, related notes and other information included in this annual report. The consolidated financial statements were prepared in accordance with accounting principles generally accepted in the United States of America and include certain amounts based on management’s estimates and assumptions. Other financial information presented in the annual report is derived from the consolidated financial statements.
Management is also responsible for establishing and maintaining adequate internal control over financial reporting, and for performing an assessment of the effectiveness of internal control over financial reporting as of
December 31, 2018
. Internal control over financial reporting is a process designed to provide reasonable assurance regarding the reliability of financial reporting and the preparation of financial statements for external purposes in accordance with generally accepted accounting principles. Our system of internal control over financial reporting includes those policies and procedures that (i) pertain to the maintenance of records that, in reasonable detail, accurately and fairly reflect the transactions and dispositions of the assets of Partnership; (ii) provide reasonable assurance that transactions are recorded as necessary to permit preparation of financial statements in accordance with generally accepted accounting principles, and that receipts and expenditures of Partnership are being made only in accordance with authorizations of management and directors of RBI; and (iii) provide reasonable assurance regarding prevention or timely detection of unauthorized acquisition, use or disposition of Partnership’s assets that could have a material effect on the consolidated financial statements.
Management performed an assessment of the effectiveness of Partnership’s internal control over financial reporting as of
December 31, 2018
based on criteria established in
Internal Control — Integrated Framework (2013)
issued by the Committee of Sponsoring Organizations of the Treadway Commission (COSO). Based on our assessment and those criteria, management determined that Partnership’s internal control over financial reporting was effective as of
December 31, 2018
.
Because of its inherent limitations, internal control over financial reporting may not prevent or detect misstatements. Also, projections of any evaluation of effectiveness to future periods are subject to the risk that controls may become inadequate because of changes in conditions, or that the degree of compliance with the policies or procedures may deteriorate.
The effectiveness of Partnership’s internal control over financial reporting as of
December 31, 2018
has been audited by KPMG LLP, Partnership’s independent registered public accounting firm, as stated in its report which is included herein.
52
Report of Independent Registered Public Accounting Firm
The Board of Directors
Restaurant Brands International Inc., the sole general partner of Restaurant Brands International Limited Partnership:
Opinion on the Consolidated Financial Statements
We have audited the accompanying consolidated balance sheets of Restaurant Brands International Limited Partnership and subsidiaries (the “Partnership”) as of
December 31, 2018
and
2017
, the related consolidated statements of operations, comprehensive income (loss), equity, and cash flows for each of the years in the three-year period ended
December 31, 2018
, and the related notes (collectively, the “consolidated financial statements”). In our opinion, the consolidated financial statements present fairly, in all material respects, the financial position of the Partnership as of
December 31, 2018
and
2017
, and the results of its operations and its cash flows for each of the years in the three-year period ended
December 31, 2018
, in conformity with U.S. generally accepted accounting principles.
We also have audited, in accordance with the standards of the Public Company Accounting Oversight Board (United States) (“PCAOB”), the Partnership’s internal control over financial reporting as of
December 31, 2018
, based on criteria established in
Internal Control - Integrated Framework (2013)
issued by the Committee of Sponsoring Organizations of the Treadway Commission, and our report dated
February 22, 2019
expressed an unqualified opinion on the effectiveness of the Partnership’s internal control over financial reporting.
Change in Accounting Principle
As discussed in Note 2 to the consolidated financial statements, the Partnership has changed its method of accounting for revenue from contracts with customers in 2018 due to the adoption of the new revenue standard.
Basis for Opinion
These consolidated financial statements are the responsibility of the Partnership’s management. Our responsibility is to express an opinion on these consolidated financial statements based on our audits. We are a public accounting firm registered with the PCAOB and are required to be independent with respect to the Partnership in accordance with the U.S. federal securities laws and the applicable rules and regulations of the Securities and Exchange Commission and the PCAOB.
We conducted our audits in accordance with the standards of the PCAOB. Those standards require that we plan and perform the audit to obtain reasonable assurance about whether the consolidated financial statements are free of material misstatement, whether due to error or fraud. Our audits included performing procedures to assess the risks of material misstatement of the consolidated financial statements, whether due to error or fraud, and performing procedures that respond to those risks. Such procedures included examining, on a test basis, evidence regarding the amounts and disclosures in the consolidated financial statements. Our audits also included evaluating the accounting principles used and significant estimates made by management, as well as evaluating the overall presentation of the consolidated financial statements. We believe that our audits provide a reasonable basis for our opinion.
(signed) KPMG LLP
We have served as the Partnership's auditor since 1989.
Miami, Florida
February 22, 2019
53
Report of Independent Registered Public Accounting Firm
The Board of Directors
Restaurant Brands International Inc., the sole general partner of Restaurant Brands International Limited Partnership:
Opinion on Internal Control over Financial Reporting
We have audited Restaurant Brands International Limited Partnership and subsidiaries’ (the “Partnership”) internal control over financial reporting as of
December 31, 2018
, based on criteria established in
Internal Control – Integrated Framework (2013)
issued by the Committee of Sponsoring Organizations of the Treadway Commission. In our opinion, the Partnership maintained, in all material respects, effective internal control over financial reporting as of
December 31, 2018
, based on criteria established in
Internal Control – Integrated Framework (2013)
issued by the Committee of Sponsoring Organizations of the Treadway Commission.
We also have audited, in accordance with the standards of the Public Company Accounting Oversight Board (United States) (“PCAOB”), the consolidated balance sheets of the Partnership as of
December 31, 2018
and
2017
, the related consolidated statements of operations, comprehensive income (loss), equity, and cash flows for each of the years in the three-year period ended
December 31, 2018
, and the related notes (collectively, the “consolidated financial statements”), and our report dated
February 22, 2019
expressed an unqualified opinion on those consolidated financial statements.
Basis for Opinion
The Partnership's management is responsible for maintaining effective internal control over financial reporting and for its assessment of the effectiveness of internal control over financial reporting, included in the accompanying Management’s Report on Internal Control over Financial Reporting. Our responsibility is to express an opinion on the Partnership's internal control over financial reporting based on our audit. We are a public accounting firm registered with the PCAOB and are required to be independent with respect to the Partnership in accordance with the U.S. federal securities laws and the applicable rules and regulations of the Securities and Exchange Commission and the PCAOB.
We conducted our audit in accordance with the standards of the PCAOB. Those standards require that we plan and perform the audit to obtain reasonable assurance about whether effective internal control over financial reporting was maintained in all material respects. Our audit of internal control over financial reporting included obtaining an understanding of internal control over financial reporting, assessing the risk that a material weakness exists, and testing and evaluating the design and operating effectiveness of internal control based on the assessed risk. Our audit also included performing such other procedures as we considered necessary in the circumstances. We believe that our audit provides a reasonable basis for our opinion.
Definition and Limitations of Internal Control over Financial Reporting
A company’s internal control over financial reporting is a process designed to provide reasonable assurance regarding the reliability of financial reporting and the preparation of financial statements for external purposes in accordance with generally accepted accounting principles. A company’s internal control over financial reporting includes those policies and procedures that (1) pertain to the maintenance of records that, in reasonable detail, accurately and fairly reflect the transactions and dispositions of the assets of the company; (2) provide reasonable assurance that transactions are recorded as necessary to permit preparation of financial statements in accordance with generally accepted accounting principles, and that receipts and expenditures of the company are being made only in accordance with authorizations of management and directors of the company; and (3) provide reasonable assurance regarding prevention or timely detection of unauthorized acquisition, use, or disposition of the company’s assets that could have a material effect on the financial statements.
Because of its inherent limitations, internal control over financial reporting may not prevent or detect misstatements. Also, projections of any evaluation of effectiveness to future periods are subject to the risk that controls may become inadequate because of changes in conditions, or that the degree of compliance with the policies or procedures may deteriorate.
(signed) KPMG LLP
Miami, Florida
February 22, 2019
54
RESTAURANT BRANDS INTERNATIONAL LIMITED PARTNERSHIP AND SUBSIDIARIES
Consolidated Balance Sheets
(In millions of U.S. dollars, except unit data)
|
|
As of December 31,
|
||||||
|
|
2018
|
2017
|
|||||
|
ASSETS
|
|
|
|||||
|
Current assets:
|
|||||||
|
Cash and cash equivalents
|
$
|
913
|
|
$
|
1,097
|
|
|
|
Accounts and notes receivable, net of allowance of $14 and $16, respectively
|
452
|
|
489
|
|
|||
|
Inventories, net
|
75
|
|
78
|
|
|||
|
Prepaids and other current assets
|
60
|
|
86
|
|
|||
|
Total current assets
|
1,500
|
|
1,750
|
|
|||
|
Property and equipment, net of accumulated depreciation and amortization of $704 and $623, respectively
|
1,996
|
|
2,133
|
|
|||
|
Intangible assets, net
|
10,463
|
|
11,062
|
|
|||
|
Goodwill
|
5,486
|
|
5,782
|
|
|||
|
Net investment in property leased to franchisees
|
54
|
|
71
|
|
|||
|
Other assets, net
|
642
|
|
426
|
|
|||
|
Total assets
|
$
|
20,141
|
|
$
|
21,224
|
|
|
|
LIABILITIES AND EQUITY
|
|
|
|||||
|
Current liabilities:
|
|||||||
|
Accounts and drafts payable
|
$
|
513
|
|
$
|
496
|
|
|
|
Other accrued liabilities
|
637
|
|
866
|
|
|||
|
Gift card liability
|
167
|
|
215
|
|
|||
|
Current portion of long term debt and capital leases
|
91
|
|
78
|
|
|||
|
Total current liabilities
|
1,408
|
|
1,655
|
|
|||
|
Term debt, net of current portion
|
11,823
|
|
11,801
|
|
|||
|
Capital leases, net of current portion
|
226
|
|
244
|
|
|||
|
Other liabilities, net
|
1,547
|
|
1,455
|
|
|||
|
Deferred income taxes, net
|
1,519
|
|
1,508
|
|
|||
|
Total liabilities
|
16,523
|
|
16,663
|
|
|||
|
Commitments and contingencies (Note 18)
|
|
|
|||||
|
Partners’ capital:
|
|||||||
|
Class A common units - 202,006,067 units issued and outstanding at December 31, 2018 and December 31, 2017
|
4,323
|
|
4,168
|
|
|||
|
Partnership exchangeable units - 207,523,591 units issued and outstanding at December 31, 2018; 217,708,924 units issued and outstanding at December 31, 2017
|
730
|
|
1,276
|
|
|||
|
Accumulated other comprehensive income (loss)
|
(1,437
|
)
|
(884
|
)
|
|||
|
Total Partners’ capital
|
3,616
|
|
4,560
|
|
|||
|
Noncontrolling interests
|
2
|
|
1
|
|
|||
|
Total equity
|
3,618
|
|
4,561
|
|
|||
|
Total liabilities and equity
|
$
|
20,141
|
|
$
|
21,224
|
|
|
See accompanying notes to consolidated financial statements.
Approved on behalf of the Board of Directors of Restaurant Brands International Inc., as general partner of Restaurant Brands International Limited Partnership:
|
By:
|
|
/s/ Alexandre Behring
|
|
By:
|
|
/s/ Paul J. Fribourg
|
|
|
Alexandre Behring, Co-Chairman of Restaurant Brands International Inc.
|
|
|
Paul J. Fribourg, Director of Restaurant Brands International Inc.
|
||
55
RESTAURANT BRANDS INTERNATIONAL LIMITED PARTNERSHIP AND SUBSIDIARIES
Consolidated Statements of Operations
(In millions of U.S. dollars, except unit data)
|
2018
|
2017
|
2016
|
|||||||||
|
Revenues:
|
|||||||||||
|
Sales
|
$
|
2,355
|
|
$
|
2,390
|
|
$
|
2,205
|
|
||
|
Franchise and property revenues (Note 16)
|
3,002
|
|
2,186
|
|
1,941
|
|
|||||
|
Total revenues
|
5,357
|
|
4,576
|
|
4,146
|
|
|||||
|
Operating costs and expenses:
|
|||||||||||
|
Cost of sales
|
1,818
|
|
1,850
|
|
1,727
|
|
|||||
|
Franchise and property expenses
|
422
|
|
478
|
|
454
|
|
|||||
|
Selling, general and administrative expenses (Note 16)
|
1,214
|
|
416
|
|
319
|
|
|||||
|
(Income) loss from equity method investments
|
(22
|
)
|
(12
|
)
|
(20
|
)
|
|||||
|
Other operating expenses (income), net
|
8
|
|
109
|
|
(1
|
)
|
|||||
|
Total operating costs and expenses
|
3,440
|
|
2,841
|
|
2,479
|
|
|||||
|
Income from operations
|
1,917
|
|
1,735
|
|
1,667
|
|
|||||
|
Interest expense, net
|
535
|
|
512
|
|
467
|
|
|||||
|
Loss on early extinguishment of debt
|
—
|
|
122
|
|
—
|
|
|||||
|
Income before income taxes
|
1,382
|
|
1,101
|
|
1,200
|
|
|||||
|
Income tax (benefit) expense
|
238
|
|
(134
|
)
|
244
|
|
|||||
|
Net income
|
1,144
|
|
1,235
|
|
956
|
|
|||||
|
Net income attributable to noncontrolling interests
|
1
|
|
2
|
|
3
|
|
|||||
|
Partnership preferred unit distributions
|
—
|
|
256
|
|
270
|
|
|||||
|
Gain on redemption of Partnership preferred units (Note 13)
|
—
|
|
(234
|
)
|
—
|
|
|||||
|
Net income attributable to common unitholders
|
$
|
1,143
|
|
$
|
1,211
|
|
$
|
683
|
|
||
|
Earnings per unit - basic and diluted (Note 4):
|
|||||||||||
|
Class A common units
|
$
|
3.03
|
|
$
|
3.10
|
|
$
|
1.71
|
|
||
|
Partnership exchangeable units
|
$
|
2.46
|
|
$
|
2.59
|
|
$
|
1.48
|
|
||
|
Weighted average units outstanding - basic and diluted (Note 4):
|
|||||||||||
|
Class A common units
|
202
|
|
202
|
|
202
|
|
|||||
|
Partnership exchangeable units
|
216
|
|
226
|
|
228
|
|
|||||
See accompanying notes to consolidated financial statements.
56
RESTAURANT BRANDS INTERNATIONAL LIMITED PARTNERSHIP AND SUBSIDIARIES
Consolidated Statements of Comprehensive Income (Loss)
(In millions of U.S. dollars)
|
2018
|
2017
|
2016
|
|||||||||
|
Net income
|
$
|
1,144
|
|
$
|
1,235
|
|
$
|
956
|
|
||
|
Foreign currency translation adjustment
|
(831
|
)
|
824
|
|
223
|
|
|||||
|
Net change in fair value of net investment hedges, net of tax of $(101), $13, and $(12)
|
282
|
|
(371
|
)
|
(99
|
)
|
|||||
|
Net change in fair value of cash flow hedges, net of tax of $7, $4, and $7
|
(19
|
)
|
(11
|
)
|
(20
|
)
|
|||||
|
Amounts reclassified to earnings of cash flow hedges, net of tax of $(5), $(9), and $(6)
|
14
|
|
25
|
|
16
|
|
|||||
|
Gain (loss) recognized on defined benefit pension plans, net of tax of $0, $2, and $2
|
1
|
|
4
|
|
(8
|
)
|
|||||
|
Other comprehensive income (loss)
|
(553
|
)
|
471
|
|
112
|
|
|||||
|
Comprehensive income (loss)
|
591
|
|
1,706
|
|
1,068
|
|
|||||
|
Comprehensive income (loss) attributable to noncontrolling interests
|
1
|
|
2
|
|
3
|
|
|||||
|
Comprehensive income (loss) attributable to preferred unitholders
|
—
|
|
22
|
|
270
|
|
|||||
|
Comprehensive income (loss) attributable to common unitholders
|
$
|
590
|
|
$
|
1,682
|
|
$
|
795
|
|
||
See accompanying notes to consolidated financial statements.
57
RESTAURANT BRANDS INTERNATIONAL LIMITED PARTNERSHIP AND SUBSIDIARIES
Consolidated Statements of Equity
(In millions of U.S. dollars, except unit data)
|
|
Class A
Common Units |
Partnership
Exchangeable units |
Accumulated
Other Comprehensive Income (Loss) |
Noncontrolling
Interests |
Total
|
||||||||||||||||||||
|
|
Units
|
Amount
|
Units
|
Amount
|
|||||||||||||||||||||
|
Balances at Balances at December 31, 2015
|
202,006,067
|
|
$
|
2,878
|
|
233,739,648
|
|
$
|
1,503
|
|
$
|
(1,467
|
)
|
$
|
—
|
|
$
|
2,914
|
|
||||||
|
Distributions declared on Class A common units ($0.72 per unit)
|
—
|
|
(145
|
)
|
—
|
|
—
|
|
—
|
|
—
|
|
(145
|
)
|
|||||||||||
|
Distributions declared on partnership exchangeable units ($0.62 per unit)
|
—
|
|
—
|
|
—
|
|
(141
|
)
|
—
|
|
—
|
|
(141
|
)
|
|||||||||||
|
Preferred unit distributions
|
—
|
|
(137
|
)
|
—
|
|
(133
|
)
|
—
|
|
—
|
|
(270
|
)
|
|||||||||||
|
Repurchase of Partnership exchangeable units
|
—
|
|
—
|
|
—
|
|
—
|
|
—
|
|
—
|
|
—
|
|
|||||||||||
|
Exchange of Partnership exchangeable units for RBI common shares
|
—
|
|
223
|
|
(6,744,244
|
)
|
(223
|
)
|
—
|
|
—
|
|
—
|
|
|||||||||||
|
Capital contribution from RBI Inc.
|
—
|
|
63
|
|
—
|
|
—
|
|
—
|
|
—
|
|
63
|
|
|||||||||||
|
Restaurant VIE distributions
|
—
|
|
—
|
|
—
|
|
—
|
|
—
|
|
—
|
|
—
|
|
|||||||||||
|
Net income
|
—
|
|
482
|
|
—
|
|
471
|
|
—
|
|
3
|
|
956
|
|
|||||||||||
|
Other comprehensive income (loss)
|
—
|
|
—
|
|
—
|
|
—
|
|
112
|
|
—
|
|
112
|
|
|||||||||||
|
Balances at Balances at December 31, 2016
|
202,006,067
|
|
$
|
3,364
|
|
226,995,404
|
|
$
|
1,477
|
|
$
|
(1,355
|
)
|
$
|
3
|
|
$
|
3,489
|
|
||||||
|
Distributions declared on Class A common units ($0.92 per unit)
|
—
|
|
(186
|
)
|
—
|
|
—
|
|
—
|
|
—
|
|
(186
|
)
|
|||||||||||
|
Distributions declared on partnership exchangeable units ($0.78 per unit)
|
—
|
|
—
|
|
—
|
|
(175
|
)
|
—
|
|
—
|
|
(175
|
)
|
|||||||||||
|
Preferred unit distributions
|
—
|
|
(131
|
)
|
—
|
|
(125
|
)
|
—
|
|
—
|
|
(256
|
)
|
|||||||||||
|
Exchange of Partnership exchangeable units for RBI common shares
|
—
|
|
280
|
|
(4,286,480
|
)
|
(280
|
)
|
—
|
|
—
|
|
—
|
|
|||||||||||
|
Repurchase of Partnership exchangeable units
|
—
|
|
—
|
|
(5,000,000
|
)
|
(330
|
)
|
—
|
|
—
|
|
(330
|
)
|
|||||||||||
|
Gain on redemption of partnership preferred units
|
—
|
|
122
|
|
—
|
|
112
|
|
—
|
|
—
|
|
234
|
|
|||||||||||
|
Capital contribution from RBI Inc.
|
—
|
|
83
|
|
—
|
|
—
|
|
—
|
|
—
|
|
83
|
|
|||||||||||
|
Restaurant VIE distributions
|
—
|
|
—
|
|
—
|
|
—
|
|
—
|
|
(4
|
)
|
(4
|
)
|
|||||||||||
|
Net income
|
—
|
|
636
|
|
—
|
|
597
|
|
—
|
|
2
|
|
1,235
|
|
|||||||||||
|
Other comprehensive income (loss)
|
—
|
|
—
|
|
—
|
|
—
|
|
471
|
|
—
|
|
471
|
|
|||||||||||
|
Balances at Balances at December 31, 2017
|
202,006,067
|
|
$
|
4,168
|
|
217,708,924
|
|
$
|
1,276
|
|
$
|
(884
|
)
|
$
|
1
|
|
$
|
4,561
|
|
||||||
|
Cumulative effect adjustment (Note 16)
|
—
|
|
(132
|
)
|
—
|
|
(118
|
)
|
—
|
|
—
|
|
(250
|
)
|
|||||||||||
|
Distributions declared on Class A common units ($2.23 per unit)
|
—
|
|
(452
|
)
|
—
|
|
—
|
|
—
|
|
—
|
|
(452
|
)
|
|||||||||||
|
Distributions declared on partnership exchangeable units ($1.80 per unit)
|
—
|
|
—
|
|
—
|
|
(387
|
)
|
—
|
|
—
|
|
(387
|
)
|
|||||||||||
|
Exchange of Partnership exchangeable units for RBI common shares
|
—
|
|
11
|
|
(185,333
|
)
|
(11
|
)
|
—
|
|
—
|
|
—
|
|
|||||||||||
|
Repurchase of Partnership exchangeable units
|
—
|
|
—
|
|
(10,000,000
|
)
|
(561
|
)
|
—
|
|
—
|
|
(561
|
)
|
|||||||||||
|
Capital contribution from RBI Inc.
|
—
|
|
116
|
|
—
|
|
—
|
|
—
|
|
—
|
|
116
|
|
|||||||||||
|
Net income
|
—
|
|
612
|
|
—
|
|
531
|
|
—
|
|
1
|
|
1,144
|
|
|||||||||||
|
Other comprehensive income (loss)
|
—
|
|
—
|
|
—
|
|
—
|
|
(553
|
)
|
—
|
|
(553
|
)
|
|||||||||||
|
Balances at December 31, 2018
|
202,006,067
|
|
$
|
4,323
|
|
207,523,591
|
|
$
|
730
|
|
$
|
(1,437
|
)
|
$
|
2
|
|
$
|
3,618
|
|
||||||
See accompanying notes to consolidated financial statements.
58
RESTAURANT BRANDS INTERNATIONAL LIMITED PARTNERSHIP AND SUBSIDIARIES
Consolidated Statements of Cash Flows
(In millions of U.S. dollars)
|
|
2018
|
2017
|
2016
|
||||||||
|
Cash flows from operating activities:
|
|||||||||||
|
Net income
|
$
|
1,144
|
|
$
|
1,235
|
|
$
|
956
|
|
||
|
Adjustments to reconcile net income to net cash provided by operating activities:
|
|||||||||||
|
Depreciation and amortization
|
180
|
|
182
|
|
172
|
|
|||||
|
Premiums paid and non-cash loss on early extinguishment of debt
|
—
|
|
119
|
|
—
|
|
|||||
|
Amortization of deferred financing costs and debt issuance discount
|
29
|
|
33
|
|
39
|
|
|||||
|
(Income) loss from equity method investments
|
(22
|
)
|
(12
|
)
|
(20
|
)
|
|||||
|
Loss (gain) on remeasurement of foreign denominated transactions
|
(33
|
)
|
77
|
|
(20
|
)
|
|||||
|
Net (gains) losses on derivatives
|
(40
|
)
|
31
|
|
21
|
|
|||||
|
Share-based compensation expense
|
48
|
|
48
|
|
35
|
|
|||||
|
Deferred income taxes
|
29
|
|
(742
|
)
|
80
|
|
|||||
|
Other
|
5
|
|
18
|
|
4
|
|
|||||
|
Changes in current assets and liabilities, excluding acquisitions and dispositions:
|
|||||||||||
|
Accounts and notes receivable
|
19
|
|
(30
|
)
|
(16
|
)
|
|||||
|
Inventories and prepaids and other current assets
|
(7
|
)
|
19
|
|
(10
|
)
|
|||||
|
Accounts and drafts payable
|
41
|
|
14
|
|
16
|
|
|||||
|
Other accrued liabilities and gift card liability
|
(219
|
)
|
360
|
|
(1
|
)
|
|||||
|
Tenant inducements paid to franchisees
|
(52
|
)
|
(20
|
)
|
(19
|
)
|
|||||
|
Other long-term assets and liabilities
|
43
|
|
99
|
|
(23
|
)
|
|||||
|
Net cash provided by operating activities
|
1,165
|
|
1,431
|
|
1,214
|
|
|||||
|
Cash flows from investing activities:
|
|||||||||||
|
Payments for property and equipment
|
(86
|
)
|
(37
|
)
|
(34
|
)
|
|||||
|
Proceeds from disposal of assets, restaurant closures and refranchisings
|
8
|
|
26
|
|
30
|
|
|||||
|
Net payment for purchase of Popeyes, net of cash acquired
|
—
|
|
(1,636
|
)
|
—
|
|
|||||
|
Return of investment on direct financing leases
|
16
|
|
16
|
|
17
|
|
|||||
|
Settlement/sale of derivatives, net
|
17
|
|
772
|
|
11
|
|
|||||
|
Other investing activities, net
|
1
|
|
1
|
|
3
|
|
|||||
|
Net cash provided by (used for) investing activities
|
(44
|
)
|
(858
|
)
|
27
|
|
|||||
|
Cash flows from financing activities:
|
|||||||||||
|
Proceeds from issuance of long-term debt
|
75
|
|
5,850
|
|
—
|
|
|||||
|
Repayments of long-term debt and capital leases
|
(74
|
)
|
(2,742
|
)
|
(70
|
)
|
|||||
|
Distributions to RBI for payments in connection with redemption of preferred shares
|
(60
|
)
|
(3,006
|
)
|
—
|
|
|||||
|
Payment of financing costs
|
(3
|
)
|
(63
|
)
|
—
|
|
|||||
|
Distributions paid on common, preferred and Partnership exchangeable units
|
(728
|
)
|
(664
|
)
|
(538
|
)
|
|||||
|
Repurchase of Partnership exchangeable units
|
(561
|
)
|
(330
|
)
|
—
|
|
|||||
|
Capital contribution from RBI Inc.
|
61
|
|
29
|
|
14
|
|
|||||
|
Excess tax benefits from share-based compensation
|
—
|
|
—
|
|
8
|
|
|||||
|
Other financing activities, net
|
5
|
|
(10
|
)
|
(5
|
)
|
|||||
|
Net cash provided by (used for) financing activities
|
(1,285
|
)
|
(936
|
)
|
(591
|
)
|
|||||
|
Effect of exchange rates on cash and cash equivalents
|
(20
|
)
|
24
|
|
(2
|
)
|
|||||
|
Increase (decrease) in cash and cash equivalents
|
(184
|
)
|
(339
|
)
|
648
|
|
|||||
|
Cash and cash equivalents at beginning of period
|
1,097
|
|
1,436
|
|
788
|
|
|||||
|
Cash and cash equivalents at end of period
|
$
|
913
|
|
$
|
1,097
|
|
$
|
1,436
|
|
||
|
Supplemental cashflow disclosures:
|
|||||||||||
|
Interest paid
|
$
|
561
|
|
$
|
447
|
|
$
|
407
|
|
||
|
Income taxes paid
|
$
|
433
|
|
$
|
200
|
|
$
|
159
|
|
||
See accompanying notes to consolidated financial statements.
59
RESTAURANT BRANDS INTERNATIONAL LIMITED PARTNERSHIP AND SUBSIDIARIES
Notes to Consolidated Financial Statements
Note 1. Description of Business and Organization
Description of Business
Restaurant Brands International Limited Partnership (“Partnership”, “we”, “us” or “our”) was formed on August 25, 2014 as a general partnership and was registered on October 27, 2014 as a limited partnership in accordance with the laws of the Province of Ontario. Pursuant to Rule 12g-3(a) under the Securities Exchange Act of 1934, as amended, Partnership is a successor issuer to Burger King Worldwide, Inc. We franchise and operate quick service restaurants serving premium coffee and other beverage and food products under the
Tim Hortons
®
brand (“Tim Hortons” or “TH”), fast food hamburgers principally under the
Burger King
®
brand (“Burger King” or “BK”), and chicken under the
Popeyes
®
brand (“Popeyes” or “PLK”). We are one of the world’s largest quick service restaurant, or QSR, companies as measured by total number of restaurants. As of
December 31, 2018
, we franchised or owned
4,846
Tim Hortons restaurants,
17,796
Burger King restaurants, and
3,102
Popeyes restaurants, for a total of
25,744
restaurants, and operate in more than
100
countries and U.S. territories. Approximately
100%
of current system-wide restaurants are franchised.
We are a subsidiary of Restaurant Brands International Inc. (“RBI”). RBI is our sole general partner, and as such, RBI has the exclusive right, power and authority to manage, control, administer and operate the business and affairs and to make decisions regarding the undertaking and business of Partnership in accordance with the partnership agreement of Partnership (“partnership agreement”) and applicable laws.
All references to “$” or “dollars” are to the currency of the United States unless otherwise indicated. All references to “Canadian dollars” or “C$” are to the currency of Canada unless otherwise indicated.
Note 2. Significant Accounting Policies
Basis of Presentation
The preparation of consolidated financial statements in conformity with accounting principles generally accepted in the United States (“GAAP”) and related rules and regulations of the U.S. Securities and Exchange Commission requires our management to make estimates and assumptions that affect the reported amounts of assets, liabilities, revenues and expenses, and the related disclosure of contingent assets and liabilities. Actual results could differ from these estimates.
Principles of Consolidation
The consolidated financial statements include our accounts and the accounts of entities in which we have a controlling financial interest, the usual condition of which is ownership of a majority voting interest. All material intercompany balances and transactions have been eliminated in consolidation. Investments in other affiliates that are owned
50%
or less where we have significant influence are accounted for by the equity method.
We also consider for consolidation entities in which we have certain interests, where the controlling financial interest may be achieved through arrangements that do not involve voting interests. Such an entity, known as a variable interest entity (“VIE”), is required to be consolidated by its primary beneficiary. The primary beneficiary is the entity that possesses the power to direct the activities of the VIE that most significantly impact its economic performance and has the obligation to absorb losses or the right to receive benefits from the VIE that are significant to it. Our maximum exposure to loss resulting from involvement with VIEs is attributable to accounts and notes receivable balances, outstanding loan guarantees and future lease payments, where applicable.
As our franchise and master franchise arrangements provide the franchise and master franchise entities the power to direct the activities that most significantly impact their economic performance, we do not consider ourselves the primary beneficiary of any such entity that might be a VIE.
Tim Hortons has historically entered into certain arrangements in which an operator acquires the right to operate a restaurant, but Tim Hortons owns the restaurant’s assets. In these arrangements, Tim Hortons has the ability to determine which operators manage the restaurants and for what duration. We perform an analysis to determine if the legal entity in which operations are conducted is a VIE and consolidate a VIE entity if we also determine Tim Hortons is the entity’s primary beneficiary (“Restaurant VIEs”). As of
December 31, 2018
and
2017
, we determined that we are the primary beneficiary of
17
and
31
Restaurant VIEs, respectively, and accordingly, have consolidated the results of operations, assets and liabilities, and cash flows of these Restaurant VIEs in our consolidated financial statements. Material intercompany accounts and transactions have been eliminated in consolidation.
60
Assets and liabilities related to consolidated VIEs are not significant to our total consolidated assets and liabilities. Liabilities recognized as a result of consolidating these VIEs do not necessarily represent additional claims on our general assets; rather, they represent claims against the specific assets of the consolidated VIEs. Conversely, assets recognized as a result of consolidating these VIEs do not represent additional assets that could be used to satisfy claims by our creditors as they are not legally included within our general assets.
Reclassifications
Certain prior year amounts in the accompanying consolidated financial statements and notes to the consolidated financial statements have been reclassified in order to be comparable with the current year classifications. These consist of the reclassification of
$20 million
and
$19 million
for the years ended December 31,
2017
and
2016
, respectively, from changes in Other long-term assets and liabilities to Tenant inducements paid to franchisees in the Consolidated Statement of Cash Flows and the December 31, 2017 reclassification of Advertising fund restricted assets to Cash and cash equivalents, Accounts and notes receivable, net and Prepaids and other current assets and the reclassification of Advertising fund liabilities to Accounts and drafts payable and Other accrued liabilities as detailed below (in millions). These reclassifications had no effect on previously reported net income.
|
December 31, 2017
|
December 31, 2017
|
||||||||||
|
As Reported
|
Reclassification
|
As Adjusted
|
|||||||||
|
Current assets:
|
|||||||||||
|
Cash and cash equivalents
|
$
|
1,073
|
|
$
|
24
|
|
$
|
1,097
|
|
||
|
Accounts and notes receivable, net
|
456
|
|
33
|
|
489
|
|
|||||
|
Inventories, net
|
78
|
|
—
|
|
78
|
|
|||||
|
Advertising fund restricted assets
|
83
|
|
(83
|
)
|
—
|
|
|||||
|
Prepaids and other current assets
|
60
|
|
26
|
|
86
|
|
|||||
|
Total current assets
|
$
|
1,750
|
|
$
|
—
|
|
$
|
1,750
|
|
||
|
Current liabilities:
|
|||||||||||
|
Accounts and drafts payable
|
$
|
413
|
|
$
|
83
|
|
$
|
496
|
|
||
|
Other accrued liabilities
|
838
|
|
28
|
|
866
|
|
|||||
|
Gift card liability
|
215
|
|
—
|
|
215
|
|
|||||
|
Advertising fund liabilities
|
111
|
|
(111
|
)
|
—
|
|
|||||
|
Current portion of long term debt and capital leases
|
78
|
|
—
|
|
78
|
|
|||||
|
Total current liabilities
|
$
|
1,655
|
|
$
|
—
|
|
$
|
1,655
|
|
||
Foreign Currency Translation and Transaction Gains and Losses
Our functional currency is the U.S. dollar, since our term loan and senior secured notes are denominated in U.S. dollars. The functional currency of each of our operating subsidiaries is generally the currency of the economic environment in which the subsidiary primarily does business. Our foreign subsidiaries’ financial statements are translated into U.S. dollars using the foreign exchange rates applicable to the dates of the financial statements. Assets and liabilities are translated using the end-of-period spot foreign exchange rates. Income, expenses and cash flows are translated at the average foreign exchange rates for each period. Equity accounts are translated at historical foreign exchange rates. The effects of these translation adjustments are reported as a component of accumulated other comprehensive income (loss) (“AOCI”) in the consolidated statements of equity.
For any transaction that is denominated in a currency different from the entity’s functional currency, we record a gain or loss based on the difference between the foreign exchange rate at the transaction date and the foreign exchange rate at the transaction settlement date (or rate at period end, if unsettled) which is included within other operating expenses (income), net in the consolidated statements of operations.
Cash and Cash Equivalents
All highly liquid investments with original maturities of
three
months or less and credit card receivables are considered cash equivalents.
61
Inventories
Inventories are carried at the lower of cost or net realizable value and consist primarily of raw materials such as green coffee beans and finished goods such as new equipment, parts, paper supplies and restaurant food items. The moving average method is used to determine the cost of raw material and finished goods inventories held for sale to Tim Hortons franchisees.
Property and Equipment, net
We record property and equipment at historical cost less accumulated depreciation and amortization, which is recognized using the straight-line method over the following estimated useful lives: (i) buildings and improvements – up to
40 years
; (ii) restaurant equipment – up to
17 years
; (iii) furniture, fixtures and other – up to
10 years
; (iv) manufacturing equipment – up to
25 years
; and (v) capital leases – up to
40 years
or lease term. Leasehold improvements to properties where we are the lessee are amortized over the lesser of the remaining term of the lease or the estimated useful life of the improvement.
We are considered to be the owner of certain restaurants leased from unrelated lessors because Tim Hortons constructed some of the structural elements of those restaurants. Accordingly, lessors’ contributions to the construction costs of these restaurants was recognized as other debt and was
$71 million
and
$83 million
at
December 31, 2018
and
2017
, respectively.
Major improvements are capitalized, while maintenance and repairs are expensed when incurred.
Leases
We define lease term as the initial term of a lease plus any renewals covered by bargain renewal options or that are reasonably assured of exercise because non-renewal would create an economic penalty, plus any periods that the lessee has use of the property but is not charged rent by a landlord (rent holiday). We record rental income and rental expense for operating leases on a straight-line basis over the lease term, net of any applicable lease incentive amortization. Contingent rental income is recognized on an accrual basis as earned.
Assets we acquire as lessee under capital leases are stated at the lower of the present value of future minimum lease payments or fair market value at the date of inception of the lease. Capital lease assets are depreciated using the straight-line method over the shorter of the useful life of the asset or the underlying lease term.
We also have net investments in properties leased to franchisees, which meet the criteria of direct financing leases. Investments in direct financing leases are recorded on a net basis, consisting of the gross investment and residual value in the lease, less unearned income. Earned income on direct financing leases is recognized when earned and collectability is reasonably assured. Unearned income is recognized over the lease term yielding a constant periodic rate of return on the net investment in the lease. Direct financing leases are reviewed for impairment whenever events or circumstances indicate that the carrying amount of the asset may not be recoverable based on the payment history under the lease.
We have recorded favorable and unfavorable operating leases in connection with the acquisition method of accounting. We amortize favorable and unfavorable leases on a straight-line basis over the remaining term of the leases, as determined at the acquisition date.
Goodwill and Intangible Assets Not Subject to Amortization
Goodwill represents the excess of the purchase price over the fair value of assets acquired and liabilities assumed in connection with the acquisition of Popeyes in 2017, the acquisition of Tim Hortons in 2014 and the acquisition of Burger King Holdings, Inc. by 3G Capital Partners Ltd. Our indefinite-lived intangible assets consist of the
Tim Hortons
brand, the
Burger King
brand, and the
Popeyes
brand (each a “Brand” and together, the “Brands”). Goodwill and the Brands are tested for impairment at least annually as of October 1 of each year and more often if an event occurs or circumstances change which indicate impairment might exist. Our annual impairment tests of goodwill and the Brands may be completed through qualitative assessments. We may elect to bypass the qualitative assessment and proceed directly to a quantitative impairment test for any reporting unit or Brand in any period. We can resume the qualitative assessment for any reporting unit or Brand in any subsequent period.
Under a qualitative approach, our impairment review for goodwill consists of an assessment of whether it is more-likely-than-not that a reporting unit’s fair value is less than its carrying amount. If we elect to bypass the qualitative assessment for any reporting unit, or if a qualitative assessment indicates it is more-likely-than-not that the estimated carrying value of a reporting unit exceeds its fair value, we perform a two-step quantitative goodwill impairment test. The first step requires us to estimate the fair value of the reporting unit. If the fair value of the reporting unit is less than its carrying amount, the estimated fair value of the reporting unit is
62
allocated to all its underlying assets and liabilities, including both recognized and unrecognized tangible and intangible assets, based on their fair value. If necessary, goodwill is then written down to its implied fair value.
Under a qualitative approach, our impairment review for the Brands consists of an assessment of whether it is more-likely-than-not that a Brand’s fair value is less than its carrying amount. If we elect to bypass the qualitative assessment for a Brand, or if a qualitative assessment indicates it is more-likely-than-not that the estimated carrying value of a Brand exceeds its fair value, we estimate the fair value of the Brand and compare it to its carrying amount. If the carrying amount exceeds fair value, an impairment loss is recognized in an amount equal to that excess.
We completed our impairment tests for goodwill and the Brands as of October 1, 2018, 2017 and 2016 and
no
impairment resulted.
Long-Lived Assets
Long-lived assets, such as property and equipment and intangible assets subject to amortization, are tested for impairment whenever events or changes in circumstances indicate that the carrying amount of the asset or asset group may not be recoverable. Some of the events or changes in circumstances that would trigger an impairment review include, but are not limited to, bankruptcy proceedings or other significant financial distress of a lessee; significant negative industry or economic trends; knowledge of transactions involving the sale of similar property at amounts below the carrying value; or our expectation to dispose of long-lived assets before the end of their estimated useful lives. The impairment test for long-lived assets requires us to assess the recoverability of long-lived assets by comparing their net carrying value to the sum of undiscounted estimated future cash flows directly associated with and arising from use and eventual disposition of the assets or asset group. Long-lived assets are grouped for recognition and measurement of impairment at the lowest level for which identifiable cash flows are largely independent of the cash flows of other assets. If the net carrying value of a group of long-lived assets exceeds the sum of related undiscounted estimated future cash flows, we record an impairment charge equal to the excess, if any, of the net carrying value over fair value.
Other Comprehensive Income (Loss)
Other comprehensive income (loss) (“OCI”) refers to revenues, expenses, gains and losses that are included in comprehensive income (loss), but are excluded from net income (loss) as these amounts are recorded directly as an adjustment to equity, net of tax. Our other comprehensive income (loss) is primarily comprised of unrealized gains and losses on foreign currency translation adjustments and unrealized gains and losses on hedging activity, net of tax.
Derivative Financial Instruments
We recognize and measure all derivative instruments as either assets or liabilities at fair value in the consolidated balance sheets. We may enter into derivatives that are not initially designated as hedging instruments for accounting purposes, but which largely offset the economic impact of certain transactions.
Gains or losses resulting from changes in the fair value of derivatives are recognized in earnings or recorded in other comprehensive income (loss) and recognized in the consolidated statements of operations when the hedged item affects earnings, depending on the purpose of the derivatives and whether they qualify for, and we have applied, hedge accounting treatment.
When applying hedge accounting, we designate at a derivative’s inception, the specific assets, liabilities or future commitments being hedged, and assess the hedge’s effectiveness at inception and on an ongoing basis. We discontinue hedge accounting when: (i) we determine that the cash flow derivative is no longer effective in offsetting changes in the cash flows of a hedged item; (ii) the derivative expires or is sold, terminated or exercised; (iii) it is no longer probable that the forecasted transaction will occur; or (iv) management determines that designation of the derivatives as a hedge instrument is no longer appropriate. We do not enter into or hold derivatives for speculative purposes.
Disclosures about Fair Value
Fair value is defined as the price that would be received to sell an asset or paid to transfer a liability in an orderly transaction between market participants in the principal market, or if none exists, the most advantageous market, for the specific asset or liability at the measurement date (the exit price). The fair value is based on assumptions that market participants would use when pricing the asset or liability. The fair values are assigned a level within the fair value hierarchy, depending on the source of the inputs into the calculation, as follows:
Level 1
Observable inputs that reflect quoted prices (unadjusted) for identical assets or liabilities in active markets.
63
Level 2
Inputs other than quoted prices included in Level 1 that are observable for the asset or liability either directly or indirectly.
Level 3
Unobservable inputs reflecting management’s own assumptions about the inputs used in pricing the asset or liability.
The carrying amounts for cash and equivalents, accounts and notes receivable and accounts and drafts payable approximate fair value based on the short-term nature of these amounts.
We carry all of our derivatives at fair value and value them using various pricing models or discounted cash flow analysis that incorporate observable market parameters, such as interest rate yield curves and currency rates, which are Level 2 inputs. Derivative valuations incorporate credit risk adjustments that are necessary to reflect the probability of default by the counterparty or us. For disclosures about the fair value measurements of our derivative instruments, see Note 12,
Derivative Instruments
.
The following table presents the fair value of our variable rate term debt and senior notes, estimated using inputs based on bid and offer prices that are Level 2 inputs, and principal carrying amount (in billions):
|
As of December 31,
|
|||||||
|
2018
|
2017
|
||||||
|
Fair value of our variable term debt and senior notes
|
$
|
11
|
|
$
|
12
|
|
|
|
Principal carrying amount of our variable term debt and senior notes
|
12
|
|
12
|
|
|||
The determinations of fair values of certain tangible and intangible assets for purposes of the application of the acquisition method of accounting to the acquisition of Popeyes were based upon Level 3 inputs. The determination of fair values of our reporting units and the determination of the fair value of the Brands for impairment testing using a quantitative approach during 2018 and 2017 were based upon Level 3 inputs.
Revenue Recognition
We transitioned to FASB Accounting Standards Codification (“ASC”) Topic 606,
Revenue From Contracts with Customers
(“ASC 606”), from ASC Topic 605,
Revenue Recognition
and ASC Subtopic 952-605,
Franchisors - Revenue Recognition
(together, the “Previous Standards”) on January 1, 2018 using the modified retrospective transition method. Our Financial Statements reflect the application of ASC 606 guidance beginning in 2018, while our consolidated financial statements for prior periods were prepared under the guidance of the Previous Standards. See Note 16,
Revenue Recognition
, for further information about our transition to this new revenue recognition model using the modified retrospective transition method.
Sales
Sales consist primarily of supply chain sales, which represent sales of products, supplies and restaurant equipment to franchisees, as well as sales to retailers and are presented net of any related sales tax. Orders placed by customers specify the goods to be delivered and transaction prices for supply chain sales. Revenue is recognized upon transfer of control over ordered items, generally upon delivery to the customer, which is when the customer obtains physical possession of the goods, legal title is transferred, the customer has all risks and rewards of ownership and an obligation to pay for the goods is created. Shipping and handling costs associated with outbound freight for supply chain sales are accounted for as fulfillment costs and classified as cost of sales.
Commencing on January 1, 2018, we classify all sales of restaurant equipment to franchisees as Sales and related cost of equipment sold as Cost of sales. In periods prior to January 1, 2018, we classified sales of restaurant equipment at establishment of a restaurant and in connection with renewal or renovation as Franchise and property revenues and related costs as Franchise and property expense.
To a much lesser extent, sales also include Company restaurant sales (including Restaurant VIEs), which consist of sales to restaurant guests. Revenue from Company restaurant sales is recognized at the point of sale. Taxes assessed by a governmental authority that we collect are excluded from revenue.
Franchise revenues
Franchise revenues consist primarily of royalties, advertising fund contributions, initial and renewal franchise fees and upfront fees from development agreements and master franchise and development agreements (“MFDAs”). Under franchise agreements, we provide franchisees with (i) a franchise license, which includes a license to use our intellectual property and, in those markets where our subsidiaries manage an advertising fund, advertising and promotion management, (ii) pre-opening services, such as training and inspections, and (iii) ongoing services, such as development of training materials and menu items and restaurant monitoring and
64
inspections. The services we provide under franchise agreements are highly interrelated and dependent upon the franchise license and we concluded the services do not represent individually distinct performance obligations. Consequently, we bundle the franchise license performance obligation and promises to provide services into a single performance obligation under ASC 606, which we satisfy by providing a right to use our intellectual property over the term of each franchise agreement.
Royalties, including franchisee contributions to advertising funds managed by our subsidiaries, are calculated as a percentage of franchise restaurant sales over the term of the franchise agreement. Under our franchise agreements, advertising contributions paid by franchisees must be spent on advertising, product development, marketing and related activities. Initial and renewal franchise fees are payable by the franchisee upon a new restaurant opening or renewal of an existing franchise agreement. Our franchise agreement royalties, inclusive of advertising fund contributions, represent sales-based royalties that are related entirely to our performance obligation under the franchise agreement and are recognized as franchise sales occur. Additionally, under ASC 606, initial and renewal franchise fees are recognized as revenue on a straight-line basis over the term of the respective agreement. Under the Previous Standards, initial franchise fees were recognized as revenue when the related restaurant commenced operations and our completion of all material services and conditions. Renewal franchise fees were recognized as revenue upon execution of a new franchise agreement. Our performance obligation under development agreements other than MFDAs generally consists of an obligation to grant exclusive development rights over a stated term. These development rights are not distinct from franchise agreements, so upfront fees paid by franchisees for exclusive development rights are deferred and apportioned to each franchise restaurant opened by the franchisee. The pro rata amount apportioned to each restaurant is accounted for as an initial franchise fee.
We have a distinct performance obligation under our MFDAs to grant subfranchising rights over a stated term. Under the terms of MFDAs, we typically either receive an upfront fee paid in cash and/or receive noncash consideration in the form of an equity interest in the master franchisee or an affiliate of the master franchisee. Under the Previous Standards, we accounted for noncash consideration as a nonmonetary exchange and did not record revenue or a basis in the equity interest received in arrangements where we received noncash consideration. These transactions now fall within the scope of ASC 606, which requires us to record investments in the applicable equity method investee and recognize revenue in an amount equal to the fair value of the equity interest received. In accordance with ASC 606, upfront fees from master franchisees, including the fair value of noncash consideration, are deferred and amortized over the MFDA term on a straight-line basis. We may recognize unamortized upfront fees when a contract with a franchisee or master franchisee is modified and is accounted for as a termination of the existing contract.
The portion of gift cards sold to customers which are never redeemed is commonly referred to as gift card breakage. Under ASC 606, we recognize gift card breakage income proportionately as each gift card is redeemed using an estimated breakage rate based on our historical experience. Under the Previous Standards, we recognized gift card breakage income for each gift card's remaining balance when redemption of that balance was deemed remote.
Property revenues
Property revenues consists of rental income from properties we lease or sublease to franchisees. Property revenues are accounted for in accordance with applicable accounting guidance for leases and are excluded from the scope of ASC 606.
Advertising and Promotional Costs
Company restaurants and franchise restaurants contribute to advertising funds that our subsidiaries manage in the United States and Canada and certain other international markets. The advertising funds expense the production costs of advertising when the advertisements are first aired or displayed. All other advertising and promotional costs are expensed in the period incurred. Under our franchise agreements, advertising contributions received from franchisees must be spent on advertising, product development, marketing and related activities. As a result of our transition to ASC 606, advertising contributions received from franchisees are included in franchise and property revenues and advertising expenses are included as selling, general and administrative expenses commencing on January 1, 2018. Advertising expenses included in selling, general and administrative expenses totaled
$793 million
for 2018. Prior to January 1, 2018, since we were deemed to be acting as an agent for these specifically designated contributions in accordance with the Previous Standards, the revenues and expenses of the advertising funds were generally netted in our consolidated statements of operations.
Prior to our transition to ASC 606, advertising expenses, which primarily consisted of advertising contributions by Company restaurants (including Restaurant VIEs) based on a percentage of gross sales, totaled
$7 million
for 2017 and
$6 million
for 2016 and were included in selling, general and administrative expenses in the accompanying consolidated statements of operations. As a result of our transition to ASC 606, the advertising contributions by Company restaurants (including Restaurant VIEs) are eliminated in consolidation in 2018.
65
Deferred Financing Costs
Deferred financing costs are amortized over the term of the related debt agreement into interest expense using the effective interest method.
Income Taxes
Amounts in the financial statements related to income taxes are calculated using the principles of ASC Topic 740,
Income Taxes
. Under these principles, deferred tax assets and liabilities reflect the impact of temporary differences between the amounts of assets and liabilities recognized for financial reporting purposes and the amounts recognized for tax purposes, as well as tax credit carry-forwards and loss carry-forwards. These deferred taxes are measured by applying currently enacted tax rates. A deferred tax asset is recognized when it is considered more-likely-than-not to be realized. The effects of changes in tax rates on deferred tax assets and liabilities are recognized in income in the year in which the law is enacted. A valuation allowance reduces deferred tax assets when it is more-likely-than-not that some portion or all of the deferred tax assets will not be realized.
We recognize positions taken or expected to be taken in a tax return in the financial statements when it is more-likely-than-not (i.e., a likelihood of more than 50%) that the position would be sustained upon examination by tax authorities. A recognized tax position is then measured at the largest amount of benefit with greater than 50% likelihood of being realized upon ultimate settlement.
Translation gains and losses resulting from the remeasurement of foreign deferred tax assets or liabilities denominated in a currency other than the functional currency are classified as other operating expenses (income), net in the consolidated statements of operations.
Share-based Compensation
Compensation expense related to the issuance of share-based awards to our employees is measured at fair value on the grant date. We use the Black-Scholes option pricing model to value stock options. The compensation expense for awards that vest over a future service period is recognized over the requisite service period on a straight-line basis, adjusted for estimated forfeitures of awards that are not expected to vest. The compensation expense for awards that do not require future service is recognized immediately. Upon the end of the service period, compensation expense is adjusted to account for the actual forfeiture rate. Cash settled share-based awards are classified as liabilities and are re-measured at the end of each reporting period. The compensation expense for awards that contain performance conditions is recognized when it is probable that the performance conditions will be achieved.
Restructuring
The determination of when we accrue for employee involuntary termination benefits depends on whether the termination benefits are provided under an on-going benefit arrangement or under a one-time benefit arrangement. We record charges for ongoing benefit arrangements in accordance with ASC Topic 712,
Nonretirement Postemployment Benefits
. We record charges for one-time benefit arrangements in accordance with ASC Topic 420,
Exit or Disposal Cost Obligations
.
New Accounting Pronouncements
Revenue Recognition
– In May 2014, the Financial Accounting Standards Board (the “FASB”) issued a new single comprehensive model for entities to use in accounting for revenue arising from contracts with customers. We adopted this new guidance on January 1, 2018. See Note 16,
Revenue Recognition
, for further information about our transition to this new revenue recognition model using the modified retrospective transition method.
Lease Accounting
– In February 2016, the FASB issued new guidance on leases. The new guidance requires lessees to recognize on the balance sheet the assets and liabilities for the rights and obligations created by finance and operating leases with lease terms of more than 12 months, amends various other aspects of accounting for leases by lessees and lessors, and requires enhanced disclosures. The new guidance is effective commencing in 2019 and requires a modified retrospective transition approach with application in all comparative periods presented (the “comparative method”), or alternatively, as of the effective date as the date of initial application without restating comparative period financial statements (the “effective date method”). The new guidance also provides several practical expedients and policies that companies may elect under either transition method. We have elected to apply the effective date method and the package of practical expedients under which we will not reassess the classification of our existing leases, reevaluate whether any expired or existing contracts are or contain leases or reassess initial direct costs under the new guidance. Additionally, we have elected lessee and lessor practical expedients to not separate non-lease components from lease components. We did not elect the practical expedient that permits a reassessment of lease terms for existing leases.
66
We performed an analysis of the impact of the new lease guidance and are in the process of completing the final phase of a comprehensive plan for our implementation of the new guidance, including implementation of a new lease accounting system. The project plan includes analyzing the impact of the new guidance on our current lease contracts, reviewing the completeness of our existing lease portfolio, comparing our accounting policies under current accounting guidance to the new accounting guidance and identifying potential differences from applying the requirements of the new guidance to our lease contracts. Upon our transition to the new guidance, we currently expect to recognize approximately
$1.1 billion
of operating lease liabilities. Additionally, we expect to record right-of-use assets in a corresponding amount, net of amounts reclassified from other assets and liabilities, as specified by the new lease guidance.
We also expect this guidance will result in the gross presentation of property tax and maintenance expenses and related lessee reimbursements as franchise and property expenses and franchise and property revenues, respectively. These expenses and reimbursements are presented on a net basis under current accounting guidance. Otherwise, we do not expect the adoption of this guidance will have a material impact on our consolidated statements of operations. We do not expect an impact to the amount or timing of our cash flows or liquidity.
Goodwill Impairment
– In January 2017, the FASB issued guidance to simplify how an entity measures goodwill impairment by removing the second step of the two-step quantitative goodwill impairment test. An entity will no longer be required to perform a hypothetical purchase price allocation to measure goodwill impairment. Instead, impairment will be measured at the amount by which the carrying value exceeds the fair value of a reporting unit; however, the loss recognized should not exceed the total amount of goodwill allocated to that reporting unit. The amendment requires prospective adoption and is effective commencing in 2020 with early adoption permitted. The adoption of this new guidance will not have a material impact on our Financial Statements.
Hedge Accounting
– In August 2017, the FASB issued guidance to improve the transparency and understandability of information conveyed to financial statement users about an entity's risk management activities and to simplify the application of hedge accounting by preparers. We adopted this guidance on January 1, 2018 (the “Adoption Date”).
The new guidance eliminates the requirement to separately measure and report hedge ineffectiveness for cash flow and net investment hedges that are deemed effective. Most notably, for our cross-currency swaps designated as net investment hedges, the new guidance permits the exclusion of the interest component (the “Excluded Component”) from the accounting hedge without affecting net investment hedge designation. The initial value of the Excluded Component may be recognized in earnings on a systematic and rational basis over the life of the derivative instrument.
Subsequent to the Adoption Date, we changed the method of assessing effectiveness for net investment hedges using derivatives from the forward method to the spot method. We de-designated the cross-currency swaps and re-designated them as of March 15, 2018 (the “Re-designation Date”). As a result of adopting the new guidance and the re-designation of our cross-currency swaps, we will recognize a benefit from the amortization of the initial value of the Excluded Component as a component of Interest expense, net in our consolidated statements of operations rather than as a component of other comprehensive income. All changes in fair value of the instruments related to currency fluctuations will continue to be recognized within other comprehensive income.
The impact of adoption did not have a material effect on our Financial Statements as of the Adoption Date. We recorded a
$60 million
net benefit to Interest expense, net from the Re-designation Date through
December 31, 2018
in our consolidated statements of operations for the amortization of the initial value of the Excluded Component, as described above. We believe the new guidance better portrays the economic results of our risk management activities and net investment hedges in our Financial Statements.
Reclassification of Certain Tax Effects
– In February 2018, the FASB issued guidance which allows a reclassification from accumulated other comprehensive income to retained earnings for the tax effects of certain items within accumulated other comprehensive income. The amendment is effective commencing in 2019 with early adoption permitted. The adoption of this new guidance will not have a material impact on our Financial Statements.
Share-based payment arrangements with nonemployees
– In June 2018, the FASB issued guidance which simplifies the accounting for share-based payments granted to nonemployees for goods and services. Most of the guidance on such payments to nonemployees would be aligned with the requirements for share-based payments granted to employees. The amendment is effective commencing in 2019 with early adoption permitted. The adoption of this new guidance will not have a material impact on our Financial Statements.
Note 3. Popeyes Acquisition
On
March 27, 2017
, we completed the acquisition of all of the outstanding shares of common stock of Popeyes Louisiana Kitchen, Inc. (the “Popeyes Acquisition”). Popeyes Louisiana Kitchen, Inc. is one of the world’s largest chicken quick service restaurant companies and its global footprint complements RBI’s existing portfolio. Like our other brands, the
Popeyes
brand is
67
managed independently, while benefiting from our global scale and resources. The Popeyes Acquisition was accounted for as a business combination using the acquisition method of accounting.
Total consideration in connection with the Popeyes Acquisition was
$1,655 million
, which includes
$33 million
for the settlement of equity awards. The consideration was funded through (1) cash on hand of approximately
$355 million
, and (2)
$1,300 million
from incremental borrowings under our Term Loan Facility – see Note 9,
Long-Term Debt
.
Fees and expenses related to the Popeyes Acquisition and related financings totaled
$34 million
consisting primarily of professional fees and compensation related expenses, all of which are classified as selling, general and administrative expenses in the accompanying consolidated statements of operations. These fees and expenses were funded through cash on hand.
The final allocation of consideration to the net tangible and intangible assets acquired is presented in the table below (in millions):
|
March 27, 2017
|
|||
|
Total current assets
|
$
|
64
|
|
|
Property and equipment
|
114
|
|
|
|
Intangible assets
|
1,405
|
|
|
|
Other assets
|
1
|
|
|
|
Total current liabilities
|
(73
|
)
|
|
|
Total debt and capital lease obligations
|
(159
|
)
|
|
|
Deferred income taxes
|
(523
|
)
|
|
|
Other liabilities
|
(20
|
)
|
|
|
Total identifiable net assets
|
809
|
|
|
|
Goodwill
|
846
|
|
|
|
Total consideration
|
$
|
1,655
|
|
Intangible assets include
$1,355 million
related to the
Popeyes
brand,
$41 million
related to franchise agreements and
$9 million
related to favorable leases. The
Popeyes
brand has been assigned an indefinite life and, therefore, will not be amortized, but rather tested annually for impairment. Franchise agreements have a weighted average amortization period of
17
years. Favorable leases have a weighted average amortization period of
14
years.
Goodwill attributable to the Popeyes Acquisition will not be amortizable or deductible for tax purposes. Goodwill is considered to represent the value associated with the workforce and synergies anticipated to be realized as a combined company.
The Popeyes Acquisition is not material to our consolidated financial statements, and therefore, supplemental pro forma financial information related to the acquisition is not included herein.
Note 4. Earnings Per Unit
Partnership uses the two-class method in the computation of earnings per unit. Pursuant to the terms of the partnership agreement, RBI, as the holder of the Class A common units, is entitled to receive distributions from Partnership in an amount equal to the aggregate dividends payable by RBI to holders of RBI common shares, and the holders of Class B exchangeable limited partnership units (the “Partnership exchangeable units”) are entitled to receive distributions from Partnership in an amount per unit equal to the dividends payable by RBI on each RBI common share. Partnership’s net income available to common unitholders is allocated between the Class A common units and Partnership exchangeable units on a fully-distributed basis and reflects residual net income after noncontrolling interests, Partnership preferred unit distributions and gain on redemption of Partnership preferred units. Basic and diluted earnings per Class A common unit is determined by dividing net income allocated to Class A common unitholders by the weighted average number of Class A common units outstanding for the period. Basic and diluted earnings per Partnership exchangeable unit is determined by dividing net income allocated to the Partnership exchangeable units by the weighted average number of Partnership exchangeable units outstanding during the period.
There are no dilutive securities for Partnership as the exercise of stock options will not affect the numbers of Class A common units or Partnership exchangeable units outstanding. However, the issuance of shares by RBI in future periods will affect the allocation of net income attributable to common unitholders between Partnership’s Class A common units and Partnership exchangeable units.
68
The following table summarizes the basic and diluted earnings per unit calculations (in millions, except per unit amounts):
|
2018
|
2017
|
2016
|
|||||||||
|
Allocation of net income among partner interests:
|
|||||||||||
|
Net income allocated to Class A common unitholders
|
$
|
612
|
|
$
|
626
|
|
$
|
346
|
|
||
|
Net income allocated to Partnership exchangeable unitholders
|
531
|
|
585
|
|
337
|
|
|||||
|
Net income attributable to common unitholders
|
$
|
1,143
|
|
$
|
1,211
|
|
$
|
683
|
|
||
|
Denominator - basic and diluted partnership units:
|
|||||||||||
|
Weighted average Class A common units
|
202
|
|
202
|
|
202
|
|
|||||
|
Weighted average Partnership exchangeable units
|
216
|
|
226
|
|
228
|
|
|||||
|
Earnings per unit - basic and diluted:
|
|||||||||||
|
Class A common units (a)
|
$
|
3.03
|
|
$
|
3.10
|
|
$
|
1.71
|
|
||
|
Partnership exchangeable units (a)
|
$
|
2.46
|
|
$
|
2.59
|
|
$
|
1.48
|
|
||
|
(a)
|
Earnings per unit may not recalculate exactly as it is calculated based on unrounded numbers.
|
Note 5. Property and Equipment, net
Property and equipment, net, consist of the following (in millions):
|
|
As of December 31,
|
||||||
|
|
2018
|
2017
|
|||||
|
Land
|
$
|
998
|
|
$
|
1,020
|
|
|
|
Buildings and improvements
|
1,145
|
|
1,172
|
|
|||
|
Restaurant equipment
|
99
|
|
122
|
|
|||
|
Furniture, fixtures, and other
|
182
|
|
171
|
|
|||
|
Capital leases
|
257
|
|
256
|
|
|||
|
Construction in progress
|
19
|
|
15
|
|
|||
|
2,700
|
|
2,756
|
|
||||
|
Accumulated depreciation and amortization
|
(704
|
)
|
(623
|
)
|
|||
|
Property and equipment, net
|
$
|
1,996
|
|
$
|
2,133
|
|
|
Depreciation and amortization expense on property and equipment totaled
$148 million
for
2018
,
$150 million
for
2017
and
$144 million
for
2016
.
Included in our property and equipment, net at
December 31, 2018
and
2017
are
$180 million
and
$193 million
, respectively, of assets leased under capital leases (mostly buildings and improvements), net of accumulated depreciation and amortization of
$77 million
and
$63 million
, respectively.
69
Note 6. Intangible Assets, net and Goodwill
Intangible assets, net and goodwill consist of the following (in millions):
|
As of December 31,
|
|||||||||||||||||||||||
|
2018
|
2017
|
||||||||||||||||||||||
|
Gross
|
Accumulated Amortization
|
Net
|
Gross
|
Accumulated Amortization
|
Net
|
||||||||||||||||||
|
Identifiable assets subject to amortization:
|
|||||||||||||||||||||||
|
Franchise agreements
|
$
|
705
|
|
$
|
(194
|
)
|
$
|
511
|
|
$
|
725
|
|
$
|
(168
|
)
|
$
|
557
|
|
|||||
|
Favorable leases
|
407
|
|
(200
|
)
|
207
|
|
456
|
|
(194
|
)
|
262
|
|
|||||||||||
|
Subtotal
|
1,112
|
|
(394
|
)
|
718
|
|
1,181
|
|
(362
|
)
|
819
|
|
|||||||||||
|
Indefinite lived intangible assets:
|
|||||||||||||||||||||||
|
Tim Hortons brand
|
$
|
6,259
|
|
$
|
—
|
|
$
|
6,259
|
|
$
|
6,727
|
|
$
|
—
|
|
$
|
6,727
|
|
|||||
|
Burger King brand
|
2,131
|
|
—
|
|
2,131
|
|
2,161
|
|
—
|
|
2,161
|
|
|||||||||||
|
Popeyes brand
|
1,355
|
|
—
|
|
1,355
|
|
1,355
|
|
—
|
|
1,355
|
|
|||||||||||
|
Subtotal
|
9,745
|
|
—
|
|
9,745
|
|
10,243
|
|
—
|
|
10,243
|
|
|||||||||||
|
Intangible assets, net
|
$
|
10,463
|
|
$
|
11,062
|
|
|||||||||||||||||
|
Goodwill
|
|||||||||||||||||||||||
|
Tim Hortons segment
|
$
|
4,038
|
|
$
|
4,326
|
|
|||||||||||||||||
|
Burger King segment
|
602
|
|
610
|
|
|||||||||||||||||||
|
Popeyes segment
|
846
|
|
846
|
|
|||||||||||||||||||
|
Total
|
$
|
5,486
|
|
$
|
5,782
|
|
|||||||||||||||||
Amortization expense on intangible assets totaled
$70 million
for
2018
,
$72 million
for
2017
, and
$72 million
for
2016
. The change in the brands and goodwill balances during
2018
was due principally to the impact of foreign currency translation.
As of
December 31, 2018
, the estimated future amortization expense on identifiable assets subject to amortization is as follows (in millions):
|
Twelve-months ended December 31,
|
Amount
|
||
|
2019
|
$
|
64
|
|
|
2020
|
59
|
|
|
|
2021
|
55
|
|
|
|
2022
|
51
|
|
|
|
2023
|
48
|
|
|
|
Thereafter
|
441
|
|
|
|
Total
|
$
|
718
|
|
70
Note 7. Equity Method Investments
The aggregate carrying amount of our equity method investments was
$259 million
and
$155 million
as of
December 31, 2018
and
2017
, respectively, and is included as a component of Other assets, net in our consolidated balance sheets. The increase in the carrying amount of our equity method investments as of
December 31, 2018
compared to
December 31, 2017
is primarily attributable to the recognition of investments received in connection with master franchise and development arrangements as a result of our transition to ASC 606. See Note 2,
Significant Accounting Policies
. TH and BK both have equity method investments. PLK does not have any equity method investments.
With respect to our TH business, the most significant equity method investment is our
50.0%
joint venture interest with The Wendy’s Company (the “TIMWEN Partnership”), which jointly holds real estate underlying Canadian combination restaurants. Distributions received from this joint venture were
$13 million
,
$12 million
and
$11 million
during
2018
,
2017
and
2016
, respectively.
The aggregate market value of our
20.5%
equity interest in Carrols Restaurant Group, Inc. (“Carrols”) based on the quoted market price on
December 31, 2018
is approximately
$93 million
. The aggregate market value of our
10.1%
equity interest in BK Brasil Operação e Assessoria a Restaurantes S.A. based on the quoted market price on
December 31, 2018
is approximately
$120 million
. No quoted market prices are available for our other equity method investments.
We have equity interests in entities that own or franchise Tim Hortons or Burger King restaurants. Franchise and property revenue recognized from franchisees that are owned or franchised by entities in which we have an equity interest consist of the following (in millions):
|
2018
|
2017
|
2016
|
|||||||||
|
Revenues from affiliates:
|
|||||||||||
|
Royalties
|
$
|
310
|
|
$
|
175
|
|
$
|
132
|
|
||
|
Property revenues
|
36
|
|
27
|
|
28
|
|
|||||
|
Franchise fees and other revenue
|
11
|
|
26
|
|
19
|
|
|||||
|
Total
|
$
|
357
|
|
$
|
228
|
|
$
|
179
|
|
||
We recognized
$20 million
of rent expense associated with the TIMWEN Partnership during each of
2018
,
2017
and
2016
.
At
December 31, 2018
and
2017
, we had
$41 million
and
$32 million
, respectively, of accounts receivable from our equity method investments which were recorded in accounts and notes receivable, net in our consolidated balance sheets.
(Income) loss from equity method investments reflects our share of investee net income or loss, non-cash dilution gains or losses from changes in our ownership interests in equity method investees and basis difference amortization. We recorded increases to the carrying value of our equity method investment balances and non-cash dilution gains in the amounts of
$20 million
and
$12 million
during
2018
and
2016
, respectively.
No
non-cash dilution gains were recorded during
2017
. The dilution gains resulted from the issuance of capital stock by our equity method investees, which reduced our ownership interests in these equity method investments. The dilution gains we recorded in connection with the issuance of capital stock reflect adjustments to the differences between the amount of underlying equity in the net assets of equity method investees before and after their issuance of capital stock.
71
Note 8. Other Accrued Liabilities and Other Liabilities
Other accrued liabilities (current) and other liabilities, net (non-current) consist of the following (in millions):
|
|
As of December 31,
|
||||||
|
|
2018
|
2017
|
|||||
|
Current:
|
|||||||
|
Dividend payable
|
$
|
207
|
|
$
|
97
|
|
|
|
Interest payable
|
87
|
|
89
|
|
|||
|
Accrued compensation and benefits
|
69
|
|
67
|
|
|||
|
Taxes payable
|
113
|
|
401
|
|
|||
|
Deferred income
|
27
|
|
43
|
|
|||
|
Accrued advertising expenses
|
30
|
|
27
|
|
|||
|
Closed property reserve
|
9
|
|
11
|
|
|||
|
Restructuring and other provisions
|
11
|
|
12
|
|
|||
|
Other
|
84
|
|
119
|
|
|||
|
Other accrued liabilities
|
$
|
637
|
|
$
|
866
|
|
|
|
Non-current:
|
|||||||
|
Derivatives liabilities
|
$
|
179
|
|
$
|
499
|
|
|
|
Taxes payable
|
493
|
|
496
|
|
|||
|
Contract liabilities, net
|
486
|
|
10
|
|
|||
|
Unfavorable leases
|
192
|
|
252
|
|
|||
|
Accrued pension
|
64
|
|
72
|
|
|||
|
Accrued lease straight-lining liability
|
69
|
|
46
|
|
|||
|
Deferred income
|
22
|
|
27
|
|
|||
|
Other
|
42
|
|
53
|
|
|||
|
Other liabilities, net
|
$
|
1,547
|
|
$
|
1,455
|
|
|
Note 9. Long-Term Debt
Long-term debt consist of the following (in millions):
|
|
As of December 31,
|
||||||
|
|
2018
|
2017
|
|||||
|
Term Loan Facility (due February 17, 2024)
|
$
|
6,338
|
|
$
|
6,389
|
|
|
|
2017 4.25% Senior Notes (due May 15, 2024)
|
1,500
|
|
1,500
|
|
|||
|
2015 4.625% Senior Notes (due January 15, 2022)
|
1,250
|
|
1,250
|
|
|||
|
2017 5.00% Senior Notes (due October 15, 2025)
|
2,800
|
|
2,800
|
|
|||
|
Other
|
150
|
|
89
|
|
|||
|
Less: unamortized deferred financing costs and deferred issuance discount
|
(145
|
)
|
(170
|
)
|
|||
|
Total debt, net
|
11,893
|
|
11,858
|
|
|||
|
Less: current maturities of debt
|
(70
|
)
|
(57
|
)
|
|||
|
Total long-term debt
|
$
|
11,823
|
|
$
|
11,801
|
|
|
72
Credit Facilities
On February 17, 2017, two of our subsidiaries (the “Borrowers”) entered into a second amendment (the “Second Amendment”) to the credit agreement governing our senior secured term loan facility (the “Term Loan Facility”) and our senior secured revolving credit facility of up to
$500 million
of revolving extensions of credit outstanding at any time (including revolving loans, swingline loans and letters of credit) (the “Revolving Credit Facility” and together with the Term Loan Facility, the “Credit Facilities”). Under the Second Amendment, (i) the outstanding aggregate principal amount under our Term Loan Facility was decreased to
$4,900 million
as a result of a repayment of
$146 million
from cash on hand, (ii) the interest rate applicable to our Term Loan Facility was reduced to, at our option, either (a) a base rate plus an applicable margin equal to
1.25%
, or (b) a Eurocurrency rate plus an applicable margin equal to
2.25%
, (iii) the maturity of our Term Loan Facility was extended from
December 12, 2021
to
February 17, 2024
, and (iv) the Borrowers and their subsidiaries were provided with additional flexibility under certain negative covenants, including incurrence of indebtedness, making of investments, dispositions and restricted payments, and prepayment of subordinated indebtedness. Except as described herein, the Second Amendment did not materially change the terms of the Credit Facilities.
In connection with the Second Amendment, we capitalized approximately
$11 million
in debt issuance costs and recorded a loss on early extinguishment of debt of
$20 million
during
2017
. The loss on early extinguishment of debt primarily reflects the write-off of unamortized debt issuance costs and discounts.
Incremental Term Loans
In connection with the Popeyes Acquisition, we obtained an incremental term loan in the aggregate principal amount of
$1,300 million
(the “Incremental Term Loan No. 1”) under our Term Loan Facility. Also, simultaneously and in connection with the issuance of the 2017
4.25%
Senior Notes (described below), we obtained an additional incremental term loan in the aggregate principal amount of
$250 million
(the “Incremental Term Loan No. 2” and together with the Incremental Term Loan No. 1, the “Incremental Term Loans”) under our Term Loan Facility. The Incremental Term Loans bear interest at the same rate as the Term Loan Facility and also mature on
February 17, 2024
. In connection with the Incremental Term Loan No. 1, Popeyes Louisiana Kitchen, Inc. was included as loan guarantor and its assets as collateral under the Credit Facilities. Except as described herein, there were no other material changes to the terms of the Credit Facilities. Debt issuance costs capitalized in connection with the Incremental Term Loans were approximately
$23 million
.
Revolving Credit Facility
As of
December 31, 2018
, we had
no
amounts outstanding under our Revolving Credit Facility. Funds available under the Revolving Credit Facility may be used to repay other debt, finance debt or share repurchases, to fund acquisitions or capital expenditures and for other general corporate purposes. We have a
$125 million
letter of credit sublimit as part of the Revolving Credit Facility, which reduces our borrowing availability thereunder by the cumulative amount of outstanding letters of credit. As of
December 31, 2018
, we had
$20 million
of letters of credit issued against the Revolving Credit Facility, and our borrowing availability was
$480 million
.
During 2017, the Borrowers extended the maturity date of the Revolving Credit Facility from
December 12, 2019
to
October 13, 2022
. The extension was effected through the termination of the existing revolving credit commitments and the entry into Incremental Facility Amendment No. 3 (the “Third Amendment”) to the credit agreement. The Third Amendment maintained the same
$500 million
in aggregate principal amount of the commitments under the Revolving Credit Facility but reduced interest rates and commitment fees. As amended, the Revolving Credit Facility matures on
October 13, 2022
, provided that if, on
October 15, 2021
, more than an aggregate of
$150 million
of the 2015
4.625%
Senior Notes (as defined below) are outstanding, then the maturity date of the Revolving Credit Facility shall be
October 15, 2021
. Except as described herein, there were no other material changes to the Revolving Credit Facility. In connection with the Third Amendment we capitalized approximately
$1 million
in debt issuance costs.
Interest Rate Applicable to the Credit Facilities
The interest rate applicable to the Credit Facilities is, at our option, either (i) a base rate plus an applicable margin equal to
1.25%
in respect of the Term Loan Facility and ranging from
0.25%
to
1.00%
, depending on our leverage ratio, in respect of the Revolving Credit Facility, or (ii) a Eurocurrency rate plus an applicable margin equal to
2.25%
in respect of the Term Loan Facility and ranging from
1.25%
to
2.00%
, depending on our leverage ratio, in respect of the Revolving Credit Facility. Borrowings are subject to a floor of
2.00%
in the case of the base rate and a floor of
1.00%
in the case of Eurocurrency rate. Amounts drawn under each letter of credit that is issued and outstanding under this facility bear interest ranging from
1.25%
to
2.00%
, depending on our leverage ratio. The unused portion of the Revolving Credit Facility is subject to a commitment fee of
0.25%
. We are also required to pay (i) letters of credit fees on the aggregate face amounts of outstanding letters of credit plus a fronting fee to the issuing bank and (ii) administration fees. As of
December 31, 2018
, the weighted average interest rate on our Term Loan Facility was
4.77%
. The principal amount of the Term Loan Facility amortizes in quarterly installments equal to
$16 million
, with the balance payable at maturity.
Obligations under the Credit Facilities are guaranteed on a senior secured basis, jointly and severally, by the direct parent company of one of the Borrowers and substantially all of its Canadian and U.S. subsidiaries, including The TDL Group Corp., Burger
73
King Worldwide, Inc., Popeyes Louisiana Kitchen, Inc. and substantially all of their respective Canadian and U.S. subsidiaries (the “Credit Guarantors”). Amounts borrowed under the Credit Facilities are secured on a first priority basis by a perfected security interest in substantially all of the present and future property (subject to certain exceptions) of each Borrower and Credit Guarantor.
2017 4.25% Senior Notes
During 2017, the Borrowers entered into an indenture (the “2017
4.25%
Senior Notes Indenture”) in connection with the issuance of
$1,500 million
of
4.25%
first lien senior notes due
May 15, 2024
(the “2017
4.25%
Senior Notes”). No principal payments are due until maturity and interest is paid semi-annually. The net proceeds from the offering of the 2017
4.25%
Senior Notes, together with other sources of liquidity, were used to redeem all of the outstanding RBI Class A
9.0%
cumulative compounding perpetual voting preferred shares (see Note 13,
Partnership Preferred Units
) and for other general corporate purposes. In connection with the issuance of the 2017
4.25%
Senior Notes, we capitalized approximately
$13 million
in debt issuance costs.
Obligations under the 2017
4.25%
Senior Notes are guaranteed on a senior secured basis, jointly and severally, by the Borrowers and substantially all of the Borrowers' Canadian and U.S. subsidiaries, including The TDL Group Corp., Burger King Worldwide, Inc., Popeyes Louisiana Kitchen, Inc. and substantially all of their respective Canadian and U.S. subsidiaries (the “Note Guarantors”). The 2017
4.25%
Senior Notes are first lien senior secured obligations and rank equal in right of payment with all of the existing and future senior debt of the Borrowers and Note Guarantors, including borrowings and guarantees of the Credit Facilities.
Our 2017
4.25%
Senior Notes may be redeemed in whole or in part, on or after
May 15, 2020
at the redemption prices set forth in the 2017
4.25%
Senior Notes Indenture, plus accrued and unpaid interest, if any, at the date of redemption. The 2017
4.25%
Senior Notes Indenture also contains optional redemption provisions related to tender offers, change of control and equity offerings, among others.
2017 5.00% Senior Notes
During 2017, the Borrowers entered into an indenture (the “2017
5.00%
Senior Notes Indenture”) in connection with the issuance of
$2,800 million
of
5.00%
second lien senior notes due
October 15, 2025
(the “2017
5.00%
Senior Notes”). No principal payments are due until maturity and interest is paid semi-annually. The net proceeds from the offering of the 2017
5.00%
Senior Notes were used to redeem the entire outstanding principal balance of
$2,250 million
of
6.00%
second lien secured notes due April 1, 2022 (the “2014 6.00% Senior Notes”), pay related redemption premiums, fees and expenses, and for general corporate purposes. In connection with the issuance of the 2017
5.00%
Senior Notes, we capitalized approximately
$15 million
in debt issuance costs. In connection with the full redemption of the 2014
6.00%
Senior Notes, we recorded a loss on early extinguishment of debt of
$102 million
that primarily reflects the payment of premiums to redeem the notes and the write-off of unamortized debt issuance costs.
Obligations under the 2017
5.00%
Senior Notes are guaranteed on a second priority senior secured basis, jointly and severally, by the Note Guarantors. The 2017
5.00%
Senior Notes are second lien senior secured obligations and rank equal in right of payment with all of the existing and future senior debt of the Borrowers and Note Guarantors, including borrowings and guarantees of the Credit Facilities.
Our 2017
5.00%
Senior Notes may be redeemed in whole or in part, on or after
October 15, 2020
at the redemption prices set forth in the 2017
5.00%
Senior Notes Indenture, plus accrued and unpaid interest, if any, at the date of redemption. The 2017
5.00%
Senior Notes Indenture also contains optional redemption provisions related to tender offers, change of control and equity offerings, among others.
2015 4.625% Senior Notes
The Borrowers are also party to an indenture (the “2015
4.625%
Senior Notes Indenture”) in connection with the issuance of
$1,250 million
of
4.625%
first lien senior notes due
January 15, 2022
(the “2015
4.625%
Senior Notes”).
No
principal payments are due until maturity and interest is paid semi-annually.
Obligations under the 2015
4.625%
Senior Notes are guaranteed on a senior secured basis, jointly and severally, by the Note Guarantors. The 2015
4.625%
Senior Notes are first lien senior secured obligations and rank equal in right of payment with all of the existing and future senior debt of the Borrowers and Note Guarantors, including borrowings and guarantees of the Credit Facilities.
Our 2015
4.625%
Senior Notes may be redeemed in whole or in part, on or after
October 1, 2017
, at the redemption prices set forth in the corresponding indenture, plus accrued and unpaid interest, if any, at the date of redemption. The 2015
4.625%
Senior Notes Indenture also contains optional redemption provisions related to tender offers, change of control and equity offerings, among others.
Restrictions and Covenants
Our Credit Facilities, 2017
4.25%
Senior Notes Indenture, 2017
5.00%
Senior Notes Indenture and 2015
4.625%
Senior Notes Indenture contain a number of customary affirmative and negative covenants that, among other things, limit or restrict our ability and
74
the ability of certain of our subsidiaries to: incur additional indebtedness; incur liens; engage in mergers, consolidations, liquidations and dissolutions; sell assets; pay dividends and make other payments in respect of capital stock; make investments, loans and advances; pay or modify the terms of certain indebtedness; engage in certain transactions with affiliates. In addition, the Borrowers are not permitted to exceed a first lien senior secured leverage ratio of
6.50
to
1.00
when, as of the end of any fiscal quarter, the sum of (i) the amount of letters of credit outstanding exceeding
$50 million
(other than those that are cash collateralized); (ii) outstanding amounts under the Revolving Credit Facility and (iii) outstanding amounts of swing line loans, exceeds
30.0%
of the commitments under the Revolving Credit Facility.
The restrictions under the Credit Facilities, the 2017
4.25%
Senior Notes Indenture, the 2017
5.00%
Senior Notes Indenture, the 2015
4.625%
Senior Notes Indenture have resulted in substantially all of our consolidated assets being restricted.
As of
December 31, 2018
, we were in compliance with all debt covenants under the Credit Facilities, 2017
4.25%
Senior Notes Indenture, 2017
5.00%
Senior Notes Indenture and 2015
4.625%
Senior Notes Indenture and there were no limitations on our ability to draw on the remaining availability under our Revolving Credit Facility.
Other
On October 11, 2018, one of our subsidiaries entered into a non-revolving delayed drawdown term credit facility in a total aggregate principal amount of
C$100 million
with a maturity date of October 4, 2025 (the “TH Facility”). The interest rate applicable to the TH Facility is the Canadian Bankers’ Acceptance rate plus an applicable margin equal to
1.40%
or the Prime Rate plus an applicable margin equal to
0.40%
, at our option. Obligations under the TH Facility are guaranteed by three of our subsidiaries, and amounts borrowed under the TH Facility are and will be secured by certain parcels of real estate. As of
December 31, 2018
, we had drawn down the entire
C$100 million
available under the TH Facility with a weighted average interest rate of
3.64%
.
On March 27, 2017, we repaid
$156 million
of debt assumed in connection with the Popeyes Acquisition. Additionally,
$36 million
of Tim Hortons Series 1 notes were repaid on June 1, 2017, the original maturity date.
Debt Issuance Costs
During 2017, we incurred aggregate deferred financing costs of
$63 million
.
No
significant deferred financing costs were incurred in 2018 and 2016.
Loss on Early Extinguishment of Debt
During 2017, we recorded a
$122 million
loss on early extinguishment of debt, which primarily reflects the payment of premiums to redeem our 2014
6.00%
Senior Notes and the write-off of unamortized debt issuance costs and discounts in connection with the refinancing of our Term Loan Facility and the redemption of our 2014
6.00%
Senior Notes.
Maturities
The aggregate maturities of our long-term debt as of
December 31, 2018
are as follows (in millions):
|
Year Ended December 31,
|
Principal Amount
|
||
|
2019
|
$
|
70
|
|
|
2020
|
74
|
|
|
|
2021
|
72
|
|
|
|
2022
|
1,324
|
|
|
|
2023
|
78
|
|
|
|
Thereafter
|
10,420
|
|
|
|
Total
|
$
|
12,038
|
|
75
Interest Expense, net
Interest expense, net consists of the following (in millions):
|
2018
|
2017
|
2016
|
|||||||||
|
Debt (a)
|
$
|
498
|
|
$
|
484
|
|
$
|
412
|
|
||
|
Capital lease obligations
|
23
|
|
21
|
|
20
|
|
|||||
|
Amortization of deferred financing costs and debt issuance discount
|
29
|
|
33
|
|
39
|
|
|||||
|
Interest income
|
(15
|
)
|
(26
|
)
|
(4
|
)
|
|||||
|
Interest expense, net
|
$
|
535
|
|
$
|
512
|
|
$
|
467
|
|
||
|
(a)
|
Amount includes
$60 million
benefit during
2018
from our adoption of a new hedge accounting standard. See Note 2,
Significant Accounting Policies – New Accounting Pronouncements
, for further details of the effects of this change in accounting principle on Interest expense, net.
|
Note 10. Leases
Partnership as Lessor
As of
December 31, 2018
, we leased or subleased
5,284
restaurant properties to franchisees and
129
non-restaurant properties to third parties under operating leases and direct financing leases where we are the lessor. Initial lease terms generally range from
10
to
20 years
. Most leases to franchisees provide for fixed monthly payments and many provide for future rent escalations and renewal options. Certain leases also include provisions for contingent rent, determined as a percentage of sales, generally when annual sales exceed specific levels. Lessees typically bear the cost of maintenance, insurance and property taxes.
Assets leased to franchisees and others under operating leases where we are the lessor and which are included within our property and equipment, net are as follows (in millions):
|
|
As of December 31,
|
||||||
|
|
2018
|
2017
|
|||||
|
Land
|
$
|
906
|
|
$
|
931
|
|
|
|
Buildings and improvements
|
1,175
|
|
1,215
|
|
|||
|
Restaurant equipment
|
17
|
|
17
|
|
|||
|
2,098
|
|
2,163
|
|
||||
|
Accumulated depreciation and amortization
|
(475
|
)
|
(407
|
)
|
|||
|
Property and equipment leased, net
|
$
|
1,623
|
|
$
|
1,756
|
|
|
Our net investment in direct financing leases is as follows (in millions):
|
|
As of December 31,
|
||||||
|
|
2018
|
2017
|
|||||
|
Future rents to be received:
|
|||||||
|
Future minimum lease receipts
|
$
|
60
|
|
$
|
77
|
|
|
|
Contingent rents (a)
|
29
|
|
39
|
|
|||
|
Estimated unguaranteed residual value
|
16
|
|
17
|
|
|||
|
Unearned income
|
(35
|
)
|
(45
|
)
|
|||
|
70
|
|
88
|
|
||||
|
Current portion included within accounts receivables
|
(16
|
)
|
(17
|
)
|
|||
|
Net investment in property leased to franchisees
|
$
|
54
|
|
$
|
71
|
|
|
|
(a)
|
Amounts represent estimated contingent rents recorded in connection with the acquisition method of accounting.
|
76
Property revenues are comprised primarily of rental income from operating leases and earned income on direct financing leases with franchisees as follows (in millions):
|
2018
|
2017
|
2016
|
|||||||||
|
Rental income:
|
|||||||||||
|
Minimum
|
$
|
454
|
|
$
|
464
|
|
$
|
451
|
|
||
|
Contingent
|
273
|
|
284
|
|
282
|
|
|||||
|
Amortization of favorable and unfavorable income lease contracts, net
|
8
|
|
8
|
|
9
|
|
|||||
|
Total rental income
|
735
|
|
756
|
|
742
|
|
|||||
|
Earned income on direct financing leases
|
9
|
|
9
|
|
11
|
|
|||||
|
Total property revenues
|
$
|
744
|
|
$
|
765
|
|
$
|
753
|
|
||
Partnership as Lessee
In addition, we lease land, building, equipment, office space and warehouse space, including
675
restaurant buildings under capital leases where we are the lessee. Land and building leases generally have an initial term of
10
to
30 years
, while land-only lease terms can extend longer, and most leases provide for fixed monthly payments. Many of these leases provide for future rent escalations and renewal options. Certain leases also include provisions for contingent rent, determined as a percentage of sales, generally when annual sales exceed specific levels. Most leases also obligate us to pay the cost of maintenance, insurance and property taxes.
Rent expense associated with these lease commitments is as follows (in millions):
|
2018
|
2017
|
2016
|
|||||||||
|
Rental expense:
|
|||||||||||
|
Minimum
|
$
|
201
|
|
$
|
198
|
|
$
|
193
|
|
||
|
Contingent
|
71
|
|
71
|
|
71
|
|
|||||
|
Amortization of favorable and unfavorable payable lease contracts, net
|
9
|
|
10
|
|
9
|
|
|||||
|
Total rental expense (a)
|
$
|
281
|
|
$
|
279
|
|
$
|
273
|
|
||
|
(a)
|
Amounts include rental expense related to properties subleased to franchisees of
$263 million
for
2018
,
$263 million
for
2017
, and
$254 million
for
2016
.
|
As of
December 31, 2018
, future minimum lease receipts and commitments are as follows (in millions):
|
Lease Receipts
|
Lease Commitments (a)
|
||||||||||||||
|
Direct
Financing Leases |
Operating
Leases |
Capital
Leases |
Operating
Leases |
||||||||||||
|
2019
|
$
|
14
|
|
$
|
416
|
|
$
|
38
|
|
$
|
183
|
|
|||
|
2020
|
10
|
|
388
|
|
36
|
|
172
|
|
|||||||
|
2021
|
7
|
|
360
|
|
34
|
|
158
|
|
|||||||
|
2022
|
5
|
|
331
|
|
33
|
|
145
|
|
|||||||
|
2023
|
5
|
|
306
|
|
30
|
|
130
|
|
|||||||
|
Thereafter
|
19
|
|
1,704
|
|
201
|
|
831
|
|
|||||||
|
Total minimum receipts / payments
|
$
|
60
|
|
$
|
3,505
|
|
372
|
|
$
|
1,619
|
|
||||
|
Less amount representing interest
|
(125
|
)
|
|||||||||||||
|
Present value of minimum capital lease payments
|
247
|
|
|||||||||||||
|
Current portion of capital lease obligation
|
(21
|
)
|
|||||||||||||
|
Long-term portion of capital lease obligation
|
$
|
226
|
|
||||||||||||
|
(a)
|
Minimum lease payments have not been reduced by minimum sublease rentals of
$2,290 million
due in the future under non-cancelable subleases.
|
77
Note 11. Income Taxes
Tax Act
In December 2017, the U.S. government enacted comprehensive tax legislation commonly referred to as the Tax Cuts and Jobs Act (the “Tax Act”) that significantly revises the U.S. tax code generally effective January 1, 2018 by, among other changes, lowering the corporate income tax rate from 35% to 21%, limiting deductibility of interest expense and performance based incentive compensation and implementing a modified territorial tax system. As a Canadian entity, we generally would be classified as a foreign entity (and, therefore, a non-U.S. tax resident) under general rules of U.S. federal income taxation. However, we have subsidiaries subject to U.S. federal income taxation and therefore the Tax Act impacted our consolidated results of operations during 2017 and 2018, and is expected to continue to impact our consolidated results of operations in future periods.
The impacts to our consolidated statement of operations consist of the following (the “Tax Act Impact”):
|
•
|
A provisional benefit of
$420 million
recorded in our provision from income taxes for 2017 and a favorable adjustment of
$9 million
recorded for 2018, as a result of the remeasurement of net deferred tax liabilities.
|
|
•
|
Provisional charges of
$103 million
recorded in 2017 and a favorable adjustment of
$3 million
recorded in 2018, related to certain deductions allowed to be carried forward before the Tax Act, which potentially may not be carried forward and deductible under the Tax Act.
|
|
•
|
A provisional estimate for a one-time transitional repatriation tax on unremitted foreign earnings (the “Transition Tax”) of
$119 million
recorded in 2017, most of which had been previously accrued with respect to certain undistributed foreign earnings, and a favorable adjustment of
$15 million
(primarily related to utilization of foreign tax credits) recorded in 2018.
|
In accordance with Staff Accounting Bulletin No. 118 issued by the staff of the SEC, adjustments to provisional amounts were recorded as discrete items in the provision for income taxes in 2018, the period in which those adjustments became reasonably estimable, as described above.
The ultimate impact of the Tax Act on our effective tax rate in future periods will depend on interpretations and regulatory changes from the Internal Revenue Service, the SEC, the FASB and various tax jurisdictions, or actions we may take.
Income (loss) before income taxes, classified by source of income (loss), is as follows (in millions):
|
2018
|
2017
|
2016
|
|||||||||
|
Canadian
|
$
|
1,111
|
|
$
|
1,223
|
|
$
|
1,050
|
|
||
|
Foreign
|
271
|
|
(122
|
)
|
150
|
|
|||||
|
Income before income taxes
|
$
|
1,382
|
|
$
|
1,101
|
|
$
|
1,200
|
|
||
Income tax (benefit) expense attributable to income from continuing operations consists of the following (in millions):
|
2018
|
2017
|
2016
|
|||||||||
|
Current:
|
|||||||||||
|
Canadian
|
$
|
25
|
|
$
|
438
|
|
$
|
79
|
|
||
|
U.S. Federal
|
95
|
|
113
|
|
45
|
|
|||||
|
U.S. state, net of federal income tax benefit
|
17
|
|
3
|
|
2
|
|
|||||
|
Other Foreign
|
72
|
|
54
|
|
38
|
|
|||||
|
$
|
209
|
|
$
|
608
|
|
$
|
164
|
|
|||
|
Deferred:
|
|||||||||||
|
Canadian
|
$
|
78
|
|
$
|
(302
|
)
|
$
|
49
|
|
||
|
U.S. Federal
|
(65
|
)
|
(473
|
)
|
37
|
|
|||||
|
U.S. state, net of federal income tax benefit
|
13
|
|
34
|
|
(7
|
)
|
|||||
|
Other Foreign
|
3
|
|
(1
|
)
|
1
|
|
|||||
|
$
|
29
|
|
$
|
(742
|
)
|
$
|
80
|
|
|||
|
Income tax (benefit) expense
|
$
|
238
|
|
$
|
(134
|
)
|
$
|
244
|
|
||
78
The statutory rate reconciles to the effective income tax rate as follows:
|
2018
|
2017
|
2016
|
||||||
|
Statutory rate
|
26.5
|
%
|
26.5
|
%
|
26.5
|
%
|
||
|
Costs and taxes related to foreign operations
|
4.2
|
|
8.9
|
|
9.6
|
|
||
|
Foreign exchange gain (loss)
|
(0.1
|
)
|
(7.7
|
)
|
0.1
|
|
||
|
Foreign tax rate differential
|
(6.1
|
)
|
(1.9
|
)
|
(1.0
|
)
|
||
|
Change in valuation allowance
|
3.2
|
|
12.0
|
|
0.2
|
|
||
|
Change in accrual for tax uncertainties
|
0.1
|
|
(0.4
|
)
|
1.0
|
|
||
|
Intercompany financing
|
(4.4
|
)
|
(19.5
|
)
|
(16.0
|
)
|
||
|
Impact of Tax Act
|
(1.9
|
)
|
(27.4
|
)
|
—
|
|
||
|
Benefit from stock option exercises
|
(5.0
|
)
|
(4.9
|
)
|
—
|
|
||
|
Other
|
0.7
|
|
2.3
|
|
(0.1
|
)
|
||
|
Effective income tax rate
|
17.2
|
%
|
(12.1
|
)%
|
20.3
|
%
|
||
Income tax (benefit) expense allocated to continuing operations and amounts separately allocated to other items was (in millions):
|
2018
|
2017
|
2016
|
|||||||||
|
Income tax (benefit) expense from continuing operations
|
$
|
238
|
|
$
|
(134
|
)
|
$
|
244
|
|
||
|
Cash flow hedge in accumulated other comprehensive income (loss)
|
(2
|
)
|
5
|
|
(2
|
)
|
|||||
|
Net investment hedge in accumulated other comprehensive income (loss)
|
101
|
|
(13
|
)
|
12
|
|
|||||
|
Pension liability in accumulated other comprehensive income (loss)
|
—
|
|
(2
|
)
|
(2
|
)
|
|||||
|
Stock option tax benefit in common shares
|
—
|
|
—
|
|
(9
|
)
|
|||||
|
Total
|
$
|
337
|
|
$
|
(144
|
)
|
$
|
243
|
|
||
The significant components of deferred income tax (benefit) expense attributable to income from continuing operations are as follows (in millions):
|
2018
|
2017
|
2016
|
|||||||||
|
Deferred income tax (benefit) expense
|
$
|
(14
|
)
|
$
|
(449
|
)
|
$
|
78
|
|
||
|
Change in valuation allowance
|
43
|
|
133
|
|
2
|
|
|||||
|
Change in effective Canadian income tax rate
|
(3
|
)
|
—
|
|
—
|
|
|||||
|
Change in effective U.S. federal income tax rate
|
(8
|
)
|
(433
|
)
|
—
|
|
|||||
|
Change in effective U.S. state income tax rate
|
15
|
|
4
|
|
(3
|
)
|
|||||
|
Change in effective foreign income tax rate
|
(4
|
)
|
3
|
|
3
|
|
|||||
|
Total
|
$
|
29
|
|
$
|
(742
|
)
|
$
|
80
|
|
||
79
The tax effects of temporary differences that give rise to significant portions of the deferred tax assets and deferred tax liabilities are presented below (in millions):
|
|
As of December 31,
|
||||||
|
|
2018
|
2017
|
|||||
|
Deferred tax assets:
|
|||||||
|
Accounts and notes receivable
|
$
|
5
|
|
$
|
5
|
|
|
|
Accrued employee benefits
|
49
|
|
49
|
|
|||
|
Unfavorable leases
|
123
|
|
146
|
|
|||
|
Liabilities not currently deductible for tax
|
176
|
|
74
|
|
|||
|
Tax loss and credit carryforwards
|
509
|
|
550
|
|
|||
|
Derivatives
|
25
|
|
136
|
|
|||
|
Other
|
8
|
|
—
|
|
|||
|
Total gross deferred tax assets
|
895
|
|
960
|
|
|||
|
Valuation allowance
|
(325
|
)
|
(282
|
)
|
|||
|
Net deferred tax assets
|
570
|
|
678
|
|
|||
|
Less deferred tax liabilities:
|
|||||||
|
Property and equipment, principally due to differences in depreciation
|
43
|
|
33
|
|
|||
|
Intangible assets
|
1,734
|
|
1,791
|
|
|||
|
Leases
|
105
|
|
129
|
|
|||
|
Statutory impairment
|
31
|
|
26
|
|
|||
|
Outside basis difference
|
35
|
|
68
|
|
|||
|
Total gross deferred tax liabilities
|
1,948
|
|
2,047
|
|
|||
|
Net deferred tax liability
|
$
|
1,378
|
|
$
|
1,369
|
|
|
The valuation allowance had a net increase of
$43 million
during
2018
primarily due to the change in provisional estimates related to the utilization of foreign tax credits. This increase was partially offset by a release due to the utilization of capital losses that had been previously valued.
Changes in the valuation allowance are as follows (in millions):
|
2018
|
2017
|
2016
|
|||||||||
|
Beginning balance
|
$
|
282
|
|
$
|
133
|
|
$
|
125
|
|
||
|
Additions due to acquisition
|
—
|
|
9
|
|
—
|
|
|||||
|
Change in estimates recorded to deferred income tax expense
|
43
|
|
133
|
|
2
|
|
|||||
|
Changes from foreign currency exchange rates
|
—
|
|
6
|
|
(1
|
)
|
|||||
|
True-ups from changes in losses and credits
|
—
|
|
1
|
|
7
|
|
|||||
|
Ending balance
|
$
|
325
|
|
$
|
282
|
|
$
|
133
|
|
||
The gross amount and expiration dates of operating loss and tax credit carry-forwards as of
December 31, 2018
are as follows (in millions):
|
Amount
|
Expiration Date
|
||||
|
Canadian net operating loss carryforwards
|
$
|
735
|
|
2036-2038
|
|
|
Canadian capital loss carryforwards
|
1,139
|
|
Indefinite
|
||
|
U.S. state net operating loss carryforwards
|
595
|
|
2019-2038
|
||
|
U.S. foreign tax credits
|
81
|
|
2019-2028
|
||
|
Other foreign net operating loss carryforwards
|
192
|
|
Indefinite
|
||
|
Other foreign net operating loss carryforwards
|
57
|
|
2020-2037
|
||
|
Other foreign capital loss carryforward
|
30
|
|
Indefinite
|
||
|
Foreign credits
|
2
|
|
2019-2036
|
||
|
Total
|
$
|
2,831
|
|
||
80
In prior periods, we provided deferred taxes on certain undistributed foreign earnings. Under our transition to a modified territorial tax system whereby all previously untaxed undistributed foreign earnings are subject to a transition tax charge at reduced rates and future repatriations of foreign earnings will generally be exempt from U.S. tax, we wrote off the existing deferred tax liability on undistributed foreign earnings and recorded the impact of the new transition tax charge on foreign earnings. We will continue to monitor available evidence and our plans for foreign earnings and expect to continue to provide any applicable deferred taxes based on the tax liability or withholding taxes that would be due upon repatriation of amounts not considered permanently reinvested.
We had
$441 million
of unrecognized tax benefits at
December 31, 2018
, which if recognized, would favorably affect the effective income tax rate. A reconciliation of the beginning and ending amounts of unrecognized tax benefits is as follows (in millions):
|
2018
|
2017
|
2016
|
|||||||||
|
Beginning balance
|
$
|
461
|
|
$
|
241
|
|
$
|
239
|
|
||
|
Additions on tax position related to the current year
|
1
|
|
186
|
|
2
|
|
|||||
|
Additions for tax positions of prior years
|
18
|
|
41
|
|
6
|
|
|||||
|
Additions for tax positions taken in conjunction with acquisition of Tim Hortons
|
—
|
|
2
|
|
—
|
|
|||||
|
Reductions for tax positions of prior year
|
(18
|
)
|
—
|
|
(1
|
)
|
|||||
|
Reductions for settlement
|
(18
|
)
|
(2
|
)
|
(5
|
)
|
|||||
|
Reductions due to statute expiration
|
(3
|
)
|
(7
|
)
|
—
|
|
|||||
|
Ending balance
|
$
|
441
|
|
$
|
461
|
|
$
|
241
|
|
||
During the twelve months beginning January 1, 2019, it is reasonably possible we will reduce unrecognized tax benefits by approximately
$6 million
, primarily as a result of the expiration of certain statutes of limitations and the resolution of audits.
We recognize interest and penalties related to unrecognized tax benefits in income tax expense. The total amount of accrued interest and penalties was
$51 million
and
$37 million
at
December 31, 2018
and
2017
, respectively. Potential interest and penalties associated with uncertain tax positions recognized was
$14 million
during
2018
,
$10 million
during
2017
and
$11 million
during
2016
. To the extent interest and penalties are not assessed with respect to uncertain tax positions, amounts accrued will be reduced and reflected as a reduction of the overall income tax provision.
We file income tax returns with Canada and its provinces and territories. Generally we are subject to routine examinations by the Canada Revenue Agency (“CRA”). The CRA is conducting examinations of the 2013 through 2015 taxation years. Additionally, income tax returns filed with various provincial jurisdictions are generally open to examination for periods of
three
to
five years
subsequent to the filing of the respective return.
We also file income tax returns, including returns for our subsidiaries, with U.S. federal, U.S. state, and foreign jurisdictions. Generally we are subject to routine examination by taxing authorities in the U.S. jurisdictions, as well as foreign tax jurisdictions. None of the foreign jurisdictions should be individually material. The examination of our U.S. federal income tax returns for fiscal 2009, 2010, the period July 1, 2010 through October 18, 2010 and the period October 19, 2010 through December 31, 2010 was closed during the first half of 2018. The U.S. federal income tax returns for our U.S. companies for fiscal years 2014, 2015 and 2016 are currently under audit by the U.S. Internal Revenue Service. We have various U.S. state and foreign income tax returns in the process of examination. From time to time, these audits result in proposed assessments where the ultimate resolution may result in owing additional taxes. We believe that our tax positions comply with applicable tax law and that we have adequately provided for these matters.
Note 12. Derivative Instruments
Disclosures about Derivative Instruments and Hedging Activities
We enter into derivative instruments for risk management purposes, including derivatives designated as cash flow hedges, derivatives designated as net investment hedges and those utilized as economic hedges. We use derivatives to manage our exposure to fluctuations in interest rates and currency exchange rates.
81
Interest Rate Swaps
During 2018, we entered into a series of receive-variable, pay-fixed interest rate swaps with a notional value of
$3,500 million
to hedge the variability in the interest payments on a portion of our senior secured term loan facility (the “Term Loan Facility”) beginning March 29, 2018 through the expiration of the final swap on
February 17, 2024
, resetting each March. At inception, these interest rate swaps were designated as cash flow hedges for hedge accounting. The unrealized changes in market value are recorded in AOCI and reclassified into earnings during the period in which the hedged forecasted transaction affects earnings.
During 2015, we entered into a series of receive-variable, pay-fixed interest rate swaps with a notional value of
$2,500 million
to hedge the variability in the interest payments on a portion of our Term Loan Facility beginning May 28, 2015. All of these interest rate swaps were settled on
April 26, 2018
for an insignificant cash receipt. At inception, these interest rate swaps were designated as cash flow hedges for hedge accounting. The unrealized changes in market value were recorded in AOCI and reclassified into earnings during the period in which the hedged forecasted transaction affects earnings.
During 2015, we settled certain interest rate swaps and recognized a net unrealized loss of
$85 million
in AOCI at the date of settlement. This amount gets reclassified into Interest expense, net as the original hedged forecasted transaction affects earnings. The amount of pre-tax losses in AOCI as of
December 31, 2018
that we expect to be reclassified into interest expense within the next 12 months is
$12 million
.
Cross-Currency Rate Swaps
To protect the value of our investments in our foreign operations against adverse changes in foreign currency exchange rates, we hedge a portion of our net investment in one or more of our foreign subsidiaries by using cross-currency rate swaps. At
December 31, 2018
, we had outstanding cross-currency rate swap contracts between the Canadian dollar and U.S. dollar and the Euro and U.S. dollar that have been designated as net investment hedges of a portion of our equity in foreign operations in those currencies. The component of the gains and losses on our net investment in these designated foreign operations driven by changes in foreign exchange rates are economically offset by movements in the fair value of our cross currency swap contracts. The fair value of the swaps is calculated each period with changes in fair value reported in AOCI, net of tax. Such amounts will remain in AOCI until the complete or substantially complete liquidation of our investment in the underlying foreign operations.
During 2017, we terminated and settled our previous cross-currency rate swaps with an aggregate notional value of
$5,000 million
, between the Canadian dollar and U.S. dollar. In connection with this termination, we received
$764 million
which is reflected as a source of cash provided by investing activities in the consolidated statement of cash flows. The unrealized gains totaled
$533 million
, net of tax, as of the termination date and will remain in AOCI until the complete or substantially complete liquidation of our investment in the underlying foreign operations. Additionally during 2017, we entered into new fixed-to-fixed cross-currency rate swaps to partially hedge the net investment in our Canadian subsidiaries. At inception, these cross-currency rate swaps were designated as a hedge and are accounted for as net investment hedges. These swaps are contracts to exchange quarterly fixed-rate interest payments we make on the Canadian dollar notional amount of C
$6,754 million
for quarterly fixed-rate interest payments we receive on the U.S. dollar notional amount of
$5,000 million
through the maturity date of
June 30, 2023
. In making such changes, we effectively realigned our Canadian dollar hedges to reflect our current cash flow mix and capital structure maturity profile.
At
December 31, 2018
, we also had outstanding cross-currency rate swaps in which we pay quarterly fixed-rate interest payments on the Euro notional amount of €
1,108 million
and receive quarterly fixed-rate interest payments on the U.S. dollar notional amount of
$1,200 million
. At inception, these cross-currency rate swaps were designated as a hedge and are accounted for as a net investment hedge. During 2018, we extended the term of the swaps from
March 31, 2021
to the maturity date of
February 17, 2024
. The extension of the term resulted in a re-designation of the hedge and the swaps continue to be accounted for as a net investment hedge. Additionally, during 2018, we entered into cross-currency rate swaps in which we receive quarterly fixed-rate interest payments on the U.S. dollar notional value of
$400 million
through the maturity date of
February 17, 2024
. At inception, these cross-currency rate swaps were designated as a hedge are accounted for as a net investment hedge.
The fixed to fixed cross-currency rate swaps hedging Canadian dollar and Euro net investments utilized the forward method of effectiveness assessment prior to March 15, 2018. On March 15, 2018, we dedesignated and subsequently redesignated the outstanding fixed to fixed cross-currency rate swaps to prospectively use the spot method of hedge effectiveness assessment. We also elected to amortize the Excluded Component over the life of the derivative instrument. The amortization of the Excluded Component is recognized in Interest expense, net in the consolidated statement of operations. The change in fair value that is not related to the Excluded Component is recorded in AOCI and will be reclassified to earnings when the foreign subsidiaries are sold or substantially liquidated. See Note 2,
Significant Accounting Policies - New Accounting Pronouncements
, for further information on the adoption of this new guidance.
82
Foreign Currency Exchange Contracts
We use foreign exchange derivative instruments to manage the impact of foreign exchange fluctuations on U.S. dollar purchases and payments, such as coffee purchases made by our Canadian Tim Hortons operations. At
December 31, 2018
, we had outstanding forward currency contracts to manage this risk in which we sell Canadian dollars and buy U.S. dollars with a notional value of
$124 million
with maturities to
January 2020
. We have designated these instruments as cash flow hedges, and as such, the unrealized changes in market value of effective hedges are recorded in AOCI and are reclassified into earnings during the period in which the hedged forecasted transaction affects earnings.
Credit Risk
By entering into derivative contracts, we are exposed to counterparty credit risk. Counterparty credit risk is the failure of the counterparty to perform under the terms of the derivative contract. When the fair value of a derivative contract is in an asset position, the counterparty has a liability to us, which creates credit risk for us. We attempt to minimize this risk by selecting counterparties with investment grade credit ratings and regularly monitoring our market position with each counterparty.
Credit-Risk Related Contingent Features
Our derivative instruments do not contain any credit-risk related contingent features.
Quantitative Disclosures about Derivative Instruments and Fair Value Measurements
The following tables present the required quantitative disclosures for our derivative instruments, including their estimated fair values (all estimated using Level 2 inputs) and their location on our consolidated balance sheets (in millions):
|
|
Gain (Loss) Recognized in
Other Comprehensive Income (Loss) |
||||||||||
|
|
2018
|
2017
|
2016
|
||||||||
|
Derivatives designated as cash flow hedges
(1)
|
|||||||||||
|
Interest rate swaps
|
$
|
(37
|
)
|
$
|
(6
|
)
|
$
|
(23
|
)
|
||
|
Forward-currency contracts
|
$
|
11
|
|
$
|
(9
|
)
|
$
|
(5
|
)
|
||
|
Derivatives designated as net investment hedges
|
|||||||||||
|
Cross-currency rate swaps
|
$
|
383
|
|
$
|
(384
|
)
|
$
|
(87
|
)
|
||
|
(1)
|
We did not exclude any components from the cash flow hedge relationships presented in this table.
|
|
Location of Gain or (Loss) Reclassified from AOCI into Earnings
|
Gain or (Loss) Reclassified from AOCI into
Earnings
|
|||||||||||||
|
|
2018
|
2017
|
2016
|
|||||||||||
|
Derivatives designated as cash flow hedges
|
||||||||||||||
|
Interest rate swaps
|
Interest expense, net
|
$
|
(19
|
)
|
$
|
(31
|
)
|
$
|
(21
|
)
|
||||
|
Forward-currency contracts
|
Cost of sales
|
$
|
(1
|
)
|
$
|
(3
|
)
|
$
|
—
|
|
||||
|
|
Location of Gain or (Loss) Recognized in Earnings
|
Gain or (Loss) Recognized in Earnings (Amount Excluded from Effectiveness Testing)
|
||||||||||||
|
|
2018
|
2017
|
2016
|
|||||||||||
|
Derivatives designated as net investment hedges
|
||||||||||||||
|
Cross-currency rate swaps
|
Interest expense, net
|
$
|
60
|
|
$
|
—
|
|
$
|
—
|
|
||||
83
|
|
Fair Value as of
December 31, |
|
|||||||
|
|
2018
|
2017
|
Balance Sheet Location
|
||||||
|
Assets:
|
|||||||||
|
Derivatives designated as cash flow hedges
|
|||||||||
|
Foreign currency
|
$
|
7
|
|
$
|
1
|
|
Prepaids and other current assets
|
||
|
Derivatives designated as net investment hedges
|
|||||||||
|
Foreign currency
|
58
|
|
—
|
|
Other assets, net
|
||||
|
Total assets at fair value
|
$
|
65
|
|
$
|
1
|
|
|||
|
Liabilities:
|
|||||||||
|
Derivatives designated as cash flow hedges
|
|||||||||
|
Interest rate
|
$
|
72
|
|
$
|
42
|
|
Other liabilities, net
|
||
|
Foreign currency
|
—
|
|
5
|
|
Other accrued liabilities
|
||||
|
Derivatives designated as net investment hedges
|
|||||||||
|
Foreign currency
|
107
|
|
456
|
|
Other liabilities, net
|
||||
|
Total liabilities at fair value
|
$
|
179
|
|
$
|
503
|
|
|||
Note 13. Partnership Preferred Units
On
December 12, 2014
we issued
68,530,939
Partnership preferred units to RBI. Under the terms of the partnership agreement, Partnership was required to make distributions to RBI on the Partnership preferred units in amounts equal to (i) preferred dividends declared and payable by RBI on the
68,530,939
Class A
9.0%
cumulative compounding perpetual voting preferred shares issued by RBI (the “Preferred Shares”) and (ii) in the event RBI redeemed the Preferred Shares, the redemption amount of the Preferred Shares. Upon payment of a distribution to RBI to fund the redemption of the Preferred Shares, the Partnership preferred units remain outstanding, but provide no economic rights to RBI, other than a nominal dividend of
$100
per year.
The distribution provisions of the partnership agreement requiring Partnership to fund RBI's redemption of the Preferred Shares were accounted for as an in-substance redemption provision of the Partnership preferred units. The Partnership preferred units were classified as temporary equity as a result of Partnership's lack of control over this distribution provision. In 2014, Partnership adjusted the carrying value of the Partnership preferred units to reflect the Preferred Shares redemption price of
$48.109657
per Preferred Share (the “redemption price”).
On
December 12, 2017
(the “Redemption Date”), RBI redeemed all of the issued and outstanding Preferred Shares for aggregate consideration of
$3,116 million
(the “Redemption Consideration”), including
$54 million
of accrued and unpaid Preferred Share dividends up to the Redemption Date. Partnership made a distribution to RBI in an equal amount under the terms of the partnership agreement described above. Partnership accounted for
$54 million
of this distribution as a preferred unit distribution, with the remainder accounted for as an in-substance redemption of the Partnership preferred units. The difference between (i) the Redemption Consideration and related transaction costs, net of the
$54 million
preferred unit distribution and (ii) the carrying amount of the Partnership preferred units on the Redemption Date is reflected as a
$234 million
increase in net income attributable to common unitholders and partner's capital.
During 2018, RBI made a payment, which was funded by Partnership through a distribution, in connection with the settlement of certain provisions associated with the 2017 redemption of the Preferred Shares as a result of recently proposed Treasury regulations included within Other operating expense (income), net in our consolidated statements of operations.
Note 14. Equity
Pursuant to the terms of the partnership agreement, RBI, as the holder of Class A common units, is entitled to distributions from Partnership in an amount equal to the aggregate dividends payable by RBI to holders of RBI common shares, and the holders of Partnership exchangeable units are entitled to receive distributions from Partnership in an amount per unit equal to the dividend payable by RBI on each RBI common share. Additionally, if RBI proposes to redeem, repurchase or otherwise acquire any RBI common shares, the partnership agreement requires that Partnership, immediately prior to such redemption, repurchase or acquisition, make a distribution to RBI on the Class A common units in an amount sufficient for RBI to fund such redemption, repurchase or acquisition, as the case may be. Each holder of a Partnership exchangeable unit is entitled to vote in respect of matters on which holders of RBI common shares are entitled to vote through one special voting share of RBI. Since December 12, 2015, a holder of a Partnership exchangeable unit may require Partnership to exchange all or any portion of such holder’s Partnership exchangeable units for RBI common shares at a ratio of one common share for each Partnership exchangeable unit, subject to RBI’s right as the general
84
partner of Partnership, in its sole discretion, to deliver a cash payment in lieu of RBI common shares. If RBI elects to make a cash payment in lieu of issuing common shares, the amount of the payment will be the weighted average trading price of the RBI common shares on the New York Stock Exchange for the
20
consecutive trading days ending on the last business day prior to the exchange date.
During
2018
, Partnership exchanged
10,185,333
Partnership exchangeable units, pursuant to exchange notices received. In accordance with the terms of the partnership agreement, Partnership satisfied the exchange notices by repurchasing
10,000,000
Partnership exchangeable units for approximately
$561 million
in cash and exchanging
185,333
Partnership exchangeable units for the same number of newly issued RBI common shares. During
2017
, Partnership exchanged
9,286,480
Partnership exchangeable units, pursuant to exchange notices received. In accordance with the terms of the partnership agreement, Partnership satisfied the exchange notices by repurchasing
5,000,000
Partnership exchangeable units for approximately
$330 million
in cash and exchanging
4,286,480
Partnership exchangeable units for the same number of newly issued RBI common shares. During
2016
, Partnership exchanged
6,744,244
Partnership exchangeable units, pursuant to exchange notices received. In accordance with the terms of the partnership agreement, Partnership satisfied the exchange notices by exchanging these Partnership exchangeable units for the same number of newly issued RBI common shares. The exchanges of Partnership exchangeable units were recorded as increases to the Class A common units balance within partner’s capital in our consolidated balance sheets in an amount equal to the market value of the newly issued RBI common shares and a reduction to the Partnership exchangeable units balance within partner’s capital of our consolidated balance sheets in an amount equal to the cash paid by Partnership and the market value of the newly issued RBI common shares. Pursuant to the terms of the partnership agreement, upon the exchange of Partnership exchangeable units, each such Partnership exchangeable unit was cancelled concurrently with the exchange.
85
Accumulated Other Comprehensive Income (Loss)
The following table displays the change in the components of AOCI (in millions):
|
Derivatives
|
Pensions
|
Foreign
Currency Translation |
Accumulated
Other Comprehensive Income (Loss) |
||||||||||||
|
Balances at December 31, 2015
|
$
|
637
|
|
$
|
(24
|
)
|
$
|
(2,080
|
)
|
$
|
(1,467
|
)
|
|||
|
Foreign currency translation adjustment
|
—
|
|
—
|
|
223
|
|
223
|
|
|||||||
|
Net change in fair value of derivatives, net of tax
|
(119
|
)
|
—
|
|
—
|
|
(119
|
)
|
|||||||
|
Amounts reclassified to earnings of cash flow hedges, net of tax
|
16
|
|
—
|
|
—
|
|
16
|
|
|||||||
|
Pension and post-retirement benefit plans, net of tax
|
—
|
|
(8
|
)
|
—
|
|
(8
|
)
|
|||||||
|
Balances at December 31, 2016
|
$
|
534
|
|
$
|
(32
|
)
|
$
|
(1,857
|
)
|
$
|
(1,355
|
)
|
|||
|
Foreign currency translation adjustment
|
—
|
|
—
|
|
824
|
|
824
|
|
|||||||
|
Net change in fair value of derivatives, net of tax
|
(382
|
)
|
—
|
|
—
|
|
(382
|
)
|
|||||||
|
Amounts reclassified to earnings of cash flow hedges, net of tax
|
25
|
|
—
|
|
—
|
|
25
|
|
|||||||
|
Pension and post-retirement benefit plans, net of tax
|
—
|
|
4
|
|
—
|
|
4
|
|
|||||||
|
Balances at December 31, 2017
|
$
|
177
|
|
$
|
(28
|
)
|
$
|
(1,033
|
)
|
$
|
(884
|
)
|
|||
|
Foreign currency translation adjustment
|
—
|
|
—
|
|
(831
|
)
|
(831
|
)
|
|||||||
|
Net change in fair value of derivatives, net of tax
|
263
|
|
—
|
|
—
|
|
263
|
|
|||||||
|
Amounts reclassified to earnings of cash flow hedges, net of tax
|
14
|
|
—
|
|
—
|
|
14
|
|
|||||||
|
Pension and post-retirement benefit plans, net of tax
|
—
|
|
1
|
|
—
|
|
1
|
|
|||||||
|
Balances at December 31, 2018
|
$
|
454
|
|
$
|
(27
|
)
|
$
|
(1,864
|
)
|
$
|
(1,437
|
)
|
|||
Note 15. Share-based Compensation
Share-based compensation expense associated with the participation of Partnership and its subsidiaries in RBI’s share-based compensation plans is recognized in Partnership’s financial statements.
On January 30, 2015, RBI’s board of directors approved: (i) adoption of the Restaurant Brands International Inc. 2014 Omnibus Incentive Plan, currently the Amended and Restated 2014 Omnibus Incentive Plan, (the “Omnibus Plan”), to provide for the grant of awards to employees, directors, consultants and other persons who provide services to RBI and its subsidiaries; (ii) assumption and amendment of various legacy plans of BK, and assumption of the obligation for all BK stock options and restricted stock units (“RSUs”) outstanding; and (iii) assumption and amendment of various legacy plans of TH, and assumption of the obligation for each vested and unvested TH stock option issued with tandem stock appreciation rights (“SARs”) that was not surrendered in connection with the Tim Hortons transaction on the same terms and conditions of the original awards, as adjusted.
No
new awards may be granted under these legacy BK plans or legacy TH plans.
RBI is currently issuing awards under the Omnibus Plan and the number of shares available for issuance under such plan as of
December 31, 2018
was
16,945,969
. The Omnibus Plan permits the grant of several types of awards with respect to RBI common shares, including stock options, time-vested RSUs, and performance-based RSUs, which may include RBI and/or individual performance based-vesting conditions. Under the terms of the Omnibus Plan, RSUs are entitled to dividend equivalents, unless otherwise noted. Dividends are not distributed unless the awards vest. Upon vesting, the amount of the dividend, which is distributed in additional RSUs, except in the case of RSUs awarded to non-management members of RBI's board of directors, is equal to the equivalent of the aggregate dividends declared on common shares during the period from the date of grant of the award compounded until the date the shares underlying the award are delivered.
Stock option awards are granted with an exercise price or market value equal to the closing price of RBI's common shares on the trading day preceding the date of grant. RBI satisfies stock option exercises through the issuance of authorized but previously unissued common shares. New stock option grants generally cliff vest
5 years
from the original grant date, provided the employee is continuously employed by RBI or one of our subsidiaries, and the stock options expire
10 years
following the grant date. Additionally, if RBI terminates the employment of a stock option holder without cause prior to the vesting date, or if the employee retires or becomes disabled, the employee will become vested in the number of stock options as if the stock options vested
20%
on each anniversary of the grant date. If the employee dies, the employee will become vested in the number of stock options as if the stock
86
options vested
20%
on the first anniversary of the grant date,
40%
on the second anniversary of the grant date and
100%
on the third anniversary of the grant date. If an employee is terminated with cause or resigns before vesting, all stock options are forfeited. If there is an event such as a return of capital or dividend that is determined to be dilutive, the exercise price of the awards will be adjusted accordingly.
Share-based compensation expense consists of the following for the periods presented (in millions):
|
2018
|
2017
|
2016
|
|||||||||
|
Stock options, stock options with tandem SARs and RSUs (a)
|
$
|
48
|
|
$
|
48
|
|
$
|
35
|
|
||
|
Accelerated vesting of Popeyes stock options (b)
|
—
|
|
12
|
|
—
|
|
|||||
|
Total share-based compensation expense (c)
|
$
|
48
|
|
$
|
60
|
|
$
|
35
|
|
||
|
(a)
|
Includes
$2 million
,
$5 million
, and
$1 million
due to modification of awards in
2018
,
2017
and
2016
, respectively.
|
|
(b)
|
Represents expense attributed to the post-combination service associated with the accelerated vesting of stock options in connection with the Popeyes Acquisition.
|
|
(c)
|
Generally classified as selling, general and administrative expenses in the consolidated statements of operations.
|
As of
December 31, 2018
, total unrecognized compensation cost related to share-based compensation arrangements was
$126 million
and is expected to be recognized over a weighted-average period of approximately
3.3 years
.
The following assumptions were used in the Black-Scholes option-pricing model to determine the fair value of stock option awards at the grant date:
|
2018
|
2017
|
2016
|
|||
|
Risk-free interest rate
|
2.13%
|
1.23% - 1.25%
|
0.85%
|
||
|
Expected term (in years)
|
6.39
|
6.74
|
6.74
|
||
|
Expected volatility
|
25.2%
|
24.5%
|
26.6%
|
||
|
Expected dividend yield
|
3.08%
|
1.37%
|
1.81%
|
||
The risk-free interest rate was based on the U.S. Treasury or Canadian Sovereign bond yield with a remaining term equal to the expected option life assumed at the date of grant. The expected term was calculated based on the analysis of a
three
to
five
-year vesting period coupled with our expectations of exercise activity. Expected volatility was based on the historical equity volatility of RBI and a review of the equity volatilities of publicly-traded guideline companies. The expected dividend yield is based on the annual dividend yield at the time of grant.
The following is a summary of stock option activity under our plans for the year ended
December 31, 2018
:
|
Total Number of
Options (in 000’s) |
Weighted
Average Exercise Price |
Aggregate
Intrinsic Value (a) (in 000’s) |
Weighted
Average Remaining Contractual Term (Years) |
|||||||||
|
Outstanding at January 1, 2018
|
20,071
|
|
$
|
25.15
|
|
|||||||
|
Granted
|
1,548
|
|
$
|
58.19
|
|
|||||||
|
Exercised
|
(7,268
|
)
|
$
|
8.37
|
|
|||||||
|
Forfeited
|
(748
|
)
|
$
|
48.26
|
|
|||||||
|
Outstanding at December 31, 2018
|
13,603
|
|
$
|
36.41
|
|
$
|
231,988
|
|
6.2
|
|||
|
Exercisable at December 31, 2018
|
3,118
|
|
$
|
16.32
|
|
$
|
112,215
|
|
3.8
|
|||
|
Vested or expected to vest at December 31, 2018
|
12,479
|
|
$
|
35.75
|
|
$
|
220,320
|
|
6.1
|
|||
|
(a)
|
The intrinsic value represents the amount by which the fair value of our stock exceeds the option exercise price at
December 31, 2018
.
|
87
The weighted-average grant date fair value per stock option granted was
$10.82
,
$12.57
, and
$7.53
during
2018
,
2017
and
2016
, respectively. The total intrinsic value of stock options exercised was
$371 million
during
2018
,
$288 million
during
2017
, and
$47 million
during
2016
.
The fair value of the time-vested RSUs and performance-based RSUs is based on the closing price of RBI’s common shares on the trading day preceding the date of grant. New grants generally cliff vest
five years
from the original grant date. RBI has awarded a limited number of performance-based RSUs that proportionally vest over a
four
year period. Time-vested RSUs and performance-based RSUs are expensed over the vesting period, based upon the probability that the performance target will be met. RBI grants fully vested RSUs, with dividend equivalent rights that accrue in cash, to non-employee members of RBI's board of directors in lieu of a cash retainer and committee fees. All such RSUs will settle and common shares of RBI will be issued upon termination of service by the board member.
The time-vested RSUs generally cliff vest
five years
from December 31
st
of the year preceding the grant date and performance-based RSUs generally cliff vest five years from the grant date (in each case, the “Anniversary Date”). If the employee is terminated for any reason within the first
two years
of the Anniversary Date,
100%
of the time-vested RSUs granted will be forfeited. If RBI terminates the employment of a time-vested RSU holder without cause two years after the Anniversary Date, or if the employee retires, the employee will become vested in the number of time-vested RSUs as if the time-vested RSUs vested
20%
for each year after the Anniversary Date. If the employee is terminated for any reason within the first
three years
of the Anniversary Date,
100%
of the performance-based RSUs granted will be forfeited. If RBI terminates the employment of a performance-based RSU holder without cause between
three
and
five years
after the Anniversary Date, or if the employee retires, the employee will become vested in
50%
of the performance-based RSUs on the fourth anniversary date. An alternate ratable vesting schedule applies to the extent the participant ends employment by reason of death or disability.
The following is a summary of time-vested RSUs and performance-based RSUs activity for the year ended
December 31, 2018
:
|
|
Time-vested RSUs
|
Performance-based RSUs
|
|||||||||||
|
|
Total Number of
Shares (in 000’s) |
Weighted Average
Grant Date Fair Value |
Total Number of
Shares (in 000’s) |
Weighted Average
Grant Date Fair Value |
|||||||||
|
Outstanding at January 1, 2018
|
1,293
|
|
$
|
38.64
|
|
1,590
|
|
$
|
36.31
|
|
|||
|
Granted
|
329
|
|
$
|
57.68
|
|
920
|
|
$
|
58.49
|
|
|||
|
Vested and settled
|
(43
|
)
|
$
|
41.62
|
|
(81
|
)
|
$
|
34.68
|
|
|||
|
Dividend equivalents granted
|
31
|
|
$
|
—
|
|
58
|
|
$
|
—
|
|
|||
|
Forfeited
|
(110
|
)
|
$
|
51.05
|
|
(80
|
)
|
$
|
34.65
|
|
|||
|
Outstanding at December 31, 2018
|
1,500
|
|
$
|
41.88
|
|
2,407
|
|
$
|
45.25
|
|
|||
The total intrinsic value, determined as of the date of vesting, of RSUs vested and converted to common shares of RBI during
2018
,
2017
and
2016
was
$7 million
,
$6 million
and
$3 million
, respectively.
Note 16. Revenue Recognition
Revenue from Contracts with Customers
We transitioned to ASC 606 from the Previous Standards on January 1, 2018 using the modified retrospective transition method. Our Financial Statements reflect the application of ASC 606 guidance beginning in 2018, while our consolidated financial statements for prior periods were prepared under the guidance of the Previous Standards. The
$250 million
cumulative effect of our transition to ASC 606 is reflected as an adjustment to January 1, 2018 Partners' capital.
Our transition to ASC 606 represents a change in accounting principle. ASC 606 eliminates industry-specific guidance and provides a single revenue recognition model for recognizing revenue from contracts with customers. The core principle of ASC 606 is that a reporting entity should recognize revenue to depict the transfer of promised goods or services to customers in an amount that reflects the consideration to which the reporting entity expects to be entitled for the exchange of those goods or services.
88
Contract Liabilities
Contract liabilities consist of deferred revenue resulting from initial and renewal franchise fees paid by franchisees, as well as upfront fees paid by master franchisees, which are generally recognized on a straight-line basis over the term of the underlying agreement. We classify these contract liabilities as Other liabilities, net in our consolidated balance sheets. The following table reflects the change in contract liabilities by segment and on a consolidated basis between the date of adoption (January 1, 2018) and
December 31, 2018
(in millions):
|
Contract Liabilities
|
TH
|
BK
|
PLK
|
Consolidated
|
||||||||||||
|
Balance at January 1, 2018
|
$
|
47
|
|
$
|
402
|
|
$
|
6
|
|
$
|
455
|
|
||||
|
Revenue recognized that was included in the contract liability balance at the beginning of the year
|
(6
|
)
|
(43
|
)
|
—
|
|
(49
|
)
|
||||||||
|
Increase, excluding amounts recognized as revenue during the period
|
24
|
|
58
|
|
13
|
|
95
|
|
||||||||
|
Impact of foreign currency translation
|
(3
|
)
|
(12
|
)
|
—
|
|
(15
|
)
|
||||||||
|
Balance at December 31, 2018
|
$
|
62
|
|
$
|
405
|
|
$
|
19
|
|
$
|
486
|
|
||||
The following table illustrates estimated revenues expected to be recognized in the future related to performance obligations that are unsatisfied (or partially unsatisfied) by segment and on a consolidated basis as of
December 31, 2018
(in millions):
|
Contract liabilities expected to be recognized in
|
TH
|
BK
|
PLK
|
Consolidated
|
||||||||||||
|
2019
|
$
|
7
|
|
$
|
30
|
|
$
|
1
|
|
$
|
38
|
|
||||
|
2020
|
7
|
|
29
|
|
1
|
|
37
|
|
||||||||
|
2021
|
7
|
|
28
|
|
1
|
|
36
|
|
||||||||
|
2022
|
6
|
|
28
|
|
1
|
|
35
|
|
||||||||
|
2023
|
6
|
|
27
|
|
1
|
|
34
|
|
||||||||
|
Thereafter
|
29
|
|
263
|
|
14
|
|
306
|
|
||||||||
|
Total
|
$
|
62
|
|
$
|
405
|
|
$
|
19
|
|
$
|
486
|
|
||||
Disaggregation of Total Revenues
Total revenues consist of the following (in millions):
|
2018
|
2017
|
2016
|
|||||||||
|
Sales
|
$
|
2,355
|
|
$
|
2,390
|
|
$
|
2,205
|
|
||
|
Royalties
|
2,165
|
|
1,215
|
|
993
|
|
|||||
|
Property revenues
|
744
|
|
765
|
|
753
|
|
|||||
|
Franchise fees and other revenue
|
93
|
|
206
|
|
195
|
|
|||||
|
Total revenues
|
$
|
5,357
|
|
$
|
4,576
|
|
$
|
4,146
|
|
||
89
Financial Statement Impact of Transition to ASC 606
As noted above, we transitioned to ASC 606 using the modified retrospective method on January 1, 2018. The cumulative effect of this transition to applicable contracts with customers that were not completed as of January 1, 2018 was recorded as an adjustment to Partners’ capital as of this date. As a result of applying the modified retrospective method to transition to ASC 606, the following adjustments were made to the consolidated balance sheet as of January 1, 2018 (in millions):
|
As Reported
|
Total
|
Adjusted
|
|||||||||
|
December 31, 2017
|
Adjustments
|
January 1, 2018
|
|||||||||
|
ASSETS
|
|||||||||||
|
Current assets:
|
|||||||||||
|
Cash and cash equivalents
|
$
|
1,097
|
|
$
|
—
|
|
$
|
1,097
|
|
||
|
Accounts and notes receivable, net
|
489
|
|
—
|
|
489
|
|
|||||
|
Inventories, net
|
78
|
|
—
|
|
78
|
|
|||||
|
Prepaids and other current assets
|
86
|
|
(23
|
)
|
63
|
|
|||||
|
Total current assets
|
1,750
|
|
(23
|
)
|
1,727
|
|
|||||
|
Property and equipment, net
|
2,133
|
|
—
|
|
2,133
|
|
|||||
|
Intangible assets, net
|
11,062
|
|
—
|
|
11,062
|
|
|||||
|
Goodwill
|
5,782
|
|
—
|
|
5,782
|
|
|||||
|
Net investment in property leased to franchisees
|
71
|
|
—
|
|
71
|
|
|||||
|
Other assets, net
|
426
|
|
107
|
|
533
|
|
|||||
|
Total assets
|
$
|
21,224
|
|
$
|
84
|
|
$
|
21,308
|
|
||
|
LIABILITIES AND EQUITY
|
|||||||||||
|
Current liabilities:
|
|||||||||||
|
Accounts and drafts payable
|
$
|
496
|
|
$
|
—
|
|
$
|
496
|
|
||
|
Other accrued liabilities
|
866
|
|
9
|
|
875
|
|
|||||
|
Gift card liability
|
215
|
|
(43
|
)
|
172
|
|
|||||
|
Current portion of long term debt and capital leases
|
78
|
|
—
|
|
78
|
|
|||||
|
Total current liabilities
|
1,655
|
|
(34
|
)
|
1,621
|
|
|||||
|
Term debt, net of current portion
|
11,801
|
|
—
|
|
11,801
|
|
|||||
|
Capital leases, net of current portion
|
244
|
|
—
|
|
244
|
|
|||||
|
Other liabilities, net
|
1,455
|
|
426
|
|
1,881
|
|
|||||
|
Deferred income taxes, net
|
1,508
|
|
(58
|
)
|
1,450
|
|
|||||
|
Total liabilities
|
16,663
|
|
334
|
|
16,997
|
|
|||||
|
Partners' capital
|
|||||||||||
|
Class A common units
|
4,168
|
|
(132
|
)
|
4,036
|
|
|||||
|
Partnership exchangeable units
|
1,276
|
|
(118
|
)
|
1,158
|
|
|||||
|
Accumulated other comprehensive income (loss)
|
(884
|
)
|
—
|
|
(884
|
)
|
|||||
|
Total Partners' capital
|
4,560
|
|
(250
|
)
|
4,310
|
|
|||||
|
Noncontrolling interests
|
1
|
|
—
|
|
1
|
|
|||||
|
Total equity
|
4,561
|
|
(250
|
)
|
4,311
|
|
|||||
|
Total liabilities and equity
|
$
|
21,224
|
|
$
|
84
|
|
$
|
21,308
|
|
||
90
Franchise Fees
The cumulative adjustment for franchise fees consists of the following:
|
•
|
A
$321 million
increase in Other liabilities, net for the cumulative reversal and deferral of previously recognized franchise fees related to franchise agreements in effect at January 1, 2018 that were entered into subsequent to the acquisitions of BK in 2010, TH in 2014 and PLK in 2017 (net of the cumulative revenue attributable for the period through January 1, 2018), with a corresponding decrease to Partners’ capital.
|
|
•
|
A
$107 million
increase in Other assets, net for the previously unrecognized value of equity interests received in connection with MFDA arrangements. This increase resulted in a corresponding increase in Other liabilities, net of
$105 million
and an increase to Partners’ capital of
$2 million
for the cumulative effect of revenue attributable for the period between the inception of each such arrangement and January 1, 2018.
|
|
•
|
A
$67 million
decrease to Deferred income taxes, net for the tax effects of the two adjustments noted above, with a corresponding increase to Partners’ capital.
|
Advertising Funds
The cumulative adjustment for advertising funds reflects the recognition of cumulative advertising expenditures temporarily in excess of cumulative advertising fund contributions as of January 1, 2018, which is reflected as a
$23 million
decrease in Prepaids and other current assets and a
$23 million
decrease to Partners’ capital.
Gift Card Breakage
The adjustment for gift card breakage reflects the impact of the change to recognize gift card breakage proportionately as gift card balances are used rather than when it is deemed remote that the unused gift card balance would be redeemed, as done under the Previous Standards. The cumulative effect of applying ASC 606 accounting to gift card balances outstanding at January 1, 2018 is reflected as a
$43 million
decrease in Gift card liability, a
$9 million
increase in Other accrued liabilities, a
$9 million
increase in Deferred income taxes, net and a
$25 million
increase in January 1, 2018 Partners’ capital.
91
Comparison to Amounts if Previous Standards Had Been in Effect
The following tables reflect the impact of adoption of ASC 606 on our consolidated statements of operations for
2018
and cash flows from operating activities for
2018
and our consolidated balance sheet as of
December 31, 2018
and the amounts as if the Previous Standards were in effect (“Amounts Under Previous Standards”) (in millions):
Consolidated Statement of Operations for
2018
|
As Reported
|
Total Adjustments
|
Amounts Under Previous Standards
|
|||||||||
|
Revenues:
|
|||||||||||
|
Sales
|
$
|
2,355
|
|
$
|
—
|
|
$
|
2,355
|
|
||
|
Franchise and property revenues
|
3,002
|
|
(750
|
)
|
2,252
|
|
|||||
|
Total revenues
|
5,357
|
|
(750
|
)
|
4,607
|
|
|||||
|
Operating costs and expenses:
|
|||||||||||
|
Cost of sales
|
1,818
|
|
—
|
|
1,818
|
|
|||||
|
Franchise and property expenses
|
422
|
|
—
|
|
422
|
|
|||||
|
Selling, general and administrative expenses
|
1,214
|
|
(785
|
)
|
429
|
|
|||||
|
(Income) loss from equity method investments
|
(22
|
)
|
(6
|
)
|
(28
|
)
|
|||||
|
Other operating expenses (income), net
|
8
|
|
(1
|
)
|
7
|
|
|||||
|
Total operating costs and expenses
|
3,440
|
|
(792
|
)
|
2,648
|
|
|||||
|
Income from operations
|
1,917
|
|
42
|
|
1,959
|
|
|||||
|
Interest expense, net
|
535
|
|
1
|
|
536
|
|
|||||
|
Income before income taxes
|
1,382
|
|
41
|
|
1,423
|
|
|||||
|
Income tax expense
|
238
|
|
9
|
|
247
|
|
|||||
|
Net income
|
1,144
|
|
32
|
|
1,176
|
|
|||||
|
Net income attributable to noncontrolling interests
|
1
|
|
—
|
|
1
|
|
|||||
|
Net income attributable to common unitholders
|
$
|
1,143
|
|
$
|
32
|
|
$
|
1,175
|
|
||
|
Earnings per unit - basic and diluted:
|
|||||||||||
|
Class A common units
|
$
|
3.03
|
|
$
|
3.12
|
|
|||||
|
Partnership exchangeable units
|
$
|
2.46
|
|
$
|
2.53
|
|
|||||
The following summarizes the adjustments to our condensed consolidated statement of operations for
2018
to reflect our consolidated statement of operations as if we had continued to recognize revenue under the Previous Standards:
|
•
|
As described above, our transition to ASC 606 resulted in the deferral of franchise fees, recognition of franchise fees in connection with MFDAs where we received an equity interest in the equity method investee, and a change in the timing of recognizing gift card breakage income. The adjustments for
2018
to reflect the recognition of this revenue as if the Previous Standards were in effect consists of a
$43 million
increase in Franchise and property revenue and a
$11 million
increase in Income tax expense.
|
|
•
|
The adjustments to (income) loss from equity method investments for
2018
reflect the amount of losses from equity method investments we would not have recognized if the Previous Standards were in effect. There is no tax impact related to these adjustments.
|
|
•
|
As described above, under the Previous Standards our statement of operations did not reflect gross presentations of advertising fund contributions and expenses. Our transition to ASC 606 requires the presentation of advertising fund contributions and advertising fund expenses on a gross basis. The adjustments for
2018
reflect advertising fund contributions and expenses as if the Previous Standards were in effect consist of a
$793 million
decrease in Franchise and property revenues, a
$785 million
decrease in Selling, general and administrative expenses, a
$1 million
decrease in Other operating expenses (income), net, a
$1 million
increase in Interest expense, net, and a
$2 million
decrease in Income tax expense.
|
92
Consolidated Statement of Cash Flows for
2018
The transition to ASC 606 had no net impact on our cash provided by operating activities and no impact on our cash used for investing activities or cash used for financing activities during
2018
.
|
Total
|
Amounts Under
|
|||||||||||
|
As Reported
|
Adjustments
|
Previous Standards
|
||||||||||
|
Cash flows from operating activities:
|
||||||||||||
|
Net income
|
$
|
1,144
|
|
$
|
32
|
|
$
|
1,176
|
|
|||
|
Adjustments to reconcile net income to net cash provided by operating activities:
|
||||||||||||
|
Depreciation and amortization
|
180
|
|
—
|
|
180
|
|
||||||
|
Amortization of deferred financing costs and debt issuance discount
|
29
|
|
—
|
|
29
|
|
||||||
|
(Income) loss from equity method investments
|
(22
|
)
|
(6
|
)
|
(28
|
)
|
||||||
|
Loss (gain) on remeasurement of foreign denominated transactions
|
(33
|
)
|
—
|
|
(33
|
)
|
||||||
|
Net (gains) losses on derivatives
|
(40
|
)
|
—
|
|
(40
|
)
|
||||||
|
Share-based compensation expense
|
48
|
|
—
|
|
48
|
|
||||||
|
Deferred income taxes
|
29
|
|
9
|
|
38
|
|
||||||
|
Other
|
5
|
|
—
|
|
5
|
|
||||||
|
Changes in current assets and liabilities, excluding acquisitions and dispositions:
|
||||||||||||
|
Accounts and notes receivable
|
19
|
|
—
|
|
19
|
|
||||||
|
Inventories and prepaids and other current assets
|
(7
|
)
|
6
|
|
(1
|
)
|
||||||
|
Accounts and drafts payable
|
41
|
|
7
|
|
48
|
|
||||||
|
Other accrued liabilities and gift card liability
|
(219
|
)
|
(6
|
)
|
(225
|
)
|
||||||
|
Tenant inducements paid to franchisees
|
(52
|
)
|
—
|
|
(52
|
)
|
||||||
|
Other long-term assets and liabilities
|
43
|
|
(42
|
)
|
1
|
|
||||||
|
Net cash provided by operating activities
|
$
|
1,165
|
|
$
|
—
|
|
$
|
1,165
|
|
|||
93
Consolidated Balance Sheet as of
December 31, 2018
|
As Reported
|
Total
|
Amounts Under
|
|||||||||
|
December 31, 2018
|
Adjustments
|
Previous Standards
|
|||||||||
|
ASSETS
|
|||||||||||
|
Current assets:
|
|||||||||||
|
Cash and cash equivalents
|
$
|
913
|
|
$
|
—
|
|
$
|
913
|
|
||
|
Accounts and notes receivable, net
|
452
|
|
—
|
|
452
|
|
|||||
|
Inventories, net
|
75
|
|
—
|
|
75
|
|
|||||
|
Prepaids and other current assets
|
60
|
|
17
|
|
77
|
|
|||||
|
Total current assets
|
1,500
|
|
17
|
|
1,517
|
|
|||||
|
Property and equipment, net
|
1,996
|
|
—
|
|
1,996
|
|
|||||
|
Intangible assets, net
|
10,463
|
|
—
|
|
10,463
|
|
|||||
|
Goodwill
|
5,486
|
|
—
|
|
5,486
|
|
|||||
|
Net investment in property leased to franchisees
|
54
|
|
—
|
|
54
|
|
|||||
|
Other assets, net
|
642
|
|
(101
|
)
|
541
|
|
|||||
|
Total assets
|
$
|
20,141
|
|
$
|
(84
|
)
|
$
|
20,057
|
|
||
|
LIABILITIES AND EQUITY
|
|||||||||||
|
Current liabilities:
|
|||||||||||
|
Accounts and drafts payable
|
$
|
513
|
|
$
|
7
|
|
$
|
520
|
|
||
|
Other accrued liabilities
|
637
|
|
(15
|
)
|
622
|
|
|||||
|
Gift card liability
|
167
|
|
42
|
|
209
|
|
|||||
|
Current portion of long term debt and capital leases
|
91
|
|
—
|
|
91
|
|
|||||
|
Total current liabilities
|
1,408
|
|
34
|
|
1,442
|
|
|||||
|
Term debt, net of current portion
|
11,823
|
|
—
|
|
11,823
|
|
|||||
|
Capital leases, net of current portion
|
226
|
|
—
|
|
226
|
|
|||||
|
Other liabilities, net
|
1,547
|
|
(468
|
)
|
1,079
|
|
|||||
|
Deferred income taxes, net
|
1,519
|
|
67
|
|
1,586
|
|
|||||
|
Total liabilities
|
16,523
|
|
(367
|
)
|
16,156
|
|
|||||
|
Partners' capital
|
|||||||||||
|
Class A common units
|
4,323
|
|
155
|
|
4,478
|
|
|||||
|
Partnership exchangeable units
|
730
|
|
128
|
|
858
|
|
|||||
|
Accumulated other comprehensive income (loss)
|
(1,437
|
)
|
—
|
|
(1,437
|
)
|
|||||
|
Total Partners' capital
|
3,616
|
|
283
|
|
3,899
|
|
|||||
|
Noncontrolling interests
|
2
|
|
—
|
|
2
|
|
|||||
|
Total equity
|
3,618
|
|
283
|
|
3,901
|
|
|||||
|
Total liabilities and equity
|
$
|
20,141
|
|
$
|
(84
|
)
|
$
|
20,057
|
|
||
Note 17. Other Operating Expenses (Income), net
Other operating expenses (income), net, consist of the following (in millions):
|
2018
|
2017
|
2016
|
|||||||||
|
Net losses on disposal of assets, restaurant closures and refranchisings
|
$
|
19
|
|
$
|
29
|
|
$
|
18
|
|
||
|
Litigation settlements and reserves, net
|
11
|
|
2
|
|
1
|
|
|||||
|
Net losses (gains) on foreign exchange
|
(33
|
)
|
77
|
|
(20
|
)
|
|||||
|
Other, net
|
11
|
|
1
|
|
—
|
|
|||||
|
Other operating expenses (income), net
|
$
|
8
|
|
$
|
109
|
|
$
|
(1
|
)
|
||
94
Net losses (gains) on disposal of assets, restaurant closures, and refranchisings represent sales of properties and other costs related to restaurant closures and refranchisings. Gains and losses recognized in the current period may reflect certain costs related to closures and refranchisings that occurred in previous periods.
Litigation settlements and reserves, net primarily reflects accruals and payments made and proceeds received in connection with litigation matters.
Net losses (gains) on foreign exchange is primarily related to revaluation of foreign denominated assets and liabilities.
Other, net during 2018 is comprised primarily of a payment in connection with the settlement of certain provisions associated with the 2017 redemption of our preferred shares as a result of recently proposed Treasury regulations.
Note 18. Commitments and Contingencies
Letters of Credit
As of
December 31, 2018
, we had
$20 million
in irrevocable standby letters of credit outstanding, which were issued primarily to certain insurance carriers to guarantee payments of deductibles for various insurance programs, such as health and commercial liability insurance. These letters of credit outstanding are secured by the collateral under our Revolving Credit Facility. As of
December 31, 2018
, no amounts had been drawn on any of these irrevocable standby letters of credit.
Purchase Commitments
We have arrangements for information technology and telecommunication services with an aggregate contractual obligation of
$41 million
over the next
three years
, some of which have early termination fees. We also enter into commitments to purchase advertising. As of
December 31, 2018
, these commitments totaled
$380 million
and run through
2024
.
Litigation
From time to time, we are involved in legal proceedings arising in the ordinary course of business relating to matters including, but not limited to, disputes with franchisees, suppliers, employees and customers, as well as disputes over our intellectual property.
On June 19, 2017, a claim was filed in the Ontario Superior Court of Justice against The TDL Group Corp, a subsidiary of RBI, RBI, the Tim Hortons Ad Fund and certain individual defendants. The plaintiff, a franchisee of
two
Tim Hortons restaurants, seeks to certify a class of all persons who have carried on business as a Tim Hortons franchisee in Canada at any time after December 15, 2014. The claim alleges various causes of action against the defendants in relation to the purported misuse of amounts paid by members of the proposed class to the Tim Hortons Canada advertising fund (the “Ad Fund”). The plaintiff seeks to have the Ad Fund franchisee contributions held in trust for the benefit of members of the proposed class, an accounting of the Ad Fund, as well as damages for breach of contract, breach of trust, breach of the statutory duty of fair dealing, and breach of fiduciary duties.
On October 6, 2017, a claim was filed in the Ontario Superior Court of Justice against the same defendants as named above. The plaintiffs,
two
franchisees of Tim Hortons restaurants, seek to certify a class of all persons who have carried on business as a Tim Hortons franchisee at any time after March 8, 2017. The claim alleges various causes of action against the defendants in relation to the purported adverse treatment of member and potential member franchisees of the Great White North Franchisee Association. The plaintiffs seek damages for, among other things, breach of contract, breach of the statutory duty of fair dealing, and breach of the franchisees’ statutory right of association.
In connection with these
two
lawsuits, the court granted our motion to strike the individuals named in the lawsuits, RBI and the Tim Hortons Ad Fund on October 22, 2018. The only defendant that remains in the lawsuits is The TDL Group Corp.
On July 24, 2018, a complaint for declaratory relief was filed against Tim Hortons USA, Inc. (“THUSA”) and Restaurant Brands International Limited Partnership in the Circuit Court of the 11th Judicial Circuit in Miami-Dade County, Florida by Great White North Franchisee Association - USA, Inc., on behalf of its members. The complaint alleges certain breaches of the franchise agreements between THUSA and its franchisees and the implied covenant of good faith and fair dealing, as well as violations of the U.S. franchise rules and the Florida Deceptive and Unfair Trade Practices Act.
On October 5, 2018, a class action complaint was filed against Burger King Worldwide, Inc. (“BKW”) and Burger King Corporation (“BKC”) in the U.S. District Court for the Southern District of Florida by Jarvis Arrington, individually and on behalf of all others similarly situated. On October 18, 2018, a second class action complaint was filed against RBI, BKW and BKC in the U.S. District Court for the Southern District of Florida by Monique Michel, individually and on behalf of all others similarly situated. On October 31, 2018, a third class action complaint was filed against BKC and BKW in the U.S. District Court for the Southern District
95
of Florida by Geneva Blanchard and Tiffany Miller, individually and on behalf of all others similarly situated. On November 2, 2018, a fourth class action complaint was filed against RBI, BKW and BKC in the U.S. District Court for the Southern District of Florida by Sandra Muster, individually and on behalf of all others similarly situated. These complaints allege that the defendants violated Section 1 of the Sherman Act by incorporating an employee no-solicitation and no-hiring clause in the standard form franchise agreement all Burger King franchisees are required to sign. Each plaintiff seeks injunctive relief and damages for himself or herself and other members of the class.
While we believe the claims are without merit, we are unable to predict the ultimate outcome of these cases or estimate the range of possible loss, if any.
Note 19. Segment Reporting and Geographical Information
As stated in Note 1,
Description of Business and Organization
, we manage
three
brands. Under the
Tim Hortons
brand, we operate in the donut/coffee/tea category of the quick service segment of the restaurant industry. Under the
Burger King
brand, we operate in the fast food hamburger restaurant category of the quick service segment of the restaurant industry. Under the
Popeyes
brand, we operate in the chicken category of the quick service segment of the restaurant industry. Our business generates revenue from the following sources: (i) franchise revenues, consisting primarily of royalties based on a percentage of sales reported by franchise restaurants and franchise fees paid by franchisees; (ii) property revenues from properties we lease or sublease to franchisees; and (iii) sales at restaurants owned by us (“Company restaurants”). In addition, our TH business generates revenue from sales to franchisees related to our supply chain operations, including manufacturing, procurement, warehousing and distribution, as well as sales to retailers.
Each brand is managed by a brand president that reports directly to our Chief Executive Officer, who is our Chief Operating Decision Maker. Therefore, we have
three
operating segments: (1) TH, which includes all operations of our
Tim Hortons
brand, (2) BK, which includes all operations of our
Burger King
brand, and (3) PLK, which includes all operations of our
Popeyes
brand. Our
three
operating segments represent our reportable segments.
As stated in Note 16,
Revenue Recognition
, we transitioned to ASC 606 on January 1, 2018 using the modified retrospective transition method. Our Financial Statements reflect the application of ASC 606 guidance beginning in 2018, while our Financial Statements for prior periods were prepared under the guidance of the Previous Standards. For comparability purposes, we have disclosed 2018 total revenues by operating segment under the Previous Standards as well as segment income with a reconciliation to net income under the Previous Standards. See Note 16,
Revenue Recognition
, for further details of the effects of this change in accounting principle on total revenues and net income.
PLK revenues and segment income from the acquisition date of March 27, 2017 through December 31, 2017 are included in our consolidated statement of operations for 2017. The following tables present revenues, by segment and by country, depreciation and amortization, (income) loss from equity method investments, and capital expenditures by segment (in millions):
|
2018
As Reported
|
2018
Amounts Under Previous Standards
|
2017
|
2016
|
||||||||||||
|
Revenues by operating segment:
|
|||||||||||||||
|
TH
|
$
|
3,292
|
|
$
|
3,077
|
|
$
|
3,155
|
|
$
|
3,001
|
|
|||
|
BK
|
1,651
|
|
1,251
|
|
1,219
|
|
1,145
|
|
|||||||
|
PLK
|
414
|
|
279
|
|
202
|
|
—
|
|
|||||||
|
Total
|
$
|
5,357
|
|
$
|
4,607
|
|
$
|
4,576
|
|
$
|
4,146
|
|
|||
|
Revenues by country (a):
|
|||||||||||||||
|
Canada
|
$
|
2,984
|
|
$
|
2,832
|
|
$
|
2,672
|
|
||||||
|
United States
|
1,785
|
|
1,190
|
|
1,004
|
|
|||||||||
|
Other
|
588
|
|
554
|
|
470
|
|
|||||||||
|
Total
|
$
|
5,357
|
|
$
|
4,576
|
|
$
|
4,146
|
|
||||||
96
|
Depreciation and amortization:
|
|||||||||||||
|
TH
|
$
|
108
|
|
$
|
110
|
|
$
|
108
|
|
||||
|
BK
|
61
|
|
62
|
|
64
|
|
|||||||
|
PLK
|
11
|
|
10
|
|
—
|
|
|||||||
|
Total
|
$
|
180
|
|
$
|
182
|
|
$
|
172
|
|
||||
|
(Income) loss from equity method investments:
|
|||||||||||||
|
TH
|
$
|
(6
|
)
|
$
|
(8
|
)
|
$
|
(8
|
)
|
||||
|
BK
|
(16
|
)
|
(4
|
)
|
(12
|
)
|
|||||||
|
Total
|
$
|
(22
|
)
|
$
|
(12
|
)
|
$
|
(20
|
)
|
||||
|
Capital expenditures:
|
|||||||||||||
|
TH
|
$
|
59
|
|
$
|
13
|
|
$
|
12
|
|
||||
|
BK
|
25
|
|
23
|
|
22
|
|
|||||||
|
PLK
|
2
|
|
1
|
|
—
|
|
|||||||
|
Total
|
$
|
86
|
|
$
|
37
|
|
$
|
34
|
|
||||
(a)
Only Canada and the United States represented
10%
or more of our total revenues in each period presented.
Total assets by segment, and long-lived assets by segment and country are as follows (in millions):
|
|
Assets
|
Long-Lived Assets
|
|||||||||||||
|
|
As of December 31,
|
As of December 31,
|
|||||||||||||
|
|
2018
|
2017
|
2018
|
2017
|
|||||||||||
|
By operating segment:
|
|||||||||||||||
|
TH
|
$
|
12,666
|
|
$
|
13,733
|
|
$
|
1,226
|
|
$
|
1,351
|
|
|||
|
BK
|
4,514
|
|
4,633
|
|
729
|
|
751
|
|
|||||||
|
PLK
|
2,420
|
|
2,440
|
|
95
|
|
102
|
|
|||||||
|
Unallocated
|
541
|
|
418
|
|
—
|
|
—
|
|
|||||||
|
Total
|
$
|
20,141
|
|
$
|
21,224
|
|
$
|
2,050
|
|
$
|
2,204
|
|
|||
|
By country:
|
|||||||||||||||
|
Canada
|
$
|
945
|
|
$
|
1,059
|
|
|||||||||
|
United States
|
1,098
|
|
1,138
|
|
|||||||||||
|
Other
|
7
|
|
7
|
|
|||||||||||
|
Total
|
$
|
2,050
|
|
$
|
2,204
|
|
|||||||||
Long-lived assets include property and equipment, net, and net investment in property leased to franchisees. Only Canada and the United States represented
10%
or more of our total long-lived assets as of
December 31, 2018
and
December 31, 2017
.
97
Our measure of segment income is Adjusted EBITDA. Adjusted EBITDA represents earnings (net income or loss) before interest expense, net, loss on early extinguishment of debt, income tax expense (benefit), and depreciation and amortization, adjusted to exclude the non-cash impact of share-based compensation and non-cash incentive compensation expense and (income) loss from equity method investments, net of cash distributions received from equity method investments, as well as other operating expenses (income), net. Other specifically identified costs associated with non-recurring projects are also excluded from Adjusted EBITDA, including fees and expenses associated with the Popeyes Acquisition (“PLK Transaction costs”), Corporate restructuring and tax advisory fees related to the interpretation and implementation of the Tax Act, including Treasury regulations proposed in late 2018, non-operational Office centralization and relocation costs in connection with the centralization and relocation of our Canadian and U.S. restaurant support centers to new offices in Toronto, Ontario, and Miami, Florida, respectively, and integration costs associated with the acquisition of Tim Hortons. Adjusted EBITDA is used by management to measure operating performance of the business, excluding these non-cash and other specifically identified items that management believes are not relevant to management’s assessment of operating performance or the performance of an acquired business. A reconciliation of segment income to net income (loss) consists of the following (in millions):
|
2018
As Reported
|
2018
Amounts Under Previous Standards
|
2017
|
2016
|
||||||||||||
|
Segment income:
|
|||||||||||||||
|
TH
|
$
|
1,127
|
|
$
|
1,128
|
|
$
|
1,136
|
|
$
|
1,072
|
|
|||
|
BK
|
928
|
|
950
|
|
903
|
|
816
|
|
|||||||
|
PLK
|
157
|
|
169
|
|
107
|
|
—
|
|
|||||||
|
Adjusted EBITDA
|
2,212
|
|
2,247
|
|
2,146
|
|
1,888
|
|
|||||||
|
Share-based compensation and non-cash incentive compensation expense
|
55
|
|
55
|
|
55
|
|
42
|
|
|||||||
|
PLK Transaction costs
|
10
|
|
10
|
|
62
|
|
—
|
|
|||||||
|
Corporate restructuring and tax advisory fees
|
25
|
|
25
|
|
2
|
|
—
|
|
|||||||
|
Office centralization and relocation costs
|
20
|
|
20
|
|
—
|
|
—
|
|
|||||||
|
Integration costs
|
—
|
|
—
|
|
—
|
|
16
|
|
|||||||
|
Impact of equity method investments (a)
|
(3
|
)
|
(9
|
)
|
1
|
|
(8
|
)
|
|||||||
|
Other operating expenses (income), net
|
8
|
|
7
|
|
109
|
|
(1
|
)
|
|||||||
|
EBITDA
|
2,097
|
|
2,139
|
|
1,917
|
|
1,839
|
|
|||||||
|
Depreciation and amortization
|
180
|
|
180
|
|
182
|
|
172
|
|
|||||||
|
Income from operations
|
1,917
|
|
1,959
|
|
1,735
|
|
1,667
|
|
|||||||
|
Interest expense, net
|
535
|
|
536
|
|
512
|
|
467
|
|
|||||||
|
Loss on early extinguishment of debt
|
—
|
|
—
|
|
122
|
|
—
|
|
|||||||
|
Income tax expense (benefit)
|
238
|
|
247
|
|
(134
|
)
|
244
|
|
|||||||
|
Net income (loss)
|
$
|
1,144
|
|
$
|
1,176
|
|
$
|
1,235
|
|
$
|
956
|
|
|||
|
(a)
|
Represents (i) (income) loss from equity method investments and (ii) cash distributions received from our equity method investments. Cash distributions received from our equity method investments are included in segment income.
|
98
Note 20. Quarterly Financial Data (Unaudited)
Our Financial Statements reflect the application of ASC 606 guidance beginning in 2018, while our consolidated financial statements for prior periods were prepared under the guidance of the Previous Standards. As such, 2018 results are not comparable to 2017 results.
Summarized unaudited quarterly financial data (in millions, except per share data) was as follows:
|
|
Quarters Ended
|
||||||||||||||||||||||||||||||
|
|
March 31,
|
June 30,
|
September 30,
|
December 31,
|
|||||||||||||||||||||||||||
|
|
2018
|
2017
|
2018
|
2017
|
2018
|
2017
|
2018
|
2017
|
|||||||||||||||||||||||
|
Total revenues
|
$
|
1,254
|
|
$
|
1,001
|
|
$
|
1,343
|
|
$
|
1,132
|
|
$
|
1,375
|
|
$
|
1,209
|
|
$
|
1,385
|
|
$
|
1,234
|
|
|||||||
|
Income from operations
|
$
|
421
|
|
$
|
336
|
|
$
|
503
|
|
$
|
415
|
|
$
|
477
|
|
$
|
479
|
|
$
|
516
|
|
$
|
505
|
|
|||||||
|
Net income
|
$
|
279
|
|
$
|
167
|
|
$
|
314
|
|
$
|
243
|
|
$
|
250
|
|
$
|
247
|
|
$
|
301
|
|
$
|
578
|
|
|||||||
|
Basic and diluted earnings per unit
|
|||||||||||||||||||||||||||||||
|
Class A common units
|
$
|
0.73
|
|
$
|
0.25
|
|
$
|
0.83
|
|
$
|
0.44
|
|
$
|
0.66
|
|
$
|
0.45
|
|
$
|
0.81
|
|
$
|
1.96
|
|
|||||||
|
Partnership exchangeable units
|
$
|
0.60
|
|
$
|
0.21
|
|
$
|
0.67
|
|
$
|
0.38
|
|
$
|
0.53
|
|
$
|
0.39
|
|
$
|
0.65
|
|
$
|
1.64
|
|
|||||||
Note 21. Supplemental Financial Information
On May 22, 2015, 1011778 B.C. Unlimited Liability Company (the “Parent Issuer”) and New Red Finance Inc. (the “Co-Issuer” and together with the Parent Issuer, the “Issuers”) entered into an amended credit agreement that provides for obligations under the Credit Facilities. On May 22, 2015 the Issuers entered into the 2015 Senior Notes Indenture with respect to the 2015 Senior Notes. On October 8, 2014 the Issuers entered into the 2014 Senior Notes Indenture with respect to the 2014 Senior Notes.
The agreement governing our Credit Facilities, the 2015 Senior Notes Indenture and the 2014 Senior Notes Indenture allow the financial reporting obligation of the Parent Issuer to be satisfied through the reporting of Partnership’s consolidated financial information, provided that the consolidated financial information of the Parent Issuer and its restricted subsidiaries is presented on a standalone basis.
The following represents the condensed consolidating financial information for the Parent Issuer and its restricted subsidiaries (“Consolidated Borrowers”) on a consolidated basis, together with eliminations, as of and for the periods indicated. The condensed consolidating financial information of Partnership is combined with the financial information of its wholly-owned subsidiaries that are also parent entities of the Parent Issuer and presented in a single column under the heading “RBILP”. The consolidating financial information may not necessarily be indicative of the financial position, results of operations or cash flows had the Issuers and Partnership operated as independent entities.
RESTAURANT BRANDS INTERNATIONAL LIMITED PARTNERSHIP AND SUBSIDIARIES
Condensed Consolidating Balance Sheets
(In millions)
As of
December 31, 2018
|
Consolidated
Borrowers |
RBILP
|
Eliminations
|
Consolidated
|
||||||||||||
|
ASSETS
|
|||||||||||||||
|
Current assets:
|
|||||||||||||||
|
Cash and cash equivalents
|
$
|
913
|
|
$
|
—
|
|
$
|
—
|
|
$
|
913
|
|
|||
|
Accounts and notes receivable, net
|
452
|
|
—
|
|
—
|
|
452
|
|
|||||||
|
Inventories, net
|
75
|
|
—
|
|
—
|
|
75
|
|
|||||||
|
Prepaids and other current assets
|
60
|
|
—
|
|
—
|
|
60
|
|
|||||||
|
Total current assets
|
1,500
|
|
—
|
|
—
|
|
1,500
|
|
|||||||
|
Property and equipment, net
|
1,996
|
|
—
|
|
—
|
|
1,996
|
|
|||||||
|
Intangible assets, net
|
10,463
|
|
—
|
|
—
|
|
10,463
|
|
|||||||
|
Goodwill
|
5,486
|
|
—
|
|
—
|
|
5,486
|
|
|||||||
|
Net investment in property leased to franchisees
|
54
|
|
—
|
|
—
|
|
54
|
|
|||||||
|
Intercompany receivable
|
—
|
|
207
|
|
(207
|
)
|
—
|
|
|||||||
|
Investment in subsidiaries
|
—
|
|
3,618
|
|
(3,618
|
)
|
—
|
|
|||||||
|
Other assets, net
|
642
|
|
—
|
|
—
|
|
642
|
|
|||||||
|
Total assets
|
$
|
20,141
|
|
$
|
3,825
|
|
$
|
(3,825
|
)
|
$
|
20,141
|
|
|||
|
LIABILITIES AND EQUITY
|
|||||||||||||||
|
Current liabilities:
|
|||||||||||||||
|
Accounts and drafts payable
|
$
|
513
|
|
$
|
—
|
|
$
|
—
|
|
$
|
513
|
|
|||
|
Other accrued liabilities
|
430
|
|
207
|
|
—
|
|
637
|
|
|||||||
|
Gift card liability
|
167
|
|
—
|
|
—
|
|
167
|
|
|||||||
|
Current portion of long term debt and capital leases
|
91
|
|
—
|
|
—
|
|
91
|
|
|||||||
|
Total current liabilities
|
1,201
|
|
207
|
|
—
|
|
1,408
|
|
|||||||
|
Term debt, net of current portion
|
11,823
|
|
—
|
|
—
|
|
11,823
|
|
|||||||
|
Capital leases, net of current portion
|
226
|
|
—
|
|
—
|
|
226
|
|
|||||||
|
Other liabilities, net
|
1,547
|
|
—
|
|
—
|
|
1,547
|
|
|||||||
|
Payables to affiliates
|
207
|
|
—
|
|
(207
|
)
|
—
|
|
|||||||
|
Deferred income taxes, net
|
1,519
|
|
—
|
|
—
|
|
1,519
|
|
|||||||
|
Total liabilities
|
16,523
|
|
207
|
|
(207
|
)
|
16,523
|
|
|||||||
|
Partners’ capital:
|
|||||||||||||||
|
Class A common units
|
—
|
|
4,323
|
|
—
|
|
4,323
|
|
|||||||
|
Partnership exchangeable units
|
—
|
|
730
|
|
—
|
|
730
|
|
|||||||
|
Common shares
|
3,071
|
|
—
|
|
(3,071
|
)
|
—
|
|
|||||||
|
Retained earnings
|
1,982
|
|
—
|
|
(1,982
|
)
|
—
|
|
|||||||
|
Accumulated other comprehensive income (loss)
|
(1,437
|
)
|
(1,437
|
)
|
1,437
|
|
(1,437
|
)
|
|||||||
|
Total Partners’ capital/shareholders’ equity
|
3,616
|
|
3,616
|
|
(3,616
|
)
|
3,616
|
|
|||||||
|
Noncontrolling interests
|
2
|
|
2
|
|
(2
|
)
|
2
|
|
|||||||
|
Total equity
|
3,618
|
|
3,618
|
|
(3,618
|
)
|
3,618
|
|
|||||||
|
Total liabilities and equity
|
$
|
20,141
|
|
$
|
3,825
|
|
$
|
(3,825
|
)
|
$
|
20,141
|
|
|||
100
RESTAURANT BRANDS INTERNATIONAL LIMITED PARTNERSHIP AND SUBSIDIARIES
Condensed Consolidating Balance Sheets
(In millions)
As of
December 31, 2017
|
Consolidated
Borrowers |
RBILP
|
Eliminations
|
Consolidated
|
||||||||||||
|
ASSETS
|
|||||||||||||||
|
Current assets:
|
|||||||||||||||
|
Cash and cash equivalents
|
$
|
1,097
|
|
$
|
—
|
|
$
|
—
|
|
$
|
1,097
|
|
|||
|
Accounts and notes receivable, net
|
489
|
|
—
|
|
—
|
|
489
|
|
|||||||
|
Inventories, net
|
78
|
|
—
|
|
—
|
|
78
|
|
|||||||
|
Prepaids and other current assets
|
86
|
|
—
|
|
—
|
|
86
|
|
|||||||
|
Total current assets
|
1,750
|
|
—
|
|
—
|
|
1,750
|
|
|||||||
|
Property and equipment, net
|
2,133
|
|
—
|
|
—
|
|
2,133
|
|
|||||||
|
Intangible assets, net
|
11,062
|
|
—
|
|
—
|
|
11,062
|
|
|||||||
|
Goodwill
|
5,782
|
|
—
|
|
—
|
|
5,782
|
|
|||||||
|
Net investment in property leased to franchisees
|
71
|
|
—
|
|
—
|
|
71
|
|
|||||||
|
Intercompany receivable
|
—
|
|
97
|
|
(97
|
)
|
—
|
|
|||||||
|
Investment in subsidiaries
|
—
|
|
4,561
|
|
(4,561
|
)
|
—
|
|
|||||||
|
Other assets, net
|
426
|
|
—
|
|
—
|
|
426
|
|
|||||||
|
Total assets
|
$
|
21,224
|
|
$
|
4,658
|
|
$
|
(4,658
|
)
|
$
|
21,224
|
|
|||
|
LIABILITIES AND EQUITY
|
|||||||||||||||
|
Current liabilities:
|
|||||||||||||||
|
Accounts and drafts payable
|
$
|
496
|
|
$
|
—
|
|
$
|
—
|
|
$
|
496
|
|
|||
|
Other accrued liabilities
|
769
|
|
97
|
|
—
|
|
866
|
|
|||||||
|
Gift card liability
|
215
|
|
—
|
|
—
|
|
215
|
|
|||||||
|
Current portion of long term debt and capital leases
|
78
|
|
—
|
|
—
|
|
78
|
|
|||||||
|
Total current liabilities
|
1,558
|
|
97
|
|
—
|
|
1,655
|
|
|||||||
|
Term debt, net of current portion
|
11,801
|
|
—
|
|
—
|
|
11,801
|
|
|||||||
|
Capital leases, net of current portion
|
244
|
|
—
|
|
—
|
|
244
|
|
|||||||
|
Other liabilities, net
|
1,455
|
|
—
|
|
—
|
|
1,455
|
|
|||||||
|
Payables to affiliates
|
97
|
|
—
|
|
(97
|
)
|
—
|
|
|||||||
|
Deferred income taxes, net
|
1,508
|
|
—
|
|
—
|
|
1,508
|
|
|||||||
|
Total liabilities
|
16,663
|
|
97
|
|
(97
|
)
|
16,663
|
|
|||||||
|
Partners’ capital:
|
|||||||||||||||
|
Class A common units
|
—
|
|
4,168
|
|
—
|
|
4,168
|
|
|||||||
|
Partnership exchangeable units
|
—
|
|
1,276
|
|
—
|
|
1,276
|
|
|||||||
|
Common shares
|
3,516
|
|
—
|
|
(3,516
|
)
|
—
|
|
|||||||
|
Retained earnings
|
1,928
|
|
—
|
|
(1,928
|
)
|
—
|
|
|||||||
|
Accumulated other comprehensive income (loss)
|
(884
|
)
|
(884
|
)
|
884
|
|
(884
|
)
|
|||||||
|
Total Partners’ capital/shareholders’ equity
|
4,560
|
|
4,560
|
|
(4,560
|
)
|
4,560
|
|
|||||||
|
Noncontrolling interests
|
1
|
|
1
|
|
(1
|
)
|
1
|
|
|||||||
|
Total equity
|
4,561
|
|
4,561
|
|
(4,561
|
)
|
4,561
|
|
|||||||
|
Total liabilities and equity
|
$
|
21,224
|
|
$
|
4,658
|
|
$
|
(4,658
|
)
|
$
|
21,224
|
|
|||
101
RESTAURANT BRANDS INTERNATIONAL LIMITED PARTNERSHIP AND SUBSIDIARIES
Condensed Consolidating Statements of Operations
(In millions)
2018
|
Consolidated
Borrowers |
RBILP
|
Eliminations
|
Consolidated
|
||||||||||||
|
Revenues:
|
|||||||||||||||
|
Sales
|
$
|
2,355
|
|
$
|
—
|
|
$
|
—
|
|
$
|
2,355
|
|
|||
|
Franchise and property revenues
|
3,002
|
|
—
|
|
—
|
|
3,002
|
|
|||||||
|
Total revenues
|
5,357
|
|
—
|
|
—
|
|
5,357
|
|
|||||||
|
Operating costs and expenses:
|
|||||||||||||||
|
Cost of sales
|
1,818
|
|
—
|
|
—
|
|
1,818
|
|
|||||||
|
Franchise and property expenses
|
422
|
|
—
|
|
—
|
|
422
|
|
|||||||
|
Selling, general and administrative expenses
|
1,214
|
|
—
|
|
—
|
|
1,214
|
|
|||||||
|
(Income) loss from equity method investments
|
(22
|
)
|
—
|
|
—
|
|
(22
|
)
|
|||||||
|
Other operating expenses (income), net
|
8
|
|
—
|
|
—
|
|
8
|
|
|||||||
|
Total operating costs and expenses
|
3,440
|
|
—
|
|
—
|
|
3,440
|
|
|||||||
|
Income from operations
|
1,917
|
|
—
|
|
—
|
|
1,917
|
|
|||||||
|
Interest expense, net
|
535
|
|
—
|
|
—
|
|
535
|
|
|||||||
|
Income before income taxes
|
1,382
|
|
—
|
|
—
|
|
1,382
|
|
|||||||
|
Income tax (benefit) expense
|
238
|
|
—
|
|
—
|
|
238
|
|
|||||||
|
Net income
|
1,144
|
|
—
|
|
—
|
|
1,144
|
|
|||||||
|
Equity in earnings of consolidated subsidiaries
|
—
|
|
1,144
|
|
(1,144
|
)
|
—
|
|
|||||||
|
Net income (loss)
|
1,144
|
|
1,144
|
|
(1,144
|
)
|
1,144
|
|
|||||||
|
Net income (loss) attributable to noncontrolling interests
|
1
|
|
1
|
|
(1
|
)
|
1
|
|
|||||||
|
Net income (loss) attributable to common unitholders / shareholders
|
$
|
1,143
|
|
$
|
1,143
|
|
$
|
(1,143
|
)
|
$
|
1,143
|
|
|||
|
Total comprehensive income (loss)
|
$
|
591
|
|
$
|
591
|
|
$
|
(591
|
)
|
$
|
591
|
|
|||
102
RESTAURANT BRANDS INTERNATIONAL LIMITED PARTNERSHIP AND SUBSIDIARIES
Condensed Consolidating Statements of Operations
(In millions)
2017
|
Consolidated
Borrowers |
RBILP
|
Eliminations
|
Consolidated
|
||||||||||||
|
Revenues:
|
|||||||||||||||
|
Sales
|
$
|
2,390
|
|
$
|
—
|
|
$
|
—
|
|
$
|
2,390
|
|
|||
|
Franchise and property revenues
|
2,186
|
|
—
|
|
—
|
|
2,186
|
|
|||||||
|
Total revenues
|
4,576
|
|
—
|
|
—
|
|
4,576
|
|
|||||||
|
Operating costs and expenses:
|
|||||||||||||||
|
Cost of sales
|
1,850
|
|
—
|
|
—
|
|
1,850
|
|
|||||||
|
Franchise and property expenses
|
478
|
|
—
|
|
—
|
|
478
|
|
|||||||
|
Selling, general and administrative expenses
|
416
|
|
—
|
|
—
|
|
416
|
|
|||||||
|
(Income) loss from equity method investments
|
(12
|
)
|
—
|
|
—
|
|
(12
|
)
|
|||||||
|
Other operating expenses (income), net
|
109
|
|
—
|
|
—
|
|
109
|
|
|||||||
|
Total operating costs and expenses
|
2,841
|
|
—
|
|
—
|
|
2,841
|
|
|||||||
|
Income from operations
|
1,735
|
|
—
|
|
—
|
|
1,735
|
|
|||||||
|
Interest expense, net
|
512
|
|
—
|
|
—
|
|
512
|
|
|||||||
|
Loss on early extinguishment of debt
|
122
|
|
—
|
|
—
|
|
122
|
|
|||||||
|
Income before income taxes
|
1,101
|
|
—
|
|
—
|
|
1,101
|
|
|||||||
|
Income tax expense
|
(134
|
)
|
—
|
|
—
|
|
(134
|
)
|
|||||||
|
Net income
|
1,235
|
|
—
|
|
—
|
|
1,235
|
|
|||||||
|
Equity in earnings of consolidated subsidiaries
|
—
|
|
1,235
|
|
(1,235
|
)
|
—
|
|
|||||||
|
Net income (loss)
|
1,235
|
|
1,235
|
|
(1,235
|
)
|
1,235
|
|
|||||||
|
Net income (loss) attributable to noncontrolling interests
|
2
|
|
2
|
|
(2
|
)
|
2
|
|
|||||||
|
Partnership preferred unit distributions
|
—
|
|
256
|
|
—
|
|
256
|
|
|||||||
|
Gain on redemption of Partnership preferred units
|
—
|
|
(234
|
)
|
—
|
|
(234
|
)
|
|||||||
|
Net income (loss) attributable to common unitholders / shareholders
|
$
|
1,233
|
|
$
|
1,211
|
|
$
|
(1,233
|
)
|
$
|
1,211
|
|
|||
|
Total comprehensive income (loss)
|
$
|
1,706
|
|
$
|
1,706
|
|
$
|
(1,706
|
)
|
$
|
1,706
|
|
|||
103
RESTAURANT BRANDS INTERNATIONAL LIMITED PARTNERSHIP AND SUBSIDIARIES
Condensed Consolidating Statements of Operations
(In millions)
2016
|
Consolidated
Borrowers |
RBILP
|
Eliminations
|
Consolidated
|
||||||||||||
|
Revenues:
|
|||||||||||||||
|
Sales
|
$
|
2,205
|
|
$
|
—
|
|
$
|
—
|
|
$
|
2,205
|
|
|||
|
Franchise and property revenues
|
1,941
|
|
—
|
|
—
|
|
1,941
|
|
|||||||
|
Total revenues
|
4,146
|
|
—
|
|
—
|
|
4,146
|
|
|||||||
|
Operating costs and expenses:
|
|||||||||||||||
|
Cost of sales
|
1,727
|
|
—
|
|
—
|
|
1,727
|
|
|||||||
|
Franchise and property expenses
|
454
|
|
—
|
|
—
|
|
454
|
|
|||||||
|
Selling, general and administrative expenses
|
319
|
|
—
|
|
—
|
|
319
|
|
|||||||
|
(Income) loss from equity method investments
|
(20
|
)
|
—
|
|
—
|
|
(20
|
)
|
|||||||
|
Other operating expenses (income), net
|
(1
|
)
|
—
|
|
—
|
|
(1
|
)
|
|||||||
|
Total operating costs and expenses
|
2,479
|
|
—
|
|
—
|
|
2,479
|
|
|||||||
|
Income from operations
|
1,667
|
|
—
|
|
—
|
|
1,667
|
|
|||||||
|
Interest expense, net
|
467
|
|
—
|
|
—
|
|
467
|
|
|||||||
|
Income before income taxes
|
1,200
|
|
—
|
|
—
|
|
1,200
|
|
|||||||
|
Income tax expense
|
244
|
|
—
|
|
—
|
|
244
|
|
|||||||
|
Net income
|
956
|
|
—
|
|
—
|
|
956
|
|
|||||||
|
Equity in earnings of consolidated subsidiaries
|
—
|
|
956
|
|
(956
|
)
|
—
|
|
|||||||
|
Net income (loss)
|
956
|
|
956
|
|
(956
|
)
|
956
|
|
|||||||
|
Net income (loss) attributable to noncontrolling interests
|
3
|
|
3
|
|
(3
|
)
|
3
|
|
|||||||
|
Partnership preferred unit distributions
|
—
|
|
270
|
|
—
|
|
270
|
|
|||||||
|
Net income (loss) attributable to common unitholders / shareholders
|
$
|
953
|
|
$
|
683
|
|
$
|
(953
|
)
|
$
|
683
|
|
|||
|
Total comprehensive income (loss)
|
$
|
1,068
|
|
$
|
1,068
|
|
$
|
(1,068
|
)
|
$
|
1,068
|
|
|||
104
RESTAURANT BRANDS INTERNATIONAL LIMITED PARTNERSHIP AND SUBSIDIARIES
Condensed Consolidating Statements of Cash Flows
(In millions)
2018
|
|
Consolidated
Borrowers
|
RBILP
|
Eliminations
|
Consolidated
|
|||||||||||
|
Cash flows from operating activities:
|
|||||||||||||||
|
Net income
|
$
|
1,144
|
|
$
|
1,144
|
|
$
|
(1,144
|
)
|
$
|
1,144
|
|
|||
|
Adjustments to reconcile net income to net cash provided by operating activities:
|
|||||||||||||||
|
Equity in loss (earnings) of consolidated subsidiaries
|
—
|
|
(1,144
|
)
|
1,144
|
|
—
|
|
|||||||
|
Depreciation and amortization
|
180
|
|
—
|
|
—
|
|
180
|
|
|||||||
|
Amortization of deferred financing costs and debt issuance discount
|
29
|
|
—
|
|
—
|
|
29
|
|
|||||||
|
(Income) loss from equity method investments
|
(22
|
)
|
—
|
|
—
|
|
(22
|
)
|
|||||||
|
Loss (gain) on remeasurement of foreign denominated transactions
|
(33
|
)
|
—
|
|
—
|
|
(33
|
)
|
|||||||
|
Net (gains) losses on derivatives
|
(40
|
)
|
—
|
|
—
|
|
(40
|
)
|
|||||||
|
Share-based compensation expense
|
48
|
|
—
|
|
—
|
|
48
|
|
|||||||
|
Deferred income taxes
|
29
|
|
—
|
|
—
|
|
29
|
|
|||||||
|
Other
|
5
|
|
—
|
|
—
|
|
5
|
|
|||||||
|
Changes in current assets and liabilities, excluding acquisitions and dispositions:
|
|||||||||||||||
|
Accounts and notes receivable
|
19
|
|
—
|
|
—
|
|
19
|
|
|||||||
|
Inventories and prepaids and other current assets
|
(7
|
)
|
—
|
|
—
|
|
(7
|
)
|
|||||||
|
Accounts and drafts payable
|
41
|
|
—
|
|
—
|
|
41
|
|
|||||||
|
Other accrued liabilities and gift card liability
|
(219
|
)
|
—
|
|
—
|
|
(219
|
)
|
|||||||
|
Tenant inducements paid to franchisees
|
(52
|
)
|
—
|
|
—
|
|
(52
|
)
|
|||||||
|
Other long-term assets and liabilities
|
43
|
|
—
|
|
—
|
|
43
|
|
|||||||
|
Net cash provided by operating activities
|
1,165
|
|
—
|
|
—
|
|
1,165
|
|
|||||||
|
Cash flows from investing activities:
|
|||||||||||||||
|
Payments for property and equipment
|
(86
|
)
|
—
|
|
—
|
|
(86
|
)
|
|||||||
|
Proceeds from disposal of assets, restaurant closures and refranchisings
|
8
|
|
—
|
|
—
|
|
8
|
|
|||||||
|
Return of investment on direct financing leases
|
16
|
|
—
|
|
—
|
|
16
|
|
|||||||
|
Settlement/sale of derivatives, net
|
17
|
|
—
|
|
—
|
|
17
|
|
|||||||
|
Other investing activities, net
|
1
|
|
—
|
|
—
|
|
1
|
|
|||||||
|
Net cash provided by (used for) investing activities
|
(44
|
)
|
—
|
|
—
|
|
(44
|
)
|
|||||||
|
Cash flows from financing activities:
|
|||||||||||||||
|
Proceeds from issuance of long-term debt
|
75
|
|
—
|
|
—
|
|
75
|
|
|||||||
|
Repayments of long-term debt and capital leases
|
(74
|
)
|
—
|
|
—
|
|
(74
|
)
|
|||||||
|
Distributions to RBI for payments in connection with redemption of Preferred Shares
|
—
|
|
(60
|
)
|
—
|
|
(60
|
)
|
|||||||
|
Payment of financing costs
|
(3
|
)
|
—
|
|
—
|
|
(3
|
)
|
|||||||
|
Distributions paid on common, preferred and Partnership exchangeable units
|
—
|
|
(728
|
)
|
—
|
|
(728
|
)
|
|||||||
|
Repurchase of Partnership exchangeable units
|
—
|
|
(561
|
)
|
—
|
|
(561
|
)
|
|||||||
|
Capital contribution from RBI Inc.
|
61
|
|
—
|
|
—
|
|
61
|
|
|||||||
|
Distributions from subsidiaries
|
(1,349
|
)
|
1,349
|
|
—
|
|
—
|
|
|||||||
|
Other financing activities, net
|
5
|
|
—
|
|
—
|
|
5
|
|
|||||||
|
Net cash provided by (used for) financing activities
|
(1,285
|
)
|
—
|
|
—
|
|
(1,285
|
)
|
|||||||
|
Effect of exchange rates on cash and cash equivalents
|
(20
|
)
|
—
|
|
—
|
|
(20
|
)
|
|||||||
|
Increase (decrease) in cash and cash equivalents
|
(184
|
)
|
—
|
|
—
|
|
(184
|
)
|
|||||||
|
Cash and cash equivalents at beginning of period
|
1,097
|
|
—
|
|
—
|
|
1,097
|
|
|||||||
|
Cash and cash equivalents at end of period
|
$
|
913
|
|
$
|
—
|
|
$
|
—
|
|
$
|
913
|
|
|||
105
RESTAURANT BRANDS INTERNATIONAL LIMITED PARTNERSHIP AND SUBSIDIARIES
Condensed Consolidating Statements of Cash Flows
(In millions)
2017
|
Consolidated
Borrowers
|
RBILP
|
Eliminations
|
Consolidated
|
||||||||||||
|
Cash flows from operating activities:
|
|||||||||||||||
|
Net income
|
$
|
1,235
|
|
$
|
1,235
|
|
$
|
(1,235
|
)
|
$
|
1,235
|
|
|||
|
Adjustments to reconcile net income to net cash provided by operating activities:
|
|||||||||||||||
|
Equity in loss (earnings) of consolidated subsidiaries
|
—
|
|
(1,235
|
)
|
1,235
|
|
—
|
|
|||||||
|
Depreciation and amortization
|
182
|
|
—
|
|
—
|
|
182
|
|
|||||||
|
Premiums paid and non-cash loss on early extinguishment of debt
|
119
|
|
—
|
|
—
|
|
119
|
|
|||||||
|
Amortization of deferred financing costs and debt issuance discount
|
33
|
|
—
|
|
—
|
|
33
|
|
|||||||
|
(Income) loss from equity method investments
|
(12
|
)
|
—
|
|
—
|
|
(12
|
)
|
|||||||
|
Loss (gain) on remeasurement of foreign denominated transactions
|
77
|
|
—
|
|
—
|
|
77
|
|
|||||||
|
Net losses on derivatives
|
31
|
|
—
|
|
—
|
|
31
|
|
|||||||
|
Share-based compensation expense
|
48
|
|
—
|
|
—
|
|
48
|
|
|||||||
|
Deferred income taxes
|
(742
|
)
|
—
|
|
—
|
|
(742
|
)
|
|||||||
|
Other
|
18
|
|
—
|
|
—
|
|
18
|
|
|||||||
|
Changes in current assets and liabilities, excluding acquisitions and dispositions:
|
|||||||||||||||
|
Accounts and notes receivable
|
(30
|
)
|
—
|
|
—
|
|
(30
|
)
|
|||||||
|
Inventories and prepaids and other current assets
|
19
|
|
—
|
|
—
|
|
19
|
|
|||||||
|
Accounts and drafts payable
|
14
|
|
—
|
|
—
|
|
14
|
|
|||||||
|
Other accrued liabilities and gift card liability
|
360
|
|
—
|
|
—
|
|
360
|
|
|||||||
|
Tenant inducements paid to franchisees
|
(20
|
)
|
—
|
|
—
|
|
(20
|
)
|
|||||||
|
Other long-term assets and liabilities
|
99
|
|
—
|
|
—
|
|
99
|
|
|||||||
|
Net cash provided by operating activities
|
1,431
|
|
—
|
|
—
|
|
1,431
|
|
|||||||
|
Cash flows from investing activities:
|
|||||||||||||||
|
Payments for property and equipment
|
(37
|
)
|
—
|
|
—
|
|
(37
|
)
|
|||||||
|
Proceeds from disposal of assets, restaurant closures and refranchisings
|
26
|
|
—
|
|
—
|
|
26
|
|
|||||||
|
Net payment for purchase of Popeyes, net of cash acquired
|
(1,636
|
)
|
—
|
|
—
|
|
(1,636
|
)
|
|||||||
|
Return of investment on direct financing leases
|
16
|
|
—
|
|
—
|
|
16
|
|
|||||||
|
Settlement/sale of derivatives, net
|
772
|
|
—
|
|
—
|
|
772
|
|
|||||||
|
Other investing activities, net
|
1
|
|
—
|
|
—
|
|
1
|
|
|||||||
|
Net cash provided by (used for) investing activities
|
(858
|
)
|
—
|
|
—
|
|
(858
|
)
|
|||||||
|
Cash flows from financing activities:
|
|||||||||||||||
|
Proceeds from issuance of long-term debt
|
5,850
|
|
—
|
|
—
|
|
5,850
|
|
|||||||
|
Repayments of long-term debt and capital leases
|
(2,742
|
)
|
—
|
|
—
|
|
(2,742
|
)
|
|||||||
|
Distributions to RBI for payments in connection with redemption of Preferred Shares
|
—
|
|
(3,006
|
)
|
—
|
|
(3,006
|
)
|
|||||||
|
Payment of financing costs
|
(63
|
)
|
—
|
|
—
|
|
(63
|
)
|
|||||||
|
Distributions paid on common, preferred and Partnership exchangeable units
|
—
|
|
(664
|
)
|
—
|
|
(664
|
)
|
|||||||
|
Repurchase of Partnership exchangeable units
|
—
|
|
(330
|
)
|
—
|
|
(330
|
)
|
|||||||
|
Capital contribution from RBI Inc.
|
29
|
|
—
|
|
—
|
|
29
|
|
|||||||
|
Distributions from subsidiaries
|
(4,000
|
)
|
4,000
|
|
—
|
|
—
|
|
|||||||
|
Other financing activities, net
|
(10
|
)
|
—
|
|
—
|
|
(10
|
)
|
|||||||
|
Net cash provided by (used for) financing activities
|
(936
|
)
|
—
|
|
—
|
|
(936
|
)
|
|||||||
|
Effect of exchange rates on cash and cash equivalents
|
24
|
|
—
|
|
—
|
|
24
|
|
|||||||
|
Increase (decrease) in cash and cash equivalents
|
(339
|
)
|
—
|
|
—
|
|
(339
|
)
|
|||||||
|
Cash and cash equivalents at beginning of period
|
1,436
|
|
—
|
|
—
|
|
1,436
|
|
|||||||
|
Cash and cash equivalents at end of period
|
$
|
1,097
|
|
$
|
—
|
|
$
|
—
|
|
$
|
1,097
|
|
|||
106
RESTAURANT BRANDS INTERNATIONAL LIMITED PARTNERSHIP AND SUBSIDIARIES
Condensed Consolidating Statements of Cash Flows
(In millions)
2016
|
|
Consolidated
Borrowers
|
RBILP
|
Eliminations
|
Consolidated
|
|||||||||||
|
Cash flows from operating activities:
|
|||||||||||||||
|
Net income
|
$
|
956
|
|
$
|
956
|
|
$
|
(956
|
)
|
$
|
956
|
|
|||
|
Adjustments to reconcile net income to net cash provided by operating activities:
|
|||||||||||||||
|
Equity in loss (earnings) of consolidated subsidiaries
|
—
|
|
(956
|
)
|
956
|
|
—
|
|
|||||||
|
Depreciation and amortization
|
172
|
|
—
|
|
—
|
|
172
|
|
|||||||
|
Amortization of deferred financing costs and debt issuance discount
|
39
|
|
—
|
|
—
|
|
39
|
|
|||||||
|
(Income) loss from equity method investments
|
(20
|
)
|
—
|
|
—
|
|
(20
|
)
|
|||||||
|
Loss (gain) on remeasurement of foreign denominated transactions
|
(20
|
)
|
—
|
|
—
|
|
(20
|
)
|
|||||||
|
Net losses on derivatives
|
21
|
|
—
|
|
—
|
|
21
|
|
|||||||
|
Share-based compensation expense
|
35
|
|
—
|
|
—
|
|
35
|
|
|||||||
|
Deferred income taxes
|
80
|
|
—
|
|
—
|
|
80
|
|
|||||||
|
Other
|
4
|
|
—
|
|
—
|
|
4
|
|
|||||||
|
Changes in current assets and liabilities, excluding acquisitions and dispositions:
|
|||||||||||||||
|
Accounts and notes receivable
|
(16
|
)
|
—
|
|
—
|
|
(16
|
)
|
|||||||
|
Inventories and prepaids and other current assets
|
(10
|
)
|
—
|
|
—
|
|
(10
|
)
|
|||||||
|
Accounts and drafts payable
|
16
|
|
—
|
|
—
|
|
16
|
|
|||||||
|
Other accrued liabilities and gift card liability
|
(1
|
)
|
—
|
|
—
|
|
(1
|
)
|
|||||||
|
Tenant inducements paid to franchisees
|
(19
|
)
|
—
|
|
—
|
|
(19
|
)
|
|||||||
|
Other long-term assets and liabilities
|
(23
|
)
|
—
|
|
—
|
|
(23
|
)
|
|||||||
|
Net cash provided by operating activities
|
1,214
|
|
—
|
|
—
|
|
1,214
|
|
|||||||
|
Cash flows from investing activities:
|
|||||||||||||||
|
Payments for property and equipment
|
(34
|
)
|
—
|
|
—
|
|
(34
|
)
|
|||||||
|
Proceeds from disposal of assets, restaurant closures and refranchisings
|
30
|
|
—
|
|
—
|
|
30
|
|
|||||||
|
Return of investment on direct financing leases
|
17
|
|
—
|
|
—
|
|
17
|
|
|||||||
|
Settlement/sale of derivatives, net
|
11
|
|
—
|
|
—
|
|
11
|
|
|||||||
|
Other investing activities, net
|
3
|
|
—
|
|
—
|
|
3
|
|
|||||||
|
Net cash provided by (used for) investing activities
|
27
|
|
—
|
|
—
|
|
27
|
|
|||||||
|
Cash flows from financing activities:
|
|||||||||||||||
|
Repayments of long-term debt and capital leases
|
(70
|
)
|
—
|
|
—
|
|
(70
|
)
|
|||||||
|
Distributions paid on common, preferred and Partnership exchangeable units
|
—
|
|
(538
|
)
|
—
|
|
(538
|
)
|
|||||||
|
Capital contribution from RBI Inc.
|
14
|
|
—
|
|
—
|
|
14
|
|
|||||||
|
Excess tax benefits from share-based compensation
|
8
|
|
—
|
|
—
|
|
8
|
|
|||||||
|
Distributions from subsidiaries
|
(538
|
)
|
538
|
|
—
|
|
—
|
|
|||||||
|
Other financing activities, net
|
(5
|
)
|
—
|
|
—
|
|
(5
|
)
|
|||||||
|
Net cash provided by (used for) financing activities
|
(591
|
)
|
—
|
|
—
|
|
(591
|
)
|
|||||||
|
Effect of exchange rates on cash and cash equivalents
|
(2
|
)
|
—
|
|
—
|
|
(2
|
)
|
|||||||
|
Increase (decrease) in cash and cash equivalents
|
648
|
|
—
|
|
—
|
|
648
|
|
|||||||
|
Cash and cash equivalents at beginning of period
|
788
|
|
—
|
|
—
|
|
788
|
|
|||||||
|
Cash and cash equivalents at end of period
|
$
|
1,436
|
|
$
|
—
|
|
$
|
—
|
|
$
|
1,436
|
|
|||
107
Note 22. Subsequent Events
Dividends
On
January 4, 2019
, RBI paid a cash dividend of
$0.45
per RBI common share to common shareholders of record on
December 15, 2018
. Partnership made a distribution to RBI as holder of Class A common units in the amount of the aggregate dividends declared and paid by RBI on RBI common shares and also made a distribution in respect of each Partnership exchangeable unit in the amount of
$0.45
per exchangeable unit to holders of record on
December 15, 2018
.
On
January 22, 2019
, the RBI board of directors declared a cash dividend of
$0.50
per RBI common share for the first quarter of 2019. The dividend will be paid on
April 3, 2019
to RBI common shareholders of record on
March 15, 2019
. Partnership will make a distribution to RBI as holder of Class A common units in the amount of the aggregate dividends declared and paid by RBI on RBI common shares. Partnership will also make a distribution in respect of each Partnership exchangeable unit in the amount of
$0.50
per Partnership exchangeable unit, and the record date and payment date for such distribution will be the same as the record date and payment date for the cash dividend per RBI common share set forth above.
*****
108
Item 9.
Changes in and Disagreements with Accountants on Accounting and
Financial Disclosure
None.
Item 9A.
Controls and Procedures
Evaluation of Disclosure Controls and Procedures
An evaluation was conducted under the supervision and with the participation of the management of RBI, as the general partner of Partnership, including the Chief Executive Officer (CEO) and Chief Financial Officer (CFO) of RBI, of the effectiveness of the design and operation of Partnership’s disclosure controls and procedures (as defined in Rule 13a-15e under the Exchange Act) as of
December 31, 2018
. Based on that evaluation, the CEO and CFO of RBI concluded that Partnership’s disclosure controls and procedures were effective as of such date.
Internal Control over Financial Reporting
RBI’s management, including the CEO and CFO, confirm that there were no changes in Partnership’s internal control over financial reporting during the fourth quarter of
2018
that have materially affected, or are reasonably likely to materially affect, Partnership’s internal control over financial reporting.
Management’s Report on Internal Control over Financial Reporting
Management’s Report on Internal Control Over Financial Reporting and the report of Independent Registered Public Accounting Firm are set forth in Part II, Item 8 of this Form 10-K.
Part III
Item 10.
Directors, Executive Officers and Corporate Governance
The information required by this Item, other than the information regarding the executive officers of RBI, as general partner of Partnership, set forth below required by Item 401 of Regulation S-K, is incorporated herein by reference from RBI’s definitive proxy statement to be filed no later than 120 days after
December 31, 2018
. We refer to this proxy statement as the RBI Definitive Proxy Statement.
Executive Officers of the Registrant
Set forth below is certain information about RBI’s executive officers. Ages are as of the date hereof.
|
Name
|
Age
|
Position
|
||
|
Daniel S. Schwartz
|
38
|
Executive Chairman
|
||
|
José E. Cil
|
49
|
Chief Executive Officer
|
||
|
Matthew Dunnigan
|
35
|
Chief Financial Officer
|
||
|
Joshua Kobza
|
32
|
Chief Operating Officer
|
||
|
Alexandre Macedo
|
41
|
President, Tim Hortons
|
||
|
Alexandre Santoro
|
47
|
President, Popeyes
|
||
|
Jacqueline Friesner
|
46
|
Controller and Chief Accounting Officer
|
||
|
Jill Granat
|
53
|
General Counsel and Corporate Secretary
|
||
José Cil.
Mr. Cil was appointed Chief Executive Officer of RBI in January 2019, and previously served as President, Burger King since December 2014. Mr. Cil served as Executive Vice President and President of Europe, the Middle East and Africa for Burger King Worldwide and its predecessor from November 2010 until December 2014. Prior to this role, Mr. Cil was Vice President and Regional General Manager for Wal-Mart Stores, Inc. in Florida from February 2010 to November 2010. From September 2008 to January 2010, Mr. Cil served as Vice President of Company Operations of Burger King Corporation and from September 2005 to September 2008, he served as Division Vice President, Mediterranean and NW Europe Divisions, EMEA of a subsidiary of Burger King Corporation.
Daniel S. Schwartz.
Mr. Schwartz was appointed Executive Chairman of RBI in January 2019. Prior to that, Mr. Schwartz served as Chief Executive Officer of RBI from December 2014 to January 2019. Mr. Schwartz has also served as a director of RBI since December 2014 and was appointed as Co-Chairman of the Board of Directors in January 2019. From June 2013 until December 2014, Mr. Schwartz served as Chief Executive Officer, from April 2013 until June 2013, he served as Chief Operating Officer and
109
from January 2011 until April 2013, he served as Chief Financial Officer of Burger King Worldwide and its predecessor. Mr. Schwartz joined Burger King Worldwide in October 2010 as Executive Vice President, Deputy Chief Finance Officer and was appointed as Executive Vice President and Chief Financial Officer in December 2010, effective January 2011. Since January 2008, Mr. Schwartz has been a partner with 3G Capital, where he was responsible for managing 3G Capital’s private equity business until October 2010. Mr. Schwartz is a director of 3G Capital.
Joshua Kobza.
Mr. Kobza was appointed Chief Operating Officer of RBI in January 2019. Prior to that, Mr. Kobza served as Chief Technology Officer and Development Officer of RBI from January 2018 to January 2019, and as Chief Financial Officer of RBI from December 2014 to January 2018. From April 2013 to December 2014, Mr. Kobza served as Executive Vice President and Chief Financial Officer of Burger King Worldwide. Mr. Kobza joined Burger King Worldwide in June 2012 as Director, Investor Relations, and was promoted to Senior Vice President, Global Finance in December 2012. From January 2011 until June 2012, Mr. Kobza worked at SIP Capital, a Sao Paulo based private investment firm, where he evaluated investments across a number of industries and geographies. From July 2008 until December 2010, Mr. Kobza served as an analyst in the corporate private equity area of the Blackstone Group in New York City.
Matthew Dunnigan.
Mr. Dunnigan was appointed Chief Financial Officer in January 2018. From October 2014 until January 2018, Mr. Dunnigan held the position of Treasurer, where he took on increasing responsibilities and successfully led all of RBI's capital markets activities. Before he joined RBI, Mr. Dunnigan served as Vice President of Crescent Capital Group LP, from September 2013 through October 2014, where he evaluated investments across the credit markets. Prior to that, Mr. Dunnigan spent three years as a private equity investment professional for H.I.G. Capital.
Alexandre Macedo.
Mr. Macedo has served as President, Tim Hortons since December 2017. Previously, he served as President North America for Burger King from April 2013 until December 2017, where he led the turnaround of the Burger King business. Mr. Macedo joined Burger King Corporation in July 2011 as SVP, Marketing, North America and later was General Manager of the U.S. franchise business. Prior to joining Burger King, Mr. Macedo was founder and partner of True Marketing, a Brazilian based marketing consulting firm form from December 2008 to June 2011. He also worked at AmBev, a Brazilian brewing company from June 2003 through March 2007, where he served as head of the Brahma Beer business unit.
Alexandre Santoro.
Mr. Santoro was appointed President, Popeyes in March 2017. From April 2015 until March 2017, Mr. Santoro was responsible for Global Supply Chain, Quality Assurance and Global Operations. Mr. Santoro served in multiple strategic roles for America Latina Logistica from April 2002 through March 2015, including Chief Executive Officer of America Latina Logistica from June 2013 through March 2015.
Jacqueline Friesner.
Ms. Friesner was appointed Controller and Chief Accounting Officer of RBI in December 2014. Ms. Friesner served as Vice President, Controller and Chief Accounting Officer of Burger King Worldwide and its predecessor from March 2011 until December 2014. Prior thereto, Ms. Friesner served in positions of increasing responsibility with Burger King Corporation. Before joining Burger King Corporation in October 2002, she was an audit manager at Pricewaterhouse Coopers in Miami, Florida.
Jill Granat.
Ms. Granat was appointed General Counsel and Corporate Secretary in December 2014. Ms. Granat served as Senior Vice President, General Counsel and Secretary of Burger King Worldwide and its predecessor since February 2011. Prior to this time, Ms. Granat was Vice President and Assistant General Counsel of Burger King Corporation from July 2009 until March 2011. Ms. Granat joined Burger King Corporation in 1998 as a member of the legal department and served in positions of increasing responsibility with Burger King Corporation.
Item 11.
Executive Compensation
The information required by this item will be contained in the RBI Definitive Proxy Statement and is incorporated herein by reference.
Item 12.
Security Ownership of Certain Beneficial Owners and Management and Related Stockholder Matters
The information required by this item, other than the information regarding our equity plans set forth below required by Item 201(d) of Regulation S-K, will be contained in the RBI Definitive Proxy Statement and is incorporated herein by reference.
Securities Authorized for Issuance under Equity Compensation Plans
Information regarding equity awards outstanding under RBI's compensation plans as of
December 31, 2018
was as follows (amounts in thousands, except per share data):
110
|
(a)
|
(b)
|
(c)
|
|||||||
|
Plan Category
|
Number of
Securities to be Issued Upon Exercise of Outstanding Options, Warrants and Rights |
Weighted-Average
Exercise Price of Outstanding Options, Warrants and Rights |
Number of
Securities Remaining Available for Future Issuance under Equity Compensation Plans (Excluding Securities Reflected in Column (a)) |
||||||
|
Equity Compensation Plans Approved by Security Holders
|
13,603
|
|
$
|
36.41
|
|
16,946
|
|
||
|
Equity Compensation Plans Not Approved by Security Holders
|
—
|
|
—
|
|
—
|
|
|||
|
Total
|
13,603
|
|
$
|
36.41
|
|
16,946
|
|
||
Item 13.
Certain Relationships and Related Transactions, and Director Independence
The information required by this item will be contained in the RBI Definitive Proxy Statement and is incorporated herein by reference.
Item 14.
Principal Accountant Fees and Services
The information required by this item will be contained in the RBI Definitive Proxy Statement and is incorporated herein by reference.
111
Part IV
Item 15.
Exhibits and Financial Statement Schedules
|
(a)(1)
|
All Financial Statements
|
Consolidated financial statements filed as part of this report are listed under Part II, Item 8 of this Form 10-K.
|
(a)(2)
|
Financial Statement Schedules
|
No schedules are required because either the required information is not present or is not present in amounts sufficient to require submission of the schedule, or because the information required is included in the consolidated financial statements or the notes thereto.
|
(a)(3)
|
Exhibits
|
The following exhibits are filed as part of this report.
|
Exhibit
Number
|
|
Description
|
|
Incorporated by Reference
|
|
|
|
|||
|
|
|
|||
|
|
||||
|
|
|
|||
|
|
|
|||
|
|
|
|||
|
|
|
|||
112
|
|
||||
|
|
|
|||
|
|
||||
|
|
|
|||
|
|
||||
113
|
|
||||
|
|
|
|||
|
|
|
|||
|
|
|
|||
|
|
|
|||
114
115
116
|
|
||||
|
|
||||
|
|
|
|||
|
|
||||
|
|
||||
|
|
||||
|
Filed herewith.
|
||||
|
Filed herewith.
|
||||
|
Filed herewith.
|
||||
117
|
Furnished herewith.
|
||||
|
Furnished herewith.
|
||||
|
101.INS
|
XBRL Instance Document.
|
Filed herewith.
|
||
|
101.SCH
|
XBRL Taxonomy Extension Schema Document.
|
Filed herewith.
|
||
|
101.CAL
|
XBRL Taxonomy Extension Calculation Linkbase Document.
|
Filed herewith.
|
||
|
101.DEF
|
XBRL Taxonomy Extension Definition Linkbase Document.
|
Filed herewith.
|
||
|
101.LAB
|
XBRL Taxonomy Extension Label Linkbase Document.
|
Filed herewith.
|
||
|
101.PRE
|
XBRL Taxonomy Extension Presentation Linkbase Document.
|
Filed herewith.
|
||
|
* Management contract or compensatory plan or arrangement
|
|
Certain instruments relating to long-term borrowings, constituting less than 10 percent of the total assets of the Registrant and its subsidiaries on a consolidated basis, are not filed as exhibits herewith pursuant to Item 601(b)(4)(iii)(A) of Regulation S-K. The Registrant agrees to furnish copies of such instruments to the SEC upon request.
Item 16. Form 10-K Summary
None.
118
Signatures
Pursuant to the requirements of Section 13 or 15(d) of the Securities Exchange Act of 1934, the registrant has duly caused this report to be signed on its behalf by the undersigned, thereunto duly authorized.
|
Restaurant Brands International Limited Partnership
|
||
|
By:
|
|
Restaurant Brands International Inc., its general partner
|
|
By:
|
|
/s/ José E. Cil
|
|
Name:
|
|
José E. Cil
|
|
Title:
|
|
Chief Executive Officer
|
Date:
February 22, 2019
Pursuant to the requirements of the Securities Exchange Act of 1934, this report has been signed below by the following persons on behalf of the registrant and in the capacities and on the dates indicated.
|
Signature
|
|
Title
|
|
Date
|
|
/s/ José E. Cil
|
|
Chief Executive Officer of Restaurant Brands International Inc.
(principal executive officer)
|
|
February 22, 2019
|
|
José E. Cil
|
||||
|
/s/ Matthew Dunnigan
|
|
Chief Financial Officer of Restaurant Brands International Inc.
(principal financial officer)
|
|
February 22, 2019
|
|
Matthew Dunnigan
|
||||
|
/s/ Jacqueline Friesner
|
|
Controller and Chief Accounting Officer of Restaurant Brands International Inc.
(principal accounting officer)
|
|
February 22, 2019
|
|
Jacqueline Friesner
|
||||
|
/s/ Alexandre Behring
|
|
Co-Chairman of Restaurant Brands International Inc.
|
|
February 22, 2019
|
|
Alexandre Behring
|
||||
|
/s/ Daniel Schwartz
|
|
Co-Chairman of Restaurant Brands International Inc.
|
|
February 22, 2019
|
|
Daniel Schwartz
|
||||
|
/s/ Marc Caira
|
|
Vice Chairman of Restaurant Brands International Inc.
|
|
February 22, 2019
|
|
Marc Caira
|
||||
|
|
Director of Restaurant Brands International Inc.
|
|
February 22, 2019
|
|
|
Martin Franklin
|
||||
|
/s/ Paul J. Fribourg
|
|
Director of Restaurant Brands International Inc.
|
|
February 22, 2019
|
|
Paul J. Fribourg
|
||||
|
/s/ Neil Golden
|
|
Director of Restaurant Brands International Inc.
|
|
February 22, 2019
|
|
Neil Golden
|
||||
|
/s/ Ali Hedayat
|
|
Director of Restaurant Brands International Inc.
|
|
February 22, 2019
|
|
Ali Hedayat
|
||||
|
/s/ Golnar Khosrowshahi
|
|
Director of Restaurant Brands International Inc.
|
|
February 22, 2019
|
|
Golnar Khosrowshahi
|
||||
|
|
Director of Restaurant Brands International Inc.
|
|
February 22, 2019
|
|
|
Carlos Alberto Sicupira
|
||||
|
/s/ Joao M. Castro-Neves
|
|
Director of Restaurant Brands International Inc.
|
|
February 22, 2019
|
|
Joao M. Castro-Neves
|
||||
|
/s/ Roberto Thompson Motta
|
|
Director of Restaurant Brands International Inc.
|
|
February 22, 2019
|
|
Roberto Thompson Motta
|
||||
|
/s/ Alexandre Van Damme
|
|
Director of Restaurant Brands International Inc.
|
|
February 22, 2019
|
|
Alexandre Van Damme
|
||||
119
TABLE OF CONTENTS
Part IItem 1. BusinessItem 1A. Risk FactorsItem 1B. Unresolved Staff CommentsItem 2. PropertiesItem 3. Legal ProceedingsItem 4. Mine Safety DisclosuresPart IIItem 5. Market For Registrant S Common Equity, Related Stockholder Matters and Issuer Purchases Of Equity SecuritiesItem 6. Selected Financial DataItem 7. Management S Discussion and Analysis Of Financial Condition and Results Of OperationsItem 7A. Quantitative and Qualitative Disclosures About Market RiskItem 8. Financial Statements and Supplementary DataNote 1. Description Of Business and OrganizationNote 2. Significant Accounting PoliciesNote 3. Popeyes AcquisitionNote 4. Earnings Per UnitNote 5. Property and Equipment, NetNote 6. Intangible Assets, Net and GoodwillNote 7. Equity Method InvestmentsNote 8. Other Accrued Liabilities and Other LiabilitiesNote 9. Long-term DebtNote 10. LeasesNote 11. Income TaxesNote 12. Derivative InstrumentsNote 13. Partnership Preferred UnitsNote 14. EquityNote 15. Share-based CompensationNote 16. Revenue RecognitionNote 17. Other Operating Expenses (income), NetNote 18. Commitments and ContingenciesNote 19. Segment Reporting and Geographical InformationNote 20. Quarterly Financial Data (unaudited)Note 21. Supplemental Financial InformationNote 22. Subsequent EventsItem 9. Changes in and Disagreements with Accountants on Accounting and Financial DisclosureItem 9A. Controls and ProceduresPart IIIItem 10. Directors, Executive Officers and Corporate GovernanceItem 11. Executive CompensationItem 12. Security Ownership Of Certain Beneficial Owners and Management and Related Stockholder MattersItem 13. Certain Relationships and Related Transactions, and Director IndependenceItem 14. Principal Accountant Fees and ServicesPart IVItem 15. Exhibits and Financial Statement SchedulesItem 16. Form 10-k Summary