RAYONIER INC
10-Ks and 10-Qs
|
|
|
|
|
|
|
|
|
|
|
|
|
|
|
|
|
|
|
|
|
|
|
|
|
|
|
|
|
|
|
|
|
|
|
|
|
|
|
|
|
|
|
|
|
|
|
|
|
|
|
|
|
|
|
|
|
|
|
UNITED STATES SECURITIES AND EXCHANGE COMMISSION
Washington, D.C. 20549
FORM 10-K
(Mark One)
|
x
|
ANNUAL REPORT PURSUANT TO SECTION 13 OR 15(d) OF THE SECURITIES EXCHANGE ACT OF 1934
|
For the fiscal year ended
December 31, 2017
OR
|
o
|
TRANSITION REPORT PURSUANT TO SECTION 13 OR 15(d) OF THE SECURITIES EXCHANGE ACT OF 1934
|
|
|
For the transition period from to
|
Commission File Number 1-6780
Incorporated in the State of North Carolina
I.R.S. Employer Identification No. 13-2607329
1 RAYONIER WAY
YULEE, FL 32097
(Principal Executive Office)
Telephone Number: (904) 357-9100
Securities registered pursuant to Section 12(b) of the Exchange Act,
all of which are registered on the New York Stock Exchange:
Common Shares
Securities registered pursuant to Section 12(g) of the Act: None
Indicate by check mark if the registrant is a well-known seasoned issuer, as defined in Rule 405 of the Securities Act.
YES
x
NO
o
Indicate by check mark if the registrant is not required to file reports pursuant to Section 13 or Section 15(d) of the Exchange Act.
YES
o
NO
x
Indicate by check mark whether the registrant (1) has filed all reports required to be filed by Section 13 or 15(d) of the Securities Exchange Act of 1934 during the preceding 12 months (or for such shorter period that the registrant was required to file such reports), and (2) has been subject to such filing requirements for the past 90 days.
YES
x
NO
o
Indicate by check mark whether the registrant has submitted electronically and posted on its corporate Web site, if any, every Interactive Data File required to be submitted and posted pursuant to Rule 405 of Regulation S-T during the preceding 12 months (or for such shorter period that the registrant was required to submit and post such files).
YES
x
NO
o
Indicate by check mark if disclosure of delinquent filers pursuant to Item 405 of Regulation S-K is not contained herein, and will not be contained, to the best of registrant’s knowledge, in definitive proxy or information statements incorporated by reference in Part III of this Form 10-K or any amendment to this
Form 10-K.
x
Indicate by check mark whether the registrant is a large accelerated filer, an accelerated filer, a non-accelerated filer, or a smaller reporting company. See the definitions of “large accelerated filer,” “accelerated filer” and “smaller reporting company” in Rule 12b-2 of the Exchange Act.
|
Large accelerated filer
x
|
|
Accelerated filer
o
|
|
Non-accelerated filer
o
|
|
Smaller reporting company
o
|
Indicate by check mark whether the registrant is a shell company (as defined in Rule 12b-2 of the Exchange Act).
YES
o
NO
x
The aggregate market value of the Common Shares of the registrant held by non-affiliates at the close of business on June 30, 2017 was
$3,694,658,677
based on the closing sale price as reported on the New York Stock Exchange.
As of February 16, 2018, there were outstanding
129,084,186
Common Shares of the registrant.
Portions of the registrant’s definitive proxy statement to be filed with the Securities and Exchange Commission in connection with the 2018 annual meeting of the shareholders of the registrant scheduled to be held May 17, 2018, are incorporated by reference in Part III hereof.
TABLE OF CONTENTS
|
Item
|
|
Page
|
|
|
|
PART I
|
||
|
1.
|
|
||
|
1A.
|
|
||
|
1B.
|
|
||
|
2.
|
|
||
|
3.
|
|
||
|
4.
|
|||
|
|
PART II
|
||
|
5.
|
|
||
|
6.
|
|
||
|
7.
|
|
||
|
7A.
|
|
||
|
8.
|
|
||
|
9.
|
|
||
|
9A.
|
|
||
|
9B.
|
|
||
|
|
PART III
|
||
|
10.
|
|
||
|
11.
|
|
||
|
12.
|
|
||
|
13.
|
|
||
|
14.
|
|
||
|
|
PART IV
|
||
|
15.
|
|
||
|
16.
|
|||
i
When we refer to “we,” “us,” “our,” “the Company,” or “Rayonier,” we mean Rayonier Inc. and its consolidated subsidiaries. References herein to “Notes to Financial Statements” or “Note” refer to the Notes to the Consolidated Financial Statements of Rayonier Inc. included in
Item 8
of this Report.
NOTE ABOUT FORWARD-LOOKING STATEMENTS
Certain statements in this document regarding anticipated financial outcomes, including Rayonier’s earnings guidance, if any, business and market conditions, outlook, expected dividend rate, Rayonier’s business strategies, including expected harvest schedules, timberland acquisitions, sales of non-strategic timberlands, the anticipated benefits of Rayonier’s business strategies, and other similar statements relating to Rayonier’s future events, developments, or financial or operational performance or results, are “forward-looking statements” made pursuant to the safe harbor provisions of the Private Securities Litigation Reform Act of 1995 and other federal securities laws. These forward-looking statements are identified by the use of words such as “may,” “will,” “should,” “expect,” “estimate,” “believe,” “intend,” “project,” “anticipate” and other similar language. However, the absence of these or similar words or expressions does not mean that a statement is not forward-looking. While management believes that these forward-looking statements are reasonable when made, forward-looking statements are not guarantees of future performance or events and undue reliance should not be placed on these statements. The risk factors contained in
Item 1A — Risk Factors
in this Annual Report on Form 10-K and similar discussions included in other reports that we subsequently file with the SEC, among others, could cause actual results or events to differ materially from the Company’s historical experience and those expressed in forward-looking statements made in this document.
Forward-looking statements are only as of the date they are made, and the Company undertakes no duty to update its forward-looking statements except as required by law. You are advised, however, to review any subsequent disclosures the Company makes on related subjects in its subsequent reports filed with the SEC.
|
Item 1.
|
BUSINESS
|
GENERAL
We are a leading timberland real estate investment trust (“REIT”) with assets located in some of the most productive softwood timber growing regions in the U.S. and New Zealand. The focus of our business is to invest in timberlands and to actively manage them to provide current income and attractive long-term returns to our shareholders. As of
December 31, 2017
, we owned, leased or managed approximately
2.6 million
acres of timberlands located in the U.S. South (
1.82 million
acres), U.S. Pacific Northwest (
378,000
acres) and New Zealand (
410,000
gross acres, or 293,000 net plantable acres). In addition, we engage in the trading of logs from New Zealand and Australia to Pacific Rim markets, primarily to support our New Zealand export operations. We have an added focus to maximize the value of our land portfolio by pursuing higher and better use (“HBU”) land sales opportunities.
We originated as the Rainier Pulp & Paper Company founded in Shelton, Washington in 1926. On June 27, 2014, Rayonier completed the tax-free spin-off of its Performance Fibers manufacturing business from its timberland and real estate operations, thereby becoming a “pure-play” timberland REIT.
Under our REIT structure, we are generally not required to pay U.S. federal income taxes on our earnings from timber harvest operations and other REIT-qualifying activities contingent upon meeting applicable distribution, income, asset, shareholder and other tests. As of
December 31, 2017
and as of the date of the filing of this Annual Report on Form 10-K, we believe the Company is in compliance with all REIT tests.
Our U.S. timber operations are primarily conducted by our wholly-owned REIT subsidiaries. Our New Zealand timber operations are conducted by Matariki Forestry Group, a majority-owned joint venture subsidiary (“New Zealand JV”). Our non-REIT qualifying operations, which are subject to corporate-level tax, are held by various taxable REIT subsidiaries. These operations include our log trading business and certain real estate activities, such as the sale and entitlement of development HBU properties.
Our shares are publicly traded on the NYSE under the symbol RYN. We are a North Carolina corporation with executive offices located at 1 Rayonier Way, Yulee, Florida 32097. Our telephone number is (904) 357-9100.
1
For information on sales and operating income by reportable segment and geographic region, see
Item 7 — Management’s Discussion and Analysis of Financial Condition and Results of Operations
and
Note 4 — Segment and Geographical Information
.
OUR COMPETITIVE STRENGTHS
We believe that we distinguish ourselves from other timberland owners and managers through the following competitive strengths:
|
•
|
Leading Pure-Play Timberland REIT
.
We are differentiated from other publicly-traded timberland REITs in that we are invested exclusively in timberlands and real estate and do not own any pulp, paper or wood products manufacturing assets. We are the largest publicly-traded “pure-play” timberland REIT, which provides our investors with a focused, large-scale timberland investment alternative without taking on the risks and volatility inherent in direct ownership of forest products manufacturing assets.
|
|
•
|
Located in Premier Softwood Growing Regions with Access to Strong Markets
.
Our geographically diverse timberland holdings are strategically located in core softwood producing regions, including the U.S. South, U.S. Pacific Northwest and New Zealand. Our most significant timberland holdings are located in the U.S. South, in close proximity to a variety of established pulp, paper and wood products manufacturing facilities, which provide a steady source of competitive demand for both pulpwood and higher-value sawtimber products. Our Pacific Northwest and New Zealand timberlands benefit from strong domestic sawmilling markets and are located near ports to capitalize on export markets serving the Pacific Rim.
|
|
•
|
Sophisticated Log Marketing Capabilities Serving Various Pacific Rim Markets
.
We conduct a log trading operation based in New Zealand that serves timberland owners in New Zealand and Australia, providing access to key export markets in China, South Korea and India. This operation provides us with superior market intelligence and economies of scale, both of which add value to our New Zealand timber portfolio. It also provides additional market intelligence that helps our Southern and Pacific Northwest export log marketing and contributes to the Company’s earnings and cash flows, with minimal investment.
|
|
•
|
Attractive Land Portfolio with Higher and Better Use Potential
.
We own approximately 200,000 acres of timberlands located in the vicinity of Interstate 95 primarily north of Daytona Beach, FL and south of Savannah, GA, some of which have the potential to transition to higher and better uses over time as market conditions support increased demand. These properties provide us with select opportunities to add value to our portfolio through real estate development activities, which we believe will allow us to periodically sell parcels of such land at favorable valuations relative to timberland values through one of our taxable REIT subsidiaries.
|
|
•
|
Dedicated HBU Platform with Established Track Record.
We have a dedicated HBU platform led by an experienced team with an established track record of selling rural and development HBU properties across our U.S. South holdings at strong premiums to timberland values. We maintain a detailed land classification analysis of our portfolio, which allows us to identify the highest-value use of our lands and then capitalize on identified HBU opportunities through strategies uniquely tailored to maximize value, including selectively pursuing land-use entitlements and infrastructure improvements.
|
|
•
|
Advantageous Structure and Capitalization
.
Under our REIT structure, we are generally not required to pay federal income taxes on our earnings from timber harvest operations and other REIT-qualifying activities, which allows us to optimize the value of our portfolio in a tax efficient manner. We also maintain a strong credit profile and have an investment grade debt rating. As of
December 31, 2017
, our net debt to enterprise value was
18%
. We believe that our advantageous REIT structure and conservative capitalization provide us with a competitive cost of capital and significant financial flexibility to pursue growth initiatives.
|
2
OUR STRATEGY
Our business strategy consists of the following key elements:
|
•
|
Manage our Timberlands on a Sustainable Yield Basis for Long-term Results.
We generate recurring income and cash flow from the harvest and sale of timber and intend to actively manage our timberlands to maximize net present value over the long term by achieving an optimal balance among biological timber growth, generation of cash flow from harvesting activities, and responsible environmental stewardship. Our harvesting strategy is designed to produce a long-term, sustainable yield, although we may adjust harvest levels periodically in response to then-current market conditions.
|
|
•
|
Apply Advanced Silviculture to Increase the Productivity of our Timberlands.
We use our forestry expertise and disciplined financial approach to determine the appropriate silviculture programs and investments to maximize returns. This includes re-planting a significant portion of our harvested acres with improved seedlings we have developed through decades of research and cultivation. Over time, we expect these improved seedlings will result in higher volumes per acre and a higher value product mix.
|
|
•
|
Increase the Size and Quality of our Timberland Holdings through Acquisitions.
We intend to selectively pursue timberland acquisition opportunities that improve the average productivity of our timberland holdings and support cash flow generation from our annual harvesting activities. We expect there will be an ample supply of attractive timberlands available for sale as a result of anticipated sales from a number of Timberland Investment Management Organizations (“TIMOs”). Our acquisition strategy employs a disciplined approach with rigorous adherence to strategic and financial metrics. Generally, we expect to focus our acquisition efforts on the most commercially desirable timber-producing regions of the U.S. South, the U.S. Pacific Northwest and New Zealand, particularly on timberlands with a geographic distribution and age-class profile that are complementary to our existing timberland holdings. We acquired 90,000 acres of fee timberland in 2017, 111,000 acres in 2016, and 35,000 acres in 2015. Additionally, we acquired leases or forestry rights covering approximately 19,000 acres in 2017, 2,000 acres in 2016, and 2,000 acres in 2015.
|
|
•
|
Optimize our Portfolio Value.
We continuously assess potential alternative uses of our timberlands, as some of our properties may become more valuable for development, residential, recreation or other purposes. We intend to capitalize on such higher-valued uses by opportunistically monetizing HBU properties in our portfolio. While the majority of our HBU sales involve rural and recreational land, we also selectively pursue various land-use entitlements on certain properties for residential, commercial and industrial development in order to fully realize the enhanced long-term value potential of such properties. For selected development properties, we also invest in infrastructure improvements, such as roadways and utilities, to accelerate the marketability and improve the value of such properties. We generally expect that sales of HBU property will comprise approximately 1% to 1.5% of our Southern timberland holdings on an annual basis.
|
|
•
|
Focus on Timberland Operations to Support Cash Flow Generation.
As described above, we rely primarily on annual harvesting activities and ongoing sales of HBU properties to generate cash flow from our timberland holdings. However, we also periodically generate income and cash flow from the sale of non-strategic and/or non-HBU timberlands, in particular as we seek to optimize our portfolio by disposing of less desirable properties or to fund capital allocation priorities, including share repurchases, debt repayment or acquisitions. Our strategy is to limit reliance on planned sales of non-HBU timberlands to augment cash flow generation and instead rely primarily on supporting cash flow from the operation, rather than sale, of our timberlands. We believe this strategy will support the sustainability of our harvesting activities over the long term.
|
|
•
|
Promote Best-in-Class Disclosure and Responsible Stewardship.
We intend to be an industry leader in transparent disclosure, particularly relating to our timberland holdings, harvest schedules, inventory and age-class profiles. In addition, we are committed to responsible stewardship and environmentally and economically sustainable forestry. We believe our continued commitment to transparency and the stewardship of our assets and capital will allow us to maintain our timberlands’ productivity, more effectively attract and deploy capital and enhance our reputation as a preferred timber supplier.
|
3
SEGMENT INFORMATION
Rayonier operates in five reportable business segments:
|
•
|
Southern Timber,
|
|
•
|
Pacific Northwest Timber,
|
|
•
|
New Zealand Timber,
|
|
•
|
Real Estate, and
|
|
•
|
Trading.
|
The Southern Timber, Pacific Northwest Timber and New Zealand Timber segments reflect all activities related to the harvesting of timber and other value-added activities, such as recreational licenses, within each respective geography. The New Zealand Timber segment also reflects any land sales that occur within our New Zealand portfolio.
Our Real Estate segment reflects all U.S. land sales, which are reported in five sales categories:
|
•
|
Improved Development,
|
|
•
|
Unimproved Development,
|
|
•
|
Rural,
|
|
•
|
Non-Strategic / Timberlands, and
|
|
•
|
Large Dispositions.
|
The Trading segment reflects the log trading activities that primarily support our New Zealand operations.
DISCUSSION OF TIMBER INVENTORY AND SUSTAINABLE YIELD
We define gross timber inventory as an estimate of all standing timber volume beyond the specified age at which we commence calculating our timber inventory for inclusion in our inventory tracking systems. The age at which we commence calculating our timber inventory is 10 years for our Southern timberlands, 20 years for our Pacific Northwest timberlands, and 20 years for our New Zealand timberlands. Our estimate of gross timber inventory is based on an inventory system that involves periodic statistical sampling and growth modeling. Periodic adjustments are made on the basis of growth estimates, harvest information, and environmental and operational restrictions. Gross timber inventory includes certain timber that we do not deem to be of a merchantable age as well as certain timber located in restricted, environmentally sensitive or economically inaccessible areas.
We define merchantable timber inventory as an estimate of timber volume beyond a specified age that approximates such timber’s earliest economically harvestable age. Our estimate includes certain timber located in restricted or environmentally sensitive areas based on an estimate of lawfully recoverable volumes from such areas. The estimate does not include volumes in restricted or environmentally sensitive areas that may not be lawfully harvested or volumes located in economically inaccessible areas. The merchantable age (
i.e.
, the age at which timber moves from pre-merchantable to merchantable) is 15 years for our Southern timberlands, with the exception of Oklahoma which is 17 years, 35 years for our Pacific Northwest timberlands, 20 years for radiata pine and 30 years for Douglas-fir in our New Zealand timberlands. Our estimated merchantable timber inventory changes over time as timber is harvested, as pre-merchantable timber transitions to merchantable timber, as existing merchantable timber inventory grows, as we acquire and sell timberland and as we periodically update our statistical sampling and growth and yield models. We estimate our merchantable timber inventory annually for purposes of calculating per unit depletion rates.
Timber inventory is generally measured and expressed in short green tons (SGT) in our Southern Timberlands, in thousand board feet (MBF) or million board feet (MMBF) in our Pacific Northwest Timberlands, and in cubic meters (m
3
) in our New Zealand Timberlands. For conversion purposes, one MBF and one m
3
is equal to approximately
8.0
and
1.12
short green tons, respectively. For comparison purposes, we provide inventory estimates for our Pacific Northwest and New Zealand timberlands in MBF and cubic meters, respectively, as well as in short green tons.
4
The following table sets forth the estimated volumes of merchantable timber inventory by location in short green tons as of
September 30, 2017
for the South and Pacific Northwest and as of
December 31, 2017
for New Zealand:
|
(volumes in thousands of SGT)
|
||||
|
Location
|
Merchantable Inventory (a)
|
%
|
||
|
South
|
67,737
|
|
74
|
|
|
Pacific Northwest
|
7,282
|
|
8
|
|
|
New Zealand
|
16,452
|
|
18
|
|
|
91,471
|
|
100
|
||
|
(a)
|
For all regions, depletion rate calculations for the upcoming year are based on estimated volumes of merchantable inventory at
December 31, 2017
.
|
We define sustainable yield as the average harvest level that can be sustained into perpetuity based on our estimates of biological growth and the expected productivity resulting from our reforestation and silvicultural efforts. Our estimated sustainable yield may change over time based on changes in silvicultural techniques and resulting timber yields, changes in environmental laws and restrictions, changes in the statistical sampling and estimates of our merchantable timber inventory, acquisitions and dispositions of timberlands, the expiration or renewal of timberland leases, casualty losses, and other factors. Moreover, our harvest level in any given year may deviate from our estimated sustainable yield due to variations in the age class of our timberlands, the product mix of our harvest (
i.e
., pulpwood versus sawtimber), our deliberate acceleration or deferral of harvest in response to market conditions, our thinning activity (in which we periodically remove some smaller trees from a stand to enhance long-term sawtimber potential of the remaining timber), or other factors.
We manage our U.S. timberlands in accordance with the requirements of the Sustainable Forestry Initiative
®
(“SFI”) program. The timberland holdings of the New Zealand JV are certified under the Forest Stewardship Certification
®
(“FSC”) program. Both programs are a comprehensive system of environmental principles, objectives and performance measures that combine the perpetual growing and harvesting of trees with the protection of wildlife, plants, soil and water quality. Through application of our site-specific silvicultural expertise and financial discipline, we manage timber in a way that is designed to optimize site preparation, tree species selection, competition control, fertilization, timing of thinning and final harvest. We also have a genetic seedling improvement program to enhance the productivity and quality of our timberlands and overall forest health. In addition, non-timber income opportunities associated with our timberlands such as recreational licenses, as well as considerations for the future higher and better uses of the land, are integral parts of our site-specific management philosophy. All these activities are designed to maximize value while complying with SFI and FSC requirements.
5
SOUTHERN TIMBER
As of
December 31, 2017
, our Southern timberlands acreage consisted of approximately
1.82 million
acres (including approximately
191,000
acres of leased lands) located in Alabama, Arkansas, Florida, Georgia, Louisiana, Mississippi, Oklahoma, South Carolina, Tennessee and Texas. Approximately two-thirds of this land supports intensively managed plantations of predominantly loblolly and slash pine. The other one-third of this land is too wet to support pine plantations, but supports productive natural stands primarily consisting of natural pine and a variety of hardwood species. Rotation ages typically range from 21 to 28 years for pine plantations and from 35 to 60 years for natural stands. Key consumers of our timber include pulp, paper, wood products and biomass facilities.
We estimate that the gross timber inventory and merchantable timber inventory of our Southern timberlands was
86 million
tons and
68 million
tons, respectively, as of
September 30, 2017
. We estimate that the sustainable yield of our Southern timberlands, including both pine and hardwoods, is approximately 5.9 to 6.3 million tons annually. We expect that the average annual harvest volume of our Southern timberlands over the next five years (2018 to 2022) will be generally within this range. For additional information, see
Item 1 — Business — Discussion of Timber Inventory and Sustainable Yield
and
Item 1A — Risk Factors
.
In
2017
, we acquired approximately 101,000 acres of timberland (including
11,000
acres of leased lands) in the Southern region. For additional information, see
Note 3 — Timberland Acquisitions
.
The following table provides a breakdown of our Southern timberlands acreage and timber inventory by product and age class as of
September 30, 2017
(inventory volumes are estimated at December 31 to calculate a depletion rate for the upcoming year):
|
(volumes in thousands of SGT)
|
|||||||||||||||||||
|
Age Class
|
Acres
(000’s)
|
Pine Pulpwood
|
Pine Sawtimber
|
Hardwood Pulpwood
|
Hardwood Sawtimber
|
Total
|
|||||||||||||
|
Pine Plantation
|
|||||||||||||||||||
|
0 to 4 years (a)
|
229
|
|
—
|
|
—
|
|
—
|
|
—
|
|
—
|
|
|||||||
|
5 to 9 years
|
203
|
|
—
|
|
—
|
|
—
|
|
—
|
|
—
|
|
|||||||
|
10 to 14 years
|
243
|
|
10,738
|
|
1,331
|
|
29
|
|
—
|
|
12,098
|
|
|||||||
|
15 to 19 years
|
281
|
|
13,074
|
|
4,845
|
|
116
|
|
3
|
|
18,038
|
|
|||||||
|
20 to 24 years
|
169
|
|
6,581
|
|
6,108
|
|
101
|
|
2
|
|
12,792
|
|
|||||||
|
25 to 29 years
|
67
|
|
2,280
|
|
3,236
|
|
95
|
|
2
|
|
5,613
|
|
|||||||
|
30 + years
|
46
|
|
1,213
|
|
2,798
|
|
92
|
|
3
|
|
4,106
|
|
|||||||
|
Total Pine Plantation
|
1,238
|
|
33,886
|
|
18,318
|
|
433
|
|
10
|
|
52,647
|
|
|||||||
|
Natural Pine (Plantable) (b)
|
47
|
|
507
|
|
906
|
|
895
|
|
207
|
|
2,515
|
|
|||||||
|
Natural Mixed Pine/Hardwood (c)
|
548
|
|
4,278
|
|
6,971
|
|
15,186
|
|
3,908
|
|
30,343
|
|
|||||||
|
Forested Acres and Gross Inventory
|
1,833
|
|
38,671
|
|
26,195
|
|
16,514
|
|
4,125
|
|
85,505
|
|
|||||||
|
Plus: Non-Forested Acres (d)
|
68
|
|
|||||||||||||||||
|
Gross Acres
|
1,900
|
|
|||||||||||||||||
|
Less: Pre-Merchantable Age Class
Inventory (e)
|
(12,651
|
)
|
|||||||||||||||||
|
Less: Volume in Environmentally
Sensitive/Legally Restricted Areas |
(5,117
|
)
|
|||||||||||||||||
|
Merchantable Timber Inventory
|
67,737
|
|
|||||||||||||||||
|
(a)
|
0 to 4 years includes clearcut acres not yet replanted.
|
|
(b)
|
Consists of natural stands that are convertible into pine plantations once harvested.
|
|
(c)
|
Consists of all non-plantable natural stands, including those that are in environmentally sensitive or economically inaccessible areas.
|
|
(d)
|
Includes roads, rights of way and all other non-forested areas.
|
|
(e)
|
Includes inventory that is less than 15 years old or less than 17 years old in Oklahoma.
|
6
PACIFIC NORTHWEST TIMBER
As of
December 31, 2017
, our Pacific Northwest timberlands consisted of approximately
378,000
acres located in Oregon and Washington, of which approximately
291,000
acres were designated as productive acres, meaning land that is capable of growing merchantable timber and where the harvesting of timber is not constrained by physical, environmental or regulatory restrictions. These timberlands primarily comprise second and third rotation western hemlock and Douglas-fir, as well as a small amount of other softwood species, such as western red cedar. A small percentage also consists of natural hardwood stands of predominantly red alder. In the Pacific Northwest, rotation ages typically range from 35 to 50 years. Our product mix in the Pacific Northwest is heavily weighted to sawtimber, which is sold to domestic wood products facilities as well as exported primarily to Pacific Rim markets.
We estimate that the gross timber inventory and merchantable timber inventory of our Pacific Northwest timberlands was
2,773
MMBF and
911 MMBF
, respectively, as of
September 30, 2017
. We estimate that the sustainable yield of our Pacific Northwest timberlands is approximately 180 MMBF (or 1.4 million tons) annually. We expect that the average annual harvest volume of our Pacific Northwest timberlands over the next five years (2018 to 2022) will be approximately 160 MMBF (or 1.3 million tons). For additional information, see
Item 1 — Business — Discussion of Timber Inventory and Sustainable Yield
and
Item 1A — Risk Factors
.
In
2017
, we acquired approximately
481
acres of timberlands in the Pacific Northwest region. For additional information, see
Note 3 — Timberland Acquisitions
.
The following table provides a breakdown of our Pacific Northwest timberlands acreage and timber inventory by product and age class as of
September 30, 2017
(inventory volumes are estimated at December 31 to calculate a depletion rate for the upcoming year):
|
(volumes in MBF, except as noted)
|
|||||||||||||
|
Age Class
|
Acres (000’s)
|
Softwood
Pulpwood (e)
|
Softwood
Sawtimber (e)
|
Total
|
|||||||||
|
Commercial Forest
|
|||||||||||||
|
0 to 4 years (a)
|
36
|
|
—
|
|
—
|
|
—
|
|
|||||
|
5 to 9 years
|
41
|
|
—
|
|
—
|
|
—
|
|
|||||
|
10 to 14 years
|
41
|
|
—
|
|
—
|
|
—
|
|
|||||
|
15 to 19 years
|
25
|
|
—
|
|
—
|
|
—
|
|
|||||
|
20 to 24 years
|
23
|
|
29,126
|
|
68,060
|
|
97,186
|
|
|||||
|
25 to 29 years
|
36
|
|
67,850
|
|
314,490
|
|
382,340
|
|
|||||
|
30 to 34 years
|
43
|
|
100,424
|
|
604,403
|
|
704,827
|
|
|||||
|
35 to 39 years
|
21
|
|
51,129
|
|
352,134
|
|
403,263
|
|
|||||
|
40 to 44 years
|
8
|
|
20,104
|
|
137,970
|
|
158,074
|
|
|||||
|
45 to 49 years
|
4
|
|
11,834
|
|
82,347
|
|
94,181
|
|
|||||
|
50+ years
|
7
|
|
23,701
|
|
180,537
|
|
204,238
|
|
|||||
|
Total Commercial Forest
|
285
|
|
304,168
|
|
1,739,941
|
|
2,044,109
|
|
|||||
|
Non-Commercial Forest (b)
|
6
|
|
6,664
|
|
46,111
|
|
52,775
|
|
|||||
|
Productive Forested Acres
|
291
|
|
|
|
|
||||||||
|
Restricted Forest (c)
|
66
|
|
82,508
|
|
593,794
|
|
676,302
|
|
|||||
|
Total Forested Acres and Gross Inventory
|
357
|
|
393,340
|
|
2,379,846
|
|
2,773,186
|
|
|||||
|
Plus: Non-Forested Acres (d)
|
21
|
|
|||||||||||
|
Gross Acres
|
378
|
|
|||||||||||
|
Less: Pre-Merchantable Age Class Inventory
|
(1,185,516
|
)
|
|||||||||||
|
Less: Restricted Forest Inventory
|
(676,302
|
)
|
|||||||||||
|
Total Merchantable Timber
|
911,368
|
|
|||||||||||
|
Conversion factor for MBF to SGT
|
7.99
|
|
|||||||||||
|
Total Merchantable Timber (thousands of SGT)
|
7,282
|
|
|||||||||||
|
(a)
|
0 to 4 years includes clearcut acres not yet replanted.
|
|
(b)
|
Includes non-commercial forests with limited productivity.
|
|
(c)
|
Includes significant portions of riparian management zones, legally restricted forests, and environmentally sensitive areas.
|
|
(d)
|
Includes roads, rights of way, and all other non-forested areas.
|
|
(e)
|
Includes a minor component of hardwood in red alder and other hardwood species.
|
7
NEW ZEALAND TIMBER
As of
December 31, 2017
, our New Zealand timberlands consisted of approximately
410,000
acres (including approximately
231,000
acres of leased lands), of which approximately
293,000
acres (including approximately 158,000 acres of leased lands) were designated as productive or plantation acres, meaning land that is capable of growing merchantable timber and where the harvesting of timber is not constrained by physical, environmental or regulatory restrictions. The leased acres are generally leased through long-term arrangements including Crown Forest Licenses (“CFLs”), forestry rights and other leases. Our New Zealand timberlands serve a domestic sawmilling market and also export logs to Pacific Rim markets.
Our New Zealand timber operations are conducted by Matariki Forestry Group, a joint venture with Phaunos Timber Fund Limited. The Company maintains a controlling financial interest of 77% in the New Zealand JV and, accordingly, consolidates the New Zealand JV’s balance sheet and results of operations. The minority owner’s interest in the New Zealand JV and its earnings are reported as noncontrolling interest in our financial statements. Rayonier’s wholly-owned subsidiary, Rayonier New Zealand Limited (“RNZ”), serves as the manager of the New Zealand JV. For additional information, see
Note 7 — Joint Venture Investment
.
We estimate that the gross timber inventory and merchantable timber inventory of our New Zealand timberlands were both
14.7 million
cubic meters as of
December 31, 2017
. We estimate that the sustainable yield of our New Zealand timberlands is approximately 2.1 million cubic meters (or 2.5 million tons) annually. We expect that the average annual harvest volume of our New Zealand timberlands over the next five years (2018 to 2022) will be generally in line with our sustainable yield. For additional information, see
Item 1 — Business — Discussion of Timber Inventory and Sustainable Yield
and
Item 1A — Risk Factors
.
The following table provides a breakdown of our New Zealand timberlands acreage and timber inventory by product and age class as of
December 31, 2017
(inventory volumes at December 31 are used to calculate a depletion rate for the upcoming year):
|
(volumes in thousands of m
3
, except as noted)
|
|||||||||||||
|
Age Class
|
Acres (000’s)
|
Pulpwood
|
Sawtimber
|
Total
|
|||||||||
|
Radiata Pine
|
|||||||||||||
|
0 to 4 years (a)
|
54
|
|
—
|
|
—
|
|
—
|
|
|||||
|
5 to 9 years
|
45
|
|
—
|
|
—
|
|
—
|
|
|||||
|
10 to 14 years
|
46
|
|
—
|
|
—
|
|
—
|
|
|||||
|
15 to 19 years
|
52
|
|
—
|
|
—
|
|
—
|
|
|||||
|
20 to 24 years
|
45
|
|
1,652
|
|
7,101
|
|
8,753
|
|
|||||
|
25 to 29 years
|
12
|
|
525
|
|
1,987
|
|
2,512
|
|
|||||
|
30 + years
|
4
|
|
243
|
|
650
|
|
893
|
|
|||||
|
Total Radiata Pine
|
258
|
|
2,420
|
|
9,738
|
|
12,158
|
|
|||||
|
Other (b)
|
35
|
|
1,282
|
|
1,249
|
|
2,531
|
|
|||||
|
Forested Acres and Merchantable Timber Inventory
|
293
|
|
3,702
|
|
10,987
|
|
14,689
|
|
|||||
|
Conversion factor for m
3
to SGT
|
1.12
|
|
|||||||||||
|
Total Merchantable Timber (thousands of SGT)
|
16,452
|
|
|||||||||||
|
Plus: Non-Productive Acres (c)
|
117
|
|
|||||||||||
|
Gross Acres
|
410
|
|
|||||||||||
|
(a)
|
0 to 4 years includes clearcut acres not yet replanted.
|
|
(b)
|
Includes primarily Douglas-fir age 30 and over.
|
|
(c)
|
Includes natural forest and other non-planted acres.
|
8
REAL ESTATE
All of our U.S. land sales, including HBU and non-HBU, are reported in our Real Estate segment. We report our Real Estate sales in five categories:
•
Improved Development,
•
Unimproved Development,
•
Rural,
•
Non-Strategic / Timberlands, and
•
Large Dispositions.
The Improved Development category comprises properties sold for development for which Rayonier, through a taxable REIT subsidiary, has invested in site improvements such as infrastructure, roadways, utilities, amenities and/or other improvements designed to enhance marketability and create parcels, pads and/or lots for sale.
The Unimproved Development category comprises properties sold for development for which Rayonier has obtained entitlements but not invested in site improvements.
The Rural category comprises properties sold in rural markets to buyers interested in the property for rural residential or recreational use.
The Non-Strategic / Timberlands category includes: 1) sales of non-core timberlands that do not meet our strategic criteria, 2) sales of core timberlands for which we obtain attractive values, and 3) sales of properties to conservation interests that wish to preserve the land for habitat, public recreation, natural growth, buffer zones or other environmental purposes.
The Large Dispositions category includes sales of timberland that exceed $20 million in size and do not have a demonstrable premium relative to timberland value. Proceeds from Large Dispositions are generally used to fund capital allocation priorities, which include share repurchases, debt repayment or acquisitions. Sales designated as Large Dispositions are excluded from cash flow from operations and the calculation of Adjusted EBITDA and Cash Available for Distribution (“CAD”). See
Item 7 — Performance and Liquidity Indicators
for the definition of Adjusted EBITDA and CAD.
We maintain a detailed land classification analysis for all of our timberland and HBU acres. The vast majority of our HBU properties are managed as timberland and generate cash flow from timber operations prior to their sale or, in the case of Improved Development properties, prior to improvement.
TRADING
Our Trading segment reflects log trading activities in New Zealand and Australia conducted by our New Zealand JV. Our Trading segment complements the New Zealand Timber segment by providing added market intelligence, increasing the scale of export operations and achieving cost savings that directly benefit the New Zealand Timber segment. It also provides additional market intelligence that helps our Southern and Pacific Northwest export log marketing.
Trading activities are broadly categorized as either managed export services or procured logs. For managed export services, the New Zealand JV does not take title to the log cargo but arranges sales, shipping and export documentation services for other forest owners for an agreed commission. For procured logs, the New Zealand JV buys logs directly from other forest owners at New Zealand ports and exports them in its own name. Income from this business is generated by achieving a sales margin over the purchase price of the procured logs. The New Zealand JV also purchases standing timber from time to time, whereby it manages the harvest and sale of the logs for approximately one to three years. The Trading segment generally utilizes a managed export service arrangement for logs sourced from third parties outside of New Zealand, and generally utilizes a procured log arrangement for logs sourced from third parties within New Zealand. For managed export services, Trading segment revenues reflect only the commission earned on the sale. For procured log sales, Trading segment revenues reflect the full sales price of the logs.
9
In
2017
, Trading volume from both managed export services and procured log sales was approximately 1.8 million JAS cubic meters of logs. Approximately 846,000 JAS cubic meters of logs were sourced from outside New Zealand, primarily Australia, of which 85% were undertaken through managed export service arrangements. Approximately 873,000 JAS cubic meters of logs were purchased directly from third parties in New Zealand through procured log arrangements, with 52% purchased from two key suppliers. Additionally, 105,000 JAS cubic meters were harvested from stumpage purchases. Approximately 35% of third-party purchases in New Zealand were purchased at spot prices, with the New Zealand JV thereby assuming some price risk on subsequent resale. The remaining 65% were purchased on a fixed margin basis, with the New Zealand JV thereby earning a spread on the resale price irrespective of subsequent price fluctuations. The New Zealand JV generally seeks to mitigate its risk of loss on procured logs by securing export orders prior to or concurrent with its spot purchases of logs.
FOREIGN SALES AND OPERATIONS
Sales from non-U.S. operations originate from our New Zealand Timber and Trading segments and comprised approximately
49%
of consolidated
2017
sales. See
Note 4 — Segment and Geographical Information
for additional information.
COMPETITION
TIMBER
Timber markets in our Southern and Pacific Northwest regions are relatively fragmented with price being the principal method of competition. In New Zealand, there are four major private timberland owners accounting for approximately 37% of New Zealand planted forests.
The following table provides an overview of certain major competitors in each of our Timber segments:
|
Segment
|
Competitors
|
|
Southern Timber (a)
|
Weyerhaeuser Company
|
|
CatchMark Timber Trust
|
|
|
Hancock Timber Resource Group
|
|
|
Resource Management Service
|
|
|
Forest Investment Associates
|
|
|
Campbell Global
|
|
|
Pacific Northwest Timber (a)
|
Weyerhaeuser Company
|
|
Hancock Timber Resource Group
|
|
|
Green Diamond Resource Company
|
|
|
Campbell Global
|
|
|
Port Blakely Tree Farms
|
|
|
Pope Resources
|
|
|
State of Washington Department of Natural Resources
|
|
|
Bureau of Indian Affairs
|
|
|
New Zealand (b)
|
Hancock Natural Resource Group
|
|
Kaingaroa Timberlands
|
|
|
Ernslaw One
|
|
(a) In addition to the competitors listed, we also compete with numerous other large and small privately held timber companies.
|
(b)
|
The New Zealand JV competes with these and other smaller New Zealand timber companies for supply into New Zealand domestic and export markets, predominantly China, South Korea and India. Logs supplied into Asian markets also compete with export supply from other regions, including Russia and North America.
|
10
REAL ESTATE
In our Real Estate business, we compete with other owners of entitled and unentitled properties. Each property has unique attributes, but overall quantity of supply and price for residential, commercial, industrial and rural properties in the geographic areas in which we operate are the most significant competitive drivers.
TRADING
Our log trading operations are based out of New Zealand and performed by our New Zealand JV. The New Zealand market remains very competitive with over 20 entities competing for export log supply at different ports across the country. We are one of the larger log trading companies in the region with access to multiple export ports and a range of different export markets.
CUSTOMERS
In
2017
, no individual customer (or group of customers under common control) represented 10% or more of
2017
consolidated sales. As such, there is not a significant risk that the loss of one customer would have a material adverse effect on our results of operations.
SEASONALITY
Across all our segments, results are normally not impacted significantly by seasonal changes. However, particularly wet weather in areas of our Southern Timber operations can hinder access for harvesting, thereby temporarily reducing supply in the affected areas and generally strengthening prices. Conversely, extended dry weather in an area tends to suppress prices as timber is more accessible for harvesting.
ENVIRONMENTAL MATTERS
See
Item 1A — Risk Factors
.
RESEARCH AND DEVELOPMENT
The research and development activities of our timber operations include genetic seedling improvement, growth and yield modeling, and applied silvicultural programs to identify management practices that will improve financial returns from our timberlands. We also contribute to research cooperatives that undertake forestry research and development.
EXECUTIVE OFFICERS
David L. Nunes, 56
,
Mr. Nunes joined the Company in June 2014 as Chief Operating Officer, and shortly thereafter assumed the role of President and CEO following the Company’s spin-off of its Performance Fibers business. Prior to joining the Company, Mr. Nunes served as President and CEO of Pope Resources/Olympic Resource Management from 2002 to 2014. He joined Pope in 1997 as director of portfolio management, working with third-party investors and timberland owners to develop and manage timberland investment portfolios. The following year, he was named Vice President of portfolio development, and then served two years as Senior Vice President of acquisitions and portfolio development before being named President and COO in 2000. Previously, Mr. Nunes spent nine years with the Weyerhaeuser Company, joining the organization in 1988 as a business analyst and advancing through a number of leadership roles to become director of corporate strategic planning. During his time with Weyerhaeuser, he gained extensive experience involving export log sales and marketing, timberland acquisitions, mergers and acquisitions, and capital planning. Mr. Nunes holds a Bachelors of Arts and Economics from Pomona College and an MBA from the Tepper School of Business at Carnegie Mellon University.
Mark D. McHugh, 42,
Mr. McHugh was appointed Senior Vice President and Chief Financial Officer in December 2014. He was previously Managing Director in the Real Estate Investment Banking group at Raymond James, where he worked since 2008. Prior to joining Raymond James, Mr. McHugh was a Director in the Paper & Forest Products Group at Credit Suisse, where he worked from 2000 to 2008. Mr. McHugh received his B.S.B.A. in Finance from the University of Central Florida and his JD from Harvard Law School.
11
Douglas M. Long, 47,
Mr. Long was appointed to Senior Vice President, U.S. Operations in December 2015. He was named Vice President, U.S. Operations in November 2014. Prior to such appointment, Mr. Long served as Director, Atlantic Region, U.S. Forest Resources. He joined the Company in 1995 as a GIS Forestry Analyst and has held multiple positions of increasing responsibility within the forestry division. Mr. Long holds bachelor’s and master’s degrees in Forest Resources and Conservation from the University of Florida.
Christopher T. Corr, 54,
Mr. Corr joined the Company in July 2013 and currently serves as Senior Vice President, Real Estate & Public Affairs and President, Raydient LLC. Prior to joining Rayonier, he served as Executive Vice President, Buildings and Places for AECOM from 2008 to 2013. Prior to that, Mr. Corr held various positions with The St. Joe Company between 1998 and 2008, most recently as Executive Vice President. From 1992 to 1998, Mr. Corr was a senior manager with The Walt Disney Company, where he was a key member of the team that developed the visionary town of Celebration near Orlando, Florida. From 1990-1992, Mr. Corr served as an elected member of the Florida House of Representatives. He holds a Bachelor of Arts degree from the University of Florida and has completed programs with the Harvard Real Estate Institute and the Wharton School of Business at University of Pennsylvania.
Mark R. Bridwell, 55,
Mr. Bridwell was promoted to Vice President and General Counsel in June 2014 and assumed the role of Corporate Secretary in March 2015. He joined the Company in 2006 as Associate General Counsel for Performance Fibers. In 2009, he became Associate General Counsel for Timber and Real Estate and in 2012 was promoted to Assistant General Counsel for Land Resources. Prior to joining Rayonier, Mr. Bridwell served as counsel for six years at Siemens Corporation. Previously, he was an attorney for five years with the international law firms of Jones, Day, Reavis & Pogue and Seyfarth, Shaw, Fairweather & Geraldson. Mr. Bridwell has a B.S.B.A. in Finance from the University of Central Florida, and an MBA and JD from Emory University.
Shelby L. Pyatt, 47,
Ms. Pyatt was named Vice President, Human Resources in July 2014. Ms. Pyatt joined Rayonier in 2003 as Manager, Compensation and became Director, Compensation and Employee Services in 2006. She was named Director, Compensation, Benefits and Employee Services in 2009 before being promoted to her current position, where she now also oversees IT. Prior to joining Rayonier, Ms. Pyatt held human resources positions with CSX Corporation and Barnett Bank. Ms. Pyatt holds a bachelor’s degree in Business Management.
W. Rhett Rogers, 41,
Mr. Rogers was appointed to Vice President, Portfolio Management in February 2017. In this position, he oversees the Company’s acquisition and disposition activities, as well as its land information systems function. He joined Rayonier in 2001 as a District Technical Forester, and has held numerous roles of increasing responsibility, most recently as Director, Land Asset Management before being promoted to his current position. Mr. Rogers holds a BS in Forestry from Louisiana Tech University, and both an MBA and MS in Forest Resources from Mississippi State University.
EMPLOYEE RELATIONS
We currently employ approximately 334 people, of which approximately 250 are in the United States. We believe relations with our employees are satisfactory.
AVAILABILITY OF REPORTS AND OTHER INFORMATION
Our annual reports on Form 10-K, quarterly reports on Form 10-Q, current reports on Form 8-K, proxy statements and amendments to those reports filed or furnished pursuant to Sections 13(a) or 14 of the Securities Exchange Act of 1934 are made available to the public free of charge in the Investor Relations section of our website
www.rayonier.com
, shortly after we electronically file such material with, or furnish them to, the Securities and Exchange Commission (“SEC”). Our corporate governance guidelines and charters of all committees of our board of directors are also available on our website. The information on the Company’s website is not incorporated by reference into this annual report on Form 10-K.
12
|
Item 1A.
|
RISK FACTORS
|
Our operations are subject to a number of risks. When considering an investment in our securities, you should carefully read and consider these risks, together with all other information in this Annual Report on Form 10-K. If any of the events described in the following risk factors actually occur, our business, financial condition or operating results, as well as the market price of our securities, could be materially adversely affected.
We are exposed to the cyclicality of the markets in which we operate and other factors beyond our control, which could adversely affect our results of operations.
Some of the industries in which our end-use customers participate, such as the construction and home building industries, the global pulp, packaging and paper industries and the real estate industry, are cyclical in nature, exposing us to risks beyond our control, including general macroeconomic conditions, both in the U.S. and globally, as well as local economic conditions.
In our Timber segments, the level of new residential construction activity and, to a lesser extent, home repair and remodeling activity, is the primary driver of sawtimber demand. In addition, demand for logs can be affected by the demand for wood chips in the pulp and paper and engineered wood products markets, as well as the bio-energy production markets. The ongoing level of activity in these markets is subject to fluctuation due to future changes in economic conditions, interest rates, credit availability, population growth, weather conditions and other factors. Changes in global economic conditions, such as new timber supply sources and changes in currency exchange rates, foreign interest rates and foreign and domestic trade policies, can also negatively impact demand for our timber and logs. In addition, the industries in which these customers participate are highly competitive and may experience overcapacity or reductions in demand, all of which may affect demand for and pricing of our products. For example, the supply of timber and logs has historically increased during favorable pricing environments, which then causes downward pressure on prices, and can have an adverse effect on our business.
In our Real Estate segment, our inability to sell our HBU properties at attractive prices could have a significant effect on our results of operations. Demand for real estate can be affected by the availability of capital, changes in interest rates, availability and terms of financing, governmental agencies, developers, conservation organizations, individuals and others seeking to purchase our timberlands, our ability to obtain land use entitlements and other permits necessary for our development activities, local real estate market economic conditions, competition from other sellers of land and real estate developers, the relative illiquidity of real estate investments, employment rates, new housing starts, population growth, demographics and federal, state and local land use, zoning and environmental protections laws or regulations (including any changes in laws or regulations). In addition, changes in investor interest in purchasing timberlands could reduce our ability to execute sales of non-strategic timberlands.
These macroeconomic and cyclical factors impacting our operations are beyond our control and, if such conditions deteriorate or do not continue to improve, could have an adverse effect on our business.
Weather and other natural conditions may limit our timber harvest and sales.
Weather conditions and extreme events, timber growth cycles and restrictions on access (for example, due to prolonged wet conditions) and other factors, including damage by fire, insect infestation, disease, prolonged drought and natural disasters such as wind storms and hurricanes, may limit harvesting of our timberlands. The volume and value of timber that can be harvested from our timberlands may be reduced by any such occurrence and other causes beyond our control. As is typical in the forestry industry, we do not maintain insurance for any loss to our timber, including losses due to fire and these other causes. These and other factors beyond our control could reduce our timber inventory and accordingly, our sustainable yield, thereby adversely affecting our financial results and cash flows.
13
Entitlement and development of real estate entail a lengthy, uncertain and costly approval process, which could adversely affect our ability to grow the businesses in our Real Estate segment.
Entitlement and development of real estate entail extensive approval processes involving multiple regulatory jurisdictions. It is common for a project to require multiple approvals, permits and consents from U.S. federal, state and local governing and regulatory bodies. For example, in Florida, real estate projects must generally comply with the provisions of the Community Planning Act and local land use, zoning and development regulations. In addition, development projects in Florida that exceed certain specified regulatory thresholds (and are not located in a jurisdiction classified as a dense urban land area) may require approval pursuant to specialized Comprehensive Plan evaluation and process standards. Compliance with these and other regulations and standards is more time intensive and costly and may require additional long range infrastructure review and approvals which can add to project cost. In addition, development of properties containing delineated wetlands may be affected by revisions to the definition of wetlands subject to state and/or federal regulation and may require one or more permits from the U.S. federal government and/or state and local governmental agencies. Any of these issues can materially affect the cost, timing and economic viability of our real estate projects.
The real estate entitlement process is frequently a political one, which involves uncertainty and often extensive negotiation and concessions in order to secure the necessary approvals and permits. In the U.S., a significant amount of our development property is located in counties in which local governments face challenging issues relating to growth and development, including zoning and future land use, public services, water availability, transportation and other infrastructure, and funding for same, and the requirements of state law, especially in the case of Florida under the Community Planning Act process standards. In addition, anti-development groups are active, especially in Florida, in filing litigation to oppose particular entitlement activities and development projects, and in seeking legislation and other anti-development limitations on real estate development activities. We expect this type of anti-development activity to continue in the future.
Issues affecting real estate development also include the availability of potable water for new development projects. For example, the Georgia Legislature enacted the Comprehensive Statewide Watershed Management Planning Act, which, among other things, created a governmental entity called the Georgia Water Council which was charged with preparing a comprehensive water management plan for the state and presenting it to the Georgia Legislature. It is unclear at this time how the plan will affect the cost and timing of real estate development along the southern Georgia coast, where the Company has significant timberland holdings with downstream real estate development potential. Concerns about the availability of potable water also exist in certain Florida counties, which could impact future growth opportunities.
Changes in the laws, or interpretation or enforcement thereof, regarding the use and development of real estate, changes in the political composition of state and local governmental bodies, and the identification of new facts regarding our properties could lead to new or greater costs and delays and liabilities that could materially adversely affect our business, profitability or financial condition.
Changes in energy and fuel costs could affect our results of operations and financial condition.
Energy costs are a significant operating expense for our logging and hauling contractors and for the contractors who support the customers of our standing timber. Energy costs can be volatile and are susceptible to rapid and substantial increases or decreases due to factors beyond our control, such as changing economic conditions, political unrest, instability in energy-producing nations, and supply and demand considerations. Although the price of oil has recently decreased, increases in the price of oil could adversely affect our business, financial condition and results of operations. In addition, an increase in fuel costs, and its impact on the cost and availability of transportation for our products, both domestically and internationally, and the cost and availability of third-party logging and hauling contractors, could have a material adverse effect on the operating costs of our contractors and our standing timber customers, as well as in defining economically accessible timber stands. Such factors could in turn have a material adverse effect on our business, financial condition and results of operations, particularly in our Timber segments and Trading segment.
14
We depend on third parties for logging and transportation services and increases in the costs or decreases in the availability of quality service providers could adversely affect our business.
Our Timber segments depend on logging and transportation services provided by third parties, both domestically and internationally, including by railroad, trucks, or ships. If any of our transportation providers were to fail to deliver timber supply or logs to our customers in a timely manner, or were to damage timber supply or logs during transport, we may be unable to sell it at full value, or at all. During the global financial crisis and subsequent downturn in U.S. housing starts, timber harvest volumes declined significantly. As a result, many logging contractors, particularly cable logging operators in the western U.S., permanently shut down their operations. As harvest levels have returned to higher levels with the recovery in U.S. housing starts, this shortage of logging contractors has resulted in sharp increases in logging costs and in the availability of logging contractors. It is expected that the supply of qualified logging contractors will be impacted by the availability of debt financing for equipment purchases as well as a sufficient supply of adequately trained loggers. As housing starts continue to recover, harvest levels are expected to increase, placing more pressure on the existing supply of logging contractors. Any significant failure or unavailability of third-party logging or transportation providers, or increases in transportation rates or fuel costs, may result in higher logging costs or the inability to capitalize on stronger log prices to the extent logging contractors cannot be secured at a competitive cost. Such events could harm our reputation, negatively affect our customer relationships and adversely affect our business.
We are subject to risks associated with doing business outside of the U.S.
Although the majority of our customers are in the U.S., a significant portion of our sales are to end markets outside of the U.S., including China, South Korea, Japan, Taiwan, India, Vietnam and New Zealand. The export of our products into international markets results in risks inherent in conducting business pursuant to international laws, regulations and customs. We expect that international sales will continue to contribute to future growth. The risks associated with our business outside the U.S. include:
|
•
|
changes in and reinterpretations of the laws, regulations and enforcement priorities of the countries in which our products are sold;
|
|
•
|
responsibility to comply with anti-bribery laws such as the U.S. Foreign Corrupt Practices Act and similar anti-bribery laws in other jurisdictions;
|
|
•
|
trade protection laws, policies and measures and other regulatory requirements affecting trade and investment, including loss or modification of exemptions for taxes and tariffs, imposition of new tariffs and duties and import and export licensing requirements;
|
|
•
|
difficulty in establishing, staffing and managing non-U.S. operations;
|
|
•
|
product damage or losses incurred during shipping;
|
|
•
|
potentially negative consequences from changes in or interpretations of tax laws;
|
|
•
|
economic or political instability, inflation, recessions and interest rate and exchange rate fluctuations;
|
|
•
|
uncertainties regarding non-U.S. judicial systems, rules and procedures; and
|
|
•
|
uncertainties regarding changes in trade policies under consideration by the current presidential administration.
|
These risks could adversely affect our business, financial condition and results of operations.
15
Our estimates of timber inventories and growth rates may be inaccurate, include risks inherent to such estimates and may impair our ability to realize expected revenues.
We rely upon estimates of merchantable timber inventories (which include judgments regarding inventories that may be lawfully and economically harvested), timber growth rates and end-product yields when acquiring and managing working forests. These estimates, which are inherently inexact and uncertain in nature, are central to forecasting our anticipated timber revenues and expected cash flows. Growth rates and end-product yield estimates are developed using statistical sampling, harvest results and growth and yield modeling, in conjunction with industry research cooperatives and by in-house forest biometricians, using measurements of trees in research plots spread across our timberland holdings. The growth equations predict the rate of height and diameter growth of trees so that foresters can estimate the volume of timber that may be present in the tree stand at a given age. Tree growth varies by soil type, geographic area, and climate. Inappropriate application of growth equations in forest management planning may lead to inaccurate estimates of future volumes. If the assumptions we rely upon change or these estimates are inaccurate, our ability to manage our timberlands in a sustainable or profitable manner may be diminished, which may cause our results of operations and our stock price to be adversely affected.
Our businesses are subject to extensive environmental laws and regulations that may restrict or adversely affect our ability to conduct our business.
Environmental laws and regulations are constantly changing and are generally becoming more restrictive.
Laws, regulations and related judicial decisions and administrative interpretations affecting our business are subject to change, and new laws and regulations are frequently enacted. These changes may adversely affect our ability to harvest and sell timber, remediate contaminated properties and/or entitle real estate. These laws and regulations may relate to, among other things, the protection of timberlands and endangered species, recreation and aesthetics, protection and restoration of natural resources, surface water quality, timber harvesting practices, and remedial standards for contaminated property and groundwater. Over time, the complexity and stringency of these laws and regulations have increased and the enforcement of these laws and regulations has intensified. For example, the U.S. Environmental Protection Agency (“EPA”) has pursued a number of initiatives that, if implemented, could impose additional operational and pollution control obligations on industrial facilities like those of Rayonier’s customers, especially in the area of air emissions and wastewater and stormwater control. In addition, as a result of certain judicial rulings and state and federal initiatives, including some that would require timberland operators to obtain permits to conduct certain ordinary course forestry activities, silvicultural practices on our timberlands could be impacted in the future. Environmental laws and regulations will likely continue to become more restrictive and over time could adversely affect our business, financial condition and results of operations.
If regulatory and environmental permits are delayed, restricted or rejected, a variety of our operations could be adversely affected.
We are required to seek permission from government agencies in the states and countries in which we operate to perform certain activities related to our properties. Any of these agencies could delay review of, or reject, any of our filings. In our Southern Timber, Pacific Northwest Timber and New Zealand Timber segments, any delay associated with a filing could result in a delay or restriction in replanting, thinning, insect control, fire control or harvesting, any of which could have an adverse effect on our operating results. For example, in Washington State, we are required to file a Forest Practice Application for each unit of timberland to be harvested. These applications may be denied, conditioned or restricted by the regulatory agency. Actions by the regulatory agencies could delay or restrict timber harvest activities pursuant to these permits. Delays or harvest restrictions on a significant number of applications could have an adverse effect on our operating results.
Environmental groups and interested individuals may seek to delay or prevent a variety of operations.
We expect that environmental groups and interested individuals will intervene with increasing frequency in the regulatory processes in the states and countries where we own, lease or manage timberlands. For example, in Washington State, environmental groups and interested individuals may appeal individual forest practice applications or file petitions with the Forest Practices Board to challenge the regulations under which forest practices are approved. These and other challenges could materially delay or prevent operations on our properties. For example, interveners at times may bring legal action in Florida in opposition to entitlement and change of use of timberlands to commercial, industrial or residential use. Delays or restrictions due to the intervention of environmental groups or interested individuals could adversely affect our operating results. In addition to intervention in regulatory proceedings, interested groups and individuals may file or threaten to file lawsuits that seek to prevent us from obtaining permits, implementing capital improvements or pursuing operating plans. Any threatened or actual lawsuit could delay harvesting on our timberlands, affect how we operate or limit our ability to modify or invest in our real estate. Among the remedies that could be enforced in a lawsuit is a judgment preventing or restricting harvesting on a portion of our timberlands.
16
Third-party operators may create environmental liabilities.
We lease and/or grant easements across some of our properties to third-party operators for the purpose of operating communications towers, generating renewable energy (wind and solar), operating pipelines for the transport of gases and liquids, and exploring, extracting, developing and producing oil, gas, rock and other minerals. These activities are subject to federal, state and local laws and regulations. These operations may also create risk of environmental liabilities for an unlawful discharge of oil, gas, chemicals or other materials into the air, soil or water. Generally, these third-party operators indemnify us against any such liability, and we require that they maintain liability insurance. However, if for any reason our third-party operators are not able to honor their obligations to us, or if the required insurance is not in effect, then it is possible that we could be responsible for costs associated with environmental liability caused by such third-party operators.
The impact of existing regulatory restrictions on future harvesting activities may be significant.
U.S. federal, state and local laws and regulations, as well as those of other countries, which are intended to protect threatened and endangered species, as well as waterways and wetlands, limit and may prevent timber harvesting, road building and other activities on our timberlands. Restrictions relating to threatened and endangered species apply to activities that would adversely impact a protected species or significantly degrade its habitat. The size of the restricted area varies depending on the protected species, the time of year and other factors, but can range from less than one acre to several thousand acres. A number of species that naturally live on or near our timberlands, including, among others, the northern spotted owl, marbled murrelet, several species of salmon and trout in the Pacific Northwest, and the red cockaded woodpecker, red hills salamander and eastern indigo snake in the Southeast, are protected under the Federal Endangered Species Act (the “ESA”) or similar U.S. federal and state laws. A significant number of other species, such as the southeastern gopher tortoise and certain species of southern pine snake are currently under review for possible protection under the ESA. As we gain additional information regarding the presence of threatened or endangered species on our timberlands, or if other regulations, such as those that require buffers to protect water bodies, become more restrictive, the amount of our timberlands subject to harvest restrictions could increase.
We formerly owned or operated or may own or acquire timberlands or properties that may require environmental remediation or otherwise be subject to environmental and other liabilities.
We owned or operated manufacturing facilities and discontinued operations that we do not currently own, and we may currently own or may acquire timberlands and other properties in the future that are subject to environmental liabilities, such as remediation of soil, sediment and groundwater contamination and other existing or potential liabilities. In connection with the spin-off of our Performance Fibers business, and pursuant to the related Separation and Distribution Agreement between us and Rayonier Advanced Materials, Rayonier Advanced Materials has assumed any environmental liability of ours in connection with the manufacturing facilities and discontinued operations related to the Performance Fibers business and has agreed to indemnify and hold us harmless in connection with such environmental liabilities. However, in the event we seek indemnification from Rayonier Advanced Materials, we cannot provide any assurance that a court will enforce our indemnification right if challenged by Rayonier Advanced Materials or that Rayonier Advanced Materials will be able to fund any amounts for indemnification owed to us. In addition, the cost of investigation and remediation of contaminated timberlands and properties that we currently own or acquire in the future could increase operating costs and adversely affect financial results. We could also incur substantial costs, such as civil or criminal fines, sanctions and enforcement actions (including orders limiting our operations or requiring corrective measures, installation of pollution control equipment or other remedial actions), clean-up and closure costs, and third-party claims for property damage and personal injury as a result of violations of, or liabilities under, environmental laws and regulations related to such timberlands or properties.
The industries in which we operate are highly competitive.
The markets in which we operate are highly competitive, and we compete with companies that have substantially greater financial resources than we do in each of these businesses. The competitive pressures relating to our Timber segments are primarily driven by quantity of product supply and quality of the timber offered by competitors in the domestic and export markets, each of which may impact pricing. With respect to our Real Estate segment, we compete with other owners of entitled and unentitled properties. Each property has unique attributes, but overall quantity of supply and price for residential, commercial, industrial and rural properties in the geographic areas in which we operate are the most significant competitive drivers. The market in which our Trading segment operates remains very competitive with over 20 entities competing for export log supply at different ports across New Zealand.
17
Our strategy will be adversely affected if we are unable to make future acquisitions.
We have pursued, and intend to continue to pursue, acquisitions of timberland and real estate properties that meet our investment criteria and achieve our strategic goals of growing the size and average quality of our land base. The ability to grow through acquisitions or other investments depends upon our ability to identify, negotiate, complete and integrate suitable acquisitions or joint venture arrangements. In addition, the discount rate we use in our acquisition underwriting has to meet our internal hurdle rate while also being competitive with that of other timberland REITs and TIMOs. In particular, our future success and growth depend upon our ability to make acquisitions that increase merchantable timber inventory and complement the existing age-class structure of our ownership. If we are unable to make acquisitions on acceptable terms or that do not support our strategic goals, our revenues and cash flows may stagnate or decline.
Our inability to access the capital markets could adversely affect our business strategy and competitive position.
Due to the REIT income distribution requirements, we rely significantly on external sources of capital to finance growth and acquisitions. Both our ability to obtain financing and the related costs of borrowing are affected by a number of factors, many of which are outside of our control, including a decline in general market conditions, decreased market liquidity, a downgrade to our public debt rating, increases in interest rates, an unfavorable market perception of our growth potential, a decrease in our current or estimated future earnings or a decrease in the market price of our common stock. If capital is not available when needed, or is available only on unfavorable terms relative to other timberland REITs or TIMOs, or not at all, we may be unable to complete acquisitions or otherwise take advantage of business opportunities or respond to competitive pressures. As of December 31, 2017, our credit ratings from S&P and Moody’s Investors Service (Moody’s) were BBB- and Baa3, respectively. Any combination of the factors described above, including our failure to maintain our investment grade credit rating, could prevent us from obtaining the capital we require on terms that are acceptable to us, or at all, which could adversely affect our business, liquidity and competitive position.
We are subject to risks associated with an increase in market interest rates.
One of the factors that may influence the price of our common shares is our annual dividend yield as compared to yields on other financial instruments. Thus, an increase in market interest rates could result in higher yields on other financial instruments and could adversely affect relative attractiveness of an investment in the Company and, accordingly, the trading price of our common shares.
An increase in market interest rates could cause increases in discount rates and, accordingly, a decline in property values and total returns for timberland assets. An increase in market interest rates would also negatively impact financing costs on our floating rate debt as well as any additional debt we may raise.
Investment returns on pension assets may be lower than expected or interest rates may decline, requiring us to make significant additional cash contributions to our benefit plans.
We sponsor now frozen defined benefit pension plans, which covered a portion of our salaried and hourly employees. The Federal Pension Protection Act of 2006 requires that certain capitalization levels be maintained in each of these benefit plans. At December 31, 2017, our qualified plan was underfunded by approximately $29 million. We estimate that we are subject to approximately $2.9 million of pension contribution requirements in 2018. Because it is unknown what the investment return on pension assets will be in future years or what interest rates may be at any point in time, we cannot provide any assurance that applicable law will not require us to make future material plan contributions. Any such contributions could adversely affect our financial condition. See
Item 7 — Management’s Discussion and Analysis of Financial Condition and Results of Operations — Critical Accounting Policies and Use of Estimates
for additional information about these plans, including funding status.
18
The impacts of climate-related initiatives, at the international, U.S. federal and state levels, remain uncertain at this time.
There continue to be numerous international, U.S. federal and state-level initiatives and proposals to address domestic and global climate issues. Within the U.S., most of these proposals would regulate and/or tax the production of carbon dioxide and other “greenhouse gases” to facilitate the reduction of carbon compound emissions into the atmosphere, and provide tax and other incentives to produce and use “cleaner” energy.
In late 2009, the EPA issued an “endangerment finding” under the Clean Air Act with respect to certain greenhouse gases, leading to the regulation of carbon dioxide as a pollutant under the Clean Air Act and having significant ramifications for Rayonier and the industry in general. In this regard, the EPA has published various regulations, affecting the operation of existing and new industrial facilities that emit carbon dioxide. As a result of the EPA’s decision to regulate greenhouse gases under the Clean Air Act, states will now have to consider them in permitting new or modified facilities.
Overall, it is reasonably likely that legislative and regulatory activity in this area will in some way affect Rayonier and the U.S. customers of our Southern Timber and Pacific Northwest Timber segments, but it is unclear at this time what the nature of the impact will be. We continue to monitor political and regulatory developments in this area, but their overall impact on Rayonier, from a cost, benefit and financial performance standpoint remains uncertain at this time. In addition, the EPA has yet to finalize the treatment of biomass under greenhouse gas regulatory schemes, leaving Rayonier’s biomass customers in a position of uncertainty.
REIT AND TAX-RELATED RISKS
Loss of our REIT status would adversely affect our cash flow and stock price.
We intend to continue to operate in accordance with REIT requirements pursuant to the Internal Revenue Code of 1986, as amended (the “Code”), and related U.S. Treasury regulations and administrative guidance. Qualification as a REIT involves the application of highly technical and complex provisions of the Code, which are subject to change, perhaps retroactively, and which are not within our control. We cannot assure that we will remain qualified as a REIT or that new legislation, U.S. Treasury regulations, administrative interpretations or court decisions will not significantly affect our ability to remain qualified as a REIT or the U.S. federal income tax consequences of such qualification.
We continually monitor and test our compliance with all REIT requirements. In particular, we regularly test our compliance with the REIT “asset tests,” which require generally that, at the close of each calendar quarter, (1) at least 75% of the market value of our total assets must consist of REIT-qualifying interests in real property (such as timberlands), including leaseholds and options to acquire real property and leaseholds, as well as cash and cash items and certain other specified assets, (2) no more than 25% of the market value of our total assets may consist of other assets that are not qualifying assets for purposes of the 75% test in clause (1) above and (3) for calendar years prior to 2018, no more than 25% of the market value of our total assets may consist of the securities of one or more “taxable REIT subsidiaries.”
If in any taxable year we fail to qualify as a REIT, we will not be allowed a deduction for dividends paid to shareholders in computing our taxable income and we will be subject to U.S. federal income tax on our REIT taxable income. In addition, we will be disqualified from qualification as a REIT for the four taxable years following the year during which the qualification was lost, unless we are entitled to relief under certain provisions of the Code. As a result, our net income and the cash available for distribution to our shareholders could be reduced for up to five years or longer, which could have a material adverse effect on our financial condition.
As of December 31, 2017, Rayonier is in compliance with the asset tests described above.
If we fail to remain qualified as a REIT, we may need to borrow funds or liquidate some investments or assets to pay any resulting additional tax liability. Accordingly, cash available for distribution to our shareholders would be reduced.
19
Certain of our business activities are potentially subject to prohibited transactions tax.
As a REIT, we will be subject to a 100% tax on any net income from “prohibited transactions.” In general, prohibited transactions are sales or other dispositions of property to customers in the ordinary course of business. Sales of logs, and dealer sales of timberlands or other real estate, constitute prohibited transactions.
We intend to avoid the 100% prohibited transactions tax by conducting activities that would otherwise be prohibited transactions through one or more taxable REIT subsidiaries. We may not, however, always be able to identify timberland properties that become part of our “dealer” real estate sales business. Therefore, if we sell timberlands which we incorrectly identify as property not held for sale to customers in the ordinary course of business or which subsequently become properties held for sale to customers in the ordinary course of business, we may be subject to the 100% prohibited transactions tax.
Our cash dividends are not guaranteed and may fluctuate.
Generally, REITs are required to distribute 90% of their ordinary taxable income, but not their net capital gains income. Accordingly, we do not generally believe that we are required to distribute material amounts of cash since substantially all of our taxable income is generally treated as capital gains income. However, a REIT must pay corporate level tax on its undistributed taxable income and capital gains.
Our Board of Directors, in its sole discretion, determines the amount of quarterly dividends to be paid to our shareholders based on consideration of a number of factors. These factors include, but are not limited to, our results of operations, cash flow and capital requirements, economic conditions, tax considerations, borrowing capacity and other factors, including debt covenant restrictions that may impose limitations on cash payments, future acquisitions and divestitures, harvest levels, changes in the price and demand for our products and general market demand for timberlands, including those timberland properties that have higher and better uses. Consequently, our dividend levels may fluctuate.
Lack of shareholder ownership and transfer restrictions in our articles of incorporation may affect our ability to qualify as a REIT.
In order to qualify as a REIT, an entity cannot have five or fewer individuals who own, directly or indirectly after applying attribution of ownership rules, 50% or more of the value of its outstanding shares during the last six months in each calendar year. Although it is not required by law or the REIT provisions of the Code, almost all REITs have adopted ownership and transfer restrictions in their articles of incorporation or organizational documents which seek to assure compliance with that rule. While we are not in violation of the ownership rules, we do not have, nor do we have any current plans to adopt, share ownership and transfer restrictions. As such, the possibility exists that five or fewer individuals could acquire 50% or more of the value of our outstanding shares, which could result in our disqualification as a REIT.
|
Item 1B.
|
UNRESOLVED STAFF COMMENTS
|
None.
20
|
Item 2.
|
PROPERTIES
|
The following table provides a breakdown of our timberland holdings as of
September 30, 2017
and
December 31, 2017
:
|
(acres in 000s)
|
As of September 30, 2017
|
As of December 31, 2017
|
|||||||||||||||
|
Owned
|
Leased
|
Total
|
Owned
|
Leased
|
Total
|
||||||||||||
|
Alabama
|
254
|
|
24
|
|
278
|
|
229
|
|
14
|
|
243
|
|
|||||
|
Arkansas
|
—
|
|
13
|
|
13
|
|
—
|
|
11
|
|
11
|
|
|||||
|
Florida
|
281
|
|
101
|
|
382
|
|
274
|
|
83
|
|
357
|
|
|||||
|
Georgia
|
618
|
|
104
|
|
722
|
|
622
|
|
82
|
|
704
|
|
|||||
|
Louisiana
|
144
|
|
1
|
|
145
|
|
144
|
|
1
|
|
145
|
|
|||||
|
Mississippi
|
67
|
|
—
|
|
67
|
|
67
|
|
—
|
|
67
|
|
|||||
|
Oklahoma
|
92
|
|
—
|
|
92
|
|
92
|
|
—
|
|
92
|
|
|||||
|
South Carolina
|
18
|
|
—
|
|
18
|
|
18
|
|
—
|
|
18
|
|
|||||
|
Tennessee
|
1
|
|
—
|
|
1
|
|
1
|
|
—
|
|
1
|
|
|||||
|
Texas
|
182
|
|
—
|
|
182
|
|
182
|
|
—
|
|
182
|
|
|||||
|
1,657
|
|
|
243
|
|
1,900
|
|
1,629
|
|
191
|
|
1,820
|
|
|||||
|
Pacific Northwest
|
|||||||||||||||||
|
Oregon
|
61
|
|
—
|
|
61
|
|
61
|
|
—
|
|
61
|
|
|||||
|
Washington
|
316
|
|
1
|
|
317
|
|
316
|
|
1
|
|
317
|
|
|||||
|
377
|
|
|
1
|
|
|
378
|
|
|
377
|
|
|
1
|
|
|
378
|
|
|
|
New Zealand (a)
|
179
|
|
250
|
|
429
|
|
179
|
|
231
|
|
410
|
|
|||||
|
Total
|
2,213
|
|
494
|
|
2,707
|
|
2,185
|
|
423
|
|
2,608
|
|
|||||
|
(a)
|
Represents legal acres owned and leased by the New Zealand JV, in which Rayonier owns a 77% interest. As of
December 31, 2017
, legal acres in New Zealand were comprised of
293,000
plantable acres and
117,000
non-productive acres.
|
21
The following tables detail activity for owned and leased acres in our timberland holdings by state from
December 31, 2016
to
December 31, 2017
:
|
(acres in 000s)
|
Acres Owned
|
|||||||||||||
|
December 31, 2016
|
Acquisitions
|
Sales
|
Other
|
December 31, 2017
|
||||||||||
|
Southern
|
||||||||||||||
|
Alabama
|
284
|
|
—
|
|
(55
|
)
|
—
|
|
229
|
|
||||
|
Florida
|
281
|
|
4
|
|
(11
|
)
|
—
|
|
274
|
|
||||
|
Georgia
|
554
|
|
68
|
|
—
|
|
—
|
|
622
|
|
||||
|
Louisiana
|
145
|
|
—
|
|
(1
|
)
|
—
|
|
144
|
|
||||
|
Mississippi
|
67
|
|
—
|
|
—
|
|
—
|
|
67
|
|
||||
|
Oklahoma
|
92
|
|
—
|
|
—
|
|
—
|
|
92
|
|
||||
|
South Carolina
|
—
|
|
18
|
|
—
|
|
—
|
|
18
|
|
||||
|
Tennessee
|
1
|
|
—
|
|
—
|
|
—
|
|
1
|
|
||||
|
Texas
|
187
|
|
—
|
|
(5
|
)
|
—
|
|
182
|
|
||||
|
1,611
|
|
90
|
|
(72
|
)
|
—
|
|
1,629
|
|
|||||
|
Pacific Northwest
|
||||||||||||||
|
Oregon
|
61
|
|
—
|
|
—
|
|
—
|
|
61
|
|
||||
|
Washington
|
316
|
|
—
|
|
—
|
|
—
|
|
316
|
|
||||
|
377
|
|
|
—
|
|
|
—
|
|
|
—
|
|
|
377
|
|
|
|
New Zealand (a)
|
179
|
|
—
|
|
—
|
|
—
|
|
179
|
|
||||
|
Total
|
2,167
|
|
90
|
|
(72
|
)
|
—
|
|
2,185
|
|
||||
|
(a)
|
Represents legal acres owned by the New Zealand JV, in which Rayonier has a 77% interest.
|
|
(acres in 000s)
|
Acres Leased
|
|||||||||||||
|
December 31, 2016
|
New Leases
|
Sold/Expired Leases (a)
|
Other (b)
|
December 31, 2017
|
||||||||||
|
Southern
|
||||||||||||||
|
Alabama
|
24
|
|
—
|
|
(10
|
)
|
—
|
|
14
|
|
||||
|
Arkansas
|
14
|
|
—
|
|
(3
|
)
|
—
|
|
11
|
|
||||
|
Florida
|
92
|
|
11
|
|
(20
|
)
|
—
|
|
83
|
|
||||
|
Georgia
|
107
|
|
—
|
|
(20
|
)
|
(5
|
)
|
82
|
|
||||
|
Louisiana
|
1
|
|
—
|
|
—
|
|
—
|
|
1
|
|
||||
|
238
|
|
11
|
|
(53
|
)
|
(5
|
)
|
191
|
|
|||||
|
Pacific Northwest
|
||||||||||||||
|
Washington
|
1
|
|
—
|
|
—
|
|
—
|
|
1
|
|
||||
|
|
||||||||||||||
|
New Zealand (c)
|
254
|
|
8
|
|
(31
|
)
|
—
|
|
231
|
|
||||
|
Total
|
493
|
|
19
|
|
(84
|
)
|
(5
|
)
|
423
|
|
||||
|
(a)
|
Includes acres previously under lease that have been harvested and activity for the relinquishment of leased acres.
|
|
(b)
|
Includes leased acres purchased by Rayonier and adjustments for land mapping reviews.
|
|
(c)
|
Represents legal acres leased by the New Zealand JV, in which Rayonier has a 77% interest.
|
22
TIMBERLAND LEASES
U.S. timberland leases typically have initial terms of approximately 30 to 65 years, with renewal provisions in some cases. New Zealand timberland lease terms typically range between 30 and 99 years. New Zealand lease arrangements are generally comprised of Crown Forest Licenses (“CFLs”), forestry rights and land leases. A CFL is a license arrangement with the New Zealand government to use public or government-owned land to operate a commercial forest. CFLs generally extend indefinitely and may only be terminated upon a 35-year termination notice from the government. If no termination notice is given, the CFLs renew automatically each year for a one-year term. Alternatively, some CFLs extend for a specific term. Once a CFL is terminated, the Company may be able to obtain a forestry right from the subsequent owner. A forestry right is a license arrangement with a private entity or native tribal group to use their lands to operate a commercial forest. Forestry rights terminate either upon the issuance of a termination notice, which can last 35 to 45 years, or completion of harvest.
As of
December 31, 2017
, the New Zealand JV has
three
CFLs comprising 10,000 acres under termination notice that are currently being relinquished as harvest activities are concluding, as well as two fixed-term CFLs comprising 3,000 acres expiring in 2062. Additionally, the New Zealand JV has two forestry rights comprising 33,000 acres under termination notice, terminating in 2028 and 2031.
The following table details the Company’s acres under lease as of
December 31, 2017
by type of lease and estimated lease expiration:
|
(acres in 000s)
|
|||||||||||||||||
|
Location
|
Type of Lease
|
Total
|
2018-2027
|
2028-2037
|
2038-2047
|
Thereafter
|
|||||||||||
|
Southern U.S.
|
Fixed Term
|
170
|
|
120
|
|
44
|
|
—
|
|
6
|
|
||||||
|
Fixed Term with Renewal Option
|
21
|
|
21
|
|
—
|
|
—
|
|
—
|
|
|||||||
|
Pacific Northwest
|
Fixed Term
|
1
|
|
1
|
|
—
|
|
—
|
|
—
|
|
||||||
|
New Zealand
|
CFL - Perpetual (a)
|
83
|
|
—
|
|
—
|
|
—
|
|
83
|
|
||||||
|
CFL - Fixed Term (a)
|
3
|
|
—
|
|
—
|
|
—
|
|
3
|
|
|||||||
|
CFL - Terminating (a)
|
10
|
|
—
|
|
—
|
|
9
|
|
1
|
|
|||||||
|
Forestry Right (a)
|
118
|
|
13
|
|
26
|
|
6
|
|
73
|
|
|||||||
|
Fixed Term Land Leases
|
17
|
|
—
|
|
1
|
|
—
|
|
16
|
|
|||||||
|
Total Acres under Long-term Leases
|
423
|
|
155
|
|
71
|
|
15
|
|
182
|
|
|||||||
|
(a)
|
Estimated lease expiration / termination based on the earlier of: (1) the scheduled expiration / termination date, or (2) the estimated year of final harvest before such expiration / termination date.
|
23
The following table details the Company’s estimated leased acres, lease expirations and lease costs over the next five years:
|
(acres and dollars in 000s, except per acre amounts)
|
||||||||||||||||||||||
|
Location
|
2018
|
2019
|
2020
|
2021
|
2022
|
|||||||||||||||||
|
Southern U.S.
|
||||||||||||||||||||||
|
Leased Acres Expiring
|
19
|
|
12
|
|
7
|
|
6
|
|
11
|
|
||||||||||||
|
Year-end Leased Acres
|
172
|
|
160
|
|
153
|
|
147
|
|
136
|
|
||||||||||||
|
Estimated Annual Lease Cost (a)
|
|
$5,323
|
|
|
$4,963
|
|
|
$4,714
|
|
|
$4,558
|
|
|
$4,534
|
|
|||||||
|
Average Lease Cost per Acre
|
|
$23.56
|
|
|
$24.83
|
|
|
$25.53
|
|
|
$24.89
|
|
|
$26.09
|
|
|||||||
|
Pacific Northwest (b)
|
||||||||||||||||||||||
|
Leased Acres Expiring
|
—
|
|
1
|
|
—
|
|
—
|
|
—
|
|
||||||||||||
|
Year-End Leased Acres
|
1
|
|
—
|
|
—
|
|
—
|
|
—
|
|
||||||||||||
|
New Zealand
|
||||||||||||||||||||||
|
Leased Acres Expiring
|
1
|
|
1
|
|
1
|
|
1
|
|
4
|
|
||||||||||||
|
Year-end Leased Acres
|
230
|
|
229
|
|
228
|
|
227
|
|
223
|
|
||||||||||||
|
Estimated Annual Lease Cost (a)(d)
|
|
$4,375
|
|
|
$4,339
|
|
|
$4,326
|
|
|
$4,308
|
|
|
$4,283
|
|
|||||||
|
Average Lease Cost per Acre (c)(d)
|
|
$25.09
|
|
|
$24.67
|
|
|
$24.67
|
|
|
$24.67
|
|
|
$25.43
|
|
|||||||
|
(a)
|
Represents capitalized and expensed lease payments.
|
|
(b)
|
The 659-acre lease in the Pacific Northwest expires in 2019 and does not require a lease payment.
|
|
(c)
|
Excludes lump sum payments.
|
|
(d)
|
Translated using the year-end foreign exchange rate.
|
OTHER NON-TIMBERLAND LEASES
In addition to our timberland holdings, we lease properties for certain office locations. Our significant leased properties include a regional office in Lufkin, Texas; our Pacific Northwest Timber offices in Hoquiam, Washington and our New Zealand Timber and Trading headquarters in Auckland, New Zealand.
|
Item 3.
|
LEGAL PROCEEDINGS
|
The information set forth under
Note 10 — Contingencies
is incorporated herein by reference.
|
Item 4.
|
MINE SAFETY DISCLOSURES
|
Not applicable.
24
|
Item 5.
|
MARKET FOR THE REGISTRANT’S COMMON EQUITY, RELATED STOCKHOLDER MATTERS AND ISSUER PURCHASES OF EQUITY SECURITIES
|
MARKET PRICES OF OUR COMMON SHARES; DIVIDENDS
The table below reflects, for the quarters indicated, the dividends declared per share and the highest and lowest intraday sales prices of our common shares as reported in the consolidated transaction reporting system of the NYSE, the only exchange on which our shares are listed, under the trading symbol
RYN
.
|
|
High
|
Low
|
Dividends
|
||||||||
|
2017
|
|||||||||||
|
Fourth Quarter
|
|
$31.91
|
|
|
$28.78
|
|
|
$0.25
|
|
||
|
Third Quarter
|
|
$29.75
|
|
|
$27.71
|
|
|
$0.25
|
|
||
|
Second Quarter
|
|
$29.47
|
|
|
$26.85
|
|
|
$0.25
|
|
||
|
First Quarter
|
|
$29.86
|
|
|
$26.54
|
|
|
$0.25
|
|
||
|
2016
|
|||||||||||
|
Fourth Quarter
|
|
$28.47
|
|
|
$25.24
|
|
|
$0.25
|
|
||
|
Third Quarter
|
|
$28.16
|
|
|
$25.50
|
|
|
$0.25
|
|
||
|
Second Quarter
|
|
$26.37
|
|
|
$24.01
|
|
|
$0.25
|
|
||
|
First Quarter
|
|
$24.80
|
|
|
$17.85
|
|
|
$0.25
|
|
||
The table below summarizes the tax characteristics of the dividend paid to shareholders on a percentage basis for the three years ended
December 31, 2017
:
|
|
2017
|
2016
|
2015
|
||||||||
|
Total cash dividend per common share
|
|
$1.00
|
|
|
$1.00
|
|
|
$1.00
|
|
||
|
Tax characteristics:
|
|||||||||||
|
Capital gain
|
100.00
|
%
|
100.00
|
%
|
90.47
|
%
|
|||||
|
Qualified
|
—
|
|
—
|
|
—
|
|
|||||
|
Non-dividend distribution
|
—
|
|
—
|
|
9.53
|
%
|
|||||
HOLDERS
There were approximately 5,970 shareholders of record of our Common Shares on February 16, 2018.
SECURITIES AUTHORIZED FOR ISSUANCE UNDER EQUITY COMPENSATION PLANS
See
Note 16 — Incentive Stock Plans
for information on securities that are authorized for issuance under The Rayonier Incentive Stock Plan (“the Stock Plan”).
SHELF REGISTRATIONS
In May 2004, we completed a Form S-4 acquisition shelf registration to offer and issue 7.0 million common shares for the acquisition of other businesses, assets or properties. As of
December 31, 2017
, no common shares have been offered or issued under the Form S-4 shelf registration. In April 2015, we filed a universal shelf registration giving us the ability to issue and sell an indeterminate amount of various types of debt and equity securities. In March 2017, 5.75 million common shares were offered and sold under the universal shelf registration to finance a portion of the company’s acquisition of approximately 95,100 acres of timberlands in Florida, Georgia and South Carolina. As of
December 31, 2017
, no other securities have been offered or issued under the universal shelf registration.
25
ISSUER REPURCHASES
In February 2016, the Board of Directors approved the repurchase of up to $100 million of Rayonier’s common shares (the “share repurchase program”) to be made at management’s and the Board of Directors’ discretion. The program has no time limit and may be suspended or discontinued at any time. There were no shares repurchased under this program in the fourth quarter of 2017. As of December 31, 2017, there was $99.3 million, or approximately 3,139,754 shares based on the period-end closing stock price of $31.63, remaining under the program.
In 1996, we began a Common Share repurchase program (the “anti-dilutive program”) to minimize the dilutive effect of our employee incentive stock plans on earnings per share. This program limits the number of shares that may be purchased each year to the greater of 1.5% of outstanding shares at the beginning of the year or the number of incentive shares issued to employees during the year. In October 2000, July 2003 and October 2011, our Board of Directors authorized the purchase of shares under the program totaling 2.1 million shares. The anti-dilutive program does not have an expiration date. There were no shares purchased under this program in the fourth quarter of 2017 and there were 3,778,625 shares available for purchase at
December 31, 2017
.
The following table provides information regarding our purchases of
Rayonier common stock during the quarter ended
December 31, 2017
:
|
Period
|
Total Number of Shares Purchased
(a)
|
Average Price Paid per Share
|
Total Number of Shares Purchased as Part of Publicly Announced Plans or Programs
|
Maximum Number of Shares that May Yet Be Purchased Under the Plans or Programs (b)
|
||||||||
|
October 1 to October 31
|
—
|
|
—
|
|
—
|
|
6,918,379
|
|||||
|
November 1 to November 30
|
—
|
|
—
|
|
—
|
|
6,918,379
|
|||||
|
December 1 to December 31
|
5,608
|
|
31.41
|
|
—
|
|
6,918,379
|
|||||
|
Total
|
5,608
|
|
—
|
|
6,918,379
|
|||||||
|
(a)
|
Includes 5,608 shares of the Company’s common stock purchased in December from employees in non-open market transactions. The shares of stock were sold by employees of the Company in exchange for cash that was used to pay withholding taxes associated with the vesting of restricted stock awards under the Company’s stock incentive plan. The price per share surrendered is based on the closing price of the company’s stock on the respective vesting dates of the awards.
|
|
(b)
|
Maximum number of shares authorized to be purchased as of
December 31, 2017
include 3,778,625 under the 1996 anti-dilutive program.
|
26
STOCK PERFORMANCE GRAPH
The following graph compares the performance of Rayonier’s Common Shares (assuming reinvestment of dividends) with a broad-based market index (Standard & Poor’s (“S&P”) 500), and two industry-specific indices (the S&P Global Timber and Forestry Index and the S&P 1500 Real Estate Index).
1
This graph has been adjusted to reflect the spin-off of the Performance Fibers business in 2014.
The table and related information shall not be deemed to be “filed” with the SEC, nor shall such information be incorporated by reference into any future filing under the Securities Act of 1933 or Securities Exchange Act of 1934, each as amended, except to the extent that the Company specifically incorporates it by reference into such filing.
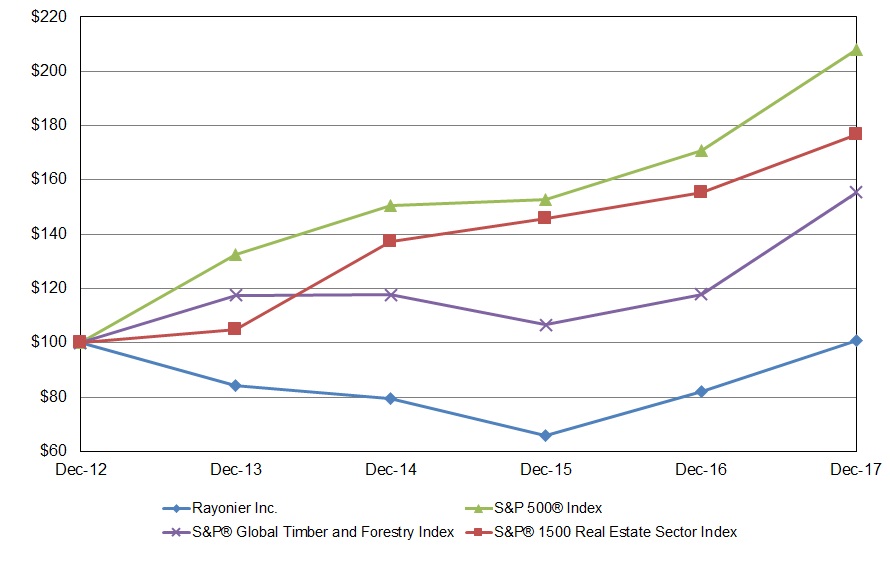
The data in the following table was used to create the above graph as of December 31:
|
|
2012
|
2013
|
2014
|
2015
|
2016
|
2017
|
|||||
|
Rayonier Inc.
|
$100
|
$84
|
$79
|
$66
|
$82
|
$101
|
|||||
|
S&P 500
®
Index
|
100
|
132
|
151
|
153
|
171
|
208
|
|||||
|
S&P
®
Global Timber and Forestry Index
|
100
|
117
|
118
|
107
|
118
|
155
|
|||||
|
S&P
®
1500 Real Estate Sector Index
1
|
100
|
105
|
137
|
146
|
155
|
177
|
|||||
1
Based on constituents as of December 31, 2017 and excludes entities that were not publicly traded for the entire comparative period.
27
|
Item 6.
|
SELECTED FINANCIAL DATA
|
The following financial data should be read in conjunction with our Consolidated Financial Statements.
|
|
At or For the Years Ended December 31,
|
||||||||||||||||||
|
|
2017
|
2016
|
2015
|
2014
|
2013
|
||||||||||||||
|
|
(dollar amounts in millions, except per share data)
|
||||||||||||||||||
|
Profitability:
|
|||||||||||||||||||
|
Sales (a)
|
|
$819.6
|
|
|
$815.9
|
|
|
$568.8
|
|
|
$624.0
|
|
|
$682.8
|
|
||||
|
Operating income (a)(b)
|
215.5
|
|
255.8
|
|
77.8
|
|
98.3
|
|
108.7
|
|
|||||||||
|
Income from continuing operations attributable to Rayonier Inc. (a)(b)
|
148.8
|
|
212.0
|
|
46.2
|
|
55.9
|
|
103.9
|
|
|||||||||
|
Diluted earnings per common share from continuing operations
|
1.16
|
|
1.73
|
|
0.37
|
|
0.43
|
|
0.80
|
|
|||||||||
|
Financial Condition:
|
|||||||||||||||||||
|
Total assets (a)
|
|
$2,858.5
|
|
|
$2,685.8
|
|
|
$2,315.9
|
|
|
$2,449.9
|
|
|
$3,680.1
|
|
||||
|
Total debt (a)
|
1,025.4
|
|
1,061.9
|
|
830.6
|
|
748.3
|
|
1,568.8
|
|
|||||||||
|
Shareholders’ equity
|
1,693.0
|
|
1,496.9
|
|
1,361.7
|
|
1,575.2
|
|
1,755.2
|
|
|||||||||
|
Shareholders’ equity — per share
|
13.13
|
|
12.18
|
|
11.09
|
|
12.51
|
|
13.90
|
|
|||||||||
|
Cash Flows:
|
|||||||||||||||||||
|
Cash provided by operating activities
|
|
$256.3
|
|
|
$203.8
|
|
|
$177.2
|
|
|
$320.4
|
|
|
$546.8
|
|
||||
|
Cash used for investing activities
|
223.2
|
|
283.2
|
|
166.3
|
|
196.7
|
|
470.5
|
|
|||||||||
|
Cash used for (provided by) for financing activities
|
6.9
|
|
(114.4
|
)
|
116.5
|
|
161.4
|
|
157.1
|
|
|||||||||
|
Depreciation, depletion and amortization
|
127.6
|
|
115.1
|
|
113.7
|
|
120.0
|
|
116.9
|
|
|||||||||
|
Cash dividends paid
|
127.1
|
|
122.8
|
|
124.9
|
|
257.5
|
|
237.0
|
|
|||||||||
|
Dividends paid — per share
|
|
$1.00
|
|
|
$1.00
|
|
|
$1.00
|
|
|
$2.03
|
|
|
$1.86
|
|
||||
|
Non-GAAP Financial Measures:
|
|||||||||||||||||||
|
Adjusted EBITDA (c)
|
|||||||||||||||||||
|
Southern Timber
|
|
$91.6
|
|
|
$92.9
|
|
|
$101.0
|
|
|
$97.9
|
|
|
$87.2
|
|
||||
|
Pacific Northwest Timber
|
33.1
|
|
21.2
|
|
21.7
|
|
50.8
|
|
54.1
|
|
|||||||||
|
New Zealand Timber
|
109.0
|
|
58.3
|
|
33.0
|
|
46.0
|
|
38.3
|
|
|||||||||
|
Real Estate
|
71.6
|
|
84.7
|
|
70.8
|
|
48.4
|
|
57.8
|
|
|||||||||
|
Trading
|
4.6
|
|
2.0
|
|
1.2
|
|
1.7
|
|
1.8
|
|
|||||||||
|
Corporate and other
|
(19.4
|
)
|
(19.4
|
)
|
(19.7
|
)
|
(31.3
|
)
|
(45.3
|
)
|
|||||||||
|
Total Adjusted EBITDA (c)
|
|
$290.5
|
|
|
$239.7
|
|
|
$208.0
|
|
|
$213.5
|
|
|
$193.9
|
|
||||
|
Other:
|
|||||||||||||||||||
|
Timberland and real estate acres — owned, leased, or managed, in millions of acres
|
2.6
|
|
2.7
|
|
2.7
|
|
2.7
|
|
2.7
|
|
|||||||||
28
|
|
For the Years Ended December 31,
|
|||||||||||||
|
|
2017
|
2016
|
2015
|
2014
|
2013
|
|||||||||
|
Selected Operating Data:
|
||||||||||||||
|
Timber
|
||||||||||||||
|
Sales volume (thousands of tons)
|
||||||||||||||
|
Southern
|
5,314
|
|
5,317
|
|
5,492
|
|
5,296
|
|
5,292
|
|
||||
|
Pacific Northwest (d)
|
1,247
|
|
1,195
|
|
1,243
|
|
1,664
|
|
1,979
|
|
||||
|
New Zealand Domestic (e)
|
1,300
|
|
1,204
|
|
1,346
|
|
1,462
|
|
1,271
|
|
||||
|
New Zealand Export (e)
|
1,239
|
|
1,017
|
|
1,065
|
|
898
|
|
651
|
|
||||
|
Total Sales Volume
|
9,100
|
|
8,733
|
|
9,146
|
|
9,320
|
|
9,193
|
|
||||
|
Real Estate — acres sold
|
||||||||||||||
|
Improved Development
|
23
|
|
47
|
|
74
|
|
—
|
|
45
|
|
||||
|
Unimproved Development
|
1,449
|
|
206
|
|
699
|
|
852
|
|
281
|
|
||||
|
Rural
|
6,344
|
|
6,684
|
|
8,754
|
|
18,077
|
|
13,833
|
|
||||
|
Non-Strategic / Timberlands
|
16,007
|
|
28,743
|
|
23,602
|
|
6,363
|
|
13,360
|
|
||||
|
Large Dispositions (f)(g)
|
49,599
|
|
92,434
|
|
—
|
|
19,556
|
|
149,428
|
|
||||
|
Total Acres Sold
|
73,422
|
|
128,114
|
|
33,129
|
|
44,848
|
|
176,947
|
|
||||
|
(a)
|
In April 2013, the Company increased its interest in the New Zealand JV to 65% and began consolidating the New Zealand JV's results of operations and balance sheet.
|
|
(b)
|
The 2017, 2016 and 2014 results included
$67.0 million
,
$143.9 million
and
$21.4 million
, respectively, related to Large Dispositions. The 2013 results included a
$16.2 million
gain related to the consolidation of the New Zealand JV and
$25.7 million
related to Large Dispositions.
|
|
(c)
|
Adjusted EBITDA is a non-GAAP financial measure and is defined as earnings before interest, taxes, depreciation, depletion, amortization, the non-cash cost of land and real estate sold, costs related to shareholder litigation, gain on foreign currency derivatives, costs related to the spin-off of the Performance Fibers business, internal review and restatement costs, Large Dispositions, discontinued operations, and the gain related to the consolidation of the New Zealand joint venture. A reconciliation of Adjusted EBITDA to Operating Income (Loss) and Net Income, respectively, is included in the following pages and
Item 7 — Performance and Liquidity Indicators
.
|
|
(d)
|
2013 results include sales volumes from New York timberlands.
|
|
(e)
|
New Zealand sales volume for 2013 includes volumes sold subsequent to the April 2013 consolidation.
|
|
(f)
|
Large Dispositions are defined as transactions involving the sale of timberland that exceed $20 million in size and do not have a demonstrable premium relative to timberland value. Sales designated as Large Dispositions are excluded from our calculation of Adjusted EBITDA and CAD.
|
|
(g)
|
The 2013 results included a fourth quarter sale of approximately 128,000 acres of New York timberlands.
|
29
Reconciliation of Operating Income (Loss) by Segment to Adjusted EBITDA by Segment
(dollars in millions)
|
|
|
Southern Timber
|
Pacific Northwest Timber
|
New Zealand Timber
|
Real Estate
|
Trading
|
Corporate
and
other
|
Total
|
||||||||||||||||||||
|
2017
|
||||||||||||||||||||||||||||
|
Operating income
|
|
$42.2
|
|
|
$1.1
|
|
|
$72.5
|
|
|
$116.0
|
|
|
$4.6
|
|
|
($20.9
|
)
|
|
$215.5
|
|
|||||||
|
Add:
|
Depreciation, depletion and amortization
|
49.4
|
|
32.0
|
|
36.4
|
|
9.0
|
|
—
|
|
0.8
|
|
127.6
|
|
|||||||||||||
|
Add:
|
Non-cash cost of land and improved development
|
—
|
|
—
|
|
0.1
|
|
13.6
|
|
—
|
|
—
|
|
13.7
|
|
|||||||||||||
|
Add:
|
Costs related to shareholder litigation (a)
|
—
|
|
—
|
|
—
|
|
—
|
|
—
|
|
0.7
|
|
0.7
|
|
|||||||||||||
|
Less:
|
Large Dispositions
|
—
|
|
—
|
|
—
|
|
(67.0
|
)
|
—
|
|
—
|
|
(67.0
|
)
|
|||||||||||||
|
Adjusted EBITDA
|
|
$91.6
|
|
|
$33.1
|
|
|
$109.0
|
|
|
$71.6
|
|
|
$4.6
|
|
|
($19.4
|
)
|
|
$290.5
|
|
|||||||
|
2016
|
||||||||||||||||||||||||||||
|
Operating income (loss)
|
|
$43.1
|
|
|
($4.0
|
)
|
|
$33.1
|
|
|
$202.4
|
|
|
$2.0
|
|
|
($20.8
|
)
|
|
$255.8
|
|
|||||||
|
Add:
|
Depreciation, depletion and amortization
|
49.8
|
|
25.2
|
|
23.4
|
|
16.3
|
|
—
|
|
0.4
|
|
115.1
|
|
|||||||||||||
|
Add:
|
Non-cash cost of land and improved development
|
—
|
|
—
|
|
1.8
|
|
9.9
|
|
—
|
|
—
|
|
11.7
|
|
|||||||||||||
|
Add:
|
Costs related to shareholder litigation (a)
|
—
|
|
—
|
|
—
|
|
—
|
|
—
|
|
2.2
|
|
2.2
|
|
|||||||||||||
|
Add:
|
Gain on foreign currency derivatives (b)
|
—
|
|
—
|
|
—
|
|
—
|
|
—
|
|
(1.2
|
)
|
(1.2
|
)
|
|||||||||||||
|
Less:
|
Large Dispositions
|
—
|
|
—
|
|
—
|
|
(143.9
|
)
|
—
|
|
—
|
|
(143.9
|
)
|
|||||||||||||
|
Adjusted EBITDA
|
|
$92.9
|
|
|
$21.2
|
|
|
$58.3
|
|
|
$84.7
|
|
|
$2.0
|
|
|
($19.4
|
)
|
|
$239.7
|
|
|||||||
|
2015
|
||||||||||||||||||||||||||||
|
Operating income
|
|
$46.7
|
|
|
$6.9
|
|
|
$2.8
|
|
|
$44.3
|
|
|
$1.2
|
|
|
($24.1
|
)
|
|
$77.8
|
|
|||||||
|
Less:
|
Non-operating expense
|
—
|
|
—
|
|
—
|
|
—
|
|
—
|
|
(0.1
|
)
|
(0.1
|
)
|
|||||||||||||
|
Add:
|
Depreciation, depletion and amortization
|
54.3
|
|
14.8
|
|
29.7
|
|
14.5
|
|
—
|
|
0.4
|
|
113.7
|
|
|||||||||||||
|
Add:
|
Non-cash cost of land and improved development
|
—
|
|
—
|
|
0.5
|
|
12.0
|
|
—
|
|
—
|
|
12.5
|
|
|||||||||||||
|
Less:
|
Costs related to shareholder litigation (a)
|
—
|
|
—
|
|
—
|
|
—
|
|
—
|
|
4.1
|
|
4.1
|
|
|||||||||||||
|
Adjusted EBITDA
|
|
$101.0
|
|
|
$21.7
|
|
|
$33.0
|
|
|
$70.8
|
|
|
$1.2
|
|
|
($19.7
|
)
|
|
$208.0
|
|
|||||||
|
2014
|
||||||||||||||||||||||||||||
|
Operating income
|
|
$45.7
|
|
|
$29.5
|
|
|
$9.5
|
|
|
$47.5
|
|
|
$1.7
|
|
|
($35.6
|
)
|
|
$98.3
|
|
|||||||
|
Add:
|
Depreciation, depletion and amortization
|
52.2
|
|
21.3
|
|
32.2
|
|
13.4
|
|
—
|
|
0.9
|
|
120.0
|
|
|||||||||||||
|
Add:
|
Non-cash cost of land and improved development
|
—
|
|
—
|
|
4.3
|
|
8.9
|
|
—
|
|
—
|
|
13.2
|
|
|||||||||||||
|
Less:
|
Large Dispositions
|
—
|
|
—
|
|
—
|
|
(21.4
|
)
|
—
|
|
—
|
|
(21.4
|
)
|
|||||||||||||
|
Less:
|
Internal review and restatement costs
|
—
|
|
—
|
|
—
|
|
—
|
|
—
|
|
3.4
|
|
3.4
|
|
|||||||||||||
|
Adjusted EBITDA
|
|
$97.9
|
|
|
$50.8
|
|
|
$46.0
|
|
|
$48.4
|
|
|
$1.7
|
|
|
($31.3
|
)
|
|
$213.5
|
|
|||||||
|
2013
|
||||||||||||||||||||||||||||
|
Operating income
|
|
$37.8
|
|
|
$32.7
|
|
|
$10.6
|
|
|
$55.9
|
|
|
$1.8
|
|
|
($30.1
|
)
|
|
$108.7
|
|
|||||||
|
Add:
|
Depreciation, depletion and amortization
|
49.4
|
|
21.4
|
|
27.7
|
|
17.4
|
|
—
|
|
1.0
|
|
116.9
|
|
|||||||||||||
|
Add:
|
Non-cash cost of land and improved development
|
—
|
|
—
|
|
—
|
|
10.2
|
|
—
|
|
—
|
|
10.2
|
|
|||||||||||||
|
Less:
|
Large Dispositions
|
—
|
|
—
|
|
—
|
|
(25.7
|
)
|
—
|
|
—
|
|
(25.7
|
)
|
|||||||||||||
|
Less:
|
Gain related to consolidation of New Zealand JV
|
—
|
|
—
|
|
—
|
|
—
|
|
—
|
|
(16.2
|
)
|
(16.2
|
)
|
|||||||||||||
|
Adjusted EBITDA
|
|
$87.2
|
|
|
$54.1
|
|
|
$38.3
|
|
|
$57.8
|
|
|
$1.8
|
|
|
($45.3
|
)
|
|
$193.9
|
|
|||||||
|
|
||||
|
(a)
|
Costs related to shareholder litigation include expenses incurred as a result of the securities litigation and the shareholder derivative demands. See
Note 10 — Contingencies
. In addition, these costs include the costs associated with the Company’s response to a subpoena it received from the SEC in November 2014. In July 2016, the Division of Enforcement of the SEC notified the Company that it had concluded its investigation into the Company.
|
|
(b)
|
The Company used foreign exchange derivatives to mitigate the risk of fluctuations in foreign exchange rates while awaiting the planned capital contribution to the New Zealand JV.
|
30
|
Item 7.
|
MANAGEMENT’S DISCUSSION AND ANALYSIS OF FINANCIAL CONDITION AND RESULTS OF OPERATIONS
|
EXECUTIVE SUMMARY
OUR COMPANY
We are a leading timberland real estate investment trust (“REIT”) with assets located in some of the most productive softwood timber growing regions in the U.S. and New Zealand. Our revenues, operating income and cash flows are primarily derived from the following core business segments: Southern Timber, Pacific Northwest Timber, New Zealand Timber, Real Estate and Trading. We own or lease under long-term agreements approximately 2.2 million acres of timberland and real estate in Alabama, Arkansas, Florida, Georgia, Louisiana, Mississippi, Oklahoma, Oregon, South Carolina, Tennessee, Texas and Washington. We also have a 77% ownership interest in Matariki Forestry Group, a joint venture (“New Zealand JV”), that owns or leases approximately
410,000
gross acres (
293,000
net plantable acres) of timberlands in New Zealand.
Across our timberland management segments, we sell standing timber (primarily at auction to third parties) and delivered logs. Sales from our timber segments include all activities related to the harvesting of timber and other value-added activities such as the licensing of properties for hunting and the leasing of properties for mineral extraction and cell towers. We believe we are the second largest publicly-traded timberland REIT and the sixth largest private landowner in the United States. Our Real Estate business manages all property sales and seeks to maximize the value of our properties that are more valuable for development, recreational or residential uses than for growing timber, and opportunistically sells non-strategic timberlands. Our Trading segment, also part of the New Zealand JV, markets and sells timber owned or acquired from third parties in New Zealand and Australia.
CURRENT YEAR DEVELOPMENTS
In January 2017, we closed on the disposition of approximately 25,000 acres located in Alabama for a sale price of approximately $42 million. This was the last closing of a phased disposition totaling 62,000 acres that was announced in the previous year. This transaction was characterized as a Large Disposition.
In March 2017, we entered into an Underwriting Agreement in connection with the public offering and sale of 5,000,000 shares of the Company’s common stock, no par value, at a price to the public of $27.75 per share. As a component of the Offering, we granted the Underwriters a 30-day option to purchase up to an additional 750,000 common shares to cover over-allotments. This option was exercised resulting in a total increase in common shares outstanding of 5,750,000. Proceeds from the March 2017 equity offering amounted to $152.4 million, net of costs, and were used to finance a portion of the Company’s acquisition of approximately 95,100 acres of timberlands in Florida, Georgia and South Carolina.
In December 2017, we closed on a second Large Disposition of approximately 25,000 acres located in Alabama for a sale price of approximately $53.4 million.
In summary, during 2017, we completed Large Dispositions of
50
,000 acres for
$95.4 million
and acquired approximately
109,000
acres of timberlands for
$242.9 million
. For additional information on acquisitions, see
Note 3 — Timberland Acquisitions
.
INDUSTRY AND MARKET CONDITIONS
In 2017, pricing in the U.S. South was negatively impacted by lower demand in the Gulf states and further hampered by fire and hurricane salvage along the east coast in the second half of the year. We anticipate pricing to improve modestly in certain geographical areas of the U.S. South; however, we expect overall pricing to remain relatively flat in the near-term. Improving export and domestic markets drove increases in delivered sawtimber pricing in the Pacific Northwest, while export and domestic sawtimber pricing in New Zealand improved primarily due to strong demand from China as well as strong local demand.
In Real Estate, we expect steady demand for rural properties and a strengthening interest in selected development properties, particularly within Wildlight, our East Nassau mixed-use development project.
31
CRITICAL ACCOUNTING POLICIES AND USE OF ESTIMATES
The preparation of financial statements requires us to establish accounting policies and make estimates, assumptions and judgments that affect our assets, liabilities, revenues and expenses, and to disclose contingent assets and liabilities in our Annual Report on Form 10-K. We base these estimates and assumptions on historical data and trends, current fact patterns, expectations and other sources of information we believe are reasonable. Actual results may differ from these estimates.
CAPITALIZED COSTS INCLUDED IN TIMBER BASIS
Timber is stated at the lower of cost or market value. Costs relating to acquiring, planting and growing timber including real estate taxes, site preparation and direct support costs relating to facilities, vehicles and supplies are capitalized. Annual lease payments are allocated between capital and expense based on the proportion of acres that the Company will be able to harvest prior to lease expiration. Lease payments made within one year of expiration are expensed as incurred. Payroll costs are capitalized for time spent on timber growing activities, while interest or any other intangible costs are not capitalized.
MERCHANTABLE INVENTORY AND DEPLETION COSTS AS DETERMINED BY TIMBER HARVEST MODELS
An annual depletion rate is established for each particular region by dividing the cost of merchantable inventory (including costs described above) by standing merchantable inventory volume. Pre-merchantable records are maintained for each planted year age class, recording acres planted, stems per acre and costs of planting and tending.
Significant assumptions and estimates are used in the recording of timber inventory and depletion costs. Factors that can impact timber volume include weather changes, losses due to natural causes, differences in actual versus estimated growth rates and changes in the age when timber is considered merchantable. A 3% company-wide change in estimated standing merchantable inventory would cause an estimated change of approximately $3.2 million to 2017 depletion expense.
Merchantable standing timber inventory is estimated by our land information services group annually, using industry-standard computer software. The inventory calculation takes into account growth, in-growth (annual transfer of oldest pre-merchantable age class into merchantable inventory), timberland sales and the annual harvest specific to each business unit. The age at which timber is considered merchantable is reviewed periodically and updated for changing harvest practices, future harvest age profiles and biological growth factors.
Acquisitions of timberland can also affect the depletion rate. Upon the acquisition of timberland, we make a determination whether to combine the newly-acquired merchantable timber with an existing depletion pool or to create a new pool. The determination is based on the geographic location of the new timber, the customers/markets that will be served and species mix. During
2017
, we acquired
109,000
acres of timberlands in Florida, Georgia, South Carolina, Washington and New Zealand. These acquisitions increased
2017
depletion expense by $5.1 million and are expected to increase 2018 depletion expense by approximately $13.5 million.
REVENUE RECOGNITION FOR TIMBER SALES
Revenue from the sale of timber is recognized when title passes to the buyer. We utilize two primary methods or sales channels for the sale of timber: a stumpage or standing timber model and a delivered log model. The sales method the Company employs depends upon local market conditions and which method management believes will provide the best overall margins. Under the stumpage model, standing timber is sold generally under pay-as-cut contracts, with specified duration (typically one year or less) and fixed prices, whereby revenue is recognized as timber is severed and the sales volume is determined. We also sell stumpage under lump-sum contracts for specified parcels where the Company receives cash for the full agreed value of the timber prior to harvest and title and risk of loss pass to the buyer upon signing the contract. The Company retains interest in the land, slash products, and the use of the land for recreational and other purposes. Any uncut timber remaining at the end of the contract period reverts to the Company. We recognize revenue for lump-sum timber sales when payment is received, the contract is signed and title and risk of loss pass to the buyer. A third type of stumpage sale is an agreed-volume sale whereby revenue is recognized as periodic physical observations are made of the percentage of acreage harvested.
32
Under the delivered log model, the Company hires third-party loggers and haulers to harvest timber and deliver it to a buyer. Sales of domestic logs generally do not require an initial payment and are made to third-party customers on open credit terms. Sales of export logs generally require a letter of credit from an approved bank. Revenue is recognized when the logs are delivered and title and risk of loss transfer to the buyer.
For domestic log sales, title and risk are considered passed to the buyer as the logs are delivered to the customer. For export log sales (primarily in New Zealand), title and risk are considered passed to the buyer at the time the ship leaves the port.
In the Trading business, revenue is recognized and title and risk of loss transfer similar to the delivered log model.
Non-timber income is primarily comprised of hunting and recreational licenses. Such income and costs are recognized ratably over the term of the agreement and included in “Sales” and “Cost of Sales”, respectively.
REVENUE RECOGNITION FOR REAL ESTATE SALES
The Company generally recognizes revenue on sales of real estate using the full accrual method at closing when cash has been received, the sale has closed, title and risk of loss have passed to the buyer and there is no continuing involvement with the property. Revenue is recognized using the percentage-of-completion method on sales of real estate containing future performance obligations. Cost of sales associated with real estate sold includes the cost of the land, the cost of any timber on the property that was conveyed to the buyer, any real estate development costs and any closing costs including sales commissions that may be borne by the Company. Costs incurred to obtain land use entitlements or for infrastructure such as utilities, roads or other improvements are charged to cost of sales for a project as a percentage of revenue earned to total anticipated revenue and costs for each project.
When developed residential or commercial land is sold, the cost of sales includes actual costs incurred and estimates of future development costs benefiting the property sold through completion. Costs are allocated to each sold unit or lot based upon the relative sales value. For purposes of allocating development costs, estimates of future revenues and development costs are re-evaluated periodically throughout the year, with adjustments being allocated prospectively to the remaining units available for sale.
DETERMINING THE ADEQUACY OF PENSION AND OTHER POSTRETIREMENT BENEFIT ASSETS AND LIABILITIES
We have one qualified non-contributory defined benefit pension plan covering a portion of our employees and an unfunded plan that provides benefits in excess of amounts allowable under current tax law in the qualified plan. The qualified and unfunded plans are closed to new participants.
In
2017
, we recognized no pension and postretirement expense due to the expected return on plan assets offsetting interest costs and amortization of losses (gains). Numerous estimates and assumptions are required to determine the proper amount of pension and postretirement liabilities and annual expense to record in our financial statements. The key assumptions include discount rate, return on assets, health care cost trends, mortality rates and longevity of employees. Although there is authoritative guidance on how to select most of the assumptions, some degree of judgment is exercised in selecting these assumptions. Different assumptions, as well as actual versus expected results, would change the periodic benefit cost and funded status of the benefit plans recognized in the financial statements. Effective December 31, 2016, the Company froze benefits for all employees participating in the pension plans. See
Note 15 — Employee Benefit Plans
for additional information.
REALIZABILITY OF BOTH RECORDED AND UNRECORDED TAX ASSETS AND TAX LIABILITIES
The Timber and Real Estate operations conducted within our REIT are generally not subject to U.S. income taxation. We expect any variability in our effective tax rate and the amount of cash taxes to be paid to be driven by our New Zealand Timber and Trading segments as our other business operations are conducted within our U.S. REIT subsidiaries. However, the assessment of the ability to realize certain deferred tax assets, or estimate deferred tax liabilities, remains subjective
.
See
Note 9 — Income Taxes
for additional information about our unrecognized tax benefits.
33
Summary of our results of operations for the three years ended
December 31
:
|
Financial Information (in millions)
|
2017
|
2016
|
2015
|
||||||||
|
Sales
|
|||||||||||
|
Southern Timber
|
|
$144.5
|
|
|
$151.2
|
|
|
$157.8
|
|
||
|
Pacific Northwest Timber
|
91.9
|
|
77.8
|
|
80.2
|
|
|||||
|
New Zealand Timber
|
247.6
|
|
177.8
|
|
162.8
|
|
|||||
|
Real Estate
|
|||||||||||
|
Improved Development
|
6.3
|
|
1.7
|
|
2.6
|
|
|||||
|
Unimproved Development
|
16.4
|
|
5.5
|
|
6.4
|
|
|||||
|
Rural
|
18.6
|
|
18.8
|
|
22.7
|
|
|||||
|
Non-Strategic / Timberlands
|
46.3
|
|
66.1
|
|
54.8
|
|
|||||
|
Large Dispositions
|
95.4
|
|
207.3
|
|
—
|
|
|||||
|
Total Real Estate
|
183.0
|
|
299.4
|
|
86.5
|
|
|||||
|
Trading
|
152.6
|
|
109.7
|
|
81.5
|
|
|||||
|
Total Sales
|
|
$819.6
|
|
|
$815.9
|
|
|
$568.8
|
|
||
|
Operating Income
|
|||||||||||
|
Southern Timber
|
|
$42.2
|
|
|
$43.1
|
|
|
$46.7
|
|
||
|
Pacific Northwest Timber
|
1.1
|
|
(4.0
|
)
|
6.9
|
|
|||||
|
New Zealand Timber
|
72.5
|
|
33.1
|
|
2.8
|
|
|||||
|
Real Estate (a)
|
116.0
|
|
202.4
|
|
44.3
|
|
|||||
|
Trading
|
4.6
|
|
2.0
|
|
1.2
|
|
|||||
|
Corporate and other
|
(20.9
|
)
|
(20.8
|
)
|
(24.1
|
)
|
|||||
|
Operating Income
|
215.5
|
|
255.8
|
|
77.8
|
|
|||||
|
Interest Expense
|
(34.1
|
)
|
(32.2
|
)
|
(31.7
|
)
|
|||||
|
Interest/Other Income (Expense)
|
1.9
|
|
(0.8
|
)
|
(3.0
|
)
|
|||||
|
Income Tax (Expense) Benefit
|
(21.8
|
)
|
(5.0
|
)
|
0.8
|
|
|||||
|
Net Income (a)
|
161.5
|
|
217.8
|
|
43.9
|
|
|||||
|
Less: Net Income (Loss) Attributable to Noncontrolling Interest
|
12.7
|
|
5.8
|
|
(2.3
|
)
|
|||||
|
Net Income Attributable to Rayonier Inc. (a)
|
|
$148.8
|
|
|
$212.0
|
|
|
$46.2
|
|
||
|
Adjusted EBITDA (b)
|
|||||||||||
|
Southern Timber
|
|
$91.6
|
|
|
$92.9
|
|
|
$101.0
|
|
||
|
Pacific Northwest Timber
|
33.1
|
|
21.2
|
|
21.7
|
|
|||||
|
New Zealand Timber
|
109.0
|
|
58.3
|
|
33.0
|
|
|||||
|
Real Estate
|
71.6
|
|
84.7
|
|
70.8
|
|
|||||
|
Trading
|
4.6
|
|
2.0
|
|
1.2
|
|
|||||
|
Corporate and other
|
(19.4
|
)
|
(19.4
|
)
|
(19.7
|
)
|
|||||
|
Total Adjusted EBITDA (b)
|
|
$290.5
|
|
|
$239.7
|
|
|
$208.0
|
|
||
|
(a)
|
The 2017 and 2016 results included
$67.0 million
and
$143.9 million
related to Large Dispositions, respectively.
|
|
(b)
|
Adjusted EBITDA is a non-GAAP measure defined and reconciled at
Item 6 — Selected Financial Data
.
|
34
|
Southern Timber Overview
|
2017
|
2016
|
2015
|
||||||||
|
Sales Volume (in thousands of tons)
|
|||||||||||
|
Pine Pulpwood
|
3,103
|
|
3,376
|
|
3,614
|
|
|||||
|
Pine Sawtimber
|
1,933
|
|
1,587
|
|
1,581
|
|
|||||
|
Total Pine Volume
|
5,036
|
|
4,963
|
|
5,195
|
|
|||||
|
Hardwood
|
278
|
|
354
|
|
297
|
|
|||||
|
Total Volume
|
5,314
|
|
5,317
|
|
5,492
|
|
|||||
|
Percentage Delivered Sales
|
22
|
%
|
27
|
%
|
27
|
%
|
|||||
|
Percentage Stumpage Sales
|
78
|
%
|
73
|
%
|
73
|
%
|
|||||
|
Net Stumpage Prices (dollars per ton)
|
|||||||||||
|
Pine Pulpwood
|
|
$16.14
|
|
|
$17.76
|
|
|
$18.13
|
|
||
|
Pine Sawtimber
|
25.64
|
|
26.76
|
|
27.62
|
|
|||||
|
Weighted Average Pine
|
|
$19.79
|
|
|
$20.64
|
|
|
$21.01
|
|
||
|
Hardwood
|
12.58
|
|
13.91
|
|
14.65
|
|
|||||
|
Weighted Average Total
|
|
$19.41
|
|
|
$20.18
|
|
|
$20.66
|
|
||
|
Summary Financial Data (in millions of dollars)
|
|||||||||||
|
Sales
|
|
$122.6
|
|
|
$132.9
|
|
|
$139.1
|
|
||
|
Less: Cut and Haul
|
(19.5
|
)
|
(25.6
|
)
|
(25.7
|
)
|
|||||
|
Net Stumpage Sales
|
|
$103.1
|
|
|
$107.3
|
|
|
$113.4
|
|
||
|
Non-Timber Sales
|
|
$21.9
|
|
|
$18.3
|
|
|
$18.7
|
|
||
|
Total Sales
|
|
$144.5
|
|
|
$151.2
|
|
|
$157.8
|
|
||
|
Operating Income
|
|
$42.2
|
|
|
$43.1
|
|
|
$46.7
|
|
||
|
(+) Depreciation, depletion and amortization
|
49.4
|
|
49.8
|
|
54.3
|
|
|||||
|
Adjusted EBITDA (a)
|
|
$91.6
|
|
|
$92.9
|
|
|
$101.0
|
|
||
|
Other Data
|
|||||||||||
|
Year-End Acres (in thousands)
|
1,820
|
|
1,849
|
|
1,876
|
|
|||||
|
(a)
|
Adjusted EBITDA is a non-GAAP measure defined and reconciled at
Item 6 — Selected Financial Data
.
|
35
|
Pacific Northwest Timber Overview
|
2017
|
2016
|
2015
|
||||||||
|
Sales Volume (in thousands of tons)
|
|||||||||||
|
Pulpwood
|
276
|
|
319
|
|
308
|
|
|||||
|
Sawtimber
|
971
|
|
876
|
|
935
|
|
|||||
|
Total Volume
|
1,247
|
|
1,195
|
|
1,243
|
|
|||||
|
Sales Volume (converted to MBF)
|
|||||||||||
|
Pulpwood
|
25,973
|
|
30,200
|
|
29,208
|
|
|||||
|
Sawtimber
|
125,577
|
|
114,091
|
|
120,932
|
|
|||||
|
Total Volume
|
151,550
|
|
144,291
|
|
150,140
|
|
|||||
|
Percentage Delivered Sales
|
83
|
%
|
91
|
%
|
88
|
%
|
|||||
|
Percentage Sawtimber Sales
|
78
|
%
|
73
|
%
|
75
|
%
|
|||||
|
Delivered Log Prices (in dollars per ton)
|
|||||||||||
|
Pulpwood
|
|
$40.62
|
|
|
$41.97
|
|
|
$44.61
|
|
||
|
Sawtimber
|
84.55
|
|
73.44
|
|
72.13
|
|
|||||
|
Weighted Average Log Price
|
|
$73.89
|
|
|
$64.68
|
|
|
$64.83
|
|
||
|
Summary Financial Data (in millions of dollars)
|
|||||||||||
|
Sales
|
|
$88.7
|
|
|
$75.2
|
|
|
$76.5
|
|
||
|
Less: Cut and Haul
|
(36.7
|
)
|
(34.7
|
)
|
(35.4
|
)
|
|||||
|
Net Stumpage Sales
|
|
$52.0
|
|
|
$40.5
|
|
|
$41.1
|
|
||
|
Non-Timber Sales
|
|
$3.2
|
|
|
$2.6
|
|
|
$3.7
|
|
||
|
Total Sales
|
|
$91.9
|
|
|
$77.8
|
|
|
$80.2
|
|
||
|
Operating Income
|
|
$1.1
|
|
|
($4.0
|
)
|
|
$6.9
|
|
||
|
(+) Depreciation, depletion and amortization
|
32.0
|
|
25.2
|
|
14.8
|
|
|||||
|
Adjusted EBITDA (a)
|
|
$33.1
|
|
|
$21.2
|
|
|
$21.7
|
|
||
|
Other Data
|
|||||||||||
|
Year-End Acres (in thousands)
|
378
|
|
378
|
|
373
|
|
|||||
|
Sawtimber (in dollars per MBF) (b)
|
|
$665
|
|
|
$566
|
|
|
$565
|
|
||
|
Estimated Percentage of Export Volume
|
26
|
%
|
24
|
%
|
22
|
%
|
|||||
|
(a)
|
Adjusted EBITDA is a non-GAAP measure defined and reconciled at
Item 6 — Selected Financial Data
.
|
|
(b)
|
Delivered sawtimber excluding chip-n-saw.
|
36
|
New Zealand Timber Overview
|
2017
|
2016
|
2015
|
||||||||
|
Sales Volume (in thousands of tons)
|
|||||||||||
|
Domestic Pulpwood (Delivered)
|
448
|
|
374
|
|
434
|
|
|||||
|
Domestic Sawtimber (Delivered)
|
852
|
|
820
|
|
684
|
|
|||||
|
Export Pulpwood (Delivered)
|
106
|
|
85
|
|
83
|
|
|||||
|
Export Sawtimber (Delivered)
|
1,133
|
|
932
|
|
982
|
|
|||||
|
Stumpage
|
—
|
|
10
|
|
228
|
|
|||||
|
Total Volume
|
2,539
|
|
2,221
|
|
2,412
|
|
|||||
|
Delivered Log Prices (in dollars per ton)
|
|||||||||||
|
Domestic Pulpwood
|
|
$33.84
|
|
|
$31.75
|
|
|
$32.00
|
|
||
|
Domestic Sawtimber
|
|
$81.12
|
|
|
$72.68
|
|
|
$64.05
|
|
||
|
Export Sawtimber
|
|
$112.74
|
|
|
$98.32
|
|
|
$88.59
|
|
||
|
Summary Financial Data (in millions of dollars)
|
|||||||||||
|
Sales
|
|
$222.5
|
|
|
$170.7
|
|
|
$155.7
|
|
||
|
Less: Cut and Haul
|
(80.6
|
)
|
(70.9
|
)
|
(71.5
|
)
|
|||||
|
Less: Port and Freight Costs
|
(39.7
|
)
|
(28.0
|
)
|
(32.0
|
)
|
|||||
|
Net Stumpage Sales
|
|
$102.2
|
|
|
$71.8
|
|
|
$52.2
|
|
||
|
Land / Other Sales
|
|
$24.3
|
|
|
$1.8
|
|
|
$5.9
|
|
||
|
Non-Timber Sales / Carbon Credits
|
0.8
|
|
5.3
|
|
1.2
|
|
|||||
|
Total Sales
|
|
$247.6
|
|
|
$177.8
|
|
|
$162.8
|
|
||
|
Operating Income
|
|
$72.5
|
|
|
$33.1
|
|
|
$2.8
|
|
||
|
(+) Depreciation, depletion and amortization
|
36.4
|
|
23.4
|
|
29.7
|
|
|||||
|
(+) Non-cash cost of land sold
|
0.1
|
|
1.8
|
|
0.5
|
|
|||||
|
Adjusted EBITDA (a)
|
|
$109.0
|
|
|
$58.3
|
|
|
$33.0
|
|
||
|
Other Data
|
|||||||||||
|
New Zealand Dollar to U.S. Dollar Exchange Rate (b)
|
0.7108
|
|
0.6971
|
|
0.7031
|
|
|||||
|
Net Plantable Year-End Acres (in thousands)
|
293
|
|
299
|
|
299
|
|
|||||
|
Export Sawtimber (in dollars per JAS m3)
|
|
$131.08
|
|
|
$114.27
|
|
|
$103.49
|
|
||
|
Domestic Sawtimber (in $NZD per tonne)
|
|
$125.43
|
|
|
$114.54
|
|
|
$100.47
|
|
||
|
(a)
|
Adjusted EBITDA is a non-GAAP measure defined and reconciled at
Item 6 — Selected Financial Data
.
|
|
(b)
|
Represents the average of the month-end exchange rates for each year.
|
37
|
Real Estate Overview
|
2017
|
2016
|
2015
|
||||||||
|
Sales (in millions of dollars)
|
|||||||||||
|
Improved Development (a)
|
|
$6.3
|
|
|
$1.7
|
|
|
$2.6
|
|
||
|
Unimproved Development
|
16.4
|
|
5.5
|
|
6.4
|
|
|||||
|
Rural
|
18.6
|
|
18.8
|
|
22.7
|
|
|||||
|
Non-Strategic / Timberlands
|
46.3
|
|
66.1
|
|
54.8
|
|
|||||
|
Large Dispositions (b)
|
95.4
|
|
207.3
|
|
—
|
|
|||||
|
Total Sales
|
|
$183.0
|
|
|
$299.4
|
|
|
$86.5
|
|
||
|
Acres Sold
|
|||||||||||
|
Improved Development (a)
|
23
|
|
47
|
|
74
|
|
|||||
|
Unimproved Development
|
1,449
|
|
206
|
|
699
|
|
|||||
|
Rural
|
6,344
|
|
6,684
|
|
8,754
|
|
|||||
|
Non-Strategic / Timberlands
|
16,007
|
|
28,743
|
|
23,602
|
|
|||||
|
Large Dispositions (b)
|
49,599
|
|
92,434
|
|
—
|
|
|||||
|
Total Acres Sold
|
73,422
|
|
128,114
|
|
33,130
|
|
|||||
|
Price per Acre (dollars per acre)
|
|||||||||||
|
Improved Development (a)
|
|
$296,550
|
|
|
$37,353
|
|
|
$35,131
|
|
||
|
Unimproved Development
|
11,318
|
|
26,959
|
|
9,148
|
|
|||||
|
Rural
|
2,937
|
|
2,794
|
|
2,588
|
|
|||||
|
Non-Strategic / Timberlands
|
2,891
|
|
2,301
|
|
2,324
|
|
|||||
|
Large Dispositions (b)
|
1,922
|
|
2,242
|
|
—
|
|
|||||
|
Weighted Average (Total) (c)
|
|
$3,702
|
|
|
$2,581
|
|
|
$2,611
|
|
||
|
Weighted Average (Adjusted) (d)
|
|
$3,417
|
|
|
$2,536
|
|
|
$2,538
|
|
||
|
Total Sales (Excluding Large Dispositions)
|
|
$87.6
|
|
|
$92.1
|
|
|
$86.5
|
|
||
|
Operating Income
|
|
$116.0
|
|
|
$202.4
|
|
|
$44.3
|
|
||
|
(+) Depreciation, depletion and amortization
|
9.0
|
|
16.3
|
|
14.5
|
|
|||||
|
(+) Non-cash cost of land and improved development
|
13.6
|
|
9.9
|
|
12.0
|
|
|||||
|
(–) Large Dispositions (b)
|
(67.0
|
)
|
(143.9
|
)
|
—
|
|
|||||
|
Adjusted EBITDA (e)
|
|
$71.6
|
|
|
$84.7
|
|
|
$70.8
|
|
||
|
(a)
|
Reflects land with capital invested in infrastructure improvements. Sales for the year ended December 31, 2017 are presented net of $0.6 million of deferred revenue adjustments due to remaining performance obligations. Price per acre is calculated on gross sales of
$6.9 million
for the year ended December 31, 2017.
|
|
(b)
|
Large Dispositions are defined as transactions involving the sale of timberland that exceed $20 million in size and do not have a demonstrable premium relative to timberland value. In 2017, the Company completed two dispositions of approximately 50,000 total acres. In January 2017, the Company completed a disposition of approximately 25,000 acres of timberland located in Alabama for a sales price and gain of approximately $42.0 million and $28.2 million, respectively. In December 2017, the Company completed a second disposition of approximately 25,000 acres of timberland located in Alabama for a sales price and gain of approximately $53.4 million and $38.8 million, respectively. In 2016, the Company completed two dispositions of approximately 92,000 total acres for a combined sales price and gain of approximately $207.3 million and $143.9 million, respectively.
|
|
(c)
|
Excludes Large Dispositions.
|
|
(d)
|
Excludes Improved Development and Large Dispositions.
|
|
(e)
|
Adjusted EBITDA is a non-GAAP measure defined and reconciled at
Item 6 — Selected Financial Data
.
|
38
|
Capital Expenditures By Segment
|
2017
|
2016
|
2015
|
||||||||
|
Timber Capital Expenditures (in millions of dollars)
|
|||||||||||
|
Southern Timber
|
|||||||||||
|
Reforestation, silvicultural and other capital expenditures
|
|
$17.9
|
|
|
$19.2
|
|
|
$17.7
|
|
||
|
Property taxes
|
8.1
|
|
5.0
|
|
5.9
|
|
|||||
|
Lease payments
|
4.8
|
|
5.2
|
|
5.7
|
|
|||||
|
Allocated overhead
|
3.7
|
|
4.2
|
|
3.9
|
|
|||||
|
Subtotal Southern Timber
|
|
$34.5
|
|
|
$33.6
|
|
|
$33.2
|
|
||
|
Pacific Northwest Timber
|
|||||||||||
|
Reforestation, silvicultural and other capital expenditures
|
7.3
|
|
5.8
|
|
6.2
|
|
|||||
|
Property taxes
|
0.9
|
|
0.7
|
|
0.5
|
|
|||||
|
Allocated overhead
|
2.0
|
|
1.5
|
|
1.8
|
|
|||||
|
Subtotal Pacific Northwest Timber
|
|
$10.2
|
|
|
$8.0
|
|
|
$8.5
|
|
||
|
New Zealand Timber
|
|||||||||||
|
Reforestation, silvicultural and other capital expenditures
|
9.1
|
|
8.6
|
|
8.0
|
|
|||||
|
Property taxes
|
0.7
|
|
0.6
|
|
0.7
|
|
|||||
|
Lease payments
|
4.4
|
|
4.2
|
|
4.1
|
|
|||||
|
Allocated overhead
|
2.9
|
|
2.6
|
|
2.4
|
|
|||||
|
Subtotal New Zealand Timber
|
|
$17.1
|
|
|
$16.0
|
|
|
$15.2
|
|
||
|
Total Timber Segments Capital Expenditures
|
|
$61.8
|
|
|
$57.6
|
|
|
$56.9
|
|
||
|
Real Estate
|
1.3
|
|
0.3
|
|
0.3
|
|
|||||
|
Corporate
|
2.2
|
|
0.8
|
|
0.1
|
|
|||||
|
Total Capital Expenditures
|
|
$65.3
|
|
|
$58.7
|
|
|
$57.3
|
|
||
|
|
|
|
|
|
|||||||
|
Timberland Acquisitions
|
|||||||||||
|
Southern Timber
|
|
$220.0
|
|
|
$104.0
|
|
|
$54.4
|
|
||
|
Pacific Northwest Timber
|
1.5
|
|
262.5
|
|
34.1
|
|
|||||
|
New Zealand Timber
|
21.4
|
|
—
|
|
9.9
|
|
|||||
|
Total Timberland Acquisitions
|
|
$242.9
|
|
|
$366.5
|
|
|
|
$98.4
|
|
|
|
Real Estate Development Investments
|
|
$15.8
|
|
|
$8.7
|
|
|
$2.7
|
|
||
|
Rayonier Office Building
|
|
$6.1
|
|
|
$6.3
|
|
|
$0.9
|
|
||
39
RESULTS OF OPERATIONS,
2017
VERSUS
2016
(millions of dollars)
The following tables summarize sales, operating income and Adjusted EBITDA variances for 2017 versus 2016:
|
Sales
|
Southern Timber
|
Pacific Northwest Timber
|
New Zealand Timber
|
Real Estate
|
Trading
|
Total
|
||||||||||||||||||
|
2016
|
|
$151.2
|
|
|
$77.8
|
|
|
$177.8
|
|
|
$299.4
|
|
|
$109.7
|
|
|
$815.9
|
|
||||||
|
Volume/Mix
|
(0.1
|
)
|
1.8
|
|
24.6
|
|
(30.6
|
)
|
25.5
|
|
21.2
|
|
||||||||||||
|
Price
|
(4.2
|
)
|
9.7
|
|
26.3
|
|
26.7
|
|
17.4
|
|
75.9
|
|
||||||||||||
|
Non-timber sales
|
3.6
|
|
0.6
|
|
(4.7
|
)
|
—
|
|
—
|
|
(0.5
|
)
|
||||||||||||
|
Foreign exchange (a)
|
—
|
|
—
|
|
1.1
|
|
—
|
|
—
|
|
1.1
|
|
||||||||||||
|
Other
|
(6.0
|
)
|
(b)
|
2.0
|
|
(b)
|
22.5
|
|
(c)
|
(112.5
|
)
|
(d)
|
—
|
|
(94.0
|
)
|
||||||||
|
2017
|
|
$144.5
|
|
|
$91.9
|
|
|
$247.6
|
|
|
$183.0
|
|
|
$152.6
|
|
|
$819.6
|
|
||||||
|
(a)
|
Net of currency hedging impact.
|
|
(b)
|
Includes variance due to stumpage versus delivered sales.
|
|
(c)
|
New Zealand Timber includes $24.3 million of timberland sales in 2017, offset by $1.8 million of timberland sales in 2016.
|
|
(d)
|
Real Estate included
$95.4 million
of sales from Large Dispositions in 2017, offset by
$207.3 million
of sales from Large Dispositions in 2016 and $0.6 million of deferred revenue in 2017.
|
|
Operating Income
|
Southern Timber
|
Pacific Northwest Timber
|
New Zealand Timber
|
Real Estate
|
Trading
|
Corporate and Other
|
Total
|
|||||||||||||||||||||
|
2016
|
|
$43.1
|
|
|
($4.0
|
)
|
|
$33.1
|
|
|
$202.4
|
|
|
$2.0
|
|
|
($20.8
|
)
|
|
$255.8
|
|
|||||||
|
Volume/Mix
|
(0.2
|
)
|
0.4
|
|
7.2
|
|
(21.6
|
)
|
—
|
|
—
|
|
(14.2
|
)
|
||||||||||||||
|
Price
|
(4.2
|
)
|
9.7
|
|
20.3
|
|
26.7
|
|
—
|
|
—
|
|
52.5
|
|
||||||||||||||
|
Cost
|
0.6
|
|
0.3
|
|
(1.2
|
)
|
(0.3
|
)
|
2.6
|
|
0.3
|
|
2.3
|
|
||||||||||||||
|
Non-timber income
|
2.4
|
|
0.4
|
|
(4.1
|
)
|
—
|
|
—
|
|
—
|
|
(1.3
|
)
|
||||||||||||||
|
Foreign exchange (a)
|
—
|
|
—
|
|
2.5
|
|
—
|
|
—
|
|
—
|
|
2.5
|
|
||||||||||||||
|
Depreciation, depletion & amortization
|
0.5
|
|
(5.7
|
)
|
(0.5
|
)
|
2.0
|
|
—
|
|
(0.4
|
)
|
(4.1
|
)
|
||||||||||||||
|
Non-cash cost of land and improved development
|
—
|
|
—
|
|
—
|
|
(7.0
|
)
|
—
|
|
—
|
|
(7.0
|
)
|
||||||||||||||
|
Other
|
—
|
|
—
|
|
15.2
|
|
(b)
|
(86.2
|
)
|
(c)
|
—
|
|
—
|
|
(71.0
|
)
|
||||||||||||
|
2017
|
|
$42.2
|
|
|
$1.1
|
|
|
$72.5
|
|
|
$116.0
|
|
|
$4.6
|
|
|
($20.9
|
)
|
|
$215.5
|
|
|||||||
|
(a)
|
Net of currency hedging impact.
|
|
(b)
|
New Zealand Timber includes $14.8 million from timberland sales in 2017 and $0.4 million from a settlement received in 2017.
|
|
(c)
|
Real Estate includes
$67.0
million of operating income from two Large Dispositions in 2017, offset by $0.6 million of deferred revenue in 2017,
$143.9
million of operating income from Large Dispositions in 2016 and receipt of $8.7 million in deferred payments with respect to prior land sales.
|
40
|
Adjusted EBITDA (a)
|
Southern Timber
|
Pacific Northwest Timber
|
New Zealand Timber
|
Real Estate
|
Trading
|
Corporate and Other
|
Total
|
|||||||||||||||||||||
|
2016
|
|
$92.9
|
|
|
$21.2
|
|
|
$58.3
|
|
|
$84.7
|
|
|
$2.0
|
|
|
($19.4
|
)
|
|
$239.7
|
|
|||||||
|
Volume/Mix
|
(0.1
|
)
|
1.5
|
|
10.3
|
|
(30.1
|
)
|
—
|
|
—
|
|
(18.4
|
)
|
||||||||||||||
|
Price
|
(4.2
|
)
|
9.7
|
|
20.3
|
|
26.7
|
|
—
|
|
—
|
|
52.5
|
|
||||||||||||||
|
Cost
|
0.6
|
|
0.3
|
|
(1.2
|
)
|
(0.3
|
)
|
2.6
|
|
—
|
|
2.0
|
|
||||||||||||||
|
Non-timber income
|
2.4
|
|
0.4
|
|
(4.1
|
)
|
—
|
|
—
|
|
—
|
|
(1.3
|
)
|
||||||||||||||
|
Foreign exchange (b)
|
—
|
|
—
|
|
3.0
|
|
—
|
|
—
|
|
—
|
|
3.0
|
|
||||||||||||||
|
Other
|
—
|
|
—
|
|
22.4
|
|
(c)
|
(9.4
|
)
|
(d)
|
—
|
|
—
|
|
13.0
|
|
||||||||||||
|
2017
|
|
$91.6
|
|
|
$33.1
|
|
|
$109.0
|
|
|
$71.6
|
|
|
$4.6
|
|
|
($19.4
|
)
|
|
$290.5
|
|
|||||||
|
(a)
|
Adjusted EBITDA is a non-GAAP measure defined and reconciled at
Item 6 — Selected Financial Data
.
|
|
(b)
|
Net of currency hedging impact.
|
|
(c)
|
New Zealand Timber includes $24.3 million of timberland sold in 2017 less cash costs of $0.5 million and $0.4 million of operating income from a settlement received in 2017, offset by $1.8 million of timberland sold in 2016.
|
|
(d)
|
Real Estate includes $0.6 million of deferred revenue in 2017 and receipt of $8.7 million in deferred payments in 2016 with respect to prior land sales.
|
41
SOUTHERN TIMBER
Full-year sales of
$144.5 million
decreased
$6.7 million
, or
4%
, versus the prior year
.
This decrease in sales includes a $3.6 million increase in non-timber sales versus the prior year. Harvest volumes were relatively flat at
5.31 million
tons in the current year versus
5.32 million
tons in the prior year. Average pine sawtimber stumpage prices
decreased
4%
to
$25.64
per ton versus
$26.76
per ton in the prior year, while average pine pulpwood stumpage prices
decreased
9%
to
$16.14
per ton versus
$17.76
per ton in the prior year. The modest decrease in average sawtimber prices was driven by lower demand in the Gulf states as well as geographic mix due to hurricanes affecting the ability to harvest volume in one of the Company’s higher-priced sawtimber regions. The decrease in average pulpwood prices was due to salvage volume from the West Mims fire and increased supply as a result of extended dry weather along the east coast during the first half of the year. Overall
, weighted-average stumpage prices (including hardwood)
decreased
4%
to
$19.41
per ton versus
$20.18
per ton in the prior year.
Operating income of
$42.2 million
decreased
$0.9 million
versus the prior year due to
lower
weighted-average stumpage prices (
$4.2 million
), lower volumes (
$0.2 million
), higher severance and franchise taxes ($0.4 million) and higher lease land expenses
($0.4 million)
, which were partially offset by
higher
non-timber income (
$2.4 million
),
lower
depreciation and amortization (
$0.5 million
), and lower overhead expense ($1.4 million). Full-year
Adjusted EBITDA of
$91.6 million
was
$1.3 million
below
the prior year.
PACIFIC NORTHWEST TIMBER
Full-year sales of
$91.9 million
increased
$14.1 million
, or
18%
, versus the prior year. Included in this increase is a $0.6 million increase in non-timber sales versus the prior year. Harvest volumes
increased
4%
to
1.25 million
tons versus
1.20 million
tons in the prior year. Average delivered sawtimber prices
increased
15%
to
$84.55
per ton versus
$73.44
per ton in the prior year, while average delivered pulpwood prices
decreased
3%
to
$40.62
per ton versus
$41.97
per ton in the prior year. The increase in average sawtimber prices was due to stronger domestic and export sawtimber markets as well as a more favorable species mix. The decrease in average pulpwood prices was due to an increase in volume from a lower-priced region and an increase in the availability of wood chip residuals from lumber mills, which in turn reduced the demand for pulpwood logs.
Operating income of
$1.1 million
versus operating loss of
$4.0 million
in the prior year was primarily due to
higher
prices (
$9.7 million
), lower overhead expense (
$0.6 million
),
higher
volumes (
$0.4 million
) and
higher
non-timber income (
$0.4 million
), partially offset by
higher
depletion rates resulting from our Menasha acquisition (
$5.7 million
) and higher road maintenance and other costs ($0.3 million), Full-year Adjusted EBITDA of
$33.1 million
was
$11.9 million
above
the prior year.
NEW ZEALAND TIMBER
Full-year sales of
$247.6 million
increased
$69.8 million
, or
39%
, versus the prior year. This increase in sales includes a $4.7 million decrease in non-timber sales versus the prior year. Harvest volumes
increased
14%
to
2.54 million
tons versus
2.22 million
tons in the prior year due to incremental volume from recent acquisitions. Average delivered prices for export sawtimber
increased
15%
to
$112.74
per ton versus
$98.32
per ton in the prior year, while average delivered prices for domestic sawtimber
increased
12%
to
$81.12
per ton versus
$72.68
in the prior year. The
increase
in export sawtimber prices was primarily due to stronger demand from China, while the
increase
in domestic sawtimber prices (in U.S. dollar terms) was driven primarily by stronger local demand for construction materials and a modest rise in the NZ$/US$ exchange rate (US
$0.71
per NZ$1.00 versus US
$0.70
per NZ$1.00). Excluding the impact of foreign exchange rates, domestic sawtimber prices increased
10%
from the prior year.
Operating income of
$72.5 million
increased
$39.4 million
versus the prior year due to
higher
prices (
$20.3 million
), higher income from land sales (
$14.8 million
), higher volumes (
$7.2 million
), favorable foreign exchange impacts (
$2.5 million
) and higher other income ($0.4 million), which were partially offset by lower carbon sales (
$4.1 million
), higher forest management costs (
$1.2 million
) and higher depletion rates ($0.5 million). Full-year Adjusted EBITDA of
$109.0 million
was
$50.7 million
above
the prior year.
42
REAL ESTATE
Full-year sales of
$183.0 million
decreased
$116.4 million
versus the prior year, while operating income of
$116.0 million
decreased
$86.4 million
versus the prior year. Full-year sales and operating income include
$95.4 million
and
$67.0 million
, respectively, from Large Dispositions in 2017 and
$207.3 million
and
$143.9 million
in the prior year. Sales and operating income decreased primarily due to lower volumes (
73,422
acres sold versus
128,114
acres sold in the prior year), partially offset by higher weighted average prices (
$2,500
per acre versus
$2,337
per acre in the prior year). Full-year operating income also decreased due to the receipt of $8.7 million in deferred payments in 2016 with respect to prior land sales. Full-year Adjusted EBITDA of
$71.6 million
was
$13.1 million
below the prior year.
TRADING
Full-year sales of
$152.6 million
increased
$42.9 million
versus the prior year due to higher volumes and prices. Sales volumes
increased
24%
to
1.41 million
tons versus
1.14 million
tons in the prior year due to increased volume from existing suppliers and stumpage blocks purchased from third-parties, coupled with improving export market demand. Average prices
increased
13%
to
$107.60
per ton versus
$95.22
per ton in the prior year primarily due to stronger demand from China. Operating income of
$4.6 million
increased
$2.6 million
versus the prior year.
CORPORATE AND OTHER EXPENSE/ELIMINATIONS
Full-year corporate and other operating expense of $
20.9
million increased $0.1 million versus the prior year due to higher depreciation expense ($0.4 million), the prior year gain on foreign currency derivatives ($1.2 million), higher selling, general and administrative costs ($0.2 million) and a reduction in overhead costs historically allocated to operating segments ($4.1 million) as a result of pension and organizational changes made in the fourth quarter of 2016. These increases were partially offset by lower costs related to shareholder litigation (
$1.5 million
), the prior year transaction costs related to the Menasha acquisition ($1.0 million), and lower pension costs ($3.3 million).
INTEREST EXPENSE
Full-year interest expense of
$34.1 million
increased
$1.9 million
versus the prior year period due to higher average outstanding debt versus the prior year period.
INTEREST AND MISCELLANEOUS INCOME (EXPENSE), NET
Other non-operating income was
$1.9 million
in 2017 versus expense of
$0.8 million
in 2016. The 2016 results were comprised of unfavorable mark-to-market adjustments on New Zealand JV interest rate swaps.
INCOME TAX (EXPENSE) BENEFIT
Full-year income tax expense of
$21.8 million
increased
$16.8 million
versus the prior year period. The increase in income tax expense versus the prior year was due to improved results from the New Zealand JV, which is the primary driver of income tax expense.
OUTLOOK FOR
2018
In 2018, we expect harvest volumes in our Southern Timber segment of 5.8 to 6.0 million tons, with a full-year contribution from our 2017 acquisitions in Florida, Georgia and South Carolina. We further anticipate modestly improved pricing in certain Southern markets; however, we expect overall pricing in the Southern Timber segment to be relatively flat to 2017 average pricing due to geographic mix.
In our Pacific Northwest Timber segment, we expect harvest volumes of 1.3 to 1.4 million tons, as well as higher sawtimber prices relative to 2017 average pricing due to stronger domestic and export markets.
In our New Zealand Timber segment, we expect harvest volumes of 2.5 to 2.7 million tons and continued strong pricing dynamics driven by solid demand in both domestic and export markets.
In our Real Estate segment, we continue to focus on unlocking the long-term value of our HBU development and rural property portfolio. Following a year of meaningful infrastructure investments in our Wildlight development project, we expect additional residential and commercial closings in 2018.
Our
2018
outlook is subject to a number of variables and uncertainties, including those discussed at
Item 1A — Risk Factors
.
43
RESULTS OF OPERATIONS,
2016
VERSUS
2015
(millions of dollars)
The following tables summarize the sales, operating income and Adjusted EBITDA variances for 2016 versus 2015:
|
Sales
|
Southern Timber
|
Pacific Northwest Timber
|
New Zealand Timber
|
Real Estate
|
Trading
|
Total
|
||||||||||||||||||
|
2015
|
|
$157.8
|
|
|
$80.2
|
|
|
$162.8
|
|
|
$86.5
|
|
|
$81.5
|
|
|
$568.8
|
|
||||||
|
Volume/Mix
|
(4.1
|
)
|
(1.9
|
)
|
(2.0
|
)
|
6.7
|
|
18.3
|
|
17.0
|
|
||||||||||||
|
Price
|
(2.1
|
)
|
0.6
|
|
17.7
|
|
(1.1
|
)
|
9.5
|
|
24.6
|
|
||||||||||||
|
Non-timber sales
|
(0.4
|
)
|
(1.1
|
)
|
4.1
|
|
—
|
|
1.1
|
|
3.7
|
|
||||||||||||
|
Foreign exchange (a)
|
—
|
|
—
|
|
(0.6
|
)
|
—
|
|
—
|
|
(0.6
|
)
|
||||||||||||
|
Other (b)
|
—
|
|
—
|
|
(4.2
|
)
|
207.3
|
|
(0.7
|
)
|
202.4
|
|
||||||||||||
|
2016
|
|
$151.2
|
|
|
$77.8
|
|
|
$177.8
|
|
|
$299.4
|
|
|
$109.7
|
|
|
$815.9
|
|
||||||
|
(a)
|
Net of currency hedging impact.
|
|
(b)
|
Real Estate included $207.3 million of sales from two Large Dispositions.
|
|
Operating Income
|
Southern Timber
|
Pacific Northwest Timber
|
New Zealand Timber
|
Real Estate
|
Trading
|
Corporate and Other
|
Total
|
|||||||||||||||||||||
|
2015
|
|
$46.7
|
|
|
$6.9
|
|
|
$2.8
|
|
|
$44.3
|
|
|
$1.2
|
|
|
($24.1
|
)
|
|
$77.8
|
|
|||||||
|
Volume/Mix
|
(1.7
|
)
|
(0.7
|
)
|
(2.3
|
)
|
4.5
|
|
—
|
|
—
|
|
(0.2
|
)
|
||||||||||||||
|
Price
|
(2.5
|
)
|
1.0
|
|
23.6
|
|
(1.1
|
)
|
—
|
|
—
|
|
21.0
|
|
||||||||||||||
|
Cost
|
(1.5
|
)
|
0.9
|
|
(0.2
|
)
|
(0.3
|
)
|
0.8
|
|
3.4
|
|
3.1
|
|
||||||||||||||
|
Non-timber income
|
(0.5
|
)
|
(1.1
|
)
|
3.6
|
|
—
|
|
—
|
|
—
|
|
2.0
|
|
||||||||||||||
|
Foreign exchange (a)
|
—
|
|
—
|
|
6.6
|
|
—
|
|
—
|
|
—
|
|
6.6
|
|
||||||||||||||
|
Depreciation, depletion & amortization
|
2.6
|
|
(11.0
|
)
|
0.3
|
|
(0.7
|
)
|
—
|
|
(0.1
|
)
|
(8.9
|
)
|
||||||||||||||
|
Non-cash cost of land and real estate sold
|
—
|
|
—
|
|
(1.4
|
)
|
3.1
|
|
—
|
|
—
|
|
1.7
|
|
||||||||||||||
|
Other (b)
|
—
|
|
—
|
|
0.1
|
|
152.6
|
|
—
|
|
—
|
|
152.7
|
|
||||||||||||||
|
2016
|
|
$43.1
|
|
|
($4.0
|
)
|
|
$33.1
|
|
|
$202.4
|
|
|
$2.0
|
|
|
($20.8
|
)
|
|
$255.8
|
|
|||||||
|
(a)
|
Net of currency hedging impact.
|
|
(b)
|
Real Estate included $143.9 million of operating income from Large Dispositions and receipt of $8.7 million in deferred payments with respect to prior land sales.
|
44
|
Adjusted EBITDA (a)
|
Southern Timber
|
Pacific Northwest Timber
|
New Zealand Timber
|
Real Estate
|
Trading
|
Corporate and Other
|
Total
|
|||||||||||||||||||||
|
2015
|
|
$101.0
|
|
|
$21.7
|
|
|
$33.0
|
|
|
$70.8
|
|
|
$1.2
|
|
|
($19.7
|
)
|
|
$208.0
|
|
|||||||
|
Volume/Mix
|
(3.6
|
)
|
(1.3
|
)
|
(4.1
|
)
|
6.6
|
|
—
|
|
—
|
|
(2.4
|
)
|
||||||||||||||
|
Price
|
(2.5
|
)
|
1.0
|
|
23.6
|
|
(1.1
|
)
|
—
|
|
—
|
|
21.0
|
|
||||||||||||||
|
Cost
|
(1.5
|
)
|
0.9
|
|
(0.2
|
)
|
(0.3
|
)
|
0.8
|
|
0.3
|
|
—
|
|
||||||||||||||
|
Non-timber income
|
(0.5
|
)
|
(1.1
|
)
|
3.6
|
|
—
|
|
—
|
|
—
|
|
2.0
|
|
||||||||||||||
|
Foreign exchange (b)
|
—
|
|
—
|
|
6.5
|
|
—
|
|
—
|
|
—
|
|
6.5
|
|
||||||||||||||
|
Other
|
—
|
|
—
|
|
(4.1
|
)
|
8.7
|
|
—
|
|
—
|
|
4.6
|
|
||||||||||||||
|
2016
|
|
$92.9
|
|
|
$21.2
|
|
|
$58.3
|
|
|
$84.7
|
|
|
$2.0
|
|
|
($19.4
|
)
|
|
$239.7
|
|
|||||||
|
(a)
|
Adjusted EBITDA is a non-GAAP measure defined and reconciled at
Item 6 — Selected Financial Data
.
|
|
(b)
|
Net of currency hedging impact.
|
45
SOUTHERN TIMBER
Full-year 2016 Southern Timber sales of $151.2 million decreased $6.6 million, or 4%, versus the prior year. This decrease in sales includes a $0.4 million decrease in non-timber sales versus the prior year. Harvest volumes decreased 3% to 5.32 million tons versus 5.49 million tons in the prior year. Average sawtimber stumpage prices decreased 3% to $26.76 per ton versus $27.62 per ton in the prior year, while average pulpwood stumpage prices decreased 2% to $17.76 per ton versus $18.13 per ton in the prior year. The decrease in average sawtimber prices was driven primarily by geographic mix, specifically decreased volume in one of our higher-priced sawtimber regions. The decrease in average pulpwood prices was primarily attributable to deferred harvesting in our best pulpwood markets due to soft market conditions. Overall, weighted average stumpage prices (including hardwood) decreased 2% to $20.18 per ton versus $20.66 per ton in the prior year period.
Operating income of $43.1 million decreased $3.6 million versus the prior year due to lower prices ($2.5 million), lower volumes ($1.7 million), higher leased land expenses and salvage timber costs ($1.5 million) and lower non-timber income ($0.5 million), which were partially offset by lower depletion rates ($2.6 million). Full-year 2016 Adjusted EBITDA of $92.9 million was $8.1 million below the prior year.
PACIFIC NORTHWEST TIMBER
Full-year 2016 Pacific Northwest Timber sales of $77.8 million decreased $2.4 million, or 3%, versus the prior year. This decrease in sales includes a $1.1 million decrease in non-timber sales versus the prior year. Harvest volumes declined 4% to 1.19 million tons versus 1.24 million tons in the prior year. Average delivered sawtimber prices increased 2% to $73.44 per ton versus $72.13 per ton in the prior year, while average delivered pulpwood prices decreased 6% to $41.97 per ton versus $44.61 per ton in the prior year. The increase in average sawtimber prices was driven by strengthening export and domestic lumber markets. However, the improved domestic lumber market had a negative effect on pulpwood prices, as more residual chips were entering the market.
Operating loss of $4.0 million versus operating income of $6.9 million in the prior year was due to higher depletion rates ($11.0 million), lower cedar salvage sales ($1.1 million) and lower volumes ($0.7 million), which were partially offset by higher prices ($1.0 million) and lower severance taxes ($0.9 million). Full-year Adjusted EBITDA of $21.2 million was $0.5 million below the prior year.
NEW ZEALAND TIMBER
Full-year 2016 New Zealand Timber sales of $177.8 million increased $15.0 million, or 9%, versus the prior year. Included in this increase is a $4.1 million increase in non-timber sales versus the prior year. Harvest volumes declined 8% to 2.22 million tons versus 2.41 million tons in the prior year. Average delivered prices for export sawtimber increased 11% to $98.32 per ton versus $88.59 per ton in the prior year, while average delivered prices for domestic sawtimber increased 13% to $72.68 per ton versus $64.05 per ton in the prior year. The increase in export sawtimber prices was primarily due to stronger demand from China, while the increase in domestic sawtimber prices (in U.S. dollar terms) was driven primarily by strong domestic demand for construction materials. Excluding the impact of foreign exchange rates, domestic sawtimber prices increased 14% versus the prior year.
Operating income of $33.1 million increased $30.3 million versus the prior year due to the increase in prices ($23.6 million), favorable changes in foreign exchange impacts ($6.6 million), higher non-timber income ($3.6 million) and lower depletion rates ($0.3 million), which were partially offset by lower volume ($2.3 million), lower land sale income ($1.4 million) and higher overhead costs ($0.2 million). Full-year 2016 Adjusted EBITDA of $58.3 million was $25.3 million above the prior year period.
REAL ESTATE
Full-year 2016 sales of $299.4 million increased $212.9 million versus the prior year, while operating income of $202.4 million increased $158.1 million versus the prior year. Full-year 2016 sales and operating income include $207.3 million and $143.9 million, respectively, of Large Dispositions. Sales and operating income increased in 2016 due to higher volumes (128,114 acres sold versus 33,130 acres sold in the prior year), partially offset by lower weighted average prices ($2,337 per acre versus $2,611 per acre in the prior year). Full-year 2016 operating income also increased due to the receipt of $8.7 million of deferred payments with respect to prior land sales. Full-year 2016 Adjusted EBITDA of $84.7 million was $13.9 million above the prior year.
46
TRADING
Full-year 2016 sales of $109.7 million increased $28.2 million versus the prior year due to higher volumes and prices. Included in this increase is a $1.1 million increase in non-timber sales versus the prior year. Sales volumes increased 23% to 1.14 million tons versus 926,000 tons in the prior year. Average prices increased 10% to $95.22 per ton versus $86.89 per ton in the prior year. The increase in both volumes and prices were primarily due to stronger demand from China. Operating income increased $0.8 million versus the prior year, primarily due to lower sourcing and export costs.
CORPORATE AND OTHER EXPENSE/ELIMINATIONS
Full-year 2016 corporate and other expense of $20.8 million decreased $3.3 million versus the prior year primarily due to lower selling, general and administrative expenses ($2.5 million), lower costs related to shareholder litigation ($1.9 million) and a gain on foreign currency derivatives ($1.2 million), which were partially offset by timberland transaction costs ($1.4 million) and other minor variances ($0.8 million).
INTEREST EXPENSE
Interest expense of $32.2 million in 2016 decreased $0.5 million from the prior year primarily due to lower average rates, partially offset by higher outstanding debt.
INTEREST AND MISCELLANEOUS (EXPENSE) INCOME, NET
Other non-operating expense was $0.7 million in 2016 versus $3.0 million in 2015. The 2015 results were comprised of unfavorable mark-to-market adjustments on New Zealand JV interest rate swaps.
INCOME TAX (EXPENSE) BENEFIT
Full-year 2016 tax expense was $5.0 million versus a tax benefit of $0.8 million in 2015. The 2016 income tax expense was principally related to the New Zealand JV. See
Note 9 — Income Taxes
for additional information regarding the provision for income taxes.
LIQUIDITY AND CAPITAL RESOURCES
Our principal source of cash is cash flow from operations, primarily the harvesting of timber and sales of real estate. As a REIT, our main use of cash is dividends. We also use cash to maintain the productivity of our timberlands through replanting and silviculture. Our operations have generally produced consistent cash flow and required limited capital resources. Short-term borrowings have helped fund working capital needs while acquisitions of timberlands generally require funding from external sources or Large Dispositions.
SUMMARY OF LIQUIDITY AND FINANCING COMMITMENTS
|
|
As of December 31,
|
||||||||||
|
(in millions of dollars)
|
2017
|
2016
|
2015
|
||||||||
|
Cash and cash equivalents
|
|
$112.7
|
|
|
$85.9
|
|
|
$51.8
|
|
||
|
Total debt (a)
|
1,028.4
|
|
1,065.5
|
|
833.9
|
|
|||||
|
Shareholders’ equity
|
1,693.0
|
|
1,496.9
|
|
1,361.7
|
|
|||||
|
Adjusted EBITDA (b)
|
290.5
|
|
239.7
|
|
208.0
|
|
|||||
|
Total capitalization (total debt plus equity)
|
2,721.4
|
|
2,562.4
|
|
2,195.6
|
|
|||||
|
Debt to capital ratio
|
38
|
%
|
|
42
|
%
|
38
|
%
|
||||
|
Debt to Adjusted EBITDA (b)
|
3.5
|
|
|
4.4
|
|
4.0
|
|
||||
|
Net debt to Adjusted EBITDA (b)
|
3.2
|
|
|
4.1
|
|
3.8
|
|
||||
|
Net debt to enterprise value (c)
|
18
|
%
|
23
|
%
|
22
|
%
|
|||||
|
(a)
|
Total debt as of December 31, 2017, 2016 and 2015 is presented gross of deferred financing costs of $3.0 million, $3.6 million and $3.3 million, respectively.
|
|
(b)
|
For a reconciliation of Adjusted EBITDA to net income see
Management’s Discussion and Analysis of Financial Condition and Results of Operations—Performance and Liquidity Indicators
.
|
|
(c)
|
Enterprise value is calculated as the number of shares outstanding multiplied by the Company’s share price, plus net debt, at
December 31, 2017
.
|
47
LIQUIDITY FACILITIES
TERM CREDIT AGREEMENT
In August 2015, the Company entered into a credit agreement with CoBank, ACB, as administrative agent, and a syndicate of Farm Credit institutions and other commercial banks to provide $550 million of new credit facilities, including a nine-year $350 million term loan facility. The periodic interest rate on the term loan facility is subject to a pricing grid based on the Company’s leverage ratio, as defined in the credit agreement. As of December 31, 2017, the periodic interest rate on the term loan facility was LIBOR plus 1.625%. Monthly payments of interest only are due on this loan through maturity. Following the closing of the term loan, the Company entered into several interest rate swap transactions to fix the cost of the term loan facility over its nine-year term. The term credit agreement allows the Company to receive annual patronage payments, which are profit distributions made by a cooperative to its member-users based on the quantity or value of business done with the member-user. The Company estimates the effective interest rate on the term loan facility to be approximately 3.3% after consideration of the interest rate swaps and estimated patronage refunds. For additional information on the Company’s interest rate swaps see
Note 13 — Derivative Financial Instruments and Hedging Activities
.
3.75% SENIOR NOTES ISSUED MARCH 2012
In March 2012, Rayonier Inc. issued $325 million of 3.75% Senior Notes due 2022, guaranteed by certain subsidiaries. Semi-annual payments of interest only are due on these notes through maturity. The guarantors were revised in October 2012, leaving TRS and Rayonier Operating Company LLC as the remaining guarantors. See
Note 24 - Consolidating Financial Statements
for further information regarding the subsidiary guarantors.
INCREMENTAL TERM LOAN AGREEMENT
In April 2016, the Company entered into an incremental term loan agreement with CoBank, ACB, as administrative agent, and a syndicate of Farm Credit institutions to provide a 10-year, $300 million incremental term loan. Proceeds from the new term loan were used to fund Rayonier’s portion of the Menasha acquisition net of the proceeds received from the Washington disposition, to repay approximately $105 million outstanding on the Company’s revolving credit facility and for general corporate purposes. The periodic interest rate on the incremental term loan agreement is subject to a pricing grid based on the Company’s leverage ratio, as defined in the credit agreement. As of December 31, 2017, the periodic interest rate on the incremental term loan was LIBOR plus 1.900%. Monthly payments of interest only are due on this loan through maturity. Following the closing of the incremental term loan, the Company entered into several interest rate swap transactions to fix the cost of the facility over its 10-year term. The Company estimates the effective interest rate on the incremental term loan facility to be approximately 2.8% after consideration of the interest rate swaps and estimated patronage payments. For additional information on the Company’s interest rate swaps see
Note 13 — Derivative Financial Instruments and Hedging Activities
.
REVOLVING CREDIT FACILITY
In August 2015, the Company entered into a five-year $200 million unsecured revolving credit facility, replacing the previous $200 million revolving credit facility and $100 million farm credit facility which were scheduled to expire in April 2016 and December 2019, respectively. The periodic interest rate on the revolving credit facility is subject to a pricing grid based on the Company’s leverage ratio, as defined in the credit agreement. As of December 31, 2017, the periodic interest rate on the revolving credit facility was LIBOR plus 1.250%, with an unused commitment fee of 0.175%. Monthly payments of interest only are due on this loan through maturity. At December 31, 2017, the Company had $139.6 million of available borrowings under this facility, net of $10.4 million to secure its outstanding letters of credit.
In April 2013, Rayonier acquired an additional 39% interest in its New Zealand JV, bringing its total ownership to 65%, and as a result, the New Zealand JV’s debt was consolidated effective on that date. On March 3, 2016, as a result of a capital contribution, the Company’s ownership interest in the New Zealand JV increased to 77%. See
Note 7 — Joint Venture Investment
for further information.
48
In June 2016, the New Zealand JV entered into a 12-month NZ$20 million working capital facility and an 18-month NZ$20 million working capital facility, replacing the previous NZ$40 million facility that expired in June 2016. Both working capital facilities were renewed in 2017 for an additional 12-month term, with new expiration dates of June 30, 2018 and December 31, 2018. The NZ$40 million Working Capital Facility is available for short-term operating cash flow needs of the New Zealand JV. This facility holds a variable interest rate indexed to the 90-day New Zealand Bank Bill rate (“BKBM”). The margins are set for the term of the facility. During the year ended December 31, 2017, the New Zealand JV made borrowings and repayments of $38.4 million on its working capital facility. At December 31, 2017, there was no outstanding balance on the Working Capital Facility.
See
Note 5 — Debt
for additional information on these agreements and other outstanding debt, as well as for information on covenants that must be met in connection with our Senior Notes, Term Credit Agreement, Incremental Term Loan Agreement and the Revolving Credit Facility.
CASH FLOWS
The following table summarizes our cash flows from operating, investing and financing activities for each of the past three years ended December 31 (in millions of dollars):
|
|
2017
|
2016
|
2015
|
||||||||
|
Total cash provided by (used for):
|
|||||||||||
|
Operating activities
|
|
$256.3
|
|
|
$203.8
|
|
|
$177.2
|
|
||
|
Investing activities
|
(223.2
|
)
|
(283.2
|
)
|
(166.3
|
)
|
|||||
|
Financing activities
|
(6.9
|
)
|
114.4
|
|
(116.5
|
)
|
|||||
|
Effect of exchange rate changes on cash
|
0.5
|
|
(0.9
|
)
|
(4.2
|
)
|
|||||
|
Increase (decrease) in cash and cash equivalents
|
|
$26.7
|
|
|
$34.1
|
|
|
($109.8
|
)
|
||
CASH PROVIDED BY OPERATING ACTIVITIES
Cash provided by operating activities increased
$52.5 million
versus the prior year due to favorable operating results.
CASH USED FOR INVESTING ACTIVITIES
Cash used for investing activities decreased
$60.0 million
versus the prior year primarily due to a
$14.9 million
decrease in cash used for acquisitions, net of proceeds from Large Dispositions and a
$60.2 million
change in restricted cash. These decreases in cash used for investing activities were partially offset by a
$7.1 million
increase in real estate development investments and a
$6.6 million
increase in capital expenditures.
CASH USED FOR FINANCING ACTIVITIES
Cash used for financing activities in
2017
reflects an increase in cash provided by the
$152.4 million
equity offering which was used to finance a portion of the Company’s acquisition of approximately 95,100 acres of timberlands in Florida, Georgia and South Carolina. This increase in cash was primarily offset by dividend payments of
$127.1 million
and net repayments of
$36.8 million
in debt.
RESTRICTED CASH
At
December 31, 2017
, the Company had approximately
$59.7 million
of proceeds from real estate and timberland sales classified as restricted cash which were deposited with a like-kind exchange (“LKE”) intermediary as well as cash held in escrow for a real estate sale. These funds can be used for acquiring suitable timberland replacement property, or if the LKE purchases are not completed, returned to the Company after 180 days and reclassified as available cash.
CREDIT RATINGS
Both our ability to obtain financing and the related costs of borrowing are affected by our credit ratings, which are periodically reviewed by the rating agencies. As of
December 31, 2017
, our credit ratings from S&P and Moody’s were “BBB-” and “Baa3,” respectively, with both services listing our outlook as “Stable.”
49
STRATEGY
We continuously evaluate our capital structure. Our strategy is to maintain a weighted-average cost of capital competitive with other timberland REITs and TIMOs, while maintaining an investment grade debt rating as well as retaining the flexibility to actively pursue capital allocation opportunities as they become available. Overall, we believe we have adequate liquidity and sources of capital to run our businesses efficiently and effectively and to maximize the value of our timberland and real estate assets under management.
EXPECTED
2018
EXPENDITURES
Capital expenditures in 2018 are forecasted to be between $64 million and $69 million, excluding any strategic timberland acquisitions we may make. Capital expenditures are expected to be primarily comprised of seedling planting, fertilization and other silvicultural activities, property taxes, lease payments, allocated overhead and other capitalized costs. Aside from capital expenditures, we may also acquire timberland as we actively evaluate acquisition opportunities.
Real estate development investments in 2018 are expected to be between $7 million and $10 million. Expected real estate development investments are primarily related to Wildlight, our mixed-use community development project located north of Jacksonville, Florida at the interchange of I-95 and State Road A1A.
Our
2018
dividend payments are expected to be approximately $129 million assuming no change in the quarterly dividend rate of $0.25 per share or material changes in the number of shares outstanding.
Future share repurchases, if any, will depend on the Company’s liquidity and cash flow, as well as general market conditions and other considerations including capital allocation priorities.
We made no discretionary pension contributions in
2017
or
2016
. We have approximately $2.9 million of pension contribution requirements in
2018
and may make discretionary contributions in the future.
Cash income tax payments in 2018 are expected to be approximately $2.3 million, primarily due to the New Zealand JV.
50
PERFORMANCE AND LIQUIDITY INDICATORS
The discussion below is presented to enhance the reader’s understanding of our operating performance, liquidity, ability to generate cash and satisfy rating agency and creditor requirements. This information includes two measures of financial results: Adjusted Earnings before Interest, Taxes, Depreciation, Depletion and Amortization (“Adjusted EBITDA”), and Cash Available for Distribution (“CAD”). These measures are not defined by Generally Accepted Accounting Principles (“GAAP”) and the discussion of Adjusted EBITDA and CAD is not intended to conflict with or change any of the GAAP disclosures described above. Management considers these measures to be important to estimate the enterprise and shareholder values of the Company as a whole and of its core segments, and for allocating capital resources. In addition, analysts, investors and creditors use these measures when analyzing our operating performance, financial condition and cash generating ability. Management uses Adjusted EBITDA as a performance measure and CAD as a liquidity measure. Adjusted EBITDA and CAD as defined may not be comparable to similarly titled measures reported by other companies.
Adjusted EBITDA is defined as earnings before interest, taxes, depreciation, depletion, amortization, the non-cash cost of land and improved development, costs related to shareholder litigation, the gain on foreign currency derivatives, Large Dispositions, costs related to the spin-off of the Performance Fibers business, discontinued operations, internal review and restatement costs and the gain related to consolidation of the New Zealand joint venture. Below is a reconciliation of Net Income to Adjusted EBITDA for the five years ended December 31 (in millions of dollars):
|
|
2017
|
2016
|
2015
|
2014
|
2013
|
||||||||||||||
|
Net Income to Adjusted EBITDA Reconciliation
|
|||||||||||||||||||
|
Net Income
|
|
$161.5
|
|
|
$217.8
|
|
|
$43.9
|
|
|
$97.8
|
|
|
$373.8
|
|
||||
|
Interest, net, continuing operations
|
32.2
|
|
33.0
|
|
34.7
|
|
49.7
|
|
38.5
|
|
|||||||||
|
Income tax expense (benefit), continuing operations
|
21.8
|
|
5.0
|
|
(0.9
|
)
|
(9.6
|
)
|
(35.7
|
)
|
|||||||||
|
Depreciation, depletion and amortization
|
127.6
|
|
115.1
|
|
113.7
|
|
120.0
|
|
116.9
|
|
|||||||||
|
Non-cash cost of land and improved development
|
13.7
|
|
11.7
|
|
12.5
|
|
13.2
|
|
10.2
|
|
|||||||||
|
Costs related to shareholder litigation (a)
|
0.7
|
|
2.2
|
|
4.1
|
|
—
|
|
—
|
|
|||||||||
|
Gain on foreign currency derivatives (b)
|
—
|
|
(1.2
|
)
|
—
|
|
—
|
|
—
|
|
|||||||||
|
Large Dispositions (c)
|
(67.0
|
)
|
(143.9
|
)
|
—
|
|
(21.4
|
)
|
(25.7
|
)
|
|||||||||
|
Cost related to spin-off of Performance Fibers
|
—
|
|
—
|
|
—
|
|
3.8
|
|
—
|
|
|||||||||
|
Internal review and restatement costs
|
—
|
|
—
|
|
—
|
|
3.4
|
|
—
|
|
|||||||||
|
Gain related to consolidation of New Zealand JV
|
—
|
|
—
|
|
—
|
|
—
|
|
(16.2
|
)
|
|||||||||
|
Net income from discontinued operations
|
—
|
|
—
|
|
—
|
|
(43.4
|
)
|
(267.9
|
)
|
|||||||||
|
Adjusted EBITDA
|
|
$290.5
|
|
|
$239.7
|
|
|
$208.0
|
|
|
$213.5
|
|
|
$193.9
|
|
||||
|
(a)
|
Costs related to shareholder litigation include expenses incurred as a result of the securities litigation and the shareholder derivative demands. See
Note 10 — Contingencies
. In addition, these costs include the costs associated with the Company’s response to a subpoena it received from the SEC in November 2014. In July 2016, the Division of Enforcement of the SEC notified the Company that it had concluded its investigation into the Company.
|
|
(b)
|
Gain on foreign currency derivatives is the gain resulting from the foreign exchange derivatives the Company used to mitigate the risk of fluctuations in foreign exchange rates while awaiting the capital contribution to the New Zealand JV.
|
|
(c)
|
Large Dispositions are defined as transactions involving the sale of timberland that exceed $20 million in size and do not have a demonstrable premium relative to timberland value.
|
See
Item 6 — Selected Financial Data
for a reconciliation of Adjusted EBITDA to Operating Income by segment as well as
Item 7 — Results of Operations
for an analysis of changes in Adjusted EBITDA from the prior year.
51
CAD is a non-GAAP measure of cash generated during a period which is available for common stock dividends, distributions to the New Zealand minority shareholder, repurchase of the Company’s common shares, debt reduction and strategic acquisitions. We define CAD as Cash Provided by Operating Activities adjusted for capital spending (excluding timberland acquisitions, real estate development investments and spending on the Rayonier office building), Large Dispositions, cash provided by discontinued operations and working capital and other balance sheet changes. In compliance with SEC requirements for non-GAAP measures, we reduce CAD by mandatory debt repayments which results in the measure entitled “Adjusted CAD.” Adjusted CAD generated in any period is not necessarily indicative of the amounts that may be generated in future periods.
Below is a reconciliation of Cash Provided by Operating Activities to Adjusted CAD for the five years ended
December 31
(in millions):
|
|
2017
|
2016
|
2015
|
2014
|
2013
|
||||||||||||||
|
Cash provided by operating activities
|
|
$256.3
|
|
|
$203.8
|
|
|
$177.2
|
|
|
$320.4
|
|
|
$546.8
|
|
||||
|
Capital expenditures from continuing operations (a)
|
(65.3
|
)
|
(58.7
|
)
|
(57.3
|
)
|
(63.7
|
)
|
(63.2
|
)
|
|||||||||
|
Large Dispositions (b)
|
—
|
|
—
|
|
—
|
|
(21.4
|
)
|
(79.7
|
)
|
|||||||||
|
Cash flow from discontinued operations
|
—
|
|
—
|
|
—
|
|
(102.4
|
)
|
(276.3
|
)
|
|||||||||
|
Working capital and other balance sheet changes
|
(2.3
|
)
|
(0.8
|
)
|
(2.5
|
)
|
(39.5
|
)
|
(70.0
|
)
|
|||||||||
|
CAD
|
|
$188.7
|
|
|
$144.3
|
|
|
$117.4
|
|
|
$93.4
|
|
|
$57.6
|
|
||||
|
Mandatory debt repayments (c)
|
—
|
|
(31.5
|
)
|
(131.0
|
)
|
—
|
|
(42.0
|
)
|
|||||||||
|
Adjusted CAD
|
|
$188.7
|
|
|
$112.8
|
|
|
($13.6
|
)
|
|
$93.4
|
|
|
$15.6
|
|
||||
|
Cash used for investing activities
|
|
($223.2
|
)
|
|
($283.2
|
)
|
|
($166.3
|
)
|
|
($196.7
|
)
|
|
($470.5
|
)
|
||||
|
Cash (used for) provided by financing activities
|
|
($6.9
|
)
|
|
$114.4
|
|
|
($116.5
|
)
|
|
($161.4
|
)
|
|
($157.1
|
)
|
||||
|
(a)
|
Capital expenditures exclude timberland acquisitions, real estate development investments, spending on the Rayonier office building and purchases of additional interest in the New Zealand JV.
|
|
(b)
|
Large Dispositions are defined as transactions involving the sale of timberland that exceed $20 million in size and do not have a demonstrable premium relative to timberland value.
|
|
(c)
|
Excludes debt repayments on the New Zealand JV noncontrolling interest shareholder loan. See
Note 5 — Debt
for additional information.
|
The following table provides supplemental cash flow data for the five years ended
December 31
(in millions):
|
|
2017
|
2016
|
2015
|
2014
|
2013
|
||||||||||||||
|
Purchase of timberlands
|
|
($242.9
|
)
|
|
($366.5
|
)
|
|
($98.4
|
)
|
|
($130.9
|
)
|
|
($20.4
|
)
|
||||
|
Real Estate Development Investments
|
(15.8
|
)
|
(8.7
|
)
|
(2.7
|
)
|
(3.7
|
)
|
(1.3
|
)
|
|||||||||
|
Distributions to New Zealand minority shareholder (a)
|
(15.8
|
)
|
(4.9
|
)
|
(1.4
|
)
|
(1.2
|
)
|
(1.0
|
)
|
|||||||||
|
Rayonier Office Building
|
(6.1
|
)
|
(6.3
|
)
|
(0.9
|
)
|
—
|
|
—
|
|
|||||||||
|
Purchase of additional interest in New Zealand joint venture
|
—
|
|
—
|
|
—
|
|
—
|
|
(139.9
|
)
|
|||||||||
|
(a)
|
Includes debt repayments on the New Zealand JV noncontrolling interest shareholder loan. See
Note 5 — Debt
for additional information.
|
OFF-BALANCE SHEET ARRANGEMENTS
We utilize off-balance sheet arrangements to provide credit support for certain suppliers and vendors in case of their default on critical obligations, and collateral for certain self-insurance programs that we maintain. These arrangements consist of standby letters of credit and surety bonds. As part of our ongoing operations, we also periodically issue guarantees to third parties. Off-balance sheet arrangements are not considered a source of liquidity or capital resources and do not expose us to material risks or material unfavorable financial impacts. See
Note 11 — Guarantees
for further discussion.
52
CONTRACTUAL FINANCIAL OBLIGATIONS
In addition to using cash flow from operations and proceeds from Large Dispositions, we finance our operations and acquisitions through the issuance of debt and by entering into leases. These financial obligations are recorded in accordance with accounting rules applicable to the underlying transaction, with the result that some are recorded as liabilities on the Consolidated Balance Sheets, while others are required to be disclosed in the Notes to Consolidated Financial Statements and Management’s Discussion and Analysis.
The following table aggregates our contractual financial obligations as of
December 31, 2017
and anticipated cash spending by period:
|
Contractual Financial Obligations (in millions)
|
Total
|
Payments Due by Period
|
|||||||||||||||||
|
2018
|
2019-2020
|
2021-2022
|
Thereafter
|
||||||||||||||||
|
Long-term debt (a)
|
|
$1,025.0
|
|
—
|
|
|
$50.0
|
|
|
$325.0
|
|
|
$650.0
|
|
|||||
|
Current maturities of long-term debt
|
3.4
|
|
3.4
|
|
—
|
|
—
|
|
—
|
|
|||||||||
|
Interest payments on long-term debt (b)
|
206.2
|
|
33.9
|
|
67.2
|
|
55.8
|
|
49.3
|
|
|||||||||
|
Operating leases — timberland
|
200.9
|
|
9.7
|
|
18.3
|
|
17.7
|
|
155.2
|
|
|||||||||
|
Operating leases — PP&E, offices
|
4.5
|
|
1.1
|
|
1.6
|
|
1.2
|
|
0.6
|
|
|||||||||
|
Commitments — derivatives (c)
|
23.9
|
|
3.7
|
|
7.0
|
|
7.0
|
|
6.2
|
|
|||||||||
|
Commitments — other (d)
|
14.3
|
|
8.0
|
|
5.8
|
|
0.5
|
|
—
|
|
|||||||||
|
Total contractual cash obligations
|
|
$1,478.2
|
|
|
$59.8
|
|
|
$149.9
|
|
|
$407.2
|
|
|
$861.3
|
|
||||
|
(a)
|
The book value of long-term debt, net of deferred financing costs, is currently recorded at
$1,022.0 million
on the Company’s Consolidated Balance Sheet, but upon maturity the liability will be
$1,025.0 million
.
|
|
(b)
|
Projected interest payments for variable-rate debt were calculated based on outstanding principal amounts and interest rates as of
December 31, 2017
.
|
|
(c)
|
Commitments — derivatives represent payments expected to be made on derivative financial instruments (foreign exchange contracts and interest rate swaps). See
Note 13 — Derivative Financial Instruments and Hedging Activities
.
|
|
(d)
|
Commitments — other include
$2.9 million
of pension contribution requirements in 2018 based on actuarially determined estimates and IRS minimum funding requirements, payments expected to be made on the construction of the Wildlight development project and other purchase obligations. For additional information on the pension contribution see
Note 15 — Employee Benefit Plans
.
|
53
|
Item 7A.
|
QUANTITATIVE AND QUALITATIVE DISCLOSURES ABOUT MARKET RISK
|
We are exposed to various market risks, including changes in interest rates, commodity prices and foreign exchange rates. Our objective is to minimize the economic impact of these market risks. We use derivatives in accordance with policies and procedures approved by the Audit Committee of the Board of Directors. Derivatives are managed by a senior executive committee whose responsibilities include initiating, managing and monitoring resulting exposures. We do not enter into financial instruments for trading or speculative purposes.
Interest Rate Risk
We are exposed to interest rate risk through our variable rate debt, primarily due to changes in LIBOR. However, we use interest rate swaps to manage our exposure to interest rate movements on our term credit agreements by swapping existing and anticipated future borrowings from floating rates to fixed rates. As of December 31, 2017 we had $700 million of U.S. long-term variable rate debt. The notional amount of outstanding interest rate swap contracts at December 31, 2017 was $650 million. The term credit agreement and associated interest rate swaps mature in August 2024 and the incremental term loan agreement and associated interest rate swaps mature in May 2026. At this borrowing level, a hypothetical one-percentage point increase/decrease in interest rates would result in a corresponding increase/decrease of approximately $0.5 million in interest payments and expense over a 12-month period.
The fair market value of our long-term fixed interest rate debt is also subject to interest rate risk. The estimated fair value of our long-term fixed rate debt at December 31, 2017 was $330 million compared to the $325 million principal amount. We use interest rates of debt with similar terms and maturities to estimate the fair value of our debt. Generally, the fair market value of fixed-rate debt will increase as interest rates fall and decrease as interest rates rise. A hypothetical one-percentage point increase/decrease in prevailing interest rates at December 31, 2017 would result in a corresponding decrease/increase in the fair value of our long-term fixed rate debt of approximately $13 million.
We estimate the periodic effective interest rate on U.S. long-term fixed and variable rate debt to be approximately 3.3% after consideration of interest rate swaps and estimated patronage refunds, excluding unused commitment fees on the revolving credit facility.
The following table summarizes our outstanding debt, interest rate swaps and average interest rates, by year of expected maturity and their fair values at December 31, 2017:
|
(Dollars in thousands)
|
2018
|
2019
|
2020
|
2021
|
2022
|
Thereafter
|
Total
|
Fair Value
|
|||||||
|
Variable rate debt:
|
|||||||||||||||
|
Principal amounts
|
—
|
—
|
$50,000
|
—
|
—
|
$650,000
|
$700,000
|
$700,000
|
|||||||
|
Average interest rate (a)(b)
|
—
|
—
|
2.82%
|
—
|
—
|
3.12%
|
3.10%
|
—
|
|||||||
|
Fixed rate debt:
|
|||||||||||||||
|
Principal amounts
|
$3,375
|
—
|
—
|
—
|
$325,000
|
—
|
$328,375
|
$333,510
|
|||||||
|
Average interest rate (b)
|
—
|
—
|
—
|
—
|
3.75%
|
—
|
3.71%
|
—
|
|||||||
|
Interest rate swaps:
|
|||||||||||||||
|
Variable to Fixed
|
—
|
—
|
—
|
—
|
—
|
$650,000
|
$650,000
|
$15,440
|
|||||||
|
Average pay rate (b)
|
—
|
—
|
—
|
—
|
—
|
1.91%
|
1.91%
|
—
|
|||||||
|
Average receive rate (b)
|
—
|
—
|
—
|
—
|
—
|
1.37%
|
1.37%
|
—
|
|||||||
(a) Excludes estimated patronage refunds.
(b) Interest rates as of December 31, 2017.
54
Foreign Currency Exchange Rate Risk
The functional currency of the Company’s New Zealand-based operations and New Zealand JV is the New Zealand dollar. Through these operations and our ownership in the New Zealand JV, we are exposed to foreign currency risk on cash held in foreign currencies, shareholder loan payments which are denominated in U.S. dollars and on foreign export sales and ocean freight payments that are predominantly denominated in U.S. dollars. To mitigate these risks, the New Zealand JV routinely enters into foreign currency exchange contracts and foreign currency option contracts to hedge a portion of the New Zealand JV’s foreign exchange exposure. At
December 31, 2017
, the New Zealand JV had foreign currency exchange contracts representing 27% of forecast shareholder distribution payments over the next 12 months. At
December 31, 2017
, the New Zealand JV also had foreign currency exchange contracts with a notional amount of $107 million and foreign currency option contracts with a notional amount of $48 million outstanding related to foreign export sales and ocean freight payments. The amount hedged represents 64% of forecast U.S. dollar denominated harvesting sales proceeds over the next 18 months and 50% of log trading sales proceeds over the next 3 months. At
December 31, 2017
, the New Zealand JV also had foreign currency exchange contracts with a notional amount of $2 million outstanding on behalf of suppliers.
55
|
Item 8.
|
FINANCIAL STATEMENTS AND SUPPLEMENTARY DATA
|
INDEX TO FINANCIAL STATEMENTS
|
|
Page
|
56
MANAGEMENT’S REPORT ON INTERNAL CONTROL OVER FINANCIAL REPORTING
To Our Shareholders:
The management of Rayonier Inc. and its subsidiaries is responsible for establishing and maintaining adequate internal control over financial reporting (as defined in Rule 13a-15(f) under the Securities Exchange Act of 1934, as amended). Our system of internal controls over financial reporting is designed to provide reasonable assurance to the Company’s management and Board of Directors regarding the preparation and fair presentation of the financial statements for external purposes in accordance with accounting principles generally accepted in the United States of America.
Because of the inherent limitations of internal control over financial reporting, misstatements due to error or fraud may not be prevented or detected on a timely basis. Also, projections of any evaluation of effectiveness to future periods are subject to the risk that controls may become inadequate because of changes in conditions, or that the degree of compliance with the policies or procedures may deteriorate.
Rayonier Inc.’s management, under the supervision of the Chief Executive Officer and Chief Financial Officer, assessed the effectiveness of our internal control over financial reporting as of
December 31, 2017
. In making this assessment, we used the framework included in
Internal Control — Integrated Framework
issued by the Committee of Sponsoring Organizations of the Treadway Commission (2013 framework). Based on our evaluation under the criteria set forth in
Internal Control — Integrated Framework
, management concluded that our internal control over financial reporting was effective as of
December 31, 2017
.
Ernst & Young LLP, the independent registered public accounting firm that audited the Company’s consolidated financial statements, has issued an audit report on the Company’s internal control over financial reporting as of
December 31, 2017
. The report on the Company’s internal control over financial reporting as of
December 31, 2017
, is on page
58
.
|
RAYONIER INC.
|
|
|
By:
|
/s/ DAVID L. NUNES
|
|
David L. Nunes
President and Chief Executive Officer
(Principal Executive Officer)
|
|
|
February 23, 2018
|
|
|
By:
|
/s/ MARK MCHUGH
|
|
Mark McHugh
Senior Vice President and Chief Financial Officer
(Principal Financial Officer)
|
|
|
February 23, 2018
|
|
|
By:
|
/s/ APRIL TICE
|
|
April Tice
Director, Financial Services and Corporate Controller
(Principal Accounting Officer)
|
|
|
February 23, 2018
|
|
57
REPORT OF INDEPENDENT REGISTERED PUBLIC ACCOUNTING FIRM
To the Shareholders and the Board of Directors of Rayonier Inc.
Opinion on Internal Control over Financial Reporting
We have audited Rayonier Inc. and Subsidiaries’ internal control over financial reporting as of December 31, 2017, based on criteria established in Internal Control - Integrated Framework issued by the Committee of Sponsoring Organizations of the Treadway Commission (2013 framework) (the COSO criteria). In our opinion, Rayonier Inc. and Subsidiaries (the Company) maintained, in all material respects, effective internal control over financial reporting as of December 31, 2017, based on the COSO criteria.
We also have audited, in accordance with the standards of the Public Company Accounting Oversight Board (United States) (PCAOB), the consolidated balance sheets of the Company as of December 31, 2017 and 2016, the related consolidated statements of income and comprehensive income, shareholders’ equity and cash flows for each of the three years in the period ended December 31, 2017, and the related notes and schedule and our report dated February 23, 2018 expressed an unqualified opinion thereon.
Basis for Opinion
The Company’s management is responsible for maintaining effective internal control over financial reporting and for its assessment of the effectiveness of internal control over financial reporting included in the accompanying Management’s Report on Internal Control over Financial Reporting. Our responsibility is to express an opinion on the Company’s internal control over financial reporting based on our audit. We are a public accounting firm registered with the PCAOB and are required to be independent with respect to the Company in accordance with the U.S. federal securities laws and the applicable rules and regulations of the Securities and Exchange Commission and the PCAOB.
We conducted our audit in accordance with the standards of the PCAOB. Those standards require that we plan and perform the audit to obtain reasonable assurance about whether effective internal control over financial reporting was maintained in all material respects.
Our audit included obtaining an understanding of internal control over financial reporting, assessing the risk that a material weakness exists, testing and evaluating the design and operating effectiveness of internal control based on the assessed risk, and performing such other procedures as we considered necessary in the circumstances. We believe that our audit provides a reasonable basis for our opinion.
Definition and Limitations of Internal Control Over Financial Reporting
A company’s internal control over financial reporting is a process designed to provide reasonable assurance regarding the reliability of financial reporting and the preparation of financial statements for external purposes in accordance with generally accepted accounting principles. A company’s internal control over financial reporting includes those policies and procedures that (1) pertain to the maintenance of records that, in reasonable detail, accurately and fairly reflect the transactions and dispositions of the assets of the company; (2) provide reasonable assurance that transactions are recorded as necessary to permit preparation of financial statements in accordance with generally accepted accounting principles, and that receipts and expenditures of the company are being made only in accordance with authorizations of management and directors of the company; and (3) provide reasonable assurance regarding prevention or timely detection of unauthorized acquisition, use, or disposition of the company’s assets that could have a material effect on the financial statements.
Because of its inherent limitations, internal control over financial reporting may not prevent or detect misstatements. Also, projections of any evaluation of effectiveness to future periods are subject to the risk that controls may become inadequate because of changes in conditions, or that the degree of compliance with the policies or procedures may deteriorate.
|
/s/ Ernst & Young LLP
|
|
Certified Public Accountants
|
Jacksonville, Florida
February 23, 2018
58
REPORT OF INDEPENDENT REGISTERED PUBLIC ACCOUNTING FIRM
To the Shareholders and the Board of Directors of Rayonier Inc.
Opinion on the Financial Statements
We have audited the accompanying consolidated balance sheets of Rayonier Inc. and Subsidiaries (the Company) as of December 31, 2017 and 2016, the related consolidated statements of income and comprehensive income, shareholders' equity and cash flows for each of the three years in the period ended December 31, 2017, and the related notes and financial statement schedule listed in the Index at Item 15(a) (collectively referred to as the “consolidated financial statements”). In our opinion, the consolidated financial statements present fairly, in all material respects, the financial position of the Company at December 31, 2017 and 2016, and the results of its operations and its cash flows for each of the three years in the period ended December 31, 2017, in conformity with U.S. generally accepted accounting principles.
We also have audited, in accordance with the standards of the Public Company Accounting Oversight Board (United States) (PCAOB), the Company's internal control over financial reporting as of December 31, 2017, based on criteria established in Internal Control-Integrated Framework issued by the Committee of Sponsoring Organizations of the Treadway Commission (2013 framework), and our report dated February 23, 2018 expressed an unqualified opinion thereon.
Basis for Opinion
These financial statements are the responsibility of the Company's management. Our responsibility is to express an opinion on the Company’s financial statements based on our audits. We are a public accounting firm registered with the PCAOB and are required to be independent with respect to the Company in accordance with the U.S. federal securities laws and the applicable rules and regulations of the Securities and Exchange Commission and the PCAOB.
We conducted our audits in accordance with the standards of the PCAOB. Those standards require that we plan and perform the audit to obtain reasonable assurance about whether the financial statements are free of material misstatement, whether due to error or fraud. Our audits included performing procedures to assess the risks of material misstatement of the financial statements, whether due to error or fraud, and performing procedures that respond to those risks. Such procedures included examining, on a test basis, evidence regarding the amounts and disclosures in the financial statements. Our audits also included evaluating the accounting principles used and significant estimates made by management, as well as evaluating the overall presentation of the financial statements. We believe that our audits provide a reasonable basis for our opinion.
|
/
s
/ Ernst & Young LLP
|
|
Certified Public Accountants
|
We have served as the Company’s auditor since 2012.
Jacksonville, Florida
February 23, 2018
59
RAYONIER INC. AND SUBSIDIARIES
For the Years Ended December 31,
(Thousands of dollars, except per share data)
|
|
2017
|
2016
|
2015
|
||||||||
|
SALES
|
|
$819,596
|
|
|
$815,915
|
|
|
$568,800
|
|
||
|
Costs and Expenses
|
|||||||||||
|
Cost of sales
|
568,253
|
|
526,439
|
|
441,718
|
|
|||||
|
Selling and general expenses
|
40,245
|
|
42,785
|
|
45,750
|
|
|||||
|
Other operating (income) expense, net
(Note 17)
|
(4,393
|
)
|
(9,086
|
)
|
3,548
|
|
|||||
|
604,105
|
|
560,138
|
|
491,016
|
|
||||||
|
OPERATING INCOME
|
215,491
|
|
255,777
|
|
77,784
|
|
|||||
|
Interest expense
|
(34,071
|
)
|
(32,245
|
)
|
(31,699
|
)
|
|||||
|
Interest income and miscellaneous income (expense), net
|
1,840
|
|
(698
|
)
|
(3,003
|
)
|
|||||
|
INCOME BEFORE INCOME TAXES
|
183,260
|
|
222,834
|
|
43,082
|
|
|||||
|
Income tax (expense) benefit
(Note 9)
|
(21,681
|
)
|
(5,064
|
)
|
859
|
|
|||||
|
NET INCOME
|
161,579
|
|
217,770
|
|
43,941
|
|
|||||
|
Less: Net income (loss) attributable to noncontrolling interest
|
12,737
|
|
5,798
|
|
(2,224
|
)
|
|||||
|
NET INCOME ATTRIBUTABLE TO RAYONIER INC.
|
148,842
|
|
211,972
|
|
46,165
|
|
|||||
|
OTHER COMPREHENSIVE INCOME (LOSS)
|
|||||||||||
|
Foreign currency translation adjustment, net of income tax effect of $0, $0 and $1,066
|
9,114
|
|
6,322
|
|
(32,451
|
)
|
|||||
|
Cash flow hedges, net of income tax effect of $594, $545 and $91
|
5,693
|
|
22,822
|
|
(9,961
|
)
|
|||||
|
Actuarial change and amortization of pension and postretirement plan liabilities, net of income tax effect of $0, $0 and $470
|
(208
|
)
|
5,533
|
|
2,933
|
|
|||||
|
14,599
|
|
34,677
|
|
(39,479
|
)
|
||||||
|
COMPREHENSIVE INCOME
|
176,178
|
|
252,447
|
|
4,462
|
|
|||||
|
Less: Comprehensive income (loss) attributable to noncontrolling interest
|
14,775
|
|
9,555
|
|
(13,027
|
)
|
|||||
|
COMPREHENSIVE INCOME ATTRIBUTABLE TO RAYONIER INC.
|
|
$161,403
|
|
|
$242,892
|
|
|
$17,489
|
|
||
|
EARNINGS PER COMMON SHARE
(NOTE 12)
|
|||||||||||
|
Basic earnings per share attributable to Rayonier Inc.
|
|
$1.17
|
|
|
$1.73
|
|
|
$0.37
|
|
||
|
Diluted earnings per share attributable to Rayonier Inc.
|
|
$1.16
|
|
|
$1.73
|
|
|
$0.37
|
|
||
See Notes to Consolidated Financial Statements.
60
RAYONIER INC. AND SUBSIDIARIES
As of December 31,
(Thousands of dollars)
|
|
2017
|
2016
|
|||||
|
ASSETS
|
|||||||
|
CURRENT ASSETS
|
|||||||
|
Cash and cash equivalents
|
|
$112,653
|
|
|
$85,909
|
|
|
|
Accounts receivable, less allowance for doubtful accounts of $23 and $33
|
27,693
|
|
20,664
|
|
|||
|
Inventory
(Note 18)
|
24,141
|
|
21,379
|
|
|||
|
Prepaid logging roads
|
11,207
|
|
10,228
|
|
|||
|
Prepaid expenses
|
4,786
|
|
1,579
|
|
|||
|
Assets held for sale
(Note 21)
|
—
|
|
23,171
|
|
|||
|
Other current assets
|
3,047
|
|
1,874
|
|
|||
|
Total current assets
|
183,527
|
|
164,804
|
|
|||
|
TIMBER AND TIMBERLANDS, NET OF DEPLETION AND AMORTIZATION
|
2,462,066
|
|
2,291,015
|
|
|||
|
HIGHER AND BETTER USE TIMBERLANDS AND REAL ESTATE DEVELOPMENT
INVESTMENTS
(NOTE 6)
|
80,797
|
|
70,374
|
|
|||
|
PROPERTY, PLANT AND EQUIPMENT
|
|||||||
|
Land
|
3,962
|
|
2,279
|
|
|||
|
Buildings
|
23,618
|
|
7,990
|
|
|||
|
Machinery and equipment
|
4,440
|
|
4,658
|
|
|||
|
Construction in progress
|
627
|
|
8,170
|
|
|||
|
Total property, plant and equipment, gross
|
32,647
|
|
23,097
|
|
|||
|
Less—accumulated depreciation
|
(9,269
|
)
|
(9,063
|
)
|
|||
|
Total property, plant and equipment, net
|
23,378
|
|
14,034
|
|
|||
|
RESTRICTED CASH
(NOTE 19)
|
59,703
|
|
71,708
|
|
|||
|
OTHER ASSETS
(NOTE 20)
|
49,010
|
|
73,825
|
|
|||
|
TOTAL ASSETS
|
|
$2,858,481
|
|
|
$2,685,760
|
|
|
|
LIABILITIES AND SHAREHOLDERS’ EQUITY
|
|||||||
|
CURRENT LIABILITIES
|
|||||||
|
Accounts payable
|
|
$25,148
|
|
|
$22,337
|
|
|
|
Current maturities of long-term debt
(Note 5)
|
3,375
|
|
31,676
|
|
|||
|
Accrued taxes
|
3,781
|
|
2,657
|
|
|||
|
Accrued payroll and benefits
|
9,662
|
|
9,277
|
|
|||
|
Accrued interest
|
5,054
|
|
5,340
|
|
|||
|
Deferred revenue
|
9,721
|
|
9,099
|
|
|||
|
Other current liabilities
|
11,807
|
|
11,580
|
|
|||
|
Total current liabilities
|
68,548
|
|
91,966
|
|
|||
|
LONG-TERM DEBT, NET OF DEFERRED FINANCING COSTS
(NOTE 5)
|
1,022,004
|
|
1,030,205
|
|
|||
|
PENSION AND OTHER POSTRETIREMENT BENEFITS
(NOTE 15)
|
31,905
|
|
31,856
|
|
|||
|
OTHER NON-CURRENT LIABILITIES
|
43,084
|
|
34,981
|
|
|||
|
|
|
|
|
||||
|
SHAREHOLDERS’ EQUITY
|
|||||||
|
Common Shares, 480,000,000 shares authorized, 128,970,776 and 122,904,368 shares issued and outstanding
|
872,228
|
|
709,867
|
|
|||
|
Retained earnings
|
707,378
|
|
700,887
|
|
|||
|
Accumulated other comprehensive income
(Note 22)
|
13,417
|
|
856
|
|
|||
|
TOTAL RAYONIER INC. SHAREHOLDERS’ EQUITY
|
1,593,023
|
|
1,411,610
|
|
|||
|
Noncontrolling interest
|
99,917
|
|
85,142
|
|
|||
|
TOTAL SHAREHOLDERS’ EQUITY
|
1,692,940
|
|
1,496,752
|
|
|||
|
TOTAL LIABILITIES AND SHAREHOLDERS’ EQUITY
|
|
$2,858,481
|
|
|
$2,685,760
|
|
|
See Notes to Consolidated Financial Statements.
61
RAYONIER INC. AND SUBSIDIARIES
CONSOLIDATED STATEMENTS OF SHAREHOLDERS' EQUITY
(Thousands of dollars, except share data)
|
|
Common Shares
|
Retained
Earnings
|
Accumulated
Other
Comprehensive
Income/(Loss)
|
Non-controlling Interest
|
Shareholders’
Equity
|
|||||||||||||||||
|
|
Shares
|
Amount
|
||||||||||||||||||||
|
Balance, December 31, 2014
|
126,773,097
|
|
|
$702,598
|
|
|
$790,697
|
|
|
($4,825
|
)
|
|
$86,681
|
|
|
$1,575,151
|
|
|||||
|
Net income
|
—
|
|
—
|
|
46,165
|
|
—
|
|
(2,224
|
)
|
43,941
|
|
||||||||||
|
Dividends ($1.00 per share)
|
—
|
|
—
|
|
(124,943
|
)
|
—
|
|
—
|
|
(124,943
|
)
|
||||||||||
|
Issuance of shares under incentive stock plans
|
205,219
|
|
2,117
|
|
—
|
|
—
|
|
—
|
|
2,117
|
|
||||||||||
|
Stock-based compensation
|
—
|
|
4,484
|
|
—
|
|
—
|
|
—
|
|
4,484
|
|
||||||||||
|
Tax deficiency on stock-based compensation
|
—
|
|
(250
|
)
|
—
|
|
—
|
|
—
|
|
(250
|
)
|
||||||||||
|
Repurchase of common shares
|
(4,208,099
|
)
|
(122
|
)
|
(100,000
|
)
|
—
|
|
—
|
|
(100,122
|
)
|
||||||||||
|
Actuarial change and amortization of pension and postretirement plan liabilities
|
—
|
|
—
|
|
—
|
|
2,933
|
|
—
|
|
2,933
|
|
||||||||||
|
Adjustments to Rayonier Advanced Materials
|
—
|
|
—
|
|
841
|
|
—
|
|
—
|
|
841
|
|
||||||||||
|
Foreign currency translation adjustment
|
—
|
|
—
|
|
—
|
|
(21,567
|
)
|
(10,884
|
)
|
(32,451
|
)
|
||||||||||
|
Cash flow hedges
|
—
|
|
—
|
|
—
|
|
(10,044
|
)
|
83
|
|
(9,961
|
)
|
||||||||||
|
Balance, December 31, 2015
|
122,770,217
|
|
|
$708,827
|
|
|
$612,760
|
|
|
($33,503
|
)
|
|
$73,656
|
|
|
$1,361,740
|
|
|||||
|
Net income
|
—
|
|
—
|
|
211,972
|
|
—
|
|
5,798
|
|
217,770
|
|
||||||||||
|
Dividends ($1.00 per share)
|
—
|
|
—
|
|
(123,155
|
)
|
—
|
|
—
|
|
(123,155
|
)
|
||||||||||
|
Issuance of shares under incentive stock plans
|
179,743
|
|
1,576
|
|
—
|
|
—
|
|
—
|
|
1,576
|
|
||||||||||
|
Stock-based compensation
|
—
|
|
5,136
|
|
—
|
|
—
|
|
—
|
|
5,136
|
|
||||||||||
|
Repurchase of common shares
|
(45,592
|
)
|
(178
|
)
|
(690
|
)
|
—
|
|
—
|
|
(868
|
)
|
||||||||||
|
Actuarial change and amortization of pension and postretirement plan liabilities
|
—
|
|
—
|
|
—
|
|
5,533
|
|
—
|
|
5,533
|
|
||||||||||
|
Foreign currency translation adjustment
|
—
|
|
—
|
|
—
|
|
2,780
|
|
3,542
|
|
6,322
|
|
||||||||||
|
Cash flow hedges
|
—
|
|
—
|
|
—
|
|
22,608
|
|
214
|
|
22,822
|
|
||||||||||
|
Recapitalization of New Zealand Joint Venture
|
—
|
|
(5,398
|
)
|
—
|
|
3,438
|
|
1,960
|
|
—
|
|
||||||||||
|
Recapitalization costs
|
—
|
|
(96
|
)
|
—
|
|
—
|
|
(28
|
)
|
(124
|
)
|
||||||||||
|
Balance, December 31, 2016
|
122,904,368
|
|
|
$709,867
|
|
|
$700,887
|
|
|
$856
|
|
|
$85,142
|
|
|
$1,496,752
|
|
|||||
|
Cumulative-effect adjustment due to adoption of ASU No. 2016-16
|
—
|
|
—
|
|
(14,365
|
)
|
—
|
|
—
|
|
(14,365
|
)
|
||||||||||
|
Net income
|
—
|
|
—
|
|
148,842
|
|
—
|
|
12,737
|
|
161,579
|
|
||||||||||
|
Dividends ($1.00 per share)
|
—
|
|
—
|
|
(127,986
|
)
|
—
|
|
—
|
|
(127,986
|
)
|
||||||||||
|
Issuance of shares under incentive stock plans
|
322,314
|
|
4,751
|
|
—
|
|
—
|
|
—
|
|
4,751
|
|
||||||||||
|
Stock-based compensation
|
—
|
|
5,396
|
|
—
|
|
—
|
|
—
|
|
5,396
|
|
||||||||||
|
Repurchase of common shares
|
(5,906
|
)
|
(176
|
)
|
—
|
|
—
|
|
—
|
|
(176
|
)
|
||||||||||
|
Actuarial change and amortization of pension and postretirement plan liabilities
|
—
|
|
—
|
|
—
|
|
(208
|
)
|
—
|
|
(208
|
)
|
||||||||||
|
Foreign currency translation adjustment
|
—
|
|
—
|
|
—
|
|
7,416
|
|
1,698
|
|
9,114
|
|
||||||||||
|
Cash flow hedges
|
—
|
|
—
|
|
—
|
|
5,353
|
|
340
|
|
5,693
|
|
||||||||||
|
Issuance of shares under equity offering, net of costs
|
5,750,000
|
|
152,390
|
|
—
|
|
—
|
|
—
|
|
152,390
|
|
||||||||||
|
Balance, December 31, 2017
|
128,970,776
|
|
|
$872,228
|
|
|
$707,378
|
|
|
$13,417
|
|
|
$99,917
|
|
|
$1,692,940
|
|
|||||
See Notes to Consolidated Financial Statements.
62
RAYONIER INC. AND SUBSIDIARIES
For the Years Ended
December 31
,
(Thousands of dollars)
|
|
2017
|
|
2016
|
|
2015
|
||||||
|
OPERATING ACTIVITIES
|
|
|
|
|
|
||||||
|
Net income
|
|
$161,579
|
|
|
|
$217,770
|
|
|
|
$43,941
|
|
|
Adjustments to reconcile net income to cash provided by operating activities:
|
|
|
|
|
|||||||
|
Depreciation, depletion and amortization
|
127,566
|
|
|
115,142
|
|
|
113,708
|
|
|||
|
Non-cash cost of land and real estate sold
|
13,684
|
|
|
11,690
|
|
|
12,509
|
|
|||
|
Stock-based incentive compensation expense
|
5,396
|
|
|
5,136
|
|
|
4,484
|
|
|||
|
Amortization of debt discount/premium
|
—
|
|
|
(462
|
)
|
|
604
|
|
|||
|
Deferred income taxes
|
21,980
|
|
|
5,170
|
|
|
(1,475
|
)
|
|||
|
Non-cash adjustments to unrecognized tax benefit liability
|
—
|
|
—
|
|
135
|
|
|||||
|
Amortization of losses from pension and postretirement plans
|
465
|
|
|
2,513
|
|
|
3,403
|
|
|||
|
Gain on sale of Large Dispositions
|
(66,994
|
)
|
(143,933
|
)
|
—
|
|
|||||
|
Other
|
(716
|
)
|
|
336
|
|
|
350
|
|
|||
|
Changes in operating assets and liabilities:
|
|
|
|
|
|||||||
|
Receivables
|
(6,362
|
)
|
|
2,517
|
|
|
2,034
|
|
|||
|
Inventories
|
(1,384
|
)
|
|
(1,175
|
)
|
|
(9,749
|
)
|
|||
|
Accounts payable
|
3,435
|
|
|
(559
|
)
|
|
1,863
|
|
|||
|
Income tax receivable/payable
|
(434
|
)
|
|
(206
|
)
|
|
(894
|
)
|
|||
|
All other operating activities
|
(1,931
|
)
|
|
(10,138
|
)
|
|
6,251
|
|
|||
|
CASH PROVIDED BY OPERATING ACTIVITIES
|
256,284
|
|
|
203,801
|
|
|
177,164
|
|
|||
|
INVESTING ACTIVITIES
|
|
|
|
|
|
||||||
|
Capital expenditures
|
(65,345
|
)
|
|
(58,723
|
)
|
|
(57,293
|
)
|
|||
|
Real estate development investments
|
(15,784
|
)
|
(8,746
|
)
|
(2,676
|
)
|
|||||
|
Purchase of timberlands
|
(242,910
|
)
|
|
(366,481
|
)
|
|
(98,409
|
)
|
|||
|
Assets purchased in business acquisition
|
—
|
|
(887
|
)
|
—
|
|
|||||
|
Net proceeds from Large Dispositions
|
95,243
|
|
203,862
|
|
—
|
|
|||||
|
Proceeds from settlement of foreign currency hedge
|
—
|
|
—
|
|
2,804
|
|
|||||
|
Rayonier office building under construction
|
(6,084
|
)
|
(6,307
|
)
|
(908
|
)
|
|||||
|
Change in restricted cash
|
12,005
|
|
|
(48,184
|
)
|
|
(16,836
|
)
|
|||
|
Other
|
(373
|
)
|
|
2,311
|
|
|
7,009
|
|
|||
|
CASH USED FOR INVESTING ACTIVITIES
|
(223,248
|
)
|
|
(283,155
|
)
|
|
(166,309
|
)
|
|||
|
FINANCING ACTIVITIES
|
|
|
|
|
|
||||||
|
Issuance of debt
|
63,389
|
|
695,916
|
|
|
472,558
|
|
||||
|
Repayment of debt
|
(100,157
|
)
|
(458,415
|
)
|
|
(364,402
|
)
|
||||
|
Dividends paid
|
(127,069
|
)
|
(122,845
|
)
|
|
(124,936
|
)
|
||||
|
Proceeds from the issuance of common shares
|
4,751
|
|
|
1,576
|
|
|
2,117
|
|
|||
|
Proceeds from the issuance of common shares from equity offering, net of costs
|
152,390
|
|
—
|
|
—
|
|
|||||
|
Repurchase of common shares
|
(176
|
)
|
(690
|
)
|
(100,000
|
)
|
|||||
|
Debt issuance costs
|
—
|
|
|
(818
|
)
|
|
(1,678
|
)
|
|||
|
Other
|
—
|
|
(301
|
)
|
(122
|
)
|
|||||
|
CASH (USED FOR) PROVIDED BY FINANCING ACTIVITIES
|
(6,872
|
)
|
|
114,423
|
|
|
(116,463
|
)
|
|||
|
EFFECT OF EXCHANGE RATE CHANGES ON CASH
|
580
|
|
|
(937
|
)
|
|
(4,173
|
)
|
|||
|
CASH AND CASH EQUIVALENTS
|
|
|
|
|
|
||||||
|
Change in cash and cash equivalents
|
26,744
|
|
34,132
|
|
|
(109,781
|
)
|
||||
|
Balance, beginning of year
|
85,909
|
|
51,777
|
|
|
161,558
|
|
||||
|
Balance, end of year
|
|
$112,653
|
|
|
$85,909
|
|
|
|
$51,777
|
|
|
63
RAYONIER INC. AND SUBSIDIARIES
CONSOLIDATED STATEMENTS OF CASH FLOWS (CONTINUED)
For the Years Ended
December 31
,
(Thousands of dollars)
|
2017
|
2016
|
2015
|
|||||||||
|
SUPPLEMENTAL DISCLOSURES OF CASH FLOW INFORMATION
|
|||||||||||
|
Cash paid during the year:
|
|||||||||||
|
Interest
|
|
$36,041
|
|
|
$36,289
|
|
|
$33,011
|
|
||
|
Income taxes
|
514
|
|
501
|
|
277
|
|
|||||
|
Non-cash investing activity:
|
|||||||||||
|
Capital assets purchased on account
|
3,809
|
|
4,683
|
|
3,429
|
|
|||||
|
Purchase of timberlands
|
—
|
|
—
|
|
700
|
|
|||||
See Notes to Consolidated Financial Statements.
64
RAYONIER INC. AND SUBSIDIARIES
NOTES TO CONSOLIDATED FINANCIAL STATEMENTS
(Dollar amounts in thousands unless otherwise stated)
|
1.
|
NATURE OF BUSINESS OPERATIONS
|
Rayonier Inc., a North Carolina corporation, including its consolidated subsidiaries (“Rayonier” or “the Company”), is a leading timberland real estate investment trust (“REIT”) with assets located in some of the most productive softwood timber growing regions in the U.S. and New Zealand. Shares of the Company have a
$0.00
par value. Rayonier owns or leases approximately
2.6 million
acres of timberland, located in the United States and New Zealand. Included in this property is approximately
0.2 million
acres of timberlands located primarily along the coastal region from Savannah, Georgia to Daytona Beach, Florida, some of which has long-term potential for real estate development. The Company also engages in the trading of logs, primarily to support the Company’s New Zealand export operations.
Rayonier operates in
five
reportable business segments: Southern Timber, Pacific Northwest Timber, New Zealand Timber, Real Estate and Trading. See
Note 4 — Segment and Geographical Information
for further discussion of reportable business segments.
The Company is a REIT and is generally not required to pay federal income taxes on its U.S. timber harvest earnings and other U.S. REIT operations contingent upon meeting applicable distribution, income, asset, shareholder and other tests. The U.S. timber operations are primarily conducted by the Company’s wholly-owned REIT subsidiaries. Non-REIT qualifying and certain foreign operations, which are subject to corporate-level tax on earnings, are operated by taxable subsidiaries. These operations include the Real Estate segment’s entitlement activities, limited development activities and sale of higher and better use (“HBU”) properties. The Company’s consolidated joint venture, Matariki Forestry Group (“New Zealand JV”), is subject to entity-level tax in New Zealand.
SOUTHERN, PACIFIC NORTHWEST AND NEW ZEALAND TIMBER
The Company’s Timber segments own or lease approximately
2.6 million
acres of timberlands located in the U.S. and New Zealand. The Timber segments conduct timber harvesting activities, manage timberlands and sell timber and logs to third parties. On March 3, 2016, the Company acquired an additional
12%
interest in the New Zealand JV, which currently owns or leases approximately
410,000
gross acres (
293,000
net plantable acres) of New Zealand timberlands. The acquisition of additional interest brought the Company’s ownership to
77%
. The Company maintains a controlling financial interest in the New Zealand JV and, accordingly, consolidates the New Zealand JV’s balance sheet and results of operations. Rayonier’s wholly-owned subsidiary, Rayonier New Zealand Limited (“RNZ”) serves as the manager of the New Zealand JV forests. See
Note 7 — Joint Venture Investment
.
During 2017, the Company acquired approximately
109,000
acres of timberlands in Florida, Georgia, South Carolina, Washington and New Zealand for
$242.9 million
. During 2016, the Company acquired approximately
111,000
acres of timberlands in the U.S. for
$366.5 million
. See
Note 3 — Timberland Acquisitions
for additional information.
REAL ESTATE
The vast majority of the Company’s HBU properties are managed as timberland and generate cash flow from timber operations prior to their sale or, in the case of Improved Development properties, prior to improvement. All of the Company’s U.S. land sales, including HBU and non-HBU, are reported in the Real Estate segment. Rayonier employs a detailed land classification process for all of its timberland and HBU acres.
TRADING
The Company’s trading business is comprised of log trading conducted by the New Zealand JV in
two
core areas of business: managed export services on behalf of third parties and procured logs for export sale by the New Zealand JV. The Trading segment primarily complements the New Zealand Timber segment by adding scale and achieving cost savings that directly benefit the New Zealand Timber segment.
65
RAYONIER INC. AND SUBSIDIARIES
NOTES TO CONSOLIDATED FINANCIAL STATEMENTS (Continued)
(Dollar amounts in thousands unless otherwise stated)
|
2.
|
SUMMARY OF SIGNIFICANT ACCOUNTING POLICIES
|
BASIS OF PRESENTATION AND PRINCIPLES OF CONSOLIDATION
The Company’s consolidated financial statements have been prepared in accordance with accounting principles generally accepted in the United States of America (“U.S. GAAP”). These statements include the accounts of Rayonier Inc. and its subsidiaries, in which it has a majority ownership or controlling interest. As of April 2013, the Company held a controlling interest (
65%
) in the New Zealand JV, and, as such, consolidates its results of operations and Balance Sheet. In March 2016, the Company made a capital contribution into the New Zealand JV, and as a result, the Company’s ownership interest increased to
77%
. The Company records a noncontrolling interest in its consolidated financial statements representing the minority ownership interest (
23%
) of the New Zealand JV’s results of operations and equity. All intercompany balances and transactions are eliminated.
RECLASSIFICATION OF OTHER OPERATING INCOME, NET
In an effort to report certain revenue and expenses in a manner more representative of activities that constitute ongoing central operations, the Company has changed its classification of primarily lease and license income, other non-timber income, carbon credit sales and log agency fees, net of costs from “Other Operating Income (Expense), Net” to “Sales” and “Cost of Sales.” This reclassification was applied retrospectively to all periods presented and had no effect on the presentation of operating income, net income, consolidated balance sheets, or consolidated statements of cash flows.
The impact of the reclassification for the three years ended
December 31, 2017
are as follows:
|
|
Year Ended December 31, 2017
|
|||||||||||
|
|
Prior to Reclassification
|
|
Change in Accounting Classification
|
|
As Adjusted
|
|
||||||
|
Sales
|
|
$792,659
|
|
|
$26,937
|
|
|
$819,596
|
|
|||
|
Cost of sales
|
565,889
|
|
2,364
|
|
568,253
|
|
||||||
|
Other operating (income) expense, net
|
(28,966
|
)
|
24,573
|
|
(4,393
|
)
|
||||||
|
|
Year Ended December 31, 2016
|
|||||||||||
|
|
As Previously Classified
|
|
Change in Accounting Classification
|
|
As Adjusted
|
|
||||||
|
Sales
|
|
$788,278
|
|
|
$27,637
|
|
|
$815,915
|
|
|||
|
Cost of sales
|
524,707
|
|
1,732
|
|
526,439
|
|
||||||
|
Other operating (income) expense, net
|
(34,991
|
)
|
25,905
|
|
(9,086
|
)
|
||||||
|
|
Year Ended December 31, 2015
|
|||||||||||
|
|
As Previously Classified
|
|
Change in Accounting Classification
|
|
As Adjusted
|
|
||||||
|
Sales
|
|
$544,874
|
|
|
$23,926
|
|
|
$568,800
|
|
|||
|
Cost of sales
|
441,099
|
|
619
|
|
441,718
|
|
||||||
|
Other operating (income) expense, net
|
(19,759
|
)
|
23,307
|
|
3,548
|
|
||||||
USE OF ESTIMATES
The preparation of financial statements in conformity with U.S. GAAP requires management to make estimates and assumptions that affect the reported amounts of assets and liabilities and to disclose contingent assets and liabilities at the date of the financial statements and the reported amounts of revenues and expenses during the reporting period. There are risks inherent in estimating and therefore actual results could differ from those estimates.
66
RAYONIER INC. AND SUBSIDIARIES
NOTES TO CONSOLIDATED FINANCIAL STATEMENTS (Continued)
(Dollar amounts in thousands unless otherwise stated)
CASH AND CASH EQUIVALENTS
Cash and cash equivalents include time deposits with original maturities of three months or less. The consolidated cash balance includes time deposits of
$26.7 million
and
$25.6 million
at
December 31, 2017
and
December 31, 2016
, respectively.
ACCOUNTS RECEIVABLE
Accounts receivable are primarily amounts due to the Company for the sale of timber and are presented net of an allowance for doubtful accounts.
INVENTORY
HBU real estate properties that are expected to be sold within one year are included in inventory at lower of cost or net realizable value. HBU properties that are expected to be sold after one year are included in a separate balance sheet line, entitled “Higher and Better Use Timberlands and Real Estate Development Investments.” See below for additional information.
Inventory also includes logs available to be sold by the Trading segment. Log inventory is recorded at the lower of cost or net realizable value and expensed to cost of sales when sold to third-party buyers. See
Note 18 — Inventory
for additional information.
PREPAID LOGGING ROADS
Costs for roads built in the Pacific Northwest and New Zealand to access particular tracts to be harvested in the upcoming
24 months
to
60 months
are recorded as prepaid logging roads. The Company charges such costs to expense as timber is harvested using an amortization rate determined annually as the total cost of prepaid roads divided by the estimated tons of timber to be accessed by those roads. The prepaid balance is classified as short-term or long-term based on the upcoming harvest schedule. See
Note 20 — Other Assets
for additional information.
ASSETS HELD FOR SALE
Assets that meet the held-for-sale criteria in ASC 360-10-45-9 are recorded in a separate balance sheet line, entitled “Assets Held for Sale,” and measured at the lower of the carrying amount or fair value less cost to sell. See
Note 21 — Assets Held for Sale
for additional information.
TIMBER AND TIMBERLANDS
Timber is stated at the lower of cost or net realizable value. Costs relating to acquiring, planting and growing timber including real estate taxes, site preparation and direct support costs relating to facilities, vehicles and supplies are capitalized. Annual lease payments are capitalized or expensed based on the proportion of acres that the Company will be able to harvest prior to lease expiration. Lease payments made within one year of expiration are expensed as incurred. Payroll costs are capitalized for time spent on timber growing activities, while interest or any other intangible costs are not capitalized. An annual depletion rate is established for each particular region by dividing merchantable inventory cost by standing merchantable inventory volume, which is estimated annually. The Company charges accumulated costs attributed to merchantable timber to depletion expense (cost of sales), at the time the timber is harvested or when the underlying timberland is sold.
Upon the acquisition of timberland, the Company makes a determination on whether to combine the newly acquired merchantable timber with an existing depletion pool or to create a new, separate pool. This determination is based on the geographic location of the new timber, the customers/markets that will be served and the species mix. If the acquisition is similar, the cost of the acquired timber is combined into an existing depletion pool and a new depletion rate is calculated for the pool. This determination and depletion rate adjustment normally occurs in the quarter following the acquisition.
67
RAYONIER INC. AND SUBSIDIARIES
NOTES TO CONSOLIDATED FINANCIAL STATEMENTS (Continued)
(Dollar amounts in thousands unless otherwise stated)
HIGHER AND BETTER USE TIMBERLANDS AND REAL ESTATE DEVELOPMENT INVESTMENTS
HBU timberland is recorded at the lower of cost or net realizable value. These properties are managed as timberlands until sold or developed with sales and depletion expense related to the harvesting of timber accounted for within the respective timber segment. At the time of sale, the cost basis of any unharvested timber is recorded as depletion expense, a component of cost of sales, within the Real Estate segment.
Real estate development investments include capitalized costs for targeted infrastructure improvements, such as roadways and utilities. HBU timberland and real estate development investments expected to be sold within twelve months are recorded as inventory. See
Note 6 — Higher and Better Use Timberlands and Real Estate Development Investments
for additional information.
PROPERTY, PLANT, EQUIPMENT AND DEPRECIATION
Property, plant and equipment additions are recorded at cost, including applicable freight, interest, construction and installation costs. The Company depreciates its assets, including office and transportation equipment, using the straight-line depreciation method over
3
to
25
years. Buildings and land improvements are depreciated using the straight-line method over
15
to
35
years and
5
to
30
years, respectively.
Gains and losses on the retirement of assets are included in operating income. Long-lived assets are reviewed for impairment whenever events or changes in circumstances indicate the carrying amount of an asset may not be recoverable. Recoverability of assets that are held and used is measured by net undiscounted cash flows expected to be generated by the asset. If such assets are considered to be impaired, the impairment to be recognized is the amount the carrying value exceeds the fair value of the assets, which is based on a discounted cash flow model. Assets to be disposed of are reported at the lower of the carrying amount or fair value less cost to sell.
FAIR VALUE MEASUREMENTS
Fair value is defined as the exchange price that would be received for an asset or paid to transfer a liability (an exit price) in the principal or most advantageous market for the asset or liability in an orderly transaction between market participants at the measurement date. A three-level hierarchy that prioritizes the inputs used to measure fair value was established as follows:
Level 1
— Quoted prices in active markets for identical assets or liabilities.
Level 2
— Observable inputs other than quoted prices included in Level 1, such as quoted prices for similar assets and liabilities in active markets, quoted prices for identical or similar assets and liabilities in markets that are not active; or other inputs that are observable or can be corroborated by observable market data.
Level 3
— Unobservable inputs that are supported by little or no market activity and that are significant to the fair value of the assets or liabilities. This includes certain pricing models, discounted cash flow methodologies and similar techniques that use significant unobservable inputs.
GOODWILL
Goodwill represents the excess of the acquisition cost of the New Zealand Timber segment over the fair value of the net assets acquired. Goodwill is not amortized, but is periodically reviewed for impairment. An impairment test for this reporting unit’s goodwill is performed annually and whenever events or circumstances indicate that the value of goodwill may be impaired. The Company compares the fair value of the New Zealand Timber segment, using an independent valuation for the New Zealand forest assets, to its carrying value including goodwill. The independent valuation of the New Zealand forest assets is based on discounted cash flow models where the fair value is calculated using cash flows from sustainable forest management plans. The fair value of the forest assets is measured as the present value of cash flows from one growth cycle based on the productive forest land, taking into consideration environmental, operational, and market restrictions. These cash flow valuations involve a number of estimates that require broad assumptions and significant judgment regarding future performance. The annual impairment test was performed as of October 1, 2017; the estimated fair value of the New Zealand Timber segment exceeded its carrying value and
no
impairment was recorded.
68
RAYONIER INC. AND SUBSIDIARIES
NOTES TO CONSOLIDATED FINANCIAL STATEMENTS (Continued)
(Dollar amounts in thousands unless otherwise stated)
FOREIGN CURRENCY TRANSLATION
The functional currency of the Company’s New Zealand-based operations is the New Zealand dollar. All assets and liabilities are translated into U.S. dollars at the exchange rate in effect at the respective balance sheet dates. Translation gains and losses are recorded as a separate component of Accumulated Other Comprehensive Income (“AOCI”), within Shareholders’ Equity.
U.S. denominated transactions of the New Zealand JV are translated into New Zealand dollars at the exchange rate in effect on the date of the transaction and recognized in earnings, net of related cash flow hedges. All income statement items of the New Zealand JV are translated into U.S. dollars for reporting purposes using monthly average exchange rates with translation gains and losses being recorded as a separate component of AOCI, within Shareholders’ Equity.
REVENUE RECOGNITION
The Company generally recognizes revenues when the following criteria are met: (i) persuasive evidence of an agreement exists, (ii) delivery has occurred or services rendered, (iii) the Company’s price to the buyer is fixed and determinable, and (iv) collectibility is reasonably assured.
TIMBER SALES
Revenue from the sale of timber is recognized when title passes to the buyer. The Company utilizes
two
primary methods or sales channels for the sale of timber, a stumpage or standing timber model and a delivered log model. The sales method the Company employs depends upon local market conditions and which method management believes will provide the best overall margins. Under the stumpage model, standing timber is sold primarily under pay-as-cut contracts, with specified duration (typically
one
year or less) and fixed prices, whereby revenue is recognized as timber is severed and the sales volume is determined. The Company also sells stumpage under lump-sum contracts for specified parcels where the Company receives cash for the full agreed value of the timber prior to harvest and title and risk of loss pass to the buyer upon signing the contract. The Company retains interest in the land, slash products, and the use of the land for recreational and other purposes. Any uncut timber remaining at the end of the contract period reverts to the Company. Revenue is recognized for lump-sum timber sales when payment is received, the contract is signed and title and risk of loss pass to the buyer. A third type of stumpage sale the Company utilizes is an agreed-volume sale, whereby revenue is recognized as periodic physical observations are made of the percentage of acreage harvested.
Under the delivered log model, the Company hires third-party loggers and haulers to harvest timber and deliver it to a buyer. Sales of domestic logs generally do not require an initial payment and are made to third-party customers on open credit terms. Sales of export logs generally require a letter of credit from an approved bank.
Revenue is recognized when the logs are delivered and title and risk of loss transfer to the buyer. For domestic log sales, title and risk are considered passed to the buyer as the logs are delivered to the customer. For export log sales (primarily in New Zealand), title and risk are considered passed to the buyer at the time the ship leaves the port.
Non-timber income is primarily comprised of hunting and recreational licenses. Such income and any related cost are recognized ratably over the term of the agreement and included in “Sales” and “Cost of Sales”, respectively.
LOG TRADING
Domestic log trading revenue for sales within New Zealand is recorded when the goods are received by the customer and title passes. Export log trading revenue is recorded when the ship leaves the port, at which time title passes to the customer.
69
RAYONIER INC. AND SUBSIDIARIES
NOTES TO CONSOLIDATED FINANCIAL STATEMENTS (Continued)
(Dollar amounts in thousands unless otherwise stated)
REAL ESTATE
The Company generally recognizes revenue on sales of real estate using the full accrual method at closing when cash has been received, title and risk of loss have passed to the buyer and there is no continuing involvement with the property. Revenue is recognized using the percentage-of-completion method on sales of real estate containing future performance obligations. Cost of sales associated with real estate sold includes the cost of the land, the cost of any timber on the property that was conveyed to the buyer, any real estate development costs and any closing costs including sales commissions that may be borne by the Company. Costs incurred to obtain land use entitlements or for infrastructure such as utilities, roads or other improvements are charged to cost of sales for a project as a percentage of revenue earned to total anticipated revenue and costs for each project.
When developed residential or commercial land is sold, the cost of sales includes actual costs incurred and estimates of future development costs benefiting the property sold through completion. Costs are allocated to each sold unit or lot based upon the relative sales value. For purposes of allocating development costs, estimates of future revenues and development costs are re-evaluated periodically throughout the year, with adjustments being allocated prospectively to the remaining units available for sale.
EMPLOYEE BENEFIT PLANS
The determination of expense and funding requirements for Rayonier’s defined benefit pension plan, its unfunded excess pension plan and its postretirement life insurance plan are largely based on a number of actuarial assumptions. The key assumptions include discount rate, return on assets, salary increases, mortality rates and longevity of employees. See
Note 15 — Employee Benefit Plans
for assumptions used to determine benefit obligations, and the net periodic benefit cost for the year ended
December 31, 2017
.
Periodic pension and other postretirement expense is included in “Cost of sales” and “Selling and general expenses” in the Consolidated Statements of Income and Comprehensive Income. At
December 31, 2017
and
2016
, the Company’s pension plans were in a net liability position (underfunded) of
$30.6 million
and
$30.6 million
, respectively. The estimated amount to be paid in the next 12 months is recorded in “Accrued payroll and benefits” on the Consolidated Balance Sheets, with the remainder recorded as a long-term liability in “Pension and Other Postretirement Benefits.” Changes in the funded status of the Company’s plans are recorded through other comprehensive income (loss) in the year in which the changes occur. The Company measures
plan assets and benefit obligations as of the fiscal year-end. See
Note 15 — Employee Benefit Plans
for additional information.
INCOME TAXES
The Company uses the asset and liability method of accounting for income taxes. Under this method, deferred tax assets and liabilities are recognized for the estimated future tax consequences attributable to differences between the financial statement carrying amounts of assets and liabilities and their respective tax bases, operating loss carryforwards and tax credit carryforwards. Deferred tax assets and liabilities are measured pursuant to tax laws using rates expected to apply to taxable income in the years in which the temporary differences are expected to be recovered or settled. The Company recognizes the effect of a change in income tax rates on deferred tax assets and liabilities in the Consolidated Statements of Income and Comprehensive Income in the period that includes the enactment date of the rate change. The Company records a valuation allowance to reduce the carrying amounts of deferred tax assets if it is more-likely-than-not that such deferred tax assets will not be realized.
In determining the provision for income taxes, the Company computes an annual effective income tax rate based on annual income by legal entity, permanent differences between book and tax, and statutory income tax rates by jurisdiction. Inherent in the effective tax rate is an assessment of the ultimate outcome of current period uncertain tax positions. The Company adjusts its annual effective tax rate as additional information on outcomes or events becomes available. Discrete items such as taxing authority examination findings or legislative changes are recognized in the period in which they occur.
70
RAYONIER INC. AND SUBSIDIARIES
NOTES TO CONSOLIDATED FINANCIAL STATEMENTS (Continued)
(Dollar amounts in thousands unless otherwise stated)
The Company’s income tax returns are subject to audit by U.S. federal, state and foreign taxing authorities. In evaluating the tax benefits associated with various tax filing positions, the Company records a tax benefit for an uncertain tax position if it is more-likely-than-not to be realized upon ultimate settlement of the issue. The Company records a liability for an uncertain tax position that does not meet this criterion. The Company adjusts its liabilities for uncertain tax benefits in the period in which it is determined the issue is settled with the taxing authorities, the statute of limitations expires for the relevant taxing authority to examine the tax position or when new facts or information becomes available. Liabilities for unrecognized tax benefits are included in “Other Non-Current Liabilities” in the Company’s Consolidated Balance Sheets. See
Note 9 — Income Taxes
for additional information.
RECENTLY ADOPTED ACCOUNTING PRONOUNCEMENTS
In October 2016, the Financial Accounting Standards Board (“FASB”) issued Accounting Standards Update (“ASU”) No. 2016-16, Intra-Entity Transfers of Assets Other Than Inventory, stating entities should recognize income tax consequences of intra-entity transfers of assets other than inventory in the period in which they occur. As such, the Company is required to apply the changes on a modified retrospective basis through a cumulative-effect adjustment directly to retained earnings as of the beginning of the period of adoption. ASU No. 2016-16 is effective for annual periods beginning after December 15, 2017 with early adoption permitted at the beginning of an annual period for which financial statements have not been issued. Rayonier early adopted ASU No. 2016-16 during the first quarter ended March 31, 2017. See
Note 9 — Income Taxes
for additional information.
In March 2016, the FASB issued ASU No. 2016-09, Compensation - Stock Compensation (Topic 718): Improvements to Employee Share-Based Payment Accounting. This update simplifies the accounting for employee share-based payment transactions, including the accounting for income taxes, forfeitures and statutory tax withholding requirements, as well as classification in the statement of cash flows. ASU No. 2016-09 is effective for annual periods beginning after December 15, 2016, and interim periods within those annual periods. Rayonier adopted ASU No. 2016-09 during the first quarter ended March 31, 2017. Upon adoption, additional excess tax benefits and tax deficiencies are recorded to “Income tax expense” in the Consolidated Statements of Income and Comprehensive Income, forfeitures are accounted for when they occur and cash paid by Rayonier when directly withholding shares for tax withholding purposes are classified as a financing activity within the Consolidated Statements of Cash Flows. The adoption of this standard did not have a material impact on the consolidated financial statements.
In January 2017, the FASB issued ASU No. 2017-01, Business Combinations (Topic 805): Clarifying the Definition of a Business, which revised the definition of a business. This update will likely result in more of Rayonier’s future timberland acquisitions being accounted for as asset acquisitions as opposed to acquisitions of a businesses. ASU No. 2017-01 is effective for annual periods beginning after December 15, 2017 with early adoption permitted, including adoption in an interim period. Rayonier early adopted ASU No. 2017-01 during the fourth quarter ended December 31, 2017 and will apply the standard prospectively, as required.
Rayonier adopted ASU Nos. 2015-11, 2016-01 (early adopted), 2016-05, 2017-04 (early adopted) and 2017-09 (early adopted) in the fourth quarter ended December 31, 2017 with no material impact on the consolidated financial statements.
NEW ACCOUNTING PRONOUNCEMENTS
In August 2017, the FASB issued ASU No. 2017-12, Derivatives and Hedging (Topic 815): Targeted Improvements to Accounting for Hedging Activities, which will make more financial and nonfinancial hedging strategies eligible for hedge accounting. It also amends the presentation and disclosure requirements and changes how companies assess effectiveness. It is intended to more closely align hedge accounting with companies’ risk management strategies, simplify the application of hedge accounting, and increase transparency as to the scope and results of hedging programs. ASU No. 2017-12 is effective for annual periods beginning after December 15, 2018, and interim periods within those annual periods. Early adoption is permitted and the amended presentation and disclosure guidance is required to be applied on a prospective basis. The Company is currently evaluating the impact of adopting this new guidance on the consolidated financial statements.
71
RAYONIER INC. AND SUBSIDIARIES
NOTES TO CONSOLIDATED FINANCIAL STATEMENTS (Continued)
(Dollar amounts in thousands unless otherwise stated)
In March 2017, the FASB issued ASU No. 2017-07, Compensation - Retirement Benefits (Topic 715): Improving the Presentation of Net Periodic Pension Cost and Net Periodic Postretirement Benefit Cost, which requires that an employer report the service cost component of net periodic benefit cost in the Consolidated Statements of Income in the same line item as other compensation costs arising from services rendered by the pertinent employees during the period. Additionally, the other components of net periodic benefit cost (interest cost, expected return on plan assets and amortization of losses or gains) are required to be presented in the income statement separately from the service cost component and outside a subtotal of income from operations. If a separate line item is used to present the other components of net benefit cost, that line item must be appropriately described. If a separate line item is not used, the line item used in the income statement to present the other components of net benefit cost must be disclosed. ASU No. 2017-07 is effective for annual periods beginning after December 15, 2017, including interim periods within those annual periods. ASU No. 2017-07 is required to be applied retrospectively to all periods presented beginning in the period of adoption. Rayonier intends to adopt ASU No. 2017-07 in the Company’s first quarter 2018 Form 10-Q. Interest cost, expected return on plan assets and amortization of losses or gains are currently recorded in “Selling and general expenses” and “Cost of sales” in the Consolidated Statements of Income and “Timber and timberlands, net of depletion and amortization” in the Consolidated Balance Sheets. Upon adoption, these components of net period benefit cost will be recorded in “Interest income and miscellaneous income (expense), net.” As the Company froze benefits for all employees participating in the pension plan effective December 31, 2016, the service cost component of net period benefit is no longer recognized by Rayonier. Based on current actuarial estimates and management assumptions, Rayonier anticipates that the adoption of this standard will not have a significant impact on the Company’s consolidated financial statements. See
Note 15 — Employee Benefit Plans
for the components of net periodic benefit cost.
In November 2016, the FASB issued ASU No. 2016-18, Statement of Cash Flows (Topic 230): Restricted Cash, which requires that a statement of cash flows explain the change during the period in the total of cash, cash equivalents and amounts generally described as restricted cash or restricted cash equivalents. Therefore, amounts generally described as restricted cash and restricted cash equivalents should be included with cash and cash equivalents when reconciling the beginning-of-period and end-of-period total amounts shown on the Consolidated Statements of Cash Flows. ASU No. 2016-18 is effective for annual periods beginning after December 15, 2017, and interim periods within those annual periods. ASU No. 2016-18 is required to be applied retrospectively to all periods presented beginning in the period of adoption. Rayonier intends to adopt ASU No. 2016-18 in the Company’s first quarter 2018 Form 10-Q. The Company currently records changes in restricted cash within the investing section of the Consolidated Statements of Cash Flows. Upon adoption, restricted cash will be included with cash and cash equivalents when reconciling the beginning-of-period and end-of-period total amounts shown on the Consolidated Statements of Cash Flows and therefore changes in restricted cash will not be reported as cash flow activities. Rayonier will continue to disclose the nature of restrictions on the Company’s cash, cash equivalents, and restricted cash. See
Note 19 — Restricted Cash
for additional information.
In August 2016, the FASB issued ASU No. 2016-15, Statement of Cash Flows (Topic 230): Classification of Certain Cash Receipts and Cash Payments, which addresses the diversity in practice in how certain cash receipts and cash payments are presented and classified in the Consolidated Statements of Cash Flows under Topic 230, Statement of Cash Flows, and other Topics. This update addresses eight specific cash flow issues with the objective of reducing the existing diversity in practice. ASU No. 2016-15 is effective for annual periods beginning after December 15, 2017, and interim periods within those annual periods. ASU No. 2016-15 is required to be applied retrospectively to all periods presented beginning in the period of adoption. Early adoption is permitted. The Company anticipates the adoption of this standard will not have a significant impact on the Company’s consolidated financial statements.
In February 2016, the FASB issued ASU No. 2016-02, Leases (Topic 842), which currently requires lessees to recognize most leases on their balance sheets related to the rights and obligations created by those leases. ASU No. 2016-02 also requires additional qualitative and quantitative disclosures related to the nature, timing and uncertainty of cash flows arising from leases. ASU No. 2016-02 is effective for annual reporting periods beginning after December 15, 2018, including interim periods within that reporting period. ASU No. 2016-02 is required to be applied on a modified retrospective basis beginning at the earliest period presented. Early adoption is permitted. The Company is currently evaluating the impact of adopting this new guidance on the consolidated financial statements.
72
RAYONIER INC. AND SUBSIDIARIES
NOTES TO CONSOLIDATED FINANCIAL STATEMENTS (Continued)
(Dollar amounts in thousands unless otherwise stated)
In May 2014, the FASB and International Accounting Standards Board (“IASB”) jointly issued ASU No. 2014-09, Revenue from Contracts with Customers (Topic 606), a comprehensive new revenue recognition standard that will supersede current revenue recognition guidance. The guidance provides a unified model to determine when and how revenue is recognized and will require enhanced disclosures regarding the nature, amount, timing and uncertainty of revenue and cash flows arising from an entity’s contracts with customers. In August 2015, the FASB issued ASU No. 2015-14, Revenue from Contracts with Customers - Deferral of the Effective Date. ASU No. 2015-14 provides a one-year deferral of the effective date of the new standard, with an option for organizations to adopt early based on the original effective date. In April 2016, the FASB issued ASU No. 2016-10, Revenue from Contracts with Customers - Identifying Performance Obligations and Licensing. The update clarifies the guidance for identifying performance obligations. In May 2016, the FASB issued ASU No. 2016-12, Revenue from Contracts with Customers (Topic 606): Narrow-Scope Improvements and Practical Expedients. The update clarifies the guidance for assessing collectibility, presenting sales taxes and other similar taxes collected from customers, non-cash consideration, contract modifications at transition, completed contracts at transition and disclosing the accounting change in the period of adoption. In February 2017, the FASB issued ASU No. 2017-05, Other Income - Gains and Losses from the Derecognition of Nonfinancial Assets (Subtopic 610-20): Clarifying the Scope of Asset Derecognition Guidance and Accounting for Partial Sales of Nonfinancial Assets. The update clarifies that a financial asset is within the scope of Subtopic 610-20 if it meets the definition of an in substance nonfinancial asset. This standard will be effective for Rayonier beginning January 1, 2018 and can be applied either retrospectively to each period presented or as a cumulative-effect adjustment as of the date of adoption. The Company expects to adopt using the cumulative-effect method.
As of December 31, 2017, and subject to the Company’s ongoing evaluation of new transactions and contracts, Rayonier has substantially completed its evaluation of the expected impact of adopting Topic 606 and anticipates that the adoption of this standard will not have a significant impact on the Company’s consolidated financial statements aside from adding expanded disclosures. Rayonier is also currently identifying and implementing appropriate changes to its business processes, systems and controls to support revenue recognition and disclosures under Topic 606. A material change in controls over financial reporting is not anticipated.
SUBSEQUENT EVENTS
The Company has evaluated events occurring from
December 31, 2017
to the date of issuance for potential recognition or disclosure in the consolidated financial statements. No events were identified that warranted recognition or disclosure.
73
RAYONIER INC. AND SUBSIDIARIES
NOTES TO CONSOLIDATED FINANCIAL STATEMENTS (Continued)
(Dollar amounts in thousands unless otherwise stated)
|
3.
|
TIMBERLAND ACQUISITIONS
|
In 2017, the Company acquired approximately
95,100
acres of timberlands (including approximately
11,000
acres of leased lands) in Florida, Georgia and South Carolina for
$214.3 million
using proceeds from the offering and sale of
5.75 million
shares under the universal shelf registration along with like-kind exchange proceeds. In
five
additional transactions throughout
2017
, Rayonier purchased approximately
7,000
acres of timberland located in Georgia and Washington for approximately
$7.2 million
, which were funded with like-kind exchange proceeds. All acquisitions were accounted for as asset purchases.
Additionally, in
two
transactions during 2017, the Company acquired forestry rights covering approximately
8,000
acres of timberland with mature timber in New Zealand for approximately
$21.4 million
. These acquisitions were funded through the short-term working capital facility, which was fully repaid during the year.
In 2016, the Company completed a business combination that resulted in the acquisition of
61,000
acres of timberland in Oregon and Washington for a final purchase price of approximately
$263 million
. The acquisition was funded with proceeds received from a Large Disposition completed in May 2016 and by entering into a
$300 million
incremental term loan. In
five
additional transactions throughout
2016
, Rayonier purchased approximately
50,000
acres of timberland located in Florida, Georgia and Texas for approximately
$103.9 million
. These acquisitions were funded with cash on hand, like-kind exchange proceeds, and borrowings under the revolving credit facility, and were accounted for as asset purchases.
The following table summarizes the timberland acquisitions at December 31,
2017
and
2016
:
|
2017
|
2016
|
||||||||||||
|
Cost
|
Acres
|
Cost
|
Acres
|
||||||||||
|
Florida
|
|
$32,334
|
|
15,382
|
|
|
$14,323
|
|
6,937
|
|
|||
|
Georgia
|
147,833
|
|
68,473
|
|
12,485
|
|
5,427
|
|
|||||
|
Oregon
|
—
|
|
—
|
|
239,896
|
|
55,603
|
|
|||||
|
South Carolina
|
39,884
|
|
17,651
|
|
—
|
|
—
|
|
|||||
|
Texas
|
—
|
|
—
|
|
77,139
|
|
37,513
|
|
|||||
|
Washington
|
1,483
|
|
481
|
|
22,638
|
|
5,247
|
|
|||||
|
New Zealand
|
21,376
|
|
7,546
|
|
—
|
|
—
|
|
|||||
|
Total Acquisitions
|
|
$242,910
|
|
109,533
|
|
|
$366,481
|
|
110,727
|
|
|||
74
RAYONIER INC. AND SUBSIDIARIES
NOTES TO CONSOLIDATED FINANCIAL STATEMENTS (Continued)
(Dollar amounts in thousands unless otherwise stated)
|
4.
|
SEGMENT AND GEOGRAPHICAL INFORMATION
|
Rayonier operates in
five
reportable segments: Southern Timber, Pacific Northwest Timber, New Zealand Timber, Real Estate and Trading.
The Company’s timber businesses are disaggregated into Southern Timber, Pacific Northwest Timber and New Zealand Timber segments. Sales in the Timber segments include all activities related to the harvesting of timber in addition to lease and license activities, other non-timber activities and carbon credit sales.
Real Estate sales include all U.S. property sales, including those lands designated as higher and better use (HBU). The Company’s Real Estate sales categories include Improved Development, Unimproved Development, Rural, Non-Strategic / Timberlands and Large Dispositions. Large Dispositions include sales of timberland that exceed
$20 million
in size and do not have a demonstrable premium relative to timberland value. Improved development includes sales of development property for which Rayonier, through one of its taxable REIT subsidiaries, has invested in infrastructure to enhance the value and marketability of the property. The unimproved development sales category comprises properties sold for commercial, industrial or residential development purposes and for which Rayonier has not invested in site improvements such as infrastructure.
The Trading segment comprises log trading in New Zealand, conducted by the Company’s New Zealand JV in
two
core areas of business, managed export services on behalf of third parties and procured logs for export sale by the New Zealand JV. Sales in the Trading segment also include log agency fees. The Trading segment primarily complements the New Zealand Timber segment by adding scale and achieving cost savings that directly benefit the New Zealand Timber segment.
Sales between operating segments are made based on estimated fair market value, and intercompany sales, purchases and profits (losses) are eliminated in consolidation. The Company evaluates financial performance based on segment operating income and Adjusted EBITDA. Asset information is not reported by segment, as the company does not produce asset information by segment internally.
Operating income as presented in the Consolidated Statements of Income and Comprehensive Income is equal to segment income. Certain income (loss) items in the Consolidated Statements of Income and Comprehensive Income are not allocated to segments. These items, which include interest income (expense), miscellaneous income (expense) and income tax (expense) benefit, are not considered by management to be part of segment operations and are included under “Corporate and other.”
Segment information for each of the three years ended
December 31, 2017
follows:
|
|
Sales
|
||||||||||
|
|
2017
|
2016
|
2015
|
||||||||
|
Southern Timber
|
|
$144,510
|
|
|
$151,192
|
|
|
$157,845
|
|
||
|
Pacific Northwest Timber
|
91,877
|
|
77,802
|
|
80,214
|
|
|||||
|
New Zealand Timber
|
247,609
|
|
177,889
|
|
162,803
|
|
|||||
|
Real Estate (a)
|
183,016
|
|
299,350
|
|
86,493
|
|
|||||
|
Trading
|
152,584
|
|
109,682
|
|
81,445
|
|
|||||
|
Total
|
|
$819,596
|
|
|
$815,915
|
|
|
$568,800
|
|
||
(a) The years 2017 and 2016 include Large Dispositions of
$95.4 million
and
$207.3 million
, respectively.
75
RAYONIER INC. AND SUBSIDIARIES
NOTES TO CONSOLIDATED FINANCIAL STATEMENTS (Continued)
(Dollar amounts in thousands unless otherwise stated)
|
|
Operating Income/(Loss)
|
||||||||||
|
|
2017
|
2016
|
2015
|
||||||||
|
Southern Timber
|
|
$42,254
|
|
|
$43,098
|
|
|
$46,669
|
|
||
|
Pacific Northwest Timber
|
1,127
|
|
(3,992
|
)
|
6,917
|
|
|||||
|
New Zealand Timber
|
72,385
|
|
33,072
|
|
2,775
|
|
|||||
|
Real Estate (a)
|
116,038
|
|
202,379
|
|
44,263
|
|
|||||
|
Trading
|
4,578
|
|
2,002
|
|
1,247
|
|
|||||
|
Corporate and other
|
(20,891
|
)
|
(20,782
|
)
|
(24,087
|
)
|
|||||
|
Total Operating Income
|
215,491
|
|
255,777
|
|
77,784
|
|
|||||
|
Unallocated interest expense and other
|
(32,231
|
)
|
(32,943
|
)
|
(34,702
|
)
|
|||||
|
Total Income before Income Taxes
|
|
$183,260
|
|
|
$222,834
|
|
|
$43,082
|
|
||
(a) The years 2017 and 2016 include Large Dispositions of
$67.0 million
and
$143.9 million
, respectively.
|
|
Gross Capital Expenditures
|
||||||||||
|
|
2017
|
2016
|
2015
|
||||||||
|
Capital Expenditures (a)
|
|||||||||||
|
Southern Timber
|
|
$34,476
|
|
|
$33,487
|
|
|
$33,245
|
|
||
|
Pacific Northwest Timber
|
10,254
|
|
8,036
|
|
8,515
|
|
|||||
|
New Zealand Timber
|
17,046
|
|
16,095
|
|
15,143
|
|
|||||
|
Real Estate
|
1,348
|
|
315
|
|
313
|
|
|||||
|
Trading
|
—
|
|
—
|
|
—
|
|
|||||
|
Corporate and other
|
2,221
|
|
790
|
|
77
|
|
|||||
|
Total capital expenditures
|
|
$65,345
|
|
|
$58,723
|
|
|
$57,293
|
|
||
|
Timberland Acquisitions
|
|||||||||||
|
Southern Timber
|
|
$220,051
|
|
|
$103,947
|
|
|
$54,408
|
|
||
|
Pacific Northwest Timber
|
1,483
|
|
262,534
|
|
34,052
|
|
|||||
|
New Zealand Timber
|
21,376
|
|
—
|
|
9,949
|
|
|||||
|
Real Estate
|
—
|
|
—
|
|
—
|
|
|||||
|
Trading
|
—
|
|
—
|
|
—
|
|
|||||
|
Corporate and other
|
—
|
|
—
|
|
—
|
|
|||||
|
Total timberland acquisitions
|
|
$242,910
|
|
|
$366,481
|
|
|
$98,409
|
|
||
|
Total Gross Capital Expenditures
|
|
$308,255
|
|
|
$425,204
|
|
|
$155,702
|
|
||
|
(a)
|
Excludes timberland acquisitions presented separately in addition to spending on the Rayonier office building of
$6.1 million
,
$6.3 million
and
$0.9 million
and real estate development investments of
$15.8 million
,
$8.7 million
and
$2.7 million
in the years 2017, 2016 and 2015, respectively.
|
76
RAYONIER INC. AND SUBSIDIARIES
NOTES TO CONSOLIDATED FINANCIAL STATEMENTS (Continued)
(Dollar amounts in thousands unless otherwise stated)
|
|
Depreciation,
Depletion and Amortization
|
||||||||||
|
|
2017
|
2016
|
2015
|
||||||||
|
Southern Timber
|
|
$49,357
|
|
|
$49,747
|
|
|
$54,299
|
|
||
|
Pacific Northwest Timber
|
32,008
|
|
25,246
|
|
14,842
|
|
|||||
|
New Zealand Timber
|
36,363
|
|
23,447
|
|
29,741
|
|
|||||
|
Real Estate (a)
|
27,479
|
|
52,304
|
|
14,533
|
|
|||||
|
Trading
|
—
|
|
—
|
|
—
|
|
|||||
|
Corporate and other
|
794
|
|
402
|
|
293
|
|
|||||
|
Total
|
|
$146,001
|
|
|
$151,146
|
|
|
$113,708
|
|
||
|
(a)
|
The years 2017 and 2016 include Large Dispositions of
$18.4 million
and
$36.1 million
, respectively.
|
|
|
Non-Cash Cost of Land and Improved Development
|
||||||||||
|
|
2017
|
2016
|
2015
|
||||||||
|
Southern Timber
|
—
|
|
—
|
|
—
|
|
|||||
|
Pacific Northwest Timber
|
—
|
|
—
|
|
—
|
|
|||||
|
New Zealand Timber
|
128
|
|
1,824
|
|
467
|
|
|||||
|
Real Estate (a)
|
23,370
|
|
32,038
|
|
12,042
|
|
|||||
|
Trading
|
—
|
|
—
|
|
—
|
|
|||||
|
Corporate and other
|
—
|
|
—
|
|
—
|
|
|||||
|
Total
|
|
$23,498
|
|
|
$33,862
|
|
|
$12,509
|
|
||
|
|
Sales by Product Line
|
||||||||||
|
|
2017
|
2016
|
2015
|
||||||||
|
Southern Timber
|
|
$144,510
|
|
|
$151,192
|
|
|
$157,845
|
|
||
|
Pacific Northwest Timber
|
91,877
|
|
77,802
|
|
80,214
|
|
|||||
|
New Zealand Timber
|
247,609
|
|
177,889
|
|
162,803
|
|
|||||
|
Real Estate
|
|||||||||||
|
Improved Development
|
6,348
|
|
1,740
|
|
2,610
|
|
|||||
|
Unimproved Development
|
16,405
|
|
5,540
|
|
6,399
|
|
|||||
|
Rural
|
18,632
|
|
18,672
|
|
22,653
|
|
|||||
|
Non-Strategic / Timberlands
|
46,280
|
|
66,133
|
|
54,831
|
|
|||||
|
Large Dispositions
|
95,351
|
|
207,265
|
|
—
|
|
|||||
|
Total Real Estate
|
183,016
|
|
299,350
|
|
86,493
|
|
|||||
|
Trading
|
152,584
|
|
109,682
|
|
81,445
|
|
|||||
|
Total Sales
|
|
$819,596
|
|
|
$815,915
|
|
|
$568,800
|
|
||
|
|
Geographical Operating Information
|
||||||||||||||||||||||||||||||
|
|
Sales
|
Operating Income
|
Identifiable Assets
|
||||||||||||||||||||||||||||
|
|
2017
|
2016
|
2015
|
2017
|
2016
|
2015
|
2017
|
2016
|
|||||||||||||||||||||||
|
United States
|
|
$419,403
|
|
|
$528,344
|
|
|
$324,552
|
|
|
$138,528
|
|
|
$220,703
|
|
|
$73,749
|
|
|
$2,331,230
|
|
|
$2,181,658
|
|
|||||||
|
New Zealand
|
400,193
|
|
287,571
|
|
244,248
|
|
76,963
|
|
35,074
|
|
4,035
|
|
527,251
|
|
504,102
|
|
|||||||||||||||
|
Total
|
|
$819,596
|
|
|
$815,915
|
|
|
$568,800
|
|
|
$215,491
|
|
|
$255,777
|
|
|
$77,784
|
|
|
$2,858,481
|
|
|
$2,685,760
|
|
|||||||
77
RAYONIER INC. AND SUBSIDIARIES
NOTES TO CONSOLIDATED FINANCIAL STATEMENTS (Continued)
(Dollar amounts in thousands unless otherwise stated)
|
5.
|
DEBT
|
Rayonier’s debt consisted of the following at
December 31, 2017
and
2016
:
|
|
2017
|
2016
|
|||||
|
Term Credit Agreement due 2024 at a variable interest rate of 3.0% at December 31, 2017
|
|
$350,000
|
|
|
$350,000
|
|
|
|
Senior Notes due 2022 at a fixed interest rate of 3.75%
|
325,000
|
|
325,000
|
|
|||
|
Incremental Term Loan Agreement due 2026 at a variable interest rate of 3.3% at December 31, 2017
|
300,000
|
|
300,000
|
|
|||
|
Mortgage notes repaid in 2017 at fixed interest rates of 4.35% (a)
|
—
|
|
31,676
|
|
|||
|
Revolving Credit Facility due 2020 at a variable interest rate of 2.8% at December 31, 2017
|
50,000
|
|
25,000
|
|
|||
|
Solid waste bonds repaid in 2017 at a variable interest rate of 2.0% at December 31, 2016
|
—
|
|
15,000
|
|
|||
|
New Zealand JV noncontrolling interest shareholder loan at 0% interest rate
|
3,375
|
|
18,796
|
|
|||
|
Total debt
|
1,028,375
|
|
1,065,472
|
|
|||
|
Less: Current maturities of long-term debt
|
(3,375
|
)
|
(31,676
|
)
|
|||
|
Less: Deferred financing costs
|
(2,996
|
)
|
(3,591
|
)
|
|||
|
Long-term debt, net of deferred financing costs
|
|
$1,022,004
|
|
|
$1,030,205
|
|
|
Principal payments due during the next five years and thereafter are as follows:
|
2018
|
|
$3,375
|
|
|
2019
|
—
|
|
|
|
2020
|
50,000
|
|
|
|
2021
|
—
|
|
|
|
2022
|
325,000
|
|
|
|
Thereafter
|
650,000
|
|
|
|
Total debt
|
|
$1,028,375
|
|
|
(a)
|
The mortgage notes, repaid in August 2017, were recorded at a premium of
$0.2 million
as of December 31,
2016
.
|
TERM CREDIT AGREEMENT
In August 2015, the Company entered into a credit agreement with CoBank, ACB, as administrative agent, and a syndicate of Farm Credit institutions and other commercial banks to provide
$550 million
of new credit facilities, including a
nine
-year
$350 million
term loan facility. The periodic interest rate on the term loan facility is subject to a pricing grid based on the Company’s leverage ratio, as defined in the credit agreement. As of December 31, 2017, the periodic interest rate on the term loan facility was LIBOR plus
1.625%
. Monthly payments of interest only are due on this loan through maturity. Following the closing of the term loan, the Company entered into several interest rate swap transactions to fix the cost of the term loan facility over its
nine
-year term. The term credit agreement allows the Company to receive annual patronage payments, which are profit distributions made by a cooperative to its member-users based on the quantity or value of business done with the member-user. The Company estimates the effective interest rate on the term loan facility to be approximately
3.3%
after consideration of the interest rate swaps and estimated patronage refunds. For additional information on the Company’s interest rate swaps see
Note 13 — Derivative Financial Instruments and Hedging Activities
.
78
RAYONIER INC. AND SUBSIDIARIES
NOTES TO CONSOLIDATED FINANCIAL STATEMENTS (Continued)
(Dollar amounts in thousands unless otherwise stated)
3.75%
SENIOR NOTES ISSUED MARCH 2012
In March 2012, Rayonier Inc. issued
$325 million
of
3.75%
Senior Notes due 2022, guaranteed by certain subsidiaries. Semi-annual payments of interest only are due on these notes through maturity. The guarantors were revised in October 2012, leaving TRS and Rayonier Operating Company LLC as the remaining guarantors. See
Note 24 - Consolidating Financial Statements
for further information regarding the subsidiary guarantors.
INCREMENTAL TERM LOAN AGREEMENT
In April 2016, the Company entered into an incremental term loan agreement with CoBank, ACB, as administrative agent, and a syndicate of Farm Credit institutions to provide a
10
-year,
$300 million
incremental term loan. Proceeds from the new term loan were used to fund Rayonier’s portion of the Menasha acquisition net of the proceeds received from the Washington disposition, to repay approximately
$105 million
outstanding on the Company’s revolving credit facility and for general corporate purposes. The periodic interest rate on the incremental term loan agreement is subject to a pricing grid based on the Company’s leverage ratio, as defined in the credit agreement. As of December 31, 2017, the periodic interest rate on the incremental term loan was LIBOR plus
1.900%
. Monthly payments of interest only are due on this loan through maturity. Following the closing of the incremental term loan, the Company entered into several interest rate swap transactions to fix the cost of the facility over its
10
-year term. The Company estimates the effective interest rate on the incremental term loan facility to be approximately
2.8%
after consideration of the interest rate swaps and estimated patronage payments. For additional information on the Company’s interest rate swaps see
Note 13 — Derivative Financial Instruments and Hedging Activities
.
$105
MILLION SECURED MORTGAGE NOTES ASSUMED
In November 2011, in connection with the acquisition of approximately
250,000
acres of timberlands, the Company assumed notes totaling
$105 million
, secured by mortgages on certain parcels of the timberlands acquired. The notes had fixed interest rates of
4.35%
with original terms of
seven years
maturing in August 2017. The Company prepaid
$21.0 million
of principal on the mortgage notes concurrent with the acquisition and an additional
$10.5 million
during each of the years 2012 through 2016, the maximum amounts allowed without penalty at the respective dates. The remaining principal on the notes of
$31.5 million
was repaid in August 2017.
REVOLVING CREDIT FACILITY
In August 2015, the Company entered into a
five
-year
$200 million
unsecured revolving credit facility, replacing the previous
$200 million
revolving credit facility and $
100 million
farm credit facility which were scheduled to expire in April 2016 and December 2019, respectively. The periodic interest rate on the revolving credit facility is subject to a pricing grid based on the Company’s leverage ratio, as defined in the credit agreement. As of December 31, 2017, the periodic interest rate on the revolving credit facility was LIBOR plus
1.250%
, with an unused commitment fee of
0.175%
. Monthly payments of interest only are due on this loan through maturity. At
December 31, 2017
, the Company had
$139.6 million
of available borrowings under this facility, net of
$10.4 million
to secure its outstanding letters of credit.
JOINT VENTURE DEBT
In April 2013, Rayonier acquired an additional
39%
interest in its New Zealand JV, bringing its total ownership to
65%
, and as a result, the New Zealand JV’s debt was consolidated effective on that date. On March 3, 2016, as a result of a capital contribution, the Company’s ownership interest in the New Zealand JV increased to
77%
. See
Note 7 — Joint Venture Investment
for further information.
SHAREHOLDER LOAN
The shareholder loan is an interest-free loan from the noncontrolling New Zealand JV partner with a remaining principal outstanding of
$3 million
. This loan represents part of the noncontrolling party’s investment in the New Zealand JV. The loan is unsecured and subordinated to the Working Capital Facilities of the New Zealand JV. Although Rayonier Inc. is not liable for this loan, the shareholder loan instrument contains features with characteristics of both debt and equity and is therefore required to be classified as debt and consolidated. As the loan is effectively at par, the carrying amount is deemed to be the fair value. The entire balance of the shareholder loan was classified as short-term debt at
December 31,
2017
since the Company’s intent is to fully repay the loan in 2018.
79
RAYONIER INC. AND SUBSIDIARIES
NOTES TO CONSOLIDATED FINANCIAL STATEMENTS (Continued)
(Dollar amounts in thousands unless otherwise stated)
WORKING CAPITAL FACILITIES
In June 2016, the New Zealand JV entered into a
12
-month NZ
$20 million
working capital facility and an
18
-month NZ
$20 million
working capital facility, replacing the previous NZ
$40 million
facility that expired in June 2016. Both working capital facilities were renewed in 2017 for an additional 12-month term, with new expiration dates of June 30, 2018 and December 31, 2018. The NZ
$40 million
Working Capital Facility is available for short-term operating cash flow needs of the New Zealand JV. This facility holds a variable interest rate indexed to the
90
-day New Zealand Bank Bill rate (“BKBM”). The margins are set for the term of the facility. During the year ended December 31, 2017, the New Zealand JV made borrowings and repayments of
$38.4 million
on its working capital facility. At
December 31,
2017
, there was
no
outstanding balance on the Working Capital Facility.
DEBT COVENANTS
In connection with the Company’s
$350 million
term credit agreement (the “Term Credit Agreement”),
$300 million
incremental term loan agreement (the “Incremental Term Loan Agreement”) and
$200 million
revolving credit facility (“the Revolving Credit Facility”), customary covenants must be met, the most significant of which include interest coverage and leverage ratios.
In addition to these financial covenants listed above, the Senior Notes, Term Credit Agreement, Incremental Term Loan Agreement and Revolving Credit Facility include customary covenants that limit the incurrence of debt and the disposition of assets, among others. At
December 31, 2017
, the Company was in compliance with all covenants.
|
6.
|
HIGHER AND BETTER USE TIMBERLANDS AND REAL ESTATE DEVELOPMENT INVESTMENTS
|
Rayonier continuously assesses potential alternative uses of its timberlands, as some properties may become more valuable for development, residential, recreation or other purposes. The Company periodically transfers, via a sale or contribution from the REIT to TRS, HBU timberlands to enable land-use entitlement, development or marketing activities. The Company also acquires HBU properties in connection with timberland acquisitions. These properties are managed as timberlands until sold or developed. While the majority of HBU sales involve rural and recreational land, the Company also selectively pursues various land-use entitlements on certain properties for residential, commercial and industrial development in order to enhance the long-term value of such properties. For selected development properties, Rayonier also invests in targeted infrastructure improvements, such as roadways and utilities, to accelerate the marketability and improve the value of such properties.
An analysis of higher and better use timberlands and real estate development costs from
December 31, 2016
to
December 31, 2017
is shown below:
|
Higher and Better Use Timberlands and Real Estate Development Investments
|
|||||||||||
|
|
Land and Timber
|
Development Investments
|
Total
|
||||||||
|
Non-current portion at December 31, 2016
|
|
$59,956
|
|
|
$10,418
|
|
|
$70,374
|
|
||
|
Plus: Current portion (a)
|
5,096
|
|
11,963
|
|
17,059
|
|
|||||
|
Total Balance at December 31, 2016
|
65,052
|
|
22,381
|
|
87,433
|
|
|||||
|
Non-cash cost of land and improved development
|
(2,165
|
)
|
(4,554
|
)
|
(6,719
|
)
|
|||||
|
Timber depletion from harvesting activities and basis of timber sold in real estate sales
|
(2,768
|
)
|
—
|
|
(2,768
|
)
|
|||||
|
Capitalized real estate development investments (b)
|
—
|
|
15,784
|
|
15,784
|
|
|||||
|
Capital expenditures (silviculture)
|
428
|
|
—
|
|
428
|
|
|||||
|
Intersegment transfers
|
5,808
|
|
(819
|
)
|
4,989
|
|
|||||
|
Total Balance at December 31, 2017
|
66,355
|
|
32,792
|
|
99,147
|
|
|||||
|
Less: Current portion (a)
|
(6,702
|
)
|
(11,648
|
)
|
(18,350
|
)
|
|||||
|
Non-current portion at December 31, 2017
|
|
$59,653
|
|
|
$21,144
|
|
|
$80,797
|
|
||
|
(a)
|
The current portion of Higher and Better Use Timberlands and Real Estate Development Investments is recorded in Inventory. See
Note 18 — Inventory
for additional information.
|
|
(b)
|
Capitalized real estate development investments includes
$0.4 million
of capitalized interest.
|
80
RAYONIER INC. AND SUBSIDIARIES
NOTES TO CONSOLIDATED FINANCIAL STATEMENTS (Continued)
(Dollar amounts in thousands unless otherwise stated)
|
7.
|
JOINT VENTURE INVESTMENT
|
The Company maintains a
77%
controlling financial interest in Matariki Forestry Group (the “New Zealand JV”), a joint venture that owns or leases approximately
0.4 million
legal acres of New Zealand timberland. Accordingly, the Company consolidates the New Zealand JV’s balance sheet and results of operations. The portions of the consolidated financial position and results of operations attributable to the New Zealand JV’s
23%
noncontrolling interest are shown separately within the Consolidated Statements of Income and Comprehensive Income and Consolidated Statements of Shareholders’ Equity. Rayonier New Zealand Limited (“RNZ”), a wholly-owned subsidiary of Rayonier Inc., serves as the manager of the New Zealand JV.
|
8.
|
COMMITMENTS
|
The Company leases certain buildings, machinery and equipment under various operating leases. Total rental expense for operating leases for the three years ended
December 31
:
|
2017
|
2016
|
2015
|
|||||||||
|
Operating Leases
|
|
$1,992
|
|
|
$2,049
|
|
|
$2,349
|
|
||
The Company also has long-term lease agreements on certain timberlands in the Southern U.S. and New Zealand. U.S. leases typically have initial terms of approximately
30
to
65
years, with renewal provisions in some cases. New Zealand timberland lease terms range between
30
and
99
years. Such leases are generally non-cancellable and require minimum annual rental payments. Total expenditures for long-term leases and deeds on timberlands (including Crown Forest Licenses) for the three years ended
December 31
:
|
2017
|
2016
|
2015
|
|||||||||
|
Long-Term Leases and Deeds on Timberlands
|
|
$10,731
|
|
|
$10,710
|
|
|
$11,342
|
|
||
At
December 31, 2017
, the future minimum payments under non-cancellable operating leases, timberland leases and other commitments were as follows:
|
|
Operating
Leases
|
Timberland
Leases (a)
|
Commitments (b)
|
Total
|
|||||||||||
|
2018
|
|
$1,135
|
|
|
$9,698
|
|
|
$11,792
|
|
|
$22,625
|
|
|||
|
2019
|
914
|
|
9,303
|
|
6,522
|
|
16,739
|
|
|||||||
|
2020
|
733
|
|
9,040
|
|
6,277
|
|
16,050
|
|
|||||||
|
2021
|
639
|
|
8,866
|
|
4,017
|
|
13,522
|
|
|||||||
|
2022
|
608
|
|
8,817
|
|
3,562
|
|
12,987
|
|
|||||||
|
Thereafter (c)
|
635
|
|
155,232
|
|
6,245
|
|
162,112
|
|
|||||||
|
|
$4,664
|
|
|
$200,956
|
|
|
$38,415
|
|
|
$244,035
|
|
||||
|
(a)
|
The majority of timberland leases are subject to increases or decreases based on either the Consumer Price Index, Producer Price Index or market rates.
|
|
(b)
|
Commitments include
$2.9 million
of pension contribution requirements in 2018 based on actuarially determined estimates and IRS minimum funding requirements, payments expected to be made on derivative financial instruments (foreign exchange contracts and interest rate swaps), construction of the Wildlight development project and other purchase obligations. For additional information on the pension contribution see
Note 15 — Employee Benefit Plans
.
|
|
(c)
|
Includes
20 years
of future minimum payments for perpetual Crown Forest Licenses (“CFL”). A CFL consists of a license to use public or government owned land to operate a commercial forest. The CFL's extend indefinitely and may only be terminated upon a
35
-year termination notice from the government. If no termination notice is given, the CFLs renew automatically each year for a
one
-year term. As of
December 31, 2017
, the New Zealand JV has
three
CFL’s under termination notice that are currently being relinquished as harvest activities are concluding, as well as
two
fixed term CFL’s expiring in 2062. The annual license fee is determined based on current market rental value, with triennial rent reviews.
|
81
RAYONIER INC. AND SUBSIDIARIES
NOTES TO CONSOLIDATED FINANCIAL STATEMENTS (Continued)
(Dollar amounts in thousands unless otherwise stated)
|
9.
|
INCOME TAXES
|
The operations conducted by the Company’s REIT entities are generally not subject to U.S. federal and state income taxation. The New Zealand JV is subject to corporate level tax in New Zealand. Non-REIT qualifying operations are conducted by the Company’s taxable REIT subsidiaries (“TRS”). During 2017, 2016 and 2015, the primary businesses performed in the TRS included log trading and certain real estate activities, such as the sale and entitlement of development HBU properties.
ALTERNATIVE FUEL MIXTURE CREDIT (“AFMC”) AND CELLULOSIC BIOFUEL PRODUCER CREDIT (“CBPC”)
The U.S. Internal Revenue Code allowed
two
credits for taxpayers that produced and used an alternative fuel in the operation of their business during calendar year 2009. The AFMC is a
$0.50
per gallon refundable excise tax credit (which is not taxable), while the CBPC is a
$1.01
per gallon credit that is nonrefundable, taxable and has limitations based on an entity’s tax liability. Rayonier produced and used an alternative fuel (“black liquor”) in its Performance Fibers business, which qualified for both credits. The Company claimed the AFMC on its original 2009 income tax return. In 2013, management approved an exchange of black liquor gallons previously claimed under the AFMC for the CBPC. The net tax benefit from this exchange of
$18.8 million
was recorded in discontinued operations. As a result of the spin-off of the Performance Fibers business in 2014, the Company recorded a
$13.6 million
valuation allowance in continuing operations related to CPBC remaining with the Company’s taxable REIT subsidiary and the limited potential use of the CBPC prior to its expiration on December 31, 2019. In 2015, a
$1.0 million
return-to-accrual adjustment was recorded related to the CBPC which resulted in a corresponding increase in the CBPC valuation allowance to
$14.6 million
.
PROVISION FOR INCOME TAXES FROM CONTINUING OPERATIONS
The (provision for)/benefit from income taxes consisted of the following:
|
|
2017
|
2016
|
2015
|
||||||||
|
Current
|
|||||||||||
|
U.S. federal
|
|
$261
|
|
—
|
|
|
($624
|
)
|
|||
|
State
|
(38
|
)
|
(254
|
)
|
226
|
|
|||||
|
Foreign
|
(245
|
)
|
(241
|
)
|
(308
|
)
|
|||||
|
(22
|
)
|
(495
|
)
|
(706
|
)
|
||||||
|
Deferred
|
|||||||||||
|
U.S. federal
|
13,028
|
|
5,403
|
|
3,702
|
|
|||||
|
State
|
—
|
|
(280
|
)
|
107
|
|
|||||
|
Foreign
|
(21,659
|
)
|
(6,079
|
)
|
2,360
|
|
|||||
|
(8,631
|
)
|
(956
|
)
|
6,169
|
|
||||||
|
Changes in valuation allowance
|
(13,028
|
)
|
(3,613
|
)
|
(4,604
|
)
|
|||||
|
Total
|
|
($21,681
|
)
|
|
($5,064
|
)
|
|
$859
|
|
||
82
RAYONIER INC. AND SUBSIDIARIES
NOTES TO CONSOLIDATED FINANCIAL STATEMENTS (Continued)
(Dollar amounts in thousands unless otherwise stated)
A reconciliation of the U.S. federal statutory income tax rate to the actual income tax rate was as follows:
|
|
2017
|
2016
|
2015
|
||||||||||||||||||
|
U.S. federal statutory income tax rate
|
|
($64,141
|
)
|
(35.0
|
)%
|
|
($77,992
|
)
|
(35.0
|
)%
|
|
($15,079
|
)
|
(35.0
|
)%
|
||||||
|
U.S. and foreign REIT income
|
63,813
|
|
34.8
|
|
82,037
|
|
36.8
|
|
17,191
|
|
39.9
|
|
|||||||||
|
Matariki Group and Rayonier New Zealand Ltd
|
(19,182
|
)
|
(10.5
|
)
|
(4,799
|
)
|
(2.2
|
)
|
3,457
|
|
8.0
|
|
|||||||||
|
Transition tax
|
(3,506
|
)
|
(1.9
|
)
|
—
|
|
—
|
|
—
|
|
—
|
|
|||||||||
|
Change in valuation allowance
|
(13,028
|
)
|
(7.1
|
)
|
(3,613
|
)
|
(1.6
|
)
|
(3,607
|
)
|
(8.4
|
)
|
|||||||||
|
ASU No. 2016-16 adoption impact
|
16,631
|
|
9.1
|
|
—
|
|
—
|
|
—
|
|
—
|
|
|||||||||
|
Deemed repatriation of unremitted foreign earnings
|
7,368
|
|
4.0
|
|
—
|
|
—
|
|
—
|
|
—
|
|
|||||||||
|
Reduction of deferred tax asset for statutory rate change
|
(10,499
|
)
|
(5.7
|
)
|
—
|
|
—
|
|
—
|
|
—
|
|
|||||||||
|
CBPC valuation allowance
|
—
|
|
—
|
|
—
|
|
—
|
|
(997
|
)
|
(2.3
|
)
|
|||||||||
|
Other
|
863
|
|
0.5
|
|
(697
|
)
|
(0.3
|
)
|
(106
|
)
|
(0.2
|
)
|
|||||||||
|
Income tax (expense) benefit as reported for net income
|
|
($21,681
|
)
|
(11.8
|
)%
|
|
($5,064
|
)
|
(2.3
|
)%
|
|
$859
|
|
2.0
|
%
|
||||||
The Company’s effective tax rate is below the
35 percent
U.S. statutory rate primarily due to tax benefits associated with being a REIT.
DEFERRED TAXES
Deferred income taxes result from recording revenues and expenses in different periods for financial reporting versus tax reporting. The nature of the temporary differences and the resulting net deferred tax asset/liability for the two years ended
December 31
, were as follows:
|
|
2017
|
2016
|
|||||
|
Gross deferred tax assets:
|
|||||||
|
Pension, postretirement and other employee benefits
|
|
$1,017
|
|
|
$1,648
|
|
|
|
New Zealand JV
|
40,224
|
|
60,452
|
|
|||
|
CBPC Tax Credit Carry Forwards
|
14,641
|
|
14,641
|
|
|||
|
Capitalized real estate costs
|
7,058
|
|
11,489
|
|
|||
|
U.S. TRS Net Operating Loss
|
1,872
|
|
4,730
|
|
|||
|
Land basis difference
|
11,090
|
|
—
|
|
|||
|
Other
|
5,079
|
|
9,165
|
|
|||
|
Total gross deferred tax assets
|
80,981
|
|
102,125
|
|
|||
|
Less: Valuation allowance
|
(34,889
|
)
|
(21,861
|
)
|
|||
|
Total deferred tax assets after valuation allowance
|
|
$46,092
|
|
|
$80,264
|
|
|
|
Gross deferred tax liabilities:
|
|||||||
|
Accelerated depreciation
|
(35
|
)
|
(1,322
|
)
|
|||
|
Repatriation of foreign earnings
|
—
|
|
(7,368
|
)
|
|||
|
New Zealand JV
|
(72,527
|
)
|
(70,315
|
)
|
|||
|
Timber installment sale
|
(4,706
|
)
|
(7,601
|
)
|
|||
|
Other
|
(1,270
|
)
|
(3,833
|
)
|
|||
|
Total gross deferred tax liabilities
|
(78,538
|
)
|
(90,439
|
)
|
|||
|
Net deferred tax liability reported as noncurrent
|
|
($32,446
|
)
|
|
($10,175
|
)
|
|
83
RAYONIER INC. AND SUBSIDIARIES
NOTES TO CONSOLIDATED FINANCIAL STATEMENTS (Continued)
(Dollar amounts in thousands unless otherwise stated)
Included below are the following foreign net operating loss (“NOL”) and tax credit carryforwards as of
December 31, 2017
:
|
Gross
Amount
|
Valuation
Allowance
|
Expiration
|
|||||||
|
2017
|
|||||||||
|
New Zealand JV NOL Carryforwards
|
|
$137,949
|
|
—
|
|
None
|
|||
|
U.S. Net Deferred Tax Asset
|
20,248
|
|
(20,248
|
)
|
None
|
||||
|
Cellulosic Biofuel Producer Credit
|
14,641
|
|
(14,641
|
)
|
2019
|
||||
|
Total Valuation Allowance
|
|
($34,889
|
)
|
||||||
|
2016
|
|||||||||
|
New Zealand JV NOL Carryforwards
|
|
$215,898
|
|
—
|
|
None
|
|||
|
U.S. Net Deferred Tax Asset
|
7,220
|
|
(7,220
|
)
|
None
|
||||
|
Cellulosic Biofuel Producer Credit
|
14,641
|
|
(14,641
|
)
|
2019
|
||||
|
Total Valuation Allowance
|
|
($21,861
|
)
|
||||||
PREPAID TAXES
In the first quarter of 2017, the Company early adopted ASU No. 2016-16,
Intra-Entity Transfers of Assets Other Than Inventory
. ASU No. 2016-16 requires income tax consequences of intra-entity transfers of assets other than inventory be recognized in the period in which they occur. See
Note 2 - Summary of Significant Accounting Policies
. As a result, a cumulative-effect adjustment to retained earnings was recorded for the long-term prepaid federal income tax of
$14.4 million
related to recognized built-in gains on 2006, 2008 and 2010 intercompany sales of timberlands between the REIT and TRS. Taxes for the transaction were paid at the time of sale, but the gain and income tax expense were deferred. See the Consolidated Statement of Shareholders’ Equity for the cumulative-effect adjustment to retained earnings due to the adoption of this standard.
UNRECOGNIZED TAX BENEFITS
The Company recognizes the impact of a tax position if a position is “more-likely-than-not” to prevail. A reconciliation of the beginning and ending unrecognized tax benefits for the three years ended
December 31
is as follows:
|
|
2017
|
2016
|
2015
|
||||||||
|
Balance at January 1,
|
|
$135
|
|
|
$135
|
|
—
|
|
|||
|
Decreases related to prior year tax positions
|
(135
|
)
|
—
|
|
—
|
|
|||||
|
Increases related to prior year tax positions
|
—
|
|
—
|
|
135
|
|
|||||
|
Balance at December 31,
|
—
|
|
|
$135
|
|
|
$135
|
|
|||
The unrecognized tax benefit of
$135 thousand
as of December 31, 2016 and December 31, 2015 related to a prior year deduction, in conjunction with the spin-off of the Performance Fibers business. The unrecognized tax benefit was reduced to zero in 2017 due to the lapse of the applicable statute of limitations.
There is
no
amount of unrecognized tax benefits that, if recognized, would have affected the effective tax rate at
December 31, 2017
,
2016
and
2015
.
The Company records interest (and penalties, if applicable) related to unrecognized tax benefits in non-operating expenses. The Company recorded no benefit to interest expense in 2017, 2016 and 2015, respectively. The Company had
no
recorded liabilities for the payment of interest at
December 31, 2017
and
2016
.
84
RAYONIER INC. AND SUBSIDIARIES
NOTES TO CONSOLIDATED FINANCIAL STATEMENTS (Continued)
(Dollar amounts in thousands unless otherwise stated)
TAX STATUTES
The following table provides detail of the tax years that remain open to examination by the IRS and other significant taxing jurisdictions:
|
Taxing Jurisdiction
|
Open Tax Years
|
|
U.S. Internal Revenue Service
|
2014 - 2016
|
|
New Zealand Inland Revenue
|
2012 - 2016
|
U.S. TAX REFORM
The Tax Cuts and Jobs Act (the “Act”) was signed into law on December 22, 2017 making significant changes to the Internal Revenue Code. Changes include a permanent reduction in the U.S. statutory corporate income tax rate from 35% to 21% beginning in 2018 and a one-time transition tax on the deemed repatriation of deferred foreign earnings as of December 31, 2017.
The SEC issued Staff Accounting Bulletin 118 (“SAB 118”), which provides additional clarification regarding the application of ASC Topic 740 when registrants do not have the necessary information available, prepared, or analyzed in reasonable detail to complete the accounting for certain income tax effects of the Act for the reporting period in which the Act was enacted. SAB 118 provides a measurement period beginning in the reporting period that includes the Act’s enactment date and ending when the registrant has obtained, prepared, and analyzed the information needed in order to complete the accounting requirements, but in no circumstances should the measurement period extend beyond one year from the enactment date.
The Company has not completed its assessment of the accounting implications of the Act. However, the Company has reasonably calculated an estimate of the impact of the Act in the year end income tax provision and recorded
$0.1
million of additional income tax expense as of December 31, 2017. This amount was offset by the Alternative Minimum Tax credit benefit, resulting in a zero net effect to income tax expense. This provisional amount is related to the one-time transition tax on the deemed repatriation of deferred foreign earnings as of December 31, 2017. The remeasurement of certain deferred tax assets and liabilities resulting from the permanent reduction in the U.S. statutory corporate tax rate resulted in a provisional amount of zero as the change in rate was offset by the change in the valuation allowance.
As the Company completes its analysis of the Act, it may make adjustments to the provisional amounts. Any subsequent adjustments to these amounts will be recorded to current tax expense in 2018 when the analysis is complete.
|
10.
|
CONTINGENCIES
|
In re Rayonier Inc. Securities Litigation
Following the Company’s November 10, 2014 earnings release and filing of the restated interim financial statements for the quarterly periods ended March 31, 2014 and June 30, 2014 (the “November 2014 Announcement”), shareholders of the Company filed
five
putative class actions against the Company and Paul G. Boynton, Hans E. Vanden Noort, David L. Nunes, and H. Edwin Kiker arising from circumstances described in the November 2014 Announcement, entitled respectively:
|
•
|
Sating v. Rayonier Inc. et al.
, Civil Action No. 3:14-cv-01395; filed November 12, 2014 in the United States District Court for the Middle District of Florida;
|
|
•
|
Keasler v. Rayonier Inc. et al.
, Civil Action No. 3:14-cv-01398, filed November 13, 2014 in the United States District Court for the Middle District of Florida;
|
|
•
|
Lake Worth Firefighters’ Pension Trust Fund v. Rayonier Inc. et al.
, Civil Action No. 3:14-cv-01403, filed November 13, 2014 in the United States District Court for the Middle District of Florida;
|
|
•
|
Christie v. Rayonier Inc. et al.
, Civil Action No. 3:14-cv-01429, filed November 21, 2014 in the United States District Court for the Middle District of Florida; and
|
|
•
|
Brown v. Rayonier Inc. et al.
, Civil Action No. 1:14-cv-08986, initially filed in the United States District Court for the Southern District of New York and later transferred to the United States District Court for the Middle District of Florida and assigned as Civil Action No. 3:14-cv-01474.
|
On January 9, 2015, the
five
securities actions were consolidated into
one
putative class action entitled
In re Rayonier Inc. Securities Litigation
, Case No. 3:14-cv-01395-TJC-JBT, in the United States District Court for the Middle District of Florida. The plaintiffs alleged that the defendants made false and/or misleading statements in violation of Sections 10(b) and 20(a) of the Securities Exchange Act of 1934 and Rule 10b-5 promulgated thereunder. The plaintiffs sought unspecified monetary damages and attorneys’ fees and costs.
Two
shareholders, the Pension Trust Fund for Operating Engineers and the Lake Worth Firefighters’ Pension Trust Fund, moved for appointment as lead plaintiff on January 12, 2015, which was granted on February 25, 2015. On April 7, 2015, the plaintiffs filed a Consolidated Class Action Complaint (the “Consolidated Complaint”). In the Consolidated Complaint, plaintiffs added allegations as to and added as a defendant N. Lynn Wilson, a former officer of Rayonier. With the filing of the Consolidated Complaint, David L. Nunes and H. Edwin Kiker were dropped from the case as defendants. Defendants timely filed Motions to Dismiss the Consolidated Complaint on May 15, 2015.
After oral argument on Defendants' motions on August 25, 2015, the Court dismissed the Consolidated Complaint without prejudice, allowing plaintiffs leave to refile. Plaintiffs filed the Amended Consolidated Class Action Complaint (the “Amended Complaint”) on September 25, 2015, which continued to assert claims against the Company, as well as Ms. Wilson and Messrs. Boynton and Vanden Noort. Defendants timely filed Motions to Dismiss the Amended Complaint on October 26, 2015. The court denied those motions on May 20, 2016. On December 31, 2016, the case continued to be in the discovery phase and the Company could not determine whether there was a reasonable likelihood a material loss had been incurred nor could the range of any such loss be estimated. On March 13, 2017, the Company reached an agreement in principle to settle the case and all parties executed a term sheet memorializing such agreement. The parties executed and filed with the Court the Stipulation and Agreement of Settlement on April 12, 2017 (the “Settlement Agreement”), which Settlement Agreement included the material terms contained in the term sheet executed on March 13. Pursuant to the terms of the Settlement Agreement, which was subject to Court approval and requests for exclusion by members of the settlement class, the Company agreed to cause certain of its directors’ and officers’ liability insurance carriers to fund a settlement payment to the class of
$73 million
(the “Settlement Fund”). The insurance carriers fully funded the Settlement Fund by deposits in an escrow account as required by the Settlement Agreement. On September 19, 2017, the court held the final fairness hearing as to the settlement. The amounts agreed to on March 13, 2017, including the realized amount funded by the insurance carriers, were reflected in the Company’s Consolidated Financial Statements as of September 30, 2017. On October 5, 2017, the court entered orders approving the settlement and plan of distribution, dismissing the case against all defendants with prejudice and awarding Plaintiffs’ counsel certain fees and cost reimbursements to be paid from the Settlement Fund.
85
RAYONIER INC. AND SUBSIDIARIES
NOTES TO CONSOLIDATED FINANCIAL STATEMENTS (Continued)
(Dollar amounts in thousands unless otherwise stated)
Derivative Claims
On November 26, 2014, December 29, 2014, January 26, 2015, February 13, 2015, and May 12, 2015, the Company received separate letters from shareholders requesting that the Company investigate or pursue derivative claims against certain officers and directors related to the November 2014 Announcement (“Derivative Claims”). Although these demands do not identify any claims against the Company, the Company has certain obligations to advance expenses and provide indemnification to certain current and former officers and directors of the Company. The Company has also incurred expenses as a result of costs arising from the investigation of the claims alleged in the various demands. At this preliminary stage, the ultimate outcome of these matters cannot be predicted, nor can the range of potential expenses the Company may incur as a result of the obligations identified above be estimated. On October 13, 2017, counsel for all five shareholders involved in the Derivative Claims filed a complaint in the name of one of the shareholders from whom the Company received a request to investigate. That case is pending in the United States District Court for the Middle District of Florida and is styled
Molloy v. Boynton, et al.
, Civil Action No. 3:17-cv-01157-TJC-MCR. The complaint alleges breaches of fiduciary duties and unjust enrichment and names as defendants, former officers Paul G. Boynton, Hans E. Vanden Noort and N. Lynn Wilson, and former directors C. David Brown, II, Mark E. Gaumond, James H. Miller, Thomas I. Morgan and Ronald Townsend.
The Company has also been named as a defendant in various other lawsuits and claims arising in the normal course of business. While the Company has procured reasonable and customary insurance covering risks normally occurring in connection with its businesses, it has in certain cases retained some risk through the operation of large deductible insurance plans, primarily in the areas of executive risk, property, automobile and general liability. These pending lawsuits and claims, either individually or in the aggregate, are not expected to have a material adverse effect on the Company’s financial position, results of operations, or cash flow.
|
11.
|
GUARANTEES
|
The Company provides financial guarantees as required by creditors, insurance programs, and various governmental agencies. As of
December 31, 2017
, the following financial guarantees were outstanding:
|
Financial Commitments
|
Maximum Potential
Payment
|
Carrying Amount
of Liability
|
|||||
|
Standby letters of credit (a)
|
|
$10,353
|
|
—
|
|
||
|
Guarantees (b)
|
2,254
|
|
43
|
|
|||
|
Surety bonds (c)
|
1,284
|
|
—
|
|
|||
|
Total financial commitments
|
|
$13,891
|
|
|
$43
|
|
|
|
(a)
|
Approximately
$9.2 million
of the standby letters of credit serve as credit support for infrastructure at the Company’s Wildlight development project. The remaining letters of credit support various insurance related agreements, primarily workers’ compensation. These letters of credit will expire at various dates during 2018 and will be renewed as required.
|
|
(b)
|
In conjunction with a timberland sale and note monetization in 2004, the Company issued a make-whole agreement pursuant to which it guaranteed
$2.3 million
of obligations of a special-purpose entity that was established to complete the monetization. At
December 31, 2017
, the Company has recorded a de minimis liability to reflect the fair market value of its obligation to perform under the make-whole agreement.
|
|
(c)
|
Rayonier issues surety bonds primarily to secure performance obligations related to various operational activities and to provide collateral for outstanding claims under the Company’s previous workers’ compensation self-insurance programs in Washington and Florida. Rayonier has also obtained performance bonds to secure the development activity at the Company’s Wildlight development project. These surety bonds expire at various dates during 2018 and are expected to be renewed as required.
|
86
RAYONIER INC. AND SUBSIDIARIES
NOTES TO CONSOLIDATED FINANCIAL STATEMENTS (Continued)
(Dollar amounts in thousands unless otherwise stated)
|
12.
|
EARNINGS PER COMMON SHARE
|
Basic earnings per share (“EPS”) is calculated by dividing net income attributable to Rayonier by the weighted average number of common shares outstanding during the year. Diluted EPS is calculated by dividing net income attributable to Rayonier by the weighted average number of common shares outstanding adjusted to include the potentially dilutive effect of outstanding stock options, performance shares, restricted shares and convertible debt.
The following table provides details of the calculation of basic and diluted EPS for the three years ended
December 31
:
|
|
2017
|
2016
|
2015
|
||||||||
|
Net Income
|
|
$161,579
|
|
|
$217,770
|
|
|
$43,941
|
|
||
|
Less: Net income (loss) attributable to noncontrolling interest
|
12,737
|
|
5,798
|
|
(2,224
|
)
|
|||||
|
Net income attributable to Rayonier Inc.
|
|
$148,842
|
|
|
$211,972
|
|
|
$46,165
|
|
||
|
Shares used for determining basic earnings per common share
|
127,367,608
|
|
122,585,200
|
|
125,385,085
|
|
|||||
|
Dilutive effect of:
|
|||||||||||
|
Stock options
|
91,956
|
|
92,473
|
|
116,792
|
|
|||||
|
Performance and restricted shares
|
350,385
|
|
134,650
|
|
39,863
|
|
|||||
|
Assumed conversion of Senior Exchangeable Notes (a)
|
—
|
|
—
|
|
358,449
|
|
|||||
|
Assumed conversion of warrants (a)
|
—
|
|
—
|
|
—
|
|
|||||
|
Shares used for determining diluted earnings per common share
|
127,809,949
|
|
122,812,323
|
|
125,900,189
|
|
|||||
|
Basic earnings per common share attributable to Rayonier Inc.:
|
|
$1.17
|
|
|
$1.73
|
|
|
$0.37
|
|
||
|
Diluted earnings per common share attributable to Rayonier Inc.:
|
|
$1.16
|
|
|
$1.73
|
|
|
$0.37
|
|
||
|
|
2017
|
2016
|
2015
|
|||||
|
Anti-dilutive shares excluded from computations of diluted earnings per share:
|
||||||||
|
Stock options, performance and restricted shares
|
596,061
|
|
829,469
|
|
897,800
|
|
||
|
Assumed conversion of exchangeable note hedges (a)
|
—
|
|
—
|
|
358,449
|
|
||
|
Total
|
596,061
|
|
829,469
|
|
1,256,249
|
|
||
|
(a)
|
Rayonier did not issue additional shares upon maturity of the Senior Exchangeable Notes due August 2015 (the “2015 Notes”) due to offsetting hedges. ASC 260,
Earnings Per Share
required the assumed conversion of the 2015 Notes to be included in dilutive shares if the average stock price for the period exceeds the strike price, while the conversion of the hedges was excluded since they were anti-dilutive. The full dilutive effect of the 2015 Notes was included for the portion of the periods presented in which the notes were outstanding.
|
Rayonier did not distribute additional shares upon the February 2016 maturity of the warrants sold in conjunction with the 2015 Notes as the stock price did not exceed
$28.11
per share. The warrants were not dilutive for the year ended 2016 as the average stock price for the period the warrants were outstanding did not exceed the strike price.
87
RAYONIER INC. AND SUBSIDIARIES
NOTES TO CONSOLIDATED FINANCIAL STATEMENTS (Continued)
(Dollar amounts in thousands unless otherwise stated)
|
13.
|
DERIVATIVE FINANCIAL INSTRUMENTS AND HEDGING ACTIVITIES
|
The Company is exposed to market risk related to potential fluctuations in foreign currency exchange rates and interest rates. The Company uses derivative financial instruments to mitigate the financial impact of exposure to these risks. The Company also uses derivative financial instruments to mitigate exposure to foreign currency risk due to the translation of the investment in Rayonier’s New Zealand-based operations from New Zealand dollars to U.S. dollars.
Accounting for derivative financial instruments is governed by Accounting Standards Codification Topic 815,
Derivatives and Hedging,
(“ASC 815”). In accordance with ASC 815, the Company records its derivative instruments at fair value as either assets or liabilities in the Consolidated Balance Sheets. Changes in the instruments’ fair value are accounted for based on their intended use. Gains and losses on derivatives that are designated and qualify for cash flow hedge accounting are recorded as a component of accumulated other comprehensive income (“AOCI”) and reclassified into earnings when the hedged transaction materializes. Gains and losses on derivatives that are designated and qualify for net investment hedge accounting are recorded as a component of AOCI and will not be reclassified into earnings until the Company’s investment in its New Zealand operations is partially or completely liquidated. The ineffective portion of any hedge, changes in the fair value of derivatives not designated as hedging instruments and those which are no longer effective as hedging instruments, are recognized immediately in earnings. The Company's hedge ineffectiveness was de minimis for all periods presented.
FOREIGN CURRENCY EXCHANGE AND OPTION CONTRACTS
The functional currency of Rayonier’s wholly-owned subsidiary, Rayonier New Zealand Limited, and the New Zealand JV is the New Zealand dollar. The New Zealand JV is exposed to foreign currency risk on export sales and ocean freight payments which are mainly denominated in U.S. dollars. The New Zealand JV typically hedges
35%
to
90%
of its estimated foreign currency exposure with respect to the following
three
months forecasted sales and purchases,
25%
to
75%
of its forecasted sales and purchases for the forward
three
to
12
months and up to
50%
of the forward
12
to
18
months. Foreign currency exposure from the New Zealand JV’s trading operations is typically hedged based on the following three months forecasted sales and purchases. As of
December 31, 2017
, foreign currency exchange contracts and foreign currency option contracts had maturity dates through May 2019 and March 2019, respectively.
Foreign currency exchange and option contracts hedging foreign currency risk on export sales and ocean freight payments qualify for cash flow hedge accounting. The fair value of foreign currency exchange contracts is determined by a mark-to-market valuation which estimates fair value by discounting the difference between the contracted forward price and the current forward price for the residual maturity of the contract using a risk-free interest rate. The fair value of foreign currency option contracts is based on a mark-to-market calculation using the Black-Scholes option pricing model.
The Company may de-designate cash flow hedge relationships in advance or at the occurrence of the forecasted transaction. The portion of gains or losses on the derivative instrument previously accumulated in AOCI for de-designated hedges remains in AOCI until the forecasted transaction affects earnings. Changes in the value of derivative instruments after de-designation are recorded in earnings. De-designated cash flow hedges are included in “Derivatives not designated as hedging instruments” in the table below.
Through our ownership in the New Zealand JV, the Company is exposed to foreign currency risk on shareholder loan payments which are denominated in N.Z. dollars. On behalf of the Company, the New Zealand JV typically hedges
60%
to
100%
of its estimated foreign currency exposure with respect to the following
three
months forecasted distributions, up to
75%
of forecasted distributions for the forward
three
to
six
months and up to
50%
of the forward
six
to
12
months. For the year ended December 31, 2017, the change in fair value of the foreign exchange forward contracts of
$0.1 million
was recorded in “Interest income and miscellaneous income (expense), net” as the contracts did not qualify for hedge accounting treatment. As of December 31, 2017, foreign exchange forward contracts had maturity dates through
June 2018
.
88
RAYONIER INC. AND SUBSIDIARIES
NOTES TO CONSOLIDATED FINANCIAL STATEMENTS (Continued)
(Dollar amounts in thousands unless otherwise stated)
INTEREST RATE SWAPS
The Company is exposed to cash flow interest rate risk on its variable-rate Term Credit Agreement and Incremental Term Loan (as discussed below), and uses variable-to-fixed interest rate swaps to hedge this exposure. For these derivative instruments, the Company reports the gains/losses from the fluctuations in the fair market value of the hedges in AOCI and reclassifies them to earnings as interest expense in the same period in which the hedged interest payments affect earnings. For additional information on the Company’s interest rate swaps see
Note 5 — Debt
.
The following table contains information on the outstanding interest rate swaps as of December 31, 2017:
|
Outstanding Interest Rate Swaps (a)
|
|||||||||||
|
Date Entered Into
|
Term
|
Notional Amount
|
Related Debt Facility
|
Fixed Rate of Swap
|
Bank Margin
on Debt
|
Total Effective Interest Rate (b)
|
|||||
|
August 2015
|
9 years
|
|
$170,000
|
|
Term Credit Agreement
|
2.20
|
%
|
1.63
|
%
|
3.83
|
%
|
|
August 2015
|
9 years
|
180,000
|
|
Term Credit Agreement
|
2.35
|
%
|
1.63
|
%
|
3.98
|
%
|
|
|
April 2016
|
10 years
|
100,000
|
|
Incremental Term Loan
|
1.60
|
%
|
1.90
|
%
|
3.50
|
%
|
|
|
April 2016
|
10 years
|
100,000
|
|
Incremental Term Loan
|
1.60
|
%
|
1.90
|
%
|
3.50
|
%
|
|
|
July 2016
|
10 years
|
100,000
|
|
Incremental Term Loan
|
1.26
|
%
|
1.90
|
%
|
3.16
|
%
|
|
|
(a)
|
All interest rate swaps have been designated as interest rate cash flow hedges and qualify for hedge accounting.
|
|
(b)
|
Rate is before estimated patronage payments.
|
The following table demonstrates the impact of the Company’s derivatives on the Consolidated Statements of Income and Comprehensive Income for the years ended
December 31, 2017
,
2016
and
2015
.
|
Location on Statement of Income and Comprehensive Income
|
2017
|
2016
|
2015
|
||||||||||
|
Derivatives designated as cash flow hedges:
|
|||||||||||||
|
Foreign currency exchange contracts
|
Other comprehensive income (loss)
|
|
$2,100
|
|
|
$867
|
|
|
($205
|
)
|
|||
|
Foreign currency option contracts
|
Other comprehensive income (loss)
|
(52
|
)
|
1,035
|
|
370
|
|
||||||
|
Interest rate swaps
|
Other comprehensive income (loss)
|
4,214
|
|
21,422
|
|
(10,197
|
)
|
||||||
|
Derivatives designated as a net investment hedge:
|
|||||||||||||
|
Foreign currency exchange contract
|
Other comprehensive income (loss)
|
—
|
|
—
|
|
2,875
|
|
||||||
|
Foreign currency option contracts
|
Other comprehensive income (loss)
|
—
|
|
(4,606
|
)
|
4,606
|
|
||||||
|
Derivatives not designated as hedging instruments:
|
|||||||||||||
|
Foreign currency exchange contracts
|
Other operating (income) expense, net
|
—
|
|
895
|
|
—
|
|
||||||
|
Interest income and miscellaneous income (expense), net
|
47
|
|
—
|
|
—
|
|
|||||||
|
Foreign currency option contracts
|
Other operating (income) expense, net
|
—
|
|
258
|
|
1,394
|
|
||||||
|
Interest rate swaps
|
Interest income and miscellaneous income (expense), net
|
—
|
|
(1,219
|
)
|
(4,391
|
)
|
||||||
During the next 12 months, the amount of the
December 31, 2017
AOCI balance, net of tax, expected to be reclassified into earnings as a result of the maturation of the Company’s derivative instruments is a gain of approximately
$1.8 million
.
89
RAYONIER INC. AND SUBSIDIARIES
NOTES TO CONSOLIDATED FINANCIAL STATEMENTS (Continued)
(Dollar amounts in thousands unless otherwise stated)
The following table contains the notional amounts of the derivative financial instruments recorded in the Consolidated Balance Sheets at
December 31, 2017
and
2016
:
|
Notional Amount
|
|||||||
|
2017
|
2016
|
||||||
|
Derivatives designated as cash flow hedges:
|
|||||||
|
Foreign currency exchange contracts
|
|
$107,400
|
|
|
$44,800
|
|
|
|
Foreign currency option contracts
|
48,000
|
|
91,000
|
|
|||
|
Interest rate swaps
|
650,000
|
|
650,000
|
|
|||
|
Derivatives not designated as hedging instruments:
|
|||||||
|
Foreign currency exchange contracts
|
18,439
|
|
—
|
|
|||
The following table contains the fair values of the derivative financial instruments recorded in the Consolidated Balance Sheets at
December 31, 2017
and
2016
. Changes in balances of derivative financial instruments are recorded as operating activities in the Consolidated Statements of Cash Flows.
|
Fair Value Assets (Liabilities) (a)
|
|||||||||
|
Location on Balance Sheet
|
2017
|
2016
|
|||||||
|
Derivatives designated as cash flow hedges:
|
|||||||||
|
Foreign currency exchange contracts
|
Other current assets
|
|
$2,286
|
|
|
$692
|
|
||
|
Other assets
|
538
|
|
33
|
|
|||||
|
Other current liabilities
|
(37
|
)
|
(261
|
)
|
|||||
|
Foreign currency option contracts
|
Other current assets
|
389
|
|
1,064
|
|
||||
|
Other assets
|
137
|
|
327
|
|
|||||
|
Other current liabilities
|
(119
|
)
|
(574
|
)
|
|||||
|
Other non-current liabilities
|
(55
|
)
|
(426
|
)
|
|||||
|
Interest rate swaps
|
Other assets
|
17,473
|
|
17,204
|
|
||||
|
Other non-current liabilities
|
(2,033
|
)
|
(5,979
|
)
|
|||||
|
Derivatives not designated as hedging instruments:
|
|||||||||
|
Foreign currency exchange contracts
|
Other current assets
|
209
|
|
—
|
|
||||
|
Other current liabilities
|
(189
|
)
|
—
|
|
|||||
|
Total derivative contracts:
|
|||||||||
|
Other current assets
|
|
$2,884
|
|
|
$1,756
|
|
|||
|
Other assets
|
18,148
|
|
17,564
|
|
|||||
|
Total derivative assets
|
|
$21,032
|
|
|
$19,320
|
|
|||
|
Other current liabilities
|
(345
|
)
|
(835
|
)
|
|||||
|
Other non-current liabilities
|
(2,088
|
)
|
(6,405
|
)
|
|||||
|
Total derivative liabilities
|
|
($2,433
|
)
|
|
($7,240
|
)
|
|||
|
(a)
|
See
Note 14 — Fair Value Measurements
for further information on the fair value of our derivatives including their classification within the fair value hierarchy.
|
90
RAYONIER INC. AND SUBSIDIARIES
NOTES TO CONSOLIDATED FINANCIAL STATEMENTS (Continued)
(Dollar amounts in thousands unless otherwise stated)
OFFSETTING DERIVATIVES
Derivative financial instruments are presented at their gross fair values in the Consolidated Balance Sheets. The Company’s derivative financial instruments are not subject to master netting arrangements which would allow the right of offset.
|
14.
|
FAIR VALUE MEASUREMENTS
|
FAIR VALUE OF FINANCIAL INSTRUMENTS
A three-level hierarchy that prioritizes the inputs used to measure fair value was established in the Accounting Standards Codification as follows:
Level 1
— Quoted prices in active markets for identical assets or liabilities.
Level 2
—
Observable inputs other than quoted prices included in Level 1.
Level 3
—
Unobservable inputs that are supported by little or no market activity and that are significant to the fair value of the assets or liabilities.
The following table presents the carrying amount and estimated fair values of financial instruments held by the Company at
December 31, 2017
and
2016
, using market information and what the Company believes to be appropriate valuation methodologies under generally accepted accounting principles:
|
|
December 31, 2017
|
December 31, 2016
|
|||||||||||||||||||
|
Asset (liability) (a)
|
Carrying
Amount
|
Fair Value
|
Carrying
Amount
|
Fair Value
|
|||||||||||||||||
|
Level 1
|
Level 2
|
Level 1
|
Level 2
|
||||||||||||||||||
|
Cash and cash equivalents
|
|
$112,653
|
|
|
$112,653
|
|
—
|
|
|
$85,909
|
|
|
$85,909
|
|
—
|
|
|||||
|
Restricted cash (b)
|
59,703
|
|
59,703
|
|
—
|
|
71,708
|
|
71,708
|
|
—
|
|
|||||||||
|
Current maturities of long-term debt
|
(3,375
|
)
|
—
|
|
(3,375
|
)
|
(31,676
|
)
|
—
|
|
(31,984
|
)
|
|||||||||
|
Long-term debt (c)
|
(1,022,004
|
)
|
—
|
|
(1,030,135
|
)
|
(1,030,205
|
)
|
—
|
|
(1,030,708
|
)
|
|||||||||
|
Interest rate swaps (d)
|
15,440
|
|
—
|
|
15,440
|
|
11,225
|
|
—
|
|
11,225
|
|
|||||||||
|
Foreign currency exchange contracts (d)
|
2,807
|
|
—
|
|
2,807
|
|
464
|
|
—
|
|
464
|
|
|||||||||
|
Foreign currency option contracts (d)
|
352
|
|
—
|
|
352
|
|
391
|
|
—
|
|
391
|
|
|||||||||
|
(a)
|
The Company did not have Level 3 assets or liabilities at
December 31, 2017
and
2016
.
|
|
(b)
|
Restricted cash represents the proceeds from like-kind exchange sales deposited with a third-party intermediary and cash held in escrow for a real estate sale. See
Note 19 - Restricted Cash
for additional information.
|
|
(c)
|
The carrying amount of long-term debt is presented net of capitalized debt costs on non-revolving debt. See
Note 5 — Debt
for additional information.
|
|
(d)
|
See
Note 13 — Derivative Financial Instruments and Hedging Activities
for information regarding the Balance Sheet classification of the Company’s derivative financial instruments.
|
Rayonier uses the following methods and assumptions in estimating the fair value of its financial instruments:
Cash and cash equivalents and Restricted cash
— The carrying amount is equal to fair market value.
Debt
— The fair value of fixed rate debt is based upon quoted market prices for debt with similar terms and maturities. The variable rate debt adjusts with changes in the market rate, therefore the carrying value approximates fair value.
Interest rate swap agreements
— The fair value of interest rate contracts is determined by discounting the expected future cash flows, for each instrument, at prevailing interest rates.
Foreign currency exchange contracts
— The fair value of foreign currency exchange contracts is determined by a mark-to-market valuation which estimates fair value by discounting the difference between the contracted forward price and the current forward price for the residual maturity of the contract using a risk-free interest rate.
Foreign currency option contracts
— The fair value of foreign currency option contracts is based on a mark-to-market calculation using the Black-Scholes option pricing model.
91
RAYONIER INC. AND SUBSIDIARIES
NOTES TO CONSOLIDATED FINANCIAL STATEMENTS (Continued)
(Dollar amounts in thousands unless otherwise stated)
|
15.
|
EMPLOYEE BENEFIT PLANS
|
The Company has
one
qualified non-contributory defined benefit pension plan covering a portion of its employees and an unfunded plan that provides benefits in excess of amounts allowable under current tax law in the qualified plans. The Company closed enrollment in its pension plans to salaried employees hired after December 31, 2005. Effective December 31, 2016, the Company froze benefits for all employees participating in the pension plan. In lieu of the pension plan, the Company provides those employees with an enhanced 401(k) plan match similar to what is currently provided to employees hired after December 31, 2005. Employee benefit plan liabilities are calculated using actuarial estimates and management assumptions. These estimates are based on historical information, along with certain assumptions about future events. Changes in assumptions, as well as changes in actual experience, could cause the estimates to change.
The following tables set forth the change in the projected benefit obligation and plan assets and reconcile the funded status and the amounts recognized in the Consolidated Balance Sheets for the pension and postretirement benefit plans for the two years ended December 31:
|
|
Pension
|
Postretirement
|
|||||||||||||
|
|
2017
|
2016
|
2017
|
2016
|
|||||||||||
|
Change in Projected Benefit Obligation
|
|||||||||||||||
|
Projected benefit obligation at beginning of year
|
|
$81,752
|
|
|
$84,005
|
|
|
$1,285
|
|
|
$1,159
|
|
|||
|
Service cost
|
—
|
|
1,307
|
|
6
|
|
4
|
|
|||||||
|
Interest cost
|
3,259
|
|
3,474
|
|
53
|
|
42
|
|
|||||||
|
Curtailment gain
|
—
|
|
(5,447
|
)
|
—
|
|
—
|
|
|||||||
|
Actuarial loss
|
6,123
|
|
1,296
|
|
89
|
|
99
|
|
|||||||
|
Benefits paid
|
(3,148
|
)
|
(2,883
|
)
|
(13
|
)
|
(19
|
)
|
|||||||
|
Projected benefit obligation at end of year
|
|
$87,986
|
|
|
$81,752
|
|
|
$1,420
|
|
|
$1,285
|
|
|||
|
Change in Plan Assets
|
|||||||||||||
|
Fair value of plan assets at beginning of year
|
|
$51,114
|
|
|
$50,970
|
|
—
|
|
—
|
|
|||
|
Actual return on plan assets
|
9,909
|
|
3,557
|
|
—
|
|
—
|
|
|||||
|
Employer contributions
|
90
|
|
29
|
|
13
|
|
19
|
|
|||||
|
Benefits paid
|
(3,148
|
)
|
(2,883
|
)
|
(13
|
)
|
(19
|
)
|
|||||
|
Other expense
|
(588
|
)
|
(559
|
)
|
—
|
|
—
|
|
|||||
|
Fair value of plan assets at end of year
|
|
$57,377
|
|
|
$51,114
|
|
—
|
|
—
|
|
|||
|
Funded Status at End of Year:
|
|||||||||||||||
|
Net accrued benefit cost
|
|
($30,609
|
)
|
|
($30,638
|
)
|
|
($1,420
|
)
|
|
($1,285
|
)
|
|||
|
Amounts Recognized in the Consolidated
|
|||||||||||||||
|
Balance Sheets Consist of:
|
|||||||||||||||
|
Current liabilities
|
|
($92
|
)
|
|
($36
|
)
|
|
($32
|
)
|
|
($30
|
)
|
|||
|
Noncurrent liabilities
|
(30,517
|
)
|
(30,602
|
)
|
(1,388
|
)
|
(1,255
|
)
|
|||||||
|
Net amount recognized
|
|
($30,609
|
)
|
|
($30,638
|
)
|
|
($1,420
|
)
|
|
($1,285
|
)
|
|||
Net gains or losses recognized in other comprehensive income for the three years ended December 31 are as follows:
|
|
Pension
|
Postretirement
|
|||||||||||||||||||||
|
|
2017
|
2016
|
2015
|
2017
|
2016
|
2015
|
|||||||||||||||||
|
Net (losses) gains
|
|
($583
|
)
|
|
$3,119
|
|
|
($477
|
)
|
|
($89
|
)
|
|
($99
|
)
|
|
$123
|
|
|||||
92
RAYONIER INC. AND SUBSIDIARIES
NOTES TO CONSOLIDATED FINANCIAL STATEMENTS (Continued)
(Dollar amounts in thousands unless otherwise stated)
Net gains or losses and prior service costs or credits reclassified from other comprehensive income and recognized as a component of pension and postretirement expense for the three years ended December 31 are as follows:
|
|
Pension
|
Postretirement
|
|||||||||||||||||||||
|
|
2017
|
2016
|
2015
|
2017
|
2016
|
2015
|
|||||||||||||||||
|
Amortization of losses (gains)
|
|
$466
|
|
|
$2,526
|
|
|
$3,733
|
|
|
($1
|
)
|
|
($13
|
)
|
|
$12
|
|
|||||
|
Amortization of prior service cost
|
—
|
|
—
|
|
13
|
|
—
|
|
—
|
|
—
|
|
|||||||||||
Net losses that have not yet been included in pension and postretirement expense for the two years ended December 31, which have been recognized as a component of AOCI are as follows:
|
|
Pension
|
Postretirement
|
|||||||||||||
|
|
2017
|
2016
|
2017
|
2016
|
|||||||||||
|
Net (losses) gains
|
|
($22,183
|
)
|
|
($22,065
|
)
|
|
($157
|
)
|
|
($67
|
)
|
|||
|
Deferred income tax benefit
|
1,927
|
|
1,927
|
|
6
|
|
6
|
|
|||||||
|
AOCI
|
|
($20,256
|
)
|
|
($20,138
|
)
|
|
($151
|
)
|
|
($61
|
)
|
|||
For pension and postretirement plans with accumulated benefit obligations in excess of plan assets, the following table sets forth the projected and accumulated benefit obligations and the fair value of plan assets for the two years ended December 31:
|
|
2017
|
2016
|
|||||
|
Projected benefit obligation
|
|
$87,986
|
|
|
$81,752
|
|
|
|
Accumulated benefit obligation
|
87,986
|
|
81,752
|
|
|||
|
Fair value of plan assets
|
57,377
|
|
51,114
|
|
|||
The following tables set forth the components of net pension and postretirement benefit (credit) cost that have been recognized during the three years ended
December 31
:
|
|
Pension
|
Postretirement
|
|||||||||||||||||||||
|
|
2017
|
2016
|
2015
|
2017
|
2016
|
2015
|
|||||||||||||||||
|
Components of Net Periodic Benefit (Credit) Cost
|
|||||||||||||||||||||||
|
Service cost
|
—
|
|
|
$1,307
|
|
|
$1,484
|
|
|
$6
|
|
|
$4
|
|
|
$11
|
|
||||||
|
Interest cost
|
3,259
|
|
3,474
|
|
3,319
|
|
53
|
|
42
|
|
52
|
|
|||||||||||
|
Expected return on plan assets
|
(3,781
|
)
|
(4,030
|
)
|
(4,027
|
)
|
—
|
|
—
|
|
—
|
|
|||||||||||
|
Amortization of prior service cost
|
—
|
|
—
|
|
13
|
|
—
|
|
—
|
|
—
|
|
|||||||||||
|
Amortization of losses (gains)
|
466
|
|
2,526
|
|
3,733
|
|
(1
|
)
|
(13
|
)
|
12
|
|
|||||||||||
|
Net periodic benefit (credit) cost (a)
|
|
($56
|
)
|
|
$3,277
|
|
|
$4,522
|
|
|
$58
|
|
|
$33
|
|
|
$75
|
|
|||||
The estimated pre-tax amounts that will be amortized from AOCI into net periodic benefit cost in
2018
are as follows:
|
|
Pension
|
Postretirement
|
|||||
|
Amortization of loss
|
|
$635
|
|
|
$2
|
|
|
93
RAYONIER INC. AND SUBSIDIARIES
NOTES TO CONSOLIDATED FINANCIAL STATEMENTS (Continued)
(Dollar amounts in thousands unless otherwise stated)
The following table sets forth the principal assumptions inherent in the determination of benefit obligations and net periodic benefit cost of the pension and postretirement benefit plans as of
December 31
:
|
|
Pension
|
Postretirement
|
|||||||||||||||
|
|
2017
|
2016
|
2015
|
2017
|
2016
|
2015
|
|||||||||||
|
Assumptions used to determine benefit obligations at December 31:
|
|||||||||||||||||
|
Discount rate
|
3.48
|
%
|
4.01
|
%
|
4.20
|
%
|
3.56
|
%
|
4.12
|
%
|
4.34
|
%
|
|||||
|
Rate of compensation increase
|
—
|
|
4.16
|
%
|
4.50
|
%
|
4.50
|
%
|
4.50
|
%
|
4.50
|
%
|
|||||
|
Assumptions used to determine net periodic benefit cost for years ended December 31:
|
|||||||||||||||||
|
Discount rate
|
4.01
|
%
|
4.20
|
%
|
3.80
|
%
|
4.12
|
%
|
4.34
|
%
|
3.96
|
%
|
|||||
|
Expected long-term return on plan assets
|
7.17
|
%
|
7.70
|
%
|
7.70
|
%
|
—
|
|
—
|
|
—
|
|
|||||
|
Rate of compensation increase
|
—
|
|
4.16
|
%
|
4.50
|
%
|
4.50
|
%
|
4.50
|
%
|
4.50
|
%
|
|||||
At
December 31, 2017
, the pension plan’s discount rate was
3.5%
, which closely approximates interest rates on high quality, long-term obligations. In
2017
, the expected return on plan assets was reduced to
7.2%
based on historical and expected long-term rates of return on broad equity and bond indices and consideration of the actual annualized rate of return. The Company utilizes this information in developing assumptions for returns, and risks and correlation of asset classes, which are then used to establish the asset allocation ranges.
INVESTMENT OF PLAN ASSETS
The Company’s pension plans’ asset allocation (excluding short-term investments) at
December 31, 2017
and
2016
, and target allocation ranges by asset category are as follows:
|
|
Percentage of
Plan Assets
|
Target
Allocation
Range
|
|||||
|
Asset Category
|
2017
|
2016
|
|||||
|
Domestic equity securities
|
41
|
%
|
41
|
%
|
35-45%
|
||
|
International equity securities
|
26
|
%
|
25
|
%
|
20-30%
|
||
|
Domestic fixed income securities
|
26
|
%
|
26
|
%
|
25-29%
|
||
|
International fixed income securities
|
4
|
%
|
5
|
%
|
3-7%
|
||
|
Real estate fund
|
3
|
%
|
3
|
%
|
2-4%
|
||
|
Total
|
100
|
%
|
100
|
%
|
|||
The Company’s Pension and Savings Plan Committee and the Audit Committee of the Board of Directors oversee the pension plans’ investment program which is designed to maximize returns and provide sufficient liquidity to meet plan obligations while maintaining acceptable risk levels. The investment approach emphasizes diversification by allocating the plans’ assets among asset categories and selecting investment managers whose various investment methodologies will be minimally correlative with each other. Investments within the equity categories may include large capitalization, small capitalization and emerging market securities, while the international fixed income portfolio may include emerging markets debt. Pension assets did not include a direct investment in Rayonier common stock at
December 31, 2017
or
2016
.
94
RAYONIER INC. AND SUBSIDIARIES
NOTES TO CONSOLIDATED FINANCIAL STATEMENTS (Continued)
(Dollar amounts in thousands unless otherwise stated)
FAIR VALUE MEASUREMENTS
The following table sets forth by level, within the fair value hierarchy (see
Note 2 — Summary of Significant Accounting Policies
for definition), the assets of the plans as of
December 31, 2017
and
2016
.
|
Fair Value at December 31, 2017
|
Fair Value at December 31, 2016
|
||||||||||||||||||||||||||
|
Asset Category
|
Level 1
|
Level 2
|
Level 3
|
Total
|
Level 1
|
Level 2
|
Level 3
|
Total
|
|||||||||||||||||||
|
Investments at Fair Value:
|
|||||||||||||||||||||||||||
|
Mutual Funds
|
|
$8,986
|
|
—
|
|
—
|
|
|
$8,986
|
|
|
$13,962
|
|
—
|
|
—
|
|
|
$13,962
|
|
|||||||
|
Investments at Net Asset Value:
|
|
|
|
|
|
|
|
|
|
|
|
|
|||||||||||||||
|
Common Collective Trusts
|
|
|
|
|
48,391
|
|
|
|
|
|
37,152
|
|
|||||||||||||||
|
Total Investments at Fair Value
|
|
|
|
|
|
$57,377
|
|
|
|
|
|
|
$51,114
|
|
|||||||||||||
The valuation methodology used for measuring the fair value of these asset categories was as follows:
Mutual funds are valued at the daily closing price as reported by the fund. Mutual funds held by the plan are open-end mutual funds that are registered with the U.S. Securities and Exchange Commission. These funds are required to publish their daily net asset value and to transact at that price. The mutual funds held by the plan are deemed to be actively traded and to be Level 1 investments.
Collective trust funds are measured using the unit value calculated based on the Net Asset Value (“NAV”) of the underlying assets. The NAV is based on the fair value of the underlying investments held by each fund less liabilities divided by the units outstanding as of the valuation date. These funds are not publicly traded; however, the unit price calculation is based on observable market inputs of the funds’ underlying assets.
The Company did not have Level 2 or Level 3 assets at December 31, 2017 and 2016.
CASH FLOWS
Expected benefit payments for the next 10 years are as follows:
|
|
Pension
Benefits
|
Postretirement
Benefits
|
|||||
|
2018
|
|
$3,315
|
|
|
$32
|
|
|
|
2019
|
3,478
|
|
35
|
|
|||
|
2020
|
3,670
|
|
37
|
|
|||
|
2021
|
3,770
|
|
40
|
|
|||
|
2022
|
4,028
|
|
43
|
|
|||
|
2023 - 2027
|
21,803
|
|
260
|
|
|||
The Company has approximately
$2.9 million
of pension contribution requirements in 2018.
DEFINED CONTRIBUTION PLANS
The Company provides defined contribution plans to all of its hourly and salaried employees. Company match contributions charged to expense for these plans were
$0.8 million
,
$0.7 million
and
$0.7 million
for the years ended December 31,
2017
,
2016
and
2015
, respectively. Rayonier Hourly and Salaried Defined Contribution Plans include Rayonier common stock with a fair market value of
$12.3 million
and
$12.8 million
at
December 31, 2017
and
2016
, respectively. As of June 1, 2016, the Rayonier Inc. Common Stock Fund was closed to new contributions. Transfers out of the fund will continue to be permitted, but no new investments or transfers into the fund are allowed.
As discussed above, the defined benefit pension plan is currently frozen. In lieu of the pension plan, employees are eligible to receive an enhanced match contribution. Company enhanced match contributions charged to expense for the years ended December 31,
2017
,
2016
and
2015
were
$0.8 million
,
$0.5 million
and
$0.4 million
, respectively.
95
RAYONIER INC. AND SUBSIDIARIES
NOTES TO CONSOLIDATED FINANCIAL STATEMENTS (Continued)
(Dollar amounts in thousands unless otherwise stated)
|
16.
|
INCENTIVE STOCK PLANS
|
The Rayonier Incentive Stock Plan (“the Stock Plan”) provides up to
15.8 million
shares to be granted for incentive stock options, non-qualified stock options, stock appreciation rights, performance shares, restricted stock and restricted stock units, subject to certain limitations. At
December 31, 2017
, a total of
5.1 million
shares were available for future grants under the Stock Plan. Under the Stock Plan, shares available for issuance are reduced by 1 share for each option or right granted and by 2.27 shares for each performance share, restricted share or restricted stock unit granted. The Company issues new shares of stock upon the exercise of stock options, the granting of restricted stock, and the vesting of performance shares.
A summary of the Company’s stock-based compensation cost is presented below:
|
|
2017
|
2016
|
2015
|
||||||||
|
Selling and general expenses
|
|
$4,784
|
|
|
$4,607
|
|
|
$3,752
|
|
||
|
Cost of sales
|
556
|
|
487
|
|
635
|
|
|||||
|
Timber and Timberlands, net (a)
|
56
|
|
42
|
|
97
|
|
|||||
|
Total stock-based compensation
|
|
$5,396
|
|
|
$5,136
|
|
|
$4,484
|
|
||
|
Tax benefit recognized related to stock-based compensation expense (b)
|
|
$249
|
|
|
$483
|
|
|
$302
|
|
||
|
(a)
|
Represents amounts capitalized as part of the overhead allocation of timber-related costs.
|
|
(b)
|
A valuation allowance is recorded against the tax benefit recognized as the Company does not expect to be able to realize the benefit in the future.
|
FAIR VALUE CALCULATIONS BY AWARD
RESTRICTED STOCK
Restricted stock granted to employees under the Stock Plan generally vests in fourths on the first, second, third and fourth anniversary of the grant date. Restricted stock granted to senior management generally vests in thirds on the third, fourth, and fifth anniversary of the grant date. Periodically, other one-time restricted stock grants are issued to employees for special purposes, such as new hire, promotion or retention, and can vest ratably over, or upon completion of, a defined period of time. Generally, holders of restricted stock receive dividend equivalent payments on outstanding restricted shares. Restricted stock granted to members of the board of directors generally vests immediately upon issuance and is subject to certain holding requirements. The fair value of each share granted is equal to the share price of the Company’s stock on the date of grant. Rayonier has elected to value each grant in total and recognize the expense on a straight-line basis from the grant date of the award to the latest vesting date.
As of
December 31, 2017
, there was
$4.3 million
of unrecognized compensation cost solely attributable to Rayonier restricted stock held by Rayonier employees. The Company expects to recognize this cost over a weighted average period of
3.0
years.
A summary of the Company’s restricted shares is presented below:
|
|
2017
|
2016
|
2015
|
||||||||
|
Restricted shares granted
|
97,643
|
|
106,326
|
|
96,088
|
|
|||||
|
Weighted average price of restricted shares granted
|
|
$28.18
|
|
|
$25.08
|
|
|
$26.28
|
|
||
|
Intrinsic value of restricted stock outstanding (a)
|
8,906
|
|
6,177
|
|
4,434
|
|
|||||
|
Grant date fair value of restricted stock vested
|
1,198
|
|
2,248
|
|
2,632
|
|
|||||
|
Cash used to purchase common shares from current and former employees to pay minimum withholding tax requirements on restricted shares vested
|
|
$176
|
|
|
$178
|
|
|
$122
|
|
||
|
(a)
|
Intrinsic value of restricted stock outstanding is based on the market price of the Company’s stock at
December 31, 2017
.
|
96
RAYONIER INC. AND SUBSIDIARIES
NOTES TO CONSOLIDATED FINANCIAL STATEMENTS (Continued)
(Dollar amounts in thousands unless otherwise stated)
|
|
2017
|
|||||
|
|
Number of
Shares
|
Weighted
Average Grant
Date Fair Value
|
||||
|
Non-vested Restricted Shares at January 1,
|
232,231
|
|
|
$29.47
|
|
|
|
Granted
|
97,643
|
|
28.18
|
|
||
|
Vested
|
(42,808
|
)
|
27.98
|
|
||
|
Cancelled
|
(5,497
|
)
|
26.22
|
|
||
|
Non-vested Restricted Shares at December 31,
|
281,569
|
|
|
$29.32
|
|
|
PERFORMANCE SHARES UNITS
The Company’s performance share units generally vest upon completion of a
three
-year period. The number of shares, if any, that are ultimately awarded is contingent upon Rayonier’s total shareholder return versus selected peer group companies. The performance share payout is based on a market condition and as such, the awards are valued using a Monte Carlo simulation model. The model generates the fair value of the award at the grant date, which is then recognized as expense on a straight-line basis over the vesting period.
The Stock Plan allows for the cash settlement of the minimum required withholding tax on performance share unit awards. As of
December 31, 2017
, there was
$4.3 million
of unrecognized compensation cost related to the Company’s performance share unit awards, which is solely attributable to awards granted in 2015, 2016 and 2017 to Rayonier employees. This cost is expected to be recognized over a weighted average period of
1.8
years.
A summary of the Company’s performance share units is presented below:
|
|
2017
|
2016
|
2015
|
||||||||
|
Common shares of Company stock reserved for performance shares granted during year
|
226,448
|
|
250,584
|
|
219,844
|
|
|||||
|
Weighted average fair value of performance share units granted
|
|
$32.17
|
|
|
$28.79
|
|
|
$29.62
|
|
||
|
Intrinsic value of outstanding performance share units (a)
|
10,414
|
|
7,482
|
|
3,822
|
|
|||||
|
Fair value of performance shares vested
|
—
|
|
—
|
|
—
|
|
|||||
|
Cash used to purchase common shares from current and former employees to pay minimum withholding tax requirements on performance shares vested
|
—
|
|
—
|
|
—
|
|
|||||
|
(a)
|
Intrinsic value of outstanding performance share units is based on the market price of the Company's stock at
December 31, 2017
.
|
|
|
2017
|
|||||
|
|
Number
of Units
|
Weighted
Average Grant
Date Fair Value
|
||||
|
Outstanding Performance Share units at January 1,
|
281,288
|
|
|
$31.35
|
|
|
|
Granted
|
113,224
|
|
32.17
|
|
||
|
Other Cancellations/Adjustments
|
(65,273
|
)
|
38.56
|
|
||
|
Outstanding Performance Share units at December 31,
|
329,239
|
|
|
$30.21
|
|
|
Expected volatility was estimated using daily returns on the Company’s common stock for the three-year period ending on the grant date. The risk-free rate was based on the 3-year U.S. treasury rate on the date of the award. The dividend yield was not used to calculate fair value as awards granted receive dividend equivalents. The following table provides an overview of the assumptions used in calculating the fair value of the awards granted for the three years ended
December 31, 2017
:
|
|
2017
|
2016
|
2015
|
|||||
|
Expected volatility
|
23.3
|
%
|
25.4
|
%
|
21.9
|
%
|
||
|
Risk-free rate
|
1.5
|
%
|
0.9
|
%
|
0.9
|
%
|
||
97
RAYONIER INC. AND SUBSIDIARIES
NOTES TO CONSOLIDATED FINANCIAL STATEMENTS (Continued)
(Dollar amounts in thousands unless otherwise stated)
NON-QUALIFIED EMPLOYEE STOCK OPTIONS
The exercise price of each non-qualified stock option granted under the Stock Plan is equal to the closing market price of the Company’s stock on the grant date. Under the Stock Plan, the maximum term is
ten
years from the grant date. At the time of the spin-off, each Rayonier stock option was converted into an adjusted Rayonier stock option and a Rayonier Advanced Materials stock option. The exercise price and number of shares subject to each stock option were adjusted in order to preserve the aggregate value of the original Rayonier stock option as measured immediately before and immediately after the spin-off.
A summary of the status of the Company’s stock options as of and for the year ended
December 31, 2017
is presented below. The information reflects options in Rayonier common shares, including those awards held by Rayonier Advanced Materials employees.
|
|
2017
|
|||||||||||
|
|
Number of
Shares
|
Weighted
Average Exercise
Price
(per common share)
|
Weighted
Average
Remaining
Contractual Term
(in years)
|
Aggregate
Intrinsic
Value
|
||||||||
|
Options outstanding at January 1,
|
1,079,800
|
|
|
$28.16
|
|
|||||||
|
Granted
|
—
|
|
—
|
|
||||||||
|
Exercised
|
(229,006
|
)
|
20.75
|
|
||||||||
|
Cancelled or expired
|
(9,728
|
)
|
33.00
|
|
||||||||
|
Options outstanding at December 31,
|
841,066
|
|
30.13
|
|
4.2
|
|
$2,589
|
|
||||
|
Options exercisable at December 31,
|
841,066
|
|
|
$30.13
|
|
4.2
|
|
$2,589
|
|
|||
A summary of additional information pertaining to the Company’s stock options is presented below:
|
|
2017
|
2016
|
2015
|
||||||||
|
Intrinsic value of options exercised (a)
|
|
$1,993
|
|
|
$539
|
|
|
$773
|
|
||
|
Fair value of options vested
|
6,138
|
|
1,317
|
|
1,938
|
|
|||||
|
Cash received from exercise of options
|
4,751
|
|
1,576
|
|
2,117
|
|
|||||
|
(a)
|
Intrinsic value of options exercised is the amount by which the fair value of the stock on the exercise date exceeded the exercise price of the option.
|
As of
December 31, 2017
, compensation cost related to Rayonier and Rayonier Advanced Materials stock options held by the Company’s employees was fully recognized.
98
RAYONIER INC. AND SUBSIDIARIES
NOTES TO CONSOLIDATED FINANCIAL STATEMENTS (Continued)
(Dollar amounts in thousands unless otherwise stated)
|
17.
|
OTHER OPERATING INCOME (EXPENSE), NET
|
The following table provides the composition of Other operating income (expense), net for the three years ended
December 31
:
|
2017
|
2016
|
2015
|
|||||||||
|
Foreign currency (loss) income
|
|
($394
|
)
|
|
$283
|
|
|
($89
|
)
|
||
|
(Loss) gain on sale or disposal of property plant & equipment
|
(68
|
)
|
85
|
|
7
|
|
|||||
|
Gain (loss) on foreign currency exchange and option contracts
|
3,438
|
|
(645
|
)
|
(5,338
|
)
|
|||||
|
Deferred payments related to prior land sales
|
—
|
|
8,658
|
|
—
|
|
|||||
|
Costs related to business combination
|
—
|
|
(1,316
|
)
|
—
|
|
|||||
|
Gain on foreign currency derivatives (a)
|
—
|
|
1,153
|
|
—
|
|
|||||
|
New Zealand JV log trading marketing fees
|
1,222
|
|
951
|
|
976
|
|
|||||
|
Miscellaneous income (expense), net
|
195
|
|
(83
|
)
|
896
|
|
|||||
|
Total
|
|
$4,393
|
|
|
$9,086
|
|
|
($3,548
|
)
|
||
|
(a)
|
The Company used foreign exchange derivatives to mitigate the risk of fluctuations in foreign exchange rates while awaiting the capital contribution to the New Zealand JV.
|
|
18.
|
INVENTORY
|
As of
December 31, 2017
and
2016
, Rayonier’s inventory was solely comprised of finished goods, as follows:
|
|
2017
|
2016
|
|||||
|
Finished goods inventory
|
|||||||
|
Real estate inventory (a)
|
|
$18,350
|
|
|
$17,059
|
|
|
|
Log inventory
|
5,791
|
|
4,320
|
|
|||
|
Total inventory
|
|
$24,141
|
|
|
$21,379
|
|
|
|
(a)
|
Represents cost of HBU real estate (including capitalized development investments) expected to be sold within 12 months. See
Note 6 — Higher and Better Use Timberlands and Real Estate Development Investments
for additional information.
|
|
19.
|
RESTRICTED CASH
|
In order to qualify for like-kind (“LKE”) treatment, the proceeds from real estate sales must be deposited with a third-party intermediary. These proceeds are accounted for as restricted cash until a suitable replacement property is acquired. In the event that the LKE purchases are not completed, the proceeds are returned to the Company after
180
days and reclassified as available cash. As of
December 31, 2017
and
2016
, the Company had
$59.7 million
and
$71.7 million
, respectively, of proceeds from real estate sales classified as restricted cash which were deposited with an LKE intermediary as well as cash held in escrow for a real estate sale.
99
RAYONIER INC. AND SUBSIDIARIES
NOTES TO CONSOLIDATED FINANCIAL STATEMENTS (Continued)
(Dollar amounts in thousands unless otherwise stated)
|
20.
|
OTHER ASSETS
|
Included in Other Assets are non-current prepaid and deferred income taxes, derivatives, goodwill in the New Zealand JV, long-term prepaid roads, and other deferred expenses including debt issuance costs related to revolving debt and capitalized software costs.
See
Note 9 — Income Taxes
for further information on the non-current prepaid and deferred income taxes.
See
Note 13 — Derivative Financial Instruments and Hedging Activities
for further information on derivatives including their classification on the Consolidated Balance Sheets.
As of
December 31, 2017
, New Zealand JV goodwill was
$8.8 million
and was included in the assets of the New Zealand Timber segment. Based on a Step 1 impairment analysis performed as of October 1, 2017, there is no indication of impairment of goodwill as of
December 31, 2017
. Except for changes in the New Zealand foreign exchange rate, there have been no adjustments to the carrying value of goodwill since the initial recognition. See
Note 2 — Summary of Significant Accounting Policies
for additional information on goodwill.
Changes in goodwill for the years ended
December 31, 2017
and
2016
were:
|
2017
|
2016
|
||||||
|
Balance, January 1 (net of $0 of accumulated impairment)
|
|
$8,679
|
|
|
$8,478
|
|
|
|
Changes to carrying amount
|
|||||||
|
Acquisitions
|
—
|
|
—
|
|
|||
|
Impairment
|
—
|
|
—
|
|
|||
|
Foreign currency adjustment
|
97
|
|
201
|
|
|||
|
Balance, December 31 (net of $0 of accumulated impairment)
|
|
$8,776
|
|
|
$8,679
|
|
|
Costs for roads in the Pacific Northwest and New Zealand built to access particular tracts to be harvested in the upcoming 24 months to 60 months are recorded as prepaid logging and secondary roads. At
December 31, 2017
and
2016
, long-term prepaid roads in the Pacific Northwest were
$3.7 million
and
$3.2 million
, respectively. At
December 31, 2017
and
2016
, long-term secondary roads in New Zealand were
$2.7 million
and
$2.2 million
, respectively.
Debt issuance costs related to revolving debt are capitalized and amortized to interest expense over the term of the revolving debt using a method that approximates the effective interest method. At
December 31, 2017
and
2016
, capitalized debt issuance costs on revolving debt were
$0.3 million
and
$0.5 million
, respectively.
Software costs are capitalized and amortized over a period not exceeding
five
years using the straight-line method. At
December 31, 2017
and
2016
, capitalized software costs were
$4.1 million
and
$4.1 million
, respectively.
21.
ASSETS HELD FOR SALE
Assets held for sale is composed of properties expected to be sold within the next
12 months
that also meet the other relevant held-for-sale criteria in accordance with ASC 360-10-45-9. As of December 31, 2017, there were
no
properties identified that met this classification. As of December 31, 2016, the basis in properties meeting this classification was
$23.2 million
. Since the basis in these properties was less than the fair value, including costs to sell, no impairment was recognized.
100
RAYONIER INC. AND SUBSIDIARIES
NOTES TO CONSOLIDATED FINANCIAL STATEMENTS (Continued)
(Dollar amounts in thousands unless otherwise stated)
|
22.
|
ACCUMULATED OTHER COMPREHENSIVE INCOME/(LOSS)
|
The following table summarizes the changes in AOCI by component for the years ended
December 31, 2017
and
2016
. All amounts are presented net of tax effect and exclude portions attributable to noncontrolling interest.
|
Foreign currency translation gains/(losses)
|
Net investment hedges of New Zealand JV
|
Cash flow hedges
|
Employee benefit plans
|
Total
|
|||||||||||||||
|
Balance as of December 31, 2015
|
|
($2,450
|
)
|
|
$6,271
|
|
|
($11,592
|
)
|
|
($25,732
|
)
|
|
($33,503
|
)
|
||||
|
Other comprehensive income before reclassifications
|
7,387
|
|
—
|
|
22,024
|
|
3,020
|
|
(b)
|
32,431
|
|
||||||||
|
Amounts reclassified from accumulated other comprehensive income
|
—
|
|
(4,606
|
)
|
583
|
|
2,513
|
|
(c)
|
(1,510
|
)
|
||||||||
|
Net other comprehensive income/(loss)
|
7,387
|
|
(4,606
|
)
|
22,607
|
|
5,533
|
|
30,921
|
|
|||||||||
|
Recapitalization of New Zealand JV
|
3,622
|
|
—
|
|
(184
|
)
|
—
|
|
3,438
|
|
|||||||||
|
Balance as of December 31, 2016
|
|
$8,559
|
|
|
$1,665
|
|
|
$10,831
|
|
|
($20,199
|
)
|
|
$856
|
|
||||
|
Other comprehensive income/(loss) before reclassifications
|
7,416
|
|
—
|
|
7,321
|
|
(a)
|
(673
|
)
|
14,064
|
|
||||||||
|
Amounts reclassified from accumulated other comprehensive income
|
—
|
|
—
|
|
(1,968
|
)
|
465
|
|
(c)
|
(1,503
|
)
|
||||||||
|
Net other comprehensive income/(loss)
|
7,416
|
|
—
|
|
5,353
|
|
(208
|
)
|
12,561
|
|
|||||||||
|
Balance as of December 31, 2017
|
|
$15,975
|
|
|
$1,665
|
|
|
$16,184
|
|
|
($20,407
|
)
|
|
$13,417
|
|
||||
|
(a)
|
Includes
$4.2 million
of other comprehensive gain related to interest rate swaps. See
Note 13 — Derivative Financial Instruments and Hedging Activities
for additional information.
|
|
(b)
|
This accumulated other comprehensive income component is comprised of
$2.4 million
from the annual computation of pension liabilities and a
$5.4 million
curtailment gain. See
Note 15 — Employee Benefit Plans
for additional information.
|
|
(c)
|
This component of other comprehensive income is included in the computation of net periodic pension cost. See
Note 15 — Employee Benefit Plans
for additional information.
|
The following table presents details of the amounts reclassified in their entirety from AOCI for the years ended
December 31, 2017
and
2016
:
|
Details about accumulated other comprehensive income (loss) components
|
Amount reclassified from accumulated other comprehensive income (loss)
|
Affected line item in the income statement
|
||||||||
|
2017
|
2016
|
|||||||||
|
Realized (gain) loss on foreign currency exchange contracts
|
|
($2,631
|
)
|
|
$759
|
|
Other operating (income) expense, net
|
|||
|
Realized (gain) loss on foreign currency option contracts
|
(919
|
)
|
436
|
|
Other operating (income) expense, net
|
|||||
|
Noncontrolling interest
|
817
|
|
(385
|
)
|
Comprehensive income (loss) attributable to noncontrolling interest
|
|||||
|
Income tax expense (benefit) from foreign currency contracts
|
765
|
|
(227
|
)
|
Income tax (expense) benefit (Note 9)
|
|||||
|
Net (gain) loss on cash flow hedges reclassified from accumulated other comprehensive income
|
|
($1,968
|
)
|
|
$583
|
|
||||
101
RAYONIER INC. AND SUBSIDIARIES
NOTES TO CONSOLIDATED FINANCIAL STATEMENTS (Continued)
(Dollar amounts in thousands unless otherwise stated)
|
23.
|
QUARTERLY RESULTS FOR
2017
and
2016
(UNAUDITED)
|
(thousands of dollars, except per share amounts)
|
|
Quarter Ended
|
Total Year
|
|||||||||||||||||
|
|
Mar. 31
|
June 30
|
Sept. 30
|
Dec. 31
|
|||||||||||||||
|
2017
|
|||||||||||||||||||
|
Sales
|
|
$194,491
|
|
|
$200,964
|
|
|
$184,419
|
|
|
$239,722
|
|
|
$819,596
|
|
||||
|
Cost of sales
|
136,828
|
|
144,610
|
|
136,983
|
|
149,832
|
|
568,253
|
|
|||||||||
|
Net Income
|
35,083
|
|
30,773
|
|
28,803
|
|
66,920
|
|
161,579
|
|
|||||||||
|
Net Income attributable to Rayonier Inc.
|
33,843
|
|
|
26,161
|
|
24,688
|
|
64,150
|
|
148,842
|
|
||||||||
|
Basic EPS attributable to Rayonier Inc.
|
|
$0.27
|
|
|
$0.20
|
|
|
$0.19
|
|
|
$0.50
|
|
|
$1.17
|
|
||||
|
Diluted EPS attributable to Rayonier Inc.
|
|
$0.27
|
|
|
$0.20
|
|
|
$0.19
|
|
|
$0.50
|
|
|
$1.16
|
|
||||
|
2016
|
|||||||||||||||||||
|
Sales
|
|
$140,575
|
|
|
$269,171
|
|
|
$176,867
|
|
|
$229,302
|
|
|
$815,915
|
|
||||
|
Cost of sales
|
108,447
|
|
138,480
|
|
116,922
|
|
162,590
|
|
526,439
|
|
|||||||||
|
Net Income
|
15,058
|
|
111,579
|
|
40,624
|
|
50,509
|
|
217,770
|
|
|||||||||
|
Net Income attributable to Rayonier Inc.
|
14,472
|
|
109,821
|
|
39,355
|
|
48,324
|
|
211,972
|
|
|||||||||
|
Basic EPS attributable to Rayonier Inc.
|
|
$0.12
|
|
|
$0.90
|
|
|
$0.32
|
|
|
$0.39
|
|
|
$1.73
|
|
||||
|
Diluted EPS attributable to Rayonier Inc.
|
|
$0.12
|
|
|
$0.89
|
|
|
$0.32
|
|
|
$0.39
|
|
|
$1.73
|
|
||||
In an effort to report certain revenue and expenses in a manner more representative of activities that constitute ongoing central operations, the Company has changed its classification of non-timber income, including lease and license income, carbon credit sales, log agency fees and other non-timber income, net of costs, from “Other Operating Income, Net” to “Sales” and “Cost of Sales.” This reclassification was applied retrospectively to all periods presented. For additional information on this classification change see
Note 2 — Summary of Significant Accounting Policies
. See table below for 2017 amounts prior to reclassification and 2016 amounts historically presented:
|
|
Quarter Ended
|
Total Year
|
|||||||||||||||||
|
|
Mar. 31
|
June 30
|
Sept. 30
|
Dec. 31
|
|||||||||||||||
|
2017
|
|||||||||||||||||||
|
Sales
|
|
$186,512
|
|
|
$194,719
|
|
|
$177,946
|
|
|
$233,482
|
|
|
$792,659
|
|
||||
|
Cost of sales
|
136,413
|
|
143,687
|
|
136,583
|
|
149,206
|
|
565,889
|
|
|||||||||
|
2016
|
|||||||||||||||||||
|
Sales
|
|
$134,843
|
|
|
$261,550
|
|
|
$171,421
|
|
|
$220,464
|
|
|
$788,278
|
|
||||
|
Cost of sales
|
107,971
|
|
138,194
|
|
116,624
|
|
161,918
|
|
524,707
|
|
|||||||||
102
RAYONIER INC. AND SUBSIDIARIES
NOTES TO CONSOLIDATED FINANCIAL STATEMENTS (Continued)
(Dollar amounts in thousands unless otherwise stated)
|
24.
|
CONSOLIDATING FINANCIAL STATEMENTS
|
The condensed consolidating financial information below follows the same accounting policies as described in the consolidated financial statements, except for the use of the equity method of accounting to reflect ownership interests in wholly-owned subsidiaries, which are eliminated upon consolidation, and the allocation of certain expenses of Rayonier Inc. incurred for the benefit of its subsidiaries.
In March 2012, Rayonier Inc. issued
$325 million
of
3.75%
Senior Notes due 2022. In connection with these notes, the Company provides the following condensed consolidating financial information in accordance with SEC Regulation S-X Rule 3-10,
Financial Statements of Guarantors and Issuers of Guaranteed Securities Registered or Being Registered
.
The subsidiary guarantors, Rayonier Operating Company LLC (“ROC”) and Rayonier TRS Holdings Inc., are wholly-owned by the parent company, Rayonier Inc. The notes are fully and unconditionally guaranteed on a joint and several basis by the guarantor subsidiaries.
|
|
CONDENSED CONSOLIDATING STATEMENTS OF INCOME AND COMPREHENSIVE INCOME
For the Year Ended December 31, 2017 |
||||||||||||||||||
|
|
Rayonier Inc.
(Parent Issuer) |
Subsidiary Guarantors
|
Non-
guarantors
|
Consolidating
Adjustments
|
Total
Consolidated
|
||||||||||||||
|
SALES
|
—
|
|
—
|
|
|
$819,596
|
|
—
|
|
|
$819,596
|
|
|||||||
|
Costs and Expenses
|
|||||||||||||||||||
|
Cost of sales
|
—
|
|
—
|
|
568,253
|
|
—
|
|
568,253
|
|
|||||||||
|
Selling and general expenses
|
—
|
|
16,797
|
|
23,448
|
|
—
|
|
40,245
|
|
|||||||||
|
Other operating expense (income), net
|
—
|
|
479
|
|
(4,872
|
)
|
—
|
|
(4,393
|
)
|
|||||||||
|
—
|
|
17,276
|
|
586,829
|
|
—
|
|
604,105
|
|
||||||||||
|
OPERATING (LOSS) INCOME
|
—
|
|
(17,276
|
)
|
232,767
|
|
—
|
|
215,491
|
|
|||||||||
|
Interest expense
|
(12,556
|
)
|
(19,699
|
)
|
(1,816
|
)
|
—
|
|
(34,071
|
)
|
|||||||||
|
Interest and miscellaneous income (expense), net
|
9,679
|
|
2,878
|
|
(10,717
|
)
|
—
|
|
1,840
|
|
|||||||||
|
Equity in income from subsidiaries
|
151,719
|
|
186,388
|
|
—
|
|
(338,107
|
)
|
—
|
|
|||||||||
|
INCOME BEFORE INCOME TAXES
|
148,842
|
|
152,291
|
|
220,234
|
|
(338,107
|
)
|
183,260
|
|
|||||||||
|
Income tax expense
|
—
|
|
(572
|
)
|
(21,109
|
)
|
—
|
|
(21,681
|
)
|
|||||||||
|
NET INCOME
|
148,842
|
|
151,719
|
|
199,125
|
|
(338,107
|
)
|
161,579
|
|
|||||||||
|
Less: Net income attributable to noncontrolling interest
|
—
|
|
—
|
|
12,737
|
|
—
|
|
12,737
|
|
|||||||||
|
NET INCOME ATTRIBUTABLE TO RAYONIER INC.
|
148,842
|
|
151,719
|
|
186,388
|
|
(338,107
|
)
|
148,842
|
|
|||||||||
|
OTHER COMPREHENSIVE INCOME
|
|||||||||||||||||||
|
Foreign currency translation adjustment
|
7,416
|
|
—
|
|
9,114
|
|
(7,416
|
)
|
9,114
|
|
|||||||||
|
New Zealand joint venture cash flow hedges
|
5,353
|
|
4,214
|
|
1,479
|
|
(5,353
|
)
|
5,693
|
|
|||||||||
|
Actuarial change and amortization of pension and postretirement plan liabilities
|
(208
|
)
|
(208
|
)
|
—
|
|
208
|
|
(208
|
)
|
|||||||||
|
Total other comprehensive income
|
12,561
|
|
4,006
|
|
10,593
|
|
(12,561
|
)
|
14,599
|
|
|||||||||
|
COMPREHENSIVE INCOME
|
161,403
|
|
155,725
|
|
209,718
|
|
(350,668
|
)
|
176,178
|
|
|||||||||
|
Less: Comprehensive income attributable to noncontrolling interest
|
—
|
|
—
|
|
14,775
|
|
—
|
|
14,775
|
|
|||||||||
|
COMPREHENSIVE INCOME ATTRIBUTABLE TO RAYONIER INC.
|
|
$161,403
|
|
|
$155,725
|
|
|
$194,943
|
|
|
($350,668
|
)
|
|
$161,403
|
|
||||
103
RAYONIER INC. AND SUBSIDIARIES
NOTES TO CONSOLIDATED FINANCIAL STATEMENTS (Continued)
(Dollar amounts in thousands unless otherwise stated)
|
|
CONDENSED CONSOLIDATING STATEMENTS OF INCOME AND COMPREHENSIVE INCOME
For the Year Ended December 31, 2016 |
||||||||||||||||||
|
|
Rayonier Inc.
(Parent Issuer) |
Subsidiary Guarantors
|
Non-
guarantors
|
Consolidating
Adjustments
|
Total
Consolidated
|
||||||||||||||
|
SALES
|
—
|
|
—
|
|
|
$815,915
|
|
—
|
|
|
$815,915
|
|
|||||||
|
Costs and Expenses
|
|||||||||||||||||||
|
Cost of sales
|
—
|
|
—
|
|
526,439
|
|
—
|
|
526,439
|
|
|||||||||
|
Selling and general expenses
|
—
|
|
15,253
|
|
27,532
|
|
—
|
|
42,785
|
|
|||||||||
|
Other operating expense (income), net
|
—
|
|
448
|
|
(9,534
|
)
|
—
|
|
(9,086
|
)
|
|||||||||
|
—
|
|
15,701
|
|
544,437
|
|
—
|
|
560,138
|
|
||||||||||
|
OPERATING (LOSS) INCOME
|
—
|
|
(15,701
|
)
|
271,478
|
|
—
|
|
255,777
|
|
|||||||||
|
Interest expense
|
(12,555
|
)
|
(16,775
|
)
|
(2,915
|
)
|
—
|
|
(32,245
|
)
|
|||||||||
|
Interest and miscellaneous income (expense), net
|
8,613
|
|
2,750
|
|
(12,061
|
)
|
—
|
|
(698
|
)
|
|||||||||
|
Equity in income from subsidiaries
|
215,914
|
|
246,193
|
|
—
|
|
(462,107
|
)
|
—
|
|
|||||||||
|
INCOME BEFORE INCOME TAXES
|
211,972
|
|
216,467
|
|
256,502
|
|
(462,107
|
)
|
222,834
|
|
|||||||||
|
Income tax expense
|
—
|
|
(553
|
)
|
(4,511
|
)
|
—
|
|
(5,064
|
)
|
|||||||||
|
NET INCOME
|
211,972
|
|
215,914
|
|
251,991
|
|
(462,107
|
)
|
217,770
|
|
|||||||||
|
Less: Net income attributable to noncontrolling interest
|
—
|
|
—
|
|
5,798
|
|
—
|
|
5,798
|
|
|||||||||
|
NET INCOME ATTRIBUTABLE TO RAYONIER INC.
|
211,972
|
|
215,914
|
|
246,193
|
|
(462,107
|
)
|
211,972
|
|
|||||||||
|
OTHER COMPREHENSIVE INCOME
|
|||||||||||||||||||
|
Foreign currency translation adjustment
|
2,780
|
|
(4,606
|
)
|
10,930
|
|
(2,782
|
)
|
6,322
|
|
|||||||||
|
New Zealand joint venture cash flow hedges
|
22,607
|
|
21,422
|
|
1,401
|
|
(22,608
|
)
|
22,822
|
|
|||||||||
|
Actuarial change and amortization of pension and postretirement plan liabilities
|
5,533
|
|
5,533
|
|
—
|
|
(5,533
|
)
|
5,533
|
|
|||||||||
|
Total other comprehensive income
|
30,920
|
|
22,349
|
|
12,331
|
|
(30,923
|
)
|
34,677
|
|
|||||||||
|
COMPREHENSIVE INCOME
|
242,892
|
|
238,263
|
|
264,322
|
|
(493,030
|
)
|
252,447
|
|
|||||||||
|
Less: Comprehensive income attributable to noncontrolling interest
|
—
|
|
—
|
|
9,555
|
|
—
|
|
9,555
|
|
|||||||||
|
COMPREHENSIVE INCOME ATTRIBUTABLE TO RAYONIER INC.
|
|
$242,892
|
|
|
$238,263
|
|
|
$254,767
|
|
|
($493,030
|
)
|
|
$242,892
|
|
||||
104
RAYONIER INC. AND SUBSIDIARIES
NOTES TO CONSOLIDATED FINANCIAL STATEMENTS (Continued)
(Dollar amounts in thousands unless otherwise stated)
|
|
CONDENSED CONSOLIDATING STATEMENTS OF INCOME AND COMPREHENSIVE INCOME
For the Year Ended December 31, 2015 |
||||||||||||||||||
|
|
Rayonier Inc.
(Parent Issuer) |
Subsidiary Guarantors
|
Non-
guarantors
|
Consolidating
Adjustments
|
Total
Consolidated
|
||||||||||||||
|
SALES
|
—
|
|
—
|
|
|
$568,800
|
|
—
|
|
|
$568,800
|
|
|||||||
|
Costs and Expenses
|
|||||||||||||||||||
|
Cost of sales
|
—
|
|
—
|
|
441,718
|
|
—
|
|
441,718
|
|
|||||||||
|
Selling and general expenses
|
—
|
|
20,468
|
|
25,282
|
|
—
|
|
45,750
|
|
|||||||||
|
Other operating (income) expense, net
|
—
|
|
(404
|
)
|
3,952
|
|
—
|
|
3,548
|
|
|||||||||
|
—
|
|
20,064
|
|
470,952
|
|
—
|
|
491,016
|
|
||||||||||
|
OPERATING (LOSS) INCOME
|
—
|
|
(20,064
|
)
|
97,848
|
|
—
|
|
77,784
|
|
|||||||||
|
Interest expense
|
(12,703
|
)
|
(9,135
|
)
|
(9,861
|
)
|
—
|
|
(31,699
|
)
|
|||||||||
|
Interest and miscellaneous income (expense), net
|
7,789
|
|
2,612
|
|
(13,404
|
)
|
—
|
|
(3,003
|
)
|
|||||||||
|
Equity in income from subsidiaries
|
51,079
|
|
75,532
|
|
—
|
|
(126,611
|
)
|
—
|
|
|||||||||
|
INCOME BEFORE INCOME TAXES
|
46,165
|
|
48,945
|
|
74,583
|
|
(126,611
|
)
|
43,082
|
|
|||||||||
|
Income tax benefit (expense)
|
—
|
|
2,134
|
|
(1,275
|
)
|
—
|
|
859
|
|
|||||||||
|
NET INCOME
|
46,165
|
|
51,079
|
|
73,308
|
|
(126,611
|
)
|
43,941
|
|
|||||||||
|
Less: Net loss attributable to noncontrolling interest
|
—
|
|
—
|
|
(2,224
|
)
|
—
|
|
(2,224
|
)
|
|||||||||
|
NET INCOME ATTRIBUTABLE TO RAYONIER INC.
|
46,165
|
|
51,079
|
|
75,532
|
|
(126,611
|
)
|
46,165
|
|
|||||||||
|
OTHER COMPREHENSIVE (LOSS) INCOME
|
|
|
|||||||||||||||||
|
Foreign currency translation adjustment
|
(21,567
|
)
|
7,922
|
|
(40,373
|
)
|
21,567
|
|
(32,451
|
)
|
|||||||||
|
New Zealand joint venture cash flow hedges
|
(10,042
|
)
|
(10,195
|
)
|
234
|
|
10,042
|
|
(9,961
|
)
|
|||||||||
|
Actuarial change and amortization of pension and postretirement plan liabilities
|
2,933
|
|
2,933
|
|
—
|
|
(2,933
|
)
|
2,933
|
|
|||||||||
|
Total other comprehensive (loss) income
|
(28,676
|
)
|
660
|
|
(40,139
|
)
|
28,676
|
|
(39,479
|
)
|
|||||||||
|
COMPREHENSIVE INCOME
|
17,489
|
|
51,739
|
|
33,169
|
|
(97,935
|
)
|
4,462
|
|
|||||||||
|
Less: Comprehensive loss attributable to noncontrolling interest
|
—
|
|
—
|
|
(13,027
|
)
|
—
|
|
(13,027
|
)
|
|||||||||
|
COMPREHENSIVE INCOME ATTRIBUTABLE TO RAYONIER INC.
|
|
$17,489
|
|
|
$51,739
|
|
|
$46,196
|
|
|
($97,935
|
)
|
|
$17,489
|
|
||||
105
RAYONIER INC. AND SUBSIDIARIES
NOTES TO CONSOLIDATED FINANCIAL STATEMENTS (Continued)
(Dollar amounts in thousands unless otherwise stated)
|
|
CONDENSED CONSOLIDATING BALANCE SHEETS
As of December 31, 2017 |
||||||||||||||||||
|
|
Rayonier Inc.
(Parent Issuer) |
Subsidiary Guarantors
|
Non-
guarantors
|
Consolidating
Adjustments
|
Total
Consolidated
|
||||||||||||||
|
ASSETS
|
|||||||||||||||||||
|
CURRENT ASSETS
|
|||||||||||||||||||
|
Cash and cash equivalents
|
|
$48,564
|
|
|
$25,042
|
|
|
$39,047
|
|
—
|
|
|
$112,653
|
|
|||||
|
Accounts receivable, less allowance for doubtful accounts
|
—
|
|
3,726
|
|
23,967
|
|
—
|
|
27,693
|
|
|||||||||
|
Inventory
|
—
|
|
—
|
|
24,141
|
|
—
|
|
24,141
|
|
|||||||||
|
Prepaid logging roads
|
—
|
|
—
|
|
11,207
|
|
—
|
|
11,207
|
|
|||||||||
|
Prepaid expenses
|
—
|
|
759
|
|
4,027
|
|
—
|
|
4,786
|
|
|||||||||
|
Other current assets
|
—
|
|
14
|
|
3,033
|
|
—
|
|
3,047
|
|
|||||||||
|
Total current assets
|
48,564
|
|
29,541
|
|
105,422
|
|
—
|
|
183,527
|
|
|||||||||
|
TIMBER AND TIMBERLANDS, NET OF DEPLETION AND AMORTIZATION
|
—
|
|
—
|
|
2,462,066
|
|
—
|
|
2,462,066
|
|
|||||||||
|
HIGHER AND BETTER USE TIMBERLANDS AND REAL ESTATE DEVELOPMENT INVESTMENTS
|
—
|
|
—
|
|
80,797
|
|
—
|
|
80,797
|
|
|||||||||
|
NET PROPERTY, PLANT AND EQUIPMENT
|
—
|
|
21
|
|
23,357
|
|
—
|
|
23,378
|
|
|||||||||
|
RESTRICTED CASH
|
—
|
|
—
|
|
59,703
|
|
—
|
|
59,703
|
|
|||||||||
|
INVESTMENT IN SUBSIDIARIES
|
1,531,156
|
|
2,814,408
|
|
—
|
|
(4,345,564
|
)
|
—
|
|
|||||||||
|
INTERCOMPANY RECEIVABLE
|
40,067
|
|
(628,167
|
)
|
588,100
|
|
—
|
|
—
|
|
|||||||||
|
OTHER ASSETS
|
2
|
|
12,680
|
|
36,328
|
|
—
|
|
49,010
|
|
|||||||||
|
TOTAL ASSETS
|
|
$1,619,789
|
|
|
$2,228,483
|
|
|
$3,355,773
|
|
|
($4,345,564
|
)
|
|
$2,858,481
|
|
||||
|
LIABILITIES AND SHAREHOLDERS’ EQUITY
|
|||||||||||||||||||
|
CURRENT LIABILITIES
|
|||||||||||||||||||
|
Accounts payable
|
—
|
|
|
$2,838
|
|
|
$22,310
|
|
—
|
|
|
$25,148
|
|
||||||
|
Current maturities of long-term debt
|
—
|
|
—
|
|
3,375
|
|
—
|
|
3,375
|
|
|||||||||
|
Accrued taxes
|
—
|
|
48
|
|
3,733
|
|
—
|
|
3,781
|
|
|||||||||
|
Accrued payroll and benefits
|
—
|
|
5,298
|
|
4,364
|
|
—
|
|
9,662
|
|
|||||||||
|
Accrued interest
|
3,047
|
|
1,995
|
|
12
|
|
—
|
|
5,054
|
|
|||||||||
|
Deferred revenue
|
—
|
|
—
|
|
9,721
|
|
—
|
|
9,721
|
|
|||||||||
|
Other current liabilities
|
—
|
|
564
|
|
11,243
|
|
—
|
|
11,807
|
|
|||||||||
|
Total current liabilities
|
3,047
|
|
10,743
|
|
54,758
|
|
—
|
|
68,548
|
|
|||||||||
|
LONG-TERM DEBT
|
323,434
|
|
663,570
|
|
35,000
|
|
—
|
|
1,022,004
|
|
|||||||||
|
PENSION AND OTHER POSTRETIREMENT BENEFITS
|
—
|
|
32,589
|
|
(684
|
)
|
—
|
|
31,905
|
|
|||||||||
|
OTHER NON-CURRENT LIABILITIES
|
—
|
|
9,386
|
|
33,698
|
|
—
|
|
43,084
|
|
|||||||||
|
INTERCOMPANY PAYABLE
|
(299,715
|
)
|
(18,961
|
)
|
318,676
|
|
—
|
|
—
|
|
|||||||||
|
TOTAL RAYONIER INC. SHAREHOLDERS’ EQUITY
|
1,593,023
|
|
1,531,156
|
|
2,814,408
|
|
(4,345,564
|
)
|
1,593,023
|
|
|||||||||
|
Noncontrolling interest
|
—
|
|
—
|
|
99,917
|
|
—
|
|
99,917
|
|
|||||||||
|
TOTAL SHAREHOLDERS’ EQUITY
|
1,593,023
|
|
1,531,156
|
|
2,914,325
|
|
(4,345,564
|
)
|
1,692,940
|
|
|||||||||
|
TOTAL LIABILITIES AND SHAREHOLDERS’ EQUITY
|
|
$1,619,789
|
|
|
$2,228,483
|
|
|
$3,355,773
|
|
|
($4,345,564
|
)
|
|
$2,858,481
|
|
||||
106
RAYONIER INC. AND SUBSIDIARIES
NOTES TO CONSOLIDATED FINANCIAL STATEMENTS (Continued)
(Dollar amounts in thousands unless otherwise stated)
|
|
CONDENSED CONSOLIDATING BALANCE SHEETS
As of December 31, 2016 |
||||||||||||||||||
|
|
Rayonier Inc.
(Parent Issuer) |
Subsidiary Guarantors
|
Non-
guarantors
|
Consolidating
Adjustments
|
Total
Consolidated
|
||||||||||||||
|
ASSETS
|
|||||||||||||||||||
|
CURRENT ASSETS
|
|||||||||||||||||||
|
Cash and cash equivalents
|
|
$21,453
|
|
|
$9,461
|
|
|
$54,995
|
|
—
|
|
|
$85,909
|
|
|||||
|
Accounts receivable, less allowance for doubtful accounts
|
—
|
|
2,991
|
|
17,673
|
|
—
|
|
20,664
|
|
|||||||||
|
Inventory
|
—
|
|
—
|
|
21,379
|
|
—
|
|
21,379
|
|
|||||||||
|
Prepaid logging roads
|
—
|
|
—
|
|
10,228
|
|
—
|
|
10,228
|
|
|||||||||
|
Prepaid expenses
|
—
|
|
427
|
|
1,152
|
|
—
|
|
1,579
|
|
|||||||||
|
Assets held for sale
|
—
|
|
—
|
|
23,171
|
|
—
|
|
23,171
|
|
|||||||||
|
Other current assets
|
—
|
|
236
|
|
1,638
|
|
—
|
|
1,874
|
|
|||||||||
|
Total current assets
|
21,453
|
|
13,115
|
|
130,236
|
|
—
|
|
164,804
|
|
|||||||||
|
TIMBER AND TIMBERLANDS, NET OF DEPLETION AND AMORTIZATION
|
—
|
|
—
|
|
2,291,015
|
|
—
|
|
2,291,015
|
|
|||||||||
|
HIGHER AND BETTER USE TIMBERLANDS AND REAL ESTATE DEVELOPMENT INVESTMENTS
|
—
|
|
—
|
|
70,374
|
|
—
|
|
70,374
|
|
|||||||||
|
NET PROPERTY, PLANT AND EQUIPMENT
|
—
|
|
177
|
|
13,857
|
|
—
|
|
14,034
|
|
|||||||||
|
RESTRICTED CASH
|
—
|
|
—
|
|
71,708
|
|
—
|
|
71,708
|
|
|||||||||
|
INVESTMENT IN SUBSIDIARIES
|
1,422,081
|
|
2,671,428
|
|
—
|
|
(4,093,509
|
)
|
—
|
|
|||||||||
|
INTERCOMPANY RECEIVABLES
|
26,472
|
|
(611,571
|
)
|
585,099
|
|
—
|
|
—
|
|
|||||||||
|
OTHER ASSETS
|
2
|
|
46,846
|
|
26,977
|
|
—
|
|
73,825
|
|
|||||||||
|
TOTAL ASSETS
|
|
$1,470,008
|
|
|
$2,119,995
|
|
|
$3,189,266
|
|
|
($4,093,509
|
)
|
|
$2,685,760
|
|
||||
|
LIABILITIES AND SHAREHOLDERS’ EQUITY
|
|||||||||||||||||||
|
CURRENT LIABILITIES
|
|||||||||||||||||||
|
Accounts payable
|
—
|
|
|
$1,194
|
|
|
$21,143
|
|
—
|
|
|
$22,337
|
|
||||||
|
Current maturities of long-term debt
|
31,676
|
|
—
|
|
—
|
|
—
|
|
31,676
|
|
|||||||||
|
Accrued taxes
|
—
|
|
(111
|
)
|
2,768
|
|
—
|
|
2,657
|
|
|||||||||
|
Accrued payroll and benefits
|
—
|
|
5,013
|
|
4,264
|
|
—
|
|
9,277
|
|
|||||||||
|
Accrued interest
|
3,047
|
|
2,040
|
|
253
|
|
—
|
|
5,340
|
|
|||||||||
|
Deferred revenue
|
—
|
|
—
|
|
9,099
|
|
—
|
|
9,099
|
|
|||||||||
|
Other current liabilities
|
—
|
|
165
|
|
11,415
|
|
—
|
|
11,580
|
|
|||||||||
|
Total current liabilities
|
34,723
|
|
8,301
|
|
48,942
|
|
—
|
|
91,966
|
|
|||||||||
|
LONG-TERM DEBT
|
291,390
|
|
663,343
|
|
75,472
|
|
—
|
|
1,030,205
|
|
|||||||||
|
PENSION AND OTHER POSTRETIREMENT BENEFITS
|
—
|
|
32,541
|
|
(685
|
)
|
—
|
|
31,856
|
|
|||||||||
|
OTHER NON-CURRENT LIABILITIES
|
—
|
|
12,690
|
|
22,291
|
|
—
|
|
34,981
|
|
|||||||||
|
INTERCOMPANY PAYABLE
|
(267,715
|
)
|
(18,961
|
)
|
286,676
|
|
—
|
|
—
|
|
|||||||||
|
TOTAL RAYONIER INC. SHAREHOLDERS’ EQUITY
|
1,411,610
|
|
1,422,081
|
|
2,671,428
|
|
(4,093,509
|
)
|
1,411,610
|
|
|||||||||
|
Noncontrolling interest
|
—
|
|
—
|
|
85,142
|
|
—
|
|
85,142
|
|
|||||||||
|
TOTAL SHAREHOLDERS’ EQUITY
|
1,411,610
|
|
1,422,081
|
|
2,756,570
|
|
(4,093,509
|
)
|
1,496,752
|
|
|||||||||
|
TOTAL LIABILITIES AND SHAREHOLDERS’ EQUITY
|
|
$1,470,008
|
|
|
$2,119,995
|
|
|
$3,189,266
|
|
|
($4,093,509
|
)
|
|
$2,685,760
|
|
||||
107
RAYONIER INC. AND SUBSIDIARIES
NOTES TO CONSOLIDATED FINANCIAL STATEMENTS (Continued)
(Dollar amounts in thousands unless otherwise stated)
|
|
CONDENSED CONSOLIDATING STATEMENTS OF CASH FLOWS
For the Year Ended December 31, 2017 |
|||||||||||||||||
|
|
Rayonier Inc.
(Parent Issuer) |
Subsidiary Guarantors
|
Non-
guarantors
|
Consolidating
Adjustments
|
Total
Consolidated
|
|||||||||||||
|
CASH (USED FOR) PROVIDED BY OPERATING ACTIVITIES
|
|
($48,104
|
)
|
|
$111,431
|
|
|
$192,957
|
|
—
|
|
|
$256,284
|
|
||||
|
INVESTING ACTIVITIES
|
||||||||||||||||||
|
Capital expenditures
|
—
|
|
—
|
|
(65,345
|
)
|
—
|
|
(65,345
|
)
|
||||||||
|
Real estate development investments
|
—
|
|
—
|
|
(15,784
|
)
|
—
|
|
(15,784
|
)
|
||||||||
|
Purchase of timberlands
|
—
|
|
—
|
|
(242,910
|
)
|
—
|
|
(242,910
|
)
|
||||||||
|
Net proceeds from Large Dispositions
|
—
|
|
—
|
|
95,243
|
|
—
|
|
95,243
|
|
||||||||
|
Rayonier office building under construction
|
—
|
|
—
|
|
(6,084
|
)
|
—
|
|
(6,084
|
)
|
||||||||
|
Change in restricted cash
|
—
|
|
—
|
|
12,005
|
|
—
|
|
12,005
|
|
||||||||
|
Investment in subsidiaries
|
—
|
|
38,546
|
|
—
|
|
(38,546
|
)
|
—
|
|
||||||||
|
Other
|
—
|
|
—
|
|
(373
|
)
|
—
|
|
(373
|
)
|
||||||||
|
CASH PROVIDED BY (USED FOR) INVESTING ACTIVITIES
|
—
|
|
38,546
|
|
(223,248
|
)
|
(38,546
|
)
|
(223,248
|
)
|
||||||||
|
FINANCING ACTIVITIES
|
||||||||||||||||||
|
Issuance of debt
|
—
|
|
25,000
|
|
38,389
|
|
—
|
|
63,389
|
|
||||||||
|
Repayment of debt
|
—
|
|
(15,000
|
)
|
(85,157
|
)
|
—
|
|
(100,157
|
)
|
||||||||
|
Dividends paid
|
(127,069
|
)
|
—
|
|
—
|
|
—
|
|
(127,069
|
)
|
||||||||
|
Proceeds from the issuance of common shares
|
4,751
|
|
—
|
|
—
|
|
—
|
|
4,751
|
|
||||||||
|
Proceeds from the issuance of common shares from equity offering, net of costs
|
152,390
|
|
—
|
|
—
|
|
—
|
|
152,390
|
|
||||||||
|
Repurchase of common shares
|
(176
|
)
|
—
|
|
—
|
|
—
|
|
(176
|
)
|
||||||||
|
Issuance of intercompany notes
|
(32,000
|
)
|
—
|
|
32,000
|
|
—
|
|
—
|
|
||||||||
|
Intercompany distributions
|
77,319
|
|
(144,396
|
)
|
28,531
|
|
38,546
|
|
—
|
|
||||||||
|
CASH PROVIDED BY (USED FOR) FINANCING ACTIVITIES
|
75,215
|
|
(134,396
|
)
|
13,763
|
|
38,546
|
|
(6,872
|
)
|
||||||||
|
EFFECT OF EXCHANGE RATE CHANGES ON CASH
|
—
|
|
—
|
|
580
|
|
—
|
|
580
|
|
||||||||
|
CASH AND CASH EQUIVALENTS
|
||||||||||||||||||
|
Change in cash and cash equivalents
|
27,111
|
|
15,581
|
|
(15,948
|
)
|
—
|
|
26,744
|
|
||||||||
|
Balance, beginning of year
|
21,453
|
|
9,461
|
|
54,995
|
|
—
|
|
85,909
|
|
||||||||
|
Balance, end of year
|
|
$48,564
|
|
|
$25,042
|
|
|
$39,047
|
|
—
|
|
|
$112,653
|
|
||||
108
RAYONIER INC. AND SUBSIDIARIES
NOTES TO CONSOLIDATED FINANCIAL STATEMENTS (Continued)
(Dollar amounts in thousands unless otherwise stated)
|
|
CONDENSED CONSOLIDATING STATEMENTS OF CASH FLOWS
For the Year Ended December 31, 2016 |
|||||||||||||||||
|
|
Rayonier Inc.
(Parent Issuer) |
Subsidiary Guarantors
|
Non-
guarantors
|
Consolidating
Adjustments
|
Total
Consolidated
|
|||||||||||||
|
CASH (USED FOR) PROVIDED BY OPERATING ACTIVITIES
|
|
($7,480
|
)
|
|
$113,775
|
|
|
$97,506
|
|
—
|
|
|
$203,801
|
|
||||
|
INVESTING ACTIVITIES
|
||||||||||||||||||
|
Capital expenditures
|
—
|
|
—
|
|
(58,723
|
)
|
—
|
|
(58,723
|
)
|
||||||||
|
Real estate development investments
|
—
|
|
—
|
|
(8,746
|
)
|
—
|
|
(8,746
|
)
|
||||||||
|
Purchase of timberlands
|
—
|
|
—
|
|
(366,481
|
)
|
—
|
|
(366,481
|
)
|
||||||||
|
Assets purchased in business acquisition
|
—
|
|
—
|
|
(887
|
)
|
—
|
|
(887
|
)
|
||||||||
|
Net proceeds from Large Disposition
|
—
|
|
—
|
|
203,862
|
|
—
|
|
203,862
|
|
||||||||
|
Rayonier office building under construction
|
—
|
|
—
|
|
(6,307
|
)
|
—
|
|
(6,307
|
)
|
||||||||
|
Change in restricted cash
|
—
|
|
—
|
|
(48,184
|
)
|
—
|
|
(48,184
|
)
|
||||||||
|
Investment in subsidiaries
|
—
|
|
(293,820
|
)
|
—
|
|
293,820
|
|
—
|
|
||||||||
|
Other
|
—
|
|
—
|
|
2,311
|
|
—
|
|
2,311
|
|
||||||||
|
CASH USED FOR INVESTING ACTIVITIES
|
—
|
|
(293,820
|
)
|
(283,155
|
)
|
293,820
|
|
(283,155
|
)
|
||||||||
|
FINANCING ACTIVITIES
|
||||||||||||||||||
|
Issuance of debt
|
—
|
|
548,000
|
|
147,916
|
|
—
|
|
695,916
|
|
||||||||
|
Repayment of debt
|
—
|
|
(140,000
|
)
|
(318,415
|
)
|
—
|
|
(458,415
|
)
|
||||||||
|
Dividends paid
|
(122,845
|
)
|
—
|
|
—
|
|
—
|
|
(122,845
|
)
|
||||||||
|
Proceeds from the issuance of common shares
|
1,576
|
|
—
|
|
—
|
|
—
|
|
1,576
|
|
||||||||
|
Repurchase of common shares
|
(690
|
)
|
—
|
|
—
|
|
—
|
|
(690
|
)
|
||||||||
|
Debt issuance costs
|
—
|
|
(818
|
)
|
—
|
|
—
|
|
(818
|
)
|
||||||||
|
Issuance of intercompany notes
|
(12,000
|
)
|
—
|
|
12,000
|
|
—
|
|
—
|
|
||||||||
|
Intercompany distributions
|
160,597
|
|
(230,893
|
)
|
364,116
|
|
(293,820
|
)
|
—
|
|
||||||||
|
Other
|
(177
|
)
|
—
|
|
(124
|
)
|
—
|
|
(301
|
)
|
||||||||
|
CASH PROVIDED BY FINANCING ACTIVITIES
|
26,461
|
|
176,289
|
|
205,493
|
|
(293,820
|
)
|
114,423
|
|
||||||||
|
EFFECT OF EXCHANGE RATE CHANGES ON CASH
|
—
|
|
—
|
|
(937
|
)
|
—
|
|
(937
|
)
|
||||||||
|
CASH AND CASH EQUIVALENTS
|
||||||||||||||||||
|
Change in cash and cash equivalents
|
18,981
|
|
(3,756
|
)
|
18,907
|
|
—
|
|
34,132
|
|
||||||||
|
Balance, beginning of year
|
2,472
|
|
13,217
|
|
36,088
|
|
—
|
|
51,777
|
|
||||||||
|
Balance, end of year
|
|
$21,453
|
|
|
$9,461
|
|
|
$54,995
|
|
—
|
|
|
$85,909
|
|
||||
109
RAYONIER INC. AND SUBSIDIARIES
NOTES TO CONSOLIDATED FINANCIAL STATEMENTS (Continued)
(Dollar amounts in thousands unless otherwise stated)
|
|
CONDENSED CONSOLIDATING STATEMENTS OF CASH FLOWS
For the Year Ended December 31, 2015 |
|||||||||||||||||
|
|
Rayonier Inc.
(Parent Issuer) |
Subsidiary Guarantors
|
Non-
guarantors
|
Consolidating
Adjustments
|
Total
Consolidated
|
|||||||||||||
|
CASH (USED FOR) PROVIDED BY OPERATING ACTIVITIES
|
|
($4,890
|
)
|
|
($21,421
|
)
|
|
$203,475
|
|
—
|
|
|
$177,164
|
|
||||
|
INVESTING ACTIVITIES
|
|
|||||||||||||||||
|
Capital expenditures
|
—
|
|
(78
|
)
|
(57,215
|
)
|
—
|
|
(57,293
|
)
|
||||||||
|
Real estate development investments
|
—
|
|
—
|
|
(2,676
|
)
|
—
|
|
(2,676
|
)
|
||||||||
|
Purchase of timberlands
|
—
|
|
—
|
|
(98,409
|
)
|
—
|
|
(98,409
|
)
|
||||||||
|
Proceeds from settlement of foreign currency derivative
|
—
|
|
—
|
|
2,804
|
|
—
|
|
2,804
|
|
||||||||
|
Rayonier office building under construction
|
—
|
|
—
|
|
(908
|
)
|
—
|
|
(908
|
)
|
||||||||
|
Change in restricted cash
|
—
|
|
—
|
|
(16,836
|
)
|
—
|
|
(16,836
|
)
|
||||||||
|
Investment in subsidiaries
|
—
|
|
126,242
|
|
—
|
|
(126,242
|
)
|
—
|
|
||||||||
|
Other
|
—
|
|
—
|
|
7,009
|
|
—
|
|
7,009
|
|
||||||||
|
CASH PROVIDED BY (USED FOR) INVESTING ACTIVITIES
|
—
|
|
126,164
|
|
(166,231
|
)
|
(126,242
|
)
|
(166,309
|
)
|
||||||||
|
FINANCING ACTIVITIES
|
||||||||||||||||||
|
Issuance of debt
|
61,000
|
|
353,000
|
|
58,558
|
|
—
|
|
472,558
|
|
||||||||
|
Repayment of debt
|
(61,000
|
)
|
(232,973
|
)
|
(70,429
|
)
|
—
|
|
(364,402
|
)
|
||||||||
|
Dividends paid
|
(124,936
|
)
|
—
|
|
—
|
|
—
|
|
(124,936
|
)
|
||||||||
|
Proceeds from the issuance of common shares
|
2,117
|
|
—
|
|
—
|
|
—
|
|
2,117
|
|
||||||||
|
Repurchase of common shares
|
(100,000
|
)
|
—
|
|
—
|
|
—
|
|
(100,000
|
)
|
||||||||
|
Debt issuance costs
|
—
|
|
(1,678
|
)
|
—
|
|
—
|
|
(1,678
|
)
|
||||||||
|
Issuance of intercompany notes
|
(35,500
|
)
|
—
|
|
35,500
|
|
—
|
|
—
|
|
||||||||
|
Intercompany distributions
|
163,585
|
|
(217,980
|
)
|
(71,847
|
)
|
126,242
|
|
—
|
|
||||||||
|
Other
|
(122
|
)
|
—
|
|
—
|
|
—
|
|
(122
|
)
|
||||||||
|
CASH USED FOR FINANCING ACTIVITIES
|
(94,856
|
)
|
(99,631
|
)
|
(48,218
|
)
|
126,242
|
|
(116,463
|
)
|
||||||||
|
EFFECT OF EXCHANGE RATE CHANGES ON CASH
|
—
|
|
—
|
|
(4,173
|
)
|
—
|
|
(4,173
|
)
|
||||||||
|
CASH AND CASH EQUIVALENTS
|
||||||||||||||||||
|
Change in cash and cash equivalents
|
(99,746
|
)
|
5,112
|
|
(15,147
|
)
|
—
|
|
(109,781
|
)
|
||||||||
|
Balance, beginning of year
|
102,218
|
|
8,105
|
|
51,235
|
|
—
|
|
161,558
|
|
||||||||
|
Balance, end of year
|
|
$2,472
|
|
|
$13,217
|
|
|
$36,088
|
|
—
|
|
|
$51,777
|
|
||||
110
|
Item 9.
|
CHANGES IN AND DISAGREEMENTS WITH ACCOUNTANTS ON ACCOUNTING AND FINANCIAL DISCLOSURE
|
None.
|
Item 9A.
|
CONTROLS AND PROCEDURES
|
DISCLOSURE CONTROLS AND PROCEDURES
Rayonier management is responsible for establishing and maintaining adequate disclosure controls and procedures. Disclosure controls and procedures (as defined in Rule 13a-15(e) under the Securities Exchange Act of 1934 (the “Exchange Act”)) are designed with the objective of ensuring that information required to be disclosed by the Company in reports filed under the Exchange Act, such as this annual report on Form 10-K, is (1) recorded, processed, summarized and reported within the time periods specified in the SEC’s ru
les and forms and (2) accumulated and communicated to our management, including our Chief Executive Officer and Chief Financial Officer, as appro
priate to allow timely decisions regarding required disclosure.
Because of the inherent limitations in all control systems, no control evaluation can provide absolute assurance that all control exceptions and instances of fraud have been prevented or detected on a timely basis. Even systems determined to be effective can provide only reasonable assurance that their objectives are achieved.
Based on an evaluation of our disclosure controls and procedures as of the end of the period covered by this annual report on Form 10-K, our
management, including the Chief Executive Officer and Chief Financial Officer, concluded that the design and operation of the disclosure controls and procedures were effective as of
December 31, 2017
.
In the year ended
December 31, 2017
, based upon the evaluation required by paragraph (d) of Rule 13a-15, there were no changes in our internal control over financial reporting that would materially affect or are reasonably likely to materially affect our internal control over financial reporting.
|
Item 9B.
|
OTHER INFORMATION
|
Not applicable.
111
Certain information required by Part III is incorporated by reference from the Company’s Definitive Proxy Statement to be filed with the SEC in connection with the solicitation of proxies for the Company’s
2018
Annual Meeting of Shareholders (the “Proxy Statement”). We will make the Proxy Statement available on our website at
www.rayonier.com
as soon as it is filed with the SEC.
|
Item 10.
|
DIRECTORS, EXECUTIVE OFFICERS AND CORPORATE GOVERNANCE
|
A list of our executive officers and biographical information are found in
Item 1
in this Annual Report on Form 10-K
.
Additional information required by this Item with respect to directors and other governance matters is incorporated by reference from the sections entitled “Proposal No. 1 - Election of Directors,” “Corporate Governance,” “Named Executive Officers,” “Section 16(a) Beneficial Ownership Reporting Compliance” and “Report of the Audit Committee” in the Proxy Statement.
Our Standard of Ethics and Code of Corporate Conduct, which is applicable to our principal executive officer and financial and accounting officers, is available on our website,
www.rayonier.com
. Any amendments to or waivers of the Standard of Ethics and Code of Corporate Conduct will also be disclosed on our website.
The information called for by Item 11 is incorporated herein by reference from the section and subsections entitled “Compensation Discussion and Analysis,” “Summary Compensation Table,” “Grants of Plan-Based Awards,” “Outstanding Equity Awards at Fiscal Year-End,” “Option Exercises and Stock Vested,” “Pension Benefits,” “Nonqualified Deferred Compensation,” “Potential Payments Upon Termination or Change in Control,” “Director Compensation,” “Compensation Committee Interlocks and Insider Participation; Processes and Procedures” and “Report of the Compensation and Management Development Committee” in the Proxy Statement.
|
Item 12.
|
SECURITY OWNERSHIP OF CERTAIN BENEFICIAL OWNERS AND MANAGEMENT AND RELATED STOCKHOLDER MATTERS
|
The information called for by Item 12 is incorporated herein by reference from the section and subsections entitled “Ownership of and Trading in our Shares,” “Share Ownership of Certain Beneficial Owners,” “Share Ownership of Directors and Executive Officers” and “Equity Compensation Plan Information” in the Proxy Statement.
|
Item 13.
|
CERTAIN RELATIONSHIPS AND RELATED TRANSACTIONS, AND DIRECTOR INDEPENDENCE
|
The information called for by Item 13 is incorporated herein by reference from the section and subsections entitled “Proposal No. 1 - Election of Directors,” “Director Independence” and “Related Person Transactions” in the Proxy Statement.
|
Item 14.
|
PRINCIPAL ACCOUNTING FEES AND SERVICES
|
The information called for by Item 14 is incorporated herein by reference from the subsection entitled “Information Regarding Independent Registered Public Accounting Firm” in the Proxy Statement.
112
|
Item 15.
|
EXHIBITS, FINANCIAL STATEMENT SCHEDULES
|
|
(a)
|
Documents filed as a part of this report:
|
|
(1)
|
See
Index to Financial Statements
on page
56
for a list of the financial statements filed as part of this report.
|
|
(2)
|
Financial Statement Schedules:
|
SCHEDULE II—VALUATION AND QUALIFYING ACCOUNTS
Years Ended
December 31, 2017
,
2016
, and
2015
(In Thousands)
|
Description
|
Balance
at
Beginning
of Year
|
Additions Charged
to Cost
and
Expenses
|
Deductions
|
Balance
at End
of Year
|
||||||||||
|
Allowance for doubtful accounts:
|
||||||||||||||
|
Year ended December 31, 2017
|
|
$33
|
|
—
|
|
(10
|
)
|
|
$23
|
|
||||
|
Year ended December 31, 2016
|
42
|
|
—
|
|
(9
|
)
|
33
|
|
||||||
|
Year ended December 31, 2015
|
42
|
|
—
|
|
—
|
|
42
|
|
||||||
|
Deferred tax asset valuation allowance:
|
||||||||||||||
|
Year ended December 31, 2017
|
|
$21,861
|
|
|
$13,028
|
|
(a)
|
—
|
|
|
$34,889
|
|
||
|
Year ended December 31, 2016
|
18,248
|
|
3,613
|
|
(a)
|
—
|
|
21,861
|
|
|||||
|
Year ended December 31, 2015
|
13,644
|
|
4,604
|
|
(b)
|
—
|
|
18,248
|
|
|||||
|
(a)
|
The 2017 and 2016 increase is comprised of valuation allowance against the TRS deferred tax assets.
|
|
(b)
|
The 2015 increase is comprised of valuation allowance against the TRS deferred tax assets and the CBPC provision to return adjustment.
|
All other financial statement schedules have been omitted because they are not applicable, the required matter is not present or the required information has otherwise been supplied in the financial statements or the notes thereto.
|
(3)
|
See
Exhibit Index
for a list of the exhibits filed or incorporated herein as part of this report. Exhibits that are incorporated by reference to documents filed previously by the Company under the Securities Exchange Act of 1934, as amended, are filed with the SEC under File No. 1-6780.
|
|
Item 16.
|
FORM 10-K SUMMARY
|
None.
113
EXHIBIT INDEX
The following is a list of exhibits filed as part of the Form 10-K. As permitted by the rules of the SEC, the Company has not filed certain instruments defining the rights of holders of long-term debt of the Company or consolidated subsidiaries under which the total amount of securities authorized does not exceed 10 percent of the total assets of the Company and its consolidated subsidiaries. The Company agrees to furnish to the SEC, upon request, a copy of any omitted instrument.
|
Exhibit No.
|
Description
|
Location
|
|
|
2.1
|
|
Incorporated by reference to Exhibit 10.1 to the Registrant’s January 15, 2004 Form 8-K
|
|
|
2.2
|
|
Incorporated by reference to Exhibit 10.7 to the Registrant’s June 30, 2010 Form 10-Q
|
|
|
2.3
|
|
Incorporated by reference to Exhibit 2.1 to the Registrant’s May 30, 2014 Form 8-K
|
|
|
3.1
|
|
Incorporated by reference to Exhibit 3.1 to the Registrant’s May 23, 2012 Form
8-K
|
|
|
3.2
|
|
Incorporated by reference to Exhibit 3.2 to the Registrant’s October 21, 2009 Form 8-K
|
|
|
3.3
|
|
Incorporated by reference to Exhibit 3.3 to the Registrant’s June 30, 2010 Form 10-Q
|
|
|
4.1
|
|
Incorporated by reference to the Registrant’s April 26, 2004 S-4 Filing
|
|
|
4.2
|
|
Incorporated by reference to the Registrant’s May 6, 2004 S-4/A Filing
|
|
|
4.3
|
|
Incorporated by reference to Exhibit 4.1 to the Registrant’s March 5, 2012 Form 8-K
|
|
|
4.4
|
|
Incorporated by reference to Exhibit 4.2 to the Registrant’s March 5, 2012 Form 8-K
|
|
|
4.5
|
|
Incorporated by reference to Exhibit 4.1 to the Registrant’s October 17, 2012 Form 8-K
|
|
|
4.6
|
|
Incorporated by reference to Exhibit 4.2 to the Registrant’s March 5, 2012 Form 8-K
|
|
|
4.7
|
|
Incorporated by reference to Exhibit 4.1 to the Registrant’s May 22, 2014 Form 8-K
|
|
|
Exhibit No.
|
Description
|
Location
|
|
|
10.1
|
|
Incorporated by reference to Exhibit 10.2 to the Registrant’s December 31, 2015 Form 10-K
|
|
|
10.2
|
|
Incorporated by reference to Exhibit 10.1 to the Registrant’s March 31, 2016 Form 10-Q
|
|
|
10.3
|
|
Incorporated by reference to Exhibit 10.1 to the Registrant’s September 30, 2016 Form 10-Q
|
|
|
10.4
|
|
Incorporated by reference to Exhibit 10.1 to the Registrant’s March 31, 2017 Form 10-Q
|
|
|
10.5
|
|
Incorporated by reference to Exhibit 10.1 to the Registrant’s June 30, 2017 Form 10-Q
|
|
|
10.6
|
|
Filed herewith
|
|
|
10.7
|
|
Incorporated by reference to Exhibit 10.9 to the Registrant’s December 31, 2015 Form 10-K
|
|
|
10.8
|
|
Incorporated by reference to Exhibit 10.2 to the Registrant’s September 30, 2016 Form 10-Q
|
|
|
10.9
|
|
Incorporated by reference to Exhibit 10.2 to the Registrant’s June 30, 2010 Form 10-Q
|
|
|
10.10
|
|
Incorporated by reference to Exhibit 10.3 to the Registrant’s June 30, 2010 Form 10-Q
|
|
|
10.11
|
|
Incorporated by reference to Exhibit 10.4 to the Registrant’s June 30, 2010 Form 10-Q
|
|
|
10.12
|
|
Incorporated by reference to Appendix B to the Registrant’s March 31, 2008 Proxy Statement
|
|
|
10.13
|
|
Incorporated by reference to Exhibit 10.24 to the Registrant’s December 31, 2006 Form 10-K
|
|
|
10.14
|
|
Incorporated by reference to Exhibit 10.1 to the Registrant’s September 30, 2014 Form 10-Q
|
|
|
10.15
|
|
Incorporated by reference to Exhibit 10.38 to the Registrant’s June 30, 2005 Form 10-Q
|
|
|
10.16
|
|
Incorporated by reference to Exhibit 10.11 to the Registrant’s June 30, 2014 Form 10-Q
|
|
|
Exhibit No.
|
Description
|
Location
|
|
|
10.17
|
|
Incorporated by reference to Exhibit 10.4 to the Registrant’s June 30, 2014 Form 8-K
|
|
|
10.18
|
|
Incorporated by reference to Exhibit 10.8 to the Registrant’s June 30, 2014 Form 10-Q
|
|
|
10.19
|
|
Incorporated by reference to Exhibit 10.2 to the Registrant’s March 31, 2015 Form 10-Q
|
|
|
10.20
|
|
Incorporated by reference to Exhibit 10.19 to the Registrant’s December 31, 2008 Form 10-K
|
|
|
10.21
|
|
Incorporated by reference to Exhibit 10.5 to the Registrant’s March 31, 2015 Form 10-Q
|
|
|
10.22
|
|
Incorporated by reference to Exhibit 10.23 to the Registrant’s December 31, 2013 Form 10-K
|
|
|
10.23
|
|
Incorporated by reference to Exhibit 10.3 to the Registrant’s March 31, 2015 Form 10-Q
|
|
|
10.24
|
|
Incorporated by reference to Exhibit 10.44 to the Registrant’s December 31, 2015 Form 10-K
|
|
|
10.25
|
|
Incorporated by reference to Exhibit 10.2 to the Registrant’s March 31, 2017 Form 10-Q
|
|
|
10.26
|
|
Incorporated by reference to Exhibit 10.2 to the Registrant’s March 31, 2016 Form 10-Q
|
|
|
10.27
|
|
Incorporated by reference to Exhibit 10.3 to the Registrant’s March 31, 2016 Form 10-Q
|
|
|
10.28
|
|
Incorporated by reference to Exhibit 10.1 to the Registrant’s May 2, 2016 Form 8-K
|
|
|
10.29
|
|
Incorporated by reference to Exhibit 10.2 to the Registrant’s May 2, 2016 form 8-K.
|
|
|
10.30
|
|
Incorporated by reference to Exhibit 10.3 to the Registrant’s September 30, 2016 Form 10-Q
|
|
|
10.31
|
|
Filed herewith
|
|
|
12
|
|
Filed herewith
|
|
|
21
|
|
Filed herewith
|
|
|
Exhibit No.
|
Description
|
Location
|
|
|
23.1
|
|
Filed herewith
|
|
|
24
|
|
Filed herewith
|
|
|
31.1
|
|
Filed herewith
|
|
|
31.2
|
|
Filed herewith
|
|
|
32
|
|
Furnished herewith
|
|
|
101
|
|
The following financial information from our Annual Report on Form 10-K for the fiscal year ended December 31, 2017, formatted in Extensible Business Reporting Language (“XBRL”), includes: (i) the Consolidated Statements of Income and Comprehensive Income for the Years Ended December 31, 2017, 2016 and 2015; (ii) the Consolidated Balance Sheets as of December 31, 2017 and 2016; (iii) the Consolidated Statements of Shareholders’ Equity for the Years Ended December 31, 2017, 2016 and 2015; (iv) the Consolidated Statements of Cash Flows for the Years Ended December 31, 2017, 2016 and 2015; and (v) the Notes to the Consolidated Financial Statements.
|
Filed herewith
|
* Management contract or compensatory plan.
** Certain schedules and similar attachments have been omitted from this filing pursuant to Item 601(b)(2) of Regulation S-K. Rayonier will furnish supplemental copies of any such schedules or attachments to the U.S. Securities and Exchange Commission upon request.
SIGNATURES
Pursuant to the requirements of Section 13 or 15(d) of the Securities Exchange Act of 1934, the registrant has duly caused this report to be signed on its behalf by the undersigned, thereunto duly authorized.
|
RAYONIER INC.
|
||
|
By:
|
/
s
/ MARK MCHUGH
|
|
|
Mark McHugh
Senior Vice President and Chief Financial Officer
(Duly Authorized Officer, Principal Financial Officer)
|
||
February 23, 2018
Pursuant to the requirements of the Securities Exchange Act of 1934, this report has been signed below by the following persons on behalf of the registrant and in the capacities and on the dates indicated.
|
Signature
|
Title
|
Date
|
||
|
/s/ DAVID L. NUNES
|
President and Chief Executive Officer
|
February 23, 2018
|
||
|
David L. Nunes
(Principal Executive Officer)
|
||||
|
/s/ MARK MCHUGH
|
Senior Vice President and Chief Financial Officer
|
February 23, 2018
|
||
|
Mark McHugh
(Principal Financial Officer)
|
||||
|
/s/ APRIL TICE
|
Director, Financial Services and Corporate Controller
|
February 23, 2018
|
||
|
April Tice
(Principal Accounting Officer)
|
||||
|
*
|
Chairman of the Board
|
|||
|
Richard D. Kincaid
|
||||
|
*
|
Director
|
|||
|
Keith E. Bass
|
||||
|
*
|
Director
|
|||
|
Dod A. Fraser
|
||||
|
*
|
Director
|
|||
|
Scott R. Jones
|
||||
|
*
|
Director
|
|||
|
Bernard Lanigan, Jr.
|
||||
|
*
|
Director
|
|||
|
Blanche L. Lincoln
|
||||
|
*
|
Director
|
|||
|
V. Larkin Martin
|
||||
|
*
|
Director
|
|||
|
Andrew G. Wiltshire
|
||||
|
*By:
|
/s/ MARK R. BRIDWELL
|
|
February 23, 2018
|
||
|
Mark R. Bridwell
Attorney-In-Fact
|
|
||||
118
TABLE OF CONTENTS
Part IItem 1. BusinessItem 1A. Risk FactorsItem 1B. Unresolved Staff CommentsItem 2. PropertiesItem 3. Legal ProceedingsItem 4. Mine Safety DisclosuresPart IIItem 5. Market For The Registrant S Common Equity, Related Stockholder Matters and Issuer Purchases Of Equity SecuritiesItem 6. Selected Financial DataItem 7. Management S Discussion and Analysis Of Financial Condition and Results Of OperationsItem 7A. Quantitative and Qualitative Disclosures About Market RiskItem 8. Financial Statements and Supplementary DataItem 9. Changes in and Disagreements with Accountants on Accounting and Financial DisclosureItem 9A. Controls and ProceduresItem 9B. Other InformationPart IIIItem 10. Directors, Executive Officers and Corporate GovernanceItem 11. Executive CompensationItem 12. Security Ownership Of Certain Beneficial Owners and Management and Related Stockholder MattersItem 13. Certain Relationships and Related Transactions, and Director IndependenceItem 14. Principal Accounting Fees and ServicesPart IVItem 15. Exhibits, Financial Statement SchedulesItem 16. Form 10-k Summary