SANMINA CORP
10-Ks and 10-Qs
|
|
|
|
|
|
|
|
|
|
|
|
|
|
|
|
|
|
|
|
|
|
|
|
|
|
|
|
|
|
|
|
|
|
|
|
|
|
|
|
|
|
|
|
|
|
|
|
|
|
|
|
|
|
|
|
UNITED STATES
SECURITIES AND EXCHANGE COMMISSION
Washington, D.C. 20549
Form
10-K
(Mark One)
[x] ANNUAL REPORT PURSUANT TO SECTION 13 OR 15(d) OF THE SECURITIES EXCHANGE ACT OF 1934
For the fiscal year ended
September 29, 2018
or
[ ] TRANSITION REPORT PURSUANT TO SECTION 13 OR 15(d) OF THE SECURITIES EXCHANGE ACT OF 1934
For the transition period from to .
Commission File Number 0-21272
Sanmina Corporation
(Exact name of registrant as specified in its charter)
|
Delaware
|
77-0228183
|
|
|
(State or other jurisdiction of incorporation or organization)
|
(I.R.S. Employer Identification Number)
|
|
|
2700 N. First St., San Jose, CA
|
95134
|
|
|
(Address of principal executive offices)
|
(Zip Code)
|
|
Registrant's telephone number, including area code:
(408) 964-3500
Securities registered pursuant to Section 12(b) of the Act:
Common Stock, $0.01 Par Value
Securities registered pursuant to Section 12(g) of the Act:
None
(Title of Class)
Indicate by check mark if the registrant is a well-known seasoned issuer, as defined in Rule 405 of the Securities Act. Yes [ x ] No [ ]
Indicate by check mark if the registrant is not required to file reports pursuant to Section 13 or Section 15(d) of the Securities Act. Yes [ ] No [ x ]
Indicate by check mark whether the registrant: (1) has filed all reports required to be filed by Section 13 or 15(d) of the Exchange Act during the preceding 12 months (or for such shorter period that the registrant was required to file such reports), and (2) has been subject to such filing requirements for the past 90 days. Yes [ x ] No [ ]
Indicate by check mark whether the registrant has submitted electronically every Interactive Data File required to be submitted pursuant to Rule 405 of Regulation S-T (§232.405 of this chapter) during the preceding 12 months (or for such shorter period that the registrant was required to submit such files). Yes [ x ] No [ ]
Indicate by check mark if disclosure of delinquent filers pursuant to Item 405 of Regulation S-K (§232.405 of this chapter) is not contained herein, and will not be contained, to the best of the registrant's knowledge, in definitive proxy or information statements incorporated by reference in Part III of this Form 10-K or any amendment to this Form 10-K. [ x ]
Indicate by check mark whether the registrant is a large accelerated filer, an accelerated filer, a non-accelerated filer, or a smaller reporting company. See definitions of “large accelerated filer,” “accelerated filer,” and “smaller reporting company” in Rule 12b-2 of the Exchange Act. (Check one):
|
Large Accelerated Filer
|
[X]
|
Accelerated filer [ ]
|
Non-accelerated filer [ ]
|
Smaller reporting company [ ]
|
|
|
|
Emerging growth company [ ]
|
||
If an emerging growth company, indicate by check mark if the registrant has elected not to use the extended transition period for complying with any new or revised financial accounting standards provided pursuant to Section 13(a) of the Exchange Act. [ ]
Indicate by check mark whether the registrant is a shell company (as defined in Rule 12b-2 of the Exchange Act). Yes [ ] No [ x ]
The aggregate market value of the voting and non-voting common stock held by non-affiliates of the registrant was approximately
$1,580,526,475
as of March 31, 2018, based upon the last reported sale price of the common stock on the NASDAQ Global Select Market on March 29, 2018.
As of
November 12, 2018
, the number of shares outstanding of the registrant's common stock was
68,264,736
.
DOCUMENTS INCORPORATED BY REFERENCE
Certain information is incorporated into Part III of this report by reference to the Proxy Statement for the registrant's 2019 annual meeting of stockholders to be filed with the Securities and Exchange Commission pursuant to Regulation 14A not later than 120 days after the end of the fiscal year covered by this Form 10-K.
SANMINA CORPORATION
INDEX
|
Item 1.
|
||
|
Item 1A.
|
||
|
Item 1B.
|
||
|
Item 2.
|
||
|
Item 3.
|
||
|
Item 4.
|
||
|
Item 5.
|
||
|
Item 6.
|
||
|
Item 7.
|
||
|
Item 7A.
|
||
|
Item 8.
|
||
|
Item 9.
|
||
|
Item 9A.
|
||
|
Item 9B.
|
||
|
Item 10.
|
||
|
Item 11.
|
||
|
Item 12.
|
||
|
Item 13.
|
||
|
Item 14.
|
||
|
Item 15.
|
||
2
Item 1.
Business
Overview
Sanmina Corporation (“we” or “Sanmina”) is a leading global provider of integrated manufacturing solutions, components, products and repair, logistics and after-market services. We provide these comprehensive offerings primarily to original equipment manufacturers, or OEMs, in the following industries: industrial, medical, defense and aerospace, automotive, communications networks and cloud solutions. The combination of our advanced technologies, extensive manufacturing expertise and economies of scale enables us to meet the specialized needs of our customers. We were originally incorporated in Delaware in May 1989.
Our end-to-end solutions, combined with our global expertise in supply chain management, enable us to manage our customers' products throughout their life cycles. These solutions include:
|
•
|
product design and engineering, including concept development, detailed design, prototyping, validation, preproduction services and manufacturing design release;
|
|
•
|
manufacturing of components, subassemblies and complete systems;
|
|
•
|
final system assembly and test;
|
|
•
|
direct order fulfillment and logistics services;
|
|
•
|
after-market product service and support; and
|
|
•
|
global supply chain management.
|
We operate in the Electronics Manufacturing Services (EMS) industry and manage our operations as two businesses:
|
1)
|
Integrated Manufacturing Solutions (IMS). Our IMS business consists of printed circuit board assembly and test, final system assembly and test, and direct-order-fulfillment. This segment generated approximately 80% of our total revenue in 2018.
|
|
2)
|
Components, Products and Services (CPS). Components include interconnect systems (printed circuit board fabrication, backplane, cable assemblies and plastic injection molding) and mechanical systems (enclosures and precision machining). Products include memory, radio frequency (RF), optical and microelectronic, and enterprise solutions from our Viking Technology division; defense and aerospace products from SCI Technology; and cloud-based manufacturing execution software from our 42Q division. Services include design, engineering, logistics and repair services. CPS generated approximately 20% of our total revenue in 2018.
|
We have manufacturing facilities in 23 countries on six continents. We locate our facilities near our customers and their end markets in major centers for the electronics industry or in lower cost locations. Many of our operations located near our customers and their end markets are focused primarily on new product introduction, lower-volume, higher-complexity component and subsystem manufacturing and assembly, and final system assembly and test. Our operations located in lower cost areas engage primarily in higher-volume component and subsystem manufacturing and assembly for products ranging in complexity from lower complexity products to highly complex products.
We have become one of the largest global manufacturing solutions providers by capitalizing on our competitive strengths including our:
|
•
|
end-to-end solutions;
|
|
•
|
product design and engineering resources;
|
|
•
|
vertically integrated manufacturing solutions;
|
|
•
|
advanced component technologies;
|
|
•
|
global manufacturing capabilities, supported by robust IT systems and a global supplier base;
|
|
•
|
customer-focused organization;
|
|
•
|
expertise in serving diverse end markets; and
|
|
•
|
expertise in industry standards and regulatory requirements.
|
3
Industry Overview
EMS companies are the principal beneficiaries of the increased use of outsourced manufacturing services by the electronics and other industries. Outsourced manufacturing refers to an OEM's use of EMS companies to manufacture their products, rather than using internal manufacturing resources. As the EMS industry has evolved, OEMs have increased their reliance on EMS companies for design services, core technology development and additional, more complex manufacturing services. Today, EMS companies manufacture and test complete systems and manage their customers' entire supply chains. Industry-leading EMS companies offer end-to-end services including product design and engineering, manufacturing, final system assembly and test, direct-order-fulfillment and logistics services, after-market product service and support, and global supply chain management.
We believe OEMs will continue to outsource manufacturing because it allows them to:
|
•
|
focus on core competencies;
|
|
•
|
access leading design and engineering capabilities;
|
|
•
|
improve supply chain management and purchasing power;
|
|
•
|
reduce operating costs and capital investment;
|
|
•
|
access global manufacturing services; and
|
|
•
|
accelerate time to market.
|
Our Business Strategy
Our vision is to be the trusted leader in providing products, services and supply chain solutions to accelerate customer success. Key elements to deliver this vision include:
Capitalizing on Our Comprehensive Solutions.
We intend to capitalize on our end-to-end solutions which we believe will allow us to sell additional solutions to our existing customers and attract new customers. Our end-to-end solutions include product design and engineering, manufacturing, final system assembly and test, direct order fulfillment and logistics services, after-market product service and support, and global supply chain management. Our vertically integrated manufacturing solutions enable us to manufacture additional system components and subassemblies for our customers. When we provide a customer with a number of services, such as component manufacturing or higher value-added solutions, we are often able to improve our margins and profitability. Consequently, our goal is to increase the number of manufacturing programs for which we provide multiple solutions. To achieve this goal, our sales and marketing organization seeks to cross-sell our solutions to customers.
Extending Our Technology Capabilities.
We rely on advanced processes and technologies to provide our products, components and vertically integrated manufacturing solutions. We continually improve our manufacturing processes and develop more advanced technologies, providing competitive advantage to our customers. We work with our customers to anticipate their future product and manufacturing requirements and align our technology investment activities with their needs. We use our design expertise to develop product technology platforms that we can customize by incorporating other components and subassemblies to meet the needs of particular OEMs. These technologies enhance our ability to manufacture complex, high-value added products, enhancing our ability to continue to win business from existing and new customers.
Attracting and Retaining Long-Term Customer Partnerships.
A core component of our strategy is to attract, build and retain long-term partnerships with companies in growth industries that will benefit from our global footprint and unique value proposition in advanced electronics manufacturing. As a result of this customer-centric approach, we have experienced business growth from both existing and new customers and will continue to cultivate these partnerships with additional products and value-added solutions.
Promoting New Product Introduction (NPI) and Joint Design Manufacturing (JDM) Solutions.
As a result of customer feedback, and our customers' desire to manage research and development expenses, we offer product design services to develop systems and components jointly with our customers. Our NPI services include quick-turn prototyping, supply chain readiness, functional test development and release-to-volume production. In a JDM model, our customers bring market knowledge and product requirements and we bring complete design engineering and NPI services. Our design engineering offerings include product architecture development, detailed design, simulation, test and validation, system integration, regulatory and qualification services.
Continuing to Penetrate Diverse End Markets.
We focus our marketing and sales efforts on major end markets within the electronics technology industry. We target markets we believe offer significant growth opportunities and for which
4
OEMs sell complex products that are subject to rapid technological change because the manufacturing of these products requires higher value-added services. We intend to continue to diversify our business across market segments and customers to reduce our dependence on any particular market or customer.
Pursuing Strategic Transactions.
We seek to undertake strategic transactions that give us the opportunity to access new customers' products, manufacturing solutions, repair service capabilities, intellectual property, technologies and geographic markets. In addition, we plan to continue to pursue OEM divestiture transactions that will augment existing strategic customer relationships or build new relationships with customers in attractive end markets. In an OEM divestiture transaction, we purchase manufacturing assets from a customer and enter into a long-term supply agreement with such customer to provide products previously manufactured by them. Potential future transactions may include a variety of different business arrangements, including acquisitions, asset purchases, spin-offs, strategic partnerships, restructurings and divestitures.
Continuing to Seek Cost Savings and Efficiency Improvements.
We seek to optimize our facilities to provide cost-effective services for our customers. We maintain extensive operations in lower cost locations, including Latin America, Eastern Europe, China, Southeast Asia and India, and we plan to expand our presence in these lower cost locations as appropriate to meet the needs of our customers. We believe we are well positioned to take advantage of future opportunities on a global basis as a result of our existing manufacturing footprint in 23 countries on six continents.
Our Competitive Strengths
We believe our competitive strengths differentiate us from our competitors and enable us to better serve the needs of OEMs. Our competitive strengths include:
End-to-End Solutions.
We provide solutions throughout the world to support our customers' products during their entire life cycle, from product design and engineering, through manufacturing, to direct order fulfillment, logistics and after-market product service and support. Our end-to-end solutions are among the most comprehensive in the industry because we focus on adding value before and after the actual manufacturing of our customers' products. These solutions also enable us to 1) provide our customers with a single source of supply for their design, supply chain and manufacturing needs, 2) reduce the time required to bring products to market, 3) lower product costs and 4) allow our customers to focus on those activities they expect to add the highest value to their business. We believe our end-to-end solutions allow us to develop closer relationships with our customers and more effectively compete for their future business.
Product Design and Engineering Resources.
We provide product design and engineering services for new product designs, cost reductions and Design-for-Manufacturability/Assembly/Test (DFx) reviews. Our engineers work with our customers during the complete product life cycle. Our design and NPI centers provide turnkey system design services including: electrical, mechanical, thermal, software, layout, simulation, test development, design verification, validation, regulatory compliance and testing services. We design high-speed digital, analog, radio frequency, mixed-signal, wired, wireless, optical and electro-mechanical modules and systems.
Our engineering engagement models include Joint Design Manufacturing (JDM), Contract Design Manufacturing (CDM) and consulting engineering for DFx, Value Engineering (cost reduction re-design), and design for global environmental compliance regulations such as the European Union's Restrictions of Hazardous Substances (RoHS) and Waste Electrical and Electronic Equipment (WEEE). We focus on industry segments that include industrial, medical, defense and aerospace, automotive, communications networks and cloud solutions. System solutions for these industry segments are supported by our vertically integrated component technologies, namely printed circuit boards, backplanes, enclosures, cable assemblies, precision machining, plastics, memory modules, and optical, RF and microelectronics modules.
In these engagement models, our customers bring market knowledge and product requirements. We provide complete design engineering and new product introductions (NPI) services. For JDM products, typically the intellectual property is jointly owned by us and the customer, and we perform manufacturing and logistics services. For CDM projects, customers pay for all services and own the intellectual property.
Vertically Integrated Manufacturing Solutions.
We provide a range of vertically integrated manufacturing solutions including high-technology components, new product introduction and test development services. These solutions are provided in every major region worldwide, with design and prototyping close to our customer’s product development centers. Our customers benefit significantly from our experience in these areas, including product cost reduction, minimization of assets deployed for manufacturing, accelerated time-to-market and a simplified supply chain. Key system components we manufacture include high-technology printed circuit boards and printed circuit board assemblies, backplanes and backplane assemblies, enclosures, cable assemblies, plastic injection molded products, precision machined components, optical and RF
5
modules and memory modules. These components and sub-assemblies are integrated into a final product or system, configured and tested to our customer’s or the end-customer’s specifications and delivered to the final point of use, with Sanmina managing the entire supply chain. By manufacturing system components and subassemblies ourselves, we enhance continuity of supply and reduce costs for our customers. In addition, we are able to have greater control over the supply chain of our customers' products.
Customers also benefit from our combined design, technology and manufacturing experience with specific products and markets. For example, in communications networks, we have over 30 years of experience in developing high-speed printed circuit boards ("PCBs") and backplanes. Examples of products for which our experience and vertically integrated model provide competitive advantage include wireless base stations, network switches, routers and gateways, optical switches, servers and storage appliances, automotive products, avionics and satellite systems, magnetic resonance imaging (MRI) and computer tomography (CT) scanners, and equipment used in semiconductor manufacturing processes, including equipment for photolithography, chemical mechanical polishing, vapor deposition and robotics for wafer transfer. For these and many other products, customers can gain competitive advantage with our manufacturing technology, while reducing the capital requirements associated with manufacturing and global supply chain management.
Advanced Component Technologies.
We provide advanced component technologies which we believe allow us to differentiate ourselves from our competitors. These advanced technologies include the fabrication of complex printed circuit boards, backplanes, enclosures, precision machining and plastic components. For example, we produce some of the most advanced printed circuit boards and backplanes in the world, with up to 70 layers and process capabilities including a range of low signal loss, high performance materials, buried capacitance and thin-film resistors, high-density interconnects and micro via technology. We also manufacture high-density flex and rigid-flex printed circuit boards with up to 32 layers and 8 transition layers in support of defense and aerospace markets and high-end medical electronics.
Our printed circuit board assembly technologies include micro ball grid arrays, chip scale packages, fine-pitch discretes and small form factor radio frequency and optical components, chip on board, as well as advanced packaging technologies used in high pin count application for specific integrated circuits and network processors. We use innovative design solutions and advanced metal forming techniques to develop and fabricate high-performance indoor and outdoor chassis, enclosures, racks and frames. Our assembly services use advanced technologies including precision optical alignment, multi-axis precision stages and machine vision technologies. We use sophisticated procurement and production management tools to effectively manage inventories for our customers and ourselves. We have also developed build-to-order (BTO) and configure-to-order (CTO) systems and processes that enable us to manufacture and ship finished systems in as little as 8 hours after receipt of an order. We utilize a centralized Technology Council to coordinate the development and introduction of new technologies to meet our customers' needs in various locations and to increase technical collaboration among our facilities and divisions.
Global Manufacturing Capabilities.
Most of our customers compete and sell their products on a global basis. As such, they require global solutions that include regional manufacturing for selected end markets, especially when time to market, local manufacturing or content and low cost solutions are critical objectives. Our global network of manufacturing facilities in 23 countries provides our customers a combination of sites to maximize both the benefits of regional and low cost manufacturing solutions and repair services. Our repair partners are located in an additional 27 countries.
We offer customers five regions in which all of our technology and components, integrated manufacturing and logistics solutions can be implemented and can serve both regional and global business needs. To manage and coordinate our global operations, we employ an enterprise-wide ERP system at substantially all of our manufacturing locations that operates on a single IT platform and provides us with company-wide information regarding component inventories and orders. This system enables us to standardize planning and purchasing at the facility level and to optimize inventory management and utilization worldwide. Our systems also enable our customers to receive key information regarding the status of their programs.
We purchase large quantities of electronic components and other materials from a wide range of suppliers. Our primary supply chain goal is to consolidate our global spend to create the synergy and leverage to drive our supply base for better cost competitiveness, more favorable terms and leading-edge supply chain solutions. As a result, we often receive more favorable terms and supply chain solutions from suppliers, which generally enables us to provide our customers with greater total cost reductions than they could obtain themselves. Our strong supplier relationships often enable us to obtain electronic components and other materials that are in short supply and provide us the necessary support to optimize the use of our inventories.
Supply chain management also involves the planning, purchasing and warehousing of product components. A key objective of our supply chain management services is to reduce excess component inventory in the supply chain by scheduling
6
deliveries of components at a competitive price and on a just-in-time basis. We use sophisticated production management systems to manage our procurement and manufacturing processes in an efficient and cost effective manner. We collaborate with our customers to enable us to respond to their changing component requirements and to reflect any changes in these requirements in our production management systems. These systems enable us to forecast future supply and demand imbalances and develop strategies to help our customers manage their component requirements and mitigate the impact of supply shortages that have recently affected our industry. Our enterprise-wide ERP systems provide us with company-wide information regarding component inventories and orders to optimize inventories, planning and purchasing at the facility level.
Customer-Focused Organization.
We believe customer relationships are critical to our success and we are focused on providing a high level of customer service. Our key customer accounts are managed by dedicated account teams including a global account manager directly responsible for account management. Global account managers coordinate activities across divisions to effectively satisfy our customers' requirements and have direct access to our senior management to quickly address customer opportunities and needs. Local customer account teams further support the global teams.
Expertise in Serving Diverse End Markets.
We have experience in serving our customers in the industrial, medical, defense and aerospace, automotive, communications networks and cloud solutions. Our diversification across end markets reduces our dependence upon any one customer or segment. In order to cater to the specialized needs of customers in particular market segments, we have dedicated personnel, and in some cases facilities, with industry-specific capabilities and expertise. We also maintain compliance with industry standards and regulatory requirements applicable to certain markets including, among others, medical, automotive, energy and defense and aerospace.
Our Products and Solutions
We offer our OEM customers a diverse set of products and solutions with a focus on wireless, wireline and optical communications and network infrastructure equipment, such as switches, routers and base stations, computing and storage systems, defense and commercial avionics and communications, medical imaging, diagnostic and patient monitoring systems, point-of-sale, gaming systems, semiconductor tools for metrology, lithography, dry and wet processing, industrial products including large format printers and automated teller machines, energy and clean technology products such as solar and wind products, LED lighting, smart meters and battery systems. These products may require us to use some or all of our end-to-end solutions including design, component technologies and logistics and repair services.
Integrated Manufacturing Solutions
includes:
Printed Circuit Board Assembly and Test.
Printed circuit board assembly involves attaching electronic components, such as integrated circuits, capacitors, microprocessors, resistors and memory modules, to printed circuit boards. The most common technologies used to attach components to printed circuit boards employ surface mount technology (SMT) and pin-through-hole assembly (PTH). SMT is an automated assembly system that places and solders components to the printed circuit board. In PTH, components are inserted into holes punched in the circuit board. Another method is press-fit-technology, in which components are pressed into holes on the printed circuit board. We use SMT, PTH, press-fit and other attachment technologies that are focused on miniaturization and increasing the density of component placement on printed circuit boards. These technologies, which support the needs of our customers to provide greater functionality in smaller products, include chip-scale packaging, ball grid array, direct chip attach and high density interconnect. We perform in-circuit and functional testing of printed circuit board assemblies. In-circuit testing verifies that all components are properly inserted and attached, and that electrical circuits are complete. We perform functional tests to confirm the board or assembly operates in accordance with its final design and manufacturing specifications. We either design and procure test fixtures and develop our own test software, or we use our customers' test fixtures and test software. In addition, we provide environmental stress tests of the board or assembly that are designed to confirm that the board or assembly will meet the environmental stresses, such as heat, to which it will be subjected.
Final System Assembly and Test.
We provide final system assembly and test in which assemblies and modules are combined to form complete, finished products. Products for which we currently provide final system assembly and test include wireless base stations, wireline communications switches, optical networking products, high-end servers, industrial and automotive products, LED lighting fixtures, diagnostic medical equipment, point of sale devices, and storage. We often integrate Sanmina-manufactured printed circuit board assemblies with enclosures, cables and memory modules. Our final assembly activities may also involve integrating components and modules that others manufacture. The complex, finished products we produce typically require extensive test protocols. We offer both functional and environmental test services. We also test products for conformity to applicable industry, product integrity and regulatory standards. Our test engineering expertise enables us to design functional test processes that
7
assess critical performance elements including hardware, software and reliability. By incorporating rigorous test processes into the manufacturing process, we can help assure our customers that their products will function as designed.
Direct-Order-Fulfillment.
We provide direct-order-fulfillment for our OEM customers. Direct-order-fulfillment involves receiving customer orders, configuring products to quickly fill the orders and delivering the products either to the OEM, a distribution channel, or directly to the end customer. We manage our direct-order-fulfillment processes using a core set of common systems and processes that receive order information from the customer and provide comprehensive supply chain management including procurement and production planning. These systems and processes enable us to process orders for multiple system configurations and varying production quantities including single units. Our direct-order-fulfillment services include BTO and CTO capabilities: in BTO, we build a system with the particular configuration ordered by the OEM customer; in CTO, we configure systems to an end customer's order, for example by installing software desired by the end customer. The end customer typically places this order by choosing from a variety of possible system configurations and options. Using advanced manufacturing processes and a real-time warehouse management and data control system on the manufacturing floor, we can meet a 48 to 72 hour turn-around-time for BTO and CTO requests. We support our direct-order-fulfillment services with logistics that include delivery of parts and assemblies to the final assembly site, distribution and shipment of finished systems and processing of customer returns.
Components, Products and Services
includes:
Product Design and Engineering.
Our design and engineering groups provide customers with comprehensive services from initial product design and detailed product development to prototyping and validation, production launch and end-of-life support for a wide range of products covering all our market segments. These groups complement our vertically integrated manufacturing capabilities by providing component level design services for printed circuit boards, backplanes and a variety of electro-mechanical systems. Our offerings in design engineering include product architecture, detailed development, simulation, test and validation, integration and regulatory and qualification services, and our NPI services include quick-turn prototypes, functional test development and release-to-volume production. We also offer post-manufacturing and end-of-life support including repair and sustaining engineering support through our Global Services division. We can also complement our customer's design team with our unique skills and services which can be used to develop custom, high-performance products that are manufacturable and cost optimized to meet product and market requirements. Such engineering services can help in improving a customer’s time-to-market and cost-to-market objectives.
Printed Circuit Boards.
We have the ability to produce multilayer printed circuit boards on a global basis with high layer counts and fine line circuitry. We have also developed several proprietary technologies and processes which improve electrical performance, connection densities and reliability of printed circuit boards. Our ability to support NPI and quick-turn fabrication followed by manufacturing in both North America and Asia allows our customers to accelerate their time-to-market as well as their time-to-volume. Standardized processes and procedures make transitioning of products easier for our customers. Our technology roadmaps provide leading-edge capabilities and high yielding processes. Our engineering teams are available on a worldwide basis to support designers in Design for Manufacturability (DFM) analysis and assemblers with field applications support.
Printed circuit boards are made of fiberglass/resin-laminated material layers and contain copper circuits which interconnect and transmit electrical signals among the components that make up electronic devices. Increasing the density of the circuitry in each layer is accomplished by reducing the width of the circuit traces and placing them closer together in the printed circuit board along with adding layers and via hole structures. We are currently capable of efficiently producing printed circuit boards with up to 70 layers and circuit trace widths as narrow as two mils (50 micron) in production volumes. Specialized production equipment along with an in-depth understanding of high performance laminate materials allow us to fabricate some of the largest form factor and highest speed (frequencies in excess of 40 gigahertz or GHz) backplanes available in the industry.
Backplanes and Backplane Assemblies.
Backplanes are very large printed circuit boards that serve as the backbones of sophisticated electronics products, such as internet routers. Backplanes provide interconnections for printed circuit board assemblies, integrated circuits and other electronic components. We fabricate backplanes in our printed circuit board plants. Backplane fabrication is significantly more complex than printed circuit board fabrication due to the large size and thickness of the backplanes. We manufacture backplane assemblies by press-fitting high density connectors into plated through-holes in the bare backplane. In addition, many of the newer, advanced technology backplanes require SMT attachment of passive discrete components as well as high-pin count ball grid
8
array packages. These advanced assembly processes require specialized equipment and a strong focus on quality and process control. We also perform in-circuit and functional tests on backplane assemblies. We have developed proprietary technology and “know-how” which enable backplanes to run at data rates in excess of 40 Gbps. We currently have capabilities to manufacture backplanes with greater than 60 layers in sizes up to 26x40 and 22x52 inches and up to 0.425 inches in thickness, using a wide variety of high performance laminate materials. These are among the largest and most complex commercially manufactured backplanes and the test equipment we have to ensure the quality and performance of these backplane systems is “world class.” We are not only fully capable of the electronic integrity testing of these backplanes, but can also utilize state of the art x-ray equipment to verify defect-free installation of the new high density/high speed connectors. Lastly, performance of the backplane system is checked through a signal integrity tester to ensure the product will meet design intent. We are one of a limited number of manufacturers with these capabilities.
Cable Assemblies.
Cable assemblies are used to connect modules, assemblies and subassemblies in electronic devices. We provide a broad range of cable assembly products and services, from cable assemblies and harnesses for automobiles, to complex harnesses for industrial products and semiconductor manufacturing equipment. We design and manufacture a broad range of high-speed data, radio frequency and fiber optic cabling products. Our cable assemblies are often used in large rack systems to interconnect subsystems and modules. Our manufacturing footprint with facilities in the U.S., Mexico, the EU and China enable us to support our customers NPI and volume production needs on a global basis.
Plastic Injection Molded Products.
Plastic injection molded products are used to create a vast array of everyday items; from very small intricate mechanical components, to cosmetic enclosures designed to protect sensitive electronic equipment. Our diverse capability within the plastic injection molding space spans all major markets and industries. We are equipped with nearly 80 plastic injection molding machines with clamping pressure ranging from 28 tons to 1,000 tons. Our experienced tooling, process, quality and resin engineers work concurrently using a scientific molding approach to develop cost effective, highly reliable manufacturing solutions for medical, industrial, defense, multimedia, computing and data storage customers. We apply the principles of scientific molding, combined with strategic partnerships with U.S. and Asian toolmakers to enable delivery of cost effective high-quality plastic manufacturing solutions.
Mechanical Systems.
Mechanical systems are used across all major markets to house and protect complex and fragile electronic components, modules and sub-systems so that the system's functional performance is not compromised due to mechanical, environmental or any other usage conditions. Our mechanical systems manufacturing services are capable of fabricating mechanical components, such as cabinets, chassis (soft tool and hard progressive tools), frames, racks, and data storage cabinets integrated with various electronic components and sub-systems for power management, thermal management, sensing functions and control systems.
We manufacture a broad range of enclosures for a wide range of products from set-top boxes, medical equipment, and storage, to large and highly complex mechanical systems, such as those used in indoor and outdoor wireless base station products and high precision vacuum chambers for the semiconductor industry.
Our mechanical systems expertise is available at several of our state-of-the-art facilities worldwide. Our operations provide metal fabrication by soft tools, high-volume metal stamping and forging by hard tools with stage and progressive tools, plastic injection molding, robotic welding, powder coating, wet painting, plating and cleaning processes.
We also offer a suite of world-class precision machining services in the U.S., Mexico and Israel. We use advanced numerically controlled machines enabling the manufacture of components to very tight tolerances and the assembly of these components in clean environments. Capabilities include complex medium and large format mill and lathe machining of aluminum, stainless steel, plastics, ferrous and nonferrous alloys and exotic alloys. We also have helium and hydrostatic leak-test capabilities. By leveraging our established supply chain, we do lapping, anodizing, electrical discharge machining (EDM), heat-treating, cleaning, laser inspection, painting and packaging. We have dedicated facilities supporting machining and complex integration with access to a range of state-of-the-art, computer-controlled machining equipment that can satisfy rigorous demands for production and quality. This includes fully automated “lights-out” machinery that continues production in the absence of human operators. With some of the largest horizontal milling machines in the U.S., we are a supplier of vacuum chamber systems for the semiconductor, flat-panel display, LED
equipment, industrial, medical and AS9100-certified aerospace
markets.
9
Viking Technology
.
Viking is our high-end product technology and engineering division that focuses on memory, RF, optical, microelectronics and enterprise solutions for the OEM's as well as cloud and communications service providers. Viking's mission and philosophy is to deliver leading-edge technology solutions that help optimize the value and performance of its customers’ applications.
Viking RF, Optical and Microelectronics
.
Optical and radio frequency (RF) components are key building blocks of many systems. Viking produces both passive and active components as well as modules that are built from a combination of industry standard and/or custom components, interconnected using microelectronic and micro-optic technologies to achieve a unique function.
Based on its microelectronic design and manufacturing technologies, Viking provides RF and optical components, modules and systems for customers in the communications, networking, medical, industrial, military and aerospace markets. Viking’s experience in RF and optical communication and networking products spans long-haul/ultra-long-haul and metro regions for transport/transmission, as well as access and switching applications, including last-mile solutions. Viking is currently supplying product to the 10G, 40G, 100G, 200G and 400G optical communication marketplace based on Viking’s foundational IP within optical and RF technologies. In the medical market, Viking develops and manufactures components and subassemblies that support Sanmina’s medical operations for products such as blood analyzers, food contamination analyzers, and specialized optical spectrometers and fluorometers utilizing the latest optical technologies. Viking’s service offerings are designed to deliver end-to-end solutions with special focus on product design and industrialization, optical and RF components, module and blade manufacturing, as well as system integration and test.
Viking Memory Solutions
.
Viking supplies leading edge Non-Volatile DIMMs (NVDIMM), Solid State Drives (SSD) and DRAM solutions.
With a range of products that spans both SSD and DRAM technologies, Viking provides storage solutions ranging from high-performance computing SSDs tailored for the enterprise market to small form factor flash and DRAM modules optimized for industrial, telecommunications, and military markets. To continue its leadership in the memory space, Viking Technology is investing in several advanced technologies such as NVDIMM and new storage class memory. These investments will enable Viking to support the large and growing server market with products that optimize performance, capacity, and persistence in enhancing its customer’s applications. In addition, Viking will continue to focus on the enterprise and embedded markets with a further emphasis on medical, military and automotive applications.
Viking's comprehensive memory product offerings include Enterprise Class & Industrial Grade SSDs available across a wide portfolio of standard and OEM customized form-factors (2.5”, 1.8” SlimSATA, mSATA, M.2, PCIe/NVMe SSDs, SATADIMM™, DFC and eUSB). Viking also supports the broadest range of DDR4, DDR3, DDR2, DDR and SDRAM modules; from High-Density to Small-Form Factor with Error Checking and Correction (ECC Memory). In addition to its broad DRAM offering, Viking specializes in DRAM and Flash chip stacking, allowing for higher density Modules and drives ordinarily unachievable through normal chip manufacturing.
Viking’s custom build capabilities, extended temperature ranges, locked BOM support, test, manufacturing and logistics, creates a unique combination of value adds. These capabilities have enabled Viking to further differentiate itself in an industry that is becoming increasingly competitive.
Viking Enterprise Solutions (formerly Newisys).
Viking designs and manufactures both standard and custom storage and server products, including high performance SSD arrays, high performance HDD (Hard Disk Drive) arrays, cold storage, and cloud solutions including software to manage and provision storage across multiple fabrics. Some products are customized for streaming video applications. Viking provides complete rack scale solutions to customers.
SCI Technology Inc. (SCI).
SCI has been providing engineering services, products, manufacturing, test, and depot and repair solutions to the global defense and aerospace industry for more than 55 years. SCI offers advanced products for aircraft systems and tactical communications and also provides products for nuclear and radiation detection and monitoring, as well as fiber optics capabilities for use in a variety of applications.
SCI's customers include U.S. government agencies, U.S. allies and major defense and aerospace prime contractors. SCI has the infrastructure and facility security clearance to support the stringent certifications, regulations, processes and procedures required by these customers.
10
42Q.
42Q provides an innovative, world-class cloud-based manufacturing execution solution (MES) that is scalable, flexible, secure and easy to implement. Our solution provides customers advantages in efficiencies and costs relative to legacy systems and offers traceability and genealogy, multi-plant visibility, compliance management and on-demand work instructions.
Logistics and Repair Services.
Our logistics and repair services provide significant value to our customers while helping protect their brand name. It also improves customer experience through the deployment of enhanced tools and the provision of real-time access to critical business information. Our solutions are designed to reduce the total cost of ownership and enable our customers to shift their services operations to a variable cost model that frees up cash, enabling them to focus on their core business initiatives.
Focusing on highly complex and mission-critical products and processes, we support the logistics and repair needs of customers in the communications, defense, embedded computing and medical markets worldwide. Through our operational infrastructure of 34 Sanmina sites and 28 repair partner sites, we provide a wide range of services including direct-order-fulfillment, configure-to-order, supplier, inventory and warranty management, reverse logistics, repair, asset recovery, sustaining engineering, test development and end-of-life management to embrace the most unique needs of our customers.
Drawing on a robust set of information systems, we offer configurable environments tailored to meet specific customer needs including customized web portals, order and serial number tracking, special routings and promotions. Local, regional and global solutions are supported by a robust set of business processes that focus on inventory reduction and risk mitigation. This can improve cycle times by leveraging infrastructure, people and technology to enable reliable shipments of products to end users worldwide generally within 24 to 72 hours, depending on our customer’s requirements.
Logistics and repair services complement our end-to-end manufacturing strategy by integrating engineering, supply chain, manufacturing, logistics and repair into a seamless solution for customers around the world.
Our End Markets
We target markets that we believe offer significant growth opportunities and where OEMs sell complex products that are subject to rapid technological change. We believe that markets involving complex, rapidly changing products offer opportunities to produce products with higher margins because they require higher value-added manufacturing services and may also include our advanced vertically integrated components. Our diversification across market segments and customers helps mitigate our dependence on any particular market or customer.
Industrial/Medical/Defense/Automotive
Industrial.
We utilize our end-to-end component, engineering and complex assembly services to support the industrial market. We support a wide range of segments including transportation, power management, industrial controls, instrumentation and test equipment, inspection and public safety equipment, capital equipment, and self service kiosk solutions. We have significant experience in manufacturing high precision components that are utilized in highly complex systems such as vacuum chambers, photolithography tools, etch tools, wafer handling systems, airport security, 3D printing, flat panel display test and repair equipment, chem-mech planarization tools, optical inspection and x-ray equipment, explosive detection equipment, and large format printing machines. We have specialized and dedicated facilities for the assembly of large / complex electro-mechanical, thermal and liquid-management equipment for applications including ATMs, beverage dispensing, cash-counting and management systems, electro-mechanical patient transfer tables, industrial printers and semiconductor capital equipment.
We also manufacture sub-assemblies for machine-control units, such as high-speed machining tools, liquid management equipment and complex hydraulic-electro-mechanical systems, for applications such as industrial-grade printing and liquid dispensing.
We are committed to serving companies leading the energy and clean technology revolution in the, solar, wind, battery systems, LED lighting fixtures (including indoor, outdoor, industrial-grade and construction lighting products), as well as smart infrastructure industries. We leverage traditional EMS for clean technology customers in areas related to power electronics, control and distribution, smart meters and full-system integration of complex industrial power inverters. Beyond traditional EMS, our extensive range of electro-mechanical design and complex system manufacturing capabilities are an excellent fit
11
across all clean technology segments. Our design and manufacturing operations are strategically located in close proximity to clean technology business hubs.
Medical
.
We provide comprehensive manufacturing and related services to the medical industry including design, logistics and regulatory services. The manufacturing of products for the medical industry often requires compliance with domestic and foreign regulations including the Food and Drug Administration's (FDA's) quality system regulations and the European Union's medical device directive. In addition to complying with these standards, our medical manufacturing facilities comply with ISO 13485 (formerly EN 46002) and ISO 9001. We manufacture a broad range of medical devices including blood glucose meters, computed tomography scanner assemblies, respiration systems, blood analyzers, molecular diagnostics, cosmetic surgery systems, ultrasound imaging systems and a variety of patient monitoring equipment.
Defense
.
We offer our end-to-end services to the defense, aerospace and high-reliability electronics industry. We design, manufacture and support a comprehensive range of defense and aerospace products including avionics systems and processors, cockpit and wireless communications systems, tactical and secure network communications systems, radar subsystems, nuclear and radiation detection and monitoring systems for homeland defense and fiber-optic systems. We believe our experience in serving the defense, aerospace and high-reliability electronics industry, as well as our product design and engineering capabilities, are our key competitive strengths.
Automotive.
We provide services to the automotive industry in which we manufacture sensors, controllers, engine control units, radios, heating ventilation and air-conditioning (HVAC) control heads and blower modules, a wide array of LED (Light Emitting Diode) interior and exterior light assemblies, audio/video entertainment systems, as well as cables for entertainment solutions. We also provide design support, product and process qualification, manufacturing, supply chain management, supplier quality assurance and end-of-life services. Substantially all of our automotive facilities are ISO/TS 16949 certified and produce printed circuit boards, printed circuit board assemblies, cable assemblies and higher level electronic assemblies.
Communications Networks
In the communications sector, we focus on infrastructure equipment including wireless and wireline access, RF filters, switching, routing and transmission systems, optical networking and transmission and enterprise networking systems. Our product design and engineering team has extensive experience designing and industrializing advanced communications products and components for these markets. Products we manufacture include wireless base stations, remote radio heads, point-to-point microwave systems and other backhaul solutions, satellite receivers and various radio frequency appliances, optical switches and transmission hardware as well as switches, along with core, service and edge routers among others. We also design and manufacture advanced optical, RF and microelectronic components which are key elements in many of these products.
Cloud Solutions
We provide comprehensive design and manufacturing solutions, as well as BTO and CTO services, to the embedded computing and data storage markets. We tightly couple our vertically integrated supply chain with manufacturing and logistics allowing for assembly and distribution of products all over the world. In addition, we manufacture a broad range of products with embedded processor capability including set-top boxes, point of sale equipment, casino gaming equipment, digital home gateways, professional audio-video equipment, a variety of touch-screen-operated equipment and internet connected entertainment devices. Our vertical integration capabilities include racks, enclosures, cables, complex multi-layer printed circuit boards, printed circuit assemblies and backplanes, fiber optics and final system assembly and test, direct order fulfillment and repair services. In addition, we have designed and developed some of the most compact and powerful storage modules available in the market today which we have coupled with our global, vertically integrated supply chain to deliver some of the most compelling embedded computing and storage solutions to the data storage industry.
Customers
A small number of customers have historically generated a significant portion of our net sales. Sales to our ten largest customers typically represent approximately 50% of our net sales. Nokia represented 10% or more of our net sales in 2018, 2017 and 2016. In 2017, Motorola Solutions, Inc. also represented 10% or more of our net sales.
We seek to establish and maintain long-term relationships with our customers. Historically, we have had substantial recurring sales from existing customers. We seek to expand our customer base through our marketing and sales efforts as well as acquisitions. We have been successful in broadening relationships with customers by providing vertically integrated products and services as well as multiple products and services in multiple locations.
12
We typically enter into supply agreements with our major OEM customers with terms ranging from three to five years. Our supply agreements generally do not obligate the customer to purchase minimum quantities of products. However, the customer is typically liable for the cost of the materials and components we have ordered to meet their production forecast but which are not used, provided that the material was ordered in accordance with an agreed-upon procurement plan. In some cases, the procurement plan contains provisions regarding the types of materials for which our customers will assume responsibility. Our supply agreements generally contain provisions permitting cancellation and rescheduling of orders upon notice and, in some cases, are subject to cancellation and rescheduling charges. Order cancellation charges vary by product type, depending how far in advance of shipment a customer notifies us of an order cancellation. In some circumstances, our supply agreements with customers include provisions for cost reduction objectives during the term of the agreement, which can have the effect of reducing revenue and profitability from these arrangements.
We generally do not obtain firm, long-term commitments from our customers under supply agreements. As a result, customers can cancel their orders, change production quantities or delay orders. Even in those cases in which customers are contractually obligated to purchase products from us or purchase unused inventory from us that we have ordered for them, we may elect not to immediately enforce our contractual rights for customer relationship or other reasons.
Seasonality
With the continued diversification of our customer base, we generally have not experienced significant seasonality in our business in recent years.
Backlog
We generally do not obtain firm, long-term commitments from our customers. Instead, our procurement of inventory and our manufacturing activities are based primarily on forecasts provided by our customers. This enables us to minimize the time lapse between receipt of a customer's order and delivery of product to the customer. Customers usually do not make firm orders for product delivery more than thirty to ninety days in advance. Additionally, customers may cancel or postpone scheduled deliveries, generally without significant penalty. Therefore, we do not believe the backlog of expected product sales covered by firm orders is a meaningful measure of future sales.
Marketing and Sales
Our sales efforts are organized and managed on a regional basis with regional sales managers in geographic regions throughout the world.
We develop relationships with our customers and market our vertically integrated manufacturing solutions through our direct sales force and marketing and sales staff. Our sales resources are directed at multiple management and staff levels within target accounts. Our direct sales personnel work closely with the customers' engineering and technical personnel to better understand their requirements. Our marketing and sales staff supports our business strategy of providing end-to-end solutions by encouraging cross-selling of vertically integrated manufacturing solutions and component manufacturing across a broad range of major OEM products. To achieve this objective, our marketing and sales staff works closely with our various manufacturing and design and engineering groups and engages in marketing and sales activities targeted at key customer opportunities.
Each of our key customer accounts is managed by a dedicated account team including a global account manager directly responsible for account management. Global account managers coordinate activities across divisions to effectively satisfy customer requirements and have direct access to our senior management to quickly address customer concerns. Local customer account teams further support the global teams.
Competition
For our integrated manufacturing solutions business, we face competition from other major global EMS companies such as Benchmark Electronics, Inc., Celestica, Inc., Flex Ltd., Hon Hai Precision Industry Co., Ltd. (Foxconn), Jabil Inc. and Plexus Corp. Our components, products and services business faces competition from EMS and non-EMS companies that often have a regional product, service or industry-specific focus. In addition, our potential customers may also compare the benefits of outsourcing their manufacturing to us with the merits of manufacturing products themselves.
13
We compete with different companies depending on the type of solution or geographic area. We believe the primary competitive factors in our industry include manufacturing technology, quality, global footprint, delivery, responsiveness, provision of value-added solutions and price. We believe our primary competitive strengths include our ability to provide global end-to-end solutions, product design and engineering resources, vertically integrated manufacturing solutions, advanced technologies, global manufacturing capabilities, global supplier base, customer focus and responsiveness, and expertise in serving diverse end markets.
Intellectual Property
We hold U.S. and foreign patents and patent applications relating to, among other things, printed circuit board manufacturing technology, enclosures, cables, memory modules, optical technology and computing and storage. For other proprietary processes, we rely primarily on trade secret protection. A number of our patents have expired or will expire in the near term. The expiration and abandonment of patents reduces our ability to assert claims against competitors or others who use similar technologies and to license such patents to third parties. We have registered certain trademarks and pending trademark applications in both the U.S. and internationally.
Environmental Matters
We are subject to a variety of local, state, federal and foreign environmental laws and regulations relating to the storage and use of hazardous materials used in our manufacturing processes, as well as the storage, treatment, discharge, emission and disposal of hazardous waste that are by-products of these processes. We are also subject to occupational safety and health laws, product labeling and product content requirements, either directly or as required by our customers. Proper waste disposal is a major consideration for printed circuit board manufacturers due to the metals and chemicals used in the manufacturing process. Water used in the printed circuit board manufacturing process must be treated to remove metal particles and other contaminants before it can be discharged into municipal sanitary sewer systems. We operate on-site wastewater treatment systems at our printed circuit board manufacturing plants in order to treat wastewater generated in the fabrication process.
Additionally, the electronics assembly process can generate lead dust. Upon vacating a facility, we are responsible for remediating lead dust from the interior of the manufacturing facility. Although there are no applicable standards for lead dust remediation in manufacturing facilities, we endeavor to remove the residues. To date, lead dust remediation costs have not been material to our results of operations. We also monitor for airborne concentrations of lead in our buildings and are unaware of any significant lead concentrations in excess of the applicable OSHA or other local standards.
We have a range of corporate programs that aim to reduce the use of hazardous materials in manufacturing. We developed corporate-wide standardized environmental management systems, auditing programs and policies to enable better management of environmental compliance activities. For example, almost all of our manufacturing facilities are also certified under ISO 14001, a set of standards and procedures relating to environmental compliance management. In addition, the electronics industry must adhere to the European Union's Restrictions of Hazardous Substances (RoHS) and Waste Electrical and Electronic Equipment (WEEE). Parallel initiatives have been adopted in other jurisdictions throughout the world, including several states in the U.S. and the Peoples' Republic of China. RoHS limits the use of lead, mercury and other specified substances in electronics products. WEEE requires producers to assume responsibility for the collection, recycling and management of waste electronic products and components. We implemented procedures intended to ensure our manufacturing processes are compliant with RoHS and the European Union's Registration, Evaluation and Authorization of Chemicals (REACH) legislation, when required. WEEE compliance is primarily the responsibility of OEMs.
Asbestos containing materials, or ACM, are present at several of our manufacturing facilities. Although ACM is being managed and controls have been put in place pursuant to ACM operations and maintenance plans, the presence of ACM could give rise to remediation obligations and other liabilities.
Our facilities generally operate under environmental permits issued by governmental authorities. For the most part, these permits must be renewed periodically and are subject to revocation in the event of violations of environmental laws. Any such revocation may require us to cease or limit production at one or more of our facilities, adversely affecting our results of operations.
In connection with certain acquisitions, we have incurred liabilities associated with environmental contamination. These include ongoing investigation and remediation activities at a number of current and former sites, including those located in Owego, New York; Derry, New Hampshire; and Brockville, Ontario. In addition, we have been named in a lawsuit alleging operations at our current and former facilities in Orange County, California contributed to groundwater contamination and also
14
have ongoing investigation and remediation activities at other sites in Orange County, California. There are some sites, including our acquired facility in Gunzenhausen, Germany, that are known to have groundwater contamination caused by a third-party, and that third-party has provided indemnification to us for the related liability. However, in certain situations, third-party indemnities may not be effective to reduce our liability for environmental contamination.
We use environmental consultants primarily for risk assessments and remediation, including remedial investigation and feasibility studies, remedial action planning and design and site remediation. Our consultants provide information regarding the nature and extent of site contamination, acceptable remediation alternatives and estimated costs associated with each remediation alternative. We consider their recommendations together with other information when determining the appropriate amount to accrue for environmental liabilities.
Employees
As of
September 29, 2018
, we had approximately 47,000 employees, including approximately 11,600 temporary employees. None of our U.S. employees are represented by a labor union. In some international locations, our employees are represented by labor unions on either a national or plant level or are subject to collective bargaining agreements.
Available Information
Our Internet address is
http://www.sanmina.com.
We make available through our website, free of charge, our Annual Reports on Form 10-K, Quarterly Reports on Form 10-Q, Current Reports on Form 8-K and amendments to those reports filed or furnished pursuant to Section 13(a) or 15(d) of the Securities Exchange Act of 1934, as amended, as soon as reasonably practicable after we electronically file such material with, or furnish it to, the Securities and Exchange Commission, or SEC. All reports we file with the SEC are also available free of charge via EDGAR through the SEC's website at
http://www.sec.gov
.
15
EXECUTIVE OFFICERS OF THE REGISTRANT
The following table sets forth the name, position and age of our current executive officers and their ages as of October 31, 2018.
|
Name
|
Age
|
Position
|
|
Jure Sola
|
67
|
Executive Chairman
|
|
Michael J. Clarke
|
64
|
Chief Executive Officer
|
|
David R. Anderson
|
58
|
Executive Vice President, Chief Financial Officer and Principal Financial Officer
|
|
Alan Reid
|
55
|
Executive Vice President of Global Human Resources
|
Jure Sola
has served as our Executive Chairman since October 2017. Mr. Sola served as our Chief Executive Officer from April 1991 until October 2017, as Chairman of our Board of Directors from April 1991 until December 2001 and from December 2002 until October 2017, and as Co-Chairman of our Board of Directors from December 2001 until December 2002. In 1980, Mr. Sola co-founded Sanmina and initially held the position of Vice President of Sales. In October 1987, he became the Vice President and General Manager of Sanmina, responsible for manufacturing operations, sales and marketing. Mr. Sola served as our President from October 1989 to March 1996.
Michael J. Clarke
has served as our Chief Executive Officer since October 2018 and as a member of the Board of Directors since December 2013. From December 2011 through July 2016, Mr. Clarke was a member of the Board of Directors, President and Chief Executive Officer of Nortek, Inc., a leading global manufacturer of innovative, branded air management, security and technology products for home and work environments. From 2005 until joining Nortek, Mr. Clarke served as Group President of Integrated Network Solutions of Flex Ltd., a publicly traded provider of design and electronics manufacturing services to original equipment manufacturers.
David R. Anderson
has served as our Executive Vice President and Chief Financial Officer since October 2017. Mr. Anderson has held various roles at Sanmina, including Senior Vice President, Corporate Controller and Principal Accounting Officer, from March 2013 to September 2017. From November 2004 to February 2013 he was Senior Vice President Finance and Controller, Global Operations and Corporate Planning. Mr. Anderson served as Vice President Finance and Controller, EMS operations from February 2002 to October 2004.
Alan Reid
has served as our Executive Vice President of Global Human Resources since October 2012. Mr. Reid has held various roles at Sanmina, including Senior Vice President of Global Human Resources and Human Resources Director of EMEA, from July 2001 to October 2012. Prior to joining us, he was Group Human Resources Manager at Kymata Ltd., an optoelectronic technology startup from June 2000 to July 2001. Prior to Kymata, Mr. Reid held various roles in operations and human resources with The BOC Group PLC. (British Oxygen Company), a global industrial gases and engineering company, from September 1986 to June 2000.
16
Item 1A.
Risk Factors
Adverse changes in the key end markets we target could harm our business by reducing our sales.
We provide products and services to companies that serve the communications networks, computing and data storage, industrial, defense and aerospace, medical, automotive, energy and industries that include embedded computing technologies in products such as set-top boxes, point-of-sales devices and casino gaming machines. Adverse changes in any of these markets could reduce demand for our customers' products or make these customers more sensitive to the cost of our products and services, either of which could reduce our sales, gross margins and net income. A number of factors could affect any of these industries in general, or our customers in particular, and lead to reductions in net sales, thus harming our business. These factors include:
|
•
|
intense competition among our customers and their competitors, leading to reductions in prices for their products and pricing pressures on us;
|
|
•
|
failure of our customers' products to gain widespread commercial acceptance which could decrease the volume of orders customers place with us;
|
|
•
|
changes in regulatory requirements affecting the products we build for our customers, leading to product obsolescence and potentially causing us to lose business; and
|
|
•
|
recessionary periods in our customers' markets, which decrease orders from affected customers, such as the currently depressed conditions in the oil and gas industry, which decrease orders from affected customers.
|
We realize a substantial portion of our revenues from communications equipment customers. This market is highly competitive, particularly in the area of price. Should any of our larger customers in this market fail to effectively compete with their competitors, they could reduce their orders to us or experience liquidity difficulties, either of which could have the effect of substantially reducing our revenue and net income. There can be no assurance that we will not experience declines in demand in this or in other end markets in the future.
Our operating results and cash generated from operations are subject to significant uncertainties, which can cause our future sales and net income to be variable.
Our operating results can vary due to a number of significant uncertainties, including:
|
•
|
our ability to replace declining sales from end-of-life programs and customer disengagements with new business wins;
|
|
•
|
conditions in the economy as a whole and in the industries we serve;
|
|
•
|
fluctuations in component prices, component shortages and extended component lead times caused by high demand, natural disaster or otherwise;
|
|
•
|
timing of new product development and ramps by our customers, which creates demand for our services, but which can also require us to incur start-up costs relating to new tooling and processes;
|
|
•
|
levels of demand in the end markets served by our customers;
|
|
•
|
timing of orders from customers and the accuracy of their forecasts;
|
|
•
|
inventory levels of customers, which if high relative to their normal sales volume, could cause them to reduce their orders to us;
|
|
•
|
customer payment terms and the extent to which we factor customer receivables during the quarter;
|
|
•
|
increasing labor costs in the regions in which we operate;
|
|
•
|
mix of products ordered by and shipped to major customers, as high volume and low complexity manufacturing services typically have lower gross margins than more complex and lower volume services;
|
|
•
|
degree to which we are able to utilize our available manufacturing capacity;
|
|
•
|
customer insolvencies resulting in bad debt or inventory exposures that are in excess of our reserves;
|
|
•
|
our ability to efficiently move manufacturing activities to lower cost regions;
|
|
•
|
changes in our tax provision due to changes in our estimates of pre-tax income in the jurisdictions in which we operate, uncertain tax positions, and our ability to utilize our deferred tax assets; and
|
|
•
|
political and economic developments in countries in which we have operations which could restrict our operations or increase our costs.
|
Variability in our operating results may also lead to variability in cash generated by operations, which can adversely affect our ability to make capital expenditures, engage in strategic transactions and repurchase stock.
17
We rely on a relatively small number of customers for a substantial portion of our sales, and declines in sales to these customers could reduce our net sales and net income.
Sales to our ten largest customers have historically represented approximately half of our net sales. We expect to continue to depend upon a relatively small number of customers for a significant percentage of our sales for the foreseeable future. The loss of, or a significant reduction in sales or pricing to our largest customers, could substantially reduce our revenue and margins.
We are subject to risks arising from our international operations.
The substantial majority of our net sales are generated through our non-U.S. operations. As a result, we are affected by economic, political and other conditions in the foreign countries in which we do business, including:
|
•
|
changes in trade and tax laws that may result in us or our customers being subjected to increased taxes, duties and tariffs and thus increase our costs and/or reduce our customers’ willingness to use our services in countries in which we are currently manufacturing their products;
|
|
•
|
compliance with laws concerning the export of U.S. technology, including the International Traffic in Arms Regulations (“ITAR”) and the Export Administration Regulations (“EAR”), sanctions administered by the Office of Foreign Asset Controls (“OFAC”) and the Foreign Corrupt Practices Act;
|
|
•
|
rising labor costs;
|
|
•
|
compliance with foreign labor laws, which generally provide for increased notice, severance and consultation requirements compared to U.S. laws;
|
|
•
|
labor unrest, including strikes;
|
|
•
|
difficulties in staffing due to immigration or travel restrictions imposed by national governments, including the U.S.;
|
|
•
|
security concerns;
|
|
•
|
political instability and/or regional military tension or hostilities;
|
|
•
|
fluctuations in currency exchange rates, which may either increase or decrease our operating costs and for which we have significant exposure;
|
|
•
|
the imposition of currency controls;
|
|
•
|
exposure to heightened corruption risks;
|
|
•
|
aggressive, selective or lax enforcement of laws and regulations by national governmental authorities; and
|
|
•
|
potentially increased risk of misappropriation of intellectual property.
|
We operate in countries that have experienced labor unrest, political instability or conflict and strife, including Brazil, China, India, Israel, Malaysia and Thailand and we have experienced work stoppages and similar disruptions in these foreign jurisdictions. To the extent such developments prevent us from adequately staffing our plants and manufacturing and shipping products in those jurisdictions, our margins and net income could be reduced and our reputation as a reliable supplier could be negatively impacted.
Certain of our foreign manufacturing facilities are leased from third parties. To the extent we are unable to renew the leases covering such facilities as they expire on reasonable terms, or are forced to move our operations at those facilities to other locations as a result of a failure to agree upon renewal terms, production for our customers may be interrupted, we may breach our customer agreements, we could incur significant start-up costs at new facilities and our lease expense may increase, potentially significantly.
We are subject to intense competition in the EMS industry which could cause us to lose sales and therefore harm our financial performance.
The electronic manufacturing services (EMS) industry is highly competitive and the industry has experienced a surplus of manufacturing capacity. Our competitors include major global EMS providers, including Benchmark Electronics, Inc., Celestica, Inc., Flex Ltd., Hon Hai Precision Industry Co., Ltd. (Foxconn), Jabil Circuit, Inc. and Plexus Corp., as well as other companies that have a regional, product, service or industry-specific focus. We also face competition from current and potential OEM customers who may elect to manufacture their own products internally rather than outsourcing to EMS providers.
Competition is based on a number of factors, including end markets served, price and quality. We may not be able to offer prices as low as some of our competitors for any number of reasons, including the willingness of competitors to provide EMS services at prices we are unable or unwilling to offer. There can be no assurance that we will win new business or not lose existing business due to competitive factors, which could decrease our sales and net income. In addition, due to the extremely
18
price sensitive nature of our industry, business that we do win or maintain may have lower margins than our historical or target margins. As a result, competition may cause our gross and operating margins to fall.
Our supply chain is subject to a number of economic, regulatory and environmental risks that could increase our costs or cause us to delay shipments to customers, reducing our revenue and margins and increasing our inventory.
Our supply chain is subject to a number of risks and uncertainties. For example, we are dependent on certain suppliers, including limited and sole source suppliers, to provide key components we incorporate into our products. We are currently experiencing, and may continue to experience in the future, delays in delivery and shortages of components, particularly certain types of capacitors, resistors and discrete semiconductors used in many of the products we manufacture. These conditions have resulted and could continue to result in increased component prices and delays in product shipments to customers, both of which could decrease our revenue and margins, as well as increases of inventory of other components, which would reduce our operating cash flow.
Our components are manufactured using a number of commodities, including petroleum, gold, copper and other metals that are subject to frequent and unpredictable changes in price due to worldwide demand, investor interest and economic conditions. We do not hedge against the risk of these fluctuations, but rather attempt to adjust our product pricing to reflect such changes. Should significant increases in commodities prices occur and should we not be able to increase our product prices enough to offset these increased costs, our gross margins and profitability could decrease, perhaps significantly. In addition, we, along with our suppliers and customers, rely on various energy sources in our manufacturing and transportation activities. There has been significant volatility in the prices of energy during the recent past and such volatility is likely to continue in the future.
Concern over climate change has led to state, federal and international legislative and regulatory initiatives aimed at reducing carbon dioxide and other greenhouse gas emissions. Such initiatives could lead to an increase in the price of energy over time. A sustained increase in energy prices for any reason could increase our raw material, components, operations and transportation costs. In addition, government regulations, such as the Dodd-Frank Act disclosure requirements relating to conflict minerals, and customer interest in responsible sourcing could decrease the availability and increase the prices of components used in our customers' products. We may not be able to increase our product prices enough to offset these increased costs, in which case our profitability would be reduced.
We rely on a variety of common carriers to transport our raw materials and components from our suppliers to us, and to transport our products to our customers. The use of common carriers is subject to a number of risks, including increased costs due to rising energy prices and labor, vehicle and insurance costs, and hijacking and theft resulting in losses of shipments, delivery delays resulting from labor disturbances and strikes and other factors beyond our control. Although we attempt to mitigate our liability for any losses resulting from these risks through contracts with our customers, suppliers and insurance carriers, any costs or losses that cannot be mitigated could reduce our profitability, require us to manufacture replacement product or damage our relationships with our customers.
Changes in U.S. trade policy could increase the cost of using both our onshore and offshore manufacturing services for our U.S customers, leading them to reduce their orders to us.
Although we maintain significant manufacturing capacity in the United States, the substantial majority of our manufacturing operations are located outside the United States. This manufacturing footprint has allowed us to provide cost-effective volume manufacturing for our customers. However, the willingness of our U.S customers to have us manufacture their products in our offshore facilities for import into the U.S. could be reduced should the U.S. government (1) exit or renegotiate trade agreements and frameworks to which it is currently bound or to which it adheres, including the North American Free Trade Act and the rules of the World Trade Organization; or (2) impose any import tariff covering any such products. Both the U.S. and China have recently imposed tariffs impacting certain products imported into such countries. These tariffs will apply to both components imported into the U.S. for use in the manufacture of products at our U.S. plants and to certain of our customers’ products that we manufacture offshore and that are imported into the U.S. Any decision by a large number of our customers to cease using either our domestic or our offshore manufacturing services due to these tariffs would materially reduce our revenue and net income, an effect that would be compounded if the amount of these tariffs increase or should they be applied to additional categories of components. In addition, our gross margins would be reduced in the event we are for any reason unable to pass on any tariffs that we incur to our customers. Although our customers are generally liable for tariffs we pay on their behalf on importation of components used in the manufacture of their products, our gross margins would be reduced in the event we are for any reason unable to recover such tariffs from our customers. Further, although we are required to pay tariffs upon importation of the components, we may not recover these amounts from customers until some time later, which adversely impacts our operating cash flow in a given period.
19
Unanticipated changes in our tax rates or exposure to additional tax liabilities could increase our taxes and decrease our net income; our projections of future taxable income that drove the release of our valuation allowance in prior years could prove to be incorrect, which could cause a charge to earnings; recent corporate tax reform measures have reduced the value of our deferred tax assets and could result in taxation of untaxed foreign earnings.
We are or may become subject to income, sales, value-added, goods and services, withholding and other taxes in the United States and various foreign jurisdictions. Significant judgment is required in determining our worldwide provision for taxes and, in the ordinary course of business, there are many transactions and calculations for which the ultimate tax determination is uncertain. Our effective tax rates and liability for other taxes could increase as a result of changes in the mix of earnings in countries with differing statutory tax rates, changes in the valuation of deferred tax assets and liabilities, changes in enacted tax laws, our cash management strategies, our ability to negotiate advance pricing agreements with foreign tax authorities, compliance with local trade laws and other factors. Recent international initiatives will require multinational enterprises, like ours, to report profitability on a country-by-country basis, which could increase scrutiny by foreign tax authorities. In addition, our tax determinations are regularly subject to audit by tax authorities. For example, we are currently undergoing audits of our tax returns for certain recent tax years in a number of jurisdictions, including the United States. Developments in these or future audits could adversely affect our tax provisions, including through the disallowance or reduction of deferred tax assets or the assessment of back taxes, interest and penalties, any of which could result in an increase to income tax expense and therefore a decrease in our net income. In addition, the recently enacted U.S. Tax Cuts and Jobs Act provides for a substantial reduction in the U.S. corporate income tax rate and for a one-time mandatory deemed repatriation tax on previously untaxed foreign earnings. The impact of the Tax Act was approximately
$161 million
for the reduction in the value of our deferred tax assets as a result of the corporate tax rate reduction and conversion to a territorial system. We do not anticipate any impact for the mandatory deemed repatriation tax. However, should our estimates or recorded amounts change as a result of further analysis of the Tax Act or otherwise, we could be required to further reduce the carrying value of our deferred tax assets and the amount of the deemed repatriation tax could increase, which amounts could reduce net income and could be significant.
Our strategy to pursue higher margin business depends in part on the success of our Components, Products and Services (CPS) business, which, if not successful, could cause our future gross margins and operating results to be lower.
A key part of our strategy is to grow our CPS business, which includes printed circuit boards, backplane and cable assemblies and plastic injection molding, mechanical systems, memory, RF, optical and micoelectronic solutions, defense and aerospace products and data storage solutions and design, engineering, logistics and repair services. A decrease in orders for these components, products and services can have a disproportionately adverse impact on our profitability since these components, products and services generally carry higher than average contribution margins than our core IMS business. In addition, in order to grow this portion of our business profitably, we must continue to make substantial investments in the development of our product development capabilities, research and development activities, test and tooling equipment and skilled personnel, all of which reduce our operating results in the short term. The success of our CPS business also depends on our ability to increase sales of our proprietary products, convince our customers to agree to purchase our components for use in the manufacture of their products, rather than directing us to buy them from third parties, and expand the number of our customers who contract for our design, engineering, logistics and repair services. We may face challenges in achieving commercially viable yields and difficulties in manufacturing components in the quantities and to the specifications and quality standards required by our customers, as well as in qualifying our components for use in our customers' designs. Our proprietary products and design, engineering, logistics and repair services must compete with products and services offered by established vendors which focus solely on development of similar technologies or the provision of similar services. Any of these factors could cause our CPS revenue and margins to be less than expected, which would have an overall adverse and potentially disproportionate effect on our revenues and profitability.
Cancellations, reductions in production quantities, delays in production by our customers and changes in customer requirements could reduce our sales and net income.
We generally do not obtain firm, long-term purchase commitments from our customers and our bookings may generally be canceled prior to the scheduled shipment date. Although a customer is generally liable for raw materials we procure on their behalf, finished goods and work-in-process at the time of cancellation, the customer may fail to honor this commitment or we may be unable or, for other business reasons, choose not to enforce our contractual rights. Cancellations, reductions or delays of orders by customers could increase our inventory levels, lead to write-offs of inventory that we are not able to resell to the customer, reduce our sales and net income, delay or eliminate recovery of our expenditures for inventory purchased in preparation for customer orders and lower our asset utilization, all of which could result in lower gross margins and lower net income.
20
Our customers could experience credit problems, which could reduce our future revenues and net income.
Some companies in the industries for which we provide products have previously experienced significant financial difficulty, with a few filing for bankruptcy in the past. Such financial difficulty, if experienced by one or more of our customers, may negatively affect our business due to the decreased demand from these financially distressed customers, the lengthening of customer payment terms, the potential inability of these companies to make full payment on amounts owed to us or to purchase inventory we acquired to support their businesses. Customer bankruptcies also entail the risk of potential recovery by the bankruptcy estate of amounts previously paid to us that are deemed a preference under bankruptcy laws.
Consolidation in the electronics industry may adversely affect our business by increasing customer buying power and increasing prices we pay for components.
Consolidation in the electronics industry among our customers, our suppliers and/or our competitors may increase, which could result in a small number of very large electronics companies offering products in multiple sectors of the electronics industry. In addition, if one of our customers is acquired by another company that does not rely on us to provide EMS services, we may lose that customer's business. Similarly, consolidation among our suppliers could result in a sole or limited source for certain components used in our customers' products. Any such consolidation could cause us to be required to pay increased prices for such components, which could reduce our gross margin and profitability.
Cyberattacks and other disruptions of our IT network and systems could interrupt our operations, lead to loss of our customer data and subject us to damages.
We rely on internal and cloud-based networks and systems furnished by third parties for worldwide financial reporting, inventory management, procurement, invoicing and email communications, among other functions. In addition, our 42Q manufacturing execution solutions software used by us and certain of our customers operates in the cloud. Despite our business continuity planning, including redundant data sites and network availability, both our internal and cloud-based infrastructure may be susceptible to outages due to fire, floods, power loss, telecommunications failures, terrorist attacks and similar events. In addition, despite the implementation of network security measures that we believe to be reasonable, both our internal and our cloud-based infrastructure may also be vulnerable to hacking, computer viruses, the installation of malware and similar disruptions either by third parties or employees with access to key IT infrastructure. Cybersecurity attacks can come in many forms, including distributed denial of service attacks, advanced persistent threat, phishing and business email compromise efforts. Hacking, malware and other cybersecurity attacks, if not prevented, could lead to the collection and disclosure of sensitive personal or confidential information relating to our customers, employees or others, exposing us to legal liability and causing us to suffer reputational damage. In addition, our SCI defense division is subject to U.S. government regulations requiring the safeguarding of certain unclassified government information and to report to the U.S. government certain cyber incidents that affect such information. The increasing sophistication of cyberattacks requires us to continually evaluate new technologies and processes intended to detect and prevent these attacks. Our insurance for cyber-attacks is limited. There can be no assurance that the security measures we choose to implement will be sufficient to protect the data we manage. If we and our cloud infrastructure vendors are not successful in preventing such outages and cyberattacks, our operations could be disrupted, we could incur losses, including losses relating to claims by our customers or employees relating to loss of their information, the willingness of customers to do business with us may be damaged and, in the case of our defense business, we could be debarred from future participation in U.S. government programs.
Customer requirements to transfer business may increase our costs.
Our customers sometimes require that we transfer the manufacturing of their products from one Sanmina facility to another to achieve cost reductions and other objectives. These transfers have resulted in increased costs to us due to facility downtime, less than optimal utilization of our manufacturing capacity and delays and complications related to the transition of manufacturing programs to new locations. These transfers, and any decision by a significant customer to terminate manufacturing services in a particular facility, could require us to close or reduce operations at certain facilities and, as a result, we may incur in the future significant costs for the closure of facilities, employee severance and related matters. We may be required to relocate additional manufacturing operations in the future and, accordingly, we may incur additional costs that decrease our net income. Any of these factors could reduce our revenues, increase our expenses and reduce our net income.
21
Recruiting and retaining our key personnel is critical to the continued growth of our business.
Our success depends upon the continued service of our key personnel, particularly our highly skilled sales and operations executives, managers and engineers with many years of experience in electronics and contracts manufacturing. Such individuals can be difficult to identify, recruit and retain and are heavily recruited by our competitors. Should any of our key employees choose to retire or terminate their employment with us, and should we be unable to recruit new employees with the required experience, our operations and growth prospects could be negatively impacted.
If we are unable to protect our intellectual property or if we infringe, or are alleged to infringe, upon the intellectual property of others, we could be required to pay significant amounts in costs or damages.
We rely on a combination of copyright, patent, trademark and trade secret laws and contractual restrictions to protect our intellectual property rights. However, a number of our patents covering certain aspects of our manufacturing processes or products have expired and will continue to expire in the future. Such expirations reduce our ability to assert claims against competitors or others who use or sell similar technology. Any failure to protect our intellectual property rights could diminish or eliminate the competitive advantages that we derive from our proprietary technology.
We are also subject to the risk that current or former employees violate the terms of their proprietary information agreements with us. Should a key current or former employee use or disclose any of our or our customers' proprietary information, we could become subject to legal action by our customers or others, our key technologies could become compromised and our ability to compete could be adversely impacted.
In addition, we may become involved in administrative proceedings, lawsuits or other proceedings if others allege that the products we manufacture for our customers or our own manufacturing processes and products infringe on their intellectual property rights. If successful, such claims could force our customers and us to stop importing or producing products or components of products that use the challenged intellectual property, to pay up to treble damages and to obtain a license to the relevant technology or redesign those products or services so as not to use the infringed technology. The costs of defense and potential damages and/or impact on production of patent litigation could be significant and have a materially adverse impact on our financial results. In addition, although our customers typically indemnify us against claims that the products we manufacture for them infringe others’ intellectual property rights, there is no guaranty that these customers will have the financial wherewithal to stand behind such indemnities should the need arise, nor is there any guaranty that any such indemnity could be fully enforced. We sometimes design products on a contract basis or jointly with our customers. In these situations, we may become subject to claims that products we design infringe third party intellectual property rights and may also be required to indemnify our customer against liability caused by such claims.
Any of these risks could cause a reduction in our revenue, an increase in our costs and a reduction in our net income and could damage our reputation with our customers.
We can experience losses due to foreign exchange rate fluctuations and currency controls, which could reduce our net income and impact our ability to repatriate funds.
Because we manufacture and sell the majority of our products abroad, our operating results can be negatively impacted due to fluctuations in foreign currency exchange rates, particularly in volatile currencies to which we are exposed, such as the Euro, Mexican peso, Malaysian ringgit, Chinese renminbi and Brazilian real. We use financial instruments, primarily short-term foreign currency forward contracts, to hedge our exposure to exchange rate fluctuations. However, the success of our foreign currency hedging activities in preventing foreign exchange losses depends largely upon the accuracy of our forecasts of future sales, expenses, capital expenditures and monetary assets and liabilities. As such, our foreign currency hedging program may not fully cover our exposure to exchange rate fluctuations. If our hedging activities are not successful, we may experience a reduction of our net income. In addition, certain countries in which we operate have adopted currency controls requiring that local transactions be settled only in local currency rather than in our functional currency which is generally different than the local currency. Such controls could require us to hedge larger amounts of local currency than we otherwise would and/or prevent us from repatriating cash generated by our operations in such countries.
Allegations of failures to comply with domestic or international employment and related laws could result in the payment of significant damages, which would reduce our net income.
We are subject to a variety of domestic and foreign employment laws, including those related to safety, wages and overtime, discrimination, organizing, whistle-blowing, classification of employees, privacy and severance payments. Enforcement activity relating to these laws can increase as a result of increased governmental scrutiny, media attention due to
22
violations by other companies, changes in law, political and other factors. Allegations that we have violated such laws could lead to fines from or settlements with federal, state or foreign regulatory authorities or damages payable to employees, which fines could be substantial and which would reduce our net income.
We are subject to a number of U.S. governmental procurement rules and regulations and failure to comply with such rules and regulations could result in damages or reduction of future revenue.
We are subject to a number of laws and regulations relating to the award, administration and performance of U.S. government contracts and subcontracts, including Federal Acquisition Regulations and the Defense Federal Acquisition Regulations. Such laws and regulations govern, among other things, price negotiations, cost accounting standards, procurement practices, equal opportunity and affirmative action in employment and other aspects of performance under government contracts. These rules are complex, our performance under them is subject to audit by the Defense Contract Audit Agency, the Office of Federal Contract Compliance Programs and other government regulators, and in most cases must be complied with by our suppliers. If an audit or investigation reveals a failure to comply with regulations, we could become subject to civil or criminal penalties and administrative sanctions by either the government or the prime customer, including government pre-approval of our government contracting activities, termination of the contract, payment of fines and suspension or debarment from doing further business with the U.S. government. Any of these actions could increase our expenses, reduce our revenue and damage our reputation as a reliable government supplier.
We may not have sufficient insurance coverage for potential claims and losses, which could leave us responsible for certain costs and damages.
We carry various forms of business and liability insurance in types and amounts we believe are reasonable and customary for similarly situated companies in our industry. However, our insurance program does not generally cover failure to comply with typical customer warranties for workmanship, product and medical device liability, intellectual property infringement, product recall claims, certain natural disasters, such as earthquake, and environmental contamination. In addition, our policies generally have deductibles and/or limits or may be limited to certain lines or business or customer engagements that reduce the amount of our potential recoveries from insurance. As a result, not all of our potential business losses are covered under our insurance policies. Should we sustain a significant uncovered loss, our net income will be reduced. Additionally, if one or more counterparties to our insurance coverage were to fail, we would bear the entire amount of an otherwise insured loss.
Any failure to comply with applicable environmental laws could adversely affect our business by causing us to pay significant amounts for cleanup of hazardous materials or for damages or fines.
We are subject to various federal, state, local and foreign environmental laws and regulations, including those governing the use, generation, storage, discharge and disposal of hazardous substances and waste in the ordinary course of our manufacturing operations. If we violate environmental laws or if we own or operate, or owned or operated in the past a site at which we or a predecessor company caused contamination, we may be held liable for damages and the costs of remedial actions. Although we estimate and regularly reassess our potential liability with respect to violations or alleged violations and accrue for such liability, our accruals may not be sufficient. Any increase in existing reserves or establishment of new reserves for environmental liability would reduce our net income. Our failure or inability to comply with applicable environmental laws and regulations could also limit our ability to expand facilities or could require us to acquire costly equipment or to incur other significant expenses to comply with these laws and regulations.
Partly as a result of certain of our acquisitions, we have incurred liabilities associated with environmental contamination. These liabilities include ongoing investigation and remediation activities at a number of current and former sites. The time required to perform environmental remediation can be lengthy and there can be no assurance that the scope, and therefore cost, of these activities will not increase as a result of the discovery of new contamination or contamination on adjoining landowner's properties or the adoption of more stringent regulatory standards covering sites at which we are currently performing remediation activities.
We cannot assure that past disposal activities will not result in liability that will materially affect us in the future, nor can we provide assurance that we do not have environmental exposures of which we are unaware and which could adversely affect our future operating results.
Over the years, environmental laws have become, and in the future may continue to become, more stringent, imposing greater compliance costs and increasing risks and penalties associated with violations. We operate in several environmentally sensitive locations and are subject to potentially conflicting and changing regulatory agendas of government authorities,
23
business and environmental groups. Changes in or restrictions on discharge limits, emissions levels, permitting requirements and material storage or handling could require a higher than anticipated level of remediation activities, operating expenses and capital investment or, depending on the severity of the impact of the foregoing factors, costly plant relocation, any of which would reduce our net income.
We may not be successful in implementing and integrating strategic transactions or in divesting assets or businesses, which could harm our operating results; we could become required to book a charge to earnings should we determine that goodwill and other acquired assets are impaired.
From time to time, we may undertake strategic transactions that give us the opportunity to access new customers and new end markets, increase our proprietary product offerings, obtain new manufacturing and service capabilities and technologies, enter new geographic manufacturing locations, lower our manufacturing costs and increase our margins, and to further develop existing customer relationships. Strategic transactions involve a number of risks, uncertainties and costs, including integrating acquired operations, businesses and products, resolving quality issues involving acquired products, incurring severance and other restructuring costs, diverting management attention, maintaining customer, supplier or other favorable business relationships of acquired operations and terminating unfavorable commercial arrangements, losing key employees, integrating the systems of acquired operations into our management information systems and satisfying the liabilities of acquired businesses, including liability for past violations of law and material environmental liabilities. Any of these risks could cause our strategic transactions not to be ultimately profitable.
In addition, we have in the past recorded, and may be required to record in the future, goodwill and other intangible assets in connection with our acquisitions. We evaluate, at least on an annual basis, whether events or circumstances have occurred that indicate all, or a portion, of the carrying amount of our goodwill and other intangible assets may no longer be recoverable. Should we determine in the future that our goodwill or other intangible assets have become impaired, an impairment charge to earnings would become necessary, which could be significant.
We may be unable to generate sufficient liquidity to expand our operations, which may reduce the business our customers and vendors are able to do with us; any failure to refinance our Secured Notes would adversely impact our liquidity; we could experience losses if one or more financial institutions holding our cash or other financial counterparties were to fail; repatriation of foreign cash could increase our taxes.
Our liquidity is dependent on a number of factors, including profitability, business volume, inventory requirements, the extension of trade credit by our suppliers, the degree of alignment of payment terms from our suppliers with payment terms granted to our customers, investments in facilities and equipment, acquisitions, repayments of our outstanding indebtedness, stock repurchase activity and availability under our revolving credit facility. In the event we need or desire additional liquidity to expand our business, make acquisitions or repurchase stock, there can be no assurance that such additional liquidity will be available on acceptable terms or at all. A failure to maintain adequate liquidity could cause our stock price to fall and reduce our customers' and vendors' willingness to do business with us.
Our Secured Notes due 2019 are due and payable in June 2019. We currently intend to refinance such notes on maturity. If we are unable to do so, we would be required to pay the principal amount of such notes ($375 million) in full upon the maturity date, which would have a material adverse impact on our liquidity.
A principal source of our liquidity is our cash and cash equivalents, which are held with various financial institutions. Although we distribute such funds among a number of financial institutions that we believe to be of high quality, there can be no assurance that one or more of such institutions will not become insolvent in the future, in which case all or a portion of our uninsured funds on deposit with such institutions could be lost. Similarly, if one or more counterparties to our foreign currency hedging instruments were to fail, we could suffer losses and our hedging of risk could become less effective.
Additionally, a majority of our worldwide cash reserves are generated by, and therefore held in, foreign jurisdictions. Some of these jurisdictions restrict the amount of cash that can be transferred to the U.S. or impose taxes and penalties on such transfers of cash. To the extent we have excess cash in foreign locations that could be used in, or is needed by, our U.S. operations, we may incur significant foreign taxes to repatriate these funds which would reduce the net amount ultimately available for such purposes.
24
Our credit agreements contain covenants which may adversely impact our business; the failure to comply with such covenants could cause us to be unable to borrow additional funds and cause our outstanding debt to become immediately payable.
Our revolving credit facility contains financial covenants with which we must continue to comply. In addition, our debt agreements include a number of restrictive covenants, including restrictions on incurring additional debt, making investments and other restricted payments, selling assets, paying dividends and redeeming or repurchasing capital stock and debt, subject to certain exceptions. Collectively, these covenants could constrain our ability to grow our business through acquisition or engage in other transactions. In addition, such agreements include covenants requiring, among other things, that we file quarterly and annual financial statements with the SEC, comply with all laws, pay all taxes and maintain casualty insurance. If we are not able to comply with these covenants, for any reason, some or all of our outstanding debt could become immediately due and payable and the incurrence of additional debt under our revolving credit facility would not be allowed, any of which would have a material adverse effect on our liquidity and ability to continue to conduct our business.
If we are unable to maintain our technological and manufacturing process expertise, our business could be adversely affected.
Regular improvements to and refinements of our manufacturing processes are necessary to remain competitive in the marketplace. As a result, we are continually evaluating the cost-effectiveness and feasibility of new manufacturing processes. In some cases, we must make capital expenditures and incur engineering expense in order to qualify and validate any such new process in advance of booking new business that could utilize such processes. Such investments utilize cash and reduce our margins and net income. Any failure to adequately invest in manufacturing technology could reduce our competitiveness and, potentially, our future revenue and net income.
If we manufacture or design defective products, or if our manufacturing processes do not comply with applicable statutory and regulatory requirements and standards, we could be subject to claims, damages and fines and lose customers.
We manufacture products to our customers' specifications, and in some cases our manufacturing processes and facilities need to comply with various statutory and regulatory requirements and standards. For example, many of the medical products that we manufacture, as well as the facilities and manufacturing processes that we use to produce them must comply with standards established by the U.S. Food and Drug Administration and products we manufacture for the automotive end market are generally subject to the ISO/TS 16949:2009 standard. In addition, our customers' products and the manufacturing processes that we use to produce them often are highly complex. As a result, products that we design or manufacture may at times contain design or manufacturing defects, and our manufacturing processes may be subject to errors or may not be in compliance with applicable statutory and regulatory requirements and standards. Defects in the products we design or manufacture may result in product recalls, warranty claims by customers, including liability for repair costs, delayed shipments to customers or reduced or canceled customer orders. The failure of the products that we design or manufacture or of our manufacturing processes and facilities to comply with applicable statutory and regulatory requirements and standards may subject us to legal fines or penalties, cause us to lose business and, in some cases, require us to shut down or incur considerable expense to correct a manufacturing program or facility. In addition, these defects may result in product liability claims against us. The magnitude of such claims may increase as we continue to expand our medical, automotive, defense and aerospace and oil and gas manufacturing services because defects in these types of products can result in death or significant injury to end users of these products or environmental harm. Even when our customers are contractually responsible for defects in the design of a product, we could nonetheless be named in a product liability suit over such defects and could be required to expend significant resources to defend ourselves. Additionally, insolvency of our customers may result in us being held ultimately liable for our customers’ design defects, which could significantly reduce our net income.
We are subject to risks associated with natural disasters and global events.
We conduct a significant portion of our activities, including manufacturing, administration and information technology management in areas that have experienced natural disasters, such as major earthquakes, hurricanes, floods and tsunamis. Our insurance coverage with respect to damages to our facilities or our customers' products caused by natural disasters is limited and is subject to deductibles and coverage limits and, as a result, may not be sufficient to cover all of our losses. For example, our policies have very limited coverage for damages due to earthquake. In addition, such coverage may not continue to be available at commercially reasonable rates and terms. In the event of a major earthquake or other disaster affecting one or more of our facilities, our operations and management information systems, which control our worldwide procurement, inventory management, shipping and billing activities, could be significantly disrupted. Such events could delay or prevent product manufacturing for an extended period of time. Any extended inability to continue our operations at affected facilities following such an event could reduce our revenue.
25
Changes in financial accounting standards or policies have affected, and in the future may affect, our reported financial condition or results of operations; there are inherent limitations to our system of internal controls; changes in securities laws and regulations have increased, and are likely to continue to increase, our operating costs
.
We prepare our consolidated financial statements in conformity with U.S. GAAP. Our preparation of financial statements in accordance with U.S. GAAP requires that we make estimates and assumptions that affect the recorded amounts of assets, liabilities and net income during the reporting period. A change in the facts and circumstances surrounding those estimates could result in a change to our estimates and could impact our future operating results.
These principles are subject to interpretation by the Financial Accounting Standards Board (FASB), the SEC and various bodies formed to interpret and create accounting policies. A change in those policies can have a significant effect on our reported results and may affect our reporting of transactions which are completed before a change is announced. For example, significant changes to revenue recognition rules have been enacted and will be effective for us in fiscal 2019. We could incur significant costs to implement these new rules, including costs to modify our IT systems. In addition, a new accounting standard for lease accounting has recently been finalized and will require adoption in fiscal 2020. Changes to accounting rules or challenges to our interpretation or application of the rules by regulators may have a material adverse effect on our reported financial results or on the way we conduct business.
Our system of internal and disclosure controls and procedures were designed to provide reasonable assurance of achieving their objectives. However, no evaluation of controls can provide absolute assurance that all control issues and instances of fraud, if any, within the company have been or will be detected. As a result, there can be no assurance that our system of internal and disclosure controls and procedures will be successful in preventing all errors, theft and fraud, or in informing management of all material information in a timely manner. For example, during the fourth quarter of fiscal 2018, we identified a material weakness related to the failed operation of a management review control in one of our divisions. Although we expect to remediate such material weakness in fiscal 2019, there can be no assurance that our remediation will be completed by such time.
Finally, corporate governance, public disclosure and compliance practices continue to evolve based upon continuing legislative action, SEC rulemaking and stockholder activism. As a result, the number of rules and regulations applicable to us may increase, which could also increase our legal and financial compliance costs and the amount of time management must devote to compliance activities. Increasing regulatory burdens could also make it more difficult for us to attract and retain qualified members of our Board of Directors, particularly to serve on our Audit Committee, and qualified executive officers in light of an increase in actual or perceived workload and liability for serving in such positions.
The market price of our common stock is volatile and is impacted by factors other than our financial performance.
The stock market in recent years has experienced significant price and volume fluctuations that have affected our stock price. These fluctuations have often been unrelated to our operating performance. Factors that can cause such fluctuations include announcements by our customers, competitors or other events affecting companies in the electronics industry, currency fluctuations, general market fluctuations and macroeconomic conditions, any of which may cause the market price of our common stock to fluctuate.
26
Item 1B.
Unresolved Staff Comments
None.
27
Item 2.
Properties
Facilities.
Our customers market numerous products throughout the world and therefore need to access manufacturing services on a global basis. We maintain extensive operations in lower cost locations including Latin America, Eastern Europe, China, India and Southeast Asia. To enhance our integrated manufacturing solutions offerings, we seek to locate our facilities either near our customers or their end markets in major centers for the electronics industry or, when appropriate, in lower cost locations. Many of our plants located near customers or their end markets are focused primarily on new product introduction and final system assembly and test, and plants located in lower cost areas are engaged primarily in higher volume, less complex component and subsystem manufacturing and assembly.
We continually evaluate our global manufacturing operations and adjust our facilities and operations to keep our manufacturing capacity in line with demand and our manufacturing strategy and to provide cost efficient services to our customers. Through this process, we have closed certain facilities not required to satisfy current demand levels.
As of
September 29, 2018
, the approximate square footage of our active manufacturing facilities by country was as follows:
|
|
Approximate
Square Footage
|
|
|
Argentina
|
1,335
|
|
|
Australia
|
42,334
|
|
|
Brazil
|
261,367
|
|
|
Canada
|
136,237
|
|
|
China
|
3,342,862
|
|
|
Columbia
|
2,721
|
|
|
Czech Republic
|
70,870
|
|
|
England
|
11,174
|
|
|
Finland
|
136,120
|
|
|
Germany
|
362,972
|
|
|
Hungary
|
614,788
|
|
|
India
|
353,443
|
|
|
Indonesia
|
33,131
|
|
|
Ireland
|
120,000
|
|
|
Israel
|
212,969
|
|
|
Malaysia
|
501,843
|
|
|
Mexico
|
2,694,781
|
|
|
Singapore
|
541,045
|
|
|
South Africa
|
7,083
|
|
|
Scotland
|
30,581
|
|
|
Sweden
|
102,526
|
|
|
Thailand
|
326,293
|
|
|
United States
|
2,646,650
|
|
|
Total
|
12,553,125
|
|
As of
September 29, 2018
, our active manufacturing facilities consist of
nine million
square feet in facilities that we own, with the remaining
four million
square feet in leased facilities with lease terms expiring between
2019
and
2042
.
We regularly evaluate our expected future facilities requirements and we believe our existing facilities are adequate to meet our requirements for the next 12 months.
Pursuant to the terms of the indenture governing our senior secured notes due 2019, upon prepayment of our secured debt due 2017, we granted U.S. Bank N.A., as trustee of such notes, a security interest in our real property comprising our headquarters campus in San Jose, California, which security interest was previously held by MUFG Union Bank, N.A., the lender under the secured debt.
28
Certifications and Registrations.
Certifications and registrations under industry standards are important to our business because many customers rely on them to confirm our adherence to manufacturing process and quality standards. Certain markets, such as telecommunications, medical, defense, aerospace, automotive and oil and gas, require adherence to industry-specific standards. Substantially all of our manufacturing facilities are registered under ISO 9001:2015, a standard published by the International Organization for Standardization. As part of the ISO 9001:2015 certification process, we have a highly developed quality management system and continually improve its effectiveness in accordance with its requirements. We use this registration to demonstrate our ability to consistently provide product that meets customer and applicable regulatory requirements and enhance customer satisfaction through its effective application. ISO 9001:2015 registration is of particular importance to our customers throughout the world.
In addition to ISO 9001:2015, most of our facilities are TL 9000 6.0 registered. The TL 9000 quality system requirements and quality system metrics are designed specifically for the telecommunications industry to promote consistency and efficiency, reduce redundancy and improve customer satisfaction. Included in the TL 9000 system are performance-based metrics that quantify reliability and quality performance of the product. The majority of our facilities are also compliant with the standards set by Underwriters Laboratories (UL). These standards define requirements for quality, manufacturing process control and manufacturing documentation and are required by many OEMs in the communications sector of the electronics industry.
Our medical systems division has identified certain manufacturing facilities to be centers of excellence for medical products manufacturing. These facilities are ISO 13485:2016 certified and, where appropriate, FDA registered. All such facilities are fully compliant with the FDA's quality systems regulations.
Our defense and aerospace operations are headquartered in Huntsville, Alabama and are housed in a facility dedicated to meeting the specialized needs of our defense and aerospace customers. This defense and aerospace operation is AS9100 2016 Rev D registered and is also certified under various U.S. military specifications as well as under ANSI and other standards appropriate for defense and aerospace suppliers. Other selected operations around the world are also AS9100 2016 Rev D registered.
Our automotive facilities are strategically located worldwide. Substantially all of our automotive facilities are certified to
IATF16949:2016
, the automotive industry standard.
Our oil and gas related manufacturing operations are, as applicable, certified to American Petroleum Institute (API) requirements.
Item 3.
Legal Proceedings
Two of our subsidiaries, Sanmina-SCI do Brasil Technology Ltda. and Sanmina do Brasil Integration Ltda., are currently parties to nine administrative and judicial proceedings in the Federal Revenue Service of Brazil, the Chamber of Appeals of Administrative Court of Brazil, and the Higher Federal Court of Brazil. The cases were brought against the subsidiaries at various times between November 2006 and May 2013 by the Brazilian Federal Revenue Service. The claims allege that these subsidiaries failed to comply with certain bookkeeping and tax rules for certain periods between 2001 and 2011. The claims seek payment by the subsidiaries of social fund contributions and income and excise taxes allegedly owed by the subsidiaries, as well as fines. The subsidiaries made counterclaims against the Federal Revenue Service seeking recovery of certain income taxes and social fund contributions which they believe they overpaid. The administrative agencies and the court reached decisions in the cases against the subsidiaries between March 2007 and April 2014, all of which were appealed. Beginning in the second quarter of 2014 and continuing through the fourth quarter of 2017, the administrative agencies and court ruled on several of the subsidiaries' appeals, finding partially in favor of the subsidiaries in some cases and against them in others. In addition, one of the counterclaims against the Federal Revenue Service was dismissed in December 2017. The subsidiaries continue to appeal the remaining adverse determinations in the administrative proceedings and continue to pursue the remaining counterclaim against the Federal Revenue Service. The subsidiaries believe they have meritorious positions in these remaining matters.
On June 23, 2008, the Orange County Water District filed suit against us and 17 other defendants in California Superior Court for Orange County alleging that the defendants' actions had polluted groundwater managed by the plaintiff. The complaint sought recovery of compensatory and other damages, as well as declaratory relief, for the payment of costs necessary to investigate, monitor, remediate, abate and contain contamination of groundwater within the plaintiff's control. We disputed the plaintiff's claims and asserted various defenses. In April 2013, the Superior Court ruled in favor of our motion for summary adjudication dismissing all claims against us in the suit. In July 2013, the Superior Court entered judgment in our favor and in
29
August 2013 the plaintiff appealed this judgment. The Court of Appeal heard the appeal in July 2017 and reversed the judgment in August 2017. In November 2017, the California Supreme Court denied our petition to review this decision and in December 2017 the Court of Appeal remanded the case back to the Superior Court for further proceedings
.
A trial date has not yet been set. We intend to contest the plaintiff’s claims vigorously.
On September 7, 2011, one of our Canadian subsidiaries became party to an order from the Ontario Ministry of Environment (now, the Ontario Ministry of the Environment Conservation and Parks, the “MOE”) requiring such subsidiary to remediate certain environmental contamination at a site owned and operated by the subsidiary between 1999 and 2006. Remediation activities had been performed at such site from 1990 to 2011 by the site's former owner which, along with the site’s current owner, are also parties to and bound by the order. In July 2013, our subsidiary submitted a conceptual remedial action plan to the MOE with respect to the site outlining proposed investigation and remediation activities, which was revised following consultations with and additional submissions to the MOE. In July 2015, the MOE formally confirmed that a risk-based approach to further investigation and remediation at the site would be acceptable to the MOE and our subsidiary continues to provide
submissions to the MOE to specify the actions it would take using this approach. In May 2017, the MOE approved our risk pathway scoping document and other features of our planned approach for the site. In November 2018, the 2011 order was revoked and replaced with a new order. The new order memorializes the risk-based approach accepted by the MOE and requires that certain risk management measures be implemented. Although we believe our remedial action plan is reasonable, there can be no assurance that the plan will not be required to be modified in the future, which could increase the remediation and risk management costs, perhaps significantly.
In addition, from time to time, we may be involved in routine legal proceedings, as well as demands, claims and threatened litigation that arise in the normal course of our business. The ultimate outcome of any litigation is uncertain and unfavorable outcomes could have a negative impact on our results of operations and financial condition. Regardless of outcome, litigation can have an adverse impact on us as a result of incurrence of defense costs, diversion of management resources and other factors. We record liabilities for legal proceedings when a loss becomes probable and the amount of loss can be reasonably estimated.
See also Note 8 of Notes to Consolidated Financial Statements.
Item 4.
Mine Safety Disclosures.
Not applicable.
30
Item 5.
Market for Registrant's Common Equity, Related Stockholder Matters and Issuer Purchases of Equity Securities.
Market Information
Our common stock is traded on the Nasdaq Global Select Market under the symbol SANM. As of
November 12, 2018
, we had approximately 993 holders of record of our common stock.
The following graph compares the cumulative 5-year total stockholder return on our common stock relative to the cumulative total returns of the S&P 500 index and the NASDAQ Electronic Components index. An investment of $100 (with reinvestment of all dividends) is assumed to have been made in our common stock on
September 28, 2013
and in each of such indices at month end starting on September 29, 2013 and its relative performance is tracked through
September 29, 2018
.
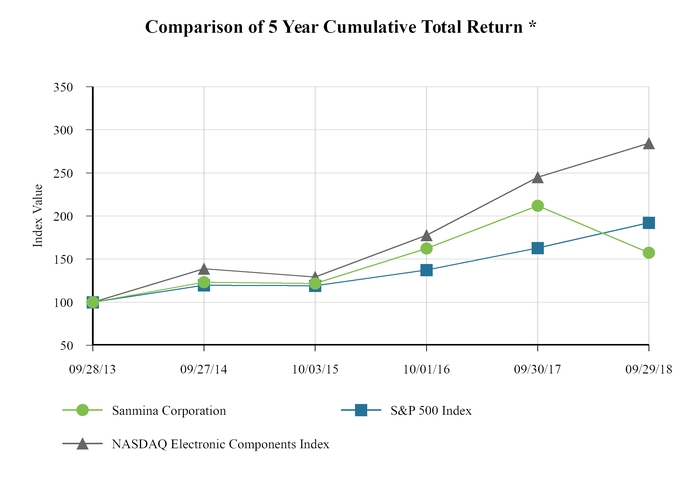
* $100 invested on 9/28/2013, including reinvestment of dividends. Indexes calculated on a month-end basis.
Copyright @ 2016 S&P, a division of The McGraw-Hill Companies Inc. All rights reserved.
|
9/28/2013
|
9/27/2014
|
10/3/2015
|
10/1/2016
|
9/30/2017
|
9/29/2018
|
|||||||||||||
|
Sanmina Corporation
|
100.00
|
|
123.15
|
|
121.84
|
|
162.31
|
|
211.80
|
|
157.35
|
|
||||||
|
S&P 500
|
100.00
|
|
119.73
|
|
119.00
|
|
137.36
|
|
162.92
|
|
192.10
|
|
||||||
|
NASDAQ Electronic Components
|
100.00
|
|
138.93
|
|
129.20
|
|
177.68
|
|
244.93
|
|
284.33
|
|
||||||
Sanmina's stock price performance included in this graph is not necessarily indicative of future stock price performance.
31
Stock Repurchases
In September 2017, our Board of Directors authorized us to repurchase up to $200 million of our common stock in the open market or in negotiated transactions off the market. The program has no expiration date.
The table below sets forth information regarding repurchases of our common stock during the fourth quarter of
2018
.
|
Period (1)
|
TOTAL NUMBER OF SHARES PURCHASED
|
AVERAGE PRICE PAID PER SHARE
(2)
|
TOTAL NUMBER OF SHARES PURCHASED AS PART OF PUBLICLY ANNOUNCED PROGRAMS
|
MAXIMUM DOLLAR VALUE OF SHARES THAT MAY YET BE PURCHASED UNDER THE PROGRAMS
(2)
|
|||||||||||
|
Beginning amount available
|
$
|
115,084,716
|
|
||||||||||||
|
Month #1
|
|||||||||||||||
|
July 1, 2018 through July 28, 2018
|
37,500
|
|
$
|
29.73
|
|
37,500
|
|
$
|
113,969,732
|
|
|||||
|
Month #2
|
|||||||||||||||
|
July 29, 2018 through August 25, 2018
|
139,810
|
|
$
|
29.68
|
|
139,810
|
|
$
|
109,819,872
|
|
|||||
|
Month #3
|
|||||||||||||||
|
August 26, 2018 through September 29, 2018
|
66,911
|
|
$
|
29.84
|
|
66,911
|
|
$
|
107,823,225
|
|
|||||
|
Total
|
244,221
|
|
$
|
29.73
|
|
244,221
|
|
$
|
107,823,225
|
|
|||||
(1) All months shown are our fiscal months.
(2) Amounts do not include commissions paid on shares repurchased.
Our debt agreements contain a number of restrictive covenants, including restrictions on paying dividends and on the amount of our stock we may repurchase, which may cause us not to be able to repurchase the entire amount approved by the Board.
During
2018
, we repurchased an aggregate of
5.0 million
shares of our common stock for
$145 million
, an average price per share of $29.03 (excluding commissions).
32
Item 6.
Selected Financial Data
The following selected financial data should be read in conjunction with “Item 7-Management's Discussion and Analysis of Financial Condition and Results of Operations” and “Item 8-Financial Statements and Supplementary Data,” included elsewhere in this Form 10-K.
FIVE YEAR SELECTED FINANCIAL HIGHLIGHTS
|
|
Year Ended
|
||||||||||||||||||
|
|
September 29, 2018
|
September 30, 2017
|
October 1, 2016
|
October 3, 2015
|
September 27, 2014
|
||||||||||||||
|
|
(In thousands, except per share data)
|
||||||||||||||||||
|
Net sales
|
$
|
7,110,130
|
|
$
|
6,868,619
|
|
$
|
6,481,181
|
|
$
|
6,374,541
|
|
$
|
6,215,106
|
|
||||
|
Operating income
|
119,441
|
|
226,467
|
|
224,785
|
|
203,101
|
|
199,682
|
|
|||||||||
|
Income from continuing operations before income taxes
|
97,539
|
|
213,480
|
|
204,617
|
|
176,193
|
|
161,739
|
|
|||||||||
|
Provision for (benefit from) income taxes (1)
|
193,072
|
|
74,647
|
|
16,779
|
|
(201,068
|
)
|
(35,426
|
)
|
|||||||||
|
Net income (loss)
|
$
|
(95,533
|
)
|
$
|
138,833
|
|
$
|
187,838
|
|
$
|
377,261
|
|
$
|
197,165
|
|
||||
|
Net income (loss) per share:
|
|
|
|
|
|
|
|
|
|
|
|||||||||
|
Basic
|
$
|
(1.37
|
)
|
$
|
1.86
|
|
$
|
2.50
|
|
$
|
4.61
|
|
$
|
2.38
|
|
||||
|
Diluted
|
$
|
(1.37
|
)
|
$
|
1.78
|
|
$
|
2.38
|
|
$
|
4.41
|
|
$
|
2.27
|
|
||||
|
Shares used in computing per share amounts:
|
|||||||||||||||||||
|
Basic
|
69,833
|
|
74,481
|
|
75,094
|
|
81,818
|
|
82,872
|
|
|||||||||
|
Diluted
|
69,833
|
|
78,128
|
|
78,787
|
|
85,641
|
|
86,731
|
|
|||||||||
(1) We released $96.2 million, $288.7 million and $87.6 million of valuation allowance attributable to certain U.S. and foreign deferred tax assets in 2016, 2015 and 2014, respectively, upon our conclusion that it was more likely than not that we would be able to realize the benefit of a portion of our deferred tax assets in the future. The increase in income tax expense in 2018 was primarily attributable to $161 million of income tax expense resulting from the U.S. Tax Cuts and Jobs Act.
|
|
As of
|
||||||||||||||||||
|
|
September 29, 2018
|
September 30, 2017
|
October 1, 2016
|
October 3, 2015
|
September 27, 2014
|
||||||||||||||
|
|
(In thousands)
|
||||||||||||||||||
|
Cash and cash equivalents
|
$
|
419,528
|
|
$
|
406,661
|
|
$
|
398,288
|
|
$
|
412,253
|
|
$
|
466,607
|
|
||||
|
Net working capital (1)
|
$
|
612,532
|
|
$
|
1,000,207
|
|
$
|
974,389
|
|
$
|
942,423
|
|
$
|
916,837
|
|
||||
|
Total assets
|
$
|
4,085,133
|
|
$
|
3,847,363
|
|
$
|
3,625,222
|
|
$
|
3,493,264
|
|
$
|
3,313,089
|
|
||||
|
Long-term debt (excluding current portion)
|
$
|
14,346
|
|
$
|
391,447
|
|
$
|
434,059
|
|
$
|
423,949
|
|
$
|
386,681
|
|
||||
|
Stockholders' equity
|
$
|
1,472,844
|
|
$
|
1,647,684
|
|
$
|
1,609,803
|
|
$
|
1,520,471
|
|
$
|
1,246,755
|
|
||||
(1) The reduction in net working capital from 2017 to 2018 resulted primarily from the reclassification of our Secured Notes due in 2019 from long-term debt to current debt. We are currently in the process of refinancing these notes and expect to complete this refinancing upon maturity of the notes.
33
Item 7.
Management's Discussion and Analysis of Financial Condition and Results of Operations
This report contains forward-looking statements within the meaning of Section 27A of the Securities Act of 1933 and Section 21E of the Securities Exchange Act of 1934. These statements relate to our expectations for future events and time periods. All statements other than statements of historical fact are statements that could be deemed to be forward-looking statements, including any statements regarding trends in future revenue or results of operations, gross margin, operating margin, expenses, earnings or losses from operations, cash flow, synergies or other financial items; any statements of the plans, strategies and objectives of management for future operations and the anticipated benefits of such plans, strategies and objectives; any statements regarding future economic conditions or performance; any statements regarding pending investigations, claims or disputes; any statements regarding the financial impact of customer bankruptcies; any statements regarding the timing of closing of, future cash outlays for, and benefits of completed, pending or anticipated acquisitions; any statements regarding expected restructuring costs; any statements concerning our expectation of satisfying the liquidity conditions in our revolving credit facility; any statements concerning our plans to refinance our Secured 2019 due Notes; any statements concerning the adequacy of our current liquidity and the availability of additional sources of liquidity; any statements regarding the amount of future potential tariffs we may be subject to; our expectations for and timing of remediation of the material weakness identified in the fourth quarter; any statements of expectation or belief; and any statements of assumptions underlying any of the foregoing. Generally, the words “anticipate,” “believe,” “plan,” “expect,” “future,” “intend,” “may,” “will,” “should,” “estimate,” “predict,” “potential,” “continue” and similar expressions identify forward-looking statements. Our forward-looking statements are based on current expectations, forecasts and assumptions and are subject to risks and uncertainties, including those contained in Part I, Item 1A of this report. As a result, actual results could vary materially from those suggested by the forward looking statements. We undertake no obligation to publicly disclose any revisions to these forward-looking statements to reflect events or circumstances occurring subsequent to filing this report with the Securities and Exchange Commission.
Overview
We are a leading global provider of integrated manufacturing solutions, components, products and repair, logistics and after-market services. Our revenue is generated from sales of our products and services primarily to original equipment manufacturers (OEMs) that serve the industrial, medical, defense and aerospace, automotive, communications networks and cloud solutions industries.
Our operations are managed as two businesses:
1) Integrated Manufacturing Solutions (IMS). Our IMS segment consists of printed circuit board assembly and test, final system assembly and test, and direct-order-fulfillment.
2) Components, Products and Services (CPS). Components include interconnect systems (printed circuit board fabrication, backplane, cable assemblies and plastic injection molding) and mechanical systems (enclosures and precision machining). Products include memory, RF, optical and microelectronic, and enterprise solutions from our Viking Technology division; defense and aerospace products from SCI Technology; and cloud-based manufacturing execution software from our 42Q division. Services include design, engineering, logistics and repair services.
Our only reportable segment for financial reporting purposes is IMS, which represented approximately
80%
of our total revenue in
2018
. Our CPS business consists of multiple operating segments which do not meet the quantitative thresholds for being presented as reportable segments. Therefore, financial information for these operating segments is presented in a single category entitled “Components, Products and Services”.
All references in this section to years refer to our fiscal years ending on the last Saturday of each year closest to September 30th. Fiscal
2018
,
2017
and
2016
were each 52 weeks.
Our strategy is to leverage our comprehensive product and service offerings, advanced technologies and global capabilities to further penetrate diverse end markets that we believe offer significant growth opportunities and have complex products that require higher value-added services. We believe this strategy differentiates us from our competitors and will help drive more sustainable revenue growth and provide opportunities for us to ultimately achieve operating margins that exceed industry standards.
There are many challenges to successfully executing our strategy. For example, we compete with a number of companies in each of our key end markets. This includes companies that are much larger than we are and smaller companies
34
that focus on a particular niche. Although we believe we are well-positioned in each of our key end markets and seek to differentiate ourselves from our competitors, competition remains intense and profitably growing our revenues has been challenging. For example, revenue in our IMS business was negatively impacted in 2018 by parts shortages and delays in new program ramps caused by customer design changes, yield issues and other factors. These factors, together with unfavorable program mix, under absorption of labor and overhead costs, and high fixed costs associated with new program ramps caused gross margins for our IMS business to decline from 7.2% in 2017 to 6.0% in 2018. Additionally, gross margins for our CPS business decreased from 8.9% in 2017 to 8.1% in 2018 and continue to be well below our expectations for this business. We continue to address these challenges on both a short-term and long-term basis. However, we expect the supply constrained environment to continue through at least the first half of calendar 2019.
A small number of customers have historically generated a significant portion of our net sales. Sales to our ten largest customers typically represent approximately 50% of our net sales. A single customer represented 10% or more of our net sales in 2018 and 2016 and
two
customers each represented 10% or more of our net sales in 2017.
We typically generate about 80% of our net sales from products manufactured in our foreign operations. The concentration of foreign operations has resulted primarily from a desire on the part of many of our customers to manufacture in lower cost locations in regions such as Asia, Latin America and Eastern Europe.
Historically, we have had substantial recurring sales to existing customers. We typically enter into supply agreements with our major OEM customers. These agreements generally have terms ranging from three to five years and cover the manufacture of a range of products. Under these agreements, a customer typically agrees to purchase its requirements for specific products in particular geographic areas from us. However, these agreements generally do not obligate the customer to purchase minimum quantities of products, which can have the effect of reducing revenue and profitability. In addition, some customer contracts contain cost reduction objectives, which can have the effect of reducing revenue from such customers.
Both the U.S. and China have recently imposed tariffs impacting certain products imported into such countries. Although our customers are generally liable to us for reimbursement of tariffs we pay on components imported for the manufacture of their products, there can be no assurance that we will be successful in recovering all of the tariffs that are owed to us. Unrecovered tariffs paid on behalf of our customers reduce our gross margins. We do not expect the net impact of tariffs, after recovery from customers, to be material. Also, although we are required to pay tariffs upon importation of the components, we may not recover these amounts from customers until some time later, which adversely impacts our operating cash flow in a given period.
35
Critical Accounting Policies and Estimates
Management's discussion and analysis of our financial condition and results of operations are based upon our consolidated financial statements which have been prepared in accordance with accounting principles generally accepted in the United States. We review the accounting policies used in reporting our financial results on a regular basis. The preparation of these financial statements requires us to make estimates and judgments that affect the reported amounts of assets, liabilities, net sales and expenses and related disclosure of contingent liabilities. On an ongoing basis, we evaluate the process used to develop estimates for certain reserves and contingent liabilities, including those related to product returns, accounts receivable, inventories, income taxes, warranty obligations, environmental matters, contingencies and litigation. We base our estimates on historical experience and various other assumptions that we believe are reasonable for making judgments about the carrying value of assets and liabilities that are not readily apparent from other sources. Our actual results may differ materially from these estimates.
We believe the following critical accounting policies reflect the more significant judgments and estimates used by us in preparing our consolidated financial statements:
Accounts Receivable and Other Related Allowances—
We estimate uncollectible accounts, product returns and other adjustments related to current period net sales to establish valuation allowances. In making these estimates, we analyze the creditworthiness of our customers, past experience, specific facts and circumstances, and the overall economic climate in the industries we serve. If actual uncollectible accounts, product returns or other adjustments differ significantly from our estimates, the amount of sales or operating expenses we report could be affected. The ultimate realization of our accounts receivable is a significant credit risk. This risk is mitigated by (i) making a significant portion of sales to financially sound companies, (ii) ongoing credit evaluation of our customers, (iii) frequent contact with our customers, especially our most significant customers, which enables us to monitor changes in their business operations and to respond accordingly and (iv) obtaining, in certain cases, a guaranty from a customer's parent entity when our customer is not the ultimate parent entity or a letter of credit from the customer's bank. To establish our allowance for doubtful accounts, we evaluate credit risk related to specific customers based on their financial condition and the current economic environment; however, we are not able to predict with absolute certainty whether our customers will become unable to meet their financial obligations to us. We believe the allowances we have established are adequate under the circumstances; however, a change in the economic environment or a customer's financial condition could cause our estimates of allowances, and consequently the provision for doubtful accounts, to change, which could have a significant adverse impact on our financial position and/or results of operations. Our allowance for product returns and other adjustments is primarily established using historical data.
Inventories—
We state inventories at the lower of cost (first-in, first-out method) and net realizable value. Cost includes raw materials, labor and manufacturing overhead. We regularly evaluate the carrying value of our inventories and make provisions to reduce excess and obsolete inventories to their estimated net realizable values. The ultimate realization of inventory carrying amounts is affected by changes in customer demand for inventory that customers are not contractually obligated to purchase and inventory held for specific customers who are experiencing financial difficulties. Inventory write-downs are recorded based on forecasted demand, past experience with specific customers, the ability to redistribute inventory to other programs or return inventories to our suppliers, and whether customers are contractually obligated and have the ability to pay for the related inventory. Certain payments received from customers for inventories that have not been shipped to customers or otherwise disposed of are netted against inventory.
We generally procure inventory based on specific customer orders and forecasts. Customers generally have limited rights of modification (for example, rescheduling or cancellations) with respect to specific orders. Customer modifications of orders affecting inventory previously procured by us and our purchases of inventory beyond customer needs may result in excess and obsolete inventory. Although we may be able to use some excess inventory for other products we manufacture, a portion of this excess inventory may not be returnable to the vendors or recoverable from customers. Write-offs or write-downs of inventory could be caused by:
|
•
|
changes in customer demand for inventory, such as cancellation of orders, and our purchases of inventory beyond customer needs that result in excess quantities on hand that we are not able to return to the vendor, use to fulfill orders from other customers or charge back to the customer;
|
|
•
|
financial difficulties experienced by specific customers for whom we hold inventory; and
|
|
•
|
declines in the market value of inventory.
|
Long-lived Assets
—We review property, plant and equipment and intangible assets subject to amortization for impairment whenever events or changes in circumstances indicate that the carrying amount of an asset or asset group may not
36
be recoverable. An asset group is the unit of accounting that represents the lowest level for which identifiable cash flows are largely independent of the cash flows of other groups of assets. An asset or asset group is considered impaired if its carrying amount exceeds the undiscounted future net cash flows the asset or asset group is expected to generate. If an asset or asset group is considered impaired, the impairment to be recognized is measured by the amount by which the carrying amount of the asset or asset group exceeds its fair value. For asset groups for which a building is the primary asset, we estimate fair value primarily based on data provided by commercial real estate brokers. For other assets, we estimate fair value based on projected discounted future net cash flows, which requires significant judgment.
Goodwill—
We test goodwill for impairment on an annual basis and whenever events or changes in circumstances indicate that the carrying amount of goodwill may not be recoverable, as assessed at a reporting unit level. If, based on a qualitative assessment, we determine it is more-likely-than-not that goodwill is impaired, we perform a quantitative assessment to determine whether the fair value of our reporting unit is less than its carrying value and, if so, we perform a further analysis to determine the amount, if any, of the impairment. As a result of our impairment analysis in 2018, we concluded that the fair value of one of our CPS operating segments was below its carrying value, resulting in an impairment charge of
$31 million
.
Income Taxes—
We estimate our income tax provision or benefit in each of the jurisdictions in which we operate, including estimating exposures related to examinations by taxing authorities. We believe our accruals for tax liabilities are adequate for all open years based on our assessment of many factors, including past experience and interpretations of tax law applied to the facts of each matter. Although we believe our accruals for tax liabilities are adequate, tax regulations are subject to interpretation and the tax controversy process is inherently lengthy and uncertain; therefore, our assessments can involve a series of complex judgments about future events and rely heavily on estimates and assumptions. To the extent the probable tax outcome of these matters changes, such changes in estimate will impact our income tax provision in the period in which such determination is made. We only recognize or continue to recognize tax positions that meet a “more likely than not” threshold of being upheld. Interest and penalties related to unrecognized tax benefits are recognized as a component of income tax expense.
We must also make judgments regarding the realizability of deferred tax assets. The carrying value of our net deferred tax assets is based on our belief that it is more likely than not that we will generate sufficient future taxable income in certain jurisdictions to realize these deferred tax assets. We evaluate positive and negative evidence each reporting period when assessing the need for a valuation allowance. A valuation allowance is established for deferred tax assets if we believe realization of such assets is not more likely than not. Our judgments regarding future taxable income may change due to changes in market conditions, new or modified tax laws, tax planning strategies or other factors. If our assumptions, and consequently our estimates, change in the future, the valuation allowances we have established may be increased or decreased, resulting in a respective increase or decrease in income tax expense.
As a result of our analysis of the positive and negative evidence available at the end of 2016, we released
$96 million
of our valuation allowances against our U.S. and foreign deferred tax assets. We based this conclusion on continued improved operating results in recent prior years and our expectations about generating taxable income in future periods. We exercised significant judgment and utilized estimates about our ability to generate revenue, gross profit, operating income and jurisdictional taxable income in future periods before expiration of our net operating losses. We will continue to evaluate all positive and negative evidence in future periods to determine if an adjustment to our valuation allowances is necessary. However, as of September 29, 2018 and September 30, 2017, we no longer had a valuation allowance against our U.S. federal deferred tax assets.
Our effective tax rate is highly dependent upon the amount and geographic distribution of our worldwide income or losses, the tax regulations, rates and holidays in each geographic region, the utilization of net operating losses, the availability of tax credits and carryforwards, and the effectiveness of our tax planning strategies.
37
Results of Operations
Years Ended
September 29, 2018
,
September 30, 2017
and
October 1, 2016
.
The following table presents our key operating results.
|
Year Ended
|
|||||||||||
|
September 29,
2018 |
September 30,
2017 |
October 1,
2016 |
|||||||||
|
(In thousands)
|
|||||||||||
|
Net sales
|
$
|
7,110,130
|
|
$
|
6,868,619
|
|
$
|
6,481,181
|
|
||
|
Gross profit
|
$
|
463,783
|
|
$
|
519,911
|
|
$
|
514,282
|
|
||
|
Gross margin
|
6.5
|
%
|
7.6
|
%
|
7.9
|
%
|
|||||
|
Operating expenses
|
$
|
344,342
|
|
$
|
293,444
|
|
$
|
289,497
|
|
||
|
Operating income
|
$
|
119,441
|
|
$
|
226,467
|
|
$
|
224,785
|
|
||
|
Operating margin
|
1.7
|
%
|
3.3
|
%
|
3.5
|
%
|
|||||
|
Net income (loss) (1)
|
$
|
(95,533
|
)
|
$
|
138,833
|
|
$
|
187,838
|
|
||
|
(1)
|
Our net loss in 2018 includes the impact of the Tax Act, which increased income tax expense by approximately $161 million.
|
Net Sales
Net sales increased from
$6.9 billion
for
2017
to
$7.1 billion
for
2018
, an increase of
3.5%
. Net sales increased from
$6.5 billion
for
2016
to
$6.9 billion
for
2017
, an increase of
6.0%
. Sales by end market were as follows:
|
Year Ended
|
2018 vs. 2017
|
2017 vs. 2016
|
|||||||||||||||||||||||
|
September 29, 2018
|
September 30, 2017
|
October 1, 2016
|
Increase/(Decrease)
|
Increase/(Decrease)
|
|||||||||||||||||||||
|
(Dollars in thousands)
|
|||||||||||||||||||||||||
|
Communications Networks
|
$
|
2,684,609
|
|
$
|
2,650,850
|
|
$
|
2,413,661
|
|
$
|
33,759
|
|
1.3
|
%
|
$
|
237,189
|
|
9.8
|
%
|
||||||
|
Industrial, Medical, Defense and Automotive
|
3,681,788
|
|
3,396,130
|
|
3,101,505
|
|
285,658
|
|
8.4
|
%
|
294,625
|
|
9.5
|
%
|
|||||||||||
|
Cloud Solutions
|
743,733
|
|
821,639
|
|
966,015
|
|
(77,906
|
)
|
(9.5
|
)%
|
(144,376
|
)
|
(14.9
|
)%
|
|||||||||||
|
Total
|
$
|
7,110,130
|
|
$
|
6,868,619
|
|
$
|
6,481,181
|
|
$
|
241,511
|
|
3.5
|
%
|
$
|
387,438
|
|
6.0
|
%
|
||||||
Comparison of 2018 to 2017
In 2018, sales to customers in our industrial, medical, defense, and automotive end market increased 8.4%, primarily as a result of increased demand and new program wins for medical products, certain programs ramping up for automotive products, partially offset by decreased demand for industrial products. Sales to customers in our communications networks end market increased 1.3%, primarily as a result of new program wins and increased demand for existing wireless products. Sales to customers in our cloud solutions end market decreased 9.5%, primarily due to reduced demand from a storage customer.
Comparison of 2017 to 2016
In 2017, sales to customers in our industrial, medical, defense, and automotive end market increased 9.5%, primarily as a result of a customer program acquisition in February 2016. Sales to customers in our communications networks end market increased 9.8%, primarily as a result of program ramps with existing customers as well as increased demand from existing customers. Sales to customers in our cloud solutions end market decreased 14.9%, primarily due to decreased end-market demand for our customers' point-of-sale equipment and set-top boxes.
38
Gross Margin
Gross margin was
6.5%
,
7.6%
and
7.9%
in
2018
,
2017
and
2016
, respectively. The decrease in gross margin from 2017 to 2018 was primarily due to a decline in our IMS gross margin, partially offset by a $4.8 million credit associated with a reduction in an accrual for contingent consideration related to an acquisition completed in a previous period. The contingent consideration accrual reversal is not allocated to our operating segments. IMS gross margin decreased from 7.2% in 2017 to 6.0% in 2018 due primarily to under absorption of labor and overhead costs caused by lower revenue than anticipated due to parts shortages,
high fixed costs and yield issues associated with new program ramp-ups, and unfavorable program mix. CPS gross margin decreased to 8.1% in 2018 from 8.9% in 2017 primarily due to increased inventory adjustments in our products group.
The decrease in gross margin from 2016 to 2017 was primarily attributable to a decrease in our IMS gross margin from 7.5% in 2016 to 7.2% in 2017. This decrease was caused by an unfavorable change in customer mix in 2017 and under absorption of overhead due to supply constraints, design changes and low yields associated with new program ramps in 2017. Also contributing to the decrease in 2017 was a $7.6 million reduction of an accrual for contingent consideration in 2016 relating to an oil and gas acquisition in 2015. The adjustment for contingent consideration was not allocated to our operating segments. Our CPS gross margin remained flat at 8.9% in 2017.
We have experienced fluctuations in gross margin in the past and may continue to do so in the future. Fluctuations in our gross margin may be caused by a number of factors, including:
|
•
|
changes in customer demand and sales volumes for our vertically integrated system components and subassemblies, including customer program ramps which can result in margin degradation if there are delays or other inefficiencies;
|
|
•
|
changes in the overall volume of our business, which affect the level of capacity utilization;
|
|
•
|
changes in the mix of high and low margin products demanded by our customers;
|
|
•
|
parts shortages and operational disruptions caused by natural disasters;
|
|
•
|
greater competition in the EMS industry and pricing pressures from OEMs due to greater focus on cost reduction;
|
|
•
|
provisions for excess and obsolete inventory, including those associated with distressed customers;
|
|
•
|
levels of operational efficiency;
|
|
•
|
wage inflation and rising materials costs; and
|
|
•
|
our ability to transition manufacturing and assembly operations to lower cost regions in an efficient manner.
|
Selling, General and Administrative
Selling, general and administrative expenses were
$250.9 million
,
$251.6 million
and
$244.6 million
in
2018
,
2017
and
2016
, respectively. As a percentage of net sales, selling, general and administrative expenses were
3.5%
,
3.7%
and
3.8%
for
2018
,
2017
and
2016
, respectively. The decrease in 2018 as a percentage of sales was due to lower incentive compensation, higher revenue and operating leverage from containing such expenses.
The increase in absolute dollars from 2016 to 2017 was primarily due to higher incentive compensation expense as a result of incremental expense for certain performance-based stock awards that, in 2017, were deemed probable of achievement, partially offset by lower bad debt expense.
Research and Development
Research and development expenses were
$30.8 million
,
$33.7 million
and
$37.7 million
in
2018
,
2017
and
2016
, respectively. As a percentage of net sales, research and development expenses were
0.4%
,
0.5%
and
0.6%
in
2018
,
2017
and
2016
, respectively. The decrease in absolute dollars from 2017 to 2018 and from 2016 to 2017 was primarily due to lower spending on projects in our cloud solutions end market.
Restructuring
Restructuring costs were
$29.1 million
,
$1.3 million
and
$2.7 million
in
2018
,
2017
and
2016
, respectively.
39
In the first quarter of 2018, we began implementing restructuring actions to address the closure and/or relocation of three of our manufacturing facilities. In addition, we are still in the process of completing restructuring actions under other plans.
The following table is a summary of restructuring costs associated with these plans:
|
Estimated Costs to Implement
|
Year ended September 29, 2018
|
||||||
|
Q1 FY18 Plan:
|
(In thousands)
|
||||||
|
Severance costs (approximately 2,900 employees)
|
$
|
27,700
|
|
$
|
26,425
|
|
|
|
Other exit costs (recognized as incurred)
|
7,300
|
|
4,984
|
|
|||
|
Total
|
35,000
|
|
31,409
|
|
|||
|
Severance reimbursement
|
(10,000
|
)
|
(10,000
|
)
|
|||
|
Total - Q1 FY18 Plan
|
$
|
25,000
|
|
21,409
|
|
||
|
Other plans
|
7,737
|
|
|||||
|
Total - all plans
|
$
|
29,146
|
|
||||
Q1 FY18 Plan
Actions under the Q1 FY18 plan began in the first quarter of 2018 and are expected to occur through calendar 2019. Cash payments of severance and other costs began in the second quarter of 2018 and are expected to occur through the end of calendar 2019. In connection with this plan, we entered into a contractual agreement with a third party pursuant to which up to
$10.0 million
of severance and retention costs incurred by us will be reimbursed. We recorded this amount as a reduction of restructuring costs in the second quarter of 2018 and, as of
September 29, 2018
,
$7.9 million
was included in accounts receivable on the consolidated balance sheets. Costs incurred for other exit costs consist primarily of costs to maintain vacant facilities that are owned and contract termination costs.
Other plans
Costs incurred in connection with other plans include severance costs of
$3.2 million
and other exit costs of
$4.5 million
, consisting primarily of a change in estimate for a certain environmental remediation matter and asset impairment charges.
All Plans
Of the
$29.1 million
of restructuring costs recorded during the year ended September 29, 2018,
$12.2 million
is attributable to our IMS segment and
$16.9 million
is attributable to our CPS segment. As of September 29, 2018,
$24.2 million
of restructuring costs (exclusive of environmental remediation liabilities) have been accrued and recorded in accrued liabilities on the consolidated balance sheets.
In addition to costs expected to be incurred under the Q1 FY18 plan, we expect to incur restructuring costs in future periods primarily for vacant facilities and former sites for which we are or may be responsible for environmental remediation.
Goodwill Impairment
During our 2018 annual goodwill impairment analysis, we concluded that the fair value of one of our CPS operating segments was below its carrying value, resulting in an impairment charge of
$30.6 million
. The fair value of the reporting unit was estimated based on the present value of future discounted cash flows. We had no such charges in 2017 or 2016.
40
Other
Other operating expenses consisted of the following:
|
Year Ended
|
|||||||||||
|
September 29,
2018 |
September 30,
2017 |
October 1,
2016 |
|||||||||
|
(In thousands, except per share amounts)
|
|||||||||||
|
Amortization of intangible assets
|
$
|
2,908
|
|
$
|
3,672
|
|
$
|
3,446
|
|
||
|
Asset impairments
|
—
|
|
4,600
|
|
1,000
|
|
|||||
|
Gain on sale of long-lived assets
|
—
|
|
(1,451
|
)
|
—
|
|
|||||
|
$
|
2,908
|
|
$
|
6,821
|
|
$
|
4,446
|
|
|||
Interest and Other, net
Interest expense was
$27.7 million
,
$21.9 million
and
$24.9 million
in
2018
,
2017
and
2016
, respectively. Interest expense increased
$5.8 million
in 2018 primarily due to higher daily average borrowings on our revolving credit facility during the year driven by higher inventory levels. Interest expense decreased $3.0 million in 2017 primarily due to lower daily average borrowings on our revolving credit facility during the year.
Other income, net was
$4.6 million
,
$7.7 million
and
$4.1 million
in
2018
,
2017
and
2016
, respectively. The following table summarizes the primary components of other income, net (in thousands):
|
Year ended
|
|||||||||||
|
September 29, 2018
|
September 30, 2017
|
October 1, 2016
|
|||||||||
|
Foreign exchange gains / (losses)
|
$
|
766
|
|
$
|
4,709
|
|
$
|
(415
|
)
|
||
|
Bargain purchase gain, net of tax
|
—
|
|
—
|
|
1,642
|
|
|||||
|
Other, net
|
3,798
|
|
2,973
|
|
2,836
|
|
|||||
|
Total
|
$
|
4,564
|
|
$
|
7,682
|
|
$
|
4,063
|
|
||
Provision for (Benefit from) Income Taxes
We recorded income tax expense of
$193.1 million
,
$74.6 million
and
$16.8 million
in
2018
,
2017
and
2016
, respectively. Our effective tax rates were
197.9%
,
35.0%
and
8.2%
for
2018
,
2017
and
2016
, respectively. Income tax expense for 2018 was
$118.4 million
higher than income tax expense for 2017, despite a decrease in pre-tax income of
$115.9 million
in 2018. This was primarily attributable to the impact of the Tax Act, which increased income tax expense approximately
$161 million
because of a non-cash reduction in the carrying value of our net deferred tax assets, partially offset by a decrease in the US tax rate from 35% to 21%, and a $4.8 million discrete tax benefit resulting from a settlement with a foreign tax authority in the third quarter of 2018.
Income tax expense for 2017 was $57.8 million higher than income tax expense for 2016, despite an increase in pre-tax income of only $8.9 million in 2017. This was due primarily to a $96.2 million release of our deferred tax assets valuation allowance in 2016, partially offset by $17.3 million of income tax expense in 2016 associated with an increase to our deferred tax liability for undistributed foreign earnings of a certain foreign subsidiary. These two items represent a net change of $78.9 million. This change was partially offset in 2017 by a discrete tax benefit that was recorded in 2017 resulting from the merger of two foreign entities, the surviving entity of which was, and continues to be, included in our U.S. federal consolidated tax group. This restructuring allowed us to recognize a U.S. deferred tax asset to reflect the federal deductibility of a foreign uncertain tax position that became recognizable upon the merger of the subsidiaries. The tax provision for 2016 was lower than the amount expected if the federal statutory tax rate of 35% was applied primarily due to a release of our deferred tax assets valuation allowance of $96.2 million.
A valuation allowance is established or maintained when, based on currently available information and other factors, it is more likely than not that all or a portion of the deferred tax assets will not be realized. We regularly assess our valuation allowance against deferred tax assets on a jurisdiction by jurisdiction basis. We consider all available positive and negative evidence, including future reversals of temporary differences, projected future taxable income, tax planning strategies and
41
recent financial results. Significant judgment is required in assessing our ability to generate revenue, gross profit, operating income and jurisdictional taxable income in future periods. As of October 1, 2016, we had released all of our U.S. federal valuation allowance.
Liquidity and Capital Resources
|
|
Year Ended
|
||||||||||
|
September 29,
2018 |
September 30,
2017 |
October 1,
2016 |
|||||||||
|
(In thousands)
|
|||||||||||
|
Net cash provided by (used in):
|
|||||||||||
|
Operating activities
|
$
|
156,424
|
|
$
|
250,961
|
|
$
|
390,116
|
|
||
|
Investing activities
|
(116,178
|
)
|
(107,898
|
)
|
(174,538
|
)
|
|||||
|
Financing activities
|
(28,335
|
)
|
(135,493
|
)
|
(231,421
|
)
|
|||||
|
Effect of exchange rate changes
|
956
|
|
803
|
|
1,878
|
|
|||||
|
Increase (decrease) in cash and cash equivalents
|
$
|
12,867
|
|
$
|
8,373
|
|
$
|
(13,965
|
)
|
||
Key Working Capital Management Measures
|
|
As of
|
||
|
|
September 29,
2018 |
|
September 30,
2017 |
|
Days sales outstanding (1)
|
56
|
55
|
|
|
Inventory turns (2)
|
5.5
|
6.2
|
|
|
Days inventory on hand (3)
|
67
|
59
|
|
|
Accounts payable days (4)
|
75
|
71
|
|
|
Cash cycle days (5)
|
48
|
43
|
|
|
(1)
|
Days sales outstanding (a measure of how quickly we collect our accounts receivable), or "DSO", is calculated as the ratio of average accounts receivable, net, to average daily net sales for the quarter.
|
|
(2)
|
Inventory turns (annualized) are calculated as the ratio of four times our cost of sales for the quarter to average inventory.
|
|
(3)
|
Days inventory on hand is calculated as the ratio of average inventory for the quarter to average daily cost of sales for the quarter.
|
|
(4)
|
Accounts payable days (a measure of how quickly we pay our suppliers), or "DPO", is calculated as the ratio of 365 days to accounts payable turns, in which accounts payable turns is calculated as the ratio of four times our cost of sales for the quarter to average accounts payable.
|
|
(5)
|
Cash cycle days is calculated as days inventory on hand plus days sales outstanding minus accounts payable days.
|
Cash and cash equivalents were
$420 million
at
September 29, 2018
and
$407 million
at
September 30, 2017
. Our cash levels vary during any given period depending on the timing of collections from customers and payments to suppliers, borrowings under credit facilities, repurchases of capital stock and other factors. Our working capital was approximately
$0.6 billion
and
$1 billion
at
September 29, 2018
and
September 30, 2017
, respectively. The reduction in net working capital resulted primarily from the reclassification of our Secured Notes due in 2019 from long-term debt to current debt. We are currently in the process of refinancing these notes and expect to complete this refinancing upon maturity of the notes.
Net cash provided by operating activities was
$156 million
,
$251 million
and
$390 million
for
2018
,
2017
and
2016
, respectively. Cash flows from operating activities consists of: (1) net income adjusted to exclude non-cash items such as depreciation and amortization, deferred income taxes and stock-based compensation expense and (2) changes in net operating assets, which are comprised of accounts receivable, inventories, prepaid expenses and other assets, accounts payable and accrued liabilities. Our working capital metrics tend to fluctuate from quarter-to-quarter based on factors such as the linearity of our shipments to customers and purchases from suppliers, customer and supplier mix, and the negotiation of payment terms with customers and suppliers. These fluctuations can significantly affect our cash flows from operating activities.
42
During 2018, we generated
$262 million
of cash from earnings, excluding non-cash items, and used
$106 million
of cash in connection with an increase in our net operating assets, resulting primarily from an increase in inventories and accounts receivable of
$324 million
and
$69 million
, respectively, partially offset by an increase in accounts payable of
$268 million
. Inventory increased primarily due to increased business volume, increased customer requirements entering 2019 and part shortages that prevented us from using previously purchased inventory in the manufacture of products for our customers. This increase resulted in annualized inventory turns decreasing from
6.2
in the fourth quarter of 2017 to
5.5
in the fourth quarter of 2018. Accounts receivable increased due primarily to increased business volume. Accounts payable increased due primarily to increased business volume, a favorable shift in supplier payment terms mix from suppliers with whom we have shorter payment terms to suppliers with whom we have longer payment terms and a favorable shift in the linearity of material receipts. This shift resulted in DPO increasing from
71
days at the end of 2017 to
75
days at the end of 2018.
Net cash used in investing activities was
$116 million
,
$108 million
and
$175 million
for
2018
,
2017
and
2016
, respectively. In 2018, we used
$119 million
of cash for capital expenditures, received proceeds of
$5 million
primarily from sales of certain properties and used
$2 million
for funding our deferred compensation plan. In 2017, we used $112 million of cash for capital expenditures and received proceeds of $4 million primarily from sales of certain properties.
Net cash used in financing activities was
$28 million
,
$135 million
and
$231 million
for
2018
,
2017
and
2016
, respectively. In 2018, we repurchased
$158 million
of common stock (including $12 million in settlement of employee tax withholding obligations), borrowed
$130 million
of cash under the Cash Flow Revolver, repaid
$3 million
of long-term debt and received
$4 million
of proceeds from issuances of common stock pursuant to stock option exercises. In 2017, we repurchased $177 million of common stock (including $17 million in settlement of employee tax withholding obligations), used $17 million of cash for net debt repayments and received $27 million of proceeds from issuances of common stock pursuant to stock option exercises.
Secured Debt.
During the second quarter of 2017, we prepaid the balance of the amount due under our secured debt due 2017 for
$40 million
plus accrued interest.
Senior Secured Notes Due 2019 ("Secured Notes")
. In 2014, we issued
$375 million
of Secured Notes that mature on
June 1, 2019
and bear interest at an annual rate of
4.375%
, payable
semi-annually in arrears
in cash.
The Secured Notes are senior secured obligations and are fully and unconditionally guaranteed, jointly and severally, on a senior secured basis by certain of our subsidiaries. The Secured Notes and the guarantees are secured by a first-priority lien, subject to permitted liens, on certain of our tangible and intangible assets including certain real property, equipment and intellectual property, and by a second-priority lien on certain assets, including accounts receivable, inventory and stock of subsidiaries securing our revolving credit facility.
Short-term Debt
Revolving Credit Facility.
On February 1, 2018, we entered into an amended cash flow revolver (the “Amended Cash Flow Revolver”) that increased the amount available under our revolving credit facility to $500 million and extended the term to February 1, 2023 provided our available liquidity is at least equal to the outstanding balance of our senior secured notes due 2019 during the six month period prior to the maturity date of such notes, which is June 1, 2019. Subject to satisfaction of certain conditions, including obtaining additional commitments from existing and/or new lenders, we may increase the revolver commitments under the Amended Cash Flow Revolver by up to an additional $200 million and/or add new term loan commitments of up to $375 million. Sanmina’s and certain subsidiary guarantors’ obligations under the Amended Cash Flow Revolver are secured by property of Sanmina and such guarantors, including, but not limited to cash, accounts receivable, inventory and the shares of our subsidiaries, subject to limited exceptions. We expect to meet the liquidity condition needed to maintain the extended maturity date of the Amended Cash Flow Revolver. There can be no assurance that we will be successful in meeting this condition, in which case the maturity date of the Amended Cash Flow Revolver would be no later than 92 days prior to the maturity date of the Secured Notes.
As of
September 29, 2018
,
$215 million
borrowings and
$8 million
of letters of credit were outstanding under the Cash Flow Revolver, and
$277 million
was available to borrow.
Short-term Borrowing Facilities
. As of
September 29, 2018
, certain of our foreign subsidiaries had a total of
$69 million
of short-term borrowing facilities, under which no borrowings were outstanding. These facilities expire at various dates through the second quarter of 2019.
43
Debt Covenants
The Amended Cash Flow Revolver requires us to comply with a minimum consolidated interest coverage ratio, measured at the end of each fiscal quarter, and at all times a maximum consolidated leverage ratio. Our debt agreements contain customary affirmative covenants, including covenants regarding the payment of taxes and other obligations, maintenance of insurance, reporting requirements and compliance with applicable laws and regulations and customary negative covenants limiting the ability of Sanmina and its subsidiaries, among other things, to incur debt, grant liens, make investments, make acquisitions, make certain restricted payments, repurchase its shares and sell assets, subject to certain exceptions.
As of
September 29, 2018
, we were in compliance with our covenants.
Other Liquidity Matters
Our Board of Directors has authorized us to repurchase shares of our common stock, subject to a dollar limitation. The timing of repurchases will depend upon capital needs to support the growth of our business, market conditions and other factors. Although stock repurchases are intended to increase stockholder value, purchases of shares reduce our liquidity. We repurchased
5.0 million
and
4.3 million
shares of our common stock for
$146 million
and
$160 million
in the open market in 2018 and 2017, respectively. As of
September 29, 2018
, subject to limitations on stock repurchases contained in our debt agreements,
$108 million
remains available under programs authorized by the Board of Directors, none of which is subject to an expiration date.
During 2018, we entered into a Receivables Purchase Agreement (the “RPA”) with certain third-party banking institutions for the sale of trade receivables generated from sales to certain customers. A maximum of
$540 million
of sold receivables can be outstanding at any point in time under this program, subject to limitations under our Amended Cash Flow Revolver. Trade receivables sold pursuant to the RPA are serviced by us.
In addition to the RPA, we have the option to participate in trade receivables sales programs that have been implemented by certain of our customers, as in effect from time to time. We do not service trade receivables sold under these other programs.
Under each of the programs noted above, we sell our entire interest in a trade receivable for
100%
of face value, less a discount. For the years ended
September 29, 2018
and
September 30, 2017
, we sold
$917 million
and
$491 million
, respectively, of accounts receivable under these programs. Upon sale, these receivables are removed from the consolidated balance sheets and cash received is presented as cash provided by operating activities in the consolidated statements of cash flows. Discounts on sold receivables were not material for any period presented. As of
September 29, 2018
,
$189 million
of accounts receivable sold under the RPA and subject to servicing by us remained outstanding and had not yet been collected.
During the fourth quarter of 2018, we entered into a forward interest rate swap agreement with an aggregate notional amount of
$50 million
with an independent counterparty to partially hedge the variability in cash flows due to changes in the benchmark interest rate (LIBOR) associated with our anticipated variable rate borrowings. The interest rate swap has an effective date of
June 3, 2019
, a maturity date of
December 1, 2023
, and effectively converts our variable interest rate obligations to fixed interest rate obligations. The swap is accounted for as a cash flow hedge under ASC Topic 815, Derivatives and Hedging. We entered into additional interest rate swaps with aggregate notional amounts totaling
$100 million
during the first quarter of 2019 bringing the total swap value to
$150 million
with an effective interest rate of approximately
4.5%
.
In the ordinary course of business, we are or may become party to legal proceedings, claims and other contingencies, including environmental, warranty and employee matters and examinations by government agencies. As of
September 29, 2018
, we had accrued liabilities of
$35 million
related to such matters. We cannot accurately predict the outcome of these matters or the amount or timing of cash flows that may be required to defend ourselves or to settle such matters or that these reserves will be sufficient to fully satisfy our contingent liabilities.
In
January 2018
, we received a notice of intent from a foreign government agency to bring a claim seeking up to
$23 million
asserting that we had been out of compliance from April 2015 through September 2016 with certain requirements of our exemption from goods and services tax on imported goods. Such claim, if formally made, could seek payment for allegedly unpaid goods and services tax. No formal claim has been brought to date. We believe we have good faith arguments in defense of our actions and have provided these arguments to the government agency in writing, most recently in April 2018. No further communications have been received from the agency since that time. As a result, we cannot, at this time, determine the outcome of this matter and have not provided a reserve for this matter as of the end of 2018.
44
As of
September 29, 2018
, we had a liability of
$98 million
for uncertain tax positions. Our estimate of liabilities for uncertain tax positions is based on a number of subjective assessments, including the likelihood of a tax obligation being assessed, the amount of taxes (including interest and penalties) that would ultimately be payable, and our ability to settle any such obligations on favorable terms. Therefore, the amount of future cash flows associated with uncertain tax positions may be significantly higher or lower than our recorded liability and we are unable to reliably estimate when cash settlement may occur.
Our liquidity needs are largely dependent on changes in our working capital, including the extension of trade credit by our suppliers, investments in manufacturing inventory, facilities and equipment, repayments of obligations under outstanding indebtedness and repurchases of common stock. Our primary sources of liquidity as of
September 29, 2018
consisted of: (1) cash and cash equivalents of
$420 million
; (2) our Cash Flow Revolver, under which
$277 million
was available as of
September 29, 2018
; (3) our foreign short-term borrowing facilities of
$69 million
, all of which was available as of
September 29, 2018
(an aggregate of $50 million of such facilities expire at various dates through the second quarter of 2019) and (4) cash generated from operations, including
$95 million
that was available under our accounts receivable sales program as of
September 29, 2018
.
We believe our existing cash resources and other sources of liquidity, together with cash generated from operations, will be sufficient to meet our working capital requirements through at least the next 12 months. Should demand for our services decrease significantly over the next 12 months, should we experience increases in our inventories, delinquent or uncollectible accounts receivable, or should the counterparties to our accounts receivable sales program not agree to fund our requests, our cash provided by operations could be adversely impacted.
As of
September 29, 2018
, 50% of our cash balance was held in the United States. Should we choose or need to remit cash to the United States from our foreign locations, we may incur tax obligations which would reduce the amount of cash ultimately available to the United States. We believe that cash held in the United States, together with liquidity available under our Cash Flow Revolver and cash from foreign subsidiaries that could be remitted to the United States without tax consequences, will be sufficient to meet our United States liquidity needs for at least the next twelve months.
Contractual Obligations
The following is a summary of our long-term debt, including interest, and operating lease obligations as of
September 29, 2018
:
|
Payments Due by Period
|
|||||||||||||||||||
|
Contractual Obligations
|
Total
|
Less than 1 year
|
1- 3 years
|
3-5 years
|
More than
5 years
|
||||||||||||||
|
(In thousands)
|
|||||||||||||||||||
|
Long-term debt obligations, including current portion of long-term debt and interest
|
$
|
404,391
|
|
$
|
389,353
|
|
$
|
15,038
|
|
$
|
—
|
|
$
|
—
|
|
||||
|
Operating lease obligations
|
85,764
|
|
21,188
|
|
27,683
|
|
15,673
|
|
21,220
|
|
|||||||||
|
Total contractual obligations
|
$
|
490,155
|
|
$
|
410,541
|
|
$
|
42,721
|
|
$
|
15,673
|
|
$
|
21,220
|
|
||||
We also have outstanding firm purchase orders with certain suppliers for the purchase of inventory, which are not included in the table above. These purchase orders are generally short-term in nature. Orders for standard, or catalog, items can typically be canceled with little or no financial penalty. Our policy regarding non-standard or customized items dictates that such items are only ordered specifically for customers who have contractually assumed liability for the inventory, although exceptions are made to this policy in certain situations. In addition, a substantial portion of catalog items covered by our purchase orders are procured for specific customers based on their purchase orders or a forecast under which the customer has contractually assumed liability for such material. Accordingly, the amount of liability from purchase obligations under these purchase orders is not expected to be significant. Lastly, pursuant to arrangements under which vendors consign inventory to us, we may be required to purchase such inventory after a certain period of time. To date, we have not been required to purchase a significant amount of inventory pursuant to these time limitations.
As of
September 29, 2018
, we were unable to reliably estimate when cash settlements with taxing authorities may occur with respect to our unrecognized tax benefits of
$98 million
. Additionally, we have provided guarantees to various third parties in the form of letters of credit totaling $
8 million
as of
September 29, 2018
. The letters of credit cover various guarantees including workers' compensation claims and customs duties. Lastly, we have defined benefit pension plans with an underfunded amount of
$31 million
at
September 29, 2018
. We will be required to provide additional funding to these plans in
45
the future if our returns on plan assets are not sufficient to meet our funding obligations. None of the amounts described in this paragraph are included in the table above.
Off-Balance Sheet Arrangements
As of
September 29, 2018
, we did not have any off-balance sheet arrangements, as defined in Item 303(a)(4)(ii) of Regulation S-K promulgated by the SEC, that have or are reasonably likely to have a current or future effect on our financial condition, changes in our financial condition, revenues, or expenses, results of operations, liquidity, capital expenditures, or capital resources that is material to investors.
Quarterly Results (
Unaudited
)
The following tables contain selected unaudited quarterly financial data for each quarter of fiscal
2018
and
2017
. In management's opinion, the unaudited data has been prepared on the same basis as the audited information and includes all adjustments (consisting only of normal recurring adjustments) necessary for a fair statement of the data for the periods presented. Our results of operations have varied and may continue to fluctuate significantly from quarter to quarter. The results of operations in any period should not be considered indicative of the results to be expected from any future period.
|
|
Year ended September 29, 2018
|
||||||||||||||
|
First Quarter (1)
|
Second Quarter
|
Third Quarter
|
Fourth Quarter (2)
|
||||||||||||
|
(In thousands, except per share data)
|
|||||||||||||||
|
Net sales
|
$
|
1,744,800
|
|
$
|
1,675,629
|
|
$
|
1,813,366
|
|
$
|
1,876,335
|
|
|||
|
Gross profit
|
$
|
109,466
|
|
$
|
114,698
|
|
$
|
118,536
|
|
$
|
121,083
|
|
|||
|
Gross margin
|
6.3
|
%
|
6.8
|
%
|
6.5
|
%
|
6.5
|
%
|
|||||||
|
Operating income
|
$
|
13,788
|
|
$
|
48,774
|
|
$
|
47,060
|
|
$
|
9,819
|
|
|||
|
Operating margin
|
0.8
|
%
|
2.9
|
%
|
2.6
|
%
|
0.5
|
%
|
|||||||
|
Net income (loss)
|
$
|
(154,910
|
)
|
$
|
24,632
|
|
$
|
33,963
|
|
$
|
782
|
|
|||
|
Basic net income per share
|
$
|
(2.16
|
)
|
$
|
0.35
|
|
$
|
0.49
|
|
$
|
0.01
|
|
|||
|
Diluted net income per share
|
$
|
(2.16
|
)
|
$
|
0.33
|
|
$
|
0.47
|
|
$
|
0.01
|
|
|||
|
|
Year ended September 30, 2017
|
||||||||||||||
|
First Quarter
|
Second Quarter
|
Third Quarter
|
Fourth Quarter
|
||||||||||||
|
(In thousands, except per share data)
|
|||||||||||||||
|
Net sales
|
$
|
1,719,977
|
|
$
|
1,682,262
|
|
$
|
1,711,377
|
|
$
|
1,755,003
|
|
|||
|
Gross profit
|
$
|
132,162
|
|
$
|
133,210
|
|
$
|
130,688
|
|
$
|
123,851
|
|
|||
|
Gross margin
|
7.7
|
%
|
7.9
|
%
|
7.6
|
%
|
7.1
|
%
|
|||||||
|
Operating income
|
$
|
58,656
|
|
$
|
58,166
|
|
$
|
66,576
|
|
$
|
43,069
|
|
|||
|
Operating margin
|
3.4
|
%
|
3.5
|
%
|
3.9
|
%
|
2.5
|
%
|
|||||||
|
Net income
|
$
|
44,864
|
|
$
|
31,717
|
|
$
|
36,404
|
|
$
|
25,848
|
|
|||
|
Basic net income per share
|
$
|
0.61
|
|
$
|
0.42
|
|
$
|
0.48
|
|
$
|
0.35
|
|
|||
|
Diluted net income per share
|
$
|
0.58
|
|
$
|
0.41
|
|
$
|
0.47
|
|
$
|
0.33
|
|
|||
(1) Includes income tax expense of
$162 million
related to enactment of the Tax Act.
(2) Includes a goodwill impairment charge of
$31 million
and a
$12.5 million
pre-tax adjustment to correct errors that occurred from fiscal 2016 through the third quarter of fiscal 2018 with respect to the accounting for certain long-term contracts in one of our CPS divisions.
46
Item 7A.
Quantitative and Qualitative Disclosures about Market Risk
Interest Rate Risk
Our primary exposure to market risk for changes in interest rates relates to our revolving credit facility as the interest rate we pay for borrowings is determined at the time of borrowing based on a floating index. Therefore, although we can elect to fix the interest rate at the time of borrowing, the facility does expose us to market risk for changes in interest rates. An immediate 10 percent change in interest rates would not have a significant impact on our results of operations.
Foreign Currency Exchange Risk
We transact business in foreign currencies. Our foreign exchange policy requires that we take certain steps to limit our foreign exchange exposures resulting from certain assets and liabilities and forecasted cash flows. However, our policy does not require us to hedge all foreign exchange exposures. Furthermore, our foreign currency hedges are based on forecasted transactions and estimated balances, the amount of which may differ from that actually incurred. As a result, we can experience foreign exchange gains and losses in our results of operations.
Our primary foreign currency cash flows are in certain Asian and European countries, Israel, Brazil and Mexico. We enter into short-term foreign currency forward contracts to hedge currency exposures associated with certain monetary assets and liabilities denominated in non-functional currencies. These contracts generally have maturities of up to two months, although we currently have a four-year contract that hedges a non-functional currency denominated note payable due in 2020. These forward contracts are not designated as part of a hedging relationship for accounting purposes. All outstanding foreign currency forward contracts are marked-to-market at the end of the period with unrealized gains and losses included in other income, net, in the consolidated statements of operations. As of
September 29, 2018
, we had outstanding foreign currency forward contracts to exchange various foreign currencies for U.S. dollars in the aggregate notional amount of
$356 million
.
We also utilize foreign currency forward contracts to hedge certain operational (“cash flow”) exposures resulting from changes in foreign currency exchange rates. Such exposures result from (1) forecasted sales denominated in currencies other than those used to pay for materials and labor, (2) forecasted non-functional currency labor and overhead expenses, (3) forecasted non-functional currency operating expenses, and (4) anticipated capital expenditures denominated in a currency other than the functional currency of the entity making the expenditures. These contracts may be up to twelve months in duration and are designated as cash flow hedges for accounting purposes. The effective portion of changes in the fair value of the contracts is recorded in stockholders' equity as a separate component of accumulated other comprehensive income and recognized in earnings when the hedged item affects earnings. We had forward contracts related to cash flow hedges in various foreign currencies in the aggregate notional amount of
$117 million
as of
September 29, 2018
.
The net impact of an immediate 10 percent change in exchange rates would not be material to our consolidated financial statements, provided we accurately forecast and estimate our foreign currency exposure. If such forecasts are materially inaccurate, we could incur significant gains or losses.
Item 8.
Financial Statements and Supplementary Data
The information required by this item is included below and incorporated by reference from the financial statement schedule included in “Part IV-Item 15(a)(2)” and the selected quarterly financial data referred to in “Part II-Item 7-Management's Discussion and Analysis of Financial Condition and Results of Operations-Quarterly Results (Unaudited).”
47
Report of Independent Registered Public Accounting Firm
To the
Board of Directors and Stockholders of Sanmina Corporation
Opinions on the Financial Statements and Internal Control over Financial Reporting
We have audited the accompanying consolidated balance sheets of Sanmina Corporation
and its subsidiaries (the “Company”) as of September 29, 2018 and September 30, 2017 and the related consolidated statements of operations, comprehensive income (loss), stockholders' equity and cash flows for each of the three years in the period ended September 29, 2018, including the related notes and
financial statement schedule listed in the index appearing under Item 15(a)(2)
(collectively referred to as the “consolidated financial statements”).
We also have audited the Company's internal control over financial reporting as of September 29, 2018, based on criteria established in
Internal Control - Integrated Framework
(2013)
issued by the Committee of Sponsoring Organizations of the Treadway Commission (COSO).
In our opinion, the consolidated financial statements referred to above present fairly, in all material respects, the financial position of the Company as of September 29, 2018
and September 30, 2017,
and the results of its operations and its cash flows for each of the three years in the period ended September 29, 2018 in conformity with accounting principles generally accepted in the United States of America. Also in our opinion, the Company did not maintain, in all material respects, effective internal control over financial reporting as of September 29, 2018, based on criteria established in
Internal Control - Integrated Framework
(2013)
issued by the COSO because a material weakness in internal control over financial reporting existed as of that date related to ineffective controls over the monitoring of the reasonableness of estimates used in accounting for certain long-term contracts.
A material weakness is a deficiency, or a combination of deficiencies, in internal control over financial reporting, such that there is a reasonable possibility that a material misstatement of the annual or interim financial statements will not be prevented or detected on a timely basis. The material weakness referred to above is described in Management's Report on Internal Control Over Financial Reporting appearing under Item 9A. We considered this material weakness in determining the nature, timing, and extent of audit tests applied in our audit of the 2018 consolidated financial statements, and our opinion regarding the effectiveness of the Company’s internal control over financial reporting does not affect our opinion on those consolidated financial statements.
Basis for Opinions
The Company's management is responsible for these consolidated financial statements, for maintaining effective internal control over financial reporting, and for its assessment of the effectiveness of internal control over financial reporting, included in management’s report referred to above. Our responsibility is to express opinions on the Company’s consolidated financial statements and on the Company's internal control over financial reporting based on our audits. We are a public accounting firm registered with the Public Company Accounting Oversight Board (United States) (PCAOB) and are required to be independent with respect to the Company in accordance with the U.S. federal securities laws and the applicable rules and regulations of the Securities and Exchange Commission and the PCAOB.
We conducted our audits in accordance with the standards of the PCAOB. Those standards require that we plan and perform the audits to obtain reasonable assurance about whether the consolidated financial statements are free of material misstatement, whether due to error or fraud, and whether effective internal control over financial reporting was maintained in all material respects.
Our audits of the consolidated financial statements included performing procedures to assess the risks of material misstatement of the consolidated financial statements, whether due to error or fraud, and performing procedures that respond to those risks. Such procedures included examining, on a test basis, evidence regarding the amounts and disclosures in the consolidated financial statements. Our audits also included evaluating the accounting principles used and significant estimates made by management, as well as evaluating the overall presentation of the consolidated financial statements. Our audit of internal control over financial reporting included obtaining an understanding of internal control over financial reporting, assessing the risk that a material weakness exists, and testing and evaluating the design and operating effectiveness of internal control based on the assessed risk. Our audits also included performing such other procedures as we considered necessary in the circumstances. We believe that our audits provide a reasonable basis for our opinions.
48
Definition and Limitations of Internal Control over Financial Reporting
A company’s internal control over financial reporting is a process designed to provide reasonable assurance regarding the reliability of financial reporting and the preparation of financial statements for external purposes in accordance with generally accepted accounting principles. A company’s internal control over financial reporting includes those policies and procedures that (i) pertain to the maintenance of records that, in reasonable detail, accurately and fairly reflect the transactions and dispositions of the assets of the company; (ii) provide reasonable assurance that transactions are recorded as necessary to permit preparation of financial statements in accordance with generally accepted accounting principles, and that receipts and expenditures of the company are being made only in accordance with authorizations of management and directors of the company; and (iii) provide reasonable assurance regarding prevention or timely detection of unauthorized acquisition, use, or disposition of the company’s assets that could have a material effect on the financial statements.
Because of its inherent limitations, internal control over financial reporting may not prevent or detect misstatements. Also, projections of any evaluation of effectiveness to future periods are subject to the risk that controls may become inadequate because of changes in conditions, or that the degree of compliance with the policies or procedures may deteriorate.
/s/ PricewaterhouseCoopers LLP
San Jose, California
November 15, 2018
We have served as the Company’s auditor since 2016.
49
SANMINA CORPORATION
CONSOLIDATED BALANCE SHEETS
|
As of
|
|||||||
|
September 29,
2018 |
September 30,
2017 |
||||||
|
(In thousands, except par value)
|
|||||||
|
ASSETS
|
|||||||
|
Current assets:
|
|||||||
|
Cash and cash equivalents
|
$
|
419,528
|
|
$
|
406,661
|
|
|
|
Accounts receivable, net of allowances of $12,211 and $14,334 as of September 29, 2018 and September 30, 2017, respectively
|
1,177,219
|
|
1,110,334
|
|
|||
|
Inventories
|
1,374,004
|
|
1,051,669
|
|
|||
|
Prepaid expenses and other current assets
|
43,676
|
|
47,586
|
|
|||
|
Total current assets
|
3,014,427
|
|
2,616,250
|
|
|||
|
Property, plant and equipment, net
|
642,913
|
|
640,275
|
|
|||
|
Deferred income tax assets, net
|
344,124
|
|
476,554
|
|
|||
|
Other
|
83,669
|
|
114,284
|
|
|||
|
Total assets
|
$
|
4,085,133
|
|
$
|
3,847,363
|
|
|
|
LIABILITIES AND STOCKHOLDERS' EQUITY
|
|
|
|
|
|||
|
Current liabilities:
|
|||||||
|
Accounts payable
|
$
|
1,547,399
|
|
$
|
1,280,106
|
|
|
|
Accrued liabilities
|
136,427
|
|
116,582
|
|
|||
|
Accrued payroll and related benefits
|
124,748
|
|
130,939
|
|
|||
|
Short-term debt, including current portion of long-term debt
|
593,321
|
|
88,416
|
|
|||
|
Total current liabilities
|
2,401,895
|
|
1,616,043
|
|
|||
|
Long-term liabilities:
|
|||||||
|
Long-term debt
|
14,346
|
|
391,447
|
|
|||
|
Other
|
196,048
|
|
192,189
|
|
|||
|
Total long-term liabilities
|
210,394
|
|
583,636
|
|
|||
|
Commitments and Contingencies (Note 8)
|
|
|
|
|
|||
|
Stockholders' equity:
|
|
|
|
|
|||
|
Preferred stock, $.01 par value, authorized 5,000 shares, none issued and outstanding
|
—
|
|
—
|
|
|||
|
Common stock, $.01 par value, authorized 166,667 shares; 103,128 and 101,672 shares issued and 67,777 and 71,664 shares outstanding as of September 29, 2018 and September 30, 2017, respectively
|
678
|
|
717
|
|
|||
|
Treasury stock, 35,351 and 30,008 shares as of September 29, 2018 and September 30, 2017, respectively, at cost
|
(791,366
|
)
|
(633,740
|
)
|
|||
|
Additional paid-in capital
|
6,222,310
|
|
6,184,371
|
|
|||
|
Accumulated other comprehensive income
|
73,944
|
|
76,794
|
|
|||
|
Accumulated deficit
|
(4,032,722
|
)
|
(3,980,458
|
)
|
|||
|
Total stockholders' equity
|
1,472,844
|
|
1,647,684
|
|
|||
|
Total liabilities and stockholders' equity
|
$
|
4,085,133
|
|
$
|
3,847,363
|
|
|
See accompanying notes to the consolidated financial statements.
50
SANMINA CORPORATION
CONSOLIDATED STATEMENTS OF OPERATIONS
|
Year Ended
|
|||||||||||
|
September 29,
2018 |
September 30,
2017 |
October 1,
2016 |
|||||||||
|
(In thousands, except per share amounts)
|
|||||||||||
|
Net sales
|
$
|
7,110,130
|
|
$
|
6,868,619
|
|
$
|
6,481,181
|
|
||
|
Cost of sales
|
6,646,347
|
|
6,348,708
|
|
5,966,899
|
|
|||||
|
Gross profit
|
463,783
|
|
519,911
|
|
514,282
|
|
|||||
|
Operating expenses:
|
|||||||||||
|
Selling, general and administrative
|
250,924
|
|
251,568
|
|
244,604
|
|
|||||
|
Research and development
|
30,754
|
|
33,716
|
|
37,746
|
|
|||||
|
Restructuring costs
|
29,146
|
|
1,339
|
|
2,701
|
|
|||||
|
Goodwill impairment
|
30,610
|
|
—
|
|
—
|
|
|||||
|
Other
|
2,908
|
|
6,821
|
|
4,446
|
|
|||||
|
Total operating expenses
|
344,342
|
|
293,444
|
|
289,497
|
|
|||||
|
|
|||||||||||
|
Operating income
|
119,441
|
|
226,467
|
|
224,785
|
|
|||||
|
|
|||||||||||
|
Interest income
|
1,268
|
|
1,265
|
|
680
|
|
|||||
|
Interest expense
|
(27,734
|
)
|
(21,934
|
)
|
(24,911
|
)
|
|||||
|
Other income, net
|
4,564
|
|
7,682
|
|
4,063
|
|
|||||
|
Interest and other, net
|
(21,902
|
)
|
(12,987
|
)
|
(20,168
|
)
|
|||||
|
Income before income taxes
|
97,539
|
|
213,480
|
|
204,617
|
|
|||||
|
Provision for income taxes
|
193,072
|
|
74,647
|
|
16,779
|
|
|||||
|
Net income (loss)
|
$
|
(95,533
|
)
|
$
|
138,833
|
|
$
|
187,838
|
|
||
|
Net income (loss) per share:
|
|||||||||||
|
Basic
|
$
|
(1.37
|
)
|
$
|
1.86
|
|
$
|
2.50
|
|
||
|
Diluted
|
$
|
(1.37
|
)
|
$
|
1.78
|
|
$
|
2.38
|
|
||
|
Weighted-average shares used in computing per share amounts:
|
|||||||||||
|
Basic
|
69,833
|
|
74,481
|
|
75,094
|
|
|||||
|
Diluted
|
69,833
|
|
78,128
|
|
78,787
|
|
|||||
See accompanying notes to the consolidated financial statements.
51
SANMINA CORPORATION
CONSOLIDATED STATEMENTS OF COMPREHENSIVE INCOME (LOSS)
|
|
Year Ended
|
||||||||||
|
|
September 29,
2018 |
September 30,
2017 |
October 1,
2016 |
||||||||
|
|
(In thousands)
|
||||||||||
|
|
|||||||||||
|
Net income (loss)
|
$
|
(95,533
|
)
|
$
|
138,833
|
|
$
|
187,838
|
|
||
|
Other comprehensive income (loss), net of tax:
|
|||||||||||
|
Foreign currency translation adjustments
|
(3,063
|
)
|
588
|
|
3,734
|
|
|||||
|
Derivative financial instruments:
|
|||||||||||
|
Changes in unrealized gain (loss)
|
(982
|
)
|
819
|
|
(2,326
|
)
|
|||||
|
Amount reclassified into net income
|
859
|
|
(592
|
)
|
2,570
|
|
|||||
|
Pension benefit plans:
|
|||||||||||
|
Changes in unrecognized net actuarial gain (loss) and unrecognized transition cost
|
(460
|
)
|
8,833
|
|
(6,327
|
)
|
|||||
|
Amortization of actuarial gain (loss) and transition cost
|
796
|
|
1,765
|
|
1,159
|
|
|||||
|
Total other comprehensive income (loss)
|
$
|
(2,850
|
)
|
$
|
11,413
|
|
$
|
(1,190
|
)
|
||
|
Comprehensive income (loss)
|
$
|
(98,383
|
)
|
$
|
150,246
|
|
$
|
186,648
|
|
||
See accompanying notes to the consolidated financial statements.
52
SANMINA CORPORATION
CONSOLIDATED STATEMENTS OF STOCKHOLDERS' EQUITY
|
Common Stock and Additional Paid-in Capital
|
Treasury Stock
|
||||||||||||||||||||||||
|
Number of
Shares
|
Amount
|
Number of
Shares
|
Amount
|
Accumulated
Other
Comprehensive
Income
|
Accumulated
Deficit
|
Total
|
|||||||||||||||||||
|
(In thousands)
|
|||||||||||||||||||||||||
|
BALANCE AT OCTOBER 3, 2015
|
96,306
|
|
$
|
6,075,579
|
|
(18,248
|
)
|
$
|
(314,550
|
)
|
$
|
66,571
|
|
$
|
(4,307,129
|
)
|
$
|
1,520,471
|
|
||||||
|
Issuances under stock plans
|
1,835
|
|
18,221
|
|
—
|
|
—
|
|
—
|
|
—
|
|
18,221
|
|
|||||||||||
|
Stock-based compensation
|
—
|
|
26,709
|
|
—
|
|
—
|
|
—
|
|
—
|
|
26,709
|
|
|||||||||||
|
Repurchases of treasury stock
|
—
|
|
—
|
|
(6,862
|
)
|
(142,246
|
)
|
—
|
|
—
|
|
(142,246
|
)
|
|||||||||||
|
Other comprehensive loss
|
—
|
|
—
|
|
—
|
|
—
|
|
(1,190
|
)
|
—
|
|
(1,190
|
)
|
|||||||||||
|
Net income
|
—
|
|
—
|
|
—
|
|
—
|
|
—
|
|
187,838
|
|
187,838
|
|
|||||||||||
|
BALANCE AT OCTOBER 1, 2016
|
98,141
|
|
$
|
6,120,509
|
|
(25,110
|
)
|
$
|
(456,796
|
)
|
$
|
65,381
|
|
$
|
(4,119,291
|
)
|
$
|
1,609,803
|
|
||||||
|
Issuances under stock plans
|
3,531
|
|
27,129
|
|
—
|
|
—
|
|
—
|
|
—
|
|
27,129
|
|
|||||||||||
|
Stock-based compensation
|
—
|
|
37,450
|
|
—
|
|
—
|
|
—
|
|
—
|
|
37,450
|
|
|||||||||||
|
Repurchases of treasury stock
|
—
|
|
—
|
|
(4,898
|
)
|
(176,944
|
)
|
—
|
|
—
|
|
(176,944
|
)
|
|||||||||||
|
Other comprehensive income
|
—
|
|
—
|
|
—
|
|
—
|
|
11,413
|
|
—
|
|
11,413
|
|
|||||||||||
|
Net income
|
—
|
|
—
|
|
—
|
|
—
|
|
—
|
|
138,833
|
|
138,833
|
|
|||||||||||
|
BALANCE AT SEPTEMBER 30, 2017
|
101,672
|
|
$
|
6,185,088
|
|
(30,008
|
)
|
$
|
(633,740
|
)
|
$
|
76,794
|
|
$
|
(3,980,458
|
)
|
$
|
1,647,684
|
|
||||||
|
Issuances under stock plans
|
1,456
|
|
4,407
|
|
—
|
|
—
|
|
—
|
|
—
|
|
4,407
|
|
|||||||||||
|
Stock-based compensation
|
—
|
|
33,493
|
|
—
|
|
—
|
|
—
|
|
—
|
|
33,493
|
|
|||||||||||
|
Repurchases of treasury stock
|
—
|
|
—
|
|
(5,343
|
)
|
(157,626
|
)
|
—
|
|
—
|
|
(157,626
|
)
|
|||||||||||
|
Other comprehensive loss
|
—
|
|
—
|
|
—
|
|
—
|
|
(2,850
|
)
|
—
|
|
(2,850
|
)
|
|||||||||||
|
Cumulative effect of new accounting pronouncement
|
—
|
|
—
|
|
—
|
|
—
|
|
—
|
|
43,269
|
|
43,269
|
|
|||||||||||
|
Net loss
|
—
|
|
—
|
|
—
|
|
—
|
|
—
|
|
(95,533
|
)
|
(95,533
|
)
|
|||||||||||
|
BALANCE AT SEPTEMBER 29, 2018
|
103,128
|
|
$
|
6,222,988
|
|
(35,351
|
)
|
$
|
(791,366
|
)
|
$
|
73,944
|
|
$
|
(4,032,722
|
)
|
$
|
1,472,844
|
|
||||||
See accompanying notes to the consolidated financial statements.
53
SANMINA CORPORATION
|
Year Ended
|
|||||||||||
|
September 29,
2018 |
September 30,
2017 |
October 1,
2016 |
|||||||||
|
(In thousands)
|
|||||||||||
|
CASH FLOWS PROVIDED BY (USED IN) OPERATING ACTIVITIES:
|
|||||||||||
|
Net income (loss)
|
$
|
(95,533
|
)
|
$
|
138,833
|
|
$
|
187,838
|
|
||
|
Adjustments to reconcile net income (loss) to cash provided by operating activities:
|
|||||||||||
|
Depreciation and amortization
|
118,820
|
|
118,751
|
|
111,910
|
|
|||||
|
Stock-based compensation expense
|
32,825
|
|
37,920
|
|
26,907
|
|
|||||
|
Deferred income taxes
|
173,591
|
|
37,892
|
|
(16,829
|
)
|
|||||
|
Impairment of goodwill
|
30,610
|
|
—
|
|
—
|
|
|||||
|
Other, net
|
1,777
|
|
4,188
|
|
1,587
|
|
|||||
|
Changes in operating assets and liabilities, net of acquisitions:
|
|||||||||||
|
Accounts receivable
|
(69,076
|
)
|
(136,072
|
)
|
(36,913
|
)
|
|||||
|
Inventories
|
(324,168
|
)
|
(104,468
|
)
|
5,614
|
|
|||||
|
Prepaid expenses and other assets
|
7,797
|
|
12,303
|
|
68
|
|
|||||
|
Accounts payable
|
268,421
|
|
130,648
|
|
95,193
|
|
|||||
|
Accrued liabilities
|
11,360
|
|
10,966
|
|
14,741
|
|
|||||
|
Cash provided by operating activities
|
156,424
|
|
250,961
|
|
|
390,116
|
|
||||
|
CASH FLOWS PROVIDED BY (USED IN) INVESTING ACTIVITIES:
|
|||||||||||
|
Purchases of property, plant and equipment
|
(118,881
|
)
|
(111,833
|
)
|
(120,400
|
)
|
|||||
|
Proceeds from sales of property, plant and equipment
|
4,722
|
|
3,935
|
|
4,740
|
|
|||||
|
Purchases of long-term investments
|
(2,019
|
)
|
—
|
|
—
|
|
|||||
|
Cash paid for business combinations, net of cash acquired
|
—
|
|
—
|
|
(58,878
|
)
|
|||||
|
Cash used in investing activities
|
(116,178
|
)
|
(107,898
|
)
|
(174,538
|
)
|
|||||
|
CASH FLOWS PROVIDED BY (USED IN) FINANCING ACTIVITIES:
|
|||||||||||
|
Repayments of short-term borrowings (1)
|
—
|
|
—
|
|
(18,014
|
)
|
|||||
|
Proceeds from revolving credit facility borrowings
|
4,040,600
|
|
932,770
|
|
2,962,450
|
|
|||||
|
Repayments of revolving credit facility borrowings
|
(3,910,600
|
)
|
(872,770
|
)
|
(3,047,450
|
)
|
|||||
|
Repayments of long-term debt
|
(3,416
|
)
|
(43,416
|
)
|
(4,382
|
)
|
|||||
|
Net proceeds from stock issuances
|
4,407
|
|
27,129
|
|
18,221
|
|
|||||
|
Repurchases of common stock
|
(157,625
|
)
|
(176,944
|
)
|
(142,246
|
)
|
|||||
|
Other, net
|
(1,701
|
)
|
(2,262
|
)
|
—
|
|
|||||
|
Cash used in financing activities
|
(28,335
|
)
|
(135,493
|
)
|
(231,421
|
)
|
|||||
|
Effect of exchange rate changes
|
956
|
|
803
|
|
1,878
|
|
|||||
|
Increase (decrease) in cash and cash equivalents
|
12,867
|
|
8,373
|
|
(13,965
|
)
|
|||||
|
Cash and cash equivalents at beginning of year
|
406,661
|
|
398,288
|
|
412,253
|
|
|||||
|
Cash and cash equivalents at end of year
|
$
|
419,528
|
|
$
|
406,661
|
|
$
|
398,288
|
|
||
|
Cash paid during the year:
|
|||||||||||
|
Interest, net of capitalized interest
|
$
|
26,156
|
|
$
|
17,983
|
|
|
$
|
21,316
|
|
|
|
Income taxes, net of refunds
|
$
|
34,819
|
|
$
|
20,417
|
|
|
$
|
29,342
|
|
|
|
Unpaid purchases of property, plant and equipment at end of period
|
$
|
49,546
|
|
$
|
49,831
|
|
$
|
22,072
|
|
||
|
Acquisition-date fair value of promissory notes issued in conjunction with business combinations (see Note 13)
|
$
|
—
|
|
$
|
—
|
|
$
|
30,105
|
|
||
|
(1)
|
2016 amount represents repayment of a promissory note issued in conjunction with a business combination in the second quarter of 2016. The note was repaid in the third quarter of 2016.
|
See accompanying notes to the consolidated financial statements.
54
SANMINA CORPORATION
NOTES TO CONSOLIDATED FINANCIAL STATEMENTS
Sanmina Corporation (“Sanmina,” or the “Company”) was incorporated in Delaware in 1989. The Company is a leading global provider of integrated manufacturing solutions, components, products and repair, logistics and after-market services. The Company provides these comprehensive solutions primarily to original equipment manufacturers (OEMs) that serve the industrial, medical, defense and aerospace, automotive, communications networks and cloud solutions industries.
The Company's operations are managed as two businesses:
|
1)
|
Integrated Manufacturing Solutions (IMS). IMS is a single operating segment consisting of printed circuit board assembly and test, final system assembly and test, and direct-order-fulfillment.
|
|
2)
|
Components, Products and Services (CPS). Components include interconnect systems (printed circuit board fabrication, backplane, cable assemblies and plastic injection molding) and mechanical systems (enclosures and precision machining). Products include memory, RF, optical and microelectronic, and enterprise solutions from the Company's Viking Technology division; defense and aerospace products from SCI Technology; and cloud-based manufacturing execution software from the Company's 42Q division. Services include design, engineering, logistics and repair services.
|
The Company's only reportable segment is IMS, which represented approximately
80%
of total revenue in
2018
. The CPS business consists of multiple operating segments which do not meet the quantitative thresholds for being presented as reportable segments. Therefore, financial information for these operating segments will be presented in a single category entitled “Components, Products and Services”.
Basis of Presentation
Fiscal Year.
The Company operates on a 52 or 53 week year ending on the Saturday nearest September 30. Fiscal
2018
,
2017
and
2016
were each 52 weeks. All references to years relate to fiscal years unless otherwise noted.
Principles of Consolidation.
The consolidated financial statements include the Company's accounts and those of its subsidiaries. All intercompany balances and transactions have been eliminated.
Management Estimates and Uncertainties.
The preparation of consolidated financial statements in conformity with generally accepted accounting principles in the United States of America requires management to make estimates and assumptions that affect the reported amounts of assets and liabilities and disclosures of contingent liabilities at the date of the consolidated financial statements and the reported amounts of revenue and expenses during the reporting period. Significant estimates made in preparing the consolidated financial statements relate to allowances for accounts receivable; provisions for excess and obsolete inventories, product returns, warranties, environmental matters, and legal exposures; determining the recoverability of claims made in connection with customer bankruptcies; determining liabilities for uncertain tax positions; determining the realizability of deferred tax assets; determining fair values of tangible and intangible assets for purposes of business combinations and impairment tests; determining fair values of contingent consideration and equity awards; and determining forfeiture rates for purposes of calculating stock compensation expense. Actual results could differ materially from these estimates.
Financial Instruments and Concentration of Credit Risk.
Financial instruments consist primarily of cash and cash equivalents, accounts receivable, foreign currency forward contracts, interest rate swap agreement, accounts payable and debt obligations. With the exception of certain of the Company's debt obligations (refer to Note 4. Financial Instruments), the fair value of these financial instruments approximates their carrying amount as of
September 29, 2018
and
September 30, 2017
due to the nature or short maturity of these instruments, or the fact that the instruments are recorded at fair value on the consolidated balance sheets.
Accounts Receivable and Other Related Allowances.
The Company had allowances of
$12 million
and
$14 million
as of
September 29, 2018
and
September 30, 2017
, respectively, for uncollectible accounts, product returns and other net sales
55
adjustments. One of the Company's most significant risks is the ultimate realization of its accounts receivable. This risk is mitigated by ongoing credit evaluations of customers and frequent contact with customers, especially the most significant customers, which enable the Company to monitor changes in its customers' business operations and respond accordingly. To establish the allowance for doubtful accounts, the Company estimates credit risk associated with accounts receivable by considering the creditworthiness of its customers, past experience, specific facts and circumstances, and the overall economic climate in industries that it serves. To establish the allowance for product returns and other adjustments, the Company primarily utilizes historical data.
Accounts Receivable Sale.
During 2018, the Company entered into a Receivables Purchase Agreement (the “RPA”) with certain third-party banking institutions for the sale of trade receivables generated from sales to certain customers. A maximum of
$540 million
of sold receivables can be outstanding at any point in time under this program. Trade receivables sold pursuant to the RPA are serviced by the Company.
In addition to the RPA, the Company has the option to participate in trade receivables sales programs that have been implemented by certain of the Company's customers, as in effect from time to time. The Company does not service trade receivables sold under these other programs. Under each of the programs noted above, the Company sells its entire interest in a trade receivable for
100%
of face value, less a discount. Accounts receivable balances sold are removed from the consolidated balance sheets and the related proceeds are reported as cash provided by operating activities in the consolidated statements of cash flows.
Inventories.
Inventories are stated at the lower of cost (first-in, first-out method) and net realizable value. Cost includes labor, materials and manufacturing overhead.
Provisions are made to reduce excess and obsolete inventories to their estimated net realizable values. The ultimate realization of inventory carrying amounts is primarily affected by changes in customer demand. Inventory provisions are established based on forecasted demand, past experience with specific customers, the age and nature of the inventory, the ability to redistribute inventory to other programs or back to suppliers, and whether customers are contractually obligated and have the ability to pay for the related inventory. Certain payments received from customers for inventory held by the Company are recorded as a reduction of inventory.
Long-lived Assets.
Property, plant and equipment are stated at cost or, in the case of property and equipment acquired through business combinations, at fair value as of the acquisition date. Depreciation is provided on a straight-line basis over
20
to
40
years for buildings and
3
to
15
years for machinery, equipment, furniture and fixtures. Leasehold improvements are amortized on a
straight-line basis over the shorter of the lease term or useful life of the asset
.
The Company reviews property, plant and equipment and intangible assets subject to amortization for impairment whenever events or changes in circumstances indicate that the carrying amount of an asset or asset group may not be recoverable. An asset group is the unit of accounting which represents the lowest level for which identifiable cash flows are largely independent of the cash flows of other groups of assets. An asset or asset group is considered impaired if its carrying amount exceeds the undiscounted future net cash flows the asset or asset group is expected to generate. If an asset or asset group is considered to be impaired, the impairment to be recognized is measured as the amount by which the carrying amount of the asset or asset group exceeds its fair value. For asset groups for which the primary asset is a building, the Company estimates fair value based on data provided by commercial real estate brokers. For other asset groups, the Company estimates fair value based on projected discounted future net cash flows.
Goodwill.
Goodwill is tested for impairment on an annual basis and whenever events or changes in circumstances indicate that the carrying value of goodwill may not be recoverable, as assessed at a reporting unit level. If, based on a qualitative assessment, the Company determines it is more-likely-than-not that goodwill is impaired, the Company performs a quantitative assessment to determine whether the fair value of our reporting unit is less than its carrying value and, if so, an impairment adjustment must be recorded up to the carrying value of goodwill.
Foreign Currency Translation.
For foreign subsidiaries using the local currency as their functional currency, assets and liabilities are translated to U.S. dollars at exchange rates in effect at the balance sheet date and income and expenses are translated at average exchange rates. The effects of these translation adjustments are reported in stockholders' equity as a component of accumulated other comprehensive income ("AOCI"). For all entities, remeasurement adjustments for non-functional currency monetary assets and liabilities are included in other income, net in the accompanying consolidated statements of operations. Remeasurement gains and losses arising from long-term intercompany loans denominated in a currency other than an entity's functional currency are recorded in AOCI if repayment of the loan is not anticipated in the foreseeable future.
56
Derivative Instruments and Hedging Activities.
The Company conducts business on a global basis in numerous currencies and certain of the Company's outstanding debt has a variable interest rate. Therefore, the Company is exposed to movements in foreign currency exchange rates and interest rates. The Company uses derivatives, such as foreign currency forward contracts and interest rate swaps, to minimize the volatility of earnings and cash flows associated with changes in foreign currency exchange rates and interest rates.
The Company accounts for derivative instruments and hedging activities in accordance with ASC Topic 815,
Derivatives and Hedging,
which requires each derivative instrument to be recorded on the consolidated balance sheets at its fair value as either an asset or a liability. If a derivative is designated as a cash flow hedge, the effective portion of changes in the fair value of the derivative is recorded in stockholders' equity as a separate component of AOCI and is recognized in earnings when the hedged item affects earnings. Ineffective portions of changes in the fair value of cash flow hedges are immediately recognized in earnings. If a derivative is designated as a fair value hedge, changes in the fair value of the derivative and of the item being hedged are recognized in earnings in the current period.
Derivative instruments are entered into for periods of time consistent with the related underlying exposures and are not entered into for speculative purposes. At the inception of a hedge, the Company documents all relationships between derivative instruments and related hedged items, as well as its risk-management objectives and strategies for the hedging transaction.
The Company's foreign currency forward contracts and interest rate swaps potentially expose the Company to credit risk to the extent the counterparties may be unable to meet the terms of the agreement. The Company minimizes such risk by seeking high quality counterparties.
Revenue Recognition.
The Company derives revenue principally from sales of manufacturing services, components and other products. Other sources of revenue include order fulfillment, logistic and repair services, and sales of certain inventory, primarily raw materials, to customers whose requirements change after the Company has procured inventory to fulfill the customers' forecasted demand. The Company recognizes revenue for manufacturing services, components, products and sales of certain inventory when a persuasive arrangement between the Company and the buyer exists, usually in the form of a purchase order received from the Company's customer, the price is fixed or determinable, delivery or performance has occurred and collectability is reasonably assured. Generally, there are no formal customer acceptance requirements or further obligations related to the product or the inventory subsequent to transfer of title and risk of loss.
The Company's order fulfillment and logistics services involve warehousing and managing finished product on behalf of a customer. These services are usually provided in conjunction with manufacturing services at one of the Company's facilities. In these instances, revenue for manufacturing services is deferred until the related goods are delivered to the customer, which is upon completion of order fulfillment and logistics services. In certain instances, the Company's facility used to provide order fulfillment and logistics services is controlled by the customer pursuant to a separate arrangement. In these instances, revenue for manufacturing services is recognized upon receipt of the manufactured product at the customer-controlled location and revenue for order fulfillment and logistics services is recognized separately as the services are provided. Revenue for repair services is generally recognized upon completion of the services.
Provisions are made for estimated sales returns and other adjustments at the time revenue is recognized. Such provisions were not material to the consolidated financial statements for any period presented herein. The Company presents sales net of sales taxes and value-added taxes in its consolidated statements of operations. Amounts billed to customers for shipping and handling are recorded as revenue and shipping and handling costs incurred by the Company are included in cost of sales.
Income taxes.
The Company estimates its income tax provision or benefit in each of the jurisdictions in which it operates, including estimating exposures and making judgments regarding the realizability of deferred tax assets. The carrying value of the Company's net deferred tax assets is based on the Company's belief that it is more likely than not that the Company will generate sufficient future taxable income in certain jurisdictions to realize these deferred tax assets. A valuation allowance has been established for deferred tax assets which do not meet the “more likely than not” criteria discussed above
.
The Company's tax rate is highly dependent upon the geographic distribution of its worldwide income or losses, the tax regulations and tax holidays in each geographic region, the availability of tax credits and carryforwards, including net operating losses, and the effectiveness of its tax planning strategies.
The Company makes an assessment of whether each income tax position is “more likely than not” of being sustained on audit, including resolution of related appeals or litigation, if any. For each income tax position that meets the “more likely
57
than not” recognition threshold, the Company then assesses the largest amount of tax benefit that is greater than 50% likely of being realized upon effective settlement with the tax authority. Interest and penalties related to unrecognized tax benefits are recognized as a component of income tax expense.
Recent Accounting Pronouncements Adopted in Fiscal Year 2018
In January 2017, the FASB issued ASU 2017-04, "Intangibles-Goodwill and Other (Topic 350)". This ASU simplifies the test for goodwill impairment by eliminating Step 2 of the goodwill impairment test which requires a hypothetical purchase price allocation to measure goodwill. A goodwill impairment loss will instead be measured at the amount by which a reporting unit's carrying value exceeds its fair value, not to exceed the carrying value of goodwill allocated to that reporting unit. The Company adopted this ASU in fiscal 2018 at the time of its annual impairment review and recognized a
$31 million
goodwill impairment charge because the fair value of one of its CPS operating segments was below its carrying value. This impairment reduced goodwill to zero for this particular operating segment. As of
September 29, 2018
, the Company has goodwill of
$29 million
, which is recorded in other noncurrent assets on the consolidated balance sheets.
In March 2016, the FASB issued ASU 2016-09 "Improvements to Employee Share-Based Payment Accounting (Topic 718)". This ASU addresses several aspects of accounting for share-based payment award transactions, including: (a) income tax consequences, (b) classification of awards as either equity or liabilities, and (c) classification in the statement of cash flows. The Company adopted this ASU at the beginning of 2018 and recorded an increase to its deferred tax assets of
$43 million
, with a corresponding increase to retained earnings. This ASU is expected to increase the variability of the Company's provision for income taxes, the effect of which could be material. Additionally, this ASU allows companies to estimate the impact of stock award forfeitures at the grant date and reduce the amount of stock compensation expense recognized over the vesting period of the awards, or to account for forfeitures as they occur. The Company has elected to continue to estimate forfeitures at the grant date. Lastly, this ASU requires the cash effect of excess tax benefits to be classified as an operating cash outflow, as opposed to a financing cash outflow, on the statement of cash flows. Due to the Company’s net operating losses in the U.S., excess tax benefits have no cash impact on the Company's cash flows and therefore there was no impact to the Company’s consolidated statements of cash flows upon adoption of this ASU.
In July 2015, the FASB issued ASU 2015-11, "Simplifying the Measurement of Inventory (Topic 330)". This ASU requires measurement of inventory at the lower of cost and net realizable value. Net realizable value is defined as estimated selling prices in the ordinary course of business, less reasonably predictable costs of completion, disposal, and transportation. Currently, inventory is generally measured at the lower of cost or market, except for excess and obsolete inventories which are carried at their estimated net realizable values. There was no impact to the Company upon adoption of this ASU at the beginning of 2018.
Recent Accounting Pronouncements Not Yet Adopted
In June 2018, the FASB issued ASU 2018-07 "Improvements to Non-employee Share-Based Payment Accounting (Topic 718)". The ASU expands the scope of Topic 718 to include share-based payment transactions for acquiring goods and services from non-employees. The standard aligns measurement and classification guidance for share-based payments to non-employees with the guidance applicable to employees. This ASU is effective for the Company at the beginning of fiscal 2020, including interim periods within that reporting period, although early adoption is permitted. The Company does not expect the impact of adoption to be significant.
In February 2018, the FASB issued ASU 2018-02,
"Income Statement-Reporting Comprehensive Income (Topic 220): Reclassification of Certain Tax Effects from Accumulated Other Comprehensive Income",
which allows companies to reclassify stranded tax effects resulting from the U.S. Tax Cuts and Jobs Act from accumulated other comprehensive income to retained earnings. The guidance also requires certain new disclosures regardless of the election. This ASU is effective for the Company at the beginning of fiscal 2020, although early adoption is permitted. The Company is currently evaluating when to adopt this ASU, but does not expect the impact of adoption to be significant.
In August 2017, the FASB issued ASU 2017-12, "Derivatives and Hedging (Topic 815): Targeted Improvements for Accounting For Hedging Activities", simplifying hedge accounting guidance and improving the financial reporting of hedging relationships by allowing an entity to better align its risk management activities and financial reporting for hedging relationships through changes to both designation and measurement for qualifying hedging relationships and the presentation of hedge results. This standard eliminates the requirement to separately measure and report hedge ineffectiveness, resulting in full recognition of the change in fair value that impacts earnings in the same income statement line item that is used to present the earnings effect of the hedged item. In addition, the guidance allows more flexibility in the requirements to qualify for and
58
maintain hedge accounting. This ASU is effective for the Company at the beginning of fiscal 2020 although early adoption is permitted. The Company is currently evaluating the potential impact of this ASU and when to adopt it.
In March 2017, the FASB issued ASU 2017-07, "Compensation-Retirement Benefits (Topic 715)". This ASU requires the service costs component of net periodic pension costs to be presented in the same line item as other compensation costs and all other components of net periodic pension costs to be presented in the income statement as non-operating expenses. This ASU is effective for the Company at the beginning of fiscal 2019 and must be applied retrospectively. A practical expedient permits the use of estimates for applying the retrospective presentation requirements. The Company does not expect the impact of adopting this new accounting standard to be significant.
In January 2017, the FASB issued ASU 2017-01, "Business Combinations (Topic 805)". This ASU provides guidance to clarify the definition of a business with the objective of adding guidance to assist entities with evaluating whether transactions should be accounted for as acquisitions (or disposals) of assets or businesses. The new standard is effective for the Company at the beginning of fiscal 2019, including interim periods within that reporting period, although early adoption is permitted.
In November 2016, the FASB issued ASU 2016-18, "Statement of Cash Flows (Topic 230)". This ASU requires that the statement of cash flows explains the change during the period in the total of cash, cash equivalents and amounts generally described as restricted cash or restricted cash equivalents. Companies will also be required to reconcile such total to amounts on the balance sheet and disclose the nature of the restrictions. This ASU is effective for the Company at the beginning of fiscal 2019, including interim periods within that annual period. The Company does not expect the impact of adopting this new accounting standard to be significant.
In October 2016, the FASB issued ASU 2016-16, "Intra-Entity Transfers of Assets Other Than Inventory (Topic 740)". This ASU simplifies the accounting for income tax consequences of intra-entity transfers of assets other than inventory by requiring recognition of current and deferred income tax consequences when such transfers occur. The new standard is effective for the Company at the beginning of fiscal 2019, including interim periods within that annual period. The Company does not expect the impact of adopting this new accounting standard to be significant.
In February 2016, the FASB issued ASU 2016-02, "Leases: Amendments to the FASB Accounting Standards Codification (Topic 842)". This ASU requires the Company to recognize on the balance sheet the assets and liabilities for the rights and obligations created by leases with terms of more than twelve months. This ASU also requires disclosures enabling the users of financial statements to understand the amount, timing and uncertainty of cash flows arising from leases. The new standard is effective for the Company at the beginning of fiscal 2020, including interim periods within that reporting period. In addition, the FASB provided a practical expedient transition method to adopt the new lease requirements by allowing entities to initially apply requirements by recognizing a cumulative-effect adjustment to the opening balance of retained earnings in the period of adoption that would enable the Company to not provide comparative period financial statements. Instead, the Company would apply the transition provisions of the leases standard at its effective date. The Company expects the impact of adopting this new accounting standard to be material to its consolidated balance sheets, but is still evaluating the impact to its consolidated statements of operations.
In May 2014, the FASB issued ASU 2014-09, "Revenue from Contracts with Customers (Topic 606)," which supersedes the revenue recognition requirements in “Revenue Recognition (Topic 605).” This ASU requires an entity to recognize revenue when goods are transferred or services are provided to customers in an amount that reflects the consideration to which the entity expects to be entitled in exchange for those goods or services. This ASU also requires disclosures enabling users of financial statements to understand the nature, amount, timing, and uncertainty of revenue and cash flows arising from contracts with customers. The new standard is effective for the Company in fiscal 2019, including interim periods within that reporting period. The Company has elected to adopt the new standard using the modified retrospective method, which does not require prior periods to be restated to conform to the requirements of the new standard.
The Company has determined that the new standard will result in a significant change to the timing of the Company’s recognition of revenue. Under the current accounting standard, the majority of the Company’s revenue is recognized at a point-in-time, which is generally upon delivery (transfer of title and risks of ownership) of a product to a customer or completion of a service for a customer. Under the new standard, for contracts in existence as of the date of adoption, the majority of the Company’s revenue is expected to be recognized on an "over time" basis, which will generally be over the period during which the Company manufactures a product for a customer or delivers a service to a customer. Despite earlier recognition of revenue under the new standard, the Company does not expect the new standard to materially impact its revenue or gross profit on a rollover basis in periods after adoption.
59
However, the new standard is expected to have a material impact to the Company's consolidated balance sheets upon initial adoption, primarily because of a reduction in finished goods and work-in-process inventories for revenue that will be recognized on an over time basis under the new standard and an associated increase in contract assets for amounts recognized as revenue in advance of invoicing a customer. The Company estimates the net impact upon adoption of the new standard will be an increase to beginning retained earnings as of September 29, 2018 of
$10 million
to
$40 million
.
Other than as noted above, the Company does not currently expect adoption of the new standard to materially impact the Company’s consolidated financial statements. However, the Company is continuing to assess the impact of adopting the new standard, including expanded disclosure requirements, on its consolidated financial statements.
Inventories
Components of inventories were as follows:
|
As of
|
|||||||
|
September 29,
2018 |
September 30,
2017 |
||||||
|
(In thousands)
|
|||||||
|
Raw materials
|
$
|
1,139,585
|
|
$
|
834,694
|
|
|
|
Work-in-process
|
132,803
|
|
106,914
|
|
|||
|
Finished goods
|
101,616
|
|
110,061
|
|
|||
|
Total
|
$
|
1,374,004
|
|
$
|
1,051,669
|
|
|
Property, Plant and Equipment, net
Property, plant and equipment consisted of the following:
|
As of
|
|||||||
|
September 29,
2018 |
September 30,
2017 |
||||||
|
(In thousands)
|
|||||||
|
Machinery and equipment
|
$
|
1,476,903
|
|
$
|
1,452,648
|
|
|
|
Land and buildings
|
617,258
|
|
607,701
|
|
|||
|
Leasehold improvements
|
56,190
|
|
55,688
|
|
|||
|
Furniture and fixtures
|
23,911
|
|
22,989
|
|
|||
|
Construction in progress
|
47,725
|
|
37,864
|
|
|||
|
|
2,221,987
|
|
2,176,890
|
|
|||
|
Less: Accumulated depreciation and amortization
|
(1,579,074
|
)
|
(1,536,615
|
)
|
|||
|
Property, plant and equipment, net
|
$
|
642,913
|
|
$
|
640,275
|
|
|
Depreciation expense was
$112 million
,
$111 million
and
$104 million
for
2018
,
2017
and
2016
, respectively.
Goodwill and Other Intangible Assets
Goodwill and other intangible assets are included in other noncurrent assets on the consolidated balance sheets. Net carrying values of goodwill and other intangible assets were as follows:
60
|
As of
|
|||||||
|
September 29,
2018 |
September 30,
2017 |
||||||
|
(In thousands)
|
|||||||
|
Goodwill - beginning of year
|
$
|
59,126
|
|
$
|
59,126
|
|
|
|
Impairment
|
(30,610
|
)
|
—
|
|
|||
|
Goodwill - end of year
|
$
|
28,516
|
|
$
|
59,126
|
|
|
|
Intangible assets - beginning of year
|
$
|
9,218
|
|
$
|
16,498
|
|
|
|
Amortization
|
(6,516
|
)
|
(7,280
|
)
|
|||
|
Intangible assets - end of year
|
$
|
2,702
|
|
$
|
9,218
|
|
|
During the Company's annual goodwill impairment analysis, the Company concluded that the fair value of one of its CPS operating segments was below its carrying value, resulting in an impairment charge of
$31 million
. The fair value of the reporting unit was estimated based on the present value of future discounted cash flows.
Other Operating Expenses
Other operating expenses consisted of the following:
|
Year Ended
|
|||||||||||
|
September 29,
2018 |
September 30,
2017 |
October 1,
2016 |
|||||||||
|
(In thousands)
|
|||||||||||
|
Amortization of intangible assets
|
$
|
2,908
|
|
$
|
3,672
|
|
$
|
3,446
|
|
||
|
Asset impairments
|
—
|
|
4,600
|
|
1,000
|
|
|||||
|
Gain on sale of long-lived assets
|
—
|
|
(1,451
|
)
|
—
|
|
|||||
|
$
|
2,908
|
|
$
|
6,821
|
|
$
|
4,446
|
|
|||
Other Income, net
The following table summarizes the major components of other income, net:
|
Year ended
|
|||||||||||
|
September 29,
2018 |
September 30,
2017 |
October 1,
2016 |
|||||||||
|
(In thousands)
|
|||||||||||
|
Foreign exchange gains / (losses)
|
$
|
766
|
|
$
|
4,709
|
|
$
|
(415
|
)
|
||
|
Bargain purchase gain, net of tax
|
—
|
|
—
|
|
1,642
|
|
|||||
|
Other, net
|
3,798
|
|
2,973
|
|
2,836
|
|
|||||
|
Total
|
$
|
4,564
|
|
$
|
7,682
|
|
$
|
4,063
|
|
||
61
Fair Value Measurements
Fair Value of Financial Instruments
The fair values of cash equivalents (generally less than 10% of cash and cash equivalents), accounts receivable, accounts payable and short-term debt approximate carrying value due to the short term duration of these instruments.
Fair Value Option for Long-term Debt
As of
September 29, 2018
,
the fair value of the Company's long-term debt, as estimated based primarily on quoted prices (Level 2 input), was equivalent to its carrying amount.
The Company has elected not to record its long-term debt instruments at fair value.
Assets and Liabilities Measured at Fair Value on a Recurring Basis
The Company's primary financial assets and financial liabilities measured at fair value on a recurring basis are deferred compensation plan assets, deferred benefit plan assets, foreign exchange contracts, interest rate swaps and contingent consideration. The fair value of these assets and liabilities, other than defined benefit plan assets (Level 1 input) and deferred compensation plan assets (Level 1 input), was not material as of
September 29, 2018
or
September 30, 2017
.
Offsetting Derivative Assets and Liabilities
The Company has entered into master netting arrangements with each of its derivative counterparties that allows net settlement of derivatives assets and liabilities under certain conditions, such as multiple transactions with the same currency maturing on the same date. The Company presents its derivative assets and derivative liabilities on a gross basis in the consolidated balance sheets. The amount that the Company had the right to offset under these netting arrangements was not material as of
September 29, 2018
or
September 30, 2017
.
Other non-financial assets, such as intangible assets, goodwill and other long-lived assets, are measured at fair value as of the date such assets are acquired or in the period an impairment is recorded.
Derivative Instruments
Foreign Exchange Rate Risk
The Company is exposed to certain risks related to its ongoing business operations. The primary risks managed by using derivative instruments is foreign currency exchange risk.
Forward contracts on various foreign currencies are used to manage foreign currency risk associated with forecasted foreign currency transactions and certain monetary assets and liabilities denominated in non-functional currencies. The Company's primary foreign currency cash flows are in certain Asian and European countries, Brazil, Israel and Mexico.
The Company had the following outstanding foreign currency forward contracts that were entered into to hedge foreign currency exposures:
|
|
As of
|
||||
|
September 29, 2018
|
|
September 30, 2017
|
|||
|
Derivatives Designated as Accounting Hedges:
|
|||||
|
Notional amount (in thousands)
|
$116,992
|
$105,523
|
|||
|
Number of contracts
|
54
|
58
|
|||
|
Derivatives Not Designated as Accounting Hedges:
|
|||||
|
Notional amount (in thousands)
|
$356,076
|
$302,944
|
|||
|
Number of contracts
|
56
|
|
46
|
|
|
62
The Company utilizes foreign currency forward contracts to hedge certain operational (“cash flow”) exposures resulting from changes in foreign currency exchange rates. Such exposures generally result from (1) forecasted sales denominated in currencies other than those used to pay for materials and labor, (2) forecasted non-functional currency labor and overhead expenses, (3) forecasted non-functional currency operating expenses, and (4) anticipated capital expenditures denominated in a currency other than the functional currency of the entity making the expenditures. These contracts are designated as cash flow hedges for accounting purposes and are generally one-to-two months in duration but, by policy, may be up to
twelve months
in duration.
For derivative instruments that are designated and qualify as cash flow hedges, the effective portion of the gain or loss on the derivative is recorded in Accumulated Other Comprehensive Income ("AOCI"), a component of equity, and reclassified into earnings in the same period or periods during which the hedged transaction affects earnings. The amount of gains (loss) recognized in Other Comprehensive Income ("OCI") on derivative instruments (effective portion), the amount of gain (loss) reclassified from AOCI into income (effective portion) and the amount of ineffectiveness were
not material
for any period presented herein. As of
September 29, 2018
, AOCI related to foreign currency forward contracts was
not material
.
The Company enters into short-term foreign currency forward contracts to hedge currency exposures associated with certain monetary assets and liabilities denominated in non-functional currencies. These contracts have maturities of up to
two months
and are not designated as accounting hedges. Accordingly, these contracts are marked-to-market at the end of each period with unrealized gains and losses recorded in other income, net, in the consolidated statements of operations. The amount of gains (losses) associated with these forward contracts were not material for any period presented herein. From an economic perspective, the objective of the Company's hedging program is for gains and losses on forward contracts to substantially offset gains and losses on the underlying hedged items. In addition to the contracts disclosed in the table above, the Company has numerous contracts that have been closed from an economic and financial accounting perspective and will settle early in the first month of the following quarter. Since these offsetting contracts do not expose the Company to risk of fluctuations in exchange rates, these contracts have been excluded from the above table.
In addition to the short-term contracts discussed above, the Company has a foreign currency forward contract that matures in 2020 and was entered into as a hedge of foreign currency exposure associated with a long-term promissory note issued in connection with a previous business combination.
Interest Rate Risk
During the fourth quarter of 2018, the Company entered into a forward interest rate swap agreement with an aggregate notional amount of
$50 million
with an independent counterparty to partially hedge the variability in cash flows due to changes in the benchmark interest rate (LIBOR) associated with anticipated variable rate borrowings. The interest rate swap has an effective date of
June 3, 2019
, a maturity date of
December 1, 2023
, and effectively converts the Company's variable interest rate obligations to fixed interest rate obligations. The swap is accounted for as cash flow hedge under ASC Topic 815, Derivatives and Hedging. The Company entered into additional interest rate swaps with aggregate notional amounts totaling
$100 million
during the first quarter of 2019 bringing the total swap value to
$150 million
with an effective interest rate of approximately
4.5%
.
Financial instruments that potentially subject the Company to credit risk consist primarily of cash, cash equivalents, trade accounts receivable, foreign currency forward contracts and interest rate swap agreement. The carrying value of assets such as cash, cash equivalents and accounts receivable is expected to approximate fair value due to the short duration of the assets. The Company maintains its cash and cash equivalents with recognized financial institutions that management believes to be of high credit quality. One of the Company's most significant credit risks is the ultimate realization of accounts receivable. This risk is mitigated by ongoing credit evaluations of, and frequent contact with, the Company's customers, especially its most significant customers, thus enabling it to monitor changes in business operations and respond accordingly. The Company generally does not require collateral for sales on credit. The Company considers these concentrations of credit risks when estimating its allowance for doubtful accounts. Foreign currency forward contracts and interest rate swap are maintained with high quality counterparties to reduce the Company's credit risk and are recorded on the Company's balance sheets at fair value.
One
customer represented more than 10% of the Company's net sales in 2018 and 2016 and
two
customers each represented more than 10% of the Company's net sales in 2017.
One
customer represented 10% or more of the Company's gross accounts receivable as of
September 29, 2018
and
September 30, 2017
.
63
Long-term debt consisted of the following:
|
As of
|
|||||||
|
September 29,
2018 |
September 30,
2017 |
||||||
|
(In thousands)
|
|||||||
|
Senior secured notes due 2019
|
$
|
375,000
|
|
$
|
375,000
|
|
|
|
Non-interest bearing promissory notes
|
17,667
|
|
19,863
|
|
|||
|
Total long-term debt
|
392,667
|
|
394,863
|
|
|||
|
Less: Current portion of non-interest bearing promissory notes
|
3,321
|
|
3,416
|
|
|||
|
Current portion of long-term debt
|
375,000
|
|
—
|
|
|||
|
Long-term debt
|
$
|
14,346
|
|
$
|
391,447
|
|
|
Secured Debt.
During the second quarter of 2017, the Company prepaid the balance of the amount due under its secured debt due 2017 for
$40 million
plus accrued interest.
Secured Notes.
In 2014, the Company issued
$375 million
of senior secured notes due 2019 ("Secured Notes"). The Secured Notes mature on
June 1, 2019
and bear interest at an annual rate of
4.375%
, payable
semi-annually in arrears
in cash. Debt issuance costs incurred in connection with issuance of the Secured Notes were not material.
The Secured Notes are senior secured obligations and are fully and unconditionally guaranteed, jointly and severally, on a senior secured basis by certain subsidiaries of the Company. The Secured Notes and the guarantees are secured by a first-priority lien, subject to permitted liens, on certain tangible and intangible assets including certain real property, equipment and intellectual property, and by a second-priority lien on certain assets, including accounts receivable, inventory and stock of subsidiaries, securing the Company’s revolving credit facility.
All or any portion of the Secured Notes may be redeemed, at any time, at the option of the Company, at a redemption price equal to 100% of the principal amount of the Secured Notes redeemed plus accrued and unpaid interest, plus a make-whole premium. Following a change of control, as defined, the Company would be required to make an offer to repurchase all of the Secured Notes at a purchase price of 101% of the principal amount of the Secured Notes to be repurchased, plus accrued and unpaid interest to, but excluding, the date of repurchase.
The Secured Notes are subject to specified events of default, including payment defaults, breaches of covenants, certain payment defaults at final maturity or acceleration of other indebtedness, failure to pay certain judgments, certain events of bankruptcy, insolvency and reorganization involving the Company or certain of its subsidiaries and certain instances in which a guarantee ceases to be in full force and effect. If any event of default occurs and is continuing, subject to certain exceptions, the trustee or the holders of at least 25% in aggregate principal amount of the then outstanding Secured Notes, may declare all the Secured Notes to be due and payable immediately, together with any accrued and unpaid interest, if any, to the acceleration date. In the case of an event of default resulting from certain events of bankruptcy, insolvency or reorganization involving the Company, such amounts with respect to the Secured Notes will be due and payable immediately without any declaration or other act on the part of the trustee or the holders of the Secured Notes.
Non-interest Bearing Promissory Notes.
On
February 1, 2016
, the Company completed an acquisition and financed
$15 million
of the purchase price with the acquiree using a
four-year non-interest bearing promissory note
with a discounted value of
$12 million
as of the acquisition date (see Note 13).
64
Short-term Debt
Revolving Credit Facility.
During the second quarter of 2018, the Company entered into an amended Cash Flow Revolver (the "Amended Cash Flow Revolver") that increased the amount available under the facility to
$500 million
and extended the term to
February 1, 2023
provided the Company’s available liquidity is at least equal to the outstanding balance of the Company’s senior secured notes due 2019 during the six month period prior to the maturity date of such notes, which is
June 1, 2019
. Subject to satisfaction of certain conditions, including obtaining additional commitments from existing and/or new lenders, the Company may increase the revolver commitments under the Amended Cash Flow Revolver by up to an additional
$200 million
and/or add new term loan commitments of up to
$375 million
. Sanmina’s and certain subsidiary guarantors’ obligations under the Amended Cash Flow Revolver are secured by property of Sanmina and such guarantors, including, but not limited to, cash, accounts receivable, inventory and shares of our subsidiaries, subject to limited exceptions. The Company expects to meet the liquidity condition needed to maintain the extended maturity date of the Amended Cash Flow Revolver. There can be no assurance that the Company will be successful in meeting this condition, in which case the maturity date of the Amended Cash Flow Revolver would be no later than 92 days prior to the maturity date of the Secured Notes.
During the fourth quarter of 2018, the Company entered into a forward interest rate swap agreement with an aggregate notional amount of
$50 million
with an independent counterparty to partially hedge the variability in cash flows due to changes in the benchmark interest rate (LIBOR) associated with anticipated variable rate borrowings. The interest rate swap has an effective date of
June 3, 2019
, a maturity date of
December 1, 2023
, and effectively converts the variable interest rate obligations to fixed interest rate obligations. The swap is accounted for as cash flow hedge under ASC Topic 815, Derivatives and Hedging. The Company entered into additional interest rate swaps with aggregate notional amounts totaling
$100 million
during the first quarter of 2019 bringing the total swap value to
$150 million
with an effective interest rate of approximately
4.5%
.
The Company and certain subsidiary guarantors’ obligations under the Amended Cash Flow Revolver are secured by property of the Company and such guarantors, including, but not limited to cash, accounts receivables, inventory and the shares of the Company's subsidiaries, subject to limited exceptions.
The Amended Cash Flow Revolver requires the Company to comply with a minimum consolidated interest coverage ratio, measured at the end of each fiscal quarter, and at all times a maximum consolidated leverage ratio. The Amended Cash Flow Revolver contains customary affirmative covenants, including covenants regarding the payment of taxes and other obligations, maintenance of insurance, reporting requirements and compliance with applicable laws and regulations.
As of
September 29, 2018
,
$215 million
of borrowings and
$8 million
of letters of credit were outstanding under the Amended Cash Flow Revolver.
Foreign Short-term Borrowing Facilities
. As of
September 29, 2018
, certain foreign subsidiaries of the Company had a total of
$69 million
of short-term borrowing facilities, under which
no
borrowings were outstanding. These facilities expire at various dates through
the second quarter of 2019
.
Debt Covenants
The Company's Amended Cash Flow Revolver requires the Company to comply with certain financial covenants. In addition, the Company's debt agreements contain a number of restrictive covenants, including restrictions on incurring additional debt, making investments and other restricted payments, selling assets, paying dividends and redeeming or repurchasing capital stock and debt, subject to certain exceptions. The Company was in compliance with these covenants as of
September 29, 2018
.
During 2018, the Company entered into a Receivables Purchase Agreement (the “RPA”) with certain third-party banking institutions for the sale of trade receivables generated from sales to certain customers. A maximum of
$540 million
of sold receivables can be outstanding at any point in time under this program, subject to limitations under the Company's Amended Cash Flow Revolver. Trade receivables sold pursuant to the RPA are serviced by the Company.
In addition to the RPA, the Company has the option to participate in trade receivables sales programs that have been implemented by certain of the Company's customers, as in effect from time to time. The Company does not service trade receivables sold under these other programs.
65
Under each of the programs noted above, the Company sells its entire interest in a trade receivable for
100%
of face value, less a discount. For the years ended
September 29, 2018
and
September 30, 2017
, the Company sold
$917 million
and
$491 million
, respectively, of accounts receivable under these programs. Upon sale, these receivables are removed from the consolidated balance sheets and cash received is presented as cash provided by operating activities in the consolidated statements of cash flows. Discounts on sold receivables were not material for any period presented. As of
September 29, 2018
,
$189 million
of accounts receivable sold under the RPA and subject to servicing by the Company remained outstanding and had not yet been collected.
From time to time, the Company is a party to litigation, claims and other contingencies, including environmental and employee matters and examinations and investigations by governmental agencies, which arise in the ordinary course of business. The Company cannot predict what effect these matters may have on its results of operations, financial condition or cash flows.
The Company records a contingent liability when it is probable that a loss has been incurred and the amount of loss is reasonably estimable in accordance with ASC Topic 450,
Contingencies
or other applicable accounting standards. As of
September 29, 2018
and
September 30, 2017
, the Company had reserves of
$35 million
and
$36 million
, respectively, for environmental matters, warranty, litigation, contingent consideration and other contingencies (excluding reserves for uncertain tax positions) which the Company believes are adequate. However, there can be no assurance that the Company's reserves will be sufficient to settle these contingencies. Such reserves are included in accrued liabilities and other long-term liabilities on the consolidated balance sheets.
In
January 2018
, the Company received a notice of intent from a foreign government agency to bring a claim seeking up to
$23 million
asserting that the Company had been out of compliance from April 2015 through September 2016 with certain requirements of the Company’s exemption from goods and services tax on imported goods. Such claim, if formally made, could seek payment for allegedly unpaid goods and services tax. No formal claim has been brought to date. The Company believes it has good faith arguments in defense of its actions and has provided these arguments to the government agency in writing, most recently in April 2018. No further communications have been received from the agency since that time and the Company cannot, at this time, determine the outcome of this matter and has not provided a reserve for this matter as of
September 29, 2018
.
Legal Proceedings
Environmental Matters
The Company is subject to various federal, state, local and foreign laws and regulations and administrative orders concerning environmental protection, including those addressing the discharge of pollutants into the environment, the management and disposal of hazardous substances, the cleanup of contaminated sites, the materials used in products, and the recycling, treatment and disposal of hazardous waste. As of
September 29, 2018
, the Company had been named in a lawsuit and several administrative orders alleging certain of its current and former sites contributed to groundwater contamination. One such order requires the Company's Canadian subsidiary to remediate certain environmental contamination at a site owned by the subsidiary between 1999 and 2006. As of
September 29, 2018
, the Company believes it has reserved a sufficient amount to satisfy anticipated future investigation and remediation costs at this site. Another such order demands that the Company and other alleged defendants remediate groundwater contamination at two landfills located in Northern California to which the Company may have sent wastewater in the past. The Company continues to investigate the allegations contained in this order and has reserved its estimated exposure for this matter as of
September 29, 2018
. However, there can be no assurance that the Company's reserve will ultimately be sufficient.
In June 2008, the Company was named by the Orange County Water District in a suit alleging that its actions contributed to polluted groundwater managed by the plaintiff. The complaint seeks recovery of compensatory and other damages, as well as declaratory relief, for the payment of costs necessary to investigate, monitor, remediate, abate and contain contamination of groundwater within the plaintiff’s control. In April 2013, all claims against the Company were dismissed. The plaintiff appealed this dismissal and the appeals court reversed the judgment in August 2017. In November 2017, the California Supreme Court denied the Company’s petition to review this decision and, in December 2017, the Court of Appeal remanded the case back to the Superior Court for further proceedings. A trial date has not yet been set. The Company intends to contest the plaintiff’s claims vigorously.
66
Other Matters
Two of the Company’s subsidiaries in Brazil are parties to a number of administrative and judicial proceedings for claims alleging that these subsidiaries failed to comply with certain bookkeeping and tax rules for certain periods between 2001 and 2011. These claims seek payment of social fund contributions and income and excise taxes allegedly owed by the subsidiaries, as well as fines. The subsidiaries believe they have meritorious positions in these matters and intend to continue to contest the claims.
In October 2018, an individual who had been employed by the Company from November 2015 to March 2016 filed a lawsuit against the Company in the Santa Clara County Superior Court on behalf of himself and all other similarly situated Company employees in California, alleging violations of California labor code provisions governing overtime, meal and rest periods, wages, wage statements and reimbursement of business expenses. The complaint seeks certification of a class of all non-exempt employees, whether employed directly or through a temporary staffing agency, employed from four years before filing of the complaint to time of trial. Although the Company is investigating the allegations and cannot, at the current time, determine the outcome of this matter and has not provided a reserve for this matter as of
September 29, 2018
, the Company intends to defend against this matter vigorously.
Other Contingencies
One of the Company's most significant risks is the ultimate realization of accounts receivable and customer inventory exposures. This risk is partially mitigated by ongoing credit evaluations of, and frequent contact with, the Company's customers, especially its most significant customers, thus enabling it to monitor changes in business operations and respond accordingly. Customer bankruptcies also entail the risk of potential recovery by the bankruptcy estate of amounts previously paid to the Company that are deemed a preference under bankruptcy laws.
Commitments - Operating Leases
The Company leases certain of its facilities and equipment under non-cancellable operating leases expiring at various dates through
2042
. The Company is responsible for utilities, maintenance, insurance and property taxes under these leases. Future minimum lease payments, net of sublease income, under operating leases are as follows:
|
(In thousands)
|
|||
|
2019
|
$
|
21,188
|
|
|
2020
|
14,647
|
|
|
|
2021
|
13,036
|
|
|
|
2022
|
9,635
|
|
|
|
2023
|
6,038
|
|
|
|
Thereafter
|
21,220
|
|
|
|
Total
|
$
|
85,764
|
|
Rent expense, net of sublease income, under operating leases was
$27 million
,
$24 million
and
$24 million
for
2018
,
2017
and
2016
, respectively.
In the first quarter of 2018, the Company began implementing restructuring actions to address the closure and/or relocation of three of its manufacturing facilities. In addition, the Company is still in the process of completing restructuring actions under other plans.
The following table is a summary of restructuring costs associated with these plans:
67
|
Estimated Costs to Implement
|
Year ended September 29, 2018
|
||||||
|
Q1 FY18 Plan:
|
(In thousands)
|
||||||
|
Severance costs (approximately 2,900 employees)
|
$
|
27,700
|
|
$
|
26,425
|
|
|
|
Other exit costs (recognized as incurred)
|
7,300
|
|
4,984
|
|
|||
|
Total
|
35,000
|
|
31,409
|
|
|||
|
Severance reimbursement
|
(10,000
|
)
|
(10,000
|
)
|
|||
|
Total - Q1 FY18 Plan
|
$
|
25,000
|
|
21,409
|
|
||
|
Other plans
|
7,737
|
|
|||||
|
Total - all plans
|
$
|
29,146
|
|
||||
Q1 FY18 Plan
Actions under the Q1 FY18 plan began in the first quarter of 2018 and are expected to occur through calendar 2019. Cash payments of severance and other costs began in the second quarter of 2018 and are expected to occur through the end of calendar 2019. In connection with this plan, the Company entered into a contractual agreement with a third party pursuant to which up to
$10 million
of severance and retention costs incurred by the Company will be reimbursed. The Company recorded this amount as a reduction of restructuring costs in the second quarter of 2018 and, as of
September 29, 2018
,
$8 million
was included in accounts receivable on the consolidated balance sheets. Costs incurred for other exit costs consist primarily of costs to maintain vacant facilities that are owned and contract termination costs.
Other plans
Costs incurred in connection with other plans include severance costs of
$3.2 million
and other exit costs of
$4.5 million
, consisting primarily of a change in estimate for a certain environmental remediation matter and asset impairment charges.
All Plans
Of the
$29.1 million
of restructuring costs recorded during the year ended September 29, 2018,
$12.2 million
is attributable to the Company's IMS segment and
$16.9 million
is attributable to the Company's CPS segment. As of September 29, 2018,
$24.2 million
of restructuring costs (exclusive of environmental remediation liabilities) have been accrued and recorded in accrued liabilities on the consolidated balance sheets.
In addition to costs expected to be incurred under the Q1 FY18 plan, the Company expects to incur restructuring costs in future periods primarily for vacant facilities and former sites for which the Company is or may be responsible for environmental remediation.
Domestic and foreign components of income before income taxes were as follows:
|
Year Ended
|
|||||||||||
|
September 29,
2018 |
September 30,
2017 |
October 1,
2016 |
|||||||||
|
(In thousands)
|
|||||||||||
|
Domestic
|
$
|
16,215
|
|
$
|
128,493
|
|
$
|
138,138
|
|
||
|
Foreign
|
81,324
|
|
84,987
|
|
66,479
|
|
|||||
|
Total
|
$
|
97,539
|
|
$
|
213,480
|
|
$
|
204,617
|
|
||
68
The provision for income taxes consists of the following:
|
Year Ended
|
|||||||||||
|
September 29,
2018 |
September 30,
2017 |
October 1,
2016 |
|||||||||
|
(In thousands)
|
|||||||||||
|
Federal:
|
|||||||||||
|
Current
|
$
|
(122
|
)
|
$
|
(2,524
|
)
|
$
|
490
|
|
||
|
Deferred
|
170,994
|
|
37,543
|
|
(4,550
|
)
|
|||||
|
State:
|
|||||||||||
|
Current
|
32
|
|
1,648
|
|
(265
|
)
|
|||||
|
Deferred
|
(3,672
|
)
|
4,204
|
|
(5,141
|
)
|
|||||
|
Foreign:
|
|||||||||||
|
Current
|
20,287
|
|
37,076
|
|
32,427
|
|
|||||
|
Deferred
|
5,553
|
|
(3,300
|
)
|
(6,182
|
)
|
|||||
|
Total provision for income taxes
|
$
|
193,072
|
|
$
|
74,647
|
|
$
|
16,779
|
|
||
Impact of U.S. Tax Reform
On December 22, 2017, the U.S. Tax Cuts and Jobs Act (the “Tax Act”) was enacted into law. In accordance with ASC 740,
Income Taxes
, the Company is required to recognize the effect of the Tax Act in the period of enactment, which was the Company’s first quarter of fiscal 2018 that ended on December 30, 2017. The many changes in the Tax Act include a permanent reduction in the maximum federal corporate income tax rate from
35%
to
21%
effective as of January 1, 2018. The statutory federal income tax rate applicable for the Company's fiscal year ending
September 29, 2018
was
24.5%
based on a fiscal year blended rate calculation. Because of this reduction in rate, the Company was required to revalue its U.S. deferred tax assets and liabilities to the new rate in the Company's first quarter of 2018. The Tax Act also requires a mandatory deemed repatriation of undistributed earnings and profits, at the rate of either
15.5%
for cash or
8%
for non-liquid assets.
As of the end of the fourth quarter of 2018, the Company has recorded a net income tax expense for the impact of the Tax Act of approximately
$161 million
, which is comprised of
$175 million
for remeasurement of the Company’s U.S deferred tax assets,
zero
for the mandatory deemed repatriation of undistributed earnings and profits, and a tax benefit of
$14 million
for the conversion to a territorial system. The Company has completed its analysis and accounting with respect to these items.
The Tax Act also includes provisions for Global Intangible Low-Taxed Income (“GILTI”), which imposes taxes on foreign income in excess of a deemed return on tangible assets of foreign corporations. These new provisions are effective for the Company in fiscal year 2019. This income will effectively be taxed at a
10.5%
tax rate. Because of the complexity of the new provisions, the Company is continuing to evaluate how the provisions will be accounted for under U.S. generally accepted accounting principles whereby companies are allowed to make an accounting policy election of either (i) accounting for GILTI as a component of income tax expense in the period in which the Company is subject to the rules (the “period cost method”), or (ii) accounting for GILTI in the Company’s measurement of deferred taxes (the “deferred method”). Currently, the Company has not elected a method and will only do so after completing its analysis of the GILTI provisions of the Tax Act. The Company’s election method will depend, in part, on analyzing the Company’s global income to determine whether the Company expects to have future U.S. inclusions in its taxable income related to GILTI and, if so, the impact that is expected. In accordance with SEC’s Accounting Bulletin No. 118, the Company will finalize the election to account for GILTI under the period cost method or deferred cost method during the first quarter of 2019. However, at this time, regardless of the Company’s election method, the Company does not expect the impact of GILTI to be material to the Company’s tax rate or to incur additional cash taxes as a result of GILTI.
The Company's provision for income taxes for
2018
,
2017
and
2016
was
$193 million
(
198%
of income before taxes),
$75 million
(
35%
of income before taxes) and
$17 million
(
8%
of income before taxes), respectively. The increase in income tax expense for 2018 was primarily attributable to the impact of the Tax Act as discussed above, which increased income tax expense approximately
$161 million
because of a non-cash reduction in the carrying value of our net deferred tax assets partially offset by a decrease in the US tax rate from
35%
to
21%
and a
$5 million
discrete tax benefit resulting from a settlement with a foreign tax authority in the third quarter of 2018, which allowed the Company to release an accrual for this uncertain tax position.
69
During the first quarter of 2017, the Company recorded a discrete tax benefit resulting from the merger of two foreign entities, the surviving entity of which was, and continues to be, included in the Company’s U.S. federal consolidated tax group. This restructuring allowed the Company to recognize a U.S. deferred tax asset to reflect the federal deductibility of a foreign uncertain tax position that became recognizable upon the merger of the subsidiaries.
The tax effects of temporary differences that give rise to significant portions of deferred tax assets and liabilities are as follows:
|
As of
|
|||||||
|
September 29, 2018
|
September 30, 2017
|
||||||
|
(In thousands)
|
|||||||
|
Deferred tax assets:
|
|||||||
|
U.S. net operating loss carryforwards
|
$
|
218,710
|
|
$
|
338,492
|
|
|
|
Foreign net operating loss carryforwards
|
129,866
|
|
186,684
|
|
|||
|
Acquisition related intangibles
|
15,099
|
|
13,913
|
|
|||
|
Accruals not currently deductible
|
45,922
|
|
55,582
|
|
|||
|
Property, plant and equipment
|
22,596
|
|
20,746
|
|
|||
|
Tax credit carryforwards
|
13,825
|
|
11,832
|
|
|||
|
Reserves not currently deductible
|
14,420
|
|
21,710
|
|
|||
|
Stock compensation expense
|
13,645
|
|
21,151
|
|
|||
|
Unrealized losses
|
3,145
|
|
4,475
|
|
|||
|
Other
|
2,789
|
|
3,949
|
|
|||
|
Valuation allowance
|
(113,559
|
)
|
(163,267
|
)
|
|||
|
Total deferred tax assets
|
366,458
|
|
515,267
|
|
|||
|
Deferred tax liabilities on undistributed earnings
|
(23,986
|
)
|
(36,027
|
)
|
|||
|
Other deferred tax liabilities
|
(3,802
|
)
|
(8,140
|
)
|
|||
|
Net deferred tax assets
|
$
|
338,670
|
|
$
|
471,100
|
|
|
|
Recorded as:
|
|||||||
|
Non-current deferred tax assets
|
$
|
344,124
|
|
$
|
476,554
|
|
|
|
Non-current deferred tax liabilities
|
(5,454
|
)
|
(5,454
|
)
|
|||
|
Net deferred tax assets
|
$
|
338,670
|
|
$
|
471,100
|
|
|
The Company offsets deferred tax assets and liabilities by tax-paying jurisdiction. The resulting net amounts by tax jurisdiction are then aggregated without further offset.
A valuation allowance is established or maintained when, based on currently available information and other factors, it is more likely than not that all or a portion of the deferred tax assets will not be realized. The Company regularly assesses its valuation allowance against deferred tax assets on a jurisdiction by jurisdiction basis. The Company considers all available positive and negative evidence, including future reversals of temporary differences, projected future taxable income, tax planning strategies and recent financial results. Significant judgment is required in assessing the Company's ability to generate revenue, gross profit, operating income and jurisdictional taxable income in future periods.
Prior to 2012, based on negative evidence (primarily a cumulative history of operating losses), the Company had a full valuation allowance against its net deferred tax assets in the U.S. and certain foreign jurisdictions. In 2012 through 2016, the Company released a portion of its U.S. valuation allowances each year in recognition of its improved historical earnings and increasing future projected earnings. The Company released
$96 million
of the valuation allowance attributable to U.S. and foreign deferred tax assets in 2016. As of
September 29, 2018
and
September 30, 2017
, the Company no longer had a valuation allowance against its U.S. deferred tax assets. The valuation allowance as of
September 29, 2018
relates primarily to foreign net operating losses, with the exception of
$12 million
related to U.S. state net operating losses.
As of
September 29, 2018
, income taxes and foreign withholding taxes have not been provided for approximately
$400 million
of cumulative undistributed earnings of several non-U.S. subsidiaries. The Company intends to reinvest these earnings indefinitely in operations outside of the U.S. Determination of the amount of unrecognized deferred tax liabilities on these undistributed earnings is not practicable.
70
As of
September 29, 2018
, the Company has cumulative net operating loss carryforwards for federal, state and foreign tax purposes of
$931 million
,
$406 million
and
$558 million
, respectively. The federal and state net operating loss carryforwards begin expiring in 2024 and 2019, respectively, and expire at
various dates through 2035
. Certain foreign net operating losses start expiring in 2019. However, the majority of foreign net operating losses carryforward indefinitely. The Tax Reform Act of 1986 and similar state provisions impose restrictions on the utilization of net operating loss and tax credit carryforwards in the event of an “ownership change” as defined in the Internal Revenue Code. The utilization of certain net operating losses may be restricted due to changes in ownership and business operations. Prior to the adoption of ASU 2016-09, the Company was prohibited from recognizing a deferred tax asset for excess tax benefits related to stock and stock option plans that have not been realized through the reduction in income taxes payable. Such unrecognized deferred tax benefit as of September 30, 2017 was
$124 million
on a pre-tax basis and was recognized upon the Company’s adoption of ASU 2016-09,
Improvements to Employee Share-based Accounting,
in 2018 with a corresponding increase to retained earnings.
Following is a reconciliation of the statutory federal tax rate to the Company's effective tax rate:
|
Year Ended
|
||||||||
|
September 29,
2018 |
September 30,
2017 |
October 1,
2016 |
||||||
|
Federal tax at statutory tax rate
|
24.50
|
%
|
35.00
|
%
|
35.00
|
%
|
||
|
Tax Act impact
|
165.16
|
|
—
|
|
—
|
|
||
|
Effect of foreign operations
|
7.92
|
|
1.89
|
|
5.35
|
|
||
|
Foreign income inclusion
|
0.17
|
|
0.26
|
|
9.43
|
|
||
|
Permanent items
|
(1.37
|
)
|
2.10
|
|
(0.29
|
)
|
||
|
Release of valuation allowance
|
—
|
|
—
|
|
(47.10
|
)
|
||
|
Discrete benefit of foreign restructuring
|
—
|
|
(4.92
|
)
|
—
|
|
||
|
Other
|
0.32
|
|
(2.10
|
)
|
4.61
|
|
||
|
State income taxes, net of federal benefit
|
1.24
|
|
2.72
|
|
1.18
|
|
||
|
Effective tax rate
|
197.94
|
%
|
34.95
|
%
|
8.18
|
%
|
||
A reconciliation of the beginning and ending amount of total unrecognized tax benefits, excluding accrued penalties and interest, is as follows:
|
Year Ended
|
|||||||||||
|
September 29,
2018 |
September 30,
2017 |
October 1,
2016 |
|||||||||
|
(In thousands)
|
|||||||||||
|
Balance, beginning of year
|
$
|
67,022
|
|
$
|
55,773
|
|
$
|
51,158
|
|
||
|
Increase (decrease) related to prior year tax positions
|
(5,917
|
)
|
1,670
|
|
(1,872
|
)
|
|||||
|
Increase related to current year tax positions
|
8,392
|
|
9,741
|
|
7,028
|
|
|||||
|
Settlements
|
(7,648
|
)
|
—
|
|
—
|
|
|||||
|
Decrease related to lapse of applicable statute of limitations
|
(1,062
|
)
|
(162
|
)
|
(541
|
)
|
|||||
|
Balance, end of year
|
$
|
60,787
|
|
$
|
67,022
|
|
$
|
55,773
|
|
||
The Company had reserves of
$38 million
and
$40 million
as of
September 29, 2018
and
September 30, 2017
, respectively, for the payment of interest and penalties relating to unrecognized tax benefits. During fiscal year 2018, the Company recognized a net income tax benefit for interest and penalties of
$3 million
compared to a net income tax expense of
$4 million
in
2017
and
$4 million
in
2016
. The Company recognizes interest and penalties related to unrecognized tax benefits as a component of income tax expense. Should the Company be able to ultimately recognize all of these uncertain tax positions, it would result in a benefit to net income and a reduction of the effective tax rate.
The Company conducts business globally and, as a result, files income tax returns in the United States federal jurisdiction and various state and foreign jurisdictions. In the normal course of business, the Company is subject to examination by taxing authorities throughout the world. The Company is currently being audited by the Internal Revenue Service for tax years 2008 through 2010. To the extent the final tax liabilities are different from the amounts accrued, this would result in an increase or decrease in net operating loss carryforwards which would impact tax expense. Additionally, the Company is being audited by various state tax agencies and certain foreign countries. To the extent the final tax liabilities are different from the
71
amounts accrued, the increases or decreases would be recorded as income tax expense or benefit in the consolidated statements of operations. Although the Company believes that the resolution of these audits will not have a material adverse impact on the Company’s results of operations, the outcome is subject to uncertainty.
In general, the Company is no longer subject to United States federal or state income tax examinations for years before 2003, and to foreign examinations for years prior to 2003 in its major foreign jurisdictions. Although the timing of the resolution of audits is highly uncertain, it is reasonably possible that the balance of gross unrecognized tax benefits could significantly change in the next 12 months. However, given the number of years subject to audit and the number of matters being examined, the Company is unable to estimate the full range of possible adjustments to the balance of gross unrecognized tax benefits.
Basic and diluted earnings per share amounts are calculated by dividing net income by the weighted average number of shares of common stock outstanding during the period, as follows:
|
Year Ended
|
|||||||||||
|
September 29,
2018 |
September 30,
2017 |
October 1, 2016
|
|||||||||
|
(In thousands, except per share amounts)
|
|||||||||||
|
Numerator:
|
|||||||||||
|
Net income (loss)
|
$
|
(95,533
|
)
|
$
|
138,833
|
|
$
|
187,838
|
|
||
|
Denominator:
|
|||||||||||
|
Weighted average common shares outstanding
|
69,833
|
|
74,481
|
|
75,094
|
|
|||||
|
Effect of dilutive stock options and restricted stock units
|
—
|
|
3,647
|
|
3,693
|
|
|||||
|
Denominator for diluted earnings per share
|
69,833
|
|
78,128
|
|
78,787
|
|
|||||
|
Net income (loss) per share:
|
|||||||||||
|
Basic
|
$
|
(1.37
|
)
|
$
|
1.86
|
|
$
|
2.50
|
|
||
|
Diluted
|
$
|
(1.37
|
)
|
$
|
1.78
|
|
$
|
2.38
|
|
||
The following table presents weighted-average dilutive securities that were excluded from the above calculation because their inclusion would have had an anti-dilutive effect under ASC Topic 260,
Earnings per Share
, due to application of the treasury stock method:
|
|
As of
|
|||||||
|
|
September 29, 2018
|
September 30, 2017
|
October 1, 2016
|
|||||
|
Potentially dilutive securities:
|
(In thousands)
|
|||||||
|
Employee stock options
|
2,061
|
|
—
|
|
477
|
|
||
|
Restricted stock units
|
1,460
|
|
6
|
|
3
|
|
||
|
Total
|
3,521
|
|
6
|
|
480
|
|
||
Had the Company reported net income in 2018 instead of a net loss,
3 million
potentially dilutive securities would have been included in the calculation of diluted earnings per share.
In 2009, the Company's stockholders approved the 2009 Incentive Plan (“2009 Plan”) and the reservation of
7.5 million
shares of common stock for issuance thereunder, which was subsequently increased to
25.3 million
shares. The 2009 Plan provides for the grant of incentive stock options, non-statutory stock options, restricted stock, restricted stock units, stock appreciation rights, performance stock units, and performance shares. The per share exercise price for shares to be issued pursuant to exercise of an option must be no less than 100% of the fair market value per share on the date of grant.
Upon approval of the 2009 Plan, all of the Company's other stock plans were terminated as to future grants. Although these plans have been terminated, they will continue to govern all awards granted under them until the expiration of the awards.
72
As of
September 29, 2018
, an aggregate of
10.1 million
shares were authorized for future issuance under the Company's stock plans, of which
6.6 million
of such shares were issuable upon exercise of outstanding options and delivery of shares upon vesting of restricted stock units and
3.5 million
shares of common stock were available for future grant. Awards other than stock options and stock appreciation rights reduce common stock available for grant by 1.36 shares for every share of common stock subject to such an award. Awards under the 2009 Plan that expire or are cancelled without delivery of shares generally become available for issuance under the plan. The 2009 Plan will expire as to future grants in January 2019.
Stock Repurchase Program
During the fourth quarter of 2017, the Board of Directors approved a
$200 million
stock repurchase plan. The timing of repurchases made under the plan depends upon capital needs to support the growth of the Company's business, market conditions and other factors. Although stock repurchases are intended to increase stockholder value by reducing the number of outstanding shares, repurchases of shares reduce the Company's liquidity. During
2018
,
2017
and
2016
, the Company repurchased
5.0 million
shares,
4.3 million
shares and
6.8 million
of its common stock for
$146 million
,
$160 million
and
$141 million
(including commissions), respectively. As of
September 29, 2018
,
$108 million
remains available under the repurchase programs authorized by the Board of Directors, inclusive of programs authorized by the Board of Directors prior to 2017, subject to limitations contained in the Company’s debt agreements.
In addition to the repurchases discussed above, the Company repurchased
334,000
,
549,000
and
46,000
shares of its common stock during
2018
,
2017
, and
2016
, respectively, in settlement of employee tax withholding obligations due upon the vesting of restricted stock units. The Company paid
$12 million
,
$17 million
and
$1 million
, respectively, in conjunction with these purchases.
Accumulated Other Comprehensive Income
Accumulated other comprehensive income, net of tax as applicable, consisted of the following:
|
As of
|
|||||||
|
September 29,
2018 |
September 30,
2017 |
||||||
|
(In thousands)
|
|||||||
|
Foreign currency translation adjustments
|
$
|
87,889
|
|
$
|
90,952
|
|
|
|
Unrealized holding losses on derivative financial instruments
|
(335
|
)
|
(212
|
)
|
|||
|
Unrecognized net actuarial loss and unrecognized transition cost for benefit plans
|
(13,610
|
)
|
(13,946
|
)
|
|||
|
Total
|
$
|
73,944
|
|
$
|
76,794
|
|
|
73
Fiscal 2016 Acquisitions
During the second quarter of 2016, the Company purchased all of the outstanding stock of a privately-held provider of data storage software solutions targeted at OEM's and systems integrators.
Goodwill arising from the acquisition is tax deductible and reflects the Company's expectation that the acquisition will enable the Company to broaden its relationships with certain of its existing key customers, realize synergies associated with leveraging the acquisition to develop other software solutions to become a provider of a full storage systems solution, and leverage the acquiree's knowledgeable and experienced workforce.
Goodwill and identifiable assets are recorded in other non-current assets on the consolidated balance sheets. Identifiable intangible assets are being amortized over
three
to
four
years.
In addition, the Company acquired a manufacturing facility and related assets from a customer in the industrial end market during the second quarter of 2016. Consideration paid was less than the fair values of assets acquired, resulting in a bargain purchase gain of
$1.6 million
, net of tax, which was recorded in interest and other, net on the consolidated statements of operations in the second quarter of 2016. The Company reassessed, in the second quarter of 2016, the recognition and measurement of identifiable assets and liabilities acquired and concluded that all acquired assets and liabilities were recognized and that the valuation procedures and resulting estimates of fair values were appropriate.
The bargain purchase gain resulted from the discount attributable to financing a portion of the purchase price with the acquiree using a non-interest bearing promissory note.
Total consideration paid for the above acquisitions was
$90 million
, consisting of
$60 million
of cash and non-interest bearing promissory notes with a discounted value of
$30 million
as of the respective acquisition dates.
The Company's allocation of the purchase price was based on management's estimate of the acquisition-date fair values of the tangible and identifiable intangible assets acquired and liabilities assumed, as follows:
|
(In thousands)
|
|||
|
Current assets, including cash of $1.3 million
|
$
|
33,198
|
|
|
Noncurrent assets, including identifiable intangible assets of $7.3 million and goodwill of $30.8 million
|
62,632
|
|
|
|
Current liabilities
|
(3,146
|
)
|
|
|
Noncurrent liabilities
|
(725
|
)
|
|
|
Total
|
91,959
|
|
|
|
Bargain purchase gain, net of tax
|
(1,642
|
)
|
|
|
Total consideration paid
|
$
|
90,317
|
|
There were no measurement-period adjustments for either of these two acquisitions during the one-year period subsequent to the date of acquisition.
ASC Topic 280,
Segment Reporting
, establishes standards for reporting information about operating segments, products and services, geographic areas of operations and major customers. Operating segments are defined as components of an enterprise for which separate financial information is available and evaluated regularly by the chief operating decision maker or decision making group in deciding how to allocate resources and in assessing performance.
The Company's operations are managed as two businesses:
|
1)
|
Integrated Manufacturing Solutions (IMS). IMS is a reportable segment consisting of printed circuit board assembly and test, final system assembly and test, and direct order fulfillment.
|
|
2)
|
Components, Products and Services (CPS). Components include interconnect systems (printed circuit board fabrication, backplane, cable assemblies and plastic injection molding) and mechanical systems (enclosures and precision machining). Products include memory, RF, optical and microelectronics and enterprise solutions from the Company's Viking Technology division; defense and aerospace products from SCI Technology; and cloud-based manufacturing execution software from the Company's 42Q division. Services include design, engineering, logistics and repair services.
|
74
The Company evaluated its operating segments to determine whether they can be aggregated into reportable segments. Factors considered in this evaluation were similarity of economic characteristics, products, production processes, type or classes of customers, distribution methods and regulatory environments. The Company determined that it has only
one
reportable segment - IMS, which generated approximately
80%
of the Company's total revenue in
2018
. The Company's CPS business consists of multiple operating segments which, based on this evaluation, do not meet the quantitative threshold for being presented as reportable segments. Therefore, financial information for these operating segments is presented in a single category entitled “Components, Products and Services".
The accounting policies for each segment are the same as those disclosed by the Company for its consolidated financial statements. Intersegment sales consist primarily of sales of components from CPS to IMS.
The Company's chief operating decision making group is the Chief Executive Officer and Chief Financial Officer and they allocate resources and assess performance of operating segments based on a measure of revenue and gross profit that excludes items not directly related to the Company's ongoing business operations. These items are typically either non-recurring or non-cash in nature.
75
Segment information is as follows:
|
Year Ended
|
||||||||||||
|
September 29, 2018
|
September 30, 2017
|
October 1, 2016
|
||||||||||
|
(In thousands)
|
||||||||||||
|
Gross sales:
|
||||||||||||
|
IMS
|
$
|
5,847,958
|
|
$
|
5,645,499
|
|
$
|
5,297,740
|
|
|||
|
CPS
|
1,458,754
|
|
1,422,264
|
|
1,372,412
|
|
||||||
|
Intersegment revenue
|
(196,582
|
)
|
(199,144
|
)
|
(188,971
|
)
|
||||||
|
Net Sales
|
$
|
7,110,130
|
|
$
|
6,868,619
|
|
$
|
6,481,181
|
|
|||
|
Gross Profit:
|
||||||||||||
|
IMS
|
$
|
352,361
|
|
$
|
404,350
|
|
$
|
397,309
|
|
|||
|
CPS
|
117,835
|
|
(1
|
)
|
127,154
|
|
121,696
|
|
||||
|
Total
|
470,196
|
|
531,504
|
|
519,005
|
|
||||||
|
Unallocated items (2)
|
(6,413
|
)
|
(11,593
|
)
|
(4,723
|
)
|
||||||
|
Total
|
$
|
463,783
|
|
$
|
519,911
|
|
$
|
514,282
|
|
|||
|
Depreciation and amortization:
|
||||||||||||
|
IMS
|
$
|
76,071
|
|
$
|
74,769
|
|
$
|
66,036
|
|
|||
|
CPS
|
30,048
|
|
31,109
|
|
33,062
|
|
||||||
|
Total
|
106,119
|
|
105,878
|
|
99,098
|
|
||||||
|
Unallocated corporate items (3)
|
12,701
|
|
12,873
|
|
12,812
|
|
||||||
|
Total
|
$
|
118,820
|
|
$
|
118,751
|
|
$
|
111,910
|
|
|||
|
Capital expenditures (receipt basis):
|
||||||||||||
|
IMS
|
$
|
87,421
|
|
$
|
106,000
|
|
$
|
83,084
|
|
|||
|
CPS
|
28,696
|
|
30,512
|
|
21,852
|
|
||||||
|
Total
|
116,117
|
|
136,512
|
|
104,936
|
|
||||||
|
Unallocated corporate items (3)
|
2,480
|
|
4,122
|
|
5,624
|
|
||||||
|
Total
|
$
|
118,597
|
|
$
|
140,634
|
|
$
|
110,560
|
|
|||
|
(1)
|
During the fourth quarter of fiscal 2018, the Company recorded a
$12.5 million
pre-tax adjustment to correct errors that occurred from fiscal 2016 through the third quarter of fiscal 2018 with respect to the accounting for certain long-term contracts in one of the Company’s CPS divisions. These errors are immaterial to all prior periods. The impact of this out-of-period adjustment on the full year fiscal 2018 was
$11.0 million
which is also immaterial to fiscal 2018.
|
|
(2)
|
For purposes of evaluating segment performance, management excludes certain items from its measures of revenue and gross profit. These items consist of stock-based compensation expense, amortization of intangible assets, charges or credits resulting from distressed customers and acquisition-related items.
|
|
(3)
|
Primarily related to selling, general and administration functions.
|
Segment assets, consisting of accounts receivable, inventories and fixed assets, are substantially proportional to segment sales.
76
Information by geographic segment, determined based on the country in which a product is manufactured or a service is provided, was as follows:
|
Year Ended
|
|||||||||||
|
September 29,
2018 |
September 30,
2017 |
October 1,
2016 |
|||||||||
|
(In thousands)
|
|||||||||||
|
Net sales:
|
|||||||||||
|
United States
|
$
|
1,338,359
|
|
$
|
1,234,739
|
|
$
|
1,045,998
|
|
||
|
Mexico
|
2,067,956
|
|
1,935,634
|
|
1,869,651
|
|
|||||
|
China
|
1,196,178
|
|
1,336,118
|
|
1,421,693
|
|
|||||
|
Malaysia
|
687,810
|
|
743,359
|
|
512,288
|
|
|||||
|
Other international
|
1,819,827
|
|
1,618,769
|
|
1,631,551
|
|
|||||
|
Total
|
$
|
7,110,130
|
|
$
|
6,868,619
|
|
$
|
6,481,181
|
|
||
|
Percentage of net sales represented by ten largest customers
|
53.0
|
%
|
52.9
|
%
|
52.0
|
%
|
||
|
Number of customers representing 10% or more of net sales
|
1
|
|
2
|
|
1
|
|
||
|
As of
|
|||||||
|
September 29,
2018 |
September 30,
2017 |
||||||
|
(In thousands)
|
|||||||
|
Property, plant and equipment, net:
|
|||||||
|
United States
|
$
|
161,889
|
|
$
|
165,254
|
|
|
|
Mexico
|
187,128
|
|
187,094
|
|
|||
|
China
|
74,438
|
|
80,787
|
|
|||
|
Other international
|
219,458
|
|
207,140
|
|
|||
|
Total
|
$
|
642,913
|
|
$
|
640,275
|
|
|
Stock-based compensation expense was attributable to:
|
Year Ended
|
|||||||||||
|
September 29,
2018 |
September 30,
2017 |
October 1,
2016 |
|||||||||
|
(In thousands)
|
|||||||||||
|
Stock options
|
$
|
1,779
|
|
$
|
1,640
|
|
$
|
3,943
|
|
||
|
Restricted stock units, including performance-based awards
|
31,046
|
|
36,280
|
|
22,964
|
|
|||||
|
Total
|
$
|
32,825
|
|
$
|
37,920
|
|
$
|
26,907
|
|
||
Stock-based compensation expense was recognized as follows:
|
Year Ended
|
|||||||||||
|
September 29,
2018 |
September 30,
2017 |
October 1,
2016 |
|||||||||
|
(In thousands)
|
|||||||||||
|
Cost of sales
|
$
|
8,187
|
|
$
|
8,959
|
|
$
|
7,350
|
|
||
|
Selling, general & administrative
|
25,206
|
|
28,169
|
|
18,903
|
|
|||||
|
Research & development
|
(568
|
)
|
792
|
|
654
|
|
|||||
|
Total
|
$
|
32,825
|
|
$
|
37,920
|
|
$
|
26,907
|
|
||
Restricted Stock Units
77
The Company grants restricted stock units to executive officers, directors and certain management employees. These units vest over periods ranging from one to four years or based upon achievement of specified performance criteria and are automatically exchanged for shares of common stock at the vesting date. Compensation expense associated with these units is recognized ratably over the vesting period.
Activity with respect to the Company's restricted stock units was as follows:
|
Number of Shares
|
Weighted Grant-Date Fair Value Per Share
($)
|
Weighted-Average Remaining Contractual Term
(Years)
|
Aggregate Intrinsic Value
($)
|
|||||||
|
(In thousands)
|
(In thousands)
|
|||||||||
|
Outstanding as of October 3, 2015
|
2,979
|
|
16.52
|
|
1.52
|
59,843
|
|
|||
|
Granted
|
1,698
|
|
23.22
|
|
||||||
|
Vested/Forfeited/Cancelled
|
(679
|
)
|
15.33
|
|
||||||
|
Outstanding as of October 1, 2016
|
3,998
|
|
19.57
|
|
1.35
|
110,183
|
|
|||
|
Granted
|
1,378
|
|
34.11
|
|
||||||
|
Vested/Forfeited/Cancelled
|
(2,017
|
)
|
16.20
|
|
||||||
|
Outstanding as of September 30, 2017
|
3,359
|
|
27.56
|
|
1.51
|
124,800
|
|
|||
|
Granted
|
1,102
|
|
33.51
|
|
||||||
|
Vested/Forfeited/Cancelled
|
(1,158
|
)
|
25.31
|
|
||||||
|
Outstanding as of September 29, 2018
|
3,303
|
|
30.33
|
|
1.21
|
97,913
|
|
|||
|
Expected to vest as of September 29, 2018
|
2,522
|
|
29.66
|
|
1.22
|
74,768
|
|
|||
The fair value of restricted stock units that vested during the year was
$36 million
for
2018
,
$53 million
for
2017
and
$10 million
for
2016
. As of
September 29, 2018
, unrecognized compensation expense of
$28 million
is expected to be recognized over a weighted average period of
1.3
years. Additionally, as of
September 29, 2018
, unrecognized compensation expense related to performance-based restricted stock units for which achievement of vesting criteria is not currently considered probable was
$11 million
.
The Company has various defined contribution retirement plans that cover the majority of its domestic employees. These retirement plans permit participants to elect to have contributions made to the retirement plans in the form of salary deferrals. Under these retirement plans, the Company may match a portion of employee contributions. Amounts contributed by the Company were not material for any period presented herein.
The Company sponsors a deferred compensation plan for eligible employees that allows participants to defer payment of all or part of their compensation. Deferrals under this plan were
$5 million
for both
2018
and
2017
. Assets and liabilities associated with these plans were
$35 million
and
$35 million
, respectively, as of
September 29, 2018
and
$27 million
and
$29 million
, respectively, as of
September 30, 2017
. These amounts are recorded in other non-current assets and other long-term liabilities on the consolidated balance sheets.
Defined benefit plans covering certain employees in the United States and Canada were frozen in 2001. Employees who had not yet vested will continue to be credited with service until vesting occurs, but no additional benefits will accrue.
The Company also provides defined benefit pension plans in certain other countries. The assumptions used for calculating the pension benefit obligations for non-U.S. plans depend on the local economic environment and regulations. The measurement date for the Company's defined benefit plans is
September 29, 2018
.
78
Changes in benefit obligations for the defined benefit plans described above were as follows (in thousands):
|
As of September 29, 2018
|
As of September 30, 2017
|
As of October 1, 2016
|
||||||||||||||||||||||
|
Change in Benefit Obligations
|
U.S.
|
Non-U.S.
|
U.S.
|
Non-U.S.
|
U.S.
|
Non-U.S.
|
||||||||||||||||||
|
Beginning projected benefit obligation
|
$
|
24,743
|
|
$
|
48,873
|
|
$
|
28,375
|
|
$
|
53,656
|
|
$
|
26,441
|
|
$
|
48,816
|
|
||||||
|
Service cost
|
—
|
|
1,331
|
|
—
|
|
1,210
|
|
—
|
|
1,569
|
|
||||||||||||
|
Interest cost
|
729
|
|
1,333
|
|
737
|
|
1,088
|
|
871
|
|
1,341
|
|
||||||||||||
|
Actuarial gain (loss)
|
(1,199
|
)
|
1,179
|
|
(1,987
|
)
|
(5,609
|
)
|
3,456
|
|
3,244
|
|
||||||||||||
|
Benefits paid
|
(716
|
)
|
(1,571
|
)
|
(709
|
)
|
(1,499
|
)
|
(718
|
)
|
(1,266
|
)
|
||||||||||||
|
Other (1)
|
(971
|
)
|
(215
|
)
|
(1,673
|
)
|
27
|
|
(1,675
|
)
|
(48
|
)
|
||||||||||||
|
Ending projected benefit obligation
|
$
|
22,586
|
|
$
|
50,930
|
|
$
|
24,743
|
|
$
|
48,873
|
|
$
|
28,375
|
|
$
|
53,656
|
|
||||||
|
Ending accumulated benefit obligation
|
$
|
22,586
|
|
$
|
47,149
|
|
$
|
24,743
|
|
$
|
45,532
|
|
$
|
28,375
|
|
$
|
48,371
|
|
||||||
|
(1)
|
Includes miscellaneous items such as settlements, curtailments, foreign exchange rate movements, etc.
|
Weighted-average actuarial assumptions used to determine benefit obligations were as follows:
|
U.S. Pensions
|
Non-U.S. Pensions
|
||||||||||
|
As of
|
As of
|
||||||||||
|
September 29,
2018 |
September 30,
2017 |
September 29,
2018 |
September 30,
2017 |
||||||||
|
Discount rate
|
3.77
|
%
|
3.05
|
%
|
2.78
|
%
|
2.78
|
%
|
|||
|
Rate of compensation increases
|
—
|
%
|
—
|
%
|
2.08
|
%
|
1.98
|
%
|
|||
The Company evaluates these assumptions on a regular basis taking into consideration current market conditions and historical market data. The discount rate is used to measure expected future cash flows at present value on the measurement date. This rate represents the market rate for high-quality fixed income investments. A lower discount rate would increase the present value of the benefit obligation. Other assumptions include demographic factors such as retirement, mortality, and turnover.
Changes in plan assets and funded status for the defined benefit plans described above were as follows (in thousands):
|
As of September 29, 2018
|
As of September 30, 2017
|
As of October 1, 2016
|
||||||||||||||||||||||
|
Change in Plan Assets
|
U.S.
|
Non-U.S.
|
U.S.
|
Non-U.S.
|
U.S.
|
Non-U.S.
|
||||||||||||||||||
|
Beginning fair value
|
$
|
16,930
|
|
$
|
26,993
|
|
$
|
17,594
|
|
$
|
26,045
|
|
$
|
18,646
|
|
$
|
27,079
|
|
||||||
|
Actual return
|
1,086
|
|
(8
|
)
|
1,598
|
|
590
|
|
1,341
|
|
(461
|
)
|
||||||||||||
|
Employer contributions
|
455
|
|
710
|
|
120
|
|
695
|
|
—
|
|
607
|
|
||||||||||||
|
Benefits paid
|
(716
|
)
|
(1,571
|
)
|
(709
|
)
|
(1,499
|
)
|
(718
|
)
|
(1,266
|
)
|
||||||||||||
|
Other (1)
|
(971
|
)
|
(10
|
)
|
(1,673
|
)
|
1,162
|
|
(1,675
|
)
|
86
|
|
||||||||||||
|
Ending fair value
|
$
|
16,784
|
|
$
|
26,114
|
|
$
|
16,930
|
|
$
|
26,993
|
|
$
|
17,594
|
|
$
|
26,045
|
|
||||||
|
Underfunded status
|
$
|
(5,802
|
)
|
$
|
(24,816
|
)
|
$
|
(7,813
|
)
|
$
|
(21,880
|
)
|
$
|
(10,781
|
)
|
$
|
(27,611
|
)
|
||||||
|
(1)
|
Includes miscellaneous items such as settlements, foreign exchange rate movements, etc.
|
79
Weighted-average asset allocations by asset category for the U.S. and non-U.S. plans were as follows:
|
U.S.
|
Non-U.S.
|
||||||||||||||||
|
Level 1
|
Level 1
|
||||||||||||||||
|
As of
|
As of
|
||||||||||||||||
|
Target
|
September 29, 2018
|
September 30, 2017
|
Target
|
September 29, 2018
|
September 30, 2017
|
||||||||||||
|
Equity securities
|
51
|
%
|
51.7
|
%
|
52.8
|
%
|
20
|
%
|
27.5
|
%
|
30.0
|
%
|
|||||
|
Debt securities
|
49
|
%
|
48.3
|
%
|
47.2
|
%
|
80
|
%
|
69.3
|
%
|
67.5
|
%
|
|||||
|
Cash
|
—
|
%
|
—
|
%
|
—
|
%
|
—
|
%
|
3.2
|
%
|
2.5
|
%
|
|||||
|
Total
|
100
|
%
|
100
|
%
|
100
|
%
|
100
|
%
|
100
|
%
|
100
|
%
|
|||||
The Company's investment strategy is designed to ensure that sufficient pension assets are available to pay benefits as they become due. In order to meet this objective, the Company has established targeted investment allocation percentages for equity and debt securities as noted in the preceding table. As of
September 29, 2018
, U.S. plan assets are invested in mutual funds which are valued based on the net asset value (NAV) of the underlying securities that is reflective of quoted prices in an active market. The beneficial interest of each participant is represented in units which are issued and redeemed daily at the fund's closing NAV. Non-U.S. plan assets are invested in publicly-traded mutual funds consisting of medium-term Euro bonds and stocks of companies in the European region. The mutual funds are valued using the NAV that is quoted in an active market. The plans are managed consistent with regulations or market practices of the country in which the assets are invested. As of
September 29, 2018
there were no significant concentrations of credit risk related to pension plan assets.
The funded status of the plans, reconciled to the amount reported on the consolidated balance sheets, is as follows (in thousands):
|
As of September 29, 2018
|
As of September 30, 2017
|
As of October 1, 2016
|
||||||||||||||||||||||
|
U.S.
|
Non-U.S.
|
U.S.
|
Non-U.S.
|
U.S.
|
Non-U.S.
|
|||||||||||||||||||
|
Components of net amount recognized on consolidated balance sheets:
|
||||||||||||||||||||||||
|
Current liabilities
|
$
|
—
|
|
$
|
(1,430
|
)
|
$
|
—
|
|
$
|
(1,117
|
)
|
$
|
—
|
|
$
|
(1,260
|
)
|
||||||
|
Non-current liabilities
|
(5,802
|
)
|
(23,386
|
)
|
(7,813
|
)
|
(20,763
|
)
|
(10,781
|
)
|
(26,351
|
)
|
||||||||||||
|
Net liability recognized on consolidated balance sheets
|
$
|
(5,802
|
)
|
$
|
(24,816
|
)
|
$
|
(7,813
|
)
|
$
|
(21,880
|
)
|
$
|
(10,781
|
)
|
$
|
(27,611
|
)
|
||||||
Amounts recognized in AOCI (pre-tax) consist primarily of unrecognized net actuarial losses and are as follows (in thousands):
|
As of September 29, 2018
|
September 30, 2017
|
As of October 1, 2016
|
||||||||||||||||||||||
|
U.S.
|
Non-U.S.
|
U.S.
|
Non-U.S.
|
U.S.
|
Non-U.S.
|
|||||||||||||||||||
|
Accumulated other comprehensive loss
|
$
|
2,531
|
|
$
|
11,401
|
|
$
|
4,484
|
|
$
|
10,076
|
|
$
|
7,801
|
|
$
|
16,841
|
|
||||||
Estimated amortization from accumulated other comprehensive income into net periodic benefit cost in
2019
is not material. Net periodic benefit costs consist primarily of service cost and interest cost and were not material for any period presented herein.
Weighted-average assumptions used to determine benefit costs were as follows:
|
|
U.S. Pensions
|
Non-U.S. Pensions
|
|||||||||
|
|
September 29,
2018 |
September 30,
2017 |
September 29,
2018 |
September 30,
2017 |
|||||||
|
Discount rate
|
3.05
|
%
|
2.71
|
%
|
2.78
|
%
|
2.32
|
%
|
|||
|
Expected return on plan assets
|
4.50
|
%
|
4.50
|
%
|
1.90
|
%
|
1.70
|
%
|
|||
|
Rate of compensation increases
|
—
|
%
|
—
|
%
|
1.98
|
%
|
2.72
|
%
|
|||
The expected long-term rate of return on assets for the U.S. and non-U.S. pension plans used in these calculations is developed considering several factors, including historical rates of returns, expectations of future returns for each major asset
80
class in which the plan invests, the weight of each asset class in the target mix, the correlations between asset classes and their expected volatilities.
Estimated future benefit payments are as follows:
|
Pension Benefits
|
|||
|
(In thousands)
|
|||
|
2019
|
$
|
7,779
|
|
|
2020
|
$
|
4,349
|
|
|
2021
|
$
|
4,276
|
|
|
2022
|
$
|
4,401
|
|
|
2023
|
$
|
4,631
|
|
|
Years 2024 through 2028
|
$
|
21,430
|
|
81
Item 9.
Changes In and Disagreements With Accountants on Accounting and Financial Disclosure
None.
Item 9A.
Controls and Procedures
|
(a)
|
Evaluation of Disclosure Controls and Procedures
|
Our management is responsible for establishing and maintaining our disclosure controls and procedures as defined in Rules 13a-15(e) and 15d-15(e) under the Securities Exchange Act of 1934, as amended, or the Exchange Act. Our management, including our Chief Executive Officer and Chief Financial Officer, does not expect that our disclosure controls and procedures will prevent all errors and all fraud. Disclosure controls and procedures, no matter how well conceived and operated, can provide only reasonable, not absolute, assurance that their objectives are met. Further, the design of disclosure controls and procedures must reflect the fact that there are resource constraints, and the benefits of disclosure controls and procedures must be considered relative to their costs. Because of the inherent limitations in all control systems, no evaluation of disclosure controls and procedures can provide absolute assurance that all disclosure control issues and instances of fraud, if any, have been detected. As a result of the material weakness in our internal control over financial reporting described below, our Chief Executive Officer and Chief Financial Officer have concluded that our disclosure controls and procedures were not effective as of
September 29, 2018
.
Notwithstanding this material weaknesses, our management has concluded that the consolidated financial statements included in this Form 10-K present fairly, in all material respects, our financial position, results of operations and cash flows for the periods presented in conformity with accounting principles generally accepted in the United States of America. This control weakness did not result in a material misstatement to the current year’s consolidated financial statements or to those of any prior period.
|
(b)
|
Management's Report on Internal Control Over Financial Reporting
|
Our management is responsible for establishing and maintaining adequate internal control over financial reporting (as defined in Rule 13a-15(f) and 15d-15(f) under the Exchange Act). Our management, including our Chief Executive Officer and Chief Financial Officer, conducted an evaluation of the effectiveness of our internal control over financial reporting as of
September 29, 2018
. In making this assessment, our management used the criteria established in Internal Control-Integrated Framework (2013), issued by the Committee of Sponsoring Organizations of the Treadway Commission (COSO).
During the fourth quarter of fiscal 2018, our management identified a material weakness related to the failed operation of a management review control in one of our CPS divisions. A material weakness is a deficiency, or combination of deficiencies, in internal control over financial reporting, such that there is a reasonable possibility that a material misstatement of our annual or interim financial statements will not be prevented or detected on a timely basis. This material weakness did not result in any material misstatements to our previously issued financial statements or disclosures, but did result in an immaterial out-of-period adjustment in fiscal 2018 of $11 million that reduced upfront capitalized inventory contract costs that accumulated during fiscal 2016 and 2017 and increased cost of sales accordingly. The out-of period effect on the fourth quarter of fiscal 2018 was $12.5 million, reflecting continued accumulation of the error through the third quarter of fiscal 2018.
As a result of this material weakness, we concluded we did not maintain effective controls over the review of certain long-term contracts in one of our CPS divisions, which is our only division with such contracts. Specifically, we did not maintain controls to monitor the reasonableness of estimates used in the accounting for long-term contracts and, therefore, failed to detect errors in a timely manner that, when aggregated or accumulated, could have been material to our interim or annual consolidated financial statements. Therefore, this material weakness could result in a misstatement of the aforementioned account balances or disclosures that would result in a material misstatement to our interim or annual consolidated financial statements that would not be prevented or detected.
Because of this material weakness, management concluded that the Company did not maintain effective internal control over financial reporting as of
September 29, 2018
.
The effectiveness of our internal control over financial reporting as of
September 29, 2018
has been audited by PricewaterhouseCoopers LLP, an independent registered public accounting firm, as stated in their report which appears herein.
Remediation Efforts to Address Material Weakness
82
Management intends to remediate its management review control by reducing the complexity of the process for preparing and developing the underlying estimates used to account for certain long-term contracts, requiring additional data to be presented during management’s review, and ensuring sufficient time is allowed for an effective review to occur.
We believe these measures, and others that may be implemented, will remediate the material weakness in internal control over financial reporting described above.
The material weakness will not be considered formally remediated until the control has operated effectively for a sufficient period of time and management has concluded, through testing, that the control is operating effectively. We expect this to occur prior to the end of fiscal 2019.
Remediation of Previously Identified Material Weakness
In the second quarter of fiscal 2018, we identified a material weakness in our internal control over financial reporting related to an ineffective business review control used to monitor the completeness and accuracy of the financial results of one of our significant divisions (unrelated to the division mentioned above) and to identify potential failures in lower level controls. This material weakness was remediated and, as of the end of fiscal 2018, the remediated control had operated for a sufficient period of time and management concluded, through testing, that the control was operating effectively.
|
(c)
|
Changes in Internal Control Over Financial Reporting
|
There were no changes in our internal control over financial reporting (as such term is defined in Rules 13a-15(f) and 15d-15(f) under the Exchange Act) that occurred during the quarter ended
September 29, 2018
that have materially affected, or are reasonably likely to materially affect, our internal control over financial reporting.
Item 9B.
Other Information
None.
83
The information called for by Items 10, 11, 12, 13 and 14 of Part III are incorporated by reference from our definitive Proxy Statement to be filed in connection with our 2019 Annual Meeting of Stockholders pursuant to Regulation 14A, except that the information regarding our executive officers called for by Item 401(b) of Regulation S-K has been included in Part I of this report.
84
Item 15.
Exhibits and Financial Statement Schedules
|
(a)
|
(1)
|
Financial Statements.
The following financial statements are filed under Item 8 hereof as part of this report:
|
|
|
Page
|
||
|
Report of Independent Registered Public Accounting Firm
|
||
|
Financial Statements:
|
||
|
Consolidated Balance Sheets, As of September 29, 2018 and September 30, 2017
|
||
|
Consolidated Statements of Operations, Years Ended September 29, 2018, September 30, 2017 and October 1, 2016
|
||
|
Consolidated Statements of Comprehensive Income (Loss), Years Ended September 29, 2018, September 30, 2017 and October 1, 2016
|
||
|
Consolidated Statements of Stockholders' Equity, Years Ended September 29, 2018, September 30, 2017 and October 1, 2016
|
||
|
Consolidated Statements of Cash Flows, Years Ended September 29, 2018, September 30, 2017 and October 1, 2016
|
||
|
Notes to Consolidated Financial Statements
|
||
|
(2)
|
Financial Statement Schedules.
The following financial statement schedule of Sanmina Corporation is filed as part of this report on Form 10-K immediately after the signature pages hereto and should be read in conjunction with our Financial Statements included in this Item 15:
|
||
|
Schedule II-Valuation and Qualifying Accounts, Years Ended September 29, 2018, September 30, 2017 and October 1, 2016
|
|||
|
All other schedules are omitted because they are not applicable or the required information is shown in the Financial Statements or the notes thereto.
|
|||
|
(3)
|
Exhibits.
Refer to Item 15(b) immediately below.
|
||
85
|
(b)
|
Exhibits
|
|
Exhibit
Number
|
|
Description
|
|
|
|
|
|
3.1(1)
|
||
|
3.2(2)
|
||
|
3.3(3)
|
||
|
3.4(4)
|
||
|
3.5(5)
|
||
|
3.6(6)
|
||
|
3.7(7)
|
||
|
3.8(8)
|
||
|
4.1(9)
|
||
|
4.2(9)
|
||
|
4.3(9)
|
||
|
4.4(9)
|
||
|
10.1(10)*
|
||
|
10.2(11)*
|
||
|
10.3(12)*
|
||
|
10.4*
|
||
|
10.5(13)*
|
||
|
10.6(14)*
|
||
|
10.7(15)*
|
||
|
10.8(16)*
|
||
|
10.9(17)*
|
||
|
10.10(18)
|
||
|
10.11(19)*
|
||
|
10.12(20)
|
||
|
10.13(21)
|
||
|
10.14(22)
|
||
|
10.15(23)*
|
||
|
10.16(24)*
|
||
|
10.17(25)*
|
||
|
10.18(26)*
|
||
|
10.19(27)*
|
||
86
|
10.20(28)‡
|
||
|
10.21(29) ‡
|
||
|
10.22*
|
||
|
10.23*
|
||
|
10.24*
|
||
|
10.25*
|
||
|
10.26±
|
||
|
14.1
|
||
|
21.1
|
||
|
23.1
|
||
|
31.1
|
||
|
31.2
|
||
|
32.1(30)
|
||
|
32.2(30)
|
||
|
101.INS
|
XBRL Instance Document
|
|
|
101.SCH
|
XBRL Taxonomy Extension Schema Document
|
|
|
101.CAL
|
XBRL Taxonomy Extension Calculation Linkbase Document
|
|
|
101.DEF
|
XBRL Taxonomy Extension Definition Linkbase Document
|
|
|
101.LAB
|
XBRL Taxonomy Extension Label Linkbase Document
|
|
|
101.PRE
|
XBRL Taxonomy Extension Presentation Linkbase Document
|
|
* Compensatory plan in which an executive officer or director participates.
‡ Portions of this exhibit have been omitted pursuant to an order granting confidential treatment and this exhibit has been filed separately with the SEC.
± Portions of this exhibit have been omitted pursuant to a confidential treatment request and this exhibit has been filed separately with the SEC.
87
|
(1
|
)
|
Incorporated by reference to Exhibit 3.2 to the Registrant's Annual Report on Form 10-K for the fiscal year ended September 30, 1996, SEC File No. 000-21272, filed with the Securities and Exchange Commission (“SEC”) on December 24, 1996.
|
|
|
(2
|
)
|
Incorporated by reference to Exhibit 3.1(a) to the Registrant's Quarterly Report on Form 10-Q for the fiscal quarter ended March 31, 2001, filed with the SEC on May 11, 2001.
|
|
|
(3
|
)
|
Incorporated by reference to Exhibit 3.1.2 to the Registrant's Registration Statement on Form S-4, filed with the SEC on August 10, 2001.
|
|
|
(4
|
)
|
Incorporated by reference to Exhibit 3.1.3 to the Registrant's Annual Report on Form 10-K for the fiscal year ended September 29, 2001, filed with the SEC on December 21, 2001.
|
|
|
(5
|
)
|
Incorporated by reference to Exhibit 3.2 to Registrant's Current Report on Form 8-K, filed with the SEC on December 5, 2008.
|
|
|
(6
|
)
|
Incorporated by reference to Exhibit 3.6 to Registrant's Current Report on Form 8-K, filed with the SEC on August 19, 2009.
|
|
|
(7
|
)
|
Incorporated by reference to Exhibit 3.7 to the Registrant's Annual Report on Form 10-K for the fiscal year ended September 29, 2012, filed with the SEC on November 21, 2012
|
|
|
(8
|
)
|
Incorporated by reference to Exhibit 3.8 to the Registrant’s Current Report on Form 8-K filed with the SEC on December 11, 2015.
|
|
|
(9
|
)
|
Incorporated by reference to exhibit to Registrant's Current Report on Form 8-K filed with the SEC on June 5, 2014.
|
|
|
(10
|
)
|
Incorporated by reference to Exhibit 10.75 to the Registrant's Quarterly Report on Form 10-Q for the fiscal quarter ended June 28, 2008, filed with the SEC on August 4, 2008.
|
|
|
(11
|
)
|
Incorporated by reference to Exhibit 10.74 to the Registrant's Quarterly Report on Form 10-Q for the fiscal quarter ended June 28, 2008, filed with the SEC on August 4, 2008.
|
|
|
(12
|
)
|
Incorporated by reference to Exhibit 10.42 to the Registrant's Quarterly Report on Form 10-Q for the fiscal quarter ended June 28, 2008, filed with the SEC on August 4, 2008.
|
|
|
(13
|
)
|
Incorporated by reference to Exhibit 10.40 to the Registrant's Quarterly Report on Form 10-Q for the fiscal quarter ended March 28, 2009, filed with the SEC on May 5, 2009.
|
|
|
(14
|
)
|
Incorporated by reference to Exhibit 10.43 to the Registrant's Quarterly Report on Form 10-Q for the fiscal quarter ended March 28, 2009, filed with the SEC on May 5, 2009
|
|
|
(15
|
)
|
Incorporated by reference to Exhibit 10.44 to the Registrant's Quarterly Report on Form 10-Q for the fiscal quarter ended March 28, 2009, filed with the SEC on May 5, 2009
|
|
|
(16
|
)
|
Incorporated by reference to Exhibit 10.45 to the Registrant's Quarterly Report on Form 10-Q for the fiscal quarter ended March 28, 2009, filed with the SEC on May 5, 2009
|
|
|
(17
|
)
|
Incorporated by reference to Exhibit 10.48 to the Registrant's Quarterly Report on Form 10-Q for the fiscal quarter ended January 2, 2010, filed with the SEC on February 5, 2010.
|
|
|
(18
|
)
|
Incorporated by reference to Exhibit 10.48 to Registrant’s Quarterly Report on Form 10-Q for the fiscal quarter ended December 28, 2013, filed with the SEC on January 31, 2014.
|
|
|
(19
|
)
|
Incorporated by reference to Exhibit 10.49 to the Registrant’s Quarterly Report on Form 10-Q for the fiscal quarter ended March 29, 2014 filed with the SEC on April 28, 2014.
|
|
|
(20
|
)
|
Incorporated by reference to Current Report on Form 8-K filed by the Registrant with the SEC on May 21, 2014.
|
|
|
(21
|
)
|
Incorporated by reference to Exhibit 10.30 to the Registrant’s Quarterly Report on Form 10-Q for the fiscal quarter ended June 27, 2015 filed with the SEC on July 24, 2015.
|
|
|
(22
|
)
|
Incorporated by reference to Exhibit 10.1 to the Registrant’s Current Report on Form 8-K filed with the SEC on February 2, 2018.
|
|
|
(23
|
)
|
Incorporated by reference to Exhibit 10.28 to Registrant’s Annual Report on Form 10-K for the fiscal year ended October 2, 2015, filed with the SEC on November 19, 2015.
|
|
|
(24
|
)
|
Incorporated by reference to Exhibit 10.29 to Registrant’s Annual Report on Form 10-K for the fiscal year ended October 2, 2015, filed with the SEC on November 19, 2015.
|
|
|
(25
|
)
|
Incorporated by reference to Exhibit 10.30 to Registrant’s Annual Report on Form 10-K for the fiscal year ended October 2, 2015, filed with the SEC on November 19, 2015.
|
|
|
(26
|
)
|
Incorporated by reference to Exhibit 10.31 to Registrant’s Annual Report on Form 10-K for the fiscal year ended October 2, 2015, filed with the SEC on November 19, 2015.
|
|
|
(27
|
)
|
Incorporated by reference to Exhibit 10.32 to Registrant’s Annual Report on Form 10-K for the fiscal year ended September 30, 2017, filed with the SEC on November 13, 2017.
|
|
|
(28
|
)
|
Incorporated by reference to Exhibit 10.33 to the Registrant’s Quarterly Report on Form 10-Q for the fiscal quarter ended March 31, 2018 filed with the SEC on May 2, 2018.
|
|
88
|
(29
|
)
|
Incorporated by reference to Exhibit 10.34 to the Registrant’s Quarterly Report on Form 10-Q for the fiscal quarter ended June 30, 2018 filed with the SEC on August 3, 2018.
|
|
|
(30
|
)
|
This exhibit shall not be deemed “filed” for purposes of Section 18 of the Securities Exchange Act of 1934 or otherwise subject to the liabilities of that Section, nor shall it be deemed incorporated by reference in any filings under the Securities Act of 1933 or the Securities Exchange Act of 1934, whether made before or after the date hereof and irrespective of any general incorporation language in any filings.
|
|
(c)
Financial Statement Schedules.
See Item 15(a)(2) above.
89
SIGNATURES
Pursuant to the requirements of Section 13 or 15(d) of the Securities Exchange Act of 1934, the registrant has duly caused this report to be signed on its behalf by the undersigned, thereunto duly authorized.
|
|
Sanmina Corporation
(Registrant)
|
|
|
|
By:
|
/s/ Michael J. Clarke
|
|
|
|
Michael J. Clarke
|
|
|
|
Chief Executive Officer
|
Date:
November 15, 2018
90
Pursuant to the requirements of the Securities Exchange Act of 1934, this report has been signed below by the following persons on behalf of the registrant and in the capacities and on the dates indicated.
POWER OF ATTORNEY
Each person whose signature appears below constitutes and appoints Michael J. Clarke and David R. Anderson and each of them, his or her true and lawful attorneys-in-fact and agents, with full power of substitution and resubstitution, for him or her and in his or her name, place and stead, in any and all capacities, to sign any and all amendments to this Annual Report on Form 10-K, and to file the same, with all exhibits thereto, and other documents in connection therewith, with the Securities and Exchange Commission, granting unto said attorneys-in-fact and agents, and each of them, full power and authority to do and perform each and every act and thing requisite and necessary to be done, as fully to all intents and purposes as he or she might or could do in person, hereby ratifying and confirming all that said attorneys-in-fact and agents or any of them, or their or his or her substitute or substitutes, may lawfully do or cause to be done by virtue hereof.
|
Signature
|
Title
|
Date
|
|
/s/ JURE SOLA
|
Executive Chairman and Director
|
November 15, 2018
|
|
Jure Sola
|
|
|
|
|
|
|
|
/s/ MICHAEL J. CLARKE
|
Chief Executive Officer and Director
(Principal Executive Officer) |
November 15, 2018
|
|
Michael J. Clarke
|
|
|
|
|
|
|
|
/s/ DAVID R. ANDERSON
|
Chief Financial Officer
(Principal Financial Officer) |
November 15, 2018
|
|
David R. Anderson
|
|
|
|
|
|
|
|
/s/ BRENT BILLINGER
|
Controller
(Principal Accounting Officer)
|
November 15, 2018
|
|
Brent Billinger
|
|
|
|
/s/ EUGENE A. DELANEY
|
Director
|
November 15, 2018
|
|
Eugene A. Delaney
|
||
|
/s/ WILLIAM DELANEY
|
Director
|
November 15, 2018
|
|
William DeLaney
|
||
|
/s/ JOHN P. GOLDSBERRY
|
Director
|
November 15, 2018
|
|
John P. Goldsberry
|
|
|
|
/s/ RITA S. LANE
|
Director
|
November 15, 2018
|
|
Rita S. Lane
|
|
|
|
|
|
|
|
/s/ JOSEPH LICATA
|
Director
|
November 15, 2018
|
|
Joseph Licata
|
|
|
|
|
|
|
|
/s/ MARIO M. ROSATI
|
Director
|
November 15, 2018
|
|
Mario M. Rosati
|
|
|
|
|
|
|
|
/s/ WAYNE SHORTRIDGE
|
Director
|
November 15, 2018
|
|
Wayne Shortridge
|
|
|
|
|
|
|
|
/s/ JACKIE M. WARD
|
Director
|
November 15, 2018
|
|
Jackie M. Ward
|
|
|
91
FINANCIAL STATEMENT SCHEDULE
The financial statement Schedule II-VALUATION AND QUALIFYING ACCOUNTS is filed as part of this Form 10-K.
SANMINA CORPORATION
SCHEDULE II-VALUATION AND QUALIFYING ACCOUNTS
|
|
Balance at Beginning of Period
|
Charged to Operations
|
Charges Utilized
|
Balance at End of Period
|
|||||||||||
|
|
(In thousands)
|
||||||||||||||
|
Allowances for Doubtful Accounts, Product Returns and Other Net Sales Adjustments
|
|||||||||||||||
|
Fiscal year ended October 1, 2016
|
$
|
13,439
|
|
$
|
1,642
|
|
$
|
—
|
|
$
|
15,081
|
|
|||
|
Fiscal year ended September 30, 2017
|
$
|
15,081
|
|
$
|
(747
|
)
|
$
|
—
|
|
$
|
14,334
|
|
|||
|
Fiscal year ended September 29, 2018
|
$
|
14,334
|
|
$
|
(2,123
|
)
|
$
|
—
|
|
$
|
12,211
|
|
|||
92
TABLE OF CONTENTS
Item 1. BusinessItem 1A. Risk FactorsItem 1B. Unresolved Staff CommentsItem 2. PropertiesItem 3. Legal ProceedingsItem 4. Mine Safety DisclosuresPart IIItem 5. Market For Registrant's Common Equity, Related Stockholder Matters and Issuer Purchases Of Equity SecuritiesItem 6. Selected Financial DataItem 7. Management's Discussion and Analysis Of Financial Condition and Results Of OperationsItem 7A. Quantitative and Qualitative Disclosures About Market RiskItem 8. Financial Statements and Supplementary DataNote 1. Organization Of SanminaNote 2. Summary Of Significant Accounting PoliciesNote 3. Balance Sheet and Income Statement DetailsNote 4. Financial InstrumentsNote 5. Financial Instruments and Concentration Of Credit RiskNote 6. DebtNote 7. Accounts Receivable Sales ProgramNote 8. Commitments and ContingenciesNote 9. RestructuringNote 10. Income TaxesNote 11. Earnings Per ShareNote 12. Stockholders' EquityNote 13. AcquisitionsNote 14. Business Segment, Geographic and Customer InformationNote 15. Stock-based CompensationNote 16. Employee Benefit PlansItem 9. Changes in and Disagreements with Accountants on Accounting and Financial DisclosureItem 9A. Controls and ProceduresItem 9B. Other InformationPart IIIPart IVItem 15. Exhibits and Financial Statement Schedules