SUNSHINE BIOPHARMA, INC
10-Ks and 10-Qs
|
|
|
|
|
|
|
|
|
|
|
|
|
|
|
|
|
|
|
|
U.S. SECURITIES AND EXCHANGE COMMISSION
WASHINGTON, D.C. 20549
__________________
FORM 10-K
__________________
(Mark one)
|
þ
|
ANNUAL REPORT PURSUANT TO SECTION 13 OR 15(D) OF THE SECURITIES EXCHANGE ACT OF
1934
FOR THE FISCAL YEAR ENDED
DECEMBER 31, 2012
|
|
o
|
TRANSITION REPORT UNDER SECTION 13 OR 15(D) OF THE SECURITIES EXCHANGE ACT OF1934 for the transition period from ____________ to____________
|
Commission File Number
000-52898
SUNSHINE BIOPHARMA, INC.
(Exact name of registrant as specified in its charter)
|
Colorado
|
20-5566275
|
|
|
(State or other jurisdiction of
Incorporation or organization)
|
(I.R.S. Employer Identification No.)
|
469 Jean-Talon West
3rd Floor
Montreal, Quebec, Canada H3N 1R4
(Address of principal executive offices)
(514) 764-9698
(Issuer’s Telephone Number)
Indicate by check mark if the registrant is a well-known seasoned issuer, as defined in Rule 405 of the Securities Act. Yes
o
No
þ
Indicate by check mark if the registrant is not required to file reports pursuant to Section 13 or Section 15(d) of the Securities Act. Yes
o
No
þ
Indicate by check mark whether the issuer (1) filed all reports required to be filed by Section 13 or 15(d) of the Exchange Act of 1934 during the preceding 12 months (or for such shorter period that the registrant was required to file such reports), and (2) has been subject to such filing requirements for the past 90 days. Yes
þ
No
o
Indicate by check mark if disclosure of delinquent filers pursuant to Item 405 of Regulation S-K is not contained herein, and will not be contained, to the best of registrant’s knowledge, in definitive proxy or information statements incorporated by reference in Part III of this Form 10-K or any amendment to this Form 10-K.
þ
Indicate by check mark whether the registrant is a large accelerated filer, an accelerated filer, a non-accelerated filer, or a smaller reporting company. See definition of “large accelerated filer,” “accelerated filer” and “smaller reporting company” in Rule 12b-2 of the Exchange Act. (Check one):
| Large accelerated filer | o | Accelerated filer | o |
| Non-accelerated filer | o | Smaller reporting company | þ |
|
(Do not check if a
smaller reporting company)
|
|||
Indicate by check mark whether the registrant is a shell company (as defined in Rule 12b-2 of the Act). Yes
o
No
þ
The aggregate market value of the shares of voting stock held by non-affiliates of the Registrant as of March 13, 2013 was $5,081,773.
As of March 13, 2013, the Registrant had 51,766,092 shares of Common Stock issued and outstanding.
DOCUMENTS INCORPORATED BY REFERENCE - None
|
Facing Page
|
Page No.
|
||||
|
Index
|
|||||
| 4 | |||||
| 8 | |||||
| 19 | |||||
| 19 | |||||
| 19 | |||||
| 19 | |||||
| 20 | |||||
| 22 | |||||
| 22 | |||||
| 25 | |||||
| 26 | |||||
| 28 | |||||
| 28 | |||||
| 29 | |||||
| 30 | |||||
| 31 | |||||
| 31 | |||||
| 32 | |||||
| 32 | |||||
| 34 | |||||
| Signatures | 35 | ||||
2
FORWARD LOOKING STATEMENTS
This Annual Report on Form 10-K contains forward-looking statements within the meaning of Section 27A of the Securities Act of 1933 and Section 21E of the Securities Act of 1934. The statements regarding Sunshine Biopharma Inc. contained in this Report that are not historical in nature, particularly those that utilize terminology such as “may,” “will,” “should,” “likely,” “expects,” “anticipates,” “estimates,” “believes” or “plans,” or comparable terminology, are forward-looking statements based on current expectations and assumptions, and entail various risks and uncertainties that could cause actual results to differ materially from those expressed in such forward-looking statements.
Important factors known to us that could cause such material differences are identified in this Report and in our “Risk Factors” in Item 1A. We undertake no obligation to correct or update any forward-looking statements, whether as a result of new information, future events or otherwise. You are advised, however, to consult any future disclosures we make on related subjects in future reports to the SEC.
History
We were incorporated in the State of Colorado on August 31, 2006 under the name “Mountain West Business Solutions, Inc.” Until October 2009 our business was to provide management consulting with regard to accounting, computer and general business issues for small and home-office based companies.
Effective October 15, 2009, we executed an agreement to acquire Sunshine Biopharma, Inc., a Colorado corporation, in exchange for the issuance of 21,962,000 shares of our Common Stock and 850,000 shares of Convertible Preferred Stock, each convertible into twenty (20) shares of our Common Stock (the “Agreement”). As a result of this transaction we changed our name to “Sunshine Biopharma, Inc.” On December 21, 2011, Advanomics Corporation, a privately held Canadian company (“Advanomics”), and our licensor, exercised its right to convert the 850,000 shares of Series “A” Preferred Stock it held in our Company into 17,000,000 shares of Common Stock.
Description of Current Business
We are currently a pharmaceutical company focused on the research, development and commercialization of drugs for the treatment of various forms of cancer. The preclinical studies for our lead compound, Adva-27a, a multi-purpose antitumor compound, were successfully completed in late 2011. We are now continuing our clinical development of Adva-27a by conducting the next sequence of steps comprised of Good Manufacturing Practice (“GMP”) manufacturing, Investigational New Drug (“IND”)-enabling studies, regulatory filing and Phase I clinical trials. We plan to conduct our Phase I clinical trials for Adva-27a at the Jewish General Hospital, Montreal, Canada, one of McGill University’s Hospital Centers. The planned indication will be multidrug resistant breast cancer as Adva-27a has shown a positive effect on this type of cancer for which there is currently little or no treatment options available. See “Clinical Trials” below.
We have licensed our technology on an exclusive basis from Advanomics, and we are planning to initiate our own research and development program as soon as practicable once financing is in place. There are no assurances that we will obtain the financing necessary to allow us to implement this aspect of our business plan, or to enter clinical trials.
Carbon-Difluoride Platform Technology
Many therapeutically important compounds contain diester bonds that link different parts of the molecule together. Diester bonds are naturally unstable often leading to suboptimal performance when the molecule is administered to patients. Diester bonds have specific three-dimensional, as well as electrostatic properties that cannot be easily mimicked by other bonds. Bonds that do not mimic the diester bond correctly invariably render the compound inactive. In collaboration with Institut National des Sciences Appliquées de Rouen in France (“INSA”), Advanomics has developed a way to replace the diester bond with a Carbon-Difluoride bond which acts as a diester isostere. An isostere is a different chemical structure that mimics the properties of the original. In the body, Carbon-Difluoride compounds are resistant to metabolic degradation but recognized similarly to the diester compounds (
see
Figure 1).

Figure 1
While no assurances can be provided, we are planning to expand our product line through acquisitions and/or in-licensing as well as in-house research and development.
Our Lead Compound (Adva-27a)
Our initial drug candidate is Adva-27a, a GEM-difluorinated C-glycoside derivative of Podophyllotoxin, targeted for various forms of cancer. If we are successful in our current financing efforts, Adva-27a is expected to enter Phase I clinical trials for multidrug resistant breast cancer in mid to late 2014 (see “Clinical Development Path” and “Clinical Trials” below). Etoposide, which is also a derivative of Podophyllotoxin, is currently on the market and is used to treat various types of cancer including leukemia, lymphoma, testicular cancer, lung cancer, brain cancer, prostate cancer, bladder cancer, colon cancer, ovarian cancer, liver cancer and several other forms of cancer. Like Etoposide, Adva-27a is a Topoisomerase II inhibitor; however, unlike Etoposide and other anti-tumor drugs currently in use, Adva-27a is able to destroy multidrug resistant cancer cells. Adva-27a is a new chemical entity and has been shown to have distinct and more desirable biological properties compared to Etoposide. Most notably, Adva-27a is very effective against multidrug resistant breast cancer cells while Etoposide has no activity against this aggressive form of cancer (see Figure 2). In other side-by-side studies against Etoposide as a reference, Adva-27a showed markedly improved cell killing activity in various other cancer types, particularly prostate, colon and lung cancer (see Table 1). Our preclinical studies to date have shown that:
|
●
|
Adva-27a is effective at killing different types of multidrug resistant cancer cells, including:
|
|
-
|
Breast Cancer Cells (MCF-7/MDR)
|
|
-
|
Small Cell Lung Cancer Cells (H69AR)
|
|
-
|
Uterine Cancer (MES-SA/Dx5)
|
|
●
|
Adva-27a is unaffected by P-Glycoprotein, the enzyme responsible for making cancer cells resistant to anti-tumor drugs.
|
|
●
|
Adva-27a has excellent clearance time (half-life = 54 minutes) as indicated by human microsomes stability studies and pharmacokinetics data in rats.
|
|
●
|
Adva-27a clearance is independent of Cytochrome P450, a mechanism that is less likely to produce toxic intermediates.
|
|
●
|
Adva-27a is an excellent inhibitor of Topoisomerase II with an IC50 of only 13.7 micromolar.
|
|
●
|
Adva-27a has shown excellent pharmacokinetics profile as indicated by studies done in rats.
|
|
●
|
Adva-27a does not inhibit tubulin assembly.
|
These and
other preclinical data have recently been published in ANTICANCER RESEARCH, a peer-reviewed International Journal of Cancer Research and Treatment. The manuscript entitled “Adva-27a, a Novel Podophyllotoxin Derivative Found to Be Effective Against Multidrug Resistant Human Cancer Cells” appeared in print in the October 2012 issue of the journal [ANTICANCER RESEARCH
32
: 4423-4432 (2012)]. A copy of the full manuscript as it appeared in the journal is available on our website at
www.sunshinebiopharma.com
.
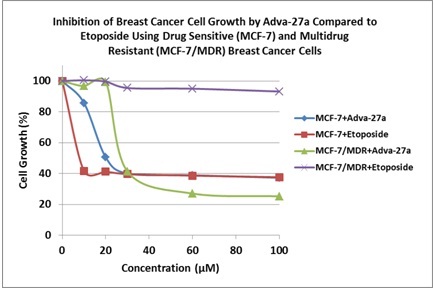
Figure 2

Table 1
Clinical Development Path
The early stage preclinical studies for our lead compound, Adva-27a, were successfully completed in late 2011 and the results have recently been published [ANTICANCER RESEARCH
32
: 4423-4432 (2012)]. We are now continuing our clinical development program of Adva-27a by conducting the next sequence of steps comprised of the following:
|
●
|
GMP Manufacturing (for use in IND-Enabling Studies and Phase I Clinical Trials)
|
|
●
|
IND-Enabling Studies
|
|
●
|
Regulatory Filing (Fast-Track Status Anticipated)
|
|
●
|
Phase I Clinical Trials (Multidrug Resistant Breast Cancer Indication)
|
Clinical Trials
Adva-27a’s initial indication will be multidrug resistant breast cancer for which there are little or no treatment options. In June 2011 we concluded an agreement with McGill University’s Jewish General Hospital in Montreal, Canada to conduct Phase I clinical trials for this indication. All aspects of the planned clinical trials in Canada will employ U.S. Food and Drug Administration (“FDA”) standards at all levels. We anticipate that the clinical trials will be completed by late 2015, at which time we, together with our licensor, expect to file for limited marketing approval with the regulatory authorities in Canada and the FDA in the U.S.
See
“Marketing,” below.
Marketing
According to the American Cancer Society, nearly 1.5 million new cases of cancer are diagnosed in the U.S. each year. Given the terminal and limited treatment options available for the multidrug resistant breast cancer indication we are planning to study, we anticipate being granted limited marketing approval (“compassionate-use”) for our Adva-27a following receipt of funding and a successful Phase I clinical trial. There are no assurances that either will occur. Such limited approval will allow us to make the drug available to various hospitals and health care centers for experimental therapy and/or “compassionate-use”, thereby generating some revenues in the near-term.
We believe that upon successful completion of Phase I Clinical Trials we may receive one or more offers from large pharmaceutical companies to buyout or license our drug. However, there are no assurances that our Phase I Trials will be successful, or if successful, that any pharmaceutical companies will make an acceptable offer to us. In the event we do not consummate such a transaction, we will require significant capital in order to manufacture and market our new drug.
Intellectual Property
We are the exclusive licensee for the U.S. territory of Advanomics’ Adva-27a which is covered by international patent applications filed on April 27, 2007 (PCT/FR2007/000697). These patent applications, which are now issued in Europe and the United States (US 8,236,935) and are still pending elsewhere around the world, were originally owned by Institut National des Sciences Appliquées de Rouen (France) and have recently been purchased by Advanomics. On January 14, 2013, Advanomics filed a new patent application covering Adva-27a manufacturing processes as well as new Adva-27a derivatives and compositions.

Our Lead Anti-Cancer Compound, Adva-27a, in 3D
Government Regulations
Our existing and proposed business operations are subject to extensive and frequently changing federal, state, provincial and local laws and regulations. We will be subject to significant regulations in the U.S. in order to obtain the approval of the FDA to offer our product on the market. The approximate procedure for obtaining FDA approval involves an initial filing of an IND application following which the FDA would give the go ahead with Phase I clinical (human) trials. Following completion of Phase I, the results is filed with the FDA and a request is made to proceed to Phase II. Similarly, following completion of Phase II the data is filed with the FDA and a request is made to proceed to Phase III. Following completion of Phase III, a request is made for marketing approval. Depending on various issues and considerations the FDA could provide limited marketing approval on a humanitarian basis if the drug treats terminally ill patients with limited treatment options available. As of the date of this Report we have not made any filings with the FDA or other regulatory bodies in other jurisdictions. We have however had extensive discussions with clinicians at the McGill University’s Jewish General Hospital in Montreal where we plan to undertake our Phase I study for multidrug resistant breast cancer. They believe that Health Canada is likely to grant us a so-called fast-track process on the basis of the terminal nature of the cancer which we will be treating. There are no assurances this will occur.
Employees
As of the date of this Report we have three (3) employees, our management. We anticipate that if we receive financing we will hire additional employees in the areas of accounting, regulatory affairs, marketing and laboratory personnel.
Competition
We will be competing with publicly and privately held companies engaged in developing cancer therapies. There are numerous other entities engaged in this business that have greater resources, both financial and otherwise, than the resources presently available to us. Nearly all major pharmaceutical companies including Amgen, Roche, Pfizer, Bristol-Myers Squibb and Novartis, to name just a few, have on-going anti-cancer drug development programs and some of the drug they may develop could be in direct competition with our drug. Also, a number of small companies are also working in the area of cancer and could develop drugs that may be in competition with ours. However, none of these competitor companies can use molecules similar to ours as they would be infringing our patents.
Trademarks-Tradenames
We are the exclusive licensee for the U.S. territory of Advanomics’ Adva-27a which is covered by international patent applications filed on April 27, 2007 (PCT/FR2007/000697). These patent applications, which are now issued in Europe and the United States (US 8,236,935) and which are still pending elsewhere around the world, were originally owned by Institut National des Sciences Appliquées de Rouen (France) and have recently been purchased by Advanomics.
An investment in our Common Stock is a risky investment. Prospective investors should carefully consider the following risk factors before purchasing shares of our Common Stock. We believe that we have included all material risks.
Risks Related to our Operations
We may not be able to continue as a going concern or fund our existing capital needs.
Our independent registered public accounting firm included an explanatory paragraph in their report included herein on our financial statements related to the uncertainty in our ability to continue as a going concern. The paragraph stated that we do not have sufficient cash on-hand or other funding available to meet our obligations and sustain our operations, which raises substantial doubt about our ability to continue as a going concern. Our cash and cash equivalents were sufficient to fund our existing development commitments, indebtedness and general operating expenses through December 31, 2012; however, we will not be generating any product-based revenues or realizing cash flows from operations in the near term, if at all, and may not have sufficient cash or other funding available to complete our anticipated business activities during 2013.
We have incurred losses in the past and expect to incur greater losses until we implement our business plan.
We are a development stage company and we have not yet begun generating revenues and we do not expect to begin generating revenues until the clinical trials for our sole product candidate is completed and is successful. In particular, our multi-purpose anti-tumor compound, Adva-27a, expects to be entering Phase I clinical trials for multidrug resistant breast cancer indication during 2014, provided that we are successful in obtaining the funding necessary to conduct these trials. We expected that we would begin these clinical trials during 2012, but were unable to secure sufficient funding to undertake this activity. There can be no assurances that we will be successful in raising the funds necessary to conduct these trials. Further, there can be no assurance that the results obtained from laboratory or research studies will be replicated in human studies or that such human studies will not identify undesirable side effects. There can be no assurance that any of our therapeutic products will meet applicable health regulatory standards, obtain required regulatory approvals or clearances, be produced in commercial quantities at reasonable costs, be successfully marketed or be profitable enough that we will recoup the investment made in such product candidates.
We are a development stage company and may never attain product sales.
We have not received approval for any of our product candidates from the FDA. Any compounds that we discover or in-license will require extensive and costly development, preclinical testing and/or clinical trials prior to seeking regulatory approval for commercial sales. Our most advanced product candidate, Adva-27a, and any other compounds we discover, develop or in-license, may never be approved for commercial sale. The time required to attain product sales and profitability is lengthy and highly uncertain, and we cannot assure you that we will be able to achieve or maintain product sales.
We expect our net operating losses to continue for at least several years, and we are unable to predict the extent of future losses or when we will become profitable, if ever. We have incurred significant net losses since our formation in 2009. We have incurred an accumulated deficit of $3,002,666 as of December 31, 2012. Our operating losses are due in large part to the significant research and development costs required to identify, validate and license potential product candidates, conduct preclinical studies and conduct clinical trials of our more advanced product candidates. To date, we have not generated any revenues and we do not anticipate generating any revenues in the near term, if ever. We expect to increase our operating expenses over the next several years as we plan to:
|
●
|
Prepare and carry out for the development of Adva-27a;
|
|
●
|
Expand our research and development activities;
|
|
●
|
Increase
our required corporate infrastructure and overhead.
|
As a result, we expect to continue to incur significant and increasing operating losses for the foreseeable future. Because of the numerous risks and uncertainties associated with our research and product development efforts, we are unable to predict the extent of any future losses or when we will become profitable, if ever. Even if we do achieve profitability, we may not be able to sustain or increase profitability on an ongoing basis.
We have not conducted any significant business operations yet and have been unprofitable to date.
There is no prior operating history by which to evaluate the likelihood of our success or our contribution to our overall profitability. We may never complete clinical trials of our product and commence significant operations or, if we do complete these clinical trials there are no assurances that the results will be positive.
We will require additional funding to satisfy our future capital needs and future financing strategies may adversely affect holders of our Common Stock.
Our operations will require significant additional funding in large part due to our anticipated research and development expenses, future preclinical and clinical testing costs, and the absence of any meaningful revenues in the near future. We do not know whether additional financing will be available to us on favorable terms or at all. If we cannot raise additional funds, we may be required to reduce our capital expenditures, scale back product development programs, reduce our workforce and license to others products or technologies that we may otherwise be able to commercialize.
To the extent we raise additional capital by issuing equity securities our stockholders could experience substantial dilution. Any additional equity securities we issue or issuances of debt we may enter into or undertake may have rights, preferences or privileges senior to those of existing holders of stock. To the extent that we raise additional funds through collaboration and licensing arrangements, we may be required to relinquish some rights to our technologies or product candidates, or grant licenses on terms that are not favorable to us.
We have not recorded any revenues from the sale of therapeutic products, have accumulated significant losses since inception and expect to continue to incur losses in the future.
There can be no assurance that we will ever be able to achieve or sustain sufficient sales or other revenue growth in order to achieve profitability or positive cash flow. To become profitable we, either alone or with one or more partners, must develop, manufacture and successfully market therapeutic product candidates. There can be no assurance that we will be successful in achieving the sales levels required to achieve profitability. In addition, lower than anticipated revenues may negatively impact our cash flows, which could accelerate the need for additional capital.
The FDA may change its approval policies or requirements, or apply interpretations to its policies or requirements, in a manner that could delay or prevent commercialization of Adva-27a.
Regulatory requirements may change in a manner that requires us to conduct additional clinical trials, which may delay or prevent commercialization of Adva-27a. We cannot provide any assurance that the FDA will not require us to repeat existing studies or conduct new or unforeseen experiments in order to demonstrate the safety and efficacy of Adva-27a before considering the approval of Adva-27a for the treatment of lung cancer or breast cancer indication. Further, FDA Advisory Panel meetings discussing such drug approvals may result in the heightened scrutiny of Adva-27a for the treatment of lung cancer or breast cancer.
Our business would be materially harmed if we fail to obtain FDA approval of a New Drug Application (“NDA”) for
Adva-27a
.
We anticipate that our ability to generate any significant product revenues in the near future will depend solely on the successful development and commercialization of Adva-27a. The FDA may not approve in a timely manner, or at all, the NDA that we submit. If we are unable to submit an NDA for other product candidates, or if the NDA we submitted is not approved by the FDA, we will be unable to commercialize those product in the United States and our business will be materially harmed. The FDA can and does reject NDAs, and often requires additional clinical trials, even when product candidates performed well or achieved favorable results in large-scale Phase III clinical trials. The FDA imposes substantial requirements on the introduction of pharmaceutical products through lengthy and detailed laboratory and clinical testing procedures, sampling activities and other costly and time-consuming procedures. Satisfaction of these requirements typically takes several years and may vary substantially based upon the type and complexity of the pharmaceutical product. Our product candidates are novel compounds or new chemical entities, which may further increase the period of time required for satisfactory testing procedures.
Data obtained from preclinical and clinical activities are susceptible to varying interpretations, which could delay, limit or prevent regulatory approval. In addition, delays or rejections may be encountered based on changes in, or additions to, regulatory policies for drug approval during the period of product development and regulatory review. The effect of government regulation may be to delay or prevent the commencement of clinical trials or marketing of our product candidates for a considerable period of time, to impose costly procedures upon our activities and to provide an advantage to our competitors that have greater financial resources or are more experienced in regulatory affairs. The FDA may not approve our product candidates for clinical trials or marketing on a timely basis or at all. Delays in obtaining or failure to obtain such approvals would adversely affect the marketing of our product candidates and our liquidity and capital resources.
Drug products and their manufacturers are subject to continual regulatory review after the product receives FDA approval. Later discovery of previously unknown problems with a product or manufacturer may result in additional clinical testing requirements or restrictions on such product or manufacturer, including withdrawal of the product from the market. Failure to comply with applicable regulatory requirements can, among other things, result in fines, injunctions and civil penalties, suspensions or withdrawals of regulatory approvals, product recalls, operating restrictions or shutdown and criminal prosecution. We may lack sufficient resources and expertise to address these and other regulatory issues as they arise.
We may be sued or become a party to litigation, which could require significant management time and attention and result in significant legal expenses and may result in an unfavorable outcome which could have a material adverse effect on our business, financial condition, results of operations and cash flows.
While we have no knowledge of any threatened litigation matters, we may be subject to lawsuits from time to time arising in the ordinary course of our business. We may be forced to incur costs and expenses in connection with defending ourselves with respect to such litigation and the payment of any settlement or judgment in connection therewith if there is an unfavorable outcome. The expense of defending litigation may be significant. The amount of time to resolve lawsuits is unpredictable and defending ourselves may divert management’s attention from the day-to-day operations of our business, which could adversely affect our business, results of operations and cash flows. In addition, an unfavorable outcome in any such litigation could have a material adverse effect on our business, results of operations and cash flows.
Holders of our Common Stock may suffer significant dilution in the future.
In order to fully implement our business plan we will require additional capital, either debt or equity, or both. As a result, we expect to raise additional equity capital by selling shares of our Common Stock or other securities in the future to raise the funds necessary to allow us to implement our business plan. If we do so, investors will suffer significant dilution.
Our management and principal shareholders have the ability to significantly influence or control matters requiring a shareholder vote and other shareholders may not have the ability to influence corporate transactions.
Currently, Dr. Steve N. Slilaty owns, either directly or indirectly, approximately 60% of our outstanding voting securities. As a result, he has the ability to determine the outcome on all matters requiring approval of our shareholders, including the election of directors and approval of significant corporate transactions.
If we are unable to attract and retain qualified scientific, technical and key management personnel, or if our key executive, Dr. Steve N. Slilaty, discontinues his employment with us, it may delay our research and development efforts.
We rely on the services of Dr. Slilaty for strategic and operational management, as well as for scientific and/or medical expertise in the development of our products. The loss of Dr. Slilaty would result in a significant negative impact on our ability to implement our business plan. We have not entered into an employment agreement with any member of our management, including Dr. Slilaty. In addition, we do not maintain “key person” life insurance covering Dr. Slilaty or any other executive officer. The loss of Dr. Slilaty will also significantly delay or prevent the achievement of our business objectives.
Our business will expose us to potential product liability risks and there can be no assurance that we will be able to acquire and maintain sufficient insurance to provide adequate coverage against potential liabilities.
Our business will expose us to potential product liability risks that are inherent in the testing, manufacturing and marketing of pharmaceutical products. The use of our product candidates in clinical trials also exposes us to the possibility of product liability claims and possible adverse publicity. These risks will increase to the extent our product candidates receive regulatory approval and are commercialized. We do not currently have any product liability insurance, although we plan to obtain product liability insurance in connection with future clinical trials of our product candidates. There can be no assurance that we will be able to obtain or maintain any such insurance on acceptable terms. Moreover, our product liability insurance may not provide adequate coverage against potential liabilities. On occasion, juries have awarded large judgments in class action lawsuits based on drugs that had unanticipated side effects. A successful product liability claim or series of claims brought against us would decrease our cash reserves and could cause our stock price to fall significantly.
We face regulation and risks related to hazardous materials and environmental laws, violations of which may subject us to claims for damages or fines that could materially affect our business, cash flows, financial condition and results of operations.
Our research and development activities involve the use of controlled and/or hazardous materials and chemicals. The risk of accidental contamination or injury from these materials cannot be completely eliminated. In the event of an accident, we could be held liable for any damages or fines that result, and the liability could have a material adverse effect on our business, financial condition and results of operations. We are also subject to federal, state and local laws and regulations governing the use, manufacture, storage, handling and disposal of hazardous materials and waste products. If we fail to comply with these laws and regulations or with the conditions attached to our operating licenses, the licenses could be revoked, and we could be subjected to criminal sanctions and substantial liability or be required to suspend or modify our operations. In addition, we may have to incur significant costs to comply with future environmental laws and regulations. We do not currently have a pollution and remediation insurance policy.
We do not have any agreements with any collaborators or third party manufacturers to manufacture our products. If and when we do reach an agreement with these parties, they may not be able to manufacture our product candidates, which would prevent us from commercializing our product candidates.
If any of our product candidates is approved by the FDA or other regulatory agencies for commercial sale, we will need third parties to manufacture the product in larger quantities. If we are able to reach an agreement with any collaborator or third party manufacturer in the future, of which there can be no assurance, due to factors beyond our control these collaborators and/or third party manufacturers may not be able to increase their manufacturing capacity for any of our product candidates in a timely or economic manner, or at all. Significant scale-up of manufacturing may require additional validation studies, which the FDA must review and approve. If we are unable to increase the manufacturing capacity for a product candidate successfully, the regulatory approval or commercial launch of that product candidate may be delayed or there may be a shortage in the supply of the product candidate. Our product candidates require precise, high-quality manufacturing. The failure of collaborators or third party manufacturers to achieve and maintain these high manufacturing standards, including the incidence of manufacturing errors, could result in patient injury or death, product recalls or withdrawals, delays or failures in product testing or delivery, cost overruns or other problems that could seriously harm our business.
If we are unable to establish sales and marketing capabilities or enter into agreements with third parties to sell and market any products we may develop, we may be unable to generate revenues.
We do not currently have product sales and marketing capabilities. If we receive regulatory approval to commence commercial sales of any of our product candidates, we will have to establish a sales and marketing organization with appropriate technical expertise and distribution capabilities or make arrangements with third parties to perform these services in other jurisdictions. If we receive approval to commercialize Adva-27a for the treatment of breast cancer indication, we intend to engage additional pharmaceutical or health care companies with existing distribution systems and direct sales organizations to assist us in North America and abroad. We may not be able to negotiate favorable distribution partnering arrangements, if at all. To the extent we enter into co-promotion or other licensing arrangements, any revenues we receive will depend on the efforts of third parties and will not be under our control. If we are unable to establish adequate sales, marketing and distribution capabilities, whether independently or with third parties, our ability to generate product revenues, and become profitable, would be severely limited.
Our ability to generate any significant revenues in the near-term is dependent entirely on the successful commercialization and market acceptance of Adva-27a. Factors that may inhibit our efforts to commercialize Adva-27a or other product candidates without strategic partners or licensees include:
|
●
|
difficulty recruiting and retaining adequate numbers of effective sales and marketing personnel;
|
|
●
|
the inability of sales personnel to obtain access to, or persuade adequate numbers of, physicians to prescribe our products;
|
|
●
|
the lack of complementary products to be offered by sales personnel, which may put us at a competitive disadvantage against companies with broader product lines; and
|
|
●
|
unforeseen
costs associated with creating an independent sales and marketing organization.
|
Even if we successfully develop and obtain approval for Adva-27a, our business will not be profitable if this product does not achieve and maintain market acceptance.
Even if our product candidate, Adva-27a, is approved for commercial sale by the FDA or other regulatory authorities, the degree of market acceptance of our approved product candidate by physicians, healthcare professionals, patients and third-party payors, and our resulting profitability and growth, will depend on a number of factors, including:
|
●
|
our ability to provide acceptable evidence of safety and efficacy;
|
|
●
|
relative convenience and ease of administration;
|
|
●
|
the prevalence and severity of any adverse side effects;
|
|
●
|
the availability of alternative treatments;
|
|
●
|
the details of FDA labeling requirements, including the scope of approved indications and any safety warnings;
|
|
●
|
pricing and cost effectiveness;
|
|
●
|
the effectiveness of our or our collaborators' sales and marketing strategy;
|
|
●
|
our ability to obtain sufficient third-party insurance coverage or reimbursement; and
|
|
●
|
our ability to have the product listed on insurance company formularies.
|
If our product candidate achieves market acceptance, we may not be able to maintain that market acceptance over time if new products or technologies are introduced that are received more favorably or are more cost effective. Complications may also arise, such as development of new know-how or new medical or therapeutic capabilities by other parties that render our product obsolete.
Because the results of preclinical studies for our preclinical product candidates are not necessarily predictive of future results, our product candidates may not have favorable results in later clinical trials or ultimately receive regulatory approval.
Our product candidate has not been tested in clinical trials. Positive results from preclinical studies are no assurance that later clinical trials will succeed. Preclinical trials are not designed to establish the clinical efficacy of our preclinical product candidate. We will be required to demonstrate through clinical trials that our product candidate is safe and effective for use before we can seek regulatory approvals for commercial sale. There is typically an extremely high rate of failure as product candidates proceed through clinical trials. If our product candidate fails to demonstrate sufficient safety and efficacy in any clinical trial, we would experience potentially significant delays in, or be required to abandon, development of that product candidate. This would adversely affect our ability to generate revenues and may damage our reputation in the industry and in the investment community.
The future clinical testing of our product candidates could be delayed, resulting in increased costs to us and a delay in our ability to generate revenues.
Our product candidate will require preclinical testing and extensive clinical trials prior to submitting a regulatory application for commercial sales. We do not know whether clinical trials will begin on time, if at all. Delays in the commencement of clinical testing could significantly increase our product development costs and delay product commercialization. In addition, many of the factors that may cause, or lead to, a delay in the commencement of clinical trials may also ultimately lead to denial of regulatory approval of a product candidate. Each of these results would adversely affect our ability to generate revenues.
The commencement of clinical trials can be delayed for a variety of reasons, including delays in:
|
●
|
demonstrating sufficient safety to obtain regulatory approval to commence a clinical trial;
|
|
●
|
reaching agreement on acceptable terms with prospective research organizations and trial sites;
|
|
●
|
manufacturing sufficient quantities of a product candidate;
|
|
●
|
obtaining institutional review board approvals to conduct clinical trials at prospective sites; and
|
|
●
|
procuring adequate financing to fund the work.
|
In addition, the commencement of clinical trials may be delayed due to insufficient patient enrollment, which is a function of many factors, including the size of the patient population, the nature of the protocol, the proximity of patients to clinical sites, the availability of effective treatments for the relevant disease, and the eligibility criteria for the clinical trial. If we are unable to enroll a sufficient number of evaluable patients, the clinical trials for our product candidates could be delayed until sufficient numbers are achieved.
We will face significant competition from other biotechnology and pharmaceutical companies, and our operating results will suffer if we fail to compete effectively.
We are a development stage company with three employees. Most of our competitors, such as Bristol-Myers Squibb, Pfizer, TEVA, Amgen, and others, are large pharmaceutical companies with substantially greater financial, technical and human resources than we have. The biotechnology and pharmaceutical industries are intensely competitive and subject to rapid and significant technological change. The drug that we are attempting to develop will compete with existing therapies if we receive marketing approval. Because of their significant resources, our competitors may be able to use discovery technologies and techniques, or partnerships with collaborators, in order to develop competing products that are more effective or less costly than the product candidate we are developing. This may render our technology or product candidate obsolete and noncompetitive. Academic institutions, government agencies, and other public and private research organizations may seek patent protection with respect to potentially competitive products or technologies and may establish exclusive collaborative or licensing relationships with our competitors.
As a company, we do not have any experience in conducting clinical trials for our Adva-27a development program. Our competitors may succeed in obtaining FDA or other regulatory approvals for product candidates more rapidly than us. Companies that complete clinical trials, obtain required regulatory agency approvals and commence commercial sale of their drugs before we do may achieve a significant competitive advantage, including certain FDA marketing exclusivity rights that would delay or prevent our ability to market certain products. Any approved drugs resulting from our research and development efforts, or from our joint efforts with our existing or future collaborative partners, might not be able to compete successfully with our competitors' existing or future products.
Because our product candidate and our development and collaboration efforts depend on our intellectual property rights, adverse events affecting our intellectual property rights will harm our ability to commercialize products.
Our success will depend to a large degree on our own and our licensors' ability to obtain and defend patents for each party's respective technologies and the compounds and other products, if any, resulting from the application of such technologies. The patent positions of pharmaceutical and biotechnology companies can be highly uncertain and involve complex legal and technical questions. No consistent policy regarding the breadth of claims allowed in biotechnology patents has emerged to date. Accordingly, we cannot predict the breadth of claims that will be allowed or maintained, after challenge, in our or other companies' patents.
The degree of future protection for our proprietary rights is uncertain, and we cannot ensure that:
|
●
|
we were the first to make the inventions covered by each of our pending patent applications;
|
|
●
|
we were the first to file patent applications for these inventions;
|
|
●
|
others will not independently develop similar or alternative technologies or duplicate any of our technologies;
|
|
●
|
our pending patent applications will result in issued patents;
|
|
●
|
any patents issued to us or our collaborators will provide a basis for commercially viable products, will provide us with any competitive advantages or will not be challenged by third parties;
|
|
●
|
we will develop additional proprietary technologies that are patentable; or
|
|
●
|
the patents of others will not have a negative effect on our ability to do business.
|
If we cannot maintain the confidentiality of our technology and other confidential information in connection with our collaborations, then our ability to receive patent protection or protect our proprietary information will be impaired. In addition, some of the technology we have licensed relies on patented inventions developed using U.S. and other governments’ resources. Under applicable law, the U.S. government has the right to require us to grant a nonexclusive, partially exclusive or exclusive license for such technology to a responsible applicant or applicants, upon terms that are reasonable under the circumstances, if the government determines that such action is necessary.
Confidentiality agreements with employees and others may not adequately prevent disclosure of trade secrets and other proprietary information and may not adequately protect our intellectual property.
We rely on trade secrets to protect our technology, particularly when we do not believe patent protection is appropriate or obtainable. However, trade secrets are difficult to protect. In order to protect our proprietary technology and processes, we rely in part on confidentiality and intellectual property assignment agreements with our employees, consultants, outside scientific collaborators and sponsored researchers and other advisors. These agreements may not effectively prevent disclosure of confidential information nor result in the effective assignment to us of intellectual property, and may not provide an adequate remedy in the event of unauthorized disclosure of confidential information or other breaches of the agreements. In addition, others may independently discover our trade secrets and proprietary information, and in such case we could not assert any trade secret rights against such party. Enforcing a claim that a party illegally obtained and is using our trade secrets is difficult, expensive and time consuming, and the outcome is unpredictable. In addition, courts outside the United States may be less willing to protect trade secrets. Costly and time-consuming litigation could be necessary to seek to enforce and determine the scope of our proprietary rights, and failure to obtain or maintain trade secret protection could adversely affect our competitive business position.
The implementation of our business plan will result in a period of rapid growth that will impose a significant burden on our current administrative and operational resources.
Our ability to effectively manage our growth will require us to substantially expand the capabilities of our administrative and operational resources by attracting, training, managing and retaining additional qualified personnel, including additional members of management, technicians and others. To successfully develop our products we will need to manage operating, producing, marketing and selling our products. There can be no assurances that we will be able to do so. Our failure to successfully manage our growth will have a negative impact on our anticipated results of operations.
Provisions of our Articles of Incorporation and Bylaws may delay or prevent a take-over that may not be in the best interests of our stockholders.
Provisions of our Articles of Incorporation and Bylaws may be deemed to have anti-takeover effects, which include when and by whom special meetings of our stockholders may be called, and may delay, defer or prevent a takeover attempt. In addition, certain provisions of the Colorado Business Corporations Act also may be deemed to have certain anti-takeover effects which include that control of shares acquired in excess of certain specified thresholds will not possess any voting rights unless these voting rights are approved by a majority of a corporation’s disinterested stockholders.
In addition, our Articles of Incorporation authorizes the issuance of up to 5,000,000 shares of Preferred Stock with such rights and preferences determined from time to time by our Board of Directors. Our Board of Directors may, without stockholder approval, issue Preferred Stock with dividends, liquidation, conversion, voting or other rights that could adversely affect the voting power or other rights of the holders of our Common Stock.
The requirements of being a public company may strain our resources, divert management’s attention and affect our ability to attract and retain executive management and qualified board members.
As a public company, we are subject to the reporting requirements of the Securities Exchange Act of 1934, as amended, or the Exchange Act, the Sarbanes-Oxley Act, the Dodd-Frank Act, and other applicable securities rules and regulations. Compliance with these rules and regulations increases our legal and financial compliance costs, make some activities more difficult, time-consuming or costly and increase demand on our systems and resources, particularly after we are no longer an “emerging growth company,” as defined in the Jumpstart our Business Startups Act, or the JOBS Act. The Exchange Act requires, among other things, that we file annual, quarterly and current reports with respect to our business and operating results. The Sarbanes-Oxley Act requires, among other things, that we maintain effective disclosure controls and procedures and internal control over financial reporting. In order to maintain and, if required, improve our disclosure controls and procedures and internal control over financial reporting to meet this standard, significant resources and management oversight may be required. As a result, management’s attention may be diverted from other business concerns which could adversely affect our business and operating results. We may need to hire more employees in the future or engage outside consultants which will increase our costs and expenses.
In addition, changing laws, regulations and standards relating to corporate governance and public disclosure are creating uncertainty for public companies, increasing legal and financial compliance costs and making some activities more time consuming. These laws, regulations and standards are subject to varying interpretations, in many cases due to their lack of specificity, and, as a result, their application in practice may evolve over time as new guidance is provided by regulatory and governing bodies. This could result in continuing uncertainty regarding compliance matters and higher costs necessitated by ongoing revisions to disclosure and governance practices. We intend to invest resources to comply with evolving laws, regulations and standards, and this investment may result in increased general and administrative expenses and a diversion of management’s time and attention from revenue-generating activities to compliance activities. If our efforts to comply with new laws, regulations and standards differ from the activities intended by regulatory or governing bodies due to ambiguities related to their application and practice, regulatory authorities may initiate legal proceedings against us and our business may be adversely affected.
However, for as long as we remain an “emerging growth company,” we may take advantage of certain exemptions from various reporting requirements that are applicable to public companies that are not “emerging growth companies” including, but not limited to, not being required to comply with the auditor attestation requirements of Section 404, reduced disclosure obligations regarding executive compensation in our periodic reports and proxy statements, and exemptions from the requirements of holding a nonbinding advisory vote on executive compensation and shareholder approval of any golden parachute payments not previously approved. We may take advantage of these reporting exemptions until we are no longer an “emerging growth company.”
We would cease to be an “emerging growth company” upon the earliest of: (i) the first fiscal year following the fifth anniversary of our becoming a reporting company, (ii) the first fiscal year after our annual gross revenues are $1.0 billion or more, (iii) the date on which we have, during the previous three-year period, issued more than $1.0 billion in non-convertible debt securities or (iv) as of the end of any fiscal year in which the market value of our Common Stock held by non-affiliates exceeded $700 million as of the end of the second quarter of that fiscal year.
We also expect that being a public company and these new rules and regulations will make it more expensive for us to obtain director and officer liability insurance, and we may be required to accept reduced coverage or incur substantially higher costs to obtain coverage. These factors could also make it more difficult for us to attract and retain qualified members of our board of directors, particularly to serve on our audit committee and compensation committee, and qualified executive officers.
As a result of disclosure of information in this report and in future filings required of a public company, our business and financial condition will become more visible, which we believe may result in threatened or actual litigation, including by competitors and other third parties. If such claims are successful, our business and operating results could be adversely affected, and even if the claims do not result in litigation or are resolved in our favor, these claims, and the time and resources necessary to resolve them, could divert the resources of our management and adversely affect our business and operating results.
We are an “emerging growth company” and we cannot be certain if the reduced disclosure requirements applicable to emerging growth companies will make our Common Stock less attractive to investors.
We are an “emerging growth company,” as defined in the JOBS Act, and we may take advantage of certain exemptions from various reporting requirements that are applicable to public companies that are not “emerging growth companies” including, but not limited to, not being required to comply with the auditor attestation requirements of Section 404, reduced disclosure obligations regarding executive compensation in our periodic reports and proxy statements, and exemptions from the requirements of holding a nonbinding advisory vote on executive compensation and shareholder approval of any golden parachute payments not previously approved. We cannot predict if investors will find our Common Stock less attractive because we may rely on these exemptions. If some investors find our Common Stock less attractive as a result, there may be a less active trading market for our Common Stock and our stock price may be more volatile.
In addition, Section 107 of the JOBS Act also provides that an “emerging growth company” can take advantage of the extended transition period provided in Section 7(a)(2)(B) of the Securities Act for complying with new or revised accounting standards. In other words, an “emerging growth company” can delay the adoption of certain accounting standards until those standards would otherwise apply to private companies. However, we are choosing to “opt out” of such extended transition period, and as a result, we will comply with new or revised accounting standards on the relevant dates on which adoption of such standards is required for non-emerging growth companies. Section 107 of the JOBS Act provides that our decision to opt out of the extended transition period for complying with new or revised accounting standards is irrevocable.
Risks Related to our Common Stock
There is a limited trading market for our securities and there can be no assurance that such a market will develop in the future.
There is no assurance that a market will develop in the future or, if developed, that it will continue. In the absence of a public trading market, an investor may be unable to liquidate his investment in our Company.
We do not have significant financial reporting experience, which may lead to delays in filing required reports with the Securities and Exchange Commission and suspension of quotation of our securities on the OTCBB or a national exchange, which will make it more difficult for you to sell your securities.
The OTCBB and other national stock exchanges each limits quotations to securities of issuers that are current in their reports filed with the Securities and Exchange Commission. Because we do not have significant financial reporting experience, we may experience delays in filing required reports with the Securities and Exchange Commission (the “SEC”). Because issuers whose securities are qualified for quotation on the OTCBB or any other national exchange are required to file these reports with the SEC in a timely manner, the failure to do so may result in a suspension of trading or delisting.
There are no automated systems for negotiating trades on the OTCBB and it is possible for the price of a stock to go up or down significantly during a lapse of time between placing a market order and its execution, which may affect your trades in our securities.
Because there are no automated systems for negotiating trades on the OTCBB, they are conducted via telephone. In times of heavy market volume, the limitations of this process may result in a significant increase in the time it takes to execute investor orders. Therefore, when investors place market orders, an order to buy or sell a specific number of shares at the current market price, it is possible for the price of a stock to go up or down significantly during the lapse of time between placing a market order and its execution.
Our stock will be considered a “penny stock” so long as it trades below $5.00 per share. This can adversely affect its liquidity.
Our Common Stock is currently considered a “penny stock” and will continue to be considered a penny stock so long as it trades below $5.00 per share and as such, trading in our Common Stock will be subject to the requirements of Rule 15g-9 under the Securities Exchange Act of 1934. Under this rule, broker/dealers who recommend low-priced securities to persons other than established customers and accredited investors must satisfy special sales practice requirements. The broker/dealer must make an individualized written suitability determination for the purchaser and receive the purchaser’s written consent prior to the transaction.
SEC regulations also require additional disclosure in connection with any trades involving a “penny stock,” including the delivery, prior to any penny stock transaction, of a disclosure schedule explaining the penny stock market and its associated risks.
In addition, broker-dealers must disclose commissions payable to both the broker-dealer and the registered representative and current quotations for the securities they offer. The additional burdens imposed upon broker-dealers by such requirements may discourage broker-dealers from recommending transactions in our securities, which could severely limit the liquidity of our securities and consequently adversely affect the market price for our securities. In addition,
few broker or dealers are likely to undertake these compliance activities. Other risks associated with trading in penny stocks could also be price fluctuations and the lack of a liquid market.
We do not anticipate payment of dividends, and investors will be wholly dependent upon the market for the Common Stock to realize economic benefit from their investment
.
As holders of our Common Stock, you will only be entitled to receive those dividends that are declared by our Board of Directors out of retained earnings. We do not expect to have retained earnings available for declaration of dividends in the foreseeable future. There is no assurance that such retained earnings will ever materialize to permit payment of dividends to you. Our Board of Directors will determine future dividend policy based upon our results of operations, financial condition, capital requirements, reserve needs and other circumstances.
Any adverse effect on the market price of our Common Stock could make it difficult for us to raise additional capital through sales of equity securities at a time and at a price that we deem appropriate.
Sales of substantial amounts of our Common Stock, or in anticipation that such sales could occur, may materially and adversely affect prevailing market prices for our Common Stock.
The market price of our Common Stock may fluctuate significantly in the future.
The market price of our Common Stock may fluctuate in response to one or more of the following factors, many of which are beyond our control:
|
●
|
competitive pricing pressures;
|
|
●
|
our ability to produce and sell our products on a cost-effective and timely basis;
|
|
●
|
our inability to obtain working capital financing;
|
|
●
|
the introduction and announcement of one or more new alternatives to our products by our competitors;
|
|
●
|
changing conditions in the market;
|
|
●
|
changes in market valuations of similar companies;
|
|
●
|
stock market price and volume fluctuations generally;
|
|
●
|
regulatory developments;
|
|
●
|
fluctuations in our quarterly or annual operating results;
|
|
●
|
additions or departures of key personnel; and
|
|
●
|
future sales of our Common Stock or other securities.
|
The price at which you purchase shares of our Common Stock may not be indicative of the price that will prevail in the trading market. You may be unable to sell your shares of Common Stock at or above your purchase price, which may result in substantial losses to you and which may include the complete loss of your investment. In the past, securities class action litigation has often been brought against a company following periods of stock price volatility. We may be the target of similar litigation in the future. Securities litigation could result in substantial costs and divert management’s attention and our resources away from our business. Any of the risks described above could adversely affect our sales and profitability and also the price of our Common Stock.
We cannot predict whether we will successfully effectuate our current business plan.
Each prospective purchaser is encouraged to carefully analyze the risks and merits of an investment in our Common Stock and should take into consideration when making such analysis, among others, the Risk Factors discussed above.
Not applicable.
Our principal place of business is located at 469 Jean-Talon West, 3
rd
Floor, Montreal, Quebec, Canada, H3N 1R4, where we relocated in June, 2012. Previously, our principal place of business was located at 2015 Peel Street, 5
th
Floor
,
Montreal, Quebec, Canada, H3A 1T8. Our current location is also the location of our licensor, Advanomics Corporation, who is providing this space to us on a rent free basis as of the date of this Report. If and when we are able to secure financing we expect that we will lease our own office and laboratory space. Our current space consists of approximately 1,000 square feet of executive office space. We anticipate that this will be sufficient for our needs until financing is in place, of which there is no assurance.
To the best of our management’s knowledge and belief, there are no claims that have been brought against us nor have there been any claims threatened.
Not Applicable.
Market Information
Trading of our Common Stock commenced on the OTCBB in September 2007 under the symbol “MWBN.” Effective November 30, 2009, the trading symbol for our Common Stock was changed to “SBFM” as a result of our name change discussed above.
The table below sets forth the reported high and low bid prices for the periods indicated. The bid prices shown reflect quotations between dealers, without adjustment for markups, markdowns or commissions, and may not represent actual transactions in our Common Stock.
|
Quarter Ended
|
High
|
Low
|
||||||
|
March 31, 2011
|
$ | 0.70 | $ | 0.125 | ||||
|
June 30, 2011
|
$ | 0.75 | $ | 0.10 | ||||
|
September 31, 2011
|
$ | 1.36 | $ | 0.25 | ||||
|
December 31, 2011
|
$ | 0.60 | $ | 0.12 | ||||
|
March 31, 2012
|
$ | 0.25 | $ | 0.13 | ||||
|
June 30, 2012
|
$ | 0.28 | $ | 0.19 | ||||
|
September 31, 2012
|
$ | 0.60 | $ | 0.18 | ||||
|
December 31, 2012
|
$ | 0.42 | $ | 0.19 |
As of March 13, 2013, the closing bid price of our Common Stock was $0.26.
Trading volume in our Common Stock is very limited. As a result, the trading price of our Common Stock is subject to significant fluctuations.
See
PART I, Item 1A,
Risk Factors
.
The Securities Enforcement and Penny Stock Reform Act of 1990
The Securities and Exchange Commission has also adopted rules that regulate broker-dealer practices in connection with transactions in penny stocks. Penny stocks are generally equity securities with a price of less than $5.00 (other than securities registered on certain national securities exchanges or quoted on the Nasdaq system, provided that current price and volume information with respect to transactions in such securities is provided by the exchange or system).
As of the date of this Report, our Common Stock is defined as a “penny stock” under the Securities and Exchange Act. It is anticipated that our Common Stock will remain a penny stock for the foreseeable future. The classification of penny stock makes it more difficult for a broker-dealer to sell the stock into a secondary market, which makes it more difficult for a purchaser to liquidate his/her investment. Any broker-dealer engaged by the purchaser for the purpose of selling his or her shares in us will be subject to Rules 15g-1 through 15g-10 of the Securities and Exchange Act. Rather than creating a need to comply with those rules, some broker-dealers will refuse to attempt to sell penny stock.
The penny stock rules require a broker-dealer, prior to a transaction in a penny stock not otherwise exempt from those rules, to deliver a standardized risk disclosure document prepared by the Commission, which:
|
●
|
contains a description of the nature and level of risk in the market for penny stocks in both public offerings and secondary trading;
|
|
|
●
|
contains a description of the broker's or dealer's duties to the customer and of the rights and remedies available to the customer with respect to a violation to such duties or other requirements of the Securities Act of 1934, as amended;
|
|
|
●
|
contains a brief, clear, narrative description of a dealer market, including "bid" and "ask" prices for penny stocks and the significance of the spread between the bid and ask price;
|
|
|
●
|
contains a toll-free telephone number for inquiries on disciplinary actions;
|
|
|
●
|
defines significant terms in the disclosure document or in the conduct of trading penny stocks; and
|
|
|
●
|
contains such other information and is in such form (including language, type, size and format) as the Securities and Exchange Commission shall require by rule or regulation;
|
The broker-dealer also must provide, prior to effecting any transaction in a penny stock, to the customer:
|
●
|
the bid and offer quotations for the penny stock;
|
|
|
●
|
the compensation of the broker-dealer and its salesperson in the transaction;
|
|
|
●
|
the number of shares to which such bid and ask prices apply, or other comparable information relating to the depth and liquidity of the market for such stock; and
|
|
|
●
|
monthly account statements showing the market value of each penny stock held in the customer's account.
|
In addition, the penny stock rules require that prior to a transaction in a penny stock not otherwise exempt from those rules; the broker-dealer must make a special written determination that the penny stock is a suitable investment for the purchaser and receive the purchaser's written acknowledgment of the receipt of a risk disclosure statement, a written agreement to transactions involving penny stocks, and a signed and dated copy of a written suitability statement. These disclosure requirements will have the effect of reducing the trading activity in the secondary market for our stock because it will be subject to these penny stock rules. Therefore, stockholders may have difficulty selling their securities.
Holders
We had 94 holders of record of our Common Stock as of the date of this Report, not including those persons who hold their shares in “street name.”
Stock Transfer Agent
The stock transfer agent for our securities is Corporate Stock Transfer, Inc., of Denver, Colorado. Their address is 3200 Cherry Creek South Drive, Suite 430, Denver, Colorado, 80209. Their phone number is (303) 282-4800.
Dividends
We have not paid any dividends since our incorporation and do not anticipate the payment of dividends in the foreseeable future. At present, our policy is to retain earnings, if any, to develop and market our products. The payment of dividends in the future will depend upon, among other factors, our earnings, capital requirements, and operating financial conditions.
Reports
We are subject to certain reporting requirements and furnish annual financial reports to our stockholders, certified by our independent accountants, and furnish unaudited quarterly financial reports in our quarterly reports filed electronically with the SEC. All reports and information filed by us can be found at the SEC website,
www.sec.gov
.
Not applicable.
The following discussion should be read in conjunction with our audited financial statements and notes thereto included herein. In connection with, and because we desire to take advantage of, the “safe harbor” provisions of the Private Securities Litigation Reform Act of 1995, we caution readers regarding certain forward looking statements in the following discussion and elsewhere in this Report and in any other statement made by, or on our behalf, whether or not in future filings with the Securities and Exchange Commission. Forward looking statements are statements not based on historical information and which relate to future operations, strategies, financial results or other developments. Forward looking statements are necessarily based upon estimates and assumptions that are inherently subject to significant business, economic and competitive uncertainties and contingencies, many of which are beyond our control and many of which, with respect to future business decisions, are subject to change. These uncertainties and contingencies can affect actual results and could cause actual results to differ materially from those expressed in any forward looking statements made by, or on our behalf. We disclaim any obligation to update forward looking statements.
Overview and History
We were incorporated in the State of Colorado on August 31, 2006 under the name “Mountain West Business Solutions, Inc.” During our fiscal year ended July 31, 2009 our business was to provide management consulting with regard to accounting, computer and general business issues for small and home-office based companies. Effective October 15, 2009, we executed an agreement to acquire Sunshine Biopharma, Inc., a Colorado corporation (“SBI”), in exchange for the issuance of 21,962,000 shares of our Common Stock and 850,000 shares of Convertible Preferred Stock, each convertible into twenty (20) shares of our Common Stock (the “Agreement”). As a result of this transaction our officers and directors resigned their positions with us and were replaced by our current management.
See
PART III, Item 10, below. As a result of this transaction we have changed our name to “Sunshine Biopharma, Inc.”
Our principal place of business is located at 469 Jean-Talon West, 3rd Floor, Montreal, Quebec, Canada H3N 1R4. Our phone number is (514) 764-9698 and our website address is
www.sunshinebiopharma.com
.
We have not been subject to any bankruptcy, receivership or similar proceeding.
Results Of Operations
Comparison of Results of Operations for the fiscal years ended December 31, 2011 and 2012
Total expenses, including general and administrative expenses and research and development expenses for our fiscal year ended December 31, 2012 were $707,952, compared to $556,202 during our fiscal year ended December 31, 2011, an increase of $151,750. During our fiscal year ended December 31, 2012, our principal expenses included $$316,375 in financial consulting fees, compared to $15,000 during 2011, an increase of $301,375 as a result of intensified efforts to secure funding for the next phase or our Adva-27a drug development program. Other principal expenses included $250,000 in licensing fees compared to $200,000 during 2011 and $101,907 in legal fees, an increase of $71,895 from the similar costs incurred in 2011. This increase was as a result of fund raising efforts and expenses associated with our being a public reporting company.
As a result, we incurred a net loss of $707,952 (approximately $0.01 per share) for the fiscal year ended December 31, 2012, compared to a net loss of $556,202 during our fiscal year ended December 31, 2011 (approximately $0.01 per share).
Because we have not generated any revenues, following is our Plan of Operation.
Plan of Operation
As of the date of this Report we are a pharmaceutical company focused on the research, development and commercialization of drugs for the treatment of various forms of cancer. Our lead compound, Adva-27, a multi-purpose anti-tumor compound, is expected to enter Phase I clinical trials in 2014. We have licensed our technology on an exclusive basis from Advanomics Corporation, a privately held Canadian company (“Advanomics”), and we are planning to initiate our own research and development program as soon as practicable, once financing is in place. There are no assurances that we will obtain the financing necessary to allow us to implement this aspect of our business plan, or to enter clinical trials. More details about our Plan of Operation are provided above under Part I, Item 1,
Business
, above.
Liquidity and Capital Resources
As of December 31, 2012, we had cash or cash equivalents of $132,638.
Net cash used in operating activities was $393,054 during our fiscal year ended December 31, 2012, compared to $297,299 during our fiscal year ended December 31, 2011. We anticipate that overhead costs in current operations will increase in the future once we enter Phase I clinical trials as discussed in Part I, Item 1,
Business
, above.
Cash flows provided or used in investing activities were $0 for the period from August 17, 2009 (inception) through December 31, 2011, as well as during our fiscal year ended December 31, 2012. Net cash flows provided or used by financing activities was $465,000 during our fiscal year ended December 31, 2012, compared to $195,600 during our fiscal year ended December 31, 2011.
In June 2012, we conducted a private placement of our Common Stock for the purposes of supporting our working capital whereby we sold 250,000 shares at a price of $0.20 per share and received proceeds of approximately $50,000 therefrom. Between July and October 2012, we conducted a private placement of our Common Stock to fund our drug development program whereby we sold 1,410,000 shares of our Common Stock at a price of $0.25 per share and received proceeds of approximately $352,500 therefrom. In December 2012, wecommenced a private offering of Convertible Notes. Prior to December 31, 2012 we issued two Convertible Notes to one accredited investor (as that term is defined under the Securities Act of 1933, as amended) in the aggregate amount of $50,000. These notes accrue interest at the rate of 6% per annum and are convertible at our option into shares of our Common Stock at $0.20 per share on or before March 31, 2013. Subsequent to December 31, 2012, we issued an additional seven notes in favor of five accredited investors in the aggregate principal amount of $503,000.
We are not generating revenue from our operations, and our ability to implement our new business plan for the future will depend on the future availability of financing. Such financing will be required to enable us to further develop our testing, research and development capabilities and continue operations. We intend to raise funds through private placements of our Common Stock, through short-term borrowing and by application for grants in conjunction with SUNY Binghamton with whom we have contracted to perform preclinical testing of our Adva-27a drug candidate. We estimate that we will require approximately $5 million in debt and/or equity capital to fully implement our business plan in the future and there are no assurances that we will be able to raise this capital. While we have engaged in discussions with various investment banking firms, venture capitalists to provide us these funds, as of the date of this Report we have not reached any agreement with any party that has agreed to provide us with the capital necessary to effectuate our new business plan or otherwise enter into a strategic alliance to provide such funding. Our inability to obtain sufficient funds from external sources when needed will have a material adverse effect on our plan of operation, results of operations and financial condition.
Our cost to continue operations as they are now conducted is nominal, but these are expected to increase once we commence Phase I clinical trials. We do not have sufficient funds to cover the anticipated increase in these expenses. We need to raise additional funds in order to continue our existing operations, to initiate research and development activities, and to finance our plans to expand our operations for the next year. If we are successful in raising additional funds, our research and development efforts will continue and expand.
Inflation
Although our operations are influenced by general economic conditions, we do not believe that inflation had a material effect on our results of operations during our fiscal year ended December 31, 2012.
Critical Accounting Policies and Estimates
Critical Accounting Estimates
The discussion and analysis of our financial condition and results of operations are based upon our financial statements, which have been prepared in accordance with accounting principles generally accepted in the United States. The preparation of these financial statements requires us to make estimates and judgments that affect the amounts of assets, liabilities, revenues and expenses, and related disclosure of contingent assets and liabilities. On an on-going basis, we evaluate our estimates based on historical experience and on various other assumptions that are believed to be reasonable under the circumstances, the results of which form the basis for making judgments about the carrying values of assets and liabilities that are not readily apparent from other sources. Actual results may differ from these estimates under different assumptions or conditions. The following represents a summary of our critical accounting policies, defined as those policies that we believe are the most important to the portrayal of our financial condition and results of operations and that require management’s most difficult, subjective or complex judgments, often as a result of the need to make estimates about the effects of matters that are inherently uncertain.
Leases
– We follow the guidance in SFAS No. 13 “
Accounting for Leases
,” as amended, which requires us to evaluate the lease agreements we enter into to determine whether they represent operating or capital leases at the inception of the lease.
Recently Adopted Accounting Standards –
As of November 1, 2011, we adopted new guidance on the testing of goodwill impairment that allows the option to assess qualitative factors to determine whether performing the two step goodwill impairment assessment is necessary. Under the option, the calculation of the reporting unit's fair value is not required to be performed unless as a result of the qualitative assessment, it is more likely than not that the fair value of the reporting unit is less than the unit's carrying amount. The adoption of this guidance impacts testing steps only, and therefore adoption did not have an impact on our consolidated financial statements. As of November 1, 2011, we adopted new guidance regarding disclosures about fair value measurements. The guidance requires new disclosures related to activity in Level 3 fair value measurements. This guidance requires purchases, sales, issuances, and settlements to be presented separately in the rollforward of activity in Level 3 fair value measurements. We have complied with the disclosure requirements of the new guidance within Note 10,
Fair value measurements
. There were various other accounting standards and interpretations issued during 2010 and 2011, none of which are expected to have a material impact on our consolidated financial position, operations or cash flows.
Off-Balance Sheet Arrangements
We have not entered into any off-balance sheet arrangements that have or are reasonably likely to have a current or future effect on our financial condition, changes in financial condition, revenues or expenses, results of operations, liquidity, capital expenditures or capital resources and would be considered material to investors.
Not applicable.
Sunshine Biopharma, Inc.
(A Development Stage Company)
CONSOLIDATED FINANCIAL STATEMENTS
With Independent Accountant’s Audit Report
At December 31, 2012 and 2011
And the period August 17, 2009 (inception) through December 31, 2012
TABLE OF CONTENTS
|
Page
|
||||
|
Independent Accountant’s Audit Report
|
F-1 | |||
|
Consolidated Balance Sheet
|
F-2 | |||
|
Consolidated Statement of Operations
|
F-3 | |||
|
Consolidated Statement of Cash Flows
|
F-4 | |||
|
Consolidated Statement of Shareholders’ Equity
|
F-5 to F-7 | |||
|
Notes to Consolidated Financial Statements
|
F-8 to F-15 | |||
27
REPORT OF INDEPENDENT REGISTERED PUBLIC ACCOUNTING FIRM
To the Board of Directors and Stockholders of Sunshine Biopharma, Inc.:
We have audited the accompanying balance sheets of Sunshine Biopharma, Inc. (“the Company”) as of December 31, 2011 and the related statements of operations, stockholders’ equity (deficit) and cash flows for the years then ended, and for the period from August 17, 2009 (inception) through December 31, 2010. These financial statements are the responsibility of the Company's management. Our responsibility is to express an opinion on these financial statements based on our audit.
We conducted our audit in accordance with standards of the Public Company Accounting Oversight Board (United States). Those standards require that we plan and perform the audit to obtain reasonable assurance about whether the financial statements are free of material misstatement. An audit includes examining, on a test basis, evidence supporting the amounts and disclosures in the financial statements, assessing the accounting principles used and significant estimates made by management, as well as evaluating the overall financial statement presentation. We believe that our audit provides a reasonable basis for our opinion.
In our opinion, the financial statements referred to above present fairly, in all material respects, the financial position of Sunshine Biopharma, Inc., as of December 31, 2011, and the results of its operations and its cash flows for the years then ended, and for the period from August 17, 2009 (inception) through December 31, 2010 in conformity with generally accepted accounting principles in the United States of America.
The company is not required to have, nor were we engaged to perform, an audit of its internal control over financial reporting. Our audit included consideration of internal control over financial reporting as a basis for designing audit procedures that are appropriate in the circumstances, but not for the purpose of expressing an opinion on the Company's internal control over financial reporting. Accordingly, we express no such opinion.
The accompanying financial statements have been prepared assuming that the Company will continue as a going concern. As discussed in Note 2 to the financial statements, the Company’s significant operating losses raise substantial doubt about its ability to continue as a going concern. The financial statements do not include any adjustments that might result from the outcome of this uncertainty.
/s/ Borgers & Cutler CPA’s PLLC
Borgers & Cutler CPA’s PLLC
Denver, CO
March 14, 2013
REPORT OF INDEPENDENT REGISTERED PUBLIC ACCOUNTING FIRM
To the Board of Directors and Stockholders of Sunshine Biopharma, Inc.:
We have audited the accompanying consolidated balance sheets of Sunshine Biopharma, Inc.(a development stage company) as of December 31, 2012 and the related statements of operations, stockholders’ equity (deficit) and cash flows for the year then ended. These financial statements are the responsibility of the Company's management. Our responsibility is to express an opinion on these financial statements based on our audit.
We conducted our audit in accordance with standards of the Public Company Accounting Oversight Board (United States). Those standards require that we plan and perform the audit to obtain reasonable assurance about whether the financial statements are free of material misstatement. An audit includes examining, on a test basis, evidence supporting the amounts and disclosures in the financial statements, assessing the accounting principles used and significant estimates made by management, as well as evaluating the overall financial statement presentation. We believe that our audit provides a reasonable basis for our opinion.
In our opinion, the consolidated financial statements referred to above present fairly, in all material respects, the consolidated financial position of Sunshine Biopharma, Inc., as of December 31, and the results of its operations and its cash flows for the years then ended in conformity with generally accepted accounting principles in the United States of America.
The company is not required to have, nor were we engaged to perform, an audit of its internal control over financial reporting. Our audit included consideration of internal control over financial reporting as a basis for designing audit procedures that are appropriate in the circumstances, but not for the purpose of expressing an opinion on the Company's internal control over financial reporting. Accordingly, we express no such opinion.
The accompanying consolidated financial statements have been prepared assuming that the Company will continue as a going concern. As discussed in Note 2 to the financial statements, the Company’s significant operating losses raise substantial doubt about its ability to continue as a going concern. The financial statements do not include any adjustments that might result from the outcome of this uncertainty.
/s/ B F Borgers CPA PC
B F Borgers CPA PC
Denver, CO
March 14, 2013
|
Sunshine Biopharma, Inc.
|
|
(A Development Stage Company)
|
|
|
|
December 31,
|
December 31,
|
|||||||
|
2012
|
2011
|
|||||||
|
ASSETS
|
||||||||
|
Current Assets:
|
||||||||
|
Cash and cash equivalents
|
$ | 132,638 | $ | 60,692 | ||||
|
Prepaid expenses
|
2,155 | 45,745 | ||||||
|
Total Current Assets
|
134,793 | 106,437 | ||||||
|
TOTAL ASSETS
|
$ | 134,793 | $ | 106,437 | ||||
|
LIABILITIES AND SHAREHOLDERS' EQUITY
|
||||||||
|
Current Liabilities:
|
||||||||
|
Current portion notes payable
|
62,500 | - | ||||||
|
Accounts payable
|
595 | 3,434 | ||||||
|
Interest payable
|
1,272 | - | ||||||
|
TOTAL LIABILITIES
|
64,367 | 3,434 | ||||||
|
SHAREHOLDERS' EQUITY
|
||||||||
|
Preferred stock, $0.10 par value per share;
|
||||||||
|
Authorized 5,000,000 Shares; Issued
|
||||||||
|
and outstanding -0- and 850,000 shares respectively
|
- | - | ||||||
|
Common Stock, $0.001 per share;
|
||||||||
|
Authorized 200,000,000 Shares; Issued
and outstanding 51,416,092
|
||||||||
|
and 48,728,842 shares respectively
|
51,416 | 48,729 | ||||||
|
Capital paid in excess of par value
|
3,021,676 | 2,348,988 | ||||||
|
(Deficit) accumulated during the development stage
|
(3,002,666 | ) | (2,294,714 | ) | ||||
|
TOTAL SHAREHOLDERS' EQUITY
|
70,426 | 103,003 | ||||||
|
TOTAL LIABILITIES AND SHAREHOLDERS' EQUITY
|
$ | 134,793 | $ | 106,437 | ||||
See Accompanying Notes To These Audited Financial Statements.
|
Sunshine Biopharma, Inc.
|
|
(A Development Stage Company)
|
|
|
|
August 17, 2009
|
||||||||||||
|
(inception) through
|
||||||||||||
|
December 31,
|
December 31,
|
December 31,
|
||||||||||
|
2012
|
2011
|
2012
|
||||||||||
|
Revenue:
|
$ | - | $ | - | $ | - | ||||||
|
Expenses:
|
||||||||||||
|
Research & Development
|
1,829 | 142,650 | 144,479 | |||||||||
|
Accounting
|
18,190 | 12,050 | 49,635 | |||||||||
|
Financial consulting
|
316,375 | 15,000 | 478,732 | |||||||||
|
Licenses
|
250,000 | 200,000 | 700,000 | |||||||||
|
Office
|
15,089 | 7,254 | 26,812 | |||||||||
|
Legal
|
101,907 | 30,012 | 242,995 | |||||||||
|
Merger costs
|
- | - | 155,150 | |||||||||
|
Public relations
|
- | 140,504 | 241,768 | |||||||||
|
Stock transfer
|
3,290 | 8,732 | 15,847 | |||||||||
|
Writedown of intangible assets
|
- | - | 945,976 | |||||||||
|
Total G & A
|
706,680 | 556,202 | 3,001,394 | |||||||||
|
(Loss) from operations
|
(706,680 | ) | (556,202 | ) | (3,001,394 | ) | ||||||
|
Other (expense) interest
|
(1,272 | ) | - | (1,272 | ) | |||||||
|
Net (Loss)
|
$ | (707,952 | ) | $ | (556,202 | ) | $ | (3,002,666 | ) | |||
|
Basic (Loss) per common share
|
(0.01 | ) | (0.02 | ) | ||||||||
|
Weighted Average Common Shares Outstanding
|
49,775,134 | 30,881,676 | ||||||||||
See Accompanying Notes To These Audited Financial Statements.
F-3
|
Sunshine Biopharma, Inc.
|
|
(A Development Stage Company)
|
|
|
|
August 17,
|
||||||||||||
|
2009 (inception)
|
||||||||||||
|
December 31,
|
December 31,
|
through December 31,
|
||||||||||
|
2012
|
2011
|
2012 | ||||||||||
|
Cash Flows From Operating Activities:
|
||||||||||||
|
Net (Loss)
|
$ | (707,952 | ) | $ | (556,202 | ) | $ | (3,002,666 | ) | |||
|
Adjustments to reconcile net loss to net cash used in
operating activities:
|
||||||||||||
|
Stock issued for licenses, services, and other assets
|
272,875 | 267,385 | 1,427,392 | |||||||||
|
(Increase) Decrease in prepaid expenses
|
43,590 | (512 | ) | (2,155 | ) | |||||||
|
Increase (Decrease) in Accounts Payable
|
(2,839 | ) | (7,970 | ) | 595 | |||||||
|
Increase in interest payable
|
1,272 | - | 1,272 | |||||||||
|
Net Cash Flows (used) in operations
|
(393,054 | ) | (297,299 | ) | (1,575,562 | ) | ||||||
|
Cash Flows From Investing Activities:
|
||||||||||||
|
Net Cash Flows (used) in Investing activities
|
- | - | - | |||||||||
|
Cash Flows From Financing Activities:
|
||||||||||||
|
Proceed from note payable
|
62,500 | - | 62,500 | |||||||||
|
Issuance of common stock
|
402,500 | 195,600 | 1,645,700 | |||||||||
|
Net Cash Flows provided by financing activities
|
465,000 | 195,600 | 1,708,200 | |||||||||
|
|
||||||||||||
|
Net Increase (Decrease) In Cash and cash equivalents
|
71,946 | (101,699 | ) | 132,638 | ||||||||
|
Cash and cash equivalents at beginning of period
|
60,692 | 162,391 | - | |||||||||
|
Cash and cash equivalents at end of period
|
$ | 132,638 | $ | 60,692 | $ | 132,638 | ||||||
|
Supplementary Disclosure Of Cash Flow Information:
|
||||||||||||
|
Stock issued for services, licenses and other assets
|
$ | 266,875 | $ | 240,200 | $ | 1,427,392 | ||||||
|
Stock issued for note conversions
|
$ | - | $ | - | $ | 29,465 | ||||||
|
Stock issued for net deficit of MWBS
|
$ | - | $ | - | $ | (29,465 | ) | |||||
|
Cash paid for interest
|
$ | - | $ | - | $ | - | ||||||
|
Cash paid for income taxes
|
$ | - | $ | - | $ | - | ||||||
See Accompanying Notes To These Audited Financial Statements.
|
Sunshine Biopharma, Inc.
|
|
(A Development Stage Company)
|
|
Audited Statement of Shareholders' Equity
|
|
Deficit accumulated
|
||||||||||||||||||||||||||||
|
Number Of
|
Capital Paid
|
Number Of
|
Stock
|
During the
|
||||||||||||||||||||||||
|
Common
|
Common
|
in Excess
|
Preferred
|
Preferred
|
Subscription
|
Comprehensive
|
development
|
|||||||||||||||||||||
|
Shares Issued
|
Stock
|
of Par Value
|
Shares Issued
|
Stock
|
Receivable
|
Income
|
stage
|
Total
|
||||||||||||||||||||
|
Balance at August 17, 2009 (Inception)
|
- | $ | - | $ | - | - | $ | - | $ | - | $ | - | $ | - | ||||||||||||||
|
August 17, 2009 issued 703,118
|
||||||||||||||||||||||||||||
|
shares of par value $.001 common stock
|
||||||||||||||||||||||||||||
|
for services valued at or $.004 per share
|
703,118 | 703 | 2,297 | 3,000 | ||||||||||||||||||||||||
|
August 19, 2009 issued 218,388
|
||||||||||||||||||||||||||||
|
shares of par value $.001 common stock
|
||||||||||||||||||||||||||||
|
for services valued at or $.004 per share
|
218,388 | 218 | 714 | 932 | ||||||||||||||||||||||||
|
August 20, 2009 issued 17,109,194
|
||||||||||||||||||||||||||||
|
shares of par value $.001 common stock and
|
||||||||||||||||||||||||||||
|
730,000 share of par value $0.10 preferred stock
|
||||||||||||||||||||||||||||
|
for license agreement Advanomics:
|
||||||||||||||||||||||||||||
|
Common valued at or $.004 per share
|
||||||||||||||||||||||||||||
|
and Preferred valued at or $.086 per share
|
17,109,194 | 17,109 | 55,891 | 850,000 | 73,000 | 146,000 | ||||||||||||||||||||||
|
September 24, 2009 :
|
||||||||||||||||||||||||||||
|
Private Placement-The Company undertook to sell
|
||||||||||||||||||||||||||||
|
2,220,552 shares of par value $.001 common stock
|
||||||||||||||||||||||||||||
|
for cash of $649,000 or $.2922 per share.
|
||||||||||||||||||||||||||||
|
Company bought 1,150,693 share of par value $.001
|
||||||||||||||||||||||||||||
|
stock for cash of $336,312 or $.2922 per share;
|
||||||||||||||||||||||||||||
|
the remaining 1,069,859 shares were collected for
|
||||||||||||||||||||||||||||
|
cash of $312,688 in October 2009.
|
1,150,693 | 1,151 | 335,161 | 336,312 | ||||||||||||||||||||||||
|
September 24, 2009 Common stock subscription
|
||||||||||||||||||||||||||||
|
(see notation above) for 1,069,074 shares of par value
|
||||||||||||||||||||||||||||
|
$.001 common stock valued at $.2922 per share
|
(312,688 | ) | 312,688 | - | ||||||||||||||||||||||||
|
September 30, 2009 issued 1,710,748
|
||||||||||||||||||||||||||||
|
shares of par value $.001 common stock
|
||||||||||||||||||||||||||||
|
for asset purchase from Sunshine Bio Investment
|
||||||||||||||||||||||||||||
|
valued at or $.2922 per share
|
1,710,748 | 1,711 | 498,289 | - | 500,000 | |||||||||||||||||||||||
|
Net (Loss)
|
(650,130 | ) | (650,130 | ) | ||||||||||||||||||||||||
|
Balance at September 30, 2009
|
20,892,141 | 20,892 | 892,352 | 850,000 | 73,000 | (312,688 | ) | 312,688 | (650,130 | ) | 336,114 | |||||||||||||||||
|
October 31, 2009 issuance of common stock
|
||||||||||||||||||||||||||||
|
subscription, upon receipt of cash 1,069,859 shs of par
|
||||||||||||||||||||||||||||
|
value $.001 common stock valued at $.2922 per share
|
1,069,859 | 1,070 | 311,618 | 312,688 | (312,688 | ) | 312,688 | |||||||||||||||||||||
|
October 31, 2009 Outstanding stock of MWBS
|
||||||||||||||||||||||||||||
|
counted as issued for MWBS net deficit
|
888,000 | 888 | (30,353 | ) | (29,465 | ) | ||||||||||||||||||||||
|
Subtotal-at October 31, 2009 reverse merger date
|
||||||||||||||||||||||||||||
|
for accounting purposes
|
22,850,000 | 22,850 | 1,173,617 | 850,000 | 73,000 | - | - | (650,130 | ) | 619,337 | ||||||||||||||||||
|
November 16, 2009 Note conversions, several,
|
||||||||||||||||||||||||||||
|
Principle of $26,500 and interest of $2,965
|
6,810,000 | 6,810 | 22,655 | 29,465 | ||||||||||||||||||||||||
|
Fractional Shares
|
7 | - | ||||||||||||||||||||||||||
|
Net (Loss)
|
(551,000 | ) | (551,000 | ) | ||||||||||||||||||||||||
|
Balance at December 31, 2009
|
29,660,007 | 29,660 | 1,196,272 | 850,000 | 73,000 | - | - | (1,201,130 | ) | 97,802 | ||||||||||||||||||
|
June 2, 2010 issued 1,675,000
|
||||||||||||||||||||||||||||
|
shares of par value $.001 common stock
|
||||||||||||||||||||||||||||
|
for services valued at or $.94 per share
|
1,675,000 | 1,675 | 1,572,825 | 1,574,500 | ||||||||||||||||||||||||
|
September 30, 2010 reversed issuance of 1,625,000
|
||||||||||||||||||||||||||||
|
shares of par value $.001 common stock
|
||||||||||||||||||||||||||||
|
for services valued at or $.94 per share
|
(1,625,000 | ) | (1,625 | ) | (1,525,875 | ) | (1,527,500 | ) | ||||||||||||||||||||
|
September 30, 2010 issued 166,667
|
||||||||||||||||||||||||||||
|
shares of par value $.001 common stock
|
||||||||||||||||||||||||||||
|
for cash at or $.60 per share
|
166,667 | 167 | 99,833 | 100,000 | ||||||||||||||||||||||||
|
October 1, 2010 issued 217,000
|
||||||||||||||||||||||||||||
|
shares of par value $.001 common stock
|
||||||||||||||||||||||||||||
|
for services valued at or $.60 per share
|
217,000 | 217 | 129,983 | 130,200 | ||||||||||||||||||||||||
|
October 29, 2010 issued 100,000
|
||||||||||||||||||||||||||||
|
shares of par value $.001 common stock
|
||||||||||||||||||||||||||||
|
for services valued at or $.60 per share
|
100,000 | 100 | 59,900 | 60,000 | ||||||||||||||||||||||||
|
October 31, 2010 issued 419,334
|
||||||||||||||||||||||||||||
|
shares of par value $.001 common stock
|
||||||||||||||||||||||||||||
|
for cash at or $.60 per share
|
419,334 | 419 | 251,181 | 251,600 | ||||||||||||||||||||||||
|
November 30, 2010 issued 78,334
|
||||||||||||||||||||||||||||
|
shares of par value $.001 common stock
|
||||||||||||||||||||||||||||
|
for cash at or $.60 per share
|
78,334 | 78 | 46,922 | 47,000 | ||||||||||||||||||||||||
|
Net (Loss)
|
(537,382 | ) | (537,382 | ) | ||||||||||||||||||||||||
|
Balance at December 30, 2010
|
30,691,342 | $ | 30,691 | $ | 1,831,040 | 850,000 | $ | 73,000 | $ | - | $ | - | $ | (1,738,512 | ) | $ | 196,220 |
|
March 29, 2011 issued 20,000
|
||||||||||||||||||||||||||||
|
shares of par value $.001 common stock
|
||||||||||||||||||||||||||||
|
for services valued at $ 12,000 or $.60 per share
|
20,000 | 20 | 11,980 | 12,000 | ||||||||||||||||||||||||
|
September 1, 2011 issued 326,00 shares
|
||||||||||||||||||||||||||||
|
of par value $.001 common stock in a
|
||||||||||||||||||||||||||||
|
private offering for cash at $0.60 per share
|
326,000 | 326 | 195,274 | 195,600 | ||||||||||||||||||||||||
|
November 3, 2011 issued 400,000 shares
|
||||||||||||||||||||||||||||
|
of par value $.001 common stock for services
|
||||||||||||||||||||||||||||
|
for services valued at $ 200,000 or $.50 per share
|
400,000 | 400 | 199,600 | 200,000 | ||||||||||||||||||||||||
|
December 16, 2011 issued 291,500 shares
|
||||||||||||||||||||||||||||
|
of par value $.001 common stock for services
|
||||||||||||||||||||||||||||
|
for services valued at $ 55,385 or $.19 per share
|
291,500 | 292 | 55,094 | 55,385 | ||||||||||||||||||||||||
|
December 21, 2011 converted 850,000 shares of
|
||||||||||||||||||||||||||||
|
preferred stock into 17,000,000 shares of par value
|
||||||||||||||||||||||||||||
|
$.001 common stock
|
17,000,000 | 17,000 | 56,000 | (850,000 | ) | (73,000 | ) | - | ||||||||||||||||||||
|
Net (Loss)
|
- | (556,202 | ) | (556,202 | ) | |||||||||||||||||||||||
|
Balance at December 31, 2011
|
48,728,842 | $ | 48,729 | $ | 2,348,988 | - | $ | - | $ | - | $ | - | $ | (2,294,714 | ) | $ | 103,003 | |||||||||||
|
June 28, 2012 issued 250,000 shares
|
||||||||||||||||||||||||||||
|
of par value $0.001 common stock in a
|
||||||||||||||||||||||||||||
|
private offering for cash at $.20 per share
|
||||||||||||||||||||||||||||
|
or $50,000
|
250,000 | 250 | 49,750 | 50,000 | ||||||||||||||||||||||||
|
June 28, 2012 issued 230,000 shares
|
||||||||||||||||||||||||||||
|
of par value $0.001 common stock for services
|
||||||||||||||||||||||||||||
|
valued at $ 69,000 or $0.30 per share
|
230,000 | 230 | 68,770 | 69,000 | ||||||||||||||||||||||||
|
July 2012 issued 840,000 shares
|
||||||||||||||||||||||||||||
|
of par value $0.001 common stock in a
|
||||||||||||||||||||||||||||
|
private offering for cash at $.25 per share
|
||||||||||||||||||||||||||||
|
or $50,000
|
840,000 | 840 | 209,160 | 210,000 | ||||||||||||||||||||||||
|
July 25, 2012 issued 44,000 shares
|
||||||||||||||||||||||||||||
|
of par value $0.001 common stock for services
|
||||||||||||||||||||||||||||
|
valued at $ 15,400 or $0.35 per share
|
44,000 | 44 | 15,356 | 15,400 | ||||||||||||||||||||||||
|
August 2012 issued 570,000 shares
|
||||||||||||||||||||||||||||
|
of par value $0.001 common stock in a
|
||||||||||||||||||||||||||||
|
private offering for cash at $.25 per share
|
||||||||||||||||||||||||||||
|
or $142,500
|
570,000 | 570 | 141,929 | 142,500 | ||||||||||||||||||||||||
|
August 17, 2012 issued 128,250 shares
|
||||||||||||||||||||||||||||
|
of par value $0.001 common stock for services
|
||||||||||||||||||||||||||||
|
valued at $ 38,475 or $0.30 per share
|
128,250 | 127 | 38,348 | 38,475 | ||||||||||||||||||||||||
|
August 31, 2012 issued 600,000 shares
|
||||||||||||||||||||||||||||
|
of par value $0.001 common stock for services
|
||||||||||||||||||||||||||||
|
valued at $ 144,000 or $0.24 per share
|
600,000 | 600 | 143,400 | 144,000 | ||||||||||||||||||||||||
|
August 31, 2012 issued 600,000 shares
|
||||||||||||||||||||||||||||
|
of par value $0.001 common stock for services
|
||||||||||||||||||||||||||||
|
valued at $ 144,000 or $0.24 per share
|
25,000 | 25 | 5,975 | 6,000 | ||||||||||||||||||||||||
|
Net (Loss)
|
- | (707,952 | ) | (707,952 | ) | |||||||||||||||||||||||
|
Balance at December 31, 2012
|
51,416,092 | $ | 51,416 | $ | 3,021,676 | - | $ | - | $ | - | $ | - | $ | (3,002,666 | ) | $ | 70,426 |
See Accompanying Notes To These Audited Financial Statements.
Sunshine Biopharma, Inc.
(A Development Stage Company)
Notes to Consolidated Financial Statements
December 31, 2012 and 2011 and
The period August 17, 2009 (inception) through December 31, 2012
ORGANIZATION
Mountain West Business Solutions, Inc. (“MWBS”) was incorporated August 31, 2006 in the State of Colorado. Sunshine Etopo, Inc. (formerly Sunshine Biopharma, Inc.) was incorporated in the State of Colorado on August 17, 2009. Effective October 15, 2009 MWBS was acquired by Sunshine Etopo, Inc. in a transaction classified as a reverse acquisition. MWBS concurrently changed its name to Sunshine Biopharma, Inc. The financial statements represent the activity of Sunshine Etopo, Inc. from August 17, 2009 (inception) through October 15, 2009, and the consolidated activity of Sunshine Etopo, Inc. and Sunshine Biopharma Inc. from October 15, 2009 forward. Sunshine Etopo, Inc. and Sunshine Biopharma Inc. are hereinafter referred to collectively as the "Company". The Company was formed for the purposes of conducting research, development and commercialization of drugs for the treatment of various forms of cancer. The Company may also engage in any other business that is permitted by law, as designated by the Board of Directors of the Company.
PRINCIPLES OF CONSOLIDATION
The accompanying consolidated financial statements include the accounts of the Company and its wholly owned subsidiary. All intercompany accounts and transactions have been eliminated in consolidation.
USE OF ESTIMATES
The preparation of financial statements in conformity with generally accepted accounting principles requires management to make estimates and assumptions that affect the reported amounts of assets and liabilities and disclosure of contingent assets and liabilities at the date of the financial statements and the reported amounts of revenues and expenses during the reporting period. Actual results could differ from those estimates.
STATEMENT OF CASH FLOWS
For purposes of the statement of cash flows, the Company considered demand deposits and highly liquid-debt instruments purchased with maturity of three months or less to be cash equivalents. Cash paid for interest during the years ended December 31, 2012 and 2011 was $0. Cash paid for income taxes during the years ended December 31, 2012 and 2011 was $0.
Sunshine Biopharma, Inc.
(A Development Stage Company)
Notes to Consolidated Financial Statements
December 31, 2012 and 2011 and
The period August 17, 2009 (inception) through December 31, 2012
Note 1 – Organization and Summary of Significant Accounting Policies (Continued)
BASIC EARNINGS PER SHARE
The net income (loss) per share is computed by dividing the net income (loss) by the weighted average number of shares of common stock outstanding. Warrants, stock options, and common stock issuable upon the conversion of the Company's preferred stock (if any), are not included in the computation if the effect would be anti-dilutive and would increase the earnings or decrease loss per share.
REVENUE RECOGNITION
The Company is a development stage pharmaceutical company focused on the research, development and commercialization of drugs for the treatment of various forms of cancer. The Company does not expect to generate revenues until clinical trials of its proposed products are completed. Once completed, revenues would be recognized as its technology is sold or its products become marketable.
FINANCIAL INSTRUMENTS
The carrying value of the Company’s financial instruments as reported in the accompanying balance sheet approximates fair value.
STOCK BASED COMPENSATION
The Company accounts for employee and non-employee stock awards under ASC 718, whereby equity instruments issued to employees for services are recorded based on the fair value of the instrument issued and those issued to non-employees are recorded based on the fair value of the consideration received or the fair value of the equity instrument, whichever is more reliably measurable.
DATE OF MANAGEMENT’S REVIEW
Subsequent events have been evaluated through March 14, 2013, which is the date the financial statements were available to be issued.
(A Development Stage Company)
Notes to Consolidated Financial Statements
December 31, 2012 and 2011 and
The period August 17, 2009 (inception) through December 31, 2012
OFFICER COMPENSATION
Through the period ended December 31, 2012 the officers and directors of the Company have not received any cash or other type of compensation.
In the course of its life the Company has had limited operations, and has a working capital deficit. This raises substantial doubt about the Company’s ability to continue as a going concern.
The Company believes it can raise capital through equity sales and borrowing to fund its operations. Management believes this will contribute toward its subsequent profitability. The accompanying financial statements do not include any adjustments that might be necessary if the Company is unable to continue as a going concern.
The Company’s authorized capital is comprised of 200,000,000 shares of $0.001 par value Common Stock and 5,000,000 shares of $0.10 par value Preferred Stock, to have such rights and preferences as the directors of the Company have or may assign from time to time. Out of the authorized Preferred Stock, the Company has designated 850,000 shares as Series A Preferred Stock (“Series A”). The Series A is convertible at any time after issuance into 20 shares of the Company's Common Stock with no further consideration, has full voting rights at 20 votes per share, and has superior liquidation rights to the common stock. Through December 31, 2012 and December 31, 2011, the Company has issued and outstanding a total of 51,416,092 and 48,728,842 shares of Common Stock and 0 and 0 shares of Series A Preferred Stock, respectively.
On August 17, 2009, the Company issued 703,118 shares of $0.001 par value Common Stock for services valued at $3,000 or $0.004 per share.
Sunshine Biopharma, Inc.
(A Development Stage Company)
Notes to Consolidated Financial Statements
December 31, 2012 and 2011 and
The period August 17, 2009 (inception) through December 31, 2012
Note 3 – Capital Stock (Continued)
On August 19, 2009, the Company issued 218,388 shares of $0.001 par value Common Stock for services valued at $932 or $0.004 per share.
On August 20, 2009, the Company issued 17,109,194 shares of $0.001 par value Common Stock for licenses valued at $73,000 or $0.004 per share.
On August 20, 2009, the Company issued 850,000 shares of $0.10 par value of Series “A” Convertible Preferred Stock for licenses valued at $73,000, or $0.086 per share.
In September and October, 2009, the Company issued 2,220,552 shares of $0.001 par value Common Stock for cash of $649,000 or $0.2922 per share as part of a private offering.
On September 30, 2009, the Company issued 1,710,748 shares of $0.001 par value Common Stock for assets valued at $500,000 or $0.2922 per share.
On October 31, 2009, the outstanding stock of Mountain West Business Solutions was counted as issued 888,000 shares of $0.001 par value Common Stock for Mountain West Business Solutions deficit of $ 29,465.
On November 16, 2009, the Company note holders converted their notes to 6,810,000 shares of $0.001 par value Common Stock for principal of $26,500 and interest of $2,965.
On June 2, 2010, the Company issued 1,675,000 shares of $0.001 par value Common Stock for services valued at $1,574,500 or $0.94 per share.
On September 30, 2010, the Company reversed issuance of 1,625,000 shares of $0.001 par value Common Stock for services valued at $1,527,500 or $0.94 per share.
On September 30, 2010, the Company issued 166,667 shares of $0.001 par value Common Stock for cash at $100,000 or $0.60 per share.
On October 1, 2010, the Company issued 217,000 shares of $0.001 par value Common Stock for services valued at $130,000 or $0.60 per share.
On October 29, 2010, the Company issued 100,000 shares of $0.001 par value Common Stock for services valued at $60,000 or $0.60 per share.
(A Development Stage Company)
Notes to Consolidated Financial Statements
December 31, 2012 and 2011 and
The period August 17, 2009 (inception) through December 31, 2012
Note 3 – Capital Stock (Continued)
On October 31, 2010, the Company issued 419,334 shares of $0.001 par value Common Stock for cash at $251,600 or $0.60 per share.
On November 30, 2010, the Company issued 78,334 shares of $0.001 par value Common Stock for cash at $47,000 or $0.60 per share.
On March 29, 2011, the Company issued 20,000 shares of $0.001 par value Common Stock for services valued at $12,000 or $0.60 per share.
On September 1, 2011, the Company issued 326,000 shares of $0.001 par value Common Stock for cash at $195,600 or $0.60 per share.
On November 3, 2011, the Company issued 400,000 shares of $0.001 par value Common Stock for services valued at $200,000 or $0.50 per share.
On September 16, 2011, the Company issued 291,500 shares of $0.001 par value Common Stock for services valued at $55,385 or $0.19 per share.
On December 21, 2011, the Company issued 17,000,000 shares of $0.001 par value Common Stock in exchange for the 850,000 shares of outstanding Series A Convertible Preferred Stock. At December 31, 2011 there was no Preferred Stock outstanding.
In June of 2012 the Company issued 230,000 shares of $0.001 par value restricted common stock for services valued at $69,000 or $0.30 per share.
In July 2012 the Company issued 44,000 shares of $0.001 par value restricted common stock for services valued at $15,400 or $0.35 per share.
In August 2012 the Company issued 128,250 shares of $0.001 par value restricted common stock for services valued at $38,475 or $0.30 per share.
(A Development Stage Company)
Notes to Consolidated Financial Statements
December 31, 2012 and 2011 and
The period August 17, 2009 (inception) through December 31, 2012
In August 2012 the Company issued 600,000 shares of $0.001 par value restricted common stock for services valued at $144,000 or $0.24 per share.
In October 2012 the Company issued 25,000 shares of $0.001 par value restricted common stock for services valued at $6,000 or $0.24 per share.
The Company has declared no dividends through December 31, 2012.
Deferred income taxes arise from the temporary differences between financial statement and income tax recognition of net operating losses. These loss carryovers are limited under the Internal Revenue Code should a significant change in ownership occur. The Company accounts for income taxes pursuant to ASC 740. At December 31, 2012 and December 31, 2011, the Company had approximately $3,002,666 and $2,294,714, respectively, in unused federal net operating loss carryforwards, which begin to expire principally in the year 2029. A deferred tax asset at each date of approximately $600,533 and $458,943 resulting from the loss carryforwards has been offset by a 100% valuation allowance. The change in the valuation allowance for the period ended December 31, 2012 and December 31, 2011 was approximately $141,590 and $111,241
.
The Company’s income tax filings are subject to audit by various taxing authorities. The Company’s open audit periods are 2009, 2010, and 2011, although, the statute of limitations for the 2009 tax year will expire effective March 15, 2013. In evaluating the Company’s provisions and accruals, future taxable income, and reversal of temporary differences, interpretations and tax planning strategies are considered. The Company believes its estimates are appropriate based on current facts and circumstances.
Sunshine Biopharma, Inc.
(A Development Stage Company)
Notes to Consolidated Financial Statements
December 31, 2012 and 2011 and
The period August 17, 2009 (inception) through December 31, 2012
The Company has licensed its technology on an exclusive basis from Advanomics Corporation, a privately held Canadian company ("Advanomics") . Dr. Steve N. Slilaty, the Company’s Chief Executive Officer and a Director, is an Officer, Director and principal shareholder of Advanomics. On December 21, 2011, Advanomics Corporation, a privately held Canadian company (“Advanomics”), and the Company’s licensor, exercised its right to convert 850,000 shares of Series “A” Preferred Stock it held in the Company into 17,000,000 shares of Common Stock.
Also, on December 21, 2011, the Company executed an amendment to the Exclusive License Agreement which waived a condition of termination and revised the consideration payable to Advanomics. The original Exclusive License Agreement required the Company to exercise an option to purchase shares in Advanomics for aggregate consideration of $9,700,000 ($5.00 per share). This obligation was waived and replaced with an annual licensing fee of $360,000 and reimbursement of research and development expenses incurred by Advanomics in connection with the Licensed Material as defined in the original Exclusive License Agreement. During 2012, the Company advanced funds pursuant to this Agreement of $250,000. The total transaction costs to date of $396,000 have been written off as impaired.
In June 2012 the Company moved its principal place of business to 469 Jean-Talon West, 3rd Floor, Montreal, Quebec, Canada, H3N 1R4. This is also the location of the Company’s licensor, Advanomics Corporation, who is providing this space on a rent free basis as of the date of this Report. Dr. Steve N. Slilaty, the Company’s Chief Executive Officer and a Director, is an Officer, Director and principal shareholder of Advanomics
On October 15, 2009 MWBS entered into an acquisition agreement (the "Agreement") with Sunshine Etopo, Inc., acquiring 100% of the outstanding common stock of Sunshine Etopo, Inc. through the issuance of 21,962,000 shares of its common stock with no readily available market price. The transaction was accounted for as a reverse acquisition as the shareholders of Sunshine Etopo, Inc. retained the majority of the outstanding common stock of MWBS after the share.
F-14
Sunshine Biopharma, Inc.
(A Development Stage Company)
Notes to Consolidated Financial Statements
December 31, 2012 and 2011 and
The period August 17, 2009 (inception) through December 31, 2012
exchange. Effective with the Agreement, the Company's stockholders' equity was retroactively recapitalized as that of Sunshine Etopo, Inc., while 100% of the assets and liabilities of MWBS valued at $(29,465), consisting of notes payable and accrued interest of $29,465, were recorded as being acquired in the reverse acquisition for its 888,000 outstanding common shares on the acquisition date. (Immediately prior to the acquisition MWBS had 9,388,000 outstanding common shares. 8,500,000 of these shares were surrendered by the holders for cancellation). Subsequent to the October 15, 2009 recapitalization, MWBS and Sunshine Etopo, Inc. remain separate legal entities (with MWBS as the parent of Sunshine Etopo, Inc.). The accompanying consolidated financial statements exclude the financial position, results of operations and cash flows of MWBS prior to the October 15, 2009 acquisition. MWBS concurrent with the transaction changed its name to Sunshine Biopharma, Inc.
In December 2012, the Company commenced a private offering of Convertible Notes. Prior to December 31, 2012, the Company issued two Convertible Notes to one accredited investor (as that term is defined under the Securities Act of 1933, as amended) in the aggregate amount of $50,000. These notes accrue interest at the rate of 6% per annum and are convertible at the option of the Company into shares of the Company’s Common Stock at $0.20 per share on or before March 31, 2013. Subsequent to December 31, 2012, the Company issued an additional seven notes in favor of five accredited investors in the aggregate principal amount of $503,000.
Effective February 22, 2013 the relationship between our Company and the firm of Borgers & Cutler CPA’s PLLC (“B&C”), our independent accountant who audited our financial statements for our fiscal year ended December 31, 2011, was terminated due to the dissolution of the partnership of B&C. B&C had audited our financial statements for the fiscal year ended, December 31, 2011 and reviewed our financial statements for the related interim periods.
In connection with the audit of our financial statements as of and for the fiscal year ended December 31, 2011, and all interim periods from December 31, 2011 through January 28, 2013, there were no disagreements with B&C on any matter of accounting principles or practices, financial statement disclosure, or auditing scope of procedures, which disagreements, if not resolved to the satisfaction of B&C, would have caused them to make reference in connection with its reports to the subject matter of the disagreements.
The audit report of B&C on our financial statements as of and for the year ended December 31, 2011 did not contain an adverse opinion or disclaimer of opinion, nor was it qualified or modified as to uncertainty, audit scope, or accounting principles, except relevant to the audit report for the year ended December 31, 2011, which stated as follows:
“The accompanying consolidated financial statements have been prepared assuming that the Company will continue as a going concern. As discussed in Note 2 to the financial statements the Company has suffered a loss from operations that raises substantial doubt about its ability to continue as a going concern. Management's plans in regard to these matters are also described in Note 2. The financial statements do not include any adjustments that might result from the outcome of this uncertainty.”
In addition, effective February 22, 2013, we retained the firm of B F Borgers CPA PC (“Borgers PC”), to audit our financial statement for our fiscal year ending December 31, 2012, and include such report as part of our annual report on Form 10-K for our fiscal year ending December 31, 2012. This change in independent accountants was approved by our Board of Directors. There were no consultations between us and Borgers PC prior to their appointment.
Disclosure Controls and Procedures
Disclosure Controls and Procedures
–
Our management, with the participation of our Chief Executive Officer and Chief Financial Officer, has evaluated the effectiveness of our disclosure controls and procedures (as such term is defined in Rules 13a-15(e) and 15d-15(e) under the Securities Exchange Act of 1934, as amended (the “Exchange Act”)) as of the end of the period covered by this Report.
These controls are designed to ensure that information required to be disclosed in the reports we file or submit pursuant to the Securities Exchange Act of 1934 is recorded, processed, summarized and reported within the time periods specified in the rules and forms of the Securities and Exchange Commission, and that such information is accumulated and communicated to our management, including our CEO/CFO to allow timely decisions regarding required disclosure.
Based on this evaluation, our CEO and CFO have concluded that our disclosure controls and procedures were effective as of December 31, 2012, at the reasonable assurance level. We believe that our financial statements presented in this annual report on Form 10-K fairly present, in all material respects, our financial position, results of operations, and cash flows for all periods presented herein.
Inherent Limitations
– Our management, including our Chief Executive Officer and Chief Financial Officer, does not expect that our disclosure controls and procedures will prevent all error and all fraud. A control system, no matter how well conceived and operated, can provide only reasonable, not absolute, assurance that the objectives of the control system are met. The design of any system of controls is based in part upon certain assumptions about the likelihood of future events, and there can be no assurance that any design will succeed in achieving its stated goals under all potential future conditions. Further, the design of a control system must reflect the fact that there are resource constraints, and the benefits of controls must be considered relative to their costs. Because of the inherent limitations in all control systems, no evaluation of controls can provide absolute assurance that all control issues and instances of fraud, if any, within our company have been detected. These inherent limitations include the realities that judgments in decision-making can be faulty, and that breakdown can occur because of simple error or mistake. In particular, many of our current processes rely upon manual reviews and processes to ensure that neither human error nor system weakness has resulted in erroneous reporting of financial data.
Changes in Internal Control over Financial Reporting
– There were no changes in our internal control over financial reporting during our fiscal year ended December 31, 2012, which were identified in conjunction with management’s evaluation required by paragraph (d) of Rules 13a-15 and 15d-15 under the Exchange Act, that have materially affected, or are reasonably likely to materially affect, our internal control over financial reporting.
This Annual Report does not include an attestation report of our registered public accounting firm regarding internal control over financial reporting. Management’s report was not subject to attestation by our registered public accounting firm pursuant to temporary rules of the Securities and Exchange Commission that permit us to provide only management’s report in this Annual Report.
Management Report on Internal Control over Financial Reporting
Our management is responsible for establishing and maintaining adequate internal control over financial reporting as defined in Rule 13a-15(f) or 15d-15(f) promulgated under the Exchange Act. Those rules define internal control over financial reporting as a process designed to provide reasonable assurance regarding the reliability of financial reporting and the preparation of financial statements for external purposes in accordance with generally accepted accounting principles and includes those policies and procedures that:
|
|
●
|
Pertain to the maintenance of records that in reasonable detail accurately and fairly reflect the transactions and dispositions of the assets of the company;
|
|
|
●
|
Provide reasonable assurance that transactions are recorded as necessary to permit preparation of financial statements in accordance with generally accepted accounting principles, and the receipts and expenditures of the company are being made only in accordance with authorizations of management and directors of the Company; and
|
|
|
●
|
Provide reasonable assurance regarding prevention or timely detection of unauthorized acquisitions, use or disposition of the company’s assets that could have a material effect on the financial statements.
|
Because of its inherent limitations, internal controls over financial reporting may not prevent or detect misstatements. Projections of any evaluation of effectiveness to future periods are subject to the risk that controls may become inadequate because of changes in conditions, or that the degree of compliance with the policies or procedures may deteriorate.
Management assessed the effectiveness of our internal control over financial reporting as of December 31, 2012. In making this assessment, our management used the criteria established in Internal Control-Integrated Framework issued by the Committee of Sponsoring Organizations of the Treadway Commission (COSO).
Based on an assessment carried out January 5-6, 2013, management believes that, as of December 31, 2012, our internal control over financial reporting was effective.
Following is a list of our officers and directors:
|
Name
|
Age
|
Position(s)
|
||
|
Dr. Steve N. Slilaty
|
60 |
President, Chief Executive Officer, and Chairman
|
||
|
Michele Di Turi
|
35 |
Chief Operating Officer and Director
|
||
|
Camille Sebaaly
|
53 |
Chief Financial Officer, Secretary and Director
|
Our directors serve as directors until our next Annual Meeting of Stockholders and the election and qualification of the director’s respective successor or until the director’s earlier death, removal or resignation.
Following is biographical information of our current management:
Dr. Steve N. Slilaty
was appointed as our CEO, President and Chairman of our Board of Directors on October 15, 2009. In addition, since February 2002, Dr. Slilaty has been President and Chief Scientific Officer of Advanomics Corporation, Montreal, Canada, a privately held company engaged in the research, development and commercialization of drugs for the treatment of various forms of cancer. Advanomics Corporation is the third in a line of biotechnology companies that Dr. Slilaty founded and managed through their early and mid-stages of development. The first,
Quantum Biotechnologies Inc.
later known as Qbiogene Inc
.
, was founded in 1991 and grew to over $60 million in annual sales. Today, Qbiogene is a member of a family of companies owned by MP Biomedicals, one of the largest international suppliers of biotechnology reagents with a catalogue containing over 55,000 products. The second company which Dr. Slilaty founded, Genomics One Corporation, now known as Alert B&C Corporation, conducted an initial public offering (IPO) of its capital stock in 1999 and, on the basis of its ownership of Dr. Slilaty’s patented TrueBlue® Technology, Genomics One became one of the handful of participants in the Human Genome Project. Formerly a research team leader of the Biotechnology Research Institute, a division of the National Research Council of Canada, Dr. Slilaty also served as a consultant in a management and advisory capacity for a major Canadian biotechnology company between 1995 and 1997 during which time the company completed one of the largest biotechnology IPO‘s in Canada raising over $34 million. Dr. Slilaty received his Ph.D degree from the University of Arizona in 1983 and a Bachelor of Science degree from Cornell University in 1976. In addition, Dr. Slilaty holds a position as Adjunct Professor at Université du Québec in the Department of Microbiology and Biotechnology. He devotes approximately 50% of his time to our business affairs.
Michele Di Turi
was appointed as our Chief Operating Officer and a Director of our Company on October 15, 2009. Since November 2008, Mr. Di Turi has been President of Sunshine Bio Investments, Inc., a privately held Canadian corporation engaged in the sale of nonregulated biotechnology and medical products. Prior, from February 2003 through November 2008, he was employed by Mazda President, Inc., Montreal, Canada, as a sales representative and director of customer service. He devotes approximately 50% of his time to our business affairs.
Camille Sebaaly
was appointed as our Chief Financial Officer, Secretary and a Director of our Company on October 15, 2009. Since 2001, Mr. Sebaaly has been self-employed as a business consultant, primarily in the biotechnology and biopharmaceutical sectors, as well as in the hydrogen generation and energy savings fields. He was a co-founder of Advanomics Corporation with Dr. Slilaty. He received a Bachelor of Science degree in electrical and computer engineering from the State University of New York at Buffalo in 1987. He devotes approximately 50% of his time to our business affairs.
There are no family relationships between any of our former or current officers and directors.
Section 16(a) Beneficial Ownership Reporting Compliance
Section 16(a) of the Securities Exchange Act of 1934 (the “34 Act”) requires our officers and directors and persons owning more than ten percent of the Common Stock, to file initial reports of ownership and changes in ownership with the Securities and Exchange Commission (“SEC”). Additionally, Item 405 of Regulation S-K under the 34 Act requires us to identify in our Form 10-K and proxy statement those individuals for whom one of the above referenced reports was not filed on a timely basis during the most recent year or prior years. To the best of our knowledge, all such reports were filed in a timely manner during 2012.
Code of Ethics
Our board of directors has not adopted a code of ethics but plans to do so in the near future.
Committees of the Board of Directors
There are no committees of the Board of Directors but it is anticipated that we will establish an audit committee, nominating committee and governance committee once independent directors are appointed, which is expected to occur in the near future.
We have not and do not expect to pay salaries to any of our executive officers or directors until such time as we are able to secure adequate funding for our operations.
Employment Agreements
None of our executive officers is party to an employment agreement with us.
Stock Plan
We have not adopted any stock option or other employee plans as of the date of this Report. We may adopt such plans in the future.
The following table sets forth certain information regarding the ownership of Common Stock as of the date of this Report, by (i) each person known to us to own more than 5% of our outstanding Common Stock as of the date of this Report, (ii) each of our directors, (iii) each of our executive officers, and (iv) all of our directors and executive officers as a group. Unless otherwise indicated, all shares are owned directly and the indicated person has sole voting and investment power.
|
Title of
Class
|
Name and Address
Of Beneficial Owner
|
Amount and Nature
Of Beneficial Ownership
|
Percent
Of Class
|
|||||||
|
Common
|
Dr. Steve N. Slilaty
(1)
579 rue Lajeunesse
Laval, Quebec
Canada H7X 3K4
|
31,752,067 | 61.3 | % | ||||||
|
Common
|
Michele Di Turi
(1)
3100 Boulevard Des Gouverneurs
Laval, Quebec
Canada H7E 5J3
|
234,373 | * | |||||||
|
Common
|
Camille Sebaaly
(1)
14464 Gouin W, #B
Montreal, Quebec
Canada H9H 1B1
|
234,373 | * | |||||||
|
Common
|
All Officers and Directors
As a Group (3 persons)
|
32,220,813 | 62.2 | % | ||||||
___________________
|
*
|
Less than 1%
|
|
(1)
|
Officer and Director of our Company.
|
|
(2)
|
Includes 31,517,694 shares held in the name of Advanomics Corporation. Dr. Slilaty is an officer, director and principal shareholder of Advanomics Corporation and as a result, controls the disposition of these shares.
|
Related Party Transactions
We licensed our technology on an exclusive basis (“Exclusive License Agreement”) from Advanomics Corporation (“Advanomics”), a privately held Canadian company. Dr. Steve N. Slilaty, our Chief Executive Officer and a Director, is an Officer, Director and principal shareholder of Advanomics. In 2009 we issued an aggregate of 17,109,194 shares of our Common Stock valued at $73,000 and 850,000 shares of Series “A” Convertible Preferred Stock valued at $73,000 in exchange for this license, and had an option to purchase 2,000,000 shares of Advanomics Common Stock at $5 (U.S.) per share within 1 year of September 30, 2009, as well as a second option to purchase an additional 1,000,000 shares of Advanomics’ Common Stock at an exercise price of $10.00 (U.S.) per share also for a 1 year term. We did not exercise either of these options. We advanced further funds pursuant to this contract of $300,000. The total transaction costs to date of $446,000 have been written off as impaired.
Pursuant to a notice of conversion received from Advanomics on December 21, 2011, we issued 17,000,000 shares of our Common Stock in exchange for the 850,000 shares of Preferred Stock held by Advanomics. On December 21, 2011, we executed an amendment to the Exclusive License Agreement which waived a condition of termination and revised the consideration payable to Advanomics. The original Exclusive License Agreement required us to exercise an option to purchase shares in Advanomics for aggregate consideration of $9,700,000.00 ($5.00 per share). This obligation was waived and replaced with an annual licensing fee of $360,000.00 and reimbursement of research and development expenses incurred by Advanomics in connection with the Licensed Material as defined in the original Exclusive License Agreement.
We have moved our principal place of business to 469 Jean-Talon West, 3rd Floor, Montreal, Quebec, Canada, H3N 1R4. This is also the location of our licensor, Advanomics Corporation, who is providing this space to us on a rent free basis as of the date of this Report. Dr. Steve N. Slilaty, our Chief Executive Officer and a Director, is an Officer, Director and principal shareholder of Advanomics. If and when we are able to secure financing we expect that we will lease our own office and laboratory space.
There are no other related party transactions that are required to be disclosed pursuant to Regulation S-K promulgated under the Securities Act of 1933, as amended.
Director Independence
None of our current directors are deemed “independent” pursuant to SEC rules. We anticipate appointing independent directors in the foreseeable future.
Fees Paid to Independent Registered Public Accounting Firms
The following table presents fees for professional audit services rendered by Borgers & Cutlet CPA's PLLC, and Ronald R. Chadwick, P.C., our former independent accountants, during our fiscal year ended December 31, 2011 and 2010, respectively. In addition, the following table also presents fees for professional audit services rendered by BF Borgers CPA PC during our fiscal year ended December 31, 2012:
|
December 31,
2012
|
December 31,
2011
|
December 31,
2010
|
||||||||||
|
Audit Fees
|
$ | 8,000 | $ | 11,500 | $ | 7,500 | ||||||
|
Audit Related Fees
|
- | - | - | |||||||||
|
Tax Fees
|
- | - | - | |||||||||
|
All Other Fees
|
- | - | - | |||||||||
|
Total
|
$ | 8,000 | $ | 11,500 | $ | 7,500 | ||||||
Audit Fees
. Consist of amounts billed for professional services rendered for the audit of our annual financial statements included in our Annual Reports on Forms 10-K for our fiscal years ended December 31, 2012, 2011, and 2010 and reviews of our interim financial statements included in our Quarterly Reports on Forms 10-Q.
Tax Fees
. Consists of amounts billed for professional services rendered for tax return preparation, tax planning and tax advice.
All Other Fees
. Consists of amounts billed for services other than those noted above.
We do not have an audit committee and as a result our entire board of directors performs the duties of an audit committee. Our board of directors evaluates the scope and cost of the engagement of an auditor before the auditor renders audit and non-audit services.
The following exhibits are included herewith:
|
Exhibit No.
|
Description
|
|
|
31.1
|
Certification of Chief Executive Officer Pursuant to Section 302 of the Sarbanes-Oxley Act of 2002
|
|
|
31.2
|
Certification of Chief Financial Officer Pursuant to Section 302 of the Sarbanes-Oxley Act of 2002
|
|
|
32.1
|
Certification of Chief Executive Officer and Chief Financial Officer Pursuant to 18 U.S.C. Section 1350
|
Following are a list of exhibits which we previously filed in other reports which we filed with the SEC, including the Exhibit No., description of the exhibit and the identity of the Report where the exhibit was filed.
|
No.
|
Description
|
Filed With
|
Date
|
|||
|
3.1
|
Articles of Incorporation
|
Form SB-2 Registration Statement
|
October 19, 2007
|
|||
|
3.2
|
Bylaws
|
Form SB-2 Registration Statement
|
October 19, 2007
|
|||
|
3.3
|
Articles of Amendment
(Name Change)
|
Form 8-K Dated November 2, 2009
|
November 6, 2009
|
|||
|
10.1
|
Share Exchange Agreement with Sunshine Biopharma, Inc.
|
Form 8-K Dated October 15, 2009
|
October 20, 2009
|
|||
|
10.2
|
License Agreement with Advanomics Corp.
|
Form 8-KA1 Dated October 15, 2009
|
January 19, 2010
|
|||
|
10.3
|
Amendment No. 1 to License Agreement
|
Form 8-KA1 Dated October 15, 2009
|
January 19, 2010
|
|||
|
21.1
|
List of Subsidiaries
|
Form 10-K For FYE July 31, 2009
|
October 29, 2009
|
Pursuant to the requirements of Section 13 or 15(d) of the Securities Exchange Act of 1934, the Registrant has duly caused this Annual Report to be signed on its behalf by the undersigned thereunder duly authorized.
| SUNSHINE BIOPHARMA, INC. | |||
| By: | s/ Dr. Steve N. Slilaty | ||
|
Dated: March 14, 2013
|
Dr. Steve N. Slilaty, Chief Executive Officer
|
||
| By: |
s/ Camille Sebaaly
|
||
| Camille Sebaaly, Chief Financial Officer | |||
In accordance with the Exchange Act, this Annual Report has been signed below by the following persons on behalf of the registrant and in the capacities indicated on March 14, 2013.
|
s/ Dr. Steve N. Slilaty
|
|
| Dr. Steve N. Slilaty, Director | |
|
s/ Camille Sebaaly
|
|
|
Camille Sebaaly, Director
|
|
| s/ Michele Di Turi | |
| Michele Di Turi, Director |
35
TABLE OF CONTENTS
Part IItem 1. BusinessItem 1A. Risk FactorsItem 1B. Unresolved Staff CommentsItem 2. PropertiesItem 3. Legal ProceedingsItem 4. Mine Safety DisclosuresPart IIItem 5. Market For Registrant S Common Equity, Related Stockholder Matters and Issuer Purchases Of Equity SecuritiesItem 6. Selected Financial DataItem 7. Management S Discussion and Analysis Of Financial Condition and Results Of OperationsItem 7A. Quantitative and Qualitative Disclosures About Market RiskItem 8. Financial Statements and Supplementary DataNote 1 Organization and Summary Of Significant Accounting PoliciesNote 1 Organization and Summary Of Significant Accounting Policies (continued)Note 2 Basis Of PresentationNote 3 Capital StockNote 3 Capital Stock (continued)Note 4 Income TaxesNote 5 Related TransactionsNote 6 Reverse AcquisitionNote 6 Reverse Acquisition (continued)Note 7 Convertible NotesItem 9. Changes in and Disagreements with Accountants on Accounting and Financial DisclosureItem 9A. Controls and ProceduresItem 9B. Other Information NoneItem 9B. Other InformationPart IIIItem 10. Directors, Executive Officers and Corporate GovernanceItem 11. Executive CompensationItem 12. Security Ownership Of Certain Beneficial Owners and Management and Related Stockholder MattersItem 13. Certain Relationships and Related Transactions and Director IndependenceItem 14. Principal Accounting Fees and ServicesPart IVItem 15. Exhibits, Financial Statement Schedules