SABRA HEALTH CARE REIT, INC.
10-Ks and 10-Qs
|
|
|
|
|
|
|
|
|
|
|
|
|
|
|
|
|
|
|
|
|
|
|
|
|
|
|
|
|
|
|
|
|
|
|
|
|
|
|
|
|
|
|
|
|
|
|
|
|
|
|
|
|
UNITED STATES
SECURITIES AND EXCHANGE COMMISSION
Washington, D.C. 20549
FORM 10-K
(Mark One)
|
x
|
ANNUAL REPORT PURSUANT TO SECTION 13 OR 15(d) OF THE SECURITIES EXCHANGE ACT OF 1934
|
For the fiscal year ended
December 31, 2012
OR
|
o
|
TRANSITION REPORT PURSUANT TO SECTION 13 OR 15(d) OF THE SECURITIES EXCHANGE ACT OF 1934
|
Commission file number 001-34950
SABRA HEALTH CARE REIT, INC.
(Exact Name of Registrant as Specified in Its Charter)
|
Maryland
|
|
27-2560479
|
|
(State of Incorporation)
|
|
(I.R.S. Employer Identification No.)
|
18500 Von Karman Avenue, Suite 550
Irvine, CA 92612
(888) 393-8248
(Address, zip code and telephone number of Registrant)
Securities registered pursuant to Section 12(b) of the Act:
|
Title of Each Class
|
|
Name of Each Exchange on Which Registered
|
|
Common Stock
|
|
The NASDAQ Stock Market LLC (NASDAQ Global Select Market)
|
Securities registered pursuant to Section 12(g) of the Act: None
Indicate by check mark if the registrant is a well-known seasoned issuer, as defined in Rule 405 of the Securities Act. Yes
x
No
o
Indicate by check mark if the registrant is not required to file reports pursuant to Section 13 or Section 15(d) of the Act. Yes
o
No
x
Indicate by check mark whether the registrant (1) has filed all reports required to be filed by Section 13 or 15(d) of the Securities Exchange Act of 1934 during the preceding 12 months (or for such shorter period that the registrant was required to file such reports) and (2) has been subject to such filing requirements for the past 90 days. Yes
x
No
o
Indicate by check mark whether the registrant has submitted electronically and posted on its corporate website, if any, every Interactive Data File required to be submitted and posted pursuant to Rule 405 of Regulation S-T (§232.405 of this chapter) during the preceding 12 months (or for such shorter period that the registrant was required to submit and post such files). Yes
x
No
o
Indicate by check mark if disclosure of delinquent filers pursuant to Item 405 of Regulation S-K is not contained herein, and will not be contained, to the best of Registrant’s knowledge, in definitive proxy or information statements incorporated by reference in Part III of this Form 10-K or any amendment of this Form 10-K.
o
Indicate by check mark whether the registrant is a large accelerated filer, an accelerated filer, a non-accelerated filer, or a smaller reporting company. See the definitions of “large accelerated filer,” “accelerated filer” and “smaller reporting company” in Rule 12b-2 of the Exchange Act. (Check one):
|
Large accelerated filer
|
|
o
|
|
Accelerated filer
|
|
x
|
|
Non-accelerated filer
|
|
o
(Do not check if a smaller reporting company)
|
|
Smaller reporting company
|
|
o
|
Indicate by check mark whether the Registrant is a shell company (as defined in Rule 12b-2 of the Exchange Act). Yes
o
No
x
State the aggregate market value of the voting and non−voting common equity held by non-affiliates computed by reference to the price at which the common equity was last sold, or the average bid and asked price of such common equity, as of the last business day of the registrant’s most recently completed second fiscal quarter: $623.0 million
As of March 4, 2013, there were 37,326,287 shares of the Registrant’s $0.01 par value Common Stock outstanding.
DOCUMENTS INCORPORATED BY REFERENCE
Portions of the Proxy Statement for the registrant's 2013 Annual Meeting of Stockholders, to be filed with the Securities and Exchange Commission not later than 120 days after
December 31, 2012
, are incorporated by reference in Part III herein.
SABRA HEALTH CARE REIT, INC. AND SUBSIDIARIES
Index
|
ITEM 4.
MINE SAFETY DISCLOSURES
|
|
1
References throughout this document to “Sabra,” “we,” “our,” “ours” and “us” refer to Sabra Health Care REIT, Inc. and its direct and indirect consolidated subsidiaries and not any other person.
STATEMENT REGARDING FORWARD-LOOKING STATEMENTS
Certain statements in this Annual Report on Form 10-K (this “10-K”) contain “forward-looking” information as that term is defined by the Private Securities Litigation Reform Act of 1995 and the federal securities laws. Any statements that do not relate to historical or current facts or matters are forward-looking statements. Examples of forward-looking statements include all statements regarding our expected future financial position, results of operations, cash flows, liquidity, financing plans, business strategy, budgets, the expected amounts and timing of dividends and other distributions, projected expenses and capital expenditures, competitive position, growth opportunities, potential acquisitions, plans and objectives for future operations, and compliance with and changes in governmental regulations. You can identify some of the forward-looking statements by the use of forward-looking words such as “anticipate,” “believe,” “plan,” “estimate,” “expect,” “intend,” “should,” “may” and other similar expressions, although not all forward-looking statements contain these identifying words.
Our actual results may differ materially from those projected or contemplated by our forward-looking statements as a result of various factors, including among others, the following:
|
•
|
our dependence on Genesis HealthCare LLC, the parent of Sun Healthcare Group, Inc., until we are able to further diversify our portfolio;
|
|
•
|
our dependence on the operating success of our tenants;
|
|
•
|
changes in general economic conditions and volatility in financial and credit markets;
|
|
•
|
the dependence of our tenants on reimbursement from governmental and other third-party payors;
|
|
•
|
the significant amount of and our ability to service our indebtedness;
|
|
•
|
covenants in our debt agreements that may restrict our ability to make acquisitions, incur additional indebtedness and refinance indebtedness on favorable terms;
|
|
•
|
increases in market interest rates;
|
|
•
|
our ability to raise capital through equity financings;
|
|
•
|
the relatively illiquid nature of real estate investments;
|
|
•
|
competitive conditions in our industry;
|
|
•
|
the loss of key management personnel or other employees;
|
|
•
|
the impact of litigation and rising insurance costs on the business of our tenants;
|
|
•
|
uninsured or underinsured losses affecting our properties and the possibility of environmental compliance costs and liabilities;
|
|
•
|
our ability to maintain our status as a real estate investment trust (“REIT”); and
|
|
•
|
compliance with REIT requirements and certain tax matters related to our status as a REIT.
|
We urge you to carefully consider these risks and review the additional disclosures we make concerning risks and other factors that may materially affect the outcome of our forward-looking statements and our future business and operating results, including those made in Item 1A, “Risk Factors” in this 10-K, as such risk factors may be amended, supplemented or superseded from time to time by other reports we file with the Securities and Exchange Commission (“SEC”), including subsequent Annual Reports on Form 10-K and Quarterly Reports on Form 10-Q. We caution you that any forward-looking statements made in this 10-K are not guarantees of future performance, events or results, and you should not place undue reliance on these forward-looking statements, which speak only as of the date of this report. We do not intend, and we undertake no obligation, to update any forward-looking information to reflect events or circumstances after the date of this 10-K or to reflect the occurrence of unanticipated events, unless required by law to do so.
GENESIS HEALTHCARE LLC AND SUN HEALTHCARE GROUP, INC. INFORMATION
This 10-K includes information regarding Genesis HealthCare LLC (“Genesis”), and Sun Healthcare Group, Inc. (formerly known as SHG Services, Inc.; “Sun”), a subsidiary of Genesis effective December 1, 2012. Prior to December 1, 2012, Sun was subject to the reporting requirements of the SEC and was required to file with the SEC annual reports containing audited financial information and quarterly reports containing unaudited financial information. Genesis is not subject to SEC reporting requirements. The information related to Genesis and Sun provided in this 10-K has been provided by Genesis and Sun or derived from Sun's historical public filings. We have not independently verified this information. We have no reason to believe that such information is inaccurate in any material respect. We are providing this data for informational purposes only. Sun’s historical filings with the SEC can be found at
www.sec.gov
.
2
Overview
We were incorporated on May 10, 2010 as a wholly owned subsidiary of Sun Healthcare Group, Inc. (“Old Sun”), a provider of nursing, rehabilitative and related specialty healthcare services principally to the senior population in the United States. Pursuant to a restructuring plan by Old Sun, Old Sun restructured its business by separating its real estate assets and its operating assets into two separate publicly traded companies, Sabra and SHG Services Inc. (which was then renamed “Sun Healthcare Group, Inc.” or “Sun”). In order to effect the restructuring, Old Sun distributed to its stockholders on a pro rata basis all of the outstanding shares of common stock of Sun (this distribution is referred to as the “Separation”), together with an additional cash distribution. Immediately following the Separation, Old Sun merged with and into Sabra, with Sabra surviving the merger and Old Sun stockholders receiving shares of Sabra common stock in exchange for their shares of Old Sun common stock (this merger is referred to as the “REIT Conversion Merger”). The Separation and REIT Conversion Merger were completed on November 15, 2010, which we refer to as the Separation Date.
Following the restructuring of Old Sun’s business and the completion of the Separation and REIT Conversion Merger, we began operating as a self-administered, self-managed REIT that, directly or indirectly, owns and invests in real estate serving the healthcare industry.
Effective December 1, 2012, Sun was acquired by Genesis HealthCare LLC (“Genesis”). In connection with this transaction, we obtained a parent guaranty from Genesis which replaced the then-existing Sun guaranty of the lease obligations of its subsidiaries that are tenants under our lease agreements. Additionally, we amended our master lease agreements with Sun to fix the annual rent escalators at 2.5% and to include cross-default provisions with Genesis’s term loan.
As of
December 31, 2012
, our investment portfolio consisted of
119
real estate properties held for investment (consisting of (i)
96
skilled nursing/post-acute facilities, (ii)
22
senior housing facilities, and (iii)
one
acute care hospital), one asset held for sale and two mortgage loan investments. As of
December 31, 2012
, our real estate properties held for investment had a total of
12,382
licensed beds, or units, spread across
27
states. As of
December 31, 2012
, all of our real estate properties were leased under triple-net operating leases with expirations ranging from
eight to 22
years.
We expect to continue to grow our portfolio primarily through the acquisition of senior housing and memory care facilities and with a secondary focus on acquiring skilled nursing facilities. We have and will continue to opportunistically originate financing secured directly or indirectly by healthcare facilities. We also expect to continue to work with operators to identify strategic development opportunities. These opportunities may involve replacing or renovating facilities in our portfolio that may have become less competitive and new development opportunities that present attractive risk-adjusted returns. In addition to pursuing acquisitions with triple-net leases, we expect to continue to pursue other forms of investment, including investments in senior housing through RIDEA-compliant structures, mezzanine and secured debt investments, and joint ventures for senior housing, memory care and skilled nursing assets.
As we acquire additional properties and expand our portfolio, we expect to further diversify by tenant, asset class and geography within the healthcare sector. We employ a disciplined, opportunistic approach in our healthcare real estate investment strategy by investing in assets that provide attractive opportunities for dividend growth and appreciation of asset values, while maintaining balance sheet strength and liquidity, thereby creating long-term stockholder value.
We elected to be treated as a REIT with the filing of our U.S. federal income tax return for the taxable year beginning January 1, 2011. We believe that we have been organized and have operated, and we intend to continue to operate, in a manner to qualify as a REIT. We operate through an umbrella partnership (commonly referred to as an UPREIT) structure in which substantially all of our properties and assets are held by Sabra Health Care Limited Partnership, a Delaware limited partnership (the “Operating Partnership”), in which we and our wholly owned subsidiaries are currently the only partners, or by subsidiaries of the Operating Partnership.
Our principal executive offices are located at 18500 Von Karman Avenue, Suite 550, Irvine, CA 92612, and our telephone number is (888) 393-8248. We maintain a website at www.sabrahealth.com. Sabra Health Care REIT, Inc. files reports with the SEC, including annual reports on Form 10-K, quarterly reports on Form 10-Q, current reports on Form 8-K and amendments to those reports filed or furnished pursuant to Section 13(a) or 15(d) of the Securities Exchange Act of 1934, as amended (the “Exchange Act”). We will make such filings available free of charge on our website as soon as reasonably practicable after such information has been filed or furnished with the SEC.
3
Our Industry
We operate as a REIT that holds investments in income-producing healthcare facilities, principally long-term care facilities, located in the United States. We invest primarily in the United States nursing home industry and other senior housing segments such as assisted living and independent living facilities. According to the American Health Care Association, as of December 2012, the nursing home industry was comprised of approximately 15,700 facilities with approximately 1.7 million Medicare certified beds in the United States. The nursing home industry is highly fragmented.
The primary growth drivers for the long-term care industry are expected to be the aging of the population and increased life expectancies. According to the United States Census Bureau, the number of Americans aged 65 or older is projected to increase from approximately 39.2 million in 2011 to approximately 54.8 million by 2020, representing a compounded annual growth rate of 3.8%. In addition to positive demographic trends, we expect demand for services provided by skilled nursing facilities to continue increasing due to the impact of cost containment measures adopted by the federal government that encourage patient treatment in more cost-effective settings, such as skilled nursing facilities. As a result, high acuity patients that previously would have been treated in long-term acute care hospitals and inpatient rehabilitation facilities are increasingly being treated in skilled nursing facilities. According to the Centers for Medicare & Medicaid Services, or CMS, nursing home expenditures are projected to grow from approximately $155 billion in 2012 to approximately $255 billion in 2021, representing a compounded annual growth rate of 5.7%. We believe that these trends will support an increasing demand for long-term care services, which in turn will support an increasing demand for our properties.
Portfolio of Healthcare Properties
We have a geographically diverse portfolio of healthcare properties in the United States that offer a range of services including skilled nursing, assisted and independent living, mental health and acute care. Of our
119
properties held for investment as of
December 31, 2012
, we owned fee title to 113 properties and title under long-term ground leases for six properties.
Our portfolio consisted of the following types of healthcare facilities as of
December 31, 2012
:
|
•
|
Skilled Nursing/Post-Acute Facilities
|
•
Skilled nursing facilities.
Skilled nursing facilities provide services that include daily nursing, therapeutic rehabilitation, social services, housekeeping, nutrition and administrative services for individuals requiring certain assistance for activities in daily living. A typical skilled nursing facility includes mostly one and two bed units, each equipped with a private or shared bathroom and community dining facilities.
•
Mental health facilities.
Mental health facilities provide a range of inpatient and outpatient behavioral health services for adults and children through specialized treatment programs.
|
•
|
Senior Housing
|
•
Assisted living facilities.
Assisted living facilities provide services that include minimal assistance for activities in daily living and permit residents to maintain some of their privacy and independence as they do not require constant supervision and assistance. Services bundled within one regular monthly fee usually include three meals per day in a central dining room, daily housekeeping, laundry, medical reminders and 24-hour availability of assistance with the activities of daily living, such as eating, dressing and bathing. Professional nursing and healthcare services are usually available at the facility on call or at regularly scheduled times. Assisted living facilities typically are comprised of one and two bedroom suites equipped with private bathrooms and efficiency kitchens.
•
Independent living facilities.
Independent living facilities are age-restricted multi-family properties with central dining facilities that provide services that include security, housekeeping, nutrition and limited laundry services. Our independent living facilities are designed specifically for independent seniors who are able to live on their own, but desire the security and conveniences of community living. Independent living facilities typically offer several services covered under a regular monthly fee.
•
Continuing care retirement community.
Continuing care retirement communities, or CCRCs, provide, as a continuum of care, the services described above for independent living facilities, assisted living facilities and skilled nursing facilities in an integrated campus, under long-term contracts with the residents.
|
•
|
Acute Care Hospital
|
•
Acute care hospitals provide inpatient medical care and other related services for surgery, acute medical conditions or injuries (usually for a short-term illness or condition).
4
The following tables display the distribution of our licensed beds/units and the geographic concentration of our real estate held for investment by property type, investment and rental income as of or for the year ended
December 31, 2012
(dollars in thousands):
|
Distribution of Licensed Beds/Units
(1)
|
||||||||||||||||||
|
Total Number of
Properties
|
|
Bed Type
|
||||||||||||||||
|
State
|
|
Skilled Nursing/Post-Acute
|
Assisted
Living
|
Acute Care Hospital
|
Total
|
% of
Total
|
||||||||||||
|
Connecticut
|
13
|
|
1,770
|
|
49
|
|
—
|
|
1,819
|
|
14.7
|
%
|
||||||
|
New Hampshire
|
16
|
|
1,470
|
|
203
|
|
—
|
|
1,673
|
|
13.5
|
|
||||||
|
Kentucky
|
15
|
|
1,020
|
|
128
|
|
—
|
|
1,148
|
|
9.3
|
|
||||||
|
Ohio
|
8
|
|
897
|
|
—
|
|
—
|
|
897
|
|
7.2
|
|
||||||
|
Texas
|
8
|
|
720
|
|
34
|
|
70
|
|
824
|
|
6.7
|
|
||||||
|
Florida
|
5
|
|
660
|
|
—
|
|
—
|
|
660
|
|
5.3
|
|
||||||
|
Michigan
|
10
|
|
—
|
|
571
|
|
—
|
|
571
|
|
4.6
|
|
||||||
|
Montana
|
4
|
|
538
|
|
—
|
|
—
|
|
538
|
|
4.3
|
|
||||||
|
Delaware
|
4
|
|
500
|
|
—
|
|
—
|
|
500
|
|
4.0
|
|
||||||
|
Colorado
|
3
|
|
362
|
|
48
|
|
—
|
|
410
|
|
3.3
|
|
||||||
|
Other (17 states)
|
33
|
|
2,889
|
|
453
|
|
—
|
|
3,342
|
|
27.1
|
|
||||||
|
119
|
|
10,826
|
|
1,486
|
|
70
|
|
12,382
|
|
100.0
|
%
|
|||||||
|
% of Total beds/units
|
87.4
|
%
|
12.0
|
%
|
0.6
|
%
|
100.0
|
%
|
||||||||||
|
|
|
|
|
|
|
|
||||||||||||
|
(
1)
|
“Licensed Beds” refer to the number of beds for which a license has been issued, which may vary in some instances from licensed beds available for use, which is used in the computation of occupancy percentage. Available beds aggregated 11,861 as of
December 31, 2012
.
|
|
Geographic Concentration — Property Type
|
|||||||||||||||
|
State
|
Skilled Nursing/Post-Acute
|
Assisted
Living
|
Acute Care Hospital
|
|
Total
|
|
% of
Total
|
||||||||
|
New Hampshire
|
14
|
|
2
|
|
—
|
|
16
|
|
13.4
|
%
|
|||||
|
Kentucky
|
13
|
|
2
|
|
—
|
|
15
|
|
12.6
|
|
|||||
|
Connecticut
|
12
|
|
1
|
|
—
|
|
13
|
|
10.9
|
|
|||||
|
Michigan
|
—
|
|
10
|
|
—
|
|
10
|
|
8.4
|
|
|||||
|
Ohio
|
8
|
|
—
|
|
—
|
|
8
|
|
6.7
|
|
|||||
|
Texas
|
6
|
|
1
|
|
1
|
|
8
|
|
6.7
|
|
|||||
|
Florida
|
5
|
|
—
|
|
—
|
|
5
|
|
4.2
|
|
|||||
|
Oklahoma
|
3
|
|
1
|
|
—
|
|
4
|
|
3.4
|
|
|||||
|
Delaware
|
4
|
|
—
|
|
—
|
|
4
|
|
3.4
|
|
|||||
|
Montana
|
4
|
|
—
|
|
—
|
|
4
|
|
3.4
|
|
|||||
|
Other (17 states)
|
27
|
|
5
|
|
—
|
|
32
|
|
26.9
|
|
|||||
|
Total
|
96
|
|
22
|
|
1
|
|
119
|
|
100.0
|
%
|
|||||
|
|
|
|
|
|
|
|
|
||||||||
5
|
Geographic Concentration — Investment
(1)
|
||||||||||||||||||||||
|
State
|
Total Number of
Properties
|
|
Skilled Nursing/Post-Acute
|
Assisted
Living
|
Acute Care Hospital
|
|
Total
|
|
% of
Total
|
|||||||||||||
|
Connecticut
|
13
|
|
$
|
143,992
|
|
$
|
7,999
|
|
$
|
—
|
|
$
|
151,991
|
|
15.9
|
%
|
||||||
|
Texas
|
8
|
|
65,795
|
|
1,396
|
|
61,640
|
|
128,831
|
|
13.5
|
|
||||||||||
|
Delaware
|
4
|
|
95,780
|
|
—
|
|
—
|
|
95,780
|
|
10.0
|
|
||||||||||
|
New Hampshire
|
16
|
|
76,992
|
|
12,792
|
|
—
|
|
89,784
|
|
9.4
|
|
||||||||||
|
Michigan
|
10
|
|
—
|
|
73,968
|
|
—
|
|
73,968
|
|
7.7
|
|
||||||||||
|
Kentucky
|
15
|
|
59,350
|
|
10,489
|
|
—
|
|
69,839
|
|
7.3
|
|
||||||||||
|
Colorado
|
3
|
|
28,852
|
|
15,702
|
|
—
|
|
44,554
|
|
4.7
|
|
||||||||||
|
Montana
|
4
|
|
42,729
|
|
—
|
|
—
|
|
42,729
|
|
4.5
|
|
||||||||||
|
Ohio
|
8
|
|
42,612
|
|
—
|
|
—
|
|
42,612
|
|
4.5
|
|
||||||||||
|
Florida
|
5
|
|
30,748
|
|
—
|
|
—
|
|
30,748
|
|
3.2
|
|
||||||||||
|
Other (17 states)
|
33
|
|
159,660
|
|
25,864
|
|
185,524
|
|
19.3
|
|
||||||||||||
|
Total
|
119
|
|
$
|
746,510
|
|
$
|
148,210
|
|
$
|
61,640
|
|
$
|
956,360
|
|
100.0
|
%
|
||||||
|
% of Total properties
|
|
|
78.1
|
%
|
15.5
|
%
|
6.4
|
%
|
100.0
|
%
|
|
|
||||||||||
|
(1)
|
Represents the undepreciated book value of our real estate held for investment as of
December 31, 2012
.
|
|
Geographic Concentration — Rental Income
|
||||||||||||||||||||||
|
Total Number of
Properties
|
Skilled Nursing/Post-Acute
|
|
Senior Housing
|
Acute Care Hospital
|
Total
|
% of Total
|
||||||||||||||||
|
New Hampshire
|
16
|
|
$
|
12,074
|
|
$
|
1,360
|
|
$
|
—
|
|
$
|
13,434
|
|
13.2
|
%
|
||||||
|
Connecticut
|
13
|
|
12,854
|
|
298
|
|
—
|
|
13,152
|
|
12.9
|
|
||||||||||
|
Kentucky
|
15
|
|
10,075
|
|
509
|
|
—
|
|
10,584
|
|
10.4
|
|
||||||||||
|
Delaware
|
4
|
|
10,578
|
|
—
|
|
—
|
|
10,578
|
|
10.4
|
|
||||||||||
|
Texas
|
8
|
|
3,320
|
|
8
|
|
6,593
|
|
9,921
|
|
9.8
|
|
||||||||||
|
Florida
|
5
|
|
7,947
|
|
—
|
|
—
|
|
7,947
|
|
7.8
|
|
||||||||||
|
Ohio
|
8
|
|
5,304
|
|
—
|
|
—
|
|
5,304
|
|
5.2
|
|
||||||||||
|
Montana
|
4
|
|
5,283
|
|
—
|
|
—
|
|
5,283
|
|
5.2
|
|
||||||||||
|
Colorado
|
3
|
|
3,353
|
|
412
|
|
—
|
|
3,765
|
|
3.7
|
|
||||||||||
|
Idaho
|
3
|
|
2,922
|
|
—
|
|
—
|
|
2,922
|
|
2.9
|
|
||||||||||
|
Other (17 states)
|
40
|
|
15,323
|
|
3,529
|
|
—
|
|
18,852
|
|
18.5
|
|
||||||||||
|
Total
|
119
|
|
$
|
89,033
|
|
$
|
6,116
|
|
$
|
6,593
|
|
$
|
101,742
|
|
100.0
|
%
|
||||||
|
% of Total properties
|
87.5
|
%
|
6.0
|
%
|
6.5
|
%
|
100.0
|
%
|
||||||||||||||
|
|
|
|
|
|
|
|||||||||||||||||
Significant Tenant Overview
As of
December 31, 2012
, 85 of our
119
properties held for investment and our one asset held for sale were operated by subsidiaries of Genesis, the parent company of Sun. These properties are leased to subsidiaries of Genesis pursuant to triple-net leases that are guaranteed by Genesis. Genesis is a privately held healthcare services company, serving principally the senior population through its various subsidiaries. As of
December 31, 2012
, Genesis and its subsidiaries, operated or managed
382
skilled nursing centers,
36
assisted or independent living centers and
8
mental health centers across
30
states. Genesis also provides rehabilitation therapy services to over
1,500
affiliated and non-affiliated centers in
44
states.
Our lease agreements with subsidiaries of Genesis provide for an initial term of between 10 and 15 years with no purchase options. At the sole option of Genesis, these lease agreements may be extended for up to two five-year renewal terms beyond the initial term and, if elected, the renewal will be effective for all of the leased property then subject to the applicable lease agreement. Amounts due under these lease agreements are fixed (except for an annual rent escalator described below), and there is no contingent rental income based upon the revenues, net income or other measures which may be derived by subsidiaries of Genesis from our properties. Under our original lease agreements with subsidiaries of Sun, the annual rent escalator was equal to the product of (a) the lesser of the percentage change in the Consumer Price Index (but not less than zero) or 2.5%, and (b) the prior year's rent. Effective December 1, 2012 with the acquisition of Sun by Genesis, these lease
6
agreements were amended to fix the annual rent escalators at 2.5%. During the year ended
December 31, 2012
, we recognized $72.8 million of rent under these lease agreements.
Because we currently lease the majority of our properties to Genesis and Genesis is a significant source of our rental revenues, Genesis's financial condition and ability and willingness to satisfy its obligations under its lease agreements with us and its willingness to renew those leases upon expiration of the initial base terms thereof will significantly impact our revenues and our ability to service our indebtedness and to make distributions to our stockholders. There can be no assurance that Genesis will have sufficient assets, income and access to financing to enable it to satisfy its obligations under its lease agreements with us, and any inability or unwillingness on its part to do so would have a material adverse effect on our business, financial condition, results of operations and liquidity, on our ability to service our indebtedness and other obligations and on our ability to make distributions to our stockholders, as required for us to qualify, and maintain our status, as a REIT. We also cannot assure you that Genesis will elect to renew its lease agreements with us upon expiration of the initial base terms or any renewal terms thereof or, if such leases are not renewed, that we can reposition the affected properties on the same or better terms. See “Risk Factors—Risks Relating to Our Business—We are dependent on Genesis until we substantially diversify our portfolio, and an event that has a material adverse effect on Genesis's business, financial position or results of operations would have a material adverse effect on our business, financial position or results of operations.”
Investment and Financing Strategy
We intend to invest in additional healthcare properties as suitable opportunities arise and adequate sources of financing are available. In making investments in healthcare properties, our investment objectives are to increase cash flow, provide quarterly cash distributions, maximize the value of our properties and acquire properties with cash flow growth potential. To date, we have generally structured our acquisitions with triple-net leases; however, we have used and will continue to use other forms of investment, including investments in senior housing through RIDEA-compliant structures, mezzanine and secured debt investments, and joint ventures for senior housing, memory care and skilled nursing assets.
We expect that future investments in properties, including any improvements or renovations of current or newly-acquired properties, will depend on and will be financed, in whole or in part, by our existing cash, borrowings available to us pursuant to our Amended Secured Revolving Credit Facility (as defined below), future borrowings or the proceeds from issuances of common stock, preferred stock, debt or other securities. In addition, we expect to seek financing from U.S. government agencies, including through Fannie Mae and the U.S. Department of Housing and Urban Development (“HUD”), in appropriate circumstances in connection with acquisitions and refinancings of existing mortgage loans.
Competitive Strengths
We believe the following competitive strengths will contribute significantly to our success:
Geographically Diverse and Stable Property Portfolio
Our portfolio of
119
properties held for investment as of
December 31, 2012
, comprising
12,382
licensed beds, is broadly diversified by location across
27
states. The properties in any one state did not account for more than
15%
of our total licensed beds as of
December 31, 2012
, and the properties in any one state did not account for more than
14%
,
16%
and 19%, respectively, of our total rental revenue during the
years
ended
December 31, 2012
and 2011 and the period from the
Separation Date through December 31, 2010
. Our geographic diversification will limit the effect of a decline in any one regional market on our overall performance. The annual weighted average occupancy percentages of our properties remained stable at between
88.3%
and
91.2%
over the last five years.
Long-Term, Triple-Net Lease Structure
All of our real estate properties are leased under triple-net operating leases with expirations ranging from
eight to 22
years, pursuant to which the tenants are responsible for all facility maintenance, insurance required in connection with the leased properties and the business conducted on the leased properties, taxes levied on or with respect to the leased properties and all utilities and other services necessary or appropriate for the leased properties and the business conducted on the leased properties. As of
December 31, 2012
, the leases had a weighted-average remaining term of
11
years. We retain substantially all of the risks and benefits of ownership of the real estate assets leased to tenants. As of
December 31, 2012
, the lease agreements with subsidiaries of Genesis are guaranteed by Genesis, and as a result, we did not require a security deposit from any of Genesis’s subsidiaries. For our properties that are leased to tenants other than Genesis’s subsidiaries, we have in certain instances obtained security deposits.
7
Strong Relationships with Operators
The members of our management team have developed an extensive network of relationships with qualified local, regional and national operators of skilled nursing and senior housing facilities across the United States. This extensive network has been built by our management team through over 20 years of operating experience, involvement in industry trade organizations and the development of banking relationships and investor relations within the skilled nursing and senior housing industries. We work collaboratively with our operators to help them achieve their growth and business objectives. We believe these strong relationships with operators help us to source investment opportunities.
Ability to Identify Talented Operators
As a result of our management team’s operating experience, network of relationships and industry insight, we have been able and expect to continue to be able to identify qualified local, regional and national operators. We seek operators who possess local market knowledge, demonstrate hands-on management, have proven track records and emphasize patient care. We believe our management team’s experience gives us a key competitive advantage in objectively evaluating an operator’s financial position, emphasis on care and operating efficiency.
Significant Experience in Proactive Asset Management
The members of our management team have significant experience developing systems to collect and evaluate data relating to the underlying operational and financial success of healthcare companies and healthcare-related real estate assets. We are able to utilize this experience and expertise to provide our operators, when requested, with significant assistance in the areas of marketing, development, facility expansion and strategic planning. We actively monitor the operating results of our tenants and, when requested, will work closely with our operators to identify and capitalize on opportunities to improve the operations of our facilities and the overall financial and operating strength of our operators.
Experienced Management Team
Our management team has extensive healthcare and real estate experience. Richard K. Matros, Chairman, President and Chief Executive Officer of Sabra, has more than 20 years of experience in the acquisition, development and disposition of skilled nursing facilities and other healthcare facilities, including nine years at Old Sun. Harold W. Andrews, Jr., Executive Vice President, Chief Financial Officer and Secretary of Sabra, is a finance professional with more than 10 years of experience in both the provision of healthcare services and healthcare real estate. Talya Nevo-Hacohen, Executive Vice President, Chief Investment Officer and Treasurer of Sabra, is a real estate finance executive with more than 20 years of experience in real estate finance, acquisition and development, including three years of experience managing and implementing the capital markets strategy of an S&P 500 healthcare REIT. Through years of public company experience, our management team also has extensive experience accessing both debt and equity capital markets to fund growth and maintain a flexible capital structure.
Flexible UPREIT Structure
We operate through an umbrella partnership, commonly referred to as an UPREIT structure, in which substantially all of our properties and assets are held by the Operating Partnership or by subsidiaries of the Operating Partnership. Conducting business through the Operating Partnership allows us flexibility in the manner in which we acquire properties. In particular, an UPREIT structure enables us to acquire additional properties from sellers in exchange for limited partnership units, which may provide property owners the opportunity to defer the tax consequences that would otherwise arise from a sale of their real properties and other assets to us. As a result, this structure allows us to acquire assets more efficiently and may allow us to acquire assets that the owner would otherwise be unwilling to sell because of tax considerations.
Business Strategies
We pursue business strategies focused on opportunistic acquisitions and property diversification where such acquisitions meet our investing and financing strategy. We also intend to further develop our relationships with tenants and healthcare providers with a goal to progressively expand the mixture of tenants managing and operating our properties.
The key components of our business strategies include:
Diversify Asset Portfolio
We expect to continue to grow our portfolio primarily through the acquisition of senior housing and memory care facilities with a secondary focus on acquiring skilled nursing facilities. We have and will continue to opportunistically originate financing secured directly or indirectly by healthcare facilities. We also expect to consider acquiring independent living and continuing care retirement community facilities and hospitals. As we acquire additional properties and expand our portfolio, we expect to further diversify by tenant, asset class and geography within the healthcare sector.
8
We seek to maintain a capital structure that provides the resources and flexibility to support the growth of our business. As of
December 31, 2012
, we had approximately
$126.2 million
in liquidity, consisting of unrestricted cash and cash equivalents of
$17.1
million and available borrowings under our Amended Secured Revolving Credit Facility of
$109.1
million. We intend to maintain a mix of credit facility debt, mortgage debt and unsecured term debt which, together with our anticipated ability to complete future equity financings, we expect will fund the growth of our operations. Further, we expect to opportunistically seek access to U.S. government agency financing, including through Fannie Mae and HUD, in appropriate circumstances in connection with acquisitions and refinancings of existing mortgage loans.
Develop New Tenant Relationships
We seek to cultivate our relationships with tenants and healthcare providers in order to expand the mix of tenants operating our properties and, in doing so, to reduce our dependence on any single tenant or operator. We expect to continue to develop new tenant relationships as part of our overall strategy to acquire new properties and further diversify our overall portfolio of healthcare properties.
Capital Source to Underserved Operators
We believe that there is a significant opportunity to be a capital source to healthcare operators through the acquisition and leasing of healthcare properties that are consistent with our investment and financing strategy, but that, due to size and other considerations, are not a focus for larger healthcare REITs. We utilize our management team’s operating experience, network of relationships and industry insight to identify financially strong and growing operators in need of capital funding for future growth. In appropriate circumstances, we may negotiate with operators to acquire individual healthcare properties from those operators and then lease those properties back to the operators pursuant to long-term triple-net leases.
Strategic Capital Improvements
We intend to continue to support operators by providing capital to them for a variety of purposes, including for capital expenditures and facility modernization. We expect to structure these investments as either lease amendments that produce additional rents or as loans that are repaid by operators during the applicable lease term.
Pursue Strategic Development Opportunities
We intend to work with our operators to identify strategic development opportunities. These opportunities may involve replacing or renovating facilities in our portfolio that may have become less competitive. We also intend to identify new development opportunities that present attractive risk-adjusted returns and, in addition to pursuing acquisitions with triple-net leases, pursue other forms of investment, including investments in senior housing through RIDEA-compliant structures, mezzanine and secured debt investments, and joint ventures for senior housing, memory care and skilled nursing assets.
Our Employees
As of
December 31, 2012
, we employed eight full-time employees (including our executive officers), none of whom is subject to a collective bargaining agreement.
Competition
We compete for real property investments with other REITs, investment companies, private equity and hedge fund investors, sovereign funds, healthcare operators, lenders and other investors. Some of our competitors are significantly larger and have greater financial resources and lower costs of capital than we do. Increased competition will make it more challenging to identify and successfully capitalize on acquisition opportunities that meet our investment objectives. Our ability to compete is also impacted by national and local economic trends, availability of investment alternatives, availability and cost of capital, construction and renovation costs, existing laws and regulations, new legislation and population trends. See “Risk Factors—Risks Relating to Our Business—Real estate is a competitive business and this competition may make it difficult for us to identify and purchase suitable healthcare properties.”
In addition, revenues from our properties are dependent on the ability of our tenants and operators to compete with other healthcare operators. These operators compete on a local and regional basis for residents and patients, and the operators’ ability to successfully attract and retain residents and patients depends on key factors such as the number of facilities in the local market, the types of services available, the quality of care, reputation, age and appearance of each facility and the cost of care in each locality. Private, federal and state payment programs and the effect of other laws and regulations may also have a significant impact on the ability of our tenants and operators to compete successfully for residents and patients at the properties.
9
Government Regulation
The tenants of our properties who operate the skilled nursing, assisted living, independent living and mental health facilities are subject to extensive and complex federal, state and local healthcare laws and regulations, including anti-kickback, anti-fraud and abuse provisions codified under the Social Security Act. These provisions prohibit certain business practices and relationships that might affect the provision and cost of healthcare services reimbursable under Medicare and Medicaid. Sanctions for violating these anti-kickback, anti-fraud and abuse provisions include criminal penalties, civil sanctions, fines and possible exclusion from government programs such as Medicare and Medicaid. If a center is decertified as a Medicare or Medicaid provider by CMS or a state, the center will not thereafter be reimbursed for caring for residents that are covered by Medicare and Medicaid, and the center would be forced to care for such residents without being reimbursed or to transfer such residents.
Our tenants’ skilled nursing centers and mental health centers are licensed under applicable state law, and are certified or approved as providers under the Medicare and Medicaid programs. State and local agencies survey all skilled nursing centers on a regular basis to determine whether such centers are in compliance with governmental operating and health standards and conditions for participation in government sponsored third party payor programs. Under certain circumstances, the federal and state agencies have the authority to take adverse actions against a center or service provider, including the imposition of a monitor, the imposition of monetary penalties and the decertification of a center or provider from participation in the Medicare and/or Medicaid programs or licensure revocation. Challenging and appealing notices or allegations of noncompliance can require significant legal expenses and management attention.
Various states in which our tenants operate our centers have established minimum staffing requirements or may establish minimum staffing requirements in the future. Failure to comply with such minimum staffing requirements may result in the imposition of fines or other sanctions. Most states in which our tenants operate have statutes requiring that prior to the addition or construction of new nursing home beds, to the addition of new services or to certain capital expenditures in excess of defined levels, the tenant first must obtain a certificate of need, which certifies that the state has made a determination that a need exists for such new or additional beds, new services or capital expenditures. The certification process is intended to promote quality healthcare at the lowest possible cost and to avoid the unnecessary duplication of services, equipment and centers. This certification process can restrict or prohibit the undertaking of a project or lengthen the period of time required to enlarge or renovate a facility or replace a tenant.
In addition to the above, those of our tenants who provide services that are paid for by Medicare and Medicaid are subject to federal and state budgetary cuts and constraints that limit the reimbursement levels available from these government programs.
Our subsidiaries own six healthcare facilities with mortgage loans that are guaranteed by HUD. Those facilities are subject to the rules and regulations of HUD, including periodic inspections by HUD, although the tenants of those facilities have the primary responsibility for maintaining the facilities in compliance with HUD’s rules and regulations. The regulatory agreements entered into by each owner and each operator of the property restrict, among other things, any sale or other transfer of the property, modification of the lease between the owner and the operator, use of surplus cash from the property except upon certain conditions, renovations of the property and use of the property other than for a skilled nursing facility, all without prior HUD approval.
In addition, as an owner of real property, we are subject to various federal, state and local environmental and health and safety laws and regulations. These laws and regulations address various matters, including asbestos, fuel oil management, wastewater discharges, air emissions, medical wastes and hazardous wastes. The costs of complying with these laws and regulations and the penalties for non-compliance can be substantial. For example, although we do not operate or manage our properties, we may be held primarily or jointly and severally liable for costs relating to the investigation and clean up of any property from which there has been a release or threatened release of a regulated material as well as other affected properties, regardless of whether we knew of or caused the release. In addition to these costs, which are typically not limited by law or regulation and could exceed the property’s value, we could be liable for certain other costs, including governmental fines and injuries to persons, property or natural resources. See “Risk Factors—Risks Relating to Our Business—Environmental compliance costs and liabilities associated with real estate properties owned by us may materially impair the value of those investments.”
The Operating Partnership
We own substantially all of our assets and properties and conduct our operations through the Operating Partnership. We believe that conducting business through the Operating Partnership provides flexibility with respect to the manner in which we acquire properties. In particular, an UPREIT structure could enable us to acquire additional properties from sellers in tax deferred transactions. In these transactions, the seller would typically contribute its assets to the Operating Partnership in exchange for limited partnership interests. Holders of these limited partnership interests would be entitled to redeem their
10
partnership interests for shares of the stock of Sabra on a specified basis, or, at our option, an equivalent amount of cash. We manage and control the Operating Partnership and are its sole general partner.
The following describes the risks and uncertainties that could cause our actual results to differ materially from those presented in our forward-looking statements. The risks and uncertainties described below are not the only ones we face but do represent those risks and uncertainties that we believe are material to us. Additional risks and uncertainties not presently known to us or that we currently deem immaterial may also harm our business.
Risks Relating to Our Business
We are dependent on Genesis until we substantially diversify our portfolio, and an event that has a material adverse effect on Genesis’s business, financial position or results of operations would have a material adverse effect on our business, financial position or results of operations.
Subsidiaries of Genesis are currently the lessees of 85 of our
119
properties held for investment and our one asset held for sale (with Genesis guaranteeing the obligations under these lease agreements) and are, therefore, a significant source of our revenues. There can be no assurance that Genesis and its subsidiaries will have sufficient assets, income and access to financing to enable them to satisfy their payment obligations under their lease agreements. The inability of Genesis and its subsidiaries to meet their rent obligations would materially adversely affect our business, financial position or results of operations including our ability to pay dividends to our stockholders as required to maintain our status as a REIT. The inability of Genesis and its subsidiaries to satisfy their other obligations under their lease agreements such as the payment of taxes, insurance and utilities could have a material adverse effect on the condition of the leased properties as well as on our business, financial position and results of operations. For these reasons, if Genesis were to experience a material adverse effect on its business, financial position or results of operations, our business, financial position or results of operations would also be materially adversely affected.
Due to our dependence on rental payments from Genesis and its subsidiaries as a significant source of revenues, we may be limited in our ability to enforce our rights under these lease agreements or to terminate a lease thereunder. Failure by Genesis and its subsidiaries to comply with the terms of their lease agreements or to comply with the healthcare regulations to which the leased properties and Genesis’s operations are subject could require us to find other lessees for any affected leased properties and there could be a decrease or cessation of rental payments by Genesis and its subsidiaries. In such event, we may be unable to locate suitable replacement lessees willing to pay similar rental rates or at all, which would have the effect of reducing our rental revenues.
We are dependent on the operating success of our tenants.
Our tenants’ revenues are primarily driven by occupancy, Medicare and Medicaid reimbursement and private pay rates. Revenues from government reimbursement have been, and may continue to be, subject to rate cuts and further pressure from federal and state budgetary cuts and constraints. Overall weak economic conditions in the United States may adversely affect occupancy rates of healthcare facilities that rely on private pay residents. Our tenants’ expenses are driven by the costs of labor, food, utilities, taxes, insurance and rent or debt service. To the extent any decrease in revenues and/or any increase in operating expenses results in our tenants’ not generating enough cash to make scheduled lease payments to us, our business, financial position or results of operations could be materially adversely affected.
We have substantial indebtedness and the ability to incur significant additional indebtedness.
As of
December 31, 2012
, our indebtedness consisted of
$325.0 million
of 8.125% senior notes due 2018 (the “Senior Notes”),
$92.5 million
outstanding under our Amended Secured Revolving Credit Facility and aggregate mortgage indebtedness to third parties of
$152.3 million
on certain of our properties. In addition, we had
$109.1 million
available for borrowing under our Amended Secured Revolving Credit Facility as of
December 31, 2012
. Our high level of indebtedness may have the following important consequences to us:
|
•
|
It may become more difficult for us to satisfy our obligations (including ongoing interest payments and, where applicable, scheduled amortization payments) with respect to the Senior Notes and our other debt;
|
|
•
|
It may limit our ability to obtain additional financing to fund future acquisitions, working capital, capital expenditures or other general corporate requirements;
|
|
•
|
It may increase our cost of borrowing;
|
11
|
•
|
It may limit our ability to adjust rapidly to changing market conditions and we may be vulnerable in the event of a downturn in general economic conditions or in the real estate and/or healthcare sectors;
|
|
•
|
It may place us at a competitive disadvantage against less leveraged competitors; and
|
|
•
|
It may require us to sell assets and properties at an inopportune time.
|
In addition, the Indenture (as defined below) governing the Senior Notes permits us to incur substantial additional debt, including secured debt (to which the Senior Notes will be effectively subordinated). If we incur additional debt, the related risks described above could intensify.
We may be unable to service our indebtedness.
Our ability to make scheduled payments on and to refinance our indebtedness depends on and is subject to our financial and operating performance, which in turn is affected by general and regional economic, financial, competitive, business and other factors beyond our control, including the availability of financing in the international banking and capital markets. Our business may fail to generate sufficient cash flow from operations or future borrowings may be unavailable to us under our Amended Secured Revolving Credit Facility or from other sources in an amount sufficient to enable us to service our debt, to refinance our debt or to fund our other liquidity needs. If we are unable to meet our debt obligations or to fund our other liquidity needs, we will need to restructure or refinance all or a portion of our debt. We may be unable to refinance any of our debt, including our Amended Secured Revolving Credit Facility, on commercially reasonable terms or at all. In particular, our Amended Secured Revolving Credit Facility will mature prior to the maturity of the Senior Notes. If we were unable to make payments or refinance our debt or obtain new financing under these circumstances, we would have to consider other options, such as asset sales, equity issuances and/or negotiations with our lenders to restructure the applicable debt. Our Amended Secured Revolving Credit Facility and the Indenture governing the Senior Notes restrict, and market or business conditions may limit, our ability to take some or all of these actions. Any restructuring or refinancing of our indebtedness could be at higher interest rates and may require us to comply with more onerous covenants that could further restrict our business operations.
Covenants in our debt agreements restrict our activities and could adversely affect our business.
Our debt agreements, including the Indenture governing the Senior Notes and our Amended Secured Revolving Credit Facility, contain various covenants that limit our ability and the ability of our restricted subsidiaries to engage in various transactions including:
|
•
|
Incurring additional secured and unsecured debt;
|
|
•
|
Paying dividends or making other distributions on, redeeming or repurchasing capital stock;
|
|
•
|
Making investments or other restricted payments;
|
|
•
|
Entering into transactions with affiliates;
|
|
•
|
Issuing stock of or interests in restricted subsidiaries;
|
|
•
|
Engaging in non-healthcare related business activities;
|
|
•
|
Creating restrictions on the ability of our restricted subsidiaries to pay dividends or other amounts to us;
|
|
•
|
Selling assets; or
|
|
•
|
Effecting a consolidation or merger or selling all or substantially all of our assets.
|
These covenants limit our operational flexibility and could prevent us from taking advantage of business opportunities as they arise, growing our business or competing effectively. In addition, our Amended Secured Revolving Credit Facility requires us to maintain specified financial covenants, which include a maximum leverage ratio, a minimum fixed charge coverage ratio and a minimum tangible net worth ratio, as well as satisfy other financial condition tests. The Indenture governing the Senior Notes requires us to maintain total unencumbered assets of at least 150% of our unsecured indebtedness. Our ability to meet these requirements may be affected by events beyond our control, and we may not meet these requirements.
Our Amended Secured Revolving Credit Facility also allows for the lenders thereunder to conduct periodic appraisals of our owned properties that secure such facility, and if the appraised values were to decline in the future, the amount that can be borrowed under such facility would be decreased unless we pledge additional assets as collateral.
A breach of any of the covenants or other provisions in our debt agreements could result in an event of default, which if not cured or waived, could result in such debt becoming immediately due and payable. This, in turn, could cause our other debt to become due and payable as a result of cross-acceleration provisions contained in the agreements governing such other debt. We may be unable to maintain compliance with these covenants and, if we fail to do so, we may be unable to obtain waivers
12
from the lenders and/or amend the covenants. In the event that some or all of our debt is accelerated and becomes immediately due and payable, we may not have the funds to repay, or the ability to refinance, such debt.
An increase in market interest rates could increase our interest costs on existing and future debt and could adversely affect our stock price.
If interest rates increase, so could our interest costs for portions of our existing debt and any new debt. This increased cost could make the financing of any acquisition more costly. Rising interest rates could limit our ability to refinance existing debt when it matures or cause us to pay higher interest rates upon refinancing. In addition, an increase in interest rates could decrease the access third parties have to credit, thereby decreasing the amount they are willing to pay for our assets, and consequently limit our ability to reposition our portfolio promptly in response to changes in economic or other conditions.
Our ability to raise capital through equity financings is dependent, in part, on the market price of our common stock, which depends on market conditions and other factors affecting REITs generally.
Our ability to raise capital through equity financings depends, in part, on the market price of our common stock, which in turn depends on fluctuating market conditions and other factors including the following:
|
•
|
the reputation of REITs and attractiveness of their equity securities in comparison with other equity securities, including securities issued by other real estate companies;
|
|
•
|
our financial performance and that of our tenants;
|
|
•
|
concentrations in our investment portfolio by tenant and facility type;
|
|
•
|
concerns about our tenants’ financial condition due to uncertainty regarding reimbursement from governmental and other third-party payor programs;
|
|
•
|
our ability to meet or exceed investor expectations of prospective investment and earnings targets;
|
|
•
|
the contents of analyst reports about us and the REIT industry;
|
|
•
|
changes in interest rates on fixed-income securities, which may lead prospective investors to demand a higher annual yield from investments in our common stock;
|
|
•
|
maintaining or increasing our dividend, which is determined by our board of directors and depends on our financial position, results of operations, cash flows, capital requirements, debt covenants (which include limits on distributions by us), applicable law, and other factors as our board of directors deems relevant; and
|
|
•
|
regulatory action and changes in REIT tax laws.
|
The market value of a REIT’s equity securities is generally based upon the market’s perception of the REIT’s growth potential and its current and potential future earnings and cash distributions. If we fail to meet the market’s expectation with regard to future earnings and cash distributions, the market price of our common stock could decline and our ability to raise capital through equity financings could be materially adversely affected.
Required regulatory approvals can delay or prohibit transfers of our healthcare properties, which could result in periods in which we are unable to receive rent for such properties.
Our tenants are operators of skilled nursing and other healthcare facilities, which operators must be licensed under applicable state law and, depending upon the type of facility, certified or approved as providers under the Medicare and/or Medicaid programs. Prior to the transfer of the operations of such healthcare properties to successor operators, the new operator generally must become licensed under state law and, in certain states, receive change of ownership approvals under certificate of need laws (which laws provide for a certification that the state has made a determination that a need exists for the beds located on the applicable property). If applicable, Medicare and Medicaid provider approvals may be needed as well. In the event that an existing lease is terminated or expires and a new tenant is found, then any delays in the new tenant receiving regulatory approvals from the applicable federal, state or local government agencies, or the inability of such tenant to receive such approvals, may prolong the period during which we are unable to collect the applicable rent. We could also incur substantial additional expenses in connection with any licensing, receivership or change-of-ownership proceedings.
Our tenants may be adversely affected by increasing healthcare regulation and enforcement.
Over the last several years, the regulatory environment of the long-term healthcare industry has intensified both in the amount and type of regulations and in the efforts to enforce those regulations. This is particularly true for large for-profit, multi-facility providers. The extensive federal, state and local laws and regulations affecting the healthcare industry include those relating to, among other things, licensure, conduct of operations, ownership of facilities, addition of facilities and equipment, allowable costs, services, prices for services, qualified beneficiaries, quality of care, patient rights, fraudulent or abusive behavior, and financial and other arrangements that may be entered into by healthcare providers. Changes in enforcement policies by federal and state governments have resulted in a significant increase in the number of inspections, citations of
13
regulatory deficiencies and other regulatory sanctions, including terminations from the Medicare and Medicaid programs, bars on Medicare and Medicaid payments for new admissions, civil monetary penalties and even criminal penalties.
If our tenants fail to comply with the extensive laws, regulations and other requirements applicable to their businesses and the operation of our properties, they could become ineligible to receive reimbursement from governmental and private third-party payor programs, face bans on admissions of new patients or residents, suffer civil or criminal penalties or be required to make significant changes to their operations. Our tenants also could be forced to expend considerable resources responding to an investigation or other enforcement action under applicable laws or regulations. In such event, the results of operations and financial condition of our tenants and the results of operations of our properties operated by those entities could be adversely affected, which, in turn, could have a material adverse effect on us. We are unable to predict future federal, state and local regulations and legislation, including the Medicare and Medicaid statutes and regulations, or the intensity of enforcement efforts with respect to such regulations and legislation, and any changes in the regulatory framework could have a material adverse effect on our tenants, which, in turn, could have a material adverse effect on us.
Our tenants depend on reimbursement from governmental and other third-party payor programs, and reimbursement rates from such payors may be reduced.
Our tenants depend on third-party payors, including Medicare, Medicaid or private third-party payors, for the majority of their revenue. The reduction in reimbursement rates from third-party payors, including Medicare and Medicaid programs, or other measures reducing reimbursements for services provided by our tenants, has resulted, and may continue to result, in a reduction in our tenants’ revenues and operating margins. In addition, reimbursement from private third-party payors may be reduced as a result of retroactive adjustment during claims settlement processes or as a result of post-payment audits. Furthermore, new legislative and regulatory proposals could impose additional limitations on government and private payments to healthcare providers. We cannot assure you that adequate reimbursement levels will continue to be available for the services provided by our tenants. Although moderate reimbursement rate reductions may not affect our tenants’ ability to meet their financial obligations to us, significant limits on reimbursement rates or on the services reimbursed could have a material adverse effect on their business, financial position or results of operations, which could materially adversely affect their ability to meet their financial obligations to us.
In March 2010, President Obama signed into law the Patient Protection and Affordable Care Act, along with the Health Care and Education Reconciliation Act of 2010 (collectively, the “Affordable Care Act”). The passage of the Affordable Care Act has resulted in comprehensive reform legislation that is expected to expand health care coverage to millions of currently uninsured people beginning in 2014 and provide for significant changes to the U.S. healthcare system over the next ten years. To help fund this expansion, the Affordable Care Act outlines certain reductions in Medicare reimbursement rates for various healthcare providers, including long-term acute care hospitals and skilled nursing facilities, as well as certain other changes to Medicare payment methodologies. This comprehensive health care legislation provides for extensive future rulemaking by regulatory authorities, and also may be altered or amended. We cannot accurately predict whether any pending legislative proposals will be adopted or, if adopted, what effect, if any, these proposals would have on our tenants and, thus, our business. Similarly, while we can anticipate that some of the rulemaking that will be promulgated by regulatory authorities will affect our tenants and the manner in which they are reimbursed by the federal health care programs, we cannot accurately predict today the impact of those regulations on our tenants and thus on our business.
Other legislative changes have been proposed since the passage of the Affordable Care Act that could also affect Medicare reimbursement rates. For example, the Budget Control Act of 2011
created a Joint Select Committee on Deficit Reduction, which was tasked with recommending proposals to reduce spending. Since that Joint Committee was unable to achieve a targeted deficit reduction of at least $1.2 trillion by March 1, 2013 for the years 2013 through 2021, an automatic reduction in federal spending, or “sequestration,” was triggered. As a result of the sequestration, a 2% reduction in Medicare payments to long-term acute care hospitals and skilled nursing facilities is expected to take effect on April 1, 2013. President Obama and members of Congress have proposed various spending cuts and tax reform initiatives as alternatives to sequestration. The sequestration will, and any proposed alternatives to sequestration or future federal legislation could, result in changes (including substantial reductions in funding) to Medicare, Medicaid or Medicare Advantage Plans. The sequestration and any such alternative or future federal legislation relating to deficit reduction that reduces reimbursement payments to healthcare providers could have a material adverse effect on our tenants' liquidity, financial condition or results of operations, which could adversely affect their ability to satisfy their obligations to us and could have a material adverse effect on our business, financial position or results of operations.
14
We may not be able to sell properties when we desire because real estate investments are relatively illiquid, which could have a material adverse effect on our business, financial position or results of operations.
Real estate investments generally cannot be sold quickly. In addition, some and potentially substantially all of our properties serve as collateral for our current and future secured debt obligations and cannot readily be sold unless the underlying mortgage indebtedness is concurrently repaid. We may not be able to vary our portfolio promptly in response to changes in the real estate market. A downturn in the real estate market could materially adversely affect the value of our properties and our ability to sell such properties for acceptable prices or on other acceptable terms. We also cannot predict the length of time needed to find a willing purchaser and to close the sale of a property or portfolio of properties. Further, because Sabra owns appreciated assets that were held before Sabra elected to be treated as a REIT, if Sabra sells any such property in a taxable transaction within the ten-year period following Sabra’s qualification as a REIT, Sabra will generally be subject to corporate tax on that gain to the extent of the built-in gain in that property at the time Sabra became a REIT. The amount of corporate tax that Sabra would pay will vary depending on the actual amount of net built-in gain or loss present in those assets as of the time Sabra became a REIT. As of January 1, 2011, the effective time of our REIT election, the built-in-gains tax associated with our properties totaled approximately $145.8 million assuming a 40% corporate tax rate. These factors and any others that would impede our ability to respond to adverse changes in the performance of our properties could have a material adverse effect on our business, financial position or results of operations.
Real estate is a competitive business and this competition may make it difficult for us to identify and purchase suitable healthcare properties.
We operate in a highly competitive industry and face competition from other REITs, investment companies, private equity and hedge fund investors, sovereign funds, healthcare operators, lenders and other investors, some of whom are significantly larger than us and have greater resources and lower costs of capital than we do. This competition makes it more challenging to identify and successfully capitalize on acquisition opportunities that meet our investment objectives. If we cannot identify and purchase a sufficient quantity of healthcare properties at favorable prices or if we are unable to finance acquisitions on commercially favorable terms, our business, financial position or results of operations could be materially adversely affected.
If we lose our key management personnel, we may not be able to successfully manage our business and achieve our objectives.
Our success depends in large part upon the leadership and performance of our executive management team, particularly Mr. Matros, our President and Chief Executive Officer. If we lose the services of Mr. Matros, we may not be able to successfully manage our business or achieve our business objectives.
We have a limited number of employees and, accordingly, the loss of any one of our employees could harm our operations.
As of
December 31, 2012
, we employed eight full-time employees, including our executive officers. Accordingly, the impact we may feel from the loss of one of our full-time employees may be greater than the impact such a loss would have on a larger organization. While it is anticipated that we could find replacements for our personnel, the loss of their services could harm our operations, at least in the short term.
Potential litigation and rising insurance costs may affect our tenants’ ability to obtain and maintain adequate liability and other insurance and their ability to make lease payments and fulfill their insurance and indemnification obligations to us.
Our tenants may be subject to lawsuits filed by advocacy groups that monitor the quality of care at healthcare facilities or by patients, facility residents or their families. Significant damage awards are possible in cases where neglect has been found. This litigation has increased our tenants’ costs of monitoring and reporting quality of care and has resulted in increases in the cost of liability and medical malpractice insurance. These increased costs may materially adversely affect our tenants’ ability to obtain and maintain adequate liability and other insurance; manage related risk exposures; fulfill their insurance, indemnification and other obligations to us under their leases; or make lease payments to us. In addition, from time to time, we may be subject to claims brought against us in lawsuits and other legal proceedings arising out of our alleged actions or the alleged actions of our tenants for which such tenants may have agreed to indemnify, defend and hold us harmless. An unfavorable resolution of any such pending or future litigation could materially adversely affect our liquidity, financial condition and results of operations and have a material adverse effect on us in the event that we are not ultimately indemnified by our tenants.
15
We face potential adverse consequences of bankruptcy or insolvency by our tenants, operators, borrowers, managers and other obligors.
We are exposed to the risk that our tenants could become bankrupt or insolvent. Although our lease agreements provide us with the right to exercise certain remedies in the event of default on the obligations owing to us or upon the occurrence of certain insolvency events, the bankruptcy and insolvency laws afford certain rights to a party that has filed for bankruptcy or reorganization. For example, a lessee may reject its lease with us in a bankruptcy proceeding. In such a case, our claim against the lessee for unpaid and future rents would be limited by the statutory cap of the U.S. Bankruptcy Code. This statutory cap could be substantially less than the remaining rent actually owed under the lease, and any claim we have for unpaid rent might not be paid in full. In addition, a lessee may assert in a bankruptcy proceeding that its lease should be re-characterized as a financing agreement. If such a claim is successful, our rights and remedies as a lender, compared to a landlord, are generally more limited.
We may experience uninsured or underinsured losses, which could result in a significant loss of the capital we have invested in a property, decrease anticipated future revenues or cause us to incur unanticipated expenses.
While our lease agreements require that comprehensive insurance and hazard insurance be maintained by the tenants, there are certain types of losses, generally of a catastrophic nature, such as earthquakes, hurricanes and floods, that may be uninsurable or not economically insurable. Insurance coverage may not be sufficient to pay the full current market value or current replacement cost of a loss. Inflation, changes in building codes and ordinances, environmental considerations, and other factors also might make it infeasible to use insurance proceeds to replace properties after they have been damaged or destroyed. Under such circumstances, the insurance proceeds received might not be adequate to restore the economic position with respect to a damaged property.
Environmental compliance costs and liabilities associated with real estate properties owned by us may materially impair the value of those investments.
As an owner of real property, we or our subsidiaries are subject to various federal, state and local environmental and health and safety laws and regulations. Although we do not currently operate or manage our properties, we or our subsidiaries may be held primarily or jointly and severally liable for costs relating to the investigation and clean-up of any property where there has been a release or threatened release of a hazardous regulated material as well as other affected properties, regardless of whether we knew of or caused the release. In addition to these costs, which are typically not limited by law or regulation and could exceed an affected property’s value, we could be liable for certain other costs, including governmental fines and injuries to persons, property or natural resources. Further, some environmental laws provide for the creation of a lien on a contaminated site in favor of the government as security for damages and any costs the government incurs in connection with such contamination and associated clean-up.
Although we require our operators and tenants to undertake to indemnify us for environmental liabilities they cause, the amount of such liabilities could exceed the financial ability of the tenant or operator to indemnify us. The presence of contamination or the failure to remediate contamination may adversely affect our ability to sell or lease the real estate or to borrow using the real estate as collateral.
Failure to maintain effective internal control over financial reporting could have a material adverse effect on our ability to report our financial results on a timely and accurate basis.
We are required to maintain internal control over financial reporting pursuant to Rule 13a-15 under the Exchange Act. Failure to maintain such controls could result in misstatements in our financial statements and potentially subject us to sanctions or investigations by the SEC or other regulatory authorities or could cause us to delay the filing of required reports with the SEC and our reporting of financial results. Any of these events could result in a decline in the price of shares of our common stock.
An ownership limit and certain anti-takeover defenses could inhibit a change of control of Sabra or reduce the value of our stock.
Certain provisions of Maryland law and of our charter and bylaws may have an anti-takeover effect. The following provisions of Maryland law and these governing documents could have the effect of making it more difficult for a third party to acquire control of Sabra, including certain acquisitions that our stockholders may deem to be in their best interests:
|
•
|
Our charter contains transfer and ownership restrictions on the percentage by number and value of outstanding shares of our stock that may be owned or acquired by any stockholder;
|
16
|
•
|
Our charter permits the issuance of one or more classes or series of preferred stock with rights and preferences to be determined by the board of directors and permits our board of directors, without stockholder action, to amend the charter to increase or decrease the aggregate number of authorized shares or the number of shares of any class or series that we have authority to issue;
|
|
•
|
“Business combination” provisions of Maryland law, subject to certain limitations, impose a moratorium on business combinations with “interested stockholders” or affiliates thereof for five years and thereafter impose additional requirements on such business combinations;
|
|
•
|
Our bylaws require advance notice of stockholder proposals and director nominations; and
|
|
•
|
Our bylaws may be amended only by our board of directors.
|
We rely on information technology in our operations, and any material failure, inadequacy, interruption or security failure of that technology could harm our business.
We rely on information technology networks and systems, including the Internet, to process, transmit and store electronic information, and to manage or support a variety of business processes, including financial transactions and records, personal identifying information, tenant and lease data. We purchase some of our information technology from vendors, on whom our systems depend. We rely on commercially available systems, software, tools and monitoring to provide security for processing, transmission and storage of confidential tenant and other customer information, such as individually identifiable information, including information relating to financial accounts. Although we have taken steps to protect the security of our information systems and the data maintained in those systems, it is possible that our safety and security measures will not be able to prevent the systems' improper functioning or damage, or the improper access or disclosure of personally identifiable information such as in the event of cyber-attacks. Security breaches, including physical or electronic break-ins, computer viruses, attacks by hackers and similar breaches, can create system disruptions, shutdowns or unauthorized disclosure of confidential information. Any failure to maintain proper function, security and availability of our information systems could interrupt our operations, damage our reputation, subject us to liability claims or regulatory penalties and could have a material adverse effect on our business, financial condition and results of operations.
Risks Associated with Our Status as a REIT
The 90% distribution requirement will decrease our liquidity and may limit our ability to engage in otherwise beneficial transactions.
To comply with the 90% distribution requirement applicable to REITs and to avoid the nondeductible excise tax, we must make distributions to our stockholders. The Indenture governing the Senior Notes permits us to declare or pay any dividend or make any distribution that is necessary to maintain our REIT status if the aggregate principal amount of all outstanding Indebtedness of the Parent and its Restricted Subsidiaries on a consolidated basis at such time is less than 60% of Adjusted Total Assets (as each term is defined in the Indenture governing the Senior Notes) and to make additional distributions if we pass certain other financial tests.
We are required under the Internal Revenue Code of 1986, as amended (the “Code”), to distribute at least 90% of our taxable income, determined without regard to the dividends-paid deduction and excluding any net capital gain, and the Operating Partnership is required to make distributions to us to allow us to satisfy these REIT distribution requirements. However, distributions may limit our ability to rely upon rental payments from our properties or subsequently acquired properties to finance investments, acquisitions or new developments.
Although we anticipate that we generally will have sufficient cash or liquid assets to enable us to satisfy the REIT distribution requirement, it is possible that, from time to time, we may not have sufficient cash or other liquid assets to meet the 90% distribution requirement. This may be due to the timing differences between the actual receipt of income and actual payment of deductible expenses, on the one hand, and the inclusion of that income and deduction of those expenses in arriving at our taxable income, on the other hand. In addition, non-deductible expenses such as principal amortization or repayments or capital expenditures in excess of non-cash deductions also may cause us to fail to have sufficient cash or liquid assets to enable us to satisfy the 90% distribution requirement.
In the event that such an insufficiency or such timing differences occur, in order to meet the 90% distribution requirement and maintain our status as a REIT, we may have to sell assets at unfavorable prices, borrow at unfavorable terms, make taxable stock dividends, or pursue other strategies. This may require us to raise additional capital to meet our obligations. The terms of our Amended Secured Revolving Credit Facility and the terms of the Indenture governing the Senior Notes may restrict our ability to engage in some of these transactions.
17
We could fail to qualify as a REIT if income we receive is not treated as qualifying income, including as a result of one or more of the lease agreements we have entered into or assumed (as well as any other leases we enter into or assume) not being characterized as true leases for U.S. federal income tax purposes, which would subject us to U.S. federal income tax at corporate tax rates.
Under applicable provisions of the Code, we will not be treated as a REIT unless we satisfy various requirements, including requirements relating to the sources of our gross income. Rents received or accrued by us will not be treated as qualifying rent for purposes of these requirements if the lease agreements we have entered into or assumed (as well as any other leases we enter into or assume) are not respected as true leases for U.S. federal income tax purposes and are instead treated as service contracts, joint ventures, loans or some other type of arrangement. In the event that the lease agreements entered into with Sun are not characterized as true leases for U.S. federal income tax purposes, we likely would fail to qualify as a REIT. In addition, rents received by us from Sun will not be treated as qualifying rent for purposes of these requirements if we are treated, either directly or under the applicable attribution rules, as owning 10% or more of Sun common stock. We will be treated as owning, under the applicable attribution rules, 10% or more of Sun common stock at any time that a stockholder owns, directly or under the applicable attribution rules, (a) 10% or more of our common stock and (b) 10% or more of Sun common stock. The provisions of our charter restrict the transfer and ownership of our common stock that would cause the rents received or accrued by us from Sun (or any other tenant of ours) to be treated as non-qualifying rent for purposes of the REIT gross income requirements. Nevertheless, there can be no assurance that such restrictions will be effective in ensuring that we will not be treated as related to Sun (or any other tenant of ours). If we fail to qualify as a REIT, we would be subject to U.S. federal income tax (including any applicable minimum tax) on our taxable income at corporate tax rates, which would decrease the amount of cash available for distribution to holders of our common stock.
Complying with REIT requirements may cause us to forego otherwise attractive acquisition opportunities or liquidate otherwise attractive investments, which could materially hinder our performance.
To qualify as a REIT for U.S. federal income tax purposes, we must continually satisfy certain tests, including tests concerning the sources of our income, the nature and diversification of our assets, the amounts we distribute to our stockholders and the ownership of our stock. In order to meet these tests, we may be required to forego investments or acquisitions we might otherwise make. Thus, compliance with the REIT requirements may materially hinder our performance.
If we have significant amounts of non-cash taxable income, we may have to declare taxable stock dividends or make other non-cash distributions, which could cause our stockholders to incur tax liabilities in excess of cash received.
We currently intend to pay dividends in cash only, and not in-kind. However, if for any taxable year, we have significant amounts of taxable income in excess of available cash flow, we may have to declare dividends in-kind in order to satisfy the REIT annual distribution requirements. We may distribute a portion of our dividends in the form of our stock or our debt instruments. In either event, a holder of our common stock will be required to report dividend income as a result of such distributions even though we distributed no cash or only nominal amounts of cash to such stockholder.
The IRS has issued private letter rulings to other REITs treating certain distributions that are paid partly in cash and partly in shares as dividends that would satisfy the REIT annual distribution requirement and qualify for the dividends paid deduction for U.S. federal income tax purposes. Those rulings may be relied upon only by taxpayers to whom they were issued. In addition, the IRS previously issued a revenue procedure authorizing publicly traded REITs to make elective cash/shares dividends, but that revenue procedure does not apply to our 2013 and future taxable years. Accordingly, it is unclear whether and to what extent we will be able to make taxable dividends payable in cash and shares. We have no current intention to make a taxable dividend payable in cash and our shares. However, if we make such a distribution, U.S. holders would be required to include the full amount of the dividend (i.e., the cash and stock portion) as ordinary income to the extent of our current and accumulated earnings and profits for U.S. federal income tax purposes. As a result, a U.S. holder may be required to pay income taxes with respect to such dividends in excess of the cash received. If a U.S. holder sells our stock that it receives as a dividend in order to pay this tax, the sales proceeds may be less than the amount included in income with respect to the dividend, depending on the market price of the stock at the time of the sale. Furthermore, with respect to non-U.S. holders, we may be required to withhold U.S. tax with respect to such dividends, including in respect of all or a portion of such dividend that is payable in stock. In addition, if a significant number of our stockholders determine to sell shares of our stock in order to pay taxes owed on dividends, these sales may put downward pressure on the trading price of our stock. Moreover, various tax aspects of a taxable dividend payable in cash and/or stock are uncertain and have not yet been addressed by the IRS. No assurance can be given that the IRS will not impose additional requirements in the future with respect to taxable dividends payable in cash and/or stock, including on a retroactive basis, or assert that the requirements for such taxable dividends have not been met.
18
Our charter restricts the transfer and ownership of our stock, which may restrict change of control or business combination opportunities in which our stockholders might receive a premium for their shares.
In order for us to maintain our qualification as a REIT for each taxable year after 2011, no more than 50% of the value of our outstanding stock may be owned, directly or constructively, by five or fewer individuals, as defined in the Code. For the purpose of preserving our REIT qualification, our charter prohibits, subject to certain exceptions, direct, indirect and constructive ownership of more than 9.9% in value or in number of shares, whichever is more restrictive, of our outstanding common stock or more than 9.9% in value of our outstanding stock. The constructive ownership rules are complex and may cause shares of stock owned directly or constructively by a group of related individuals to be constructively owned by one individual or entity. The ownership limits may have the effect of discouraging an acquisition of control of us without the approval of our board of directors.
We could be subject to tax on any unrealized net built-in gains in the assets held before electing to be treated as a REIT.
We own appreciated assets that were held before we elected to be treated as a REIT. If such appreciated assets are disposed of in a gain recognition transaction within the 10-year period following our qualification as a REIT, we will generally be subject to corporate tax on that gain to the extent of the built-in gain in those assets at the time we became a REIT. The total amount of gain on which we can be taxed is limited to our net built-in gain at the time we became a REIT, i.e., the excess of the aggregate fair market value of our assets at the time we became a REIT over the adjusted tax bases of those assets at that time. We would be subject to this tax liability even if we qualify and maintain our status as a REIT. Any recognized built-in gain will retain its character as ordinary income or capital gain and will be taken into account in determining REIT taxable income and our distribution requirement. Any tax on the recognized built-in gain will reduce REIT taxable income. We may choose not to dispose of appreciated assets we might otherwise dispose of during the 10-year period in which the built-in gain tax applies in order to avoid the built-in gain tax. However, there can be no assurances that such a disposition will not occur. If we dispose of such assets in a gain recognition transaction, the amount of corporate tax that we will pay will vary depending on the actual amount of net built-in gain or loss present in those assets as of the effective time of our REIT election. The amount of tax could be significant. As of January 1, 2011, the effective time of our REIT election, the built-in-gains tax associated with our properties totaled approximately $145.8 million assuming 40% corporate tax rate.
We may be subject to adverse legislative or regulatory tax changes that could reduce the market price of our common stock.
The rules dealing with U.S. federal income taxation are constantly under review by persons involved in the legislative process and by the IRS and the U.S. Department of the Treasury. Changes to the tax law could materially adversely affect our stockholders. We cannot predict with certainty whether, when, in what forms, or with what effective dates, the tax laws applicable to us or our stockholders may be changed.
Our failure to maintain our qualification as a REIT would subject us to U.S. federal income tax, which could adversely affect the value of the shares of our common stock and would substantially reduce the cash available for distribution to our stockholders.
We believe that we are organized in conformity with the requirements for qualification as a REIT under the Code, and we believe we have operated in a manner that will enable us to meet the requirements for qualification and taxation as a REIT commencing with our taxable year beginning on January 1, 2011. However, we cannot assure you that we will remain qualified as a REIT. Moreover, our qualification and taxation as a REIT will depend upon our ability to meet on a continuing basis, through actual annual operating results, certain qualification tests set forth in the U.S. federal tax laws. Accordingly, given the complex nature of the rules governing REITs, the ongoing importance of factual determinations, including the potential tax treatment of investments we make, and the possibility of future changes in our circumstances, no assurance can be given that our actual results of operations for any particular taxable year will satisfy such requirements.
If we fail to qualify as a REIT in any calendar year, we would be required to pay U.S. federal income tax (and any applicable state and local tax), including any applicable alternative minimum tax, on our taxable income at regular corporate rates, and dividends paid to our stockholders would not be deductible by us in computing our taxable income (although such dividends received by certain non-corporate U.S. taxpayers generally would currently be subject to a preferential rate of taxation). Further, if we fail to qualify as a REIT, we might need to borrow money or sell assets in order to pay any resulting tax. Our payment of income tax would decrease the amount of our income available for distribution to our stockholders. Furthermore, if we fail to maintain our qualification as a REIT, we no longer would be required under U.S. federal tax laws to distribute substantially all of our REIT taxable income to our stockholders. Unless our failure to qualify as a REIT was subject to relief under U.S. federal tax laws, we could not re-elect to qualify as a REIT until the fifth calendar year following the year in which we failed to qualify.
19
Dividends payable by REITs do not qualify for the reduced tax rates available for some dividends.
The maximum tax rate applicable to income from “qualified dividends” payable to domestic stockholders taxed at individual rates is currently 20%. Dividends payable by REITs, however, generally are not eligible for the reduced rates. Although this legislation does not adversely affect the taxation of REITs or dividends payable by REITs, the more favorable rates applicable to regular corporate qualified dividends could cause investors who are taxed at individual rates to perceive investments in REITs to be relatively less attractive than investments in the stocks of non-REIT corporations that pay dividends treated as qualified dividend income, which could adversely affect the value of the stock of REITs, including our common stock.
Our ownership of and relationship with any taxable REIT subsidiaries that we have formed or will form will be limited and a failure to comply with the limits would jeopardize our REIT status and may result in the application of a 100% excise tax.
A REIT may own up to 100% of the stock of one or more taxable REIT subsidiaries (“TRSs”). A TRS may earn income that would not be qualifying income if earned directly by the parent REIT. Both the subsidiary and the REIT must jointly elect to treat the subsidiary as a TRS. A corporation (other than a REIT) of which a TRS directly or indirectly owns securities possessing more than 35% of the total voting power or total value of the outstanding securities of such corporation will automatically be treated as a TRS. Overall, no more than 25% of the value of a REIT’s total assets may consist of stock or securities of one or more TRSs. A domestic TRS will pay U.S. federal, state and local income tax at regular corporate rates on any income that it earns. In addition, the TRS rules limit the deductibility of interest paid or accrued by a TRS to its parent REIT to assure that the TRS is subject to an appropriate level of corporate taxation. The rules also impose a 100% excise tax on certain transactions between a TRS and its parent REIT that are not conducted on an arm’s length basis. Any domestic TRS that we have formed or may form will pay U.S. federal, state and local income tax on its taxable income, and its after-tax net income will be available for distribution to us but is not required to be distributed to us unless necessary to maintain our REIT qualification.
Not applicable.
20
As of
December 31, 2012
, our investment portfolio consisted of
119
real estate properties held for investment (consisting of (i)
96
skilled nursing/post-acute facilities, (ii)
22
senior housing facilities, and (iii)
one
acute care hospital), one asset held for sale and two mortgage loan investments.
All of our properties are leased under long term, triple-net leases. The following table displays the expiration of the annualized straight-line rental revenues under our lease agreements as of
December 31, 2012
by year and facility type (dollars in thousands) and, in each case, without giving effect to any renewal options:
|
|
2013 - 2019
|
|
2020
|
|
2021
|
|
2022
|
|
2023
|
|
2024
|
|
2025
|
|
Thereafter
|
Total
|
|||||||||||||||||||
|
Skilled Nursing/Post-Acute
|
|
|
|
|
|
|
|
||||||||||||||||||||||||||||
|
Properties
|
—
|
|
|
29
|
|
|
30
|
|
|
12
|
|
|
—
|
|
|
1
|
|
|
5
|
|
|
19
|
|
96
|
|
||||||||||
|
Licensed Beds/Units
|
—
|
|
3,191
|
|
3,508
|
|
869
|
|
—
|
|
360
|
|
734
|
|
2,164
|
|
10,826
|
|
|||||||||||||||||
|
Annualized Revenues
|
$
|
—
|
|
|
$
|
27,575
|
|
|
$
|
30,831
|
|
|
$
|
10,072
|
|
|
$
|
—
|
|
|
$
|
2,134
|
|
|
$
|
6,245
|
|
|
$
|
27,745
|
|
$
|
104,602
|
|
|
|
Senior Housing
|
|||||||||||||||||||||||||||||||||||
|
Properties
|
—
|
|
|
2
|
|
|
3
|
|
|
14
|
|
|
—
|
|
|
—
|
|
|
2
|
|
|
1
|
|
22
|
|
||||||||||
|
Licensed Beds/Units
|
—
|
|
251
|
|
197
|
|
807
|
|
—
|
|
—
|
|
197
|
|
34
|
|
1,486
|
|
|||||||||||||||||
|
Annualized Revenues
|
—
|
|
|
1,974
|
|
|
1,492
|
|
|
9,718
|
|
|
—
|
|
|
—
|
|
|
1,465
|
|
|
99
|
|
14,748
|
|
||||||||||
|
Acute Care Hospital
|
|
|
|
|
|
|
|
||||||||||||||||||||||||||||
|
Properties
|
—
|
|
|
—
|
|
|
—
|
|
|
—
|
|
|
—
|
|
|
—
|
|
|
—
|
|
|
1
|
|
1
|
|
||||||||||
|
Licensed Beds/Units
|
—
|
|
—
|
|
—
|
|
—
|
|
—
|
|
—
|
|
—
|
|
70
|
|
70
|
|
|||||||||||||||||
|
Annualized Revenues
|
—
|
|
|
—
|
|
|
—
|
|
|
—
|
|
|
—
|
|
|
—
|
|
|
—
|
|
|
6,593
|
|
6,593
|
|
||||||||||
|
|
|
|
|
|
|
|
|
|
|
|
|
|
|
|
|||||||||||||||||||||
|
Total Properties
|
—
|
|
|
31
|
|
|
33
|
|
|
26
|
|
|
—
|
|
|
1
|
|
|
7
|
|
|
21
|
|
119
|
|
||||||||||
|
Total Licensed Beds/Units
|
—
|
|
3,442
|
|
3,705
|
|
1,676
|
|
—
|
|
360
|
|
931
|
|
2,268
|
|
12,382
|
|
|||||||||||||||||
|
Total Annualized Revenues
|
$
|
—
|
|
$
|
29,549
|
|
$
|
32,323
|
|
$
|
19,790
|
|
$
|
—
|
|
$
|
2,134
|
|
$
|
7,710
|
|
$
|
34,437
|
|
$
|
125,943
|
|
||||||||
|
% of Revenue
|
—
|
%
|
23.5
|
%
|
25.7
|
%
|
|
15.7
|
%
|
—
|
%
|
1.7
|
%
|
6.1
|
%
|
27.3
|
%
|
100.0
|
%
|
||||||||||||||||
Occupancy Trends
The following table sets forth the occupancy percentage for our properties for the periods indicated.
|
Occupancy %
(1)
|
|||||||||||||||
|
Years Ended December 31,
|
|||||||||||||||
|
2012
|
2011
|
2010
|
2009
|
2008
|
|||||||||||
|
Skilled Nursing/Post-Acute
|
89.0
|
%
|
89.1
|
%
|
89.0
|
%
|
90.4
|
%
|
91.2
|
%
|
|||||
|
Senior Housing
|
84.4
|
%
|
82.7
|
%
|
84.4
|
%
|
88.3
|
%
|
91.4
|
%
|
|||||
|
Acute Care Hospital
|
66.5
|
%
|
71.8
|
%
|
N/A
|
|
N/A
|
|
N/A
|
|
|||||
|
Weighted Average
|
88.3
|
%
|
88.5
|
%
|
88.6
|
%
|
90.2
|
%
|
91.2
|
%
|
|||||
(1)
The percentages are computed by dividing the actual census from the period presented by the available beds/units for the same period. Occupancy for independent living facilities can be greater than 100% for a given period as multiple residents could occupy a single unit. We include the occupancy percentage for a property if it was owned by us at any time during the period presented. Occupancy percentage for facilities with new tenants/operators are only included in periods subsequent to our acquisition of the facilities and exclude the impact of strategic disposition candidates and facilities held for sale. All facility financial performance data is presented one month in arrears.
You should not rely upon occupancy percentages, either individually or in the aggregate, to determine the performance of a facility. Other factors that may impact the performance of a facility include the sources of payment, terms of reimbursement and the acuity level of the patients (i.e., the condition of patients that determines the level of skilled nursing and rehabilitation therapy services required).
21
Skilled Mix Trends
The following table sets forth the skilled mix of the skilled nursing facilities included in our properties for the periods indicated.
|
Skilled Mix %
(1)
|
|||||||||||||
|
Years Ended December 31,
|
|||||||||||||
|
2012
|
2011
|
2010
|
2009
|
2008
|
|||||||||
|
37.7
|
%
|
41.8
|
%
|
39.5
|
%
|
39.3
|
%
|
39.1
|
%
|
||||
(1)
"
Skilled Mix" is defined as the total Medicare and non-Medicaid managed care patient revenue at skilled nursing facilities divided by the total revenues at skilled nursing facilities for any given period. We include skilled mix for a skilled nursing facility if it was owned by us at any time during the period presented. Skilled mix for facilities with new tenants/operators are only included in periods subsequent to our acquisition of the facilities and exclude the impact of strategic disposition candidates and facilities held for sale. All facility financial performance data is presented one month in arrears.
See also the discussion above under the heading “Business—Portfolio of Healthcare Properties” for further discussion regarding the ownership of our properties and the types of healthcare facilities that comprise our properties.
Of our
119
properties held for investment, 25 are subject to mortgage indebtedness to third parties that, as of
December 31, 2012
, totaled approximately
$152.3 million
. See the discussion under the heading “Management’s Discussion and Analysis—Liquidity and Capital Resources—Mortgage Indebtedness” for further discussion regarding our mortgage indebtedness. As of
December 31, 2012
and 2011, our mortgage notes payable consisted of the following (dollars in thousands):
|
Interest Rate Type
|
Book Value as of
December 31, 2012 |
Book Value as of December 31, 2011
(1)
|
Weighted Average
Interest Rate at December 31, 2012 |
Maturity
Date
|
||||||||
|
Fixed Rate
|
$
|
94,373
|
|
$
|
94,783
|
|
4.43
|
%
|
August 2015 - June 2047
|
|||
|
Variable Rate
(2)
|
57,949
|
|
59,159
|
|
5.00
|
%
|
August 2015
|
|||||
|
$
|
152,322
|
|
$
|
153,942
|
|
4.65
|
%
|
|||||
(1)
Book value balance for mortgage indebtedness includes mortgage premium of $0.5 million as of December 31, 2011.
(2)
Contractual interest rates under variable rate mortgages are equal to the 90-day LIBOR plus 4.0% (subject to a 1.0% LIBOR floor).
Corporate Office
We are headquartered and have our corporate office in Irvine, California. We lease our corporate office from an unaffiliated third party.
Neither we nor any of our subsidiaries is a party to, and none of our respective property is the subject of, any material legal proceeding, although we are from time to time party to legal proceedings that arise in the ordinary course of our business.
Not applicable.
22
Stockholder Information
Our common stock is listed on The NASDAQ Stock Market LLC and trades on the NASDAQ Global Select Market under the symbol “SBRA.” Set forth below for the fiscal quarters indicated are the reported high and low sales prices per share of our common stock on the NASDAQ Stock Market and the common dividends paid per share.
|
Sales Price
|
Dividends
|
|||||||||||
|
High
|
Low
|
Paid
|
||||||||||
|
2011
|
||||||||||||
|
First Quarter
|
|
$
|
19.31
|
|
$
|
16.52
|
|
|
NA
|
|
||
|
Second Quarter
|
|
$
|
18.44
|
|
$
|
15.85
|
|
|
$
|
0.32
|
|
|
|
Third Quarter
|
$
|
17.25
|
|
$
|
9.40
|
|
$
|
0.32
|
|
|||
|
Fourth Quarter
|
|
$
|
12.27
|
|
$
|
7.86
|
|
|
$
|
0.32
|
|
|
|
2012
|
||||||||||||
|
First Quarter
|
|
$
|
16.99
|
|
$
|
11.91
|
|
|
$
|
0.33
|
|
|
|
Second Quarter
|
|
$
|
17.24
|
|
$
|
13.37
|
|
|
$
|
0.33
|
|
|
|
Third Quarter
|
$
|
20.90
|
|
$
|
17.07
|
|
$
|
0.33
|
|
|||
|
Fourth Quarter
|
|
$
|
22.86
|
|
$
|
19.89
|
|
|
$
|
0.33
|
|
|
At March 4, 2013, we had approximately 3,202 stockholders of record.
We did not repurchase any shares of our common stock during the year ended
December 31, 2012
.
On
January 7, 2013
, our board of directors declared a quarterly cash dividend of
$0.34
per share of common stock. The dividend was paid on
February 28, 2013
to stockholders of record as of
February 15, 2013
.
To maintain REIT status, we are required each year to distribute to stockholders at least 90% of our annual REIT taxable income after certain adjustments. All distributions will be made by us at the discretion of our board of directors and will depend on our financial position, results of operations, cash flows, capital requirements, debt covenants (which include limits on distributions by us), applicable law, and other factors as our board of directors deems relevant. For example, while the Indenture governing the Senior Notes and our Amended Secured Revolving Credit Facility permit us to declare and pay any dividend or make any distribution that is necessary to maintain our REIT status, those distributions are subject to certain financial tests under the Indenture, and therefore, the amount of cash distributions we can make to our stockholders may be limited.
23
Stock Price Performance Graph
The following graph compares the cumulative total stockholder return of our common stock for the period from November 16, 2010, the first trading date after the Separation Date, through
December 31, 2012
. The graph assumes that $100 was invested at the close of market on November 15, 2010 in (i) our common stock, (ii) the NASDAQ Composite Index (iii) the FTSE NAREIT US Health Care REIT Index and (iv) the SNL US Healthcare REIT Index and assumes the reinvestment of all dividends. Previously, we used the FTSE NAREIT US Health Care REIT Index as the index for our peer group. However, we plan to use the SNL US Healthcare REIT Index as our peer group index prospectively due to the higher accessibility of the SNL US Healthcare REIT Index. We believe that the SNL US Healthcare REIT Index is comparable to the FTSE NAREIT US Health Care REIT Index. Stock price performances shown in the graph are not necessarily indicative of future price performances.
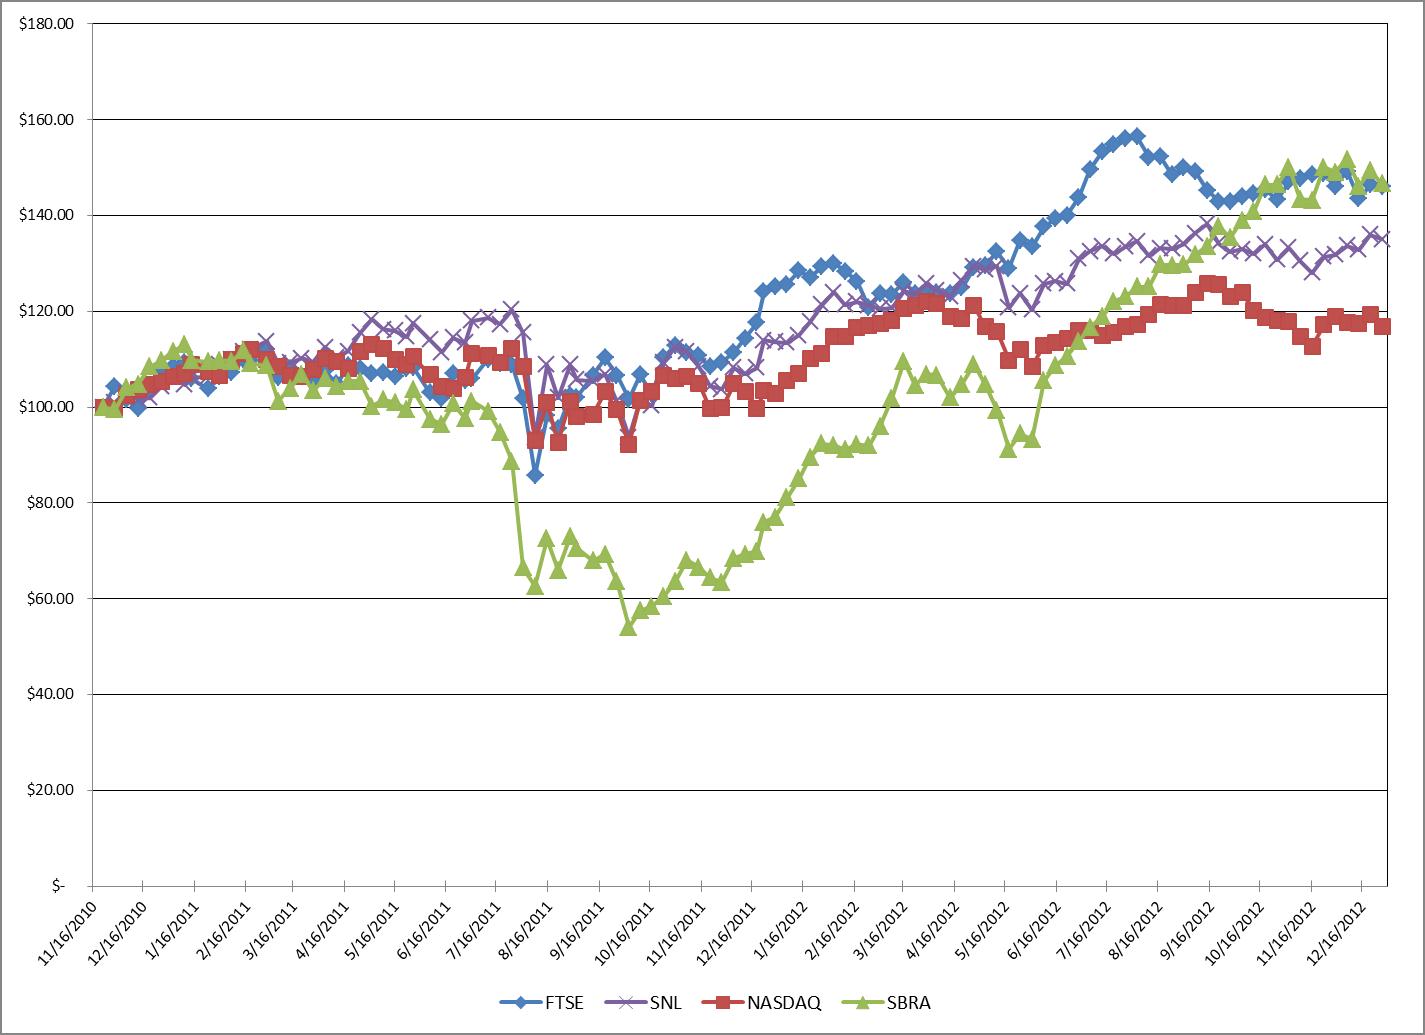
The above performance graph shall not be deemed to be soliciting material or to be filed with the SEC under the Securities Act of 1933 or the Securities Exchange Act of 1934 or incorporated by reference in any document as filed.
24
The following selected financial data as of
December 31, 2012
and
December 31, 2011
and for the years ended
December 31, 2012
and 2011 and the period from the Separation Date through December 31, 2010 should be read in conjunction with the accompanying consolidated financial statements and related notes thereto and Item 7, “Management’s Discussion and Analysis of Financial Condition and Results of Operations”:
|
As of December 31,
|
||||||||||||
|
2012
|
2011
|
2010
|
||||||||||
|
(Dollars in thousands)
|
||||||||||||
|
Balance sheet data:
|
||||||||||||
|
Total real estate investments, net
|
$
|
827,135
|
|
$
|
653,377
|
|
$
|
476,973
|
|
|||
|
Loans receivable, net
|
$
|
12,017
|
|
$
|
—
|
|
$
|
—
|
|
|||
|
Cash and cash equivalents
|
$
|
17,101
|
|
$
|
42,250
|
|
$
|
74,233
|
|
|||
|
Total assets
|
$
|
916,882
|
|
$
|
749,650
|
|
$
|
599,599
|
|
|||
|
Mortgage notes payable
|
$
|
152,322
|
|
$
|
153,942
|
|
$
|
156,913
|
|
|||
|
Secured revolving credit facility
|
$
|
92,500
|
|
$
|
—
|
|
$
|
—
|
|
|||
|
Senior unsecured notes payable
|
$
|
330,666
|
|
$
|
225,000
|
|
$
|
225,000
|
|
|||
|
Total liabilities
|
$
|
611,394
|
|
$
|
423,077
|
|
$
|
422,026
|
|
|||
|
Total stockholders' equity
|
$
|
305,488
|
|
$
|
326,573
|
|
$
|
177,533
|
|
|||
|
Year Ended
December 31, 2012
|
Year Ended
December 31, 2011
|
Separation Date
through
December 31, 2010
|
||||||||||
|
(Dollars in thousands, except per share data)
|
||||||||||||
|
Operating data:
|
||||||||||||
|
Total revenues
|
$
|
103,170
|
|
$
|
84,225
|
|
$
|
8,795
|
|
|||
|
Net income
|
$
|
19,513
|
|
$
|
12,842
|
|
$
|
7
|
|
|||
|
Net income per common share—basic
|
$
|
0.53
|
|
$
|
0.43
|
|
$
|
—
|
|
|||
|
Net income per common share—diluted
|
$
|
0.52
|
|
$
|
0.43
|
|
$
|
—
|
|
|||
|
Other data:
|
||||||||||||
|
Cash flows provided by operations
|
$
|
56,252
|
|
$
|
44,705
|
|
$
|
6,592
|
|
|||
|
Cash flows (used in) provided by investing activities
|
$
|
(218,650
|
)
|
$
|
(204,586
|
)
|
$
|
67,118
|
|
|||
|
Cash flows provided by financing activities
|
$
|
137,249
|
|
$
|
127,898
|
|
$
|
523
|
|
|||
|
Dividends declared and paid per common share
|
$
|
1.32
|
|
$
|
0.96
|
|
$
|
—
|
|
|||
|
Weighted-average number of common shares outstanding, basic
|
37,061,111
|
|
30,109,417
|
|
25,110,936
|
|
||||||
|
Weighted-average number of common shares outstanding, diluted—net income and FFO
|
37,321,517
|
|
30,171,225
|
|
25,186,988
|
|
||||||
|
Weighted-average number of common shares outstanding, diluted—AFFO
|
37,829,421
|
|
30,399,132
|
|
25,645,131
|
|
||||||
|
FFO
(1)
|
$
|
52,257
|
|
$
|
39,433
|
|
$
|
3,141
|
|
|||
|
Diluted FFO per common share
(1)
|
$
|
1.40
|
|
$
|
1.31
|
|
$
|
0.12
|
|
|||
|
AFFO
(1)
|
$
|
60,287
|
|
$
|
47,142
|
|
$
|
3,704
|
|
|||
|
Diluted AFFO per common share
(1)
|
$
|
1.59
|
|
$
|
1.55
|
|
$
|
0.14
|
|
|||
|
(1)
|
We believe that net income as defined by GAAP is the most appropriate earnings measure. We also believe that funds from operations (“FFO”), as defined in accordance with the definition used by the National Association of Real Estate Investment Trusts (“NAREIT”), and adjusted funds from operations (“AFFO”) (and related per share amounts) are important non-GAAP supplemental measures of operating performance for a REIT. We consider FFO and AFFO to be useful measures for reviewing comparative operating and financial performance because, by excluding gains or losses from real estate dispositions, impairment charges, and real estate depreciation and amortization, and, for AFFO, by excluding non-cash revenues (including straight-line rental income adjustments, amortization of acquired above/below market lease intangibles and non-cash interest income adjustments), non-cash expenses (including stock-based compensation expense, amortization of deferred financing costs and amortization of debt discounts and premiums) and acquisition pursuit costs, FFO and AFFO can help investors compare our operating performance between periods or as compared to other companies. See further discussion of FFO and AFFO in Item 7, “Management’s Discussion and Analysis of Financial Condition and Results of Operations—Results of Operations—Funds from Operations and Adjusted Funds from Operations.”
|
25
We commenced operations upon completion of the Separation and REIT Conversion Merger on November 15, 2010 (the “Separation Date”). For comparison purposes, we have presented below an unaudited pro forma consolidated income statement for the year ended December 31, 2010 as if the Separation and REIT Conversion Merger had occurred on January 1, 2010. Accordingly, the discussion and analysis of our results of operations set forth below includes a comparison of our actual results of operations for the years ended December 31, 2012 and 2011 and a comparison of our actual results of operations for the year ended December 31, 2011 and our pro forma results of operations for the year ended December 31, 2010.
The discussion below contains forward-looking statements that involve risks and uncertainties. Our actual results could differ materially from those anticipated in these forward-looking statements as a result of various factors, including those which are discussed in the section titled “Risk Factors.” Also see “Statement Regarding Forward-Looking Statements” preceding Part I.
The following discussion and analysis should be read in conjunction with the “Selected Financial Data” above and our accompanying consolidated financial statements and the notes thereto.
Our Management’s Discussion and Analysis of Financial Condition and Results of Operations is organized as follows:
|
•
|
Overview
|
|
•
|
Sun — Genesis Merger Transaction
|
|
•
|
Recent Transactions
|
|
•
|
Critical Accounting Policies
|
|
•
|
Results of Operations
|
|
•
|
Liquidity and Capital Resources
|
|
•
|
Concentration of Credit Risk
|
|
•
|
Skilled Nursing Facility Reimbursement Rates
|
|
•
|
Obligations and Commitments
|
|
•
|
Impact of Inflation
|
|
•
|
Off-Balance Sheet Arrangements
|
|
•
|
Quarterly Financial Data
|
Overview
We were incorporated on May 10, 2010 as a wholly owned subsidiary of Sun Healthcare Group, Inc. (“Old Sun”), a provider of nursing, rehabilitative and related specialty healthcare services principally to the senior population in the United States. Pursuant to a restructuring plan by Old Sun, Old Sun restructured its business by separating its real estate assets and its operating assets into two separate publicly traded companies, Sabra and SHG Services Inc. (which was then renamed “Sun Healthcare Group, Inc.” or “Sun”). In order to effect the restructuring, Old Sun distributed to its stockholders on a pro rata basis all of the outstanding shares of common stock of Sun (this distribution is referred to as the “Separation”), together with an additional cash distribution. Immediately following the Separation, Old Sun merged with and into Sabra, with Sabra surviving the merger and Old Sun stockholders receiving shares of Sabra common stock in exchange for their shares of Old Sun common stock (this merger is referred to as the “REIT Conversion Merger”). The Separation and REIT Conversion Merger were completed on November 15, 2010, which we refer to as the Separation Date.
Following the restructuring of Old Sun’s business and the completion of the Separation and REIT Conversion Merger, we began operating as a self-administered, self-managed REIT that, directly or indirectly, owns and invests in real estate serving the healthcare industry.
As of
December 31, 2012
, our investment portfolio consisted of
119
real estate properties held for investment (consisting of (i)
96
skilled nursing/post-acute facilities, (ii)
22
senior housing facilities, and (iii)
one
acute care hospital), one asset held for sale and two mortgage loan investments. As of
December 31, 2012
, our real estate properties held for investment had a total of
12,382
licensed beds, or units, spread across
27
states. As of
December 31, 2012
, all of our real estate properties were leased under triple-net operating leases with expirations ranging from
eight to 22
years.
We expect to continue to grow our portfolio primarily through the acquisition of senior housing and memory care facilities and with a secondary focus on acquiring skilled nursing facilities. We have and will continue to opportunistically originate financing secured directly or indirectly by healthcare facilities. We also expect to continue to work with operators to identify strategic development opportunities. These opportunities may involve replacing or renovating facilities in our portfolio that may have become less competitive and new development opportunities that present attractive risk-adjusted returns. In addition to pursuing acquisitions with triple-net leases, we expect to continue to pursue other forms of investment, including
26
investments in senior housing through RIDEA-compliant structures, mezzanine and secured debt investments, and joint ventures for senior housing, memory care and skilled nursing assets.
As we acquire additional properties and expand our portfolio, we expect to further diversify by tenant, asset class and geography within the healthcare sector. We employ a disciplined, opportunistic approach in our healthcare real estate investment strategy by investing in assets that provide attractive opportunities for dividend growth and appreciation of asset values, while maintaining balance sheet strength and liquidity, thereby creating long-term stockholder value.
We elected to be treated as a REIT with the filing of our U.S. federal income tax return for the taxable year beginning January 1, 2011. We believe that we have been organized and have operated, and we intend to continue to operate, in a manner to qualify as a REIT. We operate through an umbrella partnership (commonly referred to as an UPREIT) structure in which substantially all of our properties and assets are held by the Operating Partnership, of which we are the sole general partner, or by subsidiaries of the Operating Partnership.
Sun — Genesis Merger Transaction
Effective December 1, 2012, Sun was acquired by Genesis HealthCare LLC (“Genesis”). In connection with this transaction, we obtained a parent guaranty from Genesis, which replaced the then-existing Sun guaranty of the lease obligations of its subsidiaries that are tenants under our lease agreements. Additionally, we amended our master lease agreements with Sun to fix the annual rent escalators at 2.5% and to include cross-default provisions with Genesis’s term loan.
Recent Transactions
Bee Cave Preferred Equity Investment
On March 5, 2013, we entered into an agreement to provide up to $7.2 million of preferred equity funding to an affiliate of Meridian Realty Advisors, L.P. (“Meridian”) for the construction of a 141-bed skilled nursing facility and a 52-unit memory care facility in Austin, Texas (collectively, the “Bee Cave Preferred Equity Investments”). We funded $4.3 million at closing. In addition, we received an option to purchase the skilled nursing facility on or after the earlier to occur of the facility achieving and maintaining 90% occupancy for three consecutive months, or 36 months after receiving the certificate of occupancy for the facility. We also received an option to purchase the memory care facility that is not expected to be exercised as it is subordinate to a purchase option given to the manager of the memory care facility. Upon exercise of the purchase option on the skilled nursing facility, we would expect to lease the facility to Meridian under a long-term, triple net lease. Our preferred equity investment with respect to the skilled nursing facility provides for an annual 15% preferred rate of return, which will accrue on a quarterly compounding basis with payment of the preferred return deferred until the earlier of the closing under the purchase option, or 18 months after receiving a certificate of occupancy for the facility. Our preferred equity investment with respect to the memory care facility provides for an annual 15% preferred rate of return, which will accrue on a quarterly compounding basis with payment of the preferred return deferred until the earlier of the closing under the purchase option (whether by the manager of the facility or by us), or 30 months after receiving a certificate of occupancy for the facility.
Sun City West Mortgage Loan Origination
On January 31, 2013, we entered into a $12.8 million mortgage loan agreement with an affiliate of New Dawn Holding Company ("New Dawn") secured by a first trust deed on a 48-unit memory care facility located in Sun City West, Arizona ("Sun City West Mortgage Loan"). The Sun City West Mortgage Loan has a five-year term, bears interest at a fixed rate of 9.0% per annum and cannot be prepaid during the first three years of the loan term. In addition, beginning April 2014, we have an option to purchase the facility securing the Sun City West Mortgage Loan for a price equal to the greater of (a) the annualized earnings before interest, taxes, depreciation, amortization and rent of the facility for the trailing three months prior to option exercise, divided by an EBITDAR coverage ratio of 1.30 and further divided by an implied lease rate of 8.25% (subject to adjustment up to 9.00%), and (b) $15.0 million. In the event the we exercise the purchase option, we would expect to enter into a long-term lease with affiliates of New Dawn with an initial cash yield consistent with the lease rate used to determine the option exercise price. The facility was built in 2012 and is operated by affiliates of New Dawn. The Sun City West Mortgage Loan was funded with available cash.
Stoney River Marshfield Acquisition
On December 18, 2012, we purchased an assisted living facility located in Marshfield, Wisconsin (“Stoney River Marshfield”), which is the first acquisition associated with the pipeline agreement entered into with First Phoenix Group, LLC (“First Phoenix”) in August 2012.
In August 2012, we committed to a forward purchase program (the “Pipeline Agreement”) to acquire newly constructed senior housing properties to be developed by First Phoenix. On December 18, 2012, we acquired Stoney River Marshfield, a
27
60-bed assisted living facility, through a triple-net sale-leaseback transaction with First Phoenix. The purchase price consisted of $8.2 million paid upon closing with an additional amount due on or after June 30, 2013 based upon the performance of the facility and status of the license transfer of the facility. As of December 31, 2012, we estimated this additional purchase price to be $1.3 million. Upon the completion of the license transfer on the facility, which is currently expected to occur during 2013, Sabra will cancel the existing lease and enter into a new triple-net lease with a 50%/50% RIDEA-compliant joint venture between affiliates of Sabra and First Phoenix. The initial lease and replacement lease will have similar terms, including an initial term of 10 years with two five-year renewal options and annual rent escalators equal to the greater of the change in the Consumer Price Index or 3.0%, resulting in annual lease revenues determined in accordance with GAAP of $0.8 million (based on the initial consideration of $8.2 million) and an initial yield on cash rent of 8.0%. The acquisition was funded with available cash and proceeds from our Amended Secured Revolving Credit Facility. No additional consideration will be paid at the time the joint venture between affiliates of Sabra and First Phoenix is formed.
Retirement Living Portfolio Acquisition
On December 14, 2012, we purchased a nine-facility senior housing portfolio with a total of 322 units located throughout Michigan for $49.0 million. Concurrently with the purchase, we entered into a triple-net master lease agreement with affiliates of Retirement Living Management (“Retirement Living”). The lease has an initial term of 10 years with two five-year renewal options and provides for annual rent escalators equal to the greater of the change in the Consumer Price Index or 3.0%, resulting in annual lease revenues determined in accordance with GAAP of $4.5 million and an initial yield on cash rent of 8.0%. The purchase price was funded with available cash and proceeds from our Amended Secured Revolving Credit Facility. In addition, Sabra will have a right of first refusal to acquire an additional facility operated by Retirement Living and add such facility to the master lease.
Meridian Portfolio Acquisition
On November 30, 2012, we exercised our option to purchase and completed the acquisition of three skilled nursing facilities and one assisted living facility (collectively, the “Meridian Portfolio”) located in the Dallas-Fort Worth Metroplex and Rockport, Texas from Meridian Senior Properties Fund I, L.P. (“MSPF”). With a total of 394 beds, the three skilled nursing facilities were built in 2001 or later and the assisted living facility was built in 1996.
In March 2012, we provided a $10.0 million mezzanine loan secured by the partnership interests of MSPF under which we had an option to purchase these facilities for $43.0 million. At the closing of our purchase of the Meridian Portfolio, the outstanding mortgage debt and our mezzanine loan were repaid, resulting in us funding a net $33.0 million. The net purchase price was funded with available cash and proceeds from our Amended Secured Revolving Credit Facility.
Concurrently with the purchase, we entered into a triple-net master lease agreement with affiliates of MSPF. The lease has an initial term of 15 years with two five-year renewal options and provides for annual rent escalators equal to 3.0% for the first two years and the greater of the change in the Consumer Price Index or 2.5% thereafter. The initial yield on cash rent is 9.0% with $4.7 million in annual lease revenues determined in accordance with GAAP.
Camden Care Center Acquisition
On November 30, 2012, we purchased Camden Care Center, an 87-bed skilled nursing facility in Minneapolis, Minnesota (“Camden”), built in 1990, for $7.2 million. Concurrently with the purchase, we entered into a triple-net lease with Trinity Health Systems, LLC (“Trinity”). The lease has an initial term of 15 years with two five-year renewal options and provides for annual rent escalators equal to the greater of the change in the Consumer Price Index or 3.0%, resulting in annual lease revenues determined in accordance with GAAP of $0.9 million and an initial yield on cash rent of 10.0%. The purchase price was funded with available cash and proceeds from our Amended Secured Revolving Credit Facility.
Critical Accounting Policies
Below is a discussion of the accounting policies that management considers critical in that they involve significant management judgments and assumptions, require estimates about matters that are inherently uncertain and because they are important for understanding and evaluating our reported financial results. These judgments affect the reported amounts of assets and liabilities and our disclosure of contingent assets and liabilities at the dates of the financial statements and the reported amounts of revenue and expenses during the reporting periods. With different estimates or assumptions, materially different amounts could be reported in our financial statements. Additionally, other companies may utilize different estimates that may impact the comparability of our results of operations to those of companies in similar businesses.
Revenue Recognition
We recognize rental revenue from tenants, including rental abatements, lease incentives and contractual fixed increases attributable to operating leases, on a straight-line basis over the term of the related leases when collectability is reasonably assured. If the lease provides for tenant improvements, we determine whether the tenant improvements, for accounting
28
purposes, are owned by the tenant or by us. When we are the owner of the tenant improvements, the tenant is not considered to have taken physical possession or have control of the physical use of the leased asset until the tenant improvements are substantially completed. When the tenant is the owner of the tenant improvements, any tenant improvement allowance that is funded is treated as a lease incentive and amortized as a reduction of revenue over the lease term.
Real Estate Investments
Depreciation and Amortization
Real estate costs related to the acquisition and improvement of properties are capitalized and amortized over the expected useful life of the asset on a straight-line basis. Repair and maintenance costs are charged to expense as incurred and significant replacements and betterments are capitalized. Repair and maintenance costs include all costs that do not extend the useful life of the real estate asset. We consider the period of future benefit of an asset to determine its appropriate useful life. Depreciation of real estate assets and amortization of lease intangibles are included in depreciation and amortization in the consolidated statements of operations. We anticipate the estimated useful lives of our assets by class to be generally as follows: land improvements, 3 to 40 years; buildings and building improvements, 3 to 40 years; and furniture and equipment, 1 to 20 years.
Impairment of Real Estate Investments
We continually monitor events and changes in circumstances that could indicate that the carrying amounts of our real estate investments may not be recoverable or realized. When indicators of potential impairment suggest that the carrying value of real estate investments may not be recoverable, we assess the recoverability by estimating whether we will recover the carrying value of our real estate investments through its undiscounted future cash flows and the eventual disposition of the investment. If, based on this analysis, we do not believe that we will be able to recover the carrying value of our real estate investments, we would record an impairment loss to the extent that the carrying value exceeds the estimated fair value of our real estate investments. We recorded a $2.5 million impairment loss during the year ended
December 31, 2012
related to the asset held for sale. We did not record any impairment losses on our real estate investments during the year ended December 31, 2011 or during the period from the Separation Date through December 31, 2010.
Real Estate Acquisition Valuation
We account for the acquisition of income-producing real estate, or real estate that will be used for the production of income, as a business combination. All assets acquired and liabilities assumed in an acquisition of real estate are measured at their acquisition-date fair values. The acquisition value of land, building and improvements are included in real estate investments on the consolidated balance sheets. The acquisition value of tenant relationship and origination and absorption intangible assets are included in prepaid expenses, deferred financing costs and other assets in the consolidated balance sheets. Acquisition pursuit costs are expensed as incurred, and restructuring costs that do not meet the definition of a liability at the acquisition date are expensed in periods subsequent to the acquisition date. During the year ended
December 31, 2012
, we acquired
23
real estate properties and expensed
$1.7 million
of acquisition pursuit costs, which is included in general and administrative expense on the accompanying consolidated statement of income.
Estimates of the fair values of the tangible assets, identifiable intangibles and assumed liabilities require us to make significant assumptions to estimate market lease rates, property operating expenses, carrying costs during lease-up periods, discount rates, market absorption periods, and the number of years the property will be held for investment. We make our best estimate based on our evaluation of the specific characteristics of each tenant’s lease. The use of inappropriate assumptions would result in an incorrect valuation of our acquired tangible assets, identifiable intangibles and assumed liabilities, which would impact the amount of our net income.
Assets Held for Sale and Discontinued Operations
We generally consider real estate to be “held for sale” when the following criteria are met: (i) management commits to a plan to sell the property, (ii) the property is available for sale immediately, (iii) the property is actively being marketed for sale at a price that is reasonable in relation to its current fair value, (iv) the sale of the property within one year is considered probable and (v) significant changes to the plan to sell are not expected. Real estate that is held for sale and its related assets are classified as “assets held for sale” for all periods presented in the accompanying consolidated financial statements. Mortgage notes payable and other liabilities related to real estate held for sale are classified as “liabilities related to assets held for sale” for all periods presented in the accompanying consolidated financial statements. Real estate classified as held for sale is no longer depreciated and is reported at the lower of its carrying value or its estimated fair value less estimated costs to sell.
Discontinued operations is a component of an entity that has either been disposed of or is deemed to be held-for-sale and, (i) the operations and cash flows of the component have been or will be eliminated from ongoing operations as a result of the disposal transaction, and (ii) the entity will not have any significant continuing involvement in the operations of the component after the disposal transaction. Under the agreement with our tenant pertaining to the asset held for sale, revenues and cash flows
29
associated with the asset held for sale will not be eliminated as a result of the ultimate disposal of the asset. Accordingly, the operations of the held for sale asset are not classified as discontinued operations.
Loans Receivable and Interest Income
Loans Receivable
Loans receivable are recorded at amortized cost on our consolidated balance sheets. The amortized cost of a real estate loan receivable is the outstanding unpaid principal balance, net of unamortized costs and fees directly associated with the origination of the loan.
We review on a quarterly basis credit quality indicators such as payment status, changes affecting the underlying real estate collateral (for collateral dependent loans), changes affecting the operations of the facilities securing the loans, and national and regional economic factors. Our loans receivable are evaluated for impairment at each balance sheet date. We consider a loan to be impaired when, based upon current information and events, we believe that it is probable that we will be unable to collect all amounts due under the contractual terms of the loan agreement resulting from the borrower’s failure to repay contractual amounts due, the granting of a concession by us or our expectation that we will receive assets with fair values less than the carrying value of the loan in satisfaction of the loan. If a loan is considered to be impaired, a reserve is established when the present value of payments expected to be received, observable market prices, the estimated fair value of the collateral (for loans that are dependent on the collateral for repayment) or amounts expected to be received in satisfaction of a loan are lower than the carrying value of that loan. As of
December 31, 2012
, all of our loans were performing and none were considered to be impaired.
Interest Income
Interest income on our loans receivable is recognized on an accrual basis over the life of the investment using the interest method. Direct loan origination costs are amortized over the term of the loan as an adjustment to interest income. When concerns exist as to the ultimate collection of principal or interest due under a loan, the loan is placed on nonaccrual status and we will not recognize interest income until the cash is received, or the loan returns to accrual status. If we determine the collection of interest according to the contractual terms of the loan is probable, we will resume the accrual of interest.
Stock-Based Compensation
Stock-based compensation expense for stock-based awards granted to our employees and our non-employee directors are recognized in the statement of income based on their estimated fair value. Compensation expense for awards with graded vesting schedules is generally recognized ratably over the period from the grant date to the date when the award is no longer contingent on the employee providing additional services.
Income Taxes
We elected to be treated as a REIT with the filing of our U.S. federal income tax return for the taxable year beginning January 1, 2011. We believe that we have been organized and have operated, and we intend to continue to operate, in a manner to qualify as a REIT. To qualify as a REIT, we must meet certain organizational and operational requirements, including a requirement to distribute at least 90% of our annual REIT taxable income to stockholders (which is computed without regard to the dividends-paid deduction or net capital gains and which does not necessarily equal net income as calculated in accordance with GAAP). As a REIT, we generally will not be subject to federal income tax on income that we distribute as dividends to our stockholders. If we fail to qualify as a REIT in any taxable year, we will be subject to federal income tax on our taxable income at regular corporate income tax rates and generally will not be permitted to qualify for treatment as a REIT for federal income tax purposes for the four taxable years following the year during which qualification is lost, unless the IRS grants us relief under certain statutory provisions. Such an event could materially and adversely affect our net income and net cash available for distribution to stockholders. However, we believe that we are organized and operate in such a manner as to qualify for treatment as a REIT.
We evaluate our tax positions using a two-step approach: step one (recognition) occurs when a company concludes that a tax position, based solely on its technical merits, is more likely than not to be sustained upon examination and step two (measurement) is only addressed if step one has been satisfied (i.e., the position is more likely than not to be sustained). Under step two, the tax benefit is measured as the largest amount of benefit (determined on a cumulative probability basis) that is more likely than not to be realized upon ultimate settlement. We will recognize tax penalties relating to unrecognized tax benefits as additional tax expense.
Fair Value Measurements
Under GAAP, we are required to measure certain financial instruments at fair value on a recurring basis. In addition, we are required to measure other financial instruments and balances at fair value on a non-recurring basis (e.g., carrying value of
30
impaired real estate loans receivable and long-lived assets). Fair value is defined as the price that would be received upon the sale of an asset or paid to transfer a liability in an orderly transaction between market participants at the measurement date. The GAAP fair value framework uses a three-tiered approach. Fair value measurements are classified and disclosed in one of the following three categories:
|
•
|
Level 1: unadjusted quoted prices in active markets that are accessible at the measurement date for identical assets or liabilities;
|
|
•
|
Level 2: quoted prices for similar instruments in active markets, quoted prices for identical or similar instruments in markets that are not active, and model-derived valuations in which significant inputs and significant value drivers are observable in active markets; and
|
|
•
|
Level 3: prices or valuation techniques where little or no market data is available that requires inputs that are both significant to the fair value measurement and unobservable.
|
When available, we utilize quoted market prices from an independent third-party source to determine fair value and classify such items in Level 1 or Level 2. In instances where the market for a financial instrument is not active, regardless of the availability of a nonbinding quoted market price, observable inputs might not be relevant and could require us to make a significant adjustment to derive a fair value measurement. Additionally, in an inactive market, a market price quoted from an independent third party may rely more on models with inputs based on information available only to that independent third party. When we determine the market for a financial instrument owned by us to be illiquid or when market transactions for similar instruments do not appear orderly, we may use several valuation sources (including internal valuations, discounted cash flow analysis and quoted market prices) to establish a fair value. If more than one valuation source is used, we will assign weights to the various valuation sources. Additionally, when determining the fair value of liabilities in circumstances in which a quoted price in an active market for an identical liability is not available, we measure fair value using (i) a valuation technique that uses the quoted price of the identical liability when traded as an asset or quoted prices for similar liabilities or similar liabilities when traded as assets or (ii) another valuation technique that is consistent with the principles of fair value measurement, such as the income approach or the market approach.
Changes in assumptions or estimation methodologies can have a material effect on these estimated fair values. In this regard, the derived fair value estimates cannot be substantiated by comparison to independent markets and, in many cases, may not be realized in an immediate settlement of the instrument.
We consider the following factors to be indicators of an inactive market: (i) there are few recent transactions, (ii) price quotations are not based on current information, (iii) price quotations vary substantially either over time or among market makers (for example, some brokered markets), (iv) indexes that previously were highly correlated with the fair values of the asset or liability are demonstrably uncorrelated with recent indications of fair value for that asset or liability, (v) there is a significant increase in implied liquidity risk premiums, yields, or performance indicators (such as delinquency rates or loss severities) for observed transactions or quoted prices when compared with our estimate of expected cash flows, considering all available market data about credit and other nonperformance risk for the asset or liability, (vi) there is a wide bid-ask spread or significant increase in the bid-ask spread, (vii) there is a significant decline or absence of a market for new issuances (that is, a primary market) for the asset or liability or similar assets or liabilities, and (viii) little information is released publicly (for example, a principal-to-principal market).
We consider the following factors to be indicators of non-orderly transactions: (i) there was not adequate exposure to the market for a period before the measurement date to allow for marketing activities that are usual and customary for transactions involving such assets or liabilities under current market conditions, (ii) there was a usual and customary marketing period, but the seller marketed the asset or liability to a single market participant, (iii) the seller is in or near bankruptcy or receivership (that is, distressed), or the seller was required to sell to meet regulatory or legal requirements (that is, forced), and (iv) the transaction price is an outlier when compared with other recent transactions for the same or similar assets or liabilities.
Results of Operations
As of December 31, 2010, our investment portfolio consisted of 86 real estate properties. As of
December 31, 2011
, our investment portfolio consisted of 97 real estate properties. As of
December 31, 2012
, our investment portfolio consisted of
119
real estate properties held for investment, one asset held for sale and two mortgage loan investments. In general, we expect that our income and expenses related to our portfolio will increase in future periods as a result of owning investments acquired in 2011 and 2012 for an entire period and the anticipated future acquisition of additional investments. The results of operations presented for the years ended
December 31, 2012
and 2011 are not directly comparable due to the increase in acquisition activity subsequent to December 31, 2010.
31
Comparison of results of operations for the years ended
December 31, 2012
and 2011 (dollars in thousands):
|
For the Year Ended December 31,
|
|
|||||||||||||||||||||
|
2012
|
2011
|
Increase / (Decrease)
|
Percentage Difference
|
Increase (Decrease) due to Acquisitions and Originations
(1)
|
Remaining Increase (Decrease)
(2)
|
|||||||||||||||||
|
Revenues:
|
||||||||||||||||||||||
|
Rental income
|
$
|
101,742
|
|
$
|
80,678
|
|
$
|
21,064
|
|
26
|
%
|
$
|
18,630
|
|
$
|
2,434
|
|
|||||
|
Interest income
|
1,428
|
|
3,547
|
|
(2,119
|
)
|
(60
|
)%
|
1,405
|
|
(3,524
|
)
|
||||||||||
|
Expenses:
|
||||||||||||||||||||||
|
Depreciation and amortization
|
30,263
|
|
26,591
|
|
3,672
|
|
14
|
%
|
4,839
|
|
(1,167
|
)
|
||||||||||
|
Interest
|
37,005
|
|
30,319
|
|
6,686
|
|
22
|
%
|
—
|
|
6,686
|
|
||||||||||
|
General and administrative
|
16,104
|
|
14,473
|
|
1,631
|
|
11
|
%
|
(1,682
|
)
|
3,313
|
|
||||||||||
|
Impairment
|
2,481
|
|
—
|
|
2,481
|
|
100
|
%
|
—
|
|
2,481
|
|
||||||||||
|
Other income
|
2,196
|
|
—
|
|
2,196
|
|
100
|
%
|
—
|
|
2,196
|
|
||||||||||
(1)
Represents the dollar amount increase (decrease) for the year ended
December 31, 2012
compared to the year ended December 31, 2011 as a result of properties acquired and loans originated after January 1, 2011.
(2)
Represents the dollar amount increase (decrease) for the year ended
December 31, 2012
compared to the year ended December 31, 2011 that is not a direct result of acquisitions or originations during the periods.
Rental Income
During the year ended
December 31, 2012
, we recognized
$101.7
million of rental income compared to
$80.7 million
for the year ended
December 31, 2011
. The $21.0 million increase in rental income is due to an increase of
$18.6 million
from properties acquired after December 31, 2010 and an increase of
$2.4 million
due to annual rent escalators related to properties owned prior to 2011 that did not have fixed rent escalators. Amounts due under the terms of all of our lease agreements are subject to contractual increases, and there is no contingent rental income that may be derived from our properties.
Interest Income
During the year ended
December 31, 2012
, we recognized
$1.4 million
of interest income, which consisted primarily of interest income earned on loans receivable originated in 2012. During the year ended
December 31, 2011
, we recognized
$3.5 million
of interest income, which consisted mostly of interest income earned on a defaulted mortgage note we purchased at a discount (the “Hillside Terrace Mortgage Note”), which we acquired on March 25, 2011 and which was subsequently repaid on December 5, 2011. Included in 2011 interest income, is $3.0 million that we recognized in connection with the repayment of the Hillside Terrace Mortgage Note on December 5, 2011, representing the difference between our $5.3 million investment in the Hillside Terrace Mortgage Note and the repayment amount of $8.3 million.
Depreciation and Amortization
During the year ended
December 31, 2012
, we incurred
$30.3 million
of depreciation and amortization expense compared to
$26.6 million
for the year ended
December 31, 2011
. The
$3.7 million
net increase in depreciation and amortization was primarily due to an increase of
$4.8 million
from properties acquired after December 31, 2010, partially offset by a decrease of $1.1 million related to assets that have been fully depreciated.
Interest Expense
We incur interest expense comprised of costs of borrowings plus the amortization of deferred financing costs related to our indebtedness. During the year ended
December 31, 2012
, we incurred
$37.0 million
of interest expense compared to
$30.3 million
for the year ended
December 31, 2011
. The
$6.7 million
net increase is primarily related to a $3.5 million increase in interest expense, amortization of deferred financing costs and premium related to the July 2012 issuance of the $100.0 million aggregate principal amount of 8.125% Senior Notes, a $1.4 million increase in interest expense, unused facility fees and amortization of deferred financing costs related to the amounts outstanding and increase in capacity under our Amended Secured Revolving Credit Facility from $100.0 million to $230.0 million, and a $2.7 million net increase in amortization of deferred financing costs and premium due to the write-off of fees and prepayment penalty fees in connection with our mortgage debt refinancings and the repayment by us of one mortgage note. These increases were offset by a decrease of $0.6 million due to the decreased interest rates on the refinanced mortgage notes and the repayment by us of one mortgage note and a decrease of $0.3 million due to a 50 basis point reduction in the interest rate spread on certain floating rate mortgage debt totaling $57.9 million as of
December 31, 2012
.
32
General and Administrative Expenses
General and administrative expenses include compensation-related expenses as well as professional services, office costs and other costs associated with acquisition pursuit activities. During the year ended
December 31, 2012
, general and administrative expenses were
$16.1 million
compared to
$14.5 million
for the year ended
December 31, 2011
. The
$1.6 million
net increase is primarily related to a $3.7 million increase in stock-based compensation expense, from
$4.6 million
for the year ended
December 31, 2011
to
$8.3 million
for the year ended
December 31, 2012
, partially offset by a $1.5 million decrease in acquisition pursuit costs, from
$3.2 million
for the year ended
December 31, 2011
to
$1.7 million
for the year ended
December 31, 2012
. The increase in stock-based compensation expense is primarily related to 2012 annual bonuses. In 2012 and 2011, management elected to receive annual bonuses in stock rather than in cash and therefore changes in our stock price will result in changes to our bonus expense. The increase in stock-based compensation as a result of the annual bonuses to be received in stock is due to the increase in our stock price during the year ended
December 31, 2012
(an increase of $9.63 per share) compared to the year ended
December 31, 2011
(a decrease of $6.31 per share). We expect acquisition pursuit costs to fluctuate from period to period depending upon acquisition activity. We also expect stock-based compensation expense to fluctuate from period to period depending upon changes in our stock price and estimates associated with performance-based compensation.
Impairment Charges
During the year ended
December 31, 2012
, we recognized a
$2.5 million
impairment charge on one asset held for sale. The impairment charge was a result of the asset being held for sale and the resulting adjustment of its net book value to estimated fair value, less estimated costs to sell. We did not recognize any impairment charges during the year ended
December 31, 2011
.
Other Income
During the year ended
December 31, 2012
, we recognized other income of
$2.2 million
related to the granting of a consent to our tenant to close the facility designated as held for sale.
Unaudited Pro Forma Financial Data
The following reflects the unaudited pro forma consolidated income statement of Sabra for the year ended December 31, 2010 as if the Separation and REIT Conversion Merger and the October 2010 offering of the $225.0 million aggregate principal amount of Senior Notes had occurred on January 1, 2010. The pro forma adjustments represent revenues and expenses to reflect the pro forma consolidated performance for the year ended December 31, 2010 and are necessary in order to develop the pro forma financial information consistent with the requirements of the SEC. The actual results reported in periods following the Separation may differ significantly from those reflected in this pro forma consolidated income statement for a number of reasons, including differences between the assumptions used to prepare these pro forma amounts and actual amounts. In addition, no adjustments have been made to the unaudited pro forma consolidated income statement for non-recurring items related to the Separation. As a result, the pro forma financial information does not purport to be indicative of what the results of operations would have been had the Separation been completed on January 1, 2010. The unaudited pro forma consolidated income statement does not purport to project the future results of operations after giving effect to the Separation.
33
SABRA HEALTH CARE REIT, INC.
UNAUDITED PRO FORMA CONSOLIDATED INCOME STATEMENT
For the Year Ended December 31, 2010
(in thousands)
|
Actual Results from the Separation Date to December 31, 2010
|
Pro Forma
Adjustments
|
Pro Forma for the
Year Ended
December 31, 2010
|
|||||||||
|
Revenues:
|
|||||||||||
|
Rental income
|
$
|
8,781
|
|
$
|
61,464
|
|
$
|
70,245
|
|
||
|
Interest income
|
14
|
|
—
|
|
14
|
|
|||||
|
Total revenues
|
8,795
|
|
61,464
|
|
70,259
|
|
|||||
|
Expenses:
|
|||||||||||
|
Depreciation and amortization
|
3,134
|
|
21,082
|
|
24,216
|
|
|||||
|
Interest
|
3,859
|
|
26,659
|
|
30,518
|
|
|||||
|
General and administrative
|
1,553
|
|
8,082
|
|
9,635
|
|
|||||
|
Total expenses
|
8,546
|
|
55,823
|
|
64,369
|
|
|||||
|
Income before income taxes
|
249
|
|
5,641
|
|
5,890
|
|
|||||
|
Income tax expense
|
242
|
|
(242
|
)
|
—
|
|
|||||
|
Net income
|
$
|
7
|
|
$
|
5,883
|
|
$
|
5,890
|
|
||
Sabra began operating as a separate company following the Separation and REIT Conversion Merger, which was completed on November 15, 2010, which we refer to as the Separation Date. The following is a discussion of our results of operations for the year ended December 31, 2011 compared to our pro forma results of operations for the year ended December 31, 2010.
Comparison of results of operations for the year ended
December 31, 2011
and pro forma results of operations for the year ended December 31, 2010 (dollars in thousands):
|
Actual for the Year Ended
December 31, 2011 |
Pro Forma for the
Year Ended December 31, 2010 |
Variance
|
Percentage
Difference |
|||||||||||
|
Rental income
|
$
|
80,678
|
|
$
|
70,245
|
|
$
|
10,433
|
|
15
|
%
|
|||
|
Interest income
|
3,547
|
|
14
|
|
3,533
|
|
NM
|
|
||||||
|
Depreciation and amortization
|
26,591
|
|
24,216
|
|
2,375
|
|
10
|
%
|
||||||
|
Interest
|
30,319
|
|
30,518
|
|
(199
|
)
|
(1
|
)%
|
||||||
|
General and administrative
|
14,473
|
|
9,635
|
|
4,838
|
|
50
|
%
|
||||||
Rental Income
During the year ended
December 31, 2011
, we recognized $
80.7 million
of rental income, compared to
$70.2 million
on a pro forma basis for the year ended December 31, 2010. The increase during the year ended
December 31, 2011
primarily resulted from the recognition of $10.3 million of rental income from the acquisitions of
the Cadia Portfolio, Texas Regional Medical Center at Sunnyvale, the Aurora Portfolio, the Encore Portfolio, Oak Brook Health Care Center and Creekside Senior Living,
which were completed in 2011. Amounts due under the terms of all of our lease agreements are subject to contractual increases and there is no contingent rental income that may be derived from our properties.
Interest Income
During the year ended
December 31, 2011
, we recognized
$3.5 million
of interest income compared to $14,000 recognized on a pro forma basis for the year ended December 31, 2010. Interest income during the year ended
December 31, 2011
consisted primarily of interest income earned on the Hillside Terrace Mortgage Note, which we acquired on March 25, 2011. Included in interest income is $3.0 million that we recognized in connection with the repayment of the Hillside Terrace Mortgage Note on December 5, 2011, representing the difference between our $5.3 million investment in the Hillside Terrace Mortgage Note and the repayment amount of $8.3 million.
Depreciation and Amortization
During the year ended
December 31, 2011
, we incurred depreciation and amortization expense of $
26.6 million
compared to $
24.2 million
on a pro forma basis for the year ended December 31, 2010. The increase during the year ended
34
December 31, 2011
resulted from the recognition of $2.6 million of depreciation and amortization expense from the acquisitions of
the Cadia Portfolio, Texas Regional Medical Center at Sunnyvale, the Aurora Portfolio, the Encore Portfolio, Oak Brook Health Care Center and Creekside Senior Living,
which were completed in 2011.
Interest
We incur interest expense comprised of costs of borrowings plus the amortization of deferred financing costs related to our indebtedness. During the year ended
December 31, 2011
, we incurred
$30.3 million
of interest expense. On a pro forma basis for the year ended December 31, 2010, interest expense was $
30.5 million
. See “—Liquidity and Capital Resources” below for more information.
General and Administrative Expenses
General and administrative expenses include compensation-related expenses as well as professional services, office costs and other costs associated with acquisition pursuit activities. During the year ended
December 31, 2011
, general and administrative expenses were $
14.5 million
. The majority of our general and administrative expenses were comprised of compensation and benefit expenses totaling $6.8 million, including stock-based compensation expense for our employees and board members totaling $
4.6 million
and employee salaries and benefits of $2.2 million. Also included in general and administrative expenses for the year ended
December 31, 2011
were
$3.2 million
of acquisition pursuit costs and $1.4 million in expenses related to purchase and repayment of the Hillside Terrace Mortgage Note. On a pro forma basis for the year ended December 31, 2010, general and administrative expenses were $
9.6 million
, which excludes actual one-time start-up costs totaling $0.3 million, any acquisition pursuit costs and stock-based compensation accrual estimate adjustments. Pro forma compensation and benefit expenses for the year ended December 31, 2010 totaled $6.8 million, including stock-based compensation for employees and board members totaling $4.8 million and employee salaries and benefits of $2.0 million. We expect acquisition pursuit costs will fluctuate from period to period depending on acquisition activity. We also expect stock-based compensation expense to fluctuate from period to period depending upon changes in our stock price and estimates associated with performance-based compensation.
Funds from Operations and Adjusted Funds from Operations
We believe that net income as defined by GAAP is the most appropriate earnings measure. We also believe that funds from operations (“FFO”), as defined in accordance with the definition used by the National Association of Real Estate Investment Trusts (“NAREIT”), and adjusted funds from operations (“AFFO”) (and related per share amounts) are important non-GAAP supplemental measures of operating performance for a REIT. Because the historical cost accounting convention used for real estate assets requires straight-line depreciation (except on land), such accounting presentation implies that the value of real estate assets diminishes predictably over time. However, since real estate values have historically risen or fallen with market and other conditions, presentations of operating results for a REIT that uses historical cost accounting for depreciation could be less informative. Thus, NAREIT created FFO as a supplemental measure of operating performance for REITs that excludes historical cost depreciation and amortization, among other items, from net income, as defined by GAAP. FFO is defined as net income, computed in accordance with GAAP, excluding gains or losses from real estate dispositions, plus real estate depreciation and amortization and impairment charges. AFFO is defined as FFO excluding non-cash revenues (including straight-line rental income adjustments, amortization of acquired above/below market lease intangibles and non-cash interest income adjustments), non-cash expenses (including stock-based compensation expense, amortization of deferred financing costs and amortization of debt discounts and premiums) and acquisition pursuit costs. We believe that the use of FFO and AFFO (and the related per share amounts), combined with the required GAAP presentations, improves the understanding of operating results of REITs among investors and makes comparisons of operating results among such companies more meaningful. We consider FFO and AFFO to be useful measures for reviewing comparative operating and financial performance because, by excluding gains or losses from real estate dispositions, impairment charges, and real estate depreciation and amortization, and for AFFO, by excluding non-cash revenues (including straight-line rental income adjustments, amortization of acquired above/below market lease intangibles and non-cash interest income adjustments), non-cash expenses (including stock-based compensation expense, amortization of deferred financing costs and amortization of debt discounts and premiums) and acquisition pursuit costs, FFO and AFFO can help investors compare our operating performance between periods or as compared to other companies. While FFO and AFFO are relevant and widely used measures of operating performance of REITs, they do not represent cash flows from operations or net income as defined by GAAP and should not be considered an alternative to those measures in evaluating our liquidity or operating performance. FFO and AFFO also do not consider the costs associated with capital expenditures related to our real estate assets nor do they purport to be indicative of cash available to fund our future cash requirements. Further, our computation of FFO and AFFO may not be comparable to FFO and AFFO reported by other REITs that do not define FFO in accordance with the current NAREIT definition or that interpret the current NAREIT definition or define AFFO differently than we do.
35
The following table reconciles our calculations of FFO and AFFO for the
years
ended
December 31, 2012
and 2011 and for the period from the Separation Date to December 31, 2010, to net income, the most directly comparable GAAP financial measure, for the same periods (in thousands, except share and per share amounts):
|
Year Ended December 31, 2012
|
Year Ended December 31, 2011
|
Period from November 15, 2010 to December 31, 2010
|
|||||||||
|
Net income
|
$
|
19,513
|
|
$
|
12,842
|
|
$
|
7
|
|
||
|
Depreciation and amortization of real estate assets
|
30,263
|
|
26,591
|
|
3,134
|
|
|||||
|
Impairment
|
2,481
|
|
—
|
|
—
|
|
|||||
|
FFO
|
52,257
|
|
39,433
|
|
3,141
|
|
|||||
|
Acquisition pursuit costs
|
1,654
|
|
3,218
|
|
—
|
|
|||||
|
Stock-based compensation
|
8,279
|
|
4,600
|
|
335
|
|
|||||
|
Straight-line rental income adjustments
|
(4,893
|
)
|
(2,092
|
)
|
—
|
|
|||||
|
Amortization of deferred financing costs
|
3,800
|
|
1,998
|
|
230
|
|
|||||
|
Amortization of debt premium
|
(834
|
)
|
(15
|
)
|
(2
|
)
|
|||||
|
Non-cash interest income adjustments
|
24
|
|
—
|
|
—
|
|
|||||
|
AFFO
|
$
|
60,287
|
|
$
|
47,142
|
|
$
|
3,704
|
|
||
|
|
|||||||||||
|
FFO per diluted common share
|
$
|
1.40
|
|
$
|
1.31
|
|
$
|
0.12
|
|
||
|
|
|
|
|||||||||
|
AFFO per diluted common share
|
$
|
1.59
|
|
$
|
1.55
|
|
$
|
0.14
|
|
||
|
|
|||||||||||
|
Weighted average number of common shares outstanding, diluted:
|
|||||||||||
|
FFO
|
37,321,517
|
|
30,171,225
|
|
25,186,988
|
|
|||||
|
|
|||||||||||
|
AFFO
|
37,829,421
|
|
30,399,132
|
|
25,645,131
|
|
|||||
|
|
|||||||||||
Set forth below is additional information related to certain other items included in net income above, which may be helpful in assessing our operating results. Please see the accompanying consolidated statement of cash flows for details of our operating, investing, and financing cash activities.
Significant Items Included in Net Income:
|
•
|
Other income of $2.2 million during the year ended December 31, 2012 related to the granting of a consent to our tenant to close the facility designated as held for sale;
|
|
•
|
Interest expense of $2.0 million due to prepayment penalty fees related to the mortgage notes that were refinanced during the year ended
December 31, 2012
;
|
|
•
|
Interest income of $3.0 million and $1.4 million of expenses during the year ended December 31, 2011 as a result of the repayment of the Hillside Terrace Mortgage Note on December 5, 2011;
|
|
•
|
General and administrative expense of $0.3 million and $0.1 million related to one-time start-up costs incurred during the year ended December 31, 2011 and from the Separation Date through December 31, 2010, respectively; and
|
|
•
|
General and administrative expense of $0.4 million during the period from the Separation Date through December 31, 2010 related to a one-time bonus paid to Mr. Matros, our president and chief executive officer, in December 2010.
|
Liquidity and Capital Resources
As of
December 31, 2012
, we had approximately
$126.2 million
in liquidity, consisting of unrestricted cash and cash equivalents of
$17.1 million
and available borrowings under our Amended Secured Revolving Credit Facility of
$109.1 million
. On July 26, 2012, we completed an offering of $100.0 million aggregate principal amount of Senior Notes at 106.0%, providing net proceeds of $103.0 million after underwriting costs and other offering expenses. A portion of these proceeds was used to repay $42.5 million then outstanding under our Amended Secured Revolving Credit Facility.
We believe that our available cash, operating cash flows and borrowings available to us under the Amended Secured Revolving Credit Facility provide sufficient funds for our operations, scheduled debt service payments with respect to the Senior Notes, amounts outstanding under the Amended Secured Revolving Credit Facility, mortgage indebtedness on our properties, and dividend requirements for the next twelve months. We have also filed with the SEC a shelf registration
36
statement on Form S-3, which became effective on October 31, 2011, that will allow us to issue up to $500.0 million in new securities.
We intend to invest in additional healthcare properties as suitable opportunities arise and adequate sources of financing are available. We expect that future investments in properties, including any improvements or renovations of current or newly-acquired properties, will depend on and will be financed, in whole or in part, by our existing cash, borrowings available to us under our Amended Secured Revolving Credit Facility, future borrowings or the proceeds from issuances of common stock, preferred stock, debt or other securities. In addition, we expect to seek financing from U.S. government agencies, including through Fannie Mae and HUD, in appropriate circumstances in connection with acquisitions and refinancings of existing mortgage loans.
As of
December 31, 2012
, we had $
325.0 million
of indebtedness with respect to our Senior Notes and aggregate mortgage indebtedness to third parties of approximately $
152.3 million
on certain of our properties. In addition, as of
December 31, 2012
, we had
$92.5 million
outstanding under the Amended Secured Revolving Credit Facility and $
109.1 million
available for borrowing.
Although we are subject to restrictions on our ability to incur indebtedness under the Indenture governing the Senior Notes and under the terms of the Amended Secured Revolving Credit Facility, we expect that we will be able to refinance existing indebtedness or incur additional indebtedness for acquisitions or other purposes, if needed. However, there can be no assurance that in the future we will be able to refinance our indebtedness, incur additional indebtedness or access additional sources of capital, such as by issuing common stock or other debt or equity securities, on terms that are acceptable to us or at all.
Cash Flows from Operating Activities
Net cash provided by operating activities was
$56.3 million
and $
44.7 million
for the
years
ended
December 31, 2012
and 2011, respectively. Operating cash inflows were derived primarily from the rental payments received under the lease agreements with subsidiaries of Genesis and rental payments from our other tenants and operating cash outflows were the result of interest payments on our outstanding debt and payment of general and administrative expenses. Operating cash flows for the year ended December 31, 2011 also included interest from the Hillside Terrace Mortgage Note, which was repaid on December 5, 2011. We expect our annualized cash flows provided by operating activities to increase as a result of completed and anticipated future real estate investments.
Cash Flows from Investing Activities
During the year ended
December 31, 2012
, net cash used in investing activities was
$218.7 million
and consisted primarily of
$205.4 million
used in the acquisitions of
10
skilled nursing facilities and
13
senior housing facilities,
$22.2 million
used to originate three mortgage loan investments and
$1.0 million
used for tenant improvements, partially offset by the
$10.0 million
repayment of one of the loans receivable. We expect to continue using available liquidity in connection with anticipated future real estate investments and loan originations.
Cash Flows from Financing Activities
During the year ended
December 31, 2012
, net cash provided by financing activities was
$137.2 million
and consisted of
$106.0 million
in gross proceeds from the July 2012 offering of $100.0 million aggregate principal amount of Senior Notes issued at 106.0% and
$0.1 million
in net proceeds related to the issuance of common stock, partially offset by a
$5.6 million
net decrease in mortgage borrowings,
$48.9 million
of dividends paid to common stockholders and
$6.8 million
of payments for deferred financing costs related to the entry into the Amended Secured Revolving Credit Facility, the refinancing of certain mortgage notes and the July 2012 offering of $100.0 million aggregate principal amount of Senior Notes. The
$5.6 million
net decrease in mortgage borrowings consisted of $2.1 million of incremental borrowings through refinancings of existing mortgage notes less $4.4 million for the pay off of one mortgage note and $3.3 million from normal amortizing principal payments. In addition, during the year ended
December 31, 2012
, we borrowed
$135.0 million
on our Amended Secured Revolving Credit Facility and repaid
$42.5 million
during the same period.
Loan Agreements
8.125% Senior Notes due 2018
. On October 27, 2010, we through the Operating Partnership and Sabra Capital Corporation (the “Issuers”), issued $225.0 million aggregate principal amount of 8.125% senior unsecured notes (the “Senior Notes”) in a private placement. The Senior Notes were sold at par, resulting in gross proceeds of $225.0 million and net proceeds of approximately $219.9 million after deducting commissions and expenses. On December 6, 2010, substantially all of the net proceeds were used by Sun to redeem the $200.0 million in aggregate principal amount outstanding of Old Sun’s 9.125% senior subordinated notes due 2015, including accrued and unpaid interest and the applicable redemption premium. In
37
March 2011, the Issuers completed an exchange offer to exchange the Senior Notes for substantially identical 8.125% senior unsecured notes registered under the Securities Act of 1933, as amended (also referred to herein as the “Senior Notes”).
On July 26, 2012, the Issuers issued an additional $100.0 million aggregate principal amount of Senior Notes, which are treated as a single class with the existing Senior Notes. The notes were issued at 106.0% providing net proceeds of $103.0 million after underwriting costs and other offering expenses and a yield-to-maturity of 6.92%. The Company used a portion of the proceeds from this offering to repay the borrowings outstanding under the Amended Secured Revolving Credit Facility. On November 14, 2012, the Issuers completed an exchange offer to exchange the $100.0 million aggregate principal amount of Senior Notes that were issued in July 2012 for substantially identical Senior Notes registered under the Securities Act of 1933, as amended.
The obligations under the Senior Notes are fully and unconditionally guaranteed, jointly and severally, on an unsecured basis, by us and certain of our other existing and, subject to certain exceptions, future material subsidiaries; provided, however, that such guarantees are subject to release under certain customary circumstances. See Note 15, “Summarized Condensed Consolidating Information,” in the Notes to Condensed Consolidated Financial Statements for additional information concerning the circumstances pursuant to which the guarantors will be automatically and unconditionally released from their obligations under the guarantees.
The Senior Notes are redeemable at the option of the Issuers, in whole or in part, at any time, and from time to time, on or after November 1, 2014, at the redemption prices set forth in the indenture governing the Senior Notes (the “Indenture”), plus accrued and unpaid interest to the applicable redemption date. In addition, prior to November 1, 2014, the Issuers may redeem all or a portion of the Senior Notes at a redemption price equal to 100% of the principal amount of the Senior Notes redeemed, plus a “make-whole” premium, plus accrued and unpaid interest to the applicable redemption date. At any time, or from time to time, on or prior to November 1, 2013, the Issuers may redeem up to 35% of the principal amount of the Senior Notes, using the proceeds of specific kinds of equity offerings, at a redemption price of 108.125% of the principal amount to be redeemed, plus accrued and unpaid interest, if any, to the applicable redemption date. Assuming the Senior Notes are not redeemed, the Senior Notes mature on November 1, 2018.
The Indenture governing the Senior Notes contains restrictive covenants that, among other things, restrict the ability of Sabra, the Issuers and their restricted subsidiaries to: (i) incur or guarantee additional indebtedness; (ii) incur or guarantee secured indebtedness; (iii) pay dividends or distributions on, or redeem or repurchase, their capital stock; (iv) make certain investments or other restricted payments; (v) sell assets; (vi) create liens on their assets; (vii) enter into transactions with affiliates; (viii) merge or consolidate or sell all or substantially all of their assets; and (ix) create restrictions on the ability of Sabra’s restricted subsidiaries to pay dividends or other amounts to Sabra. The Indenture governing the Senior Notes also provides for customary events of default, including, but not limited to, the failure to make payments of interest or premium, if any, on, or principal of, the Senior Notes, the failure to comply with certain covenants and agreements specified in the Indenture for a period of time after notice has been provided, the acceleration of other indebtedness resulting from the failure to pay principal on such other indebtedness prior to its maturity, and certain events of insolvency. If any event of default occurs, the principal of, premium, if any, and accrued interest on all the then outstanding Senior Notes may become due and payable immediately. As of
December 31, 2012
, we were in compliance with all applicable financial covenants under the Senior Notes.
Amended Secured Revolving Credit Facility.
On November 3, 2010, the Operating Partnership and certain subsidiaries of the Operating Partnership (together with the Operating Partnership, the “Borrowers”) entered into a secured revolving credit facility with certain lenders as set forth in the related credit agreement and Bank of America, N.A., as Administrative Agent, Swing Line Lender and L/C Issuer (each as defined in such credit agreement). On February 10, 2012, the Borrowers amended the secured revolving credit facility (the “Amended Secured Revolving Credit Facility”) to increase the borrowing capacity from $100.0 million to $200.0 million (up to $20.0 million of which may be utilized for letters of credit) and to include an accordion feature that allows the Borrowers to increase borrowing availability under the Amended Secured Revolving Credit Facility by up to an additional $150.0 million, subject to certain terms and conditions. On September 20, 2012, the Borrowers utilized the accordion feature to increase the borrowing capacity to $230.0 million. The Amended Secured Revolving Credit Facility is secured by, among other things, a first priority lien against certain of the properties owned by certain of our subsidiaries. The obligations of the Borrowers under the Amended Secured Revolving Credit Facility are guaranteed by us and certain of our subsidiaries. Borrowing availability under the Amended Secured Revolving Credit Facility is subject to a borrowing base calculation based on, among other factors, the lesser of (i) the mortgageability cash flow (as such term is defined in the credit agreement relating to the Amended Secured Revolving Credit Facility) or (ii) the appraised value, in each case of the properties securing the Amended Secured Revolving Credit Facility. Borrowing availability under the Amended Secured Revolving Credit Facility terminates, and all borrowings mature, on February 10, 2015, subject to a one-year extension option. As of
December 31, 2012
, there was
$92.5 million
outstanding under the Amended Secured Revolving Credit Facility and
$109.1 million
available for borrowing.
38
Borrowings under the Amended Secured Revolving Credit Facility bear interest on the outstanding principal amount at a rate equal to an applicable percentage plus, at the Borrowers’ option, either (a) LIBOR or (b) a base rate determined as the greater of (i) the federal funds rate plus 0.5%, (ii) the prime rate, and (iii) one-month LIBOR plus 1.0% (the “Base Rate”). The applicable percentage for borrowings will vary based on the Consolidated Leverage Ratio, as defined in the credit agreement, and will range from 3.00% to 4.00% per annum for LIBOR based borrowings and 2.00% to 3.00% per annum for borrowings at the Base Rate. As of December 31, 2012, the interest rate on the Amended Secured Revolving Credit Facility was 3.71%. In addition, the Borrowers are required to pay a facility fee to the lenders equal to between 0.35% and 0.50% per annum based on the amount of unused borrowings under the Amended Secured Revolving Credit Facility. During the year ended
December 31, 2012
, we incurred $0.5 million in interest expense on amounts outstanding under the Amended Secured Revolving Credit Facility and $0.9 million of unused facility fees.
The Amended Secured Revolving Credit Facility contains customary covenants that include restrictions on the ability to make acquisitions and other investments, pay dividends, incur additional indebtedness, engage in non-healthcare related business activities, enter into transactions with affiliates and sell or otherwise transfer certain assets as well as customary events of default. The Amended Secured Revolving Credit Facility also requires that we, through the Borrowers, comply with specified financial covenants, which include a maximum leverage ratio, a minimum fixed charge coverage ratio and a minimum tangible net worth requirement. As of
December 31, 2012
, we were in compliance with all applicable financial covenants under the Amended Secured Revolving Credit Facility.
Mortgage Indebtedness
Of our
119
properties held for investment, 25 are subject to mortgage indebtedness to third parties that, as of
December 31, 2012
, totaled approximately $
152.3 million
. As of
December 31, 2012
and
December 31, 2011
, our mortgage notes payable consisted of the following (dollars in thousands):
|
Interest Rate Type
|
Book Value as of
December 31, 2012 |
Book Value as of
December 31, 2011 (1) |
Weighted Average
Interest Rate at December 31, 2012 |
Maturity
Date |
|||||||||
|
Fixed Rate
|
$
|
94,373
|
|
$
|
94,783
|
|
4.43
|
%
|
August 2015 - June 2047
|
||||
|
Variable Rate
(2)
|
57,949
|
|
59,159
|
|
5.00
|
%
|
August 2015
|
||||||
|
$
|
152,322
|
|
$
|
153,942
|
|
4.65
|
%
|
||||||
|
(1)
|
Book value balance for mortgage indebtedness includes mortgage premium of $0.5 million as of December 31, 2011.
|
|
(2)
|
Contractual interest rates under variable rate mortgages are equal to the 90-day LIBOR plus 4.0% (subject to a 1.0% LIBOR floor).
|
Capital Expenditures
For the years ended
December 31, 2012
and 2011 and for the period from the
Separation Date through December 31, 2010
, our aggregate capital expenditures were $14,000, $9,000 and $94,000, respectively, which were primarily for corporate office needs. There are no present plans for the improvement or development of any unimproved or undeveloped property; however, from time to time we may agree to fund improvements our tenants make at our facilities. Accordingly, we anticipate that our aggregate capital expenditure requirements for the next 12 months will not exceed $3.0 million, and that such expenditures will principally be for improvements to our facilities and result in incremental rental income.
Dividends
We paid dividends of
$48.9 million
during the year ended
December 31, 2012
. On
January 7, 2013
, our board of directors declared a quarterly cash dividend of
$0.34
per share of common stock. The dividend was paid on
February 28, 2013
to stockholders of record as of
February 15, 2013
.
Concentration of Credit Risk
Concentrations of credit risks arise when a number of operators, tenants or obligors related to our investments are engaged in similar business activities, or activities in the same geographic region, or have similar economic features that would cause their ability to meet contractual obligations, including those to us, to be similarly affected by changes in economic conditions. We regularly monitor our portfolio to assess potential concentrations of risks.
Genesis
Effective December 1, 2012, Sun was acquired by Genesis, becoming a wholly owned subsidiary of Genesis. In connection with this transaction, we obtained a parent guaranty from Genesis to replace the then-existing Sun guaranty of the lease obligations of its subsidiaries that are tenants under our lease agreements. As of
December 31, 2012
,
85
of our
119
real
39
estate properties held for investment and our one asset held for sale were leased to subsidiaries of Genesis. During the
years
ended
December 31, 2012
and 2011,
71%
and
84%
, respectively, of our total revenues were derived from these leases. As of December 31, 2010, all of our real estate properties were leased to Sun, and all of our rental revenues were derived from these leases. Prior to December 1, 2012, Sun was subject to the reporting requirements of the SEC and was required to file with the SEC annual reports containing audited financial information and quarterly reports containing unaudited financial information. Genesis is not an SEC registrant and is not subject to SEC reporting requirements. As of December 31, 2012, Genesis and its subsidiaries, operated or managed
382
skilled nursing centers,
36
assisted or independent living centers and
8
mental health centers across
30
states. Genesis also provides rehabilitation therapy services to over
1,500
affiliated and non-affiliated centers in
44
states. Genesis’s net revenues and adjusted normalized earnings before interest, taxes, depreciation, amortization and rent were
$3.1 billion
and
$359.0 million
, respectively, for the year ended
December 31, 2012
,
$2.7 billion
and
$363.6 million
, respectively, for the year ended
December 31, 2011
, and
$2.5 billion
and $
307.6 million
, respectively for the year ended December 31, 2010. As of
December 31, 2012
and 2011, Genesis's long-term debt, net of cash, totaled
$407.8 million
and
$85.1 million
, respectively. As of
December 31, 2012
and 2011, Genesis had approximately
$132.8 million
and
$129.5 million
, respectively, in liquidity, consisting of unrestricted cash and cash equivalents and available borrowings under its revolving credit facility.
We have presented below unaudited summary financial information for Genesis as of
December 31, 2012
and 2011 and for the years ended
December 31, 2012
, 2011 and 2010. We will make the Genesis audited financial statements available by filing those financial statements with the SEC as an exhibit to a current report on Form 8-K. As described above, Genesis has provided a parent guaranty of the lease obligations of its subsidiaries that are tenants under our lease agreements. The summary financial information presented below has been provided by Genesis, remains subject to adjustment in connection with the completion and issuance of Genesis's audited financial statements and has not been independently verified by us. We have no reason to believe that such information is inaccurate in any material respect.
|
Year Ended December 31,
(unaudited)
(in thousands)
|
|||||||||||
|
2012
|
2011
|
2010
|
|||||||||
|
Statements of Operations:
|
|||||||||||
|
Revenues
|
$
|
3,080,784
|
|
$
|
2,745,760
|
|
$
|
2,506,724
|
|
||
|
Operating expenses
|
2,770,696
|
|
2,403,709
|
|
2,226,396
|
|
|||||
|
Net income (loss)
|
(171,274
|
)
|
94,723
|
|
21,916
|
|
|||||
|
As of December 31,
(unaudited)
(in thousands)
|
|||||||||||
|
2012
|
2011
|
||||||||||
|
Balance Sheets:
|
|||||||||||
|
Cash and cash equivalents
|
$
|
50,218
|
|
$
|
50,916
|
|
|||||
|
Total current assets
|
876,012
|
|
617,280
|
|
|||||||
|
Total current liabilities
|
640,255
|
|
427,029
|
|
|||||||
|
Long-term debt, excluding current portion
|
446,302
|
|
134,158
|
|
|||||||
|
Capital lease obligations, excluding current portion
|
1,024,340
|
|
351,973
|
|
|||||||
|
Financing obligation
|
2,668,793
|
|
2,424,979
|
|
|||||||
Other than our significant tenant concentrations, management believes our current portfolio is reasonably diversified across healthcare related real estate and geographical location and does not contain any other significant concentration of credit risks. Our portfolio of
119
real estate properties held for investment as of December 31, 2012 is diversified by location across
27
states. The properties in any one state did not account for more than
14%
,
16%
and 19%, respectively, of our total rental revenue during the
years
ended
December 31, 2012
and 2011 and for the period from the
Separation Date through December 31, 2010
.
40
Skilled Nursing Facility Reimbursement Rates
Medicare reimburses skilled nursing facilities for Medicare Part A services under the Prospective Payment System (“PPS”), as implemented pursuant to the Balanced Budget Act of 1997 and modified pursuant to subsequent laws, most recently the Patient Protection and Affordable Care Act of 2010 (the “Affordable Care Act”). PPS regulations predetermine a payment amount per patient, per day, based on a market basket index calculated for all covered costs. The amount to be paid is determined by classifying each patient into one of 66 Resource Utilization Group (“RUG”) categories that represent the level of services required to treat different conditions and levels of acuity.
The current system of 66 RUG categories, or Resource Utilization Group version IV (“RUG IV”), became effective as of October 1, 2010. RUG IV resulted from research performed by CMS and was part of CMS’s continuing effort to increase the correlation of the cost of services to the condition of individual patients.
On July 29, 2011, CMS released the 2011 CMS Final Rule regarding 2012 Medicare payment rates for skilled nursing facilities, which became effective October 1, 2011. Based on the 2011 CMS Final Rule, the fiscal year 2012 Medicare reimbursement rates for skilled nursing facilities were reduced by 11.1%. On July 27, 2012, CMS released final fiscal year 2013 Medicare rates for skilled nursing facilities providing a net increase of 1.8% over fiscal year 2012 payments (comprised of a market basket increase of 2.5% less the productivity adjustment of 0.7%), which we refer to as the 2012 CMS Final Rule.
In response to the 2011 CMS Final Rule, many of our tenants undertook cost and patient mix mitigation activities intended to partially offset the impact of the 2011 CMS Final Rules. Although there has been no negative impact on our tenants’ ability to pay their lease obligations to date, if Genesis and our other skilled nursing facility tenants are unable to continue to mitigate the impact of the CMS Final Rules as expected, their business and financial results may be adversely impacted, which will adversely affect our business, financial position or results of operations if they are unable to timely make their rental payments to us.
Obligations and Commitments
The following table summarizes our contractual obligations and commitments in future years, including our Senior Notes, Amended Secured Revolving Credit Facility and our mortgage indebtedness to third parties on certain of our properties that, as of
December 31, 2012
, totaled approximately
$152.3 million
. The following table is presented as of
December 31, 2012
(in thousands):
|
|
|
Payments Due During the Years Ended December 31,
|
|||||||||||||||||||||||||
|
|
Total
|
2013
|
2014
|
2015
|
2016
|
2017
|
After 2017
|
||||||||||||||||||||
|
Mortgage indebtedness
(1)
|
$
|
191,805
|
|
$
|
11,018
|
|
$
|
11,023
|
|
$
|
91,614
|
|
$
|
3,963
|
|
$
|
3,963
|
|
$
|
70,224
|
|
||||||
|
Amended Secured Revolving Credit Facility
|
92,500
|
|
—
|
|
—
|
|
92,500
|
|
—
|
|
—
|
|
—
|
|
|||||||||||||
|
Senior Notes
(2)
|
483,436
|
|
26,406
|
|
26,406
|
|
26,406
|
|
26,406
|
|
26,406
|
|
351,406
|
|
|||||||||||||
|
Contingent consideration
|
1,300
|
|
1,300
|
|
—
|
|
—
|
|
—
|
|
—
|
|
—
|
|
|||||||||||||
|
Operating lease
|
277
|
|
91
|
|
95
|
|
91
|
|
—
|
|
—
|
|
—
|
|
|||||||||||||
|
Total
|
$
|
769,318
|
|
$
|
38,815
|
|
$
|
37,524
|
|
$
|
210,611
|
|
$
|
30,369
|
|
$
|
30,369
|
|
$
|
421,630
|
|
||||||
|
(1)
|
Mortgage indebtedness includes principal payments and interest payments through the maturity dates. Total interest on mortgage indebtedness, based on contractual rates, is $39.5 million, of which $7.6 million is attributable to variable interest rates.
|
|
(2)
|
Senior Notes includes interest payments payable semi-annually each May 1st and November 1st at a fixed rate of 8.125%. The Senior Notes mature on November 1, 2018. Total interest on the Senior Notes is $158.4 million.
|
Impact of Inflation
Our rental income in future years will be impacted by changes in inflation. Several of our lease agreements provide for an annual rent escalator based on the percentage change in the Consumer Price Index (but not less than zero), subject to minimum or maximum fixed percentages. Our lease agreements with subsidiaries of Genesis provide for a fixed 2.5% annual rent escalator.
Off-Balance Sheet Arrangements
None.
Recently Issued Accounting Standards Updates
41
See Note 2 to the Consolidated Financial Statements in this report for a discussion of recently issued accounting standards.
Quarterly Financial Data
The following table presents our quarterly financial data. This information has been prepared on a basis consistent with that of our audited consolidated financial statements. Our quarterly results of operations for the periods presented are not necessarily indicative of future results of operations. This unaudited quarterly data should be read together with the accompanying consolidated financial statements and related notes thereto (in thousands, except share and per share amounts).
|
For the Year Ended December 31, 2012
|
||||||||||||||||
|
First
Quarter
|
Second Quarter
|
Third
Quarter
|
Fourth Quarter
|
|||||||||||||
|
Operating data
|
||||||||||||||||
|
Total revenues
|
$
|
23,727
|
|
$
|
25,117
|
|
$
|
26,038
|
|
$
|
28,288
|
|
||||
|
Net income
|
4,405
|
|
5,923
|
|
5,226
|
|
3,959
|
|
||||||||
|
Net income per common share-basic
|
0.12
|
|
0.16
|
|
0.14
|
|
0.11
|
|
||||||||
|
Net income per common share-diluted
|
0.12
|
|
0.16
|
|
0.14
|
|
0.11
|
|
||||||||
|
Other data
|
||||||||||||||||
|
Cash flows provided by operations
|
$
|
16,464
|
|
$
|
7,623
|
|
$
|
23,815
|
|
$
|
8,350
|
|
||||
|
Cash flows used in investing activities
|
(40,209
|
)
|
(37,247
|
)
|
(43,744
|
)
|
(97,450
|
)
|
||||||||
|
Cash flows provided by (used in) financing activities
|
(15,830
|
)
|
30,059
|
|
47,296
|
|
75,724
|
|
||||||||
|
Weighted-average number of common shares outstanding, basic
|
37,035,970
|
|
37,147,942
|
|
37,178,162
|
|
37,106,473
|
|
||||||||
|
Weighted-average number of common shares outstanding, diluted:
|
||||||||||||||||
|
Net income and FFO
|
37,058,886
|
|
37,191,687
|
|
37,465,114
|
|
37,594,583
|
|
||||||||
|
AFFO
|
37,284,423
|
|
37,538,337
|
|
37,748,716
|
|
37,917,964
|
|
||||||||
|
FFO
(1)
|
$
|
11,708
|
|
$
|
13,480
|
|
$
|
12,722
|
|
$
|
14,347
|
|
||||
|
Diluted FFO per common share
(1)
|
0.32
|
|
0.36
|
|
0.34
|
|
0.38
|
|
||||||||
|
AFFO
(1)
|
13,995
|
|
15,665
|
|
14,868
|
|
15,759
|
|
||||||||
|
Diluted AFFO per common share
(1)
|
0.38
|
|
0.42
|
|
0.39
|
|
0.42
|
|
||||||||
|
Reconciliation of FFO and AFFO
|
||||||||||||||||
|
Net income
|
$
|
4,405
|
|
$
|
5,923
|
|
$
|
5,226
|
|
$
|
3,959
|
|
||||
|
Add:
|
||||||||||||||||
|
Depreciation of real estate assets
|
7,303
|
|
7,557
|
|
7,496
|
|
7,907
|
|
||||||||
|
Impairment
|
—
|
|
—
|
|
—
|
|
2,481
|
|
||||||||
|
FFO
|
11,708
|
|
13,480
|
|
12,722
|
|
14,347
|
|
||||||||
|
Acquisition pursuit costs
|
491
|
|
381
|
|
367
|
|
415
|
|
||||||||
|
Stock-based compensation
|
2,203
|
|
1,639
|
|
1,907
|
|
2,530
|
|
||||||||
|
Straight-line rental income adjustments
|
(969
|
)
|
(721
|
)
|
(1,167
|
)
|
(2,036
|
)
|
||||||||
|
Amortization of deferred financing costs
|
566
|
|
881
|
|
1,173
|
|
1,180
|
|
||||||||
|
Amortization of debt premium
|
(4
|
)
|
(4
|
)
|
(143
|
)
|
(683
|
)
|
||||||||
|
Non-cash interest income adjustments
|
—
|
|
9
|
|
9
|
|
6
|
|
||||||||
|
AFFO
|
$
|
13,995
|
|
$
|
15,665
|
|
$
|
14,868
|
|
$
|
15,759
|
|
||||
42
|
For the Year Ended December 31, 2011
|
||||||||||||||||
|
First
Quarter
|
Second Quarter
|
Third
Quarter
|
Fourth Quarter
|
|||||||||||||
|
Operating data
|
||||||||||||||||
|
Total revenues
|
$
|
17,601
|
|
$
|
18,805
|
|
$
|
21,470
|
|
$
|
26,349
|
|
||||
|
Net income
|
1,248
|
|
2,087
|
|
2,344
|
|
7,163
|
|
||||||||
|
Net income per common share-basic
|
0.05
|
|
0.08
|
|
0.07
|
|
0.19
|
|
||||||||
|
Net income per common share-diluted
|
0.05
|
|
0.08
|
|
0.07
|
|
0.19
|
|
||||||||
|
Other data
|
||||||||||||||||
|
Cash flows provided by operations
|
$
|
12,458
|
|
$
|
5,470
|
|
$
|
16,581
|
|
$
|
10,196
|
|
||||
|
Cash flows used in investing activities
|
(5,415
|
)
|
(74,019
|
)
|
(113,700
|
)
|
(11,452
|
)
|
||||||||
|
Cash flows provided by (used in) financing activities
|
(1,066
|
)
|
(8,207
|
)
|
150,082
|
|
(12,911
|
)
|
||||||||
|
Weighted-average number of common shares outstanding, basic
|
25,136,140
|
|
25,154,284
|
|
32,986,657
|
|
36,965,431
|
|
||||||||
|
Weighted-average number of common shares outstanding, diluted:
|
||||||||||||||||
|
Net income and FFO
|
25,211,585
|
|
25,226,179
|
|
33,049,621
|
|
37,052,574
|
|
||||||||
|
AFFO
|
25,694,787
|
|
25,480,729
|
|
33,320,262
|
|
37,248,402
|
|
||||||||
|
FFO
(1)
|
$
|
7,334
|
|
$
|
8,377
|
|
$
|
9,194
|
|
$
|
14,528
|
|
||||
|
Diluted FFO per common share
(1)
|
0.29
|
|
0.33
|
|
0.28
|
|
0.39
|
|
||||||||
|
AFFO
(1)
|
9,054
|
|
10,304
|
|
12,525
|
|
15,259
|
|
||||||||
|
Diluted AFFO per common share
(1)
|
0.35
|
|
0.40
|
|
0.38
|
|
0.41
|
|
||||||||
|
Reconciliation of FFO and AFFO
|
||||||||||||||||
|
Net income
|
$
|
1,248
|
|
$
|
2,087
|
|
$
|
2,344
|
|
$
|
7,163
|
|
||||
|
Add:
|
||||||||||||||||
|
Depreciation of real estate assets
|
6,086
|
|
6,290
|
|
6,850
|
|
7,365
|
|
||||||||
|
FFO
|
7,334
|
|
8,377
|
|
9,194
|
|
14,528
|
|
||||||||
|
Acquisition pursuit costs
|
87
|
|
224
|
|
2,643
|
|
264
|
|
||||||||
|
Stock-based compensation
|
1,142
|
|
1,335
|
|
771
|
|
1,351
|
|
||||||||
|
Straight-line rental income adjustments
|
—
|
|
(128
|
)
|
(591
|
)
|
(1,372
|
)
|
||||||||
|
Amortization of deferred financing costs
|
495
|
|
500
|
|
512
|
|
491
|
|
||||||||
|
Amortization of debt premium
|
(4
|
)
|
(4
|
)
|
(4
|
)
|
(3
|
)
|
||||||||
|
AFFO
|
$
|
9,054
|
|
$
|
10,304
|
|
$
|
12,525
|
|
$
|
15,259
|
|
||||
|
(1)
|
We believe that net income as defined by GAAP is the most appropriate earnings measure. We also believe that FFO, as defined by NAREIT, and AFFO (and related per share amounts) are important non-GAAP supplemental measures of operating performance for a REIT. We consider FFO and AFFO to be useful measures for reviewing comparative operating and financial performance because, by excluding gains or losses from real estate dispositions, impairment charges, and real estate depreciation and amortization, and, for AFFO, by excluding non-cash revenues (including straight-line rental income adjustments, amortization of acquired above/below market lease intangibles and non-cash interest income adjustments), non-cash expenses (including stock-based compensation expense, amortization of deferred financing costs and amortization of debt discounts and premiums) and acquisition pursuit costs, FFO and AFFO can help investors compare our operating performance between periods or as compared to other companies. See “—Results of Operations-Funds from Operations and Adjusted Funds from Operations” for further discussion of FFO and AFFO.
|
Our primary market risk exposure is interest rate risk with respect to our indebtedness. As of
December 31, 2012
, this indebtedness included the $
325.0 million
aggregate principal amount of Senior Notes outstanding and $
152.3 million
of mortgage indebtedness to third parties on certain of the properties that our subsidiaries own. Approximately $
57.9 million
of our outstanding mortgage indebtedness as of
December 31, 2012
had a variable interest rate. In addition, as of
December 31, 2012
, we also had
$92.5 million
outstanding under our Amended Secured Revolving Credit Facility and
$109.1 million
available for borrowing. From time to time, we may borrow under the Amended Secured Revolving Credit Facility to finance future investments in properties, including any improvements or renovations of current or newly acquired properties, or for other purposes. Because borrowings under the Amended Secured Revolving Credit Facility bear interest on the outstanding
43
principal amount at a rate equal to an applicable percentage plus, at our option, either (a) LIBOR or (b) a base rate determined as the greater of (i) the federal funds rate plus 0.5%, (ii) the prime rate, and (iii) one-month LIBOR plus 1.0%, the interest rate we will be required to pay on any such borrowings will depend on then applicable rates and may vary. An increase in interest rates could make the financing of any acquisition by us more costly. Rising interest rates could also limit our ability to refinance our debt when it matures or cause us to pay higher interest rates upon refinancing and increase interest expense on refinanced indebtedness. Assuming a 100 basis point increase in the interest rate related to our variable rate debt, and assuming no change in our outstanding debt balance as of
December 31, 2012
, interest expense would increase $1.0 million for the twelve months following
December 31, 2012
. As of
December 31, 2012
, the index underlying our variable rate mortgages was below 100 basis points and if this index would have decreased to zero during the 12 months ended
December 31, 2012
, interest expense on our variable rate debt would decrease by $0.2 million.
We expect to manage our exposure to interest rate risk by maintaining a mix of fixed and variable rates for our indebtedness. We also may manage, or hedge, interest rate risks related to our borrowings by means of interest rate swap agreements, although we are not currently a party to any swap agreements.
The table below summarizes the book values and the weighted-average interest rates of our indebtedness by type as of
December 31, 2012
based on the maturity dates (dollars in thousands):
|
Maturity
|
||||||||||||||||||||||||||||||||
|
2013
|
2014
|
2015
|
2016
|
2017
|
Thereafter
|
Total Book Value
(1)
|
Total Fair Value
|
|||||||||||||||||||||||||
|
Mortgage Indebtedness
|
||||||||||||||||||||||||||||||||
|
Fixed rate
|
$
|
2,660
|
|
$
|
2,789
|
|
$
|
31,216
|
|
$
|
2,138
|
|
$
|
2,230
|
|
$
|
53,340
|
|
$
|
94,373
|
|
$
|
94,735
|
|
||||||||
|
Weighted average effective interest rate
|
4.47
|
%
|
4.46
|
%
|
4.04
|
%
|
3.22
|
%
|
3.18
|
%
|
2.66
|
%
|
4.43
|
%
|
||||||||||||||||||
|
Variable rate
|
$
|
1,286
|
|
$
|
1,357
|
|
$
|
55,306
|
|
$
|
—
|
|
$
|
—
|
|
$
|
—
|
|
$
|
57,949
|
|
$
|
57,824
|
|
||||||||
|
Weighted average effective interest rate
|
5.00
|
%
|
5.00
|
%
|
5.00
|
%
|
—
|
%
|
—
|
%
|
—
|
%
|
5.00
|
%
|
||||||||||||||||||
|
Secured Revolving Credit Facility
|
$
|
—
|
|
$
|
—
|
|
$
|
92,500
|
|
$
|
—
|
|
$
|
—
|
|
$
|
—
|
|
$
|
92,500
|
|
$
|
92,500
|
|
||||||||
|
Weighted average effective interest rate
|
—
|
%
|
—
|
%
|
3.71
|
%
|
—
|
%
|
—
|
%
|
—
|
%
|
3.71
|
%
|
||||||||||||||||||
|
Senior Unsecured Notes
|
$
|
—
|
|
$
|
—
|
|
$
|
—
|
|
$
|
—
|
|
$
|
—
|
|
$
|
325,000
|
|
$
|
325,000
|
|
$
|
345,313
|
|
||||||||
|
Weighted average effective interest rate
|
—
|
%
|
—
|
%
|
—
|
%
|
—
|
%
|
—
|
%
|
7.75
|
%
|
7.75
|
%
|
||||||||||||||||||
(1)
Total book value for Senior Notes does not include premium of $5.7 million as of
December 31, 2012
.
For a discussion of the interest rate risks related to the current capital and credit markets, see Part I, Item 1A, “Risk Factors.”
See the Index to Financial Statements at page F-1 of this 10-K. See also “Item 7. Management’s Discussion and Analysis—Quarterly Financial Data.”
None.
Disclosure Controls and Procedures
As of the end of the period covered by this report, management, including our chief executive officer and chief financial officer, evaluated the effectiveness of the design and operation of our disclosure controls and procedures. Based upon, and as of the date of the evaluation, our chief executive officer and chief financial officer concluded that our disclosure controls and procedures were effective as of December 31, 2012 to ensure that information required to be disclosed in the reports we file or submit under the Exchange Act is recorded, processed, summarized and reported within the time periods specified in the SEC’s
44
rules and forms. Disclosure controls and procedures include, without limitation, controls and procedures designed to ensure that information required to be disclosed by us in the reports we file or submit under the Exchange Act is accumulated and communicated to our management, including our chief executive officer and our chief financial officer, as appropriate to allow timely decisions regarding required disclosure.
Management’s Annual Report on Internal Control Over Financial Reporting
Management is responsible for establishing and maintaining adequate internal control over financial reporting, as such term is defined in Exchange Act Rule 13a−15(f) and 15d−15(f). Under the supervision and with the participation of our management, including our chief executive officer and chief financial officer, we conducted an evaluation of the effectiveness of our internal control over financial reporting using the criteria described in Internal Control—Integrated Framework issued by the Committee of Sponsoring Organizations of the Treadway Commission (“COSO”). Based on our evaluation using the criteria described in Internal Control—Integrated Framework, our management concluded that our internal control over financial reporting was effective as of
December 31, 2012
.
The effectiveness of our internal control over financial reporting as of
December 31, 2012
, has been audited by PricewaterhouseCoopers LLP, an independent registered public accounting firm, as stated in their report which is included herein.
Changes in Internal Control over Financial Reporting
There were no changes in our internal control over financial reporting during the quarter ended
December 31, 2012
that have materially affected or are reasonably likely to materially affect our internal control over financial reporting.
None.
Except as provided below, the information required under Item 10 is incorporated herein by reference to our definitive proxy statement to be filed with the SEC within 120 days after the end of our fiscal year ended
December 31, 2012
in connection with our 2013 Annual Meeting of Stockholders.
Code of Conduct and Ethics
We have adopted a Code of Conduct and Ethics that applies to all of our directors and employees, including our principal executive officer and principal financial officer. Our Code of Conduct and Ethics can be found in the About Sabra—Corporate Governance section of our website at
www.sabrahealth.com
. Waivers from, and amendments to, our Code of Conduct and Ethics that apply to our directors, executive officers or persons performing similar functions will be timely posted in the About Sabra—Corporate Governance section of our website at
www.sabrahealth.com
.
The information required under Item 11 is incorporated herein by reference to our definitive proxy statement to be filed with the SEC within 120 days after the end of our fiscal year ended
December 31, 2012
in connection with our 2013 Annual Meeting of Stockholders.
The information required under Item 12 is incorporated herein by reference to our definitive proxy statement to be filed with the SEC within 120 days after the end of our fiscal year ended
December 31, 2012
in connection with our 2013 Annual Meeting of Stockholders.
45
The information required under Item 13 is incorporated herein by reference to our definitive proxy statement to be filed with the SEC within 120 days after the end of our fiscal year ended
December 31, 2012
in connection with our 2013 Annual Meeting of Stockholders.
The information required under Item 14 is incorporated herein by reference to our definitive proxy statement to be filed with the SEC within 120 days after the end of our fiscal year ended
December 31, 2012
in connection with our 2013 Annual Meeting of Stockholders.
|
(a)
|
Documents filed as part of this 10-K:
|
|
(1)
|
Financial Statements
|
See the Index to Financial Statements at page F-1 of this report.
|
(2)
|
Financial Statement Schedule
|
The following financial statement schedule is included herein at pages F-37 through F-42 of this report:
Schedule III-Real Estate Assets and Accumulated Depreciation
|
(3)
|
Exhibits
|
The following exhibits are filed herewith or are incorporated by reference, as specified below, to exhibits previously filed with the SEC.
46
|
EXHIBIT LIST
|
||
|
Ex.
|
|
Description
|
|
2.1
|
|
Agreement and Plan of Merger, dated as of September 23, 2010, by and between Sun Healthcare Group, Inc. and Sabra Health Care REIT, Inc. (incorporated by reference to Annex A to the proxy statement/prospectus included in Amendment No. 4 to the Registration Statement on Form S-4 (File No. 333-167040) filed by Sabra Health Care REIT, Inc. on September 28, 2010).
|
|
2.2
|
|
Distribution Agreement, dated November 4, 2010, by and among Sun Healthcare Group, Inc., Sabra Health Care REIT, Inc. and SHG Services, Inc. (which has been renamed Sun Healthcare Group, Inc.) (incorporated by reference to Exhibit 2.1 of the Current Report on Form 8-K filed by Sabra Health Care REIT, Inc. on November 5, 2010).†
|
|
2.3
|
|
Purchase and Sale Agreement and Joint Escrow Instructions, dated March 30, 2011, by and between Sabra Health Care REIT, Inc. and CP Sunnyvale Property, Ltd. (incorporated by reference to Exhibit 2.1 of the Current Report on Form 8-K filed by Sabra Health Care REIT, Inc. on May 5, 2011).
|
|
2.4
|
|
Purchase and Sale Agreement and Joint Escrow Instructions, dated July 8, 2011, by and between Peninsula Healthcare Services, LLC; Broadmeadow Investment LLC; Capitol Nursing & Rehabilitation Center, L.L.C.; and Pike Creek Healthcare Services LLC, and Sabra Health Care REIT, Inc. (incorporated by reference to Exhibit 2.1 of the Current Report on Form 8-K filed by Sabra Health Care REIT, Inc. on July 11, 2011).
|
|
3.1
|
|
Articles of Amendment and Restatement of Sabra Health Care REIT, Inc., dated October 20, 2010, filed with the State Department of Assessments and Taxation of the State of Maryland on October 21, 2010 (incorporated by reference to Exhibit 3.1 of the Current Report on Form 8-K filed by Sabra Health Care REIT, Inc. on October 26, 2010).
|
|
3.2
|
|
Amended and Restated Bylaws of Sabra Health Care REIT, Inc. (incorporated by reference to Exhibit 3.2 of the Current Report on Form 8-K filed by Sabra Health Care REIT, Inc. on October 26, 2010).
|
|
4.1
|
Indenture, dated October 27, 2010, among Sabra Health Care Limited Partnership, Sabra Capital Corporation, Sabra Health Care REIT, Inc., the other guarantors named therein, and Wells Fargo Bank, National Association, as Trustee (incorporated by reference to Exhibit 4.1 of the Current Report on Form 8-K filed by Sabra Health Care REIT, Inc. on October 27, 2010).
|
|
|
4.1.1
|
First Supplemental Indenture, dated November 4, 2010, among Sabra Health Care Limited Partnership, Sabra Capital Corporation, Sabra Health Care REIT, Inc., the other subsidiaries of Sabra Health Care REIT, Inc. named therein, the other Guarantors (as defined in the Indenture referred to therein) and Wells Fargo Bank, National Association, as Trustee (incorporated by reference to Exhibit 4.1.1 of the Registration Statement on Form S-4 (File No. 333-171820-26) filed by Sabra Health Care REIT, Inc. on January 21, 2011).
|
|
|
4.1.2
|
Second Supplemental Indenture, dated July 20, 2012, among Sabra Health Care Limited Partnership, Sabra Capital Corporation, Sabra Health Care REIT, Inc., the other subsidiaries of Sabra Health Care REIT, Inc. named therein, the other Guarantors (as defined in the Indenture referred to therein) and Wells Fargo Bank, National Association, as Trustee (incorporated by reference to Exhibit 4.1.2 of the Current Report on Form 8-K filed by Sabra Health Care REIT, Inc. on July 26, 2012).
|
|
|
4.1.3
|
Third Supplemental Indenture, dated September 12, 2012, among Sabra Health Care Limited Partnership, Sabra Capital Corporation, Sabra Health Care REIT, Inc., the other subsidiaries of Sabra Health Care REIT, Inc. named therein, the other Guarantors (as defined in the Indenture referred to therein) and Wells Fargo Bank, National Association, as Trustee (incorporated by reference to Exhibit 4.1.3 of the Registration Statement on Form S-4 (File No. 333-183878) filed by the issuers and guarantors on September 13, 2012).
|
|
|
4.1.4
|
Fourth Supplemental Indenture, dated October 9, 2012, among Sabra Health Care Limited Partnership, Sabra Capital Corporation, Sabra Health Care REIT, Inc., the other subsidiaries of Sabra Health Care REIT, Inc. named therein, the other Guarantors (as defined in the Indenture referred to therein) and Wells Fargo Bank, National Association, as Trustee (incorporated by reference to Exhibit 4.1.4 of Amendment No. 1 to the Registration Statement on Form S-4 (File No. 333-183878) filed by the issuers and guarantors on September 13, 2012).
|
|
|
4.2
|
Form of 8.125% Senior Note due 2018 (included in Exhibit 4.1).
|
|
|
10.1
|
Tax Allocation Agreement, dated as of September 23, 2010, by and among Sun Healthcare Group, Inc., Sabra Health Care REIT, Inc. and SHG Services, Inc. (which has been renamed Sun Healthcare Group, Inc.) (incorporated by reference to Exhibit 10.2 of Amendment No. 3 to the Registration Statement on Form S-4 (File No. 333-167040) filed by Sabra Health Care REIT, Inc. on September 24, 2010).
|
|
47
|
10.2
|
Transition Services Agreement, dated November 4, 2010 and effective as of the effective time of the REIT Conversion Merger, by and between SHG Services, Inc. (which has been renamed Sun Healthcare Group, Inc.) and Sabra Health Care REIT, Inc. (incorporated by reference to Exhibit 10.1 of the Current Report on Form 8-K filed by Sabra Health Care REIT, Inc. on November 5, 2010).
|
|
|
10.3
|
Form of Master Lease Agreement entered into between subsidiaries of SHG Services, Inc. (which has been renamed Sun Healthcare Group, Inc.) and subsidiaries of Sabra Health Care REIT, Inc. that, with certain exceptions, became effective as of the Separation with respect to the 86 properties owned by subsidiaries of Sabra Health Care REIT, Inc. following the Separation and REIT Conversion Merger (incorporated by reference to Exhibit 10.2 of the Current Report on Form 8-K filed by Sabra Health Care REIT, Inc. on November 5, 2010).
|
|
|
10.3.1
|
Form of Amendment to Master Lease Agreement entered into between subsidiaries of Sun Healthcare Group, Inc., subsidiaries of Sabra Health Care REIT, Inc., and Genesis HealthCare LLC, dated December 1, 2012 (incorporated by reference to Exhibit 10.1 of the Current Report on Form 8-K filed by Sabra Health Care REIT, Inc. on December 6, 2012).
|
|
|
10.4
|
Form of Guaranty entered into by Genesis HealthCare LLC in favor of subsidiaries of Sabra Health Care REIT, Inc., as landlords under the Master Lease Agreements, dated December 1, 2012 (incorporated by reference to Exhibit 10.2 of the Current Report on Form 8-K filed by Sabra Health Care REIT, Inc. on December 6, 2012).
|
|
|
10.5
|
Limited Partnership Agreement of Sabra Health Care Limited Partnership, dated as of November 15, 2010 (incorporated by reference to Exhibit 3.4 of the Registration Statement on Form S-4 (File No. 333-171820) filed by the issuers and guarantors on January 21, 2011).
|
|
|
10.6
|
Credit Agreement, dated November 3, 2010, among Sabra Health Care Limited Partnership, Sabra Idaho, LLC, Sabra California II, LLC, Oakhurst Manor Nursing Center LLC, Sunset Point Nursing Center LLC, Sabra New Mexico, LLC, Sabra Ohio, LLC, Sabra Kentucky, LLC, Sabra NC, LLC, Sabra Connecticut II LLC, West Bay Nursing Center LLC and Orchard Ridge Nursing Center LLC, as Borrowers, Sabra Health Care REIT, Inc., as REIT Guarantor, the other guarantors party thereto, the lenders party thereto and Bank of America, N.A., as administrative agent, swing line lender and L/C issuer (incorporated by reference to Exhibit 10.4 of the Current Report on Form 8-K filed by Sabra Health Care REIT, Inc. on November 5, 2010).
|
|
|
10.6.1
|
First Amendment to Credit Agreement, dated February 10, 2012, among Sabra Health Care Limited Partnership, Sabra Idaho, LLC, Sabra California II, LLC, Oakhurst Manor Nursing Center LLC, Sunset Point Nursing Center LLC, Sabra New Mexico, LLC, Sabra Ohio, LLC, Sabra Kentucky, LLC, Sabra NC, LLC, Sabra Connecticut II LLC, West Bay Nursing Center LLC, Orchard Ridge Nursing Center LLC, Connecticut Holdings I LLC, Sabra Health Care Delaware, LLC, Sabra Texas Properties, L.P., as Borrowers, Sabra Health Care REIT, Inc., as REIT Guarantor, the lenders party thereto and Bank of America, N.A., as administrative agent, swing line lender and L/C issuer (incorporated by reference to Exhibit 10.1 of the Current Report on Form 8-K filed by Sabra Health Care REIT, Inc. on February 14, 2012).
|
|
|
10.6.2
|
Lender Joinder Agreement, dated September 20, 2012, among Credit Agricole Corporate and Investment Bank, Sabra Health Care Limited Partnership, the other subsidiaries that are borrowers under the Credit Agreement, the guarantors, the lenders and Bank of America, N.A., as administrative agent (incorporated by reference to Exhibit 10.5.2 of Amendment No. 1 to the Registration Statement on Form S-4 (File No. 333-183878) filed by the issuers and guarantors on October 12, 2012).
|
|
|
10.7
|
Registration Rights Agreement, dated July 26, 2012, by and among Sabra Health Care Limited Partnership, Sabra Capital Corporation, Sabra Health Care REIT, Inc., the other guarantors listed therein and Merrill Lynch, Pierce, Fenner & Smith Incorporated, on behalf of itself and as representative of the initial purchasers name therein (incorporated by reference to Exhibit 10.1 of the Current Report on Form 8-K filed by Sabra Health Care REIT, Inc. on July 26, 2012).
|
|
|
10.8
|
Form of Indemnification Agreement entered into with each of the directors and officers of Sabra Health Care REIT, Inc. (incorporated by reference to Exhibit 10.5 of the Current Report on Form 8-K filed by Sabra Health Care REIT, Inc. on November 5, 2010).
|
|
|
10.9+
|
Employment Agreement, dated November 22, 2010, by and between Richard K. Matros and Sabra Health Care REIT, Inc. (incorporated by reference to Exhibit 10.1 of the Current Report on Form 8-K filed by Sabra Health Care REIT, Inc. on November 24, 2010).
|
|
|
10.10+
|
Employment Agreement, dated November 22, 2010, by and between Harold W. Andrews, Jr. and Sabra Health Care REIT, Inc. (incorporated by reference to Exhibit 10.2 of the Current Report on Form 8-K filed by Sabra Health Care REIT, Inc. on November 24, 2010).
|
|
48
|
10.11+
|
Employment Agreement, dated November 22, 2010, by and between Talya Nevo-Hacohen and Sabra Health Care REIT, Inc. (incorporated by reference to Exhibit 10.3 of the Current Report on Form 8-K filed by Sabra Health Care REIT, Inc. on November 24, 2010).
|
|
|
10.12+
|
Sabra Health Care REIT, Inc. 2009 Performance Incentive Plan (incorporated by reference to Exhibit 4.1 of the Registration Statement on Form S-8 filed by Sabra Health Care REIT, Inc. on December 22, 2010).
|
|
|
10.12.1+
|
Form of Notice and Terms and Conditions of Stock Unit Award (Time-Based Stock Units) (incorporated by reference to Exhibit 10.10.1 of the Registration Statement on Form S-4 (File No. 333-171820-26) filed by Sabra Health Care REIT, Inc. on January 21, 2011).
|
|
|
10.12.2+
|
Form of Notice and Terms and Conditions of Stock Unit Award (FFO Units) (incorporated by reference to Exhibit 10.10.2 of the Registration Statement on Form S-4 (File No. 333-171820-26) filed by Sabra Health Care REIT, Inc. on January 21, 2011).
|
|
|
10.12.3+
|
Form of Notice and Terms and Conditions of Stock Unit Award (TSR Units) (incorporated by reference to Exhibit 10.10.3 of the Registration Statement on Form S-4 (File No. 333-171820-26) filed by Sabra Health Care REIT, Inc. on January 21, 2011).
|
|
|
10.12.4+
|
Form of Notice and Terms and Conditions of Stock Unit Award (for Non-Employee Directors) (incorporated by reference to Exhibit 10.10.4 of the Registration Statement on Form S-4 (File No. 333-171820-26) filed by Sabra Health Care REIT, Inc. on January 21, 2011).
|
|
|
10.12.5+
|
Non-Employee Directors Stock-for-Fees Program (incorporated by reference to Exhibit 10.10.5 of the Registration Statement on Form S-4 (File No. 333-171820-26) filed by Sabra Health Care REIT, Inc. on January 21, 2011).
|
|
|
10.13+
|
Sabra Health Care REIT, Inc. 2004 Equity Incentive Plan (incorporated by reference to Exhibit 4.2 of the Registration Statement on Form S-8 (File No. 333-171350) filed by Sabra Health Care REIT, Inc. on December 22, 2010).
|
|
|
10.14+
|
Sabra Health Care REIT, Inc. Directors' Compensation Policy (incorporated by reference to Exhibit 10.2 of the Quarterly Report on Form 10-Q filed by Sabra Health Care REIT, Inc. on May 8, 2012).
|
|
|
10.15+
|
Sabra Health Care REIT, Inc. 2012 Bonus Plan (incorporated by reference to Exhibit 10.1 of the Quarterly Report on Form 10-Q filed by Sabra Health Care REIT, Inc. on May 8, 2012).
|
|
|
10.16*+
|
Sabra Health Care REIT, Inc. 2013 Bonus Plan.
|
|
|
12.1*
|
|
Statement Re: Computation of Ratios of Earnings to Fixed Charges.
|
|
21.1*
|
List of Subsidiaries of Sabra Health Care REIT, Inc.
|
|
|
23.1*
|
Consent of PricewaterhouseCoopers LLP.
|
|
|
31.1*
|
|
Certification of Chief Executive Officer pursuant to Section 302 of the Sarbanes-Oxley Act of 2002.
|
|
31.2*
|
|
Certification of Chief Financial Officer pursuant to Section 302 of the Sarbanes-Oxley Act of 2002.
|
|
32.1*
|
|
Certification of Chief Executive Officer pursuant to 18 U.S.C. 1350, as created by Section 906 of the Sarbanes-Oxley Act of 2002.
|
|
32.2*
|
|
Certification of Chief Financial Officer pursuant to 18 U.S.C. 1350, as created by Section 906 of the Sarbanes-Oxley Act of 2002.
|
|
101.INS*
|
XBRL Instance Document.
|
|
|
101.SCH*
|
XBRL Taxonomy Extension Schema Document.
|
|
|
101.CAL*
|
XBRL Taxonomy Extension Calculation Linkbase Document.
|
|
|
101.DEF*
|
XBRL Taxonomy Extension Definition Linkbase Document.
|
|
49
|
101.LAB*
|
XBRL Taxonomy Extension Label Linkbase Document.
|
|
|
101.PRE*
|
XBRL Taxonomy Extension Presentation Linkbase Document.
|
|
|
*
|
Filed herewith.
|
|
+
|
Designates a management compensation plan, contract or arrangement.
|
|
†
|
Schedules and exhibits have been omitted pursuant to Item 601(b)(2) of Regulation S-K. The Registrants hereby agree to furnish supplementally copies of any of the omitted schedules and exhibits upon request by the Securities and Exchange Commission.
|
50
INDEX TO CONSOLIDATED FINANCIAL STATEMENTS
|
Consolidated Financial Statements
|
|
|
Financial Statement Schedule
|
|
|
All other schedules are omitted because they are not applicable or the required information is shown in the financial statements or notes thereto.
|
|
F-1
REPORT OF INDEPENDENT REGISTERED PUBLIC ACCOUNTING FIRM
To The Board of Directors and Stockholders
Sabra Health Care REIT, Inc.
In our opinion, the consolidated financial statements listed in the accompanying index present fairly, in all material respects, the financial position of Sabra Health Care REIT, Inc. and its subsidiaries at December 31, 2012 and 2011, and the results of their operations and their cash flows for the years ended December 31, 2012 and 2011 and for the period from November 15, 2010 to December 31, 2010 in conformity with accounting principles generally accepted in the United States of America. In addition, in our opinion, the financial statement schedule listed in the accompanying index presents fairly, in all material respects, the information set forth therein when read in conjunction with the related consolidated financial statements. Also in our opinion, the Company maintained, in all material respects, effective internal control over financial reporting as of December 31, 2012, based on criteria established in Internal Control - Integrated Framework issued by the Committee of Sponsoring Organizations of the Treadway Commission (COSO). The Company’s management is responsible for these financial statements and financial statement schedule, for maintaining effective internal control over financial reporting and for its assessment of the effectiveness of internal control over financial reporting, included in Management’s Report on Internal Control Over Financial Reporting appearing under Item 9A. Our responsibility is to express opinions on these financial statements, on the financial statement schedule, and on the Company’s internal control over financial reporting based on our audits (which were integrated audits in 2012 and 2011). We conducted our audits in accordance with the standards of the Public Company Accounting Oversight Board (United States). Those standards require that we plan and perform the audits to obtain reasonable assurance about whether the financial statements are free of material misstatement and whether effective internal control over financial reporting was maintained in all material respects. Our audits of the financial statements included examining, on a test basis, evidence supporting the amounts and disclosures in the financial statements, assessing the accounting principles used and significant estimates made by management, and evaluating the overall financial statement presentation. Our audit of internal control over financial reporting included obtaining an understanding of internal control over financial reporting, assessing the risk that a material weakness exists, and testing and evaluating the design and operating effectiveness of internal control based on the assessed risk. Our audits also included performing such other procedures as we considered necessary in the circumstances. We believe that our audits provide a reasonable basis for our opinions.
A company’s internal control over financial reporting is a process designed to provide reasonable assurance regarding the reliability of financial reporting and the preparation of financial statements for external purposes in accordance with generally accepted accounting principles. A company’s internal control over financial reporting includes those policies and procedures that (i) pertain to the maintenance of records that, in reasonable detail, accurately and fairly reflect the transactions and dispositions of the assets of the company; (ii) provide reasonable assurance that transactions are recorded as necessary to permit preparation of financial statements in accordance with generally accepted accounting principles, and that receipts and expenditures of the company are being made only in accordance with authorizations of management and directors of the company; and (iii) provide reasonable assurance regarding prevention or timely detection of unauthorized acquisition, use, or disposition of the company’s assets that could have a material effect on the financial statements.
Because of its inherent limitations, internal control over financial reporting may not prevent or detect misstatements. Also, projections of any evaluation of effectiveness to future periods are subject to the risk that controls may become inadequate because of changes in conditions, or that the degree of compliance with the policies or procedures may deteriorate.
/s/ PricewaterhouseCoopers LLP
Irvine, California
March 13, 2013
F-2
SABRA HEALTH CARE REIT, INC.
CONSOLIDATED BALANCE SHEETS
(in thousands, except share and per share amounts)
|
December 31,
|
|||||||
|
2012
|
2011
|
||||||
|
|
|
||||||
|
Assets
|
|||||||
|
Real estate investments, net of accumulated depreciation of $129,479 and $107,331 as of December 31, 2012 and 2011, respectively
|
$
|
827,135
|
|
$
|
653,377
|
|
|
|
Loans receivable, net
|
12,017
|
|
—
|
|
|||
|
Cash and cash equivalents
|
17,101
|
|
42,250
|
|
|||
|
Restricted cash
|
4,589
|
|
6,093
|
|
|||
|
Deferred tax assets
|
24,212
|
|
25,540
|
|
|||
|
Assets held for sale, net
|
2,215
|
|
5,243
|
|
|||
|
Prepaid expenses, deferred financing costs and other assets
|
29,613
|
|
17,147
|
|
|||
|
Total assets
|
$
|
916,882
|
|
$
|
749,650
|
|
|
|
Liabilities and stockholders’ equity
|
|||||||
|
Mortgage notes payable
|
$
|
152,322
|
|
$
|
153,942
|
|
|
|
Secured revolving credit facility
|
92,500
|
|
—
|
|
|||
|
Senior unsecured notes payable
|
330,666
|
|
225,000
|
|
|||
|
Liabilities related to assets held for sale
|
—
|
|
4,485
|
|
|||
|
Accounts payable and accrued liabilities
|
11,694
|
|
14,110
|
|
|||
|
Tax liability
|
24,212
|
|
25,540
|
|
|||
|
Total liabilities
|
611,394
|
|
423,077
|
|
|||
|
Commitments and contingencies (Note 17)
|
|
|
|||||
|
Stockholders’ equity
|
|||||||
|
Preferred stock, $.01 par value; 10,000,000 shares authorized, zero shares issued and outstanding as of December 31, 2012 and 2011
|
—
|
|
—
|
|
|||
|
Common stock, $.01 par value; 125,000,000 shares authorized, 37,099,209 and 36,891,712 shares issued and outstanding as of
December 31, 2012 and 2011, respectively |
371
|
|
369
|
|
|||
|
Additional paid-in capital
|
353,861
|
|
344,995
|
|
|||
|
Cumulative distributions in excess of net income
|
(48,744
|
)
|
(18,791
|
)
|
|||
|
Total stockholders’ equity
|
305,488
|
|
326,573
|
|
|||
|
Total liabilities and stockholders’ equity
|
$
|
916,882
|
|
$
|
749,650
|
|
|
See accompanying notes to consolidated financial statements.
F-3
SABRA HEALTH CARE REIT, INC.
(in thousands, except share and per share amounts)
|
Year Ended December 31,
|
Period from November 15, 2010 to December 31, 2010
|
|||||||||||
|
|
2012
|
2011
|
||||||||||
|
Revenues:
|
||||||||||||
|
Rental income
|
$
|
101,742
|
|
$
|
80,678
|
|
$
|
8,781
|
|
|||
|
Interest income
|
1,428
|
|
3,547
|
|
14
|
|
||||||
|
|
|
|
||||||||||
|
Total revenues
|
103,170
|
|
84,225
|
|
8,795
|
|
||||||
|
|
|
|
||||||||||
|
Expenses:
|
||||||||||||
|
Depreciation and amortization
|
30,263
|
|
26,591
|
|
3,134
|
|
||||||
|
Interest
|
37,005
|
|
30,319
|
|
3,859
|
|
||||||
|
General and administrative
|
16,104
|
|
14,473
|
|
1,553
|
|
||||||
|
Impairment
|
2,481
|
|
—
|
|
—
|
|
||||||
|
|
|
|
||||||||||
|
Total expenses
|
85,853
|
|
71,383
|
|
8,546
|
|
||||||
|
|
|
|
||||||||||
|
Other income
|
2,196
|
|
—
|
|
—
|
|
||||||
|
Income before income taxes
|
19,513
|
|
12,842
|
|
249
|
|
||||||
|
Income tax expense
|
—
|
|
—
|
|
242
|
|
||||||
|
Net income
|
$
|
19,513
|
|
$
|
12,842
|
|
$
|
7
|
|
|||
|
|
|
|
||||||||||
|
Net income per common share, basic
|
$
|
0.53
|
|
$
|
0.43
|
|
$
|
—
|
|
|||
|
|
|
|
||||||||||
|
Net income per common share, diluted
|
$
|
0.52
|
|
$
|
0.43
|
|
$
|
—
|
|
|||
|
|
|
|
||||||||||
|
Weighted-average number of common shares outstanding, basic
|
37,061,111
|
|
30,109,417
|
|
25,110,936
|
|
||||||
|
|
|
|
||||||||||
|
Weighted-average number of common shares outstanding, diluted
|
37,321,517
|
|
30,171,225
|
|
25,186,988
|
|
||||||
See accompanying notes to consolidated financial statements.
F-4
SABRA HEALTH CARE REIT, INC.
CONSOLIDATED STATEMENTS OF STOCKHOLDERS’ EQUITY
(in thousands, except share and per share amounts)
|
|
Common Stock
|
Additional
Paid-in Capital |
Cumulative Distributions in Excess of Net Income
|
Total
Stockholders’ Equity |
||||||||||||||
|
|
Shares
|
Amounts
|
||||||||||||||||
|
Separation and REIT Conversion
|
||||||||||||||||||
|
Merger, November 15, 2010
|
25,061,072
|
|
$
|
251
|
|
$
|
176,940
|
|
$
|
—
|
|
$
|
177,191
|
|
||||
|
Net income
|
—
|
|
—
|
|
—
|
|
7
|
|
7
|
|
||||||||
|
Amortization of stock based compensation
|
—
|
|
—
|
|
335
|
|
—
|
|
335
|
|
||||||||
|
Balance, December 31, 2010
|
25,061,072
|
|
251
|
|
177,275
|
|
7
|
|
177,533
|
|
||||||||
|
Net income
|
—
|
|
—
|
|
—
|
|
12,842
|
|
12,842
|
|
||||||||
|
Amortization of stock based compensation
|
—
|
|
—
|
|
4,600
|
|
—
|
|
4,600
|
|
||||||||
|
Stock issuance
|
11,830,640
|
|
118
|
|
163,120
|
|
—
|
|
163,238
|
|
||||||||
|
Common dividends ($0.96 per share)
|
—
|
|
—
|
|
—
|
|
(31,640
|
)
|
(31,640
|
)
|
||||||||
|
Balance, December 31, 2011
|
36,891,712
|
|
369
|
|
344,995
|
|
(18,791
|
)
|
326,573
|
|
||||||||
|
Net income
|
—
|
|
—
|
|
—
|
|
19,513
|
|
19,513
|
|
||||||||
|
Amortization of stock based compensation
|
—
|
|
—
|
|
8,817
|
|
—
|
|
8,817
|
|
||||||||
|
Stock issuance
|
207,497
|
|
2
|
|
49
|
|
—
|
|
51
|
|
||||||||
|
Common dividends ($1.32 per share)
|
—
|
|
—
|
|
—
|
|
(49,466
|
)
|
(49,466
|
)
|
||||||||
|
Balance, December 31, 2012
|
37,099,209
|
|
$
|
371
|
|
$
|
353,861
|
|
$
|
(48,744
|
)
|
$
|
305,488
|
|
||||
See accompanying notes to consolidated financial statements.
F-5
SABRA HEALTH CARE REIT, INC.
(in thousands)
|
Year Ended December 31,
|
Period from November 15, 2010 to December 31, 2010
|
||||||||||
|
|
2012
|
2011
|
|||||||||
|
Cash flows from operating activities:
|
|
||||||||||
|
Net income
|
$
|
19,513
|
|
$
|
12,842
|
|
$
|
7
|
|
||
|
Adjustments to reconcile net income to net cash provided by operating activities:
|
|
||||||||||
|
Depreciation and amortization
|
30,263
|
|
26,591
|
|
3,134
|
|
|||||
|
Non-cash interest income adjustments
|
24
|
|
—
|
|
—
|
|
|||||
|
Amortization of deferred financing costs
|
3,800
|
|
1,998
|
|
230
|
|
|||||
|
Stock-based compensation expense
|
8,279
|
|
4,600
|
|
335
|
|
|||||
|
Amortization of premium on notes payable
|
(500
|
)
|
(15
|
)
|
(2
|
)
|
|||||
|
Amortization of premium on senior unsecured notes
|
(334
|
)
|
—
|
|
—
|
|
|||||
|
Deferred taxes
|
—
|
|
—
|
|
242
|
|
|||||
|
Straight-line rental income adjustments
|
(4,893
|
)
|
(2,092
|
)
|
—
|
|
|||||
|
Impairment charge
|
2,481
|
|
—
|
|
—
|
|
|||||
|
Changes in operating assets and liabilities:
|
|
|
|||||||||
|
Prepaid expenses and other assets
|
(82
|
)
|
(1,035
|
)
|
(609
|
)
|
|||||
|
Accounts payable and accrued liabilities
|
1,321
|
|
5,695
|
|
3,276
|
|
|||||
|
Restricted cash
|
(3,620
|
)
|
(3,879
|
)
|
(21
|
)
|
|||||
|
|
|
|
|||||||||
|
Net cash provided by operating activities
|
56,252
|
|
44,705
|
|
6,592
|
|
|||||
|
Cash flows from investing activities:
|
|
||||||||||
|
Cash received in the Separation
|
—
|
|
—
|
|
67,134
|
|
|||||
|
Acquisitions of real estate
|
(205,424
|
)
|
(204,500
|
)
|
—
|
|
|||||
|
Origination of loans receivable
|
(22,180
|
)
|
—
|
|
—
|
|
|||||
|
Acquisition of note receivable
|
—
|
|
(5,348
|
)
|
—
|
|
|||||
|
Additions to real estate
|
(1,046
|
)
|
(86
|
)
|
(16
|
)
|
|||||
|
Repayment of note receivable
|
10,000
|
|
5,348
|
|
—
|
|
|||||
|
|
|
|
|||||||||
|
Net cash (used in) provided by investing activities
|
(218,650
|
)
|
(204,586
|
)
|
67,118
|
|
|||||
|
Cash flows from financing activities:
|
|
||||||||||
|
Proceeds from secured revolving credit facility
|
135,000
|
|
—
|
|
—
|
|
|||||
|
Proceeds from mortgage notes payable
|
56,651
|
|
—
|
|
10,000
|
|
|||||
|
Proceeds from issuance of senior unsecured notes
|
106,000
|
|
—
|
|
—
|
|
|||||
|
Payment of Separation-related obligations
|
—
|
|
—
|
|
(9,081
|
)
|
|||||
|
Payments on secured revolving credit facility
|
(42,500
|
)
|
—
|
|
—
|
|
|||||
|
Principal payments on mortgage notes payable
|
(62,226
|
)
|
(3,027
|
)
|
(235
|
)
|
|||||
|
Payments of deferred financing costs
|
(6,800
|
)
|
(677
|
)
|
(161
|
)
|
|||||
|
Issuance of common stock
|
53
|
|
163,242
|
|
—
|
|
|||||
|
Dividends paid
|
(48,929
|
)
|
(31,640
|
)
|
—
|
|
|||||
|
|
|
|
|||||||||
|
Net cash provided by financing activities
|
137,249
|
|
127,898
|
|
523
|
|
|||||
|
|
|
|
|||||||||
|
Net (decrease) increase in cash and cash equivalents
|
(25,149
|
)
|
(31,983
|
)
|
74,233
|
|
|||||
|
Cash and cash equivalents, beginning of period
|
42,250
|
|
74,233
|
|
—
|
|
|||||
|
|
|
|
|||||||||
|
Cash and cash equivalents, end of period
|
$
|
17,101
|
|
$
|
42,250
|
|
$
|
74,233
|
|
||
|
Supplemental disclosure of cash flow information:
|
|
||||||||||
|
Interest paid
|
$
|
32,613
|
|
$
|
28,557
|
|
$
|
760
|
|
||
|
|
|
||||||||||
See accompanying notes to consolidated financial statements.
F-6
SABRA HEALTH CARE REIT, INC.
NOTES TO CONSOLIDATED FINANCIAL STATEMENTS
1.
BUSINESS
Overview
Sabra Health Care REIT, Inc. (“Sabra” or the “Company”) was incorporated on May 10, 2010 as a wholly owned subsidiary of Sun Healthcare Group, Inc. (“Old Sun”) and commenced operations on November 15, 2010. Sabra elected to be treated as a real estate investment trust (“REIT”) with the filing of its U.S. federal income tax return for the taxable year beginning January 1, 2011. Sabra believes that it has been organized and operated, and it intends to continue to operate, in a manner to qualify as a REIT. Sabra’s primary business consists of acquiring, financing and owning real estate property to be leased to third party tenants in the healthcare sector. Sabra owns substantially all of its assets and properties and conducts its operations through Sabra Health Care Limited Partnership, a Delaware limited partnership (the “Operating Partnership”), of which Sabra is the sole general partner, or by subsidiaries of the Operating Partnership. As of
December 31, 2012
, Sabra’s investment portfolio included
119
properties held for investment (consisting of (i)
96
skilled nursing/post-acute facilities, (ii)
22
senior housing facilities, and (iii)
one
acute care hospital) and one asset held for sale. In addition, as of
December 31, 2012
, a wholly owned subsidiary of the Company was the lender for two mortgage loan investments.
2.
SUMMARY OF SIGNIFICANT ACCOUNTING POLICIES
Principles of Consolidation and Basis of Presentation
The accompanying consolidated financial statements include the accounts of Sabra and its wholly owned subsidiaries as of and for the years ended
December 31, 2012
and 2011 and for the period from the Separation Date through December 31, 2010. All material intercompany transactions and balances have been eliminated in consolidation. The consolidated financial statements are prepared in accordance with U.S. generally accepted accounting principles (“GAAP”).
Use of Estimates
The preparation of the consolidated financial statements in conformity with GAAP requires management to make estimates and assumptions that affect the amounts reported in the consolidated financial statements and accompanying notes. Actual results could materially differ from those estimates.
Reclassifications
Certain amounts in the Company’s consolidated financial statements for prior periods have been reclassified to conform to the current period presentation. These reclassifications have not changed the results of operations of prior periods. The Company classified one property as held for sale as of December 31, 2012. As a result, certain reclassifications were made to the consolidated balance sheets and footnote disclosures for all periods presented.
Revenue Recognition
The Company recognizes rental revenue from tenants, including rental abatements, lease incentives and contractual fixed increases attributable to operating leases, on a straight-line basis over the term of the related leases when collectability is reasonably assured. If the lease provides for tenant improvements, the Company determines whether the tenant improvements, for accounting purposes, are owned by the tenant or by the Company. When the Company is the owner of the tenant improvements, the tenant is not considered to have taken physical possession or have control of the physical use of the leased asset until the tenant improvements are substantially completed. When the tenant is the owner of the tenant improvements, any tenant improvement allowance that is funded is treated as a lease incentive and amortized as a reduction of revenue over the lease term.
Real Estate Investments
Depreciation and Amortization
Real estate costs related to the acquisition and improvement of properties are capitalized and amortized over the expected useful life of the asset on a straight-line basis. Depreciation is discontinued when a property is identified as held for sale. Repair and maintenance costs are charged to expense as incurred and significant replacements and betterments are capitalized. Repair and maintenance costs include all costs that do not extend the useful life of the real estate asset. The Company considers the period of future benefit of an asset to determine its appropriate useful life. Depreciation of real estate assets and amortization of lease intangibles are included in depreciation and amortization in the accompanying consolidated statements of income. The
F-7
Company anticipates the estimated useful lives of its assets by class to be generally as follows: land improvements,
3
to
40
years; buildings and building improvements,
3
to
40
years; and furniture and equipment,
1
to
20
years.
Impairment of Real Estate Investments
The Company continually monitors events and changes in circumstances that could indicate that the carrying amounts of its real estate investments may not be recoverable or realized. When indicators of potential impairment suggest that the carrying value of real estate investments may not be recoverable, the Company assesses the recoverability by estimating whether the Company will recover the carrying value of its real estate investments through its undiscounted future cash flows and the eventual disposition of the investment. If, based on this analysis, the Company does not believe that it will be able to recover the carrying value of its real estate investments, the Company would record an impairment loss to the extent that the carrying value exceeds the estimated fair value of its real estate investments. The Company recorded a
$2.5 million
impairment loss during the year ended December 31, 2012 related to the asset held for sale. The Company did not record any impairment loss on its real estate investments during the period from the Separation Date through December 31, 2011.
Real Estate Acquisition Valuation
The Company accounts for the acquisition of income-producing real estate or real estate that will be used for the production of income as a business combination. All assets acquired and liabilities assumed in an acquisition of real estate are measured at their acquisition-date fair values. The acquisition value of land, building and improvements are included in real estate investments on the accompanying consolidated balance sheets. The acquisition value of tenant relationship and origination and absorption intangible assets are included in prepaid expenses, deferred financing costs and other assets in the accompanying consolidated balance sheets. Acquisition pursuit costs are expensed as incurred and restructuring costs that do not meet the definition of a liability at the acquisition date are expensed in periods subsequent to the acquisition date. During the years ended
December 31, 2012
and 2011, the Company acquired
23
and
11
real estate properties, respectively, and expensed
$1.7 million
and
$3.2 million
of acquisition pursuit costs, respectively, which is included in general and administrative expense on the accompanying consolidated statements of income. The Company had
no
acquisitions during the period from November 15, 2010 to December 31, 2010.
Estimates of the fair values of the tangible assets, identifiable intangibles and assumed liabilities require the Company to make significant assumptions to estimate market lease rates, property operating expenses, carrying costs during lease-up periods, discount rates, market absorption periods, and the number of years the property will be held for investment. The Company makes its best estimate based on the evaluation of the specific characteristics of each tenant's lease. The use of inappropriate assumptions would result in an incorrect valuation of the Company’s acquired tangible assets, identifiable intangibles and assumed liabilities, which would impact the amount of the Company’s net income.
Assets Held for Sale and Discontinued Operations
The Company generally considers real estate to be “held for sale” when the following criteria are met: (i) management commits to a plan to sell the property, (ii) the property is available for sale immediately, (iii) the property is actively being marketed for sale at a price that is reasonable in relation to its current fair value, (iv) the sale of the property within one year is considered probable and (v) significant changes to the plan to sell are not expected. Real estate that is held for sale and its related assets are classified as “assets held for sale” for all periods presented in the accompanying consolidated financial statements. Mortgage notes payable and other liabilities related to real estate held for sale are classified as “liabilities related to assets held for sale” for all periods presented in the accompanying consolidated financial statements. Real estate classified as held for sale is no longer depreciated and is reported at the lower of its carrying value or its estimated fair value less estimated costs to sell. As of
December 31, 2012
, the Company determined that one property with an aggregate book value of
$2.2 million
met the held for sale criteria.
Discontinued operations is a component of an entity that has either been disposed of or is deemed to be held for sale and, (i) the operations and cash flows of the component have been or will be eliminated from ongoing operations as a result of the disposal transaction, and (ii) the entity will not have any significant continuing involvement in the operations of the component after the disposal transaction. Under the agreement with the Company's tenant pertaining to the Company’s asset held for sale, revenues and cash flows associated with the asset held for sale will not be eliminated as a result of the ultimate disposal of the asset. Accordingly, the operations of the held for sale asset are not classified as discontinued operations.
F-8
Loans Receivable and Interest Income
Loans Receivable
The Company’s loans receivable are recorded at amortized cost on the accompanying consolidated balance sheets. The amortized cost of a real estate loan receivable is the outstanding unpaid principal balance, net of unamortized costs and fees directly associated with the origination of the loan.
The Company reviews on a quarterly basis credit quality indicators such as payment status, changes affecting the underlying real estate collateral (for collateral dependent loans), changes affecting the operations of the facilities securing the loans, and national and regional economic factors. The Company’s loans receivable are evaluated for impairment at each balance sheet date. The Company considers a loan to be impaired when, based upon current information and events, it believes that it is probable that the Company will be unable to collect all amounts due under the contractual terms of the loan agreement resulting from the borrower’s failure to repay contractual amounts due, the granting of a concession by the Company or the Company’s expectation that it will receive assets with fair values less than the carrying value of the loan in satisfaction of the loan. If a loan is considered to be impaired, a reserve is established when the present value of payments expected to be received, observable market prices, the estimated fair value of the collateral (for loans that are dependent on the collateral for repayment) or amounts expected to be received in satisfaction of a loan are lower than the carrying value of that loan. As of
December 31, 2012
, all of the Company’s loans were performing and none were considered to be impaired.
Interest Income
Interest income on the Company’s loans receivable is recognized on an accrual basis over the life of the investment using the interest method. Direct loan origination costs are amortized over the term of the loan as an adjustment to interest income. When concerns exist as to the ultimate collection of principal or interest due under a loan, the loan is placed on nonaccrual status and the Company will not recognize interest income until the cash is received, or the loan returns to accrual status. If the Company determines that the collection of interest according to the contractual terms of the loan is probable, the Company will resume the accrual of interest.
Investment in Hillside Terrace Mortgage Note
On March 25, 2011, the Company purchased, at a discount, a defaulted mortgage note (“Hillside Terrace Mortgage Note”) secured by a combined assisted living, independent living and memory care facility located in Ann Arbor, Michigan, for
$5.3 million
. Initially, due to significant uncertainty as to the ability of the borrower under the Hillside Terrace Mortgage Note to pay amounts contractually due, the Company placed this loan on nonaccrual status. During the fourth quarter of 2011, the Company determined it was likely that the borrower would be able to complete a discounted repayment of the Hillside Terrace Mortgage Note for
$8.3 million
and therefore the
$3.0 million
excess of the repayment amount over its investment in the Hillside Terrace Mortgage Note was recorded as interest income in December 2011. In addition, the Company paid a
$1.4 million
fee to an unaffiliated third party for its assistance in acquiring and ultimately collecting on the Hillside Terrace Mortgage Note.
Cash and Cash Equivalents
The Company considers all short-term (with an original maturity of
three
months or less), highly-liquid investments utilized as part of the Company’s cash-management activities to be cash equivalents. Cash equivalents may include cash and short-term investments. Short-term investments are stated at cost, which approximates fair value.
The Company’s cash and cash equivalents balance exceeded federally insurable limits as of
December 31, 2012
. To date, the Company has experienced no loss or lack of access to cash in its operating accounts. The Company has a corporate banking relationship with Bank of America, N.A. in which it deposits all funds.
Restricted Cash
Restricted cash primarily consists of amounts held by mortgage lenders to provide for future real estate tax expenditures, tenant improvements and capital expenditures. Pursuant to the terms of the Company’s leases with subsidiaries of Genesis, the Company has assigned its interests in certain of these restricted cash accounts to Genesis and this amount is included in accounts payable and accrued liabilities on the Company’s consolidated balance sheet. As of
December 31, 2012
and 2011, restricted cash totaled
$4.6 million
and
$6.1 million
, respectively, and restricted cash obligations totaled
$2.3 million
and
$5.4 million
, respectively.
F-9
Stock-Based Compensation
Stock-based compensation expense for stock-based awards granted to Sabra’s employees and its non-employee directors are recognized in the statements of income based on their estimated grant date fair value. Compensation expense for awards with graded vesting schedules is generally recognized ratably over the period from the grant date to the date when the award is no longer contingent on the employee providing additional services.
Deferred Financing Costs
Deferred financing costs representing fees paid to third parties to obtain financing are amortized over the terms of the respective financing agreements using the interest method. Unamortized deferred financing costs are expensed when the associated debt is refinanced or repaid before maturity. Costs incurred in seeking financings that do not close are expensed in the period in which it is determined that the financing will not close. As of
December 31, 2012
and 2011, the Company’s deferred financing costs were included in prepaid expenses, deferred financing costs and other assets on the accompanying consolidated balance sheets and totaled
$12.4 million
and
$9.4 million
, respectively, net of amortization. Amortization of deferred financing costs for the year ended
December 31, 2012
included
$0.9 million
in write-offs related to the refinancing of certain mortgage notes.
Income Taxes
The Company elected to be treated as a REIT with the filing of its U.S. federal income tax return for the taxable year beginning January 1, 2011. The Company believes that it has been organized and operated, and it intends to continue to operate, in a manner to qualify as a REIT. To qualify as a REIT, the Company must meet certain organizational and operational requirements, including a requirement to distribute at least 90% of the Company’s annual REIT taxable income to stockholders (which is computed without regard to the dividends-paid deduction or net capital gains and which does not necessarily equal net income as calculated in accordance with GAAP). As a REIT, the Company generally will not be subject to federal income tax on income that it distributes as dividends to its stockholders. If the Company fails to qualify as a REIT in any taxable year, it will be subject to federal income tax on its taxable income at regular corporate income tax rates and generally will not be permitted to qualify for treatment as a REIT for federal income tax purposes for the four taxable years following the year during which qualification is lost, unless the Internal Revenue Service grants the Company relief under certain statutory provisions. Such an event could materially and adversely affect the Company’s net income and net cash available for distribution to stockholders. However, the Company believes that it is organized and operates in such a manner as to qualify for treatment as a REIT.
The Company evaluates its tax positions using a two step approach: step one (recognition) occurs when a company concludes that a tax position, based solely on its technical merits, is more likely than not to be sustained upon examination and step two (measurement) is only addressed if step one has been satisfied (i.e., the position is more likely than not to be sustained). Under step two, the tax benefit is measured as the largest amount of benefit (determined on a cumulative probability basis) that is more likely than not to be realized upon ultimate settlement. The Company will recognize tax penalties relating to unrecognized tax benefits as additional tax expense.
Fair Value Measurements
Under GAAP, the Company is required to measure certain financial instruments at fair value on a recurring basis. In addition, the Company is required to measure other financial instruments and balances at fair value on a non-recurring basis (e.g., carrying value of impaired real estate loans receivable and long-lived assets). Fair value is defined as the price that would be received upon the sale of an asset or paid to transfer a liability in an orderly transaction between market participants at the measurement date. The GAAP fair value framework uses a three-tiered approach. Fair value measurements are classified and disclosed in one of the following three categories:
|
•
|
Level 1: unadjusted quoted prices in active markets that are accessible at the measurement date for identical assets or liabilities;
|
|
•
|
Level 2: quoted prices for similar instruments in active markets, quoted prices for identical or similar instruments in markets that are not active, and model-derived valuations in which significant inputs and significant value drivers are observable in active markets; and
|
|
•
|
Level 3: prices or valuation techniques where little or no market data is available that requires inputs that are both significant to the fair value measurement and unobservable.
|
When available, the Company utilizes quoted market prices from an independent third-party source to determine fair value and classifies such items in Level 1 or Level 2. In instances where the market for a financial instrument is not active, regardless of the availability of a nonbinding quoted market price, observable inputs might not be relevant and could require
F-10
the Company to make a significant adjustment to derive a fair value measurement. Additionally, in an inactive market, a market price quoted from an independent third party may rely more on models with inputs based on information available only to that independent third party. When the Company determines the market for a financial instrument owned by the Company to be illiquid or when market transactions for similar instruments do not appear orderly, the Company may use several valuation sources (including internal valuations, discounted cash flow analysis and quoted market prices) to establish a fair value. If more than one valuation source is used, the Company will assign weights to the various valuation sources. Additionally, when determining the fair value of liabilities in circumstances in which a quoted price in an active market for an identical liability is not available, the Company measures fair value using (i) a valuation technique that uses the quoted price of the identical liability when traded as an asset or quoted prices for similar liabilities or similar liabilities when traded as assets or (ii) another valuation technique that is consistent with the principles of fair value measurement, such as the income approach or the market approach.
Changes in assumptions or estimation methodologies can have a material effect on these estimated fair values. In this regard, the derived fair value estimates cannot be substantiated by comparison to independent markets and, in many cases, may not be realized in an immediate settlement of the instrument.
The Company considers the following factors to be indicators of an inactive market: (i) there are few recent transactions, (ii) price quotations are not based on current information, (iii) price quotations vary substantially either over time or among market makers (for example, some brokered markets), (iv) indexes that previously were highly correlated with the fair values of the asset or liability are demonstrably uncorrelated with recent indications of fair value for that asset or liability, (v) there is a significant increase in implied liquidity risk premiums, yields, or performance indicators (such as delinquency rates or loss severities) for observed transactions or quoted prices when compared with the Company’s estimate of expected cash flows, considering all available market data about credit and other nonperformance risk for the asset or liability, (vi) there is a wide bid-ask spread or significant increase in the bid-ask spread, (vii) there is a significant decline or absence of a market for new issuances (that is, a primary market) for the asset or liability or similar assets or liabilities, and (viii) little information is released publicly (for example, a principal-to-principal market).
The Company considers the following factors to be indicators of non-orderly transactions: (i) there was not adequate exposure to the market for a period before the measurement date to allow for marketing activities that are usual and customary for transactions involving such assets or liabilities under current market conditions, (ii) there was a usual and customary marketing period, but the seller marketed the asset or liability to a single market participant, (iii) the seller is in or near bankruptcy or receivership (that is, distressed), or the seller was required to sell to meet regulatory or legal requirements (that is, forced), and (iv) the transaction price is an outlier when compared with other recent transactions for the same or similar assets or liabilities.
Per Share Data
Basic earnings per common share is computed by dividing net income applicable to common shares by the weighted average number of shares of common stock and common equivalents outstanding during the period. Diluted earnings per common share is calculated by including the effect of dilutive securities. See “Note 14. Earnings Per Common Share” to the Consolidated Financial Statements.
Industry Segments
The Company has
one
reportable segment consisting of investments in healthcare-related real estate properties.
Beds, Units and Other Measures
The number of beds, units and other measures used to describe the Company’s real estate investments included in the Notes to Consolidated Financial Statements are presented on an unaudited basis.
Recently Issued Accounting Standards Updates
On January 31, 2013, the Financial Accounting Standards Board (FASB) issued Accounting Standards Update No. 2013-01, Balance Sheet (Topic 210):
Clarifying the Score of Disclosures about Offsetting Assets and Liabilities
(“ASU No. 2013-01”). ASU No. 2013-01 updated accounting guidance applies to derivatives, including bifurcated embedded derivatives, repurchase agreements and reverse repurchase agreements, and securities borrowing and securities lending transactions that are either offset or subject to an enforceable master netting arrangement or similar agreement. Entities with other types of financial assets and financial liabilities subject to a master netting arrangement or similar agreement also are affected because these amendments make them no longer subject to prior disclosure requirements. The amendments are effective for fiscal years beginning on or after January 1, 2013, and interim periods within those annual periods. An entity should provide the required
F-11
disclosures retrospectively for all comparative periods presented. The adoption of ASU No. 2013-01 is not expected to have a significant impact on the Company’s financial statements.
F-12
|
3.
|
THE SEPARATION AND REIT CONVERSION MERGER
|
At the time of the Separation, the balance sheet of Sabra included
86
owned real property assets, allocated cash from Old Sun, mortgage indebtedness to third parties on
26
of the real property assets, as well as unsecured indebtedness incurred prior to and in connection with completion of the Separation. The statements of income, stockholders’ equity and cash flows of Sabra consist solely of its operations after the Separation. The Separation was accounted for as a reverse spinoff. Accordingly, the assets and liabilities of Sabra are recorded based on the historical carrying values of Old Sun. The historical consolidated financial statements of Old Sun became the historical consolidated financial statements of Sun at the time of the Separation. The following table summarizes the balance sheet of the Company immediately following the Separation and REIT Conversion Merger on November 15, 2010, the Separation Date (in thousands, except share and per share amounts):
|
Assets:
|
|
||
|
Real estate investments, net of accumulated depreciation of $85,567
|
$
|
485,337
|
|
|
Cash and cash equivalents
|
67,134
|
|
|
|
Restricted cash
|
5,527
|
|
|
|
Deferred tax assets
|
26,542
|
|
|
|
Prepaid expenses, deferred financing costs and other assets
|
11,383
|
|
|
|
|
|
|
|
|
Total assets
|
$
|
595,923
|
|
|
|
|
|
|
|
Liabilities:
|
|
|
|
|
Mortgage notes payable
|
$
|
151,678
|
|
|
Senior unsecured notes payable
|
225,000
|
|
|
|
Accounts payable and accrued liabilities
|
15,754
|
|
|
|
Tax liability
|
26,300
|
|
|
|
|
|
|
|
|
Total liabilities
|
$
|
418,732
|
|
|
|
|
|
|
|
Stockholders’ equity:
|
|
|
|
|
Preferred stock, $.01 par value; 10,000,000 shares authorized, zero shares issued and outstanding as of November 15, 2010
|
—
|
|
|
|
Common stock, $.01 par value; 125,000,000 shares authorized, 25,061,072 shares issued and outstanding as of November 15, 2010
|
251
|
|
|
|
Additional paid-in capital
|
176,940
|
|
|
|
|
|
|
|
|
Total stockholders’ equity
|
177,191
|
|
|
|
|
|
|
|
|
Total liabilities and stockholders’ equity
|
$
|
595,923
|
|
|
|
|
|
|
F-13
|
4.
|
RECENT REAL ESTATE ACQUISITIONS
|
During the year ended
December 31, 2012
, the Company acquired
10
skilled nursing facilities and
13
senior housing facilities for a total purchase price of
$206.9 million
. The purchase price was allocated as follows (in thousands):
|
Intangibles
|
||||||||||||||
|
Land
|
Building and Improvements
|
Tenant Origination and Absorption Costs
|
Tenant Relationship
|
Total Purchase Price
|
||||||||||
|
$
|
35,312
|
|
$
|
167,146
|
|
$
|
3,428
|
|
$
|
977
|
|
$
|
206,863
|
|
The tenant origination and absorption costs intangibles and tenant relationship intangibles acquired in connection with these acquisitions have weighted-average amortization periods as of the date of acquisition of
13
years and
22
years, respectively. As of
December 31, 2012
, a total of
$1.3 million
of contingent consideration related to 2012 acquisitions remains outstanding and is included in other liabilities on the accompanying consolidated balance sheets.
For the year ended
December 31, 2012
, the Company recognized
$4.9 million
of total revenues from these properties.
|
5.
|
REAL ESTATE PROPERTIES HELD FOR INVESTMENT
|
The Company’s real estate properties held for investment consisted of the following (dollars in thousands):
As of
December 31, 2012
|
Property Type
|
Number of
Properties
|
Number of
Beds/Units
|
Total
Real Estate
at Cost
|
Accumulated
Depreciation
|
Total
Real Estate
Investments, Net
|
|||||||||||||
|
Skilled Nursing/Post-Acute
|
96
|
|
10,826
|
|
$
|
746,510
|
|
$
|
(116,426
|
)
|
$
|
630,084
|
|
|||||
|
Senior Housing
|
22
|
|
1,486
|
|
148,210
|
|
(9,949
|
)
|
138,261
|
|
||||||||
|
Acute Care Hospital
|
1
|
|
70
|
|
61,640
|
|
(3,001
|
)
|
58,639
|
|
||||||||
|
119
|
|
12,382
|
|
956,360
|
|
(129,376
|
)
|
826,984
|
|
|||||||||
|
Corporate Level
|
254
|
|
(103
|
)
|
151
|
|
||||||||||||
|
$
|
956,614
|
|
$
|
(129,479
|
)
|
$
|
827,135
|
|
||||||||||
As of
December 31, 2011
|
Property Type
|
Number of
Properties
|
Number of
Beds/Units
|
Total
Real Estate
at Cost
|
Accumulated
Depreciation
|
Total
Real Estate
Investments, Net
|
|||||||||||||
|
Skilled Nursing/Post-Acute
|
86
|
|
9,858
|
|
$
|
651,637
|
|
$
|
(97,985
|
)
|
$
|
553,652
|
|
|||||
|
Senior Housing
|
9
|
|
773
|
|
47,192
|
|
(8,140
|
)
|
39,052
|
|
||||||||
|
Acute Care Hospital
|
1
|
|
70
|
|
61,640
|
|
(1,154
|
)
|
60,486
|
|
||||||||
|
96
|
|
10,701
|
|
760,469
|
|
(107,279
|
)
|
653,190
|
|
|||||||||
|
Corporate Level
|
239
|
|
(52
|
)
|
187
|
|
||||||||||||
|
$
|
760,708
|
|
$
|
(107,331
|
)
|
$
|
653,377
|
|
||||||||||
|
December 31, 2012
|
December 31, 2011
|
||||||
|
Building and improvements
|
$
|
782,221
|
|
$
|
622,222
|
|
|
|
Furniture and equipment
|
43,810
|
|
43,131
|
|
|||
|
Land improvements
|
4,535
|
|
4,635
|
|
|||
|
Land
|
126,048
|
|
90,720
|
|
|||
|
956,614
|
|
760,708
|
|
||||
|
Accumulated depreciation
|
(129,479
|
)
|
(107,331
|
)
|
|||
|
$
|
827,135
|
|
$
|
653,377
|
|
||
F-14
Operating Leases
As of
December 31, 2012
, all of the Company’s real estate properties were leased under triple-net operating leases with expirations ranging from
eight to 22
years. As of
December 31, 2012
, the leases had a weighted-average remaining term of
11
years. The leases include provisions to extend the lease terms and other negotiated terms and conditions. The Company, through its subsidiaries, retains substantially all of the risks and benefits of ownership of the real estate assets leased to the tenants. In addition, the Company may receive additional security under these operating leases in the form of security deposits from the lessee or guarantees from the parent of the lessee. Security deposits received in cash related to tenant leases are included in accounts payable and accrued liabilities in the accompanying consolidated balance sheets and totaled
$1.1 million
and
$0.7 million
as of
December 31, 2012
and 2011, respectively. As of
December 31, 2012
,
85
of the Company’s
119
real estate properties held for investment and its one asset held for sale were leased to subsidiaries of Genesis.
The Company monitors the creditworthiness of its tenants by reviewing credit ratings (if available) and evaluating the ability of the tenants to meet their lease obligations to the Company based on the tenants’ financial performance, including the evaluation of any parent guarantees of tenant lease obligations. Because formal credit ratings may not be available for most of the Company’s tenants, the primary basis for the Company’s evaluation of the credit quality of its tenants (and more specifically the tenants’ ability to pay their rent obligations to the Company) is the tenants’ lease coverage ratios. These coverage ratios include earnings before interest, taxes, depreciation, amortization and rent (“EBITDAR”) to rent coverage and earnings before interest, taxes, depreciation, amortization, rent and management fees (“EBITDARM”) to rent coverage at the facility level and consolidated EBITDAR to total rent coverage at the parent guarantor level when such a guarantee exists (currently the Genesis lease portfolio). The Company obtains various financial and operational information from its tenants each month and reviews this information in conjunction with the above-described coverage metrics to determine trends and the operational and financial impact of the environment in the industry (including the impact of government reimbursement) and the management of the tenant’s operations. These metrics help the Company identify potential areas of concern relative to its tenants’ credit quality and ultimately the tenants’ ability to generate sufficient liquidity to meet its obligations, including its obligation to continue to pay the rent due to the Company.
As of
December 31, 2012
, the future minimum rental income from the Company’s properties under non-cancelable operating leases was as follows (in thousands):
|
2013
|
$
|
125,943
|
|
|
2014
|
125,943
|
|
|
|
2015
|
125,943
|
|
|
|
2016
|
125,943
|
|
|
|
2017
|
125,943
|
|
|
|
Thereafter
|
751,896
|
|
|
|
|
|||
|
$
|
1,381,611
|
|
|
|
|
|||
|
6.
|
TENANT ORIGINATION AND ABSORPTION COSTS AND TENANT RELATIONSHIP
|
As of
December 31, 2012
and
2011
, the Company’s tenant origination and absorption costs and tenant relationship assets were as follows (in thousands):
|
|
|
Tenant Origination and Absorption Costs
|
Tenant Relationship
|
|||||||||||||
|
December 31,
|
||||||||||||||||
|
2012
|
2011
|
2012
|
2011
|
|||||||||||||
|
Cost
|
|
$
|
6,688
|
|
$
|
3,166
|
|
$
|
1,551
|
|
$
|
564
|
|
|||
|
Accumulated amortization
|
|
(344
|
)
|
(75
|
)
|
(38
|
)
|
(7
|
)
|
|||||||
|
|
|
|
|
|
||||||||||||
|
Net amount
|
|
$
|
6,344
|
|
$
|
3,091
|
|
$
|
1,513
|
|
$
|
557
|
|
|||
F-15
Increases (decreases) in net income as a result of amortization of the Company’s tenant origination and absorption costs and tenant relationship assets for the years ended
December 31, 2012
and 2011 are as follows (in thousands):
|
Tenant Origination and Absorption Costs
|
|
Tenant Relationship
|
||||||||||||||
|
For the Year Ended December 31,
|
||||||||||||||||
|
2012
|
2011
|
2012
|
2011
|
|||||||||||||
|
|
|
|||||||||||||||
|
Amortization
|
|
$
|
(269
|
)
|
$
|
(75
|
)
|
$
|
(31
|
)
|
$
|
(7
|
)
|
|||
The remaining unamortized balance for these outstanding intangible assets and liabilities as of
December 31, 2012
will be amortized for the years ending December 31 as follows:
|
Tenant Origination and Absorption Costs
|
|
Tenant Relationship
|
||||||
|
|
|
|
||||||
|
2013
|
$
|
472
|
|
$
|
65
|
|
||
|
2014
|
472
|
|
65
|
|
||||
|
2015
|
472
|
|
65
|
|
||||
|
2016
|
472
|
|
65
|
|
||||
|
2017
|
472
|
|
65
|
|
||||
|
Thereafter
|
3,984
|
|
1,188
|
|
||||
|
$
|
6,344
|
|
$
|
1,513
|
|
|||
|
|
||||||||
|
Weighted-Average Remaining Amortization Period
|
14.4 years
|
|
24.0 years
|
|
||||
|
7.
|
LOANS RECEIVABLE
|
As of
December 31, 2012
, the Company’s loans receivable consisted of the following (dollars in thousands):
|
Loan Type
|
Number of Loans
|
Facility Type
|
Principal Balance as of December 31, 2012
|
Book Value as of December 31, 2012
|
Contractual Interest Rate
|
Annualized Effective Interest Rate
|
Maturity Date
|
|||||||||||
|
Mortgage
|
2
|
|
Skilled Nursing / Assisted Living
|
11,965
|
|
12,017
|
|
8.5
|
%
|
8.4
|
%
|
Various
|
||||||
Loan Originations
On March 15, 2012, a wholly owned subsidiary of the Company entered into a
$10.0 million
mezzanine loan (the “Mezzanine Loan”) secured by the borrowers’ equity interests in
three
skilled nursing facilities and
one
assisted living facility located in Texas. The Company had an option to purchase these loan assets before March 31, 2013. On November 30, 2012, the Mezzanine Loan was repaid in full and the Company exercised its purchase option for
$43.0 million
. Upon exercise of the purchase option, the Company entered into a triple-net master lease agreement with affiliates of Meridian Senior Properties Fund I, L.P. The lease has an initial term of
15
years with
two
five
-year renewal options.
On June 22, 2012, a wholly owned subsidiary of the Company entered into an
$11.0 million
mortgage loan agreement secured by a first trust deed on a
125
-bed skilled nursing facility in Texas that was built in 2010 (the “Onion Creek Mortgage Loan”) with affiliates of Meridian Equity Investors, L.P. as borrowers. The Onion Creek Mortgage Loan has a
five
year term, bears interest at a fixed rate of
8.5%
per annum and cannot be prepaid during the first
three
years of the loan term. In addition, the Company has an option to purchase and the borrowers have an option to sell the facility securing the Onion Creek Mortgage Loan from July 1, 2013 through the time the loan is repaid for between
$12.5 million
and
$14.5 million
, depending on the annualized EBITDAR of the facility for the three month period preceding the option exercise date; however, in no event can the borrowers require the Company to purchase the property if the three month annualized EBITDAR is below
$1.7 million
. The loan was funded with available cash and proceeds from the Amended Secured Revolving Credit Facility.
On August 16, 2012, the Company, through certain subsidiaries, entered into a forward purchase program (the “Pipeline Agreement”) to acquire newly constructed senior housing properties to be developed by First Phoenix Group, LLC (“First Phoenix”). The Pipeline Agreement provides for the acquisition of, as well as certain interim funding arrangements for, up to
ten
assisted living and memory care facilities to be identified by First Phoenix and approved by the Company before the end of 2014. Under the Pipeline Agreement, First Phoenix will identify and develop the properties, affiliates of the Company will
F-16
have the option to purchase the properties once stabilized and a 50%/50% RIDEA-compliant joint venture between affiliates of the Company and First Phoenix will operate the facilities, subject to certain terms and conditions. Upon acquisition, the Company will own
100%
of the real estate and lease it to the joint venture under a triple-net lease structure with an initial annual yield on cash rent of
8%
. Pursuant to the Pipeline Agreement, the Company would be obligated to purchase a property only after satisfactory completion of customary due diligence and agreed upon closing conditions. First Phoenix currently operates
one
facility under the Stoney River Assisted Living brand located in Marshfield, Wisconsin which was acquired by the Company in December 2012 in a triple-net sale leaseback transaction and, upon the completion of the license transfer on the facility, will be operated by the joint venture. The license transfer is expected to occur in 2013.
Concurrently with its execution of the Pipeline Agreement, the Company entered into a
$1.0 million
pre-development loan agreement with First Phoenix to fund the acquisition of land and certain other costs associated with the first development project under the Pipeline Agreement, a
72
-unit assisted living/memory care facility located in Ramsey, Minnesota. This loan will be funded over the course of the pre-development activities and bears interest at a fixed rate of
9.0%
per annum. The Company funded
$1.0 million
under the pre-development loan agreement in 2012. Repayment of the loan is expected to occur in connection with the acquisition of the stabilized property by Sabra, or earlier in certain circumstances.
|
8.
|
REAL ESTATE HELD FOR SALE
|
During the year ended
December 31, 2012
, the Company determined that one skilled nursing/post-acute facility with an aggregate net book value of
$2.2 million
met the criteria of held for sale as a result of the Company consenting to the tenant to close the facility and secure a buyer for the facility. In connection with the Company granting its consent to the tenant's request to close the facility, the Company received
$2.2 million
as a consent fee. During the year ended
December 31, 2012
, the Company recorded an impairment loss of
$2.5 million
related to the asset held for sale. The impairment charge was a result of the Company’s determination that the asset is held for sale and the resulting adjustment of its net book value to estimate fair value less costs to sell. The asset held for sale was sold on February 1, 2013 for
$2.2 million
.
The following summary represents the major components of real estate held for sale and liabilities related to real estate held for sale as of
December 31, 2012
and 2011 (in thousands):
|
December 31,
|
||||||||
|
2012
|
2011
|
|||||||
|
Assets related to real estate held for sale
|
||||||||
|
Real estate investment, gross
|
$
|
2,208
|
|
$
|
6,585
|
|
||
|
Accumulated depreciation
|
—
|
|
(1,585
|
)
|
||||
|
Other assets
|
7
|
|
243
|
|
||||
|
Total assets
|
$
|
2,215
|
|
$
|
5,243
|
|
||
|
Liabilities related to real estate held for sale
|
||||||||
|
Mortgage notes payable
|
$
|
—
|
|
$
|
4,456
|
|
||
|
Other liabilities
|
—
|
|
29
|
|
||||
|
Total liabilities
|
$
|
—
|
|
$
|
4,485
|
|
||
|
9.
|
DEBT
|
Mortgage Indebtedness.
The Company’s mortgage notes payable consist of the following (dollars in thousands):
|
Interest Rate Type
|
Book Value as of
December 31, 2012
|
Book Value as of
December 31, 2011
(1)
|
Weighted Average
Interest Rate at
December 31, 2012
|
Maturity
Date
|
||||||||
|
Fixed Rate
|
$
|
94,373
|
|
$
|
94,783
|
|
4.43
|
%
|
August 2015 - June 2047
|
|||
|
Variable Rate
(2)
|
57,949
|
|
59,159
|
|
5.00
|
%
|
August 2015
|
|||||
|
$
|
152,322
|
|
$
|
153,942
|
|
4.65
|
%
|
|||||
|
(1)
|
Outstanding principal balance for mortgage indebtedness includes mortgage premium of $
0.5 million
as of December 31, 2011.
|
|
(2)
|
Contractual interest rates under variable rate mortgages are equal to the
90-day LIBOR
plus
4.0%
(subject to a
1.0%
floor).
|
F-17
On June 28, 2012, the Company refinanced
four
of its existing United States Department of Housing and Urban Development (“HUD”) mortgage notes totaling
$20.9 million
. The Company maintained the original maturity dates, reduced the weighted average interest rate from
5.75%
to
2.49%
per annum and increased the aggregate outstanding principal amount of the mortgage notes by
$1.1 million
. On July 27, 2012, the Company refinanced
one
HUD mortgage note totaling
$13.5 million
. The Company maintained the original maturity date, reduced the interest rate from
5.90%
to
2.49%
per annum and increased the aggregate outstanding principal amount of the mortgage note by
$0.4 million
. On November 20, 2012, the Company refinanced
one
additional HUD mortgage note totaling
$20.2 million
. The Company maintained the original maturity date, reduced the interest rate from
5.20%
to
2.43%
per annum and increased the aggregate outstanding principal amount of the mortgage note by
$0.6 million
. In connection with these refinancings and included in interest expense, the Company wrote off
$0.9 million
in unamortized deferred financing costs and incurred and expensed
$2.0 million
in prepayment penalty fees related to the original mortgage notes during the year ended
December 31, 2012
.
Interest expense for the fourth quarter of 2012 includes an out-of-period adjustment to record an increase to interest expense of
$0.6 million
related to under reporting of fees associated with the early extinguishment of debt in the second and third quarters of 2012 in the amount of
$0.5 million
and
$0.1 million
, respectively. The Company believes that both the actual interest expense errors and the correction of those errors out of period in the fourth quarter of 2012 are not material.
On May 1, 2012, the Company amended the Amended, Restated and Consolidated Loan Agreement with General Electric Capital Corporation. The Company reduced the interest rate spread of the floating rate portion (totaling
$57.9 million
as of
December 31, 2012
) by 50 basis points and maintained the fixed rate portion (totaling
$30.7 million
as of
December 31, 2012
) at the original pricing of
6.82%
. However, when the fixed rate portion converts to a floating rate loan on December 19, 2013, the reduced interest rate spread will apply. The Company also agreed to prepayment terms that do not allow for prepayment for the loan prior to May 1, 2014 unless the prepayment is either approved by the lender in its sole discretion or arises from a refinancing of one or more of the applicable facilities under a loan program insured or otherwise supported by HUD.
8.125%
Senior Notes due 2018
. On October 27, 2010, the Operating Partnership and Sabra Capital Corporation, wholly owned subsidiaries of the Company (the “Issuers”), issued
$225.0 million
aggregate principal amount of 8.125% senior, unsecured notes (the “Senior Notes”) in a private placement. The Senior Notes were sold at par, resulting in gross proceeds of
$225.0 million
and net proceeds of approximately
$219.9 million
after deducting commissions and expenses. On December 6, 2010, substantially all of the net proceeds were used by Sun to redeem the
$200.0 million
in aggregate principal amount outstanding of Old Sun’s
9.125%
senior subordinated notes due 2015, including accrued and unpaid interest and the applicable redemption premium. In March 2011, the Issuers completed an exchange offer to exchange the Senior Notes for substantially identical
8.125%
senior unsecured notes registered under the Securities Act of 1933, as amended (also referred to herein as the “Senior Notes”).
On July 26, 2012, the Issuers issued an additional
$100.0 million
aggregate principal amount of Senior Notes, which are treated as a single class with the existing Senior Notes. The notes were issued at
106.0%
providing net proceeds of
$103.0 million
after underwriting costs and other offering expenses and a yield-to-maturity of
6.92%
. The Company used a portion of the proceeds from this offering to repay the borrowings outstanding under the Amended Secured Revolving Credit Facility. On November 14, 2012, the Issuers completed an exchange offer to exchange the
$100.0 million
aggregate principal amount of Senior Notes that were issued in July 2012 for substantially identical Senior Notes registered under the Securities Act of 1933, as amended.
The obligations under the Senior Notes are fully and unconditionally guaranteed, jointly and severally, on an unsecured basis, by Sabra and certain of Sabra’s other existing and, subject to certain exceptions, future material subsidiaries; provided, however, that such guarantees are subject to release under certain customary circumstances. See “Note 15. Summarized Condensed Consolidating Information” for additional information concerning the circumstances pursuant to which the guarantors will be automatically and unconditionally released from their obligations under the guarantees.
The Senior Notes are redeemable at the option of the Issuers, in whole or in part, at any time, and from time to time, on or after November 1, 2014, at the redemption prices set forth in the indenture governing the Senior Notes (the “Indenture”), plus accrued and unpaid interest to the applicable redemption date. In addition, prior to November 1, 2014, the Issuers may redeem all or a portion of the Senior Notes at a redemption price equal to
100%
of the principal amount of the Senior Notes redeemed, plus a “make-whole” premium, plus accrued and unpaid interest to the applicable redemption date. At any time, or from time to time, on or prior to November 1, 2013, the Issuers may redeem up to
35%
of the principal amount of the Senior Notes, using the proceeds of specific kinds of equity offerings, at a redemption price of
108.125%
of the principal amount to be redeemed, plus accrued and unpaid interest, if any, to the applicable redemption date. Assuming the Senior Notes are not redeemed, the Senior Notes mature on November 1, 2018.
F-18
The Indenture governing the Senior Notes contains restrictive covenants that, among other things, restrict the ability of Sabra, the Issuers and their restricted subsidiaries to: (i) incur or guarantee additional indebtedness; (ii) incur or guarantee secured indebtedness; (iii) pay dividends or distributions on, or redeem or repurchase, their capital stock; (iv) make certain investments or other restricted payments; (v) sell assets; (vi) create liens on their assets; (vii) enter into transactions with affiliates; (viii) merge or consolidate or sell all or substantially all of their assets; and (ix) create restrictions on the ability of Sabra’s restricted subsidiaries to pay dividends or other amounts to Sabra. The Indenture governing the Senior Notes also provides for customary events of default, including, but not limited to, the failure to make payments of interest or premium, if any, on, or principal of, the Senior Notes, the failure to comply with certain covenants and agreements specified in the Indenture for a period of time after notice has been provided, the acceleration of other indebtedness resulting from the failure to pay principal on such other indebtedness prior to its maturity, and certain events of insolvency. If any event of default occurs, the principal of, premium, if any, and accrued interest on all the then outstanding Senior Notes may become due and payable immediately. As of
December 31, 2012
, the Company was in compliance with all applicable financial covenants under the Senior Notes.
Amended Secured Revolving Credit Facility
. On November 3, 2010, the Operating Partnership and certain subsidiaries of the Operating Partnership (together with the Operating Partnership, the “Borrowers”) entered into a secured revolving credit facility with certain lenders as set forth in the related credit agreement and Bank of America, N.A., as Administrative Agent, Swing Line Lender and L/C Issuer (each as defined in such credit agreement). The secured revolving credit facility is secured by, among other things, a first priority lien against certain of the properties owned by certain of the Company’s subsidiaries. The obligations of the Borrowers under the secured revolving credit facility are guaranteed by the Company and certain of its subsidiaries. On February 10, 2012, the Borrowers amended the secured revolving credit facility (as amended, the “Amended Secured Revolving Credit Facility”) to increase the borrowing capacity from
$100.0 million
to
$200.0 million
(up to
$20.0 million
of which may be utilized for letters of credit) and to include an accordion feature that allows the Borrowers to increase borrowing availability under the Amended Secured Revolving Credit Facility by up to an additional
$150.0 million
, subject to certain terms and conditions. On September 20, 2012, the Borrowers utilized the accordion feature to increase the borrowing capacity to
$230.0 million
. Borrowing availability under the Amended Secured Revolving Credit Facility is subject to a borrowing base calculation based on, among other factors, the lesser of (i) the mortgageability cash flow (as such term is defined in the credit agreement ) or (ii) the appraised value, in each case of the properties securing the Amended Secured Revolving Credit Facility. Borrowing availability under the Amended Secured Revolving Credit Facility terminates, and all borrowings mature, on February 10, 2015, subject to a
one
-year extension option. As of
December 31, 2012
, there was
$92.5 million
outstanding under the Company’s Amended Secured Revolving Credit Facility and
$109.1 million
available for borrowing.
Borrowings under the Amended Secured Revolving Credit Facility bear interest on the outstanding principal amount at a rate equal to an applicable percentage plus, at the Borrowers’ option, either (a) LIBOR or (b) a base rate determined as the greater of (i) the federal funds rate plus
0.5%
, (ii) the prime rate, and (iii)
one-month LIBOR
plus
1.0%
(the “Base Rate”). The applicable percentage for borrowings will vary based on the Consolidated Leverage Ratio, as defined in the amended credit agreement, and will range
3.00%
to
4.00%
per annum for LIBOR based borrowings and
2.00%
to
3.00%
per annum for borrowings at the Base Rate. As of
December 31, 2012
, the interest rate on the Amended Secured Revolving Credit Facility was
3.71%
. In addition, the Borrowers are required to pay a facility fee to the lenders equal to between
0.35%
and
0.50%
per annum based on the amount of unused borrowings under the Amended Secured Revolving Credit Facility. During the year ended
December 31, 2012
, the Company incurred
$0.5 million
in interest expense on amounts outstanding under the Amended Secured Revolving Credit Facility and
$0.9 million
of unused facility fees.
The Amended Secured Revolving Credit Facility contains customary covenants that include restrictions on the ability to make acquisitions and other investments, pay dividends, incur additional indebtedness, engage in non-healthcare related business activities, enter into transactions with affiliates and sell or otherwise transfer certain assets as well as customary events of default. The Amended Secured Revolving Credit Facility also requires the Company, through the Borrowers, to comply with specified financial covenants, which include a maximum leverage ratio, a minimum fixed charge coverage ratio and a minimum tangible net worth requirement. As of
December 31, 2012
, the Company was in compliance with all applicable financial covenants under the Amended Secured Revolving Credit Facility.
During the
years
ended
December 31, 2012
and 2011 and for the period from the
Separation Date through December 31, 2010
, the Company incurred interest expense of
$37.0 million
, $
30.3 million
and
$3.9 million
, respectively. Included in interest expense for the
years
ended
December 31, 2012
and 2011 and for the period from the
Separation Date through December 31, 2010
, was $
3.8 million
,
$2.0 million
and
$0.2 million
, respectively, of deferred financing costs amortization. Amortization of deferred financing costs for the year ended
December 31, 2012
included
$0.9 million
in write-offs related to the refinancing of certain mortgage notes. Additionally, interest expense for the year ended December 31, 2012 includes
$2.0 million
of prepayment penalty fees related to the refinancing of the mortgage notes. As of
December 31, 2012
and 2011, the Company had
F-19
$
5.4 million
and $
4.0 million
, respectively, of accrued interest included in accounts payable and accrued liabilities on the accompanying consolidated balance sheets.
The following is a schedule of maturities for the Company’s outstanding debt as of
December 31, 2012
(in thousands):
|
Mortgage
Indebtedness
|
Senior Notes
(1)
|
Secured Revolving
Credit Facility
(2)
|
Total
|
||||||||||||
|
2013
|
$
|
3,946
|
|
$
|
—
|
|
$
|
—
|
|
$
|
3,946
|
|
|||
|
2014
|
4,146
|
|
—
|
|
—
|
|
4,146
|
|
|||||||
|
2015
|
86,522
|
|
—
|
|
92,500
|
|
179,022
|
|
|||||||
|
2016
|
2,138
|
|
—
|
|
—
|
|
2,138
|
|
|||||||
|
2017
|
2,230
|
|
—
|
|
—
|
|
2,230
|
|
|||||||
|
Thereafter
|
53,340
|
|
325,000
|
|
—
|
|
378,340
|
|
|||||||
|
$
|
152,322
|
|
$
|
325,000
|
|
$
|
92,500
|
|
$
|
569,822
|
|
||||
(1)
Outstanding principal balance for Senior Notes does not include premium of
$5.7 million
as of
December 31, 2012
.
(2)
Subject to a
one
-year extension option.
10.
FAIR VALUE DISCLOSURES
The fair value for certain financial instruments is derived using a combination of market quotes, pricing models and other valuation techniques that involve significant management judgment. The price transparency of financial instruments is a key determinant of the degree of judgment involved in determining the fair value of the Company’s financial instruments.
Financial instruments for which actively quoted prices or pricing parameters are available and whose markets contain orderly transactions will generally have a higher degree of price transparency than financial instruments whose markets are inactive or consist of non-orderly trades. The Company evaluates several factors when determining if a market is inactive or when market transactions are not orderly. The carrying values of cash and cash equivalents, restricted cash, accounts payable and accrued liabilities are reasonable estimates of fair value because of the short-term maturities of these instruments. Fair values for other financial instruments are derived as follows:
Loans receivable:
These instruments are presented in the accompanying condensed consolidated balance sheets at their amortized cost and not at fair value. The fair value of the loans receivable were estimated using an internal valuation model that considered the expected cash flows for the loans receivable, the underlying collateral value and other credit enhancements.
Senior Notes:
The fair values of the Senior Notes were determined using third-party market quotes derived from orderly trades.
Mortgage indebtedness:
The fair values of the Company’s notes payable were estimated using a discounted cash flow analysis based on management’s estimates of current market interest rates for instruments with similar characteristics, including remaining loan term, loan-to-value ratio, type of collateral and other credit enhancements.
The following are the carrying amounts and fair values of the Company’s financial instruments as of
December 31, 2012
and
December 31, 2011
whose carrying amounts do not approximate their fair value (in thousands):
|
|
December 31, 2012
|
December 31, 2011
|
|||||||||||||||||||||
|
|
Face
Value
(1)
|
Carrying
Amount
(2)
|
Fair
Value
|
Face
Value
(1)
|
Carrying
Amount (2) |
Fair
Value
|
|||||||||||||||||
|
Financial assets:
|
|||||||||||||||||||||||
|
Loans receivable
|
$
|
11,965
|
|
$
|
12,017
|
|
$
|
12,826
|
|
$
|
—
|
|
$
|
—
|
|
$
|
—
|
|
|||||
|
Financial liabilities:
|
|||||||||||||||||||||||
|
Senior Notes
|
325,000
|
|
330,666
|
|
345,313
|
|
225,000
|
|
225,000
|
|
227,813
|
|
|||||||||||
|
Mortgage indebtedness
|
152,322
|
|
152,322
|
|
152,559
|
|
153,442
|
|
153,942
|
|
167,413
|
|
|||||||||||
|
Secured Revolving Credit Facility
|
92,500
|
|
92,500
|
|
92,500
|
|
—
|
|
—
|
|
—
|
|
|||||||||||
(1)
Face value represents amounts contractually due under the terms of the respective agreements.
(2)
Carrying amounts represent the book value of financial instruments and include unamortized premiums (discounts).
F-20
The Company determined the fair value of financial instruments as of
December 31, 2012
whose carrying amounts do not approximate their fair value with valuation methods utilizing the following types of inputs (in thousands):
|
Fair Value Measurements Using
|
|||||||||||||||
|
Quoted Prices in Active Markets for Identical Assets
|
Significant Other Observable Inputs
|
Significant Unobservable Inputs
|
|||||||||||||
|
Total
|
(Level 1)
|
(Level 2)
|
(Level 3)
|
||||||||||||
|
Financial assets:
|
|||||||||||||||
|
Loan receivable
|
$
|
12,826
|
|
$
|
—
|
|
$
|
—
|
|
$
|
12,826
|
|
|||
|
Financial liabilities:
|
|||||||||||||||
|
Senior Notes
|
345,313
|
|
—
|
|
345,313
|
|
—
|
|
|||||||
|
Mortgage indebtedness
|
152,559
|
|
—
|
|
—
|
|
152,559
|
|
|||||||
|
Secured Revolving Credit Facility
|
92,500
|
|
—
|
|
—
|
|
92,500
|
|
|||||||
Disclosure of the fair value of financial instruments is based on pertinent information available to the Company at the applicable dates and requires a significant amount of judgment. Despite increased capital market and credit market activity, transaction volume for certain financial instruments remains relatively low. This has made the estimation of fair values difficult and, therefore, both the actual results and the Company’s estimate of fair value at a future date could be materially different.
During the year ended
December 31, 2012
, the Company recorded the following amounts measured at fair value (in thousands):
|
Fair Value Measurements Using
|
|||||||||||||||
|
Quoted Prices in Active Markets for Identical Assets
|
Significant Other Observable Inputs
|
Significant Unobservable Inputs
|
|||||||||||||
|
Total
|
(Level 1)
|
(Level 2)
|
(Level 3)
|
||||||||||||
|
Recurring Basis:
|
|||||||||||||||
|
Contingent consideration
|
$
|
1,300
|
|
—
|
|
—
|
|
1,300
|
|
||||||
|
Nonrecurring Basis:
|
|||||||||||||||
|
Real estate held for sale
|
2,208
|
|
$
|
—
|
|
$
|
2,208
|
|
$
|
—
|
|
||||
The fair value of the Company’s real estate held for sale, which is measured on a nonrecurring basis, is based on the contracted sales price and has been determined to be Level 2 within the valuation hierarchy.
|
11.
|
EQUITY
|
Common Stock
On August 1, 2011, the Company completed an underwritten public offering of
11.7 million
newly issued shares of its common stock pursuant to a registration statement filed with the Securities Exchange Commission (“SEC”) that became effective on July 26, 2011. The Company received net proceeds, before expenses, of
$163.9 million
from the offering, after giving effect to the issuance and sale of all
11.7 million
shares of common stock (which included
1.5 million
shares sold to the underwriters upon exercise of their option to purchase additional shares to cover over-allotments), at a price to the public of
$14.75
per share.
The following is a summary of the Company’s other common stock issuances during the
years
ended
December 31, 2012
and 2011:
|
Year Ended December 31,
|
||||||
|
2012
|
2011
|
|||||
|
Exercise of stock options
|
41,640
|
|
45,657
|
|
||
|
Vesting of common stock units
|
165,857
|
|
54,983
|
|
||
The following table lists the cash dividends on common stock paid and declared by the Company during the
years
ended
December 31, 2012
and 2011:
|
Declaration Date
|
|
Record Date
|
|
Amount Per Share
|
|
Dividend Payable Date
|
||
|
May 3, 2011
|
|
May 16, 2011
|
|
$
|
0.32
|
|
|
June 2, 2011
|
|
August 2, 2011
|
|
August 15, 2011
|
|
$
|
0.32
|
|
|
September 2, 2011
|
|
November 2, 2011
|
November 15, 2011
|
$
|
0.32
|
|
December 2, 2011
|
|||
|
February 29, 2012
|
March 15, 2012
|
$
|
0.33
|
|
March 30, 2012
|
|||
|
April 24, 2012
|
May 15, 2012
|
$
|
0.33
|
|
May 31, 2012
|
|||
|
August 1, 2012
|
August 15, 2012
|
$
|
0.33
|
|
August 31, 2012
|
|||
|
October 29, 2012
|
November 15, 2012
|
$
|
0.33
|
|
November 30, 2012
|
|||
Distributions with respect to the Company’s common stock can be characterized for federal income tax purposes as taxable ordinary dividends, capital gain dividends, nondividend distributions (return of capital) or a combination thereof. Following is the characterization of the Company’s cash dividends on common stock per share during the
years
ended
December 31, 2012
and 2011:
|
Year Ended December 31,
|
|||||||
|
2012
|
2011
|
||||||
|
Ordinary dividends
|
$
|
0.7992
|
|
$
|
0.7833
|
|
|
|
Nondividend distributions
|
0.5208
|
|
0.1767
|
|
|||
|
$
|
1.3200
|
|
$
|
0.9600
|
|
||
On
January 7, 2013
, the Company announced that its board of directors declared a quarterly cash dividend of
$0.34
per share of common stock. The dividend was paid on
February 28, 2013
to stockholders of record as of the close of business on
February 15, 2013
.
|
12.
|
STOCK-BASED COMPENSATION
|
All stock-based awards are subject to the terms of the 2009 Performance Incentive Plan, which was assumed by the Company in connection with the Separation and REIT Conversion Merger. The 2009 Performance Incentive Plan provides for the granting of stock-based compensation, including stock options, time-based stock units, funds from operations-based stock units ("FFO Units"), relative total stockholder return-based stock units ("TSR Units") and performance based restricted stock units to officers, employees and directors in connection with their employment with or services provided to the Company.
Stock Options
A summary of the option activity is presented in the following table (dollars in thousands, except per share amounts):
|
Range of Per Share Exercise Price
|
Shares Under Options
|
Weighted Average Exercise Price Per Share
|
Weighted Average Remaining Contractual Term (Years)
|
Aggregate Intrinsic Value
|
|||||||||||
|
Outstanding as of December 31, 2011
|
|
$12.34 - $21.83
|
404,410
|
|
$
|
18.29
|
|
|
3.3
|
|
$
|
—
|
|
||
|
Granted
|
|
—
|
—
|
|
—
|
|
|
||||||||
|
Exercised
|
|
$12.34
|
(41,640
|
)
|
12.34
|
|
|
||||||||
|
Forfeited
|
|
—
|
—
|
|
—
|
|
|
||||||||
|
|
|
|
|
|
|
|
|
|
|||||||
|
Outstanding as of December 31, 2012
|
|
$14.37 - $21.83
|
362,770
|
|
$
|
18.97
|
|
|
2.7
|
|
$
|
1,011
|
|
||
|
|
|
|
|
|
|
|
|
|
|||||||
|
Exercisable as of December 31, 2012
|
|
$14.37 - $21.83
|
298,484
|
|
$
|
19.35
|
|
|
2.4
|
|
$
|
721
|
|
||
The total intrinsic value of stock options exercised was
$0.2 million
during the years ended
December 31, 2012
and 2011. The Company received
$0.5 million
for the stock options exercised during each of the years ended December 31, 2012 and 2011. The total fair value of stock options that vested during the years ended
December 31, 2012
and 2011 was
$0.6 million
and
$0.7 million
, respectively.
No
stock options were granted, vested or exercised during the period from November 15, 2010 to December 31, 2010.
F-21
Restricted Stock Units and Performance-Based Restricted Stock Units
Under the 2009 Performance Incentive Plan, restricted stock units and performance-based restricted stock units generally have a contractual life or vest over a
three
- to
five
-year period. The vesting of certain restricted stock units may accelerate, as defined in the grant, upon retirement, a change in control and other events. When vested, each performance-based restricted stock unit is convertible into one share of common stock. The restricted stock units are valued on the grant date based on the market price of the Company's common stock on that date. Generally, the Company recognizes the fair value of the awards over the applicable vesting period as compensation expense. In addition, since the shares to be issued may vary based on the performance of the Company, the Company must make assumptions regarding the projected performance criteria and the shares that will ultimately be issued. The amount of FFO Units that will ultimately vest is dependent on the amount by which the Company's funds from operation ("FFO") differs from a target FFO amount for a period specified in each grant and will range from
0%
to
200%
of the FFO Units initially granted. Similarly, the amount of TSR Units that will ultimately vest is dependent on the amount by which the total shareholder return ("TSR") of the Company's common stock differs from a predefined peer group for a period specified in each grant and will range from
0%
to
150%
of the TSR Units initially granted. Upon any payment of restricted stock units, the participant is required to pay the related tax withholding obligation. The 2009 Performance Incentive Plan provides that unless otherwise elected in advance by the participant, the Company will reduce the number of shares to be delivered to pay the related statutory tax withholding obligation. The value of the shares withheld is dependent on the closing price of the Company's common stock on the date the relevant transaction occurs.
The following table summarizes additional information concerning restricted stock units at
December 31, 2012
(dollars in thousands, except per share amounts):
|
Restricted Stock Units
|
Weighted Average Grant Date Fair Value Per Unit
|
||||||
|
Unvested as of December 31, 2011
|
443,210
|
|
$
|
17.13
|
|
||
|
Granted
|
319,583
|
|
18.34
|
|
|||
|
Vested
|
(116,536
|
)
|
17.65
|
|
|||
|
Forfeited
|
(4,938
|
)
|
15.40
|
|
|||
|
Dividends reinvested
|
48,788
|
|
17.38
|
|
|||
|
Unvested as of December 31, 2012
|
690,107
|
|
$
|
17.64
|
|
||
As of December 31, 2012, the weighted average remaining vesting period of restricted stock units was
2.0
years. The weighted average fair value per share at the date of grant for restricted stock units for the years ended December 31, 2012 and 2011 and for the period from November 15, 2010 to December 31, 2010 was
$18.34
,
$18.33
and
$17.12
, respectively. The total fair value of units vested during the years ended
December 31, 2012
and 2011 was
$2.1 million
and
$1.3 million
, respectively.
No
restricted stock units vested during the period from November 15, 2010 to December 31, 2010.
The fair value of the TSR Units are estimated on the date of grant using a Monte Carlo valuation model that uses the assumptions noted in the table below. The risk-free rate is based on the U.S. Treasury yield curve in effect at the grant date for the expected performance period. Expected volatility was based on historical volatility for the most recent
3
-year period ending on the grant date for the Company and the selected peer companies, and calculated on a daily basis. The following are the key assumptions used in this valuation:
|
2012
|
2011
|
2010
|
||||||
|
Risk Free Interest Rate:
|
0.38 % - 0.40%
|
|
1.18
|
%
|
0.72
|
%
|
||
|
Expected Stock Price Volatility:
|
36.41% - 48.05%
|
|
49.2
|
%
|
50.4
|
%
|
||
|
Expected Service Period:
|
3.0 years
|
|
2.7 years
|
|
3.0 years
|
|
||
|
Expected Dividend Yield (assuming full reinvestment):
|
—
|
%
|
—
|
%
|
—
|
%
|
||
During the years ended
December 31, 2012
and 2011 and the period from the Separation Date through December 31, 2010, the Company recognized
$8.3 million
,
$4.6 million
and
$0.3 million
, respectively, in stock-based compensation expense. As of
December 31, 2012
, there was
$6.5 million
of total unrecognized stock-based compensation expense related to unvested awards, which is expected to be recognized over a weighted average period of
2.2
years.
F-22
Employee Benefit Plan
The Company maintains a 401(k) plan that allows for eligible participants to defer compensation, subject to certain limitations imposed by the Internal Revenue Code of 1986, as amended (the “Code”). The Company provides a discretionary matching contribution of up to
3%
of each participant's eligible compensation. During the years ended
December 31, 2012
and 2011, the Company's matching contributions were approximately
$25,000
and
$27,000
, respectively. There were
no
matching contributions during the period from the Separation Date through December 31, 2010.
|
13.
|
INCOME TAXES
|
The Company elected to be treated as a REIT with the filing of its U.S. federal income tax return for the taxable year beginning January 1, 2011 and, therefore, the Company did
not
incur any income tax expense during the years ended December 31, 2012 and 2011. Taxable income generated during the period preceding this election is subject to federal and state income taxes. During the period from the Separation Date through December 31, 2010, the Company recognized
$0.2 million
of income tax expense as follows (in thousands):
|
Current
|
$
|
—
|
|
|
Deferred
|
242
|
|
|
|
|
|
|
|
|
Total income tax expense
|
$
|
242
|
|
|
|
|
||
Income tax expense for the period from the Separation Date through December 31, 2010 is reconciled to the amount computed by applying the corporate tax rate as follows (in thousands):
|
Tax at statutory rate on income before income taxes
|
$
|
100
|
|
|
Other
|
142
|
|
|
|
|
|
|
|
|
Income tax expense
|
$
|
242
|
|
|
|
|
||
The Company is subject to corporate income tax on built-in gains (the excess of fair market value over tax basis on properties held by Sabra as of the date Sabra elected to be taxed as a REIT, or January 1, 2011) on taxable dispositions of properties acquired in the REIT Conversion Merger during the first ten years following the election to be taxed as a REIT. As of January 1, 2011, the built-in-gains tax associated with the Company’s properties totaled approximately
$145.8 million
assuming a
40%
corporate tax rate. This built-in gains tax is generally not payable on dispositions of property to the extent the proceeds from such dispositions are reinvested in qualifying like-kind replacement property as defined under various provisions of the Code. The Company does not expect to dispose of any properties held by Sabra at the Separation Date, if such a disposition would result in the imposition of a material tax liability. Gains from asset dispositions occurring more than 10 years after the acquisition will not be subject to this corporate-level tax. As a result, the Company has not recorded a deferred tax liability associated with this corporate-level tax.
The following is a reconciliation of the Company’s beginning and ending unrecognized tax benefits (in thousands):
|
|
|
|
|
|
Balance at December 31, 2010
|
$
|
26,300
|
|
|
Additions (reductions) based on prior years’ tax positions
|
(760
|
)
|
|
|
Additions (reductions) based on 2011 tax positions
|
—
|
|
|
|
|
|
||
|
Balance at December 31, 2011
|
25,540
|
|
|
|
Additions (reductions) based on prior years’ tax positions
|
(1,328
|
)
|
|
|
Additions (reductions) based on 2012 tax positions
|
—
|
|
|
|
Balance at December 31, 2012
|
$
|
24,212
|
|
The Company does not anticipate that the balance in unrecognized tax benefits will change materially in fiscal year 2013. During the period from the Separation Date through December 31, 2012, neither the Company nor its subsidiaries were assessed interest or penalties by any major tax jurisdictions. There would be no effect on the Company’s tax rate if the unrecognized tax benefits were to result in additional taxes owed due to the availability of net operating loss (“NOL”) carryforwards. The NOL carryforwards are recorded as deferred tax assets and have expiration dates from 2019 through 2027.
F-23
With certain exceptions, the Company is no longer subject to U.S. federal, state or local income tax examinations for years before 2009. For the years before 2009, these jurisdictions can, however, adjust NOL carryforwards from earlier years.
|
14.
|
EARNINGS PER COMMON SHARE
|
The following table illustrates the computation of basic and diluted earnings per share for the
years
ended
December 31, 2012
and 2011 and for the period from the
Separation Date through December 31, 2010
(in thousands, except share and per share amounts):
|
Year Ended December 31,
|
Period from November 15, 2010 to December 31, 2010
|
||||||||||
|
2012
|
2011
|
||||||||||
|
Numerator
|
|||||||||||
|
Net income
|
$
|
19,513
|
|
$
|
12,842
|
|
$
|
7
|
|
||
|
|
|
||||||||||
|
Denominator
|
|||||||||||
|
Basic weighted average common shares
|
37,061,111
|
|
30,109,417
|
|
25,110,936
|
|
|||||
|
Dilutive stock options and restricted stock units
|
260,406
|
|
61,808
|
|
76,052
|
|
|||||
|
|
|
||||||||||
|
Diluted weighted average common shares
|
37,321,517
|
|
30,171,225
|
|
25,186,988
|
|
|||||
|
|
|||||||||||
|
Net income per common share, basic
|
$
|
0.53
|
|
$
|
0.43
|
|
$
|
—
|
|
||
|
|
|
||||||||||
|
Net income per common share, diluted
|
$
|
0.52
|
|
$
|
0.43
|
|
$
|
—
|
|
||
Certain restricted stock units are considered participating securities because dividend payments are not forfeited even if the underlying award does not vest. Accordingly, the Company uses the two-class method when computing basic and diluted earnings per share. During the
years
ended
December 31, 2012
and 2011 and for the period from the
Separation Date through December 31, 2010
, approximately
27,000
,
2,400
and
200
restricted stock units, respectively, were not included because they were anti-dilutive. During the years ended
December 31, 2012
and 2011 and for the period from the
Separation Date through December 31, 2010
, approximately
60,000
,
173,000
and
50,000
stock options, respectively, were not included because they were anti-dilutive.
15.
SUMMARIZED CONSOLIDATING INFORMATION
In connection with the offering of the Senior Notes by the Issuers in October 2010, the Company and certain
100%
owned subsidiaries of the Company (the “Guarantors”) have, jointly and severally, fully and unconditionally guaranteed the Senior Notes, subject to release under certain customary circumstances as described below. These guarantees are subordinated to all existing and future senior debt and senior guarantees of the Guarantors and are unsecured. The Company conducts all of its business through and derives virtually all of its income from its subsidiaries. Therefore, the Company’s ability to make required payments with respect to its indebtedness (including the Senior Notes) and other obligations depends on the financial results and condition of its subsidiaries and its ability to receive funds from its subsidiaries.
A Guarantor will be automatically and unconditionally released from its obligations under the guarantees with respect to the Senior Notes in the event of:
|
•
|
Any sale of the subsidiary Guarantor or of all or substantially all of its assets;
|
|
•
|
A merger or consolidation of a subsidiary Guarantor with an issuer of the Senior Notes or another Guarantor, provided that the surviving entity remains a Guarantor;
|
|
•
|
A subsidiary Guarantor is declared “unrestricted” for covenant purposes under the Indenture governing the Senior Notes;
|
|
•
|
The requirements for legal defeasance or covenant defeasance or to discharge the Indenture have been satisfied;
|
|
•
|
A liquidation or dissolution, to the extent permitted under the Indenture, of a subsidiary Guarantor; and
|
F-24
|
•
|
The release or discharge of the guaranty that resulted in the creation of the subsidiary guaranty, except a discharge or release by or as a result of payment under such guaranty.
|
Pursuant to Rule 3-10 of Regulation S-X, the following summarized consolidating information is provided for the Company (the “Parent Company”), the Issuers, the Guarantors, and the Company’s non-Guarantor subsidiaries with respect to the Senior Notes. This summarized financial information has been prepared from the books and records maintained by the Company, the Issuers, the Guarantors and the non-Guarantor subsidiaries. The summarized financial information may not necessarily be indicative of the results of operations or financial position had the Issuers, the Guarantors or non-Guarantor subsidiaries operated as independent entities. Sabra’s investments in its consolidated subsidiaries are presented based upon Sabra’s proportionate share of each subsidiary’s net assets. The Guarantor subsidiaries’ investments in the non-Guarantor subsidiaries and non-Guarantor subsidiaries’ investments in Guarantor subsidiaries are presented under the equity method of accounting. Intercompany activities between subsidiaries and the Parent Company are presented within operating activities on the consolidating statement of cash flows.
Consolidating financial statements for the Company and its subsidiaries, including the Parent Company only, the Issuers, the combined Guarantor subsidiaries and the combined non-Guarantor subsidiaries, are as follows:
F-25
CONSOLIDATING BALANCE SHEET
December 31, 2012
(in thousands, except share and per share amounts)
|
Parent
Company
|
Issuers
|
Combined
Guarantor
Subsidiaries
|
Combined Non-
Guarantor
Subsidiaries
|
Elimination
|
Consolidated
|
||||||||||||||||||
|
Assets
|
|||||||||||||||||||||||
|
Real estate investments, net of accumulated depreciation
|
$
|
151
|
|
$
|
—
|
|
$
|
655,881
|
|
$
|
171,103
|
|
$
|
—
|
|
$
|
827,135
|
|
|||||
|
Loans receivable, net
|
—
|
|
—
|
|
12,017
|
|
—
|
|
—
|
|
12,017
|
|
|||||||||||
|
Cash and cash equivalents
|
15,075
|
|
—
|
|
—
|
|
2,026
|
|
—
|
|
17,101
|
|
|||||||||||
|
Restricted cash
|
—
|
|
—
|
|
92
|
|
4,497
|
|
—
|
|
4,589
|
|
|||||||||||
|
Deferred tax assets
|
24,212
|
|
—
|
|
—
|
|
—
|
|
—
|
|
24,212
|
|
|||||||||||
|
Assets held for sale, net
|
—
|
|
—
|
|
—
|
|
2,215
|
|
—
|
|
2,215
|
|
|||||||||||
|
Prepaid expenses, deferred financing costs and other assets
|
1,315
|
|
7,339
|
|
18,133
|
|
2,826
|
|
—
|
|
29,613
|
|
|||||||||||
|
Intercompany
|
125,596
|
|
227,396
|
|
—
|
|
37,466
|
|
(390,458
|
)
|
—
|
|
|||||||||||
|
Investment in subsidiaries
|
166,632
|
|
266,975
|
|
23,142
|
|
—
|
|
(456,749
|
)
|
—
|
|
|||||||||||
|
Total assets
|
$
|
332,981
|
|
$
|
501,710
|
|
$
|
709,265
|
|
$
|
220,133
|
|
$
|
(847,207
|
)
|
$
|
916,882
|
|
|||||
|
Liabilities and stockholders’ equity
|
|||||||||||||||||||||||
|
Mortgage notes payable
|
$
|
—
|
|
$
|
—
|
|
$
|
—
|
|
$
|
152,322
|
|
$
|
—
|
|
$
|
152,322
|
|
|||||
|
Secured revolving credit facility
|
—
|
|
—
|
|
92,500
|
|
—
|
|
—
|
|
92,500
|
|
|||||||||||
|
Senior unsecured notes payable
|
—
|
|
330,666
|
|
—
|
|
—
|
|
—
|
|
330,666
|
|
|||||||||||
|
Accounts payable and accrued liabilities
|
3,281
|
|
4,412
|
|
3,348
|
|
653
|
|
—
|
|
11,694
|
|
|||||||||||
|
Tax liability
|
24,212
|
|
—
|
|
—
|
|
—
|
|
—
|
|
24,212
|
|
|||||||||||
|
Intercompany
|
—
|
|
—
|
|
390,458
|
|
—
|
|
(390,458
|
)
|
—
|
|
|||||||||||
|
Total liabilities
|
27,493
|
|
335,078
|
|
486,306
|
|
152,975
|
|
(390,458
|
)
|
611,394
|
|
|||||||||||
|
Stockholders’ equity:
|
|||||||||||||||||||||||
|
Preferred stock, $.01 par value; 10,000,000 shares authorized, zero shares issued and outstanding as of December 31, 2012
|
—
|
|
—
|
|
—
|
|
—
|
|
—
|
|
—
|
|
|||||||||||
|
Common stock, $.01 par value; 125,000,000 shares authorized, 37,099,209 shares issued and outstanding as of December 31, 2012
|
371
|
|
—
|
|
—
|
|
—
|
|
—
|
|
371
|
|
|||||||||||
|
Additional paid-in capital
|
353,861
|
|
107,939
|
|
136,666
|
|
53,952
|
|
(298,557
|
)
|
353,861
|
|
|||||||||||
|
Cumulative distributions in excess of net income
|
(48,744
|
)
|
58,693
|
|
86,293
|
|
13,206
|
|
(158,192
|
)
|
(48,744
|
)
|
|||||||||||
|
Total stockholders’ equity
|
305,488
|
|
166,632
|
|
222,959
|
|
67,158
|
|
(456,749
|
)
|
305,488
|
|
|||||||||||
|
Total liabilities and stockholders’ equity
|
$
|
332,981
|
|
$
|
501,710
|
|
$
|
709,265
|
|
$
|
220,133
|
|
$
|
(847,207
|
)
|
$
|
916,882
|
|
|||||
F-26
CONSOLIDATING BALANCE SHEET
December 31, 2011
(in thousands, except share and per share amounts)
|
Parent
Company
|
Issuers
|
Combined
Guarantor
Subsidiaries
|
Combined Non-
Guarantor
Subsidiaries
|
Elimination
|
Consolidated
|
||||||||||||||||||
|
Assets
|
|||||||||||||||||||||||
|
Real estate investments, net of accumulated depreciation
|
$
|
187
|
|
$
|
—
|
|
$
|
474,256
|
|
$
|
178,934
|
|
$
|
—
|
|
$
|
653,377
|
|
|||||
|
Cash and cash equivalents
|
41,736
|
|
—
|
|
—
|
|
514
|
|
—
|
|
42,250
|
|
|||||||||||
|
Restricted cash
|
—
|
|
—
|
|
—
|
|
6,093
|
|
—
|
|
6,093
|
|
|||||||||||
|
Deferred tax assets
|
25,540
|
|
—
|
|
—
|
|
—
|
|
—
|
|
25,540
|
|
|||||||||||
|
Assets held for sale, net
|
—
|
|
—
|
|
—
|
|
5,243
|
|
—
|
|
5,243
|
|
|||||||||||
|
Prepaid expenses, deferred financing costs and other assets
|
874
|
|
5,079
|
|
8,544
|
|
2,650
|
|
—
|
|
17,147
|
|
|||||||||||
|
Intercompany
|
—
|
|
145,018
|
|
—
|
|
25,237
|
|
(170,255
|
)
|
—
|
|
|||||||||||
|
Investment in subsidiaries
|
313,181
|
|
391,131
|
|
23,611
|
|
—
|
|
(727,923
|
)
|
—
|
|
|||||||||||
|
Total assets
|
$
|
381,518
|
|
$
|
541,228
|
|
$
|
506,411
|
|
$
|
218,671
|
|
$
|
(898,178
|
)
|
$
|
749,650
|
|
|||||
|
Liabilities and stockholders’ equity
|
|||||||||||||||||||||||
|
Mortgage notes payable
|
$
|
—
|
|
$
|
—
|
|
$
|
—
|
|
$
|
153,942
|
|
$
|
—
|
|
$
|
153,942
|
|
|||||
|
Senior unsecured notes payable
|
—
|
|
225,000
|
|
—
|
|
—
|
|
—
|
|
225,000
|
|
|||||||||||
|
Liabilities related to assets held for sale
|
—
|
|
—
|
|
—
|
|
4,485
|
|
—
|
|
4,485
|
|
|||||||||||
|
Accounts payable and accrued liabilities
|
6,296
|
|
3,047
|
|
4,107
|
|
660
|
|
—
|
|
14,110
|
|
|||||||||||
|
Tax liability
|
25,540
|
|
—
|
|
—
|
|
—
|
|
—
|
|
25,540
|
|
|||||||||||
|
Intercompany
|
23,109
|
|
—
|
|
147,146
|
|
—
|
|
(170,255
|
)
|
—
|
|
|||||||||||
|
Total liabilities
|
54,945
|
|
228,047
|
|
151,253
|
|
159,087
|
|
(170,255
|
)
|
423,077
|
|
|||||||||||
|
Stockholders’ equity:
|
|||||||||||||||||||||||
|
Preferred stock, $.01 par value; 10,000,000 shares authorized, zero shares issued and outstanding as of December 31, 2011
|
—
|
|
—
|
|
—
|
|
—
|
|
—
|
|
—
|
|
|||||||||||
|
Common stock, $.01 par value; 125,000,000 shares authorized, 36,891,712 shares issued and outstanding as of December 31, 2011
|
369
|
|
—
|
|
—
|
|
—
|
|
—
|
|
369
|
|
|||||||||||
|
Additional paid-in capital
|
344,995
|
|
288,665
|
|
316,011
|
|
52,110
|
|
(656,786
|
)
|
344,995
|
|
|||||||||||
|
Cumulative distributions in excess of net income
|
(18,791
|
)
|
24,516
|
|
39,147
|
|
7,474
|
|
(71,137
|
)
|
(18,791
|
)
|
|||||||||||
|
Total stockholders’ equity
|
326,573
|
|
313,181
|
|
355,158
|
|
59,584
|
|
(727,923
|
)
|
326,573
|
|
|||||||||||
|
Total liabilities and stockholders’ equity
|
$
|
381,518
|
|
$
|
541,228
|
|
$
|
506,411
|
|
$
|
218,671
|
|
$
|
(898,178
|
)
|
$
|
749,650
|
|
|||||
F-27
CONSOLIDATING STATEMENT OF INCOME
For the Year
December 31, 2012
(in thousands, except share and per share amounts)
|
Parent Company
|
Issuers
|
Combined
Guarantor
Subsidiaries
|
Combined Non-
Guarantor
Subsidiaries
|
Elimination
|
Consolidated
|
||||||||||||||||||
|
Revenues:
|
|||||||||||||||||||||||
|
Rental income
|
$
|
—
|
|
$
|
—
|
|
$
|
75,606
|
|
$
|
26,136
|
|
$
|
—
|
|
$
|
101,742
|
|
|||||
|
Interest income
|
18
|
|
—
|
|
1,410
|
|
—
|
|
—
|
|
1,428
|
|
|||||||||||
|
Total revenues
|
18
|
|
—
|
|
77,016
|
|
26,136
|
|
—
|
|
103,170
|
|
|||||||||||
|
Expenses:
|
|||||||||||||||||||||||
|
Depreciation and amortization
|
49
|
|
—
|
|
22,061
|
|
8,153
|
|
—
|
|
30,263
|
|
|||||||||||
|
Interest
|
—
|
|
22,392
|
|
2,724
|
|
11,889
|
|
—
|
|
37,005
|
|
|||||||||||
|
General and administrative
|
14,631
|
|
3
|
|
1,392
|
|
78
|
|
—
|
|
16,104
|
|
|||||||||||
|
Impairment
|
—
|
|
—
|
|
—
|
|
2,481
|
|
—
|
|
2,481
|
|
|||||||||||
|
Total expenses
|
14,680
|
|
22,395
|
|
26,177
|
|
22,601
|
|
—
|
|
85,853
|
|
|||||||||||
|
Other income
|
—
|
|
—
|
|
—
|
|
2,196
|
|
—
|
|
2,196
|
|
|||||||||||
|
Income (loss) in subsidiary
|
34,175
|
|
56,570
|
|
(3,693
|
)
|
—
|
|
(87,052
|
)
|
—
|
|
|||||||||||
|
Net income
|
$
|
19,513
|
|
$
|
34,175
|
|
$
|
47,146
|
|
$
|
5,731
|
|
$
|
(87,052
|
)
|
$
|
19,513
|
|
|||||
|
Net income per common share, basic
|
$
|
0.53
|
|
||||||||||||||||||||
|
Net income per common share, diluted
|
$
|
0.52
|
|
||||||||||||||||||||
|
Weighted-average number of common shares outstanding, basic
|
37,061,111
|
|
|||||||||||||||||||||
|
Weighted-average number of common shares outstanding, diluted
|
37,321,517
|
|
|||||||||||||||||||||
F-28
CONSOLIDATING STATEMENT OF INCOME
For the Year December 31, 2011
(in thousands, except share and per share amounts)
|
Parent Company
|
Issuers
|
Combined
Guarantor
Subsidiaries
|
Combined Non-
Guarantor
Subsidiaries
|
Elimination
|
Consolidated
|
||||||||||||||||||
|
Revenues:
|
|||||||||||||||||||||||
|
Rental income
|
$
|
—
|
|
$
|
—
|
|
$
|
55,447
|
|
$
|
25,231
|
|
$
|
—
|
|
$
|
80,678
|
|
|||||
|
Interest income
|
64
|
|
—
|
|
3,479
|
|
4
|
|
—
|
|
3,547
|
|
|||||||||||
|
Total revenues
|
64
|
|
—
|
|
58,926
|
|
25,235
|
|
—
|
|
84,225
|
|
|||||||||||
|
Expenses:
|
|||||||||||||||||||||||
|
Depreciation and amortization
|
53
|
|
—
|
|
18,144
|
|
8,394
|
|
—
|
|
26,591
|
|
|||||||||||
|
Interest
|
—
|
|
18,913
|
|
1,333
|
|
10,073
|
|
—
|
|
30,319
|
|
|||||||||||
|
General and administrative
|
9,905
|
|
1
|
|
4,476
|
|
91
|
|
—
|
|
14,473
|
|
|||||||||||
|
Total expenses
|
9,958
|
|
18,914
|
|
23,953
|
|
18,558
|
|
—
|
|
71,383
|
|
|||||||||||
|
Income in subsidiary
|
22,736
|
|
41,650
|
|
493
|
|
—
|
|
(64,879
|
)
|
—
|
|
|||||||||||
|
Net income
|
$
|
12,842
|
|
$
|
22,736
|
|
$
|
35,466
|
|
$
|
6,677
|
|
$
|
(64,879
|
)
|
$
|
12,842
|
|
|||||
|
Net income per common share, basic
|
$
|
0.43
|
|
||||||||||||||||||||
|
Net income per common share, diluted
|
$
|
0.43
|
|
||||||||||||||||||||
|
Weighted-average number of common shares outstanding, basic
|
30,109,417
|
|
|||||||||||||||||||||
|
Weighted-average number of common shares outstanding, diluted
|
30,171,225
|
|
|||||||||||||||||||||
F-29
CONSOLIDATING STATEMENT OF INCOME
For the
Period from November 15, 2010 to December 31, 2010
(in thousands, except share and per share amounts)
|
Parent Company
|
Issuers
|
Combined
Guarantor Subsidiaries |
Combined Non-
Guarantor Subsidiaries |
Elimination
|
Consolidated
|
||||||||||||||||||
|
Revenues:
|
|||||||||||||||||||||||
|
Rental income
|
$
|
—
|
|
$
|
—
|
|
$
|
5,635
|
|
$
|
3,146
|
|
$
|
—
|
|
$
|
8,781
|
|
|||||
|
Interest income
|
12
|
|
—
|
|
—
|
|
2
|
|
—
|
|
14
|
|
|||||||||||
|
Total revenues
|
12
|
|
—
|
|
5,635
|
|
3,148
|
|
—
|
|
8,795
|
|
|||||||||||
|
Expenses:
|
|||||||||||||||||||||||
|
Depreciation and amortization
|
—
|
|
—
|
|
2,031
|
|
1,103
|
|
—
|
|
3,134
|
|
|||||||||||
|
Interest
|
—
|
|
2,470
|
|
151
|
|
1,238
|
|
—
|
|
3,859
|
|
|||||||||||
|
General and administrative
|
1,543
|
|
—
|
|
—
|
|
10
|
|
—
|
|
1,553
|
|
|||||||||||
|
Total expenses
|
1,543
|
|
2,470
|
|
2,182
|
|
2,351
|
|
—
|
|
8,546
|
|
|||||||||||
|
Income in subsidiary
|
1,780
|
|
4,250
|
|
227
|
|
—
|
|
(6,257
|
)
|
—
|
|
|||||||||||
|
Income before income taxes
|
249
|
|
1,780
|
|
3,680
|
|
797
|
|
(6,257
|
)
|
249
|
|
|||||||||||
|
Income tax expense
|
242
|
|
—
|
|
—
|
|
—
|
|
—
|
|
242
|
|
|||||||||||
|
Net income
|
$
|
7
|
|
$
|
1,780
|
|
$
|
3,680
|
|
$
|
797
|
|
$
|
(6,257
|
)
|
$
|
7
|
|
|||||
|
Net income per common share, basic
|
$
|
—
|
|
||||||||||||||||||||
|
Net income per common share, diluted
|
$
|
—
|
|
||||||||||||||||||||
|
Weighted-average number of common shares outstanding, basic
|
25,110,936
|
|
|||||||||||||||||||||
|
Weighted-average number of common shares outstanding, diluted
|
25,186,988
|
|
|||||||||||||||||||||
F-30
CONSOLIDATING STATEMENT OF CASH FLOWS
For the
Year Ended
December 31, 2012
(in thousands)
|
Parent Company
|
Issuers
|
Combined
Guarantor Subsidiaries |
Combined Non-
Guarantor Subsidiaries |
Elimination
|
Consolidated
|
||||||||||||||||||
|
Net cash provided by operating activities
|
$
|
53,584
|
|
$
|
—
|
|
$
|
—
|
|
$
|
2,668
|
|
$
|
—
|
|
$
|
56,252
|
|
|||||
|
Cash flows from investing activities:
|
|||||||||||||||||||||||
|
Acquisitions of real estate
|
—
|
|
—
|
|
(205,424
|
)
|
—
|
|
—
|
|
(205,424
|
)
|
|||||||||||
|
Origination of note receivable
|
—
|
|
—
|
|
(22,180
|
)
|
—
|
|
—
|
|
(22,180
|
)
|
|||||||||||
|
Additions to real estate
|
(14
|
)
|
—
|
|
(1,032
|
)
|
—
|
|
—
|
|
(1,046
|
)
|
|||||||||||
|
Repayment of note receivable
|
—
|
|
—
|
|
10,000
|
|
—
|
|
—
|
|
10,000
|
|
|||||||||||
|
Investment in Subsidiary
|
(7,191
|
)
|
(7,191
|
)
|
—
|
|
—
|
|
14,382
|
|
—
|
|
|||||||||||
|
Distribution from Subsidiary
|
1,751
|
|
1,751
|
|
—
|
|
—
|
|
(3,502
|
)
|
—
|
|
|||||||||||
|
Intercompany financing
|
(25,915
|
)
|
(128,721
|
)
|
—
|
|
—
|
|
154,636
|
|
—
|
|
|||||||||||
|
Net cash used in investing activities
|
(31,369
|
)
|
(134,161
|
)
|
(218,636
|
)
|
—
|
|
165,516
|
|
(218,650
|
)
|
|||||||||||
|
Cash flows from financing activities:
|
|||||||||||||||||||||||
|
Proceeds from secured revolving credit facility
|
—
|
|
—
|
|
135,000
|
|
—
|
|
—
|
|
135,000
|
|
|||||||||||
|
Proceeds from mortgage notes payable
|
—
|
|
—
|
|
—
|
|
56,651
|
|
—
|
|
56,651
|
|
|||||||||||
|
Proceeds from issuance of senior unsecured notes
|
—
|
|
106,000
|
|
—
|
|
—
|
|
—
|
|
106,000
|
|
|||||||||||
|
Payments on secured revolving credit facility
|
—
|
|
—
|
|
(42,500
|
)
|
—
|
|
—
|
|
(42,500
|
)
|
|||||||||||
|
Principal payments on mortgage notes payable
|
—
|
|
—
|
|
—
|
|
(62,226
|
)
|
—
|
|
(62,226
|
)
|
|||||||||||
|
Payments of deferred financing costs
|
—
|
|
(3,194
|
)
|
(2,585
|
)
|
(1,021
|
)
|
—
|
|
(6,800
|
)
|
|||||||||||
|
Issuance of common stock
|
53
|
|
—
|
|
—
|
|
—
|
|
—
|
|
53
|
|
|||||||||||
|
Dividends paid
|
(48,929
|
)
|
—
|
|
—
|
|
—
|
|
—
|
|
(48,929
|
)
|
|||||||||||
|
Contribution from Parent
|
—
|
|
7,191
|
|
—
|
|
7,191
|
|
(14,382
|
)
|
—
|
|
|||||||||||
|
Distribution to Parent
|
—
|
|
(1,751
|
)
|
—
|
|
(1,751
|
)
|
3,502
|
|
—
|
|
|||||||||||
|
Intercompany financing
|
—
|
|
25,915
|
|
128,721
|
|
—
|
|
(154,636
|
)
|
—
|
|
|||||||||||
|
Net cash (used in) provided by financing activities
|
(48,876
|
)
|
134,161
|
|
218,636
|
|
(1,156
|
)
|
(165,516
|
)
|
137,249
|
|
|||||||||||
|
Net (decrease) increase in cash and cash equivalents
|
(26,661
|
)
|
—
|
|
—
|
|
1,512
|
|
—
|
|
(25,149
|
)
|
|||||||||||
|
Cash and cash equivalents, beginning of period
|
41,736
|
|
—
|
|
—
|
|
514
|
|
—
|
|
42,250
|
|
|||||||||||
|
Cash and cash equivalents, end of period
|
$
|
15,075
|
|
$
|
—
|
|
$
|
—
|
|
$
|
2,026
|
|
$
|
—
|
|
$
|
17,101
|
|
|||||
F-31
CONSOLIDATING STATEMENT OF CASH FLOWS
For the
Year Ended
December 31, 2011
(in thousands)
|
Parent Company
|
Issuers
|
Combined
Guarantor Subsidiaries |
Combined Non-
Guarantor Subsidiaries |
Elimination
|
Consolidated
|
||||||||||||||||||
|
Net cash provided by operating activities
|
$
|
41,298
|
|
$
|
—
|
|
$
|
—
|
|
$
|
3,407
|
|
$
|
—
|
|
$
|
44,705
|
|
|||||
|
Cash flows from investing activities:
|
|||||||||||||||||||||||
|
Acquisitions of real estate
|
—
|
|
—
|
|
(204,500
|
)
|
—
|
|
—
|
|
(204,500
|
)
|
|||||||||||
|
Acquisition of note receivable
|
(5,348
|
)
|
—
|
|
—
|
|
—
|
|
—
|
|
(5,348
|
)
|
|||||||||||
|
Additions to real estate
|
(86
|
)
|
—
|
|
—
|
|
—
|
|
—
|
|
(86
|
)
|
|||||||||||
|
Repayment of note receivable
|
5,348
|
|
—
|
|
—
|
|
—
|
|
—
|
|
5,348
|
|
|||||||||||
|
Investment in Subsidiary
|
(164,030
|
)
|
(96
|
)
|
—
|
|
—
|
|
164,126
|
|
—
|
|
|||||||||||
|
Distribution from Subsidiary
|
3,307
|
|
3,307
|
|
—
|
|
—
|
|
(6,614
|
)
|
—
|
|
|||||||||||
|
Intercompany financing
|
(41,196
|
)
|
(204,700
|
)
|
—
|
|
—
|
|
245,896
|
|
—
|
|
|||||||||||
|
Net cash used in investing activities
|
(202,005
|
)
|
(201,489
|
)
|
(204,500
|
)
|
—
|
|
403,408
|
|
(204,586
|
)
|
|||||||||||
|
Cash flows from financing activities:
|
|||||||||||||||||||||||
|
Principal payments on mortgage notes payable
|
—
|
|
—
|
|
—
|
|
(3,027
|
)
|
—
|
|
(3,027
|
)
|
|||||||||||
|
Payments of deferred financing costs
|
—
|
|
(430
|
)
|
(200
|
)
|
(47
|
)
|
—
|
|
(677
|
)
|
|||||||||||
|
Issuance of common stock
|
163,242
|
|
—
|
|
—
|
|
—
|
|
—
|
|
163,242
|
|
|||||||||||
|
Dividends paid
|
(31,640
|
)
|
—
|
|
—
|
|
—
|
|
—
|
|
(31,640
|
)
|
|||||||||||
|
Contribution from Parent
|
—
|
|
164,030
|
|
—
|
|
96
|
|
(164,126
|
)
|
—
|
|
|||||||||||
|
Distribution to Parent
|
—
|
|
(3,307
|
)
|
—
|
|
(3,307
|
)
|
6,614
|
|
—
|
|
|||||||||||
|
Intercompany financing
|
—
|
|
41,196
|
|
204,700
|
|
—
|
|
(245,896
|
)
|
—
|
|
|||||||||||
|
Net cash provided by (used in) financing activities
|
131,602
|
|
201,489
|
|
204,500
|
|
(6,285
|
)
|
(403,408
|
)
|
127,898
|
|
|||||||||||
|
Net decrease in cash and cash equivalents
|
(29,105
|
)
|
—
|
|
—
|
|
(2,878
|
)
|
—
|
|
(31,983
|
)
|
|||||||||||
|
Cash and cash equivalents, beginning of period
|
70,841
|
|
—
|
|
—
|
|
3,392
|
|
—
|
|
74,233
|
|
|||||||||||
|
Cash and cash equivalents, end of period
|
$
|
41,736
|
|
$
|
—
|
|
$
|
—
|
|
$
|
514
|
|
$
|
—
|
|
$
|
42,250
|
|
|||||
F-32
CONSOLIDATING STATEMENT OF CASH FLOWS
For the
Period from November 15, 2010 to December 31, 2010
(in thousands, except share and per share amounts)
|
Parent Company
|
Issuers
|
Combined
Guarantor Subsidiaries |
Combined Non-
Guarantor Subsidiaries |
Elimination
|
Consolidated
|
||||||||||||||||||
|
Net cash provided by operating activities
|
$
|
5,844
|
|
$
|
—
|
|
$
|
—
|
|
$
|
748
|
|
$
|
—
|
|
$
|
6,592
|
|
|||||
|
Cash flows from investing activities:
|
|||||||||||||||||||||||
|
Cash received in the Separation
|
63,747
|
|
—
|
|
—
|
|
3,387
|
|
—
|
|
67,134
|
|
|||||||||||
|
Additions to real estate
|
(16
|
)
|
—
|
|
—
|
|
—
|
|
—
|
|
(16
|
)
|
|||||||||||
|
Intercompany financing
|
10,355
|
|
10,355
|
|
—
|
|
—
|
|
(20,710
|
)
|
—
|
|
|||||||||||
|
Net cash provided by investing activities
|
74,086
|
|
10,355
|
|
—
|
|
3,387
|
|
(20,710
|
)
|
67,118
|
|
|||||||||||
|
Cash flows from financing activities:
|
|||||||||||||||||||||||
|
Proceeds from notes payables
|
—
|
|
—
|
|
—
|
|
10,000
|
|
—
|
|
10,000
|
|
|||||||||||
|
Payment of Separation-related obligations
|
(8,928
|
)
|
—
|
|
—
|
|
(153
|
)
|
—
|
|
(9,081
|
)
|
|||||||||||
|
Intercompany financing
|
—
|
|
(10,355
|
)
|
—
|
|
(10,355
|
)
|
20,710
|
|
—
|
|
|||||||||||
|
Principal payments on mortgage notes payable
|
—
|
|
—
|
|
—
|
|
(235
|
)
|
—
|
|
(235
|
)
|
|||||||||||
|
Payments of deferred financing costs
|
(161
|
)
|
—
|
|
—
|
|
—
|
|
—
|
|
(161
|
)
|
|||||||||||
|
Net cash provided by (used in) financing activities
|
(9,089
|
)
|
(10,355
|
)
|
—
|
|
(743
|
)
|
20,710
|
|
523
|
|
|||||||||||
|
Net increase in cash and cash equivalents
|
70,841
|
|
—
|
|
—
|
|
3,392
|
|
—
|
|
74,233
|
|
|||||||||||
|
Cash and cash equivalents, beginning of period
|
—
|
|
—
|
|
—
|
|
—
|
|
—
|
|
—
|
|
|||||||||||
|
Cash and cash equivalents, end of period
|
$
|
70,841
|
|
$
|
—
|
|
$
|
—
|
|
$
|
3,392
|
|
$
|
—
|
|
$
|
74,233
|
|
|||||
F-33
|
16.
|
PRO FORMA FINANCIAL INFORMATION (UNAUDITED)
|
The following table summarizes, on an unaudited pro forma basis, the consolidated results of operations of the Company for the
years
ended
December 31, 2012
and 2011. The Company acquired
23
properties, originated
three
loans receivable, issued an additional
$100.0 million
aggregate principal amount of 8.125% Senior Notes, refinanced
six
mortgage notes, paid off
one
mortgage note, amended the master lease agreement with Genesis to a fixed 2.5% rent escalator during the year ended December 31, 2012 and had net borrowings of
$92.5 million
under its Amended Secured Revolving Credit Facility as of
December 31, 2012
. The following unaudited pro forma information has been prepared to give effect to these transactions, and the
eleven
acquisitions that occurred during the year ended December 31, 2011, as well as the offering of
11.7 million
shares of common stock that closed in August 2011, as if they had occurred on January 1, 2011. This pro forma information does not purport to represent what the actual results of operations of the Company would have been had these acquisitions occurred on this date, nor does it purport to predict the results of operations for future periods (in thousands, except share and per share amounts):
|
Year Ended December 31, 2012
|
Year Ended December 31, 2011
|
|||||||
|
Revenues
|
$
|
127,043
|
|
$
|
130,470
|
|
||
|
Depreciation and amortization
|
34,226
|
|
35,370
|
|
||||
|
Net income
|
37,631
|
|
43,765
|
|
||||
|
Net income per common share, basic
|
1.02
|
|
1.19
|
|
||||
|
Net income per common share, diluted
|
1.01
|
|
1.18
|
|
||||
|
Weighted-average number of common shares outstanding, basic
|
37,061,111
|
|
36,922,458
|
|
||||
|
Weighted-average number of common shares outstanding, diluted
|
37,321,517
|
|
36,984,266
|
|
||||
17.
COMMITMENTS AND CONTINGENCIES
Environmental
As an owner of real estate, the Company is subject to various environmental laws of federal, state and local governments. The Company is not aware of any environmental liability that could have a material adverse effect on its financial condition or results of operations. However, changes in applicable environmental laws and regulations, the uses and conditions of properties in the vicinity of the Company’s properties, the activities of its tenants and other environmental conditions of which the Company is unaware with respect to the properties could result in future environmental liabilities. Compliance with existing environmental laws is not expected to have a material adverse effect on the Company’s financial condition and results of operations as of
December 31, 2012
.
Separation and REIT Conversion Merger
On May 24, 2010, Old Sun announced its intention to restructure its business by separating its real estate assets and its operating assets into two separate publicly traded companies, Sabra and SHG Services Inc. (which was then renamed “Sun Healthcare Group, Inc.” or “Sun”). In order to effect the restructuring, Old Sun distributed to its stockholders on a pro rata basis all of the outstanding shares of common stock of Sun (this distribution is referred to as the “Separation”), together with an additional cash distribution. Immediately following the Separation, Old Sun merged with and into Sabra, with Sabra surviving the merger and Old Sun stockholders receiving shares of Sabra common stock in exchange for their shares of Old Sun common
stock (this merger is referred to as the “REIT Conversion Merger”). Effective November 15, 2010, the Separation and REIT Conversion Merger were completed and Sabra and Sun began operations as separate companies.
stock (this merger is referred to as the “REIT Conversion Merger”). Effective November 15, 2010, the Separation and REIT Conversion Merger were completed and Sabra and Sun began operations as separate companies.
Following the Separation, Sun, through its subsidiaries, continued the business and operations of Old Sun and its subsidiaries. Sabra did not operate prior to the Separation. Immediately following the Separation, subsidiaries of Sabra owned substantially all of Old Sun’s owned real property. The owned real property held by subsidiaries of Sabra following the Separation includes fixtures and certain personal property associated with the real property. The historical consolidated financial statements of Old Sun became the historical consolidated financial statements of Sun at the time of the Separation. At the time of the Separation, the balance sheet of Sabra included the owned real property and mortgage indebtedness to third parties on the real property as well as indebtedness incurred by Sabra prior to completion of the Separation. The statements of income and cash flows of Sabra consist solely of its operations after the Separation. The Separation was accounted for as a reverse spinoff. Accordingly, Sabra’s assets and liabilities are recorded at the historical carrying values of Old Sun.
F-34
In connection with the Separation and REIT Conversion Merger, any liability arising from or relating to legal proceedings involving the Company’s real estate investments has been assumed by the Company and the Company will indemnify Sun (and its subsidiaries, directors, officers, employees and agents and certain other related parties) against any losses arising from or relating to such legal proceedings. In addition, pursuant to a distribution agreement entered into among Old Sun, the Company and Sun in connection with the Separation and REIT Conversion Merger, Sun has agreed to indemnify the Company (and the Company’s subsidiaries, directors, officers, employees and agents and certain other related parties) for any liability arising from or relating to legal proceedings involving Old Sun’s healthcare business prior to the Separation, and, pursuant to the lease agreements between the Company and subsidiaries of Sun, the tenants agree to indemnify the Company for any liability arising from operations at the real property leased from the Company.
Immediately prior to the Separation, Old Sun was a party to various legal actions and administrative proceedings, including various claims arising in the ordinary course of its healthcare business, which are subject to the indemnities to be provided by Sun to the Company. While these actions and proceedings are not believed to be material, individually or in the aggregate, the ultimate outcome of these matters cannot be predicted. The resolution of any such legal proceedings, either individually or in the aggregate, could have a material adverse effect on Sun’s business, financial position or results of operations, which, in turn, could have a material adverse effect on the Company’s business, financial position or results of operations if Sun or its subsidiaries are unable to meet their indemnification obligations.
For income tax purposes, the Company is the surviving taxpayer of the Separation. Accordingly, tax positions taken by Old Sun prior to the Separation remained the Company’s obligations after the Separation. However, under an agreement with Sun relating to tax allocation matters, Sun is responsible for and will indemnify the Company against, among other things, federal, state and local taxes (including penalties and interest) related to periods prior to the Separation to the extent the deferred tax assets allocated to the Company as part of the Separation are not sufficient and/or cannot be utilized to satisfy these taxes. After the 2010 tax year, the Company and Sun have agreed, to the extent allowable by applicable law, to allocate all net operating loss attributes generated in prior years to Sun. In addition, Sun will generally have the right to control the conduct and disposition of any tax audits or other proceedings with regard to such periods, and will be entitled to any refund or credit for such periods.
Effective December 1, 2012, Sun was acquired by Genesis HealthCare LLC (“Genesis”). As a result of its acquisition of Sun, Genesis became successor to the obligations of Sun described above.
Legal Matters
From time to time, the Company is party to legal proceedings that arise in the ordinary course of its business. Management is not aware of any legal proceedings where the likelihood of a loss contingency is reasonably possible and the amount or range of reasonably possible losses is material to the Company's results of operations, financial condition or cash flows.
|
18.
|
SUBSEQUENT EVENTS
|
The Company evaluates subsequent events up until the date the consolidated financial statements are issued.
Sun City West Mortgage Loan Origination
On January 31, 2013, the Company entered into a
$12.8 million
mortgage loan agreement with an affiliate of New Dawn Holding Company ("New Dawn") secured by a first trust deed on a
48
-unit memory care facility located in Sun City West, Arizona ("Sun City West Mortgage Loan"). The Sun City West Mortgage Loan has a five-year term, bears interest at a fixed rate of
9.0%
per annum and cannot be prepaid during the first
three
years of the loan term. In addition, beginning April 2014, the Company has an option to purchase the facility securing the Sun City West Mortgage Loan for a price equal to the greater of (a) the annualized earnings before interest, taxes, depreciation, amortization and rent of the facility for the trailing three months prior to option exercise, divided by an EBITDAR coverage ratio of
1.30
and further divided by an implied lease rate of
8.25%
(subject to adjustment up to
9.00%
), and (b)
$15.0 million
. In the event the Company exercises the purchase option, the Company would expect to enter into a long-term lease with affiliates of New Dawn with an initial cash yield consistent with the lease rate used to determine the option exercise price. The facility was built in 2012 and is operated by affiliates of New Dawn. The Sun City West Mortgage Loan was funded with available cash.
Bee Cave Preferred Equity Investment
On March 5, 2013, the Company entered into an agreement to provide up to
$7.2 million
of preferred equity funding to an affiliate of Meridian Realty Advisors, L.P. (“Meridian”) for the construction of a
141
-bed skilled nursing facility and a
52
- unit memory care facility in Austin, Texas (collectively, the “Bee Cave Preferred Equity Investments”). The Company funded
$4.3 million
at closing. In addition, the Company received an option to purchase the skilled nursing facility on or after the
F-35
earlier to occur of the facility achieving and maintaining
90%
occupancy for three consecutive months, or
36
months after receiving the certificate of occupancy for the facility. The Company also received an option to purchase the memory care facility that is not expected to be exercised as it is subordinate to a purchase option given to the manager of the memory care facility. Upon exercise of the purchase option on the skilled nursing facility, the Company would expect to lease the facility to Meridian under a long-term, triple net lease. The Company's preferred equity investment with respect to the skilled nursing facility provides for an annual
15%
preferred rate of return, which will accrue on a quarterly compounding basis with payment of the preferred return deferred until the earlier of the closing under the purchase option, or
18
months after receiving a certificate of occupancy for the facility. The Company's preferred equity investment with respect to the memory care facility provides for an annual
15%
preferred rate of return, which will accrue on a quarterly compounding basis with payment of the preferred return deferred until the earlier of the closing under the purchase option (whether by the manager of the facility or by the Company), or
30
months after receiving a certificate of occupancy for the facility.
F-36
SCHEDULE III
REAL ESTATE ASSETS AND ACCUMULATED DEPRECIATION
December 31, 2012
(dollars in thousands)
|
Initial Cost to Company
|
Cost Capitalized Subsequent to Acquisition
|
Gross Amount at which Carried at Close of Period
|
Life on Which Depreciation in Latest Income Statement is Computed
|
|||||||||||||||||||||||||||||||||
|
Description
|
Location
|
Ownership Percentage
|
Encum- brances
|
Land
|
Building and Improve- ments
(1)
|
Total
|
Land
|
Building and Improve- ments
(1)(7)
|
Total
|
Accumulated Depreciation and Amortization
|
Original Date of Construction/ Renovation
|
Date Acquired
|
||||||||||||||||||||||||
|
Skilled Nursing/Post-Acute Facilities
|
|
|
|
|
|
|
|
|
|
|
|
|
||||||||||||||||||||||||
|
New Martinsville
|
New Martinsville, WV
|
100%
|
$
(3)
|
|
$
|
475
|
|
$
|
10,543
|
|
$
|
11,018
|
|
—
|
|
$
|
475
|
|
$
|
10,496
|
|
$
|
10,971
|
|
$
|
(3,033
|
)
|
1982
|
11/15/10
|
39
|
||||||
|
Glenville
|
Glenville, WV
|
100%
|
—
|
|
484
|
|
2,839
|
|
3,323
|
|
—
|
|
484
|
|
2,827
|
|
3,311
|
|
(487
|
)
|
1982
|
11/15/10
|
40
|
|||||||||||||
|
Renaissance Terrace
|
Harriman, TN
|
100%
|
—
|
|
76
|
|
4,459
|
|
4,535
|
|
—
|
|
76
|
|
4,310
|
|
4,386
|
|
(1,560
|
)
|
1985/1989,
2008
|
11/15/10
|
38
|
|||||||||||||
|
Greenwood
|
Warwick, RI
|
100%
|
—
|
|
2,066
|
|
10,178
|
|
12,244
|
|
—
|
|
2,066
|
|
9,964
|
|
12,030
|
|
(2,570
|
)
|
1964
|
11/15/10
|
24
|
|||||||||||||
|
Pawtuxet Village
|
Warwick, RI
|
100%
|
—
|
|
1,275
|
|
6,602
|
|
7,877
|
|
—
|
|
1,275
|
|
6,384
|
|
7,659
|
|
(1,761
|
)
|
1968
|
11/15/10
|
24
|
|||||||||||||
|
Forest Hills (SNF)
|
Broken Arrow, OK
|
100%
|
(5)
|
|
1,653
|
|
11,259
|
|
12,912
|
|
—
|
|
1,653
|
|
11,230
|
|
12,883
|
|
(2,676
|
)
|
1994
|
11/15/10
|
40
|
|||||||||||||
|
Seminole Estates
|
Seminole, OK
|
100%
|
—
|
|
655
|
|
3,527
|
|
4,182
|
|
—
|
|
655
|
|
3,376
|
|
4,031
|
|
(520
|
)
|
1987
|
11/15/10
|
32
|
|||||||||||||
|
Bryan Care
|
Bryan, OH
|
100%
|
—
|
|
1,278
|
|
6,477
|
|
7,755
|
|
—
|
|
1,278
|
|
6,205
|
|
7,483
|
|
(1,317
|
)
|
1976
|
11/15/10
|
30
|
|||||||||||||
|
Sylvania
|
Sylvania, OH
|
100%
|
(6)
|
|
942
|
|
5,627
|
|
6,569
|
|
—
|
|
942
|
|
5,449
|
|
6,391
|
|
(1,529
|
)
|
1967/1974, 1986, 1995, 2008, 2009
|
11/15/10
|
24
|
|||||||||||||
|
Point Place
|
Toledo, OH
|
100%
|
—
|
|
1,089
|
|
5,364
|
|
6,453
|
|
—
|
|
1,089
|
|
5,268
|
|
6,357
|
|
(982
|
)
|
1995
|
11/15/10
|
36
|
|||||||||||||
|
Perrysburg
|
Perrysburg, OH
|
100%
|
—
|
|
987
|
|
5,358
|
|
6,345
|
|
—
|
|
987
|
|
5,156
|
|
6,143
|
|
(1,118
|
)
|
1984
|
11/15/10
|
32
|
|||||||||||||
|
Forest View
|
Dayton, OH
|
100%
|
—
|
|
819
|
|
4,214
|
|
5,033
|
|
—
|
|
819
|
|
4,078
|
|
4,897
|
|
(1,080
|
)
|
1968
|
11/15/10
|
24
|
|||||||||||||
|
New Lebanon
|
New Lebanon, OH
|
100%
|
—
|
|
784
|
|
4,243
|
|
5,027
|
|
—
|
|
784
|
|
4,004
|
|
4,788
|
|
(992
|
)
|
1979
|
11/15/10
|
28
|
|||||||||||||
|
New Lexington
|
New Lexington, OH
|
100%
|
—
|
|
63
|
|
3,487
|
|
3,550
|
|
—
|
|
63
|
|
3,364
|
|
3,427
|
|
(1,656
|
)
|
1981
|
11/15/10
|
20
|
|||||||||||||
|
Twin Rivers
|
Defiance, OH
|
100%
|
—
|
|
280
|
|
3,004
|
|
3,284
|
|
—
|
|
280
|
|
2,845
|
|
3,125
|
|
(636
|
)
|
1980
|
11/15/10
|
30
|
|||||||||||||
|
San Juan
|
Farmington, NM
|
100%
|
(2)
|
|
799
|
|
4,163
|
|
4,962
|
|
—
|
|
799
|
|
4,083
|
|
4,882
|
|
(961
|
)
|
1963/1993
|
11/15/10
|
24
|
|||||||||||||
|
McKinley Care
|
Gallup, NM
|
100%
|
(2)
|
|
409
|
|
1,865
|
|
2,274
|
|
—
|
|
409
|
|
1,864
|
|
2,273
|
|
(427
|
)
|
1968
|
11/15/10
|
24
|
|||||||||||||
|
Bedford Hills
|
Bedford, NH
|
100%
|
6,968
|
|
1,911
|
|
12,245
|
|
14,156
|
|
—
|
|
1,911
|
|
11,623
|
|
13,534
|
|
(2,185
|
)
|
1992/2010
|
11/15/10
|
36
|
|||||||||||||
|
Exeter on Hampton
|
Exeter, NH
|
100%
|
(4)
|
|
2,365
|
|
2,350
|
|
4,715
|
|
—
|
|
2,365
|
|
2,259
|
|
4,624
|
|
(1,151
|
)
|
1976
|
11/15/10
|
40
|
|||||||||||||
|
Pheasant Wood
|
Petersborough, NH
|
100%
|
—
|
|
625
|
|
3,986
|
|
4,611
|
|
—
|
|
625
|
|
3,638
|
|
4,263
|
|
(959
|
)
|
1975
|
11/15/10
|
28
|
|||||||||||||
|
Westwood
|
Keene, NH
|
100%
|
—
|
|
699
|
|
3,823
|
|
4,522
|
|
—
|
|
699
|
|
3,496
|
|
4,195
|
|
(991
|
)
|
1965/2010
|
11/15/10
|
24
|
|||||||||||||
|
Colonial Hill
|
Rochester, NH
|
100%
|
(4)
|
|
412
|
|
3,960
|
|
4,372
|
|
—
|
|
412
|
|
3,796
|
|
4,208
|
|
(1,046
|
)
|
1986
|
11/15/10
|
44
|
|||||||||||||
|
Crestwood Care
|
Milford, NH
|
100%
|
—
|
|
557
|
|
3,441
|
|
3,998
|
|
—
|
|
557
|
|
3,182
|
|
3,739
|
|
(859
|
)
|
1972
|
11/15/10
|
28
|
|||||||||||||
|
Applewood
|
Winchester, NH
|
100%
|
—
|
|
348
|
|
3,075
|
|
3,423
|
|
—
|
|
348
|
|
2,790
|
|
3,138
|
|
(638
|
)
|
1987
|
11/15/10
|
32
|
|||||||||||||
|
The Elms Care
|
Milford, NH
|
100%
|
—
|
|
312
|
|
1,679
|
|
1,991
|
|
—
|
|
312
|
|
1,540
|
|
1,852
|
|
(508
|
)
|
1890/1890
|
11/15/10
|
20
|
|||||||||||||
|
Woodland Hill
|
Asheboro, NC
|
100%
|
(6)
|
|
1,706
|
|
8,053
|
|
9,759
|
|
—
|
|
1,706
|
|
7,938
|
|
9,644
|
|
(1,477
|
)
|
1987
|
11/15/10
|
32
|
|||||||||||||
|
Missouri River
|
Great Falls, MT
|
100%
|
(2)
|
|
2,023
|
|
16,967
|
|
18,990
|
|
—
|
|
2,023
|
|
16,867
|
|
18,890
|
|
(4,225
|
)
|
1960/1990, 2010
|
11/15/10
|
30
|
|||||||||||||
|
Butte Care
|
Butte, MT
|
100%
|
(2)
|
|
1,092
|
|
12,654
|
|
13,746
|
|
—
|
|
1,092
|
|
12,583
|
|
13,675
|
|
(2,715
|
)
|
1974
|
11/15/10
|
35
|
|||||||||||||
|
Whitefish Care
|
Whitefish, MT
|
100%
|
(2)
|
|
651
|
|
6,339
|
|
6,990
|
|
—
|
|
651
|
|
6,306
|
|
6,957
|
|
(1,449
|
)
|
1973
|
11/15/10
|
35
|
|||||||||||||
|
Deer Lodge
|
Deer Lodge, MT
|
100%
|
(2)
|
|
190
|
|
3,032
|
|
3,222
|
|
—
|
|
190
|
|
3,016
|
|
3,206
|
|
(839
|
)
|
1973
|
11/15/10
|
30
|
|||||||||||||
F-37
|
Initial Cost to Company
|
Cost Capitalized Subsequent to Acquisition
|
Gross Amount at which Carried at Close of Period
|
Life on Which Depreciation in Latest Income Statement is Computed
|
|||||||||||||||||||||||||||||||||
|
Description
|
Location
|
Ownership Percentage
|
Encum- brances
|
Land
|
Building and Improve- ments
(1)
|
Total
|
Land
|
Building and Improve- ments
(1)(6)
|
Total
|
Accumulated Depreciation and Amortization
|
Original Date of Construction/ Renovation
|
Date Acquired
|
||||||||||||||||||||||||
|
Twin Oaks
|
Danvers, MA
|
100%
|
—
|
|
885
|
|
5,100
|
|
5,985
|
|
—
|
|
885
|
|
4,481
|
|
5,366
|
|
(1,023
|
)
|
1969
|
11/15/10
|
24
|
|||||||||||||
|
Maplewood
|
Amesbury, MA
|
100%
|
—
|
|
771
|
|
4,550
|
|
5,321
|
|
—
|
|
771
|
|
3,967
|
|
4,738
|
|
(1,001
|
)
|
1968/1969
|
11/15/10
|
24
|
|||||||||||||
|
Saugus
|
Saugus, MA
|
100%
|
—
|
|
285
|
|
1,643
|
|
1,928
|
|
—
|
|
285
|
|
1,143
|
|
1,428
|
|
(352
|
)
|
1967
|
11/15/10
|
24
|
|||||||||||||
|
Kensington Manor
|
Elizabethtown, KY
|
100%
|
—
|
|
1,864
|
|
7,523
|
|
9,387
|
|
—
|
|
1,864
|
|
7,514
|
|
9,378
|
|
(1,532
|
)
|
2001/2010
|
11/15/10
|
37
|
|||||||||||||
|
Regency Care
|
Louisville, KY
|
100%
|
—
|
|
1,169
|
|
5,989
|
|
7,158
|
|
—
|
|
1,169
|
|
5,634
|
|
6,803
|
|
(1,441
|
)
|
1960
|
11/15/10
|
25
|
|||||||||||||
|
Paducah Care
|
Paducah, KY
|
100%
|
—
|
|
1,636
|
|
4,133
|
|
5,769
|
|
—
|
|
1,636
|
|
4,130
|
|
5,766
|
|
(1,135
|
)
|
1974/1974, 2008
|
11/15/10
|
28
|
|||||||||||||
|
Countryside Care
|
Bardwell, KY
|
100%
|
—
|
|
239
|
|
4,790
|
|
5,029
|
|
—
|
|
239
|
|
4,784
|
|
5,023
|
|
(1,045
|
)
|
1993/2010
|
11/15/10
|
35
|
|||||||||||||
|
Bradford Square
|
South Frankfort, KY
|
100%
|
—
|
|
774
|
|
3,848
|
|
4,622
|
|
—
|
|
774
|
|
3,610
|
|
4,384
|
|
(943
|
)
|
1960/1990
|
11/15/10
|
25
|
|||||||||||||
|
Hillside Villa
|
Madisonville, KY
|
100%
|
—
|
|
277
|
|
4,272
|
|
4,549
|
|
—
|
|
277
|
|
4,268
|
|
4,545
|
|
(1,319
|
)
|
1962/1978, 1997
|
11/15/10
|
25
|
|||||||||||||
|
Klondike Care
|
Louisville, KY
|
100%
|
—
|
|
764
|
|
3,576
|
|
4,340
|
|
—
|
|
764
|
|
3,385
|
|
4,149
|
|
(830
|
)
|
1974/1980, 1994, 1995, 2008
|
11/15/10
|
28
|
|||||||||||||
|
Colonial Manor
|
Bowling Green, KY
|
100%
|
—
|
|
792
|
|
3,050
|
|
3,842
|
|
—
|
|
792
|
|
3,043
|
|
3,835
|
|
(888
|
)
|
1963
|
11/15/10
|
25
|
|||||||||||||
|
Hopkins Care
|
Woodburn, KY
|
100%
|
—
|
|
592
|
|
2,277
|
|
2,869
|
|
—
|
|
592
|
|
2,275
|
|
2,867
|
|
(704
|
)
|
1960
|
11/15/10
|
25
|
|||||||||||||
|
Bridge Point
|
Florence, KY
|
100%
|
(6)
|
|
—
|
|
2,278
|
|
2,278
|
|
—
|
|
—
|
|
1,900
|
|
1,900
|
|
(629
|
)
|
1969/2008, 2009, 2010
|
11/15/10
|
20
|
|||||||||||||
|
Magnolia Village
|
Bowling Green, KY
|
100%
|
—
|
|
14
|
|
629
|
|
643
|
|
—
|
|
14
|
|
617
|
|
631
|
|
(376
|
)
|
1991
|
11/15/10
|
29
|
|||||||||||||
|
Decatur Township
|
Indianapolis, IN
|
100%
|
—
|
|
673
|
|
3,730
|
|
4,403
|
|
—
|
|
673
|
|
3,633
|
|
4,306
|
|
(826
|
)
|
1985
|
11/15/10
|
32
|
|||||||||||||
|
Gooding/Bennett Hills
|
Gooding, ID
|
100%
|
—
|
|
—
|
|
1,731
|
|
1,731
|
|
—
|
|
—
|
|
1,731
|
|
1,731
|
|
(443
|
)
|
1968/2009
|
11/15/10
|
40
|
|||||||||||||
|
Fountain City
|
Columbus, GA
|
100%
|
(3)
|
|
253
|
|
2,797
|
|
3,050
|
|
—
|
|
253
|
|
2,778
|
|
3,031
|
|
(1,307
|
)
|
1970
|
11/15/10
|
40
|
|||||||||||||
|
Etowah Landing
|
Rome, GA
|
100%
|
—
|
|
43
|
|
842
|
|
885
|
|
—
|
|
43
|
|
825
|
|
868
|
|
(352
|
)
|
1973/1977, 1987
|
11/15/10
|
40
|
|||||||||||||
|
Oakhurst
|
Ocala, FL
|
100%
|
—
|
|
1,474
|
|
8,212
|
|
9,686
|
|
—
|
|
1,474
|
|
7,936
|
|
9,410
|
|
(1,801
|
)
|
1984/2010
|
11/15/10
|
32
|
|||||||||||||
|
Orchard Ridge
|
New Port Richey, FL
|
100%
|
—
|
|
536
|
|
5,685
|
|
6,221
|
|
—
|
|
536
|
|
5,457
|
|
5,993
|
|
(1,197
|
)
|
1983/1995
|
11/15/10
|
32
|
|||||||||||||
|
Bay Tree
|
Palm Harbor, FL
|
100%
|
—
|
|
786
|
|
4,870
|
|
5,656
|
|
—
|
|
786
|
|
4,643
|
|
5,429
|
|
(1,195
|
)
|
1981
|
11/15/10
|
32
|
|||||||||||||
|
West Bay
|
Oldsmar, FL
|
100%
|
(6)
|
|
775
|
|
4,660
|
|
5,435
|
|
—
|
|
775
|
|
4,313
|
|
5,088
|
|
(1,005
|
)
|
1982/2010
|
11/15/10
|
32
|
|||||||||||||
|
Sunset Point
|
Clearwater, FL
|
100%
|
(6)
|
|
706
|
|
4,370
|
|
5,076
|
|
—
|
|
706
|
|
4,124
|
|
4,830
|
|
(1,023
|
)
|
1983
|
11/15/10
|
32
|
|||||||||||||
|
Arden House
|
Hamden, CT
|
100%
|
20,822
|
|
2,250
|
|
23,816
|
|
26,066
|
|
—
|
|
2,250
|
|
23,287
|
|
25,537
|
|
(4,865
|
)
|
1973/2008, 2010
|
11/15/10
|
28
|
|||||||||||||
|
Pope John Paul
|
Danbury, CT
|
100%
|
(6)
|
|
—
|
|
13,702
|
|
13,702
|
|
—
|
|
—
|
|
13,680
|
|
13,680
|
|
(3,187
|
)
|
1983/2009
|
11/15/10
|
32
|
|||||||||||||
|
St. Camillus
|
Stamford, CT
|
100%
|
—
|
|
—
|
|
12,528
|
|
12,528
|
|
—
|
|
—
|
|
12,513
|
|
12,513
|
|
(3,110
|
)
|
1987/2008
|
11/15/10
|
32
|
|||||||||||||
|
Madison House
|
Madison, CT
|
100%
|
—
|
|
4,337
|
|
8,164
|
|
12,501
|
|
—
|
|
4,337
|
|
7,948
|
|
12,285
|
|
(1,421
|
)
|
1994/2009, 2010
|
11/15/10
|
36
|
|||||||||||||
|
Willows (CT)
|
Woodbridge, CT
|
100%
|
—
|
|
1,838
|
|
9,961
|
|
11,799
|
|
—
|
|
1,838
|
|
9,464
|
|
11,302
|
|
(1,960
|
)
|
1989/2011
|
11/15/10
|
32
|
|||||||||||||
|
The Reservoir
|
West Hartford, CT
|
100%
|
9,992
|
|
1,204
|
|
9,457
|
|
10,661
|
|
—
|
|
1,204
|
|
9,243
|
|
10,447
|
|
(1,682
|
)
|
1995/2009, 2011
|
11/15/10
|
36
|
|||||||||||||
|
Glen Hill
|
Danbury, CT
|
100%
|
(6)
|
|
918
|
|
7,017
|
|
7,935
|
|
—
|
|
918
|
|
6,722
|
|
7,640
|
|
(1,731
|
)
|
1963/2009
|
11/15/10
|
24
|
|||||||||||||
F-38
|
Initial Cost to Company
|
Cost Capitalized Subsequent to Acquisition
|
Gross Amount at which Carried at Close of Period
|
Life on Which Depreciation in Latest Income Statement is Computed
|
|||||||||||||||||||||||||||||||||
|
Description
|
Location
|
Ownership Percentage
|
Encum- brances
|
Land
|
Building and Improve- ments
(1)
|
Total
|
Land
|
Building and Improve- ments
(1)(7)
|
Total
|
Accumulated Depreciation and Amortization
|
Original Date of Construction/ Renovation
|
Date Acquired
|
||||||||||||||||||||||||
|
Governor's House
|
Simsbury, CT
|
100%
|
—
|
|
—
|
|
5,750
|
|
5,750
|
|
—
|
|
—
|
|
5,453
|
|
5,453
|
|
(1,678
|
)
|
1895/2008, 2010
|
11/15/10
|
20
|
|||||||||||||
|
Elms Haven
|
Thornton, CO
|
100%
|
(3)
|
|
3,717
|
|
18,473
|
|
22,190
|
|
—
|
|
3,717
|
|
18,345
|
|
22,062
|
|
(3,965
|
)
|
1987/1989, 1997, 2007, 2008
|
11/15/10
|
40
|
|||||||||||||
|
Sable
|
Aurora, CO
|
100%
|
(3)
|
|
1,272
|
|
5,591
|
|
6,863
|
|
—
|
|
1,272
|
|
5,519
|
|
6,791
|
|
(1,316
|
)
|
1973
|
11/15/10
|
35
|
|||||||||||||
|
Carmichael
|
Carmichael, CA
|
100%
|
(6)
|
|
—
|
|
1,741
|
|
1,741
|
|
—
|
|
—
|
|
1,677
|
|
1,677
|
|
(715
|
)
|
1960/1976, 2010
|
11/15/10
|
40
|
|||||||||||||
|
Willows (CA)
|
Willows, CA
|
100%
|
—
|
|
137
|
|
1,426
|
|
1,563
|
|
—
|
|
137
|
|
1,401
|
|
1,538
|
|
(505
|
)
|
1969/2010
|
11/15/10
|
40
|
|||||||||||||
|
Washington Care
|
San Leandro, CA
|
100%
|
(2)
|
|
—
|
|
1,331
|
|
1,331
|
|
—
|
|
—
|
|
1,300
|
|
1,300
|
|
(351
|
)
|
1969/2010
|
11/15/10
|
40
|
|||||||||||||
|
Lake Drive
|
Henryetta, OK
|
100%
|
—
|
|
160
|
|
549
|
|
709
|
|
—
|
|
160
|
|
538
|
|
698
|
|
(367
|
)
|
1968
|
11/15/10
|
10
|
|||||||||||||
|
Boise
|
Boise, ID
|
100%
|
—
|
|
—
|
|
289
|
|
289
|
|
—
|
|
—
|
|
265
|
|
265
|
|
(135
|
)
|
1991
|
11/15/10
|
40
|
|||||||||||||
|
Langdon Place of Dover
|
Dover, NH
|
100%
|
5,094
|
|
801
|
|
10,036
|
|
10,837
|
|
—
|
|
801
|
|
9,627
|
|
10,428
|
|
(2,159
|
)
|
1987
|
11/15/10
|
42
|
|||||||||||||
|
Clipper Harbor
|
Portsmouth, NH
|
100%
|
(4)
|
|
846
|
|
7,632
|
|
8,478
|
|
—
|
|
846
|
|
7,569
|
|
8,415
|
|
(2,292
|
)
|
1986
|
11/15/10
|
43
|
|||||||||||||
|
Mineral Springs
|
North Conway, NH
|
100%
|
(4)
|
|
417
|
|
5,352
|
|
5,769
|
|
—
|
|
417
|
|
5,166
|
|
5,583
|
|
(1,281
|
)
|
1988
|
11/15/10
|
43
|
|||||||||||||
|
Wolfeboro
|
Wolfeboro, NH
|
100%
|
(4)
|
|
454
|
|
4,531
|
|
4,985
|
|
—
|
|
454
|
|
4,396
|
|
4,850
|
|
(1,011
|
)
|
1984/1986, 1987, 2009
|
11/15/10
|
41
|
|||||||||||||
|
Langdon Place of Keene
|
Keene, NH
|
100%
|
5,483
|
|
304
|
|
3,992
|
|
4,296
|
|
—
|
|
304
|
|
3,867
|
|
4,171
|
|
(1,189
|
)
|
1995
|
11/15/10
|
46
|
|||||||||||||
|
Edmondson Care
|
Brownsville, KY
|
100%
|
—
|
|
446
|
|
5,087
|
|
5,533
|
|
—
|
|
446
|
|
5,073
|
|
5,519
|
|
(1,284
|
)
|
1994/2009
|
11/15/10
|
35
|
|||||||||||||
|
Heartland Villa
|
Lewisport, KY
|
100%
|
—
|
|
532
|
|
4,025
|
|
4,557
|
|
—
|
|
532
|
|
4,016
|
|
4,548
|
|
(951
|
)
|
1994/2009
|
11/15/10
|
35
|
|||||||||||||
|
Meridian Care
|
Meridian, ID
|
100%
|
(6)
|
|
840
|
|
8,342
|
|
9,182
|
|
—
|
|
840
|
|
8,246
|
|
9,086
|
|
(2,491
|
)
|
1997
|
11/15/10
|
39
|
|||||||||||||
|
St. Joseph's
|
Trumbull, CT
|
100%
|
(6)
|
|
—
|
|
21,878
|
|
21,878
|
|
—
|
|
—
|
|
21,868
|
|
21,868
|
|
(5,986
|
)
|
1959
|
11/15/10
|
24
|
|||||||||||||
|
Oak Brook Health Care
|
Whitehouse, TX
|
100%
|
—
|
|
1,433
|
|
9,643
|
|
11,076
|
|
—
|
|
1,433
|
|
9,644
|
|
11,077
|
|
(486
|
)
|
1998
|
06/30/11
|
40
|
|||||||||||||
|
Broadmeadow Healthcare
|
Middletown, DE
|
100%
|
(6)
|
|
1,650
|
|
2,173
|
|
3,823
|
|
—
|
|
1,650
|
|
21,730
|
|
23,380
|
|
(866
|
)
|
2005
|
08/01/11
|
40
|
|||||||||||||
|
Capitol Healthcare
|
Dover, DE
|
100%
|
(6)
|
|
4,940
|
|
15,500
|
|
20,440
|
|
—
|
|
4,940
|
|
15,500
|
|
20,440
|
|
(646
|
)
|
1997
|
08/01/11
|
40
|
|||||||||||||
|
Pike Creek Healthcare
|
Wilmington, DE
|
100%
|
(6)
|
|
2,460
|
|
25,240
|
|
27,700
|
|
—
|
|
2,460
|
|
25,240
|
|
27,700
|
|
(1,017
|
)
|
2009
|
08/01/11
|
40
|
|||||||||||||
|
Renaissance Healthcare
|
Millsboro, DE
|
100%
|
(6)
|
|
1,640
|
|
22,620
|
|
24,260
|
|
—
|
|
1,640
|
|
22,620
|
|
24,260
|
|
(929
|
)
|
2008
|
08/01/11
|
40
|
|||||||||||||
|
Honey Hill Care Center
|
Norwalk, CT
|
100%
|
—
|
|
1,736
|
|
6,069
|
|
7,805
|
|
—
|
|
1,736
|
|
6,069
|
|
7,805
|
|
(289
|
)
|
1993
|
09/30/11
|
40
|
|||||||||||||
|
Manokin Manor Nursing & Rehabilitation Center
|
Princess Anne, MD
|
100%
|
—
|
|
1,953
|
|
7,811
|
|
9,764
|
|
—
|
|
1,953
|
|
7,811
|
|
9,764
|
|
(355
|
)
|
1987
|
09/30/11
|
40
|
|||||||||||||
|
Wesley Woods Alzheimer's Care Center
|
Abilene, TX
|
100%
|
—
|
|
885
|
|
7,619
|
|
8,504
|
|
—
|
|
885
|
|
7,619
|
|
8,504
|
|
(280
|
)
|
2004
|
11/01/11
|
40
|
|||||||||||||
|
Windcrest Alzheimer's Care Center
|
Waco, TX
|
100%
|
—
|
|
802
|
|
4,577
|
|
5,379
|
|
—
|
|
802
|
|
4,577
|
|
5,379
|
|
(177
|
)
|
1994/1999
|
11/01/11
|
40
|
|||||||||||||
|
Clara Burke
|
Plymouth Meeting, PA
|
100%
|
—
|
|
2,527
|
|
12,453
|
|
14,980
|
|
—
|
|
2,527
|
|
12,453
|
|
14,980
|
|
(293
|
)
|
1927/1990/2007
|
03/30/12
|
40
|
|||||||||||||
|
Warrington
|
Warrington, PA
|
100%
|
—
|
|
2,617
|
|
11,662
|
|
14,279
|
|
—
|
|
2,617
|
|
11,662
|
|
14,279
|
|
(251
|
)
|
1958/2008
|
03/30/12
|
40
|
|||||||||||||
|
Ridgecrest
|
Duffield, VA
|
100%
|
—
|
|
509
|
|
5,018
|
|
5,527
|
|
—
|
|
509
|
|
5,018
|
|
5,527
|
|
(111
|
)
|
1981
|
05/10/12
|
40
|
|||||||||||||
|
Bucks Hill
|
Waterbury, CT
|
100%
|
—
|
|
508
|
|
2,592
|
|
3,100
|
|
—
|
|
508
|
|
2,592
|
|
3,100
|
|
(54
|
)
|
1966/1999
|
06/01/12
|
40
|
|||||||||||||
F-39
|
Initial Cost to Company
|
Cost Capitalized Subsequent to Acquisition
|
Gross Amount at which Carried at Close of Period
|
Life on Which Depreciation in Latest Income Statement is Computed
|
|||||||||||||||||||||||||||||||||
|
Description
|
Location
|
Ownership Percentage
|
Encum- brances
|
Land
|
Building and Improve- ments
(1)
|
Total
|
Land
|
Building and Improve- ments
(1)(7)
|
Total
|
Accumulated Depreciation and Amortization
|
Original Date of Construction/ Renovation
|
Date Acquired
|
||||||||||||||||||||||||
|
Cromwell
|
Cromwell, CT
|
100%
|
—
|
|
2,265
|
|
10,096
|
|
12,361
|
|
—
|
|
2,265
|
|
10,096
|
|
12,361
|
|
(174
|
)
|
1967/1998
|
06/01/12
|
40
|
|||||||||||||
|
Derry
|
Derry, NH
|
100%
|
—
|
|
768
|
|
3,222
|
|
3,990
|
|
—
|
|
768
|
|
3,222
|
|
3,990
|
|
(61
|
)
|
1976/1994
|
06/01/12
|
40
|
|||||||||||||
|
Camden Care Center
|
Minneapolis, MN
|
100%
|
—
|
|
1,235
|
|
5,777
|
|
7,012
|
|
—
|
|
1,235
|
|
5,777
|
|
7,012
|
|
(15
|
)
|
1990
|
11/30/12
|
40
|
|||||||||||||
|
Arbrook Plaza
|
Arlington, TX
|
100%
|
—
|
|
3,783
|
|
14,219
|
|
18,002
|
|
—
|
|
3,783
|
|
14,219
|
|
18,002
|
|
(34
|
)
|
2002
|
11/30/12
|
40
|
|||||||||||||
|
Northgate Plaza
|
Irving, TX
|
100%
|
—
|
|
4,901
|
|
10,299
|
|
15,200
|
|
—
|
|
4,901
|
|
10,299
|
|
15,200
|
|
(25
|
)
|
2003
|
11/30/12
|
40
|
|||||||||||||
|
Gulf Pointe Plaza
|
Rockport, TX
|
100%
|
—
|
|
1,005
|
|
6,628
|
|
7,633
|
|
—
|
|
1,005
|
|
6,628
|
|
7,633
|
|
(17
|
)
|
2002
|
11/30/12
|
40
|
|||||||||||||
|
|
|
|
|
|
|
|
|
|
|
|
|
|
|
|
|
|
|
|
||||||||||||||||||
|
|
|
|
48,359
|
|
100,423
|
|
639,256
|
|
739,679
|
|
—
|
|
100,423
|
|
646,087
|
|
746,510
|
|
(116,426
|
)
|
|
|
||||||||||||||
|
Senior Housing
|
|
|
|
|
|
|
|
|
|
|
|
|
|
|
|
|
|
|
||||||||||||||||||
|
Monroe House
|
Moses Lake, WA
|
100%
|
—
|
|
—
|
|
182
|
|
182
|
|
—
|
|
—
|
|
89
|
|
89
|
|
(50
|
)
|
1997
|
11/15/10
|
15
|
|||||||||||||
|
Forest Hills (ALF)
|
Broken Arrow, OK
|
100%
|
(5)
|
|
1,803
|
|
3,927
|
|
5,730
|
|
—
|
|
1,803
|
|
3,889
|
|
5,692
|
|
(1,097
|
)
|
2000
|
11/15/10
|
30
|
|||||||||||||
|
Langdon Place of Exeter
|
Exeter, NH
|
100%
|
4,101
|
|
571
|
|
7,183
|
|
7,754
|
|
—
|
|
571
|
|
6,861
|
|
7,432
|
|
(1,731
|
)
|
1987
|
11/15/10
|
43
|
|||||||||||||
|
Langdon Place of Nashua
|
Nashua, NH
|
100%
|
(4)
|
|
—
|
|
5,654
|
|
5,654
|
|
—
|
|
—
|
|
5,360
|
|
5,360
|
|
(1,145
|
)
|
1989
|
11/15/10
|
40
|
|||||||||||||
|
Heritage Place
|
Owensboro, KY
|
100%
|
—
|
|
668
|
|
5,492
|
|
6,160
|
|
—
|
|
668
|
|
5,487
|
|
6,155
|
|
(1,109
|
)
|
2001
|
11/15/10
|
38
|
|||||||||||||
|
The Legacy
|
Paducah, KY
|
100%
|
—
|
|
325
|
|
4,019
|
|
4,344
|
|
—
|
|
325
|
|
4,010
|
|
4,335
|
|
(1,085
|
)
|
1999
|
11/15/10
|
35
|
|||||||||||||
|
Glen Crest
|
Danbury, CT
|
100%
|
—
|
|
1,356
|
|
6,666
|
|
8,022
|
|
—
|
|
1,356
|
|
6,643
|
|
7,999
|
|
(1,336
|
)
|
1986
|
11/15/10
|
32
|
|||||||||||||
|
Village at Northrise
|
Las Cruces, NM
|
100%
|
(6)
|
|
1,432
|
|
6,003
|
|
7,435
|
|
—
|
|
1,432
|
|
5,793
|
|
7,225
|
|
(1,882
|
)
|
1998/1999, 2010
|
11/15/10
|
29
|
|||||||||||||
|
Creekside Senior Living
|
Green Bay, WI
|
100%
|
—
|
|
256
|
|
2,262
|
|
2,518
|
|
1,031
|
|
256
|
|
3,293
|
|
3,549
|
|
(163
|
)
|
2004
|
11/22/11
|
40
|
|||||||||||||
|
New Dawn Memory Care
|
Aurora, CO
|
100%
|
—
|
|
2,874
|
|
12,829
|
|
15,703
|
|
—
|
|
2,874
|
|
12,829
|
|
15,703
|
|
(87
|
)
|
2009
|
09/20/12
|
40
|
|||||||||||||
|
Independence Village at Frankenmuth
|
Frankenmuth, MI
|
100%
|
—
|
|
5,027
|
|
20,929
|
|
25,956
|
|
—
|
|
5,027
|
|
20,929
|
|
25,956
|
|
(152
|
)
|
1982
|
09/21/12
|
40
|
|||||||||||||
|
Gulf Pointe Village
|
Rockport, TX
|
100%
|
—
|
|
789
|
|
607
|
|
1,396
|
|
—
|
|
789
|
|
607
|
|
1,396
|
|
(2
|
)
|
1996
|
11/30/12
|
40
|
|||||||||||||
|
Aspen Ridge Retirement Village
|
Gaylord, MI
|
100%
|
—
|
|
2,024
|
|
5,467
|
|
7,491
|
|
—
|
|
2,024
|
|
5,467
|
|
7,491
|
|
(16
|
)
|
2002
|
12/15/12
|
40
|
|||||||||||||
|
Green Acres of Cadillac
|
Cadillac, MI
|
100%
|
—
|
|
217
|
|
3,000
|
|
3,217
|
|
—
|
|
217
|
|
3,000
|
|
3,217
|
|
(8
|
)
|
2001/2006
|
12/15/12
|
40
|
|||||||||||||
|
Green Acres of Greenville
|
Greenville, MI
|
100%
|
—
|
|
684
|
|
5,832
|
|
6,516
|
|
—
|
|
684
|
|
5,832
|
|
6,516
|
|
(15
|
)
|
1999/2001
|
12/15/12
|
40
|
|||||||||||||
|
Green Acres of Manistee
|
Manistee, MI
|
100%
|
—
|
|
952
|
|
2,578
|
|
3,530
|
|
—
|
|
952
|
|
2,578
|
|
3,530
|
|
(7
|
)
|
2002
|
12/15/12
|
40
|
|||||||||||||
|
Green Acres of Mason
|
Mason, MI
|
100%
|
—
|
|
198
|
|
4,131
|
|
4,329
|
|
—
|
|
198
|
|
4,131
|
|
4,329
|
|
(11
|
)
|
2009/2012
|
12/15/12
|
40
|
|||||||||||||
|
Nottingham Place
|
Midland, MI
|
100%
|
—
|
|
744
|
|
1,745
|
|
2,489
|
|
—
|
|
744
|
|
1,745
|
|
2,489
|
|
(4
|
)
|
1995
|
12/15/12
|
40
|
|||||||||||||
|
Royal View
|
Mecosta, MI
|
100%
|
—
|
|
307
|
|
2,477
|
|
2,784
|
|
—
|
|
307
|
|
2,477
|
|
2,784
|
|
(7
|
)
|
2001
|
12/15/12
|
40
|
|||||||||||||
|
Tawas Village
|
East Tawas, MI
|
100%
|
—
|
|
258
|
|
3,713
|
|
3,971
|
|
—
|
|
258
|
|
3,713
|
|
3,971
|
|
(12
|
)
|
2005
|
12/15/12
|
40
|
|||||||||||||
|
Turning Brook
|
Alpena, MI
|
100%
|
—
|
|
546
|
|
13,139
|
|
13,685
|
|
—
|
|
546
|
|
13,139
|
|
13,685
|
|
(30
|
)
|
2006/2008/2010
|
12/15/12
|
40
|
|||||||||||||
|
Stoney River Marshfield
|
Marshfield, WI
|
100%
|
—
|
|
574
|
|
8,733
|
|
9,307
|
|
—
|
|
574
|
|
8,733
|
|
9,307
|
|
—
|
|
2010
|
12/15/12
|
40
|
|||||||||||||
|
4,101
|
|
21,605
|
|
126,568
|
|
148,173
|
|
1,031
|
|
21,605
|
|
126,605
|
|
148,210
|
|
(9,949
|
)
|
|||||||||||||||||||
F-40
|
Initial Cost to Company
|
Cost Capitalized Subsequent to Acquisition
|
Gross Amount at which Carried at Close of Period
|
Life on Which Depreciation in Latest Income Statement is Computed
|
|||||||||||||||||||||||||||||||||
|
Description
|
Location
|
Ownership Percentage
|
Encum- brances
|
Land
|
Building and Improve- ments
(1)
|
Total
|
Land
|
Building and Improve- ments
(1)(7)
|
Total
|
Accumulated Depreciation and Amortization
|
Original Date of Construction/ Renovation
|
Date Acquired
|
||||||||||||||||||||||||
|
|
|
|
|
|
|
|
|
|
|
|
|
|
|
|
|
|
|
|
||||||||||||||||||
|
|
|
|
|
|
|
|
|
|
|
|
|
|
|
|
|
|
|
|
|
|
||||||||||||||||
|
Acute Care Hospital
|
||||||||||||||||||||||||||||||||||||
|
Texas Regional Medical Center
|
Sunnyvale, TX
|
100%
|
(6)
|
|
4,020
|
|
57,620
|
|
61,640
|
|
—
|
|
4,020
|
|
57,620
|
|
61,640
|
|
(3,001
|
)
|
2009
|
05/03/11
|
40
|
|||||||||||||
|
Multi-property Indebtedness
|
|
|
99,862
|
|
—
|
|
—
|
|
—
|
|
—
|
|
—
|
|
—
|
|
—
|
|
—
|
|
|
|
||||||||||||||
|
|
|
|
152,322
|
|
126,048
|
|
823,444
|
|
949,492
|
|
1,031
|
|
126,048
|
|
830,312
|
|
956,360
|
|
(129,376
|
)
|
|
|
||||||||||||||
|
Corporate Assets
|
|
|
—
|
|
—
|
|
136
|
|
136
|
|
118
|
|
—
|
|
254
|
|
254
|
|
(103
|
)
|
|
|
||||||||||||||
|
|
|
|
|
|
|
|
|
|
|
|
|
|
|
|
|
|
|
|
||||||||||||||||||
|
|
|
|
$
|
152,322
|
|
$
|
126,048
|
|
$
|
823,580
|
|
$
|
949,628
|
|
$
|
1,149
|
|
$
|
126,048
|
|
$
|
830,566
|
|
$
|
956,614
|
|
$
|
(129,479
|
)
|
|
|
|||||
|
|
|
|
|
|
|
|
|
|
|
|
|
|
|
|
|
|
|
|
|
|||||||||||||||||
|
(1)
|
Building and building improvements include land improvements and furniture and equipment.
|
|
(2)
|
Property serves as collateral for a mortgage loan totaling
$38.4 million
as of
December 31, 2012
.
|
|
(3)
|
Property serves as collateral for a mortgage loan totaling
$19.5 million
as of
December 31, 2012
.
|
|
(4)
|
Property serves as collateral for a mortgage loan totaling
$30.7 million
as of
December 31, 2012
.
|
|
(5)
|
Property serves as collateral for a mortgage loan totaling
$13.7 million
as of
December 31, 2012
.
|
|
(6)
|
Property serves as collateral for the $201.6 million secured revolving credit facility. There was
$92.5 million
outstanding as of
December 31, 2012
.
|
|
(7)
|
The aggregate cost of real estate for federal income tax purposes was
$972.2 million
.
|
F-41
SABRA HEALTH CARE REIT, INC.
SCHEDULE III
REAL ESTATE ASSETS AND ACCUMULATED DEPRECIATION
(dollars in thousands)
|
Year Ended December 31, 2012
|
Year Ended December 31, 2011
|
Period from November 15, 2010 to December 31, 2010
(1)
|
|||||||||
|
Real estate:
|
|
||||||||||
|
Balance at the beginning of the period
|
$
|
760,708
|
|
$
|
564,355
|
|
$
|
564,261
|
|
||
|
Acquisitions
|
202,458
|
|
202,570
|
|
—
|
|
|||||
|
Improvements
|
1,046
|
|
9
|
|
94
|
|
|||||
|
Purchase price allocation adjustment
|
(104
|
)
|
—
|
|
—
|
|
|||||
|
Write-off of fully depreciated assets
|
(7,494
|
)
|
(6,226
|
)
|
—
|
|
|||||
|
|
|
|
|||||||||
|
Balance at the end of the year
|
$
|
956,614
|
|
$
|
760,708
|
|
$
|
564,355
|
|
||
|
|
|
|
|||||||||
|
Accumulated depreciation:
|
|
|
|||||||||
|
Balance at the beginning of the period
|
$
|
(107,331
|
)
|
$
|
(87,382
|
)
|
$
|
(84,248
|
)
|
||
|
Depreciation expense
(2)
|
(29,642
|
)
|
(26,175
|
)
|
(3,134
|
)
|
|||||
|
Write-off of fully depreciated assets
|
7,494
|
|
6,226
|
|
—
|
|
|||||
|
|
|||||||||||
|
Balance at the end of the year
|
$
|
(129,479
|
)
|
$
|
(107,331
|
)
|
$
|
(87,382
|
)
|
||
|
|
(129,276
|
)
|
(107,331)
|
||||||||
(1)
The beginning balances exclude real estate and accumulated depreciation related to properties reclassified as assets held for sale during 2012.
(2)
Depreciation expense for each of the years ended December 31, 2012 and 2011 excludes expense of
$0.3 million
related the to the assets held for sale.
F-42
SIGNATURES
Pursuant to the requirements of Section 13 or 15(d) of the Securities Exchange Act of 1934, the registrant has duly caused this report to be signed on its behalf by the undersigned, thereunto duly authorized, in the City of Irvine, State of California, on
March 13, 2013
.
|
SABRA HEALTH CARE REIT, INC.
|
|
|
By:
|
/S/ RICHARD K. MATROS
|
|
|
Richard K. Matros
Chairman, President and
Chief Executive Officer
|
Pursuant to the requirements of the Securities Exchange Act of 1934, this report has been signed below by the following persons on behalf of the registrant and in the capacities and on the dates indicated:
|
Name
|
Title
|
Date
|
||
|
/S/ RICHARD K. MATROS
|
Chairman, President and Chief
Executive Officer (Principal Executive Officer)
|
March 13, 2013
|
||
|
Richard K. Matros
|
||||
|
/S/ HAROLD W. ANDREWS, JR.
Harold W. Andrews, Jr.
|
Executive Vice President, Chief
Financial Officer and Secretary (Principal
Financial and Accounting Officer)
|
March 13, 2013
|
||
|
Harold W. Andrews, Jr.
|
||||
|
/S/ CRAIG A. BARBAROSH
Craig A. Barbarosh
|
Director
|
March 13, 2013
|
||
|
Craig A. Barbarosh
|
||||
|
/S/ ROBERT A. ETTL
Robert A. Ettl
|
Director
|
March 13, 2013
|
||
|
Robert A. Ettl
|
||||
|
/S/ MICHAEL J. FOSTER
Michael J. Foster
|
Director
|
March 13, 2013
|
||
|
Michael J. Foster
|
||||
|
/S/ MILTON J. WALTERS
|
Director
|
March 13, 2013
|
||
|
Milton J. Walters
|
||||
TABLE OF CONTENTS
Part IItem 1. BusinessItem 1A. Risk FactorsItem 1B. Unresolved Staff CommentsItem 2. PropertiesItem 3. Legal ProceedingsItem 4. Mine Safety DisclosuresPart IIItem 5. Market For Registrant's Common Equity, Related Stockholder Matters and Issuer Purchases Of Equity SecuritiesItem 6. Selected Financial DataItem 7. Management S Discussion and Analysis Of Financial Condition and Results Of OperationsItem 7A. Quantitative and Qualitative Disclosures About Market RiskItem 8. Financial Statements and Supplementary DataItem 9. Changes in and Disagreements with Accountants on Accounting and Financial DisclosureItem 9A. Controls and ProceduresItem 9B. Other InformationPart IIIItem 10. Directors, Executive Officers, and Corporate GovernanceItem 11. Executive CompensationItem 12. Security Ownership Of Certain Beneficial Owners and Management and Related Stockholder MattersItem 13. Certain Relationships and Related Transactions and Director IndependenceItem 14. Principal Accounting Fees and ServicesPart IVItem 15. Exhibits, Financial Statements and Financial Statement Schedule