SABRA HEALTH CARE REIT, INC.
10-Ks and 10-Qs
|
|
|
|
|
|
|
|
|
|
|
|
|
|
|
|
|
|
|
|
|
|
|
|
|
|
|
|
|
|
|
|
|
|
|
|
|
|
|
|
|
|
|
|
|
|
|
|
|
|
|
|
|
UNITED STATES
SECURITIES AND EXCHANGE COMMISSION
Washington, D.C. 20549
FORM 10-K
(Mark One)
|
x
|
ANNUAL REPORT PURSUANT TO SECTION 13 OR 15(d) OF THE SECURITIES EXCHANGE ACT OF 1934
|
For the fiscal year ended
December 31, 2017
OR
|
o
|
TRANSITION REPORT PURSUANT TO SECTION 13 OR 15(d) OF THE SECURITIES EXCHANGE ACT OF 1934
|
Commission file number 001-34950
SABRA HEALTH CARE REIT, INC.
(Exact Name of Registrant as Specified in Its Charter)
|
Maryland
|
|
27-2560479
|
|
(State of Incorporation)
|
|
(I.R.S. Employer Identification No.)
|
18500 Von Karman Avenue, Suite 550
Irvine, CA 92612
(888) 393-8248
(Address, zip code and telephone number of Registrant)
Securities registered pursuant to Section 12(b) of the Act:
|
Title of Each Class
|
|
Name of Each Exchange on Which Registered
|
|
Common Stock
|
|
The Nasdaq Stock Market LLC (Nasdaq Global Select Market)
|
|
7.125% Series A Cumulative Redeemable Preferred Stock
|
The Nasdaq Stock Market LLC (Nasdaq Global Select Market)
|
|
Securities registered pursuant to Section 12(g) of the Act: None
Indicate by check mark if the registrant is a well-known seasoned issuer, as defined in Rule 405 of the Securities Act. Yes
x
No
o
Indicate by check mark if the registrant is not required to file reports pursuant to Section 13 or Section 15(d) of the Act. Yes
o
No
x
Indicate by check mark whether the registrant (1) has filed all reports required to be filed by Section 13 or 15(d) of the Securities Exchange Act of 1934 during the preceding 12 months (or for such shorter period that the registrant was required to file such reports) and (2) has been subject to such filing requirements for the past 90 days. Yes
x
No
o
Indicate by check mark whether the registrant has submitted electronically and posted on its corporate website, if any, every Interactive Data File required to be submitted and posted pursuant to Rule 405 of Regulation S-T (§232.405 of this chapter) during the preceding 12 months (or for such shorter period that the registrant was required to submit and post such files). Yes
x
No
o
Indicate by check mark if disclosure of delinquent filers pursuant to Item 405 of Regulation S-K is not contained herein, and will not be contained, to the best of Registrant’s knowledge, in definitive proxy or information statements incorporated by reference in Part III of this Form 10-K or any amendment of this Form 10-K.
x
Indicate by check mark whether the registrant is a large accelerated filer, an accelerated filer, a non-accelerated filer, a smaller reporting company or an emerging growth company. See the definitions of “large accelerated filer,” “accelerated filer,” “smaller reporting company” and “emerging growth company” in Rule 12b-2 of the Exchange Act. (Check one):
|
Large accelerated filer
|
|
x
|
|
Accelerated filer
|
|
o
|
|
Non-accelerated filer
|
|
o
(Do not check if a smaller reporting company)
|
|
Smaller reporting company
|
|
o
|
|
Emerging growth company
|
o
|
|||||
If an emerging growth company, indicate by check mark if the registrant has elected not to use the extended transition period for complying with any new or revised financial accounting standards provided pursuant to Section 13(a) of the Exchange Act.
o
Indicate by check mark whether the Registrant is a shell company (as defined in Rule 12b-2 of the Exchange Act). Yes
o
No
x
State the aggregate market value of the voting and non-voting common equity held by non-affiliates computed by reference to the price at which the common equity was last sold, or the average bid and asked price of such common equity, as of the last business day of the registrant’s most recently completed second fiscal quarter:
$1.5 billion
As of
February 13, 2018
, there were
178,255,843
shares of the Registrant’s $0.01 par value Common Stock outstanding.
DOCUMENTS INCORPORATED BY REFERENCE
Portions of the Proxy Statement for the registrant's
2018
Annual Meeting of Stockholders, to be filed with the Securities and Exchange Commission not later than 120 days after
December 31, 2017
, are incorporated by reference in Part III herein.
SABRA HEALTH CARE REIT, INC. AND SUBSIDIARIES
Index
1
References throughout this document to “Sabra,” “we,” “our,” “ours” and “us” refer to Sabra Health Care REIT, Inc. and its direct and indirect consolidated subsidiaries and not any other person.
STATEMENT REGARDING FORWARD-LOOKING STATEMENTS
Certain statements in this Annual Report on Form 10-K (this “10-K”) contain “forward-looking” information as that term is defined by the Private Securities Litigation Reform Act of 1995. Any statements that do not relate to historical or current facts or matters are forward-looking statements. Examples of forward-looking statements include all statements regarding our expected future financial position, results of operations, cash flows, liquidity, financing plans, business strategy, tenants, the expected amounts and timing of dividends and other distributions, projected expenses and capital expenditures, competitive position, growth opportunities, potential investments, plans and objectives for future operations, and compliance with and changes in governmental regulations. You can identify some of the forward-looking statements by the use of forward-looking words such as “anticipate,” “believe,” “plan,” “estimate,” “expect,” “intend,” “should,” “may” and other similar expressions, although not all forward-looking statements contain these identifying words.
Our actual results may differ materially from those projected or contemplated by our forward-looking statements as a result of various factors, including, among others, the following:
|
•
|
our dependence on the operating success of our tenants;
|
|
•
|
operational risks with respect to our Senior Housing - Managed communities (as defined below);
|
|
•
|
the effect of our tenants declaring bankruptcy or becoming insolvent;
|
|
•
|
our ability to find replacement tenants and the impact of unforeseen costs in acquiring new properties;
|
|
•
|
the impact of litigation and rising insurance costs on the business of our tenants;
|
|
•
|
the anticipated benefits of our merger with Care Capital Properties, Inc. (“CCP”) may not be realized;
|
|
•
|
the anticipated and unanticipated costs, fees, expenses and liabilities related to our merger with CCP;
|
|
•
|
our ability to implement the previously announced rent repositioning program for certain of our tenants who were legacy tenants of CCP on the timing or terms we have previously disclosed;
|
|
•
|
our ability to dispose of facilities currently leased to Genesis Healthcare, Inc. (“Genesis”) on the timing or terms we have previously disclosed;
|
|
•
|
the possibility that Sabra may not acquire the remaining majority interest in the Enlivant Joint Venture (as defined below);
|
|
•
|
risks associated with our investments in joint ventures;
|
|
•
|
changes in healthcare regulation and political or economic conditions;
|
|
•
|
the impact of required regulatory approvals of transfers of healthcare properties;
|
|
•
|
competitive conditions in our industry;
|
|
•
|
our concentration in the healthcare property sector, particularly in skilled nursing/transitional care facilities and senior housing communities, which makes our profitability more vulnerable to a downturn in a specific sector than if we were investing in multiple industries;
|
|
•
|
the significant amount of and our ability to service our indebtedness;
|
|
•
|
covenants in our debt agreements that may restrict our ability to pay dividends, make investments, incur additional indebtedness and refinance indebtedness on favorable terms;
|
|
•
|
increases in market interest rates;
|
|
•
|
our ability to raise capital through equity and debt financings;
|
|
•
|
changes in foreign currency exchange rates;
|
|
•
|
the relatively illiquid nature of real estate investments;
|
|
•
|
the loss of key management personnel or other employees;
|
|
•
|
uninsured or underinsured losses affecting our properties and the possibility of environmental compliance costs and liabilities;
|
|
•
|
the impact of a failure or security breach of information technology in our operations;
|
|
•
|
our ability to maintain our status as a real estate investment trust (“REIT”);
|
|
•
|
changes in tax laws and regulations affecting REITs (including the potential effects of the Tax Cuts and Jobs Act);
|
|
•
|
compliance with REIT requirements and certain tax and tax regulatory matters related to our status as a REIT; and
|
|
•
|
the ownership limits and anti-takeover defenses in our governing documents and under Maryland law, which may restrict change of control or business combination opportunities.
|
We urge you to carefully consider these risks and review the additional disclosures we make concerning risks and other factors that may materially affect the outcome of our forward-looking statements and our future business and operating results, including those made in Part I, Item 1A, “Risk Factors” in this 10-K, as such risk factors may be amended, supplemented or superseded from time to time by other reports we file with the Securities and Exchange Commission (“SEC”), including
2
subsequent Annual Reports on Form 10-K and Quarterly Reports on Form 10-Q. We caution you that any forward-looking statements made in this 10-K are not guarantees of future performance, events or results, and you should not place undue reliance on these forward-looking statements, which speak only as of the date of this report. We do not intend, and we undertake no obligation, to update any forward-looking information to reflect events or circumstances after the date of this 10-K or to reflect the occurrence of unanticipated events, unless required by law to do so.
TENANT AND BORROWER INFORMATION
This 10-K includes information regarding certain of our tenants that lease properties from us and our borrowers, most of which are not subject to SEC reporting requirements. Genesis is subject to the reporting requirements of the SEC and is required to file with the SEC annual reports containing audited financial information and quarterly reports containing unaudited financial information. The information related to our tenants and borrowers that is provided in this 10-K has been provided by, or derived from information provided by, such tenants and borrowers. We have not independently verified this information. We have no reason to believe that such information is inaccurate in any material respect. We are providing this data for informational purposes only. Genesis’ filings with the SEC can be found at
www.sec.gov
.
3
Overview
We operate as a self-administered, self-managed REIT that, through our subsidiaries, owns and invests in real estate serving the healthcare industry. Our primary business consists of acquiring, financing and owning real estate property to be leased to third party tenants in the healthcare sector. We primarily generate revenues by leasing properties to tenants and owning properties operated by third-party property managers throughout the United States (“U.S.”) and Canada.
On August 17, 2017, we completed our merger with CCP as a result of which we acquired
330
properties (consisting of
296
skilled nursing/transitional care facilities,
13
senior housing communities and
21
specialty hospitals and other facilities),
one
skilled nursing/transitional care facility leased to an operator under a direct financing lease,
18
investments in loans receivable and
one
specialty valuation firm. We also assumed certain outstanding equity awards and other debt and liabilities of CCP. See Note 3, “CCP Merger and Recent Real Estate Acquisitions” in the Notes to Consolidated Financial Statements for additional information.
As of
December 31, 2017
, our investment portfolio consisted of
507
real estate properties held for investment (consisting of (i)
384
skilled nursing/transitional care facilities, (ii)
88
senior housing communities (“Senior Housing - Leased”), (iii)
13
senior housing communities operated by third-party property managers pursuant to property management agreements (“Senior Housing - Managed”) and (iv)
22
specialty hospitals and other facilities),
one
investment in a direct financing lease,
22
investments in loans receivable (consisting of (i)
two
mortgage loans, (ii)
two
construction loans, (iii)
two
mezzanine loans, (iv)
one
pre-development loan and (v)
15
other loans),
12
preferred equity investments and
one
investment in a specialty valuation firm. As of
December 31, 2017
, our real estate properties held for investment included
53,558
beds/units, spread across the U.S. and Canada. As of
December 31, 2017
, the substantial majority of our real estate properties (excluding
13
Senior Housing - Managed communities) were leased under triple-net operating leases with expirations ranging from
less than one year to 15
years.
On
January 2, 2018
, we completed our transaction with affiliates of Enlivant and TPG Real Estate, the real estate platform of TPG, to acquire a 49% equity interest in an entity that collectively owns
172
senior housing communities managed by Enlivant (the “Enlivant Joint Venture”). The joint venture agreement includes an option for us to acquire the remaining majority interest in the Enlivant Joint Venture which terminates on January 2, 2021. Our partner in the Enlivant Joint Venture has the option to transfer its interest commencing on January 2, 2020 subject to our right of first offer. Additionally on
January 2, 2018
, we acquired
11
senior housing communities under the Senior Housing - Managed structure that are operated by Enlivant pursuant to property management agreements. See “Management’s Discussion and Analysis of Financial Condition and Results of Operations—Overview—Enlivant Joint Venture” in Part I, Item 7 for additional information.
We expect to continue to grow our investment portfolio while diversifying our portfolio by tenant, asset class and geography within the healthcare sector. We plan to achieve these objectives primarily through making investments directly or indirectly in healthcare real estate, including the development of purpose built healthcare facilities with select developers. We also intend to achieve our objective of diversifying our portfolio by tenant and asset class through select asset sales and other arrangements with Genesis and with other tenants. We have entered into memoranda of understanding with Genesis to market for sale up to all of our remaining Genesis facilities and to restructure our lease agreements with Genesis to increase the marketability of these facilities to potential buyers. We expect to complete the sales of 46 of our remaining 54 Genesis facilities in 2018 and to retain eight facilities, although we cannot provide assurance that the sales will be completed in that timeframe, if at all.
We employ a disciplined, opportunistic approach in our healthcare real estate investment strategy by investing in assets that provide attractive opportunities for dividend growth and appreciation of asset values, while maintaining balance sheet strength and liquidity, thereby creating long-term stockholder value.
We were incorporated on May 10, 2010 as a wholly owned subsidiary of Sun Healthcare Group, Inc. (“Sun”) and commenced operations on November 15, 2010 following our separation from Sun (the “Separation Date”). We elected to be treated as a REIT with the filing of our U.S. federal income tax return for the taxable year beginning January 1, 2011. We believe that we have been organized and have operated, and we intend to continue to operate, in a manner to qualify as a REIT.
Our principal executive offices are located at 18500 Von Karman Avenue, Suite 550, Irvine, CA 92612, and our telephone number is (888) 393-8248. We maintain a website at
www.sabrahealth.com
. Sabra Health Care REIT, Inc. files reports with the SEC, including annual reports on Form 10-K, quarterly reports on Form 10-Q, current reports on Form 8-K and amendments to
4
those reports filed or furnished pursuant to Section 13(a) or 15(d) of the Securities Exchange Act of 1934, as amended (the “Exchange Act”). We will make such filings available free of charge on our website as soon as reasonably practicable after such information has been filed or furnished with the SEC.
Our Industry
We operate as a REIT that holds investments in income-producing healthcare facilities located in the U.S. and Canada. We invest primarily in the U.S. nursing home industry, including skilled nursing and transitional care facilities, the U.S. and Canadian senior housing industry, which includes independent living, assisted living, memory care and continuing care retirement communities and select behavioral, acute care and other hospitals. The primary growth drivers of these industries – an aging population and longer life expectancies – present attractive investment opportunities for us. According to the 2014 National Population Projections published by the U.S. Census Bureau, Americans over the age of 75 is projected to be the fastest growing segment of the population, growing at a compounded annual growth rate of 2.9% between 2015 and 2020 and 3.6% between 2015 and 2025. According to the same publication, life expectancy is expected to increase to 81.7 years in 2030 from 79.4 years in 2015. Furthermore, the National Investment Center for Seniors Housing and Care, a leading industry data provider, estimates that as of the fourth quarter of 2015, only 14.2% of nursing home and senior housing properties were owned by publicly traded REITs. The highly-fragmented nature of the nursing home and senior housing industries presents additional investment opportunities.
Demand for senior housing is expected to increase as a result of an aging population and an increase in acuity across the post-acute landscape. Cost containment measures adopted by the federal government have encouraged patient treatment in more cost-effective settings, such as skilled nursing facilities. As a result, high acuity patients that previously would have been treated in long-term acute care hospitals and inpatient rehabilitation facilities are increasingly being treated in skilled nursing facilities. According to the National Health Expenditure Projections for 2016-2025 published by the Centers for Medicare & Medicaid Services (“CMS”), nursing home expenditures are projected to grow from approximately $162 billion in 2016 to approximately $260 billion in 2025, representing a compounded annual growth rate of 5.4%. This focus on high acuity patients in skilled nursing facilities has resulted in the typical senior housing resident requiring more assistance with activities for daily living, such as assistance with bathing, grooming, dressing, eating, and medication management; however, many older senior housing communities were not built to accommodate a resident who has more needs as well as increased mobility and cognitive issues than in the past. We believe that these trends will create an emphasis on operators who can effectively adapt their operating model to accommodate the changing nursing home patient and senior housing resident and will result in increased demand for purpose-built properties that are complementary to this new system of healthcare delivery.
The hospital industry is broadly defined to include acute care, long-term acute care, rehabilitation and behavioral hospitals. Hospital services comprise one of the largest categories of healthcare expenditures. According to CMS National Health Expenditure Projections for 2016-2025, hospital care expenditures are projected to grow from approximately $1.1 trillion in 2016 to approximately $1.8 trillion in 2025, representing a compounded annual growth rate of 5.6%. Hospitals offer a wide range of services, both inpatient and outpatient, in a variety of settings. We believe that demand will increase for innovative means of delivering those services and present additional investment opportunities.
Portfolio of Healthcare Investments
We have a geographically diverse portfolio of healthcare investments across the U.S. and Canada that offer a range of services including skilled nursing/transitional care, assisted and independent living, mental health and acute care. As of
December 31, 2017
, our investment portfolio consisted of
507
real estate properties held for investment,
one
investment in a direct financing lease,
22
investments in loans receivable,
12
preferred equity investments and
one
investment in a specialty valuation firm. Of our
507
properties held for investment as of
December 31, 2017
, we owned fee title to 494 properties and title under ground leases for 13 properties.
Our portfolio consisted of the following types of healthcare facilities as of
December 31, 2017
:
|
•
|
Skilled Nursing/Transitional Care Facilities
|
Skilled nursing facilities.
Skilled nursing facilities provide services that include daily nursing, therapeutic rehabilitation, social services, activities, housekeeping, nutrition and administrative services for individuals requiring certain assistance for activities in daily living. A typical skilled nursing facility includes mostly one and two bed units, each equipped with a private or shared bathroom and community dining facilities.
Mental health facilities.
Mental health facilities provide a range of inpatient and outpatient behavioral health services for adults and children through specialized treatment programs.
5
Transitional care facilities/units.
Transitional care facilities/units are licensed nursing facilities or distinct units within a licensed nursing facility that provide short term, intensive, high acuity nursing and medical services. These facilities tend to focus on delivering specialized treatment to patients with cardiac, neurological, pulmonary, orthopedic, and renal conditions. Length of service is typically 30 days or less with the majority of patients returning to prior living arrangements and functional abilities. Generally, transitional care facilities/units provide services to Medicare, managed care and commercial insurance patients.
|
•
|
Senior Housing Communities
|
Independent living communities.
Independent living communities are age-restricted multi-family properties with central dining facilities that provide services that include security, housekeeping, activities, nutrition and limited laundry services. Our independent living communities are designed specifically for independent seniors who are able to live on their own, but desire the security and conveniences of community living. Independent living communities typically offer several services covered under a regular monthly fee.
Assisted living communities.
Assisted living communities provide services that include assistance for activities in daily living and permit residents to maintain some of their privacy and independence as they do not require constant supervision and assistance. Services bundled within one regular monthly fee usually include three meals per day in a central dining room, daily housekeeping, laundry, medical reminders and 24-hour availability of assistance with the activities of daily living, such as eating, dressing and bathing. Professional nursing and healthcare services are usually available at the community on call or at regularly scheduled times. Assisted living communities typically are comprised of one and two bedroom suites equipped with private bathrooms and efficiency kitchens.
Memory care communities.
Memory care communities offer specialized options, services and clinical programs for individuals with Alzheimer's disease and other forms of dementia. Purpose built, free-standing memory care communities offer a more residential environment than offered in a secured unit of a nursing facility. These communities offer dedicated care and specialized programming from specially trained staff for various conditions relating to memory loss in a secured environment that is typically smaller in scale and more residential in nature than traditional assisted living communities. Residents require a higher level of care, a secure environment, customized therapeutic recreation programs and more assistance with activities of daily living than in assisted living communities. Therefore, these communities have staff available 24 hours a day to respond to the unique needs of their residents.
Continuing care retirement communities.
Continuing care retirement communities, or CCRCs, provide, as a continuum of care, the services described above for independent living communities, assisted living communities and skilled nursing facilities in an integrated campus.
|
•
|
Specialty Hospitals and Other Facilities
|
Acute care hospitals.
Acute care hospitals provide emergency room, inpatient and outpatient medical care and other related services for surgery, acute medical conditions or injuries (usually for a short-term illness or condition).
Long-term acute care hospitals.
Long-term acute care hospitals provide care for patients with complex medical conditions that require longer stays and more intensive care, monitoring or emergency back-up than that available in most skilled nursing facilities.
Rehabilitation hospitals.
Rehabilitation hospitals provide inpatient and outpatient care for patients who have sustained traumatic injuries or illnesses, such as spinal cord injuries, strokes, head injuries, orthopedic problems, work-related disabilities and neurological diseases.
Behavioral hospitals.
Behavioral hospitals provide inpatient and outpatient care for patients with mental health conditions, chemical dependence or substance addictions.
Residential services facilities.
Residential services facilities provide services in home and community-based settings, which may include assistance with activities of daily living.
Other facilities.
Other facilities include facilities other than those described above that are not classified as skilled nursing/transitional care or senior housing.
6
Geographic and Property Type Diversification
The following tables display the geographic concentration by property type and by investment and the distribution of beds/units for our real estate held for investment as of
December 31, 2017
(dollars in thousands):
|
Geographic Concentration — Property Type
|
||||||||||||||||||
|
Location
|
Skilled Nursing / Transitional Care
|
|
Senior Housing - Leased
|
|
Senior Housing - Managed
|
Specialty Hospitals and Other
|
Total
|
% of Total
|
||||||||||
|
Texas
|
60
|
|
15
|
|
—
|
|
14
|
|
89
|
|
17.5
|
%
|
||||||
|
California
|
26
|
|
1
|
|
—
|
|
4
|
|
31
|
|
6.1
|
|
||||||
|
Indiana
|
22
|
|
6
|
|
—
|
|
—
|
|
28
|
|
5.5
|
|
||||||
|
Kentucky
|
27
|
|
—
|
|
—
|
|
1
|
|
28
|
|
5.5
|
|
||||||
|
Massachusetts
|
22
|
|
—
|
|
—
|
|
—
|
|
22
|
|
4.3
|
|
||||||
|
Oregon
|
16
|
|
4
|
|
—
|
|
—
|
|
20
|
|
3.9
|
|
||||||
|
New Hampshire
|
11
|
|
6
|
|
—
|
|
—
|
|
17
|
|
3.4
|
|
||||||
|
Washington
|
14
|
|
3
|
|
—
|
|
—
|
|
17
|
|
3.4
|
|
||||||
|
North Carolina
|
15
|
|
2
|
|
—
|
|
—
|
|
17
|
|
3.4
|
|
||||||
|
Connecticut
|
14
|
|
2
|
|
—
|
|
—
|
|
16
|
|
3.2
|
|
||||||
|
Other (33 states & Canada)
|
157
|
|
49
|
|
13
|
|
3
|
|
222
|
|
43.8
|
|
||||||
|
Total
|
384
|
|
88
|
|
13
|
|
22
|
|
507
|
|
100.0
|
%
|
||||||
|
|
|
|
|
|
|
|
|
|||||||||||
|
% of Total properties
|
75.7
|
%
|
17.4
|
%
|
2.6
|
%
|
4.3
|
%
|
100.0
|
%
|
||||||||
|
Distribution of Beds/Units
|
|||||||||||||||||||||
|
|
Property Type
|
||||||||||||||||||||
|
Location
|
Total Number of Properties
|
Skilled Nursing / Transitional Care
|
Senior Housing - Leased
|
Senior Housing - Managed
|
Specialty Hospitals and Other
|
Total
|
% of Total
|
||||||||||||||
|
Texas
|
89
|
|
7,391
|
|
1,502
|
|
—
|
|
366
|
|
9,259
|
|
17.3
|
%
|
|||||||
|
Kentucky
|
28
|
|
2,819
|
|
—
|
|
—
|
|
40
|
|
2,859
|
|
5.3
|
|
|||||||
|
Indiana
|
28
|
|
2,325
|
|
449
|
|
—
|
|
—
|
|
2,774
|
|
5.2
|
|
|||||||
|
California
|
31
|
|
2,210
|
|
102
|
|
—
|
|
340
|
|
2,652
|
|
5.0
|
|
|||||||
|
Massachusetts
|
22
|
|
2,621
|
|
—
|
|
—
|
|
—
|
|
2,621
|
|
4.9
|
|
|||||||
|
Oregon
|
20
|
|
1,561
|
|
509
|
|
—
|
|
—
|
|
2,070
|
|
3.9
|
|
|||||||
|
Connecticut
|
16
|
|
1,824
|
|
140
|
|
—
|
|
—
|
|
1,964
|
|
3.7
|
|
|||||||
|
North Carolina
|
17
|
|
1,672
|
|
237
|
|
—
|
|
—
|
|
1,909
|
|
3.6
|
|
|||||||
|
New Hampshire
|
17
|
|
1,016
|
|
838
|
|
—
|
|
—
|
|
1,854
|
|
3.5
|
|
|||||||
|
Washington
|
17
|
|
1,584
|
|
206
|
|
—
|
|
—
|
|
1,790
|
|
3.2
|
|
|||||||
|
Other (33 states & Canada)
|
222
|
|
18,200
|
|
4,154
|
|
1,113
|
|
339
|
|
23,806
|
|
44.4
|
|
|||||||
|
Total
|
507
|
|
43,223
|
|
8,137
|
|
1,113
|
|
1,085
|
|
53,558
|
|
100.0
|
%
|
|||||||
|
% of Total beds/units
|
80.7
|
%
|
15.2
|
%
|
2.1
|
%
|
2.0
|
%
|
100.0
|
%
|
|||||||||||
7
|
Geographic Concentration — Investment
(1)
|
||||||||||||||||||||||||||
|
Property Type
|
||||||||||||||||||||||||||
|
Location
|
Total Number of Properties
|
Skilled Nursing / Transitional Care
|
Senior Housing - Leased
|
Senior Housing - Managed
|
Specialty Hospitals and Other
|
Total
|
% of Total
|
|||||||||||||||||||
|
Texas
|
89
|
|
$
|
589,110
|
|
$
|
234,838
|
|
$
|
—
|
|
$
|
195,929
|
|
$
|
1,019,877
|
|
16.1
|
%
|
|||||||
|
California
|
31
|
|
417,387
|
|
35,901
|
|
—
|
|
217,763
|
|
671,051
|
|
10.6
|
|
||||||||||||
|
Oregon
|
20
|
|
264,892
|
|
86,250
|
|
—
|
|
—
|
|
351,142
|
|
5.5
|
|
||||||||||||
|
Maryland
|
9
|
|
320,124
|
|
6,566
|
|
—
|
|
—
|
|
326,690
|
|
5.2
|
|
||||||||||||
|
New York
|
10
|
|
297,066
|
|
19,235
|
|
—
|
|
—
|
|
316,301
|
|
5.0
|
|
||||||||||||
|
Indiana
|
28
|
|
213,438
|
|
59,888
|
|
—
|
|
—
|
|
273,326
|
|
4.3
|
|
||||||||||||
|
Kentucky
|
28
|
|
239,941
|
|
—
|
|
—
|
|
30,313
|
|
270,254
|
|
4.3
|
|
||||||||||||
|
North Carolina
|
17
|
|
138,902
|
|
67,272
|
|
—
|
|
—
|
|
206,174
|
|
3.3
|
|
||||||||||||
|
Washington
|
17
|
|
168,194
|
|
36,900
|
|
—
|
|
—
|
|
205,094
|
|
3.2
|
|
||||||||||||
|
Arizona
|
8
|
|
31,976
|
|
47,246
|
|
—
|
|
121,757
|
|
200,979
|
|
3.2
|
|
||||||||||||
|
Other (33 states & Canada)
(1)
|
250
|
|
1,683,357
|
|
572,591
|
|
189,120
|
|
48,306
|
|
2,493,374
|
|
39.3
|
|
||||||||||||
|
Total
|
507
|
|
$
|
4,364,387
|
|
$
|
1,166,687
|
|
$
|
189,120
|
|
$
|
614,068
|
|
$
|
6,334,262
|
|
100.0
|
%
|
|||||||
|
% of Total investment
|
|
|
68.9
|
%
|
18.4
|
%
|
3.0
|
%
|
9.7
|
%
|
100.0
|
%
|
|
|
||||||||||||
|
(1)
|
Represents the undepreciated book value of our real estate held for investment as of
December 31, 2017
.
|
|
(2)
|
Investment balance in Canada is based on the exchange rate as of
December 31, 2017
of $0.7967 per CAD $1.00.
|
Loans Receivable and Other Investments
As of
December 31, 2017
and
2016
, our loans receivable and other investments consisted of the following (dollars in thousands):
|
December 31, 2017
|
|||||||||||||||||||||||||
|
Investment
|
Quantity
as of December 31, 2017 |
Property Type
|
Principal Balance as of December 31, 2017
(1)
|
Book Value
as of December 31, 2017 |
Book Value
as of December 31, 2016 |
Weighted Average Contractual Interest Rate / Rate of Return
|
Weighted Average Annualized Effective Interest Rate / Rate of Return
|
Maturity Date
as of December 31, 2017 |
|||||||||||||||||
|
Loans Receivable:
|
|||||||||||||||||||||||||
|
Mortgage
|
2
|
|
Skilled Nursing / Senior Housing
|
$
|
13,366
|
|
$
|
12,351
|
|
$
|
38,262
|
|
9.9
|
%
|
11.3
|
%
|
12/31/18- 01/31/27
|
||||||||
|
Construction
|
2
|
|
Senior Housing
|
2,667
|
|
2,733
|
|
842
|
|
8.0
|
%
|
7.7
|
%
|
03/31/21- 05/31/22
|
|||||||||||
|
Mezzanine
|
2
|
|
Senior Housing
|
32,468
|
|
10,239
|
|
9,656
|
|
10.2
|
%
|
19.2
|
%
|
02/28/18- 05/25/20
|
|||||||||||
|
Pre-development
|
1
|
|
Senior Housing
|
2,357
|
|
2,357
|
|
4,023
|
|
9.0
|
%
|
8.4
|
%
|
04/01/20
|
|||||||||||
|
Other
|
15
|
|
Multiple
|
40,422
|
|
38,324
|
|
—
|
|
8.8
|
%
|
10.1
|
%
|
2/28/18- 04/30/27
|
|||||||||||
|
Debtor-in-possession
|
—
|
|
Acute Care Hospital
|
—
|
|
—
|
|
813
|
|
N/A
|
|
N/A
|
|
N/A
|
|||||||||||
|
22
|
|
91,280
|
|
66,004
|
|
53,596
|
|
9.4
|
%
|
11.6
|
%
|
||||||||||||||
|
Loan loss reserve
|
—
|
|
(97
|
)
|
(2,750
|
)
|
|||||||||||||||||||
|
91,280
|
|
65,907
|
|
50,846
|
|
||||||||||||||||||||
|
Other Investments:
|
|||||||||||||||||||||||||
|
Preferred Equity
|
12
|
|
Skilled Nursing / Senior Housing
|
48,035
|
|
48,483
|
|
45,190
|
|
12.6
|
%
|
12.6
|
%
|
N/A
|
|||||||||||
|
Total
|
34
|
|
$
|
139,315
|
|
$
|
114,390
|
|
$
|
96,036
|
|
10.5
|
%
|
12.0
|
%
|
||||||||||
|
(1)
|
Principal balance includes amounts funded and accrued unpaid interest/preferred return and excludes capitalizable fees.
|
8
Significant Credit Concentrations
The following table provides information regarding significant tenant relationships representing 10% or more of our total revenues for the year ended
December 31, 2017
:
|
As of December 31, 2017
|
For the year ended December 31, 2017
|
|||||||||||
|
Number of Investments
|
% of Total Assets
|
% of Total Investments
(1)
|
% of Total Revenues
|
|||||||||
|
Genesis Healthcare, Inc.
|
54
|
|
3.5
|
%
|
5.9
|
%
|
19.8
|
%
|
||||
|
(1)
|
Total investments consists of gross real estate investment balance, preferred equity investments, loans receivable investments plus capitalized origination fees net of loan loss reserves.
|
See “Risk Factors—Risks Related to Tenant Concentration” in Part I, Item 1A of this 10-K and “Management’s Discussion and Analysis of Financial Condition and Results of Operations—Concentration of Credit Risk” in Part I, Item 7 for additional information, including risks and uncertainties, regarding our significant tenant concentration.
Investment Financing Strategy
We intend to invest in additional healthcare properties as suitable opportunities arise and adequate sources of financing are available. We expect that future investments in properties, including any improvements or renovations of current or newly-acquired properties, will depend on and will be financed, in whole or in part, by our existing cash, borrowings available to us under our Revolving Credit Facility (as defined below), future borrowings or the proceeds from issuances of common stock, preferred stock, debt or other securities. In addition, we may seek financing from U.S. government agencies, including through Fannie Mae and the U.S. Department of Housing and Urban Development (“HUD”), in appropriate circumstances in connection with acquisitions. We also use derivative instruments in the normal course of business to mitigate interest rate and foreign currency risk.
Competitive Strengths
We believe the following competitive strengths contribute significantly to our success:
Geographically Diverse and Stable Property Portfolio
Our portfolio of
507
properties held for investment as of
December 31, 2017
is broadly diversified by location across the U.S. and Canada. Our properties in any one state or province did not account for more than
18%
of our total beds/units as of
December 31, 2017
. Our geographic diversification will limit the effect of a decline in any one regional market on our overall performance. The annual occupancy percentages of our stabilized properties remained stable over the last three fiscal years at between
84.0%
and
87.0%
for our skilled nursing/transitional care facilities, between
87.8%
and
90.3%
for our Senior Housing - Leased communities, between
75.5%
and
90.6%
for our Senior Housing - Managed communities and between
69.7%
and
79.2%
for our specialty hospitals and other facilities. We have also been able to diversify, through acquisitions and dispositions, the extent to which our revenues are dependent on our tenants’, borrowers’ and equity investees’ revenues from federal, state and local government reimbursement programs. Based on the information provided to us by our tenants and borrowers, which information is provided quarterly in arrears, on an annualized basis as of
December 31, 2017
, 66.2% of our tenants’, borrowers’ and equity investees’ revenue was from federal, state and local government reimbursement programs.
Long-Term, Triple-Net Lease Structure
As of December 31, 2017, the substantial majority of our real estate properties held for investment (excluding
13
Senior Housing - Managed communities) are leased under triple-net operating leases with expirations ranging from
less than one year to 15
years, pursuant to which the tenants are responsible for all facility maintenance, insurance required in connection with the leased properties and the business conducted on the leased properties, taxes levied on or with respect to the leased properties and all utilities and other services necessary or appropriate for the leased properties and the business conducted on the leased properties. As of
December 31, 2017
, the leases had a weighted-average remaining term of
9
years. The leases include provisions to extend the lease terms and other negotiated terms and conditions. We retain substantially all of the risks and benefits of ownership of the real estate assets leased to tenants. In addition, we may receive additional security under these operating leases in the form of letters of credit and security deposits from the lessee or guarantees from the parent of the lessee or other parties related to the lessee.
Strong Relationships with Operators
The members of our management team have developed an extensive network of relationships with qualified local, regional and national operators of skilled nursing/transitional care facilities and senior housing communities across the U.S.
9
and Canada. This extensive network has been built by our management team through more than 100 years of combined operating experience, involvement in industry trade organizations and the development of banking relationships and investor relations within the skilled nursing and senior housing industries. We work collaboratively with our operators to help them achieve their growth and business objectives. We believe these strong relationships with operators help us to source investment opportunities.
Our relationships with operators include pipeline agreements that we have entered into with certain operators that provide for the acquisition of, and interim capital commitments for, various healthcare facilities. These pipeline agreements, together with repeat transactions with other operators, help support our future growth potential by providing additional investment opportunities with lower merger and acquisition costs than would be required for investments with new operators.
Ability to Identify Talented Operators
As a result of our management team’s operating experience, network of relationships and industry insight, we have been able and expect to continue to be able to identify qualified local, regional and national operators. We seek operators who possess local market knowledge, demonstrate hands-on management, have proven track records and emphasize patient care. These operators are often located in secondary markets, which generally have lower costs to build and favorable demographics as demonstrated by the fact that the percentage of the population over the age of 65 is greater in the markets where we have invested than in the U.S. as a whole. We believe our management team’s experience gives us a key competitive advantage in objectively evaluating an operator’s financial position, emphasis on care and operating efficiency.
Significant Experience in Proactive Asset Management
The members of our management team have significant experience developing systems to collect and evaluate data relating to the underlying operational and financial success of healthcare companies and healthcare-related real estate assets. We are able to utilize this experience and expertise to provide our operators, when requested, with significant assistance in the areas of marketing, development, facility expansion and strategic planning. We have also developed a proprietary information technology system that allows us to efficiently and effectively collect tenant, financial, asset management and acquisitions information. Leveraging this system allows us to be lean in our operations and proactive in sharing information with our tenants and operators where we can be helpful to them. We actively monitor the operating results of our tenants and, when requested, will work closely with our operators to identify and capitalize on opportunities to improve the operations of our facilities and the overall financial and operating strength of our operators.
Experienced Management Team
Our management team has extensive healthcare and real estate experience. Richard K. Matros, Chairman, President and Chief Executive Officer of Sabra, has more than 30 years of experience in the acquisition, development and disposition of healthcare assets, including nine years at Sun Healthcare Group, Inc. Harold W. Andrews, Jr., Executive Vice President, Chief Financial Officer and Secretary of Sabra, is a finance professional with more than 20 years of experience in both the provision of healthcare services and healthcare real estate. Talya Nevo-Hacohen, Executive Vice President, Chief Investment Officer and Treasurer of Sabra, is a real estate finance executive with more than 25 years of experience in real estate finance, acquisition and development, including three years of experience managing and implementing the capital markets strategy of an S&P 500 healthcare REIT. Through years of public company experience, our management team also has extensive experience accessing both debt and equity capital markets to fund growth and maintain a flexible capital structure.
Business Strategies
We pursue business strategies focused on opportunistic acquisitions and property diversification where such acquisitions meet our investing and financing strategy. We also intend to further develop our relationships with tenants and healthcare providers with a goal to progressively expand the mixture of tenants managing and operating our properties.
The key components of our business strategies include:
Diversify Asset Portfolio
We expect to continue to grow our portfolio primarily through the acquisition of assisted living, independent living and memory care communities in the U.S. and Canada and through the acquisition of skilled nursing/transitional care and behavioral health facilities in the U.S. We have and expect to continue to opportunistically acquire other types of healthcare real estate, originate financing secured directly or indirectly by healthcare facilities and invest in the development of senior housing communities and skilled nursing/transitional care facilities. We also expect to expand our portfolio through the development of purpose-built healthcare facilities through pipeline agreements and other arrangements with select developers. We further expect to work with existing operators to identify strategic development opportunities. These opportunities may involve
10
replacing, renovating or expanding facilities in our portfolio that may have become less competitive and new development opportunities that present attractive risk-adjusted returns. In addition to pursuing acquisitions with triple-net leases, we expect to continue to pursue other forms of investment, including investments in Senior Housing - Managed communities, mezzanine and secured debt investments, and joint ventures for senior housing communities and skilled nursing/transitional care facilities. We also expect to continue to enhance the strength of our investment portfolio by selectively disposing of underperforming facilities or working with new or existing operators to transfer underperforming but promising properties to new operators.
With respect to our debt and preferred equity investments, in general, we originate loans and make preferred equity investments when an attractive investment opportunity is presented and (a) the property is in or near the development phase, (b) the development of the property is completed but the operations of the facility are not yet stabilized or (c) the loan investment will provide capital to existing relationships. A key component of our development strategy related to loan originations and preferred equity investments is having the option to purchase the underlying real estate that is owned by our borrowers (and that directly or indirectly secures our loan investments) or by the entity in which we have an investment. These options become exercisable upon the occurrence of various criteria, such as the passage of time or the achievement of certain operating goals, and the method to determine the purchase price upon exercise of the option is set in advance based on the same valuation methods we use to value our investments in healthcare real estate. This proprietary development pipeline strategy allows us to diversify our revenue streams and build relationships with operators and developers, and provides us with the option to add new properties to our existing real estate portfolio if we determine that those properties enhance our investment portfolio and stockholder value at the time the options are exercisable.
We seek to maintain a capital structure that provides the resources and flexibility to support the growth of our business. As of
December 31, 2017
, we had approximately
$877.4 million
in liquidity, consisting of unrestricted cash and cash equivalents of
$518.4 million
(excluding joint venture cash and cash equivalents), and available borrowings under our Revolving Credit Facility of
$359.0 million
. The Credit Facility (as defined below) also contains an accordion feature that can increase the total available borrowings to
$2.5 billion
(up from U.S.
$2.1 billion
plus CAD
$125.0 million
), subject to terms and conditions. Subsequent to December 31, 2017, we closed on our investment in the Enlivant Joint Venture and on our acquisitions of 11 senior housing communities under the Senior Housing - Managed structure that are operated by Enlivant pursuant to property management agreements and two additional skilled nursing/transitional care facilities. These closings were funded using
$515.8 million
of cash and
$18.0 million
of proceeds from our Revolving Credit Facility.
We have filed a shelf registration statement with the SEC that expires in January 2020, which allows us to offer and sell shares of common stock, preferred stock, warrants, rights, units, and certain of our subsidiaries to offer and sell debt securities, through underwriters, dealers or agents or directly to purchasers, on a continuous or delayed basis, in amounts, at prices and on terms we determine at the time of the offering, subject to market conditions.
We intend to maintain a mix of Credit Facility debt, term loan debt, secured debt and unsecured term debt, which, together with our anticipated ability to complete future equity financings, we expect will fund the growth of our operations. Further, we may opportunistically seek access to U.S. government agency financing, including through Fannie Mae and HUD, in appropriate circumstances in connection with acquisitions.
Develop New Investment Relationships
We seek to cultivate our relationships with tenants and healthcare providers in order to expand the mix of tenants operating our properties and, in doing so, to reduce our dependence on any single tenant or operator. We have grown our investment relationships from one in 2010 to
72
as of
December 31, 2017
. We expect to continue to develop new investment relationships as part of our overall strategy to acquire new properties and further diversify our overall portfolio of healthcare properties.
Capital Source to Underserved Operators
We believe that there is a significant opportunity to be a capital source to healthcare operators through the acquisition of healthcare properties that are consistent with our investment and financing strategy, but that, due to size and other considerations, are not a focus for other healthcare REITs. We utilize our management team’s operating experience, network of relationships and industry insight to identify financially strong and growing operators in need of capital funding for future growth. In appropriate circumstances, we may negotiate with operators to acquire individual healthcare properties from those operators and then lease those properties back to the operators pursuant to long-term triple-net leases or refinance new projects.
11
Strategic Capital Improvements
We intend to continue to support operators by providing capital to them for a variety of purposes, including for capital expenditures and facility modernization. We expect to structure these investments as either lease amendments that produce additional rents or as loans that are repaid by operators during the applicable lease term.
Pursue Strategic Development Opportunities
We expect to work with existing operators to identify strategic development opportunities. These opportunities may involve replacing, renovating or expanding facilities in our portfolio that may have become less competitive and new development opportunities that present attractive risk-adjusted returns. In addition to pursuing acquisitions with triple-net leases, we expect to continue to pursue other forms of investment, including investments in Senior Housing - Managed communities, mezzanine and secured debt investments, and joint ventures for senior housing and skilled nursing/transitional care facilities.
Our Employees
As of
December 31, 2017
, we employed
61
full-time employees, including our executive officers and
31
employees associated with the specialty valuation firm we acquired in the CCP Merger (as defined below), none of whom is subject to a collective bargaining agreement.
Competition
We compete for real property investments with other REITs, investment companies, private equity and hedge fund investors, sovereign funds, healthcare operators, lenders and other investors. Some of our competitors are significantly larger and have greater financial resources and lower costs of capital than we do. Increased competition makes it more challenging to identify and successfully capitalize on acquisition opportunities that meet our investment objectives. Our ability to compete is also impacted by national and local economic trends, availability of investment alternatives, availability and cost of capital, construction and renovation costs, existing laws and regulations, new legislation and population trends.
In addition, revenues from our properties are dependent on the ability of our tenants and operators to compete with other healthcare operators. These operators compete on a local and regional basis for residents and patients, and the operators’ ability to successfully attract and retain residents and patients depends on key factors such as the number of facilities in the local market, the types of services available, the quality of care, reputation, age and appearance of each facility, and the cost of care in each locality. Private, federal and state payment programs and the effect of other laws and regulations may also have a significant impact on the ability of our tenants and operators to compete successfully for residents and patients at the properties.
Government Regulation
Our tenants are subject to extensive and complex federal, state and local healthcare laws and regulations, including anti-kickback, anti-fraud and abuse provisions codified under the Social Security Act. These provisions prohibit certain business practices and relationships that might affect the provision and cost of healthcare services reimbursable under Medicare and Medicaid. Sanctions for violating these anti-kickback, anti-fraud and abuse provisions include criminal penalties, civil sanctions, fines and possible exclusion from government programs such as Medicare and Medicaid. If a facility is decertified as a Medicare or Medicaid provider by CMS or a state, the facility will not thereafter be reimbursed for caring for residents that are covered by Medicare and Medicaid, and the facility would be forced to care for such residents without being reimbursed or to transfer such residents.
Most of our tenants’ skilled nursing/transitional care facilities, assisted living and mental health facilities are licensed under applicable state law. Most of our skilled nursing/transitional care facilities and mental health facilities are certified or approved as providers under the Medicare and Medicaid programs. Some of our assisted living facilities are certified or approved as providers under various state Medicaid and/or Medicaid waiver programs. Similarly, the operators of our specialty hospitals must meet the applicable conditions of participation established by the U.S. Department of Health and Human Services and comply with state and local laws and regulations in order to receive Medicare and Medicaid reimbursement. State and local agencies survey all skilled nursing facilities and some assisted living facilities on a regular basis to determine whether such facilities are in compliance with governmental operating and health standards and conditions for participation in government sponsored third party payor programs. Under certain circumstances, the federal and state agencies have the authority to take adverse actions against a center or service provider, including the imposition of a monitor, the imposition of monetary penalties and the decertification of a facility or provider from participation in the Medicare and/or Medicaid/Medicaid waiver programs or licensure revocation. Challenging and appealing notices or allegations of noncompliance can require significant legal expenses and management attention.
12
Various states in which our tenants operate our facilities have established minimum staffing requirements or may establish minimum staffing requirements in the future. Failure to comply with such minimum staffing requirements may result in the imposition of fines or other sanctions. Most states in which our tenants operate have statutes requiring that prior to the addition or construction of new nursing home beds, to the addition of new services or to certain capital expenditures in excess of defined levels, the tenant first must obtain a certificate of need, which certifies that the state has made a determination that a need exists for such new or additional beds, new services or capital expenditures. The certification process is intended to promote quality healthcare at the lowest possible cost and to avoid the unnecessary duplication of services, equipment and centers. This certification process can restrict or prohibit the undertaking of a project or lengthen the period of time required to enlarge or renovate a facility or replace a tenant.
In addition to the above, those of our tenants who provide services that are paid for by Medicare and Medicaid are subject to federal and state budgetary cuts and constraints that limit the reimbursement levels available from these government programs. Changes to reimbursement or methods of payment from Medicare and Medicaid could result in a substantial reduction in our tenants’ revenues. On January 20, 2017, the President issued an executive order aimed at seeking the prompt repeal of the Patient Protection and Affordable Care Act of 2010 (the “Affordable Care Act”), and on December 22, 2017, the President signed into law the Tax Cuts and Jobs Act, which amends certain provisions of the Affordable Care Act. Amendments to or repeal of the Affordable Care Act and regulatory changes could impose further limitations on government payments to our tenants. On February 9, 2018, the President signed a two-year budget deal that includes a 10-year, $2 billion cut to skilled nursing facility Medicare reimbursement. Instead of providers receiving their regular annual Medicare market basket update from CMS in 2019, the new spending package freezes the reimbursement increases at 2.4%. The exact rate level will not be known until CMS releases proposed rules on May 1, 2018.
As of
December 31, 2017
, our subsidiaries owned
17
healthcare facilities (11 skilled nursing/transitional care facilities and six senior housing communities) with mortgage loans that are guaranteed by HUD. Those facilities are subject to the rules and regulations of HUD, including periodic inspections by HUD, although the tenants of those facilities have the primary responsibility for maintaining the facilities in compliance with HUD’s rules and regulations. The regulatory agreements entered into by each owner and each operator of the property restrict, among other things, any sale or other transfer of the property, modification of the lease between the owner and the operator, use of surplus cash from the property except upon certain conditions and renovations of the property, all without prior HUD approval.
In addition, as an owner of real property, we are subject to various federal, state and local environmental and health and safety laws and regulations. These laws and regulations address various matters, including asbestos, fuel oil management, wastewater discharges, air emissions, medical wastes and hazardous wastes. The costs of complying with these laws and regulations and the penalties for non-compliance can be substantial. For example, although we do not generally operate or actively manage our properties, we may be held primarily or jointly and severally liable for costs relating to the investigation and clean up of any property from which there has been a release or threatened release of a regulated material as well as other affected properties, regardless of whether we knew of or caused the release. In addition to these costs, which are typically not limited by law or regulation and could exceed the property’s value, we could be liable for certain other costs, including governmental fines and injuries to persons, property or natural resources. See “Risk Factors—Risks Relating to Our Business—Environmental compliance costs and liabilities associated with real estate properties owned by us may materially impair the value of those investments.”
The following describes the risks and uncertainties that could cause our actual results to differ materially from those presented in our forward-looking statements. The risks and uncertainties described below are not the only ones we face but do represent those risks and uncertainties that we believe are material to us. Additional risks and uncertainties not presently known to us or that we currently deem immaterial may also harm our business.
Risks Related to Tenant Concentration
We are dependent on Genesis until we further diversify our portfolio, and an event that has a material adverse effect on Genesis’s business, financial position or results of operations would have a material adverse effect on our business, financial position or results of operations.
For the year ended
December 31, 2017
, leases to subsidiaries of Genesis represented
19.8%
of our total revenues, with Genesis guaranteeing the obligations under the lease agreements. There can be no assurance that Genesis and its subsidiaries will have sufficient assets, income and access to financing to enable them to satisfy their payment obligations under their lease agreements. The inability of Genesis and its subsidiaries to meet their rent obligations would materially adversely affect our business, financial position or results of operations including our ability to pay dividends to our stockholders as required to
13
maintain our status as a REIT. The inability of Genesis and its subsidiaries to satisfy their other obligations under their lease agreements such as the payment of taxes, insurance and utilities could have a material adverse effect on the condition of the leased properties as well as on our business, financial position and results of operations. For these reasons, if Genesis were to experience a material adverse effect on its business, financial position or results of operations, our business, financial position or results of operations would also be materially adversely affected.
Due to our dependence on rental payments from Genesis and its subsidiaries as a significant source of revenues, we may be limited in our ability to enforce our rights under these lease agreements or to terminate a lease thereunder. Failure by Genesis and its subsidiaries to comply with the terms of their lease agreements or to comply with the healthcare regulations to which the leased properties and Genesis’s operations are subject could require us to find other lessees for any affected leased properties and there could be a decrease or cessation of rental payments by Genesis and its subsidiaries. In such event, we may be unable to locate suitable replacement lessees willing to pay similar rental rates or at all, which would have the effect of reducing our rental revenues.
Risks Relating to Our Business
We are dependent on the operating success of our tenants.
Our tenants’ revenues are primarily driven by occupancy, Medicare and Medicaid reimbursement and private pay rates. Revenues from government reimbursement have been, and may continue to be, subject to rate cuts and further pressure from federal and state budgetary cuts and constraints. Overall weak economic conditions in the U.S. may adversely affect occupancy rates of healthcare facilities that rely on private pay residents. Our tenants’ expenses are driven by the costs of labor, food, utilities, taxes, insurance and rent or debt service. In addition, any failure by a tenant to effectively conduct its operations or to maintain and improve our properties could adversely affect its business reputation and its ability to attract and retain residents in our properties. To the extent any decrease in revenues and/or any increase in operating expenses results in our tenants’ not generating enough cash to make scheduled lease payments to us, our business, financial position or results of operations could be materially adversely affected.
We are exposed to operational risks with respect to our Senior Housing - Managed communities.
We are exposed to various operational risks with respect to our Senior Housing - Managed communities that may increase our costs or adversely affect our ability to generate revenues. These risks are similar to the ones described above with respect to our tenants and include fluctuations in occupancy and private pay rates; economic conditions; competition; federal, state, local, and industry-regulated licensure, certification and inspection laws, regulations, and standards; the availability and increases in cost of general and professional liability insurance coverage; state regulation and rights of residents related to entrance fees; and the availability and increases in the cost of labor (as a result of unionization or otherwise). Any one or a combination of these factors may adversely affect our business, financial position or results of operations.
Our tenants and operators may be adversely affected by increasing healthcare regulation and enforcement.
Over the last several years, the regulatory environment of the long-term healthcare industry has intensified both in the amount and type of regulations and in the efforts to enforce those regulations. This is particularly true for large for-profit, multi-facility providers. The extensive federal, state and local laws and regulations affecting the healthcare industry include those relating to, among other things, licensure, conduct of operations, ownership of facilities, addition of facilities and equipment, allowable costs, services, prices for services, qualified beneficiaries, quality of care, patient rights, fraudulent or abusive behavior, and financial and other arrangements that may be entered into by healthcare providers. Changes in enforcement policies by federal and state governments have resulted in a significant increase in the number of inspections, citations of regulatory deficiencies and other regulatory sanctions, including terminations from the Medicare and Medicaid programs, bars on Medicare and Medicaid payments for new admissions, civil monetary penalties and even criminal penalties.
If our tenants or operators fail to comply with the extensive laws, regulations and other requirements applicable to their businesses and the operation of our properties, they could become ineligible to receive reimbursement from governmental and private third-party payor programs, face bans on admissions of new patients or residents, suffer civil or criminal penalties or be required to make significant changes to their operations. Our tenants and operators also could be forced to expend considerable resources responding to an investigation, lawsuit or other enforcement action under applicable laws or regulations. In such event, the results of operations and financial condition of our tenants and operators and the results of operations of our properties operated by those entities could be adversely affected, which, in turn, could have a material adverse effect on us. We are unable to predict future federal, state and local regulations and legislation, including the Medicare and Medicaid statutes and regulations, or the intensity of enforcement efforts with respect to such regulations and legislation, and any changes in the
14
regulatory framework could have a material adverse effect on our tenants, which, in turn, could have a material adverse effect on us.
Our tenants and operators depend on reimbursement from governmental and other third-party payor programs, and reimbursement rates from such payors may be reduced.
Many of our tenants and operators depend on third-party payors, including Medicare, Medicaid or private third-party payors, for the majority of their revenue. The reduction in reimbursement rates from third-party payors, including insurance companies and the Medicare and Medicaid programs, or other measures reducing reimbursements for services provided by our tenants and operators, may result in a reduction in our tenants’ and operators’ revenues and operating margins. In addition, reimbursement from private third-party payors may be reduced as a result of retroactive adjustment during claims settlement processes or as a result of post-payment audits. Furthermore, new laws and regulations could impose additional limitations on government and private payments to healthcare providers. For example, our tenants and operators may be affected by health reform initiatives that modify certain payment systems to encourage more cost-effective care and a reduction of inefficiencies and waste (e.g. the implementation of a voluntary bundled payment program and the creation of accountable care organizations). We cannot assure you that adequate reimbursement levels will continue to be available for the services provided by our tenants and operators. Although moderate reimbursement rate reductions may not affect our tenants’ ability to meet their financial obligations to us, significant limits on reimbursement rates or on the services reimbursed could have a material adverse effect on their business, financial position or results of operations, which could materially adversely affect their ability to meet their financial obligations to us.
While reimbursement rates have generally increased over the past few years, President Trump and members of the U.S. Congress may approve or propose various spending cuts and tax reform initiatives that could result in changes (including substantial reductions in funding) to Medicare, Medicaid or Medicare Advantage Plans. In addition, a number of states are currently managing budget deficits, which may put pressure on states to decrease reimbursement rates for our tenants and operators with a goal of decreasing state expenditures under their state Medicaid programs. Any such existing or future federal or state legislation relating to deficit reduction that reduces reimbursement payments to healthcare providers could have a material adverse effect on our tenants’ and operators’ business, financial position or results of operations, which could materially adversely affect their ability to meet their financial obligations to us and could have a material adverse effect on us.
We face potential adverse consequences of bankruptcy or insolvency by our tenants, operators, borrowers, managers and other obligors.
We are exposed to the risk that our tenants could become bankrupt or insolvent. Although our lease agreements provide us with the right to exercise certain remedies in the event of default on the obligations owing to us or upon the occurrence of certain insolvency events, the bankruptcy and insolvency laws afford certain rights to a party that has filed for bankruptcy or reorganization. For example, a lessee may reject its lease with us in a bankruptcy proceeding. In such a case, our claim against the lessee for unpaid and future rents would be limited by the statutory cap of the U.S. Bankruptcy Code. This statutory cap could be substantially less than the remaining rent actually owed under the lease, and any claim we have for unpaid rent might not be paid in full. In addition, a lessee may assert in a bankruptcy proceeding that its lease should be re-characterized as a financing agreement. If such a claim is successful, our rights and remedies as a lender, compared to a landlord, are generally more limited.
We may be unable to find a replacement tenant for one or more of our leased properties.
We may need to find a replacement tenant for one or more of our leased properties for a variety of reasons, including upon the expiration of the lease term or the occurrence of a tenant default. During any period in which we are attempting to locate one or more replacement tenants, there could be a decrease or cessation of rental payments on the applicable property or properties. We cannot be sure that any of our current or future tenants will elect to renew their respective leases upon expiration of the terms thereof. Similarly, we cannot be sure that we will be able to locate a suitable replacement tenant or, if we are successful in locating a replacement tenant, that the rental payments from the new tenant would not be significantly less than the existing rental payments. Our ability to locate a suitable replacement tenant may be significantly delayed or limited by various state licensing, receivership, certificate of need or other laws, as well as by Medicare and Medicaid change-of-ownership rules. We also may incur substantial additional expenses in connection with any such licensing, receivership or change-of-ownership proceedings. Any such delays, limitations and expenses could delay or impact our ability to collect rent, obtain possession of leased properties or otherwise exercise remedies for default, which could materially adversely affect our business, financial condition and results of operations.
15
Potential litigation and rising insurance costs may affect our tenants’ and operators' ability to obtain and maintain adequate liability and other insurance and their ability to make lease payments and fulfill their insurance and indemnification obligations to us.
Our tenants and operators may be subject to lawsuits filed by advocacy groups that monitor the quality of care at healthcare facilities or by patients, facility residents or their families. Significant damage awards are possible in cases where neglect has been found. This litigation has increased our tenants’ and operators’ costs of monitoring and reporting quality of care and has resulted in increases in the cost of liability and medical malpractice insurance. These increased costs may materially adversely affect our tenants’ and operators’ ability to obtain and maintain adequate liability and other insurance; manage related risk exposures; fulfill their insurance, indemnification and other obligations to us under their leases or property management agreements, as applicable; or make lease payments to us, as applicable. In addition, from time to time, we may be subject to claims brought against us in lawsuits and other legal proceedings arising out of our alleged actions or the alleged actions of our tenants and operators for which such tenants or operators may have agreed to indemnify, defend and hold us harmless. An unfavorable resolution of any such pending or future litigation could materially adversely affect our liquidity, financial condition and results of operations and have a material adverse effect on us in the event that we are not ultimately indemnified by our tenants or operators.
We face various risks in connection with our merger with CCP.
Following the closing of our merger with CCP, the combined company faces various risks, including, among others, the following:
|
•
|
The combined company may be unable to integrate the businesses of legacy Sabra and CCP successfully and realize the anticipated synergies and other benefits of the merger or do so within the anticipated timeframe;
|
|
•
|
The combined company may be unable to implement its future plans;
|
|
•
|
The combined company may be unable to retain key employees; and
|
|
•
|
The future results of the combined company will suffer if the combined company does not effectively manage its expanded operations following the merger.
|
We are subject to risks and liabilities in connection with our investments in joint ventures.
As of December 31, 2017, we owned one property through a consolidated joint venture, and on January 2, 2018, we acquired an additional 172 properties through an unconsolidated joint venture. These joint ventures involve risks not present with respect to our wholly owned properties, including the following:
|
•
|
We may be unable to take specific major actions, or such actions may be delayed, if our joint venture partners disagree with such action, due to arrangements that require us to share decision-making authority over major decisions affecting the ownership or operation of the joint venture and any property owned by the joint venture, such as the sale or financing of the property or the making of additional capital contributions for the benefit of the property;
|
|
•
|
For joint ventures in which we have a noncontrolling interest, our joint venture partners may take actions with which we disagree;
|
|
•
|
Our ability to sell or transfer our interest in a joint venture on advantageous terms when we so desire may be limited or restricted under the terms of our agreements with our partners;
|
|
•
|
We may be required to contribute additional capital if our joint venture partners fail to fund their share of required capital contributions;
|
|
•
|
Upon bankruptcy of a joint venture entity, we may become liable for the liabilities of the joint venture;
|
|
•
|
Our joint venture partners might have economic or other business interests or goals that are inconsistent with our business interests or goals, including with respect to the timing, terms and strategies for investment, which could increase the likelihood of disputes regarding the ownership, management or disposition of the property;
|
|
•
|
Disagreements with our joint venture partners could result in litigation or arbitration that increases our expenses, distracts our officers and directors, and disrupts the day-to-day operations of the property, including by delaying important decisions until the dispute is resolved; and
|
|
•
|
We may suffer losses as a result of actions taken by our joint venture partners with respect to our joint venture investments.
|
16
Required regulatory approvals can delay or prohibit transfers of our healthcare properties, which could result in periods in which we are unable to receive rent for such properties.
Our tenants are operators of skilled nursing and other healthcare facilities, which operators must be licensed under applicable state law and, depending upon the type of facility, certified or approved as providers under the Medicare and/or Medicaid programs. Prior to the transfer of the operations of such healthcare properties to successor operators, the new operator generally must become licensed under state law and, in certain states, receive change-of-ownership approvals under certificate of need laws (which laws provide for a certification that the state has made a determination that a need exists for the beds located on the applicable property). If applicable, Medicare and Medicaid provider approvals may be needed as well. In the event that an existing lease is terminated or expires and a new tenant is found, then any delays in the new tenant receiving regulatory approvals from the applicable federal, state or local government agencies, or the inability of such tenant to receive such approvals, may prolong the period during which we are unable to collect the applicable rent. We could also incur substantial additional expenses in connection with any licensing, receivership or change-of-ownership proceedings.
Real estate is a competitive business and this competition may make it difficult for us to identify and purchase suitable healthcare properties, to finance acquisitions on favorable terms, or to retain or attract tenants.
We operate in a highly competitive industry and face competition from other REITs, investment companies, private equity and hedge fund investors, sovereign funds, healthcare operators, lenders and other investors, some of whom are significantly larger than us and have greater resources and lower costs of capital than we do. This competition makes it more challenging to identify and successfully capitalize on acquisition opportunities that meet our investment objectives. Similarly, our properties face competition for patients and residents from other properties in the same market, which may affect our ability attract and retain tenants or may reduce the rents we are able to charge. If we cannot identify and purchase a sufficient quantity of healthcare properties at favorable prices, finance acquisitions on commercially favorable terms, or attract and retain profitable tenants, our business, financial position or results of operations could be materially adversely affected.
We depend on investments in the healthcare property sector, making our profitability more vulnerable to a downturn or slowdown in that specific sector than if we were investing in multiple industries.
We concentrate our investments in the healthcare property sector. As a result, we are subject to risks inherent to investments in a single industry, in real estate, and specifically in healthcare properties. A downturn or slowdown in the healthcare property sector would have a greater adverse impact on our business than if we had investments in multiple industries. Specifically, a downturn in the healthcare property sector could negatively impact the ability of our tenants, operators and borrowers to meet their obligations to us, as well as the ability to maintain rental and occupancy rates. This could adversely affect our business, financial condition and results of operations. In addition, a downturn in the healthcare property sector could adversely affect the value of our properties and our ability to sell properties at prices or on terms acceptable to us.
We have substantial indebtedness and the ability to incur significant additional indebtedness.
As of
December 31, 2017
, we had outstanding indebtedness of
$3.4 billion
, which consisted of
$1.3 billion
of Senior Notes (as defined below),
$1.2 billion
in Term Loans (as defined below),
$641.0 million
outstanding under our Revolving Credit Facility and aggregate secured indebtedness to third parties of
$259.2 million
on certain of our properties, and we had
$359.0 million
available for borrowing under our Revolving Credit Facility. Our high level of indebtedness may have the following important consequences to us:
|
•
|
It may increase our cost of borrowing;
|
|
•
|
It may limit our ability to obtain additional financing to fund future acquisitions, working capital, capital expenditures or other general corporate requirements;
|
|
•
|
It may expose us to the risk of increased interest rates under debt instruments subject to variable rates of interest, such as our Revolving Credit Facility;
|
|
•
|
It may limit our ability to adjust rapidly to changing market conditions and we may be vulnerable in the event of a downturn in general economic conditions or in the real estate and/or healthcare sectors;
|
|
•
|
It may place us at a competitive disadvantage against less leveraged competitors;
|
|
•
|
It may restrict the way in which we conduct our business because of financial and operating covenants in the agreements governing our existing and future indebtedness;
|
|
•
|
It may become more difficult for us to satisfy our obligations (including ongoing interest payments and, where applicable, scheduled amortization payments) with respect to the Senior Notes and our other debt; and
|
|
•
|
It may require us to sell assets and properties at an inopportune time.
|
17
In addition, the Senior Notes Indentures (as defined below) permit us to incur substantial additional debt, including secured debt (to which the Senior Notes will be effectively subordinated). If we incur additional debt, the related risks described above could intensify. Furthermore, the Senior Notes Indentures do not impose any limitation on our ability to incur liabilities that are not considered indebtedness under the Senior Notes Indentures.
The impact of any of these potential adverse consequences could have a material adverse effect on our results of operations, financial condition, and liquidity.
We may be unable to service our indebtedness.
Our ability to make scheduled payments on and to refinance our indebtedness depends on and is subject to our financial and operating performance, which in turn is affected by general and regional economic, financial, competitive, business and other factors beyond our control, including the availability of financing in the international banking and capital markets. Our business may fail to generate sufficient cash flow from operations or future borrowings may be unavailable to us under our Revolving Credit Facility or from other sources in an amount sufficient to enable us to service our debt, to refinance our debt or to fund our other liquidity needs. If we are unable to meet our debt obligations or to fund our other liquidity needs, we will need to restructure or refinance all or a portion of our debt. We may be unable to refinance any of our debt, including our Term Loans and any amounts outstanding under our Credit Facility, on commercially reasonable terms or at all. In particular, our Term Loans and our Revolving Credit Facility will mature prior to the maturity of the Senior Notes. If we were unable to make payments or refinance our debt or obtain new financing under these circumstances, we would have to consider other options, such as asset sales, equity issuances and/or negotiations with our lenders to restructure the applicable debt. Our Credit Facility and the Senior Notes Indentures restrict, and market or business conditions may limit, our ability to take some or all of these actions. Any restructuring or refinancing of our indebtedness could be at higher interest rates and may require us to comply with more onerous covenants that could further restrict our business operations.
Covenants in our debt agreements restrict our and our restricted subsidiaries
’
activities and could adversely affect our business.
Our debt agreements, including the Senior Notes Indentures and the credit agreement governing our Credit Facility, contain various covenants that limit our ability and the ability of our restricted subsidiaries to engage in various transactions including:
|
•
|
Incurring additional secured and unsecured debt;
|
|
•
|
Paying dividends or making other distributions on, redeeming or repurchasing capital stock;
|
|
•
|
Making investments or other restricted payments;
|
|
•
|
Entering into transactions with affiliates;
|
|
•
|
Issuing stock of or interests in restricted subsidiaries;
|
|
•
|
Engaging in non-healthcare related business activities;
|
|
•
|
Creating restrictions on the ability of our restricted subsidiaries to pay dividends or other amounts to us;
|
|
•
|
Selling assets; or
|
|
•
|
Effecting a consolidation or merger or selling all or substantially all of our assets.
|
These covenants limit our operational flexibility and could prevent us from taking advantage of business opportunities as they arise, growing our business or competing effectively. In addition, our Revolving Credit Facility requires us to maintain specified financial covenants, which include a maximum leverage ratio, a minimum fixed charge coverage ratio and a minimum tangible net worth ratio, as well as satisfy other financial condition tests. The indentures governing the 2021 Notes, 2023 Notes and 2026 Notes (each as defined below) require us to maintain total unencumbered assets of at least 150% of our unsecured indebtedness. The agreement governing our 2027 Notes (as defined below) requires us to maintain specified financial covenants, which include a maximum leverage ratio, a maximum secured debt leverage ratio, a maximum unsecured debt leverage ratio, a minimum fixed charge coverage ratio, a minimum net worth, a minimum unsecured interest coverage ratio and a minimum unencumbered debt yield ratio. Our ability to meet these requirements may be affected by events beyond our control, and we may not meet these requirements.
A breach of any of the covenants or other provisions in our debt agreements could result in an event of default, which if not cured or waived, could result in such debt becoming immediately due and payable. Further, certain change in control events could result in an event of default under the agreement governing our 2027 Notes. Any of these events of default, in turn, could cause our other debt to become due and payable as a result of cross-acceleration provisions contained in the agreements governing such other debt. We may be unable to maintain compliance with these covenants and, if we fail to do so, we may be
18
unable to obtain waivers from the lenders and/or amend the covenants. In the event that some or all of our debt is accelerated and becomes immediately due and payable, we may not have the funds to repay, or the ability to refinance, such debt.
An increase in market interest rates could increase our interest costs on borrowings on our Revolving Credit Facility and future debt and could adversely affect our stock price.
If interest rates increase, so could our interest costs for borrowings on our Revolving Credit Facility and any new debt. This increased cost could make the financing of any acquisition more costly. Rising interest rates could limit our ability to refinance existing debt when it matures or cause us to pay higher interest rates upon refinancing. In addition, an increase in interest rates could decrease the access third parties have to credit, thereby decreasing the amount they are willing to pay for our assets, and consequently limit our ability to reposition our portfolio promptly in response to changes in economic or other conditions.
Our ability to raise capital through equity financings is dependent, in part, on the market price of our common stock, which depends on market conditions and other factors affecting REITs generally.
Our ability to raise capital through equity financings depends, in part, on the market price of our common stock, which in turn depends on fluctuating market conditions and other factors including the following:
|
•
|
The reputation of REITs and attractiveness of their equity securities in comparison with other equity securities, including securities issued by other real estate companies;
|
|
•
|
Our financial performance and that of our tenants;
|
|
•
|
Concentrations in our investment portfolio by tenant and property type;
|
|
•
|
Concerns about our tenants’ financial condition due to uncertainty regarding reimbursement from governmental and other third-party payor programs;
|
|
•
|
Our ability to meet or exceed investor expectations of prospective investment and earnings targets;
|
|
•
|
The contents of analyst reports about us and the REIT industry;
|
|
•
|
Changes in interest rates on fixed-income securities, which may lead prospective investors to demand a higher annual yield from investments in our common stock;
|
|
•
|
Maintaining or increasing our dividend, which is determined by our board of directors and depends on our financial position, results of operations, cash flows, capital requirements, debt covenants (which include limits on distributions by us), applicable law, and other factors as our board of directors deems relevant; and
|
|
•
|
Regulatory action and changes in REIT tax laws.
|
The market value of a REIT’s equity securities is generally based upon the market’s perception of the REIT’s growth potential and its current and potential future earnings and cash distributions. If we fail to meet the market’s expectation with regard to future earnings and cash distributions, the market price of our common stock could decline, and our ability to raise capital through equity financings could be materially adversely affected.
We may be adversely affected by fluctuations in foreign currency exchange rates.
Our ownership of properties in Canada currently subjects us to fluctuations in the exchange rate between U.S. dollars and Canadian dollars. Although we have pursued hedging alternatives, by borrowing in Canadian dollar denominated debt and entering into cross currency swaps, to protect against foreign currency fluctuations, no amount of hedging activity can fully insulate us from the risks associated with changes in foreign currency exchange rates, and the failure to hedge effectively against foreign currency exchange rate risk could materially adversely affect our business, financial position or results of operations. In addition, any income derived from such hedging transactions may not qualify under the 75% gross income test or the 95% gross income test that we must satisfy annually in order to qualify and maintain our status as a REIT.
We may not be able to sell properties when we desire because real estate investments are relatively illiquid, which could have a material adverse effect on our business, financial position or results of operations.
Real estate investments generally cannot be sold quickly. In addition, some and potentially substantially all of our properties serve as collateral for our current and future secured debt obligations and cannot readily be sold unless the underlying secured indebtedness is concurrently repaid. We may not be able to vary our portfolio promptly in response to changes in the real estate market. A downturn in the real estate market could materially adversely affect the value of our properties and our ability to sell such properties for acceptable prices or on other acceptable terms. We also cannot predict the length of time needed to find a willing purchaser and to close the sale of a property or portfolio of properties. These factors and any others that would impede our ability to respond to adverse changes in the performance of our properties could have a material adverse effect on our business, financial position or results of operations.
19
If we lose our key management personnel, we may not be able to successfully manage our business and achieve our objectives.
Our success depends in large part upon the leadership and performance of our executive management team, particularly Mr. Matros, our President and Chief Executive Officer. If we lose the services of Mr. Matros, we may not be able to successfully manage our business or achieve our business objectives.
We have a limited number of employees and, accordingly, the loss of any one of our employees could harm our operations.
As of
December 31, 2017
, we employed
61
full-time employees, including our executive officers and
31
employees associated with the specialty valuation firm we acquired in the CCP Merger. Accordingly, the impact we may feel from the loss of one of our employees may be greater than the impact such a loss would have on a larger organization. While it is anticipated that we could find replacements for our personnel, the loss of their services could harm our operations, at least in the short term.
We may experience uninsured or underinsured losses, which could result in a significant loss of the capital we have invested in a property, decrease anticipated future revenues or cause us to incur unanticipated expenses.
While our lease agreements and property management agreements require that comprehensive insurance and hazard insurance be maintained by the tenants or operators, as applicable, there are certain types of losses, generally of a catastrophic nature, such as earthquakes, hurricanes and floods, that may be uninsurable or not economically insurable. Insurance coverage may not be sufficient to pay the full current market value or current replacement cost of a loss. Inflation, changes in building codes and ordinances, environmental considerations, and other factors also might make it infeasible to use insurance proceeds to replace properties after they have been damaged or destroyed. Under such circumstances, the insurance proceeds received might not be adequate to restore the economic position with respect to a damaged property.
Environmental compliance costs and liabilities associated with real estate properties owned by us may materially impair the value of those investments.
As an owner of real property, we or our subsidiaries are subject to various federal, state and local environmental and health and safety laws and regulations. Although we do not currently operate or manage our properties, we or our subsidiaries may be held primarily or jointly and severally liable for costs relating to the investigation and clean-up of any property where there has been a release or threatened release of a hazardous regulated material as well as other affected properties, regardless of whether we knew of or caused the release. In addition to these costs, which are typically not limited by law or regulation and could exceed an affected property’s value, we could be liable for certain other costs, including governmental fines and injuries to persons, property or natural resources. Further, some environmental laws provide for the creation of a lien on a contaminated site in favor of the government as security for damages and any costs the government incurs in connection with such contamination and associated clean-up.
Although we require our operators and tenants to undertake to indemnify us for environmental liabilities they cause, the amount of such liabilities could exceed the financial ability of the tenant or operator to indemnify us. The presence of contamination or the failure to remediate contamination may adversely affect our ability to sell or lease the real estate or to borrow using the real estate as collateral.
We rely on information technology in our operations, and any material failure, inadequacy, interruption or security failure of that technology could harm our business.
We rely on information technology networks and systems, including the Internet, to process, transmit and store electronic information, and to manage or support a variety of business processes, including financial transactions and records, personal identifying information, tenant and lease data. We purchase some of our information technology from vendors, on whom our systems depend. We rely on commercially available systems, software, tools and monitoring to provide security for processing, transmission and storage of confidential tenant and other customer information, such as individually identifiable information, including information relating to financial accounts. Although we have taken steps to protect the security of our information systems and the data maintained in those systems, it is possible that our safety and security measures will not be able to prevent the systems’ improper functioning or damage, or the improper access or disclosure of personally identifiable information such as in the event of cyber-attacks. Security breaches, including physical or electronic break-ins, computer viruses, attacks by hackers and similar breaches, can create system disruptions, shutdowns or unauthorized disclosure of confidential information. Any failure to maintain proper function, security and availability of our information systems could interrupt our operations, damage our reputation, subject us to liability claims or regulatory penalties and could have a material adverse effect on our business, financial condition and results of operations.
20
The tax imposed on REITs engaging in “prohibited transactions” may limit our ability to engage in transactions which would be treated as sales for federal income tax purposes.
A REIT’s net income from prohibited transactions is subject to a 100% penalty tax. In general, prohibited transactions are sales or other dispositions of property, other than foreclosure property, held primarily for sale to customers in the ordinary course of business. Although we do not intend to hold any properties that would be characterized as held for sale to customers in the ordinary course of our business, unless a sale or disposition qualifies under certain statutory safe harbors, such characterization is a factual determination and no guarantee can be given that the Internal Revenue Service (“IRS”) would agree with our characterization of our properties or that we will always be able to make use of the available safe harbors.
An ownership limit and certain anti-takeover defenses could inhibit a change of control of Sabra or reduce the value of our stock.
Certain provisions of Maryland law and of our charter and bylaws may have an anti-takeover effect. The following provisions of Maryland law and these governing documents could have the effect of making it more difficult for a third party to acquire control of Sabra, including certain acquisitions that our stockholders may deem to be in their best interests:
|
•
|
Our charter contains transfer and ownership restrictions on the percentage by number and value of outstanding shares of our stock that may be owned or acquired by any stockholder;
|
|
•
|
Our charter permits the issuance of one or more classes or series of preferred stock with rights and preferences to be determined by the board of directors and permits our board of directors, without stockholder action, to amend the charter to increase or decrease the aggregate number of authorized shares or the number of shares of any class or series that we have authority to issue;
|
|
•
|
“Business combination” provisions of Maryland law, subject to certain limitations, impose a moratorium on business combinations with “interested stockholders” or affiliates thereof for five years and thereafter impose additional requirements on such business combinations; and
|
|
•
|
Our bylaws require advance notice of stockholder proposals and director nominations.
|
Risks Associated with Our Status as a REIT
Our failure to maintain our qualification as a REIT would subject us to U.S. federal income tax, which could adversely affect the value of the shares of our common stock and would substantially reduce the cash available for distribution to our stockholders
.
Our qualification and taxation as a REIT will depend upon our ability to meet on a continuing basis, through actual annual operating results, certain qualification tests set forth in the U.S. federal tax laws. Accordingly, given the complex nature of the rules governing REITs, the ongoing importance of factual determinations, including the potential tax treatment of investments we make, and the possibility of future changes in our circumstances, no assurance can be given that our actual results of operations for any particular taxable year will satisfy such requirements.
If we fail to qualify as a REIT in any calendar year, we would be required to pay U.S. federal income tax (and any applicable state and local tax) on our taxable income at regular corporate rates, and dividends paid to our stockholders would not be deductible by us in computing our taxable income (although such dividends received by certain non-corporate U.S. taxpayers generally would currently be subject to a preferential rate of taxation). Further, if we fail to qualify as a REIT, we might need to borrow money or sell assets in order to pay any resulting tax. Our payment of income tax would decrease the amount of our income available for distribution to our stockholders. Furthermore, if we fail to maintain our qualification as a REIT, we no longer would be required under U.S. federal tax laws to distribute substantially all of our REIT taxable income to our stockholders. Unless our failure to qualify as a REIT was subject to relief under U.S. federal tax laws, we could not re-elect to qualify as a REIT until the fifth calendar year following the year in which we failed to qualify.
The 90% distribution requirement will decrease our liquidity and may limit our ability to engage in otherwise beneficial transactions.
To comply with the 90% taxable income distribution requirement applicable to REITs and to avoid the nondeductible excise tax, we must make distributions to our stockholders. The Senior Notes Indentures permit us to declare or pay any dividend or make any distribution that is necessary to maintain our REIT status if the aggregate principal amount of all outstanding Indebtedness of the Parent and its Restricted Subsidiaries on a consolidated basis at such time is less than 60% of Adjusted Total Assets (as each term is defined in the Senior Notes Indentures) and to make additional distributions if we pass certain other financial tests.
21
We are required under the Internal Revenue Code of 1986, as amended (the “Code”) to distribute at least 90% of our taxable income, determined without regard to the dividends-paid deduction and excluding any net capital gain, and the Operating Partnership (as defined below) is required to make distributions to us to allow us to satisfy these REIT distribution requirements. However, distributions may limit our ability to rely upon rental payments from our properties or subsequently acquired properties to finance investments, acquisitions or new developments.
Although we anticipate that we generally will have sufficient cash or liquid assets to enable us to satisfy the REIT distribution requirement, it is possible that, from time to time, we may not have sufficient cash or other liquid assets to meet the 90% distribution requirement. This may be due to the timing differences between the actual receipt of income and actual payment of deductible expenses, on the one hand, and the inclusion of that income and deduction of those expenses in arriving at our taxable income, on the other hand. Moreover, the Tax Cuts and Jobs Act (the “2017 Tax Act”) amends the Code such that income must be accrued for U.S. federal income tax purposes no later than when such income is taken into account as revenue in our financial statements, subject to certain exceptions, which could also create timing differences between net taxable income and the receipt of cash attributable to such income. In addition, non-deductible expenses such as principal amortization or repayments or capital expenditures in excess of non-cash deductions also may cause us to fail to have sufficient cash or liquid assets to enable us to satisfy the 90% distribution requirement.
In the event that such an insufficiency occurs, in order to meet the 90% distribution requirement and maintain our status as a REIT, we may have to sell assets at unfavorable prices, borrow at unfavorable terms, make taxable stock dividends, or pursue other strategies. This may require us to raise additional capital to meet our obligations. The terms of our Credit Facility and the terms of the Senior Notes Indentures may restrict our ability to engage in some of these transactions.
We could fail to qualify as a REIT if income we receive is not treated as qualifying income, including as a result of one or more of the lease agreements we have entered into or assumed not being characterized as true leases for U.S. federal income tax purposes, which would subject us to U.S. federal income tax at corporate tax rates.
Under applicable provisions of the Code, we will not be treated as a REIT unless we satisfy various requirements, including requirements relating to the sources of our gross income. Rents received or accrued by us will not be treated as qualifying rent for purposes of these requirements if the lease agreements we have entered into or assumed (as well as any other leases we enter into or assume) are not respected as true leases for U.S. federal income tax purposes and are instead treated as service contracts, joint ventures, loans or some other type of arrangement. In the event that the lease agreements entered into with lessees are not characterized as true leases for U.S. federal income tax purposes, we may fail to qualify as a REIT. In addition, rents received by us from a lessee will not be treated as qualifying rent for purposes of these requirements if we are treated, either directly or under the applicable attribution rules, as owning 10% or more of the lessee’s stock, capital or profits. We will be treated as owning, under the applicable attribution rules, 10% or more of a lessee’s stock, capital or profits at any time that a stockholder owns, directly or under the applicable attribution rules, (a) 10% or more of our common stock and (b) 10% or more of the lessee’s stock, capital or profits. The provisions of our charter restrict the transfer and ownership of our common stock that would cause the rents received or accrued by us from a tenant of ours to be treated as non-qualifying rent for purposes of the REIT gross income requirements. Nevertheless, there can be no assurance that such restrictions will be effective in ensuring that we will not be treated as related to a tenant of ours. If we fail to qualify as a REIT, we would be subject to U.S. federal income tax (including any applicable minimum tax) on our taxable income at corporate tax rates, which would decrease the amount of cash available for distribution to holders of our common stock.
Complying with REIT requirements may cause us to forego otherwise attractive acquisition opportunities or liquidate otherwise attractive investments, which could materially hinder our performance.
To qualify as a REIT for U.S. federal income tax purposes, we must continually satisfy certain tests, including tests concerning the sources of our income, the nature and diversification of our assets, the amounts we distribute to our stockholders and the ownership of our stock. In order to meet these tests, we may be required to forego investments or acquisitions we might otherwise make. Thus, compliance with the REIT requirements may materially hinder our performance.
If we have significant amounts of non-cash taxable income, we may have to declare taxable stock dividends or make other non-cash distributions, which could cause our stockholders to incur tax liabilities in excess of cash received.
We currently intend to pay dividends in cash only, and not in-kind. However, if for any taxable year, we have significant amounts of taxable income in excess of available cash flow, we may have to declare dividends in-kind in order to satisfy the REIT annual distribution requirements. We may distribute a portion of our dividends in the form of our stock or our debt instruments. In either event, a holder of our common stock will be required to report dividend income as a result of such distributions even though we distributed no cash or only nominal amounts of cash to such stockholder.
22
The IRS has issued private letter rulings to other REITs treating certain distributions that are paid partly in cash and partly in shares as dividends that would satisfy the REIT annual distribution requirement and qualify for the dividends paid deduction for U.S. federal income tax purposes. Those rulings may be relied upon only by taxpayers to whom they were issued. Accordingly, it is unclear whether and to what extent we will be able to make taxable dividends payable in cash and shares. We have no current intention to make a taxable dividend payable in cash and our shares. However, if we make such a distribution, U.S. holders would be required to include the full amount of the dividend (i.e., the cash and stock portion) as ordinary income to the extent of our current and accumulated earnings and profits for U.S. federal income tax purposes. As a result, a U.S. holder may be required to pay income taxes with respect to such dividends in excess of the cash received. If a U.S. holder sells our stock that it receives as a dividend in order to pay this tax, the sales proceeds may be less than the amount included in income with respect to the dividend, depending on the market price of the stock at the time of the sale. Furthermore, with respect to non-U.S. holders, we may be required to withhold U.S. tax with respect to such dividends, including in respect of all or a portion of such dividend that is payable in stock. In addition, if a significant number of our stockholders determine to sell shares of our stock in order to pay taxes owed on dividends, these sales may put downward pressure on the trading price of our stock. Moreover, various tax aspects of a taxable dividend payable in cash and/or stock are uncertain and have not yet been addressed by the IRS. No assurance can be given that the IRS will not impose additional requirements in the future with respect to taxable dividends payable in cash and/or stock, including on a retroactive basis, or assert that the requirements for such taxable dividends have not been met.
Our charter restricts the transfer and ownership of our stock, which may restrict change of control or business combination opportunities in which our stockholders might receive a premium for their shares.
In order for us to maintain our qualification as a REIT, no more than 50% of the value of our outstanding stock may be owned, directly or constructively, by five or fewer individuals, as defined in the Code. For the purpose of preserving our REIT qualification, our charter prohibits, subject to certain exceptions, beneficial and constructive ownership of more than 9.9% in value or in number of shares, whichever is more restrictive, of our outstanding common stock or more than 9.9% in value of all classes or series of our outstanding stock. The constructive ownership rules are complex and may cause shares of stock owned directly or constructively by a group of related individuals to be constructively owned by one individual or entity. The ownership limits may have the effect of discouraging an acquisition of control of us without the approval of our board of directors.
We may be subject to adverse legislative or regulatory tax changes that could reduce the market price of our common stock.
The rules dealing with U.S. federal income taxation are constantly under review by persons involved in the legislative process and by the IRS and the U.S. Department of the Treasury. Changes to the tax law could materially adversely affect our stockholders. In particular, the 2017 Tax Act, which generally takes effect for taxable years after December 31, 2017, significantly reforms the Code with respect to the taxation of both individuals and corporate entities (although certain changes will expire at the end of 2025) and the tax consequences of such changes as they apply to us and our stockholders may differ, in some cases materially, from the consequences under the laws in effect prior to January 1, 2018. We cannot predict with certainty whether, when, in what forms, or with what effective dates, the tax laws applicable to us or our stockholders may be changed.
Dividends payable by REITs do not qualify for the reduced tax rates available for some dividends.
The maximum income tax rate applicable to “qualified dividends” payable by non-REIT corporations to domestic stockholders taxed at individual rates is currently 20%. Dividends payable by REITs, however, generally are not eligible for the reduced rates. For taxable years after December 31, 2017 and continuing through 2025, the 2017 Tax Act temporarily reduces the maximum individual federal income tax rate from 39.6% to 37% and the effective tax rate on ordinary REIT dividends (i.e., dividends other than capital gain dividends and dividends attributable to certain qualified dividend income received by us) for U.S. holders of our common shares that are individuals, estates or trusts by permitting such holders to claim a deduction in determining their taxable income equal to 20% of any such dividends they receive. Although not adversely affecting the taxation of REITs or dividends payable by REITs, the more favorable rates applicable to regular corporate qualified dividends could cause investors who are taxed at individual rates to perceive investments in REITs to be relatively less attractive than investments in the stocks of non-REIT corporations that pay dividends treated as qualified dividend income, which could adversely affect the value of the stock of REITs, including our common stock.
Our ownership of and relationship with any taxable REIT subsidiaries that we have formed or will form will be limited and a failure to comply with the limits would jeopardize our REIT status and may result in the application of a 100% excise tax.
A REIT may own up to 100% of the stock of one or more taxable REIT subsidiaries (“TRSs”). A TRS may earn income that would not be qualifying income if earned directly by the parent REIT. Both the subsidiary and the REIT must jointly elect to treat the subsidiary as a TRS. A corporation (other than a REIT) of which a TRS directly or indirectly owns securities
23
possessing more than 35% of the total voting power or total value of the outstanding securities of such corporation will automatically be treated as a TRS. Overall, no more than 25% of the value of a REIT’s total assets may consist of stock or securities of one or more TRSs. Effective January 1, 2018, such overall limitation on the value of a REIT’s total assets consisting of stock or securities of one or more TRSs will be reduced to 20%. A domestic TRS will pay U.S. federal, state and local income tax at regular corporate rates on any income that it earns, but as a result of the enactment of the 2017 Tax Act, effective for taxable years after December 31, 2017, net operating loss (“NOL”) carryforwards of TRS losses arising in taxable years beginning after December 31, 2017 may be deducted only to the extent of 80% of TRS taxable income in the carryforward year (computed without regard to the NOL deduction). In contrast to prior law, which permitted unused NOL carryforwards to be carried back two years and forward 20 years, the 2017 Tax Act provides that losses arising in taxable years ending after December 31, 2017 can no longer be carried back but can be carried forward indefinitely. In addition, the TRS rules limit the deductibility of interest paid or accrued by a TRS to its parent REIT to assure that the TRS is subject to an appropriate level of corporate taxation. The rules also impose a 100% excise tax on certain transactions between a TRS and its parent REIT that are not conducted on an arm’s length basis. Any domestic TRS that we have formed or may form will pay U.S. federal, state and local income tax on its taxable income, and its after-tax net income will be available for distribution to us but is not required to be distributed to us unless necessary to maintain our REIT qualification.
Not applicable.
As of
December 31, 2017
, our investment portfolio consisted of
507
real estate properties held for investment (consisting of (i)
384
skilled nursing/transitional care facilities, (ii)
88
Senior Housing - Leased communities, (iii)
13
Senior Housing - Managed communities and (iv)
22
specialty hospitals and other facilities),
one
investment in a direct financing lease,
22
investments in loans receivable (consisting of (i)
two
mortgage loans, (ii)
two
construction loans, (iii)
two
mezzanine loans, (iv)
one
pre-development loan and (v)
15
other loans),
12
preferred equity investments and
one
investment in a specialty valuation firm. As of
December 31, 2017
, our real estate properties held for investment included
53,558
beds/units, spread across the U.S. and Canada. As of
December 31, 2017
, the substantial majority of our real estate properties (excluding
13
Senior Housing - Managed communities) were leased under triple-net operating leases with expirations ranging from
less than one year to 15
years.
24
The following table displays the expiration of annualized straight-line rental revenues under our lease agreements as of
December 31, 2017
by year and property type (dollars in thousands) and, in each case, without giving effect to any renewal options:
|
|
2018
|
2019
|
2020
|
|
2021
|
|
2022
|
|
2023
|
|
2024
|
|
2025
|
|
2026
|
|
2027
|
Thereafter
|
Total
|
||||||||||||||||||||||||||||
|
Skilled Nursing/Transitional Care
(1)
|
|
|
|
|
|
|
|
||||||||||||||||||||||||||||||||||||||||
|
Properties
|
8
|
|
—
|
|
37
|
|
|
9
|
|
|
23
|
|
|
54
|
|
|
27
|
|
|
20
|
|
|
20
|
|
|
68
|
|
117
|
|
383
|
|
||||||||||||||||
|
Beds/Units
|
884
|
|
—
|
|
4,674
|
|
1,175
|
|
2,482
|
|
6,675
|
|
2,766
|
|
2,174
|
|
2,248
|
|
6,825
|
|
13,320
|
|
43,223
|
|
|||||||||||||||||||||||
|
Annualized Revenues
|
$
|
4,658
|
|
$
|
—
|
|
$
|
34,632
|
|
|
$
|
7,956
|
|
|
$
|
39,228
|
|
|
$
|
70,258
|
|
|
$
|
26,088
|
|
|
$
|
14,458
|
|
|
$
|
22,990
|
|
|
$
|
54,831
|
|
$
|
196,912
|
|
$
|
472,011
|
|
||||
|
Senior Housing - Leased
(1)
|
|||||||||||||||||||||||||||||||||||||||||||||||
|
Properties
|
—
|
|
—
|
|
—
|
|
|
2
|
|
|
15
|
|
|
3
|
|
|
9
|
|
|
13
|
|
|
1
|
|
|
13
|
|
32
|
|
88
|
|
||||||||||||||||
|
Beds/Units
|
—
|
|
—
|
|
—
|
|
163
|
|
1,027
|
|
393
|
|
667
|
|
920
|
|
100
|
|
692
|
|
4,175
|
|
8,137
|
|
|||||||||||||||||||||||
|
Annualized Revenues
|
$
|
—
|
|
—
|
|
$
|
—
|
|
|
$
|
1,070
|
|
|
$
|
9,825
|
|
|
$
|
3,254
|
|
|
$
|
7,087
|
|
|
$
|
10,452
|
|
|
$
|
633
|
|
|
$
|
9,596
|
|
$
|
57,239
|
|
$
|
99,156
|
|
|||||
|
Specialty Hospitals and Other
|
|
|
|
|
|
|
|
||||||||||||||||||||||||||||||||||||||||
|
Properties
|
—
|
|
—
|
|
12
|
|
|
—
|
|
|
—
|
|
|
—
|
|
|
—
|
|
|
—
|
|
|
—
|
|
|
6
|
|
4
|
|
22
|
|
||||||||||||||||
|
Beds/Units
|
—
|
|
—
|
|
258
|
|
—
|
|
—
|
|
—
|
|
—
|
|
—
|
|
—
|
|
652
|
|
175
|
|
1,085
|
|
|||||||||||||||||||||||
|
Annualized Revenues
|
$
|
—
|
|
—
|
|
$
|
4,949
|
|
|
$
|
—
|
|
|
$
|
—
|
|
|
$
|
—
|
|
|
$
|
—
|
|
|
$
|
—
|
|
|
$
|
—
|
|
|
$
|
32,847
|
|
$
|
12,975
|
|
$
|
50,771
|
|
|||||
|
|
|
|
|
|
|
|
|
|
|
|
|
|
|
|
|||||||||||||||||||||||||||||||||
|
Total Properties
|
8
|
|
—
|
|
49
|
|
|
11
|
|
|
38
|
|
|
57
|
|
|
36
|
|
|
33
|
|
|
21
|
|
|
87
|
|
153
|
|
493
|
|
||||||||||||||||
|
Total Beds/Units
|
884
|
|
—
|
|
4,932
|
|
1,338
|
|
3,509
|
|
7,068
|
|
3,433
|
|
3,094
|
|
2,348
|
|
8,169
|
|
17,670
|
|
52,445
|
|
|||||||||||||||||||||||
|
Total Annualized Revenues
|
$
|
4,658
|
|
$
|
—
|
|
$
|
39,581
|
|
$
|
9,026
|
|
$
|
49,053
|
|
$
|
73,512
|
|
$
|
33,175
|
|
$
|
24,910
|
|
$
|
23,623
|
|
$
|
97,274
|
|
$
|
267,126
|
|
$
|
621,938
|
|
|||||||||||
|
% of Revenue
|
0.7
|
%
|
—
|
%
|
6.4
|
%
|
1.5
|
%
|
7.9
|
%
|
|
11.8
|
%
|
5.3
|
%
|
4.0
|
%
|
3.8
|
%
|
15.6
|
%
|
43.0
|
%
|
100.0
|
%
|
||||||||||||||||||||||
|
(1)
|
Excludes Senior Housing - Managed communities and one non-operational skilled nursing/transitional care facility.
|
Occupancy Trends
The following table sets forth the occupancy percentages for our properties for the periods indicated.
|
Occupancy Percentage
(1)
|
|||||||||
|
Year Ended December 31,
|
|||||||||
|
2017
|
2016
|
2015
|
|||||||
|
Skilled Nursing/Transitional Care
|
84.0
|
%
|
86.5
|
%
|
87.0
|
%
|
|||
|
Senior Housing - Leased
|
87.8
|
%
|
89.5
|
%
|
90.3
|
%
|
|||
|
Senior Housing - Managed
|
90.6
|
%
|
75.5
|
%
|
82.5
|
%
|
|||
|
Specialty Hospitals and Other
|
79.2
|
%
|
69.7
|
%
|
75.1
|
%
|
|||
|
(1)
|
Occupancy percentages represent average operating occupancy for the periods indicated and are calculated by dividing the actual census from the period presented by the available beds/units for the same period. Occupancy for independent living facilities can be greater than 100% for a given period as multiple residents could occupy a single unit. Occupancy percentages presented include only stabilized facilities owned by Sabra as of the end of the respective period (i.e. facilities previously owned by CCP are not included for time periods prior to the closing of the CCP Merger). Occupancy is only included in periods subsequent to our acquisition and is presented one quarter in arrears, except for Senior Housing - Managed communities. All facility financial performance information was provided by, or derived solely from information provided by operators/tenants without independent verification by us.
|
You should not rely upon occupancy percentages, either individually or in the aggregate, to determine the performance of a facility. Other factors that may impact the performance of a facility include the sources of payment, terms of reimbursement and the acuity level of the patients (i.e., the condition of patients that determines the level of skilled nursing and rehabilitation therapy services required).
See also the discussion above under the heading “Business—Portfolio of Healthcare Properties” for further discussion regarding the ownership of our properties and the types of healthcare facilities that comprise our properties.
25
Of our
507
properties held for investment,
30
are subject to secured indebtedness to third parties that, as of
December 31, 2017
, totaled approximately
$259.2 million
. See the discussion under the heading “Management’s Discussion and Analysis—Liquidity and Capital Resources—Secured Indebtedness” for further discussion regarding our secured indebtedness. As of
December 31, 2017
and
2016
, our secured debt consisted of the following (dollars in thousands):
|
Principal Balance as of December 31,
(1)
|
Weighted Average Effective Interest Rate at December 31,
(2)
|
||||||||||||||
|
Interest Rate Type
|
2017
|
2016
|
2017
|
2016
|
Maturity Date
|
||||||||||
|
Fixed Rate
|
$
|
160,702
|
|
$
|
163,638
|
|
3.87
|
%
|
3.87
|
%
|
December 2021 -
August 2051 |
||||
|
Variable Rate
|
98,500
|
|
—
|
|
3.36
|
%
|
—
|
|
July 2019
|
||||||
|
$
|
259,202
|
|
$
|
163,638
|
|
3.68
|
%
|
3.87
|
%
|
||||||
|
(1)
|
Principal balance does not include deferred financing costs, net of
$2.8 million
and
$2.9 million
as of
December 31, 2017
and
2016
, respectively.
|
|
(2)
|
Weighted average effective rate includes private mortgage insurance.
|
Corporate Office
We are headquartered and have our corporate office in Irvine, California. We lease our corporate office from an unaffiliated third party.
For a description of our legal proceedings, see “Legal Matters” in Note 17, “Commitments and Contingencies,” in the Notes to Consolidated Financial Statements included in this Annual Report on Form 10-K, which is incorporated by reference in response to this item.
Not applicable.
26
Stockholder Information
Our common stock is listed on The Nasdaq Stock Market LLC and trades on the Nasdaq Global Select Market under the symbol “SBRA.” Set forth below for the fiscal quarters indicated are the reported high and low sales prices per share of our common stock on the Nasdaq Stock Market and the dividends paid per share of common stock.
|
Sales Price
|
Dividends
Paid
|
|||||||||||
|
High
|
Low
|
|||||||||||
|
2016
|
||||||||||||
|
First Quarter
|
|
$
|
21.71
|
|
$
|
14.92
|
|
|
$
|
0.41
|
|
|
|
Second Quarter
|
|
$
|
23.55
|
|
$
|
18.80
|
|
|
$
|
0.42
|
|
|
|
Third Quarter
|
$
|
26.40
|
|
$
|
20.25
|
|
$
|
0.42
|
|
|||
|
Fourth Quarter
|
|
$
|
25.17
|
|
$
|
19.30
|
|
|
$
|
0.42
|
|
|
|
2017
|
||||||||||||
|
First Quarter
|
|
$
|
28.01
|
|
$
|
24.37
|
|
|
$
|
0.42
|
|
|
|
Second Quarter
|
|
$
|
29.10
|
|
$
|
22.44
|
|
|
$
|
0.43
|
|
|
|
Third Quarter
|
$
|
24.60
|
|
$
|
20.66
|
|
$
|
0.3598913
|
|
|||
|
Fourth Quarter
|
|
$
|
22.10
|
|
$
|
18.48
|
|
|
$
|
0.5201087
|
|
|
At February 19, 2018, we had approximately 5,563 stockholders of record.
We did not repurchase any shares of our common stock during the quarter ended
December 31, 2017
.
On
February 5, 2018
, our board of directors declared a quarterly cash dividend of
$0.45
per share of common stock. The dividend will be paid on
February 28, 2018
to stockholders of record as of
February 15, 2018
.
To maintain REIT status, we are required each year to distribute to stockholders at least 90% of our annual REIT taxable income after certain adjustments. All distributions will be made by us at the discretion of our board of directors and will depend on our financial position, results of operations, cash flows, capital requirements, debt covenants (which include limits on distributions by us), applicable law, and other factors as our board of directors deems relevant. For example, while the Senior Notes Indentures and the credit agreement governing our Credit Facility permit us to declare and pay any dividend or make any distribution that is necessary to maintain our REIT status, those distributions are subject to certain financial tests under the Senior Notes Indentures, and therefore, the amount of cash distributions we can make to our stockholders may be limited.
Distributions with respect to our common stock and preferred stock can be characterized for federal income tax purposes as taxable ordinary dividends, which may be non-qualified, long-term capital gain, or qualified, non-dividend distributions (return of capital) or a combination thereof. Following is the characterization of our annual cash dividends on common stock and preferred stock per share:
|
Year Ended December 31,
|
||||||||||||
|
Common Stock
|
2017
|
2016
|
2015
|
|||||||||
|
Non-qualified ordinary dividends
|
$
|
1.2288
|
|
$
|
0.7027
|
|
$
|
0.9446
|
|
|||
|
Long-term capital gains
|
—
|
|
—
|
|
0.0171
|
|
||||||
|
Non-dividend distributions
|
0.5012
|
|
0.9673
|
|
0.6383
|
|
||||||
|
$
|
1.7300
|
|
$
|
1.6700
|
|
$
|
1.6000
|
|
||||
|
Year Ended December 31,
|
||||||||||||
|
Preferred Stock
|
2017
|
2016
|
2015
|
|||||||||
|
Non-qualified ordinary dividends
|
$
|
1.7813
|
|
$
|
1.7813
|
|
$
|
1.7496
|
|
|||
|
Long-term capital gains
|
—
|
|
—
|
|
0.0317
|
|
||||||
|
$
|
1.7813
|
|
$
|
1.7813
|
|
$
|
1.7813
|
|
||||
27
Stock Price Performance Graph
The following graph compares the cumulative total stockholder return of our common stock for the five-year period ending
December 31, 2017
. The graph assumes that $100 was invested at the close of market on December 31, 2012 in (i) our common stock, (ii) the Nasdaq Composite Index and (iii) the SNL US Healthcare REIT Index and assumes the reinvestment of all dividends. Stock price performances shown in the graph are not necessarily indicative of future price performances.
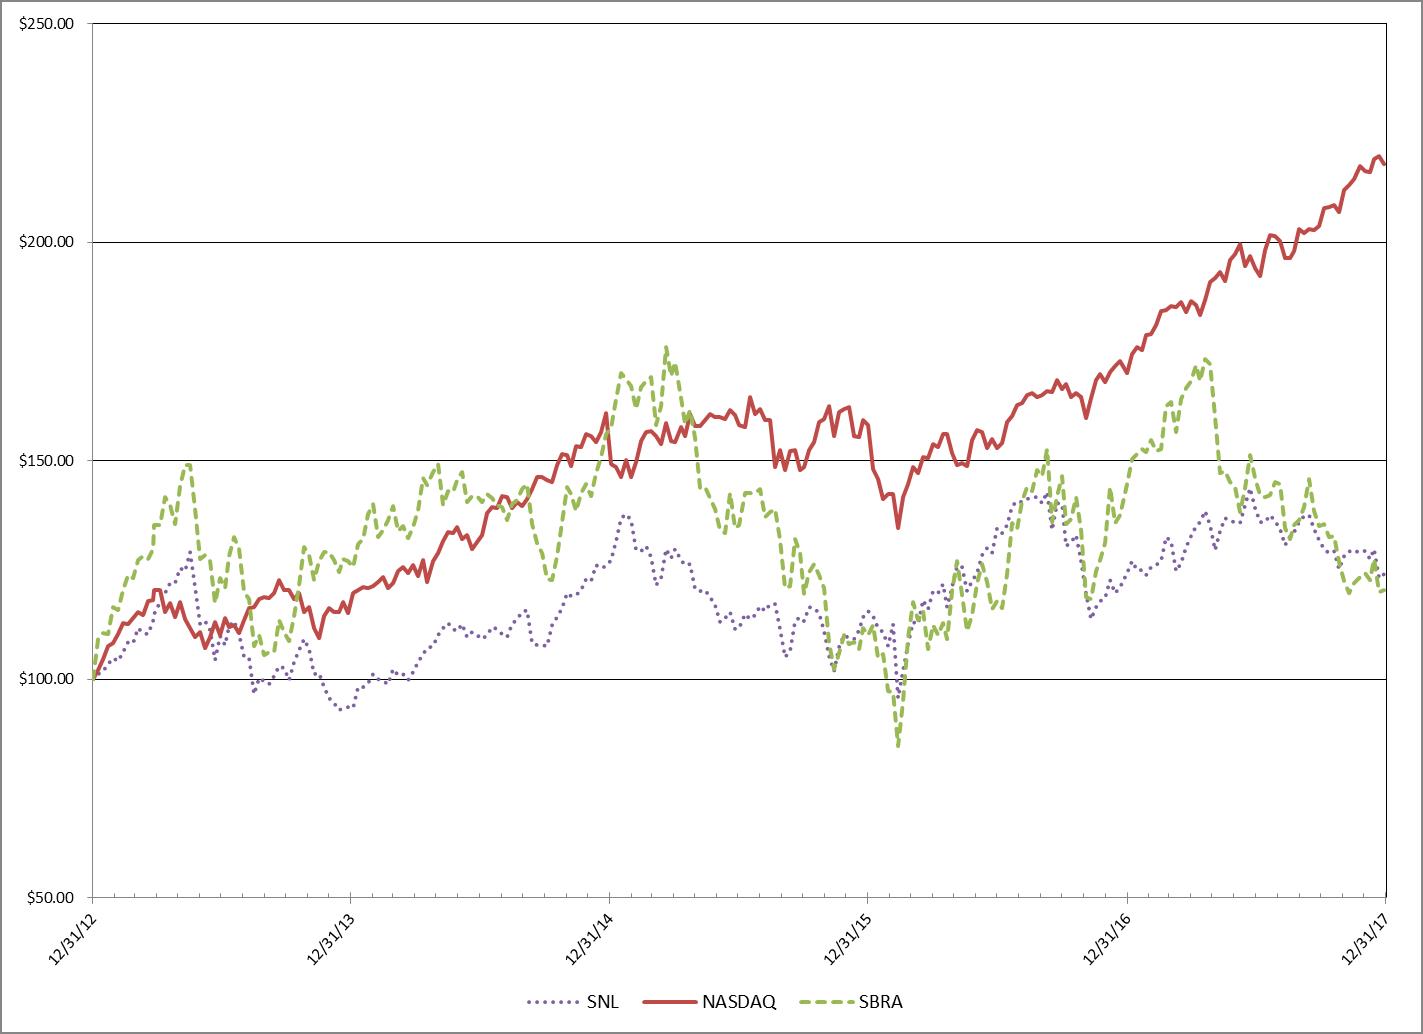
The above performance graph shall not be deemed to be soliciting material or to be filed with the SEC under the Securities Act of 1933 or the Securities Exchange Act of 1934 or incorporated by reference in any document as filed.
28
The following table sets forth our selected financial data and other data for our company on a historical basis. The following data should be read in conjunction with our audited consolidated financial statements and notes thereto and Management’s Discussion and Analysis of Financial Condition and Results of Operations included elsewhere herein. Our historical operating results may not be comparable to our future operating results. The comparability of our selected financial data is significantly affected by our merger with CCP and our other acquisitions and new investments from 2013 through 2017. See Item 7, “Management’s Discussion and Analysis of Financial Condition and Results of Operations”:
|
As of December 31,
|
||||||||||||||||||||
|
2017
|
2016
|
2015
|
2014
|
2013
|
||||||||||||||||
|
(Dollars in thousands, except per share data)
|
||||||||||||||||||||
|
Balance sheet data:
|
||||||||||||||||||||
|
Total real estate investments, net
|
$
|
5,994,432
|
|
$
|
2,009,939
|
|
$
|
2,039,616
|
|
$
|
1,645,805
|
|
$
|
915,418
|
|
|||||
|
Loans receivable and other investments, net
|
$
|
114,390
|
|
$
|
96,036
|
|
$
|
300,177
|
|
$
|
251,583
|
|
$
|
185,293
|
|
|||||
|
Cash and cash equivalents
|
$
|
518,632
|
|
$
|
25,663
|
|
$
|
7,434
|
|
$
|
61,793
|
|
$
|
4,308
|
|
|||||
|
Total assets
|
$
|
7,032,277
|
|
$
|
2,265,919
|
|
$
|
2,468,837
|
|
$
|
2,046,165
|
|
$
|
1,162,298
|
|
|||||
|
Secured debt, net
|
$
|
256,430
|
|
$
|
160,752
|
|
$
|
174,846
|
|
$
|
121,401
|
|
$
|
139,103
|
|
|||||
|
Revolving credit facility
|
$
|
641,000
|
|
$
|
26,000
|
|
$
|
255,000
|
|
$
|
68,000
|
|
$
|
135,500
|
|
|||||
|
Term loans, net
|
$
|
1,190,774
|
|
$
|
335,673
|
|
$
|
264,229
|
|
$
|
200,000
|
|
$
|
—
|
|
|||||
|
Senior unsecured notes, net
|
$
|
1,306,286
|
|
$
|
688,246
|
|
$
|
685,704
|
|
$
|
683,167
|
|
$
|
405,302
|
|
|||||
|
Total liabilities
|
$
|
3,595,028
|
|
$
|
1,250,310
|
|
$
|
1,414,961
|
|
$
|
1,104,342
|
|
$
|
702,134
|
|
|||||
|
Total Sabra Health Care REIT, Inc. stockholders’ equity
|
$
|
3,432,807
|
|
$
|
1,015,574
|
|
$
|
1,053,770
|
|
$
|
941,866
|
|
$
|
460,164
|
|
|||||
|
Operating data:
|
||||||||||||||||||||
|
Total revenues
|
$
|
405,647
|
|
$
|
260,526
|
|
$
|
238,864
|
|
$
|
183,518
|
|
$
|
134,780
|
|
|||||
|
Net income attributable to common stockholders
|
$
|
148,141
|
|
$
|
60,034
|
|
$
|
69,171
|
|
$
|
36,710
|
|
$
|
25,749
|
|
|||||
|
Net income attributable to common stockholders per share, basic
|
$
|
1.40
|
|
$
|
0.92
|
|
$
|
1.11
|
|
$
|
0.79
|
|
$
|
0.69
|
|
|||||
|
Net income attributable to common stockholders per share, diluted
|
$
|
1.40
|
|
$
|
0.92
|
|
$
|
1.11
|
|
$
|
0.78
|
|
$
|
0.68
|
|
|||||
|
Other data:
|
||||||||||||||||||||
|
Cash flows provided by operations
|
$
|
133,486
|
|
$
|
176,739
|
|
$
|
121,101
|
|
$
|
85,337
|
|
$
|
62,099
|
|
|||||
|
Cash flows (used in) provided by investing activities
|
$
|
(240,072
|
)
|
$
|
142,363
|
|
$
|
(489,226
|
)
|
$
|
(826,472
|
)
|
$
|
(297,509
|
)
|
|||||
|
Cash flows provided by (used in) financing activities
|
$
|
598,817
|
|
$
|
(300,898
|
)
|
$
|
314,078
|
|
$
|
798,620
|
|
$
|
222,617
|
|
|||||
|
Dividends declared and paid per common share
|
$
|
1.73
|
|
$
|
1.67
|
|
$
|
1.60
|
|
$
|
1.51
|
|
$
|
1.36
|
|
|||||
|
Weighted-average number of common shares outstanding, basic
|
105,621,242
|
|
65,284,251
|
|
62,235,014
|
|
46,351,544
|
|
37,514,637
|
|
||||||||||
|
Weighted-average number of common shares outstanding, diluted—net income and FFO attributable to common stockholders
|
105,842,434
|
|
65,520,672
|
|
62,460,239
|
|
46,889,531
|
|
38,071,926
|
|
||||||||||
|
Weighted-average number of common shares outstanding, diluted—AFFO attributable to common stockholders
|
106,074,862
|
|
65,904,435
|
|
62,659,935
|
|
47,147,722
|
|
38,364,727
|
|
||||||||||
|
FFO attributable to common stockholders
(1)
|
$
|
211,267
|
|
$
|
164,439
|
|
$
|
132,411
|
|
$
|
76,128
|
|
$
|
59,030
|
|
|||||
|
Diluted FFO attributable to common stockholders per common share
(1)
|
$
|
2.00
|
|
$
|
2.51
|
|
$
|
2.12
|
|
$
|
1.62
|
|
$
|
1.55
|
|
|||||
|
AFFO attributable to common stockholders
(1)
|
$
|
242,278
|
|
$
|
161,465
|
|
$
|
133,913
|
|
$
|
77,223
|
|
$
|
57,942
|
|
|||||
|
Diluted AFFO attributable to common stockholders per common share
(1)
|
$
|
2.28
|
|
$
|
2.45
|
|
$
|
2.14
|
|
$
|
1.64
|
|
$
|
1.51
|
|
|||||
|
(1)
|
We believe that net income attributable to common stockholders as defined by U.S. generally accepted accounting principles (“GAAP”) is the most appropriate earnings measure. We also believe that funds from operations attributable to common stockholders (“FFO”), as defined in accordance with the definition used by the National Association of Real Estate Investment Trusts (“NAREIT”), and adjusted funds from operations attributable to common stockholders (“AFFO”) (and related per share amounts) are important non-GAAP supplemental measures of our operating performance for a REIT. We consider FFO and AFFO to be useful measures for reviewing comparative operating and financial performance because, by excluding gains or losses from real estate dispositions, real estate depreciation and amortization, net of amounts related to noncontrolling interests, real estate impairment charges, and for AFFO, by excluding merger and acquisition costs, stock-based compensation expense, straight-line rental income adjustments, amortization of above and below market lease intangibles, net, non-cash interest income adjustments, non-cash interest expense, as well as other non-cash revenue and expense items (including non-cash portion of loss on extinguishment of debt, change in fair value of contingent consideration, provision for doubtful straight-line rental
|
29
income, loan losses and other reserves, ineffectiveness gain/loss on derivative instruments, and non-cash revenue and expense amounts related to noncontrolling interests), FFO and AFFO can help investors compare our operating performance between periods or as compared to other companies. See further discussion of FFO and AFFO in Item 7, “Management’s Discussion and Analysis of Financial Condition and Results of Operations—Results of Operations—Funds from Operations and Adjusted Funds from Operations.”
30
The discussion below contains forward-looking statements that involve risks and uncertainties. Our actual results could differ materially from those anticipated in these forward-looking statements as a result of various factors, including those which are discussed in the section titled “Risk Factors.” Also see “Statement Regarding Forward-Looking Statements” preceding Part I.
The following discussion and analysis should be read in conjunction with the “Selected Financial Data” above and our accompanying consolidated financial statements and the notes thereto.
Our Management’s Discussion and Analysis of Financial Condition and Results of Operations is organized as follows:
|
•
|
Overview
|
|
•
|
Critical Accounting Policies
|
|
•
|
Recently Issued Accounting Standards Update
|
|
•
|
Results of Operations
|
|
•
|
Liquidity and Capital Resources
|
|
•
|
Concentration of Credit Risk
|
|
•
|
Skilled Nursing Facility Reimbursement Rates
|
|
•
|
Obligations and Commitments
|
|
•
|
Impact of Inflation
|
|
•
|
Off-Balance Sheet Arrangements
|
|
•
|
Quarterly Financial Data
|
Overview
We operate as a self-administered, self-managed REIT that, through our subsidiaries, owns and invests in real estate serving the healthcare industry.
Our primary business consists of acquiring, financing and owning real estate property to be leased to third party tenants in the healthcare sector using triple-net operating leases. We primarily generate revenues by leasing properties to tenants and owning properties operated by third-party property managers throughout the United States (“U.S.”) and Canada.
Our investment portfolio is primarily comprised of skilled nursing/transitional care facilities, senior housing communities and specialty hospitals and other facilities, in each case leased to third-party operators; Senior Housing - Managed communities operated by third-party property managers pursuant to property management agreements; investments in loans receivable; and preferred equity investments.
In 2017 and early 2018, we completed a series of transactions—the CCP Merger, sales of facilities leased to Genesis, entry into our new Credit Facility, investment in the Enlivant Joint Venture, and acquisition of a portfolio of skilled nursing/transitional care facilities, each of which are detailed below—that have significantly enhanced our scale and increased our diversification. Following these transactions, we expect to continue to grow our investment portfolio while diversifying our portfolio by tenant, asset class and geography within the healthcare sector. We plan to achieve these objectives primarily through making investments directly or indirectly in healthcare real estate, including the development of purpose built healthcare facilities with select developers. We also intend to achieve our objective of diversifying our portfolio by tenant and asset class through select asset sales and other arrangements with Genesis and with other tenants. We have entered into memoranda of understanding with Genesis to market for sale up to all of our remaining Genesis facilities and to restructure our lease agreements with Genesis to increase the marketability of these facilities to potential buyers. We expect to complete the sales of 46 of our remaining 54 Genesis facilities in 2018 and to retain eight facilities, although we cannot provide assurance that the sales will be completed in that timeframe, if at all.
We expect to continue to grow our portfolio primarily through the acquisition of assisted living, independent living and memory care communities in the U.S. and Canada and through the acquisition of skilled nursing/transitional care and behavioral health facilities in the U.S. We have and expect to continue to opportunistically acquire other types of healthcare real estate, originate financing secured directly or indirectly by healthcare facilities and invest in the development of senior housing communities and skilled nursing/transitional care facilities. We also expect to expand our portfolio through the development of purpose-built healthcare facilities through pipeline agreements and other arrangements with select developers. We further expect to work with existing operators to identify strategic development opportunities. These opportunities may involve
31
replacing, renovating or expanding facilities in our portfolio that may have become less competitive and new development opportunities that present attractive risk-adjusted returns. In addition to pursuing acquisitions with triple-net leases, we expect to continue to pursue other forms of investment, including investments in Senior Housing - Managed communities, mezzanine and secured debt investments, and joint ventures for senior housing communities and skilled nursing/transitional care facilities. We also expect to continue to enhance the strength of our investment portfolio by selectively disposing of underperforming facilities or working with new or existing operators to transfer underperforming but promising properties to new operators.
With respect to our debt and preferred equity investments, in general, we originate loans and make preferred equity investments when an attractive investment opportunity is presented and (a) the property is in or near the development phase, (b) the development of the property is completed but the operations of the facility are not yet stabilized or (c) the loan investment will provide capital to existing relationships. A key component of our development strategy related to loan originations and preferred equity investments is having the option to purchase the underlying real estate that is owned by our borrowers (and that directly or indirectly secures our loan investments) or by the entity in which we have an investment. These options become exercisable upon the occurrence of various criteria, such as the passage of time or the achievement of certain operating goals, and the method to determine the purchase price upon exercise of the option is set in advance based on the same valuation methods we use to value our investments in healthcare real estate. This proprietary development pipeline strategy allows us to diversify our revenue streams and build relationships with operators and developers, and provides us with the option to add new properties to our existing real estate portfolio if we determine that those properties enhance our investment portfolio and stockholder value at the time the options are exercisable.
We employ a disciplined, opportunistic approach in our healthcare real estate investment strategy by investing in assets that provide attractive opportunities for dividend growth and appreciation of asset values, while maintaining balance sheet strength and liquidity, thereby creating long-term stockholder value.
We elected to be treated as a REIT with the filing of our U.S. federal income tax return for the taxable year beginning January 1, 2011. We believe that we have been organized and have operated, and we intend to continue to operate, in a manner to qualify as a REIT. We operate through an umbrella partnership, commonly referred to as an UPREIT structure, in which substantially all of our properties and assets are held by Sabra Health Care Limited Partnership, a Delaware limited partnership (the “Operating Partnership”), of which we are the sole general partner and our wholly owned subsidiaries are currently the only limited partners, or by subsidiaries of the Operating Partnership.
Care Capital Properties, Inc. Merger
On May 7, 2017, Sabra, the Operating Partnership, PR Sub, LLC, a Delaware limited liability company and wholly owned subsidiary of Sabra (“Merger Sub”), CCP, and Care Capital Properties, L.P. (“CCPLP”), a Delaware limited partnership and wholly owned subsidiary of CCP, entered into an Agreement and Plan of Merger (the “Merger Agreement”), pursuant to which, on August 17, 2017, CCP merged with and into Merger Sub, with Merger Sub continuing as the surviving corporation (the “CCP Merger”), following which Merger Sub merged with and into Sabra, with Sabra continuing as the surviving entity (the “Subsequent Merger”), and, simultaneous with the Subsequent Merger, CCPLP merged with and into the Operating Partnership, with the Operating Partnership continuing as the surviving entity.
Pursuant to the Merger Agreement, as of the effective time of the CCP Merger, each share of CCP common stock, par value
$0.01
per share, issued and outstanding immediately prior to the effective time of the CCP Merger (other than shares of CCP common stock owned directly by CCP, Sabra or their respective subsidiaries, in each case not held on behalf of third parties) was converted into the right to receive
1.123
newly issued shares of Company common stock, par value
$0.01
per share, plus cash in lieu of any fractional shares.
The acquisition of CCP has been reflected in our consolidated financial statements since the effective date of the CCP
Merger.
On September 7, 2017, Sabra announced its strategy to reposition the CCP portfolio, which includes a combination of lease modifications (including between $28.2 million and $31.2 million of reduction in rents), working capital advances, transitioning facilities to other Sabra tenants and strategic sales or closures of underperforming facilities.
As a result of the CCP Merger, we have increased our tenant diversification by operator and geography, including decreasing concentration from our top five relationships. In addition, shortly following the closing of the CCP Merger, we received investment grade ratings from Standard & Poor’s and Fitch and a two notch upgrade from Moody’s, which provided an immediate improvement in our cost of debt under our Revolving Credit Facility.
See Note 3, “CCP Merger and Recent Real Estate Acquisitions,” in the Notes to Consolidated Financial Statements for additional information regarding the CCP Merger.
32
Acquisitions
During the year ended
December 31, 2017
, we invested
$426.8 million
for the acquisition of
22
skilled nursing/transitional care facilities located in three states and
two
senior housing communities located in two states. See Note 3, “CCP Merger and Recent Real Estate Acquisitions,” in the Notes to Consolidated Financial Statements for additional information regarding these acquisitions.
In connection with the acquisition of a portfolio of 21 skilled nursing/transitional care facilities, we entered into a definitive agreement to acquire two additional skilled nursing/transitional care facilities from the seller for a purchase price of $42.8 million; the acquisition of the two additional facilities closed in January 2018.
Dispositions
During the year ended
December 31, 2017
, we completed the sale of
31
skilled nursing/transitional care facilities, including
24
facilities previously leased to Genesis, and
one
senior housing community for aggregate consideration of
$150.2 million
, net of closing costs. The net carrying value of the assets and liabilities of these facilities was
$98.2 million
, which resulted in an aggregate
$52.0 million
net gain on sale.
Senior Housing - Managed Properties
During the year ended
December 31, 2017
, we terminated the lease of nine senior housing real estate investments in Canada and concurrently entered into a management agreement with Sienna Senior Living (“Sienna”), whereby we own the operations, through a wholly owned foreign taxable REIT subsidiary, of the communities and the communities are operated by Sienna.
Enlivant Joint Venture
On
January 2, 2018
, we completed our transaction with affiliates of Enlivant and TPG Real Estate, the real estate platform of TPG, to acquire a
49%
equity interest in an entity that collectively owns
172
senior housing communities managed by Enlivant (the “Enlivant Joint Venture”). We contributed
$352.7 million
for the
49%
noncontrolling interest, which implies an aggregate portfolio value for the Enlivant Joint Venture of
$1.49 billion
. The Enlivant Joint Venture has outstanding indebtedness of
$791.3 million
for the portfolio and net working capital of
$22.9 million
. We financed this investment with proceeds from our Revolving Credit Facility. The joint venture agreement includes an option for us to acquire the remaining majority interest in the Enlivant Joint Venture which terminates on January 2, 2021. Our partner in the Enlivant Joint Venture has the option to transfer its interest commencing on January 2, 2020 subject to our right of first offer. In addition, Sabra has the right to designate
three
directors on the
seven
member boards of directors of the Enlivant Joint Venture and has other customary minority rights.
Additionally on
January 2, 2018
, we acquired
11
senior housing communities under the Senior Housing - Managed structure that are operated by Enlivant pursuant to property management agreements for
$138.3 million
, which includes net working capital of $14.1 million, financed with proceeds from our Revolving Credit Facility.
Credit Facility
Effective on August 17, 2017, we and certain of our subsidiaries entered into the Credit Facility. See “—Liquidity and Capital Resources—Loan Agreements—Credit Facility.”
Common Stock Issuance
During September and October 2017, we issued
18.4 million
newly issued shares of our common stock through an underwritten public offering. See “—Liquidity and Capital Resources.”
Critical Accounting Policies
Below is a discussion of the accounting policies that management considers critical in that they involve significant management judgments and assumptions, require estimates about matters that are inherently uncertain and because they are important for understanding and evaluating our reported financial results. These judgments affect the reported amounts of assets and liabilities and our disclosure of contingent assets and liabilities at the dates of the financial statements and the reported amounts of revenue and expenses during the reporting periods. With different estimates or assumptions, materially different amounts could be reported in our financial statements. Additionally, other companies may utilize different estimates that may impact the comparability of our results of operations to those of companies in similar businesses.
33
Principles of Consolidation and Basis of Presentation
The consolidated financial statements include the accounts of Sabra and our wholly owned subsidiaries. All significant intercompany balances and transactions have been eliminated in consolidation. The consolidated financial statements are prepared in accordance with GAAP.
GAAP requires us to identify entities for which control is achieved through voting rights or other means and to determine which business enterprise is the primary beneficiary of variable interest entities (“VIEs”). A VIE is broadly defined as an entity with one or more of the following characteristics: (a) the total equity investment at risk is insufficient to finance the entity’s activities without additional subordinated financial support; (b) as a group, the holders of the equity investment at risk lack (i) the ability to make decisions about the entity’s activities through voting or similar rights, (ii) the obligation to absorb the expected losses of the entity, or (iii) the right to receive the expected residual returns of the entity; or (c) the equity investors have voting rights that are not proportional to their economic interests, and substantially all of the entity’s activities either involve, or are conducted on behalf of, an investor that has disproportionately few voting rights. If we were determined to be the primary beneficiary of the VIE, we would consolidate investments in the VIE. We may change our original assessment of a VIE due to events such as modifications of contractual arrangements that affect the characteristics or adequacy of the entity’s equity investments at risk and the disposal of all or a portion of an interest held by the primary beneficiary.
We identify the primary beneficiary of a VIE as the enterprise that has both: (i) the power to direct the activities of the VIE that most significantly impact the entity’s economic performance; and (ii) the obligation to absorb losses or the right to receive benefits of the VIE that could be significant to the entity. We perform this analysis on an ongoing basis.
As of
December 31, 2017
, we determined that we were the primary beneficiary of
19
VIEs—
18
exchange accommodation titleholder variable interest entities and a joint venture variable interest entity owning
one
skilled nursing/transitional care facility—and we have consolidated the operations of these entities in the accompanying consolidated financial statements. As of
December 31, 2017
, we determined that the operations of these entities were not material to our results of operations, financial condition or cash flows.
As it relates to investments in loans, in addition to our assessment of VIEs and whether we are the primary beneficiary of those VIEs, we evaluate the loan terms and other pertinent facts to determine if the loan investment should be accounted for as a loan or as a real estate joint venture. If an investment has the characteristics of a real estate joint venture, including if we participate in the majority of the borrower’s expected residual profit, we would account for the investment as an investment in a real estate joint venture and not as a loan investment. Expected residual profit is defined as the amount of profit, whether called interest or another name, such as an equity kicker, above a reasonable amount of interest and fees expected to be earned by a lender. At
December 31, 2017
, none of our investments in loans are accounted for as real estate joint ventures.
As it relates to investments in joint ventures, we assess any limited partners’ rights and their impact on the presumption of control of the limited partnership by any single partner. We also apply this guidance to managing member interests in limited liability companies. We reassess our determination of which entity controls the joint venture if: there is a change to the terms or in the exercisability of the rights of any partners or members, the sole general partner or managing member increases or decreases its ownership interests, or there is an increase or decrease in the number of outstanding ownership interests. As of
December 31, 2017
, our determination of which entity controls our investments in joint ventures has not changed as a result of any reassessment.
Real Estate Investments and Rental Revenue Recognition
Real Estate Acquisition Valuation
All assets acquired and liabilities assumed in an acquisition of real estate accounted for as a business combination are measured at their acquisition date fair values. For acquisitions of real estate accounted for as an asset acquisition, the fair value of consideration transferred by us (including transaction costs) is allocated to all assets acquired and liabilities assumed on a relative fair value basis. The acquisition value of land, building and improvements are included in real estate investments on the consolidated balance sheets. The acquisition value of above market lease, tenant origination and absorption costs and tenant relationship intangible assets is included in lease intangible assets, net on the consolidated balance sheets. The acquisition value of below market lease intangible liabilities is included in lease intangible liabilities, net on the consolidated balance sheets. Acquisition costs associated with real estate acquisitions deemed asset acquisitions are capitalized, and costs associated with real estate acquisitions deemed business combinations are expensed as incurred. We capitalized
$1.0 million
and
$0.3 million
of acquisition costs during the years ended
December 31, 2017
and
2016
, respectively. Restructuring costs that do not meet the definition of a liability at the acquisition date are expensed in periods subsequent to the acquisition date. During the years ended
December 31, 2017
,
2016
and
2015
, we expensed
$30.3 million
,
$1.2 million
and
$7.0 million
, respectively, of merger and acquisition costs.
34
Estimates of the fair values of the tangible assets, identifiable intangibles and assumed liabilities require us to make significant assumptions to estimate market lease rates, property operating expenses, carrying costs during lease-up periods, discount rates, market absorption periods, and the number of years the property will be held for investment. We make our best estimate based on our evaluation of the specific characteristics of each tenant’s lease. The use of inappropriate assumptions would result in an incorrect valuation of our acquired tangible assets, identifiable intangibles and assumed liabilities, which would impact the amount of our net income.
Impairment of Real Estate Investments
We continually monitor events and changes in circumstances that could indicate that the carrying amounts of our real estate investments may not be recoverable or realized. When indicators of potential impairment suggest that the carrying value of real estate investments may not be recoverable, we assess the recoverability by estimating whether we will recover the carrying value of our real estate investments through the undiscounted future cash flows and the eventual disposition of the investment. In some instances, there may be various potential outcomes for an investment and its potential future cash flows. In these instances, the undiscounted future cash flows used to assess recoverability are probability-weighted based on our best estimates as of the date of evaluation. If, based on this analysis, we do not believe that we will be able to recover the carrying value of our real estate investments, we would record an impairment loss to the extent that the carrying value exceeds the estimated fair value of our real estate investments. During the year ended December 31, 2017, we recorded an impairment loss of
$1.3 million
related to one skilled nursing/transitional care facility. During the year ended December 31, 2016, we recorded an impairment loss of
$29.8 million
related to our Forest Park - Frisco real estate investment. This facility was subsequently disposed of during the year ended December 31, 2016. We did not record any impairment losses on our real estate investments during the year ended December 31, 2015.
Revenue Recognition
We recognize rental revenue from tenants, including rental abatements, lease incentives and contractual fixed increases attributable to operating leases, on a straight-line basis over the term of the related leases when collectability is reasonably assured. Certain of our leases provide for contingent rents equal to a percentage of the facility’s revenue in excess of specified base amounts or other thresholds. Such revenue is recognized when actual results reported by the tenant, or estimates of tenant results, exceed the applicable base amount or other threshold.
We make estimates of the collectability of our tenant receivables related to base rents, straight-line rent and other revenues. When we analyze accounts receivable and evaluate the adequacy of the allowance for doubtful accounts, we consider such things as historical bad debts, tenant creditworthiness, current economic trends, facility operating performance, lease structure, credit enhancements (including guarantees), current developments relevant to a tenant’s business specifically and to its business category generally, and changes in tenants’ payment patterns. Specifically for straight-line rent receivables, our assessment includes an estimation of a tenant’s ability to fulfill its rental obligations over the remaining lease term. In addition, with respect to tenants in bankruptcy, management makes estimates of the expected recovery of pre-petition and post-petition claims in assessing the estimated collectability of the related receivable. When a tenant is in bankruptcy, we record a provision for doubtful accounts for management’s estimate of the tenant’s receivable balance that is uncollectible and generally will not recognize subsequent rental revenue until cash is received or until the tenant is no longer in bankruptcy and has the ability to make rental payments. Our collectability estimates for straight-line rent receivables include an assessment at the individual or master lease level as well as at an overall portfolio level.
Revenue from resident fees and services is recorded monthly as services are provided and includes resident room and care charges and other resident charges.
Loans Receivable and Interest Income
Loans Receivable
Loans receivable are reflected at amortized cost on our consolidated balance sheets. The amortized cost of a loan receivable is the outstanding unpaid principal balance, net of unamortized discounts, costs and fees directly associated with the origination of the loan.
Loans acquired in connection with a business combination are recorded at their acquisition date fair value. We determine the fair value of loans receivable based on estimates of expected discounted cash flows, collateral, credit risk and other factors. A valuation allowance is not established at the acquisition date, as the amount of estimated future cash flows reflects our judgment regarding their uncertainty. The difference between the acquisition date fair value and the total expected cash flows is recognized as interest income using the effective interest method over the life of the applicable loan. Any unamortized balances are immediately recognized in income if the loan is repaid before its contractual maturity.
35
On a quarterly basis, we evaluate the collectability of our loan portfolio, including related interest income receivable, and establish a reserve for loan losses. Our evaluation includes reviewing credit quality indicators such as payment status, changes affecting the underlying real estate collateral (for collateral dependent loans), changes affecting the operations of the facilities securing the loans, and national and regional economic factors. The reserve for loan losses is a valuation allowance that reflects management’s estimate of loan losses inherent in the loan portfolio as of the balance sheet date. The reserve is adjusted through provision for doubtful accounts and loan losses on our consolidated statements of income and is decreased by charge-offs to specific loans when losses are confirmed. The reserve for loan losses includes an asset-specific component and a portfolio-based component.
An asset-specific reserve relates to reserves for losses on loans considered impaired and interest income receivable that is deemed uncollectible. We consider a loan to be impaired when, based upon current information and events, we believe that it is probable that we will be unable to collect all amounts due under the contractual terms of the loan agreement resulting from the borrower’s failure to repay contractual amounts due, the granting of a concession by us or our expectation that we will receive assets with fair values less than the carrying value of the loan in satisfaction of the loan. If a loan is considered to be impaired, a reserve is established when the carrying value of that loan is greater than the present value of payments expected to be received, the observable market prices for similar instruments, the estimated fair value of the collateral (for loans that are dependent on the collateral for repayment) or other amounts expected to be received in satisfaction of the loan. As of
December 31, 2017
, we did
not
consider any loans receivable investments to be impaired. We recorded a provision for loan losses of
$4.8 million
related to
two
loans receivable investments during the year ended
December 31, 2017
, both of which were repaid as of December 31, 2017. As of
December 31, 2016
, we considered
three
loans receivable investments with an aggregate principal balance of
$17.4 million
to be impaired and recorded a provision for loan losses of
$3.1 million
related to
four
loans receivable investments,
one
of which was partially repaid prior to
December 31, 2016
through the foreclosure of the related real estate asset. During the year ended
December 31, 2015
, we recorded a $2.6 million specific loan loss reserve and a $1.8 million portfolio-based loan loss reserve.
A portfolio-based reserve covers the pool of loans that do not have asset-specific reserves. A provision for loan losses is recorded when available information as of each balance sheet date indicates that it is probable that a loss occurred in the pool of loans and the amount of the loss can be reasonably estimated, but we do not know which specific loans within the pool will ultimately result in losses. The required reserve balances for this pool of loans is derived based on estimated probabilities of default and estimated loss severities assuming a default occurs. As of
December 31, 2017
and
2016
, our portfolio-based loan loss reserve totaled
$0.1 million
and
$0.4 million
, respectively.
Interest Income
Interest income on our loans receivable is recognized on an accrual basis over the life of the investment using the interest method. Direct loan origination costs are amortized over the term of the loan as an adjustment to interest income. When concerns exist as to the ultimate collection of principal or interest due under a loan, the loan is placed on nonaccrual status, and we will not recognize interest income until the cash is received, or the loan returns to accrual status. If we determine that the collection of interest according to the contractual terms of the loan or through the receipts of assets in satisfaction of contractual amounts due is probable, we will resume the accrual of interest. In instances where borrowers are in default under the terms of their loans, we may continue recognizing interest income provided that all amounts owed under the contractual terms of the loan, including accrued and unpaid interest, do not exceed the estimated fair value of the collateral, less costs to sell. As of
December 31, 2017
,
one
loan receivable with a book value of
$0
was on nonaccrual status.
Preferred Equity Investments and Preferred Return
Preferred equity investments are accounted for at unreturned capital contributions, plus accrued and unpaid preferred returns. We recognize preferred return income on a monthly basis based on the outstanding investment including any previously accrued and unpaid return. As a preferred member of the preferred equity joint ventures in which we participate, we are not entitled to share in the joint venture’s earnings or losses. Rather, we are entitled to receive a preferred return, which is deferred if the cash flow of the joint venture is insufficient to currently pay the accrued preferred return.
Income Taxes
We elected to be treated as a REIT with the filing of our U.S. federal income tax return for the taxable year beginning January 1, 2011. We believe that we have been organized and have operated, and we intend to continue to operate, in a manner to qualify as a REIT. To qualify as a REIT, we must meet certain organizational and operational requirements, including a requirement to distribute at least 90% of our annual REIT taxable income to stockholders (which is computed without regard to the dividends-paid deduction or net capital gains and which does not necessarily equal net income as calculated in accordance with GAAP). As a REIT, we generally will not be subject to federal income tax on income that we distribute as dividends to our stockholders. If we fail to qualify as a REIT in any taxable year, we will be subject to U.S. federal income tax on our taxable
36
income at regular corporate income tax rates and generally will not be permitted to qualify for treatment as a REIT for federal income tax purposes for the four taxable years following the year during which qualification is lost, unless the IRS grants us relief under certain statutory provisions. Such an event could materially and adversely affect our net income and net cash available for distribution to stockholders. However, we believe that we are organized and operate in such a manner as to qualify for treatment as a REIT.
As a result of certain investments, we now record income tax expense or benefit with respect to certain of our entities that are taxed as taxable REIT subsidiaries under provisions similar to those applicable to regular corporations and not under the REIT provisions.
We account for deferred income taxes using the asset and liability method and recognize deferred tax assets and liabilities for the expected future tax consequences of events that have been included in our financial statements or tax returns. Under this method, we determine deferred tax assets and liabilities based on the differences between the financial reporting and tax bases of assets and liabilities using enacted tax rates in effect for the year in which the differences are expected to reverse. Any increase or decrease in the deferred tax liability that results from a change in circumstances, and that causes a change in our judgment about expected future tax consequences of events, is included in the tax provision when such changes occur. Deferred income taxes also reflect the impact of operating loss and tax credit carryforwards. A valuation allowance is provided if we believe it is more likely than not that all or some portion of the deferred tax asset will not be realized. Any increase or decrease in the valuation allowance that results from a change in circumstances, and that causes a change in our judgment about the realizability of the related deferred tax asset, is included in the tax provision when such changes occur.
We evaluate our tax positions using a two-step approach: step one (recognition) occurs when we conclude that a tax position, based solely on its technical merits, is more likely than not to be sustained upon examination and step two (measurement) is only addressed if step one has been satisfied (i.e., the position is more likely than not to be sustained). Under step two, the tax benefit is measured as the largest amount of benefit (determined on a cumulative probability basis) that is more likely than not to be realized upon ultimate settlement. We will recognize tax penalties relating to unrecognized tax benefits as additional tax expense.
Fair Value Measurements
Under GAAP, we are required to measure certain financial instruments at fair value on a recurring basis. In addition, we are required to measure other financial instruments and balances at fair value on a non-recurring basis (e.g., carrying value of impaired loans receivable and long-lived assets). Fair value is defined as the price that would be received upon the sale of an asset or paid to transfer a liability in an orderly transaction between market participants at the measurement date. The GAAP fair value framework uses a three-tiered approach. Fair value measurements are classified and disclosed in one of the following three categories:
|
•
|
Level 1: unadjusted quoted prices in active markets that are accessible at the measurement date for identical assets or liabilities;
|
|
•
|
Level 2: quoted prices for similar instruments in active markets, quoted prices for identical or similar instruments in markets that are not active, and model-derived valuations in which significant inputs and significant value drivers are observable in active markets; and
|
|
•
|
Level 3: prices or valuation techniques where little or no market data is available that requires inputs that are both significant to the fair value measurement and unobservable.
|
When available, we utilize quoted market prices from an independent third-party source to determine fair value and classify such items in Level 1 or Level 2. In instances where the market for a financial instrument is not active, regardless of the availability of a nonbinding quoted market price, observable inputs might not be relevant and could require us to make a significant adjustment to derive a fair value measurement. Additionally, in an inactive market, a market price quoted from an independent third party may rely more on models with inputs based on information available only to that independent third party. When we determine the market for a financial instrument owned by us to be illiquid or when market transactions for similar instruments do not appear orderly, we may use several valuation sources (including internal valuations, discounted cash flow analysis and quoted market prices) to establish a fair value. If more than one valuation source is used, we will assign weights to the various valuation sources. Additionally, when determining the fair value of liabilities in circumstances in which a quoted price in an active market for an identical liability is not available, we measure fair value using (i) a valuation technique that uses the quoted price of the identical liability when traded as an asset or quoted prices for similar liabilities or similar liabilities when traded as assets or (ii) another valuation technique that is consistent with the principles of fair value measurement, such as the income approach or the market approach.
37
Changes in assumptions or estimation methodologies can have a material effect on these estimated fair values. In this regard, the derived fair value estimates cannot be substantiated by comparison to independent markets and, in many cases, may not be realized in an immediate settlement of the instrument.
We consider the following factors to be indicators of an inactive market: (i) there are few recent transactions, (ii) price quotations are not based on current information, (iii) price quotations vary substantially either over time or among market makers (for example, some brokered markets), (iv) indexes that previously were highly correlated with the fair values of the asset or liability are demonstrably uncorrelated with recent indications of fair value for that asset or liability, (v) there is a significant increase in implied liquidity risk premiums, yields, or performance indicators (such as delinquency rates or loss severities) for observed transactions or quoted prices when compared with our estimate of expected cash flows, considering all available market data about credit and other nonperformance risk for the asset or liability, (vi) there is a wide bid-ask spread or significant increase in the bid-ask spread, (vii) there is a significant decline or absence of a market for new issuances (that is, a primary market) for the asset or liability or similar assets or liabilities, and (viii) little information is released publicly (for example, a principal-to-principal market).
We consider the following factors to be indicators of non-orderly transactions: (i) there was not adequate exposure to the market for a period before the measurement date to allow for marketing activities that are usual and customary for transactions involving such assets or liabilities under current market conditions, (ii) there was a usual and customary marketing period, but the seller marketed the asset or liability to a single market participant, (iii) the seller is in or near bankruptcy or receivership (that is, distressed), or the seller was required to sell to meet regulatory or legal requirements (that is, forced), and (iv) the transaction price is an outlier when compared with other recent transactions for the same or similar assets or liabilities.
Recently Issued Accounting Standards Update
See Note 2, “Summary of Significant Accounting Policies,” in the Notes to Consolidated Financial Statements for information concerning recently issued accounting standards updates.
Results of Operations
As of
December 31, 2017
, our investment portfolio consisted of
507
real estate properties held for investment,
one
investment in a direct financing lease,
22
investments in loans receivable,
12
preferred equity investments and one investment in a specialty valuation firm. As of
December 31, 2016
, our investment portfolio consisted of 183 real estate properties held for investment, 10 investments in loans receivable and 12 preferred equity investments. As of
December 31, 2015
, our investment portfolio consisted of 180 real estate properties held for investment, 17 investments in loans receivable and 10 preferred equity investments. In general, we expect that our income and expenses related to our portfolio will increase in future periods in comparison to the corresponding prior periods as a result of owning acquired investments for an entire period, the anticipated future acquisition of additional investments and completion of the CCP Merger. The results of operations presented are not directly comparable due to ongoing acquisition activity.
38
Comparison of results of operations for the years ended
December 31, 2017
and
2016
(dollars in thousands):
|
For the Year Ended December 31,
|
Increase / (Decrease)
|
Percentage Difference
|
Variance due to the CCP Merger, Acquisitions, Originations and Dispositions
(1)
|
Remaining Variance
(2)
|
||||||||||||||||||
|
2017
|
2016
|
|||||||||||||||||||||
|
Revenues:
|
||||||||||||||||||||||
|
Rental income
|
$
|
364,191
|
|
$
|
225,275
|
|
$
|
138,916
|
|
62
|
%
|
$
|
146,865
|
|
$
|
(7,949
|
)
|
|||||
|
Interest and other income
|
15,026
|
|
27,463
|
|
(12,437
|
)
|
(45
|
)%
|
(13,022
|
)
|
585
|
|
||||||||||
|
Resident fees and services
|
26,430
|
|
7,788
|
|
18,642
|
|
239
|
%
|
—
|
|
18,642
|
|
||||||||||
|
Expenses:
|
|
|
||||||||||||||||||||
|
Depreciation and amortization
|
113,882
|
|
68,472
|
|
45,410
|
|
66
|
%
|
39,170
|
|
6,240
|
|
||||||||||
|
Interest
|
88,440
|
|
64,873
|
|
23,567
|
|
36
|
%
|
24,061
|
|
(494
|
)
|
||||||||||
|
Operating expenses
|
17,860
|
|
5,703
|
|
12,157
|
|
213
|
%
|
—
|
|
12,157
|
|
||||||||||
|
General and administrative
|
32,401
|
|
17,672
|
|
14,729
|
|
83
|
%
|
7,654
|
|
7,075
|
|
||||||||||
|
Merger and acquisition costs
|
30,255
|
|
1,197
|
|
29,058
|
|
2,428
|
%
|
29,058
|
|
—
|
|
||||||||||
|
Provision for doubtful accounts and loan losses
|
17,113
|
|
5,543
|
|
11,570
|
|
209
|
%
|
—
|
|
11,570
|
|
||||||||||
|
Impairment of real estate
|
1,326
|
|
29,811
|
|
(28,485
|
)
|
(96
|
)%
|
(28,485
|
)
|
—
|
|
||||||||||
|
Other income (expense):
|
||||||||||||||||||||||
|
Loss on extinguishment of debt
|
(553
|
)
|
(556
|
)
|
3
|
|
(1
|
)%
|
—
|
|
3
|
|
||||||||||
|
Other income
|
3,170
|
|
10,677
|
|
(7,507
|
)
|
(70
|
)%
|
—
|
|
(7,507
|
)
|
||||||||||
|
Net gain (loss) on sales of real estate
|
52,029
|
|
(6,122
|
)
|
58,151
|
|
NM
|
|
58,151
|
|
—
|
|
||||||||||
|
(1)
|
Represents the dollar amount increase (decrease) for the year ended
December 31, 2017
compared to the year ended December 31,
2016
as a result of the CCP Merger and investments/dispositions made after
January 1, 2016
.
|
|
(2)
|
Represents the dollar amount increase (decrease) for the year ended
December 31, 2017
compared to the year ended December 31,
2016
that is not a direct result of the CCP Merger and investments/dispositions made after
January 1, 2016
.
|
Rental Income
During the year ended
December 31, 2017
, we recognized
$364.2
million of rental income compared to
$225.3 million
for the year ended
December 31, 2016
. The
$138.9 million
net increase in rental income is primarily due to (i) an increase of $146.9 million from investment activity, consisting of $129.9 million from properties acquired in the CCP Merger and $20.8 million from other properties acquired after
January 1, 2016
partially offset by a decrease of $3.8 million from properties disposed of after
January 1, 2016
and (ii) a decrease of $7.6 million due to the nine senior housing communities that were transitioned to Senior Housing - Managed communities during the year ended
December 31, 2017
. Amounts due under the terms of all of our lease agreements are subject to contractual increases, and contingent rental income may be derived from certain lease agreements. No material contingent rental income was derived during the years ended
December 31, 2017
and
2016
.
Interest and Other Income
Interest and other income primarily consists of income earned on our loans receivable investments, preferred returns earned on our preferred equity investments and income from our direct financing lease. During the year ended
December 31, 2017
, we recognized
$15.0 million
of interest and other income compared to
$27.5 million
for the year ended
December 31, 2016
. The
$12.4 million
decrease is primarily due to a decrease of $17.2 million primarily related to interest income recognized at the default rate and late fees related to our investments in the Forest Park - Fort Worth construction loan and the Forest Park - Dallas mortgage loan during the year ended
December 31, 2017
. Both loans were repaid during the year ended December 31, 2016. The decrease is partially offset by an increase of $6.3 million related to interest income from loans receivable investments, income from a direct financing lease and income from the specialty valuation firm acquired in the CCP Merger.
Resident Fees and Services
During the year ended
December 31, 2017
, we recognized
$26.4 million
of resident fees and services compared to
$7.8 million
for the year ended
December 31, 2016
. The increase of
$18.6 million
is primarily due to the nine senior housing communities that were transitioned to Senior Housing - Managed communities in March and May 2017.
39
Depreciation and Amortization
During the year ended
December 31, 2017
, we incurred
$113.9 million
of depreciation and amortization expense compared to
$68.5 million
for the year ended
December 31, 2016
. The
$45.4 million
net increase in depreciation and amortization expense is primarily due to increases of (i) $35.7 million from properties acquired in the CCP Merger, (ii) $6.1 million from other properties acquired after
January 1, 2016
, (iii) $1.8 million due to the acceleration of lease intangible amortization related to the nine senior housing communities transitioned to Senior Housing - Managed communities and (iv) $4.7 million due to the acceleration of lease intangible amortization related to five skilled nursing/transitional care facilities transitioned to a new operator, partially offset by decreases of $2.6 million from properties disposed of after
January 1, 2016
and $0.3 million from fully depreciated assets.
Interest Expense
We incur interest expense comprised of costs of borrowings plus the amortization of deferred financing costs related to our indebtedness. During the year ended
December 31, 2017
, we incurred
$88.4 million
of interest expense compared to
$64.9 million
for the year ended
December 31, 2016
. The
$23.6 million
net increase is primarily related to (i) a $11.1 million increase in interest expense related to two senior unsecured notes assumed in the CCP Merger (see Note 8, “Debt,” in the Notes to Consolidated Financial Statements for additional information), (ii) a $9.3 million increase in interest expense related to our U.S. dollar term loans as a result of increasing U.S. dollar term loan borrowings from $245.0 million to $1.1 billion in connection with the CCP Merger, (iii) a $1.7 million increase in non-cash interest expense related to our interest rate hedges and (iv) a $1.3 million increase in interest expense related to the borrowings outstanding on our Revolving Credit Facility.
Operating Expenses
During the year ended
December 31, 2017
, we recognized
$17.9 million
of operating expenses compared to
$5.7 million
for the year ended
December 31, 2016
. The increase of
$12.2 million
is primarily due to the nine senior housing communities that were transitioned to Senior Housing - Managed communities in March and May 2017.
General and Administrative Expenses
General and administrative expenses include compensation-related expenses as well as professional services, office costs and other costs associated with asset management. During the year ended
December 31, 2017
, general and administrative expenses were
$32.4 million
compared to
$17.7 million
for the year ended
December 31, 2016
. The
$14.7 million
increase is primarily related to (i)
$5.5 million
of transition expenses for the CCP Merger primarily consisting of salaries and severance benefits, (ii) a $4.4 million increase in legal and professional fees primarily due to the management of the increased number of investments, (iii) a $2.2 million increase in payroll expense primarily due to the increased number of employees and (iv) $2.2 million in expenses incurred by our specialty valuation firm, partially offset by a $0.9 million decrease in stock-based compensation expense. Stock-based compensation expense decreased primarily because our executive officers did not participate in any annual bonus program in 2017 due to the pendency of the CCP Merger and were instead granted year-end equity awards subject to a multi-year vesting period in lieu of annual stock-based bonus awards. We expect stock-based compensation expense to fluctuate from period to period depending upon changes in our stock price and estimates associated with performance-based compensation. We do not expect transition expenses related to the CCP Merger to be material in the future.
Merger and Acquisition Costs
During the year ended
December 31, 2017
, we recognized
$30.3 million
of merger and acquisition costs compared to
$1.2 million
for the year ended
December 31, 2016
. The increase of
$29.1 million
is primarily due to costs related to the CCP Merger. We expect expensed merger and acquisition costs to fluctuate from period to period depending on acquisition activity and whether these acquisitions are considered business combinations.
Provision for Doubtful Accounts and Loan Losses
During the year ended
December 31, 2017
, we recognized
$17.1 million
in provision for doubtful accounts and loan losses. The
$17.1 million
provision is primarily due to a $10.5 million increase in reserves on straight-line rental income, a $4.5 million increase in loan loss reserves, a $1.8 million reserve for other tenant-related receivables and a $0.3 million increase in reserves on cash interest on loans. During the year ended
December 31, 2016
, we recognized
$5.5 million
in provision for doubtful accounts and loan losses, which is primarily comprised of a $3.5 million increase in general reserves on straight-line rental income, $1.8 million related to an increase in loan loss reserves and $0.5 million reserve for other tenant-related receivables, partially offset by a $0.3 million recovery on previously reserved cash rents.
40
Impairment of Real Estate
During the year ended
December 31, 2017
, we recognized
$1.3 million
of impairment of real estate related to one skilled nursing/transitional care facility. During the year ended
December 31, 2016
, we recognized
$29.8 million
of impairment of real estate related to the sale of the Forest Park - Frisco hospital. See Note 5, “Dispositions,” in the Notes to Consolidated Financial Statements for additional information.
Loss on Extinguishment of Debt
During the year ended
December 31, 2017
, we recognized a
$0.6 million
loss on extinguishment of debt related to write-offs of deferred financing costs in connection with amending the Prior Credit Facility (as defined below). We recognized a
$0.6 million
loss on extinguishment of debt during the year ended
December 31, 2016
related to write-offs of deferred financing costs in connection with amending the 2014 revolving credit facility and 2015 Canadian term loan.
Other Income
During the year ended
December 31, 2017
, we recognized
$3.2 million
in other income. Of the
$3.2 million
of other income,
$2.6 million
was due to the amortization of lease termination payments related to a memorandum of understanding entered into with Genesis regarding five Genesis facilities (of which
one
was owned as of
December 31, 2017
) and $0.4 million related to other income as a result of adjusting the fair value of our contingent consideration liability related to the acquisition of a real estate property. During the year ended
December 31, 2016
, we recognized
$10.7 million
in other income, of which $7.4 million related to the amortization of lease termination payments related to the same memorandum of understanding with Genesis, $1.5 million related to other income as a result of the net impact of adjusting the fair value of our contingent consideration arrangements related to the acquisition of a portfolio of real estate properties and two senior housing communities, $0.8 million related to ineffectiveness gain related to our LIBOR interest rate swaps, $0.4 million related to the lease termination fee related to the sale of one skilled nursing/transitional care facility and $0.3 million related to the gain on sale of 48 skilled nursing beds.
Net Gain (Loss) on Sales of Real Estate
During the year ended
December 31, 2017
, we recognized an aggregate net gain on the sale of real estate of
$52.0 million
, which consisted of a $54.6 million gain related to the disposition of 23 skilled nursing/transitional care facilities and one senior housing community, offset by a loss of $2.6 million due to the sale of eight skilled nursing/transitional care facilities. During the year ended
December 31, 2016
, we recognized an aggregate net loss on the sale of real estate of
$6.1 million
, which consisted of a $9.0 million loss related to the disposition of two skilled nursing/transitional care facilities and the Forest Park - Frisco hospital, offset by a gain of $2.9 million due to the sale of two skilled nursing/transitional care facilities. See Note 5, “Dispositions,” in the Notes to Consolidated Financial Statements for additional information.
41
Comparison of results of operations for the years ended
December 31, 2016
and
2015
(dollars in thousands):
|
For the Year Ended December 31,
|
Increase / (Decrease)
|
Percentage Difference
|
Variance due to Acquisitions, Originations and Dispositions
(1)
|
Remaining Variance
(2)
|
||||||||||||||||||
|
2016
|
2015
|
|||||||||||||||||||||
|
Revenues:
|
||||||||||||||||||||||
|
Rental income
|
$
|
225,275
|
|
$
|
209,851
|
|
$
|
15,424
|
|
7
|
%
|
$
|
16,859
|
|
$
|
(1,435
|
)
|
|||||
|
Interest and other income
|
27,463
|
|
25,505
|
|
1,958
|
|
8
|
%
|
2,968
|
|
(1,010
|
)
|
||||||||||
|
Resident fees and services
|
7,788
|
|
3,508
|
|
4,280
|
|
122
|
%
|
4,660
|
|
(380
|
)
|
||||||||||
|
Expenses:
|
||||||||||||||||||||||
|
Depreciation and amortization
|
68,472
|
|
63,079
|
|
5,393
|
|
9
|
%
|
5,046
|
|
347
|
|
||||||||||
|
Interest
|
64,873
|
|
59,218
|
|
5,655
|
|
10
|
%
|
—
|
|
5,655
|
|
||||||||||
|
Operating expenses
|
5,703
|
|
2,576
|
|
3,127
|
|
121
|
%
|
3,312
|
|
(185
|
)
|
||||||||||
|
General and administrative
|
17,672
|
|
16,093
|
|
1,579
|
|
10
|
%
|
—
|
|
1,579
|
|
||||||||||
|
Merger and acquisition costs
|
1,197
|
|
7,023
|
|
(5,826
|
)
|
(83
|
)%
|
(5,826
|
)
|
—
|
|
||||||||||
|
Provision for doubtful accounts and loan losses
|
5,543
|
|
12,842
|
|
(7,299
|
)
|
(57
|
)%
|
—
|
|
(7,299
|
)
|
||||||||||
|
Impairment of real estate
|
29,811
|
|
—
|
|
29,811
|
|
NM
|
|
29,811
|
|
—
|
|
||||||||||
|
Other income (expense):
|
||||||||||||||||||||||
|
Loss on extinguishment of debt
|
(556
|
)
|
—
|
|
(556
|
)
|
NM
|
|
—
|
|
(556
|
)
|
||||||||||
|
Other income
|
10,677
|
|
2,260
|
|
8,417
|
|
NM
|
|
—
|
|
8,417
|
|
||||||||||
|
Net loss on sales of real estate
|
(6,122
|
)
|
(161
|
)
|
(5,961
|
)
|
NM
|
|
(5,961
|
)
|
—
|
|
||||||||||
|
(1)
|
Represents the dollar amount increase (decrease) for the year ended
December 31, 2016
compared to the year ended
December 31, 2015
as a result of investments/dispositions made after
January 1, 2015
.
|
|
(2)
|
Represents the dollar amount increase (decrease) for the year ended
December 31, 2016
compared to the year ended
December 31, 2015
that is not a direct result of investments/dispositions made after
January 1, 2015
.
|
Rental Income
During the year ended
December 31, 2016
, we recognized
$225.3 million
of rental income compared to
$209.9 million
for the year ended
December 31, 2015
. The
$15.4 million
increase in rental income is primarily due to an increase of $28.3 million from properties acquired after
January 1, 2015
, offset by a decrease of $11.4 million from properties disposed of after
January 1, 2015
. The remaining decrease of $1.5 million is primarily due to the transitioning of one senior housing community to a new operator and the resulting modification of the lease. Amounts due under the terms of all of our lease agreements are subject to contractual increases, and contingent rental income may be derived from certain lease agreements. No material contingent rental income was derived during the years ended
December 31, 2016
and
2015
.
Interest and Other Income
Interest and other income primarily consists of income earned on our loans receivable investments and preferred returns earned on our preferred equity investments. During the year ended
December 31, 2016
, we recognized
$27.5 million
of interest and other income compared to
$25.5 million
for the year ended
December 31, 2015
. The
$2.0 million
increase is primarily due to interest income recognized at the default rate and late fees related to our investments in the Forest Park - Fort Worth construction loan and the Forest Park - Dallas mortgage loan during the year ended
December 31, 2016
. Both loans were repaid during the year ended
December 31, 2016
.
Resident Fees and Services
During the year ended
December 31, 2016
, we recognized
$7.8 million
of resident fees and services compared to
$3.5 million
for the year ended
December 31, 2015
. The increase of
$4.3 million
is due to the investment in one additional Senior Housing - Managed property in November 2015.
Depreciation and Amortization
During the year ended
December 31, 2016
, we incurred
$68.5 million
of depreciation and amortization expense compared to
$63.1 million
for the year ended
December 31, 2015
. The
$5.4 million
net increase in depreciation and amortization was primarily due to an increase of $9.7 million from properties acquired after
January 1, 2015
, partially offset by a decrease of $4.6 million from properties disposed of after
January 1, 2015
.
42
Interest Expense
We incur interest expense comprised of costs of borrowings plus the amortization of deferred financing costs related to our indebtedness. During the year ended
December 31, 2016
, we incurred
$64.9 million
of interest expense compared to
$59.2 million
for the year ended
December 31, 2015
. The
$5.7 million
net increase is primarily related to (i) a $3.0 million increase in interest expense related to our U.S. dollar term loan as a result of increasing U.S. dollar term loan borrowings from $200.0 million to $245.0 million, partially offset by a reduction in the interest rate from 3.03% to 2.85%, (ii) a $2.1 million increase in interest expense related to the Canadian dollar term loan as a result of increasing Canadian dollar term loan borrowings from CAD $90.0 million to CAD $125.0 million, partially offset by a reduction in the interest rate from 4.19% to 3.35% and (iii) a $1.4 million increase in interest expense primarily due to the increased average balance outstanding on secured debt borrowings. The increases are partially offset by a $0.8 million decrease in interest expense related to the borrowings outstanding on our Prior Revolving Credit Facility (as defined below).
Operating Expenses
During the year ended
December 31, 2016
, we recognized
$5.7 million
of operating expenses compared to
$2.6 million
for the year ended
December 31, 2015
. The increase of
$3.1 million
is due to the investment in a Senior Housing - Managed property in November 2015.
General and Administrative Expenses
General and administrative expenses include compensation-related expenses as well as professional services, office costs and other costs associated with asset management. During the year ended
December 31, 2016
, general and administrative expenses were
$17.7 million
compared to
$16.1 million
for the year ended
December 31, 2015
. The
$1.6 million
increase is primarily related to (i) a $1.4 million increase in stock-based compensation expense, (ii) a $0.7 million increase in legal and professional fees due to the increased number of investments and (iii) a $0.1 million increase in payroll related expenses due to the increased number of employees. The increases are partially offset by a $0.4 million decrease in facility operating expenses associated with transitioning two assets to new operators. The increase in stock-based compensation expense, from
$6.1 million
during the year ended
December 31, 2015
to
$7.5 million
during the year ended
December 31, 2016
, is primarily related to the change in our stock price during the year ended
December 31, 2016
(an increase of $4.19 per share) compared to the year ended
December 31, 2015
(a decrease of $10.14 per share). We issued stock to employees who elected to receive annual bonuses in stock rather than in cash, and therefore changes in our stock price will result in changes to our bonus expense.
Merger and Acquisition Costs
During the year ended
December 31, 2016
, we recognized merger and acquisition costs of
$1.2 million
compared to
$7.0 million
for the year ended
December 31, 2015
. The higher merger and acquisition costs during the year ended December 31, 2015 primarily related to the acquisitions of a portfolio of nine senior housing communities located in Canada and a portfolio of four skilled nursing/transitional care facilities located in Maryland.
Provision for Doubtful Accounts and Loan Losses
During the year ended
December 31, 2016
, we recognized
$5.5 million
in provision for doubtful accounts and loan losses. The
$5.5 million
provision is primarily due to a $3.5 million increase in reserves on straight-line rental income, $1.8 million related to an increase in loan loss reserves and a $0.5 million reserve for other tenant-related receivables, partially offset by a $0.3 million recovery on previously reserved cash rents. During the year ended
December 31, 2015
, we recognized
$12.8 million
in provision for doubtful accounts and loan losses. Of the
$12.8 million
provision, $8.2 million was due to reserves on rental income primarily related to our Forest Park - Frisco tenant. The remaining balance of $4.6 million related to loan loss reserves.
Impairment of Real Estate
During the year ended December 31, 2016, we recognized
$29.8 million
of impairment of real estate related to the sale of the Forest Park - Frisco hospital. No impairment of real estate was recognized during the year ended December 31, 2015.
Loss on Extinguishment of Debt
During the year ended
December 31, 2016
, we recognized
$0.6 million
of loss on extinguishment of debt related to write-offs of deferred financing costs in connection with amending the 2014 revolving credit facility and 2015 Canadian term loan. We did not recognize any loss on extinguishment of debt during the year ended
December 31, 2015
.
43
Other Income
During the year ended
December 31, 2016
, we recognized
$10.7 million
in other income. Of the
$10.7 million
of other income, $7.4 million is due to the amortization of lease termination payments related to a memorandum of understanding we entered into with Genesis regarding five Genesis facilities (of which
one
was owned as of
December 31, 2017
), $1.5 million relates to other income as a result of the net impact of adjusting the fair value of our contingent consideration arrangements related to the acquisition of a portfolio of real estate properties and two senior housing communities, $0.8 million relates to an ineffectiveness gain related to our LIBOR interest rate swaps, $0.4 million relates to the lease termination fee related to the sale of one skilled nursing/transitional care facility and $0.3 million relates to gain on the sale of 48 skilled nursing beds. During the year ended
December 31, 2015
, we recognized
$2.3 million
in other income due to a $1.6 million adjustment to the fair value of our contingent consideration liability primarily related to one acquisition of real estate properties and a $0.7 million gain upon consolidation of a variable interest entity.
Net Loss on Sales of Real Estate
During the year ended
December 31, 2016
, we recognized a net loss on the sale of real estate of
$6.1 million
, which consisted of a $9.0 million loss related to the disposition of two skilled nursing/transitional care facilities and the Forest Park - Frisco hospital, offset by a gain of $2.9 million due to the sale of two skilled nursing/transitional care facilities. During the year ended
December 31, 2015
, we recognized a net loss on the sale of real estate of
$0.2 million
made up of a $3.9 million loss related to the disposition of one skilled nursing facility, offset by a gain of $3.7 million related to the disposition of four skilled nursing/transitional care facilities.
Funds from Operations and Adjusted Funds from Operations
We believe that net income attributable to common stockholders as defined by GAAP is the most appropriate earnings measure. We also believe that funds from operations attributable to common stockholders (“FFO”), as defined in accordance with the definition used by the National Association of Real Estate Investment Trusts (“NAREIT”), and adjusted funds from operations attributable to common stockholders (“AFFO”) (and related per share amounts) are important non-GAAP supplemental measures of our operating performance. Because the historical cost accounting convention used for real estate assets requires straight-line depreciation (except on land), such accounting presentation implies that the value of real estate assets diminishes predictably over time. However, since real estate values have historically risen or fallen with market and other conditions, presentations of operating results for a REIT that uses historical cost accounting for depreciation could be less informative. Thus, NAREIT created FFO as a supplemental measure of operating performance for REITs that excludes historical cost depreciation and amortization, among other items, from net income attributable to common stockholders, as defined by GAAP. FFO is defined as net income attributable to common stockholders, computed in accordance with GAAP, excluding gains or losses from real estate dispositions, plus real estate depreciation and amortization, net of amounts related to noncontrolling interests, and real estate impairment charges. AFFO is defined as FFO excluding merger and acquisition costs, stock-based compensation expense, straight-line rental income adjustments, amortization of above and below market lease intangibles, non-cash interest income adjustments, non-cash interest expense, as well as other non-cash revenue and expense items (including non-cash portion of loss on extinguishment of debt, change in fair value of contingent consideration, provision for doubtful straight-line rental income, loan losses and other reserves, ineffectiveness gain/loss on derivative instruments, and non-cash revenue and expense amounts related to noncontrolling interests). We believe that the use of FFO and AFFO (and the related per share amounts), combined with the required GAAP presentations, improves the understanding of our operating results among investors and makes comparisons of operating results among REITs more meaningful. We consider FFO and AFFO to be useful measures for reviewing comparative operating and financial performance because, by excluding the applicable items listed above, FFO and AFFO can help investors compare our operating performance between periods or as compared to other companies. While FFO and AFFO are relevant and widely used measures of operating performance of REITs, they do not represent cash flows from operations or net income attributable to common stockholders as defined by GAAP and should not be considered an alternative to those measures in evaluating our liquidity or operating performance. FFO and AFFO also do not consider the costs associated with capital expenditures related to our real estate assets nor do they purport to be indicative of cash available to fund our future cash requirements. Further, our computation of FFO and AFFO may not be comparable to FFO and AFFO reported by other REITs that do not define FFO in accordance with the current NAREIT definition or that interpret the current NAREIT definition or define AFFO differently than we do.
44
The following table reconciles our calculations of FFO and AFFO for the
years
ended
December 31, 2017
,
2016
and
2015
, to net income attributable to common stockholders, the most directly comparable GAAP financial measure, for the same periods (in thousands, except share and per share amounts):
|
Year Ended December 31,
|
|||||||||||
|
2017
|
2016
|
2015
|
|||||||||
|
Net income attributable to common stockholders
|
$
|
148,141
|
|
$
|
60,034
|
|
$
|
69,171
|
|
||
|
Depreciation and amortization of real estate assets
|
113,882
|
|
68,472
|
|
63,079
|
|
|||||
|
Depreciation and amortization of real estate assets related to noncontrolling interests
|
(53
|
)
|
—
|
|
—
|
|
|||||
|
Net (gain) loss on sales of real estate
|
(52,029
|
)
|
6,122
|
|
161
|
|
|||||
|
Impairment of real estate
|
1,326
|
|
29,811
|
|
—
|
|
|||||
|
FFO attributable to common stockholders
|
211,267
|
|
164,439
|
|
132,411
|
|
|||||
|
Merger and acquisition costs
(1)
|
30,255
|
|
1,197
|
|
7,023
|
|
|||||
|
Stock-based compensation expense
|
7,017
|
|
7,496
|
|
6,123
|
|
|||||
|
Straight-line rental income adjustments
|
(29,440
|
)
|
(21,984
|
)
|
(24,320
|
)
|
|||||
|
Amortization of above and below market lease intangibles, net
|
(912
|
)
|
—
|
|
—
|
|
|||||
|
Non-cash interest income adjustments
|
(769
|
)
|
582
|
|
626
|
|
|||||
|
Non-cash interest expense
|
7,776
|
|
5,678
|
|
5,279
|
|
|||||
|
Non-cash portion of loss on extinguishment of debt
|
553
|
|
556
|
|
—
|
|
|||||
|
Change in fair value of contingent consideration
|
(426
|
)
|
(1,526
|
)
|
(1,550
|
)
|
|||||
|
Provision for doubtful straight-line rental income, loan losses and other reserves
|
16,854
|
|
5,833
|
|
9,031
|
|
|||||
|
Other non-cash adjustments
(2)
|
103
|
|
(806
|
)
|
(710
|
)
|
|||||
|
AFFO attributable to common stockholders
|
$
|
242,278
|
|
$
|
161,465
|
|
$
|
133,913
|
|
||
|
|
|||||||||||
|
FFO attributable to common stockholders per diluted common share
|
$
|
2.00
|
|
$
|
2.51
|
|
$
|
2.12
|
|
||
|
|
|
|
|||||||||
|
AFFO attributable to common stockholders per diluted common share
|
$
|
2.28
|
|
$
|
2.45
|
|
$
|
2.14
|
|
||
|
|
|||||||||||
|
Weighted average number of common shares outstanding, diluted:
|
|||||||||||
|
FFO attributable to common stockholders
|
105,842,434
|
|
65,520,672
|
|
62,460,239
|
|
|||||
|
|
|||||||||||
|
AFFO attributable to common stockholders
|
106,074,862
|
|
65,904,435
|
|
62,659,935
|
|
|||||
|
|
|||||||||||
|
(1)
|
Merger and acquisition costs incurred during the year ended
December 31, 2017
primarily relate to the CCP Merger. Merger and acquisition costs include
$1.4 million
of stock-based compensation expense related to former CCP employees.
|
|
(2)
|
Other non-cash adjustments include ineffectiveness gain/loss on derivative instruments and other non-cash income/loss.
|
Set forth below is additional information related to certain other items included in FFO and AFFO attributable to common stockholders above, which may be helpful in assessing our operating results. Please see the accompanying consolidated statement of cash flows for details of our operating, investing, and financing cash activities.
Significant Items Included in FFO and AFFO Attributable to Common Stockholders
:
|
•
|
During the year ended
December 31, 2017
, we incurred
$30.3 million
of merger and acquisition costs, primarily in connection with the CCP Merger. This entire amount is included in FFO for the year ended
December 31, 2017
.
|
|
•
|
During the year ended
December 31, 2017
, we incurred
$5.5 million
of transition expenses in connection with the CCP Merger primarily consisting of salaries and severance benefits. This entire amount is included in FFO and AFFO for the year ended
December 31, 2017
.
|
|
•
|
During the year ended
December 31, 2017
, we recognized
$17.1 million
in provision for doubtful accounts. Loan loss reserves increased by $4.5 million, reserves on straight-line rental income increased by $10.5 million, reserves for other tenant-related receivables increased $1.8 million and reserves for interest income increased by $0.3 million during the year ended
December 31, 2017
. These amounts in their entirety are included in FFO for the year ended
December 31, 2017
and $0.3 million is included in AFFO for the year ended
December 31, 2017
.
|
|
•
|
During the year ended
December 31, 2017
, we incurred
$0.6 million
of loss on extinguishment of debt related to write-offs of deferred financing costs in connection with amending the Prior Credit Facility. This entire amount is included in FFO for the year ended
December 31, 2017
.
|
45
|
•
|
During the year ended
December 31, 2017
, we recognized
$3.2 million
of other income. Other income primarily includes
$2.6 million
related to the amortization of lease termination payments related to a memorandum of understanding entered into with Genesis regarding five Genesis facilities (of which
one
was owned as of
December 31, 2017
) and
$0.4 million
related to adjusting the fair value of our contingent consideration liability related to the acquisition of a senior housing community. These amounts in their entirety are included in FFO for the year ended
December 31, 2017
, and $2.8 million is included in AFFO for the year ended
December 31, 2017
.
|
|
•
|
During the year ended
December 31, 2016
, we incurred
$1.2 million
of merger and acquisition costs, including $0.6 million of costs not typically incurred related to the acquisition of one skilled nursing/transitional care facility. This entire amount is included in FFO for the year ended
December 31, 2016
.
|
|
•
|
During the year ended
December 31, 2016
, we recognized
$5.5 million
in provision for doubtful accounts. Reserves on cash rents decreased by $0.3 million, reserves for other tenant-related receivables increased $0.5 million, reserves on straight-line rental income increased by $3.5 million, and reserves on loan losses increased by $1.8 million. These amounts in their entirety are included in FFO for the year ended
December 31, 2016
, and $0.3 million is included in AFFO for the year ended
December 31, 2016
.
|
|
•
|
During the year ended
December 31, 2016
, we incurred
$0.6 million
of loss on extinguishment of debt related to write-offs of deferred financing costs in connection with amending the 2014 revolving credit facility and the 2015 Canadian term loan. This entire amount is included in FFO for the year ended
December 31, 2016
.
|
|
•
|
During the year ended
December 31, 2016
, we recognized
$10.7 million
of other income. Of the $10.7 million, $7.7 million is due to lease termination payments related to two tenants, $1.5 million is due to adjusting the fair value of our contingent consideration arrangements related to three acquisitions of real estate properties, $0.8 million relates to an ineffectiveness gain related to our LIBOR interest rate swaps and $0.3 million is due to the gain on sale of 48 skilled nursing beds. This entire amount is included in FFO for the year ended
December 31, 2016
, and $8.3 million is included in AFFO for the year ended
December 31, 2016
.
|
|
•
|
During the year ended
December 31, 2015
, we recognized $0.4 million of facility operating expenses associated with transitioning two assets to new operators. This entire amount is included in FFO and AFFO for the year ended
December 31, 2015
.
|
|
•
|
During the year ended
December 31, 2015
, we incurred
$7.0 million
of merger and acquisition costs, including $4.8 million of costs not typically incurred related to the acquisitions of a portfolio of nine senior housing communities located in Canada and a portfolio of four skilled nursing/transitional care facilities located in Maryland. This entire amount is included in FFO for the year ended
December 31, 2015
.
|
|
•
|
During the year ended
December 31, 2015
, we recognized
$12.8 million
in provision for doubtful accounts. Of the $12.8 million provision, $8.2 million is due to reserves on rental income primarily related to our Forest Park - Frisco tenant. The remaining balance of $4.6 million relates to loan loss reserves. This entire amount is included in FFO for the year ended
December 31, 2015
, and $3.8 million is included in AFFO for the year ended
December 31, 2015
.
|
|
•
|
During the year ended
December 31, 2015
, we recognized $1.6 million of other income primarily as a result of adjusting the fair value of our contingent consideration liability related to two acquisitions of real estate properties. This entire amount is included in FFO for the year ended
December 31, 2015
.
|
Liquidity and Capital Resources
As of
December 31, 2017
, we had approximately
$877.4 million
in liquidity, consisting of unrestricted cash and cash equivalents of
$518.4 million
(excluding joint venture cash and cash equivalents), and available borrowings under our Revolving Credit Facility of
$359.0 million
. The Credit Facility also contains an accordion feature that can increase the total available borrowings to
$2.5 billion
(from U.S.
$2.1 billion
plus CAD
$125 million
), subject to terms and conditions. Subsequent to December 31, 2017, we closed on our investment in the Enlivant Joint Venture and on our acquisitions of 11 senior housing communities under the Senior Housing - Managed structure that are operated by Enlivant pursuant to property management agreements and two additional skilled nursing/transitional care facilities, and we funded these closings using
$515.8 million
of cash and
$18.0 million
of proceeds from our Revolving Credit Facility.
We have filed a shelf registration statement with the SEC that expires in January 2020, which allows us to offer and sell shares of common stock, preferred stock, warrants, rights, units, and certain of our subsidiaries to offer and sell debt securities, through underwriters, dealers or agents or directly to purchasers, on a continuous or delayed basis, in amounts, at prices and on terms we determine at the time of the offering, subject to market conditions.
46
On September 28, 2017, we completed an underwritten public offering of
16.0 million
newly issued shares of our common stock pursuant to an effective registration statement. The underwriters exercised their option to purchase additional shares, and on October 2, 2017, we issued an additional
2.4 million
newly issued shares of our common stock pursuant to an effective registration statement. We received net proceeds, before expenses, of
$370.9 million
from the offering, after giving effect to the issuance and sale of all
18.4 million
shares of common stock, at a price of
$21.00
per share. These proceeds were used to repay borrowings outstanding under our Revolving Credit Facility.
We believe that our available cash, operating cash flows and borrowings available to us under our Revolving Credit Facility provide sufficient funds for our operations, scheduled debt service payments with respect to our Senior Notes, secured indebtedness on our properties, and dividend requirements for the next twelve months. In addition, we do not believe that the restrictions under our Senior Notes Indentures significantly limit our ability to use our available liquidity for these purposes.
We intend to invest in additional healthcare properties as suitable opportunities arise and adequate sources of financing are available. We expect that future investments in properties, including any improvements or renovations of current or newly-acquired properties, will depend on and will be financed, in whole or in part, by our existing cash, borrowings available to us under our Revolving Credit Facility, future borrowings or the proceeds from issuances of common stock, preferred stock, debt or other securities. In addition, we may seek financing from U.S. government agencies, including through Fannie Mae and HUD, in appropriate circumstances in connection with acquisitions.
Cash Flows from Operating Activities
Net cash provided by operating activities was
$133.5 million
for the year ended
December 31, 2017
. Operating cash inflows were derived primarily from the rental payments received under our lease agreements and interest payments from borrowers under our loan investments. Operating cash outflows consisted primarily of interest payments on borrowings and payment of merger and acquisition costs both incurred and assumed in connection with the CCP Merger and general and administrative expenses, including corporate overhead. In addition, we used the $77.9 million of cash acquired in the CCP Merger for payments on the assumed merger and acquisition costs and additional liabilities assumed. We expect our annualized cash flows provided by operating activities to increase as a result of the CCP Merger and other completed and anticipated future real estate investments.
Cash Flows from Investing Activities
During the year ended
December 31, 2017
, net cash used in investing activities was
$240.1 million
and consisted of
$419.9 million
used in the acquisition of
22
skilled nursing/transitional care facilities and
two
senior housing communities,
$17.2 million
used to provide additional funding for existing loans receivable,
$2.7 million
used to fund preferred equity investments and
$7.0 million
used for tenant improvements, partially offset by
$92.7 million
in sales proceeds related to the disposition of
31
skilled nursing/transitional care facilities and
one
senior housing community,
$77.9 million
in cash acquired in the CCP Merger,
$32.4 million
in repayments of loans receivable and
$3.8 million
in repayments of preferred equity investments.
We expect to continue using available liquidity in connection with anticipated future real estate investments, loan originations and preferred equity investments.
Cash Flows from Financing Activities
During the year ended
December 31, 2017
, net cash provided by financing activities was
$598.8 million
and included
$366.8 million
in net proceeds from the common stock offering less payroll tax payments related to the issuance of common stock pursuant to equity compensation arrangements, net borrowings on our Revolving Credit Facility of
$253.0 million
and
$181.0 million
in proceeds from U.S. dollar term loans, partially offset by
$182.1 million
of dividends paid to stockholders,
$15.3 million
of payments for deferred financing costs primarily associated with the new Credit Facility and
$4.1 million
of principal repayments of secured debt.
Loan Agreements
2021 Notes
. On January 23, 2014, the Operating Partnership and Sabra Capital Corporation, wholly owned subsidiaries of Sabra (the “Issuers”), issued $350.0 million aggregate principal amount of 5.5% senior unsecured notes due 2021 (the “Original 2021 Notes”), providing net proceeds of approximately $340.8 million after deducting underwriting discounts and other offering expenses. On October 10, 2014, the Issuers issued an additional $150.0 million aggregate principal amount of 5.5% senior unsecured notes due 2021 (together with the Original 2021 Notes, the “2021 Notes”), providing net proceeds of approximately $145.6 million (not including pre-issuance accrued interest), after deducting underwriting discounts and other offering expenses and a yield-to-maturity of 5.593%.
47
2023 Notes
. On May 23, 2013, the Issuers issued $200.0 million aggregate principal amount of 5.375% senior notes due 2023 (the “2023 Notes”), providing net proceeds of approximately $194.6 million after deducting underwriting discounts and other offering expenses.
2026 and 2027 Notes.
In connection with the CCP Merger, on August 17, 2017, Sabra assumed $500 million aggregate principal amount of
5.125%
senior notes due 2026 (the “2026 Notes”) and $100 million aggregate principal amount of
5.38%
senior notes due 2027 (the “2027 Notes” and, together with the 2021 Notes, the 2023 Notes and the 2026 Notes, the “Senior Notes”).
See Note 8, “Debt,” in the Notes to Consolidated Financial Statements for additional information concerning the Senior Notes, including information regarding the indentures and agreements governing the Senior Notes (the “Senior Notes Indentures”). As of
December 31, 2017
, we were in compliance with all applicable covenants under the Senior Notes Indentures.
Credit Facility.
On January 14, 2016, the Operating Partnership and Sabra Canadian Holdings, LLC (together, the “Borrowers”) entered into a third amended and restated unsecured credit facility (the “Prior Credit Facility”).
The Prior Credit Facility included a revolving credit facility (the “Prior Revolving Credit Facility”) and U.S. dollar and Canadian dollar term loans (collectively, the “Prior Term Loans”). The Prior Revolving Credit Facility provided for a borrowing capacity of
$500.0 million
and, in addition, provided for U.S. dollar and Canadian dollar term loans of
$245.0 million
and CAD
$125.0 million
, respectively. Further, up to
$125.0 million
of the Prior Revolving Credit Facility could be used for borrowings in certain foreign currencies. The Prior Credit Facility also contained an accordion feature that allowed for an increase in the total available borrowings to
$1.25 billion
, subject to terms and conditions.
Effective on August 17, 2017, the Borrowers, Sabra and the other parties thereto entered into a fourth amended and restated unsecured credit facility (the “Credit Facility”). The Credit Facility amends and restates the Prior Credit Facility.
The Credit Facility includes a
$1.0 billion
revolving credit facility (the “Revolving Credit Facility”),
$1.1 billion
in U.S. dollar term loans and a CAD
$125.0 million
Canadian dollar term loan (collectively, the “Term Loans”). Further, up to
$175.0 million
of the Revolving Credit Facility may be used for borrowings in certain foreign currencies. The Credit Facility also contains an accordion feature that can increase the total available borrowings to
$2.5 billion
, subject to terms and conditions.
The obligations of the Borrowers under the Credit Facility are guaranteed by us and certain of our subsidiaries.
See Note 8, “Debt,” in the Notes to Consolidated Financial Statements for additional information concerning the Credit Facility, including information regarding covenants contained in the Credit Facility. As of
December 31, 2017
, we were in compliance with all applicable covenants under the Credit Facility.
Secured Indebtedness
Of our
507
properties held for investment,
30
are subject to secured debt to third parties that, as of
December 31, 2017
, totaled approximately $
259.2 million
. As of
December 31, 2017
and
December 31, 2016
, our secured debt consisted of the following (dollars in thousands):
|
Interest Rate Type
|
Principal as of
December 31, 2017 (1) |
Principal as of
December 31, 2016 (1) |
Weighted Average Effective Interest Rate at
December 31, 2017 (2) |
Maturity Date
|
||||||||
|
Fixed Rate
|
$
|
160,702
|
|
$
|
163,638
|
|
3.87
|
%
|
December 2021 -
August 2051 |
|||
|
Variable Rate
|
98,500
|
|
—
|
|
3.36
|
%
|
July 2019
|
|||||
|
$
|
259,202
|
|
$
|
163,638
|
|
3.68
|
%
|
|||||
|
(1)
|
Principal balance does not include deferred financing costs, net of
$2.8 million
and
$2.9 million
as of
December 31, 2017
and
2016
, respectively.
|
|
(2)
|
Weighted average effective rate includes private mortgage insurance.
|
On August 17, 2017, in connection with the CCP Merger, we assumed a
$98.5 million
secured term loan that bears interest at
LIBOR plus 1.80%
and matures in
July 2019
.
Capital Expenditures
For the years ended
December 31, 2017
,
2016
and
2015
, our aggregate capital expenditures were
$7.0 million
,
$1.0 million
, and
$3.7 million
, respectively. The capital expenditures for the years ended
December 31, 2017
,
2016
and
2015
, include $0.2 million, $0.1 million and $35,000, respectively, of capital expenditures for corporate office needs. There are no
48
present plans for the improvement or development of any unimproved or undeveloped property; however, from time to time we may agree to fund improvements our tenants make at our facilities. Accordingly, we anticipate that our aggregate capital expenditure requirements for the next 12 months will not exceed $66.0 million, and that such expenditures will principally be for improvements to our facilities and result in incremental rental income.
Dividends
We paid dividends of
$182.1 million
on our common and preferred stock during the year ended
December 31, 2017
. On
February 5, 2018
, our board of directors declared a quarterly cash dividend of
$0.45
per share of common stock. The dividend will be paid on
February 28, 2018
to stockholders of record as of
February 15, 2018
. Also, on
February 5, 2018
, our board of directors declared a quarterly cash dividend of
$0.4453125
per share of Series A Preferred Stock. The dividend will be paid on
February 28, 2018
to stockholders of record as of the close of business on
February 15, 2018
.
Concentration of Credit Risk
Concentrations of credit risk arise when a number of operators, tenants or obligors related to our investments are engaged in similar business activities, or activities in the same geographic region, or have similar economic features that would cause their ability to meet contractual obligations, including those to us, to be similarly affected by changes in economic conditions. We regularly monitor our portfolio to assess potential concentrations of risks.
Management believes our current portfolio is reasonably diversified across healthcare related real estate and geographical location and does not contain any other significant concentration of credit risks. Our portfolio of
507
real estate properties held for investment as of
December 31, 2017
is diversified by location across the U.S. and Canada.
The following table provides information regarding significant tenant relationships representing 10% or more of our total revenues for the year ended
December 31, 2017
(dollars in thousands):
|
As of December 31, 2017
|
For the year ended December 31, 2017
|
|||||||||||
|
Number of Investments
|
% of Total Assets
|
% of Total Investments
(1)
|
% of Total Revenues
|
|||||||||
|
Genesis Healthcare, Inc.
|
54
|
|
3.5
|
%
|
5.9
|
%
|
19.8
|
%
|
||||
Skilled Nursing Facility Reimbursement Rates
For the year ended
December 31, 2017
, 62.8% of our revenues was derived directly or indirectly from skilled nursing/transitional care facilities. Medicare reimburses skilled nursing facilities for Medicare Part A services under the Prospective Payment System (“PPS”), as implemented pursuant to the Balanced Budget Act of 1997 and modified pursuant to subsequent laws, most recently the Patient Protection and Affordable Care Act of 2010. PPS regulations predetermine a payment amount per patient, per day, based on a market basket index calculated for all covered costs. The amount to be paid is determined by classifying each patient into one of 66 Resource Utilization Group (“RUG”) categories that represent the level of services required to treat different conditions and levels of acuity.
The current system of 66 RUG categories, or Resource Utilization Group version IV (“RUG IV”), became effective as of October 1, 2010. RUG IV resulted from research performed by CMS and was part of CMS’s continuing effort to increase the correlation of the cost of services to the condition of individual patients.
On February 9, 2018, the President signed a two-year budget deal that includes a 10-year, $2 billion cut to skilled nursing facility Medicare reimbursement. Instead of providers receiving their regular annual Medicare market basket update from CMS in 2019, the new spending package freezes the reimbursement increases at 2.4%. The exact rate will not be known until CMS releases proposed rules on May 1, 2018.
On July 31, 2017, CMS released final fiscal year 2018 Medicare rates for skilled nursing facilities providing an estimated net increase of 1.0% over fiscal year 2017 payments. The new payment rates became effective on October 1, 2017. In its final rule, CMS also revised and rebased the market basket index by updating the base year from fiscal year 2010 to fiscal year 2014.
On July 29, 2016, CMS released final fiscal year 2017 Medicare rates for skilled nursing facilities providing a net increase of 2.4% over fiscal year 2016 payments (comprised of a market basket increase of 2.7% less the productivity adjustment of 0.3%). The new payment rates became effective on October 1, 2016.
On November 16, 2015, CMS finalized the Comprehensive Care for Joint Replacement model, which began on April 1, 2016 and holds hospitals accountable for the quality of care they deliver to Medicare fee-for-service beneficiaries for hip and
49
knee replacements and/or other major leg procedures from surgery through recovery. Through this payment model, hospitals in 67 geographic areas receive additional payments if quality and spending performance are strong or, if not, potentially have to repay Medicare for a portion of the spending for care surrounding a lower extremity joint replacement (LEJR) procedure. As a result, Medicare revenues derived at skilled nursing facilities related to lower
extremity joint replacement hospital discharges could be positively or negatively impacted in those geographic areas identified by CMS for mandatory participation in the bundled payment program.
Obligations and Commitments
The following table summarizes our contractual obligations and commitments in future years, including our secured indebtedness to third parties on certain of our properties, our Revolving Credit Facility, our Term Loans, our Senior Notes and our operating leases. The following table is presented as of
December 31, 2017
(in thousands):
|
|
|
Payments Due During the Years Ending December 31,
|
|||||||||||||||||||||||||
|
|
Total
|
2018
|
2019
|
2020
|
2021
|
2022
|
After 2022
|
||||||||||||||||||||
|
Secured indebtedness
(1)
|
$
|
341,553
|
|
$
|
13,136
|
|
$
|
110,154
|
|
$
|
9,777
|
|
$
|
25,511
|
|
$
|
8,581
|
|
$
|
174,394
|
|
||||||
|
Revolving Credit Facility
(2)
|
716,596
|
|
20,825
|
|
20,825
|
|
20,881
|
|
654,065
|
|
—
|
|
—
|
|
|||||||||||||
|
Term Loans
(3)
|
1,341,854
|
|
33,270
|
|
33,270
|
|
231,167
|
|
27,381
|
|
1,016,766
|
|
—
|
|
|||||||||||||
|
Senior Notes
(4)
|
1,737,110
|
|
69,255
|
|
69,255
|
|
69,255
|
|
555,505
|
|
41,755
|
|
932,085
|
|
|||||||||||||
|
Operating leases
|
3,970
|
|
651
|
|
440
|
|
426
|
|
445
|
|
467
|
|
1,541
|
|
|||||||||||||
|
Total
|
$
|
4,141,083
|
|
$
|
137,137
|
|
$
|
233,944
|
|
$
|
331,506
|
|
$
|
1,262,907
|
|
$
|
1,067,569
|
|
$
|
1,108,020
|
|
||||||
|
(1)
|
Secured indebtedness includes principal payments and interest payments through the applicable maturity dates. Total interest on secured indebtedness, based on contractual rates, is $82.4 million, of which $5.2 million is attributable to variable rate debt.
|
|
(2)
|
Revolving Credit Facility includes payments related to the facility fee due to the lenders based on the amount of commitments under the Revolving Credit Facility and also includes interest payments through the maturity date (assuming no exercise of our two six-month extension options). Total interest on the Revolving Credit Facility is $75.6 million.
|
|
(3)
|
Term Loans includes interest payments through the applicable maturity dates totaling $142.3 million.
|
|
(4)
|
Senior Notes includes interest payments through the applicable maturity dates totaling $437.1 million
|
In addition to the above, as of
December 31, 2017
, we have committed to provide up to $12.8 million of future funding related to five loans receivable investments. These loans receivable investments have maturity dates ranging from January 2018 to February 2027.
Impact of Inflation
Our rental income in future years will be impacted by changes in inflation. Several of our lease agreements provide for an annual rent escalator based on the percentage change in the Consumer Price Index (but not less than zero), subject to minimum or maximum fixed percentages that range from 1.0% to 3.5%. Our lease agreements with subsidiaries of Genesis provide for a fixed 2.5% annual rent escalator.
Off-Balance Sheet Arrangements
None.
50
Quarterly Financial Data
The following table presents our quarterly financial data. This information has been prepared on a basis consistent with that of our audited consolidated financial statements. Our quarterly results of operations for the periods presented are not necessarily indicative of future results of operations. This unaudited quarterly data should be read together with the accompanying consolidated financial statements and related notes thereto (in thousands, except share and per share amounts).
|
For the Year Ended December 31, 2017
|
||||||||||||||||
|
First
Quarter
|
Second
Quarter
|
Third
Quarter
|
Fourth
Quarter
|
|||||||||||||
|
Operating data
|
||||||||||||||||
|
Total revenues
|
$
|
62,650
|
|
$
|
64,736
|
|
$
|
111,789
|
|
$
|
166,472
|
|
||||
|
Net income attributable to common stockholders
|
16,262
|
|
17,960
|
|
12,534
|
|
101,385
|
|
||||||||
|
Net income per common share-basic
|
0.25
|
|
0.27
|
|
0.11
|
|
0.57
|
|
||||||||
|
Net income per common share-diluted
|
0.25
|
|
0.27
|
|
0.11
|
|
0.57
|
|
||||||||
|
Other data
|
||||||||||||||||
|
Cash flows provided by (used in) operations
|
$
|
31,438
|
|
$
|
22,433
|
|
$
|
(4,100
|
)
|
$
|
83,715
|
|
||||
|
Cash flows (used in) provided by investing activities
|
(961
|
)
|
(5,380
|
)
|
(296,781
|
)
|
63,050
|
|
||||||||
|
Cash flows (used in) provided by financing activities
|
(43,347
|
)
|
(16,741
|
)
|
317,891
|
|
341,014
|
|
||||||||
|
Weighted-average number of common shares outstanding, basic
|
65,354,649
|
|
65,438,739
|
|
112,149,638
|
|
178,234,481
|
|
||||||||
|
Weighted-average number of common shares outstanding, diluted:
|
||||||||||||||||
|
Net income and FFO
|
65,920,486
|
|
65,670,853
|
|
112,418,100
|
|
178,428,200
|
|
||||||||
|
AFFO
|
66,325,908
|
|
65,985,940
|
|
112,693,779
|
|
178,647,299
|
|
||||||||
|
FFO attributable to common stockholders
(1)
|
$
|
35,399
|
|
$
|
31,148
|
|
$
|
37,877
|
|
$
|
106,843
|
|
||||
|
FFO attributable to common stockholders per diluted common share
(1)
|
0.54
|
|
0.47
|
|
0.34
|
|
0.60
|
|
||||||||
|
AFFO attributable to common stockholders
(1)
|
36,187
|
|
36,134
|
|
63,387
|
|
106,570
|
|
||||||||
|
AFFO attributable to common stockholder per diluted common share
(1)
|
0.55
|
|
0.55
|
|
0.56
|
|
0.60
|
|
||||||||
|
Reconciliation of FFO and AFFO
|
||||||||||||||||
|
Net income attributable to common stockholders
|
$
|
16,262
|
|
$
|
17,960
|
|
$
|
12,534
|
|
$
|
101,385
|
|
||||
|
Add:
|
||||||||||||||||
|
Depreciation of real estate assets
|
19,137
|
|
17,220
|
|
25,933
|
|
51,592
|
|
||||||||
|
Depreciation and amortization of real estate assets related to noncontrolling interests
|
—
|
|
—
|
|
(8
|
)
|
(45
|
)
|
||||||||
|
Net gain on sale of real estate
|
—
|
|
(4,032
|
)
|
(582
|
)
|
(47,415
|
)
|
||||||||
|
Impairment of real estate
|
—
|
|
—
|
|
—
|
|
1,326
|
|
||||||||
|
FFO attributable to common stockholders
|
35,399
|
|
31,148
|
|
37,877
|
|
106,843
|
|
||||||||
|
Merger and acquisition costs
(2)
|
563
|
|
5,888
|
|
23,299
|
|
505
|
|
||||||||
|
Stock-based compensation expense
|
2,588
|
|
1,731
|
|
2,669
|
|
29
|
|
||||||||
|
Straight-line rental income adjustments
|
(4,607
|
)
|
(4,971
|
)
|
(8,682
|
)
|
(11,180
|
)
|
||||||||
|
Amortization of above and below market lease intangibles, net
|
—
|
|
—
|
|
637
|
|
(1,549
|
)
|
||||||||
|
Non-cash interest income adjustments
|
26
|
|
25
|
|
(188
|
)
|
(632
|
)
|
||||||||
|
Non-cash interest expense
|
1,590
|
|
1,654
|
|
2,044
|
|
2,488
|
|
||||||||
|
Non-cash portion of loss on extinguishment of debt
|
—
|
|
—
|
|
553
|
|
—
|
|
||||||||
|
Change in fair value of contingent consideration
|
(822
|
)
|
—
|
|
270
|
|
126
|
|
||||||||
|
Provision for doubtful straight-line rental income, loan losses and other reserves
|
1,390
|
|
534
|
|
4,886
|
|
10,044
|
|
||||||||
|
Other non-cash adjustments
(3)
|
60
|
|
125
|
|
22
|
|
(104
|
)
|
||||||||
|
AFFO attributable to common stockholders
|
$
|
36,187
|
|
$
|
36,134
|
|
$
|
63,387
|
|
$
|
106,570
|
|
||||
51
|
For the Year Ended December 31, 2016
|
||||||||||||||||
|
First
Quarter
|
Second
Quarter
|
Third
Quarter
|
Fourth
Quarter
|
|||||||||||||
|
Operating data
|
||||||||||||||||
|
Total revenues
|
$
|
62,559
|
|
$
|
74,249
|
|
$
|
61,927
|
|
$
|
61,791
|
|
||||
|
Net (loss) income attributable to common stockholders
|
(18,272
|
)
|
34,915
|
|
22,776
|
|
20,615
|
|
||||||||
|
Net (loss) income per common share-basic
|
(0.28
|
)
|
0.53
|
|
0.35
|
|
0.32
|
|
||||||||
|
Net (loss) income per common share-diluted
|
(0.28
|
)
|
0.53
|
|
0.35
|
|
0.31
|
|
||||||||
|
Other data
|
||||||||||||||||
|
Cash flows provided by operations
|
$
|
24,726
|
|
$
|
69,768
|
|
$
|
39,322
|
|
$
|
42,923
|
|
||||
|
Cash flows provided by (used in) investing activities
|
1,964
|
|
254,056
|
|
(82,467
|
)
|
(31,190
|
)
|
||||||||
|
Cash flows used in financing activities
|
(25,122
|
)
|
(229,086
|
)
|
(41,693
|
)
|
(4,997
|
)
|
||||||||
|
Weighted-average number of common shares outstanding, basic
|
65,248,203
|
|
65,303,057
|
|
65,312,288
|
|
65,286,722
|
|
||||||||
|
Weighted-average number of common shares outstanding, diluted:
|
||||||||||||||||
|
Net income
|
65,248,203
|
|
65,503,383
|
|
65,591,428
|
|
65,671,345
|
|
||||||||
|
FFO
|
65,414,703
|
|
65,503,383
|
|
65,591,428
|
|
65,671,345
|
|
||||||||
|
AFFO
|
65,825,187
|
|
65,784,776
|
|
65,872,688
|
|
65,923,624
|
|
||||||||
|
FFO attributable to common stockholders
(1)
|
$
|
33,907
|
|
$
|
51,372
|
|
$
|
38,427
|
|
$
|
40,733
|
|
||||
|
FFO attributable to common stockholders per diluted common share
(1)
|
0.52
|
|
0.78
|
|
0.59
|
|
0.62
|
|
||||||||
|
AFFO attributable to common stockholders
(1)
|
34,825
|
|
49,423
|
|
38,449
|
|
38,768
|
|
||||||||
|
AFFO attributable to common stockholder per diluted common share
(1)
|
0.53
|
|
0.75
|
|
0.58
|
|
0.59
|
|
||||||||
|
Reconciliation of FFO and AFFO
|
||||||||||||||||
|
Net (loss) income attributable to common stockholders
|
$
|
(18,272
|
)
|
$
|
34,915
|
|
$
|
22,776
|
|
$
|
20,615
|
|
||||
|
Add:
|
||||||||||||||||
|
Depreciation of real estate assets
|
17,766
|
|
16,405
|
|
17,102
|
|
17,199
|
|
||||||||
|
Net loss (gain) on sale of real estate
|
4,602
|
|
52
|
|
(1,451
|
)
|
2,919
|
|
||||||||
|
Impairment of real estate
|
29,811
|
|
—
|
|
—
|
|
—
|
|
||||||||
|
FFO attributable to common stockholders
|
33,907
|
|
51,372
|
|
38,427
|
|
40,733
|
|
||||||||
|
Merger and acquisition costs
|
89
|
|
82
|
|
1,051
|
|
(25
|
)
|
||||||||
|
Stock-based compensation expense
|
1,818
|
|
1,834
|
|
2,485
|
|
1,359
|
|
||||||||
|
Straight-line rental income adjustments
|
(5,593
|
)
|
(5,524
|
)
|
(5,593
|
)
|
(5,274
|
)
|
||||||||
|
Non-cash interest income adjustments
|
222
|
|
221
|
|
106
|
|
33
|
|
||||||||
|
Non-cash interest expense
|
1,303
|
|
1,396
|
|
1,454
|
|
1,525
|
|
||||||||
|
Non-cash portion of loss on extinguishment of debt
|
556
|
|
—
|
|
—
|
|
—
|
|
||||||||
|
Change in fair value of contingent consideration
|
—
|
|
(50
|
)
|
100
|
|
(1,576
|
)
|
||||||||
|
Provision for doubtful straight-line rental income, loan losses and other reserves
|
2,523
|
|
92
|
|
830
|
|
2,388
|
|
||||||||
|
Other non-cash adjustments
(3)
|
—
|
|
—
|
|
(411
|
)
|
(395
|
)
|
||||||||
|
AFFO attributable to common stockholders
|
$
|
34,825
|
|
$
|
49,423
|
|
$
|
38,449
|
|
$
|
38,768
|
|
||||
|
(1)
|
We believe that net income attributable to common stockholders as defined by GAAP is the most appropriate earnings measure. We also believe that funds from operations attributable to common stockholders (“FFO”), as defined in accordance with the definition used by the National Association of Real Estate Investment Trusts (“NAREIT”), and adjusted funds from operations attributable to common stockholders (“AFFO”) (and related per share amounts) are important non-GAAP supplemental measures of operating performance. We consider FFO and AFFO to be useful measures for reviewing comparative operating and financial performance because, by excluding gains or losses from real estate dispositions, real estate depreciation and amortization, net of amounts related to noncontrolling interests, real estate impairment charges, and for AFFO, by excluding merger and acquisition costs, stock-based compensation expense, straight-line rental income adjustments, amortization of above and below market lease intangibles, net, non-cash interest income adjustments, non-cash interest expense, as well as other non-cash revenue and expense items (including non-cash portion of loss on extinguishment of debt, change in fair value of contingent consideration, provision for doubtful straight-line rental income, loan losses and other reserves, ineffectiveness gain/loss on derivative instruments, and non-cash revenue and expense amounts related to noncontrolling interests), FFO and AFFO can help investors compare our operating performance between periods or as compared to other companies. See “—Results of Operations—Funds from Operations and Adjusted Funds from Operations” for further discussion of FFO and AFFO.
|
52
|
(2)
|
Merger and acquisition costs incurred during the year ended
December 31, 2017
primarily relate to the CCP Merger. Merger and acquisition costs include
$1.4 million
of stock-based compensation expense related to former CCP employees.
|
|
(3)
|
Other non-cash adjustments include ineffectiveness gain/loss on derivative instruments and other non-cash income/loss.
|
We are exposed to various market risks, primarily related to adverse changes in interest rates and the exchange rate for Canadian dollars. We use derivative instruments in the normal course of business to mitigate interest rate and foreign currency risk. We do not use derivative financial instruments for speculative or trading purposes. See Note 9, “Derivative and Hedging Instruments,” in the Notes to Consolidated Financial Statements for further discussion of our derivative instruments.
Interest rate risk.
As of
December 31, 2017
, our indebtedness included
$1.3 billion
aggregate principal amount of Senior Notes outstanding,
$259.2 million
of secured indebtedness to third parties on certain of the properties that our subsidiaries own,
$1.2 billion
in Term Loans and
$641.0 million
outstanding under the Revolving Credit Facility. As of
December 31, 2017
, we had
$1.9 billion
of outstanding variable rate indebtedness. In addition, as of
December 31, 2017
, we had
$359.0 million
available for borrowing under our Revolving Credit Facility.
We expect to manage our exposure to interest rate risk by maintaining a mix of fixed and variable rates for our indebtedness. We also may manage, or hedge, interest rate risks related to our borrowings through interest rate swap agreements. As of
December 31, 2017
, we had 10 interest rate swaps that fix the LIBOR portion of the interest rate for $845.0 million of LIBOR-based borrowings under the U.S. dollar Term Loans at a weighted average rate of 1.19% and two interest rate swaps that fix the Canadian Dollar Offered Rate (“CDOR”) portion of the interest rate for CAD $90.0 million and CAD $35.0 million of CDOR-based borrowings at 1.59% and 0.93%, respectively.
From time to time, we may borrow under the Revolving Credit Facility to finance future investments in properties, including any improvements or renovations of current or newly acquired properties, or for other purposes. Because borrowings under the Revolving Credit Facility bear interest on the outstanding principal amount at a rate equal to an applicable interest margin plus, at our option, either (a) LIBOR or (b) a base rate determined as the greater of (i) the federal funds rate plus 0.5%, (ii) the prime rate, and (iii) one-month LIBOR plus 1.0%, the interest rate we will be required to pay on any such borrowings will depend on then applicable rates and may vary. An increase in interest rates could make the financing of any investment by us more costly. Rising interest rates could also limit our ability to refinance our debt when it matures or cause us to pay higher interest rates upon refinancing and increase interest expense on refinanced indebtedness.
Assuming a 100 basis point increase/decrease in the interest rate related to our variable rate debt and after giving effect to the impact of interest rate swap derivative instruments, interest expense would increase/decrease by $9.9 million for the twelve months following
December 31, 2017
.
Foreign currency risk.
We are exposed to changes in foreign exchange rates as a result of our investments in Canadian real estate. Our foreign currency exposure is partially mitigated through the use of Canadian dollar denominated debt totaling CAD $147.6 million and cross currency swap instruments. Based on our operating results for the three months ended
December 31, 2017
, if the value of the Canadian dollar relative to the U.S. dollar were to increase or decrease by 10% compared to the average exchange rate during the three months ended
December 31, 2017
, our cash flows would have decreased or increased, as applicable by $0.1 million.
53
The table below summarizes the book values and the weighted-average interest rates of our indebtedness by type as of
December 31, 2017
, based on the maturity dates (dollars in thousands):
|
Maturity
|
||||||||||||||||||||||||||||||||
|
2018
|
2019
|
2020
|
2021
|
2022
|
Thereafter
|
Total Book Value
(1)
|
Total Fair Value
|
|||||||||||||||||||||||||
|
Secured indebtedness
|
||||||||||||||||||||||||||||||||
|
Fixed rate
|
$
|
4,301
|
|
$
|
4,445
|
|
$
|
4,594
|
|
$
|
20,482
|
|
$
|
4,285
|
|
$
|
122,595
|
|
$
|
160,702
|
|
$
|
147,974
|
|
||||||||
|
Weighted average effective interest rate
|
3.82
|
%
|
3.80
|
%
|
3.88
|
%
|
3.89
|
%
|
3.92
|
%
|
4.08
|
%
|
3.87
|
%
|
||||||||||||||||||
|
Variable rate
|
—
|
|
$
|
98,500
|
|
—
|
|
—
|
|
—
|
|
—
|
|
$
|
98,500
|
|
$
|
98,487
|
|
|||||||||||||
|
Weighted average effective interest rate
|
—
|
|
3.36
|
%
|
—
|
|
—
|
|
—
|
|
—
|
|
3.36
|
%
|
||||||||||||||||||
|
Revolving Credit Facility
|
$
|
—
|
|
$
|
—
|
|
$
|
—
|
|
$
|
641,000
|
|
—
|
|
—
|
|
$
|
641,000
|
|
$
|
641,000
|
|
||||||||||
|
Weighted average effective interest rate
|
—
|
|
—
|
|
—
|
|
2.81
|
%
|
—
|
|
—
|
|
2.81
|
%
|
||||||||||||||||||
|
Term Loans
|
—
|
|
—
|
|
$
|
200,000
|
|
$
|
—
|
|
$
|
999,587
|
|
$
|
—
|
|
$
|
1,199,587
|
|
$
|
1,199,587
|
|
||||||||||
|
Weighted average effective interest rate
(2)
|
—
|
|
—
|
|
3.01
|
%
|
—
|
|
2.99
|
%
|
—
|
|
2.74
|
%
|
||||||||||||||||||
|
Senior Notes
|
—
|
|
—
|
|
—
|
|
$
|
500,000
|
|
—
|
|
$
|
800,000
|
|
$
|
1,300,000
|
|
$
|
1,329,191
|
|
||||||||||||
|
Weighted average effective interest rate
|
—
|
|
—
|
|
—
|
|
5.5
|
%
|
—
|
|
5.22
|
%
|
5.33
|
%
|
||||||||||||||||||
|
(1)
|
Total book value for secured indebtedness and Term Loans does not include deferred financing costs, net of
$2.8 million
and
$8.8 million
, respectively, as of
December 31, 2017
. Total book value for Senior Notes does not include premium, net of
$15.9 million
and deferred financing costs, net of
$9.6 million
as of
December 31, 2017
.
|
|
(2)
|
Term loans include
$845.0 million
subject to swap agreements that fix LIBOR at a weighted average rate of
1.19%
, and
$71.7 million
(CAD
$90.0 million
) and
$27.9 million
(CAD
$35.0 million
) subject to swap agreements that fix CDOR at
1.59% and 0.93%
, respectively. Excluding these amounts, variable rate debt was
29.3%
of total debt as of
December 31, 2017
.
|
For a discussion of the interest rate risks related to the current capital and credit markets, see Part I, Item 1A, “Risk Factors.”
See the Index to Financial Statements at page F-1 of this 10-K. See also “Item 7. Management’s Discussion and Analysis—Quarterly Financial Data.”
None.
Disclosure Controls and Procedures
As of the end of the period covered by this report, management, including our chief executive officer and chief financial officer, evaluated the effectiveness of the design and operation of our disclosure controls and procedures. Based upon, and as of the date of, the evaluation, our chief executive officer and chief financial officer concluded that our disclosure controls and procedures were effective as of
December 31, 2017
to ensure that information required to be disclosed in the reports we file or submit under the Exchange Act is recorded, processed, summarized and reported within the time periods specified in the SEC’s rules and forms. Disclosure controls and procedures include, without limitation, controls and procedures designed to ensure that information required to be disclosed by us in the reports we file or submit under the Exchange Act is accumulated and communicated to our management, including our chief executive officer and our chief financial officer, as appropriate to allow timely decisions regarding required disclosure.
54
Management’s Annual Report on Internal Control Over Financial Reporting
Management is responsible for establishing and maintaining adequate internal control over financial reporting, as such term is defined in Exchange Act Rule 13a–15(f) and 15d–15(f). Under the supervision and with the participation of our management, including our chief executive officer and chief financial officer, we conducted an evaluation of the effectiveness of our internal control over financial reporting using the criteria described in the 2013 Internal Control—Integrated Framework issued by the Committee of Sponsoring Organizations of the Treadway Commission (“COSO”). Based on our evaluation using the criteria described in Internal Control—Integrated Framework, our management concluded that our internal control over financial reporting was effective as of
December 31, 2017
.
The effectiveness of our internal control over financial reporting as of
December 31, 2017
has been audited by PricewaterhouseCoopers LLP, an independent registered public accounting firm, as stated in their report which is included herein.
Changes in Internal Control over Financial Reporting
There were no changes in our internal control over financial reporting during the quarter ended
December 31, 2017
that have materially affected or are reasonably likely to materially affect our internal control over financial reporting.
None.
Except as provided below, the information required under Item 10 is incorporated herein by reference to our definitive proxy statement to be filed with the SEC within 120 days after the end of our fiscal year ended
December 31, 2017
in connection with our
2018
Annual Meeting of Stockholders.
Code of Conduct and Ethics
We have adopted a Code of Conduct and Ethics that applies to all of our directors and employees, including our principal executive officer and principal financial officer. Our Code of Conduct and Ethics can be found in the About Sabra—Governance Documents section of our website at
www.sabrahealth.com
. Waivers from, and amendments to, our Code of Conduct and Ethics that apply to our directors, executive officers or persons performing similar functions will be timely posted in the About Sabra—Governance Documents section of our website at
www.sabrahealth.com
.
The information required under Item 11 is incorporated herein by reference to our definitive proxy statement to be filed with the SEC within 120 days after the end of our fiscal year ended
December 31, 2017
in connection with our
2018
Annual Meeting of Stockholders.
The information required under Item 12 is incorporated herein by reference to our definitive proxy statement to be filed with the SEC within 120 days after the end of our fiscal year ended
December 31, 2017
in connection with our
2018
Annual Meeting of Stockholders.
The information required under Item 13 is incorporated herein by reference to our definitive proxy statement to be filed with the SEC within 120 days after the end of our fiscal year ended
December 31, 2017
in connection with our
2018
Annual Meeting of Stockholders.
55
The information required under Item 14 is incorporated herein by reference to our definitive proxy statement to be filed with the SEC within 120 days after the end of our fiscal year ended
December 31, 2017
in connection with our
2018
Annual Meeting of Stockholders.
|
(a)
|
Documents filed as part of this 10-K:
|
|
(1)
|
Financial Statements
|
See the Index to Consolidated Financial Statements at page F-1 of this report.
|
(2)
|
Financial Statement Schedules
|
Schedule II - Valuation and Qualifying Accounts for the years ended
December 31, 2017
,
2016
and
2015
Schedule III - Real Estate Assets and Accumulated Depreciation as of
December 31, 2017
Schedule IV - Mortgage Loans on Real Estate as of
December 31, 2017
|
(3)
|
Exhibits
|
The following exhibits are filed herewith or are incorporated by reference, as specified below, to exhibits previously filed with the SEC.
EXHIBIT LIST
|
Ex.
|
|
Description
|
|
2.1
|
||
|
3.1
|
|
|
|
3.1.1
|
|
|
|
3.1.2
|
||
|
3.2
|
|
|
|
4.1
|
||
|
4.2
|
||
56
|
Ex.
|
|
Description
|
|
4.2.1
|
||
|
4.2.2
|
||
|
4.2.3
|
||
|
4.2.4
|
||
|
4.2.5
|
||
|
4.2.6
|
||
|
4.2.7
|
||
|
4.3
|
||
|
4.4
|
||
|
4.5
|
||
|
4.5.1
|
||
|
4.5.2
|
||
|
4.5.3
|
||
|
4.5.4
|
||
|
4.6
|
||
|
10.1
|
||
57
|
Ex.
|
|
Description
|
|
10.1.1
|
||
|
10.2
|
||
|
10.3
|
||
|
10.4+
|
||
|
10.5+
|
||
|
10.6+
|
||
|
10.7+
|
||
|
10.8.1+*
|
||
|
10.8.2+*
|
||
|
10.8.3+*
|
||
|
10.8.4+
|
||
|
10.8.5+
|
||
|
10.9+
|
||
|
12.1*
|
|
|
|
21.1*
|
||
|
23.1*
|
||
|
31.1*
|
|
|
|
31.2*
|
|
|
|
32.1**
|
|
|
58
|
Ex.
|
|
Description
|
|
32.2**
|
|
|
|
101.INS*
|
XBRL Instance Document.
|
|
|
101.SCH*
|
XBRL Taxonomy Extension Schema Document.
|
|
|
101.CAL*
|
XBRL Taxonomy Extension Calculation Linkbase Document.
|
|
|
101.DEF*
|
XBRL Taxonomy Extension Definition Linkbase Document.
|
|
|
101.LAB*
|
XBRL Taxonomy Extension Label Linkbase Document.
|
|
|
101.PRE*
|
XBRL Taxonomy Extension Presentation Linkbase Document.
|
|
|
*
|
Filed herewith.
|
|
**
|
Furnished herewith.
|
|
+
|
Designates a management compensation plan, contract or arrangement.
|
|
†
|
Schedules and exhibits have been omitted pursuant to Item 601(b)(2) of Regulation S-K. The Registrants hereby agree to furnish supplementally copies of any of the omitted schedules and exhibits upon request by the Securities and Exchange Commission.
|
None.
59
INDEX TO CONSOLIDATED FINANCIAL STATEMENTS
|
Consolidated Financial Statements
|
|
|
Financial Statement Schedules
|
|
|
|
|
|
All other schedules are omitted because they are not applicable or the required information is shown in the financial statements or notes thereto.
|
|
F-1
REPORT OF INDEPENDENT REGISTERED PUBLIC ACCOUNTING FIRM
To The Board of Directors and Stockholders
Sabra Health Care REIT, Inc.
Opinions on the Financial Statements and Internal Control over Financial Reporting
We have audited the accompanying consolidated balance sheets of Sabra Health Care REIT, Inc. and its subsidiaries as of December 31, 2017 and 2016, and the related consolidated statements of income, comprehensive income, statements of equity, and of cash flows for each of the three years in the period ended December 31, 2017, including the related notes and financial statement schedules listed in the accompanying index (collectively referred to as the “consolidated financial statements”). We also have audited the Company's internal control over financial reporting as of December 31, 2017, based on criteria established in
Internal Control - Integrated Framework
(2013) issued by the Committee of Sponsoring Organizations of the Treadway Commission (COSO).
In our opinion, the consolidated financial statements referred to above present fairly, in all material respects, the financial position of the Company as of December 31, 2017 and 2016, and the results of their operations and their cash flows for each of the three years in the period ended December 31, 2017 in conformity with accounting principles generally accepted in the United States of America. Also in our opinion, the Company maintained, in all material respects, effective internal control over financial reporting as of December 31, 2017, based on criteria established in
Internal Control - Integrated Framework
(2013)
issued by the COSO.
Basis for Opinions
The Company's management is responsible for these consolidated financial statements, for maintaining effective internal control over financial reporting, and for its assessment of the effectiveness of internal control over financial reporting, included in Management's Annual Report on Internal Control over Financial Reporting appearing under Item 9A. Our responsibility is to express opinions on the Company’s consolidated financial statements and on the Company's internal control over financial reporting based on our audits. We are a public accounting firm registered with the Public Company Accounting Oversight Board (United States) ("PCAOB") and are required to be independent with respect to the Company in accordance with the U.S. federal securities laws and the applicable rules and regulations of the Securities and Exchange Commission and the PCAOB.
We conducted our audits in accordance with the standards of the PCAOB. Those standards require that we plan and perform the audits to obtain reasonable assurance about whether the consolidated financial statements are free of material misstatement, whether due to error or fraud, and whether effective internal control over financial reporting was maintained in all material respects.
Our audits of the consolidated financial statements included performing procedures to assess the risks of material misstatement of the consolidated financial statements, whether due to error or fraud, and performing procedures that respond to those risks. Such procedures included examining, on a test basis, evidence regarding the amounts and disclosures in the consolidated financial statements. Our audits also included evaluating the accounting principles used and significant estimates made by management, as well as evaluating the overall presentation of the consolidated financial statements. Our audit of internal control over financial reporting included obtaining an understanding of internal control over financial reporting, assessing the risk that a material weakness exists, and testing and evaluating the design and operating effectiveness of internal control based on the assessed risk. Our audits also included performing such other procedures as we considered necessary in the circumstances. We believe that our audits provide a reasonable basis for our opinions.
Definition and Limitations of Internal Control over Financial Reporting
A company’s internal control over financial reporting is a process designed to provide reasonable assurance regarding the reliability of financial reporting and the preparation of financial statements for external purposes in accordance with generally accepted accounting principles. A company’s internal control over financial reporting includes those policies and procedures that (i) pertain to the maintenance of records that, in reasonable detail, accurately and fairly reflect the transactions and dispositions of the assets of the company; (ii) provide reasonable assurance that transactions are recorded as necessary to permit preparation of financial statements in accordance with generally accepted accounting principles, and that receipts and expenditures of the company are being made only in accordance with authorizations of management and directors of the
F-2
company; and (iii) provide reasonable assurance regarding prevention or timely detection of unauthorized acquisition, use, or disposition of the company’s assets that could have a material effect on the financial statements.
Because of its inherent limitations, internal control over financial reporting may not prevent or detect misstatements. Also, projections of any evaluation of effectiveness to future periods are subject to the risk that controls may become inadequate because of changes in conditions, or that the degree of compliance with the policies or procedures may deteriorate.
/s/ PricewaterhouseCoopers LLP
Irvine, California
February 21, 2018
We have served as the Company’s auditor since 2010.
F-3
SABRA HEALTH CARE REIT, INC.
CONSOLIDATED BALANCE SHEETS
(in thousands, except share and per share amounts)
|
December 31,
|
|||||||
|
2017
|
2016
|
||||||
|
Assets
|
|||||||
|
Real estate investments, net of accumulated depreciation of $340,423 and $282,812 as of December 31, 2017 and 2016, respectively
|
$
|
5,994,432
|
|
$
|
2,009,939
|
|
|
|
Loans receivable and other investments, net
|
114,390
|
|
96,036
|
|
|||
|
Cash and cash equivalents
|
518,632
|
|
25,663
|
|
|||
|
Restricted cash
|
68,817
|
|
9,002
|
|
|||
|
Lease intangible assets, net
|
167,119
|
|
26,250
|
|
|||
|
Accounts receivable, prepaid expenses and other assets, net
|
168,887
|
|
99,029
|
|
|||
|
Total assets
|
$
|
7,032,277
|
|
$
|
2,265,919
|
|
|
|
Liabilities
|
|||||||
|
Secured debt, net
|
$
|
256,430
|
|
$
|
160,752
|
|
|
|
Revolving credit facility
|
641,000
|
|
26,000
|
|
|||
|
Term loans, net
|
1,190,774
|
|
335,673
|
|
|||
|
Senior unsecured notes, net
|
1,306,286
|
|
688,246
|
|
|||
|
Accounts payable and accrued liabilities
|
102,523
|
|
39,639
|
|
|||
|
Lease intangible liabilities, net
|
98,015
|
|
—
|
|
|||
|
Total liabilities
|
3,595,028
|
|
1,250,310
|
|
|||
|
Commitments and contingencies (Note 17)
|
|
|
|||||
|
Equity
|
|||||||
|
Preferred stock, $.01 par value; 10,000,000 shares authorized, 5,750,000 shares issued and outstanding as of December 31, 2017 and 2016
|
58
|
|
58
|
|
|||
|
Common stock, $.01 par value; 250,000,000 shares authorized, 178,255,843 and 65,285,614 shares issued and outstanding as of December 31, 2017 and 2016, respectively
|
1,783
|
|
653
|
|
|||
|
Additional paid-in capital
|
3,636,913
|
|
1,208,862
|
|
|||
|
Cumulative distributions in excess of net income
|
(217,236
|
)
|
(192,201
|
)
|
|||
|
Accumulated other comprehensive income (loss)
|
11,289
|
|
(1,798
|
)
|
|||
|
Total Sabra Health Care REIT, Inc. stockholders’ equity
|
3,432,807
|
|
1,015,574
|
|
|||
|
Noncontrolling interests
|
4,442
|
|
35
|
|
|||
|
Total equity
|
3,437,249
|
|
1,015,609
|
|
|||
|
Total liabilities and equity
|
$
|
7,032,277
|
|
$
|
2,265,919
|
|
|
See accompanying notes to consolidated financial statements.
F-4
SABRA HEALTH CARE REIT, INC.
(in thousands, except share and per share amounts)
|
Year Ended December 31,
|
||||||||||||
|
|
2017
|
2016
|
2015
|
|||||||||
|
Revenues:
|
||||||||||||
|
Rental income
|
$
|
364,191
|
|
$
|
225,275
|
|
$
|
209,851
|
|
|||
|
Interest and other income
|
15,026
|
|
27,463
|
|
25,505
|
|
||||||
|
Resident fees and services
|
26,430
|
|
7,788
|
|
3,508
|
|
||||||
|
|
|
|
||||||||||
|
Total revenues
|
405,647
|
|
260,526
|
|
238,864
|
|
||||||
|
|
|
|
||||||||||
|
Expenses:
|
||||||||||||
|
Depreciation and amortization
|
113,882
|
|
68,472
|
|
63,079
|
|
||||||
|
Interest
|
88,440
|
|
64,873
|
|
59,218
|
|
||||||
|
Operating expenses
|
17,860
|
|
5,703
|
|
2,576
|
|
||||||
|
General and administrative
|
32,401
|
|
17,672
|
|
16,093
|
|
||||||
|
Merger and acquisition costs
|
30,255
|
|
1,197
|
|
7,023
|
|
||||||
|
Provision for doubtful accounts and loan losses
|
17,113
|
|
5,543
|
|
12,842
|
|
||||||
|
Impairment of real estate
|
1,326
|
|
29,811
|
|
—
|
|
||||||
|
|
|
|
||||||||||
|
Total expenses
|
301,277
|
|
193,271
|
|
160,831
|
|
||||||
|
|
|
|
||||||||||
|
Other income (expense):
|
||||||||||||
|
Loss on extinguishment of debt
|
(553
|
)
|
(556
|
)
|
—
|
|
||||||
|
Other income
|
3,170
|
|
10,677
|
|
2,260
|
|
||||||
|
Net gain (loss) on sales of real estate
|
52,029
|
|
(6,122
|
)
|
(161
|
)
|
||||||
|
Total other income (expense)
|
54,646
|
|
3,999
|
|
2,099
|
|
||||||
|
Income before income tax expense
|
159,016
|
|
71,254
|
|
80,132
|
|
||||||
|
Income tax expense
|
(651
|
)
|
(1,049
|
)
|
(749
|
)
|
||||||
|
Net income
|
158,365
|
|
70,205
|
|
79,383
|
|
||||||
|
Net loss attributable to noncontrolling interests
|
18
|
|
71
|
|
30
|
|
||||||
|
Net income attributable to Sabra Health Care REIT, Inc.
|
158,383
|
|
70,276
|
|
79,413
|
|
||||||
|
Preferred stock dividends
|
(10,242
|
)
|
(10,242
|
)
|
(10,242
|
)
|
||||||
|
Net income attributable to common stockholders
|
$
|
148,141
|
|
$
|
60,034
|
|
$
|
69,171
|
|
|||
|
Net income attributable to common stockholders, per:
|
||||||||||||
|
|
|
|
||||||||||
|
Basic common share
|
$
|
1.40
|
|
$
|
0.92
|
|
$
|
1.11
|
|
|||
|
|
|
|
||||||||||
|
Diluted common share
|
$
|
1.40
|
|
$
|
0.92
|
|
$
|
1.11
|
|
|||
|
|
|
|
||||||||||
|
Weighted-average number of common shares outstanding, basic
|
105,621,242
|
|
65,284,251
|
|
62,235,014
|
|
||||||
|
|
|
|
||||||||||
|
Weighted-average number of common shares outstanding, diluted
|
105,842,434
|
|
65,520,672
|
|
62,460,239
|
|
||||||
See accompanying notes to consolidated financial statements.
F-5
SABRA HEALTH CARE REIT, INC.
CONSOLIDATED STATEMENTS OF COMPREHENSIVE INCOME
(in thousands)
|
Year Ended December 31,
|
||||||||||||
|
|
2017
|
2016
|
2015
|
|||||||||
|
Net income
|
$
|
158,365
|
|
$
|
70,205
|
|
$
|
79,383
|
|
|||
|
Other comprehensive income (loss):
|
||||||||||||
|
Unrealized gain (loss), net of tax:
|
||||||||||||
|
Foreign currency translation gain (loss)
|
154
|
|
(1,634
|
)
|
(1,433
|
)
|
||||||
|
Unrealized gain (loss) on cash flow hedges
(1)
|
12,933
|
|
7,169
|
|
(4,358
|
)
|
||||||
|
Total other comprehensive income (loss)
|
13,087
|
|
5,535
|
|
(5,791
|
)
|
||||||
|
Comprehensive income
|
171,452
|
|
75,740
|
|
73,592
|
|
||||||
|
Comprehensive loss attributable to noncontrolling interest
|
18
|
|
71
|
|
30
|
|
||||||
|
Comprehensive income attributable to Sabra Health Care REIT, Inc.
|
$
|
171,470
|
|
$
|
75,811
|
|
$
|
73,622
|
|
|||
|
(1)
|
Amounts are net of provision for income taxes of
$0.1 million
for the year ended
December 31, 2017
and
none
for the years ended
December 31, 2016
and 2015.
|
See accompanying notes to consolidated financial statements.
F-6
SABRA HEALTH CARE REIT, INC.
CONSOLIDATED STATEMENTS OF EQUITY
(in thousands, except share and per share amounts)
|
|
Preferred Stock
|
Common Stock
|
Additional
Paid-in Capital |
Cumulative Distributions in Excess of Net Income
|
Accumulated Other Comprehensive Loss
|
Total
Stockholders’ Equity |
Noncontrolling Interests
|
Total Equity
|
||||||||||||||||||||||||||||||
|
|
Shares
|
Amounts
|
Shares
|
Amounts
|
||||||||||||||||||||||||||||||||||
|
Balance, December 31, 2014
|
5,750,000
|
|
$
|
58
|
|
59,047,001
|
|
$
|
590
|
|
$
|
1,053,601
|
|
$
|
(110,841
|
)
|
$
|
(1,542
|
)
|
$
|
941,866
|
|
$
|
(43
|
)
|
$
|
941,823
|
|
||||||||||
|
Net income (loss)
|
—
|
|
—
|
|
—
|
|
—
|
|
—
|
|
79,413
|
|
—
|
|
79,413
|
|
(30
|
)
|
79,383
|
|
||||||||||||||||||
|
Other comprehensive loss
|
—
|
|
—
|
|
—
|
|
—
|
|
—
|
|
—
|
|
(5,791
|
)
|
(5,791
|
)
|
—
|
|
(5,791
|
)
|
||||||||||||||||||
|
Amortization of stock-based compensation
|
—
|
|
—
|
|
—
|
|
—
|
|
6,946
|
|
—
|
|
—
|
|
6,946
|
|
—
|
|
6,946
|
|
||||||||||||||||||
|
Common stock issuance, net
|
—
|
|
—
|
|
6,135,334
|
|
62
|
|
141,994
|
|
—
|
|
—
|
|
142,056
|
|
—
|
|
142,056
|
|
||||||||||||||||||
|
Preferred dividends
|
—
|
|
—
|
|
—
|
|
—
|
|
—
|
|
(10,242
|
)
|
—
|
|
(10,242
|
)
|
—
|
|
(10,242
|
)
|
||||||||||||||||||
|
Common dividends ($1.60 per share)
|
—
|
|
—
|
|
—
|
|
—
|
|
—
|
|
(100,478
|
)
|
—
|
|
(100,478
|
)
|
—
|
|
(100,478
|
)
|
||||||||||||||||||
|
Contribution from noncontrolling interest
|
—
|
|
—
|
|
—
|
|
—
|
|
—
|
|
—
|
|
—
|
|
—
|
|
179
|
|
179
|
|
||||||||||||||||||
|
Balance, December 31, 2015
|
5,750,000
|
|
58
|
|
65,182,335
|
|
652
|
|
1,202,541
|
|
(142,148
|
)
|
(7,333
|
)
|
1,053,770
|
|
106
|
|
1,053,876
|
|
||||||||||||||||||
|
Net income (loss)
|
—
|
|
—
|
|
—
|
|
—
|
|
—
|
|
70,276
|
|
—
|
|
70,276
|
|
(71
|
)
|
70,205
|
|
||||||||||||||||||
|
Other comprehensive income
|
—
|
|
—
|
|
—
|
|
—
|
|
—
|
|
—
|
|
5,535
|
|
5,535
|
|
—
|
|
5,535
|
|
||||||||||||||||||
|
Amortization of stock-based compensation
|
—
|
|
—
|
|
—
|
|
—
|
|
8,559
|
|
—
|
|
—
|
|
8,559
|
|
—
|
|
8,559
|
|
||||||||||||||||||
|
Common stock issuance, net
|
—
|
|
—
|
|
134,509
|
|
1
|
|
(1,513
|
)
|
—
|
|
—
|
|
(1,512
|
)
|
—
|
|
(1,512
|
)
|
||||||||||||||||||
|
Repurchase of common stock
|
—
|
|
—
|
|
(31,230
|
)
|
—
|
|
(725
|
)
|
—
|
|
—
|
|
(725
|
)
|
—
|
|
(725
|
)
|
||||||||||||||||||
|
Preferred dividends
|
—
|
|
—
|
|
—
|
|
—
|
|
—
|
|
(10,242
|
)
|
—
|
|
(10,242
|
)
|
—
|
|
(10,242
|
)
|
||||||||||||||||||
|
Common dividends ($1.67 per share)
|
—
|
|
—
|
|
—
|
|
—
|
|
—
|
|
(110,087
|
)
|
—
|
|
(110,087
|
)
|
—
|
|
(110,087
|
)
|
||||||||||||||||||
|
Balance, December 31, 2016
|
5,750,000
|
|
58
|
|
65,285,614
|
|
653
|
|
1,208,862
|
|
(192,201
|
)
|
(1,798
|
)
|
1,015,574
|
|
35
|
|
1,015,609
|
|
||||||||||||||||||
|
Net income (loss)
|
—
|
|
—
|
|
—
|
|
—
|
|
—
|
|
158,383
|
|
—
|
|
158,383
|
|
(18
|
)
|
158,365
|
|
||||||||||||||||||
|
Other comprehensive income
|
—
|
|
—
|
|
—
|
|
—
|
|
—
|
|
—
|
|
13,087
|
|
13,087
|
|
—
|
|
13,087
|
|
||||||||||||||||||
|
Change in noncontrolling interests
|
—
|
|
—
|
|
—
|
|
—
|
|
—
|
|
—
|
|
—
|
|
—
|
|
4,455
|
|
4,455
|
|
||||||||||||||||||
|
Distributions to noncontrolling interests
|
—
|
|
—
|
|
—
|
|
—
|
|
—
|
|
—
|
|
—
|
|
—
|
|
(30
|
)
|
(30
|
)
|
||||||||||||||||||
|
Amortization of stock-based compensation
|
—
|
|
—
|
|
—
|
|
—
|
|
9,244
|
|
—
|
|
—
|
|
9,244
|
|
—
|
|
9,244
|
|
||||||||||||||||||
|
Common stock issuance, net
|
—
|
|
—
|
|
112,970,229
|
|
1,130
|
|
2,418,807
|
|
—
|
|
—
|
|
2,419,937
|
|
—
|
|
2,419,937
|
|
||||||||||||||||||
|
Preferred dividends
|
—
|
|
—
|
|
—
|
|
—
|
|
—
|
|
(10,242
|
)
|
—
|
|
(10,242
|
)
|
—
|
|
(10,242
|
)
|
||||||||||||||||||
|
Common dividends ($1.73 per share)
|
—
|
|
—
|
|
—
|
|
—
|
|
—
|
|
(173,176
|
)
|
—
|
|
(173,176
|
)
|
—
|
|
(173,176
|
)
|
||||||||||||||||||
|
Balance, December 31, 2017
|
5,750,000
|
|
$
|
58
|
|
178,255,843
|
|
$
|
1,783
|
|
$
|
3,636,913
|
|
$
|
(217,236
|
)
|
$
|
11,289
|
|
$
|
3,432,807
|
|
$
|
4,442
|
|
$
|
3,437,249
|
|
||||||||||
See accompanying notes to consolidated financial statements.
F-7
SABRA HEALTH CARE REIT, INC.
(in thousands)
|
Year Ended December 31,
|
|||||||||||
|
|
2017
|
2016
|
2015
|
||||||||
|
Cash flows from operating activities:
|
|
||||||||||
|
Net income
|
$
|
158,365
|
|
$
|
70,205
|
|
$
|
79,383
|
|
||
|
Adjustments to reconcile net income to net cash provided by operating activities:
|
|
||||||||||
|
Depreciation and amortization
|
113,882
|
|
68,472
|
|
63,079
|
|
|||||
|
Amortization of above and below market lease intangibles, net
|
(912
|
)
|
—
|
|
—
|
|
|||||
|
Non-cash interest income adjustments
|
(769
|
)
|
582
|
|
626
|
|
|||||
|
Non-cash interest expense
|
7,776
|
|
5,678
|
|
5,279
|
|
|||||
|
Stock-based compensation expense
|
8,359
|
|
7,496
|
|
6,123
|
|
|||||
|
Loss on extinguishment of debt
|
553
|
|
556
|
|
—
|
|
|||||
|
Straight-line rental income adjustments
|
(29,440
|
)
|
(21,984
|
)
|
(24,320
|
)
|
|||||
|
Provision for doubtful accounts and loan losses
|
17,113
|
|
5,543
|
|
12,842
|
|
|||||
|
Change in fair value of contingent consideration
|
(426
|
)
|
(1,526
|
)
|
(1,550
|
)
|
|||||
|
Gain on consolidation
|
—
|
|
—
|
|
(710
|
)
|
|||||
|
Net (gain) loss on sales of real estate
|
(52,029
|
)
|
6,122
|
|
161
|
|
|||||
|
Impairment of real estate
|
1,326
|
|
29,811
|
|
—
|
|
|||||
|
Changes in operating assets and liabilities:
|
|
|
|||||||||
|
Accounts receivable, prepaid expenses and other assets
|
(16,734
|
)
|
(1,981
|
)
|
(22,827
|
)
|
|||||
|
Accounts payable and accrued liabilities
|
(67,257
|
)
|
11,462
|
|
6,977
|
|
|||||
|
Restricted cash
|
(6,321
|
)
|
(3,697
|
)
|
(3,962
|
)
|
|||||
|
Net cash provided by operating activities
|
133,486
|
|
176,739
|
|
121,101
|
|
|||||
|
Cash flows from investing activities:
|
|
||||||||||
|
Acquisition of real estate
|
(419,905
|
)
|
(153,579
|
)
|
(461,330
|
)
|
|||||
|
Cash received in CCP Merger
|
77,859
|
|
—
|
|
—
|
|
|||||
|
Origination and fundings of loans receivable
|
(17,239
|
)
|
(9,675
|
)
|
(49,687
|
)
|
|||||
|
Origination and fundings of preferred equity investments
|
(2,749
|
)
|
(7,348
|
)
|
(12,804
|
)
|
|||||
|
Additions to real estate
|
(6,954
|
)
|
(1,003
|
)
|
(3,689
|
)
|
|||||
|
Repayment of loans receivable
|
32,430
|
|
215,962
|
|
5,803
|
|
|||||
|
Repayment of preferred equity investments
|
3,755
|
|
—
|
|
—
|
|
|||||
|
Release of contingent consideration held in escrow
|
—
|
|
—
|
|
5,240
|
|
|||||
|
Net proceeds from sale of real estate
|
92,731
|
|
98,006
|
|
27,241
|
|
|||||
|
Net cash (used in) provided by investing activities
|
(240,072
|
)
|
142,363
|
|
(489,226
|
)
|
|||||
|
Cash flows from financing activities:
|
|
||||||||||
|
Net proceeds from (repayments of) revolving credit facility
|
253,000
|
|
(229,000
|
)
|
187,000
|
|
|||||
|
Proceeds from term loans
|
181,000
|
|
69,360
|
|
73,242
|
|
|||||
|
Proceeds from secured debt
|
—
|
|
—
|
|
28,735
|
|
|||||
|
Principal payments on secured debt
|
(4,145
|
)
|
(14,768
|
)
|
(3,132
|
)
|
|||||
|
Payments of deferred financing costs
|
(15,337
|
)
|
(5,937
|
)
|
(1,452
|
)
|
|||||
|
Payment of contingent consideration
|
(382
|
)
|
—
|
|
—
|
|
|||||
|
Distributions to noncontrolling interests
|
(30
|
)
|
—
|
|
—
|
|
|||||
|
Contributions by noncontrolling interests
|
—
|
|
—
|
|
179
|
|
|||||
|
Issuance of common stock, net
|
366,800
|
|
(1,289
|
)
|
139,403
|
|
|||||
|
Dividends paid on common and preferred stock
|
(182,089
|
)
|
(119,264
|
)
|
(109,897
|
)
|
|||||
|
Net cash provided by (used in) financing activities
|
598,817
|
|
(300,898
|
)
|
314,078
|
|
|||||
|
Net increase (decrease) in cash and cash equivalents
|
492,231
|
|
18,204
|
|
(54,047
|
)
|
|||||
|
Effect of foreign currency translation on cash and cash equivalents
|
738
|
|
25
|
|
(312
|
)
|
|||||
|
Cash and cash equivalents, beginning of period
|
25,663
|
|
7,434
|
|
61,793
|
|
|||||
|
Cash and cash equivalents, end of period
|
$
|
518,632
|
|
$
|
25,663
|
|
$
|
7,434
|
|
||
See accompanying notes to consolidated financial statements.
F-8
SABRA HEALTH CARE REIT, INC.
CONSOLIDATED STATEMENTS OF CASH FLOWS (CONTINUED)
(in thousands)
|
Year Ended December 31,
|
|||||||||||
|
|
2017
|
2016
|
2015
|
||||||||
|
Supplemental disclosure of cash flow information:
|
|
||||||||||
|
Interest paid
|
$
|
69,686
|
|
$
|
59,234
|
|
$
|
53,875
|
|
||
|
Income taxes paid
|
$
|
714
|
|
$
|
854
|
|
$
|
657
|
|
||
|
Supplemental disclosure of non-cash investing and financing activities:
|
|||||||||||
|
Acquisition of business in CCP Merger (see Note 3)
|
$
|
3,726,092
|
|
$
|
—
|
|
$
|
—
|
|
||
|
Assumption of indebtedness in CCP Merger
|
$
|
(1,751,373
|
)
|
$
|
—
|
|
$
|
—
|
|
||
|
Stock exchanged in CCP Merger
|
$
|
(2,052,578
|
)
|
$
|
—
|
|
$
|
—
|
|
||
|
Real estate acquired through loan receivable foreclosure
|
$
|
19,096
|
|
$
|
10,100
|
|
$
|
—
|
|
||
|
Proceeds from sale of real estate held by exchange accommodation titleholder variable interest entities
|
$
|
57,512
|
|
$
|
—
|
|
$
|
—
|
|
||
|
Decrease in loans receivable and other investments due to acquisition of real estate
|
$
|
(6,913
|
)
|
$
|
—
|
|
$
|
—
|
|
||
|
Assumption of secured indebtedness
|
$
|
—
|
|
$
|
—
|
|
$
|
30,456
|
|
||
|
Increase in real estate investments due to variable interest consolidation
|
$
|
—
|
|
$
|
—
|
|
$
|
10,700
|
|
||
|
Decrease in loans receivable and preferred equity due to variable interest consolidation
|
$
|
—
|
|
$
|
—
|
|
$
|
(8,615
|
)
|
||
See accompanying notes to consolidated financial statements.
F-9
SABRA HEALTH CARE REIT, INC.
NOTES TO CONSOLIDATED FINANCIAL STATEMENTS
1.
BUSINESS
Overview
Sabra Health Care REIT, Inc. (“Sabra” or the “Company”) was incorporated on May 10, 2010 as a wholly owned subsidiary of Sun Healthcare Group, Inc. (“Sun”) and commenced operations on November 15, 2010 following Sabra’s separation from Sun (the “Separation Date”). Sabra elected to be treated as a real estate investment trust (“REIT”) with the filing of its U.S. federal income tax return for the taxable year beginning January 1, 2011. Sabra believes that it has been organized and operated, and it intends to continue to operate, in a manner to qualify as a REIT. Sabra’s primary business consists of acquiring, financing and owning real estate property to be leased to third party tenants in the healthcare sector. Sabra primarily generates revenues by leasing properties to tenants and operators throughout the United States and Canada. Sabra owns substantially all of its assets and properties and conducts its operations through Sabra Health Care Limited Partnership, a Delaware limited partnership (the “Operating Partnership”), of which Sabra is the sole general partner and Sabra’s wholly owned subsidiaries are currently the only limited partners, or by subsidiaries of the Operating Partnership. The Company’s investment portfolio is primarily comprised of skilled nursing/transitional care facilities, senior housing communities and specialty hospitals and other facilities, in each case leased to third-party operators; senior housing communities operated by third-party property managers pursuant to property management agreements (“Senior Housing - Managed”); investments in loans receivable; and preferred equity investments.
On May 7, 2017, the Company, the Operating Partnership, PR Sub, LLC, a Delaware limited liability company and wholly owned subsidiary of the Company (“Merger Sub”), Care Capital Properties, Inc., a Delaware corporation (“CCP”), and Care Capital Properties, L.P. (“CCPLP”), a Delaware limited partnership and wholly owned subsidiary of CCP, entered into an Agreement and Plan of Merger (the “Merger Agreement”), pursuant to which, on August 17, 2017, CCP merged with and into Merger Sub, with Merger Sub continuing as the surviving corporation (the “CCP Merger”), following which Merger Sub merged with and into the Company, with the Company continuing as the surviving entity (the “Subsequent Merger”), and, simultaneous with the Subsequent Merger, CCPLP merged with and into the Operating Partnership, with the Operating Partnership continuing as the surviving entity.
Pursuant to the Merger Agreement, as of the effective time of the CCP Merger, each share of CCP common stock, par value
$0.01
per share, issued and outstanding immediately prior to the effective time of the CCP Merger (other than shares of CCP common stock owned directly by CCP, the Company or their respective subsidiaries, in each case not held on behalf of third parties) was converted into the right to receive
1.123
newly issued shares of Company common stock, par value
$0.01
per share, plus cash in lieu of any fractional shares. See Note 3, “CCP Merger and Recent Real Estate Acquisitions,” for additional information regarding the CCP Merger.
The acquisition of CCP has been reflected in the Company’s consolidated financial statements since the effective date of the CCP Merger.
2.
SUMMARY OF SIGNIFICANT ACCOUNTING POLICIES
Principles of Consolidation and Basis of Presentation
The accompanying consolidated financial statements include the accounts of Sabra and its wholly owned subsidiaries as of
December 31, 2017
and
2016
and for the years ended
December 31, 2017
,
2016
and
2015
. All significant intercompany transactions and balances have been eliminated in consolidation. The consolidated financial statements are prepared in accordance with U.S. generally accepted accounting principles (“GAAP”).
GAAP requires the Company to identify entities for which control is achieved through voting rights or other means and to determine which business enterprise is the primary beneficiary of variable interest entities (“VIEs”). A VIE is broadly defined as an entity with one or more of the following characteristics: (a) the total equity investment at risk is insufficient to finance the entity's activities without additional subordinated financial support; (b) as a group, the holders of the equity investment at risk lack (i) the ability to make decisions about the entity's activities through voting or similar rights, (ii) the obligation to absorb the expected losses of the entity, or (iii) the right to receive the expected residual returns of the entity; or (c) the equity investors have voting rights that are not proportional to their economic interests, and substantially all of the entity's activities either involve, or are conducted on behalf of, an investor that has disproportionately few voting rights. If the Company were determined to be the primary beneficiary of the VIE, the Company would consolidate investments in the VIE. The Company may change its original assessment of a VIE due to events such as modifications of contractual arrangements
F-10
that affect the characteristics or adequacy of the entity’s equity investments at risk and the disposal of all or a portion of an interest held by the primary beneficiary.
The Company identifies the primary beneficiary of a VIE as the enterprise that has both: (i) the power to direct the activities of the VIE that most significantly impact the entity's economic performance; and (ii) the obligation to absorb losses or the right to receive benefits of the VIE that could be significant to the entity. The Company performs this analysis on an ongoing basis.
As of
December 31, 2017
, the Company determined it was the primary beneficiary of
19
VIEs—
18
exchange accommodation titleholder variable interest entities and a joint venture variable interest entity owning
one
skilled nursing/transitional care facility—and has consolidated the operations of these entities in the accompanying consolidated financial statements. As of
December 31, 2017
, the Company determined that operations of these entities were not material to the Company’s results of operations, financial condition or cash flows.
As it relates to investments in loans, in addition to the Company’s assessment of VIEs and whether the Company is the primary beneficiary of those VIEs, the Company evaluates the loan terms and other pertinent facts to determine if the loan investment should be accounted for as a loan or as a real estate joint venture. If an investment has the characteristics of a real estate joint venture, including if the Company participates in the majority of the borrower's expected residual profit, the Company would account for the investment as an investment in a real estate joint venture and not as a loan investment. Expected residual profit is defined as the amount of profit, whether called interest or another name, such as an equity kicker, above a reasonable amount of interest and fees expected to be earned by a lender. At
December 31, 2017
and
2016
,
none
of the Company’s investments in loans are accounted for as real estate joint ventures.
As it relates to investments in joint ventures, the Company assesses any limited partners’ rights and their impact on the presumption of control of the limited partnership by any single partner. The Company also applies this guidance to managing member interests in limited liability companies. The Company reassesses its determination of which entity controls the joint venture if: there is a change to the terms or in the exercisability of the rights of any partners or members, the sole general partner or managing member increases or decreases its ownership interests, or there is an increase or decrease in the number of outstanding ownership interests. As of
December 31, 2017
, the Company’s determination of which entity controls its investments in joint ventures has not changed as a result of any reassessment.
Use of Estimates
The preparation of the consolidated financial statements in conformity with GAAP requires management to make estimates and assumptions that affect the amounts reported in the consolidated financial statements and accompanying notes. Actual results could materially differ from those estimates.
Reclassifications
Certain amounts in the Company’s consolidated financial statements for prior periods have been reclassified to conform to the current period presentation. These reclassifications have not changed the results of operations of prior periods. As a result, certain reclassifications were made to the consolidated balance sheets and consolidated statements of income.
Real Estate Investments and Rental Revenue Recognition
Real Estate Acquisition Valuation
All assets acquired and liabilities assumed in an acquisition of real estate accounted for as a business combination are measured at their acquisition date fair values. For acquisitions of real estate accounted for as an asset acquisition, the fair value of consideration transferred by the Company (including transaction costs) is allocated to all assets acquired and liabilities assumed on a relative fair value basis. The acquisition value of land, building and improvements are included in real estate investments on the accompanying consolidated balance sheets. The acquisition value of above market lease, tenant origination and absorption costs and tenant relationship intangible assets is included in lease intangible assets, net on the accompanying consolidated balance sheets. The acquisition value of below market lease intangible liabilities is included in lease intangible liabilities, net on the accompanying consolidated balance sheets. Acquisition costs associated with real estate acquisitions deemed asset acquisitions are capitalized, and costs associated with real estate acquisitions deemed business combinations are expensed as incurred. The Company capitalized
$1.0 million
and
$0.3 million
of acquisition costs during the years ended
December 31, 2017
and
2016
, respectively. Restructuring costs that do not meet the definition of a liability at the acquisition date are expensed in periods subsequent to the acquisition date. During the years ended
December 31, 2017
,
2016
and
2015
, the Company expensed
$30.3 million
,
$1.2 million
and
$7.0 million
, respectively, of merger and acquisition costs.
F-11
Estimates of the fair values of the tangible assets, identifiable intangibles and assumed liabilities require the Company to make significant assumptions to estimate market lease rates, property operating expenses, carrying costs during lease-up periods, discount rates, market absorption periods, and the number of years the property will be held for investment. The Company makes its best estimate based on the Company’s evaluation of the specific characteristics of each tenant’s lease. The use of inappropriate assumptions would result in an incorrect valuation of the Company’s acquired tangible assets, identifiable intangibles and assumed liabilities, which would impact the amount of the Company’s net income.
Depreciation and Amortization
Real estate costs related to the acquisition and improvement of properties are capitalized and amortized on a straight-line basis over the lesser of the expected useful life of the asset and the remaining lease term of any property subject to a ground lease. Tenant improvements are capitalized and amortized on a straight-line basis over the lesser of the expected useful life of the asset and the remaining lease term. Depreciation is discontinued when a property is identified as held for sale. Repair and maintenance costs are charged to expense as incurred and significant replacements and betterments are capitalized. Repair and maintenance costs include all costs that do not extend the useful life of the real estate asset. The Company considers the period of future benefit of an asset to determine its appropriate useful life. Depreciation of real estate assets and amortization of tenant origination and absorption costs and tenant relationship lease intangibles are included in depreciation and amortization on the accompanying consolidated statements of income. Amortization of above and below market lease intangibles is included in rental income on the accompanying consolidated statements of income. The Company anticipates the estimated useful lives of its assets by class to be generally as follows: land improvements,
3
to
40
years; buildings and building improvements,
3
to
40
years; and furniture and equipment,
1
to
20
years. Intangibles are generally amortized over the remaining noncancellable lease terms, with tenant relationship intangible amortization periods including extension periods of up to
10 years
.
Impairment of Real Estate Investments
The Company continually monitors events and changes in circumstances that could indicate that the carrying amounts of its real estate investments may not be recoverable or realized. When indicators of potential impairment suggest that the carrying value of real estate investments may not be recoverable, the Company assesses the recoverability by estimating whether the Company will recover the carrying value of its real estate investments through the undiscounted future cash flows and the eventual disposition of the investment. In some instances, there may be various potential outcomes for an investment and its potential future cash flows. In these instances, the undiscounted future cash flows used to assess recoverability are probability-weighted based on the Company’s best estimates as of the date of evaluation. If, based on this analysis, the Company does not believe that it will be able to recover the carrying value of its real estate investments, the Company would record an impairment loss to the extent that the carrying value exceeds the estimated fair value of its real estate investments. During the year ended December 31, 2017, the Company recorded an impairment loss of
$1.3 million
related to one skilled nursing/transitional care facility. During the year ended December 31, 2016, the Company recorded an impairment loss of
$29.8 million
related to the Company’s Forest Park - Frisco real estate investment. This facility was subsequently disposed of during the year ended December 31, 2016. The Company did
no
t record any impairment losses on its real estate investments during the year ended December 31, 2015.
Revenue Recognition
The Company recognizes rental revenue from tenants, including rental abatements, lease incentives and contractual fixed increases attributable to operating leases, on a straight-line basis over the term of the related leases when collectability is reasonably assured. Certain of the Company’s leases provide for contingent rents equal to a percentage of the facility’s revenue in excess of specified base amounts or other thresholds. Such revenue is recognized when actual results reported by the tenant, or estimates of tenant results, exceed the applicable base amount or other threshold.
The Company makes estimates of the collectability of its tenant receivables related to base rents, straight-line rent and other revenues. When the Company analyzes accounts receivable and evaluates the adequacy of the allowance for doubtful accounts, it considers such things as historical bad debts, tenant creditworthiness, current economic trends, facility operating performance, lease structure, credit enhancements (including guarantees), current developments relevant to a tenant’s business specifically and to its business category generally, and changes in tenants’ payment patterns. Specifically for straight-line rent receivables, the Company’s assessment includes an estimation of a tenant’s ability to fulfill its rental obligations over the remaining lease term. In addition, with respect to tenants in bankruptcy, management makes estimates of the expected recovery of pre-petition and post-petition claims in assessing the estimated collectability of the related receivable. When a tenant is in bankruptcy, the Company records a provision for doubtful accounts for management’s estimate of the tenant’s receivable balance that is uncollectible and generally will not recognize subsequent rental revenue until cash is received or until the tenant is no longer in bankruptcy and has the ability to make rental payments. The Company’s collectability estimates for straight-line rent receivables include an assessment at the individual or master lease level as well as at an overall portfolio level.
F-12
Revenue from resident fees and services is recorded monthly as services are provided and includes resident room and care charges and other resident charges.
Assets Held for Sale, Dispositions and Discontinued Operations
The Company generally considers real estate to be “held for sale” when the following criteria are met: (i) management commits to a plan to sell the property, (ii) the property is available for sale immediately, (iii) the property is actively being marketed for sale at a price that is reasonable in relation to its current fair value, (iv) the sale of the property within one year is considered probable and (v) significant changes to the plan to sell are not expected. Real estate that is held for sale and its related assets are classified as assets held for sale for all periods presented in the accompanying consolidated financial statements. Secured indebtedness and other liabilities related to real estate held for sale are classified as liabilities related to assets held for sale for all periods presented in the accompanying consolidated financial statements. Real estate classified as held for sale is no longer depreciated and is reported at the lower of its carrying value or its estimated fair value less estimated costs to sell. As of
December 31, 2017
and
2016
, the Company did
no
t have any assets held for sale.
The Company recognizes gain on sales of real estate upon closing of the transaction with the purchaser. The Company uses the full accrual method upon closing if collectability of the sales price is reasonably assured, the Company is not obligated to perform any significant activities after the sale, the Company has received adequate initial investment from the purchaser and other profit recognition criteria have been satisfied. Gain on sales of real estate may be deferred in whole or in part until all requirements for recognition have been met.
Additionally, the Company records the operating results related to real estate that has been disposed of or classified as held for sale as discontinued operations for all periods presented if it represents a strategic shift that has or will have a major effect on the Company’s operations and financial results.
Net Investment in Direct Financing Lease
As of
December 31, 2017
, the Company had a
$23.0 million
net investment in
one
skilled nursing/transitional care facility leased to an operator under a direct financing lease, as the tenant is obligated to purchase the property at the end of the lease term in 2021. The net investment in direct financing lease is recorded in accounts receivable, prepaid expenses and other assets, net on the accompanying consolidated balance sheets and represents the total undiscounted rental payments of
$7.1 million
, plus the estimated unguaranteed residual value of
$24.7 million
, less the unearned lease income of
$8.8 million
as of
December 31, 2017
. Unearned lease income represents the excess of the minimum lease payments and residual values over the cost of the investment. Unearned lease income is deferred and amortized to income over the lease term to provide a constant yield when collectability of the lease payments is reasonably assured. Income from the Company’s net investment in direct financing lease was
$1.0 million
for the year ended
December 31, 2017
and is reflected in interest and other income on the accompanying consolidated statements of income. Future minimum lease payments contractually due under the direct financing lease at
December 31, 2017
, were as follows:
$2.2 million
for 2018;
$2.2 million
for 2019;
$2.3 million
for 2020; and
$2.1 million
for 2021.
Loans Receivable and Interest Income
Loans Receivable
The Company’s loans receivable are reflected at amortized cost on the accompanying consolidated balance sheets. The amortized cost of a loan receivable is the outstanding unpaid principal balance, net of unamortized discounts, costs and fees directly associated with the origination of the loan.
Loans acquired in connection with a business combination are recorded at their acquisition date fair value. The Company determines the fair value of loans receivable based on estimates of expected discounted cash flows, collateral, credit risk and other factors. The Company does not establish a valuation allowance at the acquisition date, as the amount of estimated future cash flows reflects its judgment regarding their uncertainty. The Company recognizes the difference between the acquisition date fair value and the total expected cash flows as interest income using the effective interest method over the life of the applicable loan. The Company immediately recognizes in income any unamortized balances if the loan is repaid before its contractual maturity.
On a quarterly basis, the Company evaluates the collectability of its loan portfolio, including related interest income receivable, and establishes a reserve for loan losses. The Company’s evaluation includes reviewing credit quality indicators such as payment status, changes affecting the underlying real estate collateral (for collateral dependent loans), changes affecting the operations of the facilities securing the loans, and national and regional economic factors. The reserve for loan losses is a valuation allowance that reflects management’s estimate of loan losses inherent in the loan portfolio as of the
F-13
balance sheet date. The reserve is adjusted through provision for doubtful accounts and loan losses on the Company’s consolidated statements of income and is decreased by charge-offs to specific loans when losses are confirmed. The reserve for loan losses includes an asset-specific component and a portfolio-based component.
An asset-specific reserve relates to reserves for losses on loans considered impaired and interest income receivable that is deemed uncollectible. The Company considers a loan to be impaired when, based upon current information and events, management believes that it is probable that the Company will be unable to collect all amounts due under the contractual terms of the loan agreement resulting from the borrower’s failure to repay contractual amounts due, the granting of a concession by the Company or the expectation that the Company will receive assets with fair values less than the carrying value of the loan in satisfaction of the loan. If a loan is considered to be impaired, a reserve is established when the carrying value of that loan is greater than the present value of payments expected to be received, the observable market prices for similar instruments, the estimated fair value of the collateral (for loans that are dependent on the collateral for repayment) or other amounts expected to be received in satisfaction of the loan.
A portfolio-based reserve covers the pool of loans that do not have asset-specific reserves. A provision for loan losses is recorded when available information as of each balance sheet date indicates that it is probable that a loss occurred in the pool of loans and the amount of the loss can be reasonably estimated, but the Company does not know which specific loans within the pool will ultimately result in losses. The required reserve balances for this pool of loans is derived based on estimated probabilities of default and estimated loss severities assuming a default occurs.
Interest Income
Interest income on the Company’s loans receivable is recognized on an accrual basis over the life of the investment using the interest method. Direct loan origination costs are amortized over the term of the loan as an adjustment to interest income. When concerns exist as to the ultimate collection of principal or interest due under a loan, the loan is placed on nonaccrual status, and the Company will not recognize interest income until the cash is received, or the loan returns to accrual status. If the Company determines that the collection of interest according to the contractual terms of the loan or through the receipts of assets in satisfaction of contractual amounts due is probable, the Company will resume the accrual of interest. In instances where borrowers are in default under the terms of their loans, the Company may continue recognizing interest income provided that all amounts owed under the contractual terms of the loan, including accrued and unpaid interest, do not exceed the estimated fair value of the collateral, less costs to sell.
Preferred Equity Investments and Preferred Return
Preferred equity investments are accounted for at unreturned capital contributions, plus accrued and unpaid preferred returns. The Company recognizes preferred return income on a monthly basis based on the outstanding investment including any previously accrued and unpaid return. As a preferred member of the preferred equity joint ventures in which the Company participates, the Company is not entitled to share in the joint venture’s earnings or losses. Rather, the Company is entitled to receive a preferred return, which is deferred if the cash flow of the joint venture is insufficient to currently pay the accrued preferred return.
Cash and Cash Equivalents
The Company considers all short-term (with an original maturity of
three
months or less), highly-liquid investments utilized as part of the Company’s cash-management activities to be cash equivalents. Cash equivalents may include cash and short-term investments. Short-term investments are stated at cost, which approximates fair value.
The Company’s cash and cash equivalents balance exceeded federally insurable limits as of
December 31, 2017
. To date, the Company has experienced no loss or lack of access to cash in its operating accounts. The Company has a corporate banking relationship with Bank of America, N.A. in which it deposits the majority of all funds.
Restricted Cash
Restricted cash primarily consists of amounts held by an exchange accommodation titleholder or by secured debt lenders to provide for future real estate tax expenditures, tenant improvements and capital expenditures. Pursuant to the terms of the Company’s leases with certain tenants, the Company has assigned its interests in certain of these restricted cash accounts with secured debt lenders to the tenants, and this amount is included in accounts payable and accrued liabilities on the Company’s consolidated balance sheets. As of
December 31, 2017
and
2016
, restricted cash totaled
$68.8 million
and
$9.0 million
, respectively, and restricted cash obligations totaled
$6.5 million
and
$6.8 million
, respectively. Restricted cash as of
December 31, 2017
includes
$57.5 million
held by exchange accommodation titleholders.
F-14
Stock-Based Compensation
Stock-based compensation expense for stock-based awards granted to Sabra’s employees and its non-employee directors is recognized in the statements of income based on the estimated grant date fair value, as adjusted. Compensation expense for awards with graded vesting schedules is generally recognized ratably over the period from the grant date to the date when the award is no longer contingent on the employee providing additional services. Compensation expense for awards with performance-based vesting conditions is recognized based on the Company’s estimate of the ultimate value of such award after considering the Company’s expectations of future performance. Forfeitures of stock-based awards are recognized as they occur.
Deferred Financing Costs
Deferred financing costs representing fees paid to third parties are amortized over the terms of the respective financing agreements using the interest method. Deferred financing costs related to secured debt, term loans and senior unsecured notes are recorded as a reduction of the related debt liability, and deferred financing costs related to the revolving credit facility are recorded in accounts receivable, prepaid expenses and other assets, net. Unamortized deferred financing costs are generally expensed when the associated debt is refinanced or repaid before maturity. Costs incurred in seeking financings that do not close are expensed in the period in which it is determined that the financing will not close.
Income Taxes
The Company elected to be treated as a REIT with the filing of its U.S. federal income tax return for the taxable year beginning January 1, 2011. The Company believes that it has been organized and operated, and it intends to continue to operate, in a manner to qualify as a REIT. To qualify as a REIT, the Company must meet certain organizational and operational requirements, including a requirement to distribute at least 90% of the Company’s annual REIT taxable income to stockholders (which is computed without regard to the dividends-paid deduction or net capital gains and which does not necessarily equal net income as calculated in accordance with GAAP). As a REIT, the Company generally will not be subject to federal income tax on income that it distributes as dividends to its stockholders. If the Company fails to qualify as a REIT in any taxable year, it will be subject to U.S. federal income tax on its taxable income at regular corporate income tax rates and generally will not be permitted to qualify for treatment as a REIT for federal income tax purposes for the four taxable years following the year during which qualification is lost, unless the Internal Revenue Service grants the Company relief under certain statutory provisions. Such an event could materially and adversely affect the Company’s net income and net cash available for distribution to stockholders. However, the Company believes that it is organized and operates in such a manner as to qualify for treatment as a REIT.
As a result of certain investments, the Company now records income tax expense or benefit with respect to certain of its entities that are taxed as taxable REIT subsidiaries under provisions similar to those applicable to regular corporations and not under the REIT provisions.
The Company accounts for deferred income taxes using the asset and liability method and recognizes deferred tax assets and liabilities for the expected future tax consequences of events that have been included in the Company’s financial statements or tax returns. Under this method, the Company determines deferred tax assets and liabilities based on the differences between the financial reporting and tax bases of assets and liabilities using enacted tax rates in effect for the year in which the differences are expected to reverse. Any increase or decrease in the deferred tax liability that results from a change in circumstances, and that causes a change in the Company’s judgment about expected future tax consequences of events, is included in the tax provision when such changes occur. Deferred income taxes also reflect the impact of operating loss and tax credit carryforwards. A valuation allowance is provided if the Company believes it is more likely than not that all or some portion of the deferred tax asset will not be realized. Any increase or decrease in the valuation allowance that results from a change in circumstances, and that causes a change in the Company’s judgment about the realizability of the related deferred tax asset, is included in the tax provision when such changes occur.
The Company evaluates its tax positions using a two step approach: step one (recognition) occurs when the Company concludes that a tax position, based solely on its technical merits, is more likely than not to be sustained upon examination and step two (measurement) is only addressed if step one has been satisfied (i.e., the position is more likely than not to be sustained). Under step two, the tax benefit is measured as the largest amount of benefit (determined on a cumulative probability basis) that is more likely than not to be realized upon ultimate settlement. The Company will recognize tax penalties relating to unrecognized tax benefits as additional tax expense.
Foreign Currency
Certain of the Company's subsidiaries’ functional currencies are the local currencies of their respective foreign jurisdictions. The Company translates the results of operations of its foreign subsidiaries into U.S. dollars using average rates of
F-15
exchange in effect during the period presented, and it translates balance sheet accounts using exchange rates in effect at the end of the period presented. The Company records resulting currency translation adjustments in accumulated other comprehensive income (loss), a component of stockholders’ equity, on its consolidated balance sheets, and it records foreign currency transaction gains and losses as a component of interest and other income on its consolidated statements of income.
Derivative Instruments
The Company uses certain types of derivative instruments for the purpose of managing interest rate and currency risk. To qualify for hedge accounting, derivative instruments used for risk management purposes must effectively reduce the risk exposure that they are designed to hedge. In addition, at inception, the Company must make an assessment that the transaction that the Company intends to hedge is probable of occurring, and this assessment must be updated each reporting period.
The Company recognizes all derivative instruments as assets or liabilities on the consolidated balance sheets at their fair value. For derivatives designated and qualified as a hedge, the change in fair value of the effective portion of the derivatives is recognized in accumulated other comprehensive income (loss), whereas the change in fair value of the ineffective portion is recognized in earnings. Changes in the fair value of derivative instruments that are not designated in hedging relationships or that do not meet the criteria for hedge accounting would be recognized in earnings. As of
December 31, 2017
, all of the Company’s derivative instruments met the criteria for hedge accounting.
The Company formally documents all relationships between hedging instruments and hedged items, as well as its risk-management objectives and strategy for undertaking various hedge transactions. This process includes designating all derivatives that are part of a hedging relationship to specific transactions as well as recognizing obligations or assets on the consolidated balance sheets. The Company also assesses and documents, both at inception of the hedging relationship and on a quarterly basis thereafter, whether the derivatives are highly effective in offsetting the designated risks associated with the respective hedged items. If it is determined that a derivative ceases to be highly effective as a hedge, or that it is probable the underlying transaction will not occur, the Company would discontinue hedge accounting prospectively and record the appropriate adjustment to earnings based on the then-current fair value of the derivative.
Fair Value Measurements
Under GAAP, the Company is required to measure certain financial instruments at fair value on a recurring basis. In addition, the Company is required to measure other financial instruments and balances at fair value on a non-recurring basis (e.g., carrying value of impaired loans receivable and long-lived assets). Fair value is defined as the price that would be received upon the sale of an asset or paid to transfer a liability in an orderly transaction between market participants at the measurement date. The GAAP fair value framework uses a three-tiered approach. Fair value measurements are classified and disclosed in one of the following three categories:
|
•
|
Level 1: unadjusted quoted prices in active markets that are accessible at the measurement date for identical assets or liabilities;
|
|
•
|
Level 2: quoted prices for similar instruments in active markets, quoted prices for identical or similar instruments in markets that are not active, and model-derived valuations in which significant inputs and significant value drivers are observable in active markets; and
|
|
•
|
Level 3: prices or valuation techniques where little or no market data is available that requires inputs that are both significant to the fair value measurement and unobservable.
|
When available, the Company utilizes quoted market prices from an independent third-party source to determine fair value and classifies such items in Level 1 or Level 2. In instances where the market for a financial instrument is not active, regardless of the availability of a nonbinding quoted market price, observable inputs might not be relevant and could require the Company to make a significant adjustment to derive a fair value measurement. Additionally, in an inactive market, a market price quoted from an independent third party may rely more on models with inputs based on information available only to that independent third party. When the Company determines the market for a financial instrument owned by the Company to be illiquid or when market transactions for similar instruments do not appear orderly, the Company may use several valuation sources (including internal valuations, discounted cash flow analysis and quoted market prices) to establish a fair value. If more than one valuation source is used, the Company will assign weights to the various valuation sources. Additionally, when determining the fair value of liabilities in circumstances in which a quoted price in an active market for an identical liability is not available, the Company measures fair value using (i) a valuation technique that uses the quoted price of the identical liability when traded as an asset or quoted prices for similar liabilities or similar liabilities when traded as assets or (ii) another valuation technique that is consistent with the principles of fair value measurement, such as the income approach or the market approach.
F-16
Changes in assumptions or estimation methodologies can have a material effect on these estimated fair values. In this regard, the derived fair value estimates cannot be substantiated by comparison to independent markets and, in many cases, may not be realized in an immediate settlement of the instrument.
The Company considers the following factors to be indicators of an inactive market: (i) there are few recent transactions, (ii) price quotations are not based on current information, (iii) price quotations vary substantially either over time or among market makers (for example, some brokered markets), (iv) indexes that previously were highly correlated with the fair values of the asset or liability are demonstrably uncorrelated with recent indications of fair value for that asset or liability, (v) there is a significant increase in implied liquidity risk premiums, yields, or performance indicators (such as delinquency rates or loss severities) for observed transactions or quoted prices when compared with the Company’s estimate of expected cash flows, considering all available market data about credit and other nonperformance risk for the asset or liability, (vi) there is a wide bid-ask spread or significant increase in the bid-ask spread, (vii) there is a significant decline or absence of a market for new issuances (that is, a primary market) for the asset or liability or similar assets or liabilities, and (viii) little information is released publicly (for example, a principal-to-principal market).
The Company considers the following factors to be indicators of non-orderly transactions: (i) there was not adequate exposure to the market for a period before the measurement date to allow for marketing activities that are usual and customary for transactions involving such assets or liabilities under current market conditions, (ii) there was a usual and customary marketing period, but the seller marketed the asset or liability to a single market participant, (iii) the seller is in or near bankruptcy or receivership (that is, distressed), or the seller was required to sell to meet regulatory or legal requirements (that is, forced), and (iv) the transaction price is an outlier when compared with other recent transactions for the same or similar assets or liabilities.
Per Share Data
Basic earnings per common share is computed by dividing net income applicable to common stockholders by the weighted average number of shares of common stock and common equivalents outstanding during the period. Diluted earnings per common share is calculated by including the effect of dilutive securities. See Note 14, “Earnings Per Common Share”.
Industry Segments
The Company has
one
reportable segment consisting of investments in healthcare-related real estate properties.
Beds, Units and Other Measures
The number of beds, units and other measures used to describe the Company’s real estate investments included in the Notes to Consolidated Financial Statements are presented on an unaudited basis.
Recently Issued Accounting Standards Update
In January 2016, the FASB issued ASU 2016-01, Financial Instruments–Overall (Subtopic 825-10) (“ASU 2016-01”). ASU 2016-01 updates guidance related to recognition and measurement of financial assets and financial liabilities. ASU 2016-01 requires all equity investments to be measured at fair value with changes in the fair value recognized through net income (other than those accounted for under equity method of accounting or those that result in consolidation of the investee). The amendments in ASU 2016-01 also require an entity to present separately in other comprehensive income the portion of the total change in the fair value of a liability resulting from a change in the instrument-specific credit risk when the entity has elected to measure the liability at fair value in accordance with the fair value option for financial instruments. In addition, the amendments in ASU 2016-01 eliminate the requirement to disclose the methods and significant assumptions used to estimate the fair value that is required to be disclosed for financial instruments measured at amortized cost on the balance sheet for public business entities. The Company adopted ASU 2016-01 on January 1, 2018. The adoption of ASU 2016-01 did not have a material impact on the Company's consolidated financial statements.
Between May 2014 and May 2016, the FASB issued three ASUs changing the requirements for recognizing and reporting revenue (together, herein referred to as the “Revenue ASUs”): (i) ASU No. 2014-09, Revenue from Contracts with Customers (“ASU 2014-09”), (ii) ASU No. 2016-08, Principal versus Agent Considerations (Reporting Revenue Gross versus Net) (“ASU 2016-08”) and (iii) ASU No. 2016-12, Narrow-Scope Improvements and Practical Expedients (“ASU 2016-12”). ASU 2014-09 provides guidance for revenue recognition to depict the transfer of promised goods or services to customers in an amount that reflects the consideration to which the entity expects to be entitled in exchange for those goods or services. ASU 2016-08 is intended to improve the operability and understandability of the implementation guidance on principal versus agent considerations. ASU 2016-12 provides practical expedients and improvements on the previously narrow scope of ASU 2014-09. In August 2015, the FASB issued ASU No. 2015-14, Revenue from Contracts with Customers (Topic 606): Deferral
F-17
of the Effective Date (“ASU 2015-14”). ASU 2015-14 defers the effective date of ASU 2014-09 by one year to fiscal years, and interim periods within, beginning after December 15, 2017. All subsequent ASUs related to ASU 2014-09, including ASU 2016-08 and ASU 2016-12, assumed the deferred effective date enforced by ASU 2015-14. Early adoption of the Revenue ASUs is permitted for annual periods, and interim periods within, beginning after December 15, 2016. A reporting entity may apply the amendments in the Revenue ASUs using either a modified retrospective approach, by recording a cumulative-effect adjustment to equity as of the beginning of the fiscal year of adoption or full retrospective approach. The Revenue ASUs became effective for the Company on January 1, 2018 with the Company electing to use the modified retrospective approach for its adoption.
As the primary source of revenue for the Company is generated through leasing and financing arrangements, which are excluded from the Revenue ASUs, the Company expects that the impact of the Revenue ASUs to its consolidated financial statements will be limited to the following:
|
•
|
A requirement to disclose ancillary resident service revenue that is not included in the monthly base fees charged under resident agreements through its Senior Housing - Managed communities structures. The Company will separately disclose the amount, nature and timing of these ancillary resident service revenues in its future quarterly and annual reports.
|
|
•
|
Under ASU 2017-05, Other Income—Gains and Losses from the Derecognition of Nonfinancial Assets (Subtopic 610-20), revenue recognition for real estate sales is primarily based on the transfer of control versus continuing involvement under current guidance. Accordingly, the Company anticipates that the new guidance will result in more transactions qualifying as sales of real estate and gains on sale being recognized at an earlier date than under current accounting guidance.
|
The adoptions of these ASUs had no material impact to beginning retained earnings as of January 1, 2018.
In February 2016, the FASB issued ASU 2016-02, Leases (Topic 842) (“ASU 2016-02”). ASU 2016-02 supersedes guidance related to accounting for leases. ASU 2016-02 updates guidance around the recognition of lease assets and lease liabilities by lessees for those leases classified as operating leases under previous GAAP. The objective of ASU 2016-02 is to establish the principles that lessees and lessors shall apply to report useful information to users of financial statements about the amount, timing, and uncertainty of cash flows arising from a lease. ASU 2016-02 does not fundamentally change lessor accounting; however, some changes have been made to lessor accounting to conform and align that guidance with the lessee guidance and other areas within GAAP. ASU 2016-02 is effective for fiscal years and interim periods within those years beginning after December 15, 2018, with early adoption permitted. Entities currently are required to adopt the new lease requirements using a modified retrospective transition method whereby an entity initially applies the new lease requirements (subject to specific transition requirements and optional practical expedients) at the beginning of the earliest period presented in the financial statements. Upon adoption of ASU 2016-02, the Company will recognize its operating leases for which it is the lessee, mainly corporate office leases and ground leases, on its consolidated balance sheets. Further, as a result of adoption, the Company may be required to increase its revenue and expense for the amount of real estate taxes and insurance paid by its tenants under certain leasing arrangements with no net impact to net income.
In January 2018, the FASB issued a proposed amendment to ASU 2016-02 that would allow lessors to elect, as a practical expedient, not to separate lease and nonlease components (such as services rendered) in a contract for the purpose of revenue recognition and disclosure. The practical expedient as proposed can only be applied to leasing arrangements for which (i) the timing and pattern of revenue recognition are the same for the lease and nonlease components and (ii) the combined single lease component results in classification as an operating lease. The proposed amendment also would provide for an additional (and optional) transition method to adopt the new lease requirements by allowing entities to initially apply the requirements by recognizing a cumulative-effect adjustment to the opening balance of retained earnings in the period of adoption. If finalized by the FASB, the Company plans to elect this practical expedient and apply the transition method for its operating leases for which the Company is the lessee. The Company is still evaluating the full impact of the adoption of ASU 2016-02 on January 1, 2019 to its consolidated financial statements.
In June 2016, the FASB issued ASU 2016-13, Financial Instruments—Credit Losses (Topic 326): Measurement of Credit Losses on Financial Instruments (“ASU 2016-13”). ASU 2016-13 requires that a financial asset (or a group of financial assets) measured at amortized cost basis be presented at the net amount expected to be collected. The allowance for credit losses is a valuation account that is deducted from the amortized cost basis of the financial asset(s) to present the net carrying value at the amount expected to be collected on the financial asset. The amendments in ASU 2016-13 are an improvement because they eliminate the probable initial recognition threshold in current GAAP and, instead, reflect an entity’s current estimate of all expected credit losses. Previously, when credit losses were measured under GAAP, an entity generally only considered past events and current conditions in measuring the incurred loss. ASU 2016-13 is effective for fiscal years and interim periods within those years beginning after December 15, 2019, with early adoption permitted as of the fiscal years beginning after
F-18
December 15, 2018. An entity will apply the amendments in this update through a cumulative-effect adjustment to retained earnings as of the beginning of the first reporting period in which the guidance is effective (that is, a modified-retrospective approach). The Company is currently evaluating the impact this guidance will have on its consolidated financial statements when adopted.
In August 2016, the FASB issued ASU 2016-15, Statement of Cash Flows (Topic 230): Classification of Certain Cash Receipts and Cash Payments (“ASU 2016-15”). ASU 2016-15 provides specific guidance on the following eight specific cash flow classification issues: debt prepayment or debt extinguishment costs; settlement of zero-coupon debt instruments or other debt instruments with coupon interest rates that are insignificant in relation to the effective interest rate of the borrowing; contingent consideration payments made after a business combination; proceeds from the settlement of insurance claims; proceeds from the settlement of corporate-owned life insurance policies (including bank-owned life insurance policies); distributions received from equity method investees; beneficial interests in securitization transactions; and separately identifiable cash flows and application of the predominance principle. ASU 2016-15 will reduce the current and potential future diversity in practice of cash flow classifications. The Company adopted ASU 2016-15 on January 1, 2018. The adoption of this ASU did not have a material impact on the Company's consolidated financial statements.
In November 2016, the FASB issued ASU 2016-18, Statement of Cash Flows (Topic 230): Restricted Cash (“ASU 2016-18”). ASU 2016-18 requires that a statement of cash flows explain the change during the period in the total of cash, cash equivalents, and amounts generally described as restricted cash or restricted cash equivalents. Therefore, amounts generally described as restricted cash and restricted cash equivalents should be included with cash and cash equivalents when reconciling the beginning-of-period and end-of-period total amounts shown on the statement of cash flows. The amendments in ASU 2016-18 apply to all entities that have restricted cash or restricted cash equivalents and are required to present a statement of cash flows under Topic 230. The Company adopted ASU 2016-18 on January 1, 2018. The Company does not expect the adoption of ASU 2016-18 to have a material impact to its consolidated statements of cash flows as the Company does not expect to have material restricted cash activity in future periods.
In January 2017, the FASB issued ASU 2017-01, Business Combinations (Topic 805): Clarifying the definition of a business (“ASU 2017-01”). ASU 2017-01 clarifies the definition of a business with the objective of providing guidance to assist entities with evaluating whether transactions should be accounted for as acquisitions (or disposals) of businesses. When substantially all of the fair value of gross assets acquired is concentrated in a single asset (or a group of similar assets), the assets acquired would not represent a business. To be considered a business, an acquisition would have to include an input and a substantive process that together significantly contribute to the ability to create outputs. To be a business without outputs, there will now need to be an organized workforce. ASU 2017-01 is effective for fiscal years and interim periods within those years beginning after December 15, 2017, with early adoption permitted. The Company adopted ASU 2017-01 on October 1, 2016 on a prospective basis. The Company expects that the majority of its future acquisitions of real estate will be accounted for as asset acquisitions under the new guidance. This adoption will impact how the Company accounts for merger and acquisition costs and contingent consideration which may result in lower expensed merger and acquisition costs and eliminate fair value adjustments related to future contingent consideration arrangements.
In May 2017, the FASB issued ASU 2017-09, Compensation—Stock compensation (Topic 718): Scope of modification accounting (“ASU 2017-09”). ASU 2017-09 clarifies and reduces both (1) diversity in practice and (2) cost and complexity when applying the guidance in Topic 718, Compensation—Stock Compensation, to a change to the terms or conditions of a share-based payment award. The amendments in ASU 2017-09 provide guidance about which changes to the terms or conditions of a share-based payment award require an entity to apply modification accounting in Topic 718. The Company adopted ASU 2017-09 on January 1, 2018. The Company does not expect the adoption of ASU 2017-09 to have a material impact on its consolidated financial statements.
In August 2017, the FASB issued ASU 2017-12, Derivatives and Hedging (Topic 815): Targeted Improvements to Accounting for Hedging Activities (“ASU 2017-12”). ASU 2017-12 is intended to improve the financial reporting of hedging relationships to better portray the economic results of an entity’s risk management activities in its financial statements and to simplify the application of the hedge accounting guidance in current GAAP. ASU 2017-12 is effective for fiscal years and interim periods within those years beginning after December 15, 2018, with early adoption permitted. The Company plans to adopt ASU 2017-12 effective beginning January 1, 2018. ASU 2017-12 requires a modified retrospective transition method in which the Company will recognize the cumulative effect of the change on the opening balance of each affected component of equity in the consolidated balance sheet as of the date of adoption. While the Company continues to assess all potential impacts of the standard, the Company currently expects the adoption to have an immaterial impact on its consolidated financial statements.
F-19
|
3.
|
CCP MERGER AND RECENT REAL ESTATE ACQUISITIONS
|
CCP Merger
On August 17, 2017, the Company completed the CCP Merger. Under the terms of the Merger Agreement, each share of CCP common stock issued and outstanding immediately prior to the effective time of the CCP Merger (other than any shares owned directly by CCP, the Company or their respective subsidiaries, in each case not held on behalf of third parties) was converted into the right to receive
1.123
newly issued shares of Company common stock, resulting in the issuance of approximately
94.0 million
shares of Company common stock at the effective time of the CCP Merger. As a result of the CCP Merger, the Company acquired
330
properties (consisting of
296
skilled nursing/transitional care facilities,
13
senior housing communities and
21
specialty hospitals and other facilities),
one
skilled nursing/transitional care facility leased to an operator under a direct financing lease (see Note 2, “Summary of Significant Accounting Policies—Net Investment in Direct Financing Lease”),
18
investments in loans receivable (see Note 7, “Loans Receivable and Other Investments”) and
one
specialty valuation firm. Sabra also assumed certain outstanding equity awards and other debt and liabilities of CCP (see Note 8, “Debt”). Based on the closing price of Sabra’s common stock on August 16, 2017, the Company estimates the fair value of the consideration exchanged or assumed to be approximately
$2.1 billion
.
As of December 31, 2017, the Company updated the purchase price allocation for the CCP Merger from the provisional amounts reported as of September 30, 2017. The adjustments made during the three months ended December 31, 2017 to the fair value of acquired assets and liabilities assumed did not have a significant impact on the Company’s consolidated statements of income for the three months ended December 31, 2017. The following table summarizes the purchase price allocation for the CCP Merger based on the Company's initial valuation, including estimates and assumptions of the acquisition date fair value of the tangible and intangible assets acquired and liabilities assumed on August 17, 2017 (in thousands):
|
Real estate investments
|
$
|
3,727,310
|
|
|
Loans receivable and other investments
|
58,244
|
|
|
|
Cash and cash equivalents
|
77,859
|
|
|
|
Restricted cash
|
779
|
|
|
|
Lease intangible assets, net
|
145,786
|
|
|
|
Accounts receivable, prepaid expenses and other assets, net
|
35,873
|
|
|
|
Secured debt, net
|
(98,500
|
)
|
|
|
Revolving credit facility
|
(362,000
|
)
|
|
|
Unsecured term loans
|
(674,000
|
)
|
|
|
Senior unsecured notes, net
|
(616,873
|
)
|
|
|
Accounts payable and accrued liabilities
|
(134,802
|
)
|
|
|
Lease intangible liabilities, net
|
(102,643
|
)
|
|
|
Noncontrolling interests
|
(4,455
|
)
|
|
|
Total consideration
|
$
|
2,052,578
|
|
The lease intangible assets and lease intangible liabilities acquired in connection with the CCP Merger have weighted-average amortization periods as of the closing date of the CCP Merger of
10 years
.
For the year ended
December 31, 2017
, the Company recognized
$135.4 million
of total revenues and
$87.0 million
of net income attributable to common stockholders, excluding merger and acquisition costs, from the CCP Merger investments. Merger and acquisition costs associated with the CCP Merger were
$30.2 million
during the year ended
December 31, 2017
.
F-20
Recent Real Estate Acquisitions
During the year ended
December 31, 2017
, in addition to the properties acquired as a result of the CCP Merger, the Company acquired
22
skilled nursing/transitional care facilities and
two
senior housing communities. During the year ended
December 31, 2016
, the Company acquired
one
skilled nursing/transitional care facility and
six
senior housing communities. The consideration was allocated as follows (in thousands):
|
Year Ended December 31,
|
||||||||
|
2017
|
2016
|
|||||||
|
Land
|
$
|
58,771
|
|
|
$
|
7,755
|
|
|
|
Building and improvements
|
359,310
|
|
143,027
|
|
||||
|
Tenant origination and absorption costs intangible assets
|
6,684
|
|
2,202
|
|
||||
|
Tenant relationship intangible assets
|
2,053
|
|
642
|
|
||||
|
Total consideration
|
$
|
426,818
|
|
$
|
153,626
|
|
||
The tenant origination and absorption costs intangible assets and tenant relationship intangible assets acquired in connection with these acquisitions have weighted-average amortization periods as of the respective dates of acquisition of
13
years and
23
years, respectively, for acquisitions completed during the year ended
December 31, 2017
, and
15
years and
25
years, respectively, for acquisitions completed during the year ended
December 31, 2016
.
For the year ended
December 31, 2017
, the Company recognized
$10.6 million
and
$7.7 million
of total revenues and net income attributable to common stockholders, respectively, from the properties acquired during the year ended
December 31, 2017
. For the year ended
December 31, 2016
, the Company recognized
$4.6 million
and
$2.2 million
of total revenues and net income attributable to common stockholders, respectively, from the properties acquired during the year ended
December 31, 2016
. Net income attributable to common stockholders for the year ended
December 31, 2016
includes expensed merger and acquisition costs of
$1.1 million
related to acquisitions accounted for as business combinations.
|
4.
|
REAL ESTATE PROPERTIES HELD FOR INVESTMENT
|
The Company’s real estate properties held for investment consisted of the following (dollars in thousands):
As of
December 31, 2017
|
Property Type
|
Number of
Properties
|
Number of
Beds/Units
|
Total
Real Estate
at Cost
|
Accumulated
Depreciation
|
Total
Real Estate
Investments, Net
|
|||||||||||||
|
Skilled Nursing/Transitional Care
|
384
|
|
43,223
|
|
$
|
4,364,387
|
|
$
|
(209,039
|
)
|
$
|
4,155,348
|
|
|||||
|
Senior Housing - Leased
(1)
|
88
|
|
8,137
|
|
1,166,687
|
|
(102,370
|
)
|
1,064,317
|
|
||||||||
|
Senior Housing - Managed
(1)
|
13
|
|
1,113
|
|
189,120
|
|
(12,125
|
)
|
176,995
|
|
||||||||
|
Specialty Hospitals and Other
|
22
|
|
1,085
|
|
614,068
|
|
(16,620
|
)
|
597,448
|
|
||||||||
|
507
|
|
53,558
|
|
6,334,262
|
|
(340,154
|
)
|
5,994,108
|
|
|||||||||
|
Corporate Level
|
593
|
|
(269
|
)
|
324
|
|
||||||||||||
|
$
|
6,334,855
|
|
$
|
(340,423
|
)
|
$
|
5,994,432
|
|
||||||||||
As of
December 31, 2016
|
Property Type
|
Number of
Properties
|
Number of
Beds/Units
|
Total
Real Estate
at Cost
|
Accumulated
Depreciation
|
Total
Real Estate
Investments, Net
|
|||||||||||||
|
Skilled Nursing/Transitional Care
|
97
|
|
10,819
|
|
$
|
1,042,754
|
|
$
|
(190,038
|
)
|
$
|
852,716
|
|
|||||
|
Senior Housing - Leased
(1)
|
83
|
|
7,855
|
|
1,153,739
|
|
(80,449
|
)
|
1,073,290
|
|
||||||||
|
Senior Housing - Managed
(1)
|
2
|
|
134
|
|
34,212
|
|
(1,682
|
)
|
32,530
|
|
||||||||
|
Specialty Hospitals and Other
|
1
|
|
70
|
|
61,640
|
|
(10,387
|
)
|
51,253
|
|
||||||||
|
183
|
|
18,878
|
|
2,292,345
|
|
(282,556
|
)
|
2,009,789
|
|
|||||||||
|
Corporate Level
|
406
|
|
(256
|
)
|
150
|
|
||||||||||||
|
$
|
2,292,751
|
|
$
|
(282,812
|
)
|
$
|
2,009,939
|
|
||||||||||
|
(1)
|
During the year ended December 31, 2017, the Company transitioned
nine
senior housing communities into a managed property structure whereby the Company owns the operations of the communities and the communities are operated by a third-party property manager.
|
F-21
|
December 31, 2017
|
December 31, 2016
|
||||||
|
Building and improvements
|
$
|
5,449,415
|
|
$
|
1,983,769
|
|
|
|
Furniture and equipment
|
232,889
|
|
85,196
|
|
|||
|
Land improvements
|
3,456
|
|
3,744
|
|
|||
|
Land
|
649,095
|
|
220,042
|
|
|||
|
6,334,855
|
|
2,292,751
|
|
||||
|
Accumulated depreciation
|
(340,423
|
)
|
(282,812
|
)
|
|||
|
$
|
5,994,432
|
|
$
|
2,009,939
|
|
||
Contingent Consideration Arrangements
In connection with
three
of its prior real estate acquisitions, the Company entered into contingent consideration arrangements pursuant to which it could be required to pay out additional amounts based on incremental value created through the improvement of operations of the applicable acquired facility (a contingent consideration liability). The estimated value of the contingent consideration liabilities at the time of purchase was
$3.2 million
. The contingent consideration amounts would be determined based on portfolio performance and the facility achieving certain performance hurdles during 2017. During the year ended
December 31, 2017
,
one
earn-out arrangement expired and resulted in a
$0
payout, and a second earn-out arrangement was terminated in connection with the transition of the
eight
senior housing communities to Senior Housing - Managed communities. To determine the value of the remaining contingent consideration arrangement, the Company used significant inputs not observable in the market. Based on the performance of this facility, the contingent consideration liability had a value of
$0.4 million
and was paid in November 2017. During the years ended
December 31, 2017
and
2016
, the Company recorded decreases of
$0.4 million
and
$1.5 million
, respectively, to the contingent consideration arrangements. These amounts are included in other income on the accompanying consolidated statements of income.
Operating Leases
As of
December 31, 2017
, the substantial majority of the Company’s real estate properties (excluding
13
Senior Housing - Managed communities) were leased under triple-net operating leases with expirations ranging from
less than one year to 15
years. As of
December 31, 2017
, the leases had a weighted-average remaining term of
9
years. The leases include provisions to extend the lease terms and other negotiated terms and conditions. The Company, through its subsidiaries, retains substantially all of the risks and benefits of ownership of the real estate assets leased to the tenants. The Company may receive additional security under these operating leases in the form of letters of credit and security deposits from the lessee or guarantees from the parent of the lessee. Security deposits received in cash related to tenant leases are included in accounts payable and accrued liabilities on the accompanying consolidated balance sheets and totaled
$20.3 million
and
$2.7 million
as of
December 31, 2017
and
2016
, respectively, and letters of credit deposited with the Company totaled
$81.1 million
and
$21.3 million
as of December 31, 2017 and 2016, respectively. In addition, our tenants have deposited with the Company
$28.3 million
for future real estate taxes, insurance expenditures and tenant improvements related to our properties and their operations.
As of
December 31, 2017
, the Company had a
$3.2 million
reserve for unpaid cash rents and a
$12.4 million
reserve associated with accumulated straight-line rental income. As of
December 31, 2016
, the Company had a
$3.2 million
reserve for unpaid cash rents and a
$3.7 million
reserve associated with accumulated straight-line rental income.
The following table provides information regarding significant tenant relationships representing 10% or more of the Company’s total revenues for the year ended
December 31, 2017
(dollars in thousands):
|
As of December 31, 2017
|
For the year ended December 31, 2017
|
|||||||||||
|
Number of Investments
|
% of Total Assets
|
% of Total Investments
(1)
|
% of Total Revenues
|
|||||||||
|
Genesis Healthcare, Inc.
|
54
|
|
3.5
|
%
|
5.9
|
%
|
19.8
|
%
|
||||
The Company has entered into memoranda of understanding with Genesis to market for sale up to all of its remaining Genesis facilities and to restructure its lease agreements with Genesis to increase the marketability of these facilities to potential buyers. The Company expects to complete the sale of
46
of its remaining
54
Genesis facilities in 2018 and retain
eight
facilities, although it cannot provide assurance that the sales will be completed in that timeframe, if at all. In addition, effective January 1, 2018, the annual base rent payable under the Genesis leases was reduced by
$19.0 million
pursuant to a lease restructuring agreement.
The Company monitors the creditworthiness of its tenants by reviewing credit ratings (if available) and evaluating the ability of the tenants to meet their lease obligations to the Company based on the tenants’ financial performance, including the
F-22
evaluation of any parent guarantees (or the guarantees of other related parties) of tenant lease obligations. Because formal credit ratings may not be available for most of the Company’s tenants, the primary basis for the Company’s evaluation of the credit quality of its tenants (and more specifically the tenant’s ability to pay their rent obligations to the Company) is the tenant’s lease coverage ratio or the parent’s fixed charge coverage ratio for those entities with a parent guarantee. These coverage ratios include earnings before interest, taxes, depreciation, amortization and rent (“EBITDAR”) to rent and earnings before interest, taxes, depreciation, amortization, rent and management fees (“EBITDARM”) to rent at the lease level and consolidated EBITDAR to total fixed charges at the parent guarantor level when such a guarantee exists. The Company obtains various financial and operational information from its tenants each month and reviews this information in conjunction with the above-described coverage metrics to identify financial and operational trends, evaluate the impact of the industry’s operational and financial environment (including the impact of government reimbursement), and evaluate the management of the tenant’s operations. These metrics help the Company identify potential areas of concern relative to its tenants’ credit quality and ultimately the tenant’s ability to generate sufficient liquidity to meet its obligations, including its obligation to continue to pay the rent due to the Company.
As of
December 31, 2017
, the future minimum rental payments from the Company’s properties held for investment under non-cancelable operating leases was as follows (in thousands):
|
2018
|
$
|
559,864
|
|
|
2019
|
569,288
|
|
|
|
2020
|
560,252
|
|
|
|
2021
|
558,362
|
|
|
|
2022
|
552,610
|
|
|
|
Thereafter
|
2,928,902
|
|
|
|
$
|
5,729,278
|
|
|
|
5.
|
DISPOSITIONS
|
2017 Dispositions
During the year ended
December 31, 2017
, the Company completed the sale of
31
skilled nursing/transitional care facilities and
one
senior housing community for aggregate consideration, net of closing costs, of
$150.2 million
. The net carrying value of the assets and liabilities of these facilities was
$98.2 million
, which resulted in an aggregate
$52.0 million
net gain on sale.
Excluding the net gain on sale, the Company recognized
$12.6 million
,
$15.2 million
and
$15.6 million
of net income during the years ended
December 31, 2017
,
2016
and
2015
, respectively, from these facilities. The sale of these facilities does not represent a strategic shift that has or will have a major effect on the Company’s operations and financial results, and therefore the results of operations attributable to these facilities have remained in continuing operations.
2016 Dispositions
During the year ended
December 31, 2016
, the Company completed the sale of
four
skilled nursing/transitional care facilities,
one
acute care hospital, and
one
parcel of land for aggregate consideration, net of closing costs, of
$98.0 million
. The net carrying value of the assets and liabilities of these facilities, after the impairment loss of
$29.8 million
recognized in relation to the acute care hospital, was
$104.1 million
, resulting in an aggregate
$6.1 million
loss on sale.
Excluding the net loss on sale and real estate impairment, the Company recognized
$0.7 million
of net income and
$2.3 million
of net loss during the years ended
December 31, 2016
and
2015
, respectively, from these facilities. The sale of these facilities does not represent a strategic shift that has or will have a major effect on the Company’s operations and financial results, and therefore the results of operations attributable to these facilities have remained in continuing operations.
F-23
|
6.
|
INTANGIBLE ASSETS AND LIABILITIES
|
The following table summarizes the Company’s intangible assets and liabilities as of
December 31, 2017
and
2016
(in thousands):
|
December 31,
|
||||||||
|
2017
|
2016
|
|||||||
|
Lease Intangible Assets:
|
||||||||
|
Above market leases
|
|
$
|
76,443
|
|
$
|
—
|
|
|
|
Tenant origination and absorption costs
|
|
76,336
|
|
23,987
|
|
|||
|
Tenant relationship
|
27,436
|
|
7,430
|
|
||||
|
Gross lease intangible assets
|
|
180,215
|
|
31,417
|
|
|||
|
Accumulated amortization
|
(13,096
|
)
|
(5,167
|
)
|
||||
|
Lease intangible assets, net
|
|
$
|
167,119
|
|
$
|
26,250
|
|
|
|
Lease Intangible Liabilities:
|
||||||||
|
Below market leases
|
$
|
102,643
|
|
$
|
—
|
|
||
|
Accumulated amortization
|
(4,628
|
)
|
—
|
|
||||
|
Lease intangible liabilities, net
|
$
|
98,015
|
|
$
|
—
|
|
||
The following is a summary of real estate intangible amortization income (expense) for the years ended
December 31, 2017
,
2016
and
2015
(in thousands):
|
Year Ended December 31,
|
||||||||||||
|
2017
|
2016
|
2015
|
||||||||||
|
Increase to rental income related to above/below market leases, net
|
|
$
|
912
|
|
$
|
—
|
|
$
|
—
|
|
||
|
Depreciation and amortization related to tenant origination and absorption costs and tenant relationship
|
(11,822
|
)
|
(3,182
|
)
|
(3,195
|
)
|
||||||
The remaining unamortized balance for these outstanding intangible assets and liabilities as of
December 31, 2017
will be amortized for the years ending December 31 as follows (dollars in thousands):
|
Lease Intangible
Assets |
|
Lease Intangible
Liabilities |
||||||
|
2018
|
$
|
21,814
|
|
$
|
13,588
|
|
||
|
2019
|
21,612
|
|
13,588
|
|
||||
|
2020
|
18,482
|
|
12,328
|
|
||||
|
2021
|
16,619
|
|
8,119
|
|
||||
|
2022
|
15,193
|
|
7,227
|
|
||||
|
Thereafter
|
73,399
|
|
43,165
|
|
||||
|
$
|
167,119
|
|
$
|
98,015
|
|
|||
|
|
||||||||
|
Weighted-average remaining amortization period
|
10.5 years
|
|
9.8 years
|
|
||||
F-24
|
7.
|
LOANS RECEIVABLE AND OTHER INVESTMENTS
|
As of
December 31, 2017
and
2016
, the Company’s loans receivable and other investments consisted of the following (dollars in thousands):
|
December 31, 2017
|
|||||||||||||||||||||||||
|
Investment
|
Quantity
as of December 31, 2017 |
Property Type
|
Principal Balance as of December 31, 2017
(1)
|
Book Value
as of December 31, 2017 |
Book Value
as of December 31, 2016 |
Weighted Average Contractual Interest Rate / Rate of Return
|
Weighted Average Annualized Effective Interest Rate / Rate of Return
|
Maturity Date
as of December 31, 2017 |
|||||||||||||||||
|
Loans Receivable:
|
|||||||||||||||||||||||||
|
Mortgage
|
2
|
|
Skilled Nursing / Senior Housing
|
$
|
13,366
|
|
$
|
12,351
|
|
$
|
38,262
|
|
9.9
|
%
|
11.3
|
%
|
12/31/18- 01/31/27
|
||||||||
|
Construction
|
2
|
|
Senior Housing
|
2,667
|
|
2,733
|
|
842
|
|
8.0
|
%
|
7.7
|
%
|
03/31/21- 05/31/22
|
|||||||||||
|
Mezzanine
|
2
|
|
Senior Housing
|
32,468
|
|
10,239
|
|
9,656
|
|
10.2
|
%
|
19.2
|
%
|
02/28/18- 05/25/20
|
|||||||||||
|
Pre-development
|
1
|
|
Senior Housing
|
2,357
|
|
2,357
|
|
4,023
|
|
9.0
|
%
|
8.4
|
%
|
04/01/20
|
|||||||||||
|
Other
|
15
|
|
Multiple
|
40,422
|
|
38,324
|
|
—
|
|
8.8
|
%
|
10.1
|
%
|
2/28/18- 04/30/27
|
|||||||||||
|
Debtor-in-possession
|
—
|
|
Acute Care Hospital
|
—
|
|
—
|
|
813
|
|
N/A
|
|
N/A
|
|
N/A
|
|||||||||||
|
22
|
|
91,280
|
|
66,004
|
|
53,596
|
|
9.4
|
%
|
11.6
|
%
|
||||||||||||||
|
Loan loss reserve
|
—
|
|
(97
|
)
|
(2,750
|
)
|
|||||||||||||||||||
|
$
|
91,280
|
|
$
|
65,907
|
|
$
|
50,846
|
|
|||||||||||||||||
|
Other Investments:
|
|||||||||||||||||||||||||
|
Preferred Equity
|
12
|
|
Skilled Nursing / Senior Housing
|
48,035
|
|
48,483
|
|
45,190
|
|
12.6
|
%
|
12.6
|
%
|
N/A
|
|||||||||||
|
Total
|
34
|
|
$
|
139,315
|
|
$
|
114,390
|
|
$
|
96,036
|
|
10.5
|
%
|
12.0
|
%
|
||||||||||
|
(1)
|
Principal balance includes amounts funded and accrued but unpaid interest/preferred return and excludes capitalizable fees.
|
In connection with the CCP Merger, the Company acquired
18
loans receivable investments with a principal balance of
$83.3 million
and fair value of
$58.2 million
as of August 17, 2017. Of these loans,
eight
loans receivable investments with a principal balance of
$36.3 million
were considered to have deteriorated credit quality, and based on the collateral or expected cash flows, the fair value was determined to be
$11.3 million
as of August 17, 2017. The accretable yield was
$2.9 million
and
$2.7 million
as of August 17, 2017 and December 31, 2017, respectively. The decrease was due to
$0.2 million
of accretion recorded in interest and other income during the year ended December 31, 2017. As of December 31, 2017, the book value of these loans was
$10.0 million
.
During the year ended
December 31, 2017
, the Company recorded a provision for loan losses of
$4.8 million
related to
two
loans receivable investments, both of which were repaid as of December 31, 2017, and reduced its portfolio-based loan loss reserve by
$0.3 million
. As of
December 31, 2017
, the Company had
no
specific loan loss reserve and had a
$0.1 million
portfolio-based loan loss reserve. As of
December 31, 2017
, the Company did
not
consider any loans receivable investments to be impaired, and
one
loan receivable with a book value of
$0
was on nonaccrual status.
During the year ended
December 31, 2016
, the Company recorded a provision for loan losses of
$3.1 million
related to
four
loans receivable investments during the year ended
December 31, 2016
,
one
of which was partially repaid prior to
December 31, 2016
through the foreclosure of the real estate asset, and reduced its portfolio-based loan loss reserve by
$1.3 million
during the year ended
December 31, 2016
. The Company’s specific loan loss reserve was
$2.3 million
and the portfolio-based loan loss reserve was
$0.4 million
as of
December 31, 2016
. As of
December 31, 2016
, the Company considered
three
loans receivable investments with an aggregate principal balance of
$17.4 million
to be impaired.
F-25
|
8.
|
DEBT
|
Secured Indebtedness
The Company’s secured debt consists of the following (dollars in thousands):
|
Interest Rate Type
|
Principal as of
December 31, 2017 (1) |
Principal as of
December 31, 2016 (1) |
Weighted Average Effective Interest Rate at
December 31, 2017 (2) |
Maturity Date
|
||||||||
|
Fixed Rate
|
$
|
160,702
|
|
$
|
163,638
|
|
3.87
|
%
|
December 2021 -
August 2051 |
|||
|
Variable Rate
|
98,500
|
|
—
|
|
3.36
|
%
|
July 2019
|
|||||
|
$
|
259,202
|
|
$
|
163,638
|
|
3.68
|
%
|
|||||
|
(1)
|
Principal balance does not include deferred financing costs, net of
$2.8 million
and
$2.9 million
as of
December 31, 2017
and
2016
, respectively.
|
|
(2)
|
Weighted average effective interest rate includes private mortgage insurance.
|
On August 17, 2017, in connection with the CCP Merger (see Note 3, “CCP Merger and Recent Real Estate Acquisitions”), the Company assumed a
$98.5 million
variable rate secured term loan that bears interest at
LIBOR plus 1.80%
and matures in
July 2019
.
Senior Unsecured Notes
The Company’s senior unsecured notes consist of the following (dollars in thousands):
|
Principal Balance as of December 31,
|
||||||||||
|
Title
|
Maturity Date
|
2017
(1)
|
2016
(1)
|
|||||||
|
5.5% senior unsecured notes due 2021 (“2021 Notes”)
|
February 1, 2021
|
$
|
500,000
|
|
$
|
500,000
|
|
|||
|
5.375% senior unsecured notes due 2023 (“2023 Notes”)
|
June 1, 2023
|
200,000
|
|
200,000
|
|
|||||
|
5.125% senior unsecured notes due 2026 (“2026 Notes”)
|
August 15, 2026
|
500,000
|
|
—
|
|
|||||
|
5.38% senior unsecured notes due 2027 (“2027 Notes”)
|
May 17, 2027
|
100,000
|
|
—
|
|
|||||
|
$
|
1,300,000
|
|
$
|
700,000
|
|
|||||
|
(1)
|
Principal balance does not include premium, net of
$15.9 million
and deferred financing costs, net of
$9.6 million
as of
December 31, 2017
and does not include discount, net of
$0.5 million
and deferred financing costs, net of
$11.2 million
as of
December 31, 2016
.
|
5.5%
Notes Due 2021
. On January 23, 2014, the Operating Partnership and Sabra Capital Corporation, wholly owned subsidiaries of the Company (the “Issuers”), issued
$350.0 million
aggregate principal amount of
5.5%
senior unsecured notes due 2021 (the “Original 2021 Notes”), and on October 10, 2014, they issued
$150.0 million
aggregate principal amount of
5.5%
senior unsecured notes due 2021, which are treated as a single class with, and have the same terms as, the Original 2021 Notes (the additional notes and the Original 2021 Notes, together, the “2021 Notes”). The 2021 Notes accrue interest at a rate of
5.5%
per annum payable semiannually on February 1 and August 1 of each year.
The 2021 Notes are redeemable at the option of the Issuers, in whole or in part, at any time, and from time to time, on or after February 1, 2017, at the redemption prices set forth in the indenture governing the 2021 Notes, plus accrued and unpaid interest to the applicable redemption date. Assuming the 2021 Notes are not redeemed, the 2021 Notes mature on February 1, 2021.
5.375%
Notes Due 2023.
On May 23, 2013, the Issuers issued
$200.0 million
aggregate principal amount of
5.375%
senior unsecured notes due 2023 (the “2023 Notes”). The 2023 Notes accrue interest at a rate of
5.375%
per annum payable semiannually on June 1 and December 1 of each year.
The 2023 Notes are redeemable at the option of the Issuers, in whole or in part, at any time, and from time to time, on or after June 1, 2018, at the redemption prices set forth in the indenture governing the 2023 Notes, plus accrued and unpaid interest to the applicable redemption date. In addition, prior to June 1, 2018, the Issuers may redeem all or a portion of the 2023 Notes at a redemption price equal to
100%
of the principal amount of the 2023 Notes redeemed, plus a “make-whole” premium, plus accrued and unpaid interest to the applicable redemption date. Assuming the 2023 Notes are not redeemed, the 2023 Notes mature on June 1, 2023.
5.125%
Notes Due 2026
. In connection with the CCP Merger, on August 17, 2017, the Operating Partnership assumed
$500.0 million
aggregate principal amount of
5.125%
senior unsecured notes due 2026 (the “2026 Notes”) issued by Care
F-26
Capital Properties, LP in July 2016 (see Note 3, “CCP Merger and Recent Real Estate Acquisitions”). The 2026 Notes accrue interest at a rate of
5.125%
per annum payable semiannually on February 15 and August 15 of each year.
The Operating Partnership may, at its option, redeem the 2026 Notes at any time in whole or from time to time in part prior to their stated maturity. The redemption price for 2026 Notes that are redeemed will be equal to (i) 100% of their principal amount, together with accrued and unpaid interest thereon, if any, to (but excluding) the date of redemption, plus, (ii) if redeemed prior to May 15, 2026, a make-whole premium. Assuming the 2026 Notes are not redeemed, the 2026 Notes mature on August 15, 2026.
5.38%
Notes Due 2027
. In connection with the CCP Merger, on August 17, 2017, the Operating Partnership assumed
$100.0 million
aggregate principal amount of unregistered
5.38%
senior unsecured notes due 2027 (the “2027 Notes”) issued by Care Capital Properties, LP in May 2016 (see Note 3, “CCP Merger and Recent Real Estate Acquisitions”). The 2027 Notes accrue interest at a rate of
5.38%
per annum payable semiannually on May 17 and November 17 of each year.
The Operating Partnership may prepay the 2027 Notes, in whole at any time or in part from time to time, at
100%
of the principal amount to be prepaid plus a make-whole premium. Assuming the 2027 Notes are not redeemed, the 2027 Notes mature on May 17, 2027.
The obligations under the 2021 Notes, 2023 Notes and 2027 Notes are fully and unconditionally guaranteed, jointly and severally, on an unsecured basis, by Sabra and certain subsidiaries of Sabra; provided, however, that such guarantees are subject to release under certain customary circumstances. The obligations under the 2026 Notes are fully and unconditionally guaranteed, on an unsecured basis, by Sabra; provided, however, that such guarantee is subject to release under certain customary circumstances. See Note 15, “Summarized Consolidating Information,” for additional information concerning the circumstances pursuant to which the guarantors will be automatically and unconditionally released from their obligations under the guarantees.
The indenture governing the 2021 Notes and 2023 Notes contains restrictive covenants that, among other things, restrict the ability of Sabra, the Issuers and their restricted subsidiaries to: (i) incur or guarantee additional indebtedness; (ii) incur or guarantee secured indebtedness; (iii) pay dividends or distributions on, or redeem or repurchase, their capital stock; (iv) make certain investments or other restricted payments; (v) sell assets; (vi) create liens on their assets; (vii) enter into transactions with affiliates; (viii) merge or consolidate or sell all or substantially all of their assets; and (ix) create restrictions on the ability of Sabra’s restricted subsidiaries to pay dividends or other amounts to Sabra. Such limitations on distributions also include a limitation on the extent of allowable cumulative distributions made, which shall not exceed the greater of (a) the sum of (x)
95%
of cumulative Adjusted Funds from Operations and (y) the net proceeds from the issuance of common and preferred equity and (b) the minimum amount of distributions required for the Company to maintain its REIT status. The indenture governing the 2021 Notes and 2023 Notes also provides for customary events of default, including, but not limited to, the failure to make payments of interest or premium, if any, on, or principal of, the 2021 Notes and 2023 Notes, the failure to comply with certain covenants and agreements specified in the indenture for a period of time after notice has been provided, the acceleration of other indebtedness resulting from the failure to pay principal on such other indebtedness prior to its maturity, and certain events of insolvency. If any event of default occurs, the principal of, premium, if any, and accrued interest on all the then-outstanding 2021 Notes and 2023 Notes may become due and payable immediately. The indenture governing the 2021 Notes and 2023 Notes requires us to maintain Total Unencumbered Assets (as defined in the indenture) of at least
150%
of our unsecured indebtedness.
The indenture governing the 2026 Notes contains certain covenants that, among other things, limits the ability of Sabra, the Issuer and our subsidiaries to: (i) consummate a merger, consolidate or sell all or substantially all of our consolidated assets and (ii) incur secured or unsecured indebtedness. In addition, we are required to maintain at all times consolidated unencumbered total asset value in an amount not less than
150%
of the aggregate outstanding principal amount of our consolidated unsecured debt.
The agreement governing the 2027 Notes provides for customary events of default, including, but not limited to, the failure to make payments of interest or premium, if any, on, or principal of, the 2027 Notes, the failure to comply with certain covenants and agreements specified in the agreement governing the 2027 Notes for a period of time after notice has been provided, the acceleration of other indebtedness resulting from the failure to pay principal on such other indebtedness prior to its maturity, and certain events of insolvency. In addition, certain change of control events constitute an event of default under the agreement governing the 2027 Notes. If any event of default occurs, the principal of, premium, if any, and accrued interest on all the then-outstanding 2027 Notes may become due and payable immediately.
The Company was in compliance with all applicable financial covenants under the indentures and agreements (the “Senior Notes Indentures”) governing the 2021 Notes, 2023 Notes, 2026 Notes and 2027 Notes (collectively, the “Senior Notes”) outstanding as of
December 31, 2017
.
F-27
Credit Facility
On January 14, 2016, the Operating Partnership and Sabra Canadian Holdings, LLC (together, the “Borrowers”) entered into a third amended and restated unsecured credit facility (the “Prior Credit Facility”).
The Prior Credit Facility included a revolving credit facility (the “Prior Revolving Credit Facility”) and U.S. dollar and Canadian dollar term loans (collectively, the “Prior Term Loans”). The Prior Revolving Credit Facility provided for a borrowing capacity of
$500.0 million
and, in addition, provided for U.S. dollar and Canadian dollar term loans of
$245.0 million
and CAD
$125.0 million
, respectively. Further, up to
$125.0 million
of the Prior Revolving Credit Facility could be used for borrowings in certain foreign currencies. The Prior Credit Facility also contained an accordion feature that allowed for an increase in the total available borrowings to
$1.25 billion
, subject to terms and conditions. In addition, the Canadian dollar term loan was re-designated as a net investment hedge (see Note 9, “Derivative and Hedging Instruments,” for further information).
The Prior Revolving Credit Facility had a maturity date of January 14, 2020, and included
two
six
-month extension options. The Prior Term Loans had a maturity date of January 14, 2021.
Borrowings under the Prior Revolving Credit Facility bore interest on the outstanding principal amount at a rate equal to an applicable percentage plus, at the Operating Partnership’s option, either (a) LIBOR or (b) a base rate determined as the greater of (i) the federal funds rate plus
0.5%
, (ii) the prime rate, and (iii) one-month LIBOR plus
1.0%
(the “Base Rate”). The applicable percentage for borrowings varied based on the Consolidated Leverage Ratio, as defined in the credit agreement for the Prior Credit Facility, and ranged from
1.80%
to
2.40%
per annum for LIBOR based borrowings and
0.80%
to
1.40%
per annum for borrowings at the Base Rate. In addition, the Operating Partnership paid an unused facility fee to the lenders equal to
0.25%
or
0.30%
per annum, which was determined by usage under the Prior Revolving Credit Facility.
The Prior Term Loans bore interest as follows: the U.S. dollar term loan bore interest on the outstanding principal amount at a rate equal to an applicable percentage plus, at the Operating Partnership’s option, either (a) LIBOR or (b) the Base Rate (the applicable percentage varied based on the Consolidated Leverage Ratio, as defined in the credit agreement for the Prior Credit Facility, and ranged from
1.75%
to
2.35%
per annum for LIBOR based borrowings and
0.75%
to
1.35%
per annum for borrowings at the Base Rate); and the Canadian dollar term loan bore interest on the outstanding principal amount at a rate equal to the Canadian Dollar Offered Rate (“CDOR”) plus
1.75%
to
2.35%
depending on the Consolidated Leverage Ratio.
Effective on August 17, 2017, the Borrowers, Sabra and the other parties thereto entered into a fourth amended and restated unsecured credit facility (the “Credit Facility”). The Credit Facility amends and restates the Prior Credit Facility. The Company recognized a
$0.6 million
loss on extinguishment of debt related to write-offs of deferred financing costs in connection with amending and restating the Prior Credit Facility during the year ended
December 31, 2017
.
The Credit Facility includes a
$1.0 billion
revolving credit facility (the “Revolving Credit Facility”),
$1.1 billion
in U.S. dollar term loans and a CAD
$125.0 million
Canadian dollar term loan (collectively, the “Term Loans”). Further, up to
$175.0 million
of the Revolving Credit Facility may be used for borrowings in certain foreign currencies. The Credit Facility also contains an accordion feature that can increase the total available borrowings to
$2.5 billion
, subject to terms and conditions.
The Revolving Credit Facility has a maturity date of August 17, 2021, and includes
two
six
-month extension options.
$200 million
of the U.S. dollar Term Loans has a maturity date of August 17, 2020, and the other Term Loans have a maturity date of August 17, 2022.
As of
December 31, 2017
, there was
$641.0 million
outstanding under the Revolving Credit Facility and
$359.0 million
available for borrowing.
Borrowings under the Revolving Credit Facility bear interest on the outstanding principal amount at a rate equal to an applicable interest margin plus, at the Operating Partnership’s option, either (a) LIBOR or (b) the Base Rate. On August 17, 2017, Sabra’s ratings met the Investment Grade Ratings Criteria (as defined in the credit agreement), and Sabra elected to use the ratings-based applicable interest margin for borrowings which will vary based on the Debt Ratings, as defined in the credit agreement, and will range from
0.875%
to
1.65%
per annum for LIBOR based borrowings and
0.00%
to
0.65%
per annum for borrowings at the Base Rate. As of
December 31, 2017
, the interest rate on the Revolving Credit Facility was
2.81%
. In addition, the Operating Partnership pays a facility fee ranging between
0.125%
and
0.300%
per annum based on the aggregate amount of commitments under the Revolving Credit Facility regardless of amounts outstanding thereunder.
The U.S. dollar Term Loans bear interest on the outstanding principal amount at a rate equal to an applicable interest margin plus, at the Operating Partnership’s option, either (a) LIBOR or (b) the Base Rate. The ratings-based applicable interest margin for borrowings will vary based on the Debt Ratings, as defined in the credit agreement, and will range from
0.90%
to
1.90%
per annum for LIBOR based borrowings and
0.00%
to
0.90%
per annum for borrowings at the Base Rate. The Canadian
F-28
dollar Term Loan bears interest on the outstanding principal amount at a rate equal to CDOR plus an interest margin that will range from
0.90%
to
1.90%
depending on the Debt Ratings.
On June 10, 2015, the Company entered into an interest rate swap agreement to fix the CDOR portion of the interest rate for CAD
$90.0 million
of its Canadian dollar Term Loan at
1.59%
. In addition, CAD
$90.0 million
of the Canadian dollar Term Loan was designated as a net investment hedge. On August 10, 2016, the Company entered into
two
interest rate swap agreements to fix the LIBOR portion of the interest rate for
$245.0 million
of its U.S. dollar Term Loans at
0.90%
and
one
interest rate swap agreement to fix the CDOR portion on CAD
$35.0 million
of its Canadian dollar Term Loan at
0.93%
. In addition, the Company terminated the
five
-year interest rate cap contract that capped LIBOR at
2.0%
. See Note 9, “Derivative and Hedging Instruments,” for further information.
As a result of the CCP Merger (see Note 3, “CCP Merger and Recent Real Estate Acquisitions”), the Company assumed
eight
interest rate swap agreements that fix the LIBOR portion of the interest rate for
$600 million
of the Company’s U.S. dollar Term Loans at a weighted average rate of
1.31%
. See Note 9, “Derivative and Hedging Instruments,” for further information.
The obligations of the Borrowers under the Credit Facility are guaranteed by Sabra and certain subsidiaries of Sabra.
The Credit Facility contains customary covenants that include restrictions or limitations on the ability to make acquisitions and other investments, pay dividends, incur additional indebtedness, engage in non-healthcare related business activities, enter into transactions with affiliates and sell or otherwise transfer certain assets as well as customary events of default. The Credit Facility also requires Sabra, through the Operating Partnership, to comply with specified financial covenants, which include a maximum leverage ratio, a minimum fixed charge coverage ratio and a minimum tangible net worth requirement. As of
December 31, 2017
, the Company was in compliance with all applicable financial covenants under the Credit Facility.
Interest Expense
During the
years
ended
December 31, 2017
,
2016
and
2015
, the Company incurred interest expense of
$88.4 million
, $
64.9 million
and
$59.2 million
, respectively. Interest expense includes non-cash interest expense of
$7.8 million
,
$5.7 million
and
$5.3 million
for the
years
ended
December 31, 2017
,
2016
and
2015
, respectively. As of
December 31, 2017
and
2016
, the Company had $
24.7 million
and $
13.8 million
, respectively, of accrued interest included in accounts payable and accrued liabilities on the accompanying consolidated balance sheets.
Maturities
The following is a schedule of maturities for the Company’s outstanding debt as of
December 31, 2017
(in thousands):
|
Secured
Indebtedness
|
Revolving
Credit Facility
(1)
|
Term Loans
|
Senior Notes
|
Total
|
|||||||||||||||
|
2018
|
$
|
4,301
|
|
$
|
—
|
|
$
|
—
|
|
$
|
—
|
|
$
|
4,301
|
|
||||
|
2019
|
102,945
|
|
—
|
|
—
|
|
—
|
|
102,945
|
|
|||||||||
|
2020
|
4,594
|
|
—
|
|
200,000
|
|
—
|
|
204,594
|
|
|||||||||
|
2021
|
20,482
|
|
641,000
|
|
—
|
|
500,000
|
|
1,161,482
|
|
|||||||||
|
2022
|
4,285
|
|
—
|
|
999,587
|
|
—
|
|
1,003,872
|
|
|||||||||
|
Thereafter
|
122,595
|
|
—
|
|
—
|
|
800,000
|
|
922,595
|
|
|||||||||
|
Total Debt
|
259,202
|
|
641,000
|
|
1,199,587
|
|
1,300,000
|
|
3,399,789
|
|
|||||||||
|
Premium, net
|
—
|
|
—
|
|
—
|
|
15,915
|
|
15,915
|
|
|||||||||
|
Deferred financing costs, net
|
(2,772
|
)
|
—
|
|
(8,813
|
)
|
(9,629
|
)
|
(21,214
|
)
|
|||||||||
|
Total Debt, Net
|
$
|
256,430
|
|
$
|
641,000
|
|
$
|
1,190,774
|
|
$
|
1,306,286
|
|
$
|
3,394,490
|
|
||||
|
(1)
|
Revolving Credit Facility is subject to
two
six
-month extension options.
|
|
9.
|
DERIVATIVE AND HEDGING INSTRUMENTS
|
The Company is exposed to various market risks, including the potential loss arising from adverse changes in interest rates and foreign exchange rates. The Company enters into derivative financial instruments to manage exposures that arise from business activities that result in the receipt or payment of future known and uncertain cash amounts, the value of which are determined by interest rates and foreign exchange rates. The Company’s derivative financial instruments are used to manage
F-29
differences in the amount of the Company’s known or expected cash receipts and its known or expected cash payments principally related to the Company’s investments and borrowings.
Certain of the Company’s foreign operations expose the Company to fluctuations of foreign interest rates and exchange rates. These fluctuations may impact the value in the Company’s functional currency, the U.S. dollar, of the Company’s investment in foreign operations, the cash receipts and payments related to these foreign operations and payments of interest and principal under Canadian dollar denominated debt. The Company enters into derivative financial instruments to protect the value of its foreign investments and fix a portion of the interest payments for certain debt obligations. The Company does not enter into derivatives for speculative purposes.
Cash Flow Hedges
The Company’s objectives in using interest rate derivatives are to add stability to interest expense and to manage its exposure to interest rate movements. To accomplish these objectives, the Company primarily uses interest rate swaps as part of its interest rate risk management strategy. Approximately
$1.1 million
of losses, which are included in accumulated other comprehensive loss, as of
December 31, 2017
, are expected to be reclassified into earnings in the next 12 months. During the year ended December 31, 2016, the Company terminated its interest rate cap, generating cash proceeds of
$0.3 million
. The balance of the loss in other comprehensive income will be reclassified to earnings through 2019.
Net Investment Hedges
The Company is exposed to fluctuations in foreign exchange rates on investments it holds in Canada. The Company uses cross currency interest rate swaps to hedge its exposure to changes in foreign exchange rates on these foreign investments.
The following presents the notional amount of derivatives instruments as of the dates indicated (in thousands):
|
December 31, 2017
|
December 31, 2016
|
|||||||
|
Derivatives designated as cash flow hedges:
|
||||||||
|
Denominated in U.S. Dollars
|
$
|
845,000
|
|
$
|
245,000
|
|
||
|
Denominated in Canadian Dollars
|
$
|
125,000
|
|
$
|
125,000
|
|
||
|
Derivatives designated as net investment hedges:
|
||||||||
|
Denominated in Canadian Dollars
|
$
|
56,300
|
|
$
|
56,300
|
|
||
|
Financial instrument designated as net investment hedge:
|
||||||||
|
Denominated in Canadian Dollars
|
$
|
125,000
|
|
$
|
125,000
|
|
||
Derivative and Financial Instruments Designated as Hedging Instruments
The following is a summary of the derivative and financial instruments designated as hedging instruments held by the Company at
December 31, 2017
and
2016
(dollars in thousands):
|
Count as of December 31, 2017
|
Fair Value
|
Maturity Dates
|
|||||||||||||||
|
December 31,
|
|||||||||||||||||
|
Type
|
Designation
|
2017
|
2016
|
Balance Sheet Location
|
|||||||||||||
|
Assets:
|
|||||||||||||||||
|
Interest rate swap
|
Cash Flow
|
12
|
|
$
|
25,221
|
|
$
|
8,083
|
|
2020 - 2023
|
Accounts receivable, prepaid expenses and other assets, net
|
||||||
|
Cross currency interest rate swaps
|
Net Investment
|
2
|
|
674
|
|
3,157
|
|
2025
|
Accounts receivable, prepaid expenses and other assets, net
|
||||||||
|
$
|
25,895
|
|
$
|
11,240
|
|
||||||||||||
|
Liabilities:
|
|||||||||||||||||
|
Interest rate swap
|
Cash Flow
|
—
|
|
$
|
—
|
|
$
|
716
|
|
2020
|
Accounts payable and accrued liabilities
|
||||||
|
CAD term loan
|
Net Investment
|
1
|
|
99,588
|
|
93,000
|
|
2022
|
Term loans, net
|
||||||||
|
$
|
99,588
|
|
$
|
93,716
|
|
||||||||||||
F-30
The following presents the effect of the Company’s derivative and financial instruments designated as hedging instruments on the consolidated statements of income and the consolidated statements of equity for years ended
December 31, 2017
,
2016
and
2015
:
|
Gain (Loss) Recognized in Other Comprehensive Income
(Effective Portion)
|
Gain (Loss) Reclassified from Accumulated Other Comprehensive Income Into Income (Effective Portion)
|
Income Statement Location
|
||||||||||||||||||||||||
|
For the year ended December 31,
|
||||||||||||||||||||||||||
|
2017
|
2016
|
2015
|
2017
|
2016
|
2015
|
|||||||||||||||||||||
|
Cash Flow Hedges:
|
||||||||||||||||||||||||||
|
Interest rate products
|
$
|
10,807
|
|
$
|
5,879
|
|
$
|
(4,764
|
)
|
$
|
(2,174
|
)
|
$
|
(1,360
|
)
|
$
|
(319
|
)
|
Interest expense
|
|||||||
|
Net Investment Hedges:
|
||||||||||||||||||||||||||
|
Foreign currency products
|
(2,378
|
)
|
(2,085
|
)
|
5,476
|
|
—
|
|
—
|
|
—
|
|
N/A
|
|||||||||||||
|
CAD term loan
|
(6,588
|
)
|
(3,750
|
)
|
(8,352
|
)
|
—
|
|
—
|
|
—
|
|
N/A
|
|||||||||||||
|
$
|
1,841
|
|
$
|
44
|
|
$
|
(7,640
|
)
|
$
|
(2,174
|
)
|
$
|
(1,360
|
)
|
$
|
(319
|
)
|
|||||||||
During the year ended
December 31, 2017
, the Company determined that a portion of a cash flow hedge was ineffective and recognized
$22,000
of unrealized gains related to its interest rate swaps to other income on the consolidated statements of income. During the year ended
December 31, 2016
, the Company determined that a portion of a cash flow hedge was ineffective and recognized
$0.8 million
of unrealized gains related to its interest rate swaps to other income on the consolidated statements of income. During the year ended
December 31, 2015
, the Company recorded
no
hedge ineffectiveness in earnings.
Derivatives Not Designated as Hedging Instruments
During the year ended
December 31, 2017
, the Company recorded
$8,000
of other expense related to a cross currency interest rate swap not designated as a hedging instrument. As of
December 31, 2017
and
2016
, the Company’s derivatives were all designated as hedging instruments.
Offsetting Derivatives
The Company enters into master netting arrangements, which reduce credit risk by permitting net settlement of transactions with the same counterparty. The table below presents a gross presentation, the effects of offsetting, and a net presentation of the Company’s derivatives as of
December 31, 2017
and
2016
(in thousands):
|
As of December 31, 2017
|
||||||||||||||||||||||||
|
Gross Amounts Not Offset in the Balance Sheet
|
||||||||||||||||||||||||
|
Gross Amounts of Recognized Assets / Liabilities
|
Gross Amounts Offset in the Balance Sheet
|
Net Amounts of Assets / Liabilities presented in the Balance Sheet
|
Financial Instruments
|
Cash Collateral Received
|
Net Amount
|
|||||||||||||||||||
|
Offsetting Assets:
|
||||||||||||||||||||||||
|
Derivatives
|
$
|
25,895
|
|
$
|
—
|
|
$
|
25,895
|
|
$
|
—
|
|
$
|
—
|
|
$
|
25,895
|
|
||||||
|
Offsetting Liabilities:
|
||||||||||||||||||||||||
|
Derivatives
|
$
|
—
|
|
$
|
—
|
|
$
|
—
|
|
$
|
—
|
|
$
|
—
|
|
$
|
—
|
|
||||||
|
As of December 31, 2016
|
||||||||||||||||||||||||
|
Gross Amounts Not Offset in the Balance Sheet
|
||||||||||||||||||||||||
|
Gross Amounts of Recognized Assets / Liabilities
|
Gross Amounts Offset in the Balance Sheet
|
Net Amounts of Assets / Liabilities presented in the Balance Sheet
|
Financial Instruments
|
Cash Collateral Received
|
Net Amount
|
|||||||||||||||||||
|
Offsetting Assets:
|
||||||||||||||||||||||||
|
Derivatives
|
$
|
11,240
|
|
$
|
—
|
|
$
|
11,240
|
|
$
|
(716
|
)
|
$
|
—
|
|
$
|
10,524
|
|
||||||
|
Offsetting Liabilities:
|
||||||||||||||||||||||||
|
Derivatives
|
$
|
716
|
|
$
|
—
|
|
$
|
716
|
|
$
|
(716
|
)
|
$
|
—
|
|
$
|
—
|
|
||||||
F-31
Credit-risk-related Contingent Features
The Company has agreements with each of its derivative counterparties that contain a provision pursuant to which the Company could be declared in default on the derivative obligation if the Company defaults on any of its indebtedness, including a default where repayment of the indebtedness has not been accelerated by the lender.
As of
December 31, 2017
, the Company had no derivatives with a fair value in a net liability position.
10.
FAIR VALUE DISCLOSURES
Financial Instruments
The fair value for certain financial instruments is derived using a combination of market quotes, pricing models and other valuation techniques that involve significant management judgment. The price transparency of financial instruments is a key determinant of the degree of judgment involved in determining the fair value of the Company’s financial instruments.
Financial instruments for which actively quoted prices or pricing parameters are available and whose markets contain orderly transactions will generally have a higher degree of price transparency than financial instruments whose markets are inactive or consist of non-orderly trades. The Company evaluates several factors when determining if a market is inactive or when market transactions are not orderly. The carrying values of cash and cash equivalents, restricted cash, accounts payable, accrued liabilities and the Credit Facility are reasonable estimates of fair value because of the short-term maturities of these instruments. Fair values for other financial instruments are derived as follows:
Loans receivable
: These instruments are presented on the accompanying consolidated balance sheets at their amortized cost and not at fair value. The fair values of the loans receivable were estimated using an internal valuation model that considered the expected cash flows for the loans receivable, as well as the underlying collateral value and other credit enhancements as applicable. As such, the Company classifies these instruments as Level 3.
Preferred equity investments
: These instruments are presented on the accompanying consolidated balance sheets at their cost and not at fair value. The fair values of the preferred equity investments were estimated using an internal valuation model that considered the expected future cash flows for the preferred equity investment, the underlying collateral value and other credit enhancements. As such, the Company classifies these instruments as Level 3.
Derivative instruments
: The Company’s derivative instruments are presented at fair value on the accompanying consolidated balance sheets. The Company estimates the fair value of derivative instruments, including its interest rate swaps and cross currency swaps, using the assistance of a third party using inputs that are observable in the market, which include forward yield curves and other relevant information. Although the Company has determined that the majority of the inputs used to value its derivative financial instruments fall within Level 2 of the fair value hierarchy, the credit valuation adjustments associated with its derivative financial instruments utilize Level 3 inputs, such as estimates of current credit spreads, to evaluate the likelihood of default by itself and its counterparties. The Company has assessed the significance of the impact of the credit valuation adjustments on the overall valuation of its derivative positions and has determined that the credit valuation adjustments are not significant to the overall valuation of its derivative financial instruments. As a result, the Company has determined that its derivative financial instruments valuations in their entirety are classified in Level 2 of the fair value hierarchy.
Senior Notes
: These instruments are presented on the accompanying consolidated balance sheets at their outstanding principal balance, net of unamortized deferred financing costs and premiums/discounts and not at fair value. The fair values of the Senior Notes were determined using third-party market quotes derived from orderly trades. As such, the Company classifies these instruments as Level 2.
Secured indebtedness
: These instruments are presented on the accompanying consolidated balance sheets at their outstanding principal balance, net of unamortized deferred financing costs and premiums/discounts and not at fair value. The fair values of the Company’s secured debt were estimated using a discounted cash flow analysis based on management’s estimates of current market interest rates for instruments with similar characteristics, including remaining loan term, loan-to-value ratio, type of collateral and other credit enhancements. As such, the Company classifies these instruments as Level 3.
F-32
The following are the face values, carrying amounts and fair values of the Company’s financial instruments as of
December 31, 2017
and
2016
whose carrying amounts do not approximate their fair value (in thousands):
|
|
December 31, 2017
|
December 31, 2016
|
|||||||||||||||||||||
|
|
Face
Value (1) |
Carrying
Amount (2) |
Fair
Value |
Face
Value (1) |
Carrying
Amount (2) |
Fair
Value |
|||||||||||||||||
|
Financial assets:
|
|||||||||||||||||||||||
|
Loans receivable
|
$
|
91,280
|
|
$
|
65,907
|
|
$
|
65,892
|
|
$
|
53,484
|
|
$
|
50,846
|
|
$
|
51,914
|
|
|||||
|
Preferred equity investments
|
48,035
|
|
48,483
|
|
47,064
|
|
44,882
|
|
45,190
|
|
48,332
|
|
|||||||||||
|
Financial liabilities:
|
|||||||||||||||||||||||
|
Senior Notes
|
1,300,000
|
|
1,306,286
|
|
1,329,191
|
|
700,000
|
|
688,246
|
|
709,500
|
|
|||||||||||
|
Secured indebtedness
|
259,202
|
|
256,430
|
|
246,461
|
|
163,638
|
|
160,752
|
|
150,091
|
|
|||||||||||
|
(1)
|
Face value represents amounts contractually due under the terms of the respective agreements.
|
|
(2)
|
Carrying amount represents the book value of financial instruments, including unamortized premiums/discounts and deferred financing costs.
|
The Company determined the fair value of financial instruments as of
December 31, 2017
whose carrying amounts do not approximate their fair value with valuation methods utilizing the following types of inputs (in thousands):
|
Fair Value Measurements Using
|
|||||||||||||||
|
Total
|
Quoted Prices in Active Markets for Identical Assets
(Level 1) |
Significant Other Observable Inputs
(Level 2) |
Significant Unobservable Inputs
(Level 3) |
||||||||||||
|
Financial assets:
|
|||||||||||||||
|
Loans receivable
|
$
|
65,892
|
|
$
|
—
|
|
$
|
—
|
|
$
|
65,892
|
|
|||
|
Preferred equity investments
|
47,064
|
|
—
|
|
—
|
|
47,064
|
|
|||||||
|
Financial liabilities:
|
|||||||||||||||
|
Senior Notes
|
1,329,191
|
|
—
|
|
1,329,191
|
|
—
|
|
|||||||
|
Secured indebtedness
|
246,461
|
|
—
|
|
—
|
|
246,461
|
|
|||||||
Disclosure of the fair value of financial instruments is based on pertinent information available to the Company at the applicable dates and requires a significant amount of judgment. Despite increased capital market and credit market activity, transaction volume for certain financial instruments remains relatively low. This has made the estimation of fair values difficult and, therefore, both the actual results and the Company’s estimate of fair value at a future date could be materially different.
Items Measured at Fair Value on a Recurring Basis
During the year ended
December 31, 2017
, the Company recorded the following amounts measured at fair value (in thousands):
|
Fair Value Measurements Using
|
|||||||||||||||
|
Total
|
Quoted Prices in Active Markets for Identical Assets
(Level 1) |
Significant Other Observable Inputs
(Level 2) |
Significant Unobservable Inputs
(Level 3) |
||||||||||||
|
Recurring Basis:
|
|||||||||||||||
|
Financial assets:
|
|||||||||||||||
|
Interest rate swap
|
$
|
25,221
|
|
$
|
—
|
|
$
|
25,221
|
|
$
|
—
|
|
|||
|
Cross currency swap
|
674
|
|
—
|
|
674
|
|
—
|
|
|||||||
The Company entered into contingent consideration arrangements that were outstanding during the year ended
December 31, 2017
in connection with
three
acquisitions of real estate (see Note 4, “Real Estate Properties Held for Investment”). During the year ended
December 31, 2017
,
one
earn-out arrangement expired and resulted in a
$0
payout, and a second earn-out arrangement was terminated in connection with the transition of the
eight
senior housing communities to Senior Housing - Managed communities. In order to determine the fair value of the Company’s remaining contingent consideration arrangement, the Company used significant inputs not observable in the market to calculate the contingent consideration. The Company used financial information provided by the facility to calculate the contingent consideration liability of
$0.4 million
, which was paid in November 2017.
F-33
The following reconciliation provides the details of activity for the contingent consideration liability recorded at fair value using Level 3 inputs (in thousands):
|
Balance as of December 31, 2015
|
$
|
2,700
|
|
|
Decrease in contingent consideration liability
|
(1,876
|
)
|
|
|
Foreign currency translation
|
(6
|
)
|
|
|
Balance as of December 31, 2016
|
$
|
818
|
|
|
Decrease in contingent consideration liability
|
(426
|
)
|
|
|
Payment of contingent consideration liability
|
(382
|
)
|
|
|
Foreign currency translation
|
(10
|
)
|
|
|
Balance as of December 31, 2017
|
$
|
—
|
|
The following reconciliation provides the details of activity for the contingent consideration asset recorded at fair value using Level 3 inputs (in thousands):
|
Balance as of December 31, 2015
|
$
|
350
|
|
|
Decrease in contingent consideration asset
|
(350
|
)
|
|
|
Balance as of December 31, 2016
|
$
|
—
|
|
Corresponding amounts equal to the decreases in the contingent consideration liability and contingent consideration asset are included in other income on the accompanying consolidated statements of income for the years ended
December 31, 2017
and
2016
as applicable.
|
11.
|
EQUITY
|
Preferred Stock
On March 21, 2013, the Company completed an underwritten public offering of
5.8 million
shares of
7.125%
Series A Cumulative Redeemable Preferred Stock (the “Series A Preferred Stock”) at a price of
$25.00
per share, pursuant to an effective registration statement. The Company received net proceeds of
$138.3 million
from the offering, after deducting underwriting discounts and other offering expenses. The Company classified the par value as preferred equity on its consolidated balance sheets with the balance of the liquidation preference, net of any issuance costs, recorded as an increase in paid-in capital.
The holders of the Company’s Series A Preferred Stock rank senior to the Company’s common stock with respect to dividend rights and rights upon the Company’s liquidation, dissolution or winding up of its affairs. At
December 31, 2017
, there were
no
dividends in arrears.
The Series A Preferred Stock does not have a stated maturity date, but the Company may redeem the Series A Preferred Stock on or after March 21, 2018, for
$25.00
per share, plus any accrued and unpaid dividends. The Company may redeem the Series A Preferred Stock prior to March 21, 2018, in limited circumstances to preserve its status as a REIT or pursuant to a specified change of control. Upon the occurrence of a specified change of control (which did not include the CCP Merger), each holder of Series A Preferred Stock will have the right to convert some or all of the shares of Series A Preferred Stock held by such holder into a number of shares of the Company’s common stock equivalent to
$25.00
plus accrued and unpaid dividends, but not to exceed a cap of
1.7864
shares of common stock per share of Series A Preferred Stock (subject to certain adjustments).
Common Stock
As a result of the CCP Merger completed on August 17, 2017, the Company issued approximately
94.0 million
shares of its common stock in exchange for shares of CCP common stock and shares underlying share-based awards assumed by the Company outstanding as of the effective time of the CCP Merger.
F-34
On September 28, 2017, the Company completed an underwritten public offering of
16.0 million
newly issued shares of its common stock pursuant to an effective registration statement. The underwriters exercised their option to purchase additional shares, and on October 2, 2017, the Company issued an additional
2.4 million
newly issued shares of its common stock pursuant to an effective registration statement. The Company received net proceeds, before expenses, of
$370.9 million
from the offering, after giving effect to the issuance and sale of all
18.4 million
shares of common stock, at a price of
$21.00
per share. These proceeds were used to repay borrowings outstanding under the Revolving Credit Facility.
Other Common Stock Issuances
During the years ended
December 31, 2017
and
2016
, the Company issued
0.3 million
and
0.1 million
of common stock units related to the vesting of employees’ restricted stock units.
Upon any payment of shares as a result of restricted stock unit vestings, the related tax withholding obligation will generally be satisfied by the Company, reducing the number of shares to be delivered by a number of shares necessary to satisfy the related applicable tax withholding obligation. During the years ended
December 31, 2017
,
2016
and
2015
, the Company incurred
$3.1
million,
$1.5 million
and
$5.0 million
, respectively, in tax withholding obligations on behalf of its employees that were satisfied through a reduction in the number of shares delivered to those participants.
Accumulated Other Comprehensive Income (Loss)
The following is a summary of the Company’s accumulated other comprehensive income (loss) (in thousands):
|
Year Ended December 31,
|
||||||||
|
2017
|
2016
|
|||||||
|
Foreign currency translation
|
$
|
(2,913
|
)
|
$
|
(3,067
|
)
|
||
|
Unrealized gains on cash flow hedges
|
14,202
|
|
1,269
|
|
||||
|
Total accumulated other comprehensive income (loss)
|
$
|
11,289
|
|
$
|
(1,798
|
)
|
||
|
12.
|
STOCK-BASED COMPENSATION
|
All stock-based awards are subject to the terms of the 2009 Performance Incentive Plan, which was assumed by the Company effective as of November 15, 2010 in connection with the Company’s separation from Sun and was most recently amended and restated in April 2017. The 2009 Performance Incentive Plan provides for the granting of stock-based compensation, including stock options, time-based stock units, funds from operations-based stock units (“FFO Units”), relative total stockholder return-based stock units (“TSR Units”) and performance-based restricted stock units to officers, employees and directors in connection with their employment with or services provided to the Company.
Stock Options
In connection with the CCP Merger, the Company assumed stock options outstanding as of the effective time of the CCP Merger. As of
December 31, 2017
, these stock options, totaling
1.7 million
shares underlying the stock options with exercise prices ranging from
$19.24
to
$34.09
per share, remained outstanding, with
0.5 million
exercisable through February 13, 2018 and
1.2 million
exercisable through February 13, 2019. As of
December 31, 2017
, the weighted average exercise price per share was
$27.92
and the stock options had
no
intrinsic value.
The Company had
no
stock options outstanding during the years ended
December 31, 2016
and
2015
.
Restricted Stock Units and Performance-Based Restricted Stock Units
Under the 2009 Performance Incentive Plan, restricted stock units and performance-based restricted stock units generally have a contractual life or vest over a
three
- to
five
-year period. The vesting of certain restricted stock units may accelerate, as defined in the grant, upon retirement, a change in control and other events. When vested (and subject to any applicable deferral or holdback period), each performance-based restricted stock unit is convertible into
one
share of common stock, subject to any deferrals in issuance pursuant to the grant. The restricted stock units are valued on the grant date based on the market price of the Company’s common stock on that date. Generally, the Company recognizes the fair value of the awards over the applicable vesting period as compensation expense. In addition, since the shares to be issued may vary based on the performance of the Company, the Company must make assumptions regarding the projected performance criteria and the shares that will ultimately be issued. The amount of FFO Units that will ultimately vest is dependent on the amount by which the Company’s funds from operation (“FFO”) differs from a target FFO amount for a period specified in each grant and will range from
0%
to
250%
of the FFO Units initially granted. Similarly, the amount of TSR Units that will ultimately vest is dependent on the amount by which
F-35
the total shareholder return (“TSR”) of the Company’s common stock differs from a predefined peer group for a period specified in each grant and will range from
0%
to
200%
of the TSR Units initially granted. Upon any payment of shares as a result of restricted stock unit vestings, the related tax withholding obligation will generally be satisfied by the Company, reducing the number of shares to be delivered by a number of shares necessary to satisfy the related applicable tax withholding obligation. The value of the shares withheld is dependent on the closing price of the Company’s common stock on the date the relevant transaction occurs.
The following table summarizes additional information concerning restricted stock units at
December 31, 2017
:
|
Restricted Stock Units
|
Weighted Average Grant Date Fair Value Per Unit
|
||||||
|
Unvested as of December 31, 2016
|
903,967
|
|
$
|
21.58
|
|
||
|
Granted
|
576,357
|
|
19.38
|
|
|||
|
Vested
|
(333,338
|
)
|
25.30
|
|
|||
|
Dividends reinvested
|
64,873
|
|
21.17
|
|
|||
|
Cancelled/forfeited
|
(86,372
|
)
|
20.61
|
|
|||
|
Unvested as of December 31, 2017
|
1,125,487
|
|
$
|
19.71
|
|
||
As of
December 31, 2017
, the weighted average remaining vesting period of restricted stock units was
2.7
years. The weighted average fair value per share at the date of grant for restricted stock units for the years ended
December 31, 2017
,
2016
and
2015
was
$19.38
,
$22.05
and
$21.11
, respectively. The total fair value of units vested during the years ended
December 31, 2017
,
2016
and
2015
was
$8.4 million
,
$4.7 million
and
$8.5 million
, respectively.
The fair value of the TSR Units is estimated on the date of grant using a Monte Carlo valuation model that uses the assumptions noted in the table below. The risk-free rate is based on the U.S. Treasury yield curve in effect at the grant date for the expected performance period. Expected volatility is based on historical volatility for the most recent
3
-year period ending on the grant date for the Company and the selected peer companies, and is calculated on a daily basis. The following are the key assumptions used in this valuation:
|
2017
|
2016
|
2015
|
||||||
|
Risk free interest rate
|
1.42% - 1.99%
|
|
0.78% - 1.60%
|
|
0.87% - 1.31%
|
|
||
|
Expected stock price volatility
|
28.86% - 30.97%
|
|
27.40% - 28.42%
|
|
23.55% - 27.02%
|
|
||
|
Expected service period
|
2.2 - 3.0 years
|
|
2.3 - 3.0 years
|
|
2.5 - 3.0 years
|
|
||
|
Expected dividend yield (assuming full reinvestment)
|
—
|
%
|
—
|
%
|
—
|
%
|
||
During the years ended
December 31, 2017
,
2016
and
2015
, the Company recognized
$7.0 million
,
$7.5 million
and
$6.1 million
, respectively, of stock-based compensation expense included in general and administrative expense in the consolidated statements of income. During the year ended
December 31, 2017
, the Company recognized
$1.4 million
of stock-based compensation expense related to former CCP employees included in merger and acquisition costs in the consolidated statements of income. As of
December 31, 2017
, there was
$15.2 million
of total unrecognized stock-based compensation expense related to unvested awards, which is expected to be recognized over a weighted average period of
2.7
years.
Employee Benefit Plan
The Company maintains a 401(k) plan that allows for eligible participants to defer compensation, subject to certain limitations imposed by the Internal Revenue Code of 1986, as amended (the “Code”). The Company provides a discretionary matching contribution of up to
3%
of each participant's eligible compensation. During the years ended
December 31, 2017
,
2016
and
2015
, the Company’s matching contributions were approximately
$143,000
,
$73,000
and
$35,000
, respectively.
|
13.
|
INCOME TAXES
|
The Company elected to be treated as a REIT with the filing of its U.S. federal income tax return for the taxable year beginning January 1, 2011. To qualify as a REIT, the Company must meet a number of organizational and operational requirements, including a requirement to distribute at least 90% of its taxable ordinary income. In addition, the Company is required to meet certain asset and income tests. As a REIT, the Company generally will not be subject to corporate level federal income tax on taxable income that it distributes to its stockholders. The Company also elected to treat certain of its consolidated subsidiaries as taxable REIT subsidiaries, which are subject to federal, state and foreign income taxes.
F-36
The Company is subject to corporate income tax on built-in gains (the excess of fair market value over tax basis on properties held by Sabra as of the date Sabra elected to be taxed as a REIT, or January 1, 2011) on taxable dispositions of properties acquired in the Company’s separation from Sun occurring within a specified period (generally five years) following the election to be taxed as a REIT. This built-in gains tax is generally not payable on dispositions of property to the extent the proceeds from such dispositions are reinvested in qualifying like-kind replacement property as defined under various provisions of the Code. The Company does not expect to dispose of any properties held by Sabra at the Separation Date if such a disposition would result in the imposition of a material tax liability. Gains from asset dispositions occurring more than five years after the acquisition will not be subject to this corporate-level tax. As a result, the Company has not recorded a deferred tax liability associated with this corporate-level tax.
As a result of acquisitions in Canada during 2015, the Company is subject to income taxes under the laws of Canada. The Company recorded a
$1.3 million
,
$0.7 million
and
$0.7 million
income tax benefit during the years ended
December 31, 2017
,
2016
and
2015
, respectively, with respect to its Canadian operations. Due to uncertainty over the Company’s ability to utilize this income tax benefit in future periods, the Company recorded a valuation allowance of
$1.2 million
,
$0.7 million
and
$0.7 million
against the deferred tax benefit during the years ended
December 31, 2017
,
2016
and
2015
, respectively.
The following is a reconciliation of the Company’s beginning and ending unrecognized tax benefits (in thousands):
|
Balance at December 31, 2015
|
$
|
24,212
|
|
|
Additions (reductions) based on prior years’ tax positions
|
(24,212
|
)
|
|
|
Additions (reductions) based on 2016 tax positions
|
—
|
|
|
|
Balance at December 31, 2016
|
$
|
—
|
|
|
Additions (reductions) based on prior years’ tax positions
|
—
|
|
|
|
Additions (reductions) based on 2017 tax positions
|
—
|
|
|
|
Balance at December 31, 2017
|
$
|
—
|
|
During the 2016 fiscal year, the full amount of unrecognized tax benefits was released due to the lapse of applicable statute of limitations. The balance of unrecognized tax benefits did not change in fiscal year 2017, and the Company does not anticipate that the balance of unrecognized tax benefits will change materially in fiscal year 2018. The Company classifies interest and penalties from significant uncertain tax positions as interest expense and operating expenses, respectively, in its consolidated financial statements. During the years ended
December 31, 2017
,
2016
and
2015
, the Company did not incur any such interest or penalties. With certain exceptions, the tax year 2014 and thereafter remain open to examination by the major taxing jurisdictions with which the Company files tax returns.
|
14.
|
EARNINGS PER COMMON SHARE
|
The following table illustrates the computation of basic and diluted earnings per share (in thousands, except share and per share amounts):
|
Year Ended December 31,
|
|||||||||||
|
2017
|
2016
|
2015
|
|||||||||
|
Numerator
|
|||||||||||
|
Net income attributable to common stockholders
|
$
|
148,141
|
|
$
|
60,034
|
|
$
|
69,171
|
|
||
|
|
|
||||||||||
|
Denominator
|
|||||||||||
|
Basic weighted average common shares and common equivalents
|
105,621,242
|
|
65,284,251
|
|
62,235,014
|
|
|||||
|
Dilutive stock options and restricted stock units
|
221,192
|
|
236,421
|
|
225,225
|
|
|||||
|
Diluted weighted average common shares
|
105,842,434
|
|
65,520,672
|
|
62,460,239
|
|
|||||
|
|
|||||||||||
|
Net income attributable to common stockholders, per:
|
|||||||||||
|
Basic common share
|
$
|
1.40
|
|
$
|
0.92
|
|
$
|
1.11
|
|
||
|
|
|
||||||||||
|
Diluted common share
|
$
|
1.40
|
|
$
|
0.92
|
|
$
|
1.11
|
|
||
During the
years
ended
December 31, 2017
,
2016
and
2015
, approximately
132,000
,
128,000
and
76,000
restricted stock units, respectively, were not included in computing diluted earnings per share because they were considered anti-dilutive.
F-37
No
stock options were considered anti-dilutive during the year ended
December 31, 2017
, and
no
stock options were outstanding during the years ended
December 31, 2016
and
2015
.
15.
SUMMARIZED CONSOLIDATING INFORMATION
In connection with the offerings of the 2021 Notes and the 2023 Notes by the Issuers, the Company and certain 100% owned subsidiaries of the Company (the “Guarantors”) have, jointly and severally, fully and unconditionally guaranteed the 2021 Notes and the 2023 Notes, subject to release under certain customary circumstances as described below. In connection with the assumption of the 2026 Notes as a result of the CCP Merger (see Note 3, “CCP Merger and Recent Real Estate Acquisitions”), the Company has fully and unconditionally guaranteed the 2026 Notes, subject to release under certain circumstances as described below. These guarantees are subordinated to all existing and future senior debt and senior guarantees of the Guarantors and are unsecured. The Company conducts all of its business through and derives virtually all of its income from its subsidiaries. Therefore, the Company’s ability to make required payments with respect to its indebtedness (including the Senior Notes) and other obligations depends on the financial results and condition of its subsidiaries and its ability to receive funds from its subsidiaries.
A Guarantor will be automatically and unconditionally released from its obligations under the guarantees with respect to the 2021 Notes and the 2023 Notes in the event of:
|
•
|
Any sale of the subsidiary Guarantor or of all or substantially all of its assets;
|
|
•
|
A merger or consolidation of a subsidiary Guarantor with an issuer of the 2021 Notes or the 2023 Notes or another Guarantor, provided that the surviving entity remains a Guarantor;
|
|
•
|
A subsidiary Guarantor is declared “unrestricted” for covenant purposes under the indentures governing the 2021 Notes or the 2023 Notes;
|
|
•
|
The requirements for legal defeasance or covenant defeasance or to discharge the indentures governing the 2021 Notes or the 2023 Notes have been satisfied;
|
|
•
|
A liquidation or dissolution, to the extent permitted under the indentures governing the 2021 Notes or the 2023 Notes, of a subsidiary Guarantor; or
|
|
•
|
The release or discharge of the guaranty that resulted in the creation of the subsidiary guaranty, except a discharge or release by or as a result of payment under such guaranty.
|
The Company will be automatically and unconditionally released from its obligations under the guarantees with respect to the 2026 Notes in the event of:
|
•
|
A liquidation or dissolution, to the extent permitted under the indenture governing the 2026 Notes;
|
|
•
|
A merger or consolidation, provided that the surviving entity remains a Guarantor; or
|
|
•
|
The requirements for legal defeasance or covenant defeasance or to discharge the indenture governing the 2026 Notes have been satisfied.
|
Pursuant to Rule 3-10 of Regulation S-X, the following summarized consolidating information is provided for the Company (the “Parent Company”), the Operating Partnership, Sabra Capital Corporation, the Guarantors, and the Company’s non-Guarantor subsidiaries with respect to the 2021 Notes and the 2023 Notes. This summarized financial information has been prepared from the books and records maintained by the Company, the Operating Partnership, Sabra Capital Corporation, the Guarantors and the non-Guarantor subsidiaries. The summarized financial information may not necessarily be indicative of the results of operations or financial position had the Operating Partnership, Sabra Capital Corporation, the Guarantors or non-Guarantor subsidiaries operated as independent entities. Sabra’s investments in its consolidated subsidiaries are presented based upon Sabra’s proportionate share of each subsidiary’s net assets. The Guarantor subsidiaries’ investments in the non-Guarantor subsidiaries and non-Guarantor subsidiaries’ investments in Guarantor subsidiaries are presented under the equity method of accounting. Intercompany activities between subsidiaries and the Parent Company are presented within operating activities on the consolidating statement of cash flows.
Consolidating financial statements for the Company and its subsidiaries, including the Parent Company only, the Operating Partnership only, Sabra Capital Corporation only, the combined Guarantor subsidiaries and the combined non-Guarantor subsidiaries, are as follows:
F-38
CONSOLIDATING BALANCE SHEET
December 31, 2017
(in thousands, except share and per share amounts)
|
Combined Non-Guarantor Subsidiaries of 2026 Notes
(6)
|
|||||||||||||||||||||||||||
|
Parent
Company (1) |
Operating
Partnership (2) |
Sabra Capital
Corporation (3) |
Combined
Guarantor Subsidiaries of 2021 Notes and 2023 Notes (4) |
Combined Non-
Guarantor Subsidiaries of 2021 Notes and 2023 Notes (5) |
Elimination
|
Consolidated
|
|||||||||||||||||||||
|
Assets
|
|||||||||||||||||||||||||||
|
Real estate investments, net of accumulated depreciation
|
$
|
324
|
|
$
|
—
|
|
$
|
—
|
|
$
|
1,756,933
|
|
$
|
4,237,175
|
|
$
|
—
|
|
$
|
5,994,432
|
|
||||||
|
Loans receivable and other investments, net
|
(97
|
)
|
—
|
|
—
|
|
55,297
|
|
59,190
|
|
—
|
|
114,390
|
|
|||||||||||||
|
Cash and cash equivalents
|
511,670
|
|
—
|
|
—
|
|
449
|
|
6,513
|
|
—
|
|
518,632
|
|
|||||||||||||
|
Restricted cash
|
—
|
|
—
|
|
—
|
|
36,910
|
|
31,907
|
|
—
|
|
68,817
|
|
|||||||||||||
|
Lease intangible assets, net
|
—
|
|
—
|
|
—
|
|
17,577
|
|
149,542
|
|
—
|
|
167,119
|
|
|||||||||||||
|
Accounts receivable, prepaid expenses and other assets, net
|
3,499
|
|
36,073
|
|
—
|
|
80,739
|
|
53,765
|
|
(5,189
|
)
|
168,887
|
|
|||||||||||||
|
Intercompany
|
2,043,402
|
|
2,721,979
|
|
—
|
|
—
|
|
—
|
|
(4,765,381
|
)
|
—
|
|
|||||||||||||
|
Investment in subsidiaries
|
890,462
|
|
1,198,305
|
|
—
|
|
14,661
|
|
—
|
|
(2,103,428
|
)
|
—
|
|
|||||||||||||
|
Total assets
|
$
|
3,449,260
|
|
$
|
3,956,357
|
|
$
|
—
|
|
$
|
1,962,566
|
|
$
|
4,538,092
|
|
$
|
(6,873,998
|
)
|
$
|
7,032,277
|
|
||||||
|
Liabilities
|
|||||||||||||||||||||||||||
|
Secured debt, net
|
$
|
—
|
|
$
|
—
|
|
$
|
—
|
|
$
|
—
|
|
$
|
256,430
|
|
$
|
—
|
|
$
|
256,430
|
|
||||||
|
Revolving credit facility
|
—
|
|
641,000
|
|
—
|
|
—
|
|
—
|
|
—
|
|
641,000
|
|
|||||||||||||
|
Term loans, net
|
—
|
|
1,092,397
|
|
—
|
|
98,377
|
|
—
|
|
—
|
|
1,190,774
|
|
|||||||||||||
|
Senior unsecured notes, net
|
—
|
|
1,306,286
|
|
—
|
|
—
|
|
—
|
|
—
|
|
1,306,286
|
|
|||||||||||||
|
Accounts payable and accrued liabilities
|
16,453
|
|
26,212
|
|
—
|
|
3,560
|
|
61,487
|
|
(5,189
|
)
|
102,523
|
|
|||||||||||||
|
Lease intangible liabilities, net
|
—
|
|
—
|
|
—
|
|
—
|
|
98,015
|
|
—
|
|
98,015
|
|
|||||||||||||
|
Intercompany
|
—
|
|
—
|
|
—
|
|
785,120
|
|
3,980,261
|
|
(4,765,381
|
)
|
—
|
|
|||||||||||||
|
Total liabilities
|
16,453
|
|
3,065,895
|
|
—
|
|
887,057
|
|
4,396,193
|
|
(4,770,570
|
)
|
3,595,028
|
|
|||||||||||||
|
Total Sabra Health Care REIT, Inc. stockholders’ equity
|
3,432,807
|
|
890,462
|
|
—
|
|
1,075,509
|
|
137,457
|
|
(2,103,428
|
)
|
3,432,807
|
|
|||||||||||||
|
Noncontrolling interests
|
—
|
|
—
|
|
—
|
|
—
|
|
4,442
|
|
—
|
|
4,442
|
|
|||||||||||||
|
Total equity
|
3,432,807
|
|
890,462
|
|
—
|
|
1,075,509
|
|
141,899
|
|
(2,103,428
|
)
|
3,437,249
|
|
|||||||||||||
|
Total liabilities and equity
|
$
|
3,449,260
|
|
$
|
3,956,357
|
|
$
|
—
|
|
$
|
1,962,566
|
|
$
|
4,538,092
|
|
$
|
(6,873,998
|
)
|
$
|
7,032,277
|
|
||||||
|
(1)
|
The Parent Company guarantees the 2021 Notes, the 2023 Notes and the 2026 Notes.
|
|
(2)
|
The Operating Partnership is the co-issuer of the 2021 Notes and the 2023 Notes and the issuer of the 2026 Notes.
|
|
(3)
|
Sabra Capital Corporation is the co-issuer of the 2021 Notes and the 2023 Notes.
|
|
(4)
|
The Combined Guarantor Subsidiaries of the 2021 Notes and the 2023 Notes guarantee the 2021 Notes and the 2023 Notes.
|
|
(5)
|
The Combined Non-Guarantor Subsidiaries of the 2021 Notes and the 2023 Notes consist of the subsidiaries that do not guarantee the 2021 Notes and the 2023 Notes.
|
|
(6)
|
None of Sabra Capital Corporation, the Combined Guarantor Subsidiaries of the 2021 Notes and the 2023 Notes, nor the Combined Non-Guarantor Subsidiaries of the 2021 Notes and the 2023 Notes guarantee the 2026 Notes.
|
F-39
CONSOLIDATING BALANCE SHEET
December 31, 2016
(in thousands, except share and per share amounts)
|
Combined Non-Guarantor Subsidiaries of 2026 Notes
(6)
|
|||||||||||||||||||||||||||
|
Parent
Company (1) |
Operating
Partnership (2) |
Sabra Capital
Corporation (3) |
Combined
Guarantor Subsidiaries of 2021 Notes and 2023 Notes (4) |
Combined Non-
Guarantor Subsidiaries of 2021 Notes and 2023 Notes (5) |
Elimination
|
Consolidated
|
|||||||||||||||||||||
|
Assets
|
|||||||||||||||||||||||||||
|
Real estate investments, net of accumulated depreciation
|
$
|
150
|
|
$
|
—
|
|
$
|
—
|
|
$
|
1,860,850
|
|
$
|
148,939
|
|
$
|
—
|
|
$
|
2,009,939
|
|
||||||
|
Loans receivable and other investments, net
|
(410
|
)
|
—
|
|
—
|
|
96,446
|
|
—
|
|
—
|
|
96,036
|
|
|||||||||||||
|
Cash and cash equivalents
|
18,168
|
|
—
|
|
—
|
|
2,675
|
|
4,820
|
|
—
|
|
25,663
|
|
|||||||||||||
|
Restricted cash
|
—
|
|
—
|
|
—
|
|
57
|
|
8,945
|
|
—
|
|
9,002
|
|
|||||||||||||
|
Lease intangible assets, net
|
—
|
|
—
|
|
—
|
|
25,489
|
|
761
|
|
—
|
|
26,250
|
|
|||||||||||||
|
Accounts receivable, prepaid expenses and other assets, net
|
2,859
|
|
18,023
|
|
—
|
|
70,812
|
|
9,244
|
|
(1,909
|
)
|
99,029
|
|
|||||||||||||
|
Intercompany
|
368,281
|
|
687,493
|
|
—
|
|
—
|
|
25,125
|
|
(1,080,899
|
)
|
—
|
|
|||||||||||||
|
Investment in subsidiaries
|
640,238
|
|
907,136
|
|
—
|
|
12,364
|
|
—
|
|
(1,559,738
|
)
|
—
|
|
|||||||||||||
|
Total assets
|
$
|
1,029,286
|
|
$
|
1,612,652
|
|
$
|
—
|
|
$
|
2,068,693
|
|
$
|
197,834
|
|
$
|
(2,642,546
|
)
|
$
|
2,265,919
|
|
||||||
|
Liabilities
|
|||||||||||||||||||||||||||
|
Secured debt, net
|
$
|
—
|
|
$
|
—
|
|
$
|
—
|
|
$
|
—
|
|
$
|
160,752
|
|
$
|
—
|
|
$
|
160,752
|
|
||||||
|
Revolving credit facility
|
—
|
|
26,000
|
|
—
|
|
—
|
|
—
|
|
—
|
|
26,000
|
|
|||||||||||||
|
Term loans, net
|
—
|
|
243,626
|
|
—
|
|
92,047
|
|
—
|
|
—
|
|
335,673
|
|
|||||||||||||
|
Senior unsecured notes, net
|
—
|
|
688,246
|
|
—
|
|
—
|
|
—
|
|
—
|
|
688,246
|
|
|||||||||||||
|
Accounts payable and accrued liabilities
|
13,712
|
|
14,542
|
|
—
|
|
11,606
|
|
1,688
|
|
(1,909
|
)
|
39,639
|
|
|||||||||||||
|
Intercompany
|
—
|
|
—
|
|
—
|
|
1,080,899
|
|
—
|
|
(1,080,899
|
)
|
—
|
|
|||||||||||||
|
Total liabilities
|
13,712
|
|
972,414
|
|
—
|
|
1,184,552
|
|
162,440
|
|
(1,082,808
|
)
|
1,250,310
|
|
|||||||||||||
|
Total Sabra Health Care REIT, Inc. stockholders’ equity
|
1,015,574
|
|
640,238
|
|
—
|
|
884,141
|
|
35,359
|
|
(1,559,738
|
)
|
1,015,574
|
|
|||||||||||||
|
Noncontrolling interests
|
—
|
|
—
|
|
—
|
|
—
|
|
35
|
|
—
|
|
35
|
|
|||||||||||||
|
Total equity
|
1,015,574
|
|
640,238
|
|
—
|
|
884,141
|
|
35,394
|
|
(1,559,738
|
)
|
1,015,609
|
|
|||||||||||||
|
Total liabilities and equity
|
$
|
1,029,286
|
|
$
|
1,612,652
|
|
$
|
—
|
|
$
|
2,068,693
|
|
$
|
197,834
|
|
$
|
(2,642,546
|
)
|
$
|
2,265,919
|
|
||||||
|
(1)
|
The Parent Company guarantees the 2021 Notes, the 2023 Notes and the 2026 Notes.
|
|
(2)
|
The Operating Partnership is the co-issuer of the 2021 Notes and the 2023 Notes and the issuer of the 2026 Notes.
|
|
(3)
|
Sabra Capital Corporation is the co-issuer of the 2021 Notes and the 2023 Notes.
|
|
(4)
|
The Combined Guarantor Subsidiaries of the 2021 Notes and the 2023 Notes guarantee the 2021 Notes and the 2023 Notes.
|
|
(5)
|
The Combined Non-Guarantor Subsidiaries of the 2021 Notes and the 2023 Notes consist of the subsidiaries that do not guarantee the 2021 Notes and the 2023 Notes.
|
|
(6)
|
None of Sabra Capital Corporation, the Combined Guarantor Subsidiaries of the 2021 Notes and the 2023 Notes, nor the Combined Non-Guarantor Subsidiaries of the 2021 Notes and the 2023 Notes guarantee the 2026 Notes.
|
F-40
CONSOLIDATING STATEMENT OF INCOME
For the Year Ended
December 31, 2017
(in thousands, except share and per share amounts)
|
Combined Non-Guarantor Subsidiaries of 2026 Notes
(6)
|
|||||||||||||||||||||||||||
|
Parent
Company (1) |
Operating
Partnership (2) |
Sabra Capital
Corporation (3) |
Combined
Guarantor Subsidiaries of 2021 Notes and 2023 Notes (4) |
Combined Non-
Guarantor Subsidiaries of 2021 Notes and 2023 Notes (5) |
Elimination
|
Consolidated
|
|||||||||||||||||||||
|
Revenues:
|
|||||||||||||||||||||||||||
|
Rental income
|
$
|
—
|
|
$
|
—
|
|
$
|
—
|
|
$
|
213,162
|
|
$
|
158,542
|
|
$
|
(7,513
|
)
|
$
|
364,191
|
|
||||||
|
Interest and other income
|
39
|
|
143
|
|
—
|
|
9,098
|
|
5,907
|
|
(161
|
)
|
15,026
|
|
|||||||||||||
|
Resident fees and services
|
—
|
|
—
|
|
—
|
|
—
|
|
26,430
|
|
—
|
|
26,430
|
|
|||||||||||||
|
Total revenues
|
39
|
|
143
|
|
—
|
|
222,260
|
|
190,879
|
|
(7,674
|
)
|
405,647
|
|
|||||||||||||
|
Expenses:
|
|||||||||||||||||||||||||||
|
Depreciation and amortization
|
867
|
|
—
|
|
—
|
|
67,723
|
|
45,292
|
|
—
|
|
113,882
|
|
|||||||||||||
|
Interest
|
—
|
|
77,767
|
|
—
|
|
2,989
|
|
7,827
|
|
(143
|
)
|
88,440
|
|
|||||||||||||
|
Operating expenses
|
—
|
|
—
|
|
—
|
|
—
|
|
25,391
|
|
(7,531
|
)
|
17,860
|
|
|||||||||||||
|
General and administrative
|
24,810
|
|
65
|
|
—
|
|
3,854
|
|
3,672
|
|
—
|
|
32,401
|
|
|||||||||||||
|
Merger and acquisition costs
|
30,208
|
|
—
|
|
—
|
|
47
|
|
—
|
|
—
|
|
30,255
|
|
|||||||||||||
|
Provision for doubtful accounts and loan losses
|
227
|
|
—
|
|
—
|
|
16,886
|
|
—
|
|
—
|
|
17,113
|
|
|||||||||||||
|
Impairment of real estate
|
—
|
|
—
|
|
—
|
|
1,326
|
|
—
|
|
—
|
|
1,326
|
|
|||||||||||||
|
Total expenses
|
56,112
|
|
77,832
|
|
—
|
|
92,825
|
|
82,182
|
|
(7,674
|
)
|
301,277
|
|
|||||||||||||
|
Other income (expense):
|
|||||||||||||||||||||||||||
|
Loss on extinguishment of debt
|
—
|
|
(422
|
)
|
—
|
|
(131
|
)
|
—
|
|
—
|
|
(553
|
)
|
|||||||||||||
|
Other income (expense)
|
2,634
|
|
1,130
|
|
—
|
|
(617
|
)
|
23
|
|
—
|
|
3,170
|
|
|||||||||||||
|
Net (loss) gain on sales of real estate
|
—
|
|
—
|
|
—
|
|
54,627
|
|
(2,598
|
)
|
—
|
|
52,029
|
|
|||||||||||||
|
Total other income (expense)
|
2,634
|
|
708
|
|
—
|
|
53,879
|
|
(2,575
|
)
|
—
|
|
54,646
|
|
|||||||||||||
|
Income in subsidiary
|
212,432
|
|
289,414
|
|
—
|
|
7,199
|
|
—
|
|
(509,045
|
)
|
—
|
|
|||||||||||||
|
Income before income tax expense
|
158,993
|
|
212,433
|
|
—
|
|
190,513
|
|
106,122
|
|
(509,045
|
)
|
159,016
|
|
|||||||||||||
|
Income tax (expense) recovery
|
(610
|
)
|
(1
|
)
|
—
|
|
(139
|
)
|
99
|
|
—
|
|
(651
|
)
|
|||||||||||||
|
Net income
|
158,383
|
|
212,432
|
|
—
|
|
190,374
|
|
106,221
|
|
(509,045
|
)
|
158,365
|
|
|||||||||||||
|
Net loss attributable to noncontrolling interests
|
—
|
|
—
|
|
—
|
|
—
|
|
18
|
|
—
|
|
18
|
|
|||||||||||||
|
Net income attributable to Sabra Health Care REIT, Inc.
|
158,383
|
|
212,432
|
|
—
|
|
190,374
|
|
106,239
|
|
(509,045
|
)
|
158,383
|
|
|||||||||||||
|
Preferred stock dividends
|
(10,242
|
)
|
—
|
|
—
|
|
—
|
|
—
|
|
—
|
|
(10,242
|
)
|
|||||||||||||
|
Net income attributable to common stockholders
|
$
|
148,141
|
|
$
|
212,432
|
|
$
|
—
|
|
$
|
190,374
|
|
$
|
106,239
|
|
$
|
(509,045
|
)
|
$
|
148,141
|
|
||||||
|
Net income attributable to common stockholders, per:
|
|||||||||||||||||||||||||||
|
Basic common share
|
$
|
1.40
|
|
||||||||||||||||||||||||
|
Diluted common share
|
$
|
1.40
|
|
||||||||||||||||||||||||
|
Weighted-average number of common shares outstanding, basic
|
105,621,242
|
|
|||||||||||||||||||||||||
|
Weighted-average number of common shares outstanding, diluted
|
105,842,434
|
|
|||||||||||||||||||||||||
|
(1)
|
The Parent Company guarantees the 2021 Notes, the 2023 Notes and the 2026 Notes.
|
|
(2)
|
The Operating Partnership is the co-issuer of the 2021 Notes and the 2023 Notes and the issuer of the 2026 Notes.
|
|
(3)
|
Sabra Capital Corporation is the co-issuer of the 2021 Notes and the 2023 Notes.
|
|
(4)
|
The Combined Guarantor Subsidiaries of the 2021 Notes and the 2023 Notes guarantee the 2021 Notes and the 2023 Notes.
|
|
(5)
|
The Combined Non-Guarantor Subsidiaries of the 2021 Notes and the 2023 Notes consist of the subsidiaries that do not guarantee the 2021 Notes and the 2023 Notes.
|
|
(6)
|
None of Sabra Capital Corporation, the Combined Guarantor Subsidiaries of the 2021 Notes and the 2023 Notes, nor the Combined Non-Guarantor Subsidiaries of the 2021 Notes and the 2023 Notes guarantee the 2026 Notes.
|
F-41
CONSOLIDATING STATEMENT OF INCOME
For the Year Ended
December 31, 2016
(in thousands, except share and per share amounts)
|
Combined Non-Guarantor Subsidiaries of 2026 Notes
(6)
|
|||||||||||||||||||||||||||
|
Parent
Company (1) |
Operating
Partnership (2) |
Sabra Capital
Corporation (3) |
Combined
Guarantor Subsidiaries of 2021 Notes and 2023 Notes (4) |
Combined Non-
Guarantor Subsidiaries of 2021 Notes and 2023 Notes (5) |
Elimination
|
Consolidated
|
|||||||||||||||||||||
|
Revenues:
|
|||||||||||||||||||||||||||
|
Rental income
|
$
|
—
|
|
$
|
—
|
|
$
|
—
|
|
$
|
206,897
|
|
$
|
20,706
|
|
$
|
(2,328
|
)
|
$
|
225,275
|
|
||||||
|
Interest and other income
|
3
|
|
—
|
|
—
|
|
27,712
|
|
1
|
|
(253
|
)
|
27,463
|
|
|||||||||||||
|
Resident fees and services
|
—
|
|
—
|
|
—
|
|
—
|
|
7,788
|
|
—
|
|
7,788
|
|
|||||||||||||
|
Total revenues
|
3
|
|
—
|
|
—
|
|
234,609
|
|
28,495
|
|
(2,581
|
)
|
260,526
|
|
|||||||||||||
|
Expenses:
|
|||||||||||||||||||||||||||
|
Depreciation and amortization
|
816
|
|
—
|
|
—
|
|
61,371
|
|
6,285
|
|
—
|
|
68,472
|
|
|||||||||||||
|
Interest
|
—
|
|
54,589
|
|
—
|
|
3,497
|
|
6,787
|
|
—
|
|
64,873
|
|
|||||||||||||
|
Operating expenses
|
—
|
|
—
|
|
—
|
|
—
|
|
8,066
|
|
(2,363
|
)
|
5,703
|
|
|||||||||||||
|
General and administrative
|
15,798
|
|
56
|
|
—
|
|
1,652
|
|
166
|
|
—
|
|
17,672
|
|
|||||||||||||
|
Merger and acquisition costs
|
(7
|
)
|
—
|
|
—
|
|
1,204
|
|
—
|
|
—
|
|
1,197
|
|
|||||||||||||
|
Provision for doubtful accounts and loan losses
|
(1,376
|
)
|
—
|
|
—
|
|
6,498
|
|
421
|
|
—
|
|
5,543
|
|
|||||||||||||
|
Impairment of real estate
|
—
|
|
—
|
|
—
|
|
29,811
|
|
—
|
|
—
|
|
29,811
|
|
|||||||||||||
|
Total expenses
|
15,231
|
|
54,645
|
|
—
|
|
104,033
|
|
21,725
|
|
(2,363
|
)
|
193,271
|
|
|||||||||||||
|
Other income (expense):
|
|||||||||||||||||||||||||||
|
Loss on extinguishment of debt
|
—
|
|
(468
|
)
|
—
|
|
(88
|
)
|
—
|
|
—
|
|
(556
|
)
|
|||||||||||||
|
Other income (expense)
|
7,366
|
|
(196
|
)
|
—
|
|
3,507
|
|
—
|
|
—
|
|
10,677
|
|
|||||||||||||
|
Net loss on sales of real estate
|
—
|
|
—
|
|
—
|
|
(6,143
|
)
|
21
|
|
—
|
|
(6,122
|
)
|
|||||||||||||
|
Total other income (expense)
|
7,366
|
|
(664
|
)
|
—
|
|
(2,724
|
)
|
21
|
|
—
|
|
3,999
|
|
|||||||||||||
|
Income in subsidiary
|
78,783
|
|
134,093
|
|
—
|
|
6,840
|
|
—
|
|
(219,716
|
)
|
—
|
|
|||||||||||||
|
Income before income tax expense
|
70,921
|
|
78,784
|
|
—
|
|
134,692
|
|
6,791
|
|
(219,934
|
)
|
71,254
|
|
|||||||||||||
|
Income tax expense
|
(427
|
)
|
(1
|
)
|
—
|
|
(538
|
)
|
(83
|
)
|
—
|
|
(1,049
|
)
|
|||||||||||||
|
Net income
|
70,494
|
|
78,783
|
|
—
|
|
134,154
|
|
6,708
|
|
(219,934
|
)
|
70,205
|
|
|||||||||||||
|
Net loss attributable to noncontrolling interests
|
—
|
|
—
|
|
—
|
|
—
|
|
71
|
|
—
|
|
71
|
|
|||||||||||||
|
Net income attributable to Sabra Health Care REIT, Inc.
|
70,494
|
|
78,783
|
|
—
|
|
134,154
|
|
6,779
|
|
(219,934
|
)
|
70,276
|
|
|||||||||||||
|
Preferred stock dividends
|
(10,242
|
)
|
—
|
|
—
|
|
—
|
|
—
|
|
—
|
|
(10,242
|
)
|
|||||||||||||
|
Net income attributable to common stockholders
|
$
|
60,252
|
|
$
|
78,783
|
|
$
|
—
|
|
$
|
134,154
|
|
$
|
6,779
|
|
$
|
(219,934
|
)
|
$
|
60,034
|
|
||||||
|
Net income attributable to common stockholders, per:
|
|||||||||||||||||||||||||||
|
Basic common share
|
$
|
0.92
|
|
||||||||||||||||||||||||
|
Diluted common share
|
$
|
0.92
|
|
||||||||||||||||||||||||
|
Weighted-average number of common shares outstanding, basic
|
65,284,251
|
|
|||||||||||||||||||||||||
|
Weighted-average number of common shares outstanding, diluted
|
65,520,672
|
|
|||||||||||||||||||||||||
|
(1)
|
The Parent Company guarantees the 2021 Notes, the 2023 Notes and the 2026 Notes.
|
|
(2)
|
The Operating Partnership is the co-issuer of the 2021 Notes and the 2023 Notes and the issuer of the 2026 Notes.
|
|
(3)
|
Sabra Capital Corporation is the co-issuer of the 2021 Notes and the 2023 Notes.
|
|
(4)
|
The Combined Guarantor Subsidiaries of the 2021 Notes and the 2023 Notes guarantee the 2021 Notes and the 2023 Notes.
|
|
(5)
|
The Combined Non-Guarantor Subsidiaries of the 2021 Notes and the 2023 Notes consist of the subsidiaries that do not guarantee the 2021 Notes and the 2023 Notes.
|
|
(6)
|
None of Sabra Capital Corporation, the Combined Guarantor Subsidiaries of the 2021 Notes and the 2023 Notes, nor the Combined Non-Guarantor Subsidiaries of the 2021 Notes and the 2023 Notes guarantee the 2026 Notes.
|
F-42
CONSOLIDATING STATEMENT OF INCOME
For the
Year Ended December 31, 2015
(in thousands, except share and per share amounts)
|
Combined Non-Guarantor Subsidiaries of 2026 Notes
(6)
|
|||||||||||||||||||||||||||
|
Parent
Company (1) |
Operating
Partnership (2) |
Sabra Capital
Corporation (3) |
Combined
Guarantor Subsidiaries of 2021 Notes and 2023 Notes (4) |
Combined Non-
Guarantor Subsidiaries of 2021 Notes and 2023 Notes (5) |
Elimination
|
Consolidated
|
|||||||||||||||||||||
|
Revenues:
|
|||||||||||||||||||||||||||
|
Rental income
|
$
|
—
|
|
$
|
—
|
|
$
|
—
|
|
$
|
190,582
|
|
$
|
20,470
|
|
$
|
(1,201
|
)
|
$
|
209,851
|
|
||||||
|
Interest and other income
|
2
|
|
334
|
|
—
|
|
25,472
|
|
1
|
|
(304
|
)
|
25,505
|
|
|||||||||||||
|
Resident fee and services
|
—
|
|
—
|
|
—
|
|
—
|
|
3,508
|
|
—
|
|
3,508
|
|
|||||||||||||
|
Total revenues
|
2
|
|
334
|
|
—
|
|
216,054
|
|
23,979
|
|
(1,505
|
)
|
238,864
|
|
|||||||||||||
|
Expenses:
|
|||||||||||||||||||||||||||
|
Depreciation and amortization
|
47
|
|
—
|
|
—
|
|
57,141
|
|
5,891
|
|
—
|
|
63,079
|
|
|||||||||||||
|
Interest
|
—
|
|
52,208
|
|
—
|
|
1,553
|
|
5,718
|
|
(261
|
)
|
59,218
|
|
|||||||||||||
|
Operating expenses
|
—
|
|
—
|
|
—
|
|
—
|
|
3,789
|
|
(1,213
|
)
|
2,576
|
|
|||||||||||||
|
General and administrative
|
14,485
|
|
29
|
|
—
|
|
1,411
|
|
168
|
|
—
|
|
16,093
|
|
|||||||||||||
|
Merger and acquisition costs
|
(14
|
)
|
—
|
|
—
|
|
6,868
|
|
169
|
|
—
|
|
7,023
|
|
|||||||||||||
|
Provision for doubtful accounts and write-offs
|
1,291
|
|
—
|
|
—
|
|
11,551
|
|
—
|
|
—
|
|
12,842
|
|
|||||||||||||
|
Total expenses
|
15,809
|
|
52,237
|
|
—
|
|
78,524
|
|
15,735
|
|
(1,474
|
)
|
160,831
|
|
|||||||||||||
|
Other income (expense):
|
|||||||||||||||||||||||||||
|
Other income
|
—
|
|
1,651
|
|
—
|
|
609
|
|
—
|
|
—
|
|
2,260
|
|
|||||||||||||
|
Gain on sale of real estate
|
—
|
|
—
|
|
—
|
|
(161
|
)
|
—
|
|
—
|
|
(161
|
)
|
|||||||||||||
|
Total other income (expense)
|
—
|
|
1,651
|
|
—
|
|
448
|
|
—
|
|
—
|
|
2,099
|
|
|||||||||||||
|
Income in subsidiary
|
95,690
|
|
145,943
|
|
—
|
|
8,368
|
|
—
|
|
(250,001
|
)
|
—
|
|
|||||||||||||
|
Income before income tax expense
|
79,883
|
|
95,691
|
|
—
|
|
146,346
|
|
8,244
|
|
(250,032
|
)
|
80,132
|
|
|||||||||||||
|
Income tax expense
|
(439
|
)
|
(1
|
)
|
—
|
|
(284
|
)
|
(25
|
)
|
—
|
|
(749
|
)
|
|||||||||||||
|
Net income
|
79,444
|
|
95,690
|
|
—
|
|
146,062
|
|
8,219
|
|
(250,032
|
)
|
79,383
|
|
|||||||||||||
|
Net loss attributable to noncontrolling interests
|
—
|
|
—
|
|
—
|
|
—
|
|
30
|
|
—
|
|
30
|
|
|||||||||||||
|
Net income attributable to Sabra Health Care REIT, Inc.
|
79,444
|
|
95,690
|
|
—
|
|
146,062
|
|
8,249
|
|
(250,032
|
)
|
79,413
|
|
|||||||||||||
|
Preferred stock dividends
|
(10,242
|
)
|
—
|
|
—
|
|
—
|
|
—
|
|
—
|
|
(10,242
|
)
|
|||||||||||||
|
Net income attributable to common stockholders
|
$
|
69,202
|
|
$
|
95,690
|
|
$
|
—
|
|
$
|
146,062
|
|
$
|
8,249
|
|
$
|
(250,032
|
)
|
$
|
69,171
|
|
||||||
|
Net income attributable to common stockholders, per:
|
|||||||||||||||||||||||||||
|
Basic common share
|
$
|
1.11
|
|
||||||||||||||||||||||||
|
Diluted common share
|
$
|
1.11
|
|
||||||||||||||||||||||||
|
Weighted-average number of common shares outstanding, basic
|
62,235,014
|
|
|||||||||||||||||||||||||
|
Weighted-average number of common shares outstanding, diluted
|
62,460,239
|
|
|||||||||||||||||||||||||
|
(1)
|
The Parent Company guarantees the 2021 Notes, the 2023 Notes and the 2026 Notes.
|
|
(2)
|
The Operating Partnership is the co-issuer of the 2021 Notes and the 2023 Notes and the issuer of the 2026 Notes.
|
|
(3)
|
Sabra Capital Corporation is the co-issuer of the 2021 Notes and the 2023 Notes.
|
|
(4)
|
The Combined Guarantor Subsidiaries of the 2021 Notes and the 2023 Notes guarantee the 2021 Notes and the 2023 Notes.
|
|
(5)
|
The Combined Non-Guarantor Subsidiaries of the 2021 Notes and the 2023 Notes consist of the subsidiaries that do not guarantee the 2021 Notes and the 2023 Notes.
|
|
(6)
|
None of Sabra Capital Corporation, the Combined Guarantor Subsidiaries of the 2021 Notes and the 2023 Notes, nor the Combined Non-Guarantor Subsidiaries of the 2021 Notes and the 2023 Notes guarantee the 2026 Notes.
|
F-43
CONSOLIDATING STATEMENT OF COMPREHENSIVE INCOME
For the
Year Ended
December 31, 2017
(in thousands)
|
Combined Non-Guarantor Subsidiaries of 2026 Notes
(6)
|
|||||||||||||||||||||||||||
|
Parent
Company (1) |
Operating
Partnership (2) |
Sabra Capital
Corporation (3) |
Combined
Guarantor Subsidiaries of 2021 Notes and 2023 Notes (4) |
Combined Non-
Guarantor Subsidiaries of 2021 Notes and 2023 Notes (5) |
Elimination
|
Consolidated
|
|||||||||||||||||||||
|
Net income
|
$
|
158,383
|
|
$
|
212,432
|
|
$
|
—
|
|
$
|
190,374
|
|
$
|
106,221
|
|
$
|
(509,045
|
)
|
$
|
158,365
|
|
||||||
|
Other comprehensive income (loss):
|
|||||||||||||||||||||||||||
|
Unrealized gain (loss), net of tax:
|
|||||||||||||||||||||||||||
|
Foreign currency translation (loss) gain
|
—
|
|
(2,821
|
)
|
—
|
|
2,233
|
|
742
|
|
—
|
|
154
|
|
|||||||||||||
|
Unrealized gain (loss) on cash flow hedge
|
—
|
|
13,078
|
|
—
|
|
(145
|
)
|
—
|
|
—
|
|
12,933
|
|
|||||||||||||
|
Total other comprehensive income
|
—
|
|
10,257
|
|
—
|
|
2,088
|
|
742
|
|
—
|
|
13,087
|
|
|||||||||||||
|
Comprehensive income
|
158,383
|
|
222,689
|
|
—
|
|
192,462
|
|
106,963
|
|
(509,045
|
)
|
171,452
|
|
|||||||||||||
|
Comprehensive loss attributable to noncontrolling interests
|
—
|
|
—
|
|
—
|
|
—
|
|
18
|
|
—
|
|
18
|
|
|||||||||||||
|
Comprehensive income attributable to Sabra Health Care REIT, Inc.
|
$
|
158,383
|
|
$
|
222,689
|
|
$
|
—
|
|
$
|
192,462
|
|
$
|
106,981
|
|
$
|
(509,045
|
)
|
$
|
171,470
|
|
||||||
|
(1)
|
The Parent Company guarantees the 2021 Notes, the 2023 Notes and the 2026 Notes.
|
|
(2)
|
The Operating Partnership is the co-issuer of the 2021 Notes and the 2023 Notes and the issuer of the 2026 Notes.
|
|
(3)
|
Sabra Capital Corporation is the co-issuer of the 2021 Notes and the 2023 Notes.
|
|
(4)
|
The Combined Guarantor Subsidiaries of the 2021 Notes and the 2023 Notes guarantee the 2021 Notes and the 2023 Notes.
|
|
(5)
|
The Combined Non-Guarantor Subsidiaries of the 2021 Notes and the 2023 Notes consist of the subsidiaries that do not guarantee the 2021 Notes and the 2023 Notes.
|
|
(6)
|
None of Sabra Capital Corporation, the Combined Guarantor Subsidiaries of the 2021 Notes and the 2023 Notes, nor the Combined Non-Guarantor Subsidiaries of the 2021 Notes and the 2023 Notes guarantee the 2026 Notes.
|
F-44
CONSOLIDATING STATEMENT OF COMPREHENSIVE INCOME
For the
Year Ended
December 31, 2016
(in thousands)
|
Combined Non-Guarantor Subsidiaries of 2026 Notes
(6)
|
|||||||||||||||||||||||||||
|
Parent
Company (1) |
Operating
Partnership (2) |
Sabra Capital
Corporation (3) |
Combined
Guarantor Subsidiaries of 2021 Notes and 2023 Notes (4) |
Combined Non-
Guarantor Subsidiaries of 2021 Notes and 2023 Notes (5) |
Elimination
|
Consolidated
|
|||||||||||||||||||||
|
Net income
|
$
|
70,494
|
|
$
|
78,783
|
|
$
|
—
|
|
$
|
134,154
|
|
$
|
6,708
|
|
$
|
(219,934
|
)
|
$
|
70,205
|
|
||||||
|
Other comprehensive income (loss):
|
|||||||||||||||||||||||||||
|
Unrealized gain (loss), net of tax:
|
|||||||||||||||||||||||||||
|
Foreign currency translation gain (loss)
|
—
|
|
(2,080
|
)
|
—
|
|
364
|
|
82
|
|
—
|
|
(1,634
|
)
|
|||||||||||||
|
Unrealized gain (loss) on cash flow hedge
|
—
|
|
7,169
|
|
—
|
|
—
|
|
—
|
|
—
|
|
7,169
|
|
|||||||||||||
|
Total other comprehensive income (loss)
|
—
|
|
5,089
|
|
—
|
|
364
|
|
82
|
|
—
|
|
5,535
|
|
|||||||||||||
|
Comprehensive income
|
70,494
|
|
83,872
|
|
—
|
|
134,518
|
|
6,790
|
|
(219,934
|
)
|
75,740
|
|
|||||||||||||
|
Comprehensive loss attributable to noncontrolling interests
|
—
|
|
—
|
|
—
|
|
—
|
|
71
|
|
—
|
|
71
|
|
|||||||||||||
|
Comprehensive income attributable to Sabra Health Care REIT, Inc.
|
$
|
70,494
|
|
$
|
83,872
|
|
$
|
—
|
|
$
|
134,518
|
|
$
|
6,861
|
|
$
|
(219,934
|
)
|
$
|
75,811
|
|
||||||
|
(1)
|
The Parent Company guarantees the 2021 Notes, the 2023 Notes and the 2026 Notes.
|
|
(2)
|
The Operating Partnership is the co-issuer of the 2021 Notes and the 2023 Notes and the issuer of the 2026 Notes.
|
|
(3)
|
Sabra Capital Corporation is the co-issuer of the 2021 Notes and the 2023 Notes.
|
|
(4)
|
The Combined Guarantor Subsidiaries of the 2021 Notes and the 2023 Notes guarantee the 2021 Notes and the 2023 Notes.
|
|
(5)
|
The Combined Non-Guarantor Subsidiaries of the 2021 Notes and the 2023 Notes consist of the subsidiaries that do not guarantee the 2021 Notes and the 2023 Notes.
|
|
(6)
|
None of Sabra Capital Corporation, the Combined Guarantor Subsidiaries of the 2021 Notes and the 2023 Notes, nor the Combined Non-Guarantor Subsidiaries of the 2021 Notes and the 2023 Notes guarantee the 2026 Notes.
|
F-45
CONSOLIDATING STATEMENT OF COMPREHENSIVE INCOME
For the
Year Ended
December 31, 2015
(in thousands)
|
Combined Non-Guarantor Subsidiaries of 2026 Notes
(6)
|
|||||||||||||||||||||||||||
|
Parent
Company (1) |
Operating
Partnership (2) |
Sabra Capital
Corporation (3) |
Combined
Guarantor Subsidiaries of 2021 Notes and 2023 Notes (4) |
Combined Non-
Guarantor Subsidiaries of 2021 Notes and 2023 Notes (5) |
Elimination
|
Consolidated
|
|||||||||||||||||||||
|
Net income
|
$
|
79,444
|
|
$
|
95,690
|
|
$
|
—
|
|
$
|
146,062
|
|
$
|
8,219
|
|
$
|
(250,032
|
)
|
$
|
79,383
|
|
||||||
|
Other comprehensive income (loss):
|
|||||||||||||||||||||||||||
|
Unrealized gain (loss), net of tax:
|
|||||||||||||||||||||||||||
|
Foreign currency translation gain (loss)
|
—
|
|
5,542
|
|
—
|
|
(5,507
|
)
|
(1,468
|
)
|
—
|
|
(1,433
|
)
|
|||||||||||||
|
Unrealized gain (loss) on cash flow hedges
|
—
|
|
(4,358
|
)
|
—
|
|
—
|
|
—
|
|
—
|
|
(4,358
|
)
|
|||||||||||||
|
Total other comprehensive income (loss)
|
—
|
|
1,184
|
|
—
|
|
(5,507
|
)
|
(1,468
|
)
|
—
|
|
(5,791
|
)
|
|||||||||||||
|
Comprehensive income
|
79,444
|
|
96,874
|
|
—
|
|
140,555
|
|
6,751
|
|
(250,032
|
)
|
73,592
|
|
|||||||||||||
|
Comprehensive loss attributable to noncontrolling interests
|
—
|
|
—
|
|
—
|
|
—
|
|
30
|
|
—
|
|
30
|
|
|||||||||||||
|
Comprehensive income attributable to Sabra Health Care REIT, Inc.
|
$
|
79,444
|
|
$
|
96,874
|
|
$
|
—
|
|
$
|
140,555
|
|
$
|
6,781
|
|
$
|
(250,032
|
)
|
$
|
73,622
|
|
||||||
|
(1)
|
The Parent Company guarantees the 2021 Notes, the 2023 Notes and the 2026 Notes.
|
|
(2)
|
The Operating Partnership is the co-issuer of the 2021 Notes and the 2023 Notes and the issuer of the 2026 Notes.
|
|
(3)
|
Sabra Capital Corporation is the co-issuer of the 2021 Notes and the 2023 Notes.
|
|
(4)
|
The Combined Guarantor Subsidiaries of the 2021 Notes and the 2023 Notes guarantee the 2021 Notes and the 2023 Notes.
|
|
(5)
|
The Combined Non-Guarantor Subsidiaries of the 2021 Notes and the 2023 Notes consist of the subsidiaries that do not guarantee the 2021 Notes and the 2023 Notes.
|
|
(6)
|
None of Sabra Capital Corporation, the Combined Guarantor Subsidiaries of the 2021 Notes and the 2023 Notes, nor the Combined Non-Guarantor Subsidiaries of the 2021 Notes and the 2023 Notes guarantee the 2026 Notes.
|
F-46
CONSOLIDATING STATEMENT OF CASH FLOWS
For the
Year Ended
December 31, 2017
(in thousands)
|
Combined Non-Guarantor Subsidiaries of 2026 Notes
(6)
|
|||||||||||||||||||||||||||
|
Parent
Company (1) |
Operating
Partnership (2) |
Sabra Capital
Corporation (3) |
Combined
Guarantor Subsidiaries of 2021 Notes and 2023 Notes (4) |
Combined Non-
Guarantor Subsidiaries of 2021 Notes and 2023 Notes (5) |
Elimination
|
Consolidated
|
|||||||||||||||||||||
|
Net cash provided by operating activities
|
$
|
59,640
|
|
$
|
—
|
|
$
|
—
|
|
$
|
61,744
|
|
$
|
12,102
|
|
$
|
—
|
|
$
|
133,486
|
|
||||||
|
Cash flows from investing activities:
|
|||||||||||||||||||||||||||
|
Acquisition of real estate
|
—
|
|
—
|
|
—
|
|
(419,905
|
)
|
—
|
|
—
|
|
(419,905
|
)
|
|||||||||||||
|
Cash received in CCP Merger
|
77,859
|
|
—
|
|
—
|
|
—
|
|
—
|
|
—
|
|
77,859
|
|
|||||||||||||
|
Origination and fundings of loans receivable
|
—
|
|
—
|
|
—
|
|
(1,799
|
)
|
(15,440
|
)
|
—
|
|
(17,239
|
)
|
|||||||||||||
|
Origination and fundings of preferred equity investments
|
—
|
|
—
|
|
—
|
|
(2,749
|
)
|
—
|
|
—
|
|
(2,749
|
)
|
|||||||||||||
|
Additions to real estate
|
(181
|
)
|
—
|
|
—
|
|
(2,339
|
)
|
(4,434
|
)
|
—
|
|
(6,954
|
)
|
|||||||||||||
|
Repayment of loans receivable
|
—
|
|
—
|
|
—
|
|
12,441
|
|
19,989
|
|
—
|
|
32,430
|
|
|||||||||||||
|
Repayment of preferred equity investments
|
—
|
|
—
|
|
—
|
|
3,755
|
|
—
|
|
—
|
|
3,755
|
|
|||||||||||||
|
Net proceeds from sale of real estate
|
—
|
|
—
|
|
—
|
|
92,337
|
|
394
|
|
—
|
|
92,731
|
|
|||||||||||||
|
Distribution from subsidiaries
|
2,474
|
|
2,474
|
|
—
|
|
—
|
|
—
|
|
(4,948
|
)
|
—
|
|
|||||||||||||
|
Intercompany financing
|
168,999
|
|
(249,664
|
)
|
—
|
|
—
|
|
—
|
|
80,665
|
|
—
|
|
|||||||||||||
|
Net cash provided by (used in) investing activities
|
249,151
|
|
(247,190
|
)
|
—
|
|
(318,259
|
)
|
509
|
|
75,717
|
|
(240,072
|
)
|
|||||||||||||
|
Cash flows from financing activities:
|
|||||||||||||||||||||||||||
|
Net repayments of revolving credit facility
|
—
|
|
253,000
|
|
—
|
|
—
|
|
—
|
|
—
|
|
253,000
|
|
|||||||||||||
|
Proceeds from term loans
|
—
|
|
181,000
|
|
—
|
|
—
|
|
—
|
|
—
|
|
181,000
|
|
|||||||||||||
|
Principal payments on secured debt
|
—
|
|
—
|
|
—
|
|
—
|
|
(4,145
|
)
|
—
|
|
(4,145
|
)
|
|||||||||||||
|
Payments of deferred financing costs
|
—
|
|
(15,337
|
)
|
—
|
|
—
|
|
—
|
|
—
|
|
(15,337
|
)
|
|||||||||||||
|
Payment of contingent consideration
|
—
|
|
—
|
|
—
|
|
(382
|
)
|
—
|
|
—
|
|
(382
|
)
|
|||||||||||||
|
Distribution to noncontrolling interest
|
—
|
|
—
|
|
—
|
|
—
|
|
(30
|
)
|
—
|
|
(30
|
)
|
|||||||||||||
|
Issuance of preferred stock
|
—
|
|
—
|
|
—
|
|
—
|
|
—
|
|
—
|
|
—
|
|
|||||||||||||
|
Issuance of common stock, net
|
366,800
|
|
—
|
|
—
|
|
—
|
|
—
|
|
—
|
|
366,800
|
|
|||||||||||||
|
Dividends paid on common and preferred stock
|
(182,089
|
)
|
—
|
|
—
|
|
—
|
|
—
|
|
—
|
|
(182,089
|
)
|
|||||||||||||
|
Distribution to parent
|
—
|
|
(2,474
|
)
|
—
|
|
—
|
|
(2,474
|
)
|
4,948
|
|
—
|
|
|||||||||||||
|
Intercompany financing
|
—
|
|
(168,999
|
)
|
—
|
|
254,608
|
|
(4,944
|
)
|
(80,665
|
)
|
—
|
|
|||||||||||||
|
Net cash provided by (used in) financing activities
|
184,711
|
|
247,190
|
|
—
|
|
254,226
|
|
(11,593
|
)
|
(75,717
|
)
|
598,817
|
|
|||||||||||||
|
Net increase (decrease) in cash and cash equivalents
|
493,502
|
|
—
|
|
—
|
|
(2,289
|
)
|
1,018
|
|
—
|
|
492,231
|
|
|||||||||||||
|
Effect of foreign currency translation on cash and cash equivalents
|
—
|
|
—
|
|
—
|
|
63
|
|
675
|
|
—
|
|
738
|
|
|||||||||||||
|
Cash and cash equivalents, beginning of period
|
18,168
|
|
—
|
|
—
|
|
2,675
|
|
4,820
|
|
—
|
|
25,663
|
|
|||||||||||||
|
Cash and cash equivalents, end of period
|
$
|
511,670
|
|
$
|
—
|
|
$
|
—
|
|
$
|
449
|
|
$
|
6,513
|
|
$
|
—
|
|
$
|
518,632
|
|
||||||
|
(1)
|
The Parent Company guarantees the 2021 Notes, the 2023 Notes and the 2026 Notes.
|
|
(2)
|
The Operating Partnership is the co-issuer of the 2021 Notes and the 2023 Notes and the issuer of the 2026 Notes.
|
|
(3)
|
Sabra Capital Corporation is the co-issuer of the 2021 Notes and the 2023 Notes.
|
|
(4)
|
The Combined Guarantor Subsidiaries of the 2021 Notes and the 2023 Notes guarantee the 2021 Notes and the 2023 Notes.
|
|
(5)
|
The Combined Non-Guarantor Subsidiaries of the 2021 Notes and the 2023 Notes consist of the subsidiaries that do not guarantee the 2021 Notes and the 2023 Notes.
|
|
(6)
|
None of Sabra Capital Corporation, the Combined Guarantor Subsidiaries of the 2021 Notes and the 2023 Notes, nor the Combined Non-Guarantor Subsidiaries of the 2021 Notes and the 2023 Notes guarantee the 2026 Notes.
|
F-47
CONSOLIDATING STATEMENT OF CASH FLOWS
For the
Year Ended
December 31, 2016
(in thousands)
|
Combined Non-Guarantor Subsidiaries of 2026 Notes
(6)
|
|||||||||||||||||||||||||||
|
Parent
Company (1) |
Operating
Partnership (2) |
Sabra Capital
Corporation (3) |
Combined
Guarantor Subsidiaries of 2021 Notes and 2023 Notes (4) |
Combined Non-
Guarantor Subsidiaries of 2021 Notes and 2023 Notes (5) |
Elimination
|
Consolidated
|
|||||||||||||||||||||
|
Net cash provided by operating activities
|
$
|
153,577
|
|
$
|
—
|
|
$
|
—
|
|
$
|
12,074
|
|
$
|
11,088
|
|
$
|
—
|
|
$
|
176,739
|
|
||||||
|
Cash flows from investing activities:
|
|||||||||||||||||||||||||||
|
Acquisition of real estate
|
—
|
|
—
|
|
—
|
|
(153,579
|
)
|
—
|
|
—
|
|
(153,579
|
)
|
|||||||||||||
|
Origination and fundings of loans receivable
|
—
|
|
—
|
|
—
|
|
(9,675
|
)
|
—
|
|
—
|
|
(9,675
|
)
|
|||||||||||||
|
Origination and fundings of preferred equity investments
|
—
|
|
—
|
|
—
|
|
(7,348
|
)
|
—
|
|
—
|
|
(7,348
|
)
|
|||||||||||||
|
Additions to real estate
|
(124
|
)
|
—
|
|
—
|
|
(502
|
)
|
(377
|
)
|
—
|
|
(1,003
|
)
|
|||||||||||||
|
Repayment of loans receivable
|
—
|
|
—
|
|
—
|
|
215,962
|
|
—
|
|
—
|
|
215,962
|
|
|||||||||||||
|
Net proceeds from sale of real estate
|
—
|
|
—
|
|
—
|
|
97,407
|
|
599
|
|
—
|
|
98,006
|
|
|||||||||||||
|
Investment in subsidiaries
|
(200
|
)
|
(200
|
)
|
—
|
|
—
|
|
—
|
|
400
|
|
—
|
|
|||||||||||||
|
Distribution from subsidiaries
|
6,404
|
|
6,404
|
|
—
|
|
—
|
|
—
|
|
(12,808
|
)
|
—
|
|
|||||||||||||
|
Intercompany financing
|
(23,484
|
)
|
165,842
|
|
—
|
|
—
|
|
—
|
|
(142,358
|
)
|
—
|
|
|||||||||||||
|
Net cash (used in) provided by investing activities
|
(17,404
|
)
|
172,046
|
|
—
|
|
142,265
|
|
222
|
|
(154,766
|
)
|
142,363
|
|
|||||||||||||
|
Cash flows from financing activities:
|
|||||||||||||||||||||||||||
|
Net repayments of revolving credit facility
|
—
|
|
(229,000
|
)
|
—
|
|
—
|
|
—
|
|
—
|
|
(229,000
|
)
|
|||||||||||||
|
Proceeds from term loans
|
—
|
|
45,000
|
|
—
|
|
24,360
|
|
—
|
|
—
|
|
69,360
|
|
|||||||||||||
|
Principal payments on secured debt
|
—
|
|
—
|
|
—
|
|
(10,766
|
)
|
(4,002
|
)
|
—
|
|
(14,768
|
)
|
|||||||||||||
|
Payments of deferred financing costs
|
—
|
|
(5,326
|
)
|
—
|
|
(611
|
)
|
—
|
|
—
|
|
(5,937
|
)
|
|||||||||||||
|
Issuance of common stock, net
|
(1,289
|
)
|
—
|
|
—
|
|
—
|
|
—
|
|
—
|
|
(1,289
|
)
|
|||||||||||||
|
Dividends paid on common and preferred stock
|
(119,264
|
)
|
—
|
|
—
|
|
—
|
|
—
|
|
—
|
|
(119,264
|
)
|
|||||||||||||
|
Contribution from parent
|
—
|
|
200
|
|
—
|
|
—
|
|
200
|
|
(400
|
)
|
—
|
|
|||||||||||||
|
Distribution to parent
|
—
|
|
(6,404
|
)
|
—
|
|
—
|
|
(6,404
|
)
|
12,808
|
|
—
|
|
|||||||||||||
|
Intercompany financing
|
—
|
|
23,484
|
|
—
|
|
(165,175
|
)
|
(667
|
)
|
142,358
|
|
—
|
|
|||||||||||||
|
Net cash (used in) provided by financing activities
|
(120,553
|
)
|
(172,046
|
)
|
—
|
|
(152,192
|
)
|
(10,873
|
)
|
154,766
|
|
(300,898
|
)
|
|||||||||||||
|
Net increase in cash and cash equivalents
|
15,620
|
|
—
|
|
—
|
|
2,147
|
|
437
|
|
—
|
|
18,204
|
|
|||||||||||||
|
Effect of foreign currency translation on cash and cash equivalents
|
—
|
|
—
|
|
—
|
|
72
|
|
(47
|
)
|
—
|
|
25
|
|
|||||||||||||
|
Cash and cash equivalents, beginning of period
|
2,548
|
|
—
|
|
—
|
|
456
|
|
4,430
|
|
—
|
|
7,434
|
|
|||||||||||||
|
Cash and cash equivalents, end of period
|
$
|
18,168
|
|
$
|
—
|
|
$
|
—
|
|
$
|
2,675
|
|
$
|
4,820
|
|
$
|
—
|
|
$
|
25,663
|
|
||||||
|
(1)
|
The Parent Company guarantees the 2021 Notes, the 2023 Notes and the 2026 Notes.
|
|
(2)
|
The Operating Partnership is the co-issuer of the 2021 Notes and the 2023 Notes and the issuer of the 2026 Notes.
|
|
(3)
|
Sabra Capital Corporation is the co-issuer of the 2021 Notes and the 2023 Notes.
|
|
(4)
|
The Combined Guarantor Subsidiaries of the 2021 Notes and the 2023 Notes guarantee the 2021 Notes and the 2023 Notes.
|
|
(5)
|
The Combined Non-Guarantor Subsidiaries of the 2021 Notes and the 2023 Notes consist of the subsidiaries that do not guarantee the 2021 Notes and the 2023 Notes.
|
|
(6)
|
None of Sabra Capital Corporation, the Combined Guarantor Subsidiaries of the 2021 Notes and the 2023 Notes, nor the Combined Non-Guarantor Subsidiaries of the 2021 Notes and the 2023 Notes guarantee the 2026 Notes.
|
F-48
CONSOLIDATING STATEMENT OF CASH FLOWS
For the
Year Ended December 31, 2015
(in thousands)
|
Combined Non-Guarantor Subsidiaries of 2026 Notes
(6)
|
|||||||||||||||||||||||||||
|
Parent
Company (1) |
Operating
Partnership (2) |
Sabra Capital
Corporation (3) |
Combined
Guarantor Subsidiaries of 2021 Notes and 2023 Notes (4) |
Combined Non-
Guarantor Subsidiaries of 2021 Notes and 2023 Notes (5) |
Elimination
|
Consolidated
|
|||||||||||||||||||||
|
Net cash provided by operating activities
|
$
|
112,291
|
|
$
|
—
|
|
$
|
—
|
|
$
|
820
|
|
$
|
7,990
|
|
$
|
—
|
|
$
|
121,101
|
|
||||||
|
Cash flows from investing activities:
|
|||||||||||||||||||||||||||
|
Acquisition of real estate
|
—
|
|
—
|
|
—
|
|
(450,082
|
)
|
(11,248
|
)
|
—
|
|
(461,330
|
)
|
|||||||||||||
|
Origination and fundings of loans receivable
|
—
|
|
—
|
|
—
|
|
(49,687
|
)
|
—
|
|
—
|
|
(49,687
|
)
|
|||||||||||||
|
Origination and fundings of preferred equity investments
|
—
|
|
—
|
|
—
|
|
(12,804
|
)
|
—
|
|
—
|
|
(12,804
|
)
|
|||||||||||||
|
Additions to real estate
|
(34
|
)
|
—
|
|
—
|
|
(1,286
|
)
|
(2,369
|
)
|
—
|
|
(3,689
|
)
|
|||||||||||||
|
Repayment of loans receivable
|
—
|
|
—
|
|
—
|
|
5,803
|
|
—
|
|
—
|
|
5,803
|
|
|||||||||||||
|
Release of contingent consideration held in escrow
|
—
|
|
—
|
|
—
|
|
5,240
|
|
—
|
|
—
|
|
5,240
|
|
|||||||||||||
|
Net proceeds from the sale of real estate
|
—
|
|
—
|
|
—
|
|
27,241
|
|
—
|
|
—
|
|
27,241
|
|
|||||||||||||
|
Investment in subsidiaries
|
(414
|
)
|
(414
|
)
|
—
|
|
—
|
|
—
|
|
828
|
|
—
|
|
|||||||||||||
|
Distribution from subsidiaries
|
3,515
|
|
3,515
|
|
—
|
|
—
|
|
—
|
|
(7,030
|
)
|
—
|
|
|||||||||||||
|
Intercompany financing
|
(200,884
|
)
|
(387,652
|
)
|
—
|
|
—
|
|
—
|
|
588,536
|
|
—
|
|
|||||||||||||
|
Net cash (used in) provided by investing activities
|
(197,817
|
)
|
(384,551
|
)
|
—
|
|
(475,575
|
)
|
(13,617
|
)
|
582,334
|
|
(489,226
|
)
|
|||||||||||||
|
Cash flows from financing activities:
|
|||||||||||||||||||||||||||
|
Net proceeds from revolving credit facility
|
—
|
|
187,000
|
|
—
|
|
—
|
|
—
|
|
—
|
|
187,000
|
|
|||||||||||||
|
Proceeds from term loans
|
—
|
|
—
|
|
—
|
|
73,242
|
|
—
|
|
—
|
|
73,242
|
|
|||||||||||||
|
Proceeds from secured debt
|
—
|
|
—
|
|
—
|
|
—
|
|
28,735
|
|
—
|
|
28,735
|
|
|||||||||||||
|
Principal payments on secured debt
|
—
|
|
—
|
|
—
|
|
—
|
|
(3,132
|
)
|
—
|
|
(3,132
|
)
|
|||||||||||||
|
Payments of deferred financing costs
|
—
|
|
(232
|
)
|
—
|
|
(740
|
)
|
(480
|
)
|
—
|
|
(1,452
|
)
|
|||||||||||||
|
Contributions by noncontrolling interests
|
—
|
|
—
|
|
—
|
|
—
|
|
179
|
|
—
|
|
179
|
|
|||||||||||||
|
Issuance of common stock, net
|
139,403
|
|
—
|
|
—
|
|
—
|
|
—
|
|
—
|
|
139,403
|
|
|||||||||||||
|
Dividends paid on common and preferred stock
|
(109,897
|
)
|
—
|
|
—
|
|
—
|
|
—
|
|
—
|
|
(109,897
|
)
|
|||||||||||||
|
Contribution from parent
|
—
|
|
414
|
|
—
|
|
—
|
|
414
|
|
(828
|
)
|
—
|
|
|||||||||||||
|
Distribution to parent
|
—
|
|
(3,515
|
)
|
—
|
|
—
|
|
(3,515
|
)
|
7,030
|
|
—
|
|
|||||||||||||
|
Intercompany financing
|
—
|
|
200,884
|
|
—
|
|
402,745
|
|
(15,093
|
)
|
(588,536
|
)
|
—
|
|
|||||||||||||
|
Net cash provided by (used in) financing activities
|
29,506
|
|
384,551
|
|
—
|
|
475,247
|
|
7,108
|
|
(582,334
|
)
|
314,078
|
|
|||||||||||||
|
Net (decrease) increase in cash and cash equivalents
|
(56,020
|
)
|
—
|
|
—
|
|
492
|
|
1,481
|
|
—
|
|
(54,047
|
)
|
|||||||||||||
|
Effect of foreign currency translation on cash and cash equivalents
|
(231
|
)
|
—
|
|
—
|
|
(36
|
)
|
(45
|
)
|
—
|
|
(312
|
)
|
|||||||||||||
|
Cash and cash equivalents, beginning of period
|
58,799
|
|
—
|
|
—
|
|
—
|
|
2,994
|
|
—
|
|
61,793
|
|
|||||||||||||
|
Cash and cash equivalents, end of period
|
$
|
2,548
|
|
$
|
—
|
|
$
|
—
|
|
$
|
456
|
|
$
|
4,430
|
|
$
|
—
|
|
$
|
7,434
|
|
||||||
|
(1)
|
The Parent Company guarantees the 2021 Notes, the 2023 Notes and the 2026 Notes.
|
|
(2)
|
The Operating Partnership is the co-issuer of the 2021 Notes and the 2023 Notes and the issuer of the 2026 Notes.
|
|
(3)
|
Sabra Capital Corporation is the co-issuer of the 2021 Notes and the 2023 Notes.
|
|
(4)
|
The Combined Guarantor Subsidiaries of the 2021 Notes and the 2023 Notes guarantee the 2021 Notes and the 2023 Notes.
|
|
(5)
|
The Combined Non-Guarantor Subsidiaries of the 2021 Notes and the 2023 Notes consist of the subsidiaries that do not guarantee the 2021 Notes and the 2023 Notes.
|
|
(6)
|
None of Sabra Capital Corporation, the Combined Guarantor Subsidiaries of the 2021 Notes and the 2023 Notes, nor the Combined Non-Guarantor Subsidiaries of the 2021 Notes and the 2023 Notes guarantee the 2026 Notes.
|
F-49
|
16.
|
PRO FORMA FINANCIAL INFORMATION (UNAUDITED)
|
The following table summarizes, on an unaudited pro forma basis, the consolidated results of operations of the Company for the
years
ended
December 31, 2017
and
2016
to give effect to the CCP Merger completed during the year ended
December 31, 2017
and the acquisition of
one
skilled nursing/transitional care facility and
three
senior housing communities during the year ended
December 31, 2016
. The following unaudited pro forma information has been prepared to give effect to the acquisitions completed during the years ended
December 31, 2017
and
2016
as if these acquisitions occurred on January 1,
2016
and
2015
, respectively. This pro forma information does not purport to represent what the actual results of operations of the Company would have been had these acquisitions occurred on January 1,
2016
and
2015
, nor does it purport to predict the results of operations for future periods.
|
Year Ended December 31,
|
||||||||
|
2017
|
2016
|
|||||||
|
(in thousands, except share and per share amounts)
|
||||||||
|
Revenues
|
$
|
631,041
|
|
$
|
627,475
|
|
||
|
Net income attributable to common stockholders
|
$
|
292,551
|
|
$
|
225,331
|
|
||
|
Net income attributable to common stockholders, per:
|
||||||||
|
Basic common share
|
$
|
1.78
|
|
$
|
1.41
|
|
||
|
Diluted common share
|
$
|
1.78
|
|
$
|
1.41
|
|
||
|
Weighted-average number of common shares outstanding, basic
|
164,361,139
|
|
159,319,612
|
|
||||
|
Weighted-average number of common shares outstanding, diluted
|
164,582,331
|
|
159,556,033
|
|
||||
Merger and acquisition costs of
$30.2 million
related to the CCP Merger completed during year the ended
December 31, 2017
are reflected above as if they were incurred on January 1, 2016.
17.
COMMITMENTS AND CONTINGENCIES
Environmental
As an owner of real estate, the Company is subject to various environmental laws of federal, state and local governments. The Company is not aware of any environmental liability that could have a material adverse effect on its financial condition or results of operations. However, changes in applicable environmental laws and regulations, the uses and conditions of properties in the vicinity of the Company’s properties, the activities of its tenants and other environmental conditions of which the Company is unaware with respect to the properties could result in future environmental liabilities. As of
December 31, 2017
, the Company does not expect that compliance with existing environmental laws will have a material adverse effect on the Company’s financial condition and results of operations.
Income Taxes
As a result of the Company’s separation from Sun effective November 15, 2010, the Company is the surviving taxpayer for income tax purposes. Accordingly, tax positions taken prior to the Separation Date remained the Company’s obligations after the Separation Date. Sun agreed to indemnify the Company against, among other things, federal, state and local taxes (including penalties and interest) related to periods prior to the Separation Date to the extent the deferred tax assets allocated to the Company are not sufficient and/or cannot be utilized to satisfy these taxes.
Effective December 1, 2012, Sun was acquired by Genesis HealthCare LLC. As a result of its acquisition Sun, Genesis HealthCare LLC became successor to the obligations of Sun described above. Effective February 2, 2015, Genesis HealthCare LLC combined with Skilled Healthcare Group, Inc. and now operates under the name Genesis Healthcare, Inc.
Legal Matters
From time to time, the Company is party to legal proceedings that arise in the ordinary course of its business. Management is not aware of any legal proceedings where the likelihood of a loss contingency is reasonably possible and the amount or range of reasonably possible losses is material to the Company’s results of operations, financial condition or cash flows.
F-50
|
18.
|
SUBSEQUENT EVENTS
|
The Company evaluates subsequent events up until the date the consolidated financial statements are issued.
Enlivant Joint Venture
On
January 2, 2018
, the Company completed its transaction with affiliates of Enlivant and TPG Real Estate, the real estate platform of TPG, to acquire a
49%
equity interest in an entity that collectively owns
172
senior housing communities managed by Enlivant (the “Enlivant Joint Venture”). The Company contributed
$352.7 million
for the
49%
noncontrolling interest, which implies an aggregate portfolio value for the Enlivant Joint Venture of
$1.49 billion
. The Enlivant Joint Venture has outstanding indebtedness of
$791.3 million
for the portfolio and net working capital of
$22.9 million
. The joint venture agreement includes an option for the Company to acquire the remaining majority interest in the Enlivant Joint Venture which terminates on January 2, 2021. Sabra's partner in the Enlivant Joint Venture has the option to transfer its interest commencing on January 2, 2020 subject to the Company's right of first offer. In addition, Sabra has the right to designate
three
directors on the
seven
member boards of directors of the Enlivant Joint Venture and has other customary minority rights.
Additionally on
January 2, 2018
, the Company acquired
11
senior housing communities that are operated by Enlivant pursuant to property management agreements for
$138.3 million
, which includes net working capital of
$14.1 million
.
Dividend Declaration
On
February 5, 2018
, the Company announced that its board of directors declared a quarterly cash dividend of
$0.45
per share of common stock. The dividend will be paid on
February 28, 2018
to stockholders of record as of the close of business on
February 15, 2018
.
Also on
February 5, 2018
, the Company announced that its board of directors declared a quarterly cash dividend of
$0.4453125
per share of Series A Preferred Stock. The dividend will be paid on
February 28, 2018
to stockholders of record as of the close of business on
February 15, 2018
.
F-51
SCHEDULE II
VALUATION AND QUALIFYING ACCOUNTS
For the Years Ended December 31, 2017, 2016 and 2015
(dollars in thousands)
|
|
Balance at Beginning of Year
|
|
Charged to Earnings
|
|
Recoveries
|
Uncollectible Accounts Written-off
|
|
Foreign Currency Translation due to Charges
|
Balance at End
of Year
|
|||||||||||||||
|
Year ended December 31, 2017
|
|
|
|
|
|
|
|
|
|
|||||||||||||||
|
Allowance for doubtful accounts
|
|
$
|
3,693
|
|
|
$
|
2,100
|
|
$
|
—
|
|
$
|
(273
|
)
|
$
|
—
|
|
$
|
5,520
|
|
||||
|
Straight-line rent receivable allowance
|
|
3,668
|
|
|
10,487
|
|
—
|
|
(1,800
|
)
|
—
|
|
12,355
|
|
||||||||||
|
Loan loss reserves
|
2,750
|
|
4,526
|
|
—
|
|
(7,178
|
)
|
—
|
|
98
|
|
||||||||||||
|
|
|
$
|
10,111
|
|
|
$
|
17,113
|
|
|
$
|
—
|
|
$
|
(9,251
|
)
|
|
$
|
—
|
|
$
|
17,973
|
|
||
|
|
|
|
|
|
|
|
|
|
|
|
|
|
||||||||||||
|
Year ended December 31, 2016
|
|
|
|
|
|
|
|
|
|
|
|
|
||||||||||||
|
Allowance for doubtful accounts
|
|
$
|
3,811
|
|
|
$
|
235
|
|
$
|
—
|
|
$
|
(353
|
)
|
$
|
—
|
|
$
|
3,693
|
|
||||
|
Straight-line rent receivable allowance
|
|
5,331
|
|
|
3,540
|
|
—
|
|
(5,191
|
)
|
(12
|
)
|
3,668
|
|
||||||||||
|
Loan loss reserves
|
4,300
|
|
1,768
|
|
—
|
|
(3,318
|
)
|
—
|
|
2,750
|
|
||||||||||||
|
|
|
$
|
13,442
|
|
|
$
|
5,543
|
|
|
$
|
—
|
|
$
|
(8,862
|
)
|
|
$
|
(12
|
)
|
$
|
10,111
|
|
||
|
Year ended December 31, 2015
|
|
|
|
|
|
|
|
|
|
|
|
|
||||||||||||
|
Allowance for doubtful accounts
|
|
$
|
—
|
|
|
$
|
3,811
|
|
—
|
|
$
|
—
|
|
$
|
—
|
|
$
|
3,811
|
|
|||||
|
Straight-line rent receivable allowance
|
600
|
|
4,731
|
|
—
|
|
—
|
|
—
|
|
5,331
|
|
||||||||||||
|
Loan loss reserves
|
—
|
|
4,300
|
|
—
|
|
—
|
|
—
|
|
4,300
|
|
||||||||||||
|
$
|
600
|
|
$
|
12,842
|
|
|
$
|
—
|
|
$
|
—
|
|
|
$
|
—
|
|
$
|
13,442
|
|
|||||
F-52
SCHEDULE III
REAL ESTATE ASSETS AND ACCUMULATED DEPRECIATION
As of December 31, 2017
(dollars in thousands)
|
Initial Cost to Company
|
Cost Capitalized Subsequent to Acquisition
|
Gross Amount at which Carried at Close of Period
|
Life on Which Depreciation in Latest Income Statement is Computed
|
||||||||||||||||||||||||
|
Description
|
Location
|
Ownership Percentage
|
Encum- brances
(1)
|
Land
|
Building and Improve- ments
(2)(3)
|
Total
|
Land
|
Building and Improve- ments
(2)(3)
|
Total
|
Accumulated Depreciation and Amortization
|
Original Date of Construction/ Renovation
|
Date Acquired
|
|||||||||||||||
|
Skilled Nursing/Transitional Care Facilities
|
|
|
|
|
|
|
|
|
|
|
|
|
|||||||||||||||
|
New Martinsville
|
New Martinsville, WV
|
100%
|
—
|
|
475
|
|
10,543
|
|
11,018
|
|
—
|
|
475
|
|
10,331
|
|
10,806
|
|
(4,317
|
)
|
1982
|
11/15/10
|
39
|
||||
|
Glenville
|
Glenville, WV
|
100%
|
—
|
|
484
|
|
2,839
|
|
3,323
|
|
—
|
|
484
|
|
2,719
|
|
3,203
|
|
(830
|
)
|
1982/2006/2015
|
11/15/10
|
40
|
||||
|
Greenwood
|
Warwick, RI
|
100%
|
—
|
|
2,066
|
|
10,178
|
|
12,244
|
|
—
|
|
2,066
|
|
9,771
|
|
11,837
|
|
(4,589
|
)
|
1964/2009
|
11/15/10
|
24
|
||||
|
Forest Hills (SNF)
|
Broken Arrow, OK
|
100%
|
(4)
|
1,653
|
|
11,259
|
|
12,912
|
|
—
|
|
1,653
|
|
10,888
|
|
12,541
|
|
(4,339
|
)
|
1994/2008, 2009/2010, 2015
|
11/15/10
|
40
|
|||||
|
Seminole Estates
|
Seminole, OK
|
100%
|
—
|
|
655
|
|
3,527
|
|
4,182
|
|
—
|
|
655
|
|
3,231
|
|
3,886
|
|
(972
|
)
|
1987
|
11/15/10
|
32
|
||||
|
Forest View
|
Dayton, OH
|
100%
|
—
|
|
819
|
|
4,214
|
|
5,033
|
|
—
|
|
819
|
|
3,926
|
|
4,745
|
|
(1,837
|
)
|
1968
|
11/15/10
|
24
|
||||
|
San Juan
|
Farmington, NM
|
100%
|
9,504
|
|
799
|
|
4,163
|
|
4,962
|
|
3
|
|
799
|
|
3,791
|
|
4,590
|
|
(1,612
|
)
|
1963/1993
|
11/15/10
|
24
|
||||
|
McKinley Care
|
Gallup, NM
|
100%
|
5,448
|
|
409
|
|
1,865
|
|
2,274
|
|
4
|
|
409
|
|
1,753
|
|
2,162
|
|
(753
|
)
|
1968
|
11/15/10
|
24
|
||||
|
Bedford Hills
|
Bedford, NH
|
100%
|
6,142
|
|
1,911
|
|
12,245
|
|
14,156
|
|
—
|
|
1,911
|
|
11,308
|
|
13,219
|
|
(3,956
|
)
|
1992/2010
|
11/15/10
|
36
|
||||
|
Exeter on Hampton
|
Exeter, NH
|
100%
|
—
|
|
2,365
|
|
2,350
|
|
4,715
|
|
—
|
|
2,365
|
|
659
|
|
3,024
|
|
(389
|
)
|
1976/2011
|
11/15/10
|
40
|
||||
|
Pheasant Wood
|
Petersborough, NH
|
100%
|
—
|
|
625
|
|
3,986
|
|
4,611
|
|
—
|
|
625
|
|
3,396
|
|
4,021
|
|
(1,509
|
)
|
1975/2016
|
11/15/10
|
28
|
||||
|
Westwood
|
Keene, NH
|
100%
|
—
|
|
699
|
|
3,823
|
|
4,522
|
|
—
|
|
699
|
|
3,320
|
|
4,019
|
|
(1,781
|
)
|
1965/2010
|
11/15/10
|
24
|
||||
|
Colonial Hill
|
Rochester, NH
|
100%
|
—
|
|
412
|
|
3,960
|
|
4,372
|
|
—
|
|
412
|
|
3,331
|
|
3,743
|
|
(1,340
|
)
|
1986/2010
|
11/15/10
|
44
|
||||
|
Crestwood Care
|
Milford, NH
|
100%
|
—
|
|
557
|
|
3,441
|
|
3,998
|
|
—
|
|
557
|
|
2,941
|
|
3,498
|
|
(1,364
|
)
|
1972
|
11/15/10
|
28
|
||||
|
Applewood
|
Winchester, NH
|
100%
|
—
|
|
348
|
|
3,075
|
|
3,423
|
|
—
|
|
348
|
|
2,654
|
|
3,002
|
|
(1,047
|
)
|
1987
|
11/15/10
|
32
|
||||
|
The Elms Care
|
Milford, NH
|
100%
|
—
|
|
312
|
|
1,679
|
|
1,991
|
|
—
|
|
312
|
|
1,464
|
|
1,776
|
|
(869
|
)
|
1890/2005
|
11/15/10
|
20
|
||||
|
Woodland Hill
|
Asheboro, NC
|
100%
|
—
|
|
1,706
|
|
8,053
|
|
9,759
|
|
—
|
|
1,706
|
|
7,569
|
|
9,275
|
|
(2,618
|
)
|
1987/2009
|
11/15/10
|
32
|
||||
|
Missouri River
|
Great Falls, MT
|
100%
|
10,841
|
|
2,023
|
|
16,967
|
|
18,990
|
|
—
|
|
2,023
|
|
15,916
|
|
17,939
|
|
(6,814
|
)
|
1960/1990, 2010
|
11/15/10
|
30
|
||||
|
Butte Care
|
Butte, MT
|
100%
|
—
|
|
1,092
|
|
12,654
|
|
13,746
|
|
—
|
|
1,092
|
|
12,449
|
|
13,541
|
|
(4,706
|
)
|
1974/2012
|
11/15/10
|
35
|
||||
|
Whitefish Care
|
Whitefish, MT
|
100%
|
—
|
|
651
|
|
6,339
|
|
6,990
|
|
—
|
|
651
|
|
6,186
|
|
6,837
|
|
(2,421
|
)
|
1973/2012
|
11/15/10
|
35
|
||||
|
Deer Lodge
|
Deer Lodge, MT
|
100%
|
4,129
|
|
190
|
|
3,032
|
|
3,222
|
|
2
|
|
190
|
|
2,637
|
|
2,827
|
|
(1,071
|
)
|
1973
|
11/15/10
|
30
|
||||
|
Twin Oaks
|
Danvers, MA
|
100%
|
—
|
|
885
|
|
5,100
|
|
5,985
|
|
—
|
|
885
|
|
4,366
|
|
5,251
|
|
(1,973
|
)
|
1969
|
11/15/10
|
24
|
||||
|
Maplewood
|
Amesbury, MA
|
100%
|
—
|
|
771
|
|
4,550
|
|
5,321
|
|
—
|
|
771
|
|
3,695
|
|
4,466
|
|
(1,666
|
)
|
1968/2010
|
11/15/10
|
24
|
||||
|
Saugus
|
Saugus, MA
|
100%
|
—
|
|
285
|
|
1,643
|
|
1,928
|
|
—
|
|
285
|
|
1,006
|
|
1,291
|
|
(516
|
)
|
1967
|
11/15/10
|
24
|
||||
|
Countryside Care
|
Bardwell, KY
|
100%
|
—
|
|
239
|
|
4,790
|
|
5,029
|
|
—
|
|
239
|
|
4,409
|
|
4,648
|
|
(1,437
|
)
|
1993/2010
|
11/15/10
|
35
|
||||
|
Barkley Center
|
Paducah, KY
|
100%
|
—
|
|
325
|
|
4,019
|
|
4,344
|
|
—
|
|
325
|
|
3,395
|
|
3,720
|
|
(1,098
|
)
|
1999/2014
|
11/15/10
|
35
|
||||
|
Gooding/Bennett Hills
|
Gooding, ID
|
100%
|
—
|
|
—
|
|
1,731
|
|
1,731
|
|
—
|
|
—
|
|
1,719
|
|
1,719
|
|
(992
|
)
|
1968/2009
|
11/15/10
|
40
|
||||
|
Oakhurst
|
Ocala, FL
|
100%
|
—
|
|
1,474
|
|
8,212
|
|
9,686
|
|
—
|
|
1,474
|
|
7,489
|
|
8,963
|
|
(2,810
|
)
|
1984/2010
|
11/15/10
|
32
|
||||
F-53
|
Initial Cost to Company
|
Cost Capitalized Subsequent to Acquisition
|
Gross Amount at which Carried at Close of Period
|
Life on Which Depreciation in Latest Income Statement is Computed
|
||||||||||||||||||||||||
|
Description
|
Location
|
Ownership Percentage
|
Encum- brances
(1)
|
Land
|
Building and Improve- ments
(2)(3)
|
Total
|
Land
|
Building and Improve- ments
(2)(3)
|
Total
|
Accumulated Depreciation and Amortization
|
Original Date of Construction/ Renovation
|
Date Acquired
|
|||||||||||||||
|
Orchard Ridge
|
New Port Richey, FL
|
100%
|
—
|
|
536
|
|
5,685
|
|
6,221
|
|
—
|
|
536
|
|
5,220
|
|
5,756
|
|
(1,944
|
)
|
1983/1995, 2012
|
11/15/10
|
32
|
||||
|
Bay Tree
|
Palm Harbor, FL
|
100%
|
—
|
|
786
|
|
4,870
|
|
5,656
|
|
—
|
|
786
|
|
4,309
|
|
5,095
|
|
(1,820
|
)
|
1981
|
11/15/10
|
32
|
||||
|
West Bay
|
Oldsmar, FL
|
100%
|
—
|
|
775
|
|
4,660
|
|
5,435
|
|
—
|
|
775
|
|
4,103
|
|
4,878
|
|
(1,629
|
)
|
1982/2010
|
11/15/10
|
32
|
||||
|
Sunset Point
|
Clearwater, FL
|
100%
|
—
|
|
706
|
|
4,370
|
|
5,076
|
|
—
|
|
706
|
|
3,880
|
|
4,586
|
|
(1,624
|
)
|
1983
|
11/15/10
|
32
|
||||
|
Arden House
|
Hamden, CT
|
100%
|
18,772
|
|
2,250
|
|
23,816
|
|
26,066
|
|
—
|
|
2,250
|
|
22,785
|
|
25,035
|
|
(8,877
|
)
|
1973/2008, 2010
|
11/15/10
|
28
|
||||
|
Pope John Paul
|
Danbury, CT
|
100%
|
—
|
|
—
|
|
13,702
|
|
13,702
|
|
—
|
|
—
|
|
12,642
|
|
12,642
|
|
(4,450
|
)
|
1983/2009
|
11/15/10
|
32
|
||||
|
St. Camillus
|
Stamford, CT
|
100%
|
—
|
|
—
|
|
12,528
|
|
12,528
|
|
—
|
|
—
|
|
11,261
|
|
11,261
|
|
(3,982
|
)
|
1987/2008
|
11/15/10
|
32
|
||||
|
Madison House
|
Madison, CT
|
100%
|
—
|
|
4,337
|
|
8,164
|
|
12,501
|
|
—
|
|
4,337
|
|
7,673
|
|
12,010
|
|
(2,541
|
)
|
1994/2009, 2010
|
11/15/10
|
36
|
||||
|
Willows (CT)
|
Woodbridge, CT
|
100%
|
—
|
|
1,838
|
|
9,961
|
|
11,799
|
|
—
|
|
1,838
|
|
9,100
|
|
10,938
|
|
(3,375
|
)
|
1989/2011
|
11/15/10
|
32
|
||||
|
The Reservoir
|
West Hartford, CT
|
100%
|
—
|
|
1,204
|
|
9,457
|
|
10,661
|
|
—
|
|
1,204
|
|
9,090
|
|
10,294
|
|
(3,082
|
)
|
1995/2009, 2011
|
11/15/10
|
36
|
||||
|
Glen Hill
|
Danbury, CT
|
100%
|
—
|
|
918
|
|
7,017
|
|
7,935
|
|
—
|
|
918
|
|
6,412
|
|
7,330
|
|
(3,206
|
)
|
1963/2009
|
11/15/10
|
24
|
||||
|
Governor's House
|
Simsbury, CT
|
100%
|
—
|
|
—
|
|
5,750
|
|
5,750
|
|
—
|
|
—
|
|
5,154
|
|
5,154
|
|
(2,810
|
)
|
1895/2008, 2010
|
11/15/10
|
20
|
||||
|
Elms Haven
|
Thornton, CO
|
100%
|
14,432
|
|
3,717
|
|
18,473
|
|
22,190
|
|
7
|
|
3,716
|
|
17,726
|
|
21,442
|
|
(6,280
|
)
|
1987/1989, 1997, 2007, 2008/2016, 2017
|
11/15/10
|
40
|
||||
|
Carmichael
|
Carmichael, CA
|
100%
|
—
|
|
—
|
|
1,741
|
|
1,741
|
|
—
|
|
—
|
|
1,083
|
|
1,083
|
|
(722
|
)
|
1960/1976, 2010
|
11/15/10
|
40
|
||||
|
Willows (CA)
|
Willows, CA
|
100%
|
—
|
|
137
|
|
1,426
|
|
1,563
|
|
—
|
|
137
|
|
1,076
|
|
1,213
|
|
(672
|
)
|
1969/2010, 2015
|
11/15/10
|
40
|
||||
|
Washington Care
|
San Leandro, CA
|
100%
|
9,111
|
|
—
|
|
1,331
|
|
1,331
|
|
8
|
|
—
|
|
1,116
|
|
1,116
|
|
(634
|
)
|
1969/2010
|
11/15/10
|
40
|
||||
|
Lake Drive
|
Henryetta, OK
|
100%
|
—
|
|
160
|
|
549
|
|
709
|
|
—
|
|
160
|
|
75
|
|
235
|
|
(56
|
)
|
1968
|
11/15/10
|
10
|
||||
|
Mineral Springs
|
North Conway, NH
|
100%
|
12,114
|
|
417
|
|
5,352
|
|
5,769
|
|
—
|
|
417
|
|
4,746
|
|
5,163
|
|
(1,682
|
)
|
1988/2009
|
11/15/10
|
43
|
||||
|
Wolfeboro
|
Wolfeboro, NH
|
100%
|
10,205
|
|
454
|
|
4,531
|
|
4,985
|
|
—
|
|
454
|
|
4,124
|
|
4,578
|
|
(1,443
|
)
|
1984/1986, 1987, 2009
|
11/15/10
|
41
|
||||
|
Meridian Care
|
Meridian, ID
|
100%
|
—
|
|
840
|
|
8,342
|
|
9,182
|
|
—
|
|
840
|
|
7,854
|
|
8,694
|
|
(3,425
|
)
|
1997/2009
|
11/15/10
|
39
|
||||
|
St. Joseph's
|
Trumbull, CT
|
100%
|
—
|
|
—
|
|
21,878
|
|
21,878
|
|
—
|
|
—
|
|
20,773
|
|
20,773
|
|
(9,456
|
)
|
1959
|
11/15/10
|
24
|
||||
|
Broadmeadow Healthcare
|
Middletown, DE
|
100%
|
—
|
|
1,650
|
|
21,730
|
|
23,380
|
|
—
|
|
1,650
|
|
21,730
|
|
23,380
|
|
(4,015
|
)
|
2005
|
08/01/11
|
40
|
||||
|
Capitol Healthcare
|
Dover, DE
|
100%
|
—
|
|
4,940
|
|
15,500
|
|
20,440
|
|
—
|
|
4,940
|
|
15,500
|
|
20,440
|
|
(2,995
|
)
|
1996/2016
|
08/01/11
|
40
|
||||
|
Pike Creek Healthcare
|
Wilmington, DE
|
100%
|
—
|
|
2,460
|
|
25,240
|
|
27,700
|
|
—
|
|
2,460
|
|
25,240
|
|
27,700
|
|
(4,715
|
)
|
2009
|
08/01/11
|
40
|
||||
|
Renaissance Healthcare
|
Millsboro, DE
|
100%
|
—
|
|
1,640
|
|
22,620
|
|
24,260
|
|
—
|
|
1,640
|
|
22,620
|
|
24,260
|
|
(4,308
|
)
|
2008
|
08/01/11
|
40
|
||||
|
Clara Burke
|
Plymouth Meeting, PA
|
100%
|
—
|
|
2,527
|
|
12,453
|
|
14,980
|
|
179
|
|
2,527
|
|
12,631
|
|
15,158
|
|
(2,256
|
)
|
1927/1990, 2007/2016
|
03/30/12
|
40
|
||||
|
Warrington
|
Warrington, PA
|
100%
|
—
|
|
2,617
|
|
11,662
|
|
14,279
|
|
106
|
|
2,617
|
|
11,768
|
|
14,385
|
|
(1,924
|
)
|
1958/2009/2016
|
03/30/12
|
40
|
||||
|
Ridgecrest
|
Duffield, VA
|
100%
|
—
|
|
509
|
|
5,018
|
|
5,527
|
|
861
|
|
509
|
|
5,879
|
|
6,388
|
|
(1,123
|
)
|
1981/2013
|
05/10/12
|
40
|
||||
|
Camden Care Center
|
Minneapolis, MN
|
100%
|
—
|
|
1,235
|
|
5,777
|
|
7,012
|
|
50
|
|
970
|
|
3,880
|
|
4,850
|
|
—
|
|
1990
|
11/30/12
|
40
|
||||
|
Arbrook Plaza
|
Arlington, TX
|
100%
|
—
|
|
3,783
|
|
14,219
|
|
18,002
|
|
—
|
|
3,783
|
|
14,219
|
|
18,002
|
|
(2,077
|
)
|
2002/2012
|
11/30/12
|
40
|
||||
F-54
|
Initial Cost to Company
|
Cost Capitalized Subsequent to Acquisition
|
Gross Amount at which Carried at Close of Period
|
Life on Which Depreciation in Latest Income Statement is Computed
|
||||||||||||||||||||||||
|
Description
|
Location
|
Ownership Percentage
|
Encum- brances
(1)
|
Land
|
Building and Improve- ments
(2)(3)
|
Total
|
Land
|
Building and Improve- ments
(2)(3)
|
Total
|
Accumulated Depreciation and Amortization
|
Original Date of Construction/ Renovation
|
Date Acquired
|
|||||||||||||||
|
Northgate Plaza
|
Irving, TX
|
100%
|
—
|
|
4,901
|
|
10,299
|
|
15,200
|
|
—
|
|
4,901
|
|
10,299
|
|
15,200
|
|
(1,550
|
)
|
2003/2012, 2015
|
11/30/12
|
40
|
||||
|
Gulf Pointe Plaza
|
Rockport, TX
|
100%
|
—
|
|
1,005
|
|
6,628
|
|
7,633
|
|
—
|
|
1,005
|
|
6,628
|
|
7,633
|
|
(1,048
|
)
|
2002/2012
|
11/30/12
|
40
|
||||
|
Gateway Senior Living
|
Lincoln, NE
|
100%
|
—
|
|
6,368
|
|
29,919
|
|
36,287
|
|
—
|
|
6,368
|
|
29,919
|
|
36,287
|
|
(3,298
|
)
|
1962/1996/2013
|
02/14/14
|
40
|
||||
|
Legacy
|
Fremont, NE
|
100%
|
—
|
|
615
|
|
16,176
|
|
16,791
|
|
—
|
|
615
|
|
16,176
|
|
16,791
|
|
(1,956
|
)
|
2008
|
02/14/14
|
40
|
||||
|
Pointe
|
Fremont, NE
|
100%
|
—
|
|
615
|
|
2,943
|
|
3,558
|
|
—
|
|
615
|
|
2,943
|
|
3,558
|
|
(422
|
)
|
1970/1979/1983/1994
|
02/14/14
|
40
|
||||
|
Regency
|
South Sioux City, NE
|
100%
|
—
|
|
246
|
|
6,206
|
|
6,452
|
|
—
|
|
246
|
|
6,206
|
|
6,452
|
|
(914
|
)
|
1962/1968/1975/2000/2004
|
02/14/14
|
40
|
||||
|
Parkmoor Village
|
Colorado Springs, CO
|
100%
|
—
|
|
430
|
|
13,703
|
|
14,133
|
|
—
|
|
430
|
|
13,703
|
|
14,133
|
|
(1,733
|
)
|
1985/2017
|
03/05/14
|
40
|
||||
|
Onion Creek
|
Austin, TX
|
100%
|
—
|
|
871
|
|
12,843
|
|
13,714
|
|
—
|
|
871
|
|
12,843
|
|
13,714
|
|
(1,345
|
)
|
2011
|
10/21/14
|
40
|
||||
|
Adams PARC
|
Barlesville, OK
|
100%
|
—
|
|
1,332
|
|
6,904
|
|
8,236
|
|
—
|
|
1,332
|
|
6,904
|
|
8,236
|
|
(687
|
)
|
1989
|
10/29/14
|
40
|
||||
|
PARCway
|
Oklahoma City, OK
|
100%
|
—
|
|
2,189
|
|
23,567
|
|
25,756
|
|
460
|
|
2,189
|
|
24,028
|
|
26,217
|
|
(2,087
|
)
|
1963/1984
|
10/29/14
|
40
|
||||
|
Brookhaven Extensive Care
|
Norman, OK
|
100%
|
—
|
|
869
|
|
5,236
|
|
6,105
|
|
—
|
|
869
|
|
5,237
|
|
6,106
|
|
(582
|
)
|
2001/2013
|
10/29/14
|
40
|
||||
|
St. Thomas More Medical Complex
|
Hyattsville, MD
|
100%
|
—
|
|
6,343
|
|
65,573
|
|
71,916
|
|
—
|
|
6,343
|
|
65,573
|
|
71,916
|
|
(4,937
|
)
|
1950/1976, 2008
|
06/30/15
|
40
|
||||
|
Bay Ridge Healthcare Center
|
Annapolis, MD
|
100%
|
—
|
|
1,548
|
|
40,773
|
|
42,321
|
|
—
|
|
1,548
|
|
40,773
|
|
42,321
|
|
(2,846
|
)
|
1964/1993, 2012
|
06/30/15
|
40
|
||||
|
NMS Healthcare of Silver Spring
|
Wheaton, MD
|
100%
|
—
|
|
676
|
|
56,897
|
|
57,573
|
|
—
|
|
676
|
|
56,897
|
|
57,573
|
|
(3,915
|
)
|
1966/1991, 2012
|
06/30/15
|
40
|
||||
|
NMS Healthcare of Hagerstown
|
Hagerstown, MD
|
100%
|
—
|
|
1,475
|
|
56,237
|
|
57,712
|
|
—
|
|
1,475
|
|
56,237
|
|
57,712
|
|
(3,271
|
)
|
1953/1975, 2014
|
11/25/15
|
40
|
||||
|
NMS Healthcare of Springbrook
|
Silver Spring, MD
|
100%
|
—
|
|
963
|
|
48,085
|
|
49,048
|
|
—
|
|
963
|
|
48,084
|
|
49,047
|
|
(1,907
|
)
|
1965/2015
|
07/26/16
|
40
|
||||
|
Andrew Residence
|
Minneapolis, MN
|
100%
|
—
|
|
2,931
|
|
6,943
|
|
9,874
|
|
90
|
|
2,931
|
|
7,033
|
|
9,964
|
|
(78
|
)
|
1941/2014
|
08/17/17
|
40
|
||||
|
Atrium Post Acute Care of Chilton
|
Chilton, WI
|
100%
|
—
|
|
230
|
|
3,645
|
|
3,875
|
|
—
|
|
230
|
|
3,645
|
|
3,875
|
|
(34
|
)
|
1963/2010
|
08/17/17
|
40
|
||||
|
Fox River Nursing and Rehab Center
|
Appleton, WI
|
100%
|
—
|
|
1,220
|
|
2,351
|
|
3,571
|
|
—
|
|
1,220
|
|
2,351
|
|
3,571
|
|
(22
|
)
|
1968/1992
|
08/17/17
|
40
|
||||
|
Bridgewood Nursing and Rehab Center
|
Neenah, WI
|
100%
|
—
|
|
890
|
|
2,985
|
|
3,875
|
|
—
|
|
890
|
|
2,985
|
|
3,875
|
|
(30
|
)
|
1965
|
08/17/17
|
40
|
||||
|
Kennedy Park Nursing and Rehab Center
|
Schofield, WI
|
100%
|
—
|
|
1,000
|
|
2,875
|
|
3,875
|
|
—
|
|
1,000
|
|
2,875
|
|
3,875
|
|
(28
|
)
|
1966/1997
|
08/17/17
|
40
|
||||
|
Avamere Riverpark of Eugene
|
Eugene, OR
|
100%
|
—
|
|
2,205
|
|
28,700
|
|
30,905
|
|
2,252
|
|
2,205
|
|
30,952
|
|
33,157
|
|
(310
|
)
|
1988/2016
|
08/17/17
|
40
|
||||
|
Avamere Rehab of Lebanon
|
Lebanon, OR
|
100%
|
—
|
|
958
|
|
14,176
|
|
15,134
|
|
—
|
|
958
|
|
14,176
|
|
15,134
|
|
(128
|
)
|
1974
|
08/17/17
|
40
|
||||
|
Avamere Crestview of Portland
|
Portland, OR
|
100%
|
—
|
|
1,791
|
|
12,833
|
|
14,624
|
|
2,761
|
|
1,791
|
|
15,594
|
|
17,385
|
|
(182
|
)
|
1964/2016
|
08/17/17
|
40
|
||||
|
Avamere Rehabilitation of King City
|
Tigard, OR
|
100%
|
—
|
|
2,011
|
|
11,667
|
|
13,678
|
|
—
|
|
2,011
|
|
11,667
|
|
13,678
|
|
(109
|
)
|
1975
|
08/17/17
|
40
|
||||
|
Avamere Rehabilitation of Hillsboro
|
Hillsboro, OR
|
100%
|
—
|
|
1,387
|
|
14,028
|
|
15,415
|
|
—
|
|
1,387
|
|
14,028
|
|
15,415
|
|
(126
|
)
|
1973
|
08/17/17
|
40
|
||||
|
Avamere Rehab of Junction City
|
Junction City, OR
|
100%
|
—
|
|
584
|
|
7,901
|
|
8,485
|
|
—
|
|
584
|
|
7,901
|
|
8,485
|
|
(74
|
)
|
1966/2015
|
08/17/17
|
40
|
||||
F-55
|
Initial Cost to Company
|
Cost Capitalized Subsequent to Acquisition
|
Gross Amount at which Carried at Close of Period
|
Life on Which Depreciation in Latest Income Statement is Computed
|
||||||||||||||||||||||||
|
Description
|
Location
|
Ownership Percentage
|
Encum- brances
(1)
|
Land
|
Building and Improve- ments
(2)(3)
|
Total
|
Land
|
Building and Improve- ments
(2)(3)
|
Total
|
Accumulated Depreciation and Amortization
|
Original Date of Construction/ Renovation
|
Date Acquired
|
|||||||||||||||
|
Avamere Rehab of Eugene
|
Eugene, OR
|
100%
|
—
|
|
1,380
|
|
14,921
|
|
16,301
|
|
1,791
|
|
1,380
|
|
16,712
|
|
18,092
|
|
(180
|
)
|
1966/2016
|
08/17/17
|
40
|
||||
|
Avamere Rehab of Coos Bay
|
Coos Bay, OR
|
100%
|
—
|
|
829
|
|
8,518
|
|
9,347
|
|
—
|
|
829
|
|
8,518
|
|
9,347
|
|
(83
|
)
|
1968
|
08/17/17
|
40
|
||||
|
Avamere Twin Oaks of Sweet Home
|
Sweet Home, OR
|
100%
|
—
|
|
238
|
|
3,338
|
|
3,576
|
|
—
|
|
238
|
|
3,338
|
|
3,576
|
|
(32
|
)
|
1972
|
08/17/17
|
40
|
||||
|
Avamere Rehab of Clackamas
|
Gladstone, OR
|
100%
|
—
|
|
792
|
|
5,000
|
|
5,792
|
|
—
|
|
792
|
|
5,000
|
|
5,792
|
|
(48
|
)
|
1961
|
08/17/17
|
40
|
||||
|
Avamere Rehab of Newport
|
Newport, OR
|
100%
|
—
|
|
406
|
|
5,001
|
|
5,407
|
|
—
|
|
406
|
|
5,001
|
|
5,407
|
|
(46
|
)
|
1973/2014
|
08/17/17
|
40
|
||||
|
Avamere Rehab of Oregon City
|
Oregon City, OR
|
100%
|
—
|
|
1,496
|
|
12,142
|
|
13,638
|
|
—
|
|
1,496
|
|
12,142
|
|
13,638
|
|
(109
|
)
|
1974
|
08/17/17
|
40
|
||||
|
Avamere Transitional Care of Puget Sound
|
Tacoma, WA
|
100%
|
—
|
|
1,771
|
|
11,595
|
|
13,366
|
|
—
|
|
1,771
|
|
11,595
|
|
13,366
|
|
(121
|
)
|
2017
|
08/17/17
|
40
|
||||
|
Richmond Beach Rehab
|
Shoreline, WA
|
100%
|
—
|
|
4,703
|
|
14,444
|
|
19,147
|
|
—
|
|
4,703
|
|
14,444
|
|
19,147
|
|
(135
|
)
|
1993/2014
|
08/17/17
|
40
|
||||
|
St. Francis of Bellingham
|
Bellingham, WA
|
100%
|
—
|
|
—
|
|
15,330
|
|
15,330
|
|
—
|
|
—
|
|
15,330
|
|
15,330
|
|
(144
|
)
|
1984/2015
|
08/17/17
|
40
|
||||
|
Avamere Olympic Rehabilitation of Sequim
|
Sequim, WA
|
100%
|
—
|
|
427
|
|
4,450
|
|
4,877
|
|
—
|
|
427
|
|
4,450
|
|
4,877
|
|
(50
|
)
|
1974
|
08/17/17
|
40
|
||||
|
Avamere Heritage Rehabilitation of Tacoma
|
Tacoma, WA
|
100%
|
—
|
|
1,705
|
|
4,952
|
|
6,657
|
|
—
|
|
1,705
|
|
4,952
|
|
6,657
|
|
(49
|
)
|
1968
|
08/17/17
|
40
|
||||
|
Avamere at Pacific Ridge
|
Tacoma, WA
|
100%
|
—
|
|
2,195
|
|
1,956
|
|
4,151
|
|
—
|
|
2,195
|
|
1,956
|
|
4,151
|
|
(25
|
)
|
1972/2014
|
08/17/17
|
40
|
||||
|
Avamere Rehabilitation of Cascade Park
|
Vancouver, WA
|
100%
|
—
|
|
1,782
|
|
15,116
|
|
16,898
|
|
—
|
|
1,782
|
|
15,116
|
|
16,898
|
|
(147
|
)
|
1991
|
08/17/17
|
40
|
||||
|
The Pearl at Kruse Way
|
Lake Oswego, OR
|
100%
|
—
|
|
5,947
|
|
13,401
|
|
19,348
|
|
—
|
|
5,947
|
|
13,401
|
|
19,348
|
|
(126
|
)
|
2005/2016
|
08/17/17
|
40
|
||||
|
Avamere at Medford
|
Medford, OR
|
100%
|
—
|
|
2,043
|
|
38,485
|
|
40,528
|
|
2,960
|
|
2,043
|
|
41,445
|
|
43,488
|
|
(409
|
)
|
1974/2016
|
08/17/17
|
40
|
||||
|
Avamere Bellingham Healthcare and Rehab Services
|
Bellingham, WA
|
100%
|
—
|
|
2,908
|
|
2,058
|
|
4,966
|
|
—
|
|
2,908
|
|
2,058
|
|
4,966
|
|
(26
|
)
|
1972/2015
|
08/17/17
|
40
|
||||
|
Queen Anne Healthcare
|
Seattle, WA
|
100%
|
—
|
|
2,508
|
|
6,401
|
|
8,909
|
|
—
|
|
2,508
|
|
6,401
|
|
8,909
|
|
(61
|
)
|
1970
|
08/17/17
|
40
|
||||
|
Avamere Transitional Care and Rehab - Boise
|
Boise, ID
|
100%
|
—
|
|
681
|
|
9,348
|
|
10,029
|
|
—
|
|
681
|
|
9,348
|
|
10,029
|
|
(89
|
)
|
1979
|
08/17/17
|
40
|
||||
|
Avamere Transitional Care at Sunnyside
|
Salem, OR
|
100%
|
—
|
|
2,114
|
|
15,651
|
|
17,765
|
|
—
|
|
2,114
|
|
15,651
|
|
17,765
|
|
(145
|
)
|
1981
|
08/17/17
|
40
|
||||
|
Avamere Health Services of Rogue Valley
|
Medford, OR
|
100%
|
—
|
|
1,375
|
|
23,808
|
|
25,183
|
|
—
|
|
1,375
|
|
23,808
|
|
25,183
|
|
(223
|
)
|
1961/2016
|
08/17/17
|
40
|
||||
|
Avamere Transitional Care and Rehab - Malley
|
Northglenn, CO
|
100%
|
—
|
|
1,662
|
|
26,014
|
|
27,676
|
|
3,258
|
|
1,662
|
|
29,273
|
|
30,935
|
|
(311
|
)
|
1972/2016
|
08/17/17
|
40
|
||||
|
Avamere Transitional Care and Rehab - Brighton
|
Brighton, CO
|
100%
|
—
|
|
1,933
|
|
11,624
|
|
13,557
|
|
—
|
|
1,933
|
|
11,624
|
|
13,557
|
|
(111
|
)
|
1971
|
08/17/17
|
40
|
||||
|
Phoenix Rehabilitation Services
|
Phoenix, AZ
|
100%
|
—
|
|
1,270
|
|
11,502
|
|
12,772
|
|
—
|
|
1,270
|
|
11,502
|
|
12,772
|
|
(104
|
)
|
2008
|
08/17/17
|
40
|
||||
|
Tustin Subacute Care Facility
|
Santa Ana, CA
|
100%
|
—
|
|
1,889
|
|
11,682
|
|
13,571
|
|
—
|
|
1,889
|
|
11,682
|
|
13,571
|
|
(102
|
)
|
2008
|
08/17/17
|
40
|
||||
|
La Mesa Inpatient Rehabilitation Facility
|
La Mesa, CA
|
100%
|
—
|
|
1,276
|
|
8,177
|
|
9,453
|
|
—
|
|
1,276
|
|
8,177
|
|
9,453
|
|
(75
|
)
|
2012
|
08/17/17
|
40
|
||||
|
Golden Living Center - Westminster
|
Westminster, MD
|
100%
|
—
|
|
2,128
|
|
6,614
|
|
8,742
|
|
161
|
|
2,128
|
|
6,775
|
|
8,903
|
|
(79
|
)
|
1973/2010
|
08/17/17
|
40
|
||||
|
Maple Wood Care Center
|
Kansas City, MO
|
100%
|
—
|
|
1,142
|
|
3,226
|
|
4,368
|
|
170
|
|
1,142
|
|
3,396
|
|
4,538
|
|
(57
|
)
|
1983
|
08/17/17
|
40
|
||||
F-56
|
Initial Cost to Company
|
Cost Capitalized Subsequent to Acquisition
|
Gross Amount at which Carried at Close of Period
|
Life on Which Depreciation in Latest Income Statement is Computed
|
||||||||||||||||||||||||
|
Description
|
Location
|
Ownership Percentage
|
Encum- brances
(1)
|
Land
|
Building and Improve- ments
(2)(3)
|
Total
|
Land
|
Building and Improve- ments
(2)(3)
|
Total
|
Accumulated Depreciation and Amortization
|
Original Date of Construction/ Renovation
|
Date Acquired
|
|||||||||||||||
|
Garden Valley Nursing & Rehab
|
Kansas City, MO
|
100%
|
—
|
|
1,985
|
|
2,714
|
|
4,699
|
|
112
|
|
1,985
|
|
2,826
|
|
4,811
|
|
(56
|
)
|
1983
|
08/17/17
|
40
|
||||
|
Worthington Nursing & Rehab
|
Parkersburg, WV
|
100%
|
—
|
|
697
|
|
10,688
|
|
11,385
|
|
—
|
|
697
|
|
10,688
|
|
11,385
|
|
(122
|
)
|
1974/1999
|
08/17/17
|
40
|
||||
|
Burlington House Rehabilitative and Alzheimers Care Center
|
Cincinnati, OH
|
100%
|
—
|
|
2,686
|
|
10,062
|
|
12,748
|
|
—
|
|
2,686
|
|
10,062
|
|
12,748
|
|
(108
|
)
|
1989/2015
|
08/17/17
|
40
|
||||
|
Golden Living Center - Charlottesville
|
Charlottesville, VA
|
100%
|
—
|
|
2,840
|
|
8,450
|
|
11,290
|
|
140
|
|
2,840
|
|
8,590
|
|
11,430
|
|
(91
|
)
|
1964/2009
|
08/17/17
|
40
|
||||
|
Golden Living Center - Sleepy Hollow
|
Annandale, VA
|
100%
|
—
|
|
7,241
|
|
17,727
|
|
24,968
|
|
318
|
|
7,241
|
|
18,045
|
|
25,286
|
|
(179
|
)
|
1963/2013
|
08/17/17
|
40
|
||||
|
Golden Living Center - Petersburg
|
Petersburg, VA
|
100%
|
—
|
|
988
|
|
8,416
|
|
9,404
|
|
1
|
|
988
|
|
8,417
|
|
9,405
|
|
(87
|
)
|
1970/2009
|
08/17/17
|
40
|
||||
|
Golden Living Center - Battlefield Park
|
Petersburg, VA
|
100%
|
—
|
|
1,174
|
|
8,858
|
|
10,032
|
|
1
|
|
1,174
|
|
8,859
|
|
10,033
|
|
(89
|
)
|
1976/2010
|
08/17/17
|
40
|
||||
|
Golden Living Center - Hagerstown
|
Hagerstown, MD
|
100%
|
—
|
|
1,393
|
|
13,438
|
|
14,831
|
|
39
|
|
1,393
|
|
13,476
|
|
14,869
|
|
(131
|
)
|
1971/2010
|
08/17/17
|
40
|
||||
|
Golden Living Center - Cumberland
|
Cumberland, MD
|
100%
|
—
|
|
800
|
|
16,973
|
|
17,773
|
|
9
|
|
800
|
|
16,983
|
|
17,783
|
|
(162
|
)
|
1968
|
08/17/17
|
40
|
||||
|
Gilroy Healthcare and Rehabilitiation Center
|
Gilroy, CA
|
100%
|
—
|
|
662
|
|
23,775
|
|
24,437
|
|
—
|
|
662
|
|
23,775
|
|
24,437
|
|
(212
|
)
|
1968
|
08/17/17
|
40
|
||||
|
North Cascades Health and Rehabilitation Center
|
Bellingham, WA
|
100%
|
—
|
|
1,437
|
|
14,196
|
|
15,633
|
|
—
|
|
1,437
|
|
14,196
|
|
15,633
|
|
(132
|
)
|
1999
|
08/17/17
|
40
|
||||
|
Granite Rehabilitation & Wellness
|
Cheyenne, WY
|
100%
|
—
|
|
387
|
|
13,613
|
|
14,000
|
|
1,045
|
|
387
|
|
14,659
|
|
15,046
|
|
(122
|
)
|
1967/2017
|
08/17/17
|
40
|
||||
|
Rawlins Rehabilitation & Wellness
|
Rawlins, WY
|
100%
|
—
|
|
281
|
|
6,007
|
|
6,288
|
|
—
|
|
281
|
|
6,007
|
|
6,288
|
|
(56
|
)
|
1967
|
08/17/17
|
40
|
||||
|
Wind River Rehabilitation & Wellness
|
Riverton, WY
|
100%
|
—
|
|
199
|
|
11,398
|
|
11,597
|
|
—
|
|
199
|
|
11,398
|
|
11,597
|
|
(103
|
)
|
1967
|
08/17/17
|
40
|
||||
|
Sage View Care Center
|
Rock Springs, WY
|
100%
|
—
|
|
420
|
|
8,665
|
|
9,085
|
|
—
|
|
420
|
|
8,665
|
|
9,085
|
|
(82
|
)
|
1964
|
08/17/17
|
40
|
||||
|
Shelton Health and Rehabilitation Center
|
Shelton, WA
|
50%
|
—
|
|
415
|
|
8,965
|
|
9,380
|
|
—
|
|
415
|
|
8,965
|
|
9,380
|
|
(90
|
)
|
1998
|
08/17/17
|
40
|
||||
|
Dundee Nursing Home
|
Bennettsville, SC
|
100%
|
—
|
|
1,437
|
|
4,631
|
|
6,068
|
|
—
|
|
1,437
|
|
4,631
|
|
6,068
|
|
(48
|
)
|
1958
|
08/17/17
|
40
|
||||
|
Mt. Pleasant Nursing Center
|
Mount Pleasant, SC
|
100%
|
—
|
|
2,689
|
|
3,942
|
|
6,631
|
|
—
|
|
2,689
|
|
3,942
|
|
6,631
|
|
(43
|
)
|
1977/2015
|
08/17/17
|
40
|
||||
|
Tri-State Comp Care Center
|
Harrogate, TN
|
100%
|
—
|
|
1,811
|
|
4,963
|
|
6,774
|
|
—
|
|
1,811
|
|
4,963
|
|
6,774
|
|
(55
|
)
|
1990/2005
|
08/17/17
|
40
|
||||
|
Emporia Manor
|
Emporia, VA
|
100%
|
—
|
|
1,656
|
|
478
|
|
2,134
|
|
—
|
|
1,656
|
|
478
|
|
2,134
|
|
(7
|
)
|
1971
|
08/17/17
|
40
|
||||
|
Epic-Conway
|
Conway, SC
|
100%
|
—
|
|
1,408
|
|
10,784
|
|
12,192
|
|
—
|
|
1,408
|
|
10,784
|
|
12,192
|
|
(108
|
)
|
1975
|
08/17/17
|
40
|
||||
|
Epic- Bayview
|
Beaufort, SC
|
100%
|
—
|
|
1,842
|
|
11,389
|
|
13,231
|
|
—
|
|
1,842
|
|
11,389
|
|
13,231
|
|
(111
|
)
|
1970
|
08/17/17
|
40
|
||||
|
Green Acres of Baytown
|
Baytown, TX
|
100%
|
—
|
|
479
|
|
6,351
|
|
6,830
|
|
85
|
|
479
|
|
6,436
|
|
6,915
|
|
(61
|
)
|
1970
|
08/17/17
|
40
|
||||
|
Allenbrook Healthcare Center
|
Baytown, TX
|
100%
|
—
|
|
426
|
|
3,236
|
|
3,662
|
|
79
|
|
426
|
|
3,316
|
|
3,742
|
|
(36
|
)
|
1975
|
08/17/17
|
40
|
||||
|
Green Acres of Huntsville
|
Huntsville, TX
|
100%
|
—
|
|
302
|
|
3,153
|
|
3,455
|
|
54
|
|
302
|
|
3,207
|
|
3,509
|
|
(34
|
)
|
1968
|
08/17/17
|
40
|
||||
|
Green Acres of Center
|
Center, TX
|
100%
|
—
|
|
231
|
|
1,335
|
|
1,566
|
|
187
|
|
231
|
|
1,522
|
|
1,753
|
|
(18
|
)
|
1972
|
08/17/17
|
40
|
||||
|
Humble Healthcare Center
|
Humble, TX
|
100%
|
—
|
|
2,114
|
|
1,643
|
|
3,757
|
|
380
|
|
2,114
|
|
2,023
|
|
4,137
|
|
(23
|
)
|
1972
|
08/17/17
|
40
|
||||
F-57
|
Initial Cost to Company
|
Cost Capitalized Subsequent to Acquisition
|
Gross Amount at which Carried at Close of Period
|
Life on Which Depreciation in Latest Income Statement is Computed
|
||||||||||||||||||||||||
|
Description
|
Location
|
Ownership Percentage
|
Encum- brances
(1)
|
Land
|
Building and Improve- ments
(2)(3)
|
Total
|
Land
|
Building and Improve- ments
(2)(3)
|
Total
|
Accumulated Depreciation and Amortization
|
Original Date of Construction/ Renovation
|
Date Acquired
|
|||||||||||||||
|
Beechnut Manor
|
Houston, TX
|
100%
|
—
|
|
1,019
|
|
5,734
|
|
6,753
|
|
128
|
|
1,019
|
|
5,862
|
|
6,881
|
|
(58
|
)
|
1982
|
08/17/17
|
40
|
||||
|
Linden Healthcare Center
|
Linden, TX
|
100%
|
—
|
|
112
|
|
256
|
|
368
|
|
109
|
|
112
|
|
365
|
|
477
|
|
(5
|
)
|
1968
|
08/17/17
|
40
|
||||
|
Sherman Healthcare Center
|
Sherman, TX
|
100%
|
—
|
|
469
|
|
6,310
|
|
6,779
|
|
124
|
|
469
|
|
6,434
|
|
6,903
|
|
(62
|
)
|
1971
|
08/17/17
|
40
|
||||
|
Mount Pleasant Healthcare Center
|
Mount Pleasant, TX
|
100%
|
—
|
|
250
|
|
6,913
|
|
7,163
|
|
90
|
|
250
|
|
7,003
|
|
7,253
|
|
(67
|
)
|
1970
|
08/17/17
|
40
|
||||
|
Renfro Healthcare Center
|
Waxahachie, TX
|
100%
|
—
|
|
416
|
|
7,259
|
|
7,675
|
|
75
|
|
416
|
|
7,335
|
|
7,751
|
|
(71
|
)
|
1976
|
08/17/17
|
40
|
||||
|
Upshur Manor Nursing Home
|
Gilmer, TX
|
100%
|
—
|
|
707
|
|
4,552
|
|
5,259
|
|
49
|
|
707
|
|
4,602
|
|
5,309
|
|
(48
|
)
|
1990
|
08/17/17
|
40
|
||||
|
Hearthstone of Northern Nevada
|
Sparks, NV
|
100%
|
—
|
|
1,986
|
|
9,004
|
|
10,990
|
|
—
|
|
1,986
|
|
9,004
|
|
10,990
|
|
(90
|
)
|
1988
|
08/17/17
|
40
|
||||
|
Sunset Hills Healthcare and Rehabilitation Center
|
St. Louis, MO
|
100%
|
—
|
|
1,595
|
|
5,822
|
|
7,417
|
|
—
|
|
1,595
|
|
5,822
|
|
7,417
|
|
(87
|
)
|
1954/2016
|
08/17/17
|
40
|
||||
|
Mountainview Specialty Care Center
|
Greensburg, PA
|
100%
|
—
|
|
549
|
|
9,926
|
|
10,475
|
|
—
|
|
549
|
|
9,926
|
|
10,475
|
|
(118
|
)
|
1971/2016
|
08/17/17
|
40
|
||||
|
Golden Living Center - Richmond
|
Richmond, IN
|
100%
|
—
|
|
259
|
|
9,819
|
|
10,078
|
|
—
|
|
259
|
|
9,819
|
|
10,078
|
|
(94
|
)
|
1975
|
08/17/17
|
40
|
||||
|
Golden Living Center - Petersburg
|
Petersburg, IN
|
100%
|
—
|
|
581
|
|
5,367
|
|
5,948
|
|
—
|
|
581
|
|
5,367
|
|
5,948
|
|
(55
|
)
|
1970/2009
|
08/17/17
|
40
|
||||
|
Beverly Health - Ft. Pierce
|
Fort Pierce, FL
|
100%
|
—
|
|
787
|
|
16,648
|
|
17,435
|
|
—
|
|
787
|
|
16,648
|
|
17,435
|
|
(152
|
)
|
1960/2011
|
08/17/17
|
40
|
||||
|
Maryville
|
Maryville, MO
|
100%
|
—
|
|
114
|
|
5,955
|
|
6,069
|
|
—
|
|
114
|
|
5,955
|
|
6,069
|
|
(62
|
)
|
1972
|
08/17/17
|
40
|
||||
|
Ashland Healthcare
|
Ashland, MO
|
100%
|
—
|
|
765
|
|
2,669
|
|
3,434
|
|
—
|
|
765
|
|
2,669
|
|
3,434
|
|
(30
|
)
|
1993
|
08/17/17
|
40
|
||||
|
Bellefontaine Gardens
|
St. Louis, MO
|
100%
|
—
|
|
2,071
|
|
5,739
|
|
7,810
|
|
—
|
|
2,071
|
|
5,739
|
|
7,810
|
|
(64
|
)
|
1988/1991
|
08/17/17
|
40
|
||||
|
Current River Nursing Center
|
Doniphan, MO
|
100%
|
—
|
|
657
|
|
8,251
|
|
8,908
|
|
—
|
|
657
|
|
8,251
|
|
8,908
|
|
(82
|
)
|
1991
|
08/17/17
|
40
|
||||
|
Dixon Nursing & Rehab
|
Dixon, MO
|
100%
|
—
|
|
521
|
|
3,358
|
|
3,879
|
|
—
|
|
521
|
|
3,358
|
|
3,879
|
|
(36
|
)
|
1989/2011
|
08/17/17
|
40
|
||||
|
Forsyth Nursing & Rehab
|
Forsyth, MO
|
100%
|
—
|
|
594
|
|
8,549
|
|
9,143
|
|
—
|
|
594
|
|
8,549
|
|
9,143
|
|
(86
|
)
|
1993/2007
|
08/17/17
|
40
|
||||
|
Glenwood Healthcare
|
Seymour, MO
|
100%
|
—
|
|
658
|
|
901
|
|
1,559
|
|
—
|
|
658
|
|
901
|
|
1,559
|
|
(13
|
)
|
1990
|
08/17/17
|
40
|
||||
|
Silex Community Care
|
Silex, MO
|
100%
|
—
|
|
807
|
|
4,990
|
|
5,797
|
|
—
|
|
807
|
|
4,990
|
|
5,797
|
|
(51
|
)
|
1991
|
08/17/17
|
40
|
||||
|
South Hampton Place
|
Columbia, MO
|
100%
|
—
|
|
2,322
|
|
6,547
|
|
8,869
|
|
—
|
|
2,322
|
|
6,547
|
|
8,869
|
|
(68
|
)
|
1994
|
08/17/17
|
40
|
||||
|
Strafford Care Center
|
Strafford, MO
|
100%
|
—
|
|
1,634
|
|
6,518
|
|
8,152
|
|
—
|
|
1,634
|
|
6,518
|
|
8,152
|
|
(66
|
)
|
1995
|
08/17/17
|
40
|
||||
|
Windsor Healthcare & Rehab
|
Windsor, MO
|
100%
|
—
|
|
471
|
|
6,819
|
|
7,290
|
|
—
|
|
471
|
|
6,819
|
|
7,290
|
|
(63
|
)
|
1996
|
08/17/17
|
40
|
||||
|
Park Manor of Conroe
|
Conroe, TX
|
100%
|
—
|
|
1,222
|
|
19,099
|
|
20,321
|
|
—
|
|
1,222
|
|
19,099
|
|
20,321
|
|
(171
|
)
|
2001
|
08/17/17
|
40
|
||||
|
Park Manor of Cypress Station
|
Houston, TX
|
100%
|
—
|
|
1,334
|
|
11,615
|
|
12,949
|
|
—
|
|
1,334
|
|
11,615
|
|
12,949
|
|
(108
|
)
|
2003/2013
|
08/17/17
|
40
|
||||
|
Park Manor of Humble
|
Humble, TX
|
100%
|
—
|
|
1,541
|
|
12,332
|
|
13,873
|
|
—
|
|
1,541
|
|
12,332
|
|
13,873
|
|
(115
|
)
|
2003
|
08/17/17
|
40
|
||||
|
Park Manor of Quail Valley
|
Missouri City, TX
|
100%
|
—
|
|
1,825
|
|
9,681
|
|
11,506
|
|
—
|
|
1,825
|
|
9,681
|
|
11,506
|
|
(94
|
)
|
2005
|
08/17/17
|
40
|
||||
|
Park Manor of Westchase
|
Houston, TX
|
100%
|
—
|
|
2,676
|
|
7,396
|
|
10,072
|
|
—
|
|
2,676
|
|
7,396
|
|
10,072
|
|
(73
|
)
|
2005
|
08/17/17
|
40
|
||||
|
Park Manor of CyFair
|
Houston, TX
|
100%
|
—
|
|
1,732
|
|
12,921
|
|
14,653
|
|
—
|
|
1,732
|
|
12,921
|
|
14,653
|
|
(120
|
)
|
1999
|
08/17/17
|
40
|
||||
|
Park Manor of McKinney
|
McKinney, TX
|
100%
|
—
|
|
1,441
|
|
9,017
|
|
10,458
|
|
—
|
|
1,441
|
|
9,017
|
|
10,458
|
|
(91
|
)
|
1993/2012
|
08/17/17
|
40
|
||||
F-58
|
Initial Cost to Company
|
Cost Capitalized Subsequent to Acquisition
|
Gross Amount at which Carried at Close of Period
|
Life on Which Depreciation in Latest Income Statement is Computed
|
||||||||||||||||||||||||
|
Description
|
Location
|
Ownership Percentage
|
Encum- brances
(1)
|
Land
|
Building and Improve- ments
(2)(3)
|
Total
|
Land
|
Building and Improve- ments
(2)(3)
|
Total
|
Accumulated Depreciation and Amortization
|
Original Date of Construction/ Renovation
|
Date Acquired
|
|||||||||||||||
|
Tanglewood Health and Rehabilitation
|
Topeka, KS
|
100%
|
—
|
|
176
|
|
2,340
|
|
2,516
|
|
—
|
|
176
|
|
2,340
|
|
2,516
|
|
(25
|
)
|
1973/2013
|
08/17/17
|
40
|
||||
|
Smoky Hill Health and Rehbilitation
|
Salina, KS
|
100%
|
—
|
|
301
|
|
4,201
|
|
4,502
|
|
—
|
|
301
|
|
4,201
|
|
4,502
|
|
(43
|
)
|
1981
|
08/17/17
|
40
|
||||
|
Belleville Health Center
|
Belleville, KS
|
100%
|
—
|
|
600
|
|
1,664
|
|
2,264
|
|
—
|
|
600
|
|
1,664
|
|
2,264
|
|
(21
|
)
|
1977
|
08/17/17
|
40
|
||||
|
Lakeview Manor
|
Indianapolis, IN
|
100%
|
—
|
|
2,743
|
|
6,015
|
|
8,758
|
|
—
|
|
2,743
|
|
6,015
|
|
8,758
|
|
(66
|
)
|
1968
|
08/17/17
|
40
|
||||
|
Westridge Healthcare Center
|
Terre Haute, IN
|
100%
|
—
|
|
1,067
|
|
7,061
|
|
8,128
|
|
—
|
|
1,067
|
|
7,061
|
|
8,128
|
|
(68
|
)
|
1965/1984
|
08/17/17
|
40
|
||||
|
Chalet Village
|
Berne, IN
|
100%
|
—
|
|
498
|
|
2,421
|
|
2,919
|
|
—
|
|
498
|
|
2,421
|
|
2,919
|
|
(27
|
)
|
1986
|
08/17/17
|
40
|
||||
|
Willow Bend Living Center
|
Muncie, IN
|
100%
|
—
|
|
1,168
|
|
9,562
|
|
10,730
|
|
—
|
|
1,168
|
|
9,562
|
|
10,730
|
|
(87
|
)
|
1976/1986
|
08/17/17
|
40
|
||||
|
Twin City Healthcare
|
Gas City, IN
|
100%
|
—
|
|
345
|
|
8,852
|
|
9,197
|
|
—
|
|
345
|
|
8,852
|
|
9,197
|
|
(81
|
)
|
1974
|
08/17/17
|
40
|
||||
|
Liberty Village
|
Muncie, IN
|
100%
|
—
|
|
1,483
|
|
4,888
|
|
6,371
|
|
—
|
|
1,483
|
|
4,888
|
|
6,371
|
|
(55
|
)
|
1998
|
08/17/17
|
40
|
||||
|
Pine Knoll Rehabilitation Center
|
Winchester, IN
|
100%
|
—
|
|
711
|
|
5,554
|
|
6,265
|
|
—
|
|
711
|
|
5,554
|
|
6,265
|
|
(53
|
)
|
1986/1998
|
08/17/17
|
40
|
||||
|
Willow Crossing Health & Rehab Center
|
Columbus, IN
|
100%
|
—
|
|
1,290
|
|
10,714
|
|
12,004
|
|
—
|
|
1,290
|
|
10,714
|
|
12,004
|
|
(98
|
)
|
1988/2004
|
08/17/17
|
40
|
||||
|
Bridgewater Center for Health & Rehab
|
Hartford City, IN
|
100%
|
—
|
|
396
|
|
3,439
|
|
3,835
|
|
—
|
|
396
|
|
3,439
|
|
3,835
|
|
(35
|
)
|
1988/2012
|
08/17/17
|
40
|
||||
|
Oakbrook Village
|
Huntington, IN
|
100%
|
—
|
|
589
|
|
3,387
|
|
3,976
|
|
—
|
|
589
|
|
3,387
|
|
3,976
|
|
(35
|
)
|
1987
|
08/17/17
|
40
|
||||
|
Persimmon Ridge Center
|
Portland, IN
|
100%
|
—
|
|
315
|
|
9,848
|
|
10,163
|
|
—
|
|
315
|
|
9,848
|
|
10,163
|
|
(92
|
)
|
1964
|
08/17/17
|
40
|
||||
|
Vermillion Convalescent Center
|
Clinton, IN
|
100%
|
—
|
|
884
|
|
9,839
|
|
10,723
|
|
—
|
|
884
|
|
9,839
|
|
10,723
|
|
(96
|
)
|
1971
|
08/17/17
|
40
|
||||
|
Meadowbrooke Rehab Centre & Suites
|
Anderson, IN
|
100%
|
—
|
|
1,565
|
|
5,126
|
|
6,691
|
|
—
|
|
1,565
|
|
5,126
|
|
6,691
|
|
(52
|
)
|
1967
|
08/17/17
|
40
|
||||
|
Whispering Pines
|
Monticello, IN
|
100%
|
—
|
|
376
|
|
2,898
|
|
3,274
|
|
—
|
|
376
|
|
2,898
|
|
3,274
|
|
(32
|
)
|
1988
|
08/17/17
|
40
|
||||
|
Woodland Hills Care Center
|
Lawrenceburg, IN
|
100%
|
—
|
|
559
|
|
2,629
|
|
3,188
|
|
—
|
|
559
|
|
2,629
|
|
3,188
|
|
(31
|
)
|
1966/2007
|
08/17/17
|
40
|
||||
|
Las Vegas Post Acute & Rehabilitation
|
Las Vegas, NV
|
100%
|
—
|
|
509
|
|
18,216
|
|
18,725
|
|
—
|
|
509
|
|
18,216
|
|
18,725
|
|
(160
|
)
|
1964
|
08/17/17
|
40
|
||||
|
Torey Pines Rehabilitation Hospital
|
Las Vegas, NV
|
100%
|
—
|
|
3,169
|
|
7,863
|
|
11,032
|
|
—
|
|
3,169
|
|
7,863
|
|
11,032
|
|
(78
|
)
|
1972/1997
|
08/17/17
|
40
|
||||
|
Villa Campana Rehabiitation Hospital
|
Tucson, AZ
|
100%
|
—
|
|
1,800
|
|
4,387
|
|
6,187
|
|
—
|
|
1,800
|
|
4,387
|
|
6,187
|
|
(50
|
)
|
1983/2011
|
08/17/17
|
40
|
||||
|
Kachina Point Rehabilitation Hospital
|
Sedona, AZ
|
100%
|
—
|
|
2,035
|
|
10,981
|
|
13,016
|
|
—
|
|
2,035
|
|
10,981
|
|
13,016
|
|
(110
|
)
|
1984/2011
|
08/17/17
|
40
|
||||
|
Bay View Rehabilitation Hospital
|
Alameda, CA
|
100%
|
—
|
|
3,078
|
|
22,328
|
|
25,406
|
|
—
|
|
3,078
|
|
22,328
|
|
25,406
|
|
(200
|
)
|
1967
|
08/17/17
|
40
|
||||
|
Dover Center for Health & Rehabilitation
|
Dover, NH
|
100%
|
—
|
|
522
|
|
5,839
|
|
6,361
|
|
—
|
|
522
|
|
5,839
|
|
6,361
|
|
(73
|
)
|
1969/1992, 2017
|
08/17/17
|
40
|
||||
|
Augusta Center for Health & Rehabilitation
|
Augusta, ME
|
100%
|
—
|
|
135
|
|
6,470
|
|
6,605
|
|
—
|
|
135
|
|
6,470
|
|
6,605
|
|
(63
|
)
|
1967
|
08/17/17
|
40
|
||||
|
Eastside Center for Health & Rehabilitation
|
Bangor, ME
|
100%
|
—
|
|
302
|
|
1,811
|
|
2,113
|
|
—
|
|
302
|
|
1,811
|
|
2,113
|
|
(21
|
)
|
1967/1993
|
08/17/17
|
40
|
||||
|
Winship Green Center for Health & Rehabilitation
|
Bath, ME
|
100%
|
—
|
|
250
|
|
1,934
|
|
2,184
|
|
—
|
|
250
|
|
1,934
|
|
2,184
|
|
(21
|
)
|
1974
|
08/17/17
|
40
|
||||
|
Brewer Center for Health & Rehabilitation
|
Brewer, ME
|
100%
|
—
|
|
177
|
|
14,497
|
|
14,674
|
|
—
|
|
177
|
|
14,497
|
|
14,674
|
|
(138
|
)
|
1974/1990
|
08/17/17
|
40
|
||||
F-59
|
Initial Cost to Company
|
Cost Capitalized Subsequent to Acquisition
|
Gross Amount at which Carried at Close of Period
|
Life on Which Depreciation in Latest Income Statement is Computed
|
||||||||||||||||||||||||
|
Description
|
Location
|
Ownership Percentage
|
Encum- brances
(1)
|
Land
|
Building and Improve- ments
(2)(3)
|
Total
|
Land
|
Building and Improve- ments
(2)(3)
|
Total
|
Accumulated Depreciation and Amortization
|
Original Date of Construction/ Renovation
|
Date Acquired
|
|||||||||||||||
|
Kennebunk Center for Health & Rehabilitation
|
Kennebunk, ME
|
100%
|
—
|
|
198
|
|
6,822
|
|
7,020
|
|
—
|
|
198
|
|
6,822
|
|
7,020
|
|
(66
|
)
|
1977
|
08/17/17
|
40
|
||||
|
Norway Center for Health & Rehabilitation
|
Norway, ME
|
100%
|
—
|
|
791
|
|
3,680
|
|
4,471
|
|
—
|
|
791
|
|
3,680
|
|
4,471
|
|
(38
|
)
|
1976
|
08/17/17
|
40
|
||||
|
Brentwood Center for Health & Rehabilitation
|
Yarmouth, ME
|
100%
|
—
|
|
134
|
|
2,072
|
|
2,206
|
|
—
|
|
134
|
|
2,072
|
|
2,206
|
|
(23
|
)
|
1952
|
08/17/17
|
40
|
||||
|
Country Center for Health & Rehabilitation
|
Newburyport, MA
|
100%
|
—
|
|
269
|
|
4,436
|
|
4,705
|
|
—
|
|
269
|
|
4,436
|
|
4,705
|
|
(58
|
)
|
1968/2009
|
08/17/17
|
40
|
||||
|
Sachem Center for Health & Rehabilitation
|
E. Bridgewater, MA
|
100%
|
—
|
|
447
|
|
1,357
|
|
1,804
|
|
—
|
|
447
|
|
1,357
|
|
1,804
|
|
(22
|
)
|
1968
|
08/17/17
|
40
|
||||
|
Eliot Center for Health & Rehabilitation
|
Natick, MA
|
100%
|
—
|
|
475
|
|
1,491
|
|
1,966
|
|
—
|
|
475
|
|
1,491
|
|
1,966
|
|
(20
|
)
|
1964
|
08/17/17
|
40
|
||||
|
The Reservoir Center for Health & Rehabilitation
|
Marlborough, MA
|
100%
|
—
|
|
942
|
|
1,541
|
|
2,483
|
|
1,152
|
|
942
|
|
2,693
|
|
3,635
|
|
(23
|
)
|
1973
|
08/17/17
|
40
|
||||
|
Newton Wellesley Center for Alzheimer's Care
|
Wellesley, MA
|
100%
|
—
|
|
1,186
|
|
13,917
|
|
15,103
|
|
—
|
|
1,186
|
|
13,917
|
|
15,103
|
|
(128
|
)
|
1971
|
08/17/17
|
40
|
||||
|
Colony Center for Health & Rehabilitation
|
Abington, MA
|
100%
|
—
|
|
1,727
|
|
2,103
|
|
3,830
|
|
—
|
|
1,727
|
|
2,103
|
|
3,830
|
|
(27
|
)
|
1965
|
08/17/17
|
40
|
||||
|
Westgate Center for Rehab & Alzheimer's Care
|
Bangor, ME
|
100%
|
—
|
|
229
|
|
7,171
|
|
7,400
|
|
—
|
|
229
|
|
7,171
|
|
7,400
|
|
(72
|
)
|
1969/1993
|
08/17/17
|
40
|
||||
|
New Orange Hills
|
Orange, CA
|
100%
|
—
|
|
4,163
|
|
14,755
|
|
18,918
|
|
—
|
|
4,163
|
|
14,755
|
|
18,918
|
|
(139
|
)
|
1987
|
08/17/17
|
40
|
||||
|
Millbrook Healthcare & Rehabilitation Center
|
Lancaster, TX
|
100%
|
—
|
|
548
|
|
5,794
|
|
6,342
|
|
—
|
|
548
|
|
5,794
|
|
6,342
|
|
(60
|
)
|
2008
|
08/17/17
|
40
|
||||
|
Pleasant Valley Health & Rehab
|
Garland, TX
|
100%
|
—
|
|
1,118
|
|
7,490
|
|
8,608
|
|
—
|
|
1,118
|
|
7,490
|
|
8,608
|
|
(74
|
)
|
2008
|
08/17/17
|
40
|
||||
|
Regency Healthcare & Rehab Center at Red River
|
Clarksville, TX
|
100%
|
—
|
|
279
|
|
4,269
|
|
4,548
|
|
—
|
|
279
|
|
4,269
|
|
4,548
|
|
(47
|
)
|
1989
|
08/17/17
|
40
|
||||
|
McKinney Healthcare & Rehab
|
McKinney, TX
|
100%
|
—
|
|
1,272
|
|
6,047
|
|
7,319
|
|
—
|
|
1,272
|
|
6,047
|
|
7,319
|
|
(64
|
)
|
2006
|
08/17/17
|
40
|
||||
|
Nicholas County Nursing and Rehabilitation
|
Richwood, WV
|
100%
|
—
|
|
10
|
|
—
|
|
10
|
|
—
|
|
10
|
|
—
|
|
10
|
|
—
|
|
1980
|
08/17/17
|
40
|
||||
|
Golden Living Center - Hopkins
|
Hopkins, MN
|
100%
|
—
|
|
807
|
|
4,668
|
|
5,475
|
|
—
|
|
807
|
|
4,668
|
|
5,475
|
|
(56
|
)
|
1961/2008
|
08/17/17
|
40
|
||||
|
Golden Living Center - Village Gardens
|
Green Bay, WI
|
100%
|
—
|
|
1,299
|
|
1,247
|
|
2,546
|
|
—
|
|
1,299
|
|
1,247
|
|
2,546
|
|
(20
|
)
|
1965/2012
|
08/17/17
|
40
|
||||
|
Golden Living Center - Florence
|
Florence, WI
|
100%
|
—
|
|
291
|
|
3,778
|
|
4,069
|
|
—
|
|
291
|
|
3,778
|
|
4,069
|
|
(42
|
)
|
1970
|
08/17/17
|
40
|
||||
|
Golden Living Center - South Shore
|
St. Francis, WI
|
100%
|
—
|
|
166
|
|
1,887
|
|
2,053
|
|
—
|
|
166
|
|
1,887
|
|
2,053
|
|
(22
|
)
|
1960/1997
|
08/17/17
|
40
|
||||
|
Golden Living Center - Rochester East
|
Rochester, MN
|
100%
|
—
|
|
645
|
|
7,067
|
|
7,712
|
|
—
|
|
645
|
|
7,067
|
|
7,712
|
|
(68
|
)
|
1967/2011
|
08/17/17
|
40
|
||||
|
Golden Living Center - Wisconsin Dells
|
Wisconsin Dells, WI
|
100%
|
—
|
|
1,640
|
|
1,599
|
|
3,239
|
|
—
|
|
1,640
|
|
1,599
|
|
3,239
|
|
(24
|
)
|
1972/2006
|
08/17/17
|
40
|
||||
|
Golden Living Center - Sheboygan
|
Sheboygan, WI
|
100%
|
—
|
|
1,038
|
|
2,839
|
|
3,877
|
|
—
|
|
1,038
|
|
2,839
|
|
3,877
|
|
(36
|
)
|
1967/2012
|
08/17/17
|
40
|
||||
|
Azalea Gardens of Mobile
|
Mobile, AL
|
100%
|
—
|
|
—
|
|
2,540
|
|
2,540
|
|
—
|
|
—
|
|
2,540
|
|
2,540
|
|
(31
|
)
|
1967
|
08/17/17
|
40
|
||||
|
Golden Living Center - Hendersonville
|
Hendersonville, NC
|
100%
|
—
|
|
1,611
|
|
3,503
|
|
5,114
|
|
—
|
|
1,611
|
|
3,503
|
|
5,114
|
|
(41
|
)
|
1979
|
08/17/17
|
40
|
||||
F-60
|
Initial Cost to Company
|
Cost Capitalized Subsequent to Acquisition
|
Gross Amount at which Carried at Close of Period
|
Life on Which Depreciation in Latest Income Statement is Computed
|
||||||||||||||||||||||||
|
Description
|
Location
|
Ownership Percentage
|
Encum- brances
(1)
|
Land
|
Building and Improve- ments
(2)(3)
|
Total
|
Land
|
Building and Improve- ments
(2)(3)
|
Total
|
Accumulated Depreciation and Amortization
|
Original Date of Construction/ Renovation
|
Date Acquired
|
|||||||||||||||
|
Trisun Care Center Coastal Palms
|
Portland, TX
|
100%
|
—
|
|
610
|
|
11,296
|
|
11,906
|
|
—
|
|
610
|
|
11,296
|
|
11,906
|
|
(104
|
)
|
1998
|
08/17/17
|
40
|
||||
|
Trisun Care Center Westwood
|
Corpus Christi, TX
|
100%
|
—
|
|
366
|
|
6,961
|
|
7,327
|
|
—
|
|
366
|
|
6,961
|
|
7,327
|
|
(66
|
)
|
1973/2010
|
08/17/17
|
40
|
||||
|
Trisun Care Center River Ridge
|
Corpus Christi, TX
|
100%
|
—
|
|
792
|
|
7,450
|
|
8,242
|
|
—
|
|
792
|
|
7,450
|
|
8,242
|
|
(73
|
)
|
1994/2012
|
08/17/17
|
40
|
||||
|
Trisun Care Center - Northeast El Paso
|
El Paso, TX
|
100%
|
—
|
|
1,331
|
|
10,117
|
|
11,448
|
|
—
|
|
1,331
|
|
10,117
|
|
11,448
|
|
(110
|
)
|
2011
|
08/17/17
|
40
|
||||
|
Lakeside Care Center
|
San Antonio, TX
|
100%
|
—
|
|
1,280
|
|
11,705
|
|
12,985
|
|
—
|
|
1,280
|
|
11,705
|
|
12,985
|
|
(122
|
)
|
2012
|
08/17/17
|
40
|
||||
|
Riverside Nursing & Rehab Center
|
Austin, TX
|
100%
|
(5)
|
1,626
|
|
4,659
|
|
6,285
|
|
—
|
|
1,626
|
|
4,659
|
|
6,285
|
|
(48
|
)
|
2010
|
08/17/17
|
40
|
|||||
|
Senior Care of West Oaks
|
Austin, TX
|
100%
|
(5)
|
2,743
|
|
11,189
|
|
13,932
|
|
—
|
|
2,743
|
|
11,189
|
|
13,932
|
|
(108
|
)
|
2006
|
08/17/17
|
40
|
|||||
|
Baytown Nursing & Rehab Center
|
Baytown, TX
|
100%
|
(5)
|
579
|
|
22,317
|
|
22,896
|
|
—
|
|
579
|
|
22,317
|
|
22,896
|
|
(201
|
)
|
2000/2013
|
08/17/17
|
40
|
|||||
|
Cedar Bayou Nursing & Rehab Center
|
Baytown, TX
|
100%
|
(5)
|
589
|
|
20,475
|
|
21,064
|
|
—
|
|
589
|
|
20,475
|
|
21,064
|
|
(191
|
)
|
2008
|
08/17/17
|
40
|
|||||
|
Mystic Park Nursing & Rehab Center
|
San Antonio, TX
|
100%
|
(5)
|
721
|
|
7,979
|
|
8,700
|
|
—
|
|
721
|
|
7,979
|
|
8,700
|
|
(79
|
)
|
2004
|
08/17/17
|
40
|
|||||
|
Paramount Senior Care Centers at San Antonio
|
San Antonio, TX
|
100%
|
(5)
|
914
|
|
12,823
|
|
13,737
|
|
—
|
|
914
|
|
12,823
|
|
13,737
|
|
(123
|
)
|
2000
|
08/17/17
|
40
|
|||||
|
Senior Care of Westwood
|
Houston, TX
|
100%
|
(5)
|
1,300
|
|
13,353
|
|
14,653
|
|
—
|
|
1,300
|
|
13,353
|
|
14,653
|
|
(129
|
)
|
2006
|
08/17/17
|
40
|
|||||
|
Paramounty Senior Care Centers at Pasadena
|
Pasadena, TX
|
100%
|
(5)
|
1,148
|
|
23,579
|
|
24,727
|
|
—
|
|
1,148
|
|
23,579
|
|
24,727
|
|
(216
|
)
|
2004
|
08/17/17
|
40
|
|||||
|
The Pointe Nursing & Rehab Center
|
Webster, TX
|
100%
|
(5)
|
904
|
|
10,315
|
|
11,219
|
|
—
|
|
904
|
|
10,315
|
|
11,219
|
|
(102
|
)
|
2000/2009
|
08/17/17
|
40
|
|||||
|
Brodie Ranch Nursing & Rehab Center
|
Austin, TX
|
100%
|
(5)
|
610
|
|
8,549
|
|
9,159
|
|
—
|
|
610
|
|
8,549
|
|
9,159
|
|
(81
|
)
|
2010
|
08/17/17
|
40
|
|||||
|
Bandera Nursing & Rehab Center
|
Bandera, TX
|
100%
|
—
|
|
691
|
|
4,987
|
|
5,678
|
|
—
|
|
691
|
|
4,987
|
|
5,678
|
|
(53
|
)
|
2009
|
08/17/17
|
40
|
||||
|
West Oaks Nursing & Rehab Center
|
Houston, TX
|
100%
|
—
|
|
1,168
|
|
11,195
|
|
12,363
|
|
—
|
|
1,168
|
|
11,195
|
|
12,363
|
|
(110
|
)
|
1994
|
08/17/17
|
40
|
||||
|
Pilgrim Manor
|
Bossier City, LA
|
100%
|
—
|
|
772
|
|
23,497
|
|
24,269
|
|
—
|
|
772
|
|
23,497
|
|
24,269
|
|
(230
|
)
|
1973/2000
|
08/17/17
|
40
|
||||
|
Spring Lake Campus
|
Shreveport, LA
|
100%
|
—
|
|
975
|
|
30,437
|
|
31,412
|
|
—
|
|
975
|
|
30,437
|
|
31,412
|
|
(297
|
)
|
1984/1998
|
08/17/17
|
40
|
||||
|
The Bradford
|
Shreveport, LA
|
100%
|
—
|
|
1,402
|
|
21,494
|
|
22,896
|
|
—
|
|
1,402
|
|
21,494
|
|
22,896
|
|
(216
|
)
|
1980/2008
|
08/17/17
|
40
|
||||
|
The Guest House
|
Shreveport, LA
|
100%
|
—
|
|
1,067
|
|
21,983
|
|
23,050
|
|
—
|
|
1,067
|
|
21,983
|
|
23,050
|
|
(224
|
)
|
1964/2006
|
08/17/17
|
40
|
||||
|
Alpine
|
Ruston, LA
|
100%
|
—
|
|
691
|
|
22,205
|
|
22,896
|
|
—
|
|
691
|
|
22,205
|
|
22,896
|
|
(220
|
)
|
2014
|
08/17/17
|
40
|
||||
|
Colonial Oaks
|
Bossier City, LA
|
100%
|
—
|
|
498
|
|
13,240
|
|
13,738
|
|
—
|
|
498
|
|
13,240
|
|
13,738
|
|
(135
|
)
|
2001
|
08/17/17
|
40
|
||||
|
Shreveport Manor
|
Shreveport, LA
|
100%
|
—
|
|
457
|
|
14,125
|
|
14,582
|
|
—
|
|
457
|
|
14,125
|
|
14,582
|
|
(141
|
)
|
1969/2008
|
08/17/17
|
40
|
||||
|
Booker T. Washington
|
Shreveport, LA
|
100%
|
—
|
|
864
|
|
9,286
|
|
10,150
|
|
—
|
|
864
|
|
9,286
|
|
10,150
|
|
(95
|
)
|
2001/2012
|
08/17/17
|
40
|
||||
|
Hill Country Care
|
Dripping Springs, TX
|
100%
|
—
|
|
1,107
|
|
5,402
|
|
6,509
|
|
—
|
|
1,107
|
|
5,402
|
|
6,509
|
|
(53
|
)
|
1986
|
08/17/17
|
40
|
||||
|
Pecan Tree Rehab & Healthcare
|
Gainesville, TX
|
100%
|
—
|
|
315
|
|
9,759
|
|
10,074
|
|
—
|
|
315
|
|
9,759
|
|
10,074
|
|
(91
|
)
|
1990
|
08/17/17
|
40
|
||||
|
Senior Care of Jacksonville
|
Jacksonville, TX
|
100%
|
—
|
|
569
|
|
6,300
|
|
6,869
|
|
—
|
|
569
|
|
6,300
|
|
6,869
|
|
(63
|
)
|
2006
|
08/17/17
|
40
|
||||
|
Senior Care of San Angelo
|
San Angelo, TX
|
100%
|
—
|
|
1,565
|
|
12,936
|
|
14,501
|
|
—
|
|
1,565
|
|
12,936
|
|
14,501
|
|
(120
|
)
|
2006
|
08/17/17
|
40
|
||||
F-61
|
Initial Cost to Company
|
Cost Capitalized Subsequent to Acquisition
|
Gross Amount at which Carried at Close of Period
|
Life on Which Depreciation in Latest Income Statement is Computed
|
||||||||||||||||||||||||
|
Description
|
Location
|
Ownership Percentage
|
Encum- brances
(1)
|
Land
|
Building and Improve- ments
(2)(3)
|
Total
|
Land
|
Building and Improve- ments
(2)(3)
|
Total
|
Accumulated Depreciation and Amortization
|
Original Date of Construction/ Renovation
|
Date Acquired
|
|||||||||||||||
|
Senior Care of Midland
|
Midland, TX
|
100%
|
—
|
|
528
|
|
2,311
|
|
2,839
|
|
—
|
|
528
|
|
2,311
|
|
2,839
|
|
(26
|
)
|
2008
|
08/17/17
|
40
|
||||
|
Summer Place Nursing and Rehab
|
Beaumont, TX
|
100%
|
—
|
|
945
|
|
20,424
|
|
21,369
|
|
—
|
|
945
|
|
20,424
|
|
21,369
|
|
(185
|
)
|
2009
|
08/17/17
|
40
|
||||
|
The Meadows Nursing and Rehab
|
Orange, TX
|
100%
|
—
|
|
711
|
|
10,737
|
|
11,448
|
|
—
|
|
711
|
|
10,737
|
|
11,448
|
|
(102
|
)
|
2006
|
08/17/17
|
40
|
||||
|
Heritage Oaks West Retirement Village
|
Corsicana, TX
|
100%
|
—
|
|
823
|
|
4,214
|
|
5,037
|
|
—
|
|
823
|
|
4,214
|
|
5,037
|
|
(46
|
)
|
1995
|
08/17/17
|
40
|
||||
|
Cypress Glen
|
Port Arthur, TX
|
100%
|
—
|
|
1,209
|
|
13,444
|
|
14,653
|
|
—
|
|
1,209
|
|
13,444
|
|
14,653
|
|
(130
|
)
|
2000/2008
|
08/17/17
|
40
|
||||
|
Lake Arthur
|
Port Arthur, TX
|
100%
|
—
|
|
396
|
|
7,846
|
|
8,242
|
|
—
|
|
396
|
|
7,846
|
|
8,242
|
|
(75
|
)
|
1986/1992
|
08/17/17
|
40
|
||||
|
Signature Healthcare of Whitesburg Gardens
|
Huntsville, AL
|
100%
|
—
|
|
634
|
|
28,071
|
|
28,705
|
|
—
|
|
634
|
|
28,071
|
|
28,705
|
|
(248
|
)
|
1968/2012
|
08/17/17
|
40
|
||||
|
Signature Healthcare of Terre Haute
|
Terre Haute, IN
|
100%
|
—
|
|
644
|
|
37,451
|
|
38,095
|
|
—
|
|
644
|
|
37,451
|
|
38,095
|
|
(372
|
)
|
1996/2013
|
08/17/17
|
40
|
||||
|
Signature Healthcare at Larkin Springs
|
Madison, TN
|
100%
|
—
|
|
902
|
|
3,850
|
|
4,752
|
|
—
|
|
902
|
|
3,850
|
|
4,752
|
|
(46
|
)
|
1969/2016
|
08/17/17
|
40
|
||||
|
Signature Healthcare of Savannah
|
Savannah, GA
|
100%
|
—
|
|
1,235
|
|
3,765
|
|
5,000
|
|
—
|
|
1,235
|
|
3,765
|
|
5,000
|
|
(48
|
)
|
1970/2015
|
08/17/17
|
40
|
||||
|
Signature Healthcare of Bluffton
|
Bluffton, IN
|
100%
|
—
|
|
254
|
|
5,105
|
|
5,359
|
|
—
|
|
254
|
|
5,105
|
|
5,359
|
|
(55
|
)
|
1970
|
08/17/17
|
40
|
||||
|
Signature Healthcare of Bowling Green
|
Bowling Green, KY
|
100%
|
—
|
|
280
|
|
13,975
|
|
14,255
|
|
—
|
|
280
|
|
13,975
|
|
14,255
|
|
(136
|
)
|
1970/2015
|
08/17/17
|
40
|
||||
|
Oakview Nursing and Rehabilitation Center
|
Calvert City, KY
|
100%
|
—
|
|
1,176
|
|
7,012
|
|
8,188
|
|
—
|
|
1,176
|
|
7,012
|
|
8,188
|
|
(73
|
)
|
1962/2015
|
08/17/17
|
40
|
||||
|
Fountain Circle Care and Rehabilitation Center
|
Winchester, KY
|
100%
|
—
|
|
554
|
|
13,207
|
|
13,761
|
|
—
|
|
554
|
|
13,207
|
|
13,761
|
|
(132
|
)
|
1967/2015
|
08/17/17
|
40
|
||||
|
Riverside Care & Rehabilitation Center
|
Calhoun, KY
|
100%
|
—
|
|
613
|
|
7,643
|
|
8,256
|
|
—
|
|
613
|
|
7,643
|
|
8,256
|
|
(81
|
)
|
1963/2015
|
08/17/17
|
40
|
||||
|
Signature Healthcare of Bremen
|
Bremen, IN
|
100%
|
—
|
|
173
|
|
7,393
|
|
7,566
|
|
—
|
|
173
|
|
7,393
|
|
7,566
|
|
(72
|
)
|
1982/2015
|
08/17/17
|
40
|
||||
|
Signature Healthcare of Muncie
|
Muncie, IN
|
100%
|
—
|
|
374
|
|
27,429
|
|
27,803
|
|
—
|
|
374
|
|
27,429
|
|
27,803
|
|
(248
|
)
|
1980/2013
|
08/17/17
|
40
|
||||
|
Signature Healthcare at Parkwood
|
Lebanon, IN
|
100%
|
—
|
|
612
|
|
11,755
|
|
12,367
|
|
—
|
|
612
|
|
11,755
|
|
12,367
|
|
(112
|
)
|
1977/2012
|
08/17/17
|
40
|
||||
|
Signature Healthcare at Tower Road
|
Marietta, GA
|
100%
|
—
|
|
364
|
|
16,116
|
|
16,480
|
|
—
|
|
364
|
|
16,116
|
|
16,480
|
|
(158
|
)
|
1969/2015
|
08/17/17
|
40
|
||||
|
Danville Centre for Health and Rehabilitation
|
Danville, KY
|
100%
|
—
|
|
790
|
|
9,356
|
|
10,146
|
|
—
|
|
790
|
|
9,356
|
|
10,146
|
|
(108
|
)
|
1962/2015
|
08/17/17
|
40
|
||||
|
Signature Healthcare at Hillcrest
|
Owensboro, KY
|
100%
|
—
|
|
1,048
|
|
22,587
|
|
23,635
|
|
—
|
|
1,048
|
|
22,587
|
|
23,635
|
|
(212
|
)
|
1963/2011
|
08/17/17
|
40
|
||||
|
Signature Healthcare of Elizabethtown
|
Elizabethtown, KY
|
100%
|
—
|
|
239
|
|
4,853
|
|
5,092
|
|
—
|
|
239
|
|
4,853
|
|
5,092
|
|
(51
|
)
|
1969
|
08/17/17
|
40
|
||||
|
Signature Healthcare of Primacy
|
Memphis, TN
|
100%
|
—
|
|
1,633
|
|
9,371
|
|
11,004
|
|
—
|
|
1,633
|
|
9,371
|
|
11,004
|
|
(96
|
)
|
1981/2015
|
08/17/17
|
40
|
||||
|
Signature Healthcare of Harbour Pointe
|
Norfolk, VA
|
100%
|
—
|
|
705
|
|
16,451
|
|
17,156
|
|
—
|
|
705
|
|
16,451
|
|
17,156
|
|
(175
|
)
|
1969/2015
|
08/17/17
|
40
|
||||
|
Harrodsburg Health & Rehabilitation Center
|
Harrodsburg, KY
|
100%
|
—
|
|
1,049
|
|
9,851
|
|
10,900
|
|
—
|
|
1,049
|
|
9,851
|
|
10,900
|
|
(108
|
)
|
1975/2016
|
08/17/17
|
40
|
||||
|
Signature Healthcare of Putnam County
|
Cookeville, TN
|
100%
|
—
|
|
1,034
|
|
15,555
|
|
16,589
|
|
—
|
|
1,034
|
|
15,555
|
|
16,589
|
|
(149
|
)
|
1979/2016
|
08/17/17
|
40
|
||||
F-62
|
Initial Cost to Company
|
Cost Capitalized Subsequent to Acquisition
|
Gross Amount at which Carried at Close of Period
|
Life on Which Depreciation in Latest Income Statement is Computed
|
||||||||||||||||||||||||
|
Description
|
Location
|
Ownership Percentage
|
Encum- brances
(1)
|
Land
|
Building and Improve- ments
(2)(3)
|
Total
|
Land
|
Building and Improve- ments
(2)(3)
|
Total
|
Accumulated Depreciation and Amortization
|
Original Date of Construction/ Renovation
|
Date Acquired
|
|||||||||||||||
|
Signature Healthcare of Fayette County
|
Washington Court House, OH
|
100%
|
—
|
|
405
|
|
4,839
|
|
5,244
|
|
—
|
|
405
|
|
4,839
|
|
5,244
|
|
(55
|
)
|
1984/2015
|
08/17/17
|
40
|
||||
|
Signature Healthcare of Warren
|
Warren, OH
|
100%
|
—
|
|
955
|
|
5,260
|
|
6,215
|
|
—
|
|
955
|
|
5,260
|
|
6,215
|
|
(70
|
)
|
1967/2015
|
08/17/17
|
40
|
||||
|
Signature Healthcare of Galion
|
Galion, OH
|
100%
|
—
|
|
836
|
|
668
|
|
1,504
|
|
—
|
|
836
|
|
668
|
|
1,504
|
|
(12
|
)
|
1967/1985
|
08/17/17
|
40
|
||||
|
Signature Healthcare of Roanoke Rapids
|
Roanoke Rapids, NC
|
100%
|
—
|
|
373
|
|
10,308
|
|
10,681
|
|
—
|
|
373
|
|
10,308
|
|
10,681
|
|
(109
|
)
|
1967/2015
|
08/17/17
|
40
|
||||
|
Signature Healthcare of Kinston
|
Kinston, NC
|
100%
|
—
|
|
954
|
|
7,987
|
|
8,941
|
|
—
|
|
954
|
|
7,987
|
|
8,941
|
|
(95
|
)
|
1960/2015
|
08/17/17
|
40
|
||||
|
Gastonia Care and Rehabilitation
|
Gastonia, NC
|
100%
|
—
|
|
173
|
|
5,993
|
|
6,166
|
|
—
|
|
173
|
|
5,993
|
|
6,166
|
|
(70
|
)
|
1968/2015
|
08/17/17
|
40
|
||||
|
Signature Healthcare of Chapel Hill
|
Chapel Hill, NC
|
100%
|
—
|
|
809
|
|
2,703
|
|
3,512
|
|
302
|
|
809
|
|
3,004
|
|
3,813
|
|
(41
|
)
|
1984/2015
|
08/17/17
|
40
|
||||
|
Signature Healthcare of Chillicothe
|
Chillicothe, OH
|
100%
|
—
|
|
260
|
|
8,924
|
|
9,184
|
|
—
|
|
260
|
|
8,924
|
|
9,184
|
|
(97
|
)
|
1974/2015
|
08/17/17
|
40
|
||||
|
Signature Healthcare of Coshocton
|
Coshocton, OH
|
100%
|
—
|
|
374
|
|
2,530
|
|
2,904
|
|
—
|
|
374
|
|
2,530
|
|
2,904
|
|
(37
|
)
|
1974/2015
|
08/17/17
|
40
|
||||
|
Balanced Care Bloomsburg
|
Bloomsburg, PA
|
100%
|
—
|
|
1,473
|
|
5,842
|
|
7,315
|
|
—
|
|
1,473
|
|
5,842
|
|
7,315
|
|
(67
|
)
|
1997
|
08/17/17
|
40
|
||||
|
McCreary Health & Rehabilitation Center
|
Pine Knot, KY
|
100%
|
—
|
|
208
|
|
7,665
|
|
7,873
|
|
—
|
|
208
|
|
7,665
|
|
7,873
|
|
(76
|
)
|
1990
|
08/17/17
|
40
|
||||
|
Colonial Health & Rehabilitation Center
|
Bardstown, KY
|
100%
|
—
|
|
634
|
|
4,094
|
|
4,728
|
|
—
|
|
634
|
|
4,094
|
|
4,728
|
|
(47
|
)
|
1968/2010
|
08/17/17
|
40
|
||||
|
Glasgow Health & Rehabilitation Center
|
Glasgow, KY
|
100%
|
—
|
|
83
|
|
2,057
|
|
2,140
|
|
—
|
|
83
|
|
2,057
|
|
2,140
|
|
(29
|
)
|
1968
|
08/17/17
|
40
|
||||
|
Green Valley Health & Rehabilitation Center
|
Carrollton, KY
|
100%
|
—
|
|
124
|
|
1,693
|
|
1,817
|
|
—
|
|
124
|
|
1,693
|
|
1,817
|
|
(25
|
)
|
1978/2016
|
08/17/17
|
40
|
||||
|
Hart County Health & Rehabilitation
|
Horse Cave, KY
|
100%
|
—
|
|
208
|
|
7,070
|
|
7,278
|
|
—
|
|
208
|
|
7,070
|
|
7,278
|
|
(77
|
)
|
1993
|
08/17/17
|
40
|
||||
|
Heritage Hall Health & Rehabilitation Center
|
Lawrenceburg, KY
|
100%
|
—
|
|
635
|
|
9,861
|
|
10,496
|
|
—
|
|
635
|
|
9,861
|
|
10,496
|
|
(99
|
)
|
1973
|
08/17/17
|
40
|
||||
|
Jackson Manor
|
Annville, KY
|
100%
|
—
|
|
479
|
|
6,078
|
|
6,557
|
|
—
|
|
479
|
|
6,078
|
|
6,557
|
|
(60
|
)
|
1989
|
08/17/17
|
40
|
||||
|
Jefferson Manor
|
Louisville, KY
|
100%
|
—
|
|
3,528
|
|
4,653
|
|
8,181
|
|
—
|
|
3,528
|
|
4,653
|
|
8,181
|
|
(57
|
)
|
1982/2012
|
08/17/17
|
40
|
||||
|
Jefferson Place
|
Louisville, KY
|
100%
|
—
|
|
2,207
|
|
20,733
|
|
22,940
|
|
—
|
|
2,207
|
|
20,733
|
|
22,940
|
|
(193
|
)
|
1991/2010
|
08/17/17
|
40
|
||||
|
Monroe Health & Rehabilitation Center
|
Tompkinsville, KY
|
100%
|
—
|
|
333
|
|
9,556
|
|
9,889
|
|
—
|
|
333
|
|
9,556
|
|
9,889
|
|
(95
|
)
|
1969
|
08/17/17
|
40
|
||||
|
North Hardin Health & Rehabilitation Center
|
Radcliff, KY
|
100%
|
—
|
|
1,815
|
|
7,470
|
|
9,285
|
|
—
|
|
1,815
|
|
7,470
|
|
9,285
|
|
(94
|
)
|
1986
|
08/17/17
|
40
|
||||
|
Professional Care Health & Rehabilitation Center
|
Hartford, KY
|
100%
|
—
|
|
312
|
|
8,189
|
|
8,501
|
|
—
|
|
312
|
|
8,189
|
|
8,501
|
|
(83
|
)
|
1967
|
08/17/17
|
40
|
||||
|
Rockford Health & Rehabilitation Center
|
Louisville, KY
|
100%
|
—
|
|
427
|
|
6,003
|
|
6,430
|
|
—
|
|
427
|
|
6,003
|
|
6,430
|
|
(65
|
)
|
1975/2005
|
08/17/17
|
40
|
||||
|
Summerfield Health & Rehabilitation Center
|
Louisville, KY
|
100%
|
—
|
|
1,134
|
|
9,166
|
|
10,300
|
|
—
|
|
1,134
|
|
9,166
|
|
10,300
|
|
(102
|
)
|
1979/2013
|
08/17/17
|
40
|
||||
|
Tanbark Senior Living
|
Lexington, KY
|
100%
|
—
|
|
2,558
|
|
4,311
|
|
6,869
|
|
—
|
|
2,558
|
|
4,311
|
|
6,869
|
|
(52
|
)
|
1989
|
08/17/17
|
40
|
||||
|
Summit Manor Health & Rehabilitation Center
|
Columbia, KY
|
100%
|
—
|
|
114
|
|
11,141
|
|
11,255
|
|
—
|
|
114
|
|
11,141
|
|
11,255
|
|
(108
|
)
|
1965
|
08/17/17
|
40
|
||||
|
Meadowview Health & Rehabilitation Center
|
Louisville, KY
|
100%
|
—
|
|
390
|
|
2,410
|
|
2,800
|
|
—
|
|
390
|
|
2,410
|
|
2,800
|
|
(21
|
)
|
1973/2013
|
08/17/17
|
40
|
||||
F-63
|
Initial Cost to Company
|
Cost Capitalized Subsequent to Acquisition
|
Gross Amount at which Carried at Close of Period
|
Life on Which Depreciation in Latest Income Statement is Computed
|
||||||||||||||||||||||||
|
Description
|
Location
|
Ownership Percentage
|
Encum- brances
(1)
|
Land
|
Building and Improve- ments
(2)(3)
|
Total
|
Land
|
Building and Improve- ments
(2)(3)
|
Total
|
Accumulated Depreciation and Amortization
|
Original Date of Construction/ Renovation
|
Date Acquired
|
|||||||||||||||
|
Belle View Estates Rehabilitation and Care Center
|
Monticello, AR
|
100%
|
—
|
|
206
|
|
3,179
|
|
3,385
|
|
—
|
|
206
|
|
3,179
|
|
3,385
|
|
(37
|
)
|
1995
|
08/17/17
|
40
|
||||
|
River Chase Rehabilitation and Care Center
|
Morrilton, AR
|
100%
|
—
|
|
508
|
|
—
|
|
508
|
|
—
|
|
508
|
|
—
|
|
508
|
|
—
|
|
1988
|
08/17/17
|
40
|
||||
|
Heartland Rehabilitation and Care Center
|
Benton, AR
|
100%
|
—
|
|
1,336
|
|
7,386
|
|
8,722
|
|
—
|
|
1,336
|
|
7,386
|
|
8,722
|
|
(79
|
)
|
1992
|
08/17/17
|
40
|
||||
|
River Ridge Rehabilitation and Care Center
|
Wynne, AR
|
100%
|
—
|
|
227
|
|
4,007
|
|
4,234
|
|
—
|
|
227
|
|
4,007
|
|
4,234
|
|
(43
|
)
|
1990
|
08/17/17
|
40
|
||||
|
Brookridge Cove Rehabilitation and Care Center
|
Morrilton, AR
|
100%
|
—
|
|
412
|
|
2,642
|
|
3,054
|
|
—
|
|
412
|
|
2,642
|
|
3,054
|
|
(35
|
)
|
1996
|
08/17/17
|
40
|
||||
|
Southern Trace Rehabilitation and Care Center
|
Bryant, AR
|
100%
|
—
|
|
819
|
|
8,938
|
|
9,757
|
|
—
|
|
819
|
|
8,938
|
|
9,757
|
|
(85
|
)
|
1989/2015
|
08/17/17
|
40
|
||||
|
Lake Village Rehabilitation and Care Center
|
Lake Village, AR
|
100%
|
—
|
|
507
|
|
4,838
|
|
5,345
|
|
—
|
|
507
|
|
4,838
|
|
5,345
|
|
(53
|
)
|
1998
|
08/17/17
|
40
|
||||
|
Savannah Specialty Care Center
|
Savannah, GA
|
100%
|
—
|
|
2,194
|
|
11,711
|
|
13,905
|
|
—
|
|
2,194
|
|
11,711
|
|
13,905
|
|
(109
|
)
|
1972
|
08/17/17
|
40
|
||||
|
Pettigrew Rehabilitation Center
|
Durham, NC
|
100%
|
—
|
|
470
|
|
9,633
|
|
10,103
|
|
—
|
|
470
|
|
9,633
|
|
10,103
|
|
(89
|
)
|
1968/2006
|
08/17/17
|
40
|
||||
|
Sunnybrook Rehabilitation Center
|
Raleigh, NC
|
100%
|
—
|
|
1,155
|
|
11,749
|
|
12,904
|
|
—
|
|
1,155
|
|
11,749
|
|
12,904
|
|
(111
|
)
|
1971
|
08/17/17
|
40
|
||||
|
Raleigh Rehabilitation Center
|
Raleigh, NC
|
100%
|
—
|
|
926
|
|
17,649
|
|
18,575
|
|
—
|
|
926
|
|
17,649
|
|
18,575
|
|
(164
|
)
|
1967/2007
|
08/17/17
|
40
|
||||
|
Cypress Pointe Rehabilitation Center
|
Wilmington, NC
|
100%
|
—
|
|
611
|
|
5,051
|
|
5,662
|
|
—
|
|
611
|
|
5,051
|
|
5,662
|
|
(53
|
)
|
1966/2013
|
08/17/17
|
40
|
||||
|
Silas Creek Rehabilitation Center
|
Winston-Salem, NC
|
100%
|
—
|
|
879
|
|
3,283
|
|
4,162
|
|
—
|
|
879
|
|
3,283
|
|
4,162
|
|
(40
|
)
|
1965
|
08/17/17
|
40
|
||||
|
Lincolnton Rehabilitation Center
|
Lincolnton, NC
|
100%
|
—
|
|
—
|
|
9,967
|
|
9,967
|
|
—
|
|
—
|
|
9,967
|
|
9,967
|
|
(95
|
)
|
1976
|
08/17/17
|
40
|
||||
|
Rehabilitation and Nursing Center of Monroe
|
Monroe, NC
|
100%
|
—
|
|
166
|
|
5,906
|
|
6,072
|
|
—
|
|
166
|
|
5,906
|
|
6,072
|
|
(63
|
)
|
1963/2005
|
08/17/17
|
40
|
||||
|
Guardian Care of Zebulon
|
Zebulon, NC
|
100%
|
—
|
|
594
|
|
8,559
|
|
9,153
|
|
—
|
|
594
|
|
8,559
|
|
9,153
|
|
(78
|
)
|
1973/2010
|
08/17/17
|
40
|
||||
|
Guardian Care of Rocky Mount
|
Rocky Mount, NC
|
100%
|
—
|
|
—
|
|
18,314
|
|
18,314
|
|
—
|
|
—
|
|
18,314
|
|
18,314
|
|
(164
|
)
|
1975
|
08/17/17
|
40
|
||||
|
San Pedro Manor
|
San Antonio, TX
|
100%
|
—
|
|
671
|
|
2,504
|
|
3,175
|
|
—
|
|
671
|
|
2,504
|
|
3,175
|
|
(30
|
)
|
1986
|
08/17/17
|
40
|
||||
|
Park Manor Health Care & Rehabilitation
|
DeSoto, TX
|
100%
|
—
|
|
942
|
|
6,033
|
|
6,975
|
|
—
|
|
942
|
|
6,033
|
|
6,975
|
|
(63
|
)
|
1987
|
08/17/17
|
40
|
||||
|
Avalon Place - Trinity
|
Trinity, TX
|
100%
|
—
|
|
363
|
|
3,852
|
|
4,215
|
|
—
|
|
363
|
|
3,852
|
|
4,215
|
|
(43
|
)
|
1985
|
08/17/17
|
40
|
||||
|
Avalon Place - Wharton
|
Wharton, TX
|
100%
|
—
|
|
249
|
|
3,245
|
|
3,494
|
|
—
|
|
249
|
|
3,245
|
|
3,494
|
|
(37
|
)
|
1988
|
08/17/17
|
40
|
||||
|
Avalon Place - Kirbyville
|
Kirbyville, TX
|
100%
|
—
|
|
208
|
|
5,809
|
|
6,017
|
|
—
|
|
208
|
|
5,809
|
|
6,017
|
|
(62
|
)
|
1987
|
08/17/17
|
40
|
||||
|
Heritage House of Marshall
|
Marshall, TX
|
100%
|
—
|
|
732
|
|
4,288
|
|
5,020
|
|
—
|
|
732
|
|
4,288
|
|
5,020
|
|
(47
|
)
|
2008
|
08/17/17
|
40
|
||||
|
Park Place Health Center
|
Hartford, CT
|
100%
|
—
|
|
310
|
|
1,190
|
|
1,500
|
|
—
|
|
310
|
|
1,190
|
|
1,500
|
|
(14
|
)
|
1969/2006
|
08/17/17
|
40
|
||||
F-64
|
Initial Cost to Company
|
Cost Capitalized Subsequent to Acquisition
|
Gross Amount at which Carried at Close of Period
|
Life on Which Depreciation in Latest Income Statement is Computed
|
||||||||||||||||||||||||
|
Description
|
Location
|
Ownership Percentage
|
Encum- brances
(1)
|
Land
|
Building and Improve- ments
(2)(3)
|
Total
|
Land
|
Building and Improve- ments
(2)(3)
|
Total
|
Accumulated Depreciation and Amortization
|
Original Date of Construction/ Renovation
|
Date Acquired
|
|||||||||||||||
|
Spectrum Healthcare Torrington
|
Torrington, CT
|
100%
|
—
|
|
250
|
|
—
|
|
250
|
|
—
|
|
250
|
|
—
|
|
250
|
|
—
|
|
1969/2011
|
08/17/17
|
40
|
||||
|
Autumn Woods Residential Health Care Facility
|
Warren, MI
|
100%
|
—
|
|
2,052
|
|
25,539
|
|
27,591
|
|
—
|
|
2,052
|
|
25,539
|
|
27,591
|
|
(264
|
)
|
1961/2001
|
08/17/17
|
40
|
||||
|
Autumn View Health Care Facility
|
Hamburg, NY
|
100%
|
—
|
|
1,026
|
|
54,086
|
|
55,112
|
|
—
|
|
1,026
|
|
54,086
|
|
55,112
|
|
(488
|
)
|
1983/2014
|
08/17/17
|
40
|
||||
|
Brookhaven Health Care Facility
|
East Patchogue, NY
|
100%
|
—
|
|
2,181
|
|
30,373
|
|
32,554
|
|
—
|
|
2,181
|
|
30,373
|
|
32,554
|
|
(288
|
)
|
1988/2011
|
08/17/17
|
40
|
||||
|
Harris Hill Nursing Facility
|
Williamsville, NY
|
100%
|
—
|
|
1,122
|
|
46,413
|
|
47,535
|
|
—
|
|
1,122
|
|
46,413
|
|
47,535
|
|
(411
|
)
|
1992/2007
|
08/17/17
|
40
|
||||
|
Garden Gate Health Care Facility
|
Cheektowaga, NY
|
100%
|
—
|
|
1,164
|
|
29,905
|
|
31,069
|
|
—
|
|
1,164
|
|
29,905
|
|
31,069
|
|
(281
|
)
|
1979/2006
|
08/17/17
|
40
|
||||
|
Northgate Health Care Facility
|
North Tonawanda, NY
|
100%
|
—
|
|
830
|
|
29,488
|
|
30,318
|
|
—
|
|
830
|
|
29,488
|
|
30,318
|
|
(277
|
)
|
1982/2007
|
08/17/17
|
40
|
||||
|
Seneca Health Care Center
|
West Seneca, NY
|
100%
|
—
|
|
1,325
|
|
26,839
|
|
28,164
|
|
—
|
|
1,325
|
|
26,839
|
|
28,164
|
|
(247
|
)
|
1974/2008
|
08/17/17
|
40
|
||||
|
Blueberry Hill Rehab and Healthcare Center
|
Beverly, MA
|
100%
|
—
|
|
2,410
|
|
13,588
|
|
15,998
|
|
—
|
|
2,410
|
|
13,588
|
|
15,998
|
|
(168
|
)
|
1965/2015
|
08/17/17
|
40
|
||||
|
River Terrace Rehabilitation and Healthcare Center
|
Lancaster, MA
|
100%
|
—
|
|
343
|
|
7,733
|
|
8,076
|
|
—
|
|
343
|
|
7,733
|
|
8,076
|
|
(74
|
)
|
1970/2005
|
08/17/17
|
40
|
||||
|
The Crossings West Campus
|
New London, CT
|
100%
|
—
|
|
356
|
|
152
|
|
508
|
|
—
|
|
356
|
|
152
|
|
508
|
|
(3
|
)
|
1967/2016
|
08/17/17
|
40
|
||||
|
The Crossings East Campus
|
New London, CT
|
100%
|
—
|
|
505
|
|
2,248
|
|
2,753
|
|
—
|
|
505
|
|
2,248
|
|
2,753
|
|
(37
|
)
|
1967/2016
|
08/17/17
|
40
|
||||
|
Parkway Pavilion Healthcare
|
Enfield, CT
|
100%
|
—
|
|
437
|
|
16,461
|
|
16,898
|
|
—
|
|
437
|
|
16,461
|
|
16,898
|
|
(161
|
)
|
1968/2015
|
08/17/17
|
40
|
||||
|
Quincy Health & Rehabilitation Center
|
Quincy, MA
|
100%
|
—
|
|
894
|
|
904
|
|
1,798
|
|
—
|
|
894
|
|
904
|
|
1,798
|
|
(16
|
)
|
1965/2003
|
08/17/17
|
40
|
||||
|
Den-Mar Health & Rebilitation Center
|
Rockport, MA
|
100%
|
—
|
|
—
|
|
1,765
|
|
1,765
|
|
—
|
|
—
|
|
1,765
|
|
1,765
|
|
(22
|
)
|
1963/1993
|
08/17/17
|
40
|
||||
|
Walden Health & Rehabilitation Center
|
Concord, MA
|
100%
|
—
|
|
549
|
|
1,737
|
|
2,286
|
|
—
|
|
549
|
|
1,737
|
|
2,286
|
|
(23
|
)
|
1968/2004
|
08/17/17
|
40
|
||||
|
Firesteel Healthcare Community
|
Mitchell, SD
|
100%
|
—
|
|
621
|
|
14,059
|
|
14,680
|
|
8,636
|
|
621
|
|
22,695
|
|
23,316
|
|
(324
|
)
|
1966/2017
|
08/17/17
|
40
|
||||
|
Fountain Springs Healthcare Community
|
Rapid City, SD
|
100%
|
—
|
|
1,134
|
|
13,109
|
|
14,243
|
|
—
|
|
1,134
|
|
13,109
|
|
14,243
|
|
(122
|
)
|
1989/2016
|
08/17/17
|
40
|
||||
|
Palisade Healthcare Community
|
Garretson, SD
|
100%
|
—
|
|
362
|
|
2,548
|
|
2,910
|
|
—
|
|
362
|
|
2,548
|
|
2,910
|
|
(31
|
)
|
1971/1982
|
08/17/17
|
40
|
||||
|
Shepherd of the Valley Healthcare Community
|
Casper, WY
|
100%
|
—
|
|
803
|
|
19,210
|
|
20,013
|
|
—
|
|
803
|
|
19,210
|
|
20,013
|
|
(186
|
)
|
1961/1990
|
08/17/17
|
40
|
||||
|
Wheatcrest Hills Healthcare Community
|
Britton, SD
|
100%
|
—
|
|
679
|
|
3,216
|
|
3,895
|
|
—
|
|
679
|
|
3,216
|
|
3,895
|
|
(37
|
)
|
1969
|
08/17/17
|
40
|
||||
|
Riverview Healthcare Community & Independent Living
|
Flandreau, SD
|
100%
|
—
|
|
240
|
|
6,327
|
|
6,567
|
|
—
|
|
240
|
|
6,327
|
|
6,567
|
|
(63
|
)
|
1965/1989
|
08/17/17
|
40
|
||||
|
Prairie View Healthcare Center
|
Woonsocket, SD
|
100%
|
—
|
|
383
|
|
2,041
|
|
2,424
|
|
—
|
|
383
|
|
2,041
|
|
2,424
|
|
(24
|
)
|
1968/2012
|
08/17/17
|
40
|
||||
|
Wingate at Dutchess (Fishkill)
|
Fishkill, NY
|
100%
|
—
|
|
964
|
|
30,107
|
|
31,071
|
|
—
|
|
964
|
|
30,107
|
|
31,071
|
|
(283
|
)
|
1995
|
08/17/17
|
40
|
||||
F-65
|
Initial Cost to Company
|
Cost Capitalized Subsequent to Acquisition
|
Gross Amount at which Carried at Close of Period
|
Life on Which Depreciation in Latest Income Statement is Computed
|
||||||||||||||||||||||||
|
Description
|
Location
|
Ownership Percentage
|
Encum- brances
(1)
|
Land
|
Building and Improve- ments
(2)(3)
|
Total
|
Land
|
Building and Improve- ments
(2)(3)
|
Total
|
Accumulated Depreciation and Amortization
|
Original Date of Construction/ Renovation
|
Date Acquired
|
|||||||||||||||
|
Wingate at Ulster (Highland)
|
Highland, NY
|
100%
|
—
|
|
4,371
|
|
11,473
|
|
15,844
|
|
—
|
|
4,371
|
|
11,473
|
|
15,844
|
|
(116
|
)
|
1998
|
08/17/17
|
40
|
||||
|
Wingate at Beacon
|
Beacon, NY
|
100%
|
—
|
|
—
|
|
25,400
|
|
25,400
|
|
—
|
|
—
|
|
25,400
|
|
25,400
|
|
(251
|
)
|
2002
|
08/17/17
|
40
|
||||
|
Wingate at Springfield
|
Springfield, MA
|
100%
|
—
|
|
817
|
|
11,357
|
|
12,174
|
|
—
|
|
817
|
|
11,357
|
|
12,174
|
|
(109
|
)
|
1987
|
08/17/17
|
40
|
||||
|
Wingate at Andover
|
Andover, MA
|
100%
|
—
|
|
2,123
|
|
5,383
|
|
7,506
|
|
—
|
|
2,123
|
|
5,383
|
|
7,506
|
|
(59
|
)
|
1992
|
08/17/17
|
40
|
||||
|
Wingate at Reading
|
Reading, MA
|
100%
|
—
|
|
1,534
|
|
5,221
|
|
6,755
|
|
—
|
|
1,534
|
|
5,221
|
|
6,755
|
|
(59
|
)
|
1988
|
08/17/17
|
40
|
||||
|
Wingate at Sudbury
|
Sudbury, MA
|
100%
|
—
|
|
2,017
|
|
3,458
|
|
5,475
|
|
—
|
|
2,017
|
|
3,458
|
|
5,475
|
|
(45
|
)
|
1997
|
08/17/17
|
40
|
||||
|
Wingate at Belvidere (Lowell)
|
Lowell, MA
|
100%
|
—
|
|
1,335
|
|
9,019
|
|
10,354
|
|
—
|
|
1,335
|
|
9,019
|
|
10,354
|
|
(93
|
)
|
1966/2007
|
08/17/17
|
40
|
||||
|
Wingate at Worcester
|
Worcester, MA
|
100%
|
—
|
|
945
|
|
8,770
|
|
9,715
|
|
—
|
|
945
|
|
8,770
|
|
9,715
|
|
(89
|
)
|
1970/1988
|
08/17/17
|
40
|
||||
|
Wingate at West Springfield
|
W. Springfield, MA
|
100%
|
—
|
|
2,022
|
|
7,345
|
|
9,367
|
|
—
|
|
2,022
|
|
7,345
|
|
9,367
|
|
(82
|
)
|
1960/1985
|
08/17/17
|
40
|
||||
|
Wingate at East Longmeadow
|
East Longmeadow, MA
|
100%
|
—
|
|
2,968
|
|
8,957
|
|
11,925
|
|
—
|
|
2,968
|
|
8,957
|
|
11,925
|
|
(101
|
)
|
1985/2005
|
08/17/17
|
40
|
||||
|
Broadway by the Sea
|
Long Beach, CA
|
100%
|
—
|
|
2,939
|
|
11,782
|
|
14,721
|
|
—
|
|
2,939
|
|
11,782
|
|
14,721
|
|
(90
|
)
|
1968/2011
|
09/19/17
|
40
|
||||
|
Coventry Court Health Center
|
Anaheim, CA
|
100%
|
—
|
|
2,044
|
|
14,167
|
|
16,211
|
|
—
|
|
2,044
|
|
14,167
|
|
16,211
|
|
(106
|
)
|
1968/2011
|
09/19/17
|
40
|
||||
|
Fairfield Post-Acute Rehab
|
Fairfield, CA
|
100%
|
—
|
|
586
|
|
23,582
|
|
24,168
|
|
—
|
|
586
|
|
23,582
|
|
24,168
|
|
(164
|
)
|
1966/2006
|
09/19/17
|
40
|
||||
|
Garden View Post-Acute Rehab
|
Baldwin Park, CA
|
100%
|
—
|
|
2,270
|
|
17,063
|
|
19,333
|
|
—
|
|
2,270
|
|
17,063
|
|
19,333
|
|
(125
|
)
|
1970/2015
|
09/19/17
|
40
|
||||
|
Grand Terrace Health Care Center
|
Grand Terrace, CA
|
100%
|
—
|
|
432
|
|
9,382
|
|
9,814
|
|
—
|
|
432
|
|
9,382
|
|
9,814
|
|
(69
|
)
|
1945/2017
|
09/19/17
|
40
|
||||
|
Pacifica Nursing & Rehab Center
|
Pacifica, CA
|
100%
|
—
|
|
1,510
|
|
27,397
|
|
28,907
|
|
—
|
|
1,510
|
|
27,397
|
|
28,907
|
|
(188
|
)
|
1975
|
09/19/17
|
40
|
||||
|
Burien Nursing & Rehab Center
|
Burien, WA
|
100%
|
—
|
|
823
|
|
17,431
|
|
18,254
|
|
—
|
|
823
|
|
17,431
|
|
18,254
|
|
(126
|
)
|
1965/2014
|
09/19/17
|
40
|
||||
|
Park West Care Center
|
Seattle, WA
|
100%
|
—
|
|
4,802
|
|
7,927
|
|
12,729
|
|
—
|
|
4,802
|
|
7,927
|
|
12,729
|
|
(64
|
)
|
1963/2016
|
09/19/17
|
40
|
||||
|
Beachside Nursing Center
|
Huntington Beach, CA
|
100%
|
—
|
|
2,312
|
|
9,885
|
|
12,197
|
|
—
|
|
2,312
|
|
9,885
|
|
12,197
|
|
(73
|
)
|
1965/2010
|
09/19/17
|
40
|
||||
|
Chatsworth Park Health Care
|
Chatsworth, CA
|
100%
|
—
|
|
7,841
|
|
16,916
|
|
24,757
|
|
—
|
|
7,841
|
|
16,916
|
|
24,757
|
|
(130
|
)
|
1976
|
09/19/17
|
40
|
||||
|
Cottonwood Post-Acute Rehab
|
Woodland, CA
|
100%
|
—
|
|
504
|
|
7,369
|
|
7,873
|
|
—
|
|
504
|
|
7,369
|
|
7,873
|
|
(57
|
)
|
1975/2010
|
09/19/17
|
40
|
||||
|
Danville Post-Acute Rehab
|
Danville, CA
|
100%
|
—
|
|
1,491
|
|
17,157
|
|
18,648
|
|
—
|
|
1,491
|
|
17,157
|
|
18,648
|
|
(123
|
)
|
1965
|
09/19/17
|
40
|
||||
|
Lake Balboa Care Center
|
Van Nuys, CA
|
100%
|
—
|
|
2,456
|
|
16,462
|
|
18,918
|
|
—
|
|
2,456
|
|
16,462
|
|
18,918
|
|
(114
|
)
|
1958/2015
|
09/19/17
|
40
|
||||
|
Lomita Post-Acute Care Center
|
Lomita, CA
|
100%
|
—
|
|
2,743
|
|
14,734
|
|
17,477
|
|
—
|
|
2,743
|
|
14,734
|
|
17,477
|
|
(111
|
)
|
1969
|
09/19/17
|
40
|
||||
|
University Post-Acute Rehab
|
Sacramento, CA
|
100%
|
—
|
|
2,846
|
|
17,962
|
|
20,808
|
|
—
|
|
2,846
|
|
17,962
|
|
20,808
|
|
(127
|
)
|
1972
|
09/19/17
|
40
|
||||
|
Issaquah Nursing & Rehab Center
|
Issaquah, WA
|
100%
|
—
|
|
10,125
|
|
7,771
|
|
17,896
|
|
—
|
|
10,125
|
|
7,771
|
|
17,896
|
|
(66
|
)
|
1975/2012
|
09/19/17
|
40
|
||||
|
Alamitos-Belmont Rehab Hospital
|
Long Beach, CA
|
100%
|
—
|
|
3,157
|
|
22,067
|
|
25,224
|
|
—
|
|
3,157
|
|
22,067
|
|
25,224
|
|
(160
|
)
|
1966/2014
|
09/19/17
|
40
|
||||
|
Edgewater Skilled Nursing Center
|
Long Beach, CA
|
100%
|
—
|
|
2,857
|
|
5,878
|
|
8,735
|
|
—
|
|
2,857
|
|
5,878
|
|
8,735
|
|
(46
|
)
|
1952/2013
|
09/19/17
|
40
|
||||
F-66
|
Initial Cost to Company
|
Cost Capitalized Subsequent to Acquisition
|
Gross Amount at which Carried at Close of Period
|
Life on Which Depreciation in Latest Income Statement is Computed
|
||||||||||||||||||||||||
|
Description
|
Location
|
Ownership Percentage
|
Encum- brances
(1)
|
Land
|
Building and Improve- ments
(2)(3)
|
Total
|
Land
|
Building and Improve- ments
(2)(3)
|
Total
|
Accumulated Depreciation and Amortization
|
Original Date of Construction/ Renovation
|
Date Acquired
|
|||||||||||||||
|
Fairmont Rehabilitation Hospital
|
Lodi, CA
|
100%
|
—
|
|
812
|
|
21,059
|
|
21,871
|
|
—
|
|
812
|
|
21,059
|
|
21,871
|
|
(142
|
)
|
1965
|
09/19/17
|
40
|
||||
|
Palm Terrace Care Center
|
Riverside, CA
|
100%
|
—
|
|
1,717
|
|
13,806
|
|
15,523
|
|
—
|
|
1,717
|
|
13,806
|
|
15,523
|
|
(109
|
)
|
1966
|
09/19/17
|
40
|
||||
|
Woodland Nursing & Rehab
|
Woodland, CA
|
100%
|
—
|
|
278
|
|
16,729
|
|
17,007
|
|
—
|
|
278
|
|
16,729
|
|
17,007
|
|
(120
|
)
|
1930/2007
|
09/19/17
|
40
|
||||
|
Park Manor at Bee Cave
|
Bee Cave, TX
|
100%
|
—
|
|
2,107
|
|
10,413
|
|
12,520
|
|
—
|
|
2,104
|
|
10,424
|
|
12,528
|
|
(87
|
)
|
2014
|
12/15/17
|
40
|
||||
|
100,698
|
|
452,641
|
|
3,913,052
|
|
4,365,693
|
|
28,238
|
|
452,372
|
|
3,912,015
|
|
4,364,387
|
|
(209,039
|
)
|
|
|
||||||||
|
Senior Housing - Leased
|
|
|
|
|
|
|
|
|
|
|
|
|
|
|
|
|
|||||||||||
|
Monroe House
|
Moses Lake, WA
|
100%
|
—
|
|
—
|
|
182
|
|
182
|
|
—
|
|
—
|
|
39
|
|
39
|
|
(33
|
)
|
1997
|
11/15/10
|
15
|
||||
|
Forest Hills (ALF)
|
Broken Arrow, OK
|
100%
|
(4)
|
1,803
|
|
3,927
|
|
5,730
|
|
—
|
|
1,803
|
|
3,775
|
|
5,578
|
|
(1,768
|
)
|
2000
|
11/15/10
|
30
|
|||||
|
Langdon Place of Exeter
|
Exeter, NH
|
100%
|
3,166
|
|
571
|
|
7,183
|
|
7,754
|
|
—
|
|
571
|
|
6,323
|
|
6,894
|
|
(2,257
|
)
|
1987
|
11/15/10
|
43
|
||||
|
Langdon Place of Nashua
|
Nashua, NH
|
100%
|
5,224
|
|
—
|
|
5,654
|
|
5,654
|
|
—
|
|
—
|
|
4,840
|
|
4,840
|
|
(1,494
|
)
|
1989
|
11/15/10
|
40
|
||||
|
Langdon Place of Keene
|
Keene, NH
|
100%
|
4,538
|
|
304
|
|
3,992
|
|
4,296
|
|
—
|
|
304
|
|
3,561
|
|
3,865
|
|
(1,451
|
)
|
1995
|
11/15/10
|
46
|
||||
|
Langdon Place of Dover
|
Dover, NH
|
100%
|
3,933
|
|
801
|
|
10,036
|
|
10,837
|
|
—
|
|
801
|
|
9,155
|
|
9,956
|
|
(3,162
|
)
|
1987/2009
|
11/15/10
|
42
|
||||
|
Clipper Harbor
|
Portsmouth, NH
|
100%
|
—
|
|
846
|
|
7,632
|
|
8,478
|
|
—
|
|
846
|
|
6,486
|
|
7,332
|
|
(2,546
|
)
|
1986/2009
|
11/15/10
|
43
|
||||
|
Glen Crest
|
Danbury, CT
|
100%
|
—
|
|
1,356
|
|
6,666
|
|
8,022
|
|
—
|
|
1,356
|
|
6,532
|
|
7,888
|
|
(2,373
|
)
|
1986
|
11/15/10
|
32
|
||||
|
Village at Northrise
|
Las Cruces, NM
|
100%
|
—
|
|
1,432
|
|
6,003
|
|
7,435
|
|
—
|
|
1,432
|
|
5,095
|
|
6,527
|
|
(2,692
|
)
|
1998/1999, 2010
|
11/15/10
|
29
|
||||
|
Age-Well Senior Living
|
Green Bay, WI
|
100%
|
—
|
|
256
|
|
2,262
|
|
2,518
|
|
1,032
|
|
256
|
|
3,294
|
|
3,550
|
|
(1,167
|
)
|
2004/2011
|
11/22/11
|
40
|
||||
|
New Dawn Memory Care
|
Aurora, CO
|
100%
|
—
|
|
2,874
|
|
12,829
|
|
15,703
|
|
—
|
|
2,874
|
|
12,829
|
|
15,703
|
|
(1,825
|
)
|
2009
|
09/20/12
|
40
|
||||
|
Independence Village at Frankenmuth
|
Frankenmuth, MI
|
100%
|
—
|
|
5,027
|
|
20,929
|
|
25,956
|
|
—
|
|
5,027
|
|
20,929
|
|
25,956
|
|
(3,217
|
)
|
1982/2008
|
09/21/12
|
40
|
||||
|
Gulf Pointe Village
|
Rockport, TX
|
100%
|
—
|
|
789
|
|
607
|
|
1,396
|
|
—
|
|
789
|
|
607
|
|
1,396
|
|
(151
|
)
|
1996
|
11/30/12
|
40
|
||||
|
Aspen Ridge Retirement Village
|
Gaylord, MI
|
100%
|
—
|
|
2,024
|
|
5,467
|
|
7,491
|
|
—
|
|
2,024
|
|
5,467
|
|
7,491
|
|
(987
|
)
|
2002
|
12/14/12
|
40
|
||||
|
Green Acres of Cadillac
|
Cadillac, MI
|
100%
|
—
|
|
217
|
|
3,000
|
|
3,217
|
|
—
|
|
218
|
|
3,000
|
|
3,218
|
|
(458
|
)
|
2001/2006
|
12/14/12
|
40
|
||||
|
Green Acres of Greenville
|
Greenville, MI
|
100%
|
—
|
|
684
|
|
5,832
|
|
6,516
|
|
—
|
|
684
|
|
5,832
|
|
6,516
|
|
(887
|
)
|
1999/2001, 2012, 2013
|
12/14/12
|
40
|
||||
|
Green Acres of Manistee
|
Manistee, MI
|
100%
|
—
|
|
952
|
|
2,578
|
|
3,530
|
|
—
|
|
952
|
|
2,578
|
|
3,530
|
|
(433
|
)
|
2002/2017
|
12/14/12
|
40
|
||||
|
Green Acres of Mason
|
Mason, MI
|
100%
|
—
|
|
198
|
|
4,131
|
|
4,329
|
|
—
|
|
198
|
|
4,131
|
|
4,329
|
|
(657
|
)
|
2009/2012
|
12/14/12
|
40
|
||||
|
Nottingham Place
|
Midland, MI
|
100%
|
—
|
|
744
|
|
1,745
|
|
2,489
|
|
400
|
|
744
|
|
2,145
|
|
2,889
|
|
(324
|
)
|
1995/2015
|
12/14/12
|
40
|
||||
|
Royal View
|
Mecosta, MI
|
100%
|
—
|
|
307
|
|
2,477
|
|
2,784
|
|
—
|
|
307
|
|
2,477
|
|
2,784
|
|
(431
|
)
|
2001
|
12/14/12
|
40
|
||||
|
Tawas Village
|
East Tawas, MI
|
100%
|
—
|
|
258
|
|
3,713
|
|
3,971
|
|
45
|
|
258
|
|
3,758
|
|
4,016
|
|
(769
|
)
|
2005
|
12/14/12
|
40
|
||||
|
Turning Brook
|
Alpena, MI
|
100%
|
—
|
|
546
|
|
13,139
|
|
13,685
|
|
—
|
|
546
|
|
13,139
|
|
13,685
|
|
(1,796
|
)
|
2006/2008, 2010
|
12/14/12
|
40
|
||||
|
Greenfield of Woodstock
|
Woodstock, VA
|
100%
|
—
|
|
597
|
|
5,465
|
|
6,062
|
|
—
|
|
597
|
|
5,465
|
|
6,062
|
|
(716
|
)
|
1996/2015
|
06/28/13
|
40
|
||||
|
Nye Square
|
Fremont, NE
|
100%
|
—
|
|
504
|
|
17,670
|
|
18,174
|
|
—
|
|
504
|
|
17,670
|
|
18,174
|
|
(1,983
|
)
|
1989/2002
|
02/14/14
|
40
|
||||
|
The Meadows
|
Norfolk, NE
|
100%
|
—
|
|
217
|
|
9,906
|
|
10,123
|
|
—
|
|
217
|
|
9,906
|
|
10,123
|
|
(1,158
|
)
|
1989/1991, 1994
|
02/14/14
|
40
|
||||
|
Park Place
|
Fort Wayne, IN
|
100%
|
13,508
|
|
2,300
|
|
21,115
|
|
23,415
|
|
2,747
|
|
2,300
|
|
23,861
|
|
26,161
|
|
(2,751
|
)
|
2011/2016
|
04/30/14
|
40
|
||||
|
Parkview in Allen
|
Allen, TX
|
100%
|
—
|
|
2,190
|
|
45,767
|
|
47,957
|
|
—
|
|
2,190
|
|
45,767
|
|
47,957
|
|
(4,207
|
)
|
2004/2010
|
09/25/14
|
40
|
||||
F-67
|
Initial Cost to Company
|
Cost Capitalized Subsequent to Acquisition
|
Gross Amount at which Carried at Close of Period
|
Life on Which Depreciation in Latest Income Statement is Computed
|
|||||||||||||||||||||||||||||||||
|
Description
|
Location
|
Ownership Percentage
|
Encum- brances
(1)
|
Land
|
Building and Improve- ments
(2)(3)
|
Total
|
Land
|
Building and Improve- ments
(2)(3)
|
Total
|
Accumulated Depreciation and Amortization
|
Original Date of Construction/ Renovation
|
Date Acquired
|
||||||||||||||||||||||||
|
The Atrium At Gainesville
|
Gainesville, FL
|
100%
|
—
|
|
2,139
|
|
44,789
|
|
46,928
|
|
—
|
|
2,139
|
|
44,789
|
|
46,928
|
|
(4,332
|
)
|
1986/2013, 2015
|
09/25/14
|
40
|
|||||||||||||
|
The Chateau
|
McKinney, TX
|
100%
|
—
|
|
2,760
|
|
44,397
|
|
47,157
|
|
—
|
|
2,760
|
|
44,397
|
|
47,157
|
|
(4,135
|
)
|
2006/2010
|
09/25/14
|
40
|
|||||||||||||
|
Gardens At Wakefield Plantation
|
Raleigh, NC
|
100%
|
—
|
|
2,344
|
|
37,506
|
|
39,850
|
|
—
|
|
2,344
|
|
37,506
|
|
39,850
|
|
(3,388
|
)
|
2002/2014
|
09/25/14
|
40
|
|||||||||||||
|
Las Brisas
|
San Luis Obispo, CA
|
100%
|
—
|
|
4,992
|
|
30,909
|
|
35,901
|
|
—
|
|
4,992
|
|
30,909
|
|
35,901
|
|
(2,901
|
)
|
1987/2006, 2015
|
09/25/14
|
40
|
|||||||||||||
|
Creekside Terrace
|
Winston-Salem, NC
|
100%
|
—
|
|
2,995
|
|
24,428
|
|
27,423
|
|
—
|
|
2,995
|
|
24,428
|
|
27,423
|
|
(2,338
|
)
|
2001
|
09/25/14
|
40
|
|||||||||||||
|
Colonial Village
|
Longview, TX
|
100%
|
—
|
|
805
|
|
26,498
|
|
27,303
|
|
—
|
|
805
|
|
26,498
|
|
27,303
|
|
(2,501
|
)
|
1985/2010
|
09/25/14
|
40
|
|||||||||||||
|
Garden Village
|
Kansas City, MO
|
100%
|
—
|
|
1,325
|
|
20,510
|
|
21,835
|
|
—
|
|
1,325
|
|
20,510
|
|
21,835
|
|
(2,039
|
)
|
1983
|
09/25/14
|
40
|
|||||||||||||
|
Desert Rose
|
Yuma, AZ
|
100%
|
—
|
|
530
|
|
21,775
|
|
22,305
|
|
—
|
|
530
|
|
21,775
|
|
22,305
|
|
(2,077
|
)
|
1996/2014
|
09/25/14
|
40
|
|||||||||||||
|
Windland South
|
Nashville, TN
|
100%
|
—
|
|
1,996
|
|
19,368
|
|
21,364
|
|
—
|
|
1,996
|
|
19,368
|
|
21,364
|
|
(1,973
|
)
|
1986/2000
|
09/25/14
|
40
|
|||||||||||||
|
Cedar Woods
|
Branford, CT
|
100%
|
—
|
|
2,403
|
|
18,821
|
|
21,224
|
|
—
|
|
2,403
|
|
18,821
|
|
21,224
|
|
(1,795
|
)
|
1987
|
09/25/14
|
40
|
|||||||||||||
|
Virginian
|
Richmond, VA
|
100%
|
—
|
|
1,080
|
|
19,545
|
|
20,625
|
|
—
|
|
1,080
|
|
19,545
|
|
20,625
|
|
(1,889
|
)
|
1989/2007
|
09/25/14
|
40
|
|||||||||||||
|
Monarch Estates
|
Auburn, AL
|
100%
|
—
|
|
3,209
|
|
17,326
|
|
20,535
|
|
—
|
|
3,209
|
|
17,326
|
|
20,535
|
|
(1,720
|
)
|
2001
|
09/25/14
|
40
|
|||||||||||||
|
Village At The Falls
|
Menomonee Falls, WI
|
100%
|
—
|
|
1,477
|
|
18,778
|
|
20,255
|
|
—
|
|
1,477
|
|
18,778
|
|
20,255
|
|
(1,861
|
)
|
2005/2006, 2007/2011
|
09/25/14
|
40
|
|||||||||||||
|
Holiday At The Atrium
|
Glenville, NY
|
100%
|
—
|
|
978
|
|
18,257
|
|
19,235
|
|
—
|
|
978
|
|
18,257
|
|
19,235
|
|
(1,764
|
)
|
2001/2014
|
09/25/14
|
40
|
|||||||||||||
|
Lake Ridge Village
|
Eustis, FL
|
100%
|
—
|
|
1,152
|
|
17,523
|
|
18,675
|
|
—
|
|
1,152
|
|
17,523
|
|
18,675
|
|
(1,729
|
)
|
1984/1988, 2013
|
09/25/14
|
40
|
|||||||||||||
|
Heritage Village
|
Mcallen, TX
|
100%
|
—
|
|
4,092
|
|
13,823
|
|
17,915
|
|
—
|
|
4,092
|
|
13,823
|
|
17,915
|
|
(1,415
|
)
|
1988
|
09/25/14
|
40
|
|||||||||||||
|
Madison Meadows
|
Phoenix, AZ
|
100%
|
—
|
|
2,567
|
|
12,029
|
|
14,596
|
|
—
|
|
2,567
|
|
12,029
|
|
14,596
|
|
(1,262
|
)
|
1986
|
09/25/14
|
40
|
|||||||||||||
|
South Wind Heights
|
Jonesboro, AR
|
100%
|
—
|
|
1,782
|
|
11,244
|
|
13,026
|
|
—
|
|
1,782
|
|
11,244
|
|
13,026
|
|
(1,162
|
)
|
1999
|
09/25/14
|
40
|
|||||||||||||
|
Harrison Regent
|
Ogden, UT
|
100%
|
—
|
|
794
|
|
10,873
|
|
11,667
|
|
—
|
|
794
|
|
10,873
|
|
11,667
|
|
(1,081
|
)
|
1985/2016
|
09/25/14
|
40
|
|||||||||||||
|
Avalon MC - Boat Club
|
Fort Worth, TX
|
100%
|
—
|
|
359
|
|
8,126
|
|
8,485
|
|
—
|
|
359
|
|
8,126
|
|
8,485
|
|
(758
|
)
|
1996/2015
|
09/29/14
|
40
|
|||||||||||||
|
Avalon MC - 7200
|
Arlington, TX
|
100%
|
—
|
|
123
|
|
4,914
|
|
5,037
|
|
—
|
|
123
|
|
4,914
|
|
5,037
|
|
(459
|
)
|
1988/2014
|
09/29/14
|
40
|
|||||||||||||
|
Avalon MC - 7204
|
Arlington, TX
|
100%
|
—
|
|
215
|
|
4,821
|
|
5,036
|
|
—
|
|
215
|
|
4,822
|
|
5,037
|
|
(453
|
)
|
1988/2014
|
09/29/14
|
40
|
|||||||||||||
|
Avalon MC - 7140
|
Arlington, TX
|
100%
|
—
|
|
143
|
|
6,653
|
|
6,796
|
|
—
|
|
144
|
|
6,653
|
|
6,797
|
|
(607
|
)
|
2011
|
09/29/14
|
40
|
|||||||||||||
|
Delaney Creek Lodge
|
Brandon, FL
|
100%
|
—
|
|
1,283
|
|
8,424
|
|
9,707
|
|
35
|
|
1,284
|
|
8,459
|
|
9,743
|
|
(856
|
)
|
1999/2016
|
10/01/14
|
40
|
|||||||||||||
|
Nature Coast Lodge
|
Lecanto, FL
|
100%
|
—
|
|
1,031
|
|
5,577
|
|
6,608
|
|
46
|
|
1,031
|
|
5,624
|
|
6,655
|
|
(649
|
)
|
1997/2016
|
10/01/14
|
40
|
|||||||||||||
|
West Winds
|
Zephyrhills, FL
|
100%
|
—
|
|
1,688
|
|
9,098
|
|
10,786
|
|
55
|
|
1,688
|
|
9,155
|
|
10,843
|
|
(1,016
|
)
|
2008/2016
|
10/01/14
|
40
|
|||||||||||||
|
Capital Place
|
Olympia, WA
|
100%
|
—
|
|
2,477
|
|
23,767
|
|
26,244
|
|
—
|
|
2,477
|
|
23,767
|
|
26,244
|
|
(2,245
|
)
|
1986/2016
|
10/07/14
|
40
|
|||||||||||||
|
Tudor Heights
|
Baltimore, MD
|
100%
|
—
|
|
561
|
|
4,865
|
|
5,426
|
|
1,139
|
|
561
|
|
6,006
|
|
6,567
|
|
(693
|
)
|
1920/1997, 2015
|
10/14/14
|
40
|
|||||||||||||
|
New Haven AL
|
Schertz, TX
|
100%
|
—
|
|
1,174
|
|
6,298
|
|
7,472
|
|
—
|
|
1,174
|
|
6,298
|
|
7,472
|
|
(535
|
)
|
2012
|
04/10/15
|
40
|
|||||||||||||
|
Life's Journey of Mattoon
|
Mattoon, IL
|
100%
|
—
|
|
812
|
|
6,796
|
|
7,608
|
|
63
|
|
812
|
|
6,859
|
|
7,671
|
|
(529
|
)
|
2006/2008
|
09/01/15
|
40
|
|||||||||||||
|
Life's Journey of Pana
|
Pana, IL
|
100%
|
—
|
|
154
|
|
2,098
|
|
2,252
|
|
—
|
|
154
|
|
2,098
|
|
2,252
|
|
(185
|
)
|
1998/2012
|
09/01/15
|
40
|
|||||||||||||
|
Life's Journey of Taylorville
|
Taylorville, IL
|
100%
|
—
|
|
267
|
|
5,201
|
|
5,468
|
|
50
|
|
267
|
|
5,252
|
|
5,519
|
|
(406
|
)
|
2012/2014
|
09/01/15
|
40
|
|||||||||||||
|
Life's Journey Estates
|
Mattoon, IL
|
100%
|
—
|
|
134
|
|
659
|
|
793
|
|
—
|
|
134
|
|
659
|
|
793
|
|
(63
|
)
|
1997
|
09/01/15
|
40
|
|||||||||||||
|
Life's Journey of Paris
|
Paris, IL
|
100%
|
—
|
|
132
|
|
3,090
|
|
3,222
|
|
—
|
|
132
|
|
3,090
|
|
3,222
|
|
(217
|
)
|
1998/2013
|
09/01/15
|
40
|
|||||||||||||
F-68
|
Initial Cost to Company
|
Cost Capitalized Subsequent to Acquisition
|
Gross Amount at which Carried at Close of Period
|
Life on Which Depreciation in Latest Income Statement is Computed
|
|||||||||||||||||||||||||||||||||
|
Description
|
Location
|
Ownership Percentage
|
Encum- brances
(1)
|
Land
|
Building and Improve- ments
(2)(3)
|
Total
|
Land
|
Building and Improve- ments
(2)(3)
|
Total
|
Accumulated Depreciation and Amortization
|
Original Date of Construction/ Renovation
|
Date Acquired
|
||||||||||||||||||||||||
|
Ashley Pointe
|
Lake Stevens, WA
|
100%
|
—
|
|
1,559
|
|
9,059
|
|
10,618
|
|
—
|
|
1,559
|
|
9,059
|
|
10,618
|
|
(627
|
)
|
1998/2012
|
09/17/15
|
40
|
|||||||||||||
|
Farmington Square Eugene
|
Eugene, OR
|
100%
|
—
|
|
1,428
|
|
16,138
|
|
17,566
|
|
—
|
|
1,428
|
|
16,138
|
|
17,566
|
|
(989
|
)
|
1996/1997, 2011
|
09/17/15
|
40
|
|||||||||||||
|
Farmington Square Tualatin
|
Tualatin, OR
|
100%
|
—
|
|
527
|
|
14,659
|
|
15,186
|
|
—
|
|
527
|
|
14,659
|
|
15,186
|
|
(904
|
)
|
1995/1997
|
09/17/15
|
40
|
|||||||||||||
|
Farmington Square of Salem
|
Salem, OR
|
100%
|
—
|
|
1,074
|
|
19,421
|
|
20,495
|
|
—
|
|
1,074
|
|
19,421
|
|
20,495
|
|
(1,236
|
)
|
1989/1995
|
09/17/15
|
40
|
|||||||||||||
|
Colorado Springs
|
Colorado Springs, CO
|
100%
|
—
|
|
1,210
|
|
9,490
|
|
10,700
|
|
—
|
|
1,210
|
|
9,490
|
|
10,700
|
|
(599
|
)
|
2013
|
11/16/15
|
40
|
|||||||||||||
|
Sun City West
|
Sun City West, AZ
|
100%
|
—
|
|
930
|
|
9,170
|
|
10,100
|
|
245
|
|
930
|
|
9,415
|
|
10,345
|
|
(414
|
)
|
2012
|
07/01/16
|
40
|
|||||||||||||
|
Poet's Walk at Fredericksburg
|
Fredericksburg, VA
|
100%
|
—
|
|
1,379
|
|
21,209
|
|
22,588
|
|
—
|
|
1,379
|
|
21,209
|
|
22,588
|
|
(929
|
)
|
2016
|
07/14/16
|
40
|
|||||||||||||
|
Poet's Walk at Chandler Oaks
|
Round Rock, TX
|
100%
|
—
|
|
679
|
|
13,642
|
|
14,321
|
|
—
|
|
679
|
|
13,642
|
|
14,321
|
|
(580
|
)
|
2016
|
08/01/16
|
40
|
|||||||||||||
|
The Montecito Santa Fe
|
Santa Fe, NM
|
100%
|
—
|
|
2,536
|
|
19,441
|
|
21,977
|
|
—
|
|
2,633
|
|
20,197
|
|
22,830
|
|
(740
|
)
|
2006
|
09/23/16
|
40
|
|||||||||||||
|
The Golden Crest
|
Franklin, NH
|
100%
|
—
|
|
292
|
|
6,889
|
|
7,181
|
|
97
|
|
292
|
|
6,996
|
|
7,288
|
|
(255
|
)
|
1988
|
11/30/16
|
40
|
|||||||||||||
|
Poet's Walk at Henderson
|
Henderson, NV
|
100%
|
—
|
|
1,430
|
|
21,850
|
|
23,280
|
|
—
|
|
1,430
|
|
21,862
|
|
23,292
|
|
(675
|
)
|
2016
|
12/01/16
|
40
|
|||||||||||||
|
Kruse Village
|
Brenham, TX
|
100%
|
—
|
|
476
|
|
11,912
|
|
12,388
|
|
—
|
|
476
|
|
11,922
|
|
12,398
|
|
(421
|
)
|
1991
|
12/02/16
|
40
|
|||||||||||||
|
Poet's Walk of Cedar Parks
|
Cedar Park, TX
|
100%
|
—
|
|
1,035
|
|
13,127
|
|
14,162
|
|
—
|
|
1,035
|
|
13,127
|
|
14,162
|
|
(226
|
)
|
2017
|
06/01/17
|
40
|
|||||||||||||
|
Avamere Court at Keizer
|
Keizer, OR
|
100%
|
—
|
|
1,220
|
|
31,783
|
|
33,003
|
|
—
|
|
1,220
|
|
31,783
|
|
33,003
|
|
(286
|
)
|
1970
|
08/17/17
|
40
|
|||||||||||||
|
Arbor Court Retirement Community at Alvamar
|
Lawrence, KS
|
100%
|
—
|
|
584
|
|
4,431
|
|
5,015
|
|
—
|
|
584
|
|
4,431
|
|
5,015
|
|
(45
|
)
|
1995/2014
|
08/17/17
|
40
|
|||||||||||||
|
Arbor Court Retirement Community at Salina
|
Salina, KS
|
100%
|
—
|
|
584
|
|
3,020
|
|
3,604
|
|
—
|
|
584
|
|
3,020
|
|
3,604
|
|
(30
|
)
|
1989/2014
|
08/17/17
|
40
|
|||||||||||||
|
Arbor Court Retirement Community at Topeka
|
Topeka, KS
|
100%
|
—
|
|
313
|
|
5,492
|
|
5,805
|
|
—
|
|
313
|
|
5,492
|
|
5,805
|
|
(51
|
)
|
1986/2014
|
08/17/17
|
40
|
|||||||||||||
|
Summit West
|
Indianapolis, IN
|
100%
|
—
|
|
996
|
|
4,401
|
|
5,397
|
|
—
|
|
996
|
|
4,401
|
|
5,397
|
|
(46
|
)
|
1998
|
08/17/17
|
40
|
|||||||||||||
|
Crownpointe of Carmel
|
Carmel, IN
|
100%
|
—
|
|
1,107
|
|
1,532
|
|
2,639
|
|
—
|
|
1,107
|
|
1,532
|
|
2,639
|
|
(16
|
)
|
1998
|
08/17/17
|
40
|
|||||||||||||
|
Crown Pointe Senior Living Community
|
Greensburg, IN
|
100%
|
—
|
|
396
|
|
7,425
|
|
7,821
|
|
—
|
|
396
|
|
7,425
|
|
7,821
|
|
(67
|
)
|
1999
|
08/17/17
|
40
|
|||||||||||||
|
Lakeview Commons Assisted Living
|
Monticello, IN
|
100%
|
—
|
|
213
|
|
1,282
|
|
1,495
|
|
—
|
|
213
|
|
1,282
|
|
1,495
|
|
(11
|
)
|
1999
|
08/17/17
|
40
|
|||||||||||||
|
Azalea Hills
|
Floyds Knobs, IN
|
100%
|
—
|
|
2,256
|
|
14,118
|
|
16,374
|
|
—
|
|
2,256
|
|
14,118
|
|
16,374
|
|
(128
|
)
|
2008
|
08/17/17
|
40
|
|||||||||||||
|
Lakeside ALF
|
San Antonio, TX
|
100%
|
—
|
|
1,158
|
|
2,536
|
|
3,694
|
|
—
|
|
1,158
|
|
2,536
|
|
3,694
|
|
(33
|
)
|
2013
|
08/17/17
|
40
|
|||||||||||||
|
Heritage Oaks Retirement Village
|
Corsicana, TX
|
100%
|
—
|
|
1,300
|
|
14,406
|
|
15,706
|
|
—
|
|
1,300
|
|
14,406
|
|
15,706
|
|
(139
|
)
|
1996/2007
|
08/17/17
|
40
|
|||||||||||||
|
Aspen Grove Assisted Living
|
Sturgis, SD
|
100%
|
—
|
|
555
|
|
6,487
|
|
7,042
|
|
—
|
|
555
|
|
6,487
|
|
7,042
|
|
(66
|
)
|
2013
|
08/17/17
|
40
|
|||||||||||||
|
Maurice Griffith Manor Living Center
|
Casper, WY
|
100%
|
—
|
|
294
|
|
72
|
|
366
|
|
—
|
|
294
|
|
72
|
|
366
|
|
(1
|
)
|
1984/1985
|
08/17/17
|
40
|
|||||||||||||
|
The Peaks at Old Laramie Trail (Lafayette)
|
Lafayette, CO
|
100%
|
—
|
|
1,085
|
|
19,243
|
|
20,328
|
|
—
|
|
1,082
|
|
19,240
|
|
20,322
|
|
(130
|
)
|
2016
|
12/15/17
|
40
|
|||||||||||||
|
30,369
|
|
104,386
|
|
1,060,928
|
|
1,165,314
|
|
5,954
|
|
104,483
|
|
1,062,204
|
|
1,166,687
|
|
(102,370
|
)
|
|||||||||||||||||||
|
Senior Housing - Managed
|
||||||||||||||||||||||||||||||||||||
|
Stoney River Marshfield
|
Marshfield, WI
|
100%
|
—
|
|
574
|
|
8,733
|
|
9,307
|
|
76
|
|
574
|
|
8,809
|
|
9,383
|
|
(1,282
|
)
|
2010
|
12/18/12
|
40
|
|||||||||||||
|
Kensington Court
|
Windsor, ON
|
100%
|
—
|
|
1,360
|
|
16,855
|
|
18,215
|
|
174
|
|
1,457
|
|
18,223
|
|
19,680
|
|
(1,363
|
)
|
1998
|
06/11/15
|
40
|
|||||||||||||
F-69
|
Initial Cost to Company
|
Cost Capitalized Subsequent to Acquisition
|
Gross Amount at which Carried at Close of Period
|
Life on Which Depreciation in Latest Income Statement is Computed
|
|||||||||||||||||||||||||||||||||
|
Description
|
Location
|
Ownership Percentage
|
Encum- brances
(1)
|
Land
|
Building and Improve- ments
(2)(3)
|
Total
|
Land
|
Building and Improve- ments
(2)(3)
|
Total
|
Accumulated Depreciation and Amortization
|
Original Date of Construction/ Renovation
|
Date Acquired
|
||||||||||||||||||||||||
|
Masonville Manor
|
London, ON
|
100%
|
—
|
|
960
|
|
19,056
|
|
20,016
|
|
196
|
|
1,028
|
|
20,601
|
|
21,629
|
|
(1,507
|
)
|
1998/2015
|
06/11/15
|
40
|
|||||||||||||
|
Okanagan Chateau
|
Kelowna, BC
|
100%
|
—
|
|
2,321
|
|
8,308
|
|
10,629
|
|
167
|
|
2,485
|
|
9,064
|
|
11,549
|
|
(755
|
)
|
1990
|
06/11/15
|
40
|
|||||||||||||
|
Court at Laurelwood
|
Waterloo, ON
|
100%
|
—
|
|
1,823
|
|
22,135
|
|
23,958
|
|
86
|
|
1,952
|
|
23,789
|
|
25,741
|
|
(1,736
|
)
|
2005/2015
|
06/11/15
|
40
|
|||||||||||||
|
Fairwoods Lodge
|
Sarnia, ON
|
100%
|
—
|
|
1,187
|
|
20,346
|
|
21,533
|
|
109
|
|
1,271
|
|
21,897
|
|
23,168
|
|
(1,602
|
)
|
2000
|
06/11/15
|
40
|
|||||||||||||
|
The Shores
|
Kamloops, BC
|
100%
|
5,473
|
|
679
|
|
8,024
|
|
8,703
|
|
26
|
|
727
|
|
8,618
|
|
9,345
|
|
(670
|
)
|
1992/2014
|
06/11/15
|
40
|
|||||||||||||
|
Orchard Valley
|
Vernon, BC
|
100%
|
7,286
|
|
843
|
|
10,724
|
|
11,567
|
|
18
|
|
289
|
|
11,502
|
|
11,791
|
|
(842
|
)
|
1990/2008
|
06/11/15
|
40
|
|||||||||||||
|
Cherry Park
|
Penticton, BC
|
100%
|
5,246
|
|
763
|
|
6,771
|
|
7,534
|
|
32
|
|
817
|
|
7,283
|
|
8,100
|
|
(564
|
)
|
1990/1991, 2014
|
06/11/15
|
40
|
|||||||||||||
|
Birmingham Lodge
|
Mount Forest, ON
|
100%
|
—
|
|
143
|
|
2,402
|
|
2,545
|
|
72
|
|
155
|
|
2,640
|
|
2,795
|
|
(292
|
)
|
1974/1976/1980
|
06/11/15
|
40
|
|||||||||||||
|
Maison Senior Living
|
Calgary, AB
|
100%
|
—
|
|
3,908
|
|
20,996
|
|
24,904
|
|
175
|
|
4,185
|
|
22,659
|
|
26,844
|
|
(1,375
|
)
|
2013
|
09/17/15
|
40
|
|||||||||||||
|
Ramsey
|
Ramsey, MN
|
100%
|
—
|
|
1,182
|
|
13,280
|
|
14,462
|
|
—
|
|
1,182
|
|
13,280
|
|
14,462
|
|
(100
|
)
|
2015
|
10/06/17
|
40
|
|||||||||||||
|
Marshfield II
|
Marshfield, WI
|
100%
|
—
|
|
500
|
|
4,134
|
|
4,634
|
|
—
|
|
500
|
|
4,133
|
|
4,633
|
|
(37
|
)
|
2014
|
10/06/17
|
40
|
|||||||||||||
|
18,005
|
|
16,243
|
|
161,764
|
|
178,007
|
|
1,131
|
|
16,622
|
|
172,498
|
|
189,120
|
|
(12,125
|
)
|
|||||||||||||||||||
|
Specialty Hospitals and Other
|
||||||||||||||||||||||||||||||||||||
|
Texas Regional Medical Center
|
Sunnyvale, TX
|
100%
|
—
|
|
4,020
|
|
57,620
|
|
61,640
|
|
—
|
|
4,020
|
|
57,620
|
|
61,640
|
|
(12,234
|
)
|
2009
|
05/03/11
|
40
|
|||||||||||||
|
Baylor Orthopedic Spine Hospital at Arlington
|
Arlington, TX
|
100%
|
—
|
|
—
|
|
44,217
|
|
44,217
|
|
—
|
|
—
|
|
44,217
|
|
44,217
|
|
(379
|
)
|
2009/2016
|
08/17/17
|
40
|
|||||||||||||
|
Touchstone Neurorecovery Center
|
Conroe, TX
|
100%
|
—
|
|
2,935
|
|
25,003
|
|
27,938
|
|
—
|
|
2,935
|
|
25,003
|
|
27,938
|
|
(242
|
)
|
1992
|
08/17/17
|
40
|
|||||||||||||
|
HealthBridge Children's Hospital (Houston)
|
Houston, TX
|
100%
|
—
|
|
3,001
|
|
14,581
|
|
17,582
|
|
—
|
|
3,001
|
|
14,581
|
|
17,582
|
|
(127
|
)
|
1999/2009
|
08/17/17
|
40
|
|||||||||||||
|
Nexus Speciality Hospital - Woodlands Campus
|
Spring, TX
|
100%
|
—
|
|
1,319
|
|
15,153
|
|
16,472
|
|
—
|
|
1,319
|
|
15,153
|
|
16,472
|
|
(132
|
)
|
1995/1998
|
08/17/17
|
40
|
|||||||||||||
|
HealthBridge Children's Hospital (Orange)
|
Orange, CA
|
100%
|
—
|
|
2,060
|
|
5,538
|
|
7,598
|
|
—
|
|
2,060
|
|
5,538
|
|
7,598
|
|
(50
|
)
|
2000
|
08/17/17
|
40
|
|||||||||||||
|
ResCare Tangram - Texas Hill Country School
|
Maxwell, TX
|
100%
|
—
|
|
902
|
|
2,384
|
|
3,286
|
|
—
|
|
902
|
|
2,384
|
|
3,286
|
|
(24
|
)
|
1993
|
08/17/17
|
40
|
|||||||||||||
|
ResCare Tangram - Chaparral
|
Maxwell, TX
|
100%
|
—
|
|
901
|
|
1,198
|
|
2,099
|
|
—
|
|
901
|
|
1,198
|
|
2,099
|
|
(15
|
)
|
1994/2009
|
08/17/17
|
40
|
|||||||||||||
|
ResCare Tangram - Sierra Verde & Roca Vista
|
Maxwell, TX
|
100%
|
—
|
|
456
|
|
2,632
|
|
3,088
|
|
—
|
|
456
|
|
2,632
|
|
3,088
|
|
(25
|
)
|
1992
|
08/17/17
|
40
|
|||||||||||||
|
ResCare Tangram - 618 W. Hutchinson
|
San Marcos, TX
|
100%
|
—
|
|
51
|
|
359
|
|
410
|
|
—
|
|
51
|
|
359
|
|
410
|
|
(4
|
)
|
1869
|
08/17/17
|
40
|
|||||||||||||
|
ResCare Tangram - Ranch
|
Seguin, TX
|
100%
|
—
|
|
539
|
|
2,627
|
|
3,166
|
|
—
|
|
539
|
|
2,627
|
|
3,166
|
|
(32
|
)
|
1989
|
08/17/17
|
40
|
|||||||||||||
|
ResCare Tangram - Mesquite
|
Seguin, TX
|
100%
|
—
|
|
228
|
|
3,407
|
|
3,635
|
|
—
|
|
228
|
|
3,407
|
|
3,635
|
|
(33
|
)
|
1985/1991
|
08/17/17
|
40
|
|||||||||||||
|
ResCare Tangram - Hacienda
|
Kingsbury, TX
|
100%
|
—
|
|
104
|
|
2,788
|
|
2,892
|
|
—
|
|
104
|
|
2,788
|
|
2,892
|
|
(25
|
)
|
1990/2012
|
08/17/17
|
40
|
|||||||||||||
|
ResCare Tangram - Loma Linda
|
Seguin, TX
|
100%
|
—
|
|
52
|
|
805
|
|
857
|
|
—
|
|
52
|
|
805
|
|
857
|
|
(8
|
)
|
1970
|
08/17/17
|
40
|
|||||||||||||
|
Aurora Chicago Lakeshore Hospital
|
Chicago, IL
|
100%
|
—
|
|
8,574
|
|
39,732
|
|
48,306
|
|
—
|
|
8,574
|
|
39,732
|
|
48,306
|
|
(368
|
)
|
1992/2011
|
08/17/17
|
40
|
|||||||||||||
|
Aurora Arizona West
|
Glendale, AZ
|
100%
|
—
|
|
1,501
|
|
67,046
|
|
68,547
|
|
—
|
|
1,501
|
|
67,046
|
|
68,547
|
|
(586
|
)
|
1996/2013
|
08/17/17
|
40
|
|||||||||||||
|
Aurora Arizona East
|
Tempe, AZ
|
100%
|
—
|
|
3,137
|
|
50,073
|
|
53,210
|
|
—
|
|
3,137
|
|
50,073
|
|
53,210
|
|
(448
|
)
|
2001/2016
|
08/17/17
|
40
|
|||||||||||||
F-70
|
Initial Cost to Company
|
Cost Capitalized Subsequent to Acquisition
|
Gross Amount at which Carried at Close of Period
|
Life on Which Depreciation in Latest Income Statement is Computed
|
|||||||||||||||||||||||||||||||||
|
Description
|
Location
|
Ownership Percentage
|
Encum- brances
(1)
|
Land
|
Building and Improve- ments
(2)(3)
|
Total
|
Land
|
Building and Improve- ments
(2)(3)
|
Total
|
Accumulated Depreciation and Amortization
|
Original Date of Construction/ Renovation
|
Date Acquired
|
||||||||||||||||||||||||
|
Aurora Charter Oak Hospital
|
Covina, CA
|
100%
|
—
|
|
23,472
|
|
71,542
|
|
95,014
|
|
—
|
|
23,472
|
|
71,542
|
|
95,014
|
|
(655
|
)
|
1974/2011
|
08/17/17
|
40
|
|||||||||||||
|
Aurora Vista del Mar Hospital
|
Ventura, CA
|
100%
|
—
|
|
8,089
|
|
43,645
|
|
51,734
|
|
—
|
|
8,089
|
|
43,645
|
|
51,734
|
|
(431
|
)
|
1984
|
08/17/17
|
40
|
|||||||||||||
|
Aurora San Diego Hospital
|
San Diego, CA
|
100%
|
—
|
|
8,403
|
|
55,015
|
|
63,418
|
|
—
|
|
8,403
|
|
55,015
|
|
63,418
|
|
(505
|
)
|
1988/2017
|
08/17/17
|
40
|
|||||||||||||
|
Gateway Rehabilitation Hospital at Florence
|
Florence, KY
|
100%
|
—
|
|
3,866
|
|
26,447
|
|
30,313
|
|
—
|
|
3,866
|
|
26,447
|
|
30,313
|
|
(231
|
)
|
2000
|
08/17/17
|
40
|
|||||||||||||
|
Highlands Regional Rehabilitation Hospital
|
El Paso, TX
|
100%
|
—
|
|
2,009
|
|
6,639
|
|
8,648
|
|
—
|
|
2,008
|
|
6,638
|
|
8,646
|
|
(66
|
)
|
1999/2009
|
08/17/17
|
40
|
|||||||||||||
|
—
|
|
75,619
|
|
538,451
|
|
614,070
|
|
—
|
|
75,618
|
|
538,450
|
|
614,068
|
|
(16,620
|
)
|
|||||||||||||||||||
|
Multi-property Indebtedness
|
|
|
110,130
|
|
—
|
|
—
|
|
—
|
|
—
|
|
—
|
|
—
|
|
—
|
|
—
|
|
|
|
||||||||||||||
|
|
|
|
259,202
|
|
648,889
|
|
5,674,195
|
|
6,323,084
|
|
35,323
|
|
649,095
|
|
5,685,167
|
|
6,334,262
|
|
(340,154
|
)
|
|
|
||||||||||||||
|
Corporate Assets
|
|
|
—
|
|
—
|
|
136
|
|
136
|
|
457
|
|
—
|
|
593
|
|
593
|
|
(269
|
)
|
|
|
||||||||||||||
|
|
|
|
$
|
259,202
|
|
$
|
648,889
|
|
$
|
5,674,331
|
|
$
|
6,323,220
|
|
$
|
35,780
|
|
$
|
649,095
|
|
$
|
5,685,760
|
|
$
|
6,334,855
|
|
$
|
(340,423
|
)
|
|
|
|||||
|
(1)
|
Encumbrances do not include deferred financing costs, net of
$2.8 million
as of
December 31, 2017
.
|
|
(2)
|
Building and building improvements include land improvements and furniture and equipment.
|
|
(3)
|
The aggregate cost of real estate for federal income tax purposes was
$5.1 billion
.
|
|
(4)
|
Property serves as collateral for secured debt totaling
$11.6 million
as of
December 31, 2017
.
|
|
(5)
|
Property serves as collateral for secured debt totaling
$98.5 million
as of
December 31, 2017
.
|
F-71
SCHEDULE III
REAL ESTATE ASSETS AND ACCUMULATED DEPRECIATION
(dollars in thousands)
|
Year Ended December 31,
|
|||||||||||
|
2017
|
2016
|
2015
|
|||||||||
|
Real estate:
|
|
||||||||||
|
Balance at the beginning of the year
|
$
|
2,292,751
|
|
$
|
2,277,457
|
|
$
|
1,831,799
|
|
||
|
Acquisitions
|
4,145,977
|
|
150,782
|
|
482,125
|
|
|||||
|
Real estate acquired through loans receivable foreclosure
|
19,096
|
|
10,100
|
|
—
|
|
|||||
|
Addition due to consolidation of variable interest entity
|
—
|
|
—
|
|
10,700
|
|
|||||
|
Improvements
|
6,954
|
|
1,003
|
|
3,689
|
|
|||||
|
Impairment
|
(2,211
|
)
|
(39,058
|
)
|
—
|
|
|||||
|
Sale of real estate
|
(133,897
|
)
|
(107,930
|
)
|
(29,395
|
)
|
|||||
|
Foreign currency translation
|
10,556
|
|
4,623
|
|
(16,944
|
)
|
|||||
|
Write-off of fully depreciated assets
|
(4,371
|
)
|
(4,226
|
)
|
(4,517
|
)
|
|||||
|
Balance at the end of the year
|
$
|
6,334,855
|
|
$
|
2,292,751
|
|
$
|
2,277,457
|
|
||
|
|
|
|
|||||||||
|
Accumulated depreciation:
|
|
|
|||||||||
|
Balance at the beginning of the year
|
$
|
(282,812
|
)
|
$
|
(237,841
|
)
|
$
|
(185,994
|
)
|
||
|
Depreciation expense
|
(101,198
|
)
|
(64,463
|
)
|
(59,864
|
)
|
|||||
|
Impairment
|
885
|
|
9,247
|
|
—
|
|
|||||
|
Sale of real estate
|
38,914
|
|
6,023
|
|
3,384
|
|
|||||
|
Foreign currency translation
|
(583
|
)
|
(4
|
)
|
116
|
|
|||||
|
Write-off of fully depreciated assets
|
4,371
|
|
4,226
|
|
4,517
|
|
|||||
|
Balance at the end of the year
|
$
|
(340,423
|
)
|
$
|
(282,812
|
)
|
$
|
(237,841
|
)
|
||
F-72
SCHEDULE IV
MORTGAGE LOANS ON REAL ESTATE
As of December 31, 2017
(dollars in thousands)
|
Description
|
Contractual Interest Rate
|
Maturity Date
|
Periodic Payment Terms
|
Prior Liens
|
Principal Balance
|
Book Value
(1)
|
Principal Amount of Loans Subject to Delinquent Principal or Interest
|
||||||||||||||
|
Mortgages:
|
|||||||||||||||||||||
|
South Tampa
|
9.8
|
%
|
2018
|
(2)
|
$
|
—
|
|
$
|
5,358
|
|
$
|
4,342
|
|
N/A
|
|||||||
|
River Vista
|
10.0
|
|
2027
|
(3)
|
—
|
|
8,008
|
|
8,008
|
|
N/A
|
||||||||||
|
Construction Mortgages:
|
|||||||||||||||||||||
|
McKinney
|
8.0
|
|
2021
|
(4)
|
—
|
|
2,453
|
|
2,499
|
|
N/A
|
||||||||||
|
Arlington
|
8.0
|
|
2022
|
(4)
|
—
|
|
214
|
|
234
|
|
N/A
|
||||||||||
|
$
|
—
|
|
$
|
16,033
|
|
$
|
15,083
|
|
|||||||||||||
|
(1)
|
The aggregate cost for federal income tax purposes was
$16.2 million
as of December 31, 2017.
|
|
(2)
|
Interest and principal is due monthly with a balloon payment at the maturity date.
|
|
(3)
|
Interest is due monthly, and principal is due at the maturity date.
|
|
(4)
|
Interest and principal for the first 36 months is deferred and due at the maturity date. Interest after the first 36 months is due monthly.
|
Changes in mortgage loans are summarized as follows:
|
Year Ended December 31,
|
||||||||||||
|
2017
|
2016
|
2015
|
||||||||||
|
Balance at the beginning of the year
|
$
|
39,026
|
|
$
|
241,038
|
|
$
|
209,275
|
|
|||
|
Additions during period:
|
||||||||||||
|
Draws
|
1,738
|
|
—
|
|
8,713
|
|
||||||
|
New mortgage loans
|
12,987
|
|
3,767
|
|
20,411
|
|
||||||
|
Interest income added to principal
|
539
|
|
690
|
|
2,639
|
|
||||||
|
Deductions during period:
|
||||||||||||
|
Paydowns/repayments
|
(14,570
|
)
|
(193,075
|
)
|
—
|
|
||||||
|
Conversion to real property
|
(19,085
|
)
|
(10,100
|
)
|
—
|
|
||||||
|
Write-offs
(1)
|
(4,602
|
)
|
(3,294
|
)
|
—
|
|
||||||
|
Balance at the end of the year
|
$
|
16,033
|
|
$
|
39,026
|
|
$
|
241,038
|
|
|||
|
(1)
|
During the year ended December 31, 2017, the Company wrote off uncollectible amounts related to one mortgage loan that was repaid. During the year ended December 31, 2016, the Company wrote off amounts in excess of the fair value upon conversion of one mortgage loan to real property.
|
F-73
SIGNATURES
Pursuant to the requirements of Section 13 or 15(d) of the Securities Exchange Act of 1934, the registrant has duly caused this report to be signed on its behalf by the undersigned, thereunto duly authorized, in the City of Irvine, State of California, on
February 21, 2018
.
|
SABRA HEALTH CARE REIT, INC.
|
|
|
By:
|
/S/ RICHARD K. MATROS
|
|
|
Richard K. Matros
Chairman, President and
Chief Executive Officer
|
Pursuant to the requirements of the Securities Exchange Act of 1934, this report has been signed below by the following persons on behalf of the registrant and in the capacities and on the dates indicated:
|
Name
|
Title
|
Date
|
||
|
/S/ RICHARD K. MATROS
|
Chairman, President and Chief
Executive Officer (Principal Executive Officer)
|
February 21, 2018
|
||
|
Richard K. Matros
|
||||
|
/S/ HAROLD W. ANDREWS, JR.
Harold W. Andrews, Jr.
|
Executive Vice President, Chief
Financial Officer and Secretary (Principal
Financial and Accounting Officer)
|
February 21, 2018
|
||
|
Harold W. Andrews, Jr.
|
||||
|
/S/ CRAIG A. BARBAROSH
Craig A. Barbarosh
|
Director
|
February 21, 2018
|
||
|
Craig A. Barbarosh
|
||||
|
/S/ ROBERT A. ETTL
Robert A. Ettl
|
Director
|
February 21, 2018
|
||
|
Robert A. Ettl
|
||||
|
/S/ MICHAEL J. FOSTER
Michael J. Foster
|
Director
|
February 21, 2018
|
||
|
Michael J. Foster
|
||||
|
/S/ RONALD G. GEARY
|
Director
|
February 21, 2018
|
||
|
Ronald G. Geary
|
||||
|
/S/ RAYMOND J. LEWIS
|
Director
|
February 21, 2018
|
||
|
Raymond J. Lewis
|
||||
|
/S/ JEFFREY A. MALEHORN
|
Director
|
February 21, 2018
|
||
|
Jeffrey A. Malehorn
|
||||
|
/S/ MILTON J. WALTERS
|
Director
|
February 21, 2018
|
||
|
Milton J. Walters
|
||||
TABLE OF CONTENTS
Part IItem 1. BusinessItem 1A. Risk FactorsItem 1B. Unresolved Staff CommentsItem 2. PropertiesItem 3. Legal ProceedingsItem 4. Mine Safety DisclosuresPart IIItem 5. Market For Registrant S Common Equity, Related Stockholder Matters and Issuer Purchases Of Equity SecuritiesItem 6. Selected Financial DataItem 7. Management S Discussion and Analysis Of Financial Condition and Results Of OperationsItem 7A. Quantitative and Qualitative Disclosures About Market RiskItem 8. Financial Statements and Supplementary DataItem 9. Changes in and Disagreements with Accountants on Accounting and Financial DisclosureItem 9A. Controls and ProceduresItem 9B. Other InformationPart IIIItem 10. Directors, Executive Officers, and Corporate GovernanceItem 11. Executive CompensationItem 12. Security Ownership Of Certain Beneficial Owners and Management and Related Stockholder MattersItem 13. Certain Relationships and Related Transactions and Director IndependenceItem 14. Principal Accounting Fees and ServicesPart IVItem 15. Exhibits, Financial Statements and Financial Statement SchedulesItem 16. Form 10-k Summary