STARBUCKS CORP
10-Ks and 10-Qs
|
|
|
|
|
|
|
|
|
|
|
|
|
|
|
|
|
|
|
|
|
|
|
|
|
|
|
|
|
|
|
|
|
|
|
|
|
|
|
|
|
|
|
|
|
|
|
|
|
|
|
|
|
UNITED STATES SECURITIES AND EXCHANGE COMMISSION
Washington, DC 20549
Form 10-K
x
ANNUAL REPORT PURSUANT TO SECTION 13 OR 15(d) OF THE SECURITIES EXCHANGE ACT OF 1934
For the Fiscal Year Ended
September 30, 2018
or
¨
TRANSITION REPORT PURSUANT TO SECTION 13 OR 15(d) OF THE SECURITIES EXCHANGE ACT OF 1934
For the transition period from to .
Commission File Number: 0-20322
Starbucks Corporation
(Exact Name of Registrant as Specified in its Charter)

|
Washington
|
|
91-1325671
|
|
(State of Incorporation)
|
|
(IRS Employer ID)
|
2401 Utah Avenue South, Seattle, Washington 98134
(206) 447-1575
(Address of principal executive offices, zip code, telephone number)
Securities Registered Pursuant to Section 12(b) of the Act:
|
Title of Each Class
|
|
Name of Each Exchange on Which Registered
|
|
Common Stock, $0.001 par value per share
|
|
Nasdaq Global Select Market
|
Securities Registered Pursuant to Section 12(g) of the Act: None
Indicate by check mark if the registrant is a well-known seasoned issuer, as defined in Rule 405 of the Securities Act. Yes
x
No
¨
Indicate by check mark if the registrant is not required to file reports pursuant to Section 13 or Section 15(d) of the Act. Yes
¨
No
x
Indicate by check mark whether the registrant: (1) has filed all reports required to be filed by Section 13 or 15(d) of the Securities Exchange Act of 1934 during the preceding 12 months (or for such shorter period that the registrant was required to file such reports), and (2) has been subject to such filing requirements for the past 90 days. Yes
x
No
¨
Indicate by check mark whether the registrant has submitted electronically every Interactive Data File required to be submitted pursuant to Rule 405 of Regulation S-T (§ 232.405 of this chapter) during the preceding 12 months (or for such shorter period that the registrant was required to submit such files). Yes
x
No
¨
Indicate by check mark if disclosure of delinquent filers pursuant to Item 405 of Regulation of S-K (§ 229.405 of this chapter) is not contained herein, and will not be contained, to the best of the registrant’s knowledge, in definitive proxy or information statements incorporated by reference in Part III of this Form 10-K or any amendment to this Form 10-K.
¨
Indicate by check mark whether the registrant is a large accelerated filer, an accelerated filer, a non-accelerated filer, a smaller reporting company, or an emerging growth company. See the definitions of “large accelerated filer,” “accelerated filer,” “smaller reporting company” and “emerging growth company” in Rule 12b-2 of the Exchange Act.
|
Large accelerated filer
|
x
|
Accelerated filer
|
¨
|
|
Non-accelerated filer
|
¨
|
Smaller reporting company
|
¨
|
|
Emerging growth company
|
¨
|
||
If an emerging growth company, indicate by checkmark if the registrant has elected not to use the extended transition period for complying with any new or revised financial accounting standards provided pursuant to Section 13(a) of the Exchange Act.
¨
Indicate by check mark whether the registrant is a shell company (as defined in Rule 12b-2 of the Act). Yes
¨
No
x
The aggregate market value of the voting stock held by non-affiliates of the registrant as of the last business day of the registrant’s most recently completed second fiscal quarter, based upon the closing sale price of the registrant’s common stock on
April 1, 2018
as reported on the NASDAQ Global Select Market was
$77.8 billion
. As of
November 9, 2018
, there were
1,240.6 million
shares of the registrant’s Common Stock outstanding.
DOCUMENTS INCORPORATED BY REFERENCE
Portions of the definitive Proxy Statement for the registrant’s Annual Meeting of Shareholders to be held on
March 20, 2019
have been incorporated by reference into Part III of this Annual Report on Form 10-K.
STARBUCKS CORPORATION
Form 10-K
For the Fiscal Year Ended
September 30, 2018
TABLE OF CONTENTS
|
PART I
|
||
|
Item 1
|
||
|
Item 1A
|
||
|
Item 1B
|
||
|
Item 2
|
||
|
Item 3
|
||
|
Item 4
|
||
|
PART II
|
||
|
Item 5
|
||
|
Item 6
|
||
|
Item 7
|
||
|
Item 7A
|
||
|
Item 8
|
||
|
Item 9
|
||
|
Item 9A
|
||
|
Item 9B
|
||
|
PART III
|
||
|
Item 10
|
||
|
Item 11
|
||
|
Item 12
|
||
|
Item 13
|
||
|
Item 14
|
||
|
PART IV
|
||
|
Item 15
|
||
CAUTIONARY NOTE REGARDING FORWARD-LOOKING STATEMENTS
This Annual Report on Form 10-K includes “forward-looking” statements within the meaning of the Private Securities Litigation Reform Act of 1995. Forward-looking statements can be identified by the fact that they do not relate strictly to historical or current facts. They often include words such as “believes,” “expects,” “anticipates,” “estimates,” “intends,” “plans,” “seeks” or words of similar meaning, or future or conditional verbs, such as “will,” “should,” “could,” “may,” “aims,” “intends,” or “projects.” A forward-looking statement is neither a prediction nor a guarantee of future events or circumstances, and those future events or circumstances may not occur. You should not place undue reliance on forward-looking statements, which speak only as of the date of this Annual Report on Form 10-K. These forward-looking statements are all based on currently available operating, financial and competitive information and are subject to various risks and uncertainties. Our actual future results and trends may differ materially depending on a variety of factors, including, but not limited to, the risks and uncertainties discussed under “Risk Factors” and “Management’s Discussion and Analysis of Financial Condition and Results of Operations.” Given these risks and uncertainties, you should not rely on forward-looking statements as a prediction of actual results. Any or all of the forward-looking statements contained in this Annual Report on Form 10-K and any other public statement made by us, including by our management, may turn out to be incorrect. We are including this cautionary note to make applicable and take advantage of the safe harbor provisions of the Private Securities Litigation Reform Act of 1995 for forward-looking statements. We expressly disclaim any obligation to update or revise any forward-looking statements, whether as a result of new information, future events or otherwise.
1
Item 1.
Business
General
Starbucks is the premier roaster, marketer and retailer of specialty coffee in the world, operating in
78
markets. Formed in 1985, Starbucks Corporation’s common stock trades on the NASDAQ Global Select Market (“NASDAQ”) under the symbol “SBUX.” We purchase and roast high-quality coffees that we sell, along with handcrafted coffee, tea and other beverages and a variety of high-quality food items through company-operated stores. We also sell a variety of coffee and tea products and license our trademarks through other channels such as licensed stores, grocery and foodservice accounts. In addition to our flagship Starbucks Coffee brand, we sell goods and services under the following brands: Teavana, Seattle’s Best Coffee, Evolution Fresh, La Boulange, Ethos, Starbucks Reserve and Princi.
Our objective is to maintain Starbucks standing as one of the most recognized and respected brands in the world. To achieve this, we are continuing the disciplined expansion of our global store base, adding stores in both existing, developed markets such as the U.S., and in newer, higher growth markets such as China, as well as optimizing the mix of company-operated and licensed stores around the world. In addition, by leveraging the experience gained through our traditional store model, we continue to offer consumers new coffee and other products in a variety of forms, across new categories, diverse channels and alternative store formats. We also believe our Starbucks Global Social Impact strategy, commitments related to ethically sourcing high-quality coffee, contributing positively to the communities we do business in and being an employer of choice are contributors to our objective.
In this Annual Report on Form 10-K (“10-K” or “Report”) for the fiscal year ended
September 30, 2018
(“fiscal
2018
”), Starbucks Corporation (together with its subsidiaries) is referred to as “Starbucks,” the “Company,” “we,” “us” or “our.”
Segment Financial Information
Segment information is prepared on the same basis that our management reviews financial information for operational decision-making purposes. On August 26, 2018, our Channel Development segment finalized licensing and distribution agreements with Nestlé S.A. (“Nestlé”) to sell and market our consumer packaged goods (“CPG”) and foodservice products and received an upfront prepaid royalty payment of approximately $7 billion. As a result, we realigned our organizational and operating segment structures in support of the newly established Global Coffee Alliance. The scope of the arrangement converts the majority of our previously defined Channel Development segment operations, as well as certain smaller businesses previously reported in the Americas, EMEA and Corporate and Other (previously All Other Segments), to licensed operations with Nestlé, and our reportable segments have been restated as if those smaller businesses were previously within our Channel Development segment.
We have
four
reportable operating segments: 1) Americas, which is inclusive of the U.S., Canada, and Latin America; 2) China/Asia Pacific (“CAP”); 3) Europe, Middle East, and Africa (“EMEA”) and 4) Channel Development. We also have several non-reportable operating segments, including Siren Retail, which consists of Starbucks Reserve
TM
Roastery & Tasting Rooms, Starbucks Reserve brand stores and products and Princi operations, as well as Evolution Fresh and the Teavana retail business which substantially ceased operations during fiscal 2018.
Collectively, the combined group of non-reportable operating segments is reported within Corporate and Other. Revenues from our reportable segments and Corporate and Other as a percentage of total net revenues for fiscal
2018
were as follows: Americas (
68%
), CAP (
18%
), EMEA (
4%
), Channel Development (
9%
) and Corporate and Other (
1%
).
Our Americas, CAP and EMEA segments include both company-operated and licensed stores. Our Americas segment is our most mature business and has achieved significant scale. Certain markets within our CAP and EMEA operations are either in various stages of development or undergoing transformations of their business models. Therefore, they may require a more extensive support organization, relative to their current levels of revenue and operating income, than our Americas operations.
Our Channel Development segment includes roasted whole bean and ground coffees, Seattle's Best Coffee
®
, Starbucks- and Teavana-branded single-serve products, a variety of ready-to-drink beverages, such as Frappuccino
®
, Starbucks Doubleshot
®
, Starbucks Refreshers
®
beverages and Teavana
TM/MC
iced tea, and other branded products sold worldwide outside of our company-operated and licensed stores. Historically our consumer packaged goods have been sold directly to grocery, warehouse club and specialty retail stores and through institutional foodservice companies. With the establishment of the Global Coffee Alliance with Nestlé, a large portion of our Channel Development business transitioned to a licensed model in the fourth quarter of fiscal 2018. Additionally, the CPG and foodservice businesses previously included in our Americas, EMEA and Corporate and Other (previously All Other Segments) were also transitioned to a licensed model under the Global Coffee Alliance and realigned to the Channel Development segment. Our collaborative relationships with PepsiCo, Inc., Anheuser-Busch InBev, Tingyi Holding Corp., Arla Foods and others for our global ready-to-drink beverage businesses in this segment are excluded from the Global Coffee Alliance.
2
Starbucks segment information is included in
Note 16
, Segment Reporting, to the consolidated financial statements included in Item 8 of Part II of this 10-K.
Revenue Components
We generate the majority of our revenues through company-operated stores and licensed stores.
Company-operated and Licensed Store Summary as of
September 30, 2018
|
Americas
|
As a% of
Total
Americas Stores
|
CAP
|
As a% of
Total CAP Stores |
EMEA
|
As a% of
Total
EMEA Stores
|
Corporate and Other
|
As a% of
Total
Corporate and Other
|
Total
|
As a% of
Total
Stores
|
||||||||||||||||||||
|
Company-operated stores
|
9,684
|
|
55
|
%
|
5,159
|
|
60
|
%
|
490
|
|
15
|
%
|
8
|
|
40
|
%
|
15,341
|
|
52
|
%
|
|||||||||
|
Licensed stores
|
7,770
|
|
45
|
%
|
3,371
|
|
40
|
%
|
2,830
|
|
85
|
%
|
12
|
|
60
|
%
|
13,983
|
|
48
|
%
|
|||||||||
|
Total
|
17,454
|
|
100
|
%
|
8,530
|
|
100
|
%
|
3,320
|
|
100
|
%
|
20
|
|
100
|
%
|
29,324
|
|
100
|
%
|
|||||||||
The mix of company-operated versus licensed stores in a given market will vary based on several factors, including our ability to access desirable local retail space, the complexity, profitability and expected ultimate size of the market for Starbucks and our ability to leverage the support infrastructure within a geographic region.
Company-operated Stores
Revenue from company-operated stores accounted for
80%
of total net revenues during fiscal
2018
. Our retail objective is to be the leading retailer and brand of coffee and tea in each of our target markets by selling the finest quality coffee, tea and related products, as well as complementary food offerings, and by providing each customer with a unique
Starbucks Experience
. The
Starbucks Experience
is built upon superior customer service and a seamless digital experience as well as clean and well-maintained stores that reflect the personalities of the communities in which they operate, thereby building a high degree of customer loyalty.
Our strategy for expanding our global retail business is to increase our market share in a disciplined manner, by selectively opening additional stores in new and existing markets, as well as increasing sales in existing stores, to support our long-term strategic objective to maintain Starbucks standing as one of the most recognized and respected brands in the world. Store growth in specific existing markets will vary due to many factors, including expected financial returns, the maturity of the market, economic conditions, consumer behavior and local business practices.
3
Company-operated store data for the year-ended
September 30, 2018
:
|
|
Stores Open
as of
|
Stores Open
as of
|
|||||||||||||||
|
|
Oct 1, 2017
|
Opened
|
Closed
|
Transfers
|
Net
|
Sep 30, 2018
|
|||||||||||
|
Americas
(1)
:
|
|||||||||||||||||
|
U.S.
|
8,222
|
|
401
|
|
(48
|
)
|
—
|
|
353
|
|
8,575
|
|
|||||
|
Canada
|
1,083
|
|
65
|
|
(39
|
)
|
—
|
|
26
|
|
1,109
|
|
|||||
|
Brazil
|
108
|
|
4
|
|
—
|
|
(112
|
)
|
(108
|
)
|
—
|
|
|||||
|
Total Americas
|
9,413
|
|
470
|
|
(87
|
)
|
(112
|
)
|
271
|
|
9,684
|
|
|||||
|
China/Asia Pacific
(2)
:
|
|||||||||||||||||
|
China
|
1,540
|
|
528
|
|
(24
|
)
|
1,477
|
|
1,981
|
|
3,521
|
|
|||||
|
Japan
|
1,218
|
|
84
|
|
(16
|
)
|
—
|
|
68
|
|
1,286
|
|
|||||
|
Thailand
|
312
|
|
41
|
|
(1
|
)
|
—
|
|
40
|
|
352
|
|
|||||
|
Total China/Asia Pacific
|
3,070
|
|
653
|
|
(41
|
)
|
1,477
|
|
2,089
|
|
5,159
|
|
|||||
|
EMEA:
|
|||||||||||||||||
|
U.K.
|
345
|
|
15
|
|
(23
|
)
|
(2
|
)
|
(10
|
)
|
335
|
|
|||||
|
All Other
|
157
|
|
3
|
|
(5
|
)
|
—
|
|
(2
|
)
|
155
|
|
|||||
|
Total EMEA
|
502
|
|
18
|
|
(28
|
)
|
(2
|
)
|
(12
|
)
|
490
|
|
|||||
|
Corporate and Other:
|
|||||||||||||||||
|
Teavana
|
288
|
|
—
|
|
(288
|
)
|
—
|
|
(288
|
)
|
—
|
|
|||||
|
Siren Retail
|
2
|
|
6
|
|
—
|
|
—
|
|
6
|
|
8
|
|
|||||
|
Total Corporate and Other
|
290
|
|
6
|
|
(288
|
)
|
—
|
|
(282
|
)
|
8
|
|
|||||
|
Total company-operated
|
13,275
|
|
|
1,147
|
|
|
(444
|
)
|
|
1,363
|
|
|
2,066
|
|
|
15,341
|
|
(1)
Americas store data includes the transfer of 112 company-operated retail stores in Brazil to licensed stores as a result of the sale of our Brazil retail operations in the second quarter of fiscal 2018.
(2)
China/Asia Pacific store data includes the transfer of 1,477 licensed stores in East China to company-operated retail stores as a result of the purchase of our East China joint venture in the first quarter of fiscal 2018.
Starbucks
®
company-operated stores are typically located in high-traffic, high-visibility locations. Our ability to vary the size and format of our stores allows us to locate them in or near a variety of settings, including downtown and suburban retail centers, office buildings, university campuses and in select rural and off-highway locations. We are continuing the expansion of our stores, inclusive of Drive Thru formats that provide a higher degree of access and convenience, and alternative store formats, which are focused on an elevated
Starbucks Experience
for our customers.
Retail sales mix by product type for company-operated stores:
|
Fiscal Year Ended
|
Sep 30,
2018 |
Oct 1,
2017 |
Oct 2,
2016 |
|||||
|
Beverages
|
74
|
%
|
73
|
%
|
74
|
%
|
||
|
Food
|
20
|
%
|
20
|
%
|
19
|
%
|
||
|
Packaged and single-serve coffees and teas
|
2
|
%
|
3
|
%
|
3
|
%
|
||
|
Other
(1)
|
4
|
%
|
4
|
%
|
4
|
%
|
||
|
Total
|
100
|
%
|
100
|
%
|
100
|
%
|
||
|
(1)
|
“Other” primarily consists of sales of serveware, ready-to-drink beverages and coffee-making equipment, among other items.
|
4
Stored Value Cards and Loyalty Program
The Starbucks Card, our branded stored value card program, is designed to provide customers with a convenient payment method, support gifting and increase the frequency of store visits by cardholders, in part through the related Starbucks Rewards
™
loyalty program where available, as discussed below. Stored value cards are issued to customers when they initially load them with an account balance. They can be obtained in our company-operated and most licensed stores in North America, China, Japan, Latin America, and many of our markets in our CAP and EMEA segments. Stored value cards can also be obtained on-line, via the Starbucks
®
Mobile App, and through other U.S. and international retailers. Customers may access their card balances by utilizing their stored value card or the Starbucks
®
Mobile App in participating stores. Using the Mobile Order and Pay functionality of the Starbucks
®
Mobile App, customers can also place orders in advance for pick-up at certain participating locations in the U.S. and Canada. In nearly all markets, including the U.S. and Canada, customers who register their Starbucks Cards are automatically enrolled in the Starbucks Rewards
™
program. Registered members can receive various benefits depending on factors such as the number of reward points (“Stars”) earned. Refer to
Note 1
, Summary of Significant Accounting Policies, included in Item 8 of Part II of this 10-K, for further discussion of our stored value cards and loyalty program.
Licensed Stores
Revenues from our licensed stores accounted for
11%
of total net revenues in fiscal
2018
. Licensed stores generally have a lower gross margin and a higher operating margin than company-operated stores. Under the licensed model, Starbucks receives a reduced share of the total store revenues, but this is more than offset by the reduction in our share of costs as these are primarily incurred by the licensee.
In our licensed store operations, we leverage the expertise of our local partners and share our operating and store development experience. Licensees provide improved, and at times the only, access to desirable retail space. Most licensees are prominent retailers with in-depth market knowledge and access. As part of these arrangements, we sell coffee, tea, food and related products to licensees for resale to customers and receive royalties and license fees from the licensees. We also sell certain equipment, such as coffee brewers and espresso machines, to our licensees for use in their operations. Employees working in licensed retail locations are required to follow our detailed store operating procedures and attend training classes similar to those given to employees in company-operated stores. In a limited number of international markets, we also use traditional franchising and include these stores in the results of operations from our other licensed stores.
5
Licensed store data for the year-ended
September 30, 2018
:
|
|
Stores Open
as of
|
Stores Open
as of
|
|||||||||||||||
|
|
Oct 1, 2017
|
Opened
|
Closed
|
Transfers
|
Net
|
Sep 30, 2018
|
|||||||||||
|
Americas
(1)
:
|
|||||||||||||||||
|
U.S.
|
5,708
|
|
442
|
|
(119
|
)
|
—
|
|
323
|
|
6,031
|
|
|||||
|
Mexico
|
632
|
|
76
|
|
—
|
|
—
|
|
76
|
|
708
|
|
|||||
|
Latin America
|
429
|
|
83
|
|
(2
|
)
|
112
|
|
193
|
|
622
|
|
|||||
|
Canada
|
377
|
|
44
|
|
(12
|
)
|
—
|
|
32
|
|
409
|
|
|||||
|
Total Americas
|
7,146
|
|
645
|
|
(133
|
)
|
112
|
|
624
|
|
7,770
|
|
|||||
|
China/Asia Pacific
(2)
:
|
|||||||||||||||||
|
China
|
1,396
|
|
84
|
|
(3
|
)
|
(1,477
|
)
|
(1,396
|
)
|
—
|
|
|||||
|
Korea
|
1,108
|
|
138
|
|
(15
|
)
|
—
|
|
123
|
|
1,231
|
|
|||||
|
Taiwan
|
420
|
|
43
|
|
(5
|
)
|
—
|
|
38
|
|
458
|
|
|||||
|
Philippines
|
324
|
|
37
|
|
(1
|
)
|
—
|
|
36
|
|
360
|
|
|||||
|
Indonesia
|
317
|
|
56
|
|
(8
|
)
|
—
|
|
48
|
|
365
|
|
|||||
|
Malaysia
|
248
|
|
23
|
|
(3
|
)
|
—
|
|
20
|
|
268
|
|
|||||
|
All Other
|
596
|
|
101
|
|
(8
|
)
|
—
|
|
93
|
|
689
|
|
|||||
|
Total China/Asia Pacific
|
4,409
|
|
482
|
|
(43
|
)
|
(1,477
|
)
|
(1,038
|
)
|
3,371
|
|
|||||
|
EMEA:
|
|||||||||||||||||
|
U.K.
|
606
|
|
62
|
|
(17
|
)
|
2
|
|
47
|
|
653
|
|
|||||
|
Turkey
|
387
|
|
67
|
|
(1
|
)
|
—
|
|
66
|
|
453
|
|
|||||
|
United Arab Emirates
|
164
|
|
26
|
|
(4
|
)
|
—
|
|
22
|
|
186
|
|
|||||
|
Germany
|
156
|
|
10
|
|
(14
|
)
|
—
|
|
(4
|
)
|
152
|
|
|||||
|
Saudi Arabia
|
124
|
|
46
|
|
(4
|
)
|
—
|
|
42
|
|
166
|
|
|||||
|
Kuwait
|
118
|
|
24
|
|
—
|
|
—
|
|
24
|
|
142
|
|
|||||
|
Spain
|
113
|
|
34
|
|
(5
|
)
|
—
|
|
29
|
|
142
|
|
|||||
|
All Other
|
804
|
|
157
|
|
(25
|
)
|
—
|
|
132
|
|
936
|
|
|||||
|
Total EMEA
|
2,472
|
|
426
|
|
(70
|
)
|
2
|
|
358
|
|
2,830
|
|
|||||
|
Corporate and Other:
|
|||||||||||||||||
|
Teavana
|
37
|
|
—
|
|
(25
|
)
|
—
|
|
(25
|
)
|
12
|
|
|||||
|
Total Corporate and Other
|
37
|
|
—
|
|
(25
|
)
|
—
|
|
(25
|
)
|
12
|
|
|||||
|
Total licensed
|
14,064
|
|
|
1,553
|
|
|
(271
|
)
|
|
(1,363
|
)
|
|
(81
|
)
|
|
13,983
|
|
(1)
Americas store data includes the transfer of 112 company-operated retail stores in Brazil to licensed stores as a result of the sale of our Brazil retail operations in the second quarter of fiscal 2018.
(2)
China/Asia Pacific store data includes the transfer of 1,477 licensed stores in East China to company-operated retail stores as a result of the purchase of our East China joint venture in the first quarter of fiscal 2018.
Other Revenues
Other revenues primarily are recorded in our Channel Development segment and include sales of packaged coffee, tea and ready-to-drink beverages to customers outside of our company-operated and licensed stores. Historically revenues have included domestic and international sales of our packaged coffee, tea and ready-to-drink products to grocery, warehouse club and specialty retail stores and through institutional foodservice companies which serviced businesses. In the fourth quarter of fiscal 2018, we began licensing the rights to sell and market Starbucks-branded products in authorized channels to Nestlé. As a result, other revenues includes product sales to and licensing revenue from Nestlé under this arrangement and the amortization of the upfront prepaid royalty payment. Our collaborative business relationships for global ready-to-drink products and the associated revenues remain unchanged due to the Global Coffee Alliance with Nestlé.
6
Product Supply
Starbucks is committed to selling the finest whole bean coffees and coffee beverages. To ensure compliance with our rigorous coffee standards, we control coffee purchasing, roasting and packaging and the global distribution of coffee used in our operations. We purchase green coffee beans from multiple coffee-producing regions around the world and custom roast them to our exacting standards for our many blends and single origin coffees.
The price of coffee is subject to significant volatility. Although most coffee trades in the commodity market, high-altitude
arabica
coffee of the quality sought by Starbucks tends to trade on a negotiated basis at a premium above the “C” coffee commodity price. Both the premium and the commodity price depend upon the supply and demand at the time of purchase. Supply and price can be affected by multiple factors in the producing countries, including weather, natural disasters, crop disease, general increase in farm inputs and costs of production, inventory levels and political and economic conditions. Price is also impacted by trading activities in the
arabica
coffee futures market, including hedge funds and commodity index funds. In addition, green coffee prices have been affected in the past, and may be affected in the future, by the actions of certain organizations and associations that have historically attempted to influence prices of green coffee through agreements establishing export quotas or by restricting coffee supplies.
We buy coffee using fixed-price and price-to-be-fixed purchase commitments, depending on market conditions, to secure an adequate supply of quality green coffee. Price-to-be-fixed contracts are purchase commitments whereby the quality, quantity, delivery period, and other negotiated terms are agreed upon, but the date, and therefore the price, at which the base “C” coffee commodity price component will be fixed has not yet been established. For most contracts, either Starbucks or the seller has the option to “fix” the base “C” coffee commodity price prior to the delivery date. For other contracts, Starbucks and the seller may agree upon pricing parameters determined by the base “C” coffee commodity price. Until prices are fixed, we estimate the total cost of these purchase commitments. Total green coffee purchase commitments as of
September 30, 2018
were
$1.1 billion
, comprised of
$996 million
under fixed-price contracts and an estimated
$166 million
under price-to-be-fixed contracts. As of
September 30, 2018
, none of our price-to-be-fixed contracts were effectively fixed through the use of futures contracts. Most price-to-be-fixed contracts as of
September 30, 2018
were at the Company’s option to fix the base “C” coffee commodity price component. Total purchase commitments, together with existing inventory, are expected to provide an adequate supply of green coffee through fiscal
2019
.
We depend upon our relationships with coffee producers, outside trading companies and exporters for our supply of green coffee. We believe, based on relationships established with our suppliers, the risk of non-delivery on such purchase commitments is remote.
To help ensure the future supply of high-quality green coffee and to reinforce our leadership role in the coffee industry, Starbucks operates
nine
farmer support centers. The farmer support centers are staffed with agronomists and sustainability experts who work with coffee farming communities to promote best practices in coffee production designed to improve both coffee quality, yields and agronomy support to address climate and other impacts.
In addition to coffee, we also purchase significant amounts of dairy products, particularly fluid milk, to support the needs of our company-operated stores. We believe, based on relationships established with our dairy suppliers, that the risk of non-delivery of sufficient fluid milk to support our stores is remote.
Products other than whole bean coffees and coffee beverages sold in Starbucks
®
stores include tea and a number of ready-to-drink beverages that are purchased from several specialty suppliers, usually under long-term supply contracts. Food products, such as pastries, breakfast sandwiches and lunch items, are purchased from national, regional and local sources. We also purchase a broad range of paper and plastic products, such as cups and cutlery, from several companies to support the needs of our retail stores as well as our manufacturing and distribution operations. We believe, based on relationships established with these suppliers and manufacturers, that the risk of non-delivery of sufficient amounts of these items is remote.
Competition
Our primary competitors for coffee beverage sales are specialty coffee shops offering premium and artisanal products and experiences. In almost all markets in which we do business, there are numerous competitors in the specialty coffee beverage business. We believe that our customers choose among specialty coffee retailers primarily on the basis of product quality, service and convenience, as well as price. We continue to experience direct competition from large competitors in the U.S. quick-service restaurant sector and the U.S. ready-to-drink coffee beverage market, in addition to well-established companies in many international markets. We also compete with restaurants and other specialty retailers for prime retail locations and qualified personnel to operate both new and existing stores.
Our coffee and tea products sold through our Channel Development segment compete directly against specialty coffees and teas sold through grocery stores, warehouse clubs, specialty retailers, convenience stores and foodservice accounts and compete indirectly against all other coffees and teas on the market.
7
Trademarks, Copyrights, Patents and Domain Names
Starbucks owns and has applied to register numerous trademarks and service marks in the U.S. and in other countries throughout the world. Some of our trademarks, including Starbucks, the Starbucks logo, Starbucks Reserve, Seattle’s Best Coffee, Teavana, Frappuccino, Starbucks VIA and La Boulange are of material importance. The duration of trademark registrations varies from country to country. However, trademarks are generally valid and may be renewed indefinitely as long as they are in use and/or their registrations are properly maintained.
We own numerous copyrights for items such as product packaging, promotional materials, in-store graphics and training materials. We also hold patents on certain products, systems and designs. In addition, Starbucks has registered and maintains numerous Internet domain names, including “Starbucks.com,” “Starbucks.net,” “Starbucksreserve.com,” “Seattlesbest.com” and “Teavana.com.”
Seasonality and Quarterly Results
Our business is subject to moderate seasonal fluctuations, of which our fiscal second quarter typically experiences lower revenues and operating income. Additionally, as Starbucks Cards are issued to and loaded by customers during the holiday season, we tend to have higher cash flows from operations during the first quarter of the fiscal year. However, since revenues from Starbucks Cards are recognized upon redemption and not when cash is loaded onto the Card, the impact of seasonal fluctuations on the consolidated statements of earnings is much less pronounced. As a result of moderate seasonal fluctuations, results for any quarter are not necessarily indicative of the results that may be achieved for the full fiscal year.
Employees
Starbucks employed approximately
291,000
people worldwide as of
September 30, 2018
. In the U.S., Starbucks employed approximately
191,000
people, with approximately
183,000
in company-operated stores and the remainder in support facilities, store development, and roasting, manufacturing, warehousing and distribution operations. Approximately
100,000
employees were employed outside of the U.S., with approximately
97,000
in company-operated stores and the remainder in regional support operations. The number of Starbucks employees represented by unions is not significant. We believe our current relations with our employees are good.
Executive Officers of the Registrant
|
Name
|
Age
|
Position
|
||
|
Kevin R. Johnson
|
58
|
president and chief executive officer
|
||
|
Rosalind G. Brewer
|
56
|
group president, Americas and chief operating officer
|
||
|
Cliff Burrows
|
59
|
group president, Siren Retail
|
||
|
John Culver
|
58
|
group president, International, Channel Development and Global Coffee & Tea
|
||
|
Rachel A. Gonzalez
|
49
|
executive vice president, general counsel and secretary
|
||
|
Patrick J. Grismer
|
56
|
executive vice president, effective November 12, 2018;
executive vice president, chief financial officer and chief accounting officer, effective November 30, 2018
|
||
|
Lucy Lee Helm
|
61
|
executive vice president, chief partner officer
|
||
|
Scott Maw
|
51
|
executive vice president, chief financial officer (retiring November 30, 2018)
|
||
|
Vivek Varma
|
52
|
executive vice president, Public Affairs
|
||
Kevin R. Johnson
has served as president and chief executive officer since April 2017, and has been a Starbucks director since March 2009. Mr. Johnson served as president and chief operating officer from March 2015 to April 2017. Mr. Johnson served as Chief Executive Officer of Juniper Networks, Inc., a leading provider of high-performance networking products and services, from September 2008 to December 2013. He also served on the Board of Directors of Juniper Networks from September 2008 through February 2014. Prior to joining Juniper Networks, Mr. Johnson served as President, Platforms and Services Division for Microsoft Corporation, a worldwide provider of software, services and solutions. Mr. Johnson was a member of Microsoft’s Senior Leadership Team and held a number of senior executive positions over the course of his 16 years at Microsoft. Prior to joining Microsoft in 1992, Mr. Johnson worked in International Business Machine Corp.’s systems integration and consulting business.
Rosalind G. Brewer
has served as group president, Americas and chief operating officer since October 2017, and has been a director of Starbucks since March 2017. Ms. Brewer served as President and Chief Executive Officer of Sam's Club, a membership-only retail warehouse club and a division of Walmart Inc., from February 2012 to February 2017. Previously, Ms.
8
Brewer was Executive Vice President and President of Walmart's East Business Unit from February 2011 to January 2012; Executive Vice President and President of Walmart South from February 2010 to February 2011; Senior Vice President and Division President of the Southeast Operating Division from March 2007 to January 2010; and Regional General Manager, Georgia Operations, from 2006 to February 2007. Prior to joining Walmart, Ms. Brewer was President of Global Nonwovens Division for Kimberly-Clark Corporation, a global health and hygiene products company, from 2004 to 2006 and held various management positions at Kimberly-Clark Corporation from 1984 to 2006. She serves as the Chair of the Board of Trustees for Spelman College and formerly served on the Board of Directors for Lockheed Martin Corporation and Molson Coors Brewing Company.
Cliff Burrows
joined Starbucks in April 2001 and has served as group president, Siren Retail, since September 2016, which includes the Starbucks Reserve
TM
Roastery & Tasting Rooms, Starbucks Reserve brand and Princi operations. From July 2015 to September 2016, he served as group president, U.S. and Americas. From February 2014 to June 2015, he served as group president, U.S., Americas and Teavana. From May 2013 to February 2014, he served as group president, Americas and U.S., EMEA (Europe, Middle East and Africa) and Teavana. Mr. Burrows served as president, Starbucks Coffee Americas and U.S. from October 2011 to May 2013 and as president, Starbucks Coffee U.S. from March 2008 to October 2011. He served as president, EMEA from April 2006 to March 2008. He served as vice president and managing director, U.K. prior to April 2006. Prior to joining Starbucks, Mr. Burrows served in various management positions with Habitat Designs Limited, a furniture and housewares retailer.
John Culver
joined Starbucks in August 2002 and has served as group president, International, Channel Development and Global Coffee & Tea, since July 2018. From October 2017 to July 2018, Mr. Culver served as group president, International and Channels. From September 2016 to October 2017, he served as group president, Starbucks Global Retail. From May 2013 to September 2016, he served as group president, China, Asia Pacific, Channel Development and Emerging Brands. Mr. Culver served as president, Starbucks Coffee China and Asia Pacific from October 2011 to May 2013. From December 2009 to October 2011, he served as president, Starbucks Coffee International. Mr. Culver served as executive vice president; president, Global Consumer Products, Foodservice and Seattle’s Best Coffee from February 2009 to September 2009, and then as president, Global Consumer Products and Foodservice from October 2009 to November 2009. He previously served as senior vice president; president, Starbucks Coffee Asia Pacific from January 2007 to February 2009, and vice president; general manager, Foodservice from August 2002 to January 2007.
Rachel A. Gonzalez
joined Starbucks and has served as executive vice president, general counsel and secretary since joining Starbucks in April 2018. Prior to joining Starbucks, Ms. Gonzalez served as executive vice president and chief administrative officer of Sabre Corporation, a technology provider to the travel industry, from May 2017 to April 2018 and as Sabre’s executive vice president and general counsel from September 2014 to May 2017. From March 2013 to September 2014, Ms. Gonzalez served as executive vice president, general counsel and corporate secretary of Dean Foods Company, a food and beverage company, and as its executive vice president, general counsel designate from November 2012 to March 2013. She served as chief counsel, corporate and securities of Dean Foods from 2008 to November 2012. From 2006 to 2008, Ms. Gonzalez served as senior vice president and group counsel for Affiliated Computer Services, Inc., an information technology service provider. Prior to that, Ms. Gonzalez was a partner with the law firm of Morgan, Lewis & Bockius LLP, where she focused on corporate finance, mergers and acquisitions, SEC compliance and corporate governance. Ms. Gonzalez serves on the Board of Directors of Dana Incorporated.
Patrick J. Grismer
joined Starbucks in November 2018, as executive vice president, effective November 12, 2018 and will be executive vice president, chief financial officer and chief accounting officer, effective November 30, 2018. From March 2016 to November 2018, Mr. Grismer served as Executive Vice President, Chief Financial Officer of Hyatt Hotels Corporation, a global hospitality company. From May 2012 to February 2016, Mr. Grismer served as Chief Financial Officer at Yum! Brands, Inc., a global restaurant company. He previously held a number of roles at Yum!, including Chief Planning and Control Officer and Chief Financial Officer for Yum! Restaurants International. Prior to that, Mr. Grismer served in various roles at The Walt Disney Company including Vice President, Business Planning and Development for The Disneyland Resort and Chief Financial Officer for the Disney Vacation Club. Mr. Grismer began his career with Price Waterhouse.
Lucy Lee Helm
joined Starbucks in September 1999, and has served as executive vice president, chief partner officer since August 2017. From May 2012 to August 2017, Ms. Helm served as executive vice president, general counsel and secretary. She served as senior vice president and deputy general counsel from October 2007 to April 2012 and served as interim general counsel and secretary from April 2012 to May 2012. Ms. Helm previously served as vice president, assistant general counsel from June 2002 to September 2007 and as director, corporate counsel from September 1999 to May 2002. During her tenure at Starbucks, Ms. Helm has led various teams of the Starbucks legal department, including the Litigation and Brand protection team, the Global Business (Commercial) team and the Litigation and Employment team. Prior to joining Starbucks, Ms. Helm was a principal at the Seattle law firm of Riddell Williams P.S. from 1990 to 1999, where she was a trial lawyer specializing in commercial, insurance coverage and environmental litigation.
9
Scott Maw
joined Starbucks in August 2011, and has served as executive vice president, chief financial officer since February 2014. He will retire from the Company on November 30, 2018. From October 2012 to February 2014, he served as senior vice president, Corporate Finance and as corporate controller from August 2011 to October 2012. Prior to joining Starbucks, Mr. Maw served as chief financial officer of SeaBright Insurance Company from February 2010 to August 2011. From October 2008 to February 2010, Mr. Maw served as chief financial officer of the Consumer Banking division of JPMorgan Chase & Co., having held a similar position at Washington Mutual Bank prior to its acquisition by Chase. From 1994 to 2003, he served in various finance leadership positions at General Electric Company. Mr. Maw serves on the Board of Directors of Avista Corporation.
Vivek Varma
joined Starbucks in September of 2008, and has served as executive vice president, Public Affairs since May 2010. From September 2008 to May 2010, Mr. Varma served as senior vice president, Public Affairs. Prior to joining Starbucks, Mr. Varma was general manager of communications and public relations for the Platforms and Services Division of Microsoft Corporation, a worldwide provider of software, services and solutions, from April 2006 to September 2008. From January 2002 to April 2006, Mr. Varma served in a number of other positions with Microsoft, including as senior director of corporate communications and public relations in Microsoft’s Corporate Marketing Group.
Global Social Impact
We are committed to being a deeply responsible company in the communities where we do business. Our focus is on ethically sourcing high-quality coffee and tea, reducing our environmental impacts and contributing positively to communities around the world. Starbucks Global Social Impact strategy and commitments are integral to our overall business strategy. As a result, we believe we deliver benefits to our stakeholders, including employees, business partners, customers, suppliers, shareholders, community members and others. For an overview of Starbucks Global Social Impact strategy and commitments, please visit www.starbucks.com/responsibility.
Available Information
Starbucks 10-K reports, along with all other reports and amendments filed with or furnished to the Securities and Exchange Commission (“SEC”), are publicly available free of charge on the Investor Relations section of our website at investor.starbucks.com or at www.sec.gov as soon as reasonably practicable after these materials are filed with or furnished to the SEC. Our corporate governance policies, code of ethics and Board committee charters and policies are also posted on the Investor Relations section of Starbucks website. The information on our website is not part of this or any other report Starbucks files with, or furnishes to, the SEC.
Item 1A.
Risk Factors
You should carefully consider the risks described below. If any of the risks and uncertainties described in the cautionary factors described below actually occurs, our business, financial condition and results of operations, and the trading price of our common stock could be materially and adversely affected. Moreover, we operate in an increasingly competitive and rapidly changing environment. New factors emerge from time to time and it is not possible to predict the impact of all these factors on our business, financial condition or results of operations.
|
•
|
Economic conditions in the U.S. and international markets could adversely affect our business and financial results.
|
As a retailer that is dependent upon consumer discretionary spending, our results of operations are sensitive to changes in or uncertainty about macro-economic conditions. Our customers may have less money for discretionary purchases and may stop or reduce their purchases of our products or trade down to Starbucks or competitors' lower priced products as a result of job losses, foreclosures, bankruptcies, increased fuel and energy costs, higher interest rates, inflation, higher taxes, reduced access to credit, economic uncertainty and potential negative impacts relating to federal economic policy changes and recent international trade disputes. These factors may also result in a general downturn in the restaurant industry. Decreases in customer traffic and/or average value per transaction will negatively impact our financial performance as reduced revenues without a corresponding decrease in expenses result in sales de-leveraging, which creates downward pressure on margins and also negatively impacts comparable store sales, net revenues, operating income and earnings per share. There is also a risk that if negative economic conditions or uncertainty persist for a long period of time or worsen, consumers may make long-lasting changes to their discretionary purchasing behavior, including less frequent discretionary purchases on a more permanent basis.
|
•
|
Our success depends substantially on the value of our brands and failure to preserve their value, either through our actions or those of our business partners, could have a negative impact on our financial results.
|
We believe we have built an excellent reputation globally for the quality of our products, for delivery of a consistently positive consumer experience and for our global social impact programs. The Starbucks brand is recognized throughout the world and we have received high ratings in global brand value studies. To be successful in the future, particularly outside of the U.S., where the Starbucks brand and our other brands are less well-known, we believe we must preserve, grow and leverage the value
10
of our brands across all sales channels. Brand value is based in part on consumer perceptions on a variety of subjective qualities.
Additionally, our business strategy, including our plans for new stores, branded products and other initiatives, relies significantly on a variety of business partners, including licensee and joint venture relationships, particularly in our international markets, and third-party manufacturers, distributors and retailers, particularly for our entire global Channel Development business. Licensees, retailers and foodservice operators are often authorized to use our logos and provide branded food, beverage and other products directly to customers. We provide training and support to, and monitor the operations of, certain of these business partners, but the product quality and service they deliver may be diminished by any number of factors beyond our control, including financial pressures they may face. We believe customers expect the same quality of products and service from our licensed-store operators as they do from us and we strive to ensure customers receive the same quality of products and service experience whether they visit a company-operated store or a licensed store. We also source our food, beverage and other products from a wide variety of domestic and international business partners in our supply chain operations, and in certain cases such products are produced or sourced by our licensees directly. And although foodservice operators are authorized to use our logos and provide branded products as part of their foodservice business, we do not monitor the quality of non-Starbucks products served in those locations. Additionally, inconsistent uses of our brand and other of our intellectual property assets, as well as failure to protect our intellectual property, including from unauthorized uses of our brand or other of our intellectual property assets, can erode consumer trust and our brand value and have a material negative impact on our financial results.
Business incidents, whether isolated or recurring and whether originating from us or our business partners, that erode consumer trust, such as actual or perceived breaches of privacy or violations of domestic or international privacy laws, contaminated food, product recalls, store employees or other food handlers infected with communicable diseases or other potential incidents discussed in this risk factors section, particularly if the incidents receive considerable publicity, including rapidly through social or digital media (including for malicious reasons), or result in litigation, and failure to respond appropriately to these incidents (or being perceived to not have reacted appropriately), can significantly reduce brand value, trigger boycotts of our stores or products or demonstrations at our stores, result in civil and criminal liability and have a negative impact on our financial results. Consumer demand for our products and our brand equity could diminish significantly if we, our employees or our licensees or other business partners fail to preserve the quality of our products, act or are perceived to act in an unethical, illegal, racially-biased or unequal treatment basis or socially irresponsible manner, including with respect to the sourcing, content or sale of our products, service and treatment at Starbucks stores or the use of customer data for general or direct marketing or other purposes, fail to comply with laws and regulations, publicly take controversial positions or actions or fail to deliver a consistently positive consumer experience in each of our markets, including by failing to invest in the right balance of wages and benefits to attract and retain employees that represent the brand well.
|
•
|
Incidents involving food or beverage-borne illnesses, tampering, adulteration, contamination or mislabeling, whether or not accurate, as well as adverse public or medical opinions about the health effects of consuming our products, could harm our business.
|
Instances or reports, whether true or not, of unclean water supply or food-safety issues, such as food or beverage-borne illnesses, tampering, adulteration, contamination or mislabeling, either during growing, manufacturing, packaging, storing or preparation, have in the past severely injured the reputations of companies in the food and beverage processing, grocery and quick-service restaurant sectors and could affect us as well. Any report linking us to the use of unclean water, food or beverage-borne illnesses, tampering, adulteration, contamination, mislabeling or other food or beverage-safety issues could damage our brand value and severely hurt sales of our food and beverage products and possibly lead to product liability claims, litigation (including class actions) or damages. Clean water is critical to the preparation of coffee, tea and other beverages, as well as ice for our cold beverages, and our ability to ensure a clean water and ice supply to our stores can be limited, particularly in some international locations. We are also continuing to incorporate more products in our food and beverage lineup that require freezing or refrigeration, including produce (such as fruits and vegetables in our salads and juices), dairy products (such as milk and cheeses), non-dairy alternative products (such as soymilk and almondmilk), ice for our cold drinks and meats. We also face risk by relying on third-party food suppliers to provide and transport ingredients and finished products to our stores. We monitor the operations of certain of these business partners, but the product quality and service they deliver may be diminished by any number of factors beyond our control, which make it more difficult to detect contamination or other defect in these products. Additionally, we are evolving our product lineup to include more local or smaller suppliers for some of our products who may not have as rigorous quality and safety systems and protocols as larger or more national suppliers. If customers become ill from food or beverage-borne illnesses, tampering, adulteration, contamination, mislabeling or other food or beverage-safety issues, we could be forced to temporarily close some stores and/or supply chain facilities, as well as recall products. In addition, instances of food or beverage-safety issues, even those involving solely the restaurants or stores of competitors or of suppliers or distributors (regardless of whether we use or have used those suppliers or distributors), could, by resulting in negative publicity about us or the foodservice industry in general, adversely affect our sales on a regional or global basis. A decrease in customer traffic as a result of food-safety concerns or negative publicity, or as a result of a temporary
11
closure of any of our stores, product recalls or food or beverage-safety claims or litigation, could materially harm our business and results of operations.
Some of our products contain caffeine, dairy products, sugar and other compounds and allergens, the health effects of which are the subject of public and regulatory scrutiny, including the suggestion that excessive consumption of caffeine, dairy products, sugar and other compounds can lead to a variety of adverse health effects. Particularly in the U.S., there is increasing consumer awareness of health risks, including obesity, due in part to increased publicity and attention from health organizations, as well as increased consumer litigation based on alleged adverse health impacts of consumption of various food and beverage products. While we have a variety of beverage and food items, including items that are coffee-free and have reduced calories, an unfavorable report on the health effects of caffeine or other compounds present in our products, whether accurate or not, imposition of additional taxes on certain types of beverages, or negative publicity or litigation arising from certain health risks could significantly reduce the demand for our beverages and food products and could materially harm our business and results of operations.
|
•
|
The unauthorized access, use, theft or destruction of customer or employee personal, financial or other data or of Starbucks proprietary or confidential information that is stored in our information systems or by third parties on our behalf could impact our reputation and brand and expose us to potential liability and loss of revenues.
|
Many of our information technology systems, such as those we use for our point-of-sale, web and mobile platforms, including online and mobile payment systems, delivery services and rewards programs, and for administrative functions, including human resources, payroll, accounting and internal and external communications, as well as the information technology systems of our licensees, franchisees and other third-party business partners and service providers, whether cloud-based or hosted in proprietary servers, contain personal, financial or other information that is entrusted to us by our customers and employees. Many of our information technology systems also contain Starbucks proprietary and other confidential information related to our business, such as business plans, product development initiatives and designs. Similar to many other retail companies and because of the prominence of our brand, we are consistently subject to attempts to compromise our information technology systems. To the extent we or a third party were to experience a material breach of our or such third party’s information technology systems that result in the unauthorized access, theft, use, destruction or other compromises of customers' or employees' data or confidential information of the Company stored in such systems, including through cyber-attacks or other external or internal methods, it could result in a material loss of revenues from the potential adverse impact to our reputation and brand, our ability to retain or attract new customers and the potential disruption to our business and plans. Such security breaches also could result in a violation of applicable U.S. and international privacy and other laws, and subject us to private consumer, business partner, or securities litigation and governmental investigations and proceedings, any of which could result in our exposure to material civil or criminal liability. For example, the European Union adopted a new regulation that became effective in May 2018, called the General Data Protection Regulation (“GDPR”), which requires companies to meet new requirements regarding the handling of personal data, including its use, protection and transfer and the ability of persons whose data is stored to correct or delete such data about themselves. Failure to meet the GDPR requirements could result in penalties of up to 4% of annual worldwide revenue. The GDPR also confers a private right of action on certain individuals and associations. Our reputation and brand and our ability to attract new customers could also be adversely impacted if we fail, or are perceived to have failed, to properly respond to these incidents. Such failure to properly respond could also result in similar exposure to liability.
Compliance with the GDPR and other applicable international and U.S. privacy, cybersecurity and related laws can be costly and time-consuming. Significant capital investments and other expenditures could also be required to remedy cybersecurity problems and prevent future breaches, including costs associated with additional security technologies, personnel, experts and credit monitoring services for those whose data has been breached. These costs, which could be material, could adversely impact our results of operations in the period in which they are incurred and may not meaningfully limit the success of future attempts to breach our information technology systems.
Media or other reports of existing or perceived security vulnerabilities in our systems or those of our third-party business partners or service providers can also adversely impact our brand and reputation and materially impact our business, even if no breach has been attempted or has occurred. Additionally, the techniques and sophistication used to conduct cyber-attacks and breaches of information technology systems, as well as the sources and targets of these attacks, change frequently and are often not recognized until such attacks are launched or have been in place for a period of time. We continue to make significant investments in technology, third-party services and personnel to develop and implement systems and processes that are designed to anticipate cyber-attacks and to prevent or minimize breaches of our information technology systems or data loss, but these security measures cannot provide assurance that we will be successful in preventing such breaches or data loss.
12
|
•
|
We rely heavily on information technology in our operations and growth initiatives, and any material failure, inadequacy, interruption or security failure of that technology could harm our ability to effectively operate and grow our business and could adversely affect our financial results.
|
We rely heavily on information technology systems across our operations, including for administrative functions, point-of-sale processing and payment in our stores and online, management of our supply chain, Starbucks Cards, online business, delivery services, mobile technology, including mobile payments and ordering apps, reloads and loyalty functionality and various other processes and transactions, and many of these systems are interdependent on one another for their functionality. Additionally, the success of several of our initiatives to drive growth, including our priority to increase digital relationships with our customers to drive incremental traffic and spend, is highly dependent on our technology systems. Our ability to effectively manage our business, launch digital and other initiatives, and coordinate the production, distribution, administration and sale of our products depends significantly on the reliability, integrity and capacity of these systems. We also rely on third-party providers and platforms for some of these information technology systems and support. Additionally, our systems hardware, software and services provided by third-party service providers are not fully redundant within a market or across our markets. Although we have operational safeguards in place, they may not be effective in preventing the failure of these systems or platforms to operate effectively and be available. Such failures may be caused by various factors, including power outages, catastrophic events, physical theft, computer and network failures, inadequate or ineffective redundancy, problems with transitioning to upgraded or replacement systems or platforms, flaws in third-party software or services, errors or improper use by our employees or third party service providers, or a breach in the security of these systems or platforms, including through cyber-attacks such as those that result in the blockage of our or our third-party business partners’ or service providers’ systems and platforms and those discussed in more detail in this risk factors section. If our incident response, disaster recovery and business continuity plans do not resolve these issues in an effective manner they could result in an interruption in our operations and could cause material negative impacts to our product availability and sales, the efficiency of our operations and our financial results. In addition, remediation of any problems with our systems could result in significant, unplanned expenses.
|
•
|
We may not be successful in implementing important strategic initiatives or effectively managing growth, which may have an adverse impact on our business and financial results.
|
There is no assurance that we will be able to implement important strategic initiatives in accordance with our expectations or that they will generate expected returns, which may result in an adverse impact on our business and financial results. These strategic initiatives are designed to create growth, improve our results of operations and drive long-term shareholder value, and include:
|
•
|
being an employer of choice and investing in employees to deliver a superior customer experience;
|
|
•
|
building our leadership position around coffee;
|
|
•
|
driving convenience, brand engagement and digital relationships through our mobile, loyalty, delivery and digital capabilities both domestically and internationally;
|
|
•
|
simplifying store administrative tasks to allow store partners to better engage with customers;
|
|
•
|
increasing the scale of the Starbucks store footprint with disciplined global expansion and introducing flexible and unique store formats;
|
|
•
|
moving to a more licensed store model in some markets and a more company-owned model in other markets;
|
|
•
|
creating new occasions in stores across all dayparts with new product offerings, including our growing lunch food and beverage product lineup;
|
|
•
|
continuing the global growth of our Channel Development business through our supply, distribution and licensing agreements with Nestlé and other Channel Development business partners;
|
|
•
|
delivering continued growth in our cold beverage business, including our tea business through the Teavana brand in our Starbucks
®
retail stores and other channels and internationally; and
|
|
•
|
reducing our general and administrative costs.
|
In addition to other factors listed in this risk factors section, factors that may adversely affect the successful implementation of these initiatives, which could have a material adverse impact on our business and financial results, include the following:
|
•
|
increases in labor costs, including wages and benefits, which, in a retail business such as ours, are two of our most significant costs, both domestically and internationally; these increases include significant and sudden increases in labor costs triggered by regulatory actions regarding wages and scheduling and benefits requirements; they also include increased health care and workers’ compensation insurance costs, as well as increased wages and costs of other
|
13
benefits necessary to attract and retain high quality employees with the right skill sets, whether due to changing industry practices, competition or our expansion into new channels or technology dependent operations;
|
•
|
not successfully developing and implementing new technologies necessary to effectuate our growth strategies, including increasing our digital relationships with customers to drive growth, due to inability to attract and retain qualified high-tech personnel or other factors;
|
|
•
|
increasing competition in channels in which we operate or seek to operate from new and existing large competitors or well-funded smaller ones that sell high-quality specialty coffee beverages;
|
|
•
|
continuing disruption in retail caused by on-line commerce, resulting in reduced foot traffic to “brick & mortar” retail stores;
|
|
•
|
consumers shifting categories of where they spend their discretionary income away from outside-the-home food and beverage;
|
|
•
|
imposition of additional taxes by jurisdictions, such as on certain types of beverages or based on number of employees;
|
|
•
|
construction cost increases associated with new store openings and remodeling of existing stores; delays in store openings for reasons beyond our control or a lack of desirable real estate locations available for lease at reasonable rates, either of which could keep us from meeting annual store opening targets in the U.S. and internationally;
|
|
•
|
not successfully scaling our supply chain infrastructure as our product offerings increase and as we continue to expand, including our emphasis on a broad range of high-quality food offerings;
|
|
•
|
the ability of our licensee partners to implement our growth platforms and product innovation;
|
|
•
|
lack of customer acceptance of new products (including due to price increases necessary to cover the costs of new products or higher input costs), brands (such as the global expansion of the Teavana brand in our Starbucks
®
retail stores and other channels) and platforms (such as features of our mobile technology, changes in our loyalty rewards programs and our delivery services initiatives), or customers reducing their demand for our current offerings as new products are introduced;
|
|
•
|
the degree to which we enter into, maintain, develop and are able to negotiate appropriate terms and conditions of, and enforce, commercial and other agreements and the performance of our business partners under such agreements;
|
|
•
|
not successfully consummating and implementing favorable strategic transactions or integrating acquired businesses, including our East China business;
|
|
•
|
the effects of the Tax Cuts and Jobs Act and related guidance and regulations that may be promulgated; and
|
|
•
|
the deterioration in our credit ratings, which could limit the availability of additional financing and increase the cost of obtaining financing to fund our initiatives.
|
Our Channel Development business is heavily reliant on Nestlé, which acquired the right to sell and distribute our packaged goods and foodservice products to retailers and operators, with few exceptions. If Nestlé fails to perform its distribution and marketing commitments under our agreements and/or fails to support, protect and grow our brand in Channel Development, our Channel Development business could be adversely impacted for a period of time, present long-term challenges to our brand, limit our ability to grow our Channel Development business and have a material adverse impact on our business and financial results. Additionally, our Channel Development business is also in part dependent on the level of support our retail business partners provide our products, and in some markets there are only a few retailers. If our retail business partners do not provide sufficient levels of support for our products, which is at their discretion, it could limit our ability to grow our Channel Development business.
Also, a relatively small number of licensee partners own a large number of licensed stores. If such licensee partners are not able to access sufficient funds or financing, or are otherwise unable to successfully operate and grow their businesses, including their licensed stores, it could have a material adverse effect on our results in the markets in which they operate their licensed stores.
Effectively managing growth can be challenging, particularly as we continue to expand into new channels outside the retail store model, implement our arrangement with Nestlé for most of our global Channel Development business and grow our Teavana brand in our Starbucks
®
retail stores and other channels, as well as expand into new markets internationally where we must balance the need for flexibility and a degree of autonomy for local management against the need for consistency with our goals, philosophy and standards. Growth can make it increasingly difficult to ensure a consistent supply of high-quality raw materials, to locate and hire sufficient numbers of key employees, to maintain an effective system of internal controls for a globally dispersed enterprise and to train employees worldwide to deliver a consistently high-quality product and customer
14
experience. Furthermore, if we are not successful in implementing these strategic initiatives, such as large acquisitions and integrations, we may be required to evaluate whether certain assets, including goodwill and other intangibles, have become impaired. In the event we record an impairment charge, it could have a material impact on our financial results.
|
•
|
We face intense competition in each of our channels and markets, which could lead to reduced profitability.
|
The specialty coffee market is intensely competitive, including with respect to product quality, innovation, service, convenience, such as delivery service and mobile ordering, and price, and we face significant and increasing competition in all these areas in each of our channels and markets. Accordingly, we do not have leadership positions in all channels and markets. In the U.S., the ongoing focus by large competitors in the quick-service restaurant sector on selling high-quality specialty coffee beverages could lead to decreases in customer traffic to Starbucks
®
stores and/or average value per transaction adversely affecting our sales and results of operations. Similarly, continued competition from well-established competitors, or competition from large new entrants or well-funded smaller companies in our domestic and international markets could hinder growth and adversely affect our sales and results of operations in those markets. Many small competitors also continue to open coffee specialty stores in many of our markets across the world, which in the aggregate may also lead to significant decreases of customer traffic to our stores in those markets. Increased competition globally in packaged coffee and tea and single-serve and ready-to-drink coffee beverage markets, including from new and large entrants to this market could adversely affect the profitability of the Channel Development segment. Furthermore, declines in general consumer demand for specialty coffee products for any reason, including due to consumer preference for other products or flattening demand for our products, could have a negative effect on our business.
|
•
|
We are highly dependent on the financial performance of our Americas operating segment.
|
Our financial performance is highly dependent on our Americas operating segment, as it comprised approximately
68%
of consolidated total net revenues in fiscal
2018
. If the Americas operating segment revenue trends slow or decline, especially in our U.S. and Canada markets, our other segments may be unable to make up any significant shortfall and our business and financial results could be adversely affected. And because the Americas segment is relatively mature and produces the large majority of our operating cash flows, such a slowdown or decline could result in reduced cash flows for funding the expansion of our international business and other initiatives and for returning cash to shareholders.
|
•
|
We are increasingly dependent on the success of certain international markets in order to achieve our growth targets.
|
Our future growth increasingly depends on the growth and sustained profitability of certain international markets. Some or all of our international market business units (“MBUs”), which we generally define by the countries in which they operate, may not be successful in their operations or in achieving expected growth, which ultimately requires achieving consistent, stable net revenues and earnings. The performance of these international operations may be adversely affected by economic downturns in one or more of the countries in which our large MBUs operate. A decline in performance of one or more of our significant international MBUs could have a material adverse impact on our consolidated results.
The CAP segment is now one of our two significant profit centers driving our global returns, along with our Americas segment. In particular, our China MBU contributes meaningfully to both consolidated and CAP net revenues and earnings. China is currently our fastest growing market and second largest market overall. With our recent acquisition of the East China business, the China market is now 100% company owned and, along with the U.S. market. Due to the significance of our China market for our profit and growth, we are exposed to risks in China, including the risks mentioned elsewhere below and the following:
|
•
|
the effects of current U.S.-China relations, including rounds of tariff increases and retaliations and increasing restrictive regulations, potential boycotts and increasing anti-Americanism;
|
|
•
|
entry of new competitors to the specialty coffee market in China;
|
|
•
|
changes in economic conditions in China and potential negative effects to the growth of its middle class, wages, labor, inflation discretionary spending and real estate and supply chain costs;
|
|
•
|
ongoing government regulatory reform, including relating to food safety, tariffs and tax, bringing uncertainty and inconsistent interpretations, which may be contrary to ours, as well as potential significant increases in compliance costs;
|
|
•
|
food-safety related matters, including compliance with food-safety regulations and ability to ensure product quality and safety; and
|
|
•
|
the ability to successfully integrate the East China business.
|
Additionally, some factors that will be critical to the success of our international operations overall are different than those affecting our U.S. stores and licensees. Tastes naturally vary by region, and consumers in some MBUs may not embrace our products to the same extent as consumers in the U.S. or other international markets. Occupancy costs and store operating expenses can be higher internationally than in the U.S. due to higher rents for prime store locations or costs of compliance with
15
country-specific regulatory requirements. Because many of our international operations are in an early phase of development, operating expenses as a percentage of related revenues are often higher compared to more developed operations, such as in the U.S. Additionally, our international joint venture partners or licensees may face capital constraints or other factors that may limit the speed at which they are able to expand and develop in a certain market.
Our international operations are also subject to additional inherent risks of conducting business abroad, such as:
|
•
|
foreign currency exchange rate fluctuations, or requirements to transact in specific currencies;
|
|
•
|
changes or uncertainties in economic, legal, regulatory, social and political conditions in our markets, as well as negative effects on U.S. businesses due to increasing anti-American sentiment in certain markets;
|
|
•
|
interpretation and application of laws and regulations, including tax, tariffs, labor, merchandise, anti-bribery and privacy laws and regulations;
|
|
•
|
uncertainties and effects of the implementation of the United Kingdom's referendum to withdraw membership from the European Union (refer to as “Brexit”), including financial, legal, tax and trade implications;
|
|
•
|
restrictive actions of foreign or U.S. governmental authorities affecting trade and foreign investment, especially during periods of heightened tension between the U.S. and such foreign governmental authorities, including protective measures such as export and customs duties and tariffs, government intervention favoring local competitors, and restrictions on the level of foreign ownership;
|
|
•
|
import or other business licensing requirements;
|
|
•
|
the enforceability of intellectual property and contract rights;
|
|
•
|
limitations on the repatriation of funds and foreign currency exchange restrictions due to current or new U.S. and international regulations;
|
|
•
|
in developing economies, the growth rate in the portion of the population achieving sufficient levels of disposable income may not be as fast as we forecast;
|
|
•
|
difficulty in staffing, developing and managing foreign operations and supply chain logistics, including ensuring the consistency of product quality and service, due to governmental actions affecting supply chain logistics, distance, language and cultural differences, as well as challenges in recruiting and retaining high quality employees in local markets;
|
|
•
|
local laws that make it more expensive and complex to negotiate with, retain or terminate employees;
|
|
•
|
delays in store openings for reasons beyond our control, competition with locally relevant competitors or a lack of desirable real estate locations available for lease at reasonable rates, any of which could keep us from meeting annual store opening targets and, in turn, negatively impact net revenues, operating income and earnings per share; and
|
|
•
|
disruption in energy supplies affecting our markets.
|
Moreover, many of the foregoing risks are particularly acute in developing countries, which are important to our long-term growth prospects.
|
•
|
Increases in the cost of high-quality
arabica
coffee beans or other commodities or decreases in the availability of high-quality
arabica
coffee beans or other commodities could have an adverse impact on our business and financial results.
|
We purchase, roast and sell high-quality whole bean
arabica
coffee beans and related coffee products. The price of coffee is subject to significant volatility and has and may again increase significantly due to one or more of the factors described below. The high-quality
arabica
coffee of the quality we seek tends to trade on a negotiated basis at a premium above the “C” price. This premium depends upon the supply and demand at the time of purchase and the amount of the premium can vary significantly. Increases in the “C” coffee commodity price do increase the price of high-quality
arabica
coffee and also impact our ability to enter into fixed-price purchase commitments. We frequently enter into supply contracts whereby the quality, quantity, delivery period, and other negotiated terms are agreed upon, but the date, and therefore price, at which the base “C” coffee commodity price component will be fixed has not yet been established. These are known as price-to-be-fixed contracts. The supply and price of coffee we purchase can also be affected by multiple factors in the producing countries, such as weather (including the potential effects of climate change), natural disasters, crop disease, general increase in farm inputs and costs of production, inventory levels and political and economic conditions, as well as the actions of certain organizations and associations that have historically attempted to influence prices of green coffee through agreements establishing export quotas or by restricting coffee supplies. Speculative trading in coffee commodities can also influence coffee prices. Because of the significance of coffee beans to our operations, combined with our ability to only partially mitigate future price risk through purchasing practices and hedging activities, increases in the cost of high-quality
arabica
coffee beans could have a material
16
adverse impact on our profitability. In addition, if we are not able to purchase sufficient quantities of green coffee due to any of the above factors or to a worldwide or regional shortage, we may not be able to fulfill the demand for our coffee, which could have a material adverse impact on our profitability.
We also purchase significant amounts of dairy products, particularly fluid milk, to support the needs of our company-operated retail stores. Additionally, and although less significant to our operations than coffee or dairy, other commodities, including but not limited to tea and those related to food and beverage inputs, such as cocoa, produce, baking ingredients, meats, eggs and energy, as well as the processing of these inputs, are important to our operations. Increases in the cost of dairy products and other commodities, or lack of availability, whether due to supply shortages, delays or interruptions in processing, or otherwise, especially in international markets, could have a material adverse impact on our profitability.
|
•
|
Our financial condition and results of operations are sensitive to, and may be adversely affected by, a number of factors, many of which are largely outside our control.
|
Our operating results have been in the past and will continue to be subject to a number of factors, many of which are largely outside our control. Any one or more of the factors listed below or described elsewhere in this risk factors section could have a material adverse impact our business, financial condition and/or results of operations:
|
•
|
increases in real estate costs in certain domestic and international markets;
|
|
•
|
adverse outcomes of litigation;
|
|
•
|
severe weather or other natural or man-made disasters affecting a large market or several closely located markets that may temporarily but significantly affect our retail business in such markets; and
|
|
•
|
especially in our larger or fast growing markets, labor discord or disruption, geopolitical events, war, terrorism (including incidents targeting us), political instability, boycotts, increasing anti-American sentiment in certain markets, social unrest, and natural disasters, including health pandemics that lead to avoidance of public places or restrictions on public gatherings such as in our stores.
|
|
•
|
Interruption of our supply chain could affect our ability to produce or deliver our products and could negatively impact our business and profitability.
|
Any material interruption in our supply chain, such as material interruption of roasted coffee supply due to the casualty loss of any of our roasting plants, interruptions in service by our third party logistic service providers or common carriers that ship goods within our distribution channels, trade restrictions, such as increased tariffs or quotas, embargoes or customs restrictions, natural disasters or political disputes and military conflicts that cause a material disruption in our supply chain could have a negative material impact on our business and our profitability.
Additionally, our food, beverage and other products are sourced from a wide variety of domestic and international business partners in our supply chain operations, and in certain cases are produced or sourced by our licensees directly. We rely on these suppliers to provide high quality products and to comply with applicable laws. Our ability to find qualified suppliers who meet our standards and supply products in a timely and efficient manner is a significant challenge, especially with respect to goods sourced from outside the U.S., especially countries or regions with diminished infrastructure, developing or failing economies or experiencing political instability or social unrest, and as we increase our fresh and prepared food offerings. For certain products, we may rely on one or very few suppliers. A supplier's failure to meet our standards, provide products in a timely and efficient manner, or comply with applicable laws is beyond our control. These issues, especially for those products for which we rely on one or few suppliers, could have a material negative impact on our business and profitability.
|
•
|
Failure to meet market expectations for our financial performance and fluctuations in the stock market as a whole will likely adversely affect the market price and volatility of our stock.
|
Failure to meet market expectations going forward, particularly with respect to operating margins, earnings per share, comparable store sales, operating cash flows, shareholder returns and net revenues, will likely result in a decline and/or increased volatility in the market price of our stock. In addition, price and volume fluctuations in the stock market as a whole may affect the market price of our stock in ways that may be unrelated to our financial performance.
|
•
|
The loss of key personnel or difficulties recruiting and retaining qualified personnel could adversely impact our business and financial results.
|
Much of our future success depends on the continued availability and service of senior management personnel. The loss of any of our executive officers or other key senior management personnel could harm our business. We must continue to recruit, retain and motivate management and other employees sufficiently, both to maintain our current business and to execute our strategic initiatives, some of which involve ongoing expansion in business channels outside of our traditional company-operated store model. Our success also depends substantially on the contributions and abilities of our retail store employees whom we rely on to give customers a superior in-store experience and elevate our brand. Accordingly, our performance
17
depends on our ability to recruit and retain high quality employees to work in and manage our stores, both domestically and internationally. Our ability to attract and retain both corporate and retail personnel is also acutely impacted in certain international and domestic markets where the competition for a relatively small number of qualified employees is intense or in markets where large high-tech companies are able to offer more competitive salaries and benefits, as well as where there is a strong economy with many available jobs and intense competition for the available workforce. Additionally, there is intense competition for qualified technology systems developers necessary to develop and implement new technologies for our growth initiatives, including increasing our digital relationships with customers. If we are unable to recruit, retain and motivate employees sufficiently to maintain our current business and support our projected growth, our business and financial performance may be adversely affected.
|
•
|
Failure to comply with applicable laws and changing legal and regulatory requirements could harm our business and financial results.
|
Our policies and procedures are designed to comply with all applicable laws, accounting and reporting requirements, tax rules and other regulations and requirements, including those imposed by the SEC, Nasdaq, and foreign countries, as well as applicable trade, labor, healthcare, privacy (including the European Union’s GDPR, discussed in more detail in this risk factors section), food and beverage, sanitation, safety, environmental, labeling, anti-bribery and corruption and merchandise laws. The complexity of the regulatory environment in which we operate and the related cost of compliance are both increasing due to additional or changing legal and regulatory requirements, our ongoing expansion into new markets and new channels, and the fact that foreign laws occasionally conflict with domestic laws. In addition to potential damage to our reputation and brand, failure by us or our business partners to comply with the various applicable laws and regulations, as well as changes in laws and regulations or the manner in which they are interpreted or applied, may result in litigation, civil and criminal liability, damages, fines and penalties, increased cost of regulatory compliance and restatements of our financial statements and have an adverse impact on our business and financial results.
Item 1B.
Unresolved Staff Comments
None.
|
Item 2.
|
Properties
|
The significant properties used by Starbucks in connection with its roasting, manufacturing, warehousing, distribution and corporate administrative operations, serving all segments, are as follows:
|
Location
|
Approximate Size
in Square Feet |
Purpose
|
||
|
Rancho Cucamonga, CA
|
265,000
|
|
Manufacturing
|
|
|
Washington, DC
|
130,000
|
|
Warehouse and distribution
|
|
|
Augusta, GA
|
131,000
|
|
Manufacturing
|
|
|
Minden, NV (Carson Valley)
|
1,080,000
|
|
Roasting and distribution
|
|
|
York, PA
|
1,957,000
|
|
Roasting, distribution and warehouse
|
|
|
Gaston, SC (Sandy Run)
|
117,000
|
|
Roasting and distribution
|
|
|
Lebanon, TN
|
680,000
|
|
Warehouse and distribution
|
|
|
Stratford, CT
|
196,000
|
|
Warehouse and distribution
|
|
|
Auburn, WA
|
491,000
|
|
Warehouse and distribution
|
|
|
Kent, WA
|
510,000
|
|
Roasting and distribution
|
|
|
Seattle, WA
|
1,283,000
|
|
Corporate administrative
|
|
|
Shanghai, China
|
211,000
|
|
Corporate administrative
|
|
|
Amsterdam, Netherlands
|
97,000
|
|
Roasting and distribution
|
|
|
Samutprakarn, Thailand
|
81,000
|
|
Warehouse and distribution
|
|
We own most of our roasting facilities and lease the majority of our warehousing and distribution locations. As of
September 30, 2018
, Starbucks ha
d
15,341
company-operated stores,
almost all of which are leased. We also lease space in various locations worldwide for regional, district and other administrative offices, training facilities and storag
e. In addition to the locations listed above, we hold inventory at various locations managed by third-party warehouses.
|
Item 3.
|
Legal Proceedings
|
See
Note 15
, Commitments and Contingencies, to the consolidated financial statements included in Item 8 of Part II of this 10-K for information regarding certain legal proceedings in which we are involved.
18
Item 4.
Mine Safety Disclosures
Not applicable.
19
Item 5.
Market for the Registrant’s Common Equity, Related Shareholder Matters and Issuer Purchases of Equity Securities
SHAREHOLDER INFORMATION
MARKET INFORMATION AND DIVIDEND POLICY
Starbucks common stock is traded on NASDAQ, under the symbol “SBUX.”
As of
November 9, 2018
, we had approximately
18,100
shareholders of record. This does not include persons whose stock is in nominee or “street name” accounts through brokers.
Future decisions to pay cash dividends continue to be at the discretion of the Board of Directors and will be dependent on our operating performance, financial condition, capital expenditure requirements and other factors that the Board of Directors considers relevant.
ISSUER PURCHASES OF EQUITY SECURITIES
The following table provides information regarding repurchases of our common stock during the quarter ended
September 30, 2018
:
|
Total
Number of Shares Purchased |
Average
Price Paid per Share |
Total Number
of Shares Purchased as Part of Publicly Announced Plans or Programs (2) |
Maximum
Number of Shares that May Yet Be Purchased Under the Plans or Programs (3) |
||||||||||
|
Period
(1)
|
|||||||||||||
|
July 2, 2018 - July 29, 2018
|
19,506,300
|
|
$
|
50.54
|
|
19,506,300
|
|
87,808,124
|
|
||||
|
July 30, 2018 - August 26, 2018
|
15,000,000
|
|
52.70
|
|
15,000,000
|
|
72,808,124
|
|
|||||
|
August 27, 2018 - September 30, 2018
|
24,000,000
|
|
55.10
|
|
24,000,000
|
|
48,808,124
|
|
|||||
|
Total
|
58,506,300
|
|
$
|
52.96
|
|
58,506,300
|
|
||||||
|
(1)
|
Monthly information is presented by reference to our fiscal months during the fourth quarter of fiscal
2018
.
|
|
(2)
|
Share repurchases are conducted under our ongoing share repurchase program announced in September 2001, which has no expiration date.
|
|
(3)
|
This column includes the total remaining number of shares available for repurchase under the authorization announced on April 26, 2018 as part of our ongoing share repurchase program. These amounts do not include the additional 120 million shares authorized for repurchase announced on November 1, 2018. Shares under our ongoing share repurchase program may be repurchased in open market transactions, including pursuant to a trading plan adopted in accordance with Rule 10b5-1 of the Securities Exchange Act of 1934, or through privately negotiated transactions. The timing, manner, price and amount of repurchases will be determined at the Company's discretion, and the share repurchase program may be suspended, terminated or modified at any time for any reason.
|
20
Performance Comparison Graph
The following graph depicts the total return to shareholders from
September 29, 2013
through
September 30, 2018
, relative to the performance of the Standard & Poor’s 500 Index, the NASDAQ Composite Index and the Standard & Poor’s 500 Consumer Discretionary Sector, a peer group that includes Starbucks. All indices shown in the graph have been reset to a base of 100 as of
September 29, 2013
, and assume an investment of $100 on that date and the reinvestment of dividends paid since that date. The stock price performance shown in the graph is not necessarily indicative of future price performance.
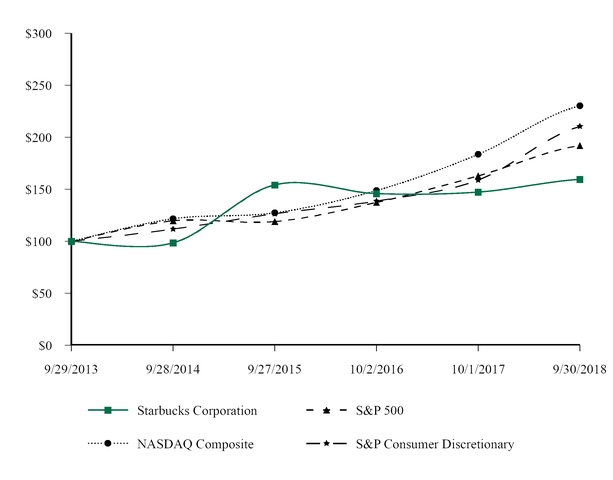
|
|
Sep 29, 2013
|
Sep 28, 2014
|
Sep 27, 2015
|
Oct 2, 2016
|
Oct 1, 2017
|
Sep 30, 2018
|
|||||||||||||||||
|
Starbucks Corporation
|
$
|
100.00
|
|
$
|
98.58
|
|
$
|
154.19
|
|
$
|
145.93
|
|
$
|
147.36
|
|
$
|
159.57
|
|
|||||
|
S&P 500
|
100.00
|
|
119.73
|
|
119.00
|
|
137.36
|
|
162.92
|
|
192.10
|
|
|||||||||||
|
NASDAQ Composite
|
100.00
|
|
121.64
|
|
127.37
|
|
148.79
|
|
183.54
|
|
230.21
|
|
|||||||||||
|
S&P Consumer Discretionary
|
100.00
|
|
111.77
|
|
126.50
|
|
138.69
|
|
158.83
|
|
210.51
|
|
|||||||||||
21
|
Item 6.
|
Selected Financial Data
|
The following selected financial data is derived from the consolidated financial statements. The data below should be read in conjunction with “Management’s Discussion and Analysis of Financial Condition and Results of Operations,” “Risk Factors,” and the consolidated financial statements and notes.
Financial Information (in millions, except per share data):
|
As of and for the Fiscal Year Ended
(1)
|
Sept 30,
2018 (52 Wks) |
Oct 1,
2017 (52 Wks) |
Oct 2,
2016 (53 Wks) |
Sep 27,
2015 (52 Wks) |
Sep 28,
2014 (52 Wks) |
|||||||||||||||
|
Results of Operations
|
||||||||||||||||||||
|
Net revenues:
|
||||||||||||||||||||
|
Company-operated stores
|
$
|
19,690.3
|
|
$
|
17,650.7
|
|
$
|
16,844.1
|
|
$
|
15,197.3
|
|
$
|
12,977.9
|
|
|||||
|
Licensed stores
|
2,652.2
|
|
2,355.0
|
|
2,154.2
|
|
1,861.9
|
|
1,588.6
|
|
||||||||||
|
Other
|
2,377.0
|
|
2,381.1
|
|
2,317.6
|
|
2,103.5
|
|
1,881.3
|
|
||||||||||
|
Total net revenues
|
$
|
24,719.5
|
|
$
|
22,386.8
|
|
$
|
21,315.9
|
|
$
|
19,162.7
|
|
$
|
16,447.8
|
|
|||||
|
Operating income/(loss)
|
$
|
3,883.3
|
|
$
|
4,134.7
|
|
$
|
4,171.9
|
|
$
|
3,601.0
|
|
$
|
3,081.1
|
|
|||||
|
Net earnings including noncontrolling interests
(2)
|
4,518.0
|
|
2,884.9
|
|
2,818.9
|
|
2,759.3
|
|
2,067.7
|
|
||||||||||
|
Net earnings/(loss) attributable to noncontrolling interests
|
(0.3
|
)
|
0.2
|
|
1.2
|
|
1.9
|
|
(0.4
|
)
|
||||||||||
|
Net earnings attributable to Starbucks
(2)
|
4,518.3
|
|
2,884.7
|
|
2,817.7
|
|
2,757.4
|
|
2,068.1
|
|
||||||||||
|
EPS — diluted
(2)
|
3.24
|
|
1.97
|
|
1.90
|
|
1.82
|
|
1.35
|
|
||||||||||
|
Cash dividends declared per share
|
1.32
|
|
1.05
|
|
0.85
|
|
0.68
|
|
0.55
|
|
||||||||||
|
Net cash provided by operating activities
(3)
|
11,937.8
|
|
4,251.8
|
|
4,697.9
|
|
3,881.5
|
|
722.2
|
|
||||||||||
|
Capital expenditures (additions to property, plant and equipment)
|
1,976.4
|
|
1,519.4
|
|
1,440.3
|
|
1,303.7
|
|
1,160.9
|
|
||||||||||
|
Balance Sheet
|
||||||||||||||||||||
|
Total assets
|
$
|
24,156.4
|
|
$
|
14,365.6
|
|
$
|
14,312.5
|
|
$
|
12,404.1
|
|
$
|
10,745.0
|
|
|||||
|
Long-term debt (including current portion)
|
9,440.1
|
|
3,932.6
|
|
3,585.2
|
|
2,335.3
|
|
2,041.3
|
|
||||||||||
|
Shareholders’ equity
|
1,169.5
|
|
5,450.1
|
|
5,884.0
|
|
5,818.0
|
|
5,272.0
|
|
||||||||||
|
(1)
|
Our fiscal year ends on the Sunday closest to September 30. The fiscal year ended on October 2, 2016 included 53 weeks, with the 53
rd
week falling in our fourth fiscal quarter.
|
|
(2)
|
Fiscal 2018 results include a gain not subject to income tax of
$1.4 billion
resulting from the acquisition of our East China joint venture. The impact of the gain to our diluted EPS was $0.99.
|
|
(3)
|
Net cash provided by operating activities for fiscal 2014 through fiscal 2017 have been adjusted for the adoption of new accounting guidance related to excess tax benefits as discussed in
Note 1
, Summary of Significant Accounting Policies.
|
22
Comparable Store Sales:
|
Fiscal Year Ended
|
Sep 30,
2018 |
Oct 1,
2017 |
Oct 2,
2016 |
Sep 27,
2015 |
Sep 28,
2014 |
||||||||||
|
Percentage change in comparable store sales
(1)
|
|||||||||||||||
|
Americas
|
|||||||||||||||
|
Sales growth
|
2
|
%
|
3
|
%
|
6
|
%
|
7
|
%
|
6
|
%
|
|||||
|
Change in transactions
|
(1
|
)%
|
—
|
%
|
1
|
%
|
3
|
%
|
2
|
%
|
|||||
|
Change in ticket
|
3
|
%
|
4
|
%
|
5
|
%
|
4
|
%
|
3
|
%
|
|||||
|
China/Asia Pacific
(2)
|
|||||||||||||||
|
Sales growth
|
1
|
%
|
3
|
%
|
3
|
%
|
9
|
%
|
7
|
%
|
|||||
|
Change in transactions
|
(1
|
)%
|
1
|
%
|
1
|
%
|
8
|
%
|
6
|
%
|
|||||
|
Change in ticket
|
2
|
%
|
1
|
%
|
2
|
%
|
1
|
%
|
—
|
%
|
|||||
|
EMEA
(3)
|
|||||||||||||||
|
Sales growth
|
—
|
%
|
1
|
%
|
—
|
%
|
4
|
%
|
5
|
%
|
|||||
|
Change in transactions
|
(3
|
)%
|
(1
|
)%
|
1
|
%
|
2
|
%
|
3
|
%
|
|||||
|
Change in ticket
|
3
|
%
|
1
|
%
|
—
|
%
|
1
|
%
|
2
|
%
|
|||||
|
Consolidated
|
|||||||||||||||
|
Sales growth
|
2
|
%
|
3
|
%
|
5
|
%
|
7
|
%
|
6
|
%
|
|||||
|
Change in transactions
|
(1
|
)%
|
—
|
%
|
1
|
%
|
3
|
%
|
3
|
%
|
|||||
|
Change in ticket
|
3
|
%
|
3
|
%
|
4
|
%
|
4
|
%
|
3
|
%
|
|||||
|
(1)
|
Includes only Starbucks
®
company-operated stores open 13 months or longer. Comparable store sales exclude the effect of fluctuations in foreign currency exchange rates. For fiscal year 2016, comparable store sales percentages were calculated excluding the 53
rd
week.
|
|
(2)
|
Beginning in December of fiscal 2016, comparable store sales include the results of the 1,009 company-operated stores acquired as part of the acquisition of Starbucks Japan in the first quarter of fiscal 2015.
|
|
(3)
|
Company-operated stores represent 15% of the EMEA segment store portfolio as of September 30, 2018.
|
23
Store Count Data:
|
As of and for the Fiscal Year Ended
|
Sept 30,
2018 (52 Wks) |
Oct 1,
2017 (52 Wks) |
Oct 2,
2016 (53 Wks) |
Sep 27,
2015 (52 Wks) |
Sep 28,
2014 (52 Wks) |
||||||||||
|
Net stores opened/(closed) and transferred during the year:
|
|||||||||||||||
|
Americas
(1)
|
|||||||||||||||
|
Company-operated stores
|
271
|
|
394
|
|
348
|
|
276
|
|
317
|
|
|||||
|
Licensed stores
|
624
|
|
558
|
|
456
|
|
336
|
|
381
|
|
|||||
|
China/Asia Pacific
(2)
|
|||||||||||||||
|
Company-operated stores
|
2,089
|
|
259
|
|
359
|
|
1,320
|
|
250
|
|
|||||
|
Licensed stores
|
(1,038
|
)
|
777
|
|
622
|
|
(482
|
)
|
492
|
|
|||||
|
EMEA
(3)
|
|||||||||||||||
|
Company-operated stores
|
(12
|
)
|
(21
|
)
|
(214
|
)
|
(80
|
)
|
(9
|
)
|
|||||
|
Licensed stores
|
358
|
|
353
|
|
494
|
|
302
|
|
180
|
|
|||||
|
Corporate and Other
(4)
|
|||||||||||||||
|
Company-operated stores
|
(282
|
)
|
(68
|
)
|
(17
|
)
|
6
|
|
12
|
|
|||||
|
Licensed stores
|
(25
|
)
|
2
|
|
(6
|
)
|
(1
|
)
|
(24
|
)
|
|||||
|
Total
|
1,985
|
|
2,254
|
|
2,042
|
|
1,677
|
|
1,599
|
|
|||||
|
Stores open at year end:
|
|||||||||||||||
|
Americas
(1)
|
|||||||||||||||
|
Company-operated stores
|
9,684
|
|
9,413
|
|
9,019
|
|
8,671
|
|
8,395
|
|
|||||
|
Licensed stores
|
7,770
|
|
7,146
|
|
6,588
|
|
6,132
|
|
5,796
|
|
|||||
|
China/Asia Pacific
(2)
|
|||||||||||||||
|
Company-operated stores
|
5,159
|
|
3,070
|
|
2,811
|
|
2,452
|
|
1,132
|
|
|||||
|
Licensed stores
|
3,371
|
|
4,409
|
|
3,632
|
|
3,010
|
|
3,492
|
|
|||||
|
EMEA
(3)
|
|||||||||||||||
|
Company-operated stores
|
490
|
|
502
|
|
523
|
|
737
|
|
817
|
|
|||||
|
Licensed stores
|
2,830
|
|
2,472
|
|
2,119
|
|
1,625
|
|
1,323
|
|
|||||
|
Corporate and Other
(4)
|
|||||||||||||||
|
Company-operated stores
|
8
|
|
290
|
|
358
|
|
375
|
|
369
|
|
|||||
|
Licensed stores
|
12
|
|
37
|
|
35
|
|
41
|
|
42
|
|
|||||
|
Total
|
29,324
|
|
27,339
|
|
25,085
|
|
23,043
|
|
21,366
|
|
|||||
|
(1)
|
Americas store data includes the transfer of 112 company-operated retail stores in Brazil to licensed stores as a result of the sale of our Brazil retail operations in the second quarter of fiscal 2018 and the closure of 132 Target Canada licensed stores in the second quarter of fiscal 2015.
|
|
(2)
|
China/Asia Pacific store data has been adjusted for the transfer of certain company-operated stores to licensed stores in the fourth quarter of fiscal 2014. China/Asia Pacific store data also includes the transfer of 1,009 Japan stores from licensed stores to company-operated as a result of the acquisition of Starbucks Japan in the first quarter of fiscal 2015, the transfer of 133 Singapore stores from company-operated stores to licensed stores in the fourth quarter of fiscal 2017 and the transfer of 1,477 licensed stores in East China to company-operated retail stores as a result of the purchase of our East China joint venture in the first quarter of fiscal 2018.
|
|
(3)
|
EMEA store data also includes the transfer of 144 Germany company-operated retail stores to licensed stores as a result of the sale to AmRest Holdings SE in the third quarter of fiscal 2016.
|
|
(4)
|
As of September 30, 2018, Corporate and Other included 12 licensed Teavana-branded stores.
|
24
|
Item 7.
|
Management’s Discussion and Analysis of Financial Condition and Results of Operations
|
General
Our fiscal year ends on the Sunday closest to September 30. The fiscal years ended on
September 30, 2018
and
October 1, 2017
included 52 weeks. The fiscal year ended on October 2, 2016 included 53 weeks, with the extra week falling in our fourth fiscal quarter. Comparable store sales percentages for fiscal 2016 are calculated excluding the 53
rd
week. All references to store counts, including data for new store openings, are reported net of related store closures, unless otherwise noted.
Financial Highlights
|
•
|
Total net revenues increased
10%
to
$24.7 billion
in fiscal
2018
compared to
$22.4 billion
in fiscal
2017
.
|
|
•
|
Global comparable store sales grew 2% driven by a 3% increase in average ticket.
|
|
•
|
Consolidated operating income decreased to
$3.9 billion
in fiscal
2018
compared to operating income of
$4.1 billion
in fiscal
2017
. Fiscal
2018
operating margin was
15.7%
compared to
18.5%
in fiscal
2017
. Operating margin compression in fiscal
2018
was primarily driven by food and beverage-related mix shifts, largely in the Americas segment, the impact of our ownership change in East China at the end of the first quarter of fiscal 2018, higher restructuring and impairment costs and higher salaries and benefits related to digital platforms, technology infrastructure and innovations.
|
|
•
|
Restructuring and impairment charges increased to
$224 million
in fiscal 2018 compared to
$154 million
in fiscal 2017. Increased costs were primarily related to higher asset impairments associated with the decision to close certain Starbucks
®
company-operated stores in the U.S. and Canada, higher goodwill impairment charges related to our Switzerland retail reporting unit and EMEA restructuring costs.
|
|
•
|
Earnings per share (“EPS”) for fiscal
2018
increased to
$3.24
, compared to EPS of
$1.97
in fiscal 2017. The increase was primarily driven by the gains from the acquisition of our East China joint venture and the sale of our Tazo brand. Additionally, the net favorable impact from the Tax Cuts and Jobs Act (the “Tax Act”) also contributed to the increase.
|
|
•
|
Cash flows from operations were
$11.9 billion
in fiscal
2018
compared to
$4.3 billion
in fiscal
2017
. The change was primarily due to receipt of the upfront payment from Nestlé related to the Global Coffee Alliance.
|
|
•
|
Capital expenditures were
$2.0 billion
in fiscal
2018
compared to
$1.5 billion
in fiscal
2017
.
|
|
•
|
We returned
$8.9 billion
to our shareholders in fiscal
2018
through share repurchases and dividends compared to $3.5 billion in fiscal 2017.
|
Overview
Starbucks results for fiscal 2018 reflect the impact of certain restructuring and streamlining efforts, beginning in the fourth quarter of fiscal 2017, to focus on accelerating growth in high-returning businesses and removing non-core, slow growth activities. These efforts primarily include the acquisition of our East China joint venture, the conversion of our Singapore, Taiwan and Brazil operations to licensed models, the closure of Teavana
TM/MC
retail stores, the sale of the Tazo brand, the licensing of our CPG and foodservice businesses to Nestlé, and the closure of certain company-operated stores in the U.S. and Canada, among other actions. These streamlining efforts span across all segments and our corporate functions.
On August 26, 2018, our Channel Development segment finalized licensing and distribution agreements with Nestlé to sell and market our CPG and foodservice products. The scope of the arrangement converts the majority of our previously defined Channel Development segment operations, as well as certain smaller businesses previously reported in the Americas, EMEA and Corporate and Other (previously All Other Segment), from company-owned to licensed operations with Nestlé. As a result, we realigned our organizational and operating segment structures in support of the newly established Global Coffee Alliance. Our reportable segments have been restated as if those smaller businesses were previously within our Channel Development segment.
Concurrent with the change in reportable operating segments, we revised our prior period financial information to reflect comparable financial information for the new segment structure. Further, in an effort to report operating expenses in line with the corresponding revenue generating activities, we have changed the classification of certain costs, primarily within our CAP segment and mainly from other operating expenses to general and administrative expenses. This reclassification has been retrospectively applied and was determined to be immaterial.
Starbucks largest acquisition to date affects our CAP segment. As a result of acquiring the remaining interest in our East China joint venture at the end of the first quarter of fiscal 2018, we began recording 100% of its revenues and expenses on our consolidated statements of earnings at the beginning of the second quarter of fiscal 2018. This is in contrast with our previous joint venture model, where we recorded only revenues and expenses from products sales to and royalties received from East China, as well as our proportionate share of the joint venture's net profit. The change from equity method to consolidation
25
method lowered the operating margin of our Consolidated and CAP segment, primarily due to incremental depreciation and amortization expenses and lower income from equity investees.
Starbucks results for fiscal
2018
continued to demonstrate the strength of our global business model and our ability to successfully make disciplined investments in our business and our partners. Consolidated total net revenues increased 10% to $24.7 billion, primarily driven by incremental revenues from 1,997 net new store openings over the past 12 months, incremental revenues from the impact of our ownership change in East China, 2% growth in global comparable store sales and favorable foreign currency translation. These increases were partially offset by the absence of revenue related to the closure of our Teavana
TM/MC
retail stores, initiated in the fourth quarter of fiscal 2017 and substantially ceased during fiscal 2018 and the sale of our Singapore retail operations to a licensed partner in the fourth quarter of fiscal 2017. Consolidated operating income declined $251 million, or 6%, to $3.9 billion. Operating margin declined 280 basis points to 15.7%, primarily due to food and beverage-related mix shifts, largely in the Americas segment, the impact of our ownership change in East China, higher restructuring and impairment costs and higher salaries and benefits related to digital platforms, technology infrastructure and innovations. Earnings per share of $3.24 increased 64% over the prior year earnings per share of $1.97.
Americas revenue grew by 7% to $16.7 billion, primarily driven by incremental revenues from 895 net new store openings over the last 12 months and comparable store sales growth of 2%, partially offset by the absence of revenue related to the conversion of our Brazil retail business to fully licensed operations in the second quarter of fiscal 2018. Operating income declined $39 million to $3.6 billion and operating margin of 21.6% declined 180 basis points from a year ago, primarily due to food and beverage-related mix shifts, increased investments in our store partners and the impact of the May 29th anti-bias training. These increases were partially offset by sales leverage.
In our CAP segment, revenue grew by 38% to $4.5 billion, primarily driven by the impact of our ownership change in East China at the end of the first quarter of fiscal 2018, incremental revenues from 756 net new stores over the past 12 months. These increases were partially offset by the absence of revenue related to the sale of our Singapore retail operations to fully licensed operations in the fourth quarter of fiscal 2017. Operating income grew 13% to $867 million, while operating margin declined 420 basis points to 19.4%, primarily due to the impact of our ownership change in East China. We now operate 8,530 stores in 15 markets in our CAP segment making this our second largest reportable segment.
In our EMEA segment, revenue grew by 9% to $1.0 billion, primarily driven by increased revenues from the opening of 356 net new licensed stores over the past 12 months and favorable foreign currency translation. Operating margin declined 400 basis points to 5.9% primarily due to higher impairment of goodwill related to our Switzerland retail business and restructuring costs, including severance, asset impairments and business process optimization expenses. These decreases were partially offset by lapping of a prior year tax settlement.
Channel Development segment revenues grew by 2% to $2.3 billion, primarily driven by increased sales of packaged coffee and premium single-serve products, lapping a prior year revenue deduction adjustment and favorable foreign currency translation. These increases were partially offset by the net impact from the sale of our Tazo brand in the first quarter of fiscal 2018 and licensing our CPG and foodservice businesses to Nestlé beginning on August 26, 2018. Operating income declined $40 million, or 4%, to $927 million. Operating margin declined 250 basis points to 40.4%, primarily driven by business taxes associated with the upfront payment received from Nestlé, Global Coffee Alliance headcount related costs, including employee bonus and retention costs, and the impact of our ownership changes, including licensing our CPG and foodservice businesses to Nestlé and the sale of our Tazo brand.
Fiscal
2019
— The View Ahead
Turning to fiscal
2019
, we expect continued growth through thoughtful long-term investments that create value and reward shareholders. These results are expected to be driven by our three strategic priorities, which include:
|
•
|
Accelerate growth in our targeted, long-term growth markets of the U.S. and China
|
|
•
|
Expand the global reach of the Starbucks brand leveraging the Global Coffee Alliance
|
|
•
|
Sharpen our focus on increasing shareholder returns
|
To successfully achieve these priorities, we will undertake a number of initiatives, including growing our core business in the U.S. through enhancement of the in-store experience, delivery of customer-relevant beverage innovation and digital relationships, and growing our business in China through new store expansion, comparable store sales and business partnerships. Further, we will continue expanding the reach of the Starbucks brand through retail market realignment, including our plans to license the France, Netherlands, Belgium and Luxembourg markets, business simplification and the Global Coffee Alliance. These additional streamlining initiatives will enable us to amplify our focus and resources on core value drivers with the greatest prospect for returns.
We expect moderate revenue growth in fiscal 2019, reflecting implementation of our streamlining activities and driven by comparable store sales growth and the opening of approximately 2,100 net new stores globally.
26
Consolidated operating margin is expected to decrease slightly in fiscal 2019 when compared to fiscal 2018, and our effective tax rate is expected to increase slightly from fiscal 2018. While GAAP full-year diluted earnings per share is expected to decrease in fiscal 2019, full-year non-GAAP diluted earnings per share is expected to grow when excluding gains from acquisitions and divestitures in fiscal 2018, integration costs related to East China and Japan and restructuring and impairment expenses.
Capital expenditures in fiscal
2019
are expected to be approximately $2.0 billion, primarily related to our retail portfolio including investments in our new and existing stores and strategic store-related initiatives.
Acquisitions and Divestitures
See
Note 2
, Acquisitions, Divestitures and Strategic Alliance, to the consolidated financial statements included in Item 8 of Part II of this 10-K for information regarding acquisitions and divestitures.
27
RESULTS OF OPERATIONS — FISCAL
2018
COMPARED TO FISCAL
2017
Consolidated results of operations
(in millions)
:
Revenues
|
Fiscal Year Ended
|
Sep 30,
2018 |
Oct 1,
2017 |
%
Change
|
|||||||
|
Net revenues:
|
||||||||||
|
Company-operated stores
|
$
|
19,690.3
|
|
$
|
17,650.7
|
|
11.6
|
%
|
||
|
Licensed stores
|
2,652.2
|
|
2,355.0
|
|
12.6
|
|
||||
|
Other
|
2,377.0
|
|
2,381.1
|
|
(0.2
|
)
|
||||
|
Total net revenues
|
$
|
24,719.5
|
|
$
|
22,386.8
|
|
10.4
|
%
|
||
Total net revenues increased
$2.3 billion
, or
10%
, over fiscal
2017
, primarily driven by increased revenues from company-operated stores (
$2.0 billion
). The growth in company-operated store revenues was driven by incremental revenues from 816 net new Starbucks
®
company-operated store openings over the past 12 months ($904 million), incremental revenues from the impact of our ownership change in East China ($903 million) and a
2%
increase in comparable store sales ($345 million), attributable to a
3%
increase in average ticket.
Licensed store revenue growth also contributed to the increase in total net revenues (
$297 million
), primarily due to increased product and equipment sales to and royalty revenues from our licensees ($298 million), largely due to the opening of 1,181 net new Starbucks
®
licensed stores over the past 12 months, the conversions of both the Singapore and Taiwan markets to fully licensed in the fourth quarter of fiscal 2017 and the first quarter of fiscal 2018, respectively ($44 million). These increases were partially offset by the impact of our ownership change in East China at the end of the first quarter of fiscal 2018 ($53 million).
Other revenues decreased
$4 million
, primarily driven by the absence of revenue from the sale of our Tazo brand in the first quarter of fiscal 2018 ($56 million), the closure of our e-commerce business in the fourth quarter of fiscal 2017 ($51 million) and licensing our CPG and foodservice businesses to Nestlé late in the fourth quarter of fiscal 2018 ($50 million). Partially offsetting these decreases were increased sales of packaged coffee and premium single-serve products ($115 million).
Operating Expenses
|
Fiscal Year Ended
|
Sep 30,
2018 |
Oct 1,
2017 |
Sep 30,
2018 |
Oct 1,
2017 |
|||||||||
|
As a % of Total
Net Revenues
|
|||||||||||||
|
Cost of sales including occupancy costs
|
$
|
10,174.5
|
|
$
|
9,034.3
|
|
41.2
|
%
|
40.4
|
%
|
|||
|
Store operating expenses
|
7,193.2
|
|
6,493.3
|
|
29.1
|
|
29.0
|
|
|||||
|
Other operating expenses
|
539.3
|
|
500.3
|
|
2.2
|
|
2.2
|
|
|||||
|
Depreciation and amortization expenses
|
1,247.0
|
|
1,011.4
|
|
5.0
|
|
4.5
|
|
|||||
|
General and administrative expenses
|
1,759.0
|
|
1,450.7
|
|
7.1
|
|
6.5
|
|
|||||
|
Restructuring and impairments
|
224.4
|
|
153.5
|
|
0.9
|
|
0.7
|
|
|||||
|
Total operating expenses
|
21,137.4
|
|
18,643.5
|
|
85.5
|
|
83.3
|
|
|||||
|
Income from equity investees
|
301.2
|
|
391.4
|
|
1.2
|
|
1.7
|
|
|||||
|
Operating income
|
$
|
3,883.3
|
|
$
|
4,134.7
|
|
15.7
|
%
|
18.5
|
%
|
|||
|
Store operating expenses as a % of related revenues
|
36.5
|
%
|
36.8
|
%
|
|||||||||
|
Other operating expenses as a % of non-company-operated store revenues
|
10.7
|
%
|
10.6
|
%
|
|||||||||
Cost of sales including occupancy costs as a percentage of total net revenues increased 80 basis points, primarily due to food and beverage-related mix shifts (approximately 120 basis points), largely in the Americas segment.
Store operating expenses as a percentage of total net revenues increased 10 basis points. Store operating expenses as a percentage of company-operated store revenues decreased 30 basis points, primarily driven by the impact of our ownership change in East China (approximately 60 basis points).
Depreciation and amortization expenses as a percentage of total net revenues increased 50 basis points, primarily due to the impact of our ownership change in East China (approximately 60 basis points).
28
General and administrative expenses as a percentage of total net revenues increased 60 basis points, primarily due to higher salaries and benefits related to digital platforms, technology infrastructure and innovations (approximately 20 basis points) and the 2018 U.S. stock award (approximately 20 basis points).
Restructuring and impairment expenses increased $71 million, primarily due to higher asset impairments associated with the decision to close certain company-operated stores in the U.S. and Canada ($23 million), higher goodwill impairment charges associated with our Switzerland company-operated retail reporting unit ($20 million) and EMEA restructuring costs, including severance and asset impairments ($18 million).
Income from equity investees decreased $90 million, primarily due to the impact of ownership changes in our East China and Taiwan joint ventures, partially offset by higher South Korea joint venture income.
The combination of these changes resulted in an overall decrease in operating margin of 280 basis points in fiscal
2018
when compared to fiscal
2017
.
Other Income and Expenses
|
Fiscal Year Ended
|
Sep 30,
2018 |
Oct 1,
2017 |
Sep 30,
2018 |
Oct 1,
2017 |
|||||||||
|
|
|
As a % of Total
Net Revenues
|
|||||||||||
|
Operating income
|
$
|
3,883.3
|
|
$
|
4,134.7
|
|
15.7
|
%
|
18.5
|
%
|
|||
|
Gain resulting from acquisition of joint venture
|
1,376.4
|
|
—
|
|
5.6
|
|
—
|
|
|||||
|
Net gain resulting from divestiture of certain operations
|
499.2
|
|
93.5
|
|
2.0
|
|
0.4
|
|
|||||
|
Interest income and other, net
|
191.4
|
|
181.8
|
|
0.8
|
|
0.8
|
|
|||||
|
Interest expense
|
(170.3
|
)
|
(92.5
|
)
|
(0.7
|
)
|
(0.4
|
)
|
|||||
|
Earnings before income taxes
|
5,780.0
|
|
4,317.5
|
|
23.4
|
|
19.3
|
|
|||||
|
Income tax expense
|
1,262.0
|
|
1,432.6
|
|
5.1
|
|
6.4
|
|
|||||
|
Net earnings including noncontrolling interests
|
4,518.0
|
|
2,884.9
|
|
18.3
|
|
12.9
|
|
|||||
|
Net earnings/(loss) attributable to noncontrolling interests
|
(0.3
|
)
|
0.2
|
|
—
|
|
—
|
|
|||||
|
Net earnings attributable to Starbucks
|
$
|
4,518.3
|
|
$
|
2,884.7
|
|
18.3
|
%
|
12.9
|
%
|
|||
|
Effective tax rate including noncontrolling interests
|
21.8
|
%
|
33.2
|
%
|
|||||||||
Gain resulting from acquisition of joint venture was due to remeasuring our preexisting 50% ownership interest in our East China joint venture to fair value upon acquisition.
Net gain resulting from divestiture of certain operations primarily consists of sales of our Tazo brand and Taiwan joint venture, partially offset by the net loss from the sale of our Brazil retail operations in fiscal 2018. The gain in fiscal 2017 was primarily due to the sale of our Singapore retail operations.
Interest income and other, net increased
$10 million
, primarily due to recognizing higher income on unredeemed stored value card balances, partially offset by lapping the gain on the sale of our investment in Square, Inc. warrants in the prior year period.
Interest expense increased
$78 million
primarily related to additional interest incurred on long-term debt issued in November 2017, March 2018 and August 2018.
The effective tax rate for fiscal
2018
was
21.8%
compared to
33.2%
for fiscal
2017
. The
decrease
in the effective tax rate was primarily due to the gain on the purchase of our East China joint venture that is not subject to income tax (approximately 580 basis points) and the Tax Act (approximately 480 basis points). The impact from the Tax Act primarily included favorability from the lower corporate income tax rate applied to our fiscal 2018 results (approximately 760 basis points) and the remeasurement of our net deferred tax liabilities (approximately 130 basis points). This favorability was partially offset by the estimated transition tax on our accumulated undistributed foreign earnings (approximately 400 basis points). See
Note 13
, Income Taxes, for further discussion.
29
Segment Information
Results of operations by segment
(in millions)
:
Americas
|
Fiscal Year Ended
|
Sep 30,
2018 |
Oct 1,
2017 |
Sep 30,
2018 |
Oct 1,
2017 |
|||||||||
|
|
|
|
As a % of Americas
Total Net Revenues
|
||||||||||
|
Net revenues:
|
|||||||||||||
|
Company-operated stores
|
$
|
14,905.1
|
|
$
|
13,996.4
|
|
89.1
|
%
|
89.6
|
%
|
|||
|
Licensed stores
|
1,814.0
|
|
1,617.3
|
|
10.8
|
|
10.4
|
|
|||||
|
Other
|
13.1
|
|
6.3
|
|
0.1
|
|
—
|
|
|||||
|
Total net revenues
|
16,732.2
|
|
15,620.0
|
|
100.0
|
|
100.0
|
|
|||||
|
Cost of sales including occupancy costs
|
6,301.2
|
|
5,695.0
|
|
37.7
|
|
36.5
|
|
|||||
|
Store operating expenses
|
5,747.9
|
|
5,320.2
|
|
34.4
|
|
34.1
|
|
|||||
|
Other operating expenses
|
150.0
|
|
130.8
|
|
0.9
|
|
0.8
|
|
|||||
|
Depreciation and amortization expenses
|
638.3
|
|
614.9
|
|
3.8
|
|
3.9
|
|
|||||
|
General and administrative expenses
|
247.0
|
|
201.4
|
|
1.5
|
|
1.3
|
|
|||||
|
Restructuring and impairments
|
33.4
|
|
4.1
|
|
0.2
|
|
—
|
|
|||||
|
Total operating expenses
|
13,117.8
|
|
11,966.4
|
|
78.4
|
|
76.6
|
|
|||||
|
Operating income
|
$
|
3,614.4
|
|
$
|
3,653.6
|
|
21.6
|
%
|
23.4
|
%
|
|||
|
Store operating expenses as a % of related revenues
|
38.6
|
%
|
38.0
|
%
|
|||||||||
|
Other operating expenses as a % of non-company-operated store revenues
|
8.2
|
%
|
8.1
|
%
|
|||||||||
Revenues
Americas total net revenues for fiscal
2018
increased
$1.1 billion
, or
7%
, over fiscal
2017
, primarily due to increased revenues from company-operated stores (contributing
$909 million
) and licensed stores (contributing
$197 million
).
The increase in company-operated store revenues was driven by incremental revenues from 383 net new Starbucks
®
company-operated store openings over the past 12 months ($604 million) and a
2%
increase in
comparable store sales ($319 million), attributable to a
3%
increase in average ticket, partially offset by the conversion of our Brazil retail business to fully licensed operations in the second quarter of fiscal 2018 ($40 million).
The increase in licensed store revenues was primarily driven by higher product sales to and royalty revenues from our licensees ($173 million), primarily resulting from the opening of 512 net new Starbucks
®
licensed stores over the past 12 months.
Operating Expenses
Cost of sales including occupancy costs as a percentage of total net revenues increased 120 basis points, primarily due to food and beverage-related mix shifts (approximately 130 basis points).
Store operating expenses as a percentage of total net revenues increased 30 basis points. As a percentage of company-operated store revenues, store operating expenses increased 60 basis points, primarily driven by increased investments in our store partners (approximately 140 basis points), which included incremental investments funded by the Tax Act, partially offset by sales leverage (approximately 60 basis points).
General and administrative expenses as a percentage of total net revenues increased 20 basis points, primarily driven by the May 29th anti-bias training (approximately 20 basis points).
Restructuring and impairment charges increased $29 million due to higher asset impairments in fiscal 2018 compared to fiscal 2017 associated with the decision to close certain U.S. company-operated stores ($23 million) and costs associated with the closure of certain company-operated stores in the U.S. and Canada ($6 million) in fiscal 2018.
The combination of these changes resulted in an overall decrease in operating margin of 180 basis points in fiscal
2018
when compared to fiscal
2017
.
30
CAP
|
Fiscal Year Ended
|
Sep 30,
2018 |
Oct 1,
2017 |
Sep 30,
2018 |
Oct 1,
2017 |
|||||||||
|
As a % of China/Asia Pacific
Total Net Revenues |
|||||||||||||
|
Net revenues:
|
|||||||||||||
|
Company-operated stores
|
$
|
4,096.9
|
|
$
|
2,906.0
|
|
91.6
|
%
|
89.7
|
%
|
|||
|
Licensed stores
|
365.7
|
|
327.4
|
|
8.2
|
|
10.1
|
|
|||||
|
Other
|
11.0
|
|
6.8
|
|
0.2
|
|
0.2
|
|
|||||
|
Total net revenues
|
4,473.6
|
|
3,240.2
|
|
100.0
|
|
100.0
|
|
|||||
|
Cost of sales including occupancy costs
|
1,898.3
|
|
1,396.2
|
|
42.4
|
|
43.1
|
|
|||||
|
Store operating expenses
|
1,148.7
|
|
845.5
|
|
25.7
|
|
26.1
|
|
|||||
|
Other operating expenses
|
22.9
|
|
21.2
|
|
0.5
|
|
0.7
|
|
|||||
|
Depreciation and amortization expenses
|
412.1
|
|
202.2
|
|
9.2
|
|
6.2
|
|
|||||
|
General and administrative expenses
|
241.6
|
|
207.1
|
|
5.4
|
|
6.4
|
|
|||||
|
Total operating expenses
|
3,723.6
|
|
2,672.2
|
|
83.2
|
|
82.5
|
|
|||||
|
Income from equity investees
|
117.4
|
|
197.0
|
|
2.6
|
|
6.1
|
|
|||||
|
Operating income
|
$
|
867.4
|
|
$
|
765.0
|
|
19.4
|
%
|
23.6
|
%
|
|||
|
Store operating expenses as a % of related revenues
|
28.0
|
%
|
29.1
|
%
|
|||||||||
|
Other operating expenses as a % of non-company-operated store revenues
|
6.1
|
%
|
6.3
|
%
|
|||||||||
Discussion of our China/Asia Pacific segment results below reflects the impact of fully consolidating our East China business due to the ownership change from an equity method joint venture to a company-operated market since the acquisition date of December 31, 2017. Under the joint venture model, we recognized royalties and product sales within revenue and related product cost of sales as well as our proportionate share of East China's net earnings, which we recognized within income from equity investees. This resulted in a higher operating margin. Under the company-operated ownership model, East China’s operating results are reflected in most income statement lines of this segment.
Re
venues
China/Asia Pacific total net revenues for fiscal
2018
increased
$1.2 billion
, or
38%
, over fiscal
2017
, primarily driven by higher company-operated store revenues ($1.2 billion) due to the impact of our ownership change in East China ($903 million) and incremental revenues from 443 net new company-operated store openings over the past 12 months ($300 million). Also contributing were favorable foreign currency translation ($82 million) and a
1%
increase in comparable store sales ($26 million). Partially offsetting these increases was the conversion of our Singapore retail business to fully licensed operations in the fourth quarter of fiscal 2017 ($121 million).
Licensed store revenues increased
$38 million
, primarily driven by increased product sales to and royalty revenues from licensees ($44 million), primarily resulting from the opening of 313 net new licensed stores over the past 12 months, the conversion of our Taiwan joint venture to fully licensed operations at the end of the first quarter of fiscal 2018 ($25 million) and the conversion of our Singapore retail operations to fully licensed operations in the fourth quarter of fiscal 2017 ($20 million). These increases were partially offset by the absence of revenue from our ownership change in East China ($53 million).
Operating Expenses
Cost of sales including occupancy costs as a percentage of total net revenues decreased 70 basis points, primarily due to the ownership change in East China (approximately 60 basis points).
Store operating expenses as a percentage of total net revenues decreased 40 basis points. As a percentage of company-operated store revenues, store operating expenses decreased 110 basis points, primarily due to the ownership change in East China (approximately 90 basis points).
General and administrative expenses as a percentage of total revenues decreased 100 basis points, primarily due to sales leverage on salaries and benefits (approximately 50 basis points) and the impact of ownership change in East China (approximately 30 basis points).
Income from equity investees decreased $80 million, primarily due to the impact of our ownership changes in East China and Taiwan joint ventures, partially offset by higher South Korea joint venture income.
31
The combination of these changes resulted in an overall decrease in operating margin of 420 basis points in fiscal
2018
when compared to fiscal
2017
.
EMEA
|
Fiscal Year Ended
|
Sep 30,
2018 |
Oct 1,
2017 |
Sep 30,
2018 |
Oct 1,
2017 |
|||||||||
|
As a % of EMEA
Total Net Revenues |
|||||||||||||
|
Net revenues:
|
|||||||||||||
|
Company-operated stores
|
$
|
575.6
|
|
$
|
551.0
|
|
54.9
|
%
|
57.5
|
%
|
|||
|
Licensed stores
|
471.3
|
|
407.7
|
|
45.0
|
|
42.5
|
|
|||||
|
Other
|
1.1
|
|
—
|
|
0.1
|
|
—
|
|
|||||
|
Total net revenues
|
1,048.0
|
|
958.7
|
|
100.0
|
|
100.0
|
|
|||||
|
Cost of sales including occupancy costs
|
559.2
|
|
508.6
|
|
53.4
|
|
53.1
|
|
|||||
|
Store operating expenses
|
226.0
|
|
214.1
|
|
21.6
|
|
22.3
|
|
|||||
|
Other operating expenses
|
62.8
|
|
51.3
|
|
6.0
|
|
5.4
|
|
|||||
|
Depreciation and amortization expenses
|
31.7
|
|
30.6
|
|
3.0
|
|
3.2
|
|
|||||
|
General and administrative expenses
|
51.7
|
|
41.7
|
|
4.9
|
|
4.3
|
|
|||||
|
Restructuring and impairments
|
55.1
|
|
17.9
|
|
5.3
|
|
1.9
|
|
|||||
|
Total operating expenses
|
986.5
|
|
864.2
|
|
94.1
|
|
90.1
|
|
|||||
|
Operating income
|
$
|
61.5
|
|
$
|
94.5
|
|
5.9
|
%
|
9.9
|
%
|
|||
|
Store operating expenses as a % of related revenues
|
39.3
|
%
|
38.9
|
%
|
|||||||||
|
Other operating expenses as a % of non-company-operated store
|
13.3
|
%
|
12.6
|
%
|
|||||||||
R
evenues
EMEA total net revenues for fiscal
2018
increased
$89 million
, or
9%
, over fiscal
2017
, primarily due to higher revenue from licensed stores ($64 million) and company-operated stores ($25 million).
Company-operated stores increased $25 million, or 4%, primarily due to favorable currency translation ($31 million).
Licensed store revenues increased
$64 million
, or 16%, due to higher product sales to and royalty revenues from our licensees ($56 million), resulting from the opening of 356 net new licensed stores, and favorable foreign currency translation ($4 million).
Operating Expenses
Cost of sales including occupancy costs as a percentage of total net revenues increased 30 basis points, primarily due to growth in our licensed stores which have a lower gross margin (approximately 30 basis points).
Store operating expenses as a percentage of total net revenues decreased 70 basis points. As a percentage of company-operated store revenues, store operating expenses increased 40 basis points, primarily due to sales deleverage on salaries and benefits, largely due to increased minimum wage in certain markets
(approximately 140 basis points), partially offset by lapping a prior year tax settlement (approximately 100 basis points).
Other operating expenses as a percentage of total net revenues increased 60 basis points. Excluding the impact of company-operated store revenues, other operating expenses increased 70 basis points, primarily due to business process optimization expenses (approximately 60 basis points).
General and administrative expenses as a percentage of total net revenues increased 60 basis points, primarily due to business process optimization expenses (approximately 50 basis points).
Restructuring and impairment expenses increased $37 million, primarily due to higher goodwill impairment expense associated with our Switzerland retail reporting unit in fiscal 2018 than in the prior year period ($20 million) and EMEA restructuring costs, including severance and asset impairments ($18 million).
The combination of these changes resulted in an overall decrease in operating margin of 400 basis points in fiscal
2018
when compared to fiscal
2017
.
32
Channel Development
|
Fiscal Year Ended
|
Sep 30,
2018 |
Oct 1,
2017 |
Sep 30,
2018 |
Oct 1,
2017 |
|||||||||
|
As a % of Channel Development
Total Net Revenues |
|||||||||||||
|
Net revenues
|
$
|
2,297.3
|
|
$
|
2,256.6
|
|
|||||||
|
Cost of sales
|
1,252.3
|
|
1,209.3
|
|
54.5
|
|
53.6
|
|
|||||
|
Other operating expenses
|
286.5
|
|
260.4
|
|
12.5
|
|
11.5
|
|
|||||
|
Depreciation and amortization expenses
|
1.3
|
|
3.0
|
|
0.1
|
|
0.1
|
|
|||||
|
General and administrative expenses
|
13.9
|
|
11.3
|
|
0.6
|
|
0.5
|
|
|||||
|
Total operating expenses
|
1,554.0
|
|
1,484.0
|
|
67.6
|
|
65.8
|
|
|||||
|
Income from equity investees
|
183.8
|
|
194.4
|
|
8.0
|
|
8.6
|
|
|||||
|
Operating income
|
$
|
927.1
|
|
$
|
967.0
|
|
40.4
|
%
|
42.9
|
%
|
|||
Discussion of our Channel Development segment results reflect the impact of the licensing of our CPG and foodservice businesses to Nestlé, the sale of Tazo and an immaterial, unfavorable revenue deduction adjustment recorded in the second quarter of fiscal 2017. Late in the fourth quarter of fiscal 2018, we licensed our CPG (Starbucks-, Starbucks Reserve-, Teavana-, Seattle's Best Coffee-, Starbucks VIA- and Torrefazione Italia-branded packaged coffee and tea) and foodservice businesses to Nestlé and formed a Global Coffee Alliance. Eleven months of fiscal 2018 results reflect our CPG and foodservice businesses as company-owned and one month as licensed operations. Our collaborative business relationships for our global ready-to-drink products and the associated revenues remain unchanged due to the Global Coffee Alliance.
Revenues
Channel Development net revenues for fiscal
2018
increased
$41 million
, or
2%
, over fiscal
2017
. Revenue growth was driven by an increase in sales of our packaged coffee and premium single-serve products ($115 million), lapping a prior year revenue deduction adjustment ($13 million) and favorable foreign currency translation ($10 million). These increases were partially offset by the absence of revenue from the sale of our Tazo brand in the first quarter of fiscal 2018 ($56 million) and licensing our CPG and foodservice businesses to Nestlé late in the fourth quarter of fiscal 2018 ($50 million).
Operating Expenses
Cost of sales as a percentage of total net revenues increased 90 basis points, primarily driven by the impact of licensing our CPG and foodservice businesses to Nestlé and the sale of our Tazo brand (approximately 120 basis points), partially offset by lapping a revenue deduction adjustment recorded in the second quarter of fiscal 2017 (approximately 30 basis points).
Other operating expenses as a percentage of total net revenues increased 100 basis points, primarily driven by business taxes associated with the upfront payment received from Nestlé (approximately 120 basis points) and Global Coffee Alliance headcount-related costs, including employee bonus and retention costs (approximately 80 basis points). These increases were partially offset by the cost savings related to our ownership changes, including licensing our CPG and foodservice businesses to Nestlé and the sale of our Tazo brand (approximately 40 basis points), and lower marketing expenses (approximately 40 basis points).
Income from equity investees decreased $11 million for fiscal
2018
, due to lower income from our North American Coffee Partnership joint venture, driven by decreased sales of Frappuccino
®
, Starbucks Doubleshot
®
and Iced Coffee beverages.
The combination of these changes contributed to an overall decrease in operating margin of 250 basis points in fiscal
2018
when compared to fiscal
2017
.
33
Corporate and Other
|
Fiscal Year Ended
|
Sep 30,
2018 |
Oct 1,
2017 |
% Change
|
|||||||
|
Net revenues:
|
||||||||||
|
Company-operated stores
|
$
|
112.7
|
|
$
|
197.3
|
|
(42.9
|
)%
|
||
|
Licensed stores
|
1.2
|
|
2.6
|
|
(53.8
|
)
|
||||
|
Other
|
54.5
|
|
111.4
|
|
(51.1
|
)
|
||||
|
Total net revenues
|
168.4
|
|
311.3
|
|
(45.9
|
)
|
||||
|
Cost of sales including occupancy costs
|
163.5
|
|
225.2
|
|
(27.4
|
)
|
||||
|
Store operating expenses
|
70.6
|
|
113.5
|
|
(37.8
|
)
|
||||
|
Other operating expenses
|
17.1
|
|
36.6
|
|
(53.3
|
)
|
||||
|
Depreciation and amortization expenses
|
163.6
|
|
160.7
|
|
1.8
|
|
||||
|
General and administrative expenses
|
1,204.8
|
|
989.2
|
|
21.8
|
|
||||
|
Restructuring and impairments
|
135.9
|
|
131.5
|
|
3.3
|
|
||||
|
Total operating expenses
|
1,755.5
|
|
1,656.7
|
|
6.0
|
|
||||
|
Operating loss
|
$
|
(1,587.1
|
)
|
$
|
(1,345.4
|
)
|
18.0
|
%
|
||
Corporate and Other primarily consists of our unallocated corporate expenses, the results from Siren Retail, as well as Evolution Fresh and the legacy operations of the Teavana retail business, which substantially ceased during fiscal 2018. Unallocated corporate expenses include corporate administrative functions that support the operating segments but are not specifically attributable to or managed by any segment and are not included in the reported financial results of the operating segments.
RESULTS OF OPERATIONS — FISCAL
2017
COMPARED TO FISCAL
2016
Consolidated results of operations
(in millions)
:
Revenues
|
Fiscal Year Ended
|
Oct 1,
2017 |
Oct 2,
2016 |
%
Change |
|||||||
|
(52 Weeks Ended)
|
(53 Weeks Ended)
|
|||||||||
|
Net revenues:
|
||||||||||
|
Company-operated stores
|
$
|
17,650.7
|
|
$
|
16,844.1
|
|
4.8
|
%
|
||
|
Licensed stores
|
2,355.0
|
|
2,154.2
|
|
9.3
|
|
||||
|
Other
|
2,381.1
|
|
2,317.6
|
|
2.7
|
|
||||
|
Total net revenues
|
$
|
22,386.8
|
|
$
|
21,315.9
|
|
5.0
|
%
|
||
Total net revenues increased $1.1 billion, or 5%, over fiscal 2016, primarily driven by increased revenues from company operated stores ($807 million). The growth in company-operated store revenues was primarily driven by incremental revenues from 768 net new Starbucks
®
company-operated store openings over the past 12 months ($869 million) and a 3% increase in comparable store sales ($496 million), attributable to a 3% increase in average ticket. Partially offsetting these incremental revenues was the absence of the 53rd week ($324 million), the absence of sales from the conversion of certain company operated stores to licensed stores ($121 million) and the impact of unfavorable foreign currency translation ($70 million).
Licensed store revenue growth also contributed to the increase in total net revenue ($201 million), primarily due to increased product sales to and royalty revenues from our licensees ($260 million), largely due to the opening of 1,552 net new Starbucks
®
licensed stores and improved comparable store sales, partially offset by the absence of the 53rd week ($41 million) and unfavorable foreign currency translation ($27 million).
Other revenues increased $64 million, primarily driven by increased sales of packaged coffee, tea and premium single-serve products ($73 million), our ready-to-drink beverages ($21 million) and higher foodservice sales ($26 million). Increased sales were partially offset by the absence of the 53rd week ($47 million) and an unfavorable revenue deduction adjustment pertaining to periods prior to 2017 ($13 million).
34
Operating Expenses
|
Fiscal Year Ended
|
Oct 1,
2017 |
Oct 2,
2016 |
Oct 1,
2017 |
Oct 2,
2016 |
|||||||||
|
(52 Weeks Ended)
|
(53 Weeks Ended)
|
||||||||||||
|
As a % of Total
Net Revenues
|
|||||||||||||
|
Cost of sales including occupancy costs
|
$
|
9,034.3
|
|
$
|
8,509.0
|
|
40.4
|
%
|
39.9
|
%
|
|||
|
Store operating expenses
|
6,493.3
|
|
6,064.3
|
|
29.0
|
|
28.4
|
|
|||||
|
Other operating expenses
|
500.3
|
|
499.2
|
|
2.2
|
|
2.3
|
|
|||||
|
Depreciation and amortization expenses
|
1,011.4
|
|
980.8
|
|
4.5
|
|
4.6
|
|
|||||
|
General and administrative expenses
|
1,450.7
|
|
1,408.9
|
|
6.5
|
|
6.6
|
|
|||||
|
Restructuring and impairments
|
153.5
|
|
—
|
|
0.7
|
|
—
|
|
|||||
|
Total operating expenses
|
18,643.5
|
|
17,462.2
|
|
83.3
|
|
81.9
|
|
|||||
|
Income from equity investees
|
391.4
|
|
318.2
|
|
1.7
|
|
1.5
|
|
|||||
|
Operating income
|
$
|
4,134.7
|
|
$
|
4,171.9
|
|
18.5
|
%
|
19.6
|
%
|
|||
|
Store operating expenses as a % of related revenues
|
36.8
|
%
|
36.0
|
%
|
|||||||||
|
Other operating expenses as a % of non-company-operated store revenues
|
10.6
|
%
|
11.2
|
%
|
|||||||||
Cost of sales including occupancy costs as a percentage of total net revenues increased 50 basis points, primarily driven by a product mix shift (approximately 70 basis points) largely towards premium food in the Americas segment, partially offset by leverage on cost of sales and occupancy costs (approximately 30 basis points).
Store operating expenses as a percentage of total net revenues increased 60 basis points. Store operating expenses as a percentage of company-operated store revenues increased 80 basis points, primarily driven by higher partner and digital investments, largely in the Americas segment (approximately 150 basis points), partially offset by sales leverage (approximately 90 basis points).
Other operating expenses as a percentage of total net revenues decreased 10 basis points. Excluding the impact of company operated store revenues, other operating expenses decreased 60 basis points, primarily due to lower performance-based compensation (approximately 20 basis points).
General and administrative expenses as a percentage of total net revenues decreased 10 basis points, primarily driven by lower performance-based compensation (approximately 30 basis points), and employment taxes, including the lapping of higher employment taxes resulting from a multiple year audit in the prior year (approximately 20 basis points). These were partially offset by increased salaries and benefits related to digital platforms, technology infrastructure and innovations.
Restructuring and impairments charges in fiscal 2017 were primarily the result of our strategic changes in Teavana. We recorded $130 million of restructuring–related costs, including a partial goodwill impairment charge of $69 million, store asset impairments, and costs related to early store closure obligations and severance. Additionally, we recorded $18 million of partial goodwill impairment relating to our Switzerland retail business.
Income from equity investees increased $73 million, due to higher income from our CAP joint venture operations, primarily China and South Korea, as well as our North American Coffee Partnership.
The combination of these changes resulted in an overall decrease in operating margin of 110 basis points in fiscal 2017 when compared to fiscal 2016.
35
Other Income and Expenses
|
Fiscal Year Ended
|
Oct 1,
2017 |
Oct 2,
2016 |
Oct 1,
2017 |
Oct 2,
2016 |
|||||||||
|
(52 Weeks Ended)
|
(53 Weeks Ended)
|
||||||||||||
|
|
|
|
As a % of Total
Net Revenues
|
||||||||||
|
Operating income
|
$
|
4,134.7
|
|
$
|
4,171.9
|
|
18.5
|
%
|
19.6
|
|
|||
|
Net gain resulting from divestiture of certain operations
|
93.5
|
|
5.4
|
|
0.4
|
|
—
|
|
|||||
|
Interest income and other, net
|
181.8
|
|
102.6
|
|
0.8
|
|
0.5
|
|
|||||
|
Interest expense
|
(92.5
|
)
|
(81.3
|
)
|
(0.4
|
)
|
(0.4
|
)
|
|||||
|
Earnings before income taxes
|
4,317.5
|
|
4,198.6
|
|
19.3
|
|
19.7
|
|
|||||
|
Income tax expense
|
1,432.6
|
|
1,379.7
|
|
6.4
|
|
6.5
|
|
|||||
|
Net earnings including noncontrolling interests
|
2,884.9
|
|
2,818.9
|
|
12.9
|
|
13.2
|
|
|||||
|
Net earnings attributable to noncontrolling interests
|
0.2
|
|
1.2
|
|
—
|
|
—
|
|
|||||
|
Net earnings attributable to Starbucks
|
$
|
2,884.7
|
|
$
|
2,817.7
|
|
12.9
|
%
|
13.2
|
%
|
|||
|
Effective tax rate including noncontrolling interests
|
33.2
|
%
|
32.9
|
%
|
|||||||||
Net gain resulting from divestiture of certain operations increased $88 million, primarily due to the gain from the sale of our Singapore retail operations in the fourth quarter of fiscal 2017 ($84 million).
Interest income and other, net increased $79 million, primarily driven by gain in our investment in Square, Inc. warrants ($41 million) and higher income recognized on unredeemed stored value card balances ($44 million).
Interest expense increased $11 million primarily related to additional interest incurred on long-term debt issued in February 2016, May 2016 and March 2017, partially offset by lower interest expense from the repayment of our December 2016 notes.
The effective tax rate for fiscal 2017 was 33.2% compared to 32.9% for fiscal 2016. The increase in the effective tax rate was primarily due to unfavorability from non-deductible goodwill impairment charges recorded in the third quarter of fiscal 2017 (approximately 70 basis points) and the lapping of the release of certain tax reserves in the third quarter of fiscal 2016, primarily related to statute closures (approximately 30 basis points). The increase was partially offset by the largely non-taxable gain on the sale of our Singapore retail operations in the fourth quarter of fiscal 2017 (approximately 70 basis points).
36
Segment Information
Results of operations by segment
(in millions)
:
Americas
|
Fiscal Year Ended
|
Oct 1,
2017 |
Oct 2,
2016 |
Oct 1,
2017 |
Oct 2,
2016 |
|||||||||
|
(52 Weeks Ended)
|
(53 Weeks Ended)
|
||||||||||||
|
|
|
|
As a % of Americas
Total Net Revenues
|
||||||||||
|
Net revenues:
|
|||||||||||||
|
Company-operated stores
|
$
|
13,996.4
|
|
$
|
13,247.4
|
|
89.6
|
%
|
89.7
|
%
|
|||
|
Licensed stores
|
1,617.3
|
|
1,518.5
|
|
10.4
|
|
10.3
|
|
|||||
|
Other
|
6.3
|
|
9.3
|
|
—
|
|
0.1
|
|
|||||
|
Total net revenues
|
15,620.0
|
|
14,775.2
|
|
100.0
|
|
100.0
|
|
|||||
|
Cost of sales including occupancy costs
|
5,695.0
|
|
5,254.2
|
|
36.5
|
|
35.6
|
|
|||||
|
Store operating expenses
|
5,320.2
|
|
4,909.3
|
|
34.1
|
|
33.2
|
|
|||||
|
Other operating expenses
|
130.8
|
|
97.1
|
|
0.8
|
|
0.7
|
|
|||||
|
Depreciation and amortization expenses
|
614.9
|
|
590.0
|
|
3.9
|
|
4.0
|
|
|||||
|
General and administrative expenses
|
201.4
|
|
186.1
|
|
1.3
|
|
1.3
|
|
|||||
|
Restructuring and impairments
|
4.1
|
|
—
|
|
—
|
|
—
|
|
|||||
|
Total operating expenses
|
11,966.4
|
|
11,036.7
|
|
76.6
|
|
74.7
|
|
|||||
|
Income from equity investees
|
—
|
|
—
|
|
—
|
|
—
|
|
|||||
|
Operating income
|
$
|
3,653.6
|
|
$
|
3,738.5
|
|
23.4
|
%
|
25.3
|
%
|
|||
|
Store operating expenses as a % of related revenues
|
38.0
|
%
|
37.1
|
%
|
|||||||||
|
Other operating expenses as a % of non-company-operated store revenues
|
8.1
|
%
|
6.4
|
%
|
|||||||||
Revenues
Americas total net revenues for fiscal 2017 increased $845 million, or 6%, over fiscal 2016, primarily due to increased revenues from company-operated stores (contributing $749 million) and licensed stores (contributing $99 million).
The increase in company-operated store revenues was driven by incremental revenues from 383 net new Starbucks® company-operated store openings over the past 12 months ($585 million) and a 3% increase in comparable store sales ($426 million), attributable to a 4% increase in average ticket, partially offset by the absence of the 53rd week ($258 million).
The increase in licensed store revenues was primarily driven by increased product sales to and royalty revenues from our licensees ($127 million), primarily resulting from the opening of 569 net new Starbucks® licensed stores over the past 12 months and improved comparable store sales, partially offset by the absence of the 53rd week ($31 million).
Operating Expenses
Cost of sales including occupancy costs as a percentage of total net revenues increased 90 basis points, primarily due to a product mix shift (approximately 90 basis points) largely towards premium food.
Store operating expenses as a percentage of total net revenues increased 90 basis points. As a percentage of company-operated store revenues, store operating expenses increased 90 basis points, primarily driven by increased partner and digital investments (approximately 180 basis points), partially offset by sales leverage on salaries and benefits (approximately 80 basis points).
Other operating expenses as a percentage of total net revenues increased 10 basis points. Excluding the impact of company-operated store revenues, other operating expenses increased 170 basis points, primarily due to lapping a settlement received in the fourth quarter of fiscal 2016 related to the closure of Target Canada stores in fiscal 2015 (approximately 120 basis points).
Restructuring and impairment charges of $4 million related to asset impairments of certain company-operated stores in Canada.
The combination of these changes resulted in an overall decrease in operating margin of 190 basis points in fiscal 2017 when compared to fiscal 2016.
37
CAP
|
Fiscal Year Ended
|
Oct 1,
2017 |
Oct 2,
2016 |
Oct 1,
2017 |
Oct 2,
2016 |
|||||||||
|
(52 Weeks Ended)
|
(53 Weeks Ended)
|
||||||||||||
|
As a % of China/Asia Pacific
Total Net Revenues |
|||||||||||||
|
Net revenues:
|
|||||||||||||
|
Company-operated stores
|
$
|
2,906.0
|
|
$
|
2,640.4
|
|
89.7
|
%
|
89.8
|
%
|
|||
|
Licensed stores
|
327.4
|
|
292.3
|
|
10.1
|
|
9.9
|
|
|||||
|
Other
|
6.8
|
|
6.1
|
|
0.2
|
|
0.2
|
|
|||||
|
Total net revenues
|
3,240.2
|
|
2,938.8
|
|
100.0
|
|
100.0
|
|
|||||
|
Cost of sales including occupancy costs
|
1,396.2
|
|
1,298.9
|
|
43.1
|
|
44.2
|
|
|||||
|
Store operating expenses
|
845.5
|
|
779.4
|
|
26.1
|
|
26.5
|
|
|||||
|
Other operating expenses
|
21.2
|
|
24.2
|
|
0.7
|
|
0.8
|
|
|||||
|
Depreciation and amortization expenses
|
202.2
|
|
180.6
|
|
6.2
|
|
6.1
|
|
|||||
|
General and administrative expenses
|
207.1
|
|
174.2
|
|
6.4
|
|
5.9
|
|
|||||
|
Total operating expenses
|
2,672.2
|
|
2,457.3
|
|
82.5
|
|
83.6
|
|
|||||
|
Income from equity investees
|
197.0
|
|
150.1
|
|
6.1
|
|
5.1
|
|
|||||
|
Operating income
|
$
|
765.0
|
|
$
|
631.6
|
|
23.6
|
%
|
21.5
|
%
|
|||
|
Store operating expenses as a % of related revenues
|
29.1
|
%
|
29.5
|
%
|
|||||||||
|
Other operating expenses as a % of non-company-operated store revenues
|
6.3
|
%
|
8.1
|
%
|
|||||||||
Revenues
China/Asia Pacific total net revenues for fiscal 2017 increased $301 million, or 10%, over fiscal 2016, primarily from higher company-operated store revenues ($266 million), driven by incremental revenues from 392 net new company-operated store
openings over the past 12 months ($293 million). Also contributing was a 3% increase in comparable store sales ($67 million), partially offset by the absence of the 53rd week ($52 million) and unfavorable foreign currency translation ($40 million).
Licensed store revenues increased $35 million, primarily driven by increased product sales to and royalty revenues from licensees ($39 million), primarily resulting from the opening of 644 net new licensed stores over the past 12 months, partially offset the absence of the 53rd week ($4 million).
Operating Expenses
Cost of sales including occupancy costs as a percentage of total net revenues decreased 110 basis points, primarily driven by favorability from the transition to China's new value added tax structure (approximately 120 basis points).
Store operating expenses as a percentage of total net revenues decreased 40 basis points. As a percentage of company-operated store revenues, store operating expenses decreased 40 basis points, primarily due to sales leverage on salaries and benefits (approximately 30 basis points) and lower performance-based compensation in Japan (approximately 10 basis points).
Other operating expenses as a percentage of total net revenues decreased 10 basis points. Excluding the impact of company operated store revenues, other operating expenses decreased 180 basis points, primarily due to lower performance-based compensation (approximately 100 basis points) and timing of certain reimbursable expenses (approximately 90 basis points).
General and administrative expenses as a percentage of total revenues increased 50 basis points, primarily due to continued focus and investment in product quality and innovation (approximately 20 basis points) and higher salaries and benefits (approximately 20 basis points).
Income from equity investees increased $47 million, driven by higher income from our joint venture operations, primarily in East China and South Korea. Favorability in both regions was attributable to comparable store sales growth and the addition of net new licensed stores over the past 12 months. East China also benefited from the new value added tax structure.
The combination of these changes resulted in an overall increase in operating margin of 210 basis points in fiscal 2017 when compared to fiscal 2016.
38
EMEA
|
Fiscal Year Ended
|
Oct 1,
2017 |
Oct 2,
2016 |
Oct 1,
2017 |
Oct 2,
2016 |
|||||||||
|
(52 Weeks Ended)
|
(53 Weeks Ended)
|
||||||||||||
|
As a % of EMEA
Total Net Revenues |
|||||||||||||
|
Net revenues:
|
|||||||||||||
|
Company-operated stores
|
$
|
551.0
|
|
$
|
732.0
|
|
57.5
|
%
|
68.3
|
%
|
|||
|
Licensed stores
|
407.7
|
|
339.5
|
|
42.5
|
|
31.7
|
|
|||||
|
Total net revenues
|
958.7
|
|
1,071.5
|
|
100.0
|
|
100.0
|
|
|||||
|
Cost of sales including occupancy costs
|
508.6
|
|
540.7
|
|
53.1
|
|
50.5
|
|
|||||
|
Store operating expenses
|
214.1
|
|
260.6
|
|
22.3
|
|
24.3
|
|
|||||
|
Other operating expenses
|
51.3
|
|
49.4
|
|
5.4
|
|
4.6
|
|
|||||
|
Depreciation and amortization expenses
|
30.6
|
|
39.9
|
|
3.2
|
|
3.7
|
|
|||||
|
General and administrative expenses
|
41.7
|
|
51.4
|
|
4.3
|
|
4.8
|
|
|||||
|
Restructuring and impairments
|
17.9
|
|
—
|
|
1.9
|
|
—
|
|
|||||
|
Total operating expenses
|
864.2
|
|
942.0
|
|
90.1
|
|
87.9
|
|
|||||
|
Income from equity investees
|
—
|
|
1.5
|
|
—
|
|
0.1
|
|
|||||
|
Operating income
|
$
|
94.5
|
|
$
|
131.0
|
|
9.9
|
%
|
12.2
|
%
|
|||
|
Store operating expenses as a % of related revenues
|
38.9
|
%
|
35.6
|
%
|
|||||||||
|
Other operating expenses as a % of non-company-operated store revenues
|
12.6
|
%
|
14.6
|
%
|
|||||||||
Revenues
EMEA total net revenues for fiscal 2017 decreased $113 million, or 11%, over fiscal 2016. The decrease was primarily due to a decline in company-operated store revenues ($181 million), driven by the shift to more licensed stores in the region ($121 million), which includes the absence of revenues related to the sale of our Germany retail operations in the third quarter of fiscal 2016. Also contributing to the decline was unfavorable foreign currency translation ($43 million) and the absence of the 53rd week ($11 million).
Licensed store revenues increased $68 million, driven by higher product sales to and royalty revenues from our licensees ($95 million), resulting from the opening of 339 net new licensed stores and the transfer of 14 company-operated stores to licensed stores over the past 12 months. These increases were partially offset by unfavorable foreign currency translation ($24 million) and the absence of the 53rd week ($6 million).
Operating Expenses
Cost of sales including occupancy costs as a percentage of total net revenues increased 260 basis points, primarily due to unfavorable foreign currency transactions (approximately 150 basis points) and the shift in the composition of our store portfolio to more licensed stores, which have a lower gross margin (approximately 100 basis points).
Store operating expenses as a percentage of total net revenues decreased 200 basis points. As a percentage of company-operated store revenues, store operating expenses increased 330 basis points, primarily due to sales deleverage in certain company-operated stores (approximately 320 basis points) and the impact of a tax settlement (approximately 100 basis points), partially offset by the shift in the portfolio towards more licensed stores (approximately 140 basis points).
Other operating expenses as a percentage of total net revenues increased 80 basis points. Excluding the impact of company operated store revenues, other operating expenses decreased 200 basis points, primarily due to sales leverage driven by the shift to more licensed stores (approximately 160 basis points).
Depreciation and amortization expenses as a percentage of total net revenues decreased 50 basis points, primarily due to the shift in portfolio towards more licensed stores (approximately 50 basis points).
Restructuring and impairment charges in fiscal 2017 relate to a partial goodwill impairment expense recorded in our Switzerland company-operated retail reporting unit, which we fully acquired in the fourth quarter of fiscal 2011. The overall economic backdrop in Europe, coupled with the strengthening of the Swiss franc when compared to the relatively inexpensive euro in surrounding countries, caused ongoing unfavorable changes in consumer behavior and depressed tourism. Our latest mitigation efforts for our Switzerland retail business are not expected to fully recover the reporting unit's carrying value given
39
the sustained nature of these and other external factors. As a result, we recorded a goodwill impairment charge of $18 million in the third quarter of fiscal 2017.
The combination of these changes resulted in an overall decrease in operating margin of 230 basis points in fiscal 2017 when compared to fiscal 2016.
Channel Development
|
Fiscal Year Ended
|
Oct 1,
2017 |
Oct 2,
2016 |
Oct 1,
2017 |
Oct 2,
2016 |
|||||||||
|
(52 Weeks Ended)
|
(53 Weeks Ended)
|
||||||||||||
|
|
|
|
As a % of Channel Development
Total Net Revenues |
||||||||||
|
Total net revenues
|
$
|
2,256.6
|
|
$
|
2,195.1
|
|
|
|
|
|
|||
|
Cost of sales
|
1,209.3
|
|
1,191.8
|
|
53.6
|
|
54.3
|
|
|||||
|
Other operating expenses
|
260.4
|
|
270.7
|
|
11.5
|
|
12.3
|
|
|||||
|
Depreciation and amortization expenses
|
3.0
|
|
3.9
|
|
0.1
|
|
0.2
|
|
|||||
|
General and administrative expenses
|
11.3
|
|
18.0
|
|
0.5
|
|
0.8
|
|
|||||
|
Total operating expenses
|
1,484.0
|
|
1,484.4
|
|
65.8
|
|
67.6
|
|
|||||
|
Income from equity investees
|
194.4
|
|
166.6
|
|
8.6
|
|
7.6
|
|
|||||
|
Operating income
|
$
|
967.0
|
|
$
|
877.3
|
|
42.9
|
%
|
40.0
|
%
|
|||
Discussion of our Channel Development segment results reflects the impact of an unfavorable revenue deduction adjustment recorded in the second quarter of fiscal 2017. While this adjustment was immaterial, the discussion below quantifies the impact to provide a better understanding of our results for fiscal 2017.
Revenues
Channel Development total net revenues for fiscal 2017 increased $62 million, or 3%, over fiscal 2016. Revenue growth was driven by increased sales of packaged coffee, tea and premium single-serve products ($73 million), our ready-to-drink beverages ($21 million) and higher foodservice sales ($26 million). Higher foodservice sales were primarily the result of a change to a direct distribution model and recognizing the benefit of full revenue from premium single-serve product sales. Increased sales were partially offset by the absence of the 53rd week ($45 million) and an unfavorable revenue deduction adjustment pertaining to prior periods ($13 million).
Operating Expenses
Cost of sales as a percentage of total net revenues decreased 70 basis points, primarily driven by lower coffee costs (approximately 80 basis points) and leverage on cost of sales (approximately 60 basis points), partially offset by a shift toward lower margin products (approximately 80 basis points) and the revenue deduction adjustment pertaining to prior periods (approximately 30 basis points).
Other operating expenses as a percentage of total net revenues decreased 80 basis points, primarily driven by lower performance-based compensation (approximately 40 basis points).
General and administrative expenses as a percentage of total net revenues decreased 30 basis points, primarily driven by lower performance-based compensation (approximately 20 basis points) and salaries and benefits (approximately 10 basis points).
Income from equity investees increased $28 million for fiscal 2017, due to higher income from our North American Coffee Partnership joint venture, driven by increased sales of Frappuccino® and Starbucks Doubleshot® beverages as well as new product launches over the past 12 months.
The combination of these changes contributed to an overall increase in operating margin of 290 basis points in fiscal 2017 when compared to fiscal 2016.
40
Corporate and Other
|
Fiscal Year Ended
|
Oct 1,
2017 |
Oct 2,
2016 |
%
Change
|
|||||||
|
(52 Weeks Ended)
|
(53 Weeks Ended)
|
|||||||||
|
Net revenues:
|
||||||||||
|
Company-operated stores
|
$
|
197.3
|
|
$
|
224.3
|
|
(12.0
|
)%
|
||
|
Licensed stores
|
2.6
|
|
3.9
|
|
(33.3
|
)%
|
||||
|
Other
|
111.4
|
|
107.1
|
|
4.0
|
|
||||
|
Total net revenues
|
311.3
|
|
335.3
|
|
(7.2
|
)
|
||||
|
Cost of sales including occupancy costs
|
225.2
|
|
223.4
|
|
0.8
|
|
||||
|
Store operating expenses
|
113.5
|
|
115.0
|
|
(1.3
|
)
|
||||
|
Other operating expenses
|
36.6
|
|
57.8
|
|
(36.7
|
)
|
||||
|
Depreciation and amortization expenses
|
160.7
|
|
166.4
|
|
(3.4
|
)
|
||||
|
General and administrative expenses
|
989.2
|
|
979.2
|
|
1.0
|
|
||||
|
Restructuring and impairments
|
131.5
|
|
—
|
|
nm
|
|
||||
|
Total operating expenses
|
1,656.7
|
|
1,541.8
|
|
7.5
|
|
||||
|
Operating loss
|
$
|
(1,345.4
|
)
|
$
|
(1,206.5
|
)
|
11.5
|
%
|
||
Corporate and Other includes the results of our Teavana, Siren Retail, Evolution Fresh and our unallocated corporate expenses. Unallocated corporate expenses include corporate administrative functions that support the operating segments but are not specifically attributable to or managed by any segment and are not included in the reported financial results of the operating segments.
The increase in the operating loss in fiscal 2017 compared to fiscal 2016 was primarily due to restructuring and impairment charges related to our strategy to close Teavana
TM/MC
retail stores and focus on Teavana
TM/MC
tea within Starbucks
®
stores. We recorded $69 million for the partial impairment of goodwill and $60 million in restructuring-related costs, including asset impairments, costs associated with the early closure of stores and their related obligations, and severance.
FINANCIAL CONDITION, LIQUIDITY AND CAPITAL RESOURCES
Cash and Investment Overview
Our cash and investments were
$9.2 billion
and
$3.2 billion
as of
September 30, 2018
and
October 1, 2017
, respectively with the increase driven primarily by the upfront payment associated with the Global Coffee Alliance. We actively manage our cash and investments in order to internally fund operating needs, make scheduled interest and principal payments on our borrowings, make acquisitions, and return cash to shareholders through common stock cash dividend payments and share repurchases. Our investment portfolio primarily includes highly liquid available-for-sale securities, including corporate debt securities, government treasury securities (domestic and foreign), mortgage and asset-backed securities, commercial paper, and agency obligations. As of
September 30, 2018
, approximately
$1.3 billion
of cash was held in foreign subsidiaries.
Borrowing capacity
Our $2.0 billion unsecured 5-year revolving credit facility (the “2018 credit facility”) and our $1.0 billion unsecured 364-Day credit facility (the “364-day credit facility”) are available for working capital, capital expenditures and other corporate purposes, including acquisitions and share repurchases.
The 2018 credit facility, of which
$150 million
may be used for issuances of letters of credit, is currently set to mature on
October 25, 2022
. We have the option, subject to negotiation and agreement with the related banks, to increase the maximum commitment amount by an additional
$500 million
. Borrowings under the credit facility will bear interest at a variable rate based on LIBOR, and, for U.S. dollar-denominated loans under certain circumstances, a Base Rate (as defined in the credit facility), in each case plus an applicable margin. The applicable margin is based on the better of (i) the Company's long-term credit ratings assigned by Moody's and Standard & Poor's rating agencies and (ii) the Company's fixed charge coverage ratio, pursuant to a pricing grid set forth in the five-year credit agreement. The current applicable margin is
0.680%
for Eurocurrency Rate Loans and
0.00%
(nil) for Base Rate Loans.
The 364-day credit facility, of which no amount may be used for issuances of letters of credit, was originally set to mature on October 25, 2018. In the first quarter of fiscal 2019, the maturity has been extended to October 23, 2019. We have the option, subject to negotiation and agreement with the related banks, to increase the maximum commitment amount by an additional
$500 million
. Borrowings under the credit facility will bear interest at a variable rate based on LIBOR, and, for U.S. dollar-
41
denominated loans under certain circumstances, a Base Rate (as defined in the credit facility), in each case plus an applicable margin. The applicable margin was increased from
0.585%
to 0.92% for Eurocurrency Rate Loans and
0.00%
(nil) for Base Rate Loans as a result of the extension.
Both credit facilities contain provisions requiring us to maintain compliance with certain covenants, including a minimum fixed charge coverage ratio, which measures our ability to cover financing expenses. As of
September 30, 2018
, we were in compliance with all applicable credit facility covenants. No amounts were outstanding under our credit facility as of
September 30, 2018
.
Under our commercial paper program, we may issue unsecured commercial paper notes up to a maximum aggregate amount outstanding at any time of
$3 billion
, with individual maturities that may vary but not exceed
397 days
from the date of issue. Amounts outstanding under the commercial paper program are required to be backstopped by available commitments under our credit facilities discussed above. The proceeds from borrowings under our commercial paper program may be used for working capital needs, capital expenditures and other corporate purposes, including, but not limited to, business expansion, payment of cash dividends on our common stock and share repurchases. As of
September 30, 2018
, we had no borrowings under our commercial paper program.
In
August 2018
, we issued long-term debt in an underwritten registered public offering, which consisted of
$1.25 billion
of
7
-year
3.800%
Senior Notes (the “2025 notes”) due
August 2025
,
$750 million
of
10
-year
4.000%
Senior Notes (the “2028 notes”) due
November 2028
and
$1 billion
of
30
-year
4.500%
Senior Notes (the “2048 notes”) due
November 2048
. Interest on the 2025 notes is payable semi-annually on February 15 and August 15, commencing on February 15, 2019. Interest on the 2028 and 2048 notes is payable semi-annually on May 15 and November 15, commencing on November 15, 2018.
In February 2018, we issued long-term debt in an underwritten registered public offering, which consisted of
$1 billion
of
5
-year
3.100%
Senior Notes (the “2023 notes”) due
March 2023
and
$600 million
of
10
-year
3.500%
Senior Notes (the “2028 notes”) due
March 2028
. Interest on the 2023 and 2028 notes is payable semi-annually on March 1 and September 1, commencing on September 1, 2018.
In November 2017, we issued long-term debt in an underwritten registered public offering, which consisted of
$500 million
of
3
-year
2.200%
Senior Notes (the “2020 notes”) due
November 2020
and
$500 million
of
30
-year
3.750%
Senior Notes (the “2047 notes”) due
December 2047
. Interest on the 2020 notes is payable semi-annually on May 22 and November 22, commencing on May 22, 2018 and interest on the 2047 notes is payable semi-annually on June 1 and December 1, commencing on June 1, 2018.
The net proceeds from these offerings are used for general corporate purposes, including repurchases of our common stock under our ongoing share repurchase program and payment of dividends.
See
Note 9
, Debt, to the consolidated financial statements included in Item 8 of Part II of this 10-K for details of the components of our long-term debt.
The indentures under which all of our Senior Notes were issued require us to maintain compliance with certain covenants, including limits on future liens and sale and leaseback transactions on certain material properties. As of
September 30, 2018
, we were in compliance with all applicable covenants.
Use of Cash
We expect to use our available cash and investments, including, but not limited to, additional potential future borrowings under the credit facilities, commercial paper program and the issuance of debt, to invest in our core businesses, including capital expenditures, new product innovations, related marketing support and partner and digital investments, return cash to shareholders through common stock cash dividend payments and share repurchases, as well as other new business opportunities related to our core and other developing businesses. Further, we may use our available cash resources to make proportionate capital contributions to our investees. We may also seek strategic acquisitions to leverage existing capabilities and further build our business in support of our growth agenda. Acquisitions may include increasing our ownership interests in our investees. Any decisions to increase such ownership interests will be driven by valuation and fit with our ownership strategy.
We believe that future cash flows generated from operations and existing cash and investments both domestically and internationally combined with our ability to leverage our balance sheet through the issuance of debt will be sufficient to finance capital requirements for our core businesses as well as any shareholder distributions for the foreseeable future. Significant new joint ventures, acquisitions and/or other new business opportunities may require additional outside funding. We have borrowed funds and continue to believe we have the ability to do so at reasonable interest rates; however, additional borrowings would result in increased interest expense in the future. In this regard, we may incur additional debt, within targeted levels, as part of our plans to fund our capital programs, including cash returns to shareholders through dividends and share repurchases.
We have historically considered the majority of undistributed earnings of our foreign subsidiaries and equity investees to be indefinitely reinvested, and, accordingly, no foreign withholding taxes have been provided on such earnings. We continue to
42
evaluate our plans for reinvestment or repatriation of unremitted foreign earnings and thus have not adjusted our previous indefinite reinvestment assertions for the effects of the Tax Act. We have not, nor do we anticipate the need for, repatriated funds to the U.S. to satisfy domestic liquidity needs. However, the Tax Act requires a one-time transition tax for deemed repatriation of accumulated undistributed earnings of certain foreign investments. This one-time transition tax is payable over eight years, with most of the cash outlay expected to be made in the later years. In connection with our initial analysis, we have estimated a provisional amount of $262 million, of which $237 million of income taxes payable was included in other long-term liabilities on the consolidated balance sheet, as of
September 30, 2018
. See
Note 13
, Income Taxes, for further discussion.
We regularly review our cash positions and our determination of permanent reinvestment of foreign earnings. In the event we determine that all or a portion of such foreign earnings are no longer indefinitely reinvested, we may be subject to additional foreign withholding taxes and U.S. state income taxes, beyond the Tax Act's one-time transition tax, which could be material.
During each of the first three quarters of fiscal
2017
, we declared a cash dividend to shareholders of
$0.25
per share. In the fourth quarter of fiscal
2017
and each of the first two quarters of fiscal
2018
, we declared a cash dividend of
$0.30
per share, and we declared
$0.36
per share in the last two quarters of fiscal 2018. Dividends are paid in the quarter following the declaration date. Cash returned to shareholders through dividends in fiscal
2018
and
2017
totaled
$1.7 billion
and
$1.5 billion
, respectively. In the fourth quarter of fiscal
2018
, we declared a cash dividend of
$0.36
per share to be paid on
November 30, 2018
with an expected payout of approximately
$445 million
.
During fiscal years
2018
and
2017
, we repurchased
131.5 million
and
37.5 million
shares of common stock, respectively, or
$7.2 billion
and
$2.1 billion
, respectively, under our ongoing share repurchase program. In early fiscal 2019, we commenced the repurchase of
$5.0 billion
of our common stock under accelerated share repurchase agreements.
Other than normal operating expenses, cash requirements for fiscal 2019 are expected to consist primarily of capital expenditures for investments in our new and existing stores, our developing Siren Retail business and our supply chain and corporate facilities. Total capital expenditures for fiscal 2019 are expected to be approximately
$2 billion
.
Cash Flows
Cash
provided
by operating activities was
$11.9 billion
for fiscal
2018
, compared to
$4.3 billion
for fiscal
2017
. The change was primarily due to receipt of the upfront payment from Nestlé in the fourth quarter of fiscal 2018.
Cash
used
by investing activities totaled
$2.4 billion
for fiscal
2018
, compared to
$0.9 billion
for fiscal
2017
. The change was primarily due to cash used to acquire the 50% ownership interest in our East China joint venture in the first quarter of fiscal 2018 and additions to property, plant and equipment driven by new store openings and increased store renovations, partially offset by the net proceeds from the divestiture of certain operations.
Cash
used
by financing activities for fiscal
2018
totaled
$3.2 billion
, compared to
$3.1 billion
for fiscal
2017
. The change was primarily due to an increase in cash returned to shareholders through share repurchases and dividend payments, partially offset by higher proceeds from the issuance of long-term debt.
43
Contractual Obligations
The following table summarizes our contractual obligations and borrowings as of
September 30, 2018
, and the timing and effect that such commitments are expected to have on our liquidity and capital requirements in future periods (
in millions
):
|
|
Payments Due by Period
|
||||||||||||||||||
|
Contractual Obligations
(1)
|
Total
|
Less than 1
Year
|
1 - 3
Years
|
3 - 5
Years
|
More than
5 Years
|
||||||||||||||
|
Operating lease obligations
(2)
|
$
|
9,353.8
|
|
$
|
1,340.6
|
|
$
|
2,463.4
|
|
$
|
2,045.4
|
|
$
|
3,504.4
|
|
||||
|
Financing lease obligations
|
58.0
|
|
4.4
|
|
8.7
|
|
8.3
|
|
36.6
|
|
|||||||||
|
Debt obligations
|
|||||||||||||||||||
|
Principal payments
|
9,548.4
|
|
350.0
|
|
1,250.0
|
|
1,500.0
|
|
6,448.4
|
|
|||||||||
|
Interest payments
|
3,698.0
|
|
278.9
|
|
586.0
|
|
488.0
|
|
2,345.1
|
|
|||||||||
|
Purchase obligations
(3)
|
1,267.1
|
|
806.6
|
|
342.9
|
|
101.0
|
|
16.6
|
|
|||||||||
|
Other obligations
(4)
|
417.7
|
|
31.0
|
|
64.3
|
|
98.8
|
|
223.6
|
|
|||||||||
|
Total
|
$
|
24,343.0
|
|
$
|
2,811.5
|
|
$
|
4,715.3
|
|
$
|
4,241.5
|
|
$
|
12,574.7
|
|
||||
|
(1)
|
We have excluded long-term gross unrecognized tax benefits for uncertain tax positions, including interest and penalties of
$237.2 million
from the amounts presented as the timing of these obligations is uncertain.
|
|
(2)
|
Amounts include direct lease obligations, excluding any taxes, insurance and other related expenses.
|
|
(3)
|
Purchase obligations include agreements to purchase goods or services that are enforceable and legally binding on Starbucks and that specify all significant terms. Green coffee purchase commitments comprise
92%
of total purchase obligations.
|
|
(4)
|
Other obligations include other long-term liabilities primarily consisting of the Tax Act transition tax, asset retirement obligations and hedging instruments.
|
Starbucks currently expects to fund these commitments primarily with operating cash flows generated in the normal course of business.
Off-Balance Sheet Arrangements
Off-balance sheet arrangements relate to operating lease and purchase commitments detailed in the footnotes to the consolidated financial statements included in
Item 8
of Part II of this 10-K.
COMMODITY PRICES, AVAILABILITY AND GENERAL RISK CONDITIONS
Commodity price risk represents Starbucks primary market risk, generated by our purchases of green coffee and dairy products, among other items. We purchase, roast and sell high-quality
arabica
coffee and related products and risk arises from the price volatility of green coffee. In addition to coffee, we also purchase significant amounts of dairy products to support the needs of our company-operated stores. The price and availability of these commodities directly impacts our results of operations, and we expect commodity prices, particularly coffee, to impact future results of operations. For additional details see Product Supply in
Item 1
, as well as Risk Factors in
Item 1A
of this 10-K.
FINANCIAL RISK MANAGEMENT
Market risk is defined as the risk of losses due to changes in commodity prices, foreign currency exchange rates, equity security prices and interest rates. We manage our exposure to various market-based risks according to a market price risk management policy. Under this policy, market-based risks are quantified and evaluated for potential mitigation strategies, such as entering into hedging transactions. The market price risk management policy governs how hedging instruments may be used to mitigate risk. Risk limits are set annually and prohibit speculative trading activity. We also monitor and limit the amount of associated counterparty credit risk, which we consider to be low. Excluding interest rate swaps, hedging instruments generally do not have maturities in excess of
three years
. Refer to
Note 1
, Summary of Significant Accounting Policies, and
Note 3
, Derivative Financial Instruments, to the consolidated financial statements included in Item 8 of Part II of this 10-K for further discussion of our hedging instruments.
The sensitivity analyses disclosed below provide only a limited, point-in-time view of the market risk of the financial instruments discussed. The actual impact of the respective underlying rates and price changes on the financial instruments may differ significantly from those shown in the sensitivity analyses.
44
Commodity Price Risk
We purchase commodity inputs, primarily coffee, dairy products, diesel, cocoa, sugar and other commodities, that are used in our operations and are subject to price fluctuations that impact our financial results. We use a combination of pricing features embedded within supply contracts, such as fixed-price and price-to-be-fixed contracts for coffee purchases, and financial derivatives to manage our commodity price risk exposure.
The following table summarizes the potential impact as of
September 30, 2018
to Starbucks future net earnings and other comprehensive income (“OCI”) from changes in commodity prices. The information provided below relates only to the hedging instruments and does not represent the corresponding changes in the underlying hedged items
(in millions)
:
|
|
Increase/(Decrease) to Net Earnings
|
Increase/(Decrease) to OCI
|
|||||||||||||
|
|
10% Increase in
Underlying Rate
|
10% Decrease in
Underlying Rate |
10% Increase in
Underlying Rate |
10% Decrease in
Underlying Rate |
|||||||||||
|
Commodity hedges
|
$
|
4
|
|
$
|
(4
|
)
|
$
|
—
|
|
$
|
—
|
|
|||
Foreign Currency Exchange Risk
The majority of our revenue, expense and capital purchasing activities are transacted in U.S. dollars. However, because a portion of our operations consists of activities outside of the U.S., we have transactions in other currencies, primarily the Chinese renminbi, Japanese yen, Canadian dollar, British pound, South Korean won and euro. To reduce cash flow volatility from foreign currency fluctuations, we enter into derivative instruments to hedge portions of cash flows of anticipated intercompany royalty payments, inventory purchases, intercompany borrowing and lending activities and certain other transactions in currencies other than the functional currency of the entity that enters into the arrangements, as well as the translation risk of certain balance sheet items. See
Note 3
, Derivative Financial Instruments, to the consolidated financial statements included in Item 8 of Part II of this 10-K for further discussion.
The following table summarizes the potential impact as of
September 30, 2018
to Starbucks future net earnings and other comprehensive income from changes in the fair value of these derivative financial instruments due to a change in the value of the U.S. dollar as compared to foreign exchange rates. The information provided below relates only to the hedging instruments and does not represent the corresponding changes in the underlying hedged items (
in millions
):
|
|
Increase/(Decrease) to Net Earnings
|
Increase/(Decrease) to OCI
|
|||||||||||||
|
|
10% Increase in
Underlying Rate |
10% Decrease in
Underlying Rate |
10% Increase in
Underlying Rate |
10% Decrease in
Underlying Rate |
|||||||||||
|
Foreign currency hedges
|
$
|
27
|
|
$
|
(27
|
)
|
$
|
108
|
|
$
|
(108
|
)
|
|||
Equity Security Price Risk
We have minimal exposure to price fluctuations on equity mutual funds and equity exchange-traded funds within our trading securities portfolio. Trading securities are recorded at fair value and approximates a portion of our liability under our Management Deferred Compensation Plan (“MDCP”). Gains and losses from the portfolio and the change in our MDCP liability are recorded in our consolidated statements of earnings.
We performed a sensitivity analysis based on a 10% change in the underlying equity prices of our investments as of
September 30, 2018
and determined that such a change would not have a significant impact on the fair value of these instruments.
45
Interest Rate Risk
Long-term Debt
We utilize short-term and long-term financing and may use interest rate hedges to manage our overall interest expense related to our existing fixed-rate debt, as well as to hedge the variability in cash flows due to changes in benchmark interest rates related to anticipated debt issuances. See
Note 3
, Derivative Financial Instruments and
Note 9
, Debt, to the consolidated financial statements included in Item 8 of Part II of this 10-K for further discussion of our interest rate hedge agreements and details of the components of our long-term debt, respectively, as of
September 30, 2018
.
The following table summarizes the impact of a change in interest rates as of
September 30, 2018
on the fair value of Starbucks debt
(in millions)
:
|
|
|
Change in Fair Value
|
||||||||||||
|
|
Stated Interest Rate
|
Fair Value
|
100 Basis Point Increase in
Underlying Rate
|
100 Basis Point Decrease in
Underlying Rate
|
||||||||||
|
|
||||||||||||||
|
2018 notes
|
2.000
|
%
|
$
|
350
|
|
$
|
(1
|
)
|
$
|
1
|
|
|||
|
2020 notes
|
2.200
|
%
|
$
|
490
|
|
$
|
(10
|
)
|
$
|
10
|
|
|||
|
2021 notes
|
2.100
|
%
|
$
|
733
|
|
$
|
(17
|
)
|
$
|
17
|
|
|||
|
2022 notes
|
2.700
|
%
|
$
|
486
|
|
$
|
(17
|
)
|
$
|
17
|
|
|||
|
2023 notes
(1)
|
3.850
|
%
|
$
|
759
|
|
$
|
—
|
|
$
|
—
|
|
|||
|
2023 notes
|
3.100
|
%
|
$
|
986
|
|
$
|
(40
|
)
|
$
|
40
|
|
|||
|
2024 notes
|
0.372
|
%
|
$
|
743
|
|
$
|
(40
|
)
|
$
|
40
|
|
|||
|
2025 notes
|
3.800
|
%
|
$
|
1,249
|
|
$
|
(74
|
)
|
$
|
74
|
|
|||
|
2026 notes
|
2.450
|
%
|
$
|
451
|
|
$
|
(34
|
)
|
$
|
34
|
|
|||
|
2028 notes
|
3.500
|
%
|
$
|
576
|
|
$
|
(47
|
)
|
$
|
47
|
|
|||
|
2028 notes
|
4.000
|
%
|
$
|
754
|
|
$
|
(61
|
)
|
$
|
61
|
|
|||
|
2045 notes
|
4.300
|
%
|
$
|
330
|
|
$
|
(53
|
)
|
$
|
53
|
|
|||
|
2047 notes
|
3.750
|
%
|
$
|
438
|
|
$
|
(81
|
)
|
$
|
81
|
|
|||
|
2048 notes
|
4.500
|
%
|
$
|
977
|
|
$
|
(159
|
)
|
$
|
159
|
|
|||
|
(1)
|
Amount disclosed is net of ($32 million) change in the fair value of our designated interest rate swap. Refer to
Note 3
, Derivative Financial Instruments, for additional information on our interest rate swap designated as a fair value hedge.
|
Available-for-Sale Securities
Our available-for-sale securities comprise a diversified portfolio consisting mainly of investment-grade debt securities. The primary objective of these investments is to preserve capital and liquidity. Available-for-sale securities are recorded on the consolidated balance sheets at fair value with unrealized gains and losses reported as a component of accumulated other comprehensive income. We do not hedge the interest rate exposure on our available-for-sale securities. We performed a sensitivity analysis based on a 100 basis point change in the underlying interest rate of our available-for-sale securities as of
September 30, 2018
and determined that such a change would not have a significant impact on the fair value of these instruments.
APPLICATION OF CRITICAL ACCOUNTING POLICIES
Critical accounting policies are those that management believes are both most important to the portrayal of our financial condition and results and require the most difficult, subjective or complex judgments, often as a result of the need to make estimates about the effect of matters that are inherently uncertain. Judgments and uncertainties affecting the application of those policies may result in materially different amounts being reported under different conditions or using different assumptions.
Our significant accounting policies are discussed in
Note 1
, Summary of Significant Accounting Policies, to the consolidated financial statements included in Item 8 of Part II of this 10-K. We believe that of our significant accounting policies, the following policies involve a higher degree of judgment and/or complexity.
We consider financial reporting and disclosure practices and accounting policies quarterly to ensure that they provide accurate and transparent information relative to the current economic and business environment. During the past five fiscal years, we have not made any material changes to the accounting methodologies used to assess the areas discussed below, unless noted otherwise.
46
Property, Plant and Equipment and Other Finite-Lived Assets
We evaluate property, plant and equipment and other finite-lived assets for impairment when facts and circumstances indicate that the carrying values of such assets may not be recoverable. When evaluating for impairment, we first compare the carrying value of the asset to the asset’s estimated future undiscounted cash flows. If the estimated undiscounted future cash flows are less than the carrying value of the asset, we determine if we have an impairment loss by comparing the carrying value of the asset to the asset's estimated fair value and recognize an impairment charge when the asset’s carrying value exceeds its estimated fair value. The adjusted carrying amount of the asset becomes its new cost basis and is depreciated over the asset's remaining useful life.
Long-lived assets are grouped with other assets and liabilities at the lowest level for which identifiable cash flows are largely independent of the cash flows of other assets and liabilities. For company-operated store assets, the impairment test is performed at the individual store asset group level. The fair value of a store’s assets is estimated using a discounted cash flow model. For other long-lived assets, fair value is determined using an approach that is appropriate based on the relevant facts and circumstances, which may include discounted cash flows, comparable transactions, or comparable company analyses.
Our impairment calculations contain uncertainties because they require management to make assumptions and to apply judgment to estimate future cash flows and asset fair values. Key assumptions used in estimating future cash flows and asset fair values include projected revenue growth and operating expenses, as well as forecasting asset useful lives and selecting an appropriate discount rate. For company-operated stores, estimates of revenue growth and operating expenses are based on internal projections and consider the store’s historical performance, the local market economics and the business environment impacting the store’s performance. The discount rate is selected based on what we believe a buyer would assume when determining a purchase price for the store. These estimates are subjective and our ability to realize future cash flows and asset fair values is affected by factors such as ongoing maintenance and improvement of the assets, changes in economic conditions, and changes in operating performance.
During fiscal 2018, there were no significant changes in any of our estimates or assumptions, aside from those related to the decision to close certain company-operated stores in the U.S. and Canada, which had a material impact on the outcome of our impairment calculations. However, as we periodically reassess estimated future cash flows and asset fair values, changes in our estimates and assumptions may cause us to realize material impairment charges in the future.
Goodwill and Indefinite-Lived Intangible Assets
We evaluate goodwill and indefinite-lived intangible assets for impairment annually during our third fiscal quarter, or more frequently if an event occurs or circumstances change that would indicate that impairment may exist. When evaluating these assets for impairment, we may first perform a qualitative assessment to determine whether it is more likely than not that a reporting unit is impaired. If we do not perform a qualitative assessment, or if we determine that it is not more likely than not that the fair value of the reporting unit exceeds its carrying amount, we calculate the estimated fair value of the reporting unit using discounted cash flows or a combination of discounted cash flow and market approaches.
When assessing goodwill for impairment, our decision to perform a qualitative impairment assessment for an individual reporting unit in a given year is influenced by a number of factors, inclusive of the size of the reporting unit's goodwill, the significance of the excess of the reporting unit's estimated fair value over carrying value at the last quantitative assessment date, the amount of time in between quantitative fair value assessments and the date of acquisition. If we perform a quantitative assessment of an individual reporting unit’s goodwill, our impairment calculations contain uncertainties because they require management to make assumptions and to apply judgment when estimating future cash flows and asset fair values, including projected revenue growth and operating expenses related to existing businesses, product innovation and new store concepts, as well as utilizing valuation multiples of similar publicly traded companies and selecting an appropriate discount rate. Estimates of revenue growth and operating expenses are based on internal projections considering the reporting unit’s past performance and forecasted growth, strategic initiatives, local market economics and the local business environment impacting the reporting unit’s performance. The discount rate is selected based on the estimated cost of capital for a market participant to operate the reporting unit in the region. These estimates, as well as the selection of comparable companies and valuation multiples used in the market approaches are highly subjective, and our ability to realize the future cash flows used in our fair value calculations is affected by factors such as the success of strategic initiatives, changes in economic conditions, changes in our operating performance and changes in our business strategies, including retail initiatives and international expansion.
When assessing indefinite-lived intangible assets for impairment, where we perform a qualitative assessment, we evaluate if changes in events or circumstances have occurred that indicate that impairment may exist. If we do not perform a qualitative impairment assessment or if changes in events and circumstances indicate that a quantitative assessment should be performed, management is required to calculate the fair value of the intangible asset group. The fair value calculation includes estimates of revenue growth, which are based on past performance and internal projections for the intangible asset group's forecasted growth, and royalty rates, which are adjusted for our particular facts and circumstances. The discount rate is selected based on the estimated cost of capital that reflects the risk profile of the related business. These estimates are highly subjective, and our
47
ability to achieve the forecasted cash flows used in our fair value calculations is affected by factors such as the success of strategic initiatives, changes in economic conditions, changes in our operating performance and changes in our business strategies, including retail initiatives and international expansion.
The goodwill impairment charges related to the Switzerland reporting unit are discussed in
Note 8
, Other Intangible Assets and Goodwill, to the consolidated financial statements included in Item 8 of Part II of this 10-K.
Income Taxes
We recognize deferred tax assets and liabilities based on the differences between the financial statement carrying amounts and the respective tax bases of our assets and liabilities. Deferred tax assets and liabilities are measured using current enacted tax rates expected to apply to taxable income in the years in which we expect the temporary differences to reverse. We routinely evaluate the likelihood of realizing the benefit of our deferred tax assets and may record a valuation allowance if, based on all available evidence, we determine that some portion of the tax benefit will not be realized.
In evaluating our ability to recover our deferred tax assets within the jurisdiction from which they arise, we consider all available positive and negative evidence, including scheduled reversals of deferred tax liabilities, projected future taxable income, tax-planning strategies, and results of operations. In projecting future taxable income, we consider historical results and incorporate assumptions about the amount of future state, federal and foreign pretax operating income adjusted for items that do not have tax consequences. Our assumptions regarding future taxable income are consistent with the plans and estimates we use to manage our underlying businesses. In evaluating the objective evidence that historical results provide, we consider three years of cumulative operating income/(loss).
In addition, our income tax returns are periodically audited by domestic and foreign tax authorities. These audits include review of our tax filing positions, including the timing and amount of deductions taken and the allocation of income between tax jurisdictions. We evaluate our exposures associated with our various tax filing positions and recognize a tax benefit only if it is more likely than not that the tax position will be sustained upon examination by the relevant taxing authorities, including resolutions of any related appeals or litigation processes, based on the technical merits of our position. For uncertain tax positions that do not meet this threshold, we record a related liability. We adjust our unrecognized tax benefit liability and income tax expense in the period in which the uncertain tax position is effectively settled, the statute of limitations expires for the relevant taxing authority to examine the tax position or when new information becomes available. As discussed in
Note 13
, Income Taxes, to the consolidated financial statements included in Item 8 of Part II of this 10-K, there is a reasonable possibility that our unrecognized tax benefit liability will be adjusted within 12 months due to the expiration of a statute of limitations and/or resolution of examinations with taxing authorities.
We have generated income in certain foreign jurisdictions that may be subject to additional income or withholding taxes. We have historically asserted our intent to reinvest these earnings for the foreseeable future. The Company continues to evaluate its plans for reinvestment or repatriation of unremitted foreign earnings and thus has not adjusted its previous indefinite reinvestment assertions for the effects of the Tax Act. While we do not expect to repatriate cash to the U.S. to satisfy domestic liquidity needs, if these amounts were distributed to the U.S., in the form of dividends or otherwise, we may be subject to additional income or withholding taxes, which could be material.
Our income tax expense, deferred tax assets and liabilities and liabilities for unrecognized tax benefits reflect management’s best assessment of estimated current and future taxes to be paid. Deferred tax asset valuation allowances and our liabilities for unrecognized tax benefits require significant management judgment regarding applicable statutes and their related interpretation, the status of various income tax audits and our particular facts and circumstances. Although we believe that the judgments and estimates discussed herein are reasonable, actual results could differ, and we may be exposed to losses or gains that could be material. To the extent we prevail in matters for which a liability has been established or are required to pay amounts in excess of our established liability, our effective income tax rate in a given financial statement period could be materially affected.
Refer to
Note 13
, Income Taxes, to the consolidated financial statements included in Item 8 of Part II of this 10-K, for additional discussion surrounding the changes as a result of the Tax Act.
RECENT ACCOUNTING PRONOUNCEMENTS
See
Note 1
, Summary of Significant Accounting Policies, to the consolidated financial statements included in Item 8 of Part II of this 10-K for a detailed description of recent accounting pronouncements.
Item 7A.
Quantitative and Qualitative Disclosures About Market Risk
The information required by this item is incorporated by reference to the section entitled “Management’s Discussion and Analysis of Financial Condition and Results of Operations — Commodity Prices, Availability and General Risk Conditions” and “Management’s Discussion and Analysis of Financial Condition and Results of Operations — Financial Risk Management” in Item 7 of this Report.
48
|
Item 8.
|
Financial Statements and Supplementary Data
|
STARBUCKS CORPORATION
CONSOLIDATED STATEMENTS OF EARNINGS
(in millions, except per share data)
|
Fiscal Year Ended
|
Sep 30,
2018 |
Oct 1,
2017 |
Oct 2,
2016 |
||||||||
|
Net revenues:
|
|||||||||||
|
Company-operated stores
|
$
|
19,690.3
|
|
$
|
17,650.7
|
|
$
|
16,844.1
|
|
||
|
Licensed stores
|
2,652.2
|
|
2,355.0
|
|
2,154.2
|
|
|||||
|
Other
|
2,377.0
|
|
2,381.1
|
|
2,317.6
|
|
|||||
|
Total net revenues
|
24,719.5
|
|
22,386.8
|
|
21,315.9
|
|
|||||
|
Cost of sales including occupancy costs
|
10,174.5
|
|
9,034.3
|
|
8,509.0
|
|
|||||
|
Store operating expenses
|
7,193.2
|
|
6,493.3
|
|
6,064.3
|
|
|||||
|
Other operating expenses
|
539.3
|
|
500.3
|
|
499.2
|
|
|||||
|
Depreciation and amortization expenses
|
1,247.0
|
|
1,011.4
|
|
980.8
|
|
|||||
|
General and administrative expenses
|
1,759.0
|
|
1,450.7
|
|
1,408.9
|
|
|||||
|
Restructuring and impairments
|
224.4
|
|
153.5
|
|
—
|
|
|||||
|
Total operating expenses
|
21,137.4
|
|
18,643.5
|
|
17,462.2
|
|
|||||
|
Income from equity investees
|
301.2
|
|
391.4
|
|
318.2
|
|
|||||
|
Operating income
|
3,883.3
|
|
4,134.7
|
|
4,171.9
|
|
|||||
|
Gain resulting from acquisition of joint venture
|
1,376.4
|
|
—
|
|
—
|
|
|||||
|
Net gain resulting from divestiture of certain operations
|
499.2
|
|
93.5
|
|
5.4
|
|
|||||
|
Interest income and other, net
|
191.4
|
|
181.8
|
|
102.6
|
|
|||||
|
Interest expense
|
(170.3
|
)
|
(92.5
|
)
|
(81.3
|
)
|
|||||
|
Earnings before income taxes
|
5,780.0
|
|
4,317.5
|
|
4,198.6
|
|
|||||
|
Income tax expense
|
1,262.0
|
|
1,432.6
|
|
1,379.7
|
|
|||||
|
Net earnings including noncontrolling interests
|
4,518.0
|
|
2,884.9
|
|
2,818.9
|
|
|||||
|
Net earnings/(loss) attributable to noncontrolling interests
|
(0.3
|
)
|
0.2
|
|
1.2
|
|
|||||
|
Net earnings attributable to Starbucks
|
$
|
4,518.3
|
|
$
|
2,884.7
|
|
$
|
2,817.7
|
|
||
|
Earnings per share — basic
|
$
|
3.27
|
|
$
|
1.99
|
|
$
|
1.91
|
|
||
|
Earnings per share — diluted
|
$
|
3.24
|
|
$
|
1.97
|
|
$
|
1.90
|
|
||
|
Weighted average shares outstanding:
|
|||||||||||
|
Basic
|
1,382.7
|
|
1,449.5
|
|
1,471.6
|
|
|||||
|
Diluted
|
1,394.6
|
|
1,461.5
|
|
1,486.7
|
|
|||||
See Notes to Consolidated Financial Statements.
49
STARBUCKS CORPORATION
(in millions)
|
Fiscal Year Ended
|
Sep 30,
2018 |
Oct 1,
2017 |
Oct 2,
2016 |
||||||||
|
Net earnings including noncontrolling interests
|
$
|
4,518.0
|
|
$
|
2,884.9
|
|
$
|
2,818.9
|
|
||
|
Other comprehensive income/(loss), net of tax:
|
|||||||||||
|
Unrealized holding gains/(losses) on available-for-sale securities
|
(7.0
|
)
|
(9.5
|
)
|
3.5
|
|
|||||
|
Tax (expense)/benefit
|
1.9
|
|
2.9
|
|
(1.3
|
)
|
|||||
|
Unrealized gains/(losses) on cash flow hedging instruments
|
24.4
|
|
53.2
|
|
(109.6
|
)
|
|||||
|
Tax (expense)/benefit
|
(6.5
|
)
|
(12.6
|
)
|
27.5
|
|
|||||
|
Unrealized gains/(losses) on net investment hedging instruments
|
7.8
|
|
20.1
|
|
—
|
|
|||||
|
Tax (expense)/benefit
|
(2.2
|
)
|
(7.4
|
)
|
—
|
|
|||||
|
Translation adjustment and other
|
(220.0
|
)
|
(38.3
|
)
|
85.5
|
|
|||||
|
Tax (expense)/benefit
|
3.4
|
|
(2.4
|
)
|
19.0
|
|
|||||
|
Reclassification adjustment for net (gains)/losses realized in net earnings for available-for-sale securities, hedging instruments, and translation adjustment
|
24.7
|
|
(67.2
|
)
|
78.2
|
|
|||||
|
Tax expense/(benefit)
|
(1.2
|
)
|
14.0
|
|
(11.8
|
)
|
|||||
|
Other comprehensive income/(loss)
|
(174.7
|
)
|
(47.2
|
)
|
91.0
|
|
|||||
|
Comprehensive income including noncontrolling interests
|
4,343.3
|
|
2,837.7
|
|
2,909.9
|
|
|||||
|
Comprehensive income/(loss) attributable to noncontrolling interests
|
(0.3
|
)
|
0.2
|
|
1.2
|
|
|||||
|
Comprehensive income attributable to Starbucks
|
$
|
4,343.6
|
|
$
|
2,837.5
|
|
$
|
2,908.7
|
|
||
See Notes to Consolidated Financial Statements.
50
STARBUCKS CORPORATION
(in millions, except per share data)
|
Sep 30,
2018 |
Oct 1,
2017 |
||||||
|
ASSETS
|
|||||||
|
Current assets:
|
|||||||
|
Cash and cash equivalents
|
$
|
8,756.3
|
|
$
|
2,462.3
|
|
|
|
Short-term investments
|
181.5
|
|
228.6
|
|
|||
|
Accounts receivable, net
|
693.1
|
|
870.4
|
|
|||
|
Inventories
|
1,400.5
|
|
1,364.0
|
|
|||
|
Prepaid expenses and other current assets
|
1,462.8
|
|
358.1
|
|
|||
|
Total current assets
|
12,494.2
|
|
5,283.4
|
|
|||
|
Long-term investments
|
267.7
|
|
542.3
|
|
|||
|
Equity and cost investments
|
334.7
|
|
481.6
|
|
|||
|
Property, plant and equipment, net
|
5,929.1
|
|
4,919.5
|
|
|||
|
Deferred income taxes, net
|
134.7
|
|
795.4
|
|
|||
|
Other long-term assets
|
412.2
|
|
362.8
|
|
|||
|
Other intangible assets
|
1,042.2
|
|
441.4
|
|
|||
|
Goodwill
|
3,541.6
|
|
1,539.2
|
|
|||
|
TOTAL ASSETS
|
$
|
24,156.4
|
|
$
|
14,365.6
|
|
|
|
LIABILITIES AND EQUITY
|
|||||||
|
Current liabilities:
|
|||||||
|
Accounts payable
|
$
|
1,179.3
|
|
$
|
782.5
|
|
|
|
Accrued liabilities
|
2,298.4
|
|
1,934.5
|
|
|||
|
Insurance reserves
|
213.7
|
|
215.2
|
|
|||
|
Stored value card liability and current portion of deferred revenue
|
1,642.9
|
|
1,288.5
|
|
|||
|
Current portion of long-term debt
|
349.9
|
|
—
|
|
|||
|
Total current liabilities
|
5,684.2
|
|
4,220.7
|
|
|||
|
Long-term debt
|
9,090.2
|
|
3,932.6
|
|
|||
|
Deferred revenue
|
6,775.7
|
|
4.4
|
|
|||
|
Other long-term liabilities
|
1,430.5
|
|
750.9
|
|
|||
|
Total liabilities
|
22,980.6
|
|
8,908.6
|
|
|||
|
Shareholders’ equity:
|
|||||||
|
Common stock ($0.001 par value) — authorized, 2,400.0 shares; issued and outstanding, 1,309.1 and 1,431.6 shares, respectively
|
1.3
|
|
1.4
|
|
|||
|
Additional paid-in capital
|
41.1
|
|
41.1
|
|
|||
|
Retained earnings
|
1,457.4
|
|
5,563.2
|
|
|||
|
Accumulated other comprehensive loss
|
(330.3
|
)
|
(155.6
|
)
|
|||
|
Total shareholders’ equity
|
1,169.5
|
|
5,450.1
|
|
|||
|
Noncontrolling interests
|
6.3
|
|
6.9
|
|
|||
|
Total equity
|
1,175.8
|
|
5,457.0
|
|
|||
|
TOTAL LIABILITIES AND EQUITY
|
$
|
24,156.4
|
|
$
|
14,365.6
|
|
|
See Notes to Consolidated Financial Statements.
51
STARBUCKS CORPORATION
(in millions)
|
Fiscal Year Ended
|
Sep 30,
2018 |
Oct 1,
2017 |
Oct 2,
2016 |
||||||||
|
OPERATING ACTIVITIES:
|
|||||||||||
|
Net earnings including noncontrolling interests
|
$
|
4,518.0
|
|
$
|
2,884.9
|
|
$
|
2,818.9
|
|
||
|
Adjustments to reconcile net earnings to net cash provided by operating activities:
|
|||||||||||
|
Depreciation and amortization
|
1,305.9
|
|
1,067.1
|
|
1,030.1
|
|
|||||
|
Deferred income taxes, net
|
714.9
|
|
95.1
|
|
265.7
|
|
|||||
|
Income earned from equity method investees
|
(242.8
|
)
|
(310.2
|
)
|
(250.2
|
)
|
|||||
|
Distributions received from equity method investees
|
226.8
|
|
186.6
|
|
223.3
|
|
|||||
|
Gain resulting from acquisition of joint venture
|
(1,376.4
|
)
|
—
|
|
—
|
|
|||||
|
Net gain resulting from divestiture of certain retail operations
|
(499.2
|
)
|
(93.5
|
)
|
(6.1
|
)
|
|||||
|
Stock-based compensation
|
250.3
|
|
176.0
|
|
218.1
|
|
|||||
|
Goodwill impairments
|
37.6
|
|
87.2
|
|
—
|
|
|||||
|
Other
|
89.0
|
|
68.9
|
|
45.1
|
|
|||||
|
Cash provided by changes in operating assets and liabilities:
|
|||||||||||
|
Accounts receivable
|
131.0
|
|
(96.8
|
)
|
(55.6
|
)
|
|||||
|
Inventories
|
(41.2
|
)
|
14.0
|
|
(67.5
|
)
|
|||||
|
Accounts payable
|
391.6
|
|
46.4
|
|
46.9
|
|
|||||
|
Deferred revenue
|
7,109.4
|
|
130.8
|
|
180.4
|
|
|||||
|
Other operating assets and liabilities
|
(677.1
|
)
|
(4.7
|
)
|
248.8
|
|
|||||
|
Net cash provided by operating activities
|
11,937.8
|
|
4,251.8
|
|
4,697.9
|
|
|||||
|
INVESTING ACTIVITIES:
|
|||||||||||
|
Purchases of investments
|
(191.9
|
)
|
(674.4
|
)
|
(1,585.7
|
)
|
|||||
|
Sales of investments
|
459.0
|
|
1,054.5
|
|
680.7
|
|
|||||
|
Maturities and calls of investments
|
45.3
|
|
149.6
|
|
27.9
|
|
|||||
|
Acquisitions, net of cash acquired
|
(1,311.3
|
)
|
—
|
|
—
|
|
|||||
|
Additions to property, plant and equipment
|
(1,976.4
|
)
|
(1,519.4
|
)
|
(1,440.3
|
)
|
|||||
|
Net proceeds from the divestiture of certain operations
|
608.2
|
|
85.4
|
|
69.6
|
|
|||||
|
Other
|
5.6
|
|
54.3
|
|
24.9
|
|
|||||
|
Net cash used by investing activities
|
(2,361.5
|
)
|
(850.0
|
)
|
(2,222.9
|
)
|
|||||
|
FINANCING ACTIVITIES:
|
|||||||||||
|
Proceeds from issuance of long-term debt
|
5,584.1
|
|
750.2
|
|
1,254.5
|
|
|||||
|
Repayments of long-term debt
|
—
|
|
(400.0
|
)
|
—
|
|
|||||
|
Proceeds from issuance of common stock
|
153.9
|
|
150.8
|
|
160.7
|
|
|||||
|
Cash dividends paid
|
(1,743.4
|
)
|
(1,450.4
|
)
|
(1,178.0
|
)
|
|||||
|
Repurchase of common stock
|
(7,133.5
|
)
|
(2,042.5
|
)
|
(1,995.6
|
)
|
|||||
|
Minimum tax withholdings on share-based awards
|
(62.7
|
)
|
(82.8
|
)
|
(106.0
|
)
|
|||||
|
Other
|
(41.2
|
)
|
(4.4
|
)
|
(8.4
|
)
|
|||||
|
Net cash used by financing activities
|
(3,242.8
|
)
|
(3,079.1
|
)
|
(1,872.8
|
)
|
|||||
|
Effect of exchange rate changes on cash and cash equivalents
|
(39.5
|
)
|
10.8
|
|
(3.5
|
)
|
|||||
|
Net increase in cash and cash equivalents
|
6,294.0
|
|
333.5
|
|
598.7
|
|
|||||
|
CASH AND CASH EQUIVALENTS:
|
|||||||||||
|
Beginning of period
|
2,462.3
|
|
2,128.8
|
|
1,530.1
|
|
|||||
|
End of period
|
$
|
8,756.3
|
|
$
|
2,462.3
|
|
$
|
2,128.8
|
|
||
|
SUPPLEMENTAL DISCLOSURE OF CASH FLOW INFORMATION:
|
|||||||||||
|
Cash paid during the period for:
|
|||||||||||
|
Interest, net of capitalized interest
|
$
|
137.1
|
|
$
|
96.6
|
|
$
|
74.7
|
|
||
|
Income taxes, net of refunds
|
$
|
1,176.9
|
|
$
|
1,389.1
|
|
$
|
878.7
|
|
||
See Notes to Consolidated Financial Statements.
52
STARBUCKS CORPORATION
CONSOLIDATED STATEMENTS OF EQUITY
(in millions, except per share data)
|
|
Common Stock
|
Additional Paid-in Capital
|
Retained
Earnings |
Accumulated
Other Comprehensive Income/(Loss) |
Shareholders’
Equity |
Noncontrolling
Interests |
Total
|
|||||||||||||||||||||||
|
|
Shares
|
Amount
|
||||||||||||||||||||||||||||
|
Balance, September 27, 2015
|
1,485.1
|
|
$
|
1.5
|
|
$
|
41.1
|
|
$
|
5,974.8
|
|
$
|
(199.4
|
)
|
$
|
5,818.0
|
|
$
|
1.8
|
|
$
|
5,819.8
|
|
|||||||
|
Net earnings
|
—
|
|
—
|
|
—
|
|
2,817.7
|
|
—
|
|
2,817.7
|
|
1.2
|
|
2,818.9
|
|
||||||||||||||
|
Other comprehensive income
|
—
|
|
—
|
|
—
|
|
—
|
|
91.0
|
|
91.0
|
|
—
|
|
91.0
|
|
||||||||||||||
|
Stock-based compensation expense
|
—
|
|
—
|
|
219.6
|
|
—
|
|
—
|
|
219.6
|
|
—
|
|
219.6
|
|
||||||||||||||
|
Exercise of stock options/vesting of RSUs, including tax benefit of $124.3
|
9.8
|
|
—
|
|
153.0
|
|
—
|
|
—
|
|
153.0
|
|
—
|
|
153.0
|
|
||||||||||||||
|
Sale of common stock, including tax benefit of $0.2
|
0.5
|
|
—
|
|
26.5
|
|
—
|
|
—
|
|
26.5
|
|
—
|
|
26.5
|
|
||||||||||||||
|
Repurchase of common stock
|
(34.9
|
)
|
—
|
|
(399.1
|
)
|
(1,596.5
|
)
|
—
|
|
(1,995.6
|
)
|
—
|
|
(1,995.6
|
)
|
||||||||||||||
|
Cash dividends declared, $0.85 per share
|
—
|
|
—
|
|
—
|
|
(1,246.2
|
)
|
—
|
|
(1,246.2
|
)
|
—
|
|
(1,246.2
|
)
|
||||||||||||||
|
Noncontrolling interest resulting from acquisition
|
—
|
|
—
|
|
—
|
|
—
|
|
—
|
|
—
|
|
3.7
|
|
3.7
|
|
||||||||||||||
|
Balance, October 2, 2016
|
1,460.5
|
|
$
|
1.5
|
|
$
|
41.1
|
|
$
|
5,949.8
|
|
$
|
(108.4
|
)
|
$
|
5,884.0
|
|
$
|
6.7
|
|
$
|
5,890.7
|
|
|||||||
|
Net earnings
|
—
|
|
—
|
|
—
|
|
2,884.7
|
|
—
|
|
2,884.7
|
|
0.2
|
|
2,884.9
|
|
||||||||||||||
|
Other comprehensive income/(loss)
|
—
|
|
—
|
|
—
|
|
—
|
|
(47.2
|
)
|
(47.2
|
)
|
—
|
|
(47.2
|
)
|
||||||||||||||
|
Stock-based compensation expense
|
—
|
|
—
|
|
177.9
|
|
—
|
|
—
|
|
177.9
|
|
—
|
|
177.9
|
|
||||||||||||||
|
Exercise of stock options/vesting of RSUs, including tax benefit of $77.4
|
8.1
|
|
—
|
|
117.0
|
|
—
|
|
—
|
|
117.0
|
|
—
|
|
117.0
|
|
||||||||||||||
|
Sale of common stock, including tax benefit of $0.2
|
0.5
|
|
—
|
|
28.7
|
|
—
|
|
—
|
|
28.7
|
|
—
|
|
28.7
|
|
||||||||||||||
|
Repurchase of common stock
|
(37.5
|
)
|
(0.1
|
)
|
(323.6
|
)
|
(1,755.4
|
)
|
—
|
|
(2,079.1
|
)
|
—
|
|
(2,079.1
|
)
|
||||||||||||||
|
Cash dividends declared, $1.05 per share
|
—
|
|
—
|
|
—
|
|
(1,515.9
|
)
|
—
|
|
(1,515.9
|
)
|
—
|
|
(1,515.9
|
)
|
||||||||||||||
|
Balance, October 1, 2017
|
1,431.6
|
|
|
$
|
1.4
|
|
|
$
|
41.1
|
|
|
$
|
5,563.2
|
|
|
$
|
(155.6
|
)
|
|
$
|
5,450.1
|
|
|
$
|
6.9
|
|
|
$
|
5,457.0
|
|
|
Net earnings/(loss)
|
—
|
|
—
|
|
—
|
|
4,518.3
|
|
—
|
|
4,518.3
|
|
(0.3
|
)
|
4,518.0
|
|
||||||||||||||
|
Other comprehensive income/(loss)
|
—
|
|
—
|
|
—
|
|
—
|
|
(174.7
|
)
|
(174.7
|
)
|
—
|
|
(174.7
|
)
|
||||||||||||||
|
Stock-based compensation expense
|
—
|
|
—
|
|
253.8
|
|
—
|
|
—
|
|
253.8
|
|
—
|
|
253.8
|
|
||||||||||||||
|
Exercise of stock options/vesting of RSUs
|
8.4
|
|
—
|
|
59.4
|
|
—
|
|
—
|
|
59.4
|
|
—
|
|
59.4
|
|
||||||||||||||
|
Sale of common stock
|
0.6
|
|
—
|
|
31.8
|
|
—
|
|
—
|
|
31.8
|
|
—
|
|
31.8
|
|
||||||||||||||
|
Repurchase of common stock
|
(131.5
|
)
|
(0.1
|
)
|
(345.0
|
)
|
(6,863.6
|
)
|
—
|
|
(7,208.7
|
)
|
—
|
|
(7,208.7
|
)
|
||||||||||||||
|
Cash dividends declared, $1.32 per share
|
—
|
|
—
|
|
—
|
|
(1,760.5
|
)
|
—
|
|
(1,760.5
|
)
|
—
|
|
(1,760.5
|
)
|
||||||||||||||
|
Net distributions to noncontrolling interests
|
—
|
|
—
|
|
—
|
|
—
|
|
—
|
|
—
|
|
(0.3
|
)
|
(0.3
|
)
|
||||||||||||||
|
Balance, September 30, 2018
|
1,309.1
|
|
|
$
|
1.3
|
|
|
$
|
41.1
|
|
|
$
|
1,457.4
|
|
|
$
|
(330.3
|
)
|
|
$
|
1,169.5
|
|
|
$
|
6.3
|
|
|
$
|
1,175.8
|
|
See Notes to Consolidated Financial Statements.
53
STARBUCKS CORPORATION
INDEX FOR NOTES TO CONSOLIDATED FINANCIAL STATEMENTS
|
Note 1
|
||
|
Note 2
|
||
|
Note 3
|
||
|
Note 4
|
||
|
Note 5
|
||
|
Note 6
|
||
|
Note 7
|
||
|
Note 8
|
||
|
Note 9
|
||
|
Note 10
|
||
|
Note 11
|
||
|
Note 12
|
||
|
Note 13
|
||
|
Note 14
|
||
|
Note 15
|
||
|
Note 16
|
||
|
Note 17
|
||
|
Note 18
|
||
54
STARBUCKS CORPORATION
NOTES TO CONSOLIDATED FINANCIAL STATEMENTS
Fiscal Years ended
September 30, 2018
,
October 1, 2017
and
October 2, 2016
Description of Business
We purchase and roast high-quality coffees that we sell, along with handcrafted coffee and tea beverages and a variety of fresh and prepared food items, through our company-operated stores. We also sell a variety of coffee and tea products and license our trademarks through other channels such as licensed stores, grocery and national foodservice accounts.
In this 10-K, Starbucks Corporation (together with its subsidiaries) is referred to as “Starbucks,” the “Company,” “we,” “us” or “our.”
Segment information is prepared on the same basis that our management reviews financial information for operational decision-making purposes. On August 26, 2018, our Channel Development segment finalized licensing and distribution agreements with Nestlé to sell and market our consumer packaged goods and foodservice products. The scope of the arrangement converts the majority of our previously defined Channel Development segment operations, as well as certain smaller businesses previously reported in the Americas, EMEA and Corporate and Other (previously All Other segments), from company-owned to licensed operations with Nestlé. As a result, we realigned our organizational and operating segment structures in support of this newly established Global Coffee Alliance, and our reportable segments were restated as if those smaller businesses were previously within our Channel Development segment.
We have
four
reportable operating segments: 1) Americas, which is inclusive of the U.S., Canada, and Latin America; 2) China/Asia Pacific (“CAP”); 3) Europe, Middle East, and Africa (“EMEA”) and 4) Channel Development. We also have several non-reportable operating segments, including Starbucks Reserve
TM
Roastery & Tasting Rooms, Starbucks Reserve brand and products and Princi operations, Evolution Fresh and the legacy operations of the Teavana retail business, which substantially ceased during fiscal 2018. Unallocated corporate operating expenses, which pertain primarily to corporate administrative functions that support the operating segments but are not specifically attributable to or managed by any segment, are combined with the non-reportable operating segments and reported within Corporate and Other.
Further, in an effort to report operating expenses in line with the corresponding revenue generating activities, we have changed the classification of certain costs, primarily within our CAP segment and mainly from other operating expenses to general and administrative expenses. These reclassifications have been retrospectively applied and was determined to be immaterial.
Additional details on the nature of our business and our reportable operating segments are included in
Note 16
, Segment Reporting.
Principles of Consolidation
Our consolidated financial statements reflect the financial position and operating results of Starbucks, including wholly-owned subsidiaries and investees that we control. Investments in entities that we do not control, but have the ability to exercise significant influence over operating and financial policies, are accounted for under the equity method. Investments in entities in which we do not have the ability to exercise significant influence are accounted for under the cost method. Intercompany transactions and balances have been eliminated.
Fiscal Year End
Our fiscal year ends on the Sunday closest to September 30. Fiscal years
2018
and
2017
included
52
weeks. Fiscal year
2016
included 53 weeks, with the 53
rd
week falling in the fourth fiscal quarter.
Estimates and Assumptions
Preparing financial statements in conformity with accounting principles generally accepted in the United States of America (“GAAP”) requires management to make estimates and assumptions that affect the reported amounts of assets, liabilities, revenues and expenses. Examples include, but are not limited to, estimates for inventory reserves, asset and goodwill impairments, assumptions underlying self-insurance reserves, income from unredeemed stored value cards, stock-based compensation forfeiture rates, future asset retirement obligations and the potential outcome of future tax consequences of events that have been recognized in the financial statements. Actual results and outcomes may differ from these estimates and assumptions.
55
Cash and Cash Equivalents
We consider all highly liquid instruments with maturities of three months or less at the time of purchase, as well as credit card receivables for sales to customers in our company-operated stores that generally settle within
two
to
five
business days, to be cash equivalents. We maintain cash and cash equivalent balances with financial institutions that exceed federally-insured limits. We have not experienced any losses related to these balances, and we believe credit risk to be minimal.
Our cash management system provides for the funding of all major bank disbursement accounts on a daily basis as checks are presented for payment. Under this system, outstanding checks are in excess of the cash balances at certain banks, which creates book overdrafts. Book overdrafts are presented as a current liability in accrued liabilities on our consolidated balance sheets.
Investments
Available-for-sale Securities
Our short-term and long-term investments consist primarily of investment-grade debt securities, all of which are classified as available-for-sale. Available-for-sale debt securities are recorded at fair value, and unrealized holding gains and losses are recorded, net of tax, as a component of accumulated other comprehensive income. Available-for-sale securities with remaining maturities of less than one year and those identified by management at the time of purchase to be used to fund operations within one year are classified as short-term. All other available-for-sale securities are classified as long-term. We evaluate our available-for-sale securities for other-than-temporary impairment on a quarterly basis. Unrealized losses are charged against net earnings when a decline in fair value is determined to be other than temporary. We review several factors to determine whether a loss is other than temporary, such as the length and extent of the fair value decline, the financial condition and near-term prospects of the issuer and whether we have the intent to sell or will more likely than not be required to sell before the securities' anticipated recovery, which may be at maturity. Realized gains and losses are accounted for using the specific identification method. Purchases and sales are recorded on a trade date basis.
Trading Securities
We also have a trading securities portfolio, which is comprised of marketable equity mutual funds and equity exchange-traded funds. Trading securities are recorded at fair value and approximates a portion of our liability under our Management Deferred Compensation Plan (“MDCP”). Gains or losses from the portfolio and the change in our MDCP liability are recorded in our consolidated statements of earnings.
Equity and Cost Method Investments
Equity investments are accounted for using the equity method of accounting if the investment gives us the ability to exercise significant influence, but not control, over an investee. Equity method investments are included within long-term investments on our consolidated balance sheets. Our share of the earnings or losses as reported by equity method investees are classified as income from equity investees on our consolidated statements of earnings.
Equity investments for which we do not have the ability to exercise significant influence are accounted for using the cost method of accounting and are recorded in long-term investments on our consolidated balance sheets. Under the cost method, investments are carried at cost and are adjusted only for other-than-temporary declines in fair value, certain distributions and additional investments.
We evaluate our equity and cost method investments for impairment annually and when facts and circumstances indicate that the carrying value of such investments may not be recoverable. We review several factors to determine whether the loss is other than temporary, such as the length and extent of the fair value decline, the financial condition and near-term prospects of the investee, and whether we have the intent to sell or will more likely than not be required to sell before the investment’s anticipated recovery. If a decline in fair value is determined to be other-than-temporary, an impairment charge is recorded in net earnings.
Fair Value
Fair value is the price we would receive to sell an asset or pay to transfer a liability (exit price) in an orderly transaction between market participants. For assets and liabilities recorded or disclosed at fair value on a recurring basis, we determine fair value based on the following:
Level 1:
The carrying value of cash and cash equivalents approximates fair value because of the short-term nature of these instruments. For trading and U.S. government treasury securities and commodity futures contracts, we use quoted prices in active markets for identical assets to determine fair value.
Level 2:
When quoted prices in active markets for identical assets are not available, we determine the fair value of our available-for-sale securities and our over-the-counter forward contracts, collars and swaps based upon factors such as the quoted market price of similar assets or a discounted cash flow model using readily observable market data, which may include
56
interest rate curves and forward and spot prices for currencies and commodities, depending on the nature of the investment. The fair value of our long-term debt is estimated based on the quoted market prices for the same or similar issues or on the current rates offered to us for debt of the same remaining maturities.
Level 3:
We determine the fair value of our auction rate securities using an internally-developed valuation model, using inputs that include interest rate curves, credit and liquidity spreads and effective maturity.
Assets and liabilities recognized or disclosed at fair value on a nonrecurring basis may include items such as property, plant and equipment, goodwill and other intangible assets, equity and cost method investments and other assets. We determine the fair value of these items using Level 3 inputs, as described in the related sections below.
Derivative Instruments
We manage our exposure to various risks within our consolidated financial statements according to a market price risk management policy. Under this policy, we may engage in transactions involving various derivative instruments to hedge interest rates, commodity prices and foreign currency denominated revenue streams, inventory purchases, assets and liabilities and investments in certain foreign operations. In order to manage our exposure to these risks, we use various types of derivative instruments including forward contracts, commodity futures contracts, collars and swaps. Forward contracts and commodity futures contracts are agreements to buy or sell a quantity of a currency or commodity at a predetermined future date and at a predetermined rate or price. A collar is a strategy that uses a combination of a purchased call option and a sold put option with equal premiums to hedge a portion of anticipated cash flows, or to limit the range of possible gains or losses on an underlying asset or liability to a specific range. A swap agreement is a contract between two parties to exchange cash flows based on specified underlying notional amounts, assets and/or indices. We do not enter into derivative instruments for speculative purposes.
We record all derivatives on our consolidated balance sheets at fair value and typically do not offset derivative assets and liabilities. Excluding interest rate swaps and foreign currency debt, we generally do not enter into derivative instruments with maturities longer than
three years
. However, we are allowed to net settle transactions with respective counterparties for certain derivative contracts, inclusive of interest rate swaps and foreign currency forwards, with a single, net amount payable by one party to the other. We also enter into collateral security arrangements that provide for collateral to be received or posted
when the net fair value of certain financial instruments fluctuates from contractually established thresholds. As of
September 30, 2018
and
October 1, 2017
, we
received
$5.4 million
and
$5.8 million
, respectively, of cash collateral related to the derivative instruments under collateral security arrangements. As of
September 30, 2018
and
October 1, 2017
, the potential effects of netting arrangements with our derivative contracts, excluding the effects of collateral, would be a reduction to both derivative assets and liabilities of
$5.5 million
and
$7.4 million
,
respectively, resulting in net derivative assets of
$29.4 million
a
nd net derivative liabilities of
$44.5 million
as of
September 30, 2018
, and net derivative assets of
$30.4 million
and net derivative liabilities of
$31.1 million
as of
October 1, 2017
.
By using these derivative instruments, we expose ourselves to potential credit risk. Credit risk is the failure of the counterparty to perform under the terms of the derivative contract. We minimize this credit risk by entering into transactions with carefully selected, credit-worthy counterparties and distribute contracts among several financial institutions to reduce the concentration of credit risk.
Cash Flow Hedges
For derivative instruments that are designated and qualify as a cash flow hedge, the effective portion of the derivative's gain or loss is reported as a component of other comprehensive income (“OCI”) and recorded in accumulated other comprehensive income (“AOCI”) on our consolidated balance sheets. The gain or loss is subsequently reclassified into net earnings when the hedged exposure affects net earnings.
To the extent that the change in the fair value of the contract corresponds to the change in the value of the anticipated transaction using forward rates on a monthly basis, the hedge is considered effective and is recognized as described above. The remaining change in fair value of the contract represents the ineffective portion, which is immediately recorded in interest income and other, net on our consolidated statements of earnings.
Cash flow hedges related to anticipated transactions are designated and documented at the inception of each hedge by matching the terms of the contract to the underlying transaction. Cash flows from hedging transactions are classified in the same categories as the cash flows from the respective hedged items. Once established, cash flow hedges generally remain designated as such until the hedged item impacts net earnings, or the anticipated transaction is no longer likely to occur. For de-designated cash flow hedges or for transactions that are no longer likely to occur, the related accumulated derivative gains or losses are recognized in interest income and other, net or interest expense on our consolidated statements of earnings based on the nature of the underlying transaction.
57
Net Investment Hedges
For derivative instruments that are designated and qualify as a net investment hedge, the effective portion of the derivative's gain or loss is reported as a component of OCI and recorded in AOCI. The gain or loss will be subsequently reclassified into net earnings when the hedged net investment is either sold or substantially liquidated.
To the extent that the change in the fair value of the forward contract corresponds to the change in value of the anticipated transactions using spot rates on a monthly basis, the hedge is considered effective and is recognized as described above. The remaining change in fair value of the forward contract represents the ineffective portion, which is immediately recognized in interest income and other, net on our consolidated statements of earnings.
Fair Value Hedges
For derivative instruments that are designated and qualify as a fair value hedge, the changes in fair value of the derivative instruments and the offsetting changes in fair values of the underlying hedged item are recorded in interest income and other, net or interest expense on our consolidated statements of earnings.
Derivatives Not Designated As Hedging Instruments
We also enter into certain foreign currency forward contracts, commodity futures contracts, collars and swaps that are not designated as hedging instruments for accounting purposes. The change in the fair value of these contracts is immediately recognized in interest income and other, net on our consolidated statements of earnings.
Normal Purchase Normal Sale
We enter into fixed-price and price-to-be-fixed green coffee purchase commitments, which are described further at
Note 5
, Inventories. For both fixed-price and price-to-be-fixed purchase commitments, we expect to take delivery of and to utilize the coffee in a reasonable period of time and in the conduct of normal business. Accordingly, these purchase commitments qualify as normal purchases and are not recorded at fair value on our balance sheets.
Refer to
Note 3
, Derivative Financial Instruments, and
Note 5
, Inventories, for further discussion of our derivative instruments and green coffee purchase commitments.
Receivables, net of Allowance for Doubtful Accounts
Our receivables are mainly comprised of receivables for product and equipment sales to and royalties from our licensees, as well as receivables from our CPG customers. Our allowance for doubtful accounts is calculated based on historical experience, customer credit risk and application of the specific identification method. As of
September 30, 2018
and
October 1, 2017
, our allowance for doubtful accounts was
$8.0 million
and
$9.8 million
, respectively.
Inventories
Inventories are stated at the lower of cost (primarily moving average cost) or net realizable value. We record inventory reserves for obsolete and slow-moving inventory and for estimated shrinkage between physical inventory counts. Inventory reserves are based on inventory obsolescence trends, historical experience and application of the specific identification method. As of
September 30, 2018
and
October 1, 2017
, inventory reserves were
$41.5 million
and
$38.4 million
, respectively.
Property, Plant and Equipment
Property, plant and equipment, which includes assets under capital leases, are carried at cost less accumulated depreciation. Cost includes all direct costs necessary to acquire and prepare assets for use, including internal labor and overhead in some cases. Depreciation is computed using the straight-line method over estimated useful lives of the assets, generally ranging from
2
to
15 years
for equipment and
30
to
40 years
for buildings. Leasehold improvements are amortized over the shorter of their estimated useful lives or the related lease life, generally
10 years
. For leases with renewal periods at our option, we generally use the original lease term, excluding renewal option periods, to determine estimated useful lives. If failure to exercise a renewal option imposes an economic penalty to us, we may determine at the inception of the lease that renewal is reasonably assured and include the renewal option period in the determination of the appropriate estimated useful lives.
The portion of depreciation expense related to production and distribution facilities is included in cost of sales including occupancy costs on our consolidated statements of earnings. The costs of repairs and maintenance are expensed when incurred, while expenditures for refurbishments and improvements that significantly add to the productive capacity or extend the useful life of an asset are capitalized. When assets are disposed of, whether through retirement or sale, the net gain or loss is recognized in net earnings. Long-lived assets to be disposed of are reported at the lower of their carrying amount or fair value less estimated costs to sell.
We evaluate property, plant and equipment for impairment when facts and circumstances indicate that the carrying values of such assets may not be recoverable. When evaluating for impairment, we first compare the carrying value of the asset to the
58
asset’s estimated future undiscounted cash flows. If the estimated undiscounted future cash flows are less than the carrying value of the asset, we determine if we have an impairment loss by comparing the carrying value of the asset to the asset's estimated fair value and recognize an impairment charge when the asset’s carrying value exceeds its estimated fair value. The fair value of the asset is estimated using a discounted cash flow model based on forecasted future revenues and operating costs, using internal projections. Property, plant and equipment assets are grouped at the lowest level for which identifiable cash flows are largely independent of the cash flows of other assets and liabilities. For company-operated store assets, the impairment test is performed at the individual store asset group level.
We recognized net disposition charges of
$32.8 million
,
$46.9 million
, and
$25.1 million
in fiscal
2018
,
2017
, and
2016
, respectively. Additionally, we recognized net impairment charges of
$42.8 million
,
$56.1 million
, and
$24.1 million
in fiscal
2018
,
2017
, and
2016
, respectively. Of the total net impairment charges,
$37.0 million
and
$39.9 million
in fiscal 2018 and 2017, respectively, were restructuring related and recorded in restructuring and impairment expenses. Unless it is restructuring related, the nature of the underlying asset that is impaired or disposed of will determine the operating expense line on which the related impact is recorded on our consolidated statements of earnings.
Goodwill
We evaluate goodwill for impairment annually during our third fiscal quarter, or more frequently if an event occurs or circumstances change, such as material deterioration in performance or a significant number of store closures, that would indicate that impairment may exist. When evaluating goodwill for impairment, we may first perform a qualitative assessment to determine whether it is more likely than not that a reporting unit is impaired. If we do not perform a qualitative assessment, or if we determine that it is not more likely than not that the fair value of the reporting unit exceeds its carrying amount, we calculate the estimated fair value of the reporting unit. Fair value is typically calculated using a discounted cash flow model. For certain reporting units, where deemed appropriate, we may also utilize a market approach for estimating fair value. If the carrying amount of the reporting unit exceeds the estimated fair value, an impairment charge is recorded to reduce the carrying value to the estimated fair value.
As part of our ongoing operations, we may close certain stores within a reporting unit containing goodwill due to underperformance of the store or inability to renew our lease, among other reasons. We may abandon certain assets associated with a closed store, including leasehold improvements and other non-transferable assets. When a portion of a reporting unit that constitutes a business is to be disposed of, goodwill associated with the business is included in the carrying amount of the business in determining any loss on disposal. Our evaluation of whether the portion of a reporting unit being disposed of constitutes a business occurs on the date of abandonment. Although an operating store meets the accounting definition of a business prior to abandonment, it does not constitute a business on the closure date because the remaining assets on that date do not constitute an integrated set of activities (substantive processes) and assets that are capable of being managed for the purpose of providing a return to investors. As a result, when closing individual stores, we do not include goodwill in the calculation of any loss on disposal of the related assets.
For goodwill related to our Switzerland retail reporting unit, we initially recorded an impairment charge of
$17.9 million
in the third quarter of fiscal 2017. This was primarily due to the impacts of the strength of the Swiss franc, continued shift of consumer behaviors to neighboring countries and the relocations of certain businesses sustaining beyond our projections and indicating the reporting unit's carrying value would not be fully recovered. Since then, the operational investments and improvements we made did not sufficiently slow the performance decline, and we recorded impairment charges of
$37.6 million
for the remaining Switzerland goodwill balance during fiscal 2018.
As noted above, if store closures are indicative of potential impairment of goodwill at the reporting unit level, we perform an evaluation of our reporting unit goodwill when such closures occur. Due to the strategic decision to close Teavana branded retail stores and our subsequent review of this reporting unit's fair value, we recorded goodwill impairment charges of
$69.3 million
during the third quarter of fiscal 2017.
There were
no
material goodwill impairment charges recorded during fiscal
2016
. Refer to
Note 8
, Other Intangible Assets and Goodwill, for further discussions.
Other Intangible Assets
Other intangible assets include finite-lived intangible assets, which mainly consist of acquired and reacquired rights, trade secrets, licensing agreements, contract-based patents and copyrights. These assets are amortized over their estimated useful lives and are tested for impairment using a similar methodology to our property, plant and equipment, as described above.
Indefinite-lived intangibles, which consist primarily of trade names and trademarks, are tested for impairment annually during the third fiscal quarter, or more frequently if an event occurs or circumstances change that would indicate that impairment may exist. When evaluating other intangible assets for impairment, we may first perform a qualitative assessment to determine whether it is more likely than not that an intangible asset group is impaired. If we do not perform the qualitative assessment, or if we determine that it is not more likely than not that the fair value of the intangible asset group exceeds its carrying amount,
59
we calculate the estimated fair value of the intangible asset group. Fair value is the price a willing buyer would pay for the intangible asset group and is typically calculated using an income approach, such as a relief-from-royalty model. If the carrying amount of the intangible asset group exceeds the estimated fair value, an impairment charge is recorded to reduce the carrying value to the estimated fair value. In addition, we continuously monitor and may revise our intangible asset useful lives if and when facts and circumstances change.
There were no significant other intangible asset impairment charges recorded during fiscal
2018
,
2017
, and
2016
.
Insurance Reserves
We use a combination of insurance and self-insurance mechanisms, including a wholly-owned captive insurance entity and participation in a reinsurance treaty, to provide for the potential liabilities for certain risks, including workers’ compensation, healthcare benefits, general liability, property insurance and director and officers’ liability insurance. Liabilities associated with the risks that are retained by us are not discounted and are estimated, in part, by considering historical claims experience, demographics, exposure and severity factors and other actuarial assumptions.
Revenue Recognition
Consolidated revenues are presented net of intercompany eliminations for wholly-owned subsidiaries and investees controlled by us and for product sales to and royalty and other fees from licensees accounted for under the equity method. Additionally, consolidated revenues are recognized net of any discounts, returns, allowances and sales incentives, including coupon redemptions and rebates.
Company-operated Store Revenues
Company-operated store revenues are recognized when payment is tendered at the point of sale. Company-operated store revenues are reported net of sales, use or other transaction taxes that are collected from customers and remitted to taxing authorities.
Licensed Store Revenues
Licensed store revenues consist of product and equipment sales to licensees, as well as royalties and other fees paid by licensees. Sales of coffee, tea, food and related products are generally recognized upon shipment to licensees, depending on contract terms. Shipping charges billed to licensees are also recognized as revenue, and the related shipping costs are included in cost of sales including occupancy costs on our consolidated statements of earnings.
Initial nonrefundable license fees for licensed stores are recognized upon substantial performance of services for new market business development activities, such as initial business, real estate and store development planning, as well as providing operational materials and functional training courses for opening new licensed retail markets. Royalty revenues based upon a percentage of reported sales, and other continuing fees, such as marketing and service fees, are recognized on a monthly basis when earned.
Other Revenues
Other revenues primarily include sales of packaged coffee, tea and a variety of ready-to-drink beverages and single-serve coffee and tea products to customers outside of our company-operated and licensed stores. Historically revenues have included domestic and international sales of our packaged coffee, tea and ready-to-drink products to grocery, warehouse clubs and specialty retail stores and through institutional foodservice accounts. Sales of coffee, tea, ready-to-drink beverages and related products to grocery, warehouse club stores and foodservice accounts were generally recognized when received by the customer or distributor, depending on contract terms. Revenues were recorded net of sales discounts given to customers for trade promotions and other incentives and for sales return allowances, which are determined based on historical patterns.
Sales to customers through CPG channels and national foodservice accounts, including sales to national distributors, were recognized net of certain fees paid to the customer. We characterized these fees as a reduction of revenue unless we were able to identify a sufficiently separable benefit from the customer's purchase of our products such that we could have entered into an exchange transaction with a party other than the customer in order to receive such benefit, and we could reasonably estimate the fair value of such benefit.
Revenues from sales of products to manufacturers that produce, market and sell our products through licensing agreements are generally recognized when the product is received by the manufacturer or distributor. License fee revenues from manufacturers are based on a percentage of sales and are recognized on a monthly basis when earned.
In the fourth quarter of fiscal 2018, we licensed the rights to sell and market our products in authorized channels to Nestlé and also received an upfront prepaid royalty. The upfront payment was recorded as deferred revenue and will be recognized as other revenue on a straight-line basis over the estimated economic life of the arrangement of
40 years
. At September 30, 2018, the current and long term deferred revenue related to the Nestlé upfront payment was
$174 million
and
$6.8 billion
, respectively.
60
Additionally, other revenues will include product sales to and licensing revenue from Nestlé under this arrangement. Product sales to Nestlé are generally recognized when the product is shipped, whereas license and royalty revenues are based on a percentage of sales and are recognized on a monthly basis when earned.
Stored Value Cards
Stored value cards, primarily Starbucks Cards, can be activated at our company-operated and most licensed store locations, online at Starbucks.com or via mobile devices held by our customers, and at certain other third party locations, such as grocery stores, although they cannot be reloaded at these third party locations. When an amount is loaded onto a stored value card at any of these locations, we recognize a corresponding liability for the full amount loaded onto the card, which is recorded within stored value card liability on our consolidated balance sheets.
Stored value cards can be redeemed at company-operated and most licensed stores. When a stored value card is redeemed at a company-operated store, we recognize revenue by reducing the stored value card liability. When a stored value card is redeemed at a licensed store location, we reduce the corresponding stored value card liability and cash, which is reimbursed to the licensee.
In most markets, there are no expiration dates on our stored value cards and we do not charge service fees that cause a decrement to customer balances. While we will continue to honor all stored value cards presented for payment, management may determine the likelihood of redemption, based on historical experience, is deemed to be remote for certain cards due to long periods of inactivity. In these circumstances, if management also determines there is no requirement for remitting balances to government agencies under unclaimed property laws, unredeemed card balances may then be recognized as breakage income, which is included in interest income and other, net on our consolidated statements of earnings. In fiscal
2018
,
2017
, and
2016
, we recognized breakage income of
$155.9 million
,
$104.6 million
, and
$60.5 million
, respectively. Refer to the
Recent Accounting Pronouncements
section of this footnote for further discussion regarding the expected changes to breakage income in the first quarter of fiscal 2019.
Loyalty Program
In the U.S. and Canada, effective April 2016, we modified our transaction-based loyalty program, My Starbucks Rewards
®
to a spend-based program, Starbucks Rewards
TM
. For fiscal 2016, the existing transaction-based programs remain unchanged for other markets. During fiscal 2017, we launched Starbucks Rewards
TM
in Japan. Customers in the U.S., Canada, and certain other countries who register their Starbucks Card are automatically enrolled in the program. They earn loyalty points (“Stars”) with each purchase at participating Starbucks
®
stores, as well as on certain packaged coffee products purchased in select Starbucks
®
stores, through CPG channels, and when making purchases with the Starbucks branded credit and debit cards. After accumulating a certain number of Stars, the customer earns a reward that can be redeemed for free product that, regardless of where the related Stars were earned within that country, will be honored at company-operated stores and certain participating licensed store locations in that same country.
Regardless of whether it is a spend or transaction-based program, we defer revenue associated with the estimated selling price of Stars earned by our program members towards free product as each Star is earned, and a corresponding liability is established within stored value card liability on our consolidated balance sheets. The estimated selling price of each Star earned is based on the estimated value of the product for which the reward is expected to be redeemed, net of Stars we do not expect to be redeemed, based on historical redemption patterns. Stars generally expire if inactive for a period of six months.
When a customer redeems an earned reward, we recognize revenue for the redeemed product and reduce the related loyalty program liability.
Advertising
We expense most advertising costs as they are incurred, except for certain production costs that are expensed the first time the advertising takes place. Advertising expenses totaled
$260.3 million
,
$282.6 million
and
$248.6 million
in fiscal
2018
,
2017
, and
2016
, respectively.
Store Preopening Expenses
Costs incurred in connection with the start-up and promotion of new store openings are expensed as incurred.
Leases
Operating Leases
We lease retail stores, roasting, distribution and warehouse facilities and office space for corporate administrative purposes under operating leases. Most lease agreements contain tenant improvement allowances, rent holidays, lease premiums, rent escalation clauses and/or contingent rent provisions. We recognize amortization of lease incentives, premiums and minimum
61
rent expenses on a straight-line basis beginning on the date of initial possession, which is generally when we enter the space and begin to make improvements in preparation for intended use.
For tenant improvement allowances and rent holidays, we record a deferred rent liability within accrued liabilities, or other long-term liabilities, on our consolidated balance sheets and amortize the deferred rent over the terms of the leases as reductions to rent expense in cost of sales including occupancy costs on our consolidated statements of earnings.
For premiums paid upfront to enter a lease agreement, we record a prepaid rent asset in prepaid expenses and other current assets and other long-term assets on our consolidated balance sheets and amortize the premium over the terms of the leases as additional rent expense in cost of sales including occupancy costs on our consolidated statements of earnings.
For scheduled rent escalation clauses during the lease terms or for rental payments commencing at a date other than the date of initial possession, we record minimum rent expense on a straight-line basis over the terms of the leases in cost of sales including occupancy costs on our consolidated statements of earnings, with the adjustments to cash rent accrued as deferred rent in our consolidated balance sheets.
Certain leases provide for contingent rent, which is determined as a percentage of gross sales in excess of specified levels. We record a contingent rent liability in accrued occupancy costs within accrued liabilities on our consolidated balance sheets and the corresponding rent expense when we determine that achieving the specified levels during the fiscal year is probable.
When ceasing operations of company-operated stores under operating leases, in cases where the lease contract specifies a termination fee due to the landlord, we record such expense at the time written notice is given to the landlord. In cases where terms, including termination fees, are yet to be negotiated with the landlord, we will record the expense upon signing of an agreement with the landlord. In cases where the landlord does not allow us to prematurely exit the lease, we recognize a lease abandonment accrual equal to the present value of the remaining lease payments to the landlord and other rent related payments such as common area maintenance, taxes and insurance, less any projected sublease income at the cease-use date.
Lease Financing Arrangements
We are sometimes involved in the construction of leased buildings, primarily stores. When we qualify as the deemed owner of these buildings due to significant involvement during the construction period under build-to-suit lease accounting requirements and do not qualify for sales recognition under sales-leaseback accounting guidance, we record the cost of the related buildings in property, plant and equipment, net. The offsetting lease financing obligations are recorded in other long-term liabilities, with the current portion recorded in accrued occupancy costs within accrued liabilities on our consolidated balance sheets. These assets and obligations are amortized in depreciation and amortization and interest expense, respectively, on our consolidated statements of earnings based on the terms of the related lease agreements.
Asset Retirement Obligations
We recognize a liability for the fair value of required asset retirement obligations (“ARO”) when such obligations are incurred. Our AROs are primarily associated with leasehold improvements, which, at the end of a lease, we are contractually obligated to remove in order to comply with the lease agreement. At the inception of a lease with such conditions, we record an ARO liability and a corresponding capital asset in an amount equal to the estimated fair value of the obligation. We estimate the liability using a number of assumptions, including store closing costs, cost inflation rates and discount rates, and accrete the liability to its projected future value over time. The capitalized asset is depreciated using the same depreciation convention as leasehold improvement assets. Upon satisfaction of the ARO conditions, any difference between the recorded ARO liability and the actual retirement costs incurred is recognized as a gain or loss in cost of sales including occupancy costs on our consolidated statements of earnings. As of
September 30, 2018
and
October 1, 2017
, our net ARO assets included in property, plant and equipment were
$19.1 million
and
$12.4 million
, respectively, and our net ARO liabilities included in other long-term liabilities were
$82.4 million
and
$70.0 million
, respectively.
Stock-based Compensation
We maintain several equity incentive plans under which we may grant non-qualified stock options, incentive stock options, restricted stock, restricted stock units (“RSUs”) or stock appreciation rights to employees, non-employee directors and consultants. We also have an employee stock purchase plan (“ESPP”). RSUs issued by us are equivalent to nonvested shares under the applicable accounting guidance. We record stock-based compensation expense based on the fair value of stock awards at the grant date and recognize the expense over the related service period following a graded vesting expense schedule. Expense for performance-based RSUs is recognized when it is probable the performance goal will be achieved. Performance goals are determined by the Board of Directors and may include measures such as earnings per share, operating income and return on invested capital. The fair value of each stock option granted is estimated on the grant date using the Black-Scholes-Merton option valuation model. The assumptions used to calculate the fair value of options granted are evaluated and revised, as necessary, to reflect market conditions and our historical experience. The fair value of RSUs is based on the closing price of Starbucks common stock on the award date, less the present value of expected dividends not received during the vesting period.
62
Compensation expense is recognized over the requisite service period for each separately vesting portion of the award, and only for those awards expected to vest, with forfeitures estimated at the date of grant based on our historical experience and future expectations.
Foreign Currency Translation
Our international operations generally use their local currency as their functional currency. Assets and liabilities are translated at exchange rates in effect at the balance sheet date. Income and expense accounts are translated at the average monthly exchange rates during the year. Resulting translation adjustments are reported as a component of OCI and recorded in AOCI on our consolidated balance sheets.
Income Taxes
We compute income taxes using the asset and liability method, under which deferred income taxes are recognized based on the differences between the financial statement carrying amounts and the respective tax basis of our assets and liabilities. Deferred tax assets and liabilities are measured using current enacted tax rates expected to apply to taxable income in the years in which we expect the temporary differences to reverse. The effect of a change in tax rates on deferred taxes is recognized in income in the period that includes the enactment date.
We routinely evaluate the likelihood of realizing the benefit of our deferred tax assets and may record a valuation allowance if, based on all available evidence, we determine that some portion of the tax benefit will not be realized. In evaluating our ability to recover our deferred tax assets within the jurisdictions from which they arise, we consider all available positive and negative evidence, including scheduled reversals of deferred tax liabilities, projected future taxable income, tax-planning strategies, and results of recent operations. If we determine that we would be able to realize our deferred tax assets in the future in excess of their net recorded amount, we would make an adjustment to the deferred tax asset valuation allowance, which would reduce the provision for income taxes.
In addition, our income tax returns are periodically audited by domestic and foreign tax authorities. These audits include review of our tax filing positions, including the timing and amount of deductions taken and the allocation of income between tax jurisdictions. We evaluate our exposures associated with our various tax filing positions and recognize a tax benefit from an uncertain tax position only if it is more likely than not that the tax position will be sustained upon examination by the relevant taxing authorities, including resolutions of any related appeals or litigation processes, based on the technical merits of our position. The tax benefits recognized in the financial statements from such a position are measured based on the largest benefit that has a greater than 50% likelihood of being realized upon ultimate settlement. For uncertain tax positions that do not meet this threshold, we record a related liability. We adjust our unrecognized tax benefit liability and income tax expense in the period in which the uncertain tax position is effectively settled, the statute of limitations expires for the relevant taxing authority to examine the tax position or when new information becomes available.
Starbucks recognizes interest and penalties related to income tax matters in income tax expense on our consolidated statements of earnings. Accrued interest and penalties are included within the related tax liability on our consolidated balance sheets.
Earnings per Share
Basic earnings per share is computed based on the weighted average number of shares of common stock outstanding during the period. Diluted earnings per share is computed based on the weighted average number of shares of common stock and the effect of dilutive potential common shares outstanding during the period, calculated using the treasury stock method. Dilutive potential common shares include outstanding stock options and RSUs. Performance-based RSUs are considered dilutive when the related performance criterion has been met.
Common Stock Share Repurchases
We may repurchase shares of Starbucks common stock under a program authorized by our Board of Directors, including pursuant to a contract, instruction or written plan meeting the requirements of Rule 10b5-1(c)(1) of the Securities Exchange Act of 1934. Under applicable Washington State law, shares repurchased are retired and not displayed separately as treasury stock on the financial statements. Instead, the par value of repurchased shares is deducted from common stock and the excess repurchase price over par value is deducted from additional paid-in capital and from retained earnings.
Recent Accounting Pronouncements
In February 2018, the Financial Accounting Standards Board (“FASB”) issued guidance on the reclassification of certain tax effects from AOCI. The guidance permits entities to reclassify the stranded tax effects resulting from the Tax Act from AOCI to retained earnings. The guidance will be effective at the beginning of our first quarter of fiscal 2020 but permits adoption in an earlier period. The guidance may be applied in the period of adoption or retrospectively to each period in which the effect of the change related to the Tax Act was recognized. We are currently evaluating the impact this guidance will have on our consolidated financial statements and the timing of adoption.
63
In August 2017, the FASB amended its guidance on the accounting for hedging relationships. The new guidance eliminates the requirement to separately measure and report hedge ineffectiveness, expands permissible cash flow hedges on contractually specified components, and simplifies hedge documentation and effectiveness assessment. The guidance will be effective at the beginning of our first quarter of fiscal 2020 and will require a modified retrospective approach on existing cash flow and net investment hedges. The presentation and disclosure requirements will be applied prospectively. We are currently evaluating the impact this guidance will have on our consolidated financial statements and the timing of adoption.
In January 2017, the FASB issued new accounting guidance that changes the definition of a business to assist companies in evaluating when a set of transferred assets and activities constitutes a business. We elected to adopt this guidance in fiscal 2018, which was applied to transactions subsequent to adoption.
In October 2016, the FASB issued guidance on the accounting for income tax effects of intercompany sales or transfers of assets other than inventory. The guidance requires entities to recognize the income tax impact of an intra-entity sale or transfer of an asset other than inventory when the sale or transfer occurs, rather than when the asset has been sold to an outside party. The guidance will require a modified retrospective application with a cumulative catch-up adjustment to opening retained earnings at the beginning of our first quarter of fiscal 2019. We expect to record a deferred tax asset relating to these historical intercompany activities; however, we are still assessing its final impact.
In March 2016, the FASB issued guidance related to stock-based compensation, which changes the accounting and classification of excess tax benefits and minimum tax withholdings on share-based awards. This guidance requires that excess tax benefits and tax deficiencies related to stock-based compensation be prospectively reflected as income tax expense in our consolidated statement of earnings instead of additional paid-in capital on our consolidated balance sheet. Additionally, within our consolidated statement of cash flows, this guidance requires excess tax benefits to be presented as an operating activity, rather than a financing activity, in the same manner as other cash flows related to income taxes. We adopted this guidance in the first quarter of fiscal 2018. The primary impact of the adoption was the recognition of excess tax benefits that reduced income tax expenses by
$60.2 million
for the year ended
September 30, 2018
, instead of additional paid-in capital. As a result, net income increased
$60.2 million
for the year ended
September 30, 2018
, and basic and diluted earnings per share increased
$0.04
for the year ended
September 30, 2018
, respectively. Excess tax benefits of
$77.5 million
and
$122.8 million
, for the years ended
October 1, 2017
and October 2, 2016, respectively, previously reported in financing activities have been reclassified to operating activities in the consolidated statements of cash flows.
In March 2016, the FASB issued guidance for financial liabilities resulting from selling prepaid stored value products that are redeemable at third-party merchants. Under the new guidance, expected breakage amounts associated with these products must be recognized proportionately in earnings as redemption occurs. Our current accounting policy of applying the remote method to all of our stored value cards, including cards redeemable at the third-party licensed locations, will no longer be allowed. We will adopt and implement the provisions of this guidance and the new revenue recognition standard issued by the FASB, as discussed below, in the first quarter of fiscal 2019.
In February 2016, the FASB issued guidance on the recognition and measurement of leases. Under the new guidance, lessees are required to recognize a lease liability, which represents the discounted obligation to make future minimum lease payments, and a corresponding right-of-use asset on the balance sheet for most leases. The guidance retains the current accounting for lessors and does not make significant changes to the recognition, measurement, and presentation of expenses and cash flows by a lessee. Enhanced disclosures will also be required to give financial statement users the ability to assess the amount, timing and uncertainty of cash flows arising from leases. In July 2018, the FASB issued an alternative method that permits application of the new guidance at the beginning of the year of adoption. This is in addition to the method of applying the new guidance retrospectively to each prior reporting period presented. The guidance will be effective for us at the beginning of our first quarter of fiscal 2020, with optional practical expedients. Early adoption is permitted. We are currently evaluating the impact this guidance will have on our consolidated financial statements and the method of adoption. We expect this adoption will result in a material increase in the assets and liabilities on our consolidated balance sheets but will likely have an insignificant impact on our consolidated statements of earnings. In preparation for the adoption of the guidance, we are in the process of implementing controls and key system changes to enable the preparation of financial information.
In May 2014, the FASB issued guidance outlining a single comprehensive model for entities to use in accounting for revenue arising from contracts with customers that supersedes most current revenue recognition guidance. This guidance requires an entity to recognize revenue when it transfers promised goods or services to customers in an amount that reflects the consideration to which the entity expects to be entitled in exchange for those goods or services. The new guidance may be applied retrospectively to each prior period presented or prospectively with the cumulative effect recognized as of the date of adoption (“modified retrospective method”). We have determined the adoption will change the timing of recognition and classification of our stored value card breakage income, which is currently recognized using the remote method and recorded in interest income and other, net. The new guidance will require application of the proportional method and classification within total net revenues on our consolidated statements of earnings. Additionally, the new guidance requires enhanced disclosures, including revenue recognition policies to identify performance obligations to customers and significant judgments in
64
measurement and recognition. We will adopt this guidance in the first quarter of fiscal 2019 utilizing the modified retrospective method with a cumulative adjustment to retained earnings of approximately
$300 million
.
Fiscal 2018
We entered into an agreement on May 6, 2018 to establish the Global Coffee Alliance with Nestlé. On August 26, 2018, Nestlé licensed the rights to market, sell and distribute Starbucks consumer packaged goods and foodservice products in authorized channels. We received an upfront payment of approximately
$7 billion
primarily of prepaid royalties which was recorded as a liability to current and long-term deferred revenue and will be recognized as other revenue on a straight-line basis over the estimated economic life of the arrangement.
On March 23, 2018, we sold our company-operated retail store assets and operations in Brazil to SouthRock, converting these operations to a fully licensed market, for a total of
$48.2 million
. This transaction resulted in an insignificant pre-tax loss. This pre-tax loss was included in net gain resulting from divestiture of certain operations on our consolidated statements of earnings.
On December 31, 2017, we acquired the remaining
50%
interest of our East China joint venture (“East China”) from President Chain Store (Hong Kong) Holding Ltd. and Kai Yu (BVI) collectively, “Uni-President Group” or “UPG”, for approximately
$1.4 billion
. Approximately
$90.5 million
of pre-existing liabilities owed by East China to Starbucks were effectively settled upon the acquisition. Acquiring the remaining interest of East China, which operates over
1,400
stores in the Shanghai, Jiangsu and Zhejiang Provinces, builds on the Company's ongoing investment in China. The estimated fair values of the assets acquired and liabilities assumed are based on valuation and analysis performed by management. The valuation of certain assets and liabilities is preliminary and are subject to change as additional information becomes available.
Concurrently with the purchase of our East China joint venture, we sold our
50%
interest in President Starbucks Coffee Taiwan Limited, our joint venture operations in Taiwan, to UPG for approximately
$181.2 million
. The transaction resulted in a pre-tax gain of
$156.6 million
which was included in net gain resulting from divestiture of certain operations on our consolidated statements of earnings.
The following table summarizes the preliminary allocation of the total consideration to the fair values of the assets acquired and liabilities assumed as of
December 31, 2017
, which are reported within our China/Asia Pacific segment
(in millions)
:
|
Consideration:
|
||||
|
Cash paid for UPG 50% equity interest
|
$
|
1,440.8
|
|
|
|
Fair value of our pre-existing 50% equity interest
|
1,440.8
|
|
||
|
Settlement of pre-existing liabilities
|
90.5
|
|
||
|
Total consideration
|
$
|
2,972.1
|
|
|
|
Fair value of assets acquired and liabilities assumed:
|
||||
|
Cash and cash equivalents
|
$
|
129.5
|
|
|
|
Accounts receivable
|
14.3
|
|
||
|
Inventories
|
16.1
|
|
||
|
Prepaid expenses and other current assets
|
20.6
|
|
||
|
Property, plant and equipment
|
254.1
|
|
||
|
Other long-term assets
|
44.6
|
|
||
|
Other intangible assets
|
818.0
|
|
||
|
Goodwill
|
2,164.1
|
|
||
|
Total assets acquired
|
3,461.3
|
|
||
|
Accounts payable
|
34.7
|
|
||
|
Accrued liabilities
|
187.7
|
|
||
|
Stored value card liability
|
21.7
|
|
||
|
Other long-term liabilities
|
245.1
|
|
||
|
Total liabilities assumed
|
489.2
|
|
||
|
Total consideration
|
$
|
2,972.1
|
|
|
As a result of this acquisition, we remeasured the carrying value of our preexisting
50%
equity method investment to fair value, which resulted in a total gain of
$1.4 billion
that is not subject to income tax, and was presented as gain resulting from acquisition of joint venture on our consolidated statements of earnings. The fair value of
$1.4 billion
was calculated using an
65
income approach, which was based on significant inputs that are not observable in the market and thus represents a fair value measurement categorized within Level 3 of the fair value hierarchy. Key assumptions used in estimating future cash flows included projected revenue growth and operating expenses, as well as the selection of an appropriate discount rate. Estimates of revenue growth and operating expenses were based on internal projections and considered the historical performance of stores, local market economics and the business environments impacting store performance. The discount rate applied was based on East China's weighted-average cost of capital and included company-specific and size risk premiums.
The assets acquired and liabilities assumed are reported within our China/Asia Pacific segment. Other current and long-term assets acquired primarily include lease deposits and prepaid rent. Accrued liabilities and other long-term liabilities assumed primarily include deferred income tax, dividend payable, accrued payroll, income tax payable and accrued occupancy costs.
The definite-lived intangibles primarily relate to reacquired rights to operate stores exclusively in East China. The reacquired rights of
$798.0 million
represent the fair value calculated over the remaining original contractual period and will be amortized on a straight-line basis through
September 2022
. Amortization expense for these definite-lived intangible assets for the fiscal year 2018 was
$129.8 million
. The estimated future amortization expense is approximately
$163.8 million
each year for the next three years and approximately
$160.4 million
in the final year of fiscal 2022.
Goodwill represents the intangible assets that do not qualify for separate recognition and primarily includes the acquired customer base, the acquired workforce including store partners in the region that have strong relationships with these customers, and the existing geographic retail and online presence. The entire balance was allocated to the China/Asia Pacific segment and is not deductible for income tax purposes. Due to foreign currency translation, the balance of goodwill related to the acquisition decreased
$115.2 million
since the date of acquisition to
$2.0 billion
as of September 30, 2018.
We began consolidating East China's results of operations and cash flows into our consolidated financial statements after December 31, 2017. For the year ended
September 30, 2018
, East China's revenue included in our consolidated statements of earnings was
$903.0 million
. For the year ended
September 30, 2018
, East China's net earnings included in our consolidated statements of earnings was
$73.1 million
.
The following table provides the supplemental pro forma revenue and net earnings of the combined entity had the acquisition date of East China been October 3, 2016, the first day of our first quarter of fiscal 2017, rather than the end of our first quarter of fiscal 2018
(in millions)
:
|
Pro Forma (unaudited)
|
|||||||
|
Year Ended
|
|||||||
|
Sep 30, 2018
|
Oct 1, 2017
(1)
|
||||||
|
Revenue
|
$
|
24,990.4
|
|
$
|
23,315.0
|
|
|
|
Net earnings attributable to Starbucks
|
3,196.8
|
|
4,209.0
|
|
|||
|
(1)
|
The pro forma net earnings attributable to Starbucks for fiscal 2017 includes acquisition-related gain of
$1.4 billion
and transaction and integration costs of
$39.3 million
for the year ended October 1, 2017.
|
The amounts in the supplemental pro forma earnings for the periods presented above fully eliminate intercompany transactions, apply our accounting policies and reflect adjustments for additional occupancy costs as well as depreciation and amortization that would have been charged assuming the same fair value adjustments to leases, property, plant and equipment and acquired intangibles had been applied on October 3, 2016. These pro forma results are unaudited and are not necessarily indicative of results of operations that would have occurred had the acquisition actually closed in the prior year period or indicative of the results of operations for any future period.
During the year ended September 30, 2018, we incurred approximately
$3.6 million
of acquisition-related costs, such as regulatory, legal, and advisory fees, which were recorded in general and administrative expenses.
On December 11, 2017, we sold the assets associated with our Tazo brand including Tazo
®
signature recipes, intellectual property and inventory to Unilever for a total of
$383.8 million
. The transaction resulted in a pre-tax gain of
$347.9 million
, which was included in the net gain from divestiture of certain operations on our consolidated statements of earnings. Results from Tazo operations prior to the sale are reported primarily in Channel Development.
Fiscal 2017
In the fourth quarter of fiscal 2017, we sold our company-operated retail store assets and operations in Singapore to Maxim's Caterers Limited, converting these operations to a fully licensed market, for a total of
$119.9 million
. This transaction resulted in a pre-tax gain of
$83.9 million
, which was included in the net gain resulting from divestiture of certain operations on our consolidated statements of earnings.
66
Fiscal 2016
During the third quarter of fiscal 2016, we sold our ownership interest in our Germany retail business to AmRest Holdings SE for a total of
$47.3 million
. This transaction converted these company-operated stores to a fully licensed market and resulted in an
insignificant
pre-tax gain, which was included in the net gain resulting from divestiture of certain operations on our consolidated statements of earnings.
Interest Rates
We are subject to interest rate volatility with regard to existing and future issuances of debt. From time to time, we enter into swap agreements to manage our exposure to interest rate fluctuations.
To hedge the variability in cash flows due to changes in benchmark interest rates, we enter into interest rate swap agreements related to anticipated debt issuances. These agreements are cash settled at the time of the pricing of the related debt. The effective portion of the derivative's gain or loss is recorded in AOCI and is subsequently reclassified to interest expense over the life of the related debt. Refer to
Note 9
, Debt, for details of the components of our long-term debt.
To hedge the exposure to changes in the fair value of our fixed-rate debt, we enter into interest rate swap agreements, which are designated as fair value hedges. The changes in fair value of these derivative instruments and the offsetting changes in fair values of the underlying hedged debt are recorded in interest expense and have an insignificant impact on our consolidated statements of earnings. Refer to
Note 9
, Debt, for additional information on our long-term debt.
Foreign Currency
To reduce cash flow volatility from foreign currency fluctuations, we enter into forward and swap contracts to hedge portions of cash flows of anticipated intercompany royalty payments, inventory purchases and intercompany borrowing and lending activities. The effective portion of the derivative's gain or loss is recorded in AOCI and is subsequently reclassified to revenue, cost of sales including occupancy costs or interest income and other, net, respectively, when the hedged exposure affects net earnings.
To mitigate foreign currency transaction risk of intercompany borrowings, we enter into cross-currency swap contracts, which are designated as cash flow hedges. Gains and losses from these swaps offset the changes in value of interest and principal payments as a result of changes in foreign exchange rates. There are no credit-risk-related contingent features associated with these swaps, although we may hold or post collateral depending upon the gain or loss position of the swap agreements.
We also enter into forward contracts or use foreign currency-denominated debt to hedge the foreign currency exposure of our net investment in certain international operations. The effective portion of the derivative's gain or loss is recorded in AOCI and is subsequently reclassified to net earnings when the hedged net investment is either sold or substantially liquidated.
To mitigate the foreign exchange risk of certain balance sheet items, we enter into foreign currency forward and swap contracts that are not designated as hedging instruments. Gains and losses from these derivatives are largely offset by the financial impact of translating foreign currency denominated payables and receivables; both are recorded in interest income and other, net.
Commodities
Depending on market conditions, we may enter into coffee futures contracts and collars to hedge a portion of anticipated cash flows under our price-to-be-fixed green coffee contracts, which are described further in
Note 5
, Inventories. The effective portion of each derivative's gain or loss is recorded in AOCI and is subsequently reclassified to cost of sales including occupancy costs when the hedged exposure affects net earnings.
To mitigate the price uncertainty of a portion of our future purchases, primarily of dairy products, diesel fuel and other commodities, we enter into swap contracts, futures and collars that are not designated as hedging instruments. Gains and losses from these derivatives are recorded in interest income and other, net and help offset price fluctuations on our beverage, food, packaging and transportation costs, which are included in cost of sales including occupancy costs on our consolidated statements of earnings.
67
Gains and losses on derivative contracts designated as hedging instruments included in AOCI and expected to be reclassified into earnings within 12 months, net of tax (
in millions
):
|
Net Gains/(Losses)
Included in AOCI |
Net Gains/(Losses) Expected to be Reclassified from AOCI into Earnings within 12 Months
|
Contract Remaining Maturity
(Months) |
|||||||||||||||
|
Sep 30,
2018 |
Oct 1,
2017 |
Oct 2,
2016 |
|||||||||||||||
|
Cash Flow Hedges:
|
|||||||||||||||||
|
Interest rates
|
$
|
24.7
|
|
$
|
17.6
|
|
$
|
20.5
|
|
$
|
4.2
|
|
0
|
||||
|
Cross-currency swaps
|
(12.6
|
)
|
(6.0
|
)
|
(7.7
|
)
|
—
|
|
74
|
||||||||
|
Foreign currency - other
|
5.8
|
|
(9.1
|
)
|
(0.4
|
)
|
3.8
|
|
36
|
||||||||
|
Coffee
|
(0.2
|
)
|
(6.6
|
)
|
(1.6
|
)
|
(0.2
|
)
|
5
|
||||||||
|
Net Investment Hedges:
|
|||||||||||||||||
|
Foreign currency
|
16.0
|
|
16.2
|
|
1.3
|
|
—
|
|
0
|
||||||||
|
Foreign currency debt
|
3.6
|
|
(2.2
|
)
|
—
|
|
—
|
|
66
|
||||||||
Pretax gains and losses on derivative contracts designated as hedging instruments recognized in other comprehensive income (“OCI”) and reclassifications from AOCI to earnings (
in millions
):
|
Year Ended
|
|||||||||||||||||||||||
|
Gains/(Losses) Recognized in
OCI Before Reclassifications |
Gains/(Losses) Reclassified from AOCI to Earnings
|
||||||||||||||||||||||
|
Sep 30,
2018 |
Oct 1,
2017 |
Oct 2,
2016 |
Sep 30,
2018 |
Oct 1,
2017 |
Oct 2,
2016 |
||||||||||||||||||
|
Cash Flow Hedges:
|
|||||||||||||||||||||||
|
Interest rates
|
$
|
14.1
|
|
$
|
—
|
|
$
|
(10.3
|
)
|
$
|
4.9
|
|
$
|
4.8
|
|
$
|
5.0
|
|
|||||
|
Cross-currency swaps
|
(6.1
|
)
|
59.5
|
|
(75.7
|
)
|
2.2
|
|
57.2
|
|
(101.1
|
)
|
|||||||||||
|
Foreign currency - other
|
16.7
|
|
1.8
|
|
(25.4
|
)
|
(3.6
|
)
|
11.4
|
|
19.1
|
|
|||||||||||
|
Coffee
|
(0.3
|
)
|
(8.1
|
)
|
1.7
|
|
(7.4
|
)
|
(2.7
|
)
|
(2.8
|
)
|
|||||||||||
|
Net Investment Hedges:
|
|||||||||||||||||||||||
|
Foreign currency
|
(0.1
|
)
|
23.6
|
|
—
|
|
—
|
|
—
|
|
—
|
|
|||||||||||
|
Foreign currency debt
|
7.9
|
|
(3.5
|
)
|
—
|
|
—
|
|
—
|
|
—
|
|
|||||||||||
Pretax gains and losses on non-designated derivatives and designated fair value hedging instruments recognized in earnings (
in millions
):
|
Gains/(Losses) Recognized in Earnings
|
|||||||||||
|
|
Sep 30, 2018
|
Oct 1, 2017
|
Oct 2, 2016
|
||||||||
|
Non-Designated Derivatives:
|
|||||||||||
|
Foreign currency - other
|
$
|
4.6
|
|
$
|
4.6
|
|
$
|
(5.7
|
)
|
||
|
Dairy
|
(2.4
|
)
|
—
|
|
(5.5
|
)
|
|||||
|
Diesel fuel and other commodities
|
3.7
|
|
1.3
|
|
(0.2
|
)
|
|||||
|
Designated Fair Value Hedging Instruments:
|
|||||||||||
|
Interest rate swap
|
(33.7
|
)
|
(5.2
|
)
|
—
|
|
|||||
68
Notional amounts of outstanding derivative contracts
(in millions)
|
Sep 30, 2018
|
Oct 1, 2017
|
||||||
|
Interest rate swap
|
$
|
750
|
|
$
|
750
|
|
|
|
Cross-currency swaps
|
434
|
|
514
|
|
|||
|
Foreign currency - other
|
914
|
|
901
|
|
|||
|
Dairy
|
16
|
|
14
|
|
|||
|
Diesel fuel and other commodities
|
21
|
|
41
|
|
|||
Fair value of outstanding derivative contracts (
in millions
):
|
Derivative Assets
|
Derivative Liabilities
|
||||||||||||||
|
Sep 30, 2018
|
Oct 1, 2017
|
Sep 30, 2018
|
Oct 1, 2017
|
||||||||||||
|
Designated Derivative Instruments:
|
|||||||||||||||
|
Cross-currency swaps
|
$
|
5.8
|
|
$
|
12.4
|
|
$
|
9.3
|
|
$
|
9.8
|
|
|||
|
Foreign currency - other
|
13.6
|
|
7.7
|
|
5.3
|
|
20.8
|
|
|||||||
|
Net investment hedges
|
—
|
|
0.3
|
|
—
|
|
—
|
|
|||||||
|
Interest rate swap
|
—
|
|
—
|
|
32.5
|
|
3.8
|
|
|||||||
|
Non-designated Derivative Instruments:
|
|||||||||||||||
|
Foreign currency
|
13.7
|
|
15.8
|
|
2.5
|
|
1.4
|
|
|||||||
|
Dairy
|
0.2
|
|
—
|
|
0.1
|
|
2.4
|
|
|||||||
|
Diesel fuel and other commodities
|
1.6
|
|
1.6
|
|
0.3
|
|
0.3
|
|
|||||||
Additional disclosures related to cash flow hedge gains and losses included in AOCI, as well as subsequent reclassifications to earnings, are included in
Note 11
, Equity.
69
Assets and Liabilities Measured at Fair Value on a Recurring Basis (in millions):
|
|
|
Fair Value Measurements at Reporting Date Using
|
|||||||||||||
|
|
Balance at
September 30, 2018 |
Quoted Prices
in Active
Markets for
Identical Assets
(Level 1)
|
Significant
Other Observable
Inputs
(Level 2)
|
Significant
Unobservable Inputs
(Level 3)
|
|||||||||||
|
Assets:
|
|||||||||||||||
|
Cash and cash equivalents
|
$
|
8,756.3
|
|
$
|
8,756.3
|
|
$
|
—
|
|
$
|
—
|
|
|||
|
Short-term investments:
|
|||||||||||||||
|
Available-for-sale securities
|
|||||||||||||||
|
Commercial paper
|
8.4
|
|
—
|
|
8.4
|
|
—
|
|
|||||||
|
Corporate debt securities
|
91.8
|
|
—
|
|
91.8
|
|
—
|
|
|||||||
|
Mortgage and other asset-backed securities
|
6.0
|
|
—
|
|
6.0
|
|
—
|
|
|||||||
|
Total available-for-sale securities
|
106.2
|
|
—
|
|
106.2
|
|
—
|
|
|||||||
|
Trading securities
|
75.3
|
|
75.3
|
|
—
|
|
—
|
|
|||||||
|
Total short-term investments
|
181.5
|
|
75.3
|
|
106.2
|
|
—
|
|
|||||||
|
Prepaid expenses and other current assets:
|
|||||||||||||||
|
Derivative assets
|
24.5
|
|
1.2
|
|
23.3
|
|
—
|
|
|||||||
|
Long-term investments:
|
|||||||||||||||
|
Available-for-sale securities
|
|||||||||||||||
|
Agency obligations
|
5.9
|
|
—
|
|
5.9
|
|
—
|
|
|||||||
|
Corporate debt securities
|
114.5
|
|
—
|
|
114.5
|
|
—
|
|
|||||||
|
Auction rate securities
|
5.9
|
|
—
|
|
—
|
|
5.9
|
|
|||||||
|
Foreign government obligations
|
3.6
|
|
—
|
|
3.6
|
|
—
|
|
|||||||
|
U.S. government treasury securities
|
108.1
|
|
108.1
|
|
—
|
|
—
|
|
|||||||
|
State and local government obligations
|
4.8
|
|
—
|
|
4.8
|
|
—
|
|
|||||||
|
Mortgage and other asset-backed securities
|
24.9
|
|
—
|
|
24.9
|
|
—
|
|
|||||||
|
Total long-term investments
|
267.7
|
|
108.1
|
|
153.7
|
|
5.9
|
|
|||||||
|
Other long-term assets:
|
|||||||||||||||
|
Derivative assets
|
10.4
|
|
—
|
|
10.4
|
|
—
|
|
|||||||
|
Total assets
|
$
|
9,240.4
|
|
$
|
8,940.9
|
|
$
|
293.6
|
|
$
|
5.9
|
|
|||
|
Liabilities:
|
|||||||||||||||
|
Accrued liabilities:
|
|||||||||||||||
|
Derivative liabilities
|
$
|
6.5
|
|
$
|
0.4
|
|
$
|
6.1
|
|
$
|
—
|
|
|||
|
Other long-term liabilities:
|
|||||||||||||||
|
Derivative liabilities
|
43.5
|
|
—
|
|
43.5
|
|
—
|
|
|||||||
|
Total liabilities
|
$
|
50.0
|
|
$
|
0.4
|
|
$
|
49.6
|
|
$
|
—
|
|
|||
70
|
|
|
Fair Value Measurements at Reporting Date Using
|
|||||||||||||
|
|
Balance at
Oct 1, 2017 |
Quoted Prices
in Active Markets for Identical Assets (Level 1) |
Significant
Other Observable Inputs (Level 2) |
Significant
Unobservable Inputs (Level 3) |
|||||||||||
|
Assets:
|
|||||||||||||||
|
Cash and cash equivalents
|
$
|
2,462.3
|
|
$
|
2,462.3
|
|
$
|
—
|
|
$
|
—
|
|
|||
|
Short-term investments:
|
|||||||||||||||
|
Available-for-sale securities
|
|||||||||||||||
|
Agency obligations
|
7.5
|
|
—
|
|
7.5
|
|
—
|
|
|||||||
|
Commercial paper
|
2.0
|
|
—
|
|
2.0
|
|
—
|
|
|||||||
|
Corporate debt securities
|
49.4
|
|
—
|
|
49.4
|
|
—
|
|
|||||||
|
Foreign government obligations
|
7.1
|
|
—
|
|
7.1
|
|
—
|
|
|||||||
|
U.S. government treasury securities
|
81.4
|
|
81.4
|
|
—
|
|
—
|
|
|||||||
|
State and local government obligations
|
2.0
|
|
—
|
|
2.0
|
|
—
|
|
|||||||
|
Certificates of deposit
|
2.3
|
|
—
|
|
2.3
|
|
—
|
|
|||||||
|
Total available-for-sale securities
|
151.7
|
|
81.4
|
|
70.3
|
|
—
|
|
|||||||
|
Trading securities
|
76.9
|
|
76.9
|
|
—
|
|
—
|
|
|||||||
|
Total short-term investments
|
228.6
|
|
158.3
|
|
70.3
|
|
—
|
|
|||||||
|
Prepaid expenses and other current assets:
|
|||||||||||||||
|
Derivative assets
|
13.4
|
|
0.1
|
|
13.3
|
|
—
|
|
|||||||
|
Long-term investments:
|
|||||||||||||||
|
Available-for-sale securities
|
|||||||||||||||
|
Agency obligations
|
21.8
|
|
—
|
|
21.8
|
|
—
|
|
|||||||
|
Corporate debt securities
|
207.4
|
|
—
|
|
207.4
|
|
—
|
|
|||||||
|
Auction rate securities
|
5.9
|
|
—
|
|
—
|
|
5.9
|
|
|||||||
|
Foreign government obligations
|
17.1
|
|
—
|
|
17.1
|
|
—
|
|
|||||||
|
U.S. government treasury securities
|
127.4
|
|
127.4
|
|
—
|
|
—
|
|
|||||||
|
State and local government obligations
|
7.0
|
|
—
|
|
7.0
|
|
—
|
|
|||||||
|
Mortgage and other asset-backed securities
|
155.7
|
|
—
|
|
155.7
|
|
—
|
|
|||||||
|
Total long-term investments
|
542.3
|
|
127.4
|
|
409.0
|
|
5.9
|
|
|||||||
|
Other long-term assets:
|
|||||||||||||||
|
Derivative assets
|
24.4
|
|
—
|
|
24.4
|
|
—
|
|
|||||||
|
Total assets
|
$
|
3,271.0
|
|
$
|
2,748.1
|
|
$
|
517.0
|
|
$
|
5.9
|
|
|||
|
Liabilities:
|
|||||||||||||||
|
Accrued liabilities:
|
|||||||||||||||
|
Derivative liabilities
|
$
|
16.4
|
|
$
|
2.5
|
|
$
|
13.9
|
|
$
|
—
|
|
|||
|
Other long-term liabilities:
|
|||||||||||||||
|
Derivative liabilities
|
22.1
|
|
—
|
|
22.1
|
|
—
|
|
|||||||
|
Total
|
$
|
38.5
|
|
$
|
2.5
|
|
$
|
36.0
|
|
$
|
—
|
|
|||
There were no material transfers between levels and there was no significant activity within Level 3 instruments during the periods presented. The fair values of any financial instruments presented above exclude the impact of netting assets and liabilities when a legally enforceable master netting agreement exists.
Available-for-sale Securities
Long-term investments generally mature within
4 years
. Proceeds from sales of available-for-sale securities were
$459.0 million
,
$999.7 million
, and
$680.7 million
for fiscal years
2018
,
2017
and
2016
, respectively. Realized gains and losses on sales and maturities of available-for-sale securities were not material for fiscal years
2018
,
2017
, and
2016
. Gross unrealized holding gains and losses on available-for-sale securities were not material as of
September 30, 2018
and
October 1, 2017
.
71
Trading Securities
Trading securities include equity mutual funds and exchange-traded funds. Our trading securities portfolio approximates a portion of our liability under our MDCP, a defined contribution plan. Our MDCP liability was
$102.2 million
and
$105.9 million
as of
September 30, 2018
and
October 1, 2017
, respectively. The changes in net unrealized holding gains and losses in the trading securities portfolio included in earnings for fiscal years
2018
,
2017
and
2016
were not material. Gross unrealized holding gains and losses on trading securities were not material as of
September 30, 2018
and
October 1, 2017
.
Derivative Assets and Liabilities
Derivative assets and liabilities include foreign currency forward contracts, commodity futures contracts, collars and swaps, which are described further in
Note 3
, Derivative Financial Instruments.
Assets and Liabilities Measured at Fair Value on a Nonrecurring Basis
Assets and liabilities recognized or disclosed at fair value on a nonrecurring basis include items such as property, plant and equipment, goodwill and other intangible assets, equity and cost method investments, and other assets. These assets are measured at fair value if determined to be impaired. Impairment of property, plant, and equipment is included at
Note 1
, Summary of Significant Accounting Policies.
Other than the impairments discussed in
Note 8
, Other Intangible Assets and Goodwill, and the aforementioned fair value adjustments, there were no other material fair value adjustments during fiscal
2018
and
2017
.
Fair Value of Other Financial Instruments
The estimated fair value of our long-term debt based on the quoted market price (Level 2) is included at
Note 9
, Debt.
|
Sep 30, 2018
|
Oct 1, 2017
|
||||||
|
Coffee:
|
|||||||
|
Unroasted
|
$
|
588.6
|
|
$
|
541.0
|
|
|
|
Roasted
|
281.2
|
|
301.1
|
|
|||
|
Other merchandise held for sale
|
273.1
|
|
301.1
|
|
|||
|
Packaging and other supplies
|
257.6
|
|
220.8
|
|
|||
|
Total
|
$
|
1,400.5
|
|
$
|
1,364.0
|
|
|
Other merchandise held for sale includes, among other items, serveware and tea. Inventory levels vary due to seasonality, commodity market supply and price fluctuations.
As of
September 30, 2018
, we had committed to purchasing green coffee totaling
$996 million
under fixed-price contracts and an estimated
$166 million
under price-to-be-fixed contracts. As of
September 30, 2018
,
none
of our price-to-be-fixed contracts were effectively fixed through the use of futures contracts. Price-to-be-fixed contracts are purchase commitments whereby the quality, quantity, delivery period and other negotiated terms are agreed upon, but the date, and therefore the price, at which the base “C” coffee commodity price component will be fixed has not yet been established. For most contracts, either Starbucks or the seller has the option to “fix” the base “C” coffee commodity price prior to the delivery date. For other contracts, Starbucks and the seller may agree upon pricing parameters determined by the base “C” coffee commodity price. Until prices are fixed, we estimate the total cost of these purchase commitments. We believe, based on relationships established with our suppliers in the past, the risk of non-delivery on these purchase commitments is remote.
|
Sep 30,
2018 |
Oct 1,
2017 |
||||||
|
Equity method investments
|
$
|
296.0
|
|
$
|
432.8
|
|
|
|
Cost method investments
|
38.7
|
|
48.8
|
|
|||
|
Total
|
$
|
334.7
|
|
$
|
481.6
|
|
|
Equity Method Investments
As of
September 30, 2018
, we had
50%
ownership interests in Starbucks Coffee Korea Co., Ltd. and Tata Starbucks Limited (India). These international entities operate licensed Starbucks
®
retail stores. Additional disclosure regarding changes in our equity method investments due to acquisition or divestiture is included at
Note 2
, Acquisitions, Divestitures and Strategic Alliance.
72
We also license the rights to produce and distribute Starbucks-branded products to our
50%
owned joint venture, The North American Coffee Partnership with the Pepsi-Cola Company, which develops and distributes bottled Starbucks
®
beverages, including Frappuccino
®
coffee drinks, Starbucks Doubleshot
®
espresso drinks, Starbucks Refreshers
®
beverages, and Starbucks
®
Iced Espresso Classics.
Our share of income and losses from our equity method investments is included in income from equity investees on our consolidated statements of earnings. Also included in this line item is our proportionate share of gross profit resulting from coffee and other product sales to, and royalty and license fee revenues generated from, equity investees. Revenues generated from these related parties were
$112.8 million
,
$187.3 million
, and
$164.2 million
in fiscal years
2018
,
2017
and
2016
, respectively. Related costs of sales were
$71.5 million
,
$109.3 million
, and
$97.5 million
in fiscal years
2018
,
2017
and
2016
, respectively. As of
September 30, 2018
and
October 1, 2017
, there were
$41.2 million
and
$54.3 million
of accounts receivable from equity investees, respectively, on our consolidated balance sheets, primarily related to product sales and royalty revenues.
Cost Method Investments
We invest in equity interests of entities that develop and operate Starbucks
®
licensed stores in several global markets and in other entities, unrelated to licensed stores, from time to time. As of
September 30, 2018
and
October 1, 2017
, we had
$23 million
invested in entities that develop and operate Starbucks
®
licensed stores and have the ability to acquire additional interests in some of these cost method investees at certain intervals. Depending on our total percentage ownership interest and our ability to exercise significant influence over financial and operating policies, additional investments may require application of the equity method of accounting.
Prepaid Expenses and Other Current Assets
|
Sep 30, 2018
|
Oct 1, 2017
|
||||||
|
Income tax receivable
|
$
|
955.4
|
|
$
|
68.0
|
|
|
|
Other prepaid expenses and current assets
|
507.4
|
|
290.1
|
|
|||
|
Total prepaid expenses and current assets
|
$
|
1,462.8
|
|
$
|
358.1
|
|
|
Property, Plant and Equipment, net
|
Sep 30, 2018
|
Oct 1, 2017
|
||||||
|
Land
|
$
|
46.8
|
|
$
|
46.9
|
|
|
|
Buildings
|
557.3
|
|
481.7
|
|
|||
|
Leasehold improvements
|
7,372.8
|
|
6,401.0
|
|
|||
|
Store equipment
|
2,400.2
|
|
2,110.7
|
|
|||
|
Roasting equipment
|
658.8
|
|
619.8
|
|
|||
|
Furniture, fixtures and other
|
1,659.3
|
|
1,514.1
|
|
|||
|
Work in progress
|
501.9
|
|
409.8
|
|
|||
|
Property, plant and equipment, gross
|
13,197.1
|
|
11,584.0
|
|
|||
|
Accumulated depreciation
|
(7,268.0
|
)
|
(6,664.5
|
)
|
|||
|
Property, plant and equipment, net
|
$
|
5,929.1
|
|
$
|
4,919.5
|
|
|
Accrued Liabilities
|
Sep 30, 2018
|
Oct 1, 2017
|
||||||
|
Accrued compensation and related costs
|
$
|
656.8
|
|
$
|
524.5
|
|
|
|
Accrued occupancy costs
|
164.2
|
|
151.3
|
|
|||
|
Accrued taxes
|
286.6
|
|
226.6
|
|
|||
|
Accrued dividends payable
|
445.4
|
|
429.5
|
|
|||
|
Accrued capital and other operating expenditures
|
745.4
|
|
602.6
|
|
|||
|
Total accrued liabilities
|
$
|
2,298.4
|
|
$
|
1,934.5
|
|
|
73
Indefinite-Lived Intangible Assets
|
(in millions)
|
Sep 30, 2018
|
Oct 1, 2017
|
|||||
|
Trade names, trademarks and patents
|
$
|
215.9
|
|
$
|
212.1
|
|
|
|
Other indefinite-lived intangible assets
|
15.1
|
|
15.1
|
|
|||
|
Total indefinite-lived intangible assets
|
$
|
231.0
|
|
$
|
227.2
|
|
|
Additional disclosure regarding changes in our intangible assets due to acquisitions is included at
Note 2
, Acquisitions, Divestitures and Strategic Alliance.
Goodwill
Changes in the carrying amount of goodwill by reportable operating segment
(in millions)
:
|
Americas
|
China/Asia Pacific
|
EMEA
|
Channel
Development |
Corporate and Other
|
Total
|
||||||||||||||||||
|
Goodwill balance at October 2, 2016
|
$
|
210.1
|
|
$
|
944.9
|
|
$
|
55.1
|
|
$
|
30.2
|
|
$
|
479.3
|
|
$
|
1,719.6
|
|
|||||
|
Acquisition/(divestiture)
|
—
|
|
(7.6
|
)
|
—
|
|
—
|
|
—
|
|
(7.6
|
)
|
|||||||||||
|
Impairment
|
—
|
|
—
|
|
(17.9
|
)
|
—
|
|
(69.3
|
)
|
(87.2
|
)
|
|||||||||||
|
Other
|
1.5
|
|
(87.1
|
)
|
—
|
|
—
|
|
—
|
|
(85.6
|
)
|
|||||||||||
|
Goodwill balance at October 1, 2017
|
$
|
211.6
|
|
$
|
850.2
|
|
$
|
37.2
|
|
$
|
30.2
|
|
$
|
410.0
|
|
$
|
1,539.2
|
|
|||||
|
Acquisition/(divestiture)
|
—
|
|
2,164.0
|
|
—
|
|
(1.5
|
)
|
—
|
|
2,162.5
|
|
|||||||||||
|
Impairment
|
—
|
|
—
|
|
(37.6
|
)
|
—
|
|
—
|
|
(37.6
|
)
|
|||||||||||
|
Other
|
285.8
|
|
(27.6
|
)
|
11.7
|
|
6.0
|
|
(398.4
|
)
|
(122.5
|
)
|
|||||||||||
|
Goodwill balance at September 30, 2018
|
$
|
497.4
|
|
$
|
2,986.6
|
|
$
|
11.3
|
|
$
|
34.7
|
|
$
|
11.6
|
|
$
|
3,541.6
|
|
|||||
“Other” consists of changes in the goodwill balance resulting from transfers between segments due to the dissolution of the Teavana reporting unit as well as foreign currency translation, as applicable.
For goodwill related to our Switzerland retail reporting unit, we initially recorded an impairment charge of
$17.9 million
in the third quarter of fiscal 2017. This was primarily due to the impacts of the strength of the Swiss franc, continued shift of consumer behaviors to neighboring countries and the relocation of certain businesses sustaining beyond our projections and indicating the reporting unit's carrying value would not be fully recovered. Since then, the operational investments and improvements we made did not sufficiently slow the performance decline, and we recorded impairment charges of
$37.6 million
for the remaining Switzerland goodwill balance during fiscal 2018.
During the third quarter of fiscal 2017, management finalized its long-term strategy for the Teavana reporting unit. The plan emphasizes sales of premium Teavana
TM/MC
tea products at Starbucks branded stores and, to a lesser extent, consumer product channels. This change in strategic direction triggered an impairment test first of the retail store assets and then an impairment test of the goodwill asset, which also coincided with our annual goodwill testing process. The retail store assets were determined to be fully impaired, which resulted in a charge of
$33.0 million
. For goodwill, we utilized a combination of income and market approaches to determine the implied fair value of the reporting unit. These approaches used primarily unobservable inputs, including discount, sales growth and royalty rates and valuation multiples of a selection of similar publicly traded companies, which are considered Level 3 fair value measurements. We then compared the implied fair value with the carrying value and recognized a goodwill impairment charge of
$69.3 million
, thus reducing goodwill of the Teavana reporting unit to
$398.3 million
as of July 2, 2017. During the third quarter of fiscal 2018, we dissolved the Teavana reporting unit upon completion of the retail store closures. As a result, we reorganized the Teavana business and allocated the remaining
$398.3 million
of goodwill to other reporting units, primarily within the Americas segment, based on a relative fair value approach. Other intangible assets of
$117.2 million
, consisting primarily of the indefinite-lived tradename and definite-lived tea recipes, were also tested, and no impairment losses were recorded.
74
Finite-Lived Intangible Assets
|
Sep 30, 2018
|
Oct 1, 2017
|
||||||||||||||||||||||
|
(in millions)
|
Gross Carrying Amount
|
Accumulated Amortization
|
Net Carrying Amount
|
Gross Carrying Amount
|
Accumulated Amortization
|
Net Carrying Amount
|
|||||||||||||||||
|
Acquired and reacquired rights
|
$
|
1,081.7
|
|
$
|
(320.1
|
)
|
$
|
761.6
|
|
$
|
328.8
|
|
$
|
(154.2
|
)
|
$
|
174.6
|
|
|||||
|
Acquired trade secrets and processes
|
27.6
|
|
(16.5
|
)
|
11.1
|
|
27.6
|
|
(13.7
|
)
|
13.9
|
|
|||||||||||
|
Trade names, trademarks and patents
|
33.0
|
|
(19.5
|
)
|
13.5
|
|
31.5
|
|
(17.6
|
)
|
13.9
|
|
|||||||||||
|
Licensing agreements
|
14.3
|
|
(5.1
|
)
|
9.2
|
|
14.4
|
|
(3.8
|
)
|
10.6
|
|
|||||||||||
|
Other finite-lived intangible assets
|
25.6
|
|
(9.8
|
)
|
15.8
|
|
6.7
|
|
(5.5
|
)
|
1.2
|
|
|||||||||||
|
Total finite-lived intangible assets
|
$
|
1,182.2
|
|
$
|
(371.0
|
)
|
$
|
811.2
|
|
$
|
409.0
|
|
$
|
(194.8
|
)
|
$
|
214.2
|
|
|||||
Amortization expense for finite-lived intangible assets was
$186.5 million
,
$57.5 million
, and
$57.3 million
during fiscal
2018
,
2017
and
2016
, respectively.
Estimated future amortization expense as of
September 30, 2018
(
in millions
):
|
Fiscal Year Ending
|
|||
|
2019
|
$
|
218.1
|
|
|
2020
|
218.0
|
|
|
|
2021
|
195.2
|
|
|
|
2022
|
168.5
|
|
|
|
2023
|
5.1
|
|
|
|
Thereafter
|
6.3
|
|
|
|
Total estimated future amortization expense
|
$
|
811.2
|
|
Additional disclosure regarding changes in our intangible assets due to acquisitions is included at
Note 2
, Acquisitions, Divestitures and Strategic Alliance.
Revolving Credit Facility and Commercial Paper Program
Our
$2.0 billion
unsecured 5-year revolving credit facility (the “2018 credit facility”) and a
$1.0 billion
unsecured 364-Day credit facility (the “364-day credit facility”) are available for working capital, capital expenditures and other corporate purposes, including acquisitions and share repurchases.
The 2018 credit facility, of which
$150 million
may be used for issuances of letters of credit, is currently set to mature on
October 25, 2022
. We have the option, subject to negotiation and agreement with the related banks, to increase the maximum commitment amount by an additional
$500 million
. Borrowings under the credit facility will bear interest at a variable rate based on LIBOR, and, for U.S. dollar-denominated loans under certain circumstances, a Base Rate (as defined in the credit facility), in each case plus an applicable margin. The applicable margin is based on the better of (i) the Company's long-term credit ratings assigned by Moody's and Standard & Poor's rating agencies and (ii) the Company's fixed charge coverage ratio, pursuant to a pricing grid set forth in the five-year credit agreement. The current applicable margin is
0.680%
for Eurocurrency Rate Loans and
0.00%
(nil) for Base Rate Loans.
The 364-day credit facility, of which
no
amount may be used for issuances of letters of credit, matured on
October 25, 2018
. See
Note 18
, Subsequent Events, for information about the extension of the 364-day credit facility. We had the option, subject to negotiation and agreement with the related banks, to increase the maximum commitment amount by an additional
$500 million
. Borrowings under the credit facility bear interest at a variable rate based on LIBOR, and, for U.S. dollar-denominated loans under certain circumstances, a Base Rate (as defined in the credit facility), in each case plus an applicable margin. The applicable margin was
0.585%
for Eurocurrency Rate Loans and
0.00%
(nil) for Base Rate Loans.
Both credit facilities contain provisions requiring us to maintain compliance with certain covenants, including a minimum fixed charge coverage ratio, which measures our ability to cover financing expenses.
As of September 30, 2018, we were in compliance with all applicable covenants.
No
amounts were outstanding under our credit facility as of
September 30, 2018
.
Under our commercial paper program, we may issue unsecured commercial paper notes up to a maximum aggregate amount outstanding at any time of
$3.0 billion
, with individual maturities that may vary but not exceed
397 days
from the date of issue. Amounts outstanding under the commercial paper program are required to be backstopped by available commitments under our
75
credit facility discussed above. The proceeds from borrowings under our commercial paper program may be used for working capital needs, capital expenditures and other corporate purposes, including, but not limited to, business expansion, payment of cash dividends on our common stock and share repurchases. As of
September 30, 2018
, availability under our commercial paper program was approximately
$3.0 billion
(which represents the full committed credit facility amount, as no amounts were outstanding under our commercial paper program).
In
August 2018
, we issued long-term debt in an underwritten registered public offering, which consisted of
$1.25 billion
of
7
-year
3.800%
Senior Notes (the “2025 notes”) due
August 2025
,
$750 million
of
10
-year
4.000%
Senior Notes (the “2028 notes”) due
November 2028
and
$1 billion
of
30
-year
4.500%
Senior Notes (the “2048 notes”) due
November 2048
. Interest on the 2025 notes is payable semi-annually on February 15 and August 15, commencing on February 15, 2019. Interest on the 2028 and 2048 notes is payable semi-annually on May 15 and November 15, commencing on November 15, 2018.
In
February 2018
, we issued long-term debt in an underwritten registered public offering, which consisted of
$1 billion
of
5
-year
3.100%
Senior Notes (the “2023 notes”) due
March 2023
and
$600 million
of
10
-year
3.500%
Senior Notes (the “2028 notes”) due
March 2028
. Interest on the 2023 and 2028 notes is payable semi-annually on March 1 and September 1, commencing on September 1, 2018.
In
November 2017
, we issued long-term debt in an underwritten registered public offering, which consisted of
$500 million
of
3
-year
2.200%
Senior Notes (the “2020 notes”) due
November 2020
and
$500 million
of
30
-year
3.750%
Senior Notes (the “2047 notes”) due
December 2047
. Interest on the 2020 notes is payable semi-annually on May 22 and November 22, commencing on May 22, 2018 and interest on the 2047 notes is payable semi-annually on June 1 and December 1, commencing on June 1, 2018.
In
March 2017
, we issued Japanese yen-denominated long-term debt in an underwritten registered public offering. The
7
-year
0.372%
Senior Notes (the “2024 notes”) due
March 2024
were issued with a face value of ¥
85 billion
, all of which has been designated to hedge the foreign currency exposure of our net investment in Japan. Interest on the 2024 notes is payable semi-annually on
March 15
and
September 15
of each year, commencing on
September 15, 2017
.
In December 2016, we repaid the
$400 million
of
0.875%
Senior Notes (the “2016 notes”) at maturity.
In
May 2016
, we issued long-term debt in an underwritten registered public offering, which consisted of
$500 million
of
10
-year
2.450%
Senior Notes (the “2026 notes”) due
June 2026
. Interest on the 2026 notes is payable semi-annually on
June 15
and
December 15
of each year, commencing on
December 15, 2016
.
In
February 2016
, we issued long-term debt in an underwritten registered public offering, which consisted of
$500 million
of
5
-year
2.100%
Senior Notes (the “2021 notes”) due
February 2021
. In
May 2016
, we reopened this offering with the same terms and issued an additional
$250 million
of Senior Notes (collectively, the “2021 notes”) for an aggregate amount outstanding of
$750 million
. Interest on the 2021 notes is payable semi-annually on
February 4
and
August 4
of each year, commencing on
August 4, 2016
.
76
Components of long-term debt including the associated interest rates and related fair values by calendar maturity (
in millions, except interest rates):
|
Sep 30, 2018
|
Oct 1, 2017
|
Stated Interest Rate
|
Effective Interest Rate
(1)
|
|||||||||||||||
|
Issuance
|
Face Value
|
Estimated Fair Value
|
Face Value
|
Estimated Fair Value
|
||||||||||||||
|
2018 notes
|
$
|
350.0
|
|
$
|
350
|
|
$
|
350.0
|
|
$
|
352
|
|
2.000
|
%
|
2.012
|
%
|
||
|
2020 notes
(2)
|
500.0
|
|
490
|
|
—
|
|
—
|
|
2.200
|
%
|
2.228
|
%
|
||||||
|
2021 notes
|
500.0
|
|
489
|
|
500.0
|
|
501
|
|
2.100
|
%
|
2.293
|
%
|
||||||
|
2021 notes
|
250.0
|
|
244
|
|
250.0
|
|
250
|
|
2.100
|
%
|
1.600
|
%
|
||||||
|
2022 notes
|
500.0
|
|
486
|
|
500.0
|
|
508
|
|
2.700
|
%
|
2.819
|
%
|
||||||
|
2023 notes
(6)
|
750.0
|
|
759
|
|
750.0
|
|
806
|
|
3.850
|
%
|
2.859
|
%
|
||||||
|
2023 notes
(3)
|
1,000.0
|
|
986
|
|
—
|
|
—
|
|
3.100
|
%
|
3.107
|
%
|
||||||
|
2024 notes
(5)
|
748.4
|
|
743
|
|
755.3
|
|
760
|
|
0.372
|
%
|
0.462
|
%
|
||||||
|
2025 notes
(4)
|
1,250.0
|
|
1,249
|
|
—
|
|
—
|
|
3.800
|
%
|
3.721
|
%
|
||||||
|
2026 notes
|
500.0
|
|
451
|
|
500.0
|
|
481
|
|
2.450
|
%
|
2.511
|
%
|
||||||
|
2028 notes
(3)
|
600.0
|
|
576
|
|
—
|
|
—
|
|
3.500
|
%
|
3.529
|
%
|
||||||
|
2028 notes
(4)
|
750.0
|
|
754
|
|
—
|
|
—
|
|
4.000
|
%
|
3.958
|
%
|
||||||
|
2045 notes
|
350.0
|
|
330
|
|
350.0
|
|
381
|
|
4.300
|
%
|
4.348
|
%
|
||||||
|
2047 notes
(2)
|
500.0
|
|
438
|
|
—
|
|
—
|
|
3.750
|
%
|
3.765
|
%
|
||||||
|
2048 notes
(4)
|
1,000.0
|
|
977
|
|
—
|
|
—
|
|
4.500
|
%
|
4.504
|
%
|
||||||
|
Total
|
9,548.4
|
|
9,322
|
|
3,955.3
|
|
4,039
|
|
||||||||||
|
Aggregate debt issuance costs and unamortized premium/(discount), net
|
(69.3
|
)
|
(17.5
|
)
|
||||||||||||||
|
Hedge accounting fair value adjustment
(6)
|
(39.0
|
)
|
(5.2
|
)
|
||||||||||||||
|
Total
|
$
|
9,440.1
|
|
$
|
3,932.6
|
|
||||||||||||
|
(1)
|
Includes the effects of the amortization of any premium or discount and any gain or loss upon settlement of related treasury locks or forward-starting interest rate swaps utilized to hedge the interest rate risk prior to the debt issuance.
|
(2)
Issued in November 2017.
(3)
Issued in February 2018.
|
(4)
|
Issued in August 2018.
|
(5)
Japanese yen-denominated long-term debt.
(6)
Amount represents the change in fair value due to changes in benchmark interest rates related to our 2023 notes. Refer to
Note 3
, Derivative Financial Instruments, for additional information on our interest rate swap designated as a fair value hedge.
The indentures under which the above notes were issued also require us to maintain compliance with certain covenants, including limits on future liens and sale and leaseback transactions on certain material properties. As of October 1, 2018, we were in compliance with each of these covenants.
77
The following table summarizes our long-term debt maturities as of
September 30, 2018
by fiscal year (
in millions
):
|
Fiscal Year
|
Total
|
||
|
2019
|
$
|
350.0
|
|
|
2020
|
—
|
|
|
|
2021
|
1,250.0
|
|
|
|
2022
|
500.0
|
|
|
|
2023
|
1,000.0
|
|
|
|
Thereafter
|
6,448.4
|
|
|
|
Total
|
$
|
9,548.4
|
|
Rent expense under operating lease agreements
(in millions)
:
|
Fiscal Year Ended
|
Sep 30, 2018
|
Oct 1, 2017
|
Oct 2, 2016
|
||||||||
|
Minimum rent
|
$
|
1,424.5
|
|
$
|
1,185.7
|
|
$
|
1,092.5
|
|
||
|
Contingent rent
|
200.7
|
|
143.5
|
|
130.7
|
|
|||||
|
Total
|
$
|
1,625.2
|
|
$
|
1,329.2
|
|
$
|
1,223.2
|
|
||
Minimum future rental payments under non-cancelable operating leases and lease financing arrangements as of
September 30, 2018
(in millions)
:
|
Fiscal Year Ending
|
Operating Leases
|
Lease Financing Arrangements
|
|||||
|
2019
|
$
|
1,340.6
|
|
$
|
4.4
|
|
|
|
2020
|
1,273.2
|
|
4.4
|
|
|||
|
2021
|
1,190.2
|
|
4.3
|
|
|||
|
2022
|
1,087.3
|
|
4.2
|
|
|||
|
2023
|
958.1
|
|
4.1
|
|
|||
|
Thereafter
|
3,504.4
|
|
36.6
|
|
|||
|
Total minimum lease payments
|
$
|
9,353.8
|
|
$
|
58.0
|
|
|
We have subleases related to certain of our operating leases. During fiscal
2018
,
2017
and
2016
, we recognized sublease income of
$12.3 million
,
$15.5 million
, and
$14.6 million
, respectively. Additionally, as of
September 30, 2018
and
October 1, 2017
, the gross carrying values of assets related to build-to-suit lease arrangements accounted for as financing leases were
$103.2 million
and
$94.3 million
, respectively, with associated accumulated depreciation of
$12.7 million
and
$9.0 million
, respectively. Lease exit costs associated with our restructuring efforts, primarily relate to the closure of Teavana retail stores and certain Starbucks company-operated stores, are recognized concurrently with actual store closures. Total lease exit costs are expected to be approximately
$208.5 million
of which
$119.3 million
and
$15.7 million
were recorded within restructuring and impairments on the consolidated statement of earnings in fiscal 2018 and 2017, respectively.
In addition to
2.4 billion
shares of authorized common stock with
$0.001
par value per share, we have authorized
7.5 million
shares of preferred stock,
none
of which was outstanding at
September 30, 2018
.
We repurchased
131.5 million
shares of common stock at a total cost of
$7.2 billion
,
37.5 million
shares at a total cost of
$2.1 billion
, and
34.9 million
shares of common stock at a total cost of
$2.0 billion
for the years ended
September 30, 2018
,
October 1, 2017
, and
October 2, 2016
, respectively. As of
September 30, 2018
,
48.8 million
shares remained available for repurchase. On November 1, 2018, we announced that our Board of Directors approved an increase of
120 million
shares to our ongoing share repurchase program.
Comprehensive Income
Comprehensive income includes all changes in equity during the period, except those resulting from transactions with our shareholders. Comprehensive income is comprised of net earnings and other comprehensive income. Accumulated other comprehensive income reported on our consolidated balance sheets consists of foreign currency translation adjustments and
78
other items and the unrealized gains and losses, net of applicable taxes, on available-for-sale securities and on derivative instruments designated and qualifying as cash flow and net investment hedges.
Changes in AOCI by component for the years ended
September 30, 2018
,
October 1, 2017
, and
October 2, 2016
, net of tax, are as follows:
|
(in millions)
|
Available-for-Sale Securities
|
Cash Flow Hedges
|
Net Investment Hedges
|
Translation Adjustment and Other
|
Total
|
||||||||||||||
|
September 30, 2018
|
|||||||||||||||||||
|
Net gains/(losses) in AOCI, beginning of period
|
$
|
(2.5
|
)
|
$
|
(4.1
|
)
|
$
|
14.0
|
|
$
|
(163.0
|
)
|
$
|
(155.6
|
)
|
||||
|
Net gains/(losses) recognized in OCI before reclassifications
|
(5.1
|
)
|
17.9
|
|
5.6
|
|
(216.6
|
)
|
(198.2
|
)
|
|||||||||
|
Net (gains)/losses reclassified from AOCI to earnings
|
2.7
|
|
3.9
|
|
—
|
|
16.9
|
|
23.5
|
|
|||||||||
|
Other comprehensive income/(loss) attributable to Starbucks
|
(2.4
|
)
|
21.8
|
|
5.6
|
|
(199.7
|
)
|
(174.7
|
)
|
|||||||||
|
Net gains/(losses) in AOCI, end of period
|
$
|
(4.9
|
)
|
$
|
17.7
|
|
$
|
19.6
|
|
$
|
(362.7
|
)
|
$
|
(330.3
|
)
|
||||
|
(in millions)
|
Available-for-Sale Securities
|
Cash Flow Hedges
|
Net Investment Hedges
|
Translation Adjustment and Other
|
Total
|
||||||||||||||
|
October 1, 2017
|
|||||||||||||||||||
|
Net gains/(losses) in AOCI, beginning of period
|
$
|
1.1
|
|
$
|
10.9
|
|
$
|
1.3
|
|
$
|
(121.7
|
)
|
$
|
(108.4
|
)
|
||||
|
Net gains/(losses) recognized in OCI before reclassifications
|
(6.6
|
)
|
40.6
|
|
12.7
|
|
(40.7
|
)
|
6.0
|
|
|||||||||
|
Net (gains)/losses reclassified from AOCI to earnings
|
3.0
|
|
(55.6
|
)
|
—
|
|
(0.6
|
)
|
(53.2
|
)
|
|||||||||
|
Other comprehensive income/(loss) attributable to Starbucks
|
(3.6
|
)
|
(15.0
|
)
|
12.7
|
|
(41.3
|
)
|
|
(47.2
|
)
|
||||||||
|
Net gains/(losses) in AOCI, end of period
|
$
|
(2.5
|
)
|
$
|
(4.1
|
)
|
$
|
14.0
|
|
$
|
(163.0
|
)
|
$
|
(155.6
|
)
|
||||
|
(in millions)
|
Available-for-Sale Securities
|
Cash Flow Hedges
|
Net Investment Hedges
|
Translation Adjustment and Other
|
Total
|
||||||||||||||
|
October 2, 2016
|
|||||||||||||||||||
|
Net gains/(losses) in AOCI, beginning of period
|
$
|
(0.1
|
)
|
$
|
25.6
|
|
$
|
1.3
|
|
$
|
(226.2
|
)
|
$
|
(199.4
|
)
|
||||
|
Net gains/(losses) recognized in OCI before reclassifications
|
2.2
|
|
(82.1
|
)
|
—
|
|
104.5
|
|
24.6
|
|
|||||||||
|
Net (gains)/losses reclassified from AOCI to earnings
|
(1.0
|
)
|
67.4
|
|
—
|
|
—
|
|
66.4
|
|
|||||||||
|
Other comprehensive income/(loss) attributable to Starbucks
|
1.2
|
|
(14.7
|
)
|
—
|
|
104.5
|
|
91.0
|
|
|||||||||
|
Net gains/(losses) in AOCI, end of period
|
$
|
1.1
|
|
$
|
10.9
|
|
$
|
1.3
|
|
$
|
(121.7
|
)
|
$
|
(108.4
|
)
|
||||
79
Impact of reclassifications from AOCI on the consolidated statements of earnings
(in millions)
:
|
AOCI
Components
|
Amounts Reclassified from AOCI
|
Affected Line Item in
the Statements of Earnings
|
||||||||||||
|
Fiscal Year Ended
|
||||||||||||||
|
Sep 30, 2018
|
Oct 1, 2017
|
Oct 2, 2016
|
||||||||||||
|
Gains/(losses) on available-for-sale securities
|
$
|
(3.6
|
)
|
$
|
(4.1
|
)
|
$
|
1.6
|
|
Interest income and other, net
|
||||
|
Gains/(losses) on cash flow hedges
|
||||||||||||||
|
Interest rate hedges
|
4.9
|
|
4.8
|
|
5.0
|
|
Interest expense
|
|||||||
|
Cross-currency swaps
|
2.2
|
|
57.2
|
|
(101.1
|
)
|
Interest income and other, net
|
|||||||
|
Foreign currency hedges
|
(0.4
|
)
|
3.0
|
|
4.9
|
|
Revenues
|
|||||||
|
Foreign currency/coffee hedges
|
(10.6
|
)
|
5.7
|
|
11.4
|
|
Cost of sales including occupancy costs
|
|||||||
|
Translation adjustment
(1)
|
||||||||||||||
|
Brazil
|
(24.1
|
)
|
—
|
|
—
|
|
Net gain resulting from divestiture of certain operations
|
|||||||
|
East China joint venture
|
7.2
|
|
—
|
|
—
|
|
Gain resulting from acquisition of joint venture
|
|||||||
|
Taiwan joint venture
|
1.4
|
|
—
|
|
—
|
|
Net gain resulting from divestiture of certain operations
|
|||||||
|
Other
|
(1.7
|
)
|
0.6
|
|
—
|
|
Interest income and other, net
|
|||||||
|
(24.7
|
)
|
67.2
|
|
(78.2
|
)
|
Total before tax
|
||||||||
|
1.2
|
|
(14.0
|
)
|
11.8
|
|
Tax (expense)/benefit
|
||||||||
|
$
|
(23.5
|
)
|
$
|
53.2
|
|
$
|
(66.4
|
)
|
Net of tax
|
|||||
|
(1)
|
Release of cumulative translation adjustments to earnings upon sale or liquidation of foreign businesses.
|
We maintain several equity incentive plans under which we may grant non-qualified stock options, incentive stock options, restricted stock, restricted stock units (“RSUs”) or stock appreciation rights to employees, non-employee directors and consultants. We issue new shares of common stock upon exercise of stock options and the vesting of RSUs. We also have an employee stock purchase plan (“ESPP”).
As of
September 30, 2018
, there were
56.9 million
shares of common stock available for issuance pursuant to future equity-based compensation awards and
12.7 million
shares available for issuance under our ESPP.
Stock-based compensation expense recognized in the consolidated financial statements
(in millions)
:
|
Fiscal Year Ended
|
Sep 30, 2018
|
Oct 1, 2017
|
Oct 2, 2016
|
||||||||
|
Options
|
$
|
28.0
|
|
$
|
44.3
|
|
$
|
42.7
|
|
||
|
RSUs
|
222.3
|
|
131.7
|
|
175.4
|
|
|||||
|
Total stock-based compensation expense recognized in the consolidated statements of earnings
|
$
|
250.3
|
|
$
|
176.0
|
|
$
|
218.1
|
|
||
|
Total related tax benefit
|
$
|
62.4
|
|
$
|
57.6
|
|
$
|
73.0
|
|
||
|
Total capitalized stock-based compensation included in net property, plant and equipment and inventories on the consolidated balance sheets
|
$
|
3.5
|
|
$
|
1.9
|
|
$
|
1.5
|
|
||
Stock Option Plans
Stock options to purchase our common stock are granted at the fair value of the stock on the grant date. The majority of options become exercisable in four equal installments beginning a year from the grant date and generally expire
10 years
from the grant date. Options granted to non-employee directors generally vest over
one
to
three years
. All outstanding stock options are non-qualified stock options.
80
The fair value of stock option awards was estimated at the grant date with the following weighted average assumptions for fiscal years
2018
,
2017
and
2016
:
|
Employee Stock Options
Granted During the Period |
|||||||||||
|
Fiscal Year Ended
|
2018
|
2017
|
2016
|
||||||||
|
Expected term (in years)
|
3.6
|
|
3.9
|
|
3.9
|
|
|||||
|
Expected stock price volatility
|
20.5
|
%
|
21.6
|
%
|
23.9
|
%
|
|||||
|
Risk-free interest rate
|
2.1
|
%
|
1.5
|
%
|
1.2
|
%
|
|||||
|
Expected dividend yield
|
2.2
|
%
|
1.8
|
%
|
1.3
|
%
|
|||||
|
Weighted average grant price
|
$
|
56.56
|
|
$
|
56.12
|
|
$
|
60.20
|
|
||
|
Estimated fair value per option granted
|
$
|
7.32
|
|
$
|
8.56
|
|
$
|
10.54
|
|
||
The expected term of the options represents the estimated period of time until exercise and is based on historical experience of similar awards, giving consideration to the contractual terms, vesting schedules and expectations of future employee behavior. Expected stock price volatility is based on a combination of historical volatility of our stock and the one-year implied volatility of Starbucks traded options, for the related vesting periods. The risk-free interest rate is based on the implied yield available on U.S. Treasury zero-coupon issues with an equivalent remaining term. The dividend yield assumption is based on our anticipated cash dividend payouts. The amounts shown above for the estimated fair value per option granted are before the estimated effect of forfeitures, which reduce the amount of expense recorded in the consolidated statements of earnings.
Stock option transactions for the year ended
September 30, 2018
(in millions, except per share and contractual life amounts)
:
|
Shares
Subject to Options |
Weighted
Average Exercise Price per Share |
Weighted
Average Remaining Contractual Life (Years) |
Aggregate
Intrinsic Value |
|||||||||
|
Outstanding, October 1, 2017
|
31.4
|
|
$
|
36.51
|
|
5.8
|
$
|
589
|
|
|||
|
Granted
|
3.9
|
|
56.56
|
|
||||||||
|
Exercised
|
(6.3
|
)
|
19.46
|
|
||||||||
|
Expired/forfeited
|
(1.7
|
)
|
55.24
|
|
||||||||
|
Outstanding, September 30, 2018
|
27.3
|
|
42.13
|
|
5.2
|
418
|
|
|||||
|
Exercisable, September 30, 2018
|
19.8
|
|
36.95
|
|
4.1
|
405
|
|
|||||
|
Vested and expected to vest, September 30, 2018
|
26.3
|
|
41.59
|
|
5.1
|
417
|
|
|||||
The aggregate intrinsic value in the table above, which is the amount by which the market value of the underlying stock exceeded the exercise price of outstanding options, is before applicable income taxes and represents the amount optionees would have realized if all in-the-money options had been exercised on the last business day of the period indicated.
As of
September 30, 2018
, total unrecognized stock-based compensation expense, net of estimated forfeitures, related to nonvested options was approximately
$19 million
, before income taxes, and is expected to be recognized over a weighted average period of approximately
2.4 years
. The total intrinsic value of options exercised was
$236 million
,
$181 million
, and
$254 million
during fiscal years
2018
,
2017
and
2016
, respectively. The total fair value of options vested was
$53 million
,
$40 million
, and
$37 million
during fiscal years
2018
,
2017
and
2016
, respectively.
RSUs
We have both time-vested and performance-based RSUs. Time-vested RSUs are awarded to eligible employees and non-employee directors and entitle the grantee to receive shares of common stock at the end of a vesting period, subject solely to the employee’s continuing employment or the non-employee director's continuing service. The majority of time-vested RSUs vest in two equal annual installments beginning a year from the grant date. Our performance-based RSUs are awarded to eligible employees and entitle the grantee to receive shares of common stock if we achieve specified performance goals during the performance period and the grantee remains employed during the subsequent vesting period. The majority of performance-based RSUs vest in two equal annual installments beginning two years from the grant date.
81
RSU transactions for the year ended
September 30, 2018
(in millions, except per share and contractual life amounts)
:
|
Number
of Shares |
Weighted
Average Grant Date Fair Value per Share |
Weighted
Average Remaining Contractual Life (Years) |
Aggregate
Intrinsic Value |
|||||||||
|
Nonvested, October 1, 2017
|
7.6
|
|
$
|
52.06
|
|
0.9
|
$
|
410
|
|
|||
|
Granted
|
9.5
|
|
56.48
|
|
||||||||
|
Vested
|
(3.3
|
)
|
50.18
|
|
||||||||
|
Forfeited/canceled
|
(2.6
|
)
|
54.87
|
|
||||||||
|
Nonvested, September 30, 2018
|
11.2
|
|
55.62
|
|
1.0
|
636
|
|
|||||
For fiscal
2017
and
2016
, the weighted average fair value per RSU granted was
$54.30
and
$58.81
, respectively. As of
September 30, 2018
, total unrecogniz
ed stock-based compensation expense related to nonvested RSUs, net of estimated forfeitures, was approximately
$192 million
, before income taxes, and is expected to be recognized over a weighted average period of approximately
1.9 years
. The total fair value of RSUs vested was
$166 million
,
$182 million
and
$169 million
during fiscal years
2018
,
2017
and
2016
, respectively.
ESPP
Our ESPP allows eligible employees to contribute up to
10%
of their base earnings toward the quarterly purchase of our common stock, subject to an annual maximum dollar amount. The purchase price is
95%
of the fair market value of the stock on the last business day of the quarterly offering period. The number of shares issued under our ESPP was
0.6 million
in fiscal
2018
.
Deferred Compensation Plan
We have a Deferred Compensation Plan for Non-Employee Directors under which non-employee directors may, for any fiscal year, irrevocably elect to defer receipt of shares of common stock the director would have received upon vesting of restricted stock units. The number of deferred shares outstanding related to deferrals made under this plan is not material.
Defined Contribution Plans
We maintain voluntary defined contribution plans, both qualified and non-qualified, covering eligible employees as defined in the plan documents. Participating employees may elect to defer and contribute a portion of their eligible compensation to the plans up to limits stated in the plan documents, not to exceed the dollar amounts set by applicable laws.
Our matching contributions to all U.S. and non-U.S. plans were
$111.7 million
,
$101.4 million
and
$86.2 million
in fiscal years
2018
,
2017
and
2016
, respectively.
On December 22, 2017, the President of the United States signed and enacted comprehensive tax legislation into law H.R. 1, commonly referred to as the Tax Act. Except for certain provisions, the Tax Act is effective for tax years beginning on or after January 1, 2018. As a fiscal year U.S. taxpayer, the majority of the provisions will apply to our fiscal 2019, such as eliminating the domestic manufacturing deduction, creating new taxes on certain foreign sourced income and introducing new limitations on certain business deductions. For fiscal 2018 and effective in the first fiscal quarter, the most significant impacts included: lowering of the U.S. federal corporate income tax rate; remeasuring certain net deferred tax liabilities; and requiring the transition tax on the deemed repatriation of certain foreign earnings. The phase in of the lower corporate income tax rate resulted in a blended rate of
24.5%
for fiscal 2018, as compared to the previous 35%. The tax rate will be reduced to 21% in subsequent fiscal years. We recorded net income tax benefit for the provisional remeasurement of certain deferred taxes and related amounts of
$71 million
for the year ended
September 30, 2018
. Additionally, we recorded a provisional
$231 million
of income tax expense for the estimated effects of the transition tax, net of adjustments related to uncertain tax positions for the year ended
September 30, 2018
. Of the total provisional transition tax obligation recorded to date,
$237 million
of income taxes payable was included in other long-term liabilities on the consolidated balance sheet as of
September 30, 2018
.
Based on our current interpretation of the Tax Act, we made reasonable estimates to record provisional adjustments during fiscal 2018, as described above. Collectively, these items did not have a material impact to our consolidated financial statements. Since we are still accumulating and processing data to finalize the underlying calculations and expect regulators to issue further guidance, among other things, we believe our estimates may change. We continue to refine such amounts within the measurement period allowed, which will be completed no later than the first quarter of fiscal 2019.
82
Components of earnings before income taxes
(in millions):
|
Fiscal Year Ended
|
Sep 30, 2018
|
Oct 1, 2017
|
Oct 2, 2016
|
||||||||
|
United States
|
$
|
4,826.0
|
|
$
|
3,393.0
|
|
$
|
3,415.7
|
|
||
|
Foreign
|
954.0
|
|
924.5
|
|
782.9
|
|
|||||
|
Total earnings before income taxes
|
$
|
5,780.0
|
|
$
|
4,317.5
|
|
$
|
4,198.6
|
|
||
Provision/(benefit) for income taxes
(in millions):
|
Fiscal Year Ended
|
Sep 30, 2018
|
Oct 1, 2017
|
Oct 2, 2016
|
||||||||
|
Current taxes:
|
|||||||||||
|
U.S. federal
|
$
|
156.2
|
|
$
|
931.0
|
|
$
|
704.1
|
|
||
|
U.S. state and local
|
52.0
|
|
170.8
|
|
166.5
|
|
|||||
|
Foreign
|
327.0
|
|
216.6
|
|
218.5
|
|
|||||
|
Total current taxes
|
535.2
|
|
1,318.4
|
|
1,089.1
|
|
|||||
|
Deferred taxes:
|
|||||||||||
|
U.S. federal
|
633.7
|
|
121.2
|
|
351.3
|
|
|||||
|
U.S. state and local
|
101.5
|
|
14.2
|
|
25.8
|
|
|||||
|
Foreign
|
(8.4
|
)
|
(21.2
|
)
|
(86.5
|
)
|
|||||
|
Total deferred taxes
|
726.8
|
|
114.2
|
|
290.6
|
|
|||||
|
Total income tax expense
|
$
|
1,262.0
|
|
$
|
1,432.6
|
|
$
|
1,379.7
|
|
||
Reconciliation of the statutory U.S. federal income tax rate with our effective income tax rate:
|
Fiscal Year Ended
|
Sep 30, 2018
|
Oct 1, 2017
|
Oct 2, 2016
|
|||||
|
Statutory rate
|
24.5
|
%
|
35.0
|
%
|
35.0
|
%
|
||
|
State income taxes, net of federal tax benefit
|
2.1
|
|
2.8
|
|
3.0
|
|
||
|
Benefits and taxes related to foreign operations
|
(0.1
|
)
|
(2.8
|
)
|
(2.2
|
)
|
||
|
Domestic production activity deduction
|
—
|
|
(1.8
|
)
|
(1.9
|
)
|
||
|
Gain resulting from acquisition of joint venture
|
(5.8
|
)
|
—
|
|
—
|
|
||
|
Impact of the Tax Act
|
2.8
|
|
—
|
|
—
|
|
||
|
Other, net
|
(1.7
|
)
|
—
|
|
(1.0
|
)
|
||
|
Effective tax rate
|
21.8
|
%
|
33.2
|
%
|
32.9
|
%
|
||
The Company continues to evaluate its plans for reinvestment or repatriation of unremitted foreign earnings and thus has not adjusted its previous indefinite reinvestment assertions for the effects of the Tax Act. In the event we determine that all or a portion of such unremitted foreign earnings are no longer indefinitely reinvested, we may be subject to additional U.S. federal and state income taxes and foreign withholding taxes, beyond the Tax Act's one-time transition tax, which could be material.
83
Tax effect of temporary differences and carryforwards that comprise significant portions of deferred tax assets and liabilities
(in millions):
|
Sep 30, 2018
|
Oct 1, 2017
|
||||||
|
Deferred tax assets:
|
|||||||
|
Property, plant and equipment
|
$
|
67.4
|
|
$
|
71.3
|
|
|
|
Accrued occupancy costs
|
109.0
|
|
118.0
|
|
|||
|
Accrued compensation and related costs
|
64.2
|
|
95.0
|
|
|||
|
Stored value card liability and deferred revenue
|
144.2
|
|
130.7
|
|
|||
|
Stock-based compensation
|
96.7
|
|
125.9
|
|
|||
|
Net operating losses
|
79.2
|
|
80.8
|
|
|||
|
Litigation charge
(1)
|
—
|
|
792.0
|
|
|||
|
Other
|
129.5
|
|
180.8
|
|
|||
|
Total
|
$
|
690.2
|
|
$
|
1,594.5
|
|
|
|
Valuation allowance
|
(129.3
|
)
|
(80.1
|
)
|
|||
|
Total deferred tax asset, net of valuation allowance
|
$
|
560.9
|
|
$
|
1,514.4
|
|
|
|
Deferred tax liabilities:
|
|||||||
|
Property, plant and equipment
|
(348.1
|
)
|
(477.2
|
)
|
|||
|
Intangible assets and goodwill
|
(274.2
|
)
|
(159.0
|
)
|
|||
|
Other
|
(74.1
|
)
|
(89.1
|
)
|
|||
|
Total
|
(696.4
|
)
|
(725.3
|
)
|
|||
|
Net deferred tax asset (liability)
|
$
|
(135.5
|
)
|
$
|
789.1
|
|
|
|
Reported as:
|
|||||||
|
Deferred income tax assets
|
134.7
|
|
795.4
|
|
|||
|
Deferred income tax liabilities (included in Other long-term liabilities)
|
(270.2
|
)
|
(6.3
|
)
|
|||
|
Net deferred tax asset (liability)
|
$
|
(135.5
|
)
|
$
|
789.1
|
|
|
(1)
The tax deduction for litigation charges was accelerated during fiscal 2018.
The valuation allowance as of
September 30, 2018
and
October 1, 2017
is primarily related to net operating losses and other deferred tax assets of consolidated foreign subsidiaries.
As of
September 30, 2018
, we had state net operating loss carryforwards of
$32.0 million
which will begin to expire in
fiscal 2024
, state tax credit carryforwards of
$9.7 million
, of which
$9.3 million
will begin to expire in fiscal 2024 and the remainder will begin to expire in fiscal 2019, and foreign net operating loss carryforwards of
$290.7 million
, of which
$180.8 million
have an indefinite carryforward period and the remainder expire at various dates starting from fiscal 2019.
Uncertain Tax Positions
As of
September 30, 2018
, we had
$224.6 million
of gross unrecognized tax benefits of which
$157.3 million
, if recognized, would affect our effective tax rate. We recognized a
benefit
of
$0.5 million
, an
expense
of
$5.2 million
and a
benefit
of
$3.6 million
of interest and penalties in income tax expense, prior to the benefit of the federal tax deduction, for fiscal
2018
,
2017
and
2016
, respectively. As of
September 30, 2018
and
October 1, 2017
, we had accrued interest and penalties of
$12.8 million
and
$11.2 million
, respectively, within our consolidated balance sheets.
84
The following table summarizes the activity related to our unrecognized tax benefits
(in millions)
:
|
Sep 30, 2018
|
Oct 1, 2017
|
Oct 2, 2016
|
|||||||||
|
Beginning balance
|
$
|
196.9
|
|
$
|
146.5
|
|
$
|
150.4
|
|
||
|
Increase related to prior year tax positions
|
17.5
|
|
10.4
|
|
—
|
|
|||||
|
Decrease related to prior year tax positions
|
(41.8
|
)
|
—
|
|
(23.6
|
)
|
|||||
|
Increase related to current year tax positions
|
62.4
|
|
41.3
|
|
33.7
|
|
|||||
|
Decreases related to settlements with taxing authorities
|
(4.5
|
)
|
—
|
|
(3.1
|
)
|
|||||
|
Decrease related to lapsing of statute of limitations
|
(5.9
|
)
|
(1.3
|
)
|
(10.9
|
)
|
|||||
|
Ending balance
|
$
|
224.6
|
|
$
|
196.9
|
|
$
|
146.5
|
|
||
We are currently under examination, or may be subject to examination, by various U.S. federal, state, local and foreign tax jurisdictions for fiscal years 2006 through 2017.
We are no longer subject to U.S. federal or state examination for years prior to fiscal year 2011, with the exception of
one
state. We are no longer subject to examination in any material international markets prior to 2006.
It is reasonably possible that a portion of the Company's gross unrecognized tax benefits may be recognized by the end of fiscal 2019 for reasons such as a lapse of the statute of limitations or resolution of examinations with tax authorities. We estimate this range to be approximately
$79 million
to
$117 million
.
Calculation of net earnings per common share (“EPS”) — basic and diluted
(in millions, except EPS)
:
|
Fiscal Year Ended
|
Sep 30, 2018
|
Oct 1, 2017
|
Oct 2, 2016
|
||||||||
|
Net earnings attributable to Starbucks
|
$
|
4,518.3
|
|
$
|
2,884.7
|
|
$
|
2,817.7
|
|
||
|
Weighted average common shares outstanding (for basic calculation)
|
1,382.7
|
|
1,449.5
|
|
1,471.6
|
|
|||||
|
Dilutive effect of outstanding common stock options and RSUs
|
11.9
|
|
12.0
|
|
15.1
|
|
|||||
|
Weighted average common and common equivalent shares outstanding (for diluted calculation)
|
1,394.6
|
|
1,461.5
|
|
1,486.7
|
|
|||||
|
EPS — basic
|
$
|
3.27
|
|
$
|
1.99
|
|
$
|
1.91
|
|
||
|
EPS — diluted
|
$
|
3.24
|
|
$
|
1.97
|
|
$
|
1.90
|
|
||
Potential dilutive shares consist of the incremental common shares issuable upon the exercise of outstanding stock options (both vested and non-vested) and unvested RSUs, calculated using the treasury stock method. The calculation of dilutive shares outstanding excludes out-of-the-money stock options (i.e., such options’ exercise prices were greater than the average market price of our common shares for the period) because their inclusion would have been antidilutive. We had
14.1 million
,
11.4 million
, and
5.4 million
out-of-the-money stock options as of
September 30, 2018
,
October 1, 2017
, and
October 2, 2016
, respectively.
Return of Capital
In September 2018, we entered into accelerated share repurchase agreements (“ASR agreements”) with third-party financial institutions totaling
$5.0 billion
, effective October 1, 2018. We made a
$5.0 billion
upfront payment on
October 2, 2018
to the financial institutions and received an initial delivery of shares, which
approximates 80 percent of the total number of shares to be repurchased under the ASR agreements.
Upon completion, the total shares repurchased will be based on the volume-weighted average share price during the term of the ASR agreements less an applicable discount. The financial institutions may be required to deliver additional shares or, under certain circumstances, we may be required to deliver shares or elect to make a cash payment to the financial institutions. Final settlement is expected to be completed as early as February 2019 and no later than March 2019. Refer to
Note 18
, Subsequent Events, for additional information about our ASR agreements.
Legal Proceedings
On April 13, 2010, an organization named Council for Education and Research on Toxics (“Plaintiff”) filed a lawsuit in the Superior Court of the State of California, County of Los Angeles, against the Company and certain other defendants who manufacture, package, distribute or sell brewed coffee. The lawsuit is
Council for Education and Research on Toxics v. Starbucks Corporation, et al
.. On May 9, 2011, the Plaintiff filed an additional lawsuit in the Superior Court of the State of California, County of Los Angeles, against the Company and additional defendants who manufacture, package, distribute or
85
sell packaged coffee. The lawsuit is
Council for Education and Research on Toxics v. Brad Barry LLC, et al
.. Both cases have since been consolidated and now include nearly eighty defendants, which constitute the great majority of the coffee industry in California. Plaintiff alleges that the Company and the other defendants failed to provide warnings for their coffee products of exposure to the chemical acrylamide as required under California Health and Safety Code section 25249.5, the California Safe Drinking Water and Toxic Enforcement Act of 1986, better known as Proposition 65. Plaintiff seeks equitable relief, including providing warnings to consumers of coffee products, as well as civil penalties in the amount of the statutory maximum of two thousand five hundred dollars per day per violation of Proposition 65. The Plaintiff asserts that every consumed cup of coffee, absent a compliant warning, is equivalent to a violation under Proposition 65.
The Company, as part of a joint defense group organized to defend against the lawsuit, disputes the claims of the Plaintiff. Acrylamide is not added to coffee, but is present in all coffee in small amounts (parts per billion) as a byproduct of the coffee bean roasting process. The Company has asserted multiple affirmative defenses. Trial of the first phase of the case commenced on September 8, 2014, and was limited to three affirmative defenses shared by all defendants. On September 1, 2015, the trial court issued a final ruling adverse to defendants on all Phase 1 defenses. Trial of the second phase of the case commenced in the fall of 2017. On May 7, 2018, the trial court issued a ruling adverse to defendants on the Phase 2 defense, the Company's last remaining defense to liability. On June 22, 2018 the California Office of Environmental Health Hazard Assessment (OEHHA) proposed a new regulation clarifying that cancer warnings are not required for coffee under Proposition 65. Defendants anticipate that the proposed regulation will be final by January 2019. The case was set to proceed to a third phase trial on damages, remedies and attorneys' fees on October 15, 2018. However, on October 12, 2018, the California Court of Appeal granted the defendants request for a stay of the Phase 3 trial.
At this stage of the proceedings, Starbucks believes that the likelihood that the Company will ultimately incur a loss in connection with this litigation is reasonably possible rather than probable. Accordingly, no loss contingency was recorded for this matter. The outcome and the financial impact of the case to Starbucks, if any, cannot be predicted.
Starbucks is party to various other legal proceedings arising in the ordinary course of business, including certain employment litigation cases that have been certified as class or collective actions, but, except as noted above, is not currently a party to any legal proceeding that management believes could have a material adverse effect on our consolidated financial position, results of operations or cash flows.
Segment information is prepared on the same basis that our ceo, who is our Chief Operating Decision Maker, manages the segments, evaluates financial results, and makes key operating decisions.
On August 26, 2018, our Channel Development segment finalized licensing and distribution agreements with Nestlé to sell and market our consumer packaged goods and foodservice products. The scope of the arrangement converts the majority of our previously defined Channel Development segment operations, as well as certain smaller businesses previously reported in the Americas, EMEA and Corporate and Other (previously All Other Segments), from company-owned to licensed operations with Nestlé. As a result, we realigned our organizational and operating segment structures in support of this newly established Global Coffee Alliance, and our reportable segments were restated as if those smaller businesses were previously within our Channel Development segment.
We have
four
reportable operating segments: 1) Americas, which is inclusive of the U.S., Canada, and Latin America; 2) China/Asia Pacific (“CAP”); 3) Europe, Middle East, and Africa (“EMEA”) and 4) Channel Development.
Americas, CAP, and EMEA operations sell coffee and other beverages, complementary food, packaged coffees, single-serve coffee products and a focused selection of merchandise through company-operated stores and licensed stores.
Our Americas segment is our most mature business and has achieved significant scale. Certain markets within our CAP and EMEA operations are in various stages of development or undergoing transformations of their business models. Therefore, they may require a more extensive support organization, relative to their current levels of revenue and operating income, than our Americas operations.
Channel Development revenues include packaged coffee sales, tea and ready-to-drink beverages to customers outside of our company-operated and licensed stores. Historically revenues have included domestic and international sales of our packaged coffee, tea and ready-to-drink products to grocery, warehouse club and specialty retail stores and through institutional foodservice companies which serviced businesses. In the fourth quarter of fiscal 2018, we licensed our consumer packaged goods and foodservice businesses to Nestlé. As a result, Channel Development revenues also include revenues from product sales to and royalty revenues from Nestlé. The collaborative business relationships for ready-to-drink products and the associated revenues remain unchanged due to the Global Coffee Alliance.
86
Consolidated revenue mix by product type
(in millions):
(1)
“Other” primarily consists of royalty and licensing revenues, beverage-related ingredients, serveware, and ready-to-drink beverages, among other items.
|
Fiscal Year Ended
|
Sep 30, 2018
|
Oct 1, 2017
|
Oct 2, 2016
|
|||||||||||||||||
|
Beverage
|
$
|
14,463.1
|
|
59
|
%
|
$
|
12,915.0
|
|
58
|
%
|
$
|
12,383.4
|
|
58
|
%
|
|||||
|
Food
|
4,397.7
|
|
18
|
%
|
3,832.1
|
|
17
|
%
|
3,495.0
|
|
16
|
%
|
||||||||
|
Packaged and single-serve coffees and teas
|
2,797.5
|
|
11
|
%
|
2,883.6
|
|
13
|
%
|
2,866.0
|
|
14
|
%
|
||||||||
|
Other
(1)
|
3,061.2
|
|
12
|
%
|
2,756.1
|
|
12
|
%
|
2,571.5
|
|
12
|
%
|
||||||||
|
Total
|
$
|
24,719.5
|
|
100
|
%
|
$
|
22,386.8
|
|
100
|
%
|
$
|
21,315.9
|
|
100
|
%
|
|||||
Information by geographic area (
in millions
):
|
Fiscal Year Ended
|
Sep 30, 2018
|
Oct 1, 2017
|
Oct 2, 2016
|
||||||||
|
Net revenues:
|
|||||||||||
|
United States
|
$
|
17,409.4
|
|
$
|
16,527.1
|
|
$
|
15,774.8
|
|
||
|
Other countries
|
7,310.1
|
|
5,859.7
|
|
5,541.1
|
|
|||||
|
Total
|
$
|
24,719.5
|
|
$
|
22,386.8
|
|
$
|
21,315.9
|
|
||
|
Long-lived assets:
|
|||||||||||
|
United States
|
$
|
5,635.9
|
|
$
|
5,848.3
|
|
$
|
6,012.8
|
|
||
|
Other countries
|
6,026.3
|
|
3,234.0
|
|
3,541.8
|
|
|||||
|
Total
|
$
|
11,662.2
|
|
$
|
9,082.3
|
|
$
|
9,554.6
|
|
||
No customer accounts for 10% or more of our revenues
. Revenues are shown based on the geographic location of our customers. Revenues from countries other than the U.S. consist primarily of revenues from China, Japan, Canada and the U.K., which together account for approximately
81%
of net revenues from other countries for fiscal
2018
.
Management evaluates the performance of its operating segments based on net revenues and operating income. The accounting policies of the operating segments are the same as those described in
Note 1
, Summary of Significant Accounting Policies. Operating income represents earnings before other income and expenses and income taxes. Management does not evaluate the performance of its operating segments using asset measures. The identifiable assets by segment disclosed in this note are those assets specifically identifiable within each segment and include cash and cash equivalents, net property, plant and equipment, equity and cost investments, goodwill, and other intangible assets. Assets not attributed to reportable operating segments are corporate assets and are primarily comprised of cash and cash equivalents available for general corporate purposes, investments, assets of the corporate headquarters and roasting facilities, and inventory.
87
The table below presents financial information for our reportable operating segments and Corporate and Other segment for the years ended
September 30, 2018
,
October 1, 2017
and
October 2, 2016
.
|
(
in millions
)
|
Americas
|
China /
Asia Pacific
|
EMEA
|
Channel
Development
|
Corporate and Other
|
Total
|
|||||||||||||||||
|
Fiscal 2018
|
|||||||||||||||||||||||
|
Total net revenues
|
$
|
16,732.2
|
|
$
|
4,473.6
|
|
$
|
1,048.0
|
|
$
|
2,297.3
|
|
$
|
168.4
|
|
$
|
24,719.5
|
|
|||||
|
Depreciation and amortization expenses
|
638.3
|
|
412.1
|
|
31.7
|
|
1.3
|
|
163.6
|
|
1,247.0
|
|
|||||||||||
|
Income from equity investees
|
—
|
|
117.4
|
|
—
|
|
183.8
|
|
—
|
|
301.2
|
|
|||||||||||
|
Operating income/(loss)
|
3,614.4
|
|
867.4
|
|
61.5
|
|
927.1
|
|
(1,587.1
|
)
|
3,883.3
|
|
|||||||||||
|
Total assets
|
4,380.9
|
|
5,863.5
|
|
356.4
|
|
148.2
|
|
13,407.4
|
|
24,156.4
|
|
|||||||||||
|
Fiscal 2017
|
|||||||||||||||||||||||
|
Total net revenues
|
$
|
15,620.0
|
|
$
|
3,240.2
|
|
$
|
958.7
|
|
$
|
2,256.6
|
|
$
|
311.3
|
|
$
|
22,386.8
|
|
|||||
|
Depreciation and amortization expenses
|
614.9
|
|
202.2
|
|
30.6
|
|
3.0
|
|
160.7
|
|
1,011.4
|
|
|||||||||||
|
Income from equity investees
|
—
|
|
197.0
|
|
—
|
|
194.4
|
|
—
|
|
391.4
|
|
|||||||||||
|
Operating income/(loss)
|
3,653.6
|
|
765.0
|
|
94.5
|
|
967.0
|
|
(1,345.4
|
)
|
4,134.7
|
|
|||||||||||
|
Total assets
|
3,327.2
|
|
2,770.9
|
|
273.8
|
|
129.1
|
|
7,864.6
|
|
14,365.6
|
|
|||||||||||
|
Fiscal 2016
|
|||||||||||||||||||||||
|
Total net revenues
|
$
|
14,775.2
|
|
$
|
2,938.8
|
|
$
|
1,071.5
|
|
$
|
2,195.1
|
|
$
|
335.3
|
|
$
|
21,315.9
|
|
|||||
|
Depreciation and amortization expenses
|
590.0
|
|
180.6
|
|
39.9
|
|
3.9
|
|
166.4
|
|
980.8
|
|
|||||||||||
|
Income from equity investees
|
—
|
|
150.1
|
|
1.5
|
|
166.6
|
|
—
|
|
318.2
|
|
|||||||||||
|
Operating income/(loss)
|
3,738.5
|
|
631.6
|
|
131.0
|
|
877.3
|
|
(1,206.5
|
)
|
4,171.9
|
|
|||||||||||
|
Total assets
|
3,424.6
|
|
2,740.2
|
|
552.1
|
|
82.2
|
|
7,513.4
|
|
14,312.5
|
|
|||||||||||
|
First
Quarter
|
Second
Quarter
|
Third
Quarter
|
Fourth
Quarter
|
Full
Year
|
|||||||||||||||
|
Fiscal 2018:
|
|||||||||||||||||||
|
Net revenues
|
$
|
6,073.7
|
|
$
|
6,031.8
|
|
$
|
6,310.3
|
|
$
|
6,303.6
|
|
$
|
24,719.5
|
|
||||
|
Operating income
|
1,116.1
|
|
772.5
|
|
1,038.2
|
|
956.6
|
|
3,883.3
|
|
|||||||||
|
Net earnings attributable to Starbucks
|
2,250.2
|
|
660.1
|
|
852.5
|
|
755.8
|
|
4,518.3
|
|
|||||||||
|
EPS — diluted
|
1.57
|
|
0.47
|
|
0.61
|
|
0.56
|
|
3.24
|
|
|||||||||
|
Fiscal 2017:
|
|||||||||||||||||||
|
Net revenues
|
$
|
5,732.9
|
|
$
|
5,294.0
|
|
$
|
5,661.5
|
|
$
|
5,698.3
|
|
$
|
22,386.8
|
|
||||
|
Operating income
|
1,132.6
|
|
935.4
|
|
1,044.2
|
|
1,022.5
|
|
4,134.7
|
|
|||||||||
|
Net earnings attributable to Starbucks
|
751.8
|
|
652.8
|
|
691.6
|
|
788.5
|
|
2,884.7
|
|
|||||||||
|
EPS — diluted
|
0.51
|
|
0.45
|
|
0.47
|
|
0.54
|
|
1.97
|
|
|||||||||
On
October 2, 2018
we used
$5.0 billion
of net proceeds received from Nestlé to enter into an accelerated share repurchase program with third-party financial institutions. As a result,
72.0 million
shares of our common stock have been retired. Final settlement is expected to be completed as early as
February 2019
and no later than
March 2019
. Refer to
Note 15
, Commitments and Contingencies for further discussion.
On October 24, 2018, we amended and restated our
$1.0 billion
unsecured 364-Day credit facility to extend the term, which is now set to mature on
October 23, 2019
.
88
REPORT OF INDEPENDENT REGISTERED PUBLIC ACCOUNTING FIRM
To the Shareholders and the Board of Directors of Starbucks Corporation
Opinion on the Financial Statements
We have audited the accompanying consolidated balance sheets of Starbucks Corporation and subsidiaries (the “Company”) as of
September 30, 2018
and
October 1, 2017
, the related consolidated statements of earnings, comprehensive income, equity, and cash flows for each of the three years in the period ended
September 30, 2018
, and the related notes (collectively referred to as the “financial statements”). In our opinion, the financial statements present fairly, in all material respects, the financial position of the Company as of
September 30, 2018
and
October 1, 2017
, and the results of its operations and its cash flows for each of the three years in the period ended
September 30, 2018
, in conformity with accounting principles generally accepted in the United States of America.
We have also audited, in accordance with the standards of the Public Company Accounting Oversight Board (United States) (PCAOB), the Company's internal control over financial reporting as of
September 30, 2018
, based on criteria established in
Internal Control - Integrated Framework (2013)
issued by the Committee of Sponsoring Organizations of the Treadway Commission and our report dated
November 16, 2018
, expressed an unqualified opinion on the Company's internal control over financial reporting.
Basis for Opinion
These financial statements are the responsibility of the Company's management. Our responsibility is to express an opinion on the Company's financial statements based on our audits. We are a public accounting firm registered with the PCAOB and are required to be independent with respect to the Company in accordance with the U.S. federal securities laws and the applicable rules and regulations of the Securities and Exchange Commission and the PCAOB.
We conducted our audits in accordance with the standards of the PCAOB. Those standards require that we plan and perform the audit to obtain reasonable assurance about whether the financial statements are free of material misstatement, whether due to error or fraud. Our audits included performing procedures to assess the risks of material misstatement of the financial statements, whether due to error or fraud, and performing procedures that respond to those risks. Such procedures included examining, on a test basis, evidence regarding the amounts and disclosures in the financial statements. Our audits also included evaluating the accounting principles used and significant estimates made by management, as well as evaluating the overall presentation of the financial statements. We believe that our audits provide a reasonable basis for our opinion.
/s/ Deloitte & Touche LLP
Seattle, Washington
November 16, 2018
We have served as the Company's auditor since 1987.
89
|
Item 9.
|
Changes in and Disagreements with Accountants on Accounting and Financial Disclosure
|
Not applicable.
|
Item 9A.
|
Controls and Procedures
|
Disclosure Controls and Procedures
We maintain disclosure controls and procedures that are designed to ensure that material information required to be disclosed in our periodic reports filed or submitted under the Securities Exchange Act of 1934, as amended (the “Exchange Act”), is recorded, processed, summarized and reported within the time periods specified in the SEC’s rules and forms. Our disclosure controls and procedures are also designed to ensure that information required to be disclosed in the reports we file or submit under the Exchange Act is accumulated and communicated to our management, including our principal executive officer and principal financial officer, as appropriate to allow timely decisions regarding required disclosure.
During the fourth quarter of fiscal
2018
, we carried out an evaluation, under the supervision and with the participation of our management, including our chief executive officer and our chief financial officer, of the effectiveness of the design and operation of our disclosure controls and procedures, as defined in Rules 13a-15(e) and 15d-15(e) under the Exchange Act. Based upon that evaluation, our chief executive officer and chief financial officer concluded that our disclosure controls and procedures were effective, as of the end of the period covered by this report (
September 30, 2018
).
There were no changes in our internal control over financial reporting (as defined in Rules 13a-15(f) and 15d-15(f) of the Exchange Act) during our most recently completed fiscal quarter that materially affected or are reasonably likely to materially affect internal control over financial reporting.
We acquired our East China joint venture on December 31, 2017 (see
Note 2
, Acquisitions and Divestitures, to the consolidated financial statements included in Item 8 of Part II of this 10-K). As permitted by the Securities Exchange Commission Staff interpretive guidance for newly acquired businesses, management excluded East China from its evaluation of internal control over financial reporting as of September 30, 2018. We are in the process of documenting and testing East China's internal controls over financial reporting and plan to incorporate East China in our evaluation of internal controls over financial reporting beginning in the first quarter of fiscal 2019. East China contributed $3.1 billion to our consolidated total assets as of September 30, 2018. For the year ended September 30, 2018, East China's revenue included in our consolidated statements of earnings was
$903.0 million
. For the year ended September 30, 2018, East China's net earnings included in our consolidated statements of earnings was
$73.1 million
.
The certifications required by Section 302 of the Sarbanes-Oxley Act of 2002 are filed as exhibits
31.1
and
31.2
, respectively, to this 10-K.
Report of Management on Internal Control over Financial Reporting
Our management is responsible for establishing and maintaining adequate internal control over financial reporting. Internal control over financial reporting is a process to provide reasonable assurance regarding the reliability of our financial reporting for external purposes in accordance with accounting principles generally accepted in the United States of America. Internal control over financial reporting includes maintaining records that in reasonable detail accurately and fairly reflect our transactions; providing reasonable assurance that transactions are recorded as necessary for preparation of our financial statements; providing reasonable assurance that receipts and expenditures are made in accordance with management authorization; and providing reasonable assurance that unauthorized acquisition, use or disposition of company assets that could have a material effect on our financial statements would be prevented or detected on a timely basis. Because of its inherent limitations, internal control over financial reporting is not intended to provide absolute assurance that a misstatement of our financial statements would be prevented or detected.
Management conducted an evaluation of the effectiveness of our internal control over financial reporting based on the framework and criteria established in
Internal Control — Integrated Framework
, issued by the Committee of Sponsoring Organizations of the Treadway Commission. This evaluation included review of the documentation of controls, evaluation of the design effectiveness of controls, testing of the operating effectiveness of controls and a conclusion on this evaluation. Based on this evaluation, management concluded that our internal control over financial reporting was effective as of
September 30, 2018
.
Our internal control over financial reporting as of
September 30, 2018
has been audited by Deloitte & Touche LLP, an independent registered public accounting firm, as stated in their report which is included herein.
90
REPORT OF INDEPENDENT REGISTERED PUBLIC ACCOUNTING FIRM
To the Shareholders and the Board of Directors of Starbucks Corporation
Opinion on Internal Control over Financial Reporting
We have audited the internal control over financial reporting of Starbucks Corporation and subsidiaries (the “Company”) as of
September 30, 2018
, based on criteria established in
Internal Control - Integrated Framework (2013)
issued by the Committee of Sponsoring Organizations of the Treadway Commission (COSO). In our opinion, the Company maintained, in all material respects, effective internal control over financial reporting as of
September 30, 2018
, based on criteria established in
Internal Control - Integrated Framework (2013)
issued by COSO.
We have also audited, in accordance with the standards of the Public Company Accounting Oversight Board (United States) (PCAOB), the consolidated financial statements as of and for the year ended
September 30, 2018
, of the Company and our report dated
November 16, 2018
, expressed an unqualified opinion on those financial statements.
Basis for Opinion
The Company’s management is responsible for maintaining effective internal control over financial reporting and for its assessment of the effectiveness of internal control over financial reporting, included in the accompanying Report of Management on Internal Control over Financial Reporting. Our responsibility is to express an opinion on the Company’s internal control over financial reporting based on our audit. We are a public accounting firm registered with the PCAOB and are required to be independent with respect to the Company in accordance with the U.S. federal securities laws and the applicable rules and regulations of the Securities and Exchange Commission and the PCAOB.
We conducted our audit in accordance with the standards of the PCAOB. Those standards require that we plan and perform the audit to obtain reasonable assurance about whether effective internal control over financial reporting was maintained in all material respects. Our audit included obtaining an understanding of internal control over financial reporting, assessing the risk that a material weakness exists, testing and evaluating the design and operating effectiveness of internal control based on the assessed risk, and performing such other procedures as we considered necessary in the circumstances. We believe that our audit provides a reasonable basis for our opinion.
Definition and Limitations of Internal Control over Financial Reporting
A company’s internal control over financial reporting is a process designed to provide reasonable assurance regarding the reliability of financial reporting and the preparation of financial statements for external purposes in accordance with generally accepted accounting principles. A company’s internal control over financial reporting includes those policies and procedures that (1) pertain to the maintenance of records that, in reasonable detail, accurately and fairly reflect the transactions and dispositions of the assets of the company; (2) provide reasonable assurance that transactions are recorded as necessary to permit preparation of financial statements in accordance with generally accepted accounting principles, and that receipts and expenditures of the company are being made only in accordance with authorizations of management and directors of the company; and (3) provide reasonable assurance regarding prevention or timely detection of unauthorized acquisition, use, or disposition of the company’s assets that could have a material effect on the financial statements.
Because of its inherent limitations, internal control over financial reporting may not prevent or detect misstatements. Also, projections of any evaluation of effectiveness to future periods are subject to the risk that controls may become inadequate because of changes in conditions, or that the degree of compliance with the policies or procedures may deteriorate.
/s/ Deloitte & Touche LLP
Seattle, Washington
November 16, 2018
91
|
Item 9B.
|
Other Information
|
None.
92
|
Item 10.
|
Directors, Executive Officers and Corporate Governance
|
Information regarding our executive officers is set forth in Item 1 of Part 1 of this Report under the caption “Executive Officers of the Registrant.”
We adopted a code of ethics that applies to our chief executive officer, chief financial officer, controller and other finance leaders, which is a “code of ethics” as defined by applicable rules of the SEC. This code is publicly available on our website at www.starbucks.com/about-us/company-information/corporate-governance. If we make any amendments to this code other than technical, administrative or other non-substantive amendments, or grant any waivers, including implicit waivers, from a provision of this code to our chief executive officer, chief operating officer, chief financial officer or controller, we will disclose the nature of the amendment or waiver, its effective date and to whom it applies on our website at www.starbucks.com/about-us/company-information/corporate-governance or in a report on Form 8-K filed with the SEC.
The remaining information required by this item is incorporated herein by reference to the sections entitled “Proposal 1 — Election of Directors” and “Beneficial Ownership of Common Stock — Section 16(a) Beneficial Ownership Reporting Compliance,” “Corporate Governance — Board Committees and Related Matters” and “Corporate Governance — Audit and Compliance Committee” in our definitive Proxy Statement for the Annual Meeting of Shareholders to be held on
March 20, 2019
(the “Proxy Statement”).
|
Item 11.
|
Executive Compensation
|
The information required by this item is incorporated by reference to the sections entitled “Executive Compensation,” “Compensation of Directors,” “Corporate Governance — Compensation and Management Development Committee” and “Compensation Committee Report” in the Proxy Statement.
|
Item 12.
|
Security Ownership of Certain Beneficial Owners and Management and Related Shareholder Matters
|
The information required by this item is incorporated by reference to the sections entitled “Equity Compensation Plan Information” and “Beneficial Ownership of Common Stock” in the Proxy Statement.
|
Item 13.
|
Certain Relationships, Related Transactions and Director Independence
|
The information required by this item is incorporated by reference to the section entitled “Certain Relationships and Related Transactions” and “Corporate Governance — Affirmative Determinations Regarding Director Independence and Other Matters” in the Proxy Statement.
|
Item 14.
|
Principal Accounting Fees and Services
|
The information required by this item is incorporated by reference to the sections entitled “Independent Registered Public Accounting Firm Fees” and “Policy on Audit Committee Pre-Approval of Audit and Permissible Non-Audit Services of the Independent Registered Public Accounting Firm” in the Proxy Statement.
93
|
Item 15.
|
Exhibits, Financial Statement Schedules
|
(a) The following documents are filed as a part of this 10-K:
1. Financial Statements
The following financial statements are included in Part II, Item 8 of this 10-K:
|
•
|
Consolidated Statements of Earnings for the fiscal years ended
September 30, 2018
,
October 1, 2017
, and
October 2, 2016
;
|
|
•
|
Consolidated Statements of Comprehensive Income for the fiscal years ended
September 30, 2018
,
October 1, 2017
, and
October 2, 2016
;
|
|
•
|
Consolidated Balance Sheets as of
September 30, 2018
and
October 1, 2017
;
|
|
•
|
Consolidated Statements of Cash Flows for the fiscal years ended
September 30, 2018
,
October 1, 2017
, and
October 2, 2016
;
|
|
•
|
Consolidated Statements of Equity for the fiscal years ended
September 30, 2018
,
October 1, 2017
, and
October 2, 2016
;
|
|
•
|
Notes to Consolidated Financial Statements; and
|
|
•
|
Reports of Independent Registered Public Accounting Firm
|
2. Financial Statement Schedules
Financial statement schedules are omitted because they are not required or are not applicable, or the required information is provided in the consolidated financial statements or notes described in Item 15(a)(1) above.
94
3. Exhibits
|
|
|
Incorporated by Reference
|
|
|||||||||
|
Exhibit
Number
|
Exhibit Description
|
Form
|
File No.
|
Date of Filing
|
Exhibit
Number
|
Filed
Herewith
|
||||||
|
8-K
|
0-20322
|
5/7/2018
|
2.1
|
|||||||||
|
10-Q
|
0-20322
|
4/28/2015
|
3.1
|
|||||||||
|
8-K
|
0-20322
|
6/5/2018
|
3.1
|
|||||||||
|
S-3ASR
|
333-213645
|
9/15/2016
|
4.1
|
|||||||||
|
8-K
|
0-20322
|
3/20/2017
|
4.2
|
|||||||||
|
8-K
|
0-20322
|
3/20/2017
|
4.3
|
|||||||||
|
8-K
|
0-20322
|
11/22/2017
|
4.2
|
|||||||||
|
8-K
|
0-20322
|
11/22/2017
|
4.3
|
|||||||||
|
8-K
|
0-20322
|
11/22/2017
|
4.4
|
|||||||||
|
8-K
|
0-20322
|
2/28/2018
|
4.2
|
|||||||||
|
8-K
|
0-20322
|
2/28/2018
|
4.3
|
|||||||||
|
8-K
|
0-20322
|
2/28/2018
|
4.4
|
|||||||||
|
8-K
|
0-20322
|
8/10/2018
|
4.2
|
|||||||||
|
8-K
|
0-20322
|
8/10/2018
|
4.3
|
|||||||||
95
|
|
|
Incorporated by Reference
|
|
|||||||||
|
Exhibit
Number
|
Exhibit Description
|
Form
|
File No.
|
Date of Filing
|
Exhibit
Number
|
Filed
Herewith
|
||||||
|
8-K
|
0-20322
|
8/10/2018
|
4.4
|
|||||||||
|
8-K
|
0-20322
|
8/10/2018
|
4.5
|
|||||||||
|
S-3ASR
|
333-190955
|
9/3/2013
|
4.1
|
|||||||||
|
8-K
|
0-20322
|
9/6/2013
|
4.2
|
|||||||||
|
|
8-K
|
0-20322
|
9/6/2013
|
4.3
|
||||||||
|
|
8-K
|
0-20322
|
12/5/2013
|
4.2
|
||||||||
|
8-K
|
0-20322
|
12/5/2013
|
4.4
|
|||||||||
|
8-K
|
0-20322
|
6/10/2015
|
4.2
|
|||||||||
|
|
8-K
|
0-20322
|
6/10/2015
|
4.3
|
||||||||
|
8-K
|
0-20322
|
6/10/2015
|
4.4
|
|||||||||
|
8-K
|
0-20322
|
2/4/2016
|
4.2
|
|||||||||
|
8-K
|
0-20322
|
2/4/2016
|
4.3
|
|||||||||
|
8-K
|
0-20322
|
5/16/2016
|
4.4
|
|||||||||
|
8-K
|
0-20322
|
5/16/2016
|
4.5
|
|||||||||
96
|
|
|
Incorporated by Reference
|
|
|||||||||
|
Exhibit
Number
|
Exhibit Description
|
Form
|
File No.
|
Date of Filing
|
Exhibit
Number
|
Filed
Herewith
|
||||||
|
10-Q
|
0-20322
|
8/1/2017
|
10.1
|
|||||||||
|
10-K
|
0-20322
|
11/18/2016
|
10.4
|
|||||||||
|
10-Q
|
0-20322
|
2/4/2011
|
10.2
|
|||||||||
|
10-K
|
0-20322
|
12/23/2003
|
10.9
|
|||||||||
|
X
|
||||||||||||
|
10-K
|
0-20322
|
12/14/2006
|
10.12
|
|||||||||
|
X
|
||||||||||||
|
10-Q
|
0-20322
|
2/10/2006
|
10.2
|
|||||||||
|
X
|
||||||||||||
|
10-Q
|
0-20322
|
5/2/2012
|
10.1
|
|||||||||
|
10-K
|
0-20322
|
11/18/2016
|
10.14
|
|||||||||
|
10-Q
|
0-20322
|
4/26/2016
|
10.2
|
|||||||||
97
|
|
|
Incorporated by Reference
|
|
|||||||||
|
Exhibit
Number
|
Exhibit Description
|
Form
|
File No.
|
Date of Filing
|
Exhibit
Number
|
Filed
Herewith
|
||||||
|
10-Q
|
0-20322
|
4/26/2016
|
10.3
|
|||||||||
|
8-K
|
0-20322
|
10/30/2017
|
10.1
|
|||||||||
|
8-K
|
0-20322
|
10/26/2018
|
10.1
|
|||||||||
|
8-K
|
0-20322
|
7/29/2016
|
10.1
|
|||||||||
|
10-K
|
0-20322
|
11/18/2011
|
10.30
|
|||||||||
|
10-K
|
0-20322
|
11/18/2016
|
10.21
|
|||||||||
|
10-K
|
0-20322
|
11/18/2016
|
10.22
|
|||||||||
|
10-K
|
0-20322
|
11/17/2017
|
10.24
|
|||||||||
|
X
|
||||||||||||
|
10-K
|
0-20322
|
11/17/2017
|
10.25
|
|||||||||
|
X
|
||||||||||||
|
10-K
|
0-20322
|
11/17/2017
|
10.26
|
|||||||||
98
|
|
|
Incorporated by Reference
|
|
|||||||||
|
Exhibit
Number
|
Exhibit Description
|
Form
|
File No.
|
Date of Filing
|
Exhibit
Number
|
Filed
Herewith
|
||||||
|
X
|
||||||||||||
|
10-Q
|
0-20322
|
4/29/2014
|
10.3
|
|||||||||
|
8-K/A
|
0-20322
|
6/29/2018
|
10.1
|
|||||||||
|
10-Q
|
0-20322
|
5/2/2017
|
10.1
|
|||||||||
|
8-K
|
0-20322
|
9/6/2017
|
10.1
|
|||||||||
|
8-K
|
0-20322
|
6/5/2018
|
10.1
|
|||||||||
|
8-K
|
0-20322
|
10/9/2018
|
10.1
|
|||||||||
99
|
|
|
Incorporated by Reference
|
|
|||||||||
|
Exhibit
Number
|
Exhibit Description
|
Form
|
File No.
|
Date of Filing
|
Exhibit
Number
|
Filed
Herewith
|
||||||
|
—
|
—
|
—
|
—
|
X
|
||||||||
|
—
|
—
|
—
|
—
|
X
|
||||||||
|
__
|
__
|
__
|
__
|
X
|
||||||||
|
—
|
—
|
—
|
—
|
X
|
||||||||
|
—
|
—
|
—
|
—
|
X
|
||||||||
|
—
|
—
|
—
|
—
|
|||||||||
|
101
|
The following financial statements from the Company’s 10-K for the fiscal year ended September 30, 2018, formatted in XBRL: (i) Consolidated Statements of Earnings, (ii) Consolidated Statements of Comprehensive Income, (iii) Consolidated Balance Sheets, (iv) Consolidated Statements of Cash Flows, (v) Consolidated Statements of Equity, and (vi) Notes to Consolidated Financial Statements
|
—
|
—
|
—
|
—
|
X
|
||||||
*
Denotes a management contract or compensatory plan or arrangement.
**Furnished herewith.
100
SIGNATURES
Pursuant to the requirements of Section 13 or 15(d) of the Securities Exchange Act of 1934, the registrant has duly caused this report to be signed on its behalf by the undersigned, thereunto duly authorized.
|
STARBUCKS CORPORATION
|
||
|
By:
|
/s/ Kevin R. Johnson
|
|
|
|
Kevin R. Johnson
president and chief executive officer
|
|
|
|
||
November 16, 2018
POWER OF ATTORNEY
Know all persons by these presents, that each person whose signature appears below constitutes and appoints Kevin R. Johnson, Scott Maw and Rachel A. Gonzalez, and each of them, as such person’s true and lawful attorneys-in-fact and agents, with full power of substitution and resubstitution, for such person and in such person’s name, place and stead, in any and all capacities, to sign any and all amendments to this report, and to file the same, with all exhibits thereto, and other documents in connection therewith, with the Securities and Exchange Commission, granting unto said attorneys-in-fact and agents, and each of them, full power and authority to do and perform each and every act and thing requisite and necessary to be done in connection therewith, as fully to all intents and purposes as such person might or could do in person, hereby ratifying and confirming all that said attorneys-in-fact and agents, or any of them or their or such person’s substitute or substitutes, may lawfully do or cause to be done by virtue thereof.
Pursuant to the requirements of the Securities Exchange Act of 1934, this report has been signed below by the following persons on behalf of the registrant and in the capacities indicated as of
November 16, 2018
.
|
|
Signature
|
|
Title
|
|
|
By:
|
/s/ Kevin R. Johnson
|
|
president and chief executive officer, director
(principal executive officer)
|
|
|
Kevin R. Johnson
|
||||
|
By:
|
/s/ Scott Maw
|
executive vice president, chief financial officer
(principal financial officer and principal accounting officer)
|
||
|
Scott Maw
|
||||
|
By:
|
/s/ Rosalind G. Brewer
|
|
director
|
|
|
Rosalind G. Brewer
|
||||
|
By:
|
/s/ Mary N. Dillon
|
|
director
|
|
|
Mary N. Dillon
|
||||
|
By:
|
/s/ Mellody Hobson
|
|
director
|
|
|
Mellody Hobson
|
||||
|
By:
|
/s/ Jørgen Vig Knudstorp
|
|
director
|
|
|
Jørgen Vig Knudstorp
|
||||
101
|
|
Signature
|
|
Title
|
|
|
By:
|
/s/ Satya Nadella
|
|
director
|
|
|
Satya Nadella
|
||||
|
By:
|
/s/ Joshua Cooper Ramo
|
|
director
|
|
|
Joshua Cooper Ramo
|
||||
|
By:
|
/s/ Clara Shih
|
|
director
|
|
|
Clara Shih
|
||||
|
By:
|
/s/ Javier G. Teruel
|
|
director
|
|
|
Javier G. Teruel
|
||||
|
By:
|
/s/ Myron E. Ullman, III
|
|
director
|
|
|
Myron E. Ullman, III
|
||||
102
TABLE OF CONTENTS
Part IItem 1. BusinessItem 1A. Risk FactorsItem 1B. Unresolved Staff CommentsItem 2. PropertiesItem 3. Legal ProceedingsItem 4. Mine Safety DisclosuresPart IIItem 5. Market For The Registrant S Common Equity, Related Shareholder Matters and Issuer Purchases Of Equity SecuritiesItem 6. Selected Financial DataItem 7. Management S Discussion and Analysis Of Financial Condition and Results Of OperationsItem 7A. Quantitative and Qualitative Disclosures About Market RiskItem 8. Financial Statements and Supplementary DataNote 1: Summary Of Significant Accounting PoliciesNote 2: Acquisitions, Divestitures and Strategic AllianceNote 3: Derivative Financial InstrumentsNote 4: Fair Value MeasurementsNote 5: InventoriesNote 6: Equity and Cost InvestmentsNote 7: Supplemental Balance Sheet Information (in Millions)Note 7: Supplemental Balance Sheet InformationNote 8: Other Intangible Assets and GoodwillNote 9: DebtNote 10: LeasesNote 11: EquityNote 12: Employee Stock and Benefit PlansNote 13: Income TaxesNote 14: Earnings Per ShareNote 15: Commitments and ContingenciesNote 16: Segment ReportingNote 17: Selected Quarterly Financial InformationNote 18: Subsequent EventsItem 9. Changes in and Disagreements with Accountants on Accounting and Financial DisclosureItem 9A. Controls and ProceduresItem 9B. Other InformationPart IIIItem 10. Directors, Executive Officers and Corporate GovernanceItem 11. Executive CompensationItem 12. Security Ownership Of Certain Beneficial Owners and Management and Related Shareholder MattersItem 13. Certain Relationships, Related Transactions and Director IndependenceItem 14. Principal Accounting Fees and ServicesPart IVItem 15. Exhibits, Financial Statement Schedules