SCHNITZER STEEL INDUSTRIES, INC.
10-Ks and 10-Qs
|
|
|
|
|
|
|
|
|
|
|
|
|
|
|
|
|
|
|
|
|
|
|
|
|
|
|
|
|
|
|
|
|
|
|
|
|
|
|
|
|
|
|
|
|
|
|
UNITED STATES SECURITIES AND EXCHANGE COMMISSION
WASHINGTON, D.C. 20549
FORM 10-K
(Mark One)
x
ANNUAL REPORT PURSUANT TO SECTION 13 OR 15(d) OF THE
SECURITIES EXCHANGE ACT OF 1934
For the fiscal year ended
August 31, 2018
or
o
TRANSITION REPORT PURSUANT TO SECTION 13 OR 15(d)
OF THE SECURITIES EXCHANGE ACT OF 1934
For the transition period from
to
Commission File Number 0-22496
SCHNITZER STEEL INDUSTRIES, INC.
(Exact name of registrant as specified in its charter)
|
OREGON
|
|
93-0341923
|
|
(State of Incorporation)
|
|
(I.R.S. Employer Identification No.)
|
|
299 SW Clay Street, Suite 350
Portland, Oregon
|
|
97201
|
|
(Address of principal executive offices)
|
|
(Zip Code)
|
Registrant’s telephone number, including area code: (503) 224-9900
Securities registered pursuant to Section 12(b) of the Act:
|
Class A Common Stock, $1.00 par value
|
|
The NASDAQ Global Select Market
|
|
(Title of Each Class)
|
|
(Name of each Exchange on which registered)
|
Securities registered pursuant to Section 12(g) of the Act:
None
Indicate by check mark if the registrant is a well-known seasoned issuer, as defined in Rule 405 of the Securities Act.
Yes
x
No
o
Indicate by check mark if the registrant is not required to file reports pursuant to Section 13 or Section 15(d) of the Act.
Yes
o
No
x
Indicate by check mark whether the registrant (1) has filed all reports required to be filed by Section 13 or 15(d) of the Securities Exchange Act of 1934 during the preceding 12 months (or for such shorter period that the registrant was required to file such reports), and (2) has been subject to such filing requirements for the past 90 days. Yes
x
No
o
Indicate by check mark whether the registrant has submitted electronically every Interactive Data File required to be submitted pursuant to Rule 405 of Regulation S-T (§232.405 of this chapter) during the preceding 12 months (or for such shorter period that the registrant was required to submit such files). Yes
x
No
o
Indicate by check mark if disclosure of delinquent filers pursuant to Item 405 of Regulation S-K (§229.405) is not contained herein, and will not be contained, to the best of registrant’s knowledge, in definitive proxy or information statements incorporated by reference in Part III of this Form 10-K or any amendment to this Form 10-K.
x
Indicate by check mark whether the registrant is a large accelerated filer, an accelerated filer, a non-accelerated filer, smaller reporting company, or an emerging growth company. See the definitions of “large accelerated filer,” “accelerated filer,” “smaller reporting company,” and “emerging growth company” in Rule 12b-2 of the Exchange Act.
|
Large accelerated filer
|
x
|
Accelerated filer
|
o
|
Non-accelerated filer
|
o
|
|
Smaller reporting company
|
o
|
Emerging growth company
|
o
|
If an emerging growth company, indicate by check mark if the registrant has elected not to use the extended transition period for complying with any new or revised financial accounting standards provided pursuant to Section 13(a) of the Exchange Act.
o
Indicate by check mark whether the registrant is a shell company (as defined in Rule 12b-2 of the Exchange Act).
Yes
o
No
x
The aggregate market value of the registrant’s outstanding common stock held by non-affiliates on
February 28, 2018
was
$892,383,882
.
The registrant had
26,502,406
shares of Class A common stock, par value of $1.00 per share, and
200,000
shares of Class B common stock, par value of $1.00 per share, outstanding as of
October 22, 2018
.
DOCUMENTS INCORPORATED BY REFERENCE
Portions of the registrant’s definitive Proxy Statement for the January
2019
Annual Meeting of Shareholders are incorporated by reference into Part III of this report.
SCHNITZER STEEL INDUSTRIES, INC.
FORM 10-K
TABLE OF CONTENTS
|
PAGE
|
|||
|
Item 1
|
|||
|
Item 1A
|
|||
|
Item 1B
|
|||
|
Item 2
|
|||
|
Item 3
|
|||
|
Item 4
|
|||
|
Item 5
|
|||
|
Item 6
|
|||
|
Item 7
|
|||
|
Item 7A
|
|||
|
Item 8
|
|||
|
Item 9
|
|||
|
Item 9A
|
|||
|
Item 9B
|
|||
|
Item 10
|
|||
|
Item 11
|
|||
|
Item 12
|
|||
|
Item 13
|
|||
|
Item 14
|
|||
|
Item 15
|
|||
|
Item 16
|
|||
FORWARD-LOOKING STATEMENTS
Statements and information included in this Annual Report on Form 10-K by Schnitzer Steel Industries, Inc. (the “Company”) that are not purely historical are forward-looking statements within the meaning of Section 21E of the Securities Exchange Act of 1934 and are made pursuant to the “safe harbor” provisions of the Private Securities Litigation Reform Act of 1995. Except as noted herein or as the context may otherwise require, all references to “we,” “our,” “us,” and “SSI” refer to the Company and its consolidated subsidiaries.
Forward-looking statements in this Annual Report on Form 10-K include statements regarding future events or our expectations, intentions, beliefs and strategies regarding the future, which may include statements regarding trends, cyclicality and changes in the markets we sell into; the Company’s outlook, growth initiatives or expected results or objectives, including pricing, margins, sales volumes and profitability; strategic direction or goals; targets; changes to manufacturing and production processes; the cost of and the status of any agreements or actions related to our compliance with environmental and other laws; expected tax rates, deductions and credits and the impact of federal tax reform; the impact of tariffs, quotas and other trade actions; the realization of deferred tax assets; planned capital expenditures; liquidity positions; ability to generate cash from continuing operations; the potential impact of adopting new accounting pronouncements; obligations under our retirement plans; benefits, savings or additional costs from business realignment, cost containment and productivity improvement programs; and the adequacy of accruals.
Forward-looking statements by their nature address matters that are, to different degrees, uncertain, and often contain words such as “outlook,” “target,” “aim,” “believes,” “expects,” “anticipates,” “intends,” “assumes,” “estimates,” “evaluates,” “may,” “will,” “should,” “could,” “opinions,” “forecasts,” “projects,” “plans,” “future,” “forward,” “potential,” “probable,” and similar expressions. However, the absence of these words or similar expressions does not mean that a statement is not forward-looking.
We may make other forward-looking statements from time to time, including in reports filed with the Securities and Exchange Commission, press releases, presentations and on public conference calls. All forward-looking statements we make are based on information available to us at the time the statements are made, and we assume no obligation to update any forward-looking statements, except as may be required by law. Our business is subject to the effects of changes in domestic and global economic conditions and a number of other risks and uncertainties that could cause actual results to differ materially from those included in, or implied by, such forward-looking statements. Some of these risks and uncertainties are discussed in “Item 1A. Risk Factors” of Part I of this Form 10-K. Examples of these risks include: potential environmental cleanup costs related to the Portland Harbor Superfund site or other locations; the cyclicality and impact of general economic conditions; changing conditions in global markets including the impact of tariffs, quotas and other trade actions; volatile supply and demand conditions affecting prices and volumes in the markets for both our products and raw materials we purchase; imbalances in supply and demand conditions in the global steel industry; the impact of goodwill impairment charges; the impact of long-lived asset and cost and equity method investment impairment charges; inability to sustain the benefits from productivity and restructuring initiatives; difficulties associated with acquisitions and integration of acquired businesses; customer fulfillment of their contractual obligations; increases in the relative value of the U.S. dollar; the impact of foreign currency fluctuations; potential limitations on our ability to access capital resources and existing credit facilities; restrictions on our business and financial covenants under our bank credit agreement; the impact of consolidation in the steel industry; inability to realize expected benefits from investments in technology; freight rates and the availability of transportation; the impact of equipment upgrades, equipment failures and facility damage on production; product liability claims; the impact of legal proceedings and legal compliance; the adverse impact of climate change; the impact of not realizing deferred tax assets; the impact of tax increases and changes in tax rules; the impact of one or more cybersecurity incidents; environmental compliance costs and potential environmental liabilities; inability to obtain or renew business licenses and permits or renew facility leases; compliance with climate change and greenhouse gas emission laws and regulations; reliance on employees subject to collective bargaining agreements; and the impact of the underfunded status of multiemployer plans in which we participate.
1
/
Schnitzer Steel Industries, Inc. Form 10-K 2018
Table of Contents
SCHNITZER STEEL INDUSTRIES, INC.
General
Founded in 1906, Schnitzer Steel Industries, Inc. (“SSI”), an Oregon corporation, is one of North America’s largest recyclers of ferrous and nonferrous scrap metal, including end-of-life vehicles, and a manufacturer of finished steel products. Worldwide demand for recycled scrap metal is driven primarily by steel production levels, as recycled scrap metal is the primary feedstock for steel mill production using electric arc furnace (“EAF”) technology and one of the raw materials utilized for steel manufacturing using blast furnace technology. Steel mills around the world, including those in the North American domestic market in which our own steel mill operates, are the primary end markets for our recycled scrap metal. Our steel mill in Oregon produces finished steel products using internally sourced recycled scrap metal as the primary raw material and sells to industrial customers primarily in North America.
SSI acquires and recycles autobodies, rail cars, home appliances, industrial machinery, manufacturing scrap and construction and demolition scrap through its
96
auto and metals recycling facilities. We source material through well-developed, regional supply chains that collect scrap from large and small businesses and individuals. Our largest source of autobodies is our own network of
52
retail self-service auto parts stores, which operate under the commercial brand-name Pick-n-Pull. The majority of our auto parts stores are located in close geographic proximity to our regional metals recycling operations which have large-scale shredders and deep water port access. The level of vertical integration of our auto parts stores and metals recycling operations provides for efficient processing of salvaged automobiles into recycled metal products for new metal production in steel mills and smelters globally or for further processing by other consumers.
We process recycled metals ranging from iron and steel to aluminum, copper, lead, stainless steel and zinc for use in the manufacture of new or refined products. With scrap recycling facilities located in
23
States, Puerto Rico and Western Canada, we are well-positioned to efficiently acquire scrap metal throughout North America and deliver recycled metal products to customers around the world from our
seven
deep water ports, and also to our steel mill in Oregon. In fiscal
2018
, we sold our products to customers located in
26
countries, including the United States (“U.S.”) and Canada, and we sold to external customers or delivered to our steel mill an aggregate of
4.3 million
tons of ferrous recycled scrap metal and sold
636 million
pounds of nonferrous recycled scrap metal to external customers.
Our internal organizational and reporting structure includes two operating and reportable segments: the Auto and Metals Recycling (“AMR”) business and the Cascade Steel and Scrap (“CSS”) business.
AMR is our largest segment, representing
80%
of our total revenues from sales to external customers in fiscal
2018
. AMR generated
93%
of its revenues in fiscal
2018
from sales of ferrous and nonferrous scrap metal, with the remainder generated primarily from retail auto parts and other sales. AMR’s revenues from sales of recycled scrap metal, disaggregated by major product category, were
73%
ferrous scrap metal and
27%
nonferrous scrap metal in fiscal
2018
. Our metals recycling operations reported within CSS also generate revenue from external sales of ferrous and nonferrous scrap metal.
CSS produces finished steel products such as rebar, wire rod, coiled rebar, merchant bar and other specialty products using ferrous recycled scrap metal primarily sourced internally from its metals recycling operations and other raw materials. CSS’s finished steel products are primarily used in nonresidential and infrastructure construction in North America. In fiscal
2018
, CSS sold
519 thousand
short tons of finished steel products.
See
Note 16
– Segment Information in the Notes to the Consolidated Financial Statements in Part II, Item 8 of this report for a discussion of the primary activities of each reportable segment, total assets by reportable segment, operating results from continuing operations by reportable segment, revenues from external customers and concentration of sales to foreign countries.
2
/
Schnitzer Steel Industries, Inc. Form 10-K 2018
Table of Contents
SCHNITZER STEEL INDUSTRIES, INC.
Tabular presentation of our active recycling and steel facilities by geographic region and segment is as follows:
|
Auto Parts Stores
|
Metals Recycling Facilities
(1)
|
Total Recycling Facilities
|
Large-Scale Shredders
(2)
|
Deep Water Ports
|
Steel Facilities
(3)
|
Segment
|
||||||||
|
Northwest
WA, OR, MT
|
7
|
3
|
10
|
1
|
1
|
—
|
AMR
|
|||||||
|
—
|
5
|
5
|
1
|
1
|
1
|
CSS
|
||||||||
|
Southwest and Hawaii
CA, NV, UT, HI
|
22
|
7
|
29
|
2
|
2
|
—
|
AMR
|
|||||||
|
—
|
—
|
—
|
—
|
—
|
1
|
CSS
|
||||||||
|
Midwest and South
IL, IN, OH, MO, KS, TX, AR
|
14
|
—
|
14
|
—
|
—
|
—
|
AMR
|
|||||||
|
Northeast
MA, ME, NH, RI
|
2
|
9
|
11
|
1
|
2
|
—
|
AMR
|
|||||||
|
Southeast and Puerto Rico
GA, AL, TN, FL, VA, PR
|
3
|
16
|
19
|
1
|
1
|
—
|
AMR
|
|||||||
|
Western Canada
BC, AB
|
4
|
4
|
8
|
—
|
—
|
—
|
AMR
|
|||||||
|
Total
|
52
|
44
|
96
|
6
|
7
|
2
|
||||||||
_____________________
|
(1)
|
Excludes joint venture facilities.
|
|
(2)
|
All large-scale shredding operations employ advanced nonferrous extraction and separation equipment.
|
|
(3)
|
Includes one steel mini-mill in Oregon and one distribution center in California.
|
In fiscal 2017, we substantially completed a multi-year program of cost reduction, productivity improvement, and restructuring initiatives to more closely align our business with market conditions. By the end of fiscal 2017, we had achieved approximately
$160 million
in combined annual benefits to operating performance since the initial phase of initiatives was announced at the end of fiscal 2012. See Management’s Discussion and Analysis of Financial Condition and Results of Operations in Part II, Item 7 of this report for further discussion of restructuring initiatives, benefits and costs.
AMR
Business
AMR sells ferrous and nonferrous recycled scrap metal in both foreign and domestic markets. AMR acquires, processes and recycles autobodies, rail cars, home appliances, industrial machinery, manufacturing scrap and construction and demolition scrap through its
91
auto and metals recycling facilities. Our largest source of autobodies is our own network of retail auto parts stores, which operate under the commercial brand-name Pick-n-Pull. AMR procures salvaged vehicles and sells serviceable used auto parts from these vehicles through its
52
self-service auto parts stores located across the U.S. and Western Canada. Upon acquiring a salvaged vehicle, we remove catalytic converters, aluminum wheels and batteries for separate processing and sale prior to placing the vehicle in our retail lot. After retail customers have removed desired parts from a vehicle, we may remove remaining major component parts containing ferrous and nonferrous materials, which are primarily sold to wholesalers. The remaining autobodies are crushed and shipped to our metals recycling facilities to be shredded, or sold to third parties where geographically more economical.
To prepare scrap metal, we crush, sort and bale the material by product grade for easier handling and sale. AMR processes mixed and large pieces of scrap metal into smaller pieces by crushing, torching, shearing, shredding and sorting, resulting in scrap metal pieces of a size, density and metal content required by customers to meet their production needs. The manufacturing process includes physical separation of ferrous and nonferrous materials through automated and manual processes into various sub-classifications, each of which has a value and metal content of importance to different customers for their end products. One of the most efficient ways to process and sort recycled scrap metal is through the use of shredding and separation systems.
AMR operates
six
deep water port locations,
five
of which are equipped with large-scale shredders. AMR’s largest port facilities in Everett, Massachusetts; Oakland, California; and Tacoma, Washington each operate a mega-shredder with 7,000 to 9,000 horsepower. Our port facilities in Salinas, Puerto Rico and Kapolei, Hawaii each operate a shredder with 1,500 to 6,000 horsepower. Our port facility in Providence, Rhode Island does not operate a shredder, but exports ferrous recycled scrap metal acquired in the regional market. Our shredders are designed to provide a denser product and, in conjunction with advanced separation equipment, a more refined form of ferrous scrap metal which is used efficiently by steel mills in the production of new steel. The shredding process reduces autobodies and other scrap metal into fist-size pieces of shredded recycled scrap metal. The shredded material is then carried by conveyor under magnetized drums that attract the ferrous scrap metal and separate it from the nonferrous scrap metal and other residue, resulting in a consistent and high-quality shredded ferrous product. The nonferrous scrap metal and residue then pass through a series of additional mechanical sorting systems designed to separate the nonferrous metal from the residue.
3
/
Schnitzer Steel Industries, Inc. Form 10-K 2018
Table of Contents
SCHNITZER STEEL INDUSTRIES, INC.
The remaining nonferrous metal is then further sorted by product and size grade before being sold. AMR invests in nonferrous metal extraction and separation technologies in order to maximize the recoverability of valuable nonferrous metal and to meet the metal purity requirements of customers. AMR also purchases nonferrous metal directly from industrial vendors and other suppliers and prepares this metal for shipment to customers by ship, rail or truck.
In addition to the sale of recycled metal products processed at our facilities, AMR also brokers the sale of ferrous and nonferrous scrap metal generated by industrial entities and demolition projects to customers in the domestic market.
Products
AMR’s primary products consist of recycled ferrous and nonferrous scrap metal. Ferrous recycled scrap metal is a key feedstock used in the production of finished steel and is largely categorized into heavy melting steel (“HMS”), plate and structural (“bonus”) and shredded scrap (“shred”), although there are various grades of each category depending on metal content and the size and consistency of individual pieces. These attributes affect the product’s relative value. Our nonferrous products include aluminum, copper, stainless steel, nickel, brass, titanium, lead, high temperature alloys and joint products such as zorba (primarily mixed aluminum nonferrous material) and zurik (predominantly stainless steel).
Prior to the shredding process, AMR sells serviceable used auto parts from salvaged vehicles through its self-service auto parts stores located across the U.S. and Western Canada. Each retail self-service store offers an extensive selection of vehicles (including domestic and foreign cars, vans and light trucks) from which customers can remove parts. We employ proprietary information technology systems to centrally manage and operate the geographically diverse network of auto parts stores, and we regularly rotate the inventory to provide customers with greater access to parts. In general, we believe the list prices of auto parts at our self-service stores are significantly lower than those offered at full-service auto dismantlers, retail car parts stores and car dealerships.
Customers
AMR sells its ferrous and nonferrous recycled metal products globally to steel mills, foundries, smelters, and recycled metal processors. AMR’s self-service auto parts stores also serve retail customers seeking to obtain serviceable used auto parts at a competitive price. Retail customers remove the parts without the assistance of store employees and pay a listed price for the part. AMR also supplies a small portion of its scrap metal to CSS’s shredding operation in Portland, Oregon, the substantial majority of which is processed and delivered to CSS’s steel mill.
Presented below are AMR revenues by continent for the last three fiscal years ended August 31 (dollars in thousands):
|
2018
|
% of
Revenue
|
2017
|
% of
Revenue
|
2016
|
% of
Revenue
|
|||||||||||||||
|
North America
(1)
|
$
|
736,494
|
|
39
|
%
|
$
|
571,620
|
|
42
|
%
|
$
|
429,997
|
|
41
|
%
|
|||||
|
Asia
|
834,038
|
|
44
|
%
|
593,332
|
|
44
|
%
|
433,415
|
|
41
|
%
|
||||||||
|
Europe
(2)
|
298,725
|
|
16
|
%
|
167,576
|
|
12
|
%
|
174,038
|
|
17
|
%
|
||||||||
|
South America
|
25,277
|
|
1
|
%
|
19,158
|
|
1
|
%
|
23,142
|
|
2
|
%
|
||||||||
|
Africa
|
14,432
|
|
1
|
%
|
11,932
|
|
1
|
%
|
—
|
|
—
|
%
|
||||||||
|
Intercompany sales to CSS
|
(24,892
|
)
|
(1
|
)%
|
(15,647
|
)
|
(1
|
)%
|
(12,081
|
)
|
(1
|
)%
|
||||||||
|
Total (net of intercompany)
|
$
|
1,884,074
|
|
|
|
$
|
1,347,971
|
|
|
|
$
|
1,048,511
|
|
|
|
|||||
____________________________
|
(1)
|
Includes intercompany sales to CSS.
|
|
(2)
|
Includes sales to customers in Turkey.
|
In fiscal
2018
, the five countries from which AMR derived its largest revenues from external customers were the U.S., Turkey, China, Bangladesh, and South Korea, which collectively accounted for
75%
of total AMR external revenues. In fiscal
2017
and
2016
, the five countries from which AMR derived its largest revenues from external customers accounted for
81%
and
85%
, respectively, of total AMR external revenues. We attribute revenues from external customers to individual countries based on the country in which the customer takes delivery of the goods.
AMR’s five largest external ferrous scrap metal customers accounted for
33%
of external recycled ferrous metal revenues in fiscal
2018
, compared to
31%
and
37%
in fiscal
2017
and
2016
, respectively. AMR had no external customers that accounted for 10% or more of consolidated revenues in fiscal
2018, 2017 and 2016
.
Total sales volumes of ferrous scrap metal vary from year-to-year due to the level of demand, availability of supply, economic growth, infrastructure spending, relative currency values, availability of credit and other factors. Ferrous scrap metal sales are
4
/
Schnitzer Steel Industries, Inc. Form 10-K 2018
Table of Contents
SCHNITZER STEEL INDUSTRIES, INC.
primarily denominated in U.S. dollars, and nearly all of our large shipments of ferrous scrap metal to foreign customers have historically been supported by letters of credit.
The table below sets forth, on a revenue and volume basis, the amount of recycled ferrous scrap metal sold by AMR to foreign and domestic customers, including sales to CSS, during the last three fiscal years ended August 31:
|
Ferrous Recycled Metal
|
2018
|
2017
|
2016
|
|||||||||||||||||
|
|
Revenues
(1)
|
Volume
(2)
|
Revenues
(1)
|
Volume
(2)
|
Revenues
(1)
|
Volume
(2)
|
||||||||||||||
|
Foreign
|
$
|
959,001
|
|
2,623
|
|
$
|
608,339
|
|
2,197
|
|
$
|
452,242
|
|
2,040
|
|
|||||
|
Domestic
|
329,286
|
|
1,085
|
|
234,883
|
|
948
|
|
173,275
|
|
859
|
|
||||||||
|
Total
|
$
|
1,288,287
|
|
3,708
|
|
$
|
843,222
|
|
3,145
|
|
$
|
625,517
|
|
2,899
|
|
|||||
|
(1)
|
Revenues stated in thousands of dollars.
|
|
(2)
|
Volume stated in thousands of long tons (one long ton = 2,240 pounds).
|
AMR sells nonferrous recycled scrap metal to specialty steelmakers, foundries, aluminum sheet and ingot manufacturers, copper refineries and smelters, brass and bronze ingot manufacturers, wholesalers, wire and cable producers, and other recycled metal processors globally. AMR invests in advanced separation technologies in order to extract higher nonferrous yields from the shredding process and to enhance the separation of nonferrous metals in order to maximize the grade and value of the individual metals, making them desirable to a wide range of customers.
The table below sets forth, on a revenue and volume basis, the amount of recycled nonferrous scrap metal sold by AMR to foreign and domestic customers during the last three fiscal years ended August 31:
|
Nonferrous Recycled Metal
|
2018
|
2017
|
2016
|
|||||||||||||||||
|
|
Revenues
(1)
|
Volume
(2)
|
Revenues
(1)
|
Volume
(2)
|
Revenues
(1)
|
Volume
(2)
|
||||||||||||||
|
Foreign
|
$
|
264,628
|
|
357,389
|
|
$
|
216,362
|
|
319,629
|
|
$
|
186,989
|
|
290,430
|
|
|||||
|
Domestic
|
217,149
|
|
214,316
|
|
178,615
|
|
221,162
|
|
143,362
|
|
183,307
|
|
||||||||
|
Total
|
$
|
481,777
|
|
571,705
|
|
$
|
394,977
|
|
540,791
|
|
$
|
330,351
|
|
473,737
|
|
|||||
|
(1)
|
Revenues stated in thousands of dollars.
|
|
(2)
|
Volume stated in thousands of pounds and volume information excludes platinum-group metals (“PGMs”) in catalytic converters.
|
AMR’s retail auto parts sales account for less than
10%
of SSI’s consolidated revenues in all of the periods presented.
Pricing
Domestic and foreign prices for ferrous and nonferrous recycled scrap metal are generally based on prevailing market rates, which differ by region, and are subject to market cycles that are influenced by worldwide demand from steel and other metal producers as well as by the availability of materials that can be processed into saleable scrap metal, among other factors. Trade actions, including tariffs, quotas and restrictions or bans on access to certain markets, can also impact pricing for the affected products. Ferrous scrap metal export sales contracts generally provide for shipment within
30
to
60
days after the price is agreed to which, in most cases, includes freight. Nonferrous scrap metal sales contracts generally provide for shipment within 30 days after the price is agreed to, which also typically includes freight.
AMR responds to changes in selling prices for processed metal by seeking to adjust purchase prices for unprocessed scrap metal in order to manage the impact on its operating income. The spread between selling prices and the cost of purchased scrap metal (metal spread) is subject to a number of factors, including differences in the market conditions between the domestic regions where scrap metal is acquired and the areas in the world to which the processed metals are sold, market volatility from the time the selling price is agreed upon with the customer until the time the scrap metal is purchased, and changes in transportation costs. We believe AMR generally benefits from sustained periods of rising recycled metal selling prices, which allow it to better maintain or increase both operating income and scrap metal flow into its facilities. When recycled scrap metal selling prices decline for a sustained period, AMR’s operating margins typically compress.
The sales prices for auto parts from salvaged vehicles are deeply discounted from prevailing national new and refurbished sales prices offered at full-service auto dismantlers, retail auto parts stores and car dealerships. Our stores provide a list price, available at each location and online. Prices for autobodies sold to third parties and for major component parts, such as engines, transmissions and alternators sold to wholesalers, are based on prevailing scrap market rates which differ by region and are subject to market cycles. Prices for catalytic converters sold to third-party processors are based on prevailing market rates for the extracted metals.
5
/
Schnitzer Steel Industries, Inc. Form 10-K 2018
Table of Contents
SCHNITZER STEEL INDUSTRIES, INC.
By consolidating shipments of autobodies and component parts, we are able to optimize prices by focusing on larger wholesale customers that pay a premium for volume and consistency of shipments.
Markets
Global production of finished steel products drives demand for materials used in the steel-making process, including ferrous recycled scrap metal which is the primary feedstock used in EAFs and can also be used in blast furnaces to manufacture steel. AMR exports ferrous recycled scrap metal primarily to countries in Asia, the Mediterranean region and North, Central and South America. Ferrous exports made up approximately
70%
of AMR’s total ferrous sales volume in fiscal
2018, 2017 and 2016
. In fiscal 2018, the combination of improved U.S. and global economic growth, a continued reduction in the level of Chinese steel exports, and further development of the steel industries using EAFs in other export markets contributed to improved demand and prices for ferrous recycled scrap metal. We believe long-term demand for recycled metals will continue to be driven by factors including global economic growth and an increased focus on environmental policies promoting natural resource conservation, lower greenhouse gas emissions and lower energy costs. We believe the significant environmental benefits and production efficiencies associated with EAF steel-making, which uses scrap metal as a primary raw material, compared to blast furnace steel-making, which primarily uses iron ore mined from natural resources, will positively contribute to worldwide long-term demand for ferrous recycled scrap metal.
Nonferrous exports made up
63%
,
59%
and
61%
of AMR’s total nonferrous sales volumes in fiscal 2018, 2017 and 2016, respectively. While China has historically been the primary destination for our nonferrous exports, AMR sold a higher proportion of its combined nonferrous exports to other countries in Asia and to Europe in fiscal 2018 primarily in response to new regulations, increased inspection requirements and tariffs on U.S. scrap imports put in place by China during the year.
Distribution
AMR delivers recycled ferrous and nonferrous scrap metal to foreign customers by ship and to domestic customers by barge, rail and road transportation networks. Cost efficiencies are achieved by operating deep water terminal facilities in Everett, Massachusetts; Oakland, California; Tacoma, Washington; and Providence, Rhode Island, all of which are owned, except for the Providence, Rhode Island facility which is operated under a long-term lease. We also have access to deep water terminal facilities at Kapolei, Hawaii and Salinas, Puerto Rico through public docks. The use of deep water terminals enables us to load ferrous material in large vessels capable of holding up to 50,000 tons for trans-oceanic shipments. We believe the use of our owned and leased terminal facilities is advantageous because it allows us to more effectively manage loading costs and minimize the berthing delays often experienced by users of unaffiliated terminals. From time to time, AMR may enter into contracts of affreightment, which guarantee the availability of ocean going vessels, in order to manage the risks associated with ship availability and freight costs.
Our nonferrous products are shipped in containers, which hold 20 to 30 tons, from container ports and rail ramps located in close proximity to our recycling facilities. Containerized shipments are exported by marine vessels to customers globally and domestic shipments are typically shipped to customers by rail or by truck.
AMR sells used auto parts from its self-service retail stores. Upon acquiring a salvaged vehicle and after retail customers have removed desired parts, we extract and consolidate certain valuable ferrous and nonferrous components from autobodies for shipment by truck primarily to wholesale customers. The salvaged autobodies are crushed and shipped by truck to our metals recycling facilities where geographically feasible, or to third-party recyclers, for shredding.
Sources of Unprocessed Metal
The most common forms of purchased unprocessed metal are obsolete machinery and equipment, such as automobiles, railroad cars, railroad tracks, home appliances and other consumer goods, waste metal from manufacturing operations and demolition metal from buildings and other infrastructure. Unprocessed metal is acquired from a diverse base of suppliers who unload at our facilities, from drop boxes at suppliers’ industrial sites, and through negotiated purchases from other large suppliers, including railroads, manufacturers, automobile salvage facilities, metal dealers, various government entities and individuals. We typically seek to locate our retail auto parts stores in major population centers with convenient road access. Our auto parts store network spans
15
states in the U.S. and two provinces in Western Canada, with a majority of the stores concentrated in regions where our large shredders are located. Through our network of auto parts stores, we seek to obtain salvaged vehicles from five primary sources: private parties, tow companies, charities, auto auctions and municipal and other contracts. AMR has a program to purchase vehicles from private parties called “Cash for Junk Cars” which is advertised in local markets. Private parties either call a toll-free number and receive a quote for their vehicle or obtain an instant online quote. The private party can either deliver the vehicle to one of our retail locations or arrange for the vehicle to be picked up. AMR also employs car buyers who travel to vendors and bid on vehicles. Further, AMR enters into limited duration contracts with public entities and other third parties for vehicle dismantling and disposal services, which provide a source of low-cost salvage vehicles. The expiration of such contracts may lead us to seek alternative sources of vehicles, potentially at a higher cost.
6
/
Schnitzer Steel Industries, Inc. Form 10-K 2018
Table of Contents
SCHNITZER STEEL INDUSTRIES, INC.
The majority of AMR’s scrap metal collection and processing facilities receive unprocessed metal via major railroad routes, waterways or highways. Metals recycling facilities situated near industrial manufacturing and major transportation routes have the competitive advantage of reduced freight costs because of the significant cost of freight relative to the cost of metal. The locations of AMR’s West Coast facilities provide access to sources of unprocessed metal in the Northern California region, northward to Western Canada and Alaska, and to the East, including Idaho, Montana, Utah, Colorado and Nevada. The locations of the East Coast facilities provide access to sources of unprocessed metal in New York, Connecticut, Maine, Massachusetts, New Hampshire, Rhode Island, Vermont, Eastern Canada and, from time to time, the Midwest. In the Southeastern U.S., approximately half of AMR’s ferrous and nonferrous unprocessed metal volume is purchased from industrial companies, including auto manufacturers, with the remaining volume being purchased from smaller dealers and individuals. These industrial companies provide AMR with metals that are by-products of their manufacturing processes.
The supply of scrap metal from these various sources can fluctuate with the level of economic activity in the U.S. and can be sensitive to variability in scrap metal prices, particularly in the short term. The supply of scrap metal can also fluctuate, to a lesser degree, due to seasonal factors, such as severe weather conditions, which can inhibit scrap metal collections at our facilities and production levels in our yards. Severe weather conditions can also adversely impact the timing of shipments of our products, the level of manufacturing activity utilizing our products, and retail admissions at our auto parts stores.
Backlog
As of September 30,
2018
, AMR had a backlog of orders to sell
$86 million
of export ferrous metal compared to
$96 million
at the same time in the prior year primarily due to the timing of sales. Additionally, as of September 30,
2018
, AMR had a backlog of orders to sell
$34 million
of export nonferrous metal compared to
$34 million
in the prior year. We expect to fill the entirety of the backlog of orders for export ferrous and nonferrous metal during fiscal
2019
.
Competition
AMR competes in the U.S. and in Western Canada for the purchase of scrap metal with large, well-financed recyclers of scrap metal, steel mills that own scrap yards, and with smaller metals facilities and dealers. AMR’s auto stores compete for the purchase of end-of-life vehicles with other auto dismantlers, used car dealers, auto auctions and metals recyclers. In general, the competitive factors impacting the purchase of scrap metal are the price offered by the purchaser and the proximity of the purchaser to the source of scrap metal and end-of-life vehicles. AMR also competes with brokers that buy scrap metal on behalf of domestic and foreign steel mills.
AMR competes globally for the sale of processed recycled metal to finished steel and other metal product producers. The predominant competitive factors that impact recycled metal sales are price (including duties and shipping cost), reliability of service, product quality, the relative value of the U.S. dollar and the availability and price of raw material alternatives, including scrap metal substitutes such as pig iron and direct-reduced iron (both derived from iron ore), and semi-finished products, such as steel billets. Our ability to compete in certain export markets may be impacted by trade actions such as tariffs and import restrictions. Such restrictions may require us to perform additional processing of certain nonferrous recycled scrap metal products, as well as engage in increased inspection and certification activities, in order to continue selling into the affected markets.
Commencing in fiscal 2012 and spanning through the first half of fiscal 2016, low-priced steel billets using iron ore as their primary raw material contributed to lower scrap metal demand and prices. These challenging market conditions led to an industry trend of reductions in capacity through idling of equipment and curtailment of operations, including by large and well-capitalized companies, while a number of smaller competitors consolidated or exited the scrap market due to the protracted cyclical downturn. In fiscal 2015, we idled a large-scale shredder in Johnston, Rhode Island and another in Surrey, British Columbia, and in fiscal 2016, we idled a small shredder in Concord, New Hampshire to more closely align our business with the prevalent market conditions. In fiscal 2018, the previously idled shredder in Surrey, British Columbia was dismantled and sold. Market conditions improved in fiscal 2017 and further in fiscal 2018 mainly due to higher demand from steel manufacturers in the domestic and export markets resulting in higher selling prices for raw materials used in steel production and increased supply flows of scrap metal, including end-of-life vehicles. Higher average selling prices and supply volumes, in combination with increased sales diversification and the continuing focus on our operating efficiency from our multi-year cost savings and productivity initiatives, led to significant improvement in our operating performance over the last three years.
AMR also competes for the sale of used auto parts to retail customers with other self-service and full-service auto dismantlers. The auto parts industry is characterized by diverse and fragmented competition and comprises a large number of aftermarket and used auto parts suppliers of all sizes, ranging from large, multinational corporations which serve both original equipment manufacturers and the aftermarket on a worldwide basis to small, local entities which have more limited supply. The main competitive factors impacting the retail sale of auto parts are price, availability and visibility of product, quality and convenience of the retail stores to customers.
7
/
Schnitzer Steel Industries, Inc. Form 10-K 2018
Table of Contents
SCHNITZER STEEL INDUSTRIES, INC.
AMR’s ability to process substantial volumes of scrap metal products, advanced processing equipment, number and geographic dispersion of locations, access to a variety of different modes of transportation, and the operating synergies of its integrated platform provide its business with the ability to compete successfully in varying market conditions.
CSS
Business
CSS operates a steel mini-mill in McMinnville, Oregon that produces a range of finished steel long products such as reinforcing bar (rebar) and wire rod. The primary feedstock for the manufacture of its products is ferrous recycled scrap metal. CSS’s steel mill obtains substantially all of its scrap metal raw material requirements from its integrated metals recycling and joint venture operations. CSS’s metals recycling operations comprise a collection, shredding and export operation in Portland, Oregon, four feeder yard operations located in Oregon and Southern Washington, and one metals recycling joint venture ownership interest. Additionally, CSS purchases small volumes of ferrous scrap metal from AMR and sells ferrous and nonferrous recycled scrap metal into the export market. CSS’s revenues from external sales of recycled scrap metal account for less than
10%
of SSI’s consolidated revenues in all of the periods presented.
Manufacturing
CSS’s melt shop includes an EAF, a ladle refining furnace with enhanced steel chemistry refining capabilities, and a five-strand continuous billet caster, permitting the mill to produce special alloy grades of steel not currently produced by other mills on the West Coast of the U.S. The melt shop produced
561 thousand
,
489 thousand
and
499 thousand
short tons of steel in the form of billets during fiscal
2018, 2017 and 2016
, respectively. The substantial majority of these billets are used by CSS in its rolling mill to produce finished steel products.
Through the end of fiscal 2016, CSS operated two computerized rolling mills. In the first quarter of fiscal 2017, we implemented a plan to shut down and decommission the older rolling mill, which was entered into service over 40 years ago, and which in recent years had been producing only a small proportion of CSS’s finished steel products. This action, in conjunction with an initiative to enhance the operating efficiency of the newer and more technologically advanced rolling mill, is expected to improve product quality, while expanding its overall effective annual production capacity. The newer rolling mill currently has an effective annual production capacity of 580 thousand tons of finished steel products.
Billets produced in CSS’s melt shop are reheated in a natural gas-fueled furnace and are then hot-rolled through the rolling mill to produce finished products. CSS continues to monitor the market for new products and, through discussions with customers, to identify additional opportunities to expand its product lines and sales.
Our steel mill has an operating permit issued under Title V of the Clean Air Act Amendments of 1990, which governs air quality standards. The permit is based upon an annual production capacity of
950 thousand
tons. The permit was first issued in 1998 and has since been renewed through
February 1, 2018
. The permit renewal process occurs every five years, and the renewal process is underway; however, the existing permit is extended by administrative rule until the current renewal process is finalized.
Products
CSS produces semi-finished goods (billets) and finished goods, consisting of rebar, coiled rebar, wire rod, merchant bar and other specialty products. Semi-finished goods are predominantly used for CSS’s finished products, but also have been produced for sale to other steel mills. Rebar is produced in either straight length steel bars or coils and used to increase the strength of poured concrete. Coiled rebar is preferred by some manufacturers because it reduces the waste generated by cutting individual lengths to meet customer specifications and, therefore, improves yield. Wire rod is steel rod, delivered in coiled form, used by manufacturers to produce a variety of products such as chain link fencing, nails, wire, stucco netting, and pre-stressed concrete strand. Merchant bar consists of rounds and square steel bars used by manufacturers to produce a wide variety of products, including bolts, threaded bars, and dowel bars. CSS is also certified to produce high-quality rebar to support nuclear power plant construction and has a license to produce certain patented high-strength specialty steels.
The table below sets forth, on a revenue and volume basis, the sales of finished steel products during the last three fiscal years ended August 31:
|
|
2018
|
2017
|
2016
|
|||||||||||||||||
|
|
Revenues
(1)
|
Volume
(2)
|
Revenues
(1)
|
Volume
(2)
|
Revenues
(1)
|
Volume
(2)
|
||||||||||||||
|
Finished steel products
|
$
|
363,849
|
|
519,162
|
|
$
|
280,206
|
|
495,516
|
|
$
|
269,355
|
|
488,212
|
|
|||||
|
(1)
|
Revenues stated in thousands of dollars.
|
|
(2)
|
Volume stated in short tons (one short ton = 2,000 pounds).
|
8
/
Schnitzer Steel Industries, Inc. Form 10-K 2018
Table of Contents
SCHNITZER STEEL INDUSTRIES, INC.
The metals recycling operations within CSS produce substantially the same recycled scrap metal products as those produced by the metals recycling operations within AMR and are exposed to similar market and competitive forces.
Customers
CSS’s finished steel customers are primarily steel service centers, construction industry subcontractors, steel fabricators, wire drawers and major farm and wood products suppliers. During fiscal
2018
, CSS sold its finished steel products to customers located primarily in the Western U.S. and Western Canada. Customers in California accounted for
48%
,
53%
, and
48%
of CSS’s steel revenues in fiscal
2018, 2017 and 2016
, respectively. CSS’s ten largest steel customers accounted for
46%
,
51%
and
45%
of its steel revenues during fiscal
2018, 2017 and 2016
, respectively. No CSS steel customer accounted for 10% or more of consolidated revenues in fiscal
2018, 2017 and 2016
.
The metals recycling operations within CSS also sell ferrous and nonferrous recycled metal products to external customers comprising primarily steel mills, foundries, smelters and recycled metal processors in Asia.
Pricing
CSS’s finished steel product prices differ by product size and grade. Selling prices are influenced by the price of raw materials, including the cost of recycled ferrous scrap metal and required consumables including graphite electrodes, as well as regional demand in the West Coast market. Selling prices for our finished steel products may be affected by competition from steel imports.
Distribution
CSS sells finished steel products directly from its mini-mill in McMinnville, Oregon and its owned distribution center in City of Industry, California (Los Angeles area). Finished steel products are shipped from the mini-mill to the distribution center primarily by rail. The distribution center facilitates sales by maintaining an inventory of products close to major customers for just-in-time delivery. CSS communicates regularly with major customers to determine their anticipated needs and plans its rolling mill production schedule accordingly. Finished steel shipments to customers are made by common carrier, primarily truck or rail.
CSS delivers recycled ferrous scrap metal to export customers by bulk ship using its deep water terminal facility in Portland, Oregon, and nonferrous recycled scrap metal to export customers in containers by ship.
Supply of Scrap Metal
We believe CSS operates the only mini-mill in the Western U.S. that obtains its scrap metal requirements from an integrated metals recycler. CSS’s metals recycling operations provide its steel mill with a mix of recycled metal grades, which allows the mill to achieve optimum efficiency in its melting operations.
Energy Supply
CSS needs electricity to run its steel manufacturing operations, primarily its EAF. CSS purchases electricity under a long-term contract with McMinnville Water & Light (“MW&L”), which in turn relies on the Bonneville Power Administration (“BPA”). We entered into our current contract with MW&L in October 2011 that will expire in September 2028.
CSS’s steel manufacturing operations also need natural gas to run its reheat furnace, which is used to reheat billets prior to running them through the rolling mill. CSS meets this demand through a natural gas agreement with a utility provider that obligates CSS at each month-end to purchase a volume of gas based on its projected needs for the immediately subsequent month on a take-or-pay basis priced using published natural gas indices.
Energy costs represented
4%
,
5%
, and
6%
of CSS’s cost of goods sold in fiscal
2018
,
2017
and
2016
, respectively.
Backlog
As of September 30,
2018
and
2017
, CSS had a backlog of finished steel orders of
$33 million
and
$19 million
, respectively. We expect to fill the entirety of the backlog of orders for finished steel products during fiscal
2019
.
Competition
The primary domestic competitors of CSS for the sale of finished steel products include Nucor Corporation’s manufacturing facilities in Arizona, Utah and Washington; Commercial Metals Company’s manufacturing facility in Arizona; and Gerdau Long Steel North America’s facility in California (which Commercial Metals Company has agreed to acquire). In addition to domestic competition, CSS competes with foreign steel producers, principally located in Asia, Canada, Mexico and Central and South America, primarily in shorter length rebar and certain wire rod grades. The principal competitive factors in CSS’s market are price, quality, service, product availability and the relative value of the U.S. dollar.
In recent years, relatively large volumes of low-priced steel imports, driven by global overcapacity in steel-making production and by the relative strength of the U.S. dollar, negatively impacted CSS’s ability to compete. For more than a decade, CSS’s steel
9
/
Schnitzer Steel Industries, Inc. Form 10-K 2018
Table of Contents
SCHNITZER STEEL INDUSTRIES, INC.
manufacturing operation, as part of a U.S. industry coalition, has petitioned the U.S. Government under our international trade laws for relief in the form of antidumping and countervailing duties against wire rod and rebar products from a number of foreign countries. Many of those cases were successful and led to a decrease in finished steel imports into CSS’s domestic markets from the peak reached in fiscal 2016. As of the start of fiscal 2018, antidumping duty orders were in effect related to imports of rebar from Belarus, China, Indonesia, Japan, Latvia, Mexico, Moldova, Poland, Taiwan, Turkey and Ukraine; a countervailing duty order was in effect related to imports of rebar from Turkey; antidumping duty orders were in effect related to imports of wire rod from Brazil, China, Indonesia, Mexico, Moldova and Trinidad and Tobago; and countervailing duty orders were in effect related to imports of wire rod from Brazil and China. During 2018, following a petition by the U.S. domestic industry and successful resolution, new antidumping duty orders were imposed against wire rod from Belarus, Italy, South Korea, Russia, South Africa, Spain, Turkey, Ukraine, United Arab Emirates and the United Kingdom, and countervailing duty orders were imposed against wire rod from Italy and Turkey.
The duties imposed as part of these orders are periodically reassessed through the administrative review process. In addition, every five years the U.S. Government conducts sunset reviews to determine whether revocation of the orders would likely lead to resumption of dumping and subsidization and negatively impact the U.S. domestic industry. Affirmative decisions allow the orders to continue for an additional five years. The sunset review for rebar from Belarus, China, Indonesia, Latvia, Moldova, Poland and Ukraine was initiated in June 2018 and, following an affirmative decision, orders covering these countries will be in place for another five years. The next sunset review for Mexico and Turkey (from the 2014 investigation) will be in 2019 and for the newest order covering imports from Japan, Taiwan and Turkey will be in 2022. The next sunset reviews for wire rod from Brazil, China, Indonesia, Mexico, Moldova and Trinidad and Tobago will be in 2019, and for the remaining countries, likely in 2022.
During fiscal 2018, the antidumping margins on one large Mexican manufacturer of both wire rod and rebar were decreased significantly in the administrative review process.
There are antidumping and countervailing duty orders in effect in Canada covering rebar from Belarus, China, Chinese Taipei, Hong Kong, Japan, South Korea, Portugal, Spain and Turkey which we expect will continue to lead to a reduction in the volume of imports into Canada from these countries.
The long-term effectiveness of existing antidumping and countervailing duty orders related to imports of wire rod and rebar products is largely uncertain and is impacted by the U.S. Government’s ability to efficiently identify and respond to violations of U.S. international trade laws affecting CSS’s steel manufacturing operations.
On March 8, 2018, the President of the United States announced the imposition of tariffs in the amount of 25 percent and 10 percent on imports of steel and aluminum, respectively. The imposition of the tariffs was the conclusion of an investigation started in April 2017 under Section 232 of the Trade Expansion Act of 1962 that allows for an exemption from normal international trade rules if imports of a product are harming national security. Currently, imports from Argentina, Australia, Brazil and South Korea are exempt from these duties pursuant to various agreements, including quotas. The Department of Commerce also implemented an exclusion process whereby U.S. entities can request that certain products be excluded from the duties. CSS reviews any exclusion requests relevant to its product line to determine whether an objection might be appropriate. Canada, Mexico and the European Union have implemented retaliatory tariffs. The Canadian retaliatory tariffs, enacted in July 2018, impose a 25 percent tariff on U.S. steel products and may impact CSS’s ability to export its steel products to Canada at competitive prices. Sales of finished steel products to customers in Canada represented
7%
of our steel mill’s external sales in fiscal 2018, and
6%
in each of fiscal 2017 and 2016.
10
/
Schnitzer Steel Industries, Inc. Form 10-K 2018
Table of Contents
SCHNITZER STEEL INDUSTRIES, INC.
Environmental Matters
Impact of Legislation and Regulation
Compliance with environmental laws and regulations is a significant factor in our operations. Our businesses are subject to extensive local, state and federal environmental protection, health, safety and transportation laws and regulations relating to, among others:
|
•
|
The United States Environmental Protection Agency (“EPA”);
|
|
•
|
Remediation under the Comprehensive Environmental Response, Compensation and Liability Act (“CERCLA”);
|
|
•
|
The discharge of materials and emissions into the air;
|
|
•
|
The prevention and remediation of soil and groundwater contamination;
|
|
•
|
The management, treatment and discharge of wastewater and storm water;
|
|
•
|
Climate change;
|
|
•
|
The generation, discharge, storage, handling and disposal of hazardous materials and secondary materials; and
|
|
•
|
The protection of our employees’ health and safety.
|
These environmental laws regulate, among other things, the release and discharge of hazardous materials into the air, water and ground; exposure to hazardous materials; and the identification, storage, treatment, handling and disposal of hazardous materials.
Concern over climate change, including the impact of global warming, has led to significant U.S. and international regulatory and legislative initiatives to limit greenhouse gas (“GHG”) emissions. In 2007, the U.S. Supreme Court ruled that the EPA was authorized to regulate carbon dioxide under the U.S. Clean Air Act. The EPA subsequently initiated a series of regulatory efforts aimed at addressing greenhouse gases as pollutants, including finding that GHG emissions endanger public health, implementing mandatory GHG emission reporting requirements, and setting carbon emission standards for light-duty vehicles.
Environmental legislation and regulations have changed rapidly in recent years, and it is likely that we will be subject to even more stringent environmental standards in the future. Legislation has been proposed in the U.S. Congress to address GHG emissions and global climate change, including “cap and trade” programs, and some form of federal climate change legislation or additional federal regulation is possible. A number of states, including states in which we have operations and facilities, have considered, are considering or have already enacted legislation to develop information or address climate change and GHG emissions, including state-level “cap and trade” programs. Currently, we are required to annually report GHG emissions from our steel mill to the State of Oregon Department of Environmental Quality and the EPA.
Although our objective is to maintain compliance with applicable environmental laws and regulations, we have, in the past, been found to be not in compliance with certain environmental laws and regulations and have incurred liabilities, expenditures, fines and penalties associated with such violations. In December 2000, we were notified by the EPA that we are one of the potentially responsible parties that owns or operates, or formerly owned or operated, sites which are part of or adjacent to the Portland Harbor Superfund site. Further, we have been notified that we are or may be a potentially responsible party at sites other than Portland Harbor currently or formerly owned or operated by us or at other sites where we may have responsibility for such costs due to past disposal or other activities. See discussion in Part I, Item 1A. Risk Factors and
Note 8
– Commitments and Contingencies in the Notes to the Consolidated Financial Statements in Part II, Item 8 of this report.
In fiscal
2018
, capital expenditures related to environmental projects were
$20 million
, and we expect to spend in the range of
$20 million
on capital expenditures related to environmental projects in fiscal 2019, excluding additional environmental projects currently under review.
Indirect Consequences of Future Legislation and Regulation
Future legislation or increased regulation regarding climate change and GHG emissions could impose significant costs on our business and our customers and suppliers, including increased energy, capital equipment, emissions controls, environmental monitoring and reporting and other costs in order to comply with laws and regulations concerning and limitations imposed on climate change and GHG emissions. The potential costs of allowances, taxes, fees, offsets or credits that may be part of “cap and trade” programs or similar future legislative or regulatory measures are still uncertain and the future of these programs or measures is unknown. Any adopted future climate change and GHG laws or regulations could negatively impact our ability (and that of our customers and suppliers) to compete with companies situated in areas not subject to or complying with such limitations. Furthermore, even without such laws or regulations, increased awareness and any adverse publicity in the global marketplace about the GHGs emitted by companies in the metals recycling and steel manufacturing industries could harm our reputation and reduce customer demand for our products.
11
/
Schnitzer Steel Industries, Inc. Form 10-K 2018
Table of Contents
SCHNITZER STEEL INDUSTRIES, INC.
GHG legislation and regulation is expected to have an effect on the price of electricity, especially electricity generated using carbon-based fuels. Since the electricity supply for CSS includes a significant element of hydro-generated production, CSS’s energy costs are less likely to be impacted than those of competitors using electricity generated by carbon-based fuels. In addition, demand for scrap metal may increase from mills with blast furnaces as they seek to maximize the scrap metal component of raw material infeed, which requires less energy than melting iron ore.
Since the use of recycled iron and steel instead of iron ore to make new steel results in savings in the consumption of energy, virgin materials and water and reduces mining wastes, we believe our recycled metal products position us to be more competitive in the future for business from companies wishing to reduce their carbon footprint and impact on the environment. In addition, our EAF generates significantly less GHG emissions than traditional blast furnaces.
Physical Impacts of Climate Change on Our Costs and Operations
There has been public discussion that climate change may be associated with rising sea levels as well as extreme weather conditions such as more intense hurricanes, thunderstorms, tornadoes and snow or ice storms. Extreme weather conditions may increase our costs or cause damage to our facilities, and any damage resulting from extreme weather may not be fully insured. As many of our recycling facilities are located near deep water ports, rising sea levels may disrupt our ability to receive scrap metal, process the scrap metal through our shredders and ship products to our customers. Periods of extended adverse weather conditions may inhibit construction activity utilizing our products, scrap metal inflows to our recycling facilities, and retail admissions and parts sales at our auto parts stores.
Employees
As of September 30,
2018
, we had
3,575
full-time employees, consisting of
2,796
employees at AMR,
586
employees at CSS and
193
corporate administrative and shared services employees. Of these employees,
764
were covered by collective bargaining agreements. The Cascade Steel Rolling Mills contract with the United Steelworkers of America, which covers
281
of these employees, was renewed and ratified in April 2016 and will expire on
March 31, 2019
. We believe that in general our labor relations are good.
Available Information
Our Internet website address is
www.schnitzersteel.com
. We make available on our website, free of charge, under the caption “Investors – SEC Filings” our annual report on Form 10-K, quarterly reports on Form 10-Q, current reports on Form 8-K, and amendments to those reports as soon as reasonably practicable after electronically filing with or furnishing such materials to the Securities and Exchange Commission (“SEC”) pursuant to Sections 13(a) or 15(d) of the Securities Exchange Act of 1934. Also available on our website are our definitive Proxy Statements and ownership reports pursuant to Section 16(a) of the Securities Act of 1933. Copies of these filings may also be obtained from the SEC’s website (
www.sec.gov
) or by visiting the Public Reference Room of the SEC at 100 F Street, NE, Washington, D.C. 20549. Information on the operation of the Public Reference Room may be obtained by calling the SEC at 1-800-SEC-0330.
We may use our website as a channel of distribution of material Company information. Financial and other material information regarding our Company is routinely posted on and accessible at
http://www.schnitzersteel.com/investors.aspx
. You may register your e-mail under the caption “Investors – E-mail Alerts” to receive e-mail notifications of new company information.
The content of our website is not incorporated by reference into this Annual Report on Form 10-K.
Described below are risks, which are categorized as “Risk Factors Relating to Our Business,” “Risk Factors Relating to the Regulatory Environment” and “Risk Factors Relating to Our Employees,” that could have a material adverse effect on our results of operations, financial condition and cash flows or could cause actual results to differ materially from the results contemplated by the forward-looking statements contained in this Annual Report. See “Forward-Looking Statements” that precedes Part I of this report. Additional risks and uncertainties that we are unaware of or that we currently deem immaterial may in the future have a material adverse effect on our results of operations, financial condition and cash flows.
Risk Factors Relating to Our Business
Potential costs related to the environmental cleanup of Portland Harbor may be material to our financial position and liquidity
In December 2000, we were notified by the United States Environmental Protection Agency (“EPA”) under the Comprehensive Environmental Response, Compensation and Liability Act (“CERCLA”) that we are one of the potentially responsible parties (“PRPs”) that own or operate or formerly owned or operated sites which are part of or adjacent to the Portland Harbor Superfund site (the “Site”). The precise nature and extent of cleanup of any specific areas within the Site, the parties to be involved, the timing of any specific remedial action and the allocation of the costs for any cleanup among responsible parties have not yet been
12
/
Schnitzer Steel Industries, Inc. Form 10-K 2018
Table of Contents
SCHNITZER STEEL INDUSTRIES, INC.
determined. The process of site investigation, remedy selection, identification of additional PRPs and allocation of costs has been underway for a number of years, but significant uncertainties remain. It is unclear to what extent we will be liable for environmental costs or natural resource damage claims or third party contribution or damage claims with respect to the Site.
While we participated in certain preliminary Site study efforts, we were not party to the consent order entered into by the EPA with certain other PRPs, referred to as the “Lower Willamette Group” (“LWG”), for a remedial investigation/feasibility study (“RI/FS”). During fiscal 2007, we and certain other parties agreed to an interim settlement with the LWG under which we made a cash contribution to the LWG RI/FS. The LWG has indicated that it had incurred over
$115 million
in investigation-related costs over an approximately
10
year period working on the RI/FS. Following submittal of draft RI and FS documents which the EPA largely rejected, the EPA took over the RI/FS process.
We have joined with approximately
100
other PRPs, including the LWG members, in a voluntary process to establish an allocation of costs at the Site, including the costs incurred by the LWG in the RI/FS process. The LWG members have also commenced federal court litigation, which has been stayed, seeking to bring additional parties into the allocation process.
In January 2008, the Portland Harbor Natural Resource Trustee Council (“Trustee Council”) invited us and other PRPs to participate in funding and implementing the Natural Resource Injury Assessment for the Site. Following meetings among the Trustee Council and the PRPs, funding and participation agreements were negotiated under which the participating PRPs, including us, agreed to fund the first phase of the three-phase natural resource damage assessment. Phase 1, which included the development of the Natural Resource Damage Assessment Plan (“AP”) and implementation of several early studies, was substantially completed in 2010. In December 2017, we joined with other participating PRPs in agreeing to fund Phase 2 of the natural resource damage assessment, which includes the implementation of the AP to develop information sufficient to facilitate early settlements between the Trustee Council and Phase 2 participants and the identification of restoration projects to be funded by the settlements. In late May 2018, the Trustee Council published notice of its intent to proceed with Phase 3, which will involve the full implementation of the AP and the final injury and damage determination. We are proceeding with the process established by the Trustee Council regarding early settlements under Phase 2. It is uncertain whether we will enter into an early settlement for natural resource damages or what costs we may incur in any such early settlement.
On January 30, 2017, one of the Trustees, the Confederated Tribes and Bands of the Yakama Nation, which withdrew from the council in 2009, filed a suit against approximately
30
parties, including us, seeking reimbursement of certain past and future response costs in connection with remedial action at the Site and recovery of assessment costs related to natural resources damages from releases at and from the Site to the Multnomah Channel and the Lower Columbia River. We intend to defend against such claims and do not have sufficient information to determine the likelihood of a loss in this matter or to estimate the amount of damages being sought or the amount of such damages that could be allocated to us.
Estimates of the cost of remedial action for the cleanup of the in-river portion of the Site have varied widely in various drafts of the FS and in the EPA’s final FS issued in June 2016 ranging from approximately
$170 million
to over
$2.5 billion
(net present value), depending on the remedial alternative and a number of other factors. In comments submitted to the EPA, we and certain other stakeholders identified a number of serious concerns regarding the EPA’s risk and remedial alternatives assessments, cost estimates, scheduling assumptions and conclusions regarding the feasibility and effectiveness of remediation technologies.
In January 2017, the EPA issued a Record of Decision (“ROD”) that identified the selected remedy for the Site. The selected remedy is a modified version of one of the alternative remedies evaluated in the EPA’s FS that was expanded to include additional work at a greater cost. The EPA has estimated the total cost of the selected remedy at
$1.7 billion
with a net present value cost of
$1.05 billion
(at a
7%
discount rate) and an estimated construction period of
13
years following completion of the remedial designs. In the ROD, the EPA stated that the cost estimate is an order-of-magnitude engineering estimate that is expected to be within +
50%
to -
30%
of the actual project cost and that changes in the cost elements are likely to occur as a result of new information and data collected during the engineering design. We have identified a number of concerns regarding the remedy described in the ROD, which is based on data that is more than a decade old, and the EPA’s estimates for the costs and time required to implement the selected remedy. Because of ongoing questions regarding cost effectiveness, technical feasibility, and the use of stale data, it is uncertain whether the ROD will be implemented as issued. In addition, the ROD did not determine or allocate the responsibility for remediation costs among the PRPs.
In the ROD, the EPA acknowledged that much of the data used in preparing the ROD was more than a decade old and would need to be updated with a new round of “baseline” sampling to be conducted prior to the remedial design phase. Accordingly, the ROD provided for additional pre-remedial design investigative work and baseline sampling to be conducted in order to provide a baseline of current conditions and delineate particular remedial actions for specific areas within the Site. This additional sampling needs to occur prior to proceeding with the next phase in the process which is the remedial design. The remedial design phase is an engineering phase during which additional technical information and data will be collected, identified and incorporated into technical drawings and specifications developed for the subsequent remedial action. Moreover, the ROD provided only Site-wide
13
/
Schnitzer Steel Industries, Inc. Form 10-K 2018
Table of Contents
SCHNITZER STEEL INDUSTRIES, INC.
cost estimates and did not provide sufficient detail to estimate costs for specific sediment management areas within the Site. Following issuance of the ROD, EPA proposed that the PRPs, or a subgroup of PRPs, perform the additional investigative work identified in the ROD under a new consent order.
In December 2017, we and
three
other PRPs entered into a new Administrative Settlement Agreement and Order on Consent with EPA to perform such pre-remedial design investigation and baseline sampling over a two-year period. We estimate that our share of the costs of performing such work will be approximately
$2 million
, which we recorded to environmental liabilities and selling, general and administrative expense in the consolidated financial statements in fiscal 2018. We believe that such costs will be fully covered by existing insurance coverage and, thus, also recorded an insurance receivable for
$2 million
in fiscal 2018, resulting in no net impact to our consolidated results of operations.
Except for certain early action projects in which we are not involved, remediation activities are not expected to commence for a number of years. In addition, as discussed above, responsibility for implementing and funding the remedy will be determined in a separate allocation process. We do not expect the next major stage of the allocation process to proceed until after the additional pre-remedial design data is collected.
Because there has not been a determination of the specific remediation actions that will be required, the amount of natural resource damages or the allocation of costs of the investigations and any remedy and natural resource damages among the PRPs, we believe it is not possible to reasonably estimate the amount or range of costs which we are likely to or which it is reasonably possible that we will incur in connection with the Site, although such costs could be material to our financial position, results of operations, cash flows and liquidity. Among the facts currently being developed are detailed information on the history of ownership of and the nature of the uses of and activities and operations performed on each property within the Site, which are factors that will play a substantial role in determining the allocation of investigation and remedy costs among the PRPs. We have insurance policies that we believe will provide reimbursement for costs we incur for defense (including the pre-remedial design investigative activities), remediation and mitigation for natural resource damages claims in connection with the Site, although there is no assurance that those policies will cover all of the costs which we may incur. Significant cash outflows in the future related to the Site could reduce the amount of our borrowing capacity that could otherwise be used for investment in capital expenditures, dividends, share repurchases and acquisitions. Any material liabilities incurred in the future related to the Site could result in our failure to maintain compliance with certain covenants in our debt agreements. See “Contingencies – Environmental” in
Note 8
– Commitments and Contingencies in the Notes to the Consolidated Financial Statements in Part II, Item 8 of this report.
We operate in industries that are cyclical and sensitive to general economic conditions, which could have a material adverse effect on our operating results, financial condition and cash flows
Demand for most of our products is cyclical in nature and sensitive to general economic conditions. The timing and magnitude of the cycles in the industries in which our products are used, including global steel manufacturing and residential construction in the U.S., are difficult to predict. The cyclical nature of our operations tends to reflect and be amplified by changes in economic conditions, both domestically and internationally, and foreign currency exchange fluctuations. Economic downturns or a prolonged period of slow growth in the U.S. and foreign markets or any of the industries in which we operate could have a material adverse effect on our results of operations, financial condition and cash flows.
Changing conditions in global markets including the impact of tariffs, quotas and other trade actions may adversely affect our business, financial position and results of operations
We generate a substantial portion of our revenues from sales to customers located outside the U.S., including countries in Asia, the Mediterranean region and North, Central and South America. In each of the last three years, exports comprised approximately 70 percent of AMR’s ferrous sales volumes and 60 percent of AMR’s nonferrous sales volumes. Further, in certain recent years, total sales to customers in each of China and Turkey exceeded 10 percent of our consolidated revenues in that year. Our ability to sell our products profitably, or at all, into international markets is subject to a number of risks including adverse impacts of political, economic, military, terrorist or major pandemic events; labor and social issues; legal and regulatory requirements or limitations imposed by foreign governments including quotas, tariffs or other protectionist trade barriers, adverse tax law changes, nationalization, currency restrictions, or import restrictions for certain types of products we export; and disruptions or delays in shipments caused by customs compliance or other actions of government agencies. The occurrence of such events and conditions may adversely affect our business, financial position and results of operations.
For example, in fiscal 2017, regulators in China began implementing the National Sword initiative involving inspections of Chinese industrial enterprises, including recyclers, in order to identify rules violations with respect to discharge of pollutants or illegally transferred scrap imports. Restrictions resulting from the National Sword initiative include a ban on certain imported recycled products, lower contamination limits for permitted recycled materials, and more comprehensive pre- and post-shipment inspection requirements. Recent disruptions in pre-inspection certifications and stringent inspection procedures at certain Chinese destination ports have limited access to these destinations and resulted in the renegotiation or cancellation of certain nonferrous customer contracts in connection with the redirection of such shipments to alternate destinations. Based on the most current information
14
/
Schnitzer Steel Industries, Inc. Form 10-K 2018
Table of Contents
SCHNITZER STEEL INDUSTRIES, INC.
available, we believe that the potential impact on our recycling operations could include requirements that would necessitate additional processing of certain nonferrous recycled scrap metal products as well as increased inspection and certification activities with respect to exports to China, or a change in the use of our sales channels in the event of an outright ban on certain or all of our recycled metals products by China. As regulatory developments progress, we may need to make further investments in nonferrous processing equipment where economically justified, incur additional costs in order to comply with new inspection requirements, or seek alternative markets for the impacted products, which may result in lower sales prices or higher costs and may adversely impact our business or results of operations.
In March 2018, the U.S. imposed a 25 percent tariff on certain imported steel products and a 10 percent tariff on certain imported aluminum products under Section 232 of the Trade Expansion Act of 1962. These new tariffs, along with other U.S. trade actions, have triggered retaliatory actions by certain affected countries, and other foreign governments have initiated or are considering imposing trade measures on other U.S. goods. For example, China has imposed a series of retaliatory tariffs on certain U.S. products, including a 25 percent tariff on all grades of U.S. scrap and an additional 25 percent tariff on U.S. aluminum scrap. These tariffs and other trade actions could result in a decrease in international steel demand and negatively impact demand for our products, which would adversely impact our business. Given the uncertainty regarding the scope and duration of these trade actions by the U.S. or other countries, the impact of the trade actions on our operations or results remains uncertain.
Changes in the availability or price of inputs such as raw materials and end-of-life vehicles could reduce our sales
Our businesses require certain materials that are sourced from third-party suppliers. Although the synergies from our integrated operations allow us to be our own source for some raw materials, particularly with respect to scrap metal for our steel manufacturing operations, we rely on other suppliers for most of our raw material and other input needs, including inputs to steel production such as graphite electrodes and other required consumables. Industry supply conditions generally involve risks, including the possibility of shortages of raw materials, increases in raw material and other input costs, and reduced control over delivery schedules. We procure our scrap inventory from numerous sources. These suppliers generally are not bound by long-term contracts and have no obligation to sell scrap metal to us. In periods of declining or lower scrap metal prices, such as the declining price environment we experienced in fiscal 2015 and the first half of fiscal 2016, suppliers may elect to hold scrap metal to wait for higher prices or intentionally slow their metal collection activities, tightening supply. If a substantial number of suppliers cease selling scrap metal to us, we will be unable to recycle metal at desired levels, and our results of operations and financial condition could be materially adversely affected. A slowdown of industrial production in the U.S. may also reduce the supply of industrial grades of metal to the metals recycling industry, resulting in less recyclable metal available to process and market. Increased competition for domestic scrap metal, including as a result of overcapacity in the scrap recycling industry in the U.S. and Canada, may also reduce the supply of scrap metal available to us. Failure to obtain a steady supply of scrap material could both adversely impact our ability to meet sales commitments and reduce our operating margins. Failure to obtain an adequate supply of end-of-life vehicles could adversely impact our ability to attract customers and charge admission fees and reduce our parts sales. Failure to obtain raw materials and other inputs to steel production such as alloys, graphite electrodes and other required consumables, could adversely impact our ability to make steel to the specifications of our customers.
Significant decreases in scrap metal prices may adversely impact our operating results
The timing and magnitude of the cycles in the industries in which we operate are difficult to predict and are influenced by different economic conditions in the domestic market, where we typically acquire our raw materials, and foreign markets, where we typically sell the majority of our products. Purchase prices for scrap metal including end-of-life vehicles and selling prices for recycled scrap metal are subject to market forces beyond our control. For instance, in fiscal 2015 and in the first half of fiscal 2016, scrap metal prices experienced a significant downward trend caused primarily by the weak macroeconomic conditions and global steel-making overcapacity, which was further exacerbated by the impact of lower iron ore prices, a raw material used in steel-making in blast furnaces which compete with EAF steel-making production that uses ferrous scrap as its primary feedstock. While we attempt to respond to changing recycled scrap metal selling prices through adjustments to our metal purchase prices, our ability to do so is limited by competitive and other market factors. As a result, we may not be able to reduce our metal purchase prices to fully offset a sharp reduction in recycled scrap metal sales prices, which may adversely impact our operating income and cash flows. In fiscal 2015 and the first half of fiscal 2016, lower demand for recycled scrap metal relative to demand and competition for supply of unprocessed scrap metal in the domestic market compressed operating margins due to selling prices decreasing at a faster rate than purchase prices for unprocessed scrap metal. In addition, a rapid decrease in selling prices may compress our operating margins due to the impact of average inventory cost accounting, which causes cost of goods sold recognized in the Consolidated Statements of Operations to decrease at a slower rate than metal purchase prices and net selling prices.
15
/
Schnitzer Steel Industries, Inc. Form 10-K 2018
Table of Contents
SCHNITZER STEEL INDUSTRIES, INC.
Imbalances in supply and demand conditions in the global steel industry may reduce demand for our products
Economic expansions and contractions in global economies can result in supply and demand imbalances in the global steel industry that can significantly affect the price of commodities used and sold by our business, as well as the price of and demand for finished steel products. In a number of foreign countries, such as China, steel producers are generally government-owned and may therefore make production decisions based on political or other factors that do not reflect free market conditions. In recent years, overcapacity and excess steel production in these foreign countries resulted in the export of aggressively priced semi-finished and finished steel products. This led to disruptions in steel-making operations within other countries, negatively impacting demand for our recycled scrap metal products used by EAF mills globally as their primary feedstock. Further, the import of foreign steel products into the U.S. at similarly aggressive prices have in the past adversely impacted finished steel sales prices and sales volumes at CSS. Existing or new trade laws and regulations may cause or be inadequate to prevent disadvantageous trade practices, which could have a material adverse effect on our financial condition and results of operations. Although trade regulations restrict or impose duties on the importation of certain products, if foreign steel production significantly exceeds consumption in those countries, global demand for our recycled scrap metal products could decline and imports of steel products into the U.S. could increase, resulting in lower volumes and selling prices for our recycled metal products and finished steel products.
Goodwill impairment charges may adversely affect our operating results
Goodwill represents the excess purchase price over the net amount of identifiable assets acquired and liabilities assumed in a business combination measured at fair value. We have a substantial amount of goodwill on our balance sheet, almost all of which was carried by a single reporting unit within AMR as of August 31, 2018. We test the goodwill balances allocated to our reporting units for impairment on an annual basis and when events occur or circumstances change that indicate that the fair value of one or more of our reporting units may be below its carrying amount. When testing goodwill for impairment, we may be required to measure the fair value of the reporting units in order to determine the amount of impairment, if any. Fair value determinations require considerable judgment and are sensitive to inherent uncertainties and changes in estimates and assumptions regarding revenue growth rates, operating margins, capital expenditures, working capital requirements, tax rates, terminal growth rates, discount rates, benefits associated with a taxable transaction and synergistic benefits available to market participants. Declines in market conditions, a trend of weaker than anticipated financial performance for one of our reporting units with allocated goodwill, a decline in our share price for a sustained period of time, or an increase in the market-based weighted average cost of capital, among other factors, are indicators that the carrying value of our goodwill may not be recoverable. We may be required to record a goodwill impairment charge that, if incurred, could have a material adverse effect on our financial condition and results of operations. For example, in the second quarter of fiscal 2015, management identified a triggering event requiring an interim impairment test of goodwill, which resulted in impairment of a reporting unit's goodwill totaling $141 million, and in the second quarter of fiscal 2016, management identified a triggering event requiring an interim impairment test of goodwill, which resulted in impairment of a different reporting unit’s goodwill totaling $9 million.
Impairment of long-lived assets and cost and equity method investments may adversely affect our operating results
Our long-lived asset groups are subject to an impairment assessment when certain triggering events or circumstances indicate that their carrying value may be impaired. If the carrying value exceeds our estimate of future undiscounted cash flows of the operations related to the asset group, an impairment is recorded for the difference between the carrying amount and the fair value of the asset group. The results of these tests for potential impairment may be adversely affected by unfavorable market conditions, our financial performance trends, or an increase in interest rates, among other factors. If as a result of the impairment test we determine that the fair value of any of our long-lived asset groups is less than its carrying amount, we may incur an impairment charge that could have a material adverse effect on our financial condition and results of operations. We recorded impairment charges on long-lived tangible and intangible assets associated with certain regional metals recycling operations and used auto parts store locations in the amount of $8 million and $44 million during fiscal 2016 and 2015, respectively. With respect to our investments in unconsolidated entities accounted for under the cost and equity methods, a loss in value of an investment that is other than a temporary decline is recognized. Once we determine that an other-than-temporary impairment exists, we may incur an impairment charge that could have a material adverse effect on our results of operations. We recorded impairment charges of $1 million and $2 million during fiscal 2017 and 2016, respectively, related to investments in joint ventures accounted for under the equity method. See Note 2 - Summary of Significant Accounting Policies in the Notes to the Consolidated Financial Statements in Part II, Item 8 of this report for further detail on long-lived asset and joint venture investment impairment charges.
Inability to sustain the benefits from productivity and restructuring initiatives may adversely impact our operating results
We have undertaken a number of productivity improvement and restructuring initiatives designed to reduce operating expenses and improve profitability and to achieve further integration and synergistic cost efficiencies in our operating platform. These initiatives included idling underutilized assets and closing facilities to more closely align our business to market conditions, implementing productivity initiatives to increase production efficiency and material recovery, and further reducing our annual operating expenses through headcount reductions, reducing organizational layers, consolidating shared service functions, savings from procurement activities, streamlining of administrative and supporting services functions, and other non-headcount measures.
16
/
Schnitzer Steel Industries, Inc. Form 10-K 2018
Table of Contents
SCHNITZER STEEL INDUSTRIES, INC.
We incurred restructuring charges and other exit-related activities in fiscal 2018, 2017 and 2016 as a result of these initiatives. Failure to sustain the expected cost reductions and other benefits related to these productivity and restructuring initiatives could have a material adverse effect on our results of operations and cash flows.
Acquisitions and integration of acquired businesses may result in operating difficulties and other unintended consequences
We may make acquisitions of complementary businesses to enable us to enhance our customer base and grow our revenues. Execution of any past or potential future acquisition involves a number of risks, including:
|
•
|
Difficulty integrating the acquired businesses’ personnel and operations;
|
|
•
|
Potential loss of key employees or customers of the acquired business;
|
|
•
|
Difficulties in realizing anticipated cost savings, efficiencies and synergies;
|
|
•
|
Unexpected costs;
|
|
•
|
Inaccurate assessment of or undisclosed liabilities;
|
|
•
|
Inability to maintain uniform standards, controls and procedures; and
|
|
•
|
Difficulty in managing growth.
|
If we do not successfully execute on acquisitions and the acquired businesses do not perform as projected, our financial condition and results of operations could be materially adversely affected.
Changing economic conditions may result in customers not fulfilling their contractual obligations
We enter into export ferrous sales contracts preceded by negotiations that include fixing price, quantity, shipping terms and other contractual terms. Upon finalization of these terms and satisfactory completion of other contractual contingencies, the customer typically opens a letter of credit to satisfy its payment obligation under the contract prior to our shipment of the cargo. Although not considered normal course of business, in times of changing economic conditions, including during periods of sharply falling scrap metal prices such as those experienced in fiscal 2015 and the first half of fiscal 2016, there is an increased risk that customers may not be willing or able to fulfill their contractual obligations or open letters of credit. For example, in fiscal 2015, the resale or modification of the terms, each at significantly lower prices, of certain previously contracted bulk shipments had a $7 million negative impact on our operating results. As of
August 31, 2018 and 2017
,
33%
of our trade accounts receivable balance were covered by letters of credit.
Increases in the value of the U.S. dollar relative to other currencies may reduce the demand for our products
A significant portion of our recycled scrap metal revenues is generated from sales to foreign customers, which are denominated in U.S. dollars, including customers located in Asia, Africa and Europe. A strengthening U.S. dollar, as experienced during recent years including fiscal 2018, makes our products more expensive for non-U.S. customers, which may negatively impact export sales. A strengthening U.S. dollar also makes imported metal products less expensive, which may result in an increase in imports of steel products into the U.S. As a result, our finished steel products, which are made in the U.S., may become more expensive for our U.S. customers relative to imported steel products thereby reducing demand for our products.
We are exposed to translation and transaction risks associated with fluctuations in foreign currency exchange rates Hedging instruments may not be effective in mitigating such risks and may expose us to losses or limit our potential gains
Our operations in Canada expose us to translation and transaction risks associated with fluctuations in foreign currency exchange rates as compared to the U.S. dollar, our reporting currency. As a result, we are subject to foreign currency exchange risks due to exchange rate movements in connection with the translation of the operating costs and the assets and liabilities of our foreign operations into our functional currency for inclusion in our Consolidated Financial Statements.
We are also exposed to foreign currency exchange transaction risk. As part of our risk management program, we may use financial instruments, including foreign currency exchange forward contracts. While intended to reduce the effects of fluctuations in foreign currency exchange rates, these instruments may not be effective in reducing all risks related to such fluctuations and may limit our potential gains or expose us to losses. Although we do not enter into these instruments for trading purposes or speculation, and we believe all such instruments are entered into as hedges of underlying physical transactions, these instruments are dependent on timely performance by our counterparties. Should our counterparties to such instruments or the sponsors of the exchanges through which these transactions are offered fail to honor their obligations due to financial distress or otherwise, we would be exposed to potential losses or the inability to recover anticipated gains from the transactions covered by these instruments.
Potential limitations on our ability to access capital resources may restrict our ability to operate
Our operations are capital intensive. Our business also requires substantial expenditures for routine maintenance. While we expect that our cash requirements, including the funding of capital expenditures, debt service, dividends, share repurchases and investments, will be financed by internally generated funds or from borrowings under our secured committed bank credit facilities,
17
/
Schnitzer Steel Industries, Inc. Form 10-K 2018
Table of Contents
SCHNITZER STEEL INDUSTRIES, INC.
there can be no assurance that this will be the case. Additional acquisitions could require financing from external sources. Although we believe we have adequate access to contractually committed borrowings, we could be adversely affected if our banks were unable to honor their contractual commitments or ceased lending. Failure to access our credit facilities could restrict our ability to fund operations, make capital expenditures or execute acquisitions.
The agreement governing our bank credit facilities imposes certain restrictions on our business and contains financial covenants
Our secured bank credit facilities contain certain restrictions on our business which limit (subject to certain exceptions) our ability to, among other things, incur or suffer to exist certain liens, make investments, incur or guaranty additional indebtedness, enter into consolidations, mergers, acquisitions, and sales of assets, make distributions and other restricted payments, change the nature of our business, engage in transactions with affiliates and enter into restrictive agreements, including agreements that restrict the ability of our subsidiaries to make distributions. These restrictions may affect our ability to operate our business or execute our strategy and may limit our ability to take advantage of potential business opportunities as they arise. Our bank credit agreement also requires that we maintain certain financial and other covenants, including a consolidated fixed charge coverage ratio and a consolidated leverage ratio. Our ability to comply with these covenants may be affected by events beyond our control, including prevailing economic, financial and industry conditions. Our failure to comply with any of these restrictions or financial covenants could result in an event of default under the bank credit agreement, and permit our lenders to cease lending to us and declare all amounts borrowed from them to be due and payable, together with accrued and unpaid interest. This could require us to refinance our bank facilities, which we may not be able to do at terms acceptable to us, or at all.
Consolidation in the steel industry may reduce demand for our products
There has been a significant amount of consolidation in the steel industry in recent years that has included steel mills acquiring steel fabricators to ensure demand for their products. If any of our steel mill’s significant remaining customers were to be acquired by competing steel mills, this could reduce the demand for our products and force us to lower our prices, reducing our revenues, or to reduce production, which could increase our unit costs and have a material adverse effect on our financial condition and results of operations.
Failure to realize expected benefits from investments in processing and manufacturing technology may impact our operating results and cash flows
We make significant investments in processing and manufacturing technology improvements aimed at increasing the efficiency and capabilities of our businesses and to maximize our economies of scale. Failure to realize the anticipated benefits and generate adequate returns on such capital improvement projects may have a material adverse effect on our results of operations and cash flows.
Reliance on third party shipping companies may restrict our ability to ship our products
We generally rely on third parties to handle and transport raw materials to our production facilities and products to customers. Despite our practice of utilizing a diversified group of suppliers of transportation, factors beyond our control, including changes in fuel prices, political events, governmental regulation of transportation, changes in market rates, carrier availability, carrier bankruptcy, shipping industry consolidation and disruptions in transportation infrastructure, may adversely impact our ability to ship our products. These impacts could include delays or other disruptions in shipments in transit or third party shipping companies increasing their charges for transportation services or otherwise reducing or eliminating the availability of their vehicles or ships. As a result, we may not be able to transport our products in a timely and cost-effective manner, which could have a material adverse effect on our financial condition and results of operations and may harm our reputation.
Equipment upgrades, equipment failures and facility damage may lead to production curtailments or shutdowns
Our recycling and manufacturing processes depend on critical pieces of equipment, including shredders, nonferrous sorting technology, furnaces and a rolling mill, which may be out of service occasionally for scheduled upgrades or maintenance or as a result of unanticipated failures. Our facilities are subject to equipment failures and the risk of catastrophic loss due to unanticipated events such as fires, earthquakes, accidents or violent weather conditions. For instance, our metals recycling operations in Puerto Rico were briefly interrupted in September 2017 as a result of Hurricane Maria, although the damages to and losses incurred by the operations were not material. We have insurance to cover certain of the risks associated with equipment damage and resulting business interruption, but there are certain events that would not be covered by insurance and there can be no assurance that insurance will continue to be available on acceptable terms. Interruptions in our processing and production capabilities and shutdowns resulting from unanticipated events could have a material adverse effect on our financial condition, results of operations and cash flows.
18
/
Schnitzer Steel Industries, Inc. Form 10-K 2018
Table of Contents
SCHNITZER STEEL INDUSTRIES, INC.
Product liability claims may adversely impact our operating results
We could inadvertently acquire radioactive scrap metal that could potentially be included in mixed scrap metal shipped to consumers worldwide. Although we have invested in radiation detection equipment in the majority of our locations, including the facilities from which we ship directly to customers, failure to detect radioactive scrap metal remains a possibility. Even though we maintain insurance to address the risk of this failure in detection, there can be no assurance that the insurance coverage would be adequate or will continue to be available on acceptable terms. In addition, if we fail to meet contractual requirements for a product, we may be subject to product warranty costs and claims. These costs and claims could both have a material adverse effect on our financial condition and results of operations and harm our reputation.
We are subject to legal proceedings and legal compliance risks that may adversely impact our financial condition, results of operations and liquidity
We spend substantial resources ensuring that we comply with domestic and foreign regulations, contractual obligations and other legal standards. Notwithstanding this, we are subject to a variety of legal proceedings and compliance risks in respect of various matters, including regulatory, safety, environmental, employment, transportation, intellectual property, contractual, import/export, international trade and governmental matters that arise in the course of our business and in our industry. For example, legal proceedings can include those arising from accidents involving Company-owned vehicles, including Company tractor trailers. In some instances, such accidents and the related litigation involve accidents that have resulted in third party fatalities. An outcome in an unusual or significant legal proceeding or compliance investigation in excess of insurance recoveries could adversely affect our financial condition and results of operations. For information regarding our current significant legal proceedings, see “Legal Proceedings” in Part I, Item 3 of this report.
Climate change may adversely impact our facilities and our ongoing operations
The potential physical impacts of climate change on our operations are highly uncertain and depend upon the unique geographic and environmental factors present, for example rising sea levels at our deep water port facilities, changing storm patterns and intensities, and changing temperature levels. As many of our recycling facilities are located near deep water ports, rising sea levels may disrupt our ability to receive scrap metal, process the scrap metal through our shredders and ship products to our customers. Periods of extended adverse weather conditions may inhibit construction activity utilizing our products, scrap metal inflows to our recycling facilities, and retail admissions and parts sales at our auto parts stores.
We may not realize our deferred tax assets in the future
The assessment of recoverability of our deferred tax assets is based on an evaluation of existing positive and negative evidence as to whether it is more likely than not that they will be realized. If negative evidence outweighs positive evidence, a valuation allowance is required. Impairment of deferred tax assets may result from significant negative industry or economic trends, a decrease in earnings performance and projections of future taxable income, adverse changes in laws or regulations, and a variety of other factors. Impairment of deferred tax assets could have a material adverse impact on our results of operations and financial condition and could result in not realizing the deferred tax assets. In recent years, we have recorded significant valuation allowances against our deferred tax assets, and our low annual effective tax rates in the fiscal years presented in this report are primarily the result of our full valuation allowance positions. Deferred tax assets may require further valuation allowances if it is not more likely than not that the deferred tax assets will be realized.
In fiscal 2018, we released valuation allowances against certain U.S., Canadian and state deferred tax assets resulting in recognition of discrete tax benefits. The release of the valuation allowances was the result of sufficient positive evidence, including cumulative income in recent years and projections of future taxable income from operations, that it is more likely than not that the deferred tax assets will be realized. In the event that actual results differ from our projections or we adjust our estimates in future periods, we may need to establish a valuation allowance, which could materially impact our financial position and results of operations.
Tax increases and changes in tax rules may adversely affect our financial results
As a company conducting business on a global basis with physical operations throughout North America, we are exposed, both directly and indirectly, to the effects of changes in U.S., state, local and foreign tax rules. Taxes for financial reporting purposes and cash tax liabilities in the future may be adversely affected by changes in such tax rules. In many cases, such changes put us at a competitive disadvantage compared to some of our major competitors, to the extent we are unable to pass the tax costs through to our customers.
On December 22, 2017, the President of the United States signed and enacted into law comprehensive tax legislation commonly referred to as the Tax Cuts and Jobs Act (“Tax Act”). Known and certain estimated effects based upon current interpretation of the Tax Act have been incorporated into our financial results beginning in the second quarter of fiscal 2018. As additional clarification and implementation guidance is issued on the Tax Act, it may be necessary to adjust the provisional amounts. Adjustments to provisional amounts could be material to our results of operations and cash flows. In addition, there is a risk that
19
/
Schnitzer Steel Industries, Inc. Form 10-K 2018
Table of Contents
SCHNITZER STEEL INDUSTRIES, INC.
states or foreign jurisdictions may amend their tax laws in response to the Tax Act, which could have a material impact on our future results of operations and cash flows.
One or more cybersecurity incidents may adversely impact our financial condition, results of operations and reputation
Our operations involve the use of multiple systems that process, store and transmit sensitive information about our customers, suppliers, employees, financial position, operating results and strategies. We face global cybersecurity risks and threats on a continual and ongoing basis, which include, but are not limited to, attempts to access systems and information, computer viruses, or denial-of-service attacks. These risks and threats range from uncoordinated individual attempts to sophisticated and targeted measures. While we are not aware of any material cyber-attacks or breaches of our systems to date, we have and continue to implement measures to safeguard our systems and information and mitigate potential risks, including employee training around phishing, malware and other cyber risks, but there is no assurance that such actions will be sufficient to prevent cyber-attacks or security breaches that manipulate or improperly use our systems, compromise sensitive information, destroy or corrupt data, or otherwise disrupt our operations. The occurrence of such events, including breaches of our security measures or those of our third-party service providers, could negatively impact our reputation and our competitive position and could result in litigation with third parties, regulatory action, loss of business due to disruption of operations and/or reputational damage, potential liability and increased remediation and protection costs, any of which could have a material adverse effect on our financial condition and results of operations. Additionally, as cybersecurity risks become more sophisticated, we may need to increase our investments in security measures which could have a material adverse effect on our financial condition and results of operations.
Risk Factors Relating to the Regulatory Environment
Environmental compliance costs and potential environmental liabilities may have a material adverse effect on our financial condition and results of operations
Compliance with environmental laws and regulations is a significant factor in our business. We are subject to local, state and federal environmental laws and regulations in the U.S. and other countries relating to, among other matters:
|
•
|
Waste disposal;
|
|
•
|
Air emissions;
|
|
•
|
Waste water and storm water management, treatment and discharge;
|
|
•
|
The use and treatment of groundwater;
|
|
•
|
Soil and groundwater contamination remediation;
|
|
•
|
Climate change;
|
|
•
|
Generation, discharge, storage, handling and disposal of hazardous materials and secondary materials; and
|
|
•
|
Employee health and safety.
|
We are also required to obtain environmental permits from governmental authorities for certain operations. Violation of or failure to obtain permits or comply with these laws or regulations could result in our business being fined or otherwise sanctioned by regulators or becoming subject to litigation by private parties. In recent years, capital expenditures for environmental projects have increased and have represented a significant share of our total capital expenditures. Future environmental compliance costs, including capital expenditures for environmental projects, may increase because of new laws and regulations, changing interpretations and stricter enforcement of current laws and regulations by regulatory authorities, uncertainty regarding adequate pollution control levels, the future costs of pollution control technology and issues related to climate change.
Our operations use, handle and generate hazardous substances. In addition, previous operations by others at facilities that we currently or formerly owned, operated or otherwise used may have caused contamination from hazardous substances. As a result, we are exposed to possible claims, including government fines and penalties, costs for investigation and clean-up activities, claims for natural resources damages and claims by third parties for personal injury and property damage, under environmental laws and regulations, especially for the remediation of waterways and soil or groundwater contamination. These laws can impose liability for the cleanup of hazardous substances even if the owner or operator was neither aware of nor responsible for the release of the hazardous substances. We have, in the past, been found not to be in compliance with certain of these laws and regulations, and have incurred liabilities, expenditures, fines and penalties associated with such violations. In addition, we have been notified that we are or may be a potentially responsible party for actual or possible investigation and cleanup costs from historical contamination at sites currently or formerly owned or operated by us or at other sites where we may have responsibility for such costs due to past disposal or other activities. Environmental compliance costs and potential environmental liabilities could have a material adverse effect on our financial condition, results of operations and cash flows. See also the risk factor “Potential costs related to the environmental cleanup of Portland Harbor may be material to our financial position and liquidity” in this Item 1A.
20
/
Schnitzer Steel Industries, Inc. Form 10-K 2018
Table of Contents
SCHNITZER STEEL INDUSTRIES, INC.
Governmental agencies may refuse to grant or renew our licenses and permits, and we may be unable to renew facility leases, thus restricting our ability to operate
We conduct certain of our operations subject to licenses, permits and approvals from state and local governments. Governmental agencies often resist the establishment of certain types of facilities in their communities, including auto parts facilities. In addition, from time to time, both the U.S. and foreign governments impose regulations and restrictions on trade in the markets in which we operate. In some countries, governments require us to apply for certificates or registration before allowing shipment of recycled metal to customers in those countries. There can be no assurance that future approvals, licenses and permits will be granted or that we will be able to maintain and renew the approvals, licenses and permits we currently hold. Failure to obtain these approvals could cause us to limit or discontinue operations in these locations or prevent us from developing or acquiring new facilities, which could have a material adverse effect on our financial condition and results of operations.
We lease a significant portion of our facilities, including the substantial majority of our auto parts facilities. Failure to renew these leases may impact our ability to continue operations within certain geographic areas, which could have a material adverse effect on our financial condition, results of operations and cash flows.
Compliance with existing and future climate change and greenhouse gas emission laws and regulations may adversely impact our operating results
Future legislation or increased regulation regarding climate change and GHG emissions could impose significant costs on our business and our customers and suppliers, including increased energy, capital equipment, emissions controls, environmental monitoring and reporting and other costs in order to comply with laws and regulations concerning and limitations imposed on climate change and GHG emissions. The potential costs of allowances, taxes, fees, offsets or credits that may be part of “cap and trade” programs or similar future legislative or regulatory measures are still uncertain and the future of these programs or measures is unknown. Any adopted future climate change and GHG laws or regulations could negatively impact our ability (and that of our customers and suppliers) to compete with companies situated in areas not subject to such limitations. Until the timing, scope and extent of any future laws or regulations becomes known, we cannot predict the effect on our financial condition, operating performance or ability to compete. Furthermore, even without such laws or regulations, increased awareness and any adverse publicity in the global marketplace about the GHGs emitted by companies in the metals recycling and steel manufacturing industries could harm our reputation and reduce customer demand for our products. See “Business - Environmental Matters” in Part I, Item 1 of this report for further detail.
Risk Factors Relating to Our Employees
Reliance on employees subject to collective bargaining may restrict our ability to operate
Approximately
21%
of our full-time employees are represented by unions under collective bargaining agreements, including substantially all of the manufacturing employees at our CSS steel manufacturing facility. As these agreements expire, we may not be able to negotiate extensions or replacements of such agreements on acceptable terms. Any failure to reach an agreement with one or more of our unions may result in strikes, lockouts or other labor actions, including work slowdowns or stoppages, which could have a material adverse effect on our results of operations.
The underfunded status of our multiemployer pension plans may cause us to increase our contributions to the plans
As discussed in
Note 11
– Employee Benefits in the Notes to the Consolidated Financial Statements in Part II, Item 8 of this report, we contribute to the Steelworkers Western Independent Shops Pension Plan (“WISPP”), a multiemployer plan benefiting union employees of our steel mill. Because we have no current intention of withdrawing from the WISPP, we have not recognized a withdrawal liability in our consolidated financial statements. However, if such a liability were triggered, it could have a material adverse effect on our results of operations, financial position, liquidity and cash flows. Our contributions to the WISPP could also increase as a result of a diminished contribution base due to the insolvency or withdrawal of other employers who currently contribute to it, the inability or failure of withdrawing employers to pay their withdrawal liabilities, or other funding deficiencies, as we would need to fund the retirement obligations of these employers.
In 2004, the Internal Revenue Service (“IRS”) approved a seven-year extension of the period over which the WISPP may amortize unfunded liabilities, conditioned upon maintenance of certain minimum funding levels. In 2014, the WISPP obtained relief from the specified funding requirements from the IRS, which requires that the WISPP meet a minimum funded percentage on each valuation date and achieve a funded percentage of 100% as of October 1, 2029. Based on the most recent actuarial valuation for the WISPP, the funded percentage using the valuation method prescribed by the IRS satisfied the minimum funded percentage requirement.
None.
21
/
Schnitzer Steel Industries, Inc. Form 10-K 2018
Table of Contents
SCHNITZER STEEL INDUSTRIES, INC.
Our facilities and administrative offices by type, including their total acreage, were as follows as of
August 31, 2018
:
|
Division
|
No. of
Facilities
|
Acreage
|
|||||||||
|
Leased
|
Owned
|
Total
|
|||||||||
|
Corporate offices – United States
|
1
|
|
—
|
|
—
|
|
—
|
|
|||
|
Auto and Metals Recycling:
|
|||||||||||
|
United States and Puerto Rico:
(1)
|
|||||||||||
|
Administrative offices
|
3
|
|
—
|
|
—
|
|
—
|
|
|||
|
Collection and processing
|
31
|
|
47
|
|
463
|
|
510
|
|
|||
|
Collection
|
4
|
|
5
|
|
14
|
|
19
|
|
|||
|
Auto parts stores
|
48
|
|
568
|
|
166
|
|
734
|
|
|||
|
Non-operating sites
(2)
|
16
|
|
51
|
|
160
|
|
211
|
|
|||
|
Canada:
|
|
||||||||||
|
Collection and processing
|
3
|
|
28
|
|
4
|
|
32
|
|
|||
|
Collection
|
1
|
|
6
|
|
—
|
|
6
|
|
|||
|
Auto parts stores
|
4
|
|
50
|
|
—
|
|
50
|
|
|||
|
Non-operating sites
(2)
|
6
|
|
23
|
|
—
|
|
23
|
|
|||
|
Cascade Scrap and Steel:
|
|||||||||||
|
United States:
|
|||||||||||
|
Steel mill and administrative offices
|
2
|
|
—
|
|
85
|
|
85
|
|
|||
|
Collection and processing
|
3
|
|
—
|
|
98
|
|
98
|
|
|||
|
Collection
|
2
|
|
—
|
|
8
|
|
8
|
|
|||
|
Non-operating sites
(2)
|
2
|
|
—
|
|
50
|
|
50
|
|
|||
|
Total company:
|
|||||||||||
|
United States and Puerto Rico
|
112
|
|
671
|
|
1,044
|
|
1,715
|
|
|||
|
Canada
|
14
|
|
107
|
|
4
|
|
111
|
|
|||
|
Total
(3)
|
126
|
|
778
|
|
1,048
|
|
1,826
|
|
|||
_____________________________
|
(1)
|
We jointly own
36
acres in California at
three
of our sites with minority interest partners.
|
|
(2)
|
Non-operating sites consist of owned and leased real properties, some of which are sublet to external parties.
|
|
(3)
|
For long-lived assets by geography, see
Note 16
– Segment Information in the Notes to the Consolidated Financial Statements in Part II, Item 8 of this report.
|
We consider all properties, both owned and leased, to be well-maintained, in good operating condition and suitable and adequate to carry on our business.
From time to time, we are involved in various litigation matters that arise in the ordinary course of business involving normal and routine claims, including environmental compliance matters. Such proceedings include, but are not limited to, proceedings relating to our status as a potentially responsible party with respect to the Portland Harbor Superfund Site, proceedings relating to other legacy environmental issues, and proceedings arising from accidents involving Company-owned vehicles, including Company tractor trailers. For additional information regarding such matters, see
Note 8
– Commitments and Contingencies in the Notes to the Consolidated Financial Statements in Part II, Item 8 of this report. Except as described in such Note, we currently believe that the ultimate outcome of these proceedings, individually or in the aggregate, will not have a material adverse effect on our consolidated financial position, results of operations, cash flows or business.
In fiscal 2013, the Commonwealth of Massachusetts advised us of alleged violations of environmental requirements, including but not limited to those related to air emissions and hazardous waste management, at our operations in the Commonwealth. We actively engaged in discussions with the Commonwealth's representatives, which resulted in a settlement agreement to resolve the alleged violations. A consent judgment was jointly filed with and entered by the Superior Court for the County of Suffolk, Commonwealth of Massachusetts on September 24, 2015. The settlement involved a $450,000 cash payment, an additional $450,000 in suspended payments to be waived upon completion of a shredder emission control system and certain other specified milestones, and $350,000 in supplemental environmental projects that we have completed.
22
/
Schnitzer Steel Industries, Inc. Form 10-K 2018
Table of Contents
SCHNITZER STEEL INDUSTRIES, INC.
We are continuing settlement discussions with the Alameda County District Attorney and the California Office of the Attorney General (“COAG”), the latter on behalf of certain state agencies, regarding alleged violations of environmental requirements, including but not limited to those related to hazardous waste management and water quality, at one of our operations in California stemming from investigations initiated in 2013 and inspections conducted in 2015. In conjunction with the on-going settlement discussions, we have completed or have underway various facility upgrades and remedial activities that are included in our capital expenditure budget and that we believe will resolve the underlying environmental concerns identified by the agencies. We have also continued to dispute certain of the allegations that have been raised and maintain that the operational practices giving rise to those allegations were in compliance with applicable laws. To date, no complaint has been filed by the District Attorney or the State of California although we anticipate that the settlement of this matter will ultimately involve the simultaneous filing of a complaint and a stipulation (settlement) that will include payment of a civil penalty and reimbursement of the agencies’ enforcement costs. Completion of a Supplemental Environmental Project may offset some portion of the penalty. We do not expect to enter into settlement until after completion of the agreed-upon facility upgrades, but based on the discussion to date and the government’s positive response to the facility improvements that have been completed or are underway, we do not believe that the potential penalty or enforcement costs associated with resolution of this enforcement proceeding will be material to our financial position, results of operations, cash flows or liquidity.
The COAG has also received a formal enforcement referral relating to another facility that we operate in California. This matter grew out of an agency inspection of the facility in 2014 and subsequent issuance of a Summary of Violations in 2015 setting forth a number of alleged violations relating to hazardous waste management requirements. We disputed the allegations in our response to the Summary of Violations, and the state agency referred the matter to COAG. COAG and Schnitzer Fresno, Inc., a wholly-owned subsidiary, which operates the facility, have agreed to settle the matter for $490,000, of which $368,000 shall be paid as a civil penalty and $122,000 shall be paid for agency investigation and enforcement costs. We are in the process of negotiating the settlement documentation and we do not believe the resolution of this threatened enforcement proceeding will be material to our financial position, results of operations, cash flows or liquidity.
In addition, we were informed in late July 2017 that the New Hampshire Office of the Attorney General (“NHOAG”) is contemplating bringing a civil action in connection with a legacy environmental issue at a closed facility in New Hampshire owned and previously operated by New England Metal Recycling LLC (NEMR), an indirectly wholly-owned subsidiary. This matter had been formally referred to the NHOAG and relates to subsurface automotive shredder residue (ASR) located at the site that we discovered and self-reported in response to findings from a routine inspection of the site by the New Hampshire Department of Environmental Services (NHDES) in May 2015. It appears that this subsurface ASR dates back to 2006 or before and may have resulted from the failure to complete a corrective action plan in 2006, although a former NEMR employee reported at the time that the work had been completed. In April 2017, NEMR received a letter of deficiency alleging violations of environmental requirements relating to the characterization and disposal of hazardous waste in connection with the subsurface ASR. We have reached substantial agreement with the NHDES on a remedial action plan for the site and have accrued for our expected cost of such work. On June 15, 2018, the NHOAG sent a letter indicating their intent to file a petition seeking civil penalties and injunctive relief in this matter. The letter included a draft petition and stated the NHOAG’s interest in beginning negotiations which may lead to a resolution of this matter. The Company had previously entered into a tolling agreement with the NHOAG and has entered into negotiations with the NHOAG to settle this matter. Based on the nature of the specific allegations and the fact that the activities in question were conducted over ten years ago, as well as our self-reporting of the matter and cooperation to date in pro-actively pursuing a remediation action plan, we do not believe the resolution of this threatened enforcement proceeding will be material to our financial position, results of operations, cash flows or liquidity.
In November 2017, the Company received a pre-filing negotiation letter from the United States Environmental Protection Agency (“EPA”) with respect to alleged violations of environmental requirements stemming from industrial stormwater inspections conducted in May and October 2016 and hazardous waste management inspections conducted in June 2017 at two of our facilities in Kansas City. We have already completed facility improvements that we believe address the concerns identified in the EPA inspection reports. EPA and Pick-N-Pull Auto Dismantlers, Kansas City, LLC, an indirect wholly-owned subsidiary which operates the two facilities, entered into a settlement agreement effective June 12, 2018 to resolve the alleged violations. The settlement included the payment of $154,391 as a civil penalty and increased site monitoring and reporting, including documentation of specified best management practices and training, the costs of which are not expected to be material.
In January 2018, the Company received a finding of violation letter from EPA with respect to alleged violations of environmental requirements stemming from refrigerant recovery management program inspections at 12 of our facilities in the New England and Pacific Northwest regions in July 2017 and November 2017. Except with respect to a minor and now corrected non-compliance matter at one facility, we believe that we have fully complied with the relevant regulations. Nevertheless, in December 2017 and prior to receipt of the EPA letter, we implemented improvements to our refrigerant recovery management program to further strengthen that program, including improvements to address concerns raised by EPA during the inspections. We have conferred with EPA regarding the alleged violations and are in negotiations with EPA to settle this matter. Based on the settlement discussions
23
/
Schnitzer Steel Industries, Inc. Form 10-K 2018
Table of Contents
SCHNITZER STEEL INDUSTRIES, INC.
to date and the program improvements we have implemented or have proposed to implement, we do not believe that the outcome of this matter will be material to our financial position, results of operations, cash flows or liquidity.
Not applicable.
EXECUTIVE OFFICERS OF THE REGISTRANT
Information about our executive officers is incorporated by reference from Part III, Item 10 of this annual report.
24
/
Schnitzer Steel Industries, Inc. Form 10-K 2018
Table of Contents
SCHNITZER STEEL INDUSTRIES, INC.
Our Class A common stock is listed on the NASDAQ Global Select Market (“NASDAQ”) under the symbol SCHN. There were
177
holders of record of Class A common stock on
October 22, 2018
. Our Class A common stock has been trading since November 16, 1993. The following table sets forth the high and low trading stock prices reported on NASDAQ and the dividends paid per share for the periods indicated.
|
|
Fiscal 2018
|
||||||||||
|
|
High Price
|
Low Price
|
Dividends Per Share
|
||||||||
|
First Quarter
|
$
|
31.35
|
|
$
|
25.60
|
|
$
|
0.1875
|
|
||
|
Second Quarter
|
$
|
38.85
|
|
$
|
28.05
|
|
$
|
0.1875
|
|
||
|
Third Quarter
|
$
|
38.15
|
|
$
|
27.95
|
|
$
|
0.1875
|
|
||
|
Fourth Quarter
|
$
|
37.95
|
|
$
|
25.00
|
|
$
|
0.1875
|
|
||
|
|
Fiscal 2017
|
||||||||||
|
|
High Price
|
Low Price
|
Dividends Per Share
|
||||||||
|
First Quarter
|
$
|
30.33
|
|
$
|
17.30
|
|
$
|
0.1875
|
|
||
|
Second Quarter
|
$
|
30.60
|
|
$
|
22.55
|
|
$
|
0.1875
|
|
||
|
Third Quarter
|
$
|
25.00
|
|
$
|
17.50
|
|
$
|
0.1875
|
|
||
|
Fourth Quarter
|
$
|
27.70
|
|
$
|
18.65
|
|
$
|
0.1875
|
|
||
Our Class B common stock is not publicly traded. There was
one
holder of record of Class B common stock on
October 22, 2018
.
We declared our 98
th
consecutive quarterly dividend in the fourth quarter of fiscal 2018. The payment of future dividends is subject to approval by our Board of Directors and continued compliance with the terms of our credit agreement. See Management’s Discussion and Analysis of Financial Condition and Results of Operations in Part II, Item 7 of this report for further discussion of our credit agreement.
Issuer Purchases of Equity Securities
Pursuant to a share repurchase program as amended in 2001, 2006 and 2008, we were authorized to repurchase up to
9 million
shares of our Class A common stock when management deems such repurchases to be appropriate. As of the beginning of fiscal 2016, we had repurchased approximately
7 million
shares of our Class A common stock under the program. We repurchased approximately
203 thousand
shares for a total of
$3 million
in open-market transactions in fiscal 2016 and approximately
516 thousand
shares for a total of
$17 million
in open-market transactions in fiscal 2018. We did not repurchase any shares in fiscal 2017. As of
August 31, 2018
, there were approximately
1.3 million
shares available for repurchase under the program.
The share repurchase program does not require us to acquire any specific number of shares, and we may suspend, extend or terminate the program at any time without prior notice and the program may be executed through open-market purchases, privately negotiated transactions or utilizing Rule 10b5-1 programs. We evaluate short- and long-range forecasts as well as anticipated sources and uses of cash before determining the course of action that would best enhance shareholder value.
The table presents a summary of our share repurchases during the quarter ended
August 31, 2018
:
|
Period
|
Total Number of Shares Purchased
|
Average Price Paid per Share
|
Total Number of Shares Purchased as Part of Publicly Announced Plans or Programs
|
Maximum Number of Shares that may yet be Purchased Under the Plans or Programs
|
||||||||
|
June 1 – June 30, 2018
|
148,402
|
|
$
|
34.09
|
|
148,402
|
|
1,387,911
|
|
|||
|
July 1 – July 31, 2018
|
101,598
|
|
$
|
34.68
|
|
101,598
|
|
1,286,313
|
|
|||
|
August 1 – August 31, 2018
|
—
|
|
—
|
|
—
|
|
1,286,313
|
|
||||
|
Total fourth quarter 2018
|
250,000
|
|
250,000
|
|
||||||||
25
/
Schnitzer Steel Industries, Inc. Form 10-K 2018
Table of Contents
SCHNITZER STEEL INDUSTRIES, INC.
Securities Authorized for Issuance under Equity Compensation Plans
See
Note 12
- Share-Based Compensation in the Notes to the Consolidated Financial Statements in Part II, Item 8 of this report for information regarding securities authorized for issuance under share-based compensation plans.
Performance Graph
The following graph and related information compares cumulative total shareholder return on our Class A common stock for the five-year period from September 1,
2013
through
August 31, 2018
, with the cumulative total return for the same period of (i) the S&P 500 Steel Index and (ii) the S&P 600 Metals & Mining Index. These comparisons assume an investment of $100 at the commencement of the five-year period and that all dividends are reinvested. The stock performance outlined in the performance graph below is not necessarily indicative of our future performance, and we do not endorse any predictions as to future stock performance.
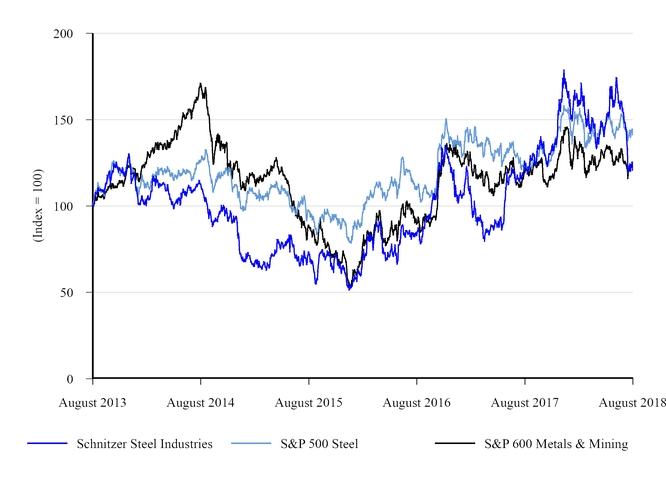
|
Year Ended August 31,
|
|||||||||||||||||||||||
|
2013
|
2014
|
2015
|
2016
|
2017
|
2018
|
||||||||||||||||||
|
Schnitzer Steel Industries
(1)
|
$
|
100
|
|
$
|
113
|
|
$
|
73
|
|
$
|
83
|
|
$
|
123
|
|
$
|
124
|
|
|||||
|
S&P 500 Steel
|
100
|
|
126
|
|
98
|
|
109
|
|
124
|
|
141
|
|
|||||||||||
|
S&P 600 Metals & Mining
|
100
|
|
171
|
|
89
|
|
90
|
|
119
|
|
124
|
|
|||||||||||
|
(1)
|
Because we operate in two distinct but related businesses, we have no direct market peer issuers.
|
In prior years, the stock performance graph presented in the Annual Report on Form 10-K also compared our stock performance with the stock performance of (i) the NASDAQ Composite Index and (ii) the S&P 500 Index. Beginning with this Annual Report on Form 10-K, we will substitute the S&P 600 Metals & Mining Index for the NASDAQ Composite Index and the S&P 500 Index. This change is being made because the Company has determined that use of the S&P 600 Metals & Mining Index presents a better comparison to the performance of our stock than the NASDAQ Composite Index and the S&P 500 Index, as the firms included in the S&P 600 Metals & Mining Index are more similar to us in size, major product types and complexity than the firms included in the NASDAQ Composite Index and the S&P 500 Index. The stock performance graph reflecting the indexes used in the presentation in the Annual Report on Form 10-K for the fiscal year ended August 31, 2017 is presented below.
26
/
Schnitzer Steel Industries, Inc. Form 10-K 2018
Table of Contents
SCHNITZER STEEL INDUSTRIES, INC.
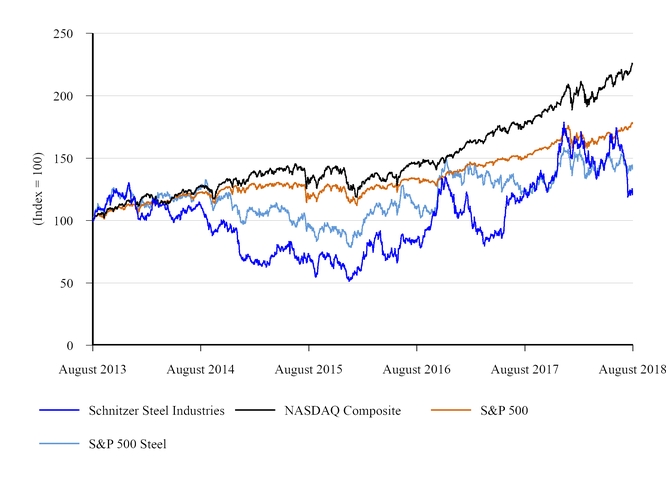
|
|
Year Ended August 31,
|
||||||||||||||||||||||
|
2013
|
2014
|
2015
|
2016
|
2017
|
2018
|
||||||||||||||||||
|
Schnitzer Steel Industries
|
$
|
100
|
|
$
|
113
|
|
$
|
73
|
|
$
|
83
|
|
$
|
123
|
|
$
|
124
|
|
|||||
|
NASDAQ Composite
|
100
|
|
128
|
|
133
|
|
145
|
|
179
|
|
226
|
|
|||||||||||
|
S&P 500
|
100
|
|
123
|
|
121
|
|
133
|
|
151
|
|
178
|
|
|||||||||||
|
S&P 500 Steel
|
100
|
|
126
|
|
98
|
|
109
|
|
124
|
|
141
|
|
|||||||||||
27
/
Schnitzer Steel Industries, Inc. Form 10-K 2018
Table of Contents
SCHNITZER STEEL INDUSTRIES, INC.
The following table sets forth selected financial and other data for each of the five years ended
August 31, 2018
. The selected financial and other data presented below should be read in conjunction with Management’s Discussion and Analysis of Financial Condition and Results of Operations set forth in Part II, Item 7 of this Annual Report on Form 10-K and the consolidated financial statements and the accompanying notes set forth in Part II, Item 8 of this Annual Report on Form 10-K.
|
|
Year Ended August 31,
|
||||||||||||||||||
|
|
2018
|
2017
|
2016
|
2015
|
2014
|
||||||||||||||
|
STATEMENT OF OPERATIONS DATA:
|
|||||||||||||||||||
|
(in thousands, except per share and dividend data)
|
|||||||||||||||||||
|
Revenues
|
$
|
2,364,715
|
|
$
|
1,687,591
|
|
$
|
1,352,543
|
|
$
|
1,915,399
|
|
$
|
2,534,926
|
|
||||
|
Operating income (loss)
(1)
|
$
|
148,988
|
|
$
|
56,013
|
|
$
|
(7,842
|
)
|
$
|
(195,529
|
)
|
$
|
24,364
|
|
||||
|
Income (loss) from continuing operations
|
$
|
159,443
|
|
$
|
47,368
|
|
$
|
(16,240
|
)
|
$
|
(187,849
|
)
|
$
|
12,400
|
|
||||
|
Income (loss) from discontinued operations, net of tax
(2)
|
$
|
346
|
|
$
|
(390
|
)
|
$
|
(1,348
|
)
|
$
|
(7,227
|
)
|
$
|
(2,809
|
)
|
||||
|
Net income (loss) attributable to SSI
|
$
|
156,451
|
|
$
|
44,511
|
|
$
|
(19,409
|
)
|
$
|
(197,009
|
)
|
$
|
5,924
|
|
||||
|
Income (loss) per share from continuing operations attributable to SSI (diluted)
|
$
|
5.46
|
|
$
|
1.60
|
|
$
|
(0.66
|
)
|
$
|
(7.03
|
)
|
$
|
0.32
|
|
||||
|
Net income (loss) per share attributable to SSI (diluted)
|
$
|
5.47
|
|
$
|
1.58
|
|
$
|
(0.71
|
)
|
$
|
(7.29
|
)
|
$
|
0.22
|
|
||||
|
Dividends declared per common share
|
$
|
0.750
|
|
$
|
0.750
|
|
$
|
0.750
|
|
$
|
0.750
|
|
$
|
0.750
|
|
||||
|
OTHER DATA:
|
|||||||||||||||||||
|
Sales volumes (in thousands)
(3)
:
|
|||||||||||||||||||
|
AMR recycled ferrous metal (LT)
(4)
|
3,708
|
|
3,145
|
|
2,899
|
|
3,186
|
|
3,591
|
|
|||||||||
|
AMR recycled nonferrous metal (pounds)
|
571,705
|
|
540,791
|
|
473,737
|
|
539,850
|
|
563,530
|
|
|||||||||
|
CSS finished steel products (ST)
|
519
|
|
496
|
|
488
|
|
540
|
|
533
|
|
|||||||||
|
Average net selling price
(3)(5)
:
|
|||||||||||||||||||
|
AMR recycled ferrous metal (per ton)
|
$
|
317
|
|
$
|
242
|
|
$
|
193
|
|
$
|
264
|
|
$
|
347
|
|
||||
|
AMR recycled nonferrous metal (per pound)
|
$
|
0.72
|
|
$
|
0.63
|
|
$
|
0.60
|
|
$
|
0.74
|
|
$
|
0.82
|
|
||||
|
CSS finished steel products (per ton)
|
$
|
666
|
|
$
|
534
|
|
$
|
522
|
|
$
|
639
|
|
$
|
677
|
|
||||
|
|
August 31,
|
||||||||||||||||||
|
|
2018
|
2017
|
2016
|
2015
|
2014
|
||||||||||||||
|
BALANCE SHEET DATA (in thousands):
|
|||||||||||||||||||
|
Total assets
|
$
|
1,104,817
|
|
$
|
933,755
|
|
$
|
891,429
|
|
$
|
962,299
|
|
$
|
1,355,210
|
|
||||
|
Long-term debt, net of current maturities
|
$
|
106,237
|
|
$
|
144,403
|
|
$
|
184,144
|
|
$
|
227,572
|
|
$
|
318,842
|
|
||||
_____________________________
|
(1)
|
Operating loss in fiscal 2016 includes a goodwill impairment charge of
$9 million
, other asset impairment charges of
$21 million
, and restructuring charges and other exit-related activities of
$7 million
. Operating loss in fiscal 2015 includes a goodwill impairment charge of
$141 million
, other asset impairment charges of
$45 million
, and restructuring charges and other exit-related activities of
$13 million
. Operating income in fiscal 2014 includes other asset impairment charges of $1 million and restructuring charges and other exit-related activities of $7 million.
|
|
(2)
|
In fiscal 2015, the Company ceased operations at seven auto parts stores, six of which qualified for discontinued operations reporting and whose results have been removed from other data on continuing operations for all periods presented, as applicable. In fiscal 2014, the Company also released an environmental liability of $1 million associated with operations disposed in fiscal 2010.
|
|
(3)
|
Tons for recycled ferrous metal are long tons (2,240 pounds) and for finished steel products are short tons (2,000 pounds).
|
|
(4)
|
The Company sold to external customers or delivered to its steel mill an aggregate of
4,299 thousand
, 3,628 thousand, 3,289 thousand, 3,708 thousand, and 4,309 thousand tons of ferrous recycled scrap metal in fiscal 2018, 2017, 2016, 2015, and 2014, respectively. Company-wide ferrous volumes include total ferrous sales volumes for AMR, ferrous tons sold externally by CSS, and ferrous tons delivered by CSS’s metals recycling operations to its steel mill, net of inter-segment eliminations.
|
|
(5)
|
In accordance with generally accepted accounting principles, the Company’s revenues include amounts billed to customers for freight; however, average net selling prices are shown net of amounts billed for freight.
|
28
/
Schnitzer Steel Industries, Inc. Form 10-K 2018
Table of Contents
SCHNITZER STEEL INDUSTRIES, INC.
This section includes a discussion of our operations for the three fiscal years ended
August 31, 2018
,
2017
, and
2016
. The following discussion and analysis provides information which management believes is relevant to an assessment and understanding of our financial condition and results of operations. The discussion should be read in conjunction with the Consolidated Financial Statements and the related notes thereto in Part II, Item 8 of this report and the Selected Financial Data contained in Part II, Item 6 of this report.
Business
Founded in 1906, Schnitzer Steel Industries, Inc. (“SSI”), an Oregon corporation, is one of North America’s largest recyclers of ferrous and nonferrous scrap metal, including end-of-life vehicles, and a manufacturer of finished steel products.
Our internal organizational and reporting structure includes two operating and reportable segments: the Auto and Metals Recycling (“AMR”) business and the Cascade Steel and Scrap (“CSS”) business.
We use segment operating income to measure our segment performance. We do not allocate corporate interest income and expense, income taxes, and other income and expense to our reportable segments. Certain expenses related to shared services that support operational activities and transactions are allocated from Corporate to the segments. Unallocated Corporate expense consists primarily of expense for management and certain administrative services that benefit both reportable segments. In addition, we do not allocate certain items to segment operating income because management does not include the information in its measurement of the performance of the operating segments. Such unallocated items include restructuring charges and other exit-related activities, charges related to legacy environmental liabilities, and provisions for certain legal matters. Because of the unallocated income and expense, the operating income of each reportable segment does not reflect the operating income the reportable segment would report as a stand-alone business. The results of discontinued operations are excluded from segment operating income and are presented separately, net of tax, from the results of ongoing operations for all periods presented. See
Note 16
– Segment Information in the Notes to the Consolidated Financial Statements in Part II, Item 8 of this report for a discussion of the primary activities of each reportable segment, total assets by reportable segment, operating results from continuing operations by reportable segment, revenues from external customers and concentration of sales to foreign countries.
Our results of operations depend in large part on the demand and prices for recycled metal in foreign and domestic markets and on the supply of raw materials, including end-of-life vehicles, available to be processed at our facilities. We respond to changes in selling prices for processed metal by seeking to adjust purchase prices for unprocessed scrap metal in order to manage the impact on our operating income. We believe we generally benefit from sustained periods of rising recycled scrap metal selling prices, which allow us to better maintain or increase both operating income and unprocessed scrap metal flow into our facilities. When recycled scrap metal selling prices decline for a sustained period, our operating margins typically compress.
Our deep water port facilities on both the East and West Coasts of the U.S. (in Everett, Massachusetts; Providence, Rhode Island; Oakland, California; Tacoma, Washington; and Portland, Oregon) and access to public deep water port facilities (in Kapolei, Hawaii and Salinas, Puerto Rico) allow us to efficiently meet the global demand for recycled ferrous metal by enabling us to ship bulk cargoes to steel manufacturers located in Europe, Africa, the Middle East, Asia, North America, Central America, and South America. Our exports of nonferrous recycled metal are shipped in containers through various public docks to specialty steelmakers, foundries, aluminum sheet and ingot manufacturers, copper refineries and smelters, brass and bronze ingot manufacturers, wire and cable producers, wholesalers, and other recycled metal processors globally. We also transport both ferrous and nonferrous metals by truck, rail and barge in order to transfer scrap metal between our facilities for further processing, to load shipments at our export facilities, and to meet regional domestic demand.
Our results of operations also depend on the demand and prices for our finished steel products, the manufacture of which uses internally sourced ferrous recycled scrap metal as the primary feedstock, as well as other raw materials. Our steel mill in Oregon sells to industrial customers primarily in North America.
Our quarterly operating results fluctuate based on a variety of factors including, but not limited to, changes in market conditions for ferrous and nonferrous recycled metal and finished steel products, the supply of scrap metal in our domestic markets, and varying demand for used auto parts from our self-service retail stores. Certain of these factors are influenced, to a degree, by the impact of seasonal changes including severe weather conditions, which can impact the timing of shipments and inhibit construction activity utilizing our products, scrap metal collection at our facilities, and retail admissions and parts sales at our auto parts stores.
29
/
Schnitzer Steel Industries, Inc. Form 10-K 2018
Table of Contents
SCHNITZER STEEL INDUSTRIES, INC.
Strategic Priorities
As we continue to closely monitor economic conditions, we remain focused on the following core strategies and plans to meet our business goals and objectives:
|
•
|
Long-term expansion of ferrous scrap metal supply and processing, sales volumes and operating margins;
|
|
•
|
Technology and process improvement investments to increase the separation and recovery of recycled materials from our shredding process and to generate more value-added products;
|
|
•
|
Use of our
seven
deep water ports and ground-based logistics network to directly access customers domestically and internationally to meet demand for our products wherever it is greatest;
|
|
•
|
Further optimization of our integrated recycling and steel manufacturing operating platforms to maximize opportunities for synergies, cost efficiencies and volumes;
|
|
•
|
Continuous improvement initiatives to increase production efficiency, enhance effectiveness in our commercial activities, ensure the safety of our employees while at work, and reduce operating expense;
|
|
•
|
Increase market share through initiatives to maximize volumes and through selective partnerships, alliances and acquisitions; and
|
|
•
|
Continued adoption of sustainable business practices to manage our social and environmental impacts and improve operating efficiency and natural resource stewardship.
|
Key economic factors and trends affecting the industries in which we operate
We sell recycled metals to the global steel industry for the production of finished steel. Our financial results largely depend on supply of raw materials in the U.S. and Western Canada and demand for recycled metal in foreign and domestic markets and for finished steel products in the Western U.S. Global economic conditions, changes in supply and demand conditions, the strength of the U.S. dollar, the availability and price of raw material alternatives, and trade actions such as tariffs affect market prices for and sales volumes of recycled ferrous and nonferrous metal in global markets and steel products in the Western U.S. and can have a significant impact on the results of operations for our reportable segments.
Commencing in fiscal 2012 and spanning through the first half of fiscal 2016, our markets were adversely impacted by a slowdown of economic activity globally. The macroeconomic uncertainty, combined with global steel-making overproduction and a strengthening of the U.S. dollar had resulted in deteriorating market conditions for global steel manufacturers and volatile pricing swings. The weak price environment for recycled metals in fiscal 2015 and the first half of fiscal 2016 was exacerbated by a decline in iron ore prices, a raw material used in steel-making blast furnaces which compete with EAF mills that use ferrous scrap metal as their primary feedstock. Low-priced steel billets which use iron ore as their primary raw material, and which are direct substitutes for ferrous scrap metal in the manufacture of finished steel, also contributed to lower scrap metal demand and prices during these years. The low economic growth in the U.S. and the lower scrap metal price environment at the time contributed to constrained scrap flows in the domestic supply markets which led to significantly lower margins in our AMR business during fiscal 2015 and the first half of fiscal 2016 before prices and margins recovered during the second half of fiscal 2016.
In fiscal 2017 and 2018, the combination of improved U.S. and global economic growth, lower Chinese steel exports, and further development of the steel industries using EAFs in other export markets contributed to improved demand and prices for ferrous recycled scrap metal, positively impacting our operating results. Compared to the prior two years, our performance in fiscal 2018 also benefited from improvements in market conditions, increased sales diversification, and improved supply volumes. The higher price environment for scrap metal during fiscal 2018 together with benefits from commercial initiatives to improve supply channels and a strong U.S. economy led to an increase in scrap supply flows into our facilities, including end-of-life vehicles, resulting in higher processed volumes compared to fiscal 2017 and 2016. In fiscal 2018, selling prices for ferrous recycled metal rose gradually during the first three quarters followed by a modest decrease in the fourth quarter. The higher average selling prices supported an expansion of the spread between direct purchase costs and selling prices of ferrous recycled metal compared to the prior year. Our operating margins also benefited from improved volumes of nonferrous material from end-of-life vehicles and the shredding process, partially offset by operating margin compression experienced near the end of fiscal 2018 as a result of a decrease in average net selling prices for certain nonferrous products driven primarily by the global impact of new regulations and measures put into place by policymakers in China during the year, including import regulations and tariffs on U.S. scrap imports. Our CSS business benefited in fiscal 2018 from reduced price pressure from steel imports, the impact of U.S. tariffs on steel imports, and steady demand for finished steel products in the West Coast markets which contributed to higher selling prices for our finished steel products. Our CSS business experienced improved metal margins from selling prices increasing faster than raw material purchase prices which, in combination with operational synergies gained following the integration of our steel manufacturing and
30
/
Schnitzer Steel Industries, Inc. Form 10-K 2018
Table of Contents
SCHNITZER STEEL INDUSTRIES, INC.
Oregon metals recycling operations in the fourth quarter of fiscal 2017, led to significantly improved results compared to the prior two years.
Trade actions, including tariffs, quotas and any retaliation by affected countries, can impact profit on sales of our products and, in certain cases, impede our ability to sell to certain export markets or require us to direct our sales to alternative market destinations, which can cause our quarterly operating results to fluctuate. For further information regarding the potential impact of changing conditions in global markets including the impact of tariffs, quotas and other trade actions on our business and results of operations, see Part I, Item 1A. Risk Factors of this report.
Executive Overview of Financial Results
We generated consolidated revenues of
$2.4 billion
in fiscal
2018
, an increase of
40%
from the
$1.7 billion
of consolidated revenues generated in fiscal
2017
, reflecting significantly improved market conditions for recycled metals in the domestic and export markets, increased supply flows and sales diversification, and the higher-price environment for our finished steel products, compared to the prior year. In fiscal
2018
, the average net selling price for ferrous recycled metal at AMR was
31%
higher compared to the prior year, and ferrous sales volumes at AMR were
18%
higher compared to the prior year. The average net selling price for our finished steel products in fiscal 2018 increased by
25%
compared to the prior year.
Consolidated operating income was
$149 million
in fiscal
2018
, compared to consolidated operating income of
$56 million
in fiscal
2017
. AMR reported operating income in fiscal
2018
of
$169 million
, compared to
$91 million
in the prior year. Operating results at AMR in fiscal
2018
benefited from stronger market conditions for ferrous recycled metal which, in combination with commercial initiatives, led to an increase in scrap supply flows into our facilities, including end-of-life vehicles, and higher processed volumes compared to fiscal
2017
. The higher-price environment together with benefits from commercial initiatives also positively impacted the spread between direct purchase costs and selling prices of ferrous recycled metal at AMR, with the metal spread for fiscal
2018
expanding by approximately
29%
compared to the prior year. CSS reported operating income of
$38 million
in fiscal
2018
, compared to
$5 million
in the prior year, reflecting significantly higher metal margins from selling prices increasing faster than raw material purchase prices, reduced price pressure from steel imports, steady demand for finished steel products in the West Coast markets, as well as operational synergies gained following the integration of our steel manufacturing and Oregon metals recycling operations in the fourth quarter of fiscal 2017 to form the CSS division. CSS’s operating results in fiscal
2017
were adversely impacted by competition from lower-priced steel imports and the adverse impact of the downtime and costs associated with major equipment upgrades at our steel mill during the first quarter of fiscal 2017.
Consolidated selling, general and administrative (“SG&A”) expense in fiscal
2018
increased by
$37 million
, or
22%
, compared to the prior year primarily due to higher employee-related expenses, including a
$10 million
increase in incentive and share-based compensation accruals resulting from improved financial performance, a
$6 million
increase in legal and professional services expenses, accruals for environmental liabilities totaling
$7 million
, and other expenses related to higher volumes.
Net income from continuing operations attributable to SSI in fiscal
2018
was
$156 million
, or
$5.46
per diluted share, compared to
$45 million
, or
$1.60
per diluted share, in the prior year. Net income from continuing operations attributable to SSI in fiscal 2018 included discrete income tax benefits totaling
$37 million
, or
$1.30
per diluted share, related to the release of valuation allowances against certain deferred tax assets, and an income tax benefit of
$7 million
, or
$0.24
per diluted share, related to the impacts of U.S. federal tax legislation enacted during the year.
The following items further highlight selected liquidity and capital structure metrics:
|
•
|
Net cash provided by operating activities of
$160 million
in fiscal
2018
, compared to
$100 million
in the prior year;
|
|
•
|
Debt of
$107 million
as of
August 31, 2018
, compared to
$145 million
as of the prior year-end;
|
|
•
|
Debt, net of cash, of
$103 million
as of
August 31, 2018
, compared to
$138 million
as of the prior year-end (see the reconciliation of debt, net of cash, in Non-GAAP Financial Measures at the end of this Item 7).
|
|
•
|
Share repurchases totaling
$17 million
in fiscal 2018, compared to no share repurchases in the prior year.
|
31
/
Schnitzer Steel Industries, Inc. Form 10-K 2018
Table of Contents
SCHNITZER STEEL INDUSTRIES, INC.
Results of Operations
|
For the Year Ended August 31,
|
|||||||||||||||||
|
|
|
|
|
% Increase / (Decrease)
|
|||||||||||||
|
($ in thousands)
|
2018
|
2017
|
2016
|
2018 vs 2017
|
2017 vs 2016
|
||||||||||||
|
Revenues:
|
|||||||||||||||||
|
Auto and Metals Recycling
|
$
|
1,908,966
|
|
$
|
1,363,618
|
|
$
|
1,060,592
|
|
40
|
%
|
29
|
%
|
||||
|
Cascade Steel and Scrap
|
480,641
|
|
339,620
|
|
304,032
|
|
42
|
%
|
12
|
%
|
|||||||
|
Intercompany revenue eliminations
(1)
|
(24,892
|
)
|
(15,647
|
)
|
(12,081
|
)
|
59
|
%
|
30
|
%
|
|||||||
|
Total revenues
|
2,364,715
|
|
1,687,591
|
|
1,352,543
|
|
40
|
%
|
25
|
%
|
|||||||
|
Cost of goods sold:
|
|||||||||||||||||
|
Auto and Metals Recycling
|
1,607,628
|
|
1,158,154
|
|
905,863
|
|
39
|
%
|
28
|
%
|
|||||||
|
Cascade Steel and Scrap
|
427,459
|
|
322,013
|
|
283,006
|
|
33
|
%
|
14
|
%
|
|||||||
|
Intercompany cost of goods sold eliminations
(1)
|
(24,602
|
)
|
(15,659
|
)
|
(12,881
|
)
|
57
|
%
|
22
|
%
|
|||||||
|
Total cost of goods sold
|
2,010,485
|
|
1,464,508
|
|
1,175,988
|
|
37
|
%
|
25
|
%
|
|||||||
|
Selling, general and administrative expense:
|
|||||||||||||||||
|
Auto and Metals Recycling
|
133,044
|
|
116,461
|
|
106,691
|
|
14
|
%
|
9
|
%
|
|||||||
|
Cascade Steel and Scrap
|
17,044
|
|
14,321
|
|
12,571
|
|
19
|
%
|
14
|
%
|
|||||||
|
Corporate
(2)
|
58,789
|
|
40,788
|
|
29,646
|
|
44
|
%
|
38
|
%
|
|||||||
|
Total selling, general and administrative expense
|
208,877
|
|
171,570
|
|
148,908
|
|
22
|
%
|
15
|
%
|
|||||||
|
(Income) loss from joint ventures:
|
|||||||||||||||||
|
Auto and Metals Recycling
|
107
|
|
(2,218
|
)
|
(386
|
)
|
NM
|
|
475
|
%
|
|||||||
|
Cascade Steel and Scrap
|
(2,060
|
)
|
(1,456
|
)
|
(433
|
)
|
41
|
%
|
236
|
%
|
|||||||
|
Total (income) loss from joint ventures
|
(1,953
|
)
|
(3,674
|
)
|
(819
|
)
|
(47
|
)%
|
349
|
%
|
|||||||
|
Goodwill impairment charges:
|
|||||||||||||||||
|
Auto and Metals Recycling
|
—
|
|
—
|
|
8,845
|
|
NM
|
|
NM
|
|
|||||||
|
Other asset impairment charges (recoveries), net:
|
|||||||||||||||||
|
Auto and Metals Recycling
|
(933
|
)
|
(184
|
)
|
16,411
|
|
407
|
%
|
NM
|
|
|||||||
|
Cascade Steel and Scrap
|
(88
|
)
|
(533
|
)
|
4,192
|
|
(83
|
)%
|
NM
|
|
|||||||
|
Corporate
|
—
|
|
—
|
|
79
|
|
NM
|
|
NM
|
|
|||||||
|
Total other asset impairment charges (recoveries), net
|
(1,021
|
)
|
(717
|
)
|
20,682
|
|
42
|
%
|
NM
|
|
|||||||
|
Operating income (loss):
|
|||||||||||||||||
|
Auto and Metals Recycling
|
169,120
|
|
91,405
|
|
23,168
|
|
85
|
%
|
295
|
%
|
|||||||
|
Cascade Steel and Scrap
|
38,286
|
|
5,275
|
|
4,696
|
|
626
|
%
|
12
|
%
|
|||||||
|
Segment operating income
|
207,406
|
|
96,680
|
|
27,864
|
|
115
|
%
|
247
|
%
|
|||||||
|
Restructuring charges and other exit-related activities
(3)
|
661
|
|
109
|
|
(6,781
|
)
|
506
|
%
|
NM
|
|
|||||||
|
Corporate expense
(2)
|
(58,789
|
)
|
(40,788
|
)
|
(29,725
|
)
|
44
|
%
|
37
|
%
|
|||||||
|
Change in intercompany profit elimination
(4)
|
(290
|
)
|
12
|
|
800
|
|
NM
|
|
(99
|
)%
|
|||||||
|
Total operating income (loss)
|
$
|
148,988
|
|
$
|
56,013
|
|
$
|
(7,842
|
)
|
166
|
%
|
NM
|
|
||||
32
/
Schnitzer Steel Industries, Inc. Form 10-K 2018
Table of Contents
SCHNITZER STEEL INDUSTRIES, INC.
NM = Not Meaningful
|
(1)
|
AMR sells a small portion of its recycled ferrous metal to CSS at prices that approximate local market rates. These intercompany revenues and cost of goods sold are eliminated in consolidation.
|
|
(2)
|
Corporate expense consists primarily of unallocated expenses for management and certain administrative services that benefit both reportable segments.
|
|
(3)
|
Restructuring charges consist of expense for severance, contract termination and other restructuring costs that management does not include in its measurement of the performance of the reportable segments. Other exit-related activities consist of asset impairments and accelerated depreciation, net of gains on exit-related disposals, related to site closures.
|
|
(4)
|
Intercompany profits are not recognized until the finished products are sold to third parties; therefore, intercompany profit is eliminated while the products remain in inventory.
|
33
/
Schnitzer Steel Industries, Inc. Form 10-K 2018
Table of Contents
SCHNITZER STEEL INDUSTRIES, INC.
We operate our business across two reportable segments: AMR and CSS. Additional financial information relating to these reportable segments is contained in
Note 16
- Segment Information in the Notes to the Consolidated Financial Statements in Part II, Item 8 of this report.
Auto and Metals Recycling
|
For the Year Ended August 31,
|
|||||||||||||||||
|
% Increase / (Decrease)
|
|||||||||||||||||
|
($ in thousands, except for prices)
|
2018
|
2017
|
2016
|
2018 vs 2017
|
2017 vs 2016
|
||||||||||||
|
Ferrous revenues
|
$
|
1,288,287
|
|
$
|
843,222
|
|
$
|
625,517
|
|
53
|
%
|
35
|
%
|
||||
|
Nonferrous revenues
|
481,777
|
|
394,977
|
|
330,351
|
|
22
|
%
|
20
|
%
|
|||||||
|
Retail and other revenues
|
138,902
|
|
125,419
|
|
104,724
|
|
11
|
%
|
20
|
%
|
|||||||
|
Total segment revenues
|
1,908,966
|
|
1,363,618
|
|
1,060,592
|
|
40
|
%
|
29
|
%
|
|||||||
|
Cost of goods sold
|
1,607,628
|
|
1,158,154
|
|
905,863
|
|
39
|
%
|
28
|
%
|
|||||||
|
Selling, general and administrative expense
|
133,044
|
|
116,461
|
|
106,691
|
|
14
|
%
|
9
|
%
|
|||||||
|
(Income) loss from joint ventures
|
107
|
|
(2,218
|
)
|
(386
|
)
|
(105
|
)%
|
475
|
%
|
|||||||
|
Goodwill impairment charges
|
—
|
|
—
|
|
8,845
|
|
NM
|
|
NM
|
|
|||||||
|
Other asset impairment charges (recoveries), net
|
(933
|
)
|
(184
|
)
|
16,411
|
|
407
|
%
|
NM
|
|
|||||||
|
Segment operating income
|
$
|
169,120
|
|
$
|
91,405
|
|
|
$
|
23,168
|
|
85
|
%
|
295
|
%
|
|||
|
Average recycled ferrous metal sales prices ($/LT):
(1)
|
|||||||||||||||||
|
Domestic
|
$
|
291
|
|
$
|
236
|
|
$
|
188
|
|
23
|
%
|
26
|
%
|
||||
|
Foreign
|
$
|
328
|
|
$
|
244
|
|
$
|
196
|
|
34
|
%
|
24
|
%
|
||||
|
Average
|
$
|
317
|
|
$
|
242
|
|
$
|
193
|
|
31
|
%
|
25
|
%
|
||||
|
Ferrous sales volume (LT, in thousands):
|
|||||||||||||||||
|
Domestic
|
1,085
|
|
948
|
|
859
|
|
14
|
%
|
10
|
%
|
|||||||
|
Foreign
|
2,623
|
|
2,197
|
|
2,040
|
|
19
|
%
|
8
|
%
|
|||||||
|
Total ferrous sales volume (LT, in thousands)
|
3,708
|
|
3,145
|
|
2,899
|
|
18
|
%
|
9
|
%
|
|||||||
|
Average nonferrous sales price ($/pound)
(1)(2)
|
$
|
0.72
|
|
$
|
0.63
|
|
$
|
0.60
|
|
14
|
%
|
5
|
%
|
||||
|
Nonferrous sales volumes (pounds, in thousands)
(2)
|
571,705
|
|
540,791
|
|
473,737
|
|
6
|
%
|
14
|
%
|
|||||||
|
Cars purchased (in thousands)
(3)
|
424
|
|
411
|
|
319
|
|
3
|
%
|
29
|
%
|
|||||||
|
Number of auto parts stores at period end
|
52
|
|
53
|
|
52
|
|
(2
|
)%
|
2
|
%
|
|||||||
|
Outbound freight included in cost of goods sold
|
$
|
128,324
|
|
$
|
97,400
|
|
$
|
77,477
|
|
32
|
%
|
26
|
%
|
||||
_____________________________
LT = Long Ton, which is equivalent to 2,240 pounds
NM = Not meaningful
|
(1)
|
Price information is shown after netting the cost of freight incurred to deliver the product to the customer.
|
|
(2)
|
Average sales price and volume information excludes platinum group metals (“PGMs”) in catalytic converters.
|
|
(3)
|
Cars purchased by auto parts stores only.
|
Fiscal
2018
compared with fiscal
2017
AMR Segment Revenues
Revenues in fiscal
2018
increased by
40%
compared to fiscal
2017
primarily due to stronger market conditions for recycled metal in the domestic and export markets resulting in significantly higher average net selling prices and increased sales volumes compared to the prior year. AMR’s revenues and sales volumes in fiscal 2018 also benefited from increased sales diversification compared to the prior year.
34
/
Schnitzer Steel Industries, Inc. Form 10-K 2018
Table of Contents
SCHNITZER STEEL INDUSTRIES, INC.
AMR Segment Operating Income
Operating income for fiscal
2018
was
$169 million
, compared to
$91 million
in fiscal
2017
. Operating results benefited from stronger market conditions for ferrous recycled metal which, in combination with commercial initiatives, led to an increase in scrap supply flows into our facilities, including end-of-life vehicles, and higher processed volumes compared to fiscal
2017
. The higher price environment in fiscal 2018 including a period of gradually rising selling prices for ferrous recycled metal during the first three quarters followed by a modest decrease in the fourth quarter, together with benefits from commercial initiatives, supported an expansion of the spread between direct purchase costs and selling prices of ferrous recycled metal at AMR, with the metal spread for fiscal
2018
expanding by approximately
29%
compared to the prior year. Operating margins also benefited from improved volumes of nonferrous material from end-of-life vehicles and the shredding process, partially offset by operating margin compression experienced near the end of fiscal 2018 as a result of a decrease in average net selling prices for certain nonferrous products driven primarily by the global impact of new regulations and measures put into place by policymakers in China during the year, including import regulations and tariffs on U.S. scrap imports. AMR selling, general and administrative (“SG&A”) expense in fiscal
2018
increased by
$17 million
, or
14%
, compared to the prior year primarily due to higher employee-related expenses, including an increase in incentive compensation accruals as a result of improved operating performance and other expenses related to higher volumes.
Fiscal
2017
compared with fiscal
2016
AMR Segment Revenues
Revenues in fiscal
2017
increased by
29%
compared to fiscal
2016
primarily due to improved market conditions for recycled metals in the domestic and export markets resulting in higher average net selling prices and increased sales volumes compared to the prior year, including benefits from increased sales diversification. Average net selling prices for shipments of ferrous scrap metal in fiscal 2017 increased by
25%
compared to the prior year. Ferrous sales volumes in fiscal 2017 also increased by
9%
compared to the prior year due to higher export and domestic shipments in fiscal 2017. Additionally, nonferrous sales volumes in fiscal 2017 were higher by
14%
compared to the prior year, and nonferrous average net selling prices were higher by
5%
.
AMR Segment Operating Income
Operating income for fiscal
2017
was
$91 million
, compared to
$23 million
in fiscal
2016
. Adjusted operating income in fiscal
2017
was
$90 million
, compared to
$48 million
in the prior year. See the reconciliation of AMR adjusted operating income in Non-GAAP Financial Measures at the end of this Item 7.
Operating results in fiscal
2017
benefited from better market conditions, increased sales diversification, improved supply volumes, expanded nonferrous metal recovery, and additional benefits from cost savings and productivity improvement initiatives compared to fiscal
2016
. The higher price environment for scrap metal in fiscal
2017
together with benefits from commercial initiatives to improve supply channels and an improved trend in U.S. economic conditions also led to an increase in the supply of scrap metal, including end-of-life vehicles, resulting in higher processed volumes compared to the prior year. The stronger price environment also positively impacted the spread between direct purchase costs and selling prices of ferrous recycled metal at AMR, with the metal spread for fiscal
2017
expanding by approximately 10% compared to the prior year. Operating results in fiscal
2016
were adversely impacted by a lower price environment which included sharp declines in commodity selling prices during the first half of fiscal
2016
resulting in an unfavorable impact from average inventory accounting during the year. This compares to a favorable impact from average inventory accounting in fiscal
2017
which, relative to performance benefits from other drivers, was not a major contributor to the improvement in AMR’s operating results year over year.
AMR SG&A expense in fiscal
2017
increased by
$10 million
, or
9%
, compared to the prior year primarily due to higher employee-related expenses, including an increase in incentive compensation accruals resulting from improved financial performance, other expenses related to higher volumes, and increased environmental liabilities. This increase was partially offset by incremental benefits from cost savings and productivity improvement measures to reduce direct costs of production and SG&A expense. AMR operating results in fiscal
2017
were positively impacted by approximately
$11 million
of incremental benefits from these measures.
In the second quarter of fiscal
2016
, we identified a triggering event requiring an interim impairment test of goodwill allocated to our reporting units. The impairment test resulted in a non-cash goodwill impairment charge of
$9 million
at a reporting unit within AMR. We also recorded non-cash impairment charges and accelerated depreciation on certain long-lived and other assets at AMR of
$16 million
primarily related to certain regional metals recycling operations and used auto parts store locations and certain previously-idled recycling equipment assets. See Results of Operations, Asset Impairment Charges (Recoveries), net in this Item 7 for further details on asset impairment charges.
35
/
Schnitzer Steel Industries, Inc. Form 10-K 2018
Table of Contents
SCHNITZER STEEL INDUSTRIES, INC.
Cascade Steel and Scrap
|
For the Year Ended August 31,
|
||||||||||||||||||
|
% Increase / (Decrease)
|
||||||||||||||||||
|
($ in thousands, except for price)
|
2018
|
2017
|
2016
|
2018 vs 2017
|
2017 vs 2016
|
|||||||||||||
|
Steel revenues
(1)
|
$
|
367,560
|
|
$
|
280,767
|
|
$
|
269,905
|
|
31
|
%
|
4
|
%
|
|||||
|
Recycling revenues
(2)
|
113,081
|
|
58,853
|
|
34,127
|
|
92
|
%
|
72
|
%
|
||||||||
|
Total segment revenues
|
480,641
|
|
339,620
|
|
304,032
|
|
42
|
%
|
12
|
%
|
||||||||
|
Cost of goods sold
|
427,459
|
|
322,013
|
|
283,006
|
|
33
|
%
|
14
|
%
|
||||||||
|
Selling, general and administrative expense
|
17,044
|
|
14,321
|
|
12,571
|
|
19
|
%
|
14
|
%
|
||||||||
|
(Income) from joint ventures
|
(2,060
|
)
|
(1,456
|
)
|
(433
|
)
|
41
|
%
|
236
|
%
|
||||||||
|
Other asset impairment charges (recoveries), net
|
(88
|
)
|
(533
|
)
|
4,192
|
|
(83
|
)%
|
NM
|
|
||||||||
|
Segment operating income
|
$
|
38,286
|
|
$
|
5,275
|
|
$
|
4,696
|
|
626
|
%
|
12
|
%
|
|||||
|
Finished steel average sales price ($/ST)
(3)
|
$
|
666
|
|
$
|
534
|
|
$
|
522
|
|
25
|
%
|
2
|
%
|
|||||
|
Finished steel products sold (ST, in thousands)
|
519
|
|
496
|
|
488
|
|
5
|
%
|
2
|
%
|
||||||||
|
Rolling mill utilization
(4)
|
88
|
%
|
83
|
%
|
63
|
%
|
6
|
%
|
32
|
%
|
||||||||
_____________________________
ST = Short Ton, which is equivalent to 2,000 pounds
NM = Not Meaningful
|
(1)
|
Steel revenues include primarily sales of finished steel products, semi-finished goods (billets) and manufacturing scrap.
|
|
(2)
|
Recycling revenues include primarily sales of ferrous and nonferrous recycled scrap metal to export markets.
|
|
(3)
|
Price information is shown after netting the cost of freight incurred to deliver the product to the customer.
|
|
(4)
|
Rolling mill utilization for fiscal 2017 and 2018 is based on effective annual production capacity under current conditions of 580 thousand tons of finished steel products, reflecting a decrease in the effective finished steel production capacity resulting from the decommissioning of the older rolling mill during the first quarter of fiscal 2017.
|
Fiscal
2018
compared with fiscal
2017
CSS Segment Revenues
Revenues in fiscal
2018
increased by
$141 million
, or
42%
, compared to fiscal
2017
primarily due to significantly higher average selling prices for our finished steel products and increased export sales of ferrous recycled scrap metal. The higher average selling prices for our finished steel products reflect the impacts of higher steel-making raw material costs compared to the prior year, as well as reduced pressure from steel imports.
CSS Segment Operating Income
Operating income for fiscal
2018
was
$38 million
, compared to operating income of
$5 million
in the prior year. Improved operating results in fiscal
2018
reflect significantly higher metal margins from selling prices increasing faster than raw material purchase prices, reduced price pressure from steel imports, steady demand for finished steel products in the West Coast markets, as well as operational synergies gained following the integration of our steel manufacturing and Oregon metals recycling operations in the fourth quarter of fiscal 2017 to form the CSS division. CSS’s operating results in fiscal
2017
were adversely impacted by competition from lower-priced steel imports and the adverse impact of the downtime and costs associated with major equipment upgrades at our steel mill during the first quarter of fiscal 2017.
Fiscal
2017
compared with fiscal
2016
CSS Segment Revenues
Revenues in fiscal
2017
increased by
$36 million
, or
12%
, compared to fiscal
2016
primarily due to increased export sales of ferrous recycled scrap metal, higher average selling prices for our finished steel products reflecting the impact of higher steel-making raw material costs, and higher sales volumes for finished steel products due to stronger demand in the West Coast markets.
CSS Segment Operating Income
Operating income for fiscal
2017
was just over
$5 million
, compared to operating income of just under
$5 million
in the prior year. Adjusted operating income in fiscal
2017
was
$5 million
, compared to adjusted operating income of
$9 million
in fiscal
2016
. Adjusted results in fiscal
2017
exclude a net recovery on previously impaired assets of
$1 million
. Adjusted results in fiscal
2016
exclude other asset impairment charges of
$4 million
. See the reconciliation of CSS adjusted operating income in Non-GAAP Financial Measures at the end of this Item 7.
36
/
Schnitzer Steel Industries, Inc. Form 10-K 2018
Table of Contents
SCHNITZER STEEL INDUSTRIES, INC.
Operating results in fiscal
2017
benefited from stronger demand for our finished steel products in the West Coast markets during the fourth quarter and improved market conditions for ferrous and nonferrous recycled scrap metal in the export markets. The benefits from the improved conditions were partially offset by continued pressure from low-priced imports and costs of
$2 million
associated with a major equipment upgrade at our steel mill in the first quarter of fiscal
2017
. Operating results for both fiscal years were adversely impacted by selling prices for finished steel products falling faster than cost of goods sold, primarily during the first half of each year, resulting in compressed operating margins. Operating results in fiscal
2016
were adversely affected by impairment charges of
$2 million
on steel mill supplies inventory and
$2 million
on an investment in a metals recycling joint venture. Fiscal
2017
operating results included a net recovery on previously impaired assets of
$1 million
consisting primarily of a gain on the sale of a previously impaired metals recycling joint venture investment.
Asset Impairment Charges (Recoveries), net
During the periods presented, we recorded non-cash impairment charges and accelerated depreciation on certain long-lived and other assets, as well as recoveries on certain previously impaired assets. The following asset impairment charges and subsequent recoveries, excluding goodwill impairment charges, were recorded in the Consolidated Statements of Operations (in thousands):
|
Year Ended August 31,
|
|||||||||||
|
2018
|
2017
|
2016
|
|||||||||
|
Reported within other asset impairment charges (recoveries), net:
|
|||||||||||
|
Auto and Metals Recycling
|
|||||||||||
|
Long-lived assets
|
$
|
—
|
|
$
|
—
|
|
$
|
7,336
|
|
||
|
Accelerated depreciation
|
(1,040
|
)
|
—
|
|
6,208
|
|
|||||
|
Investments in joint ventures
|
(118
|
)
|
860
|
|
—
|
|
|||||
|
Assets held for sale
|
(642
|
)
|
(1,044
|
)
|
1,659
|
|
|||||
|
Other assets
|
867
|
|
—
|
|
1,208
|
|
|||||
|
Total Auto and Metals Recycling
|
(933
|
)
|
(184
|
)
|
16,411
|
|
|||||
|
Cascade Steel and Scrap
|
|||||||||||
|
Accelerated depreciation
|
(88
|
)
|
401
|
|
—
|
|
|||||
|
Investments in joint ventures
|
—
|
|
(934
|
)
|
1,968
|
|
|||||
|
Supplies inventory
|
—
|
|
—
|
|
2,224
|
|
|||||
|
Total Cascade Steel and Scrap
|
(88
|
)
|
(533
|
)
|
4,192
|
|
|||||
|
Corporate - Other assets
|
—
|
|
—
|
|
79
|
|
|||||
|
(1,021
|
)
|
(717
|
)
|
20,682
|
|
||||||
|
Reported within restructuring charges and other exit-related activities:
|
|||||||||||
|
Long-lived assets
|
—
|
|
—
|
|
468
|
|
|||||
|
Accelerated depreciation
|
—
|
|
96
|
|
630
|
|
|||||
|
Supplies inventory
|
—
|
|
—
|
|
1,047
|
|
|||||
|
Other assets
|
—
|
|
62
|
|
35
|
|
|||||
|
Exit-related gains
|
(1,000
|
)
|
(565
|
)
|
(1,337
|
)
|
|||||
|
(1,000
|
)
|
(407
|
)
|
843
|
|
||||||
|
Reported within discontinued operations:
|
|||||||||||
|
Long-lived assets
|
—
|
|
—
|
|
673
|
|
|||||
|
Accelerated depreciation
|
—
|
|
—
|
|
274
|
|
|||||
|
—
|
|
—
|
|
947
|
|
||||||
|
Total
|
$
|
(2,021
|
)
|
$
|
(1,124
|
)
|
$
|
22,472
|
|
||
37
/
Schnitzer Steel Industries, Inc. Form 10-K 2018
Table of Contents
SCHNITZER STEEL INDUSTRIES, INC.
Corporate
Corporate SG&A expense was
$59 million
,
$41 million
and
$30 million
for the fiscal years
2018, 2017 and 2016
, respectively. The higher level of expense for fiscal
2018
was primarily due to higher employee-related expenses, including an increase of $6 million in incentive and share-based compensation accruals resulting from improved financial performance, a $5 million increase in legal and professional services expenses primarily reflecting the net impact of legal settlements, and $6 million of legacy environmental liabilities recorded during the year. The higher level of expense for fiscal 2017 compared to fiscal 2016 was due to an increase in incentive compensation accruals resulting from improved financial performance and the inclusion of a $6 million benefit from an insurance reimbursement in fiscal 2016.
In the fourth quarter of fiscal 2018, we modified our measurement of segment operating income to classify all legacy environmental charges within Corporate in order to align the measures with how the Chief Executive Officer, who is considered the Company’s chief operating decision maker, reviews performance and makes decisions on resource allocation. The change has been applied prospectively beginning in the fourth quarter of fiscal 2018, and such charges incurred during the quarter are reported within the Corporate division. In the fourth quarter of fiscal 2018, we recorded
$1 million
of legacy environmental charges to the Corporate division that, prior to the change, would have been classified within AMR. Legacy environmental charges reflected in AMR’s operating results prior to the change are not material to the Consolidated Financial Statements either individually or in the aggregate. Environmental charges are reported within SG&A expense in the Consolidated Statements of Operations.
Restructuring Charges and Other Exit-Related Activities
During the past several years, we implemented a number of cost reduction, productivity improvement, and restructuring initiatives to more closely align our business with market conditions. These initiatives focused on decreasing our annual operating expenses by reorganizing our business to reduce organizational layers and streamline administrative and supporting services functions and optimizing our operating capacity by idling underutilized metals recycling assets and closing facilities.
In fiscal 2017, we substantially completed a multi-year program of these initiatives. By the end of fiscal 2017, we had achieved approximately
$160 million
in combined annual benefits to operating performance since the initial phase of initiatives was announced at the end of fiscal 2012. We incurred significant restructuring charges and other exit-related activities in fiscal 2016 primarily related to initiatives announced in the second quarter of fiscal 2015 and expanded in subsequent periods (the “Q2’15 Plan”), which targeted an annual improvement to operating performance of approximately $95 million. Of the approximately $160 million in combined annual benefits achieved by the end of fiscal 2017 under the multi-year program announced in fiscal 2012, we achieved approximately $95 million in combined annual benefits related to the Q2’15 Plan in fiscal 2017, compared to $78 million in fiscal 2016.
Consolidated operating results in fiscal
2018
included a net benefit from restructuring charges and other exit-related activities of
$1 million
, compared to a net benefit of less than $1 million in fiscal
2017
and charges of $7 million in fiscal
2016
. Restructuring charges consisted of severance, contract termination and other restructuring costs. Exit-related activities consisted of asset impairments and accelerated depreciation of assets in connection with the closure of certain operations, net of gains on exit-related disposals. The charges incurred during the periods presented primarily pertain to the Q2’15 Plan. Consolidated operating results for the periods presented also reflect benefits from cost reduction and productivity improvement measures initiated prior to the second quarter of fiscal 2015 and an immaterial amount of associated costs.
38
/
Schnitzer Steel Industries, Inc. Form 10-K 2018
Table of Contents
SCHNITZER STEEL INDUSTRIES, INC.
Restructuring charges and other exit-related activities incurred in connection with cost reduction and productivity improvement plans for the fiscal year ended August 31, 2016 comprise the following (in thousands):
|
2016
|
|||||||||||
|
Q2’15 Plan
|
All Other Plans
|
Total Charges
|
|||||||||
|
Restructuring charges:
|
|||||||||||
|
Severance costs
|
$
|
4,915
|
|
$
|
—
|
|
$
|
4,915
|
|
||
|
Contract termination costs
|
796
|
|
311
|
|
1,107
|
|
|||||
|
Total restructuring charges
|
5,711
|
|
311
|
|
6,022
|
|
|||||
|
Other exit-related activities:
|
|||||||||||
|
Asset impairments and accelerated depreciation
|
3,127
|
|
—
|
|
3,127
|
|
|||||
|
Gains on exit-related disposals
|
(1,337
|
)
|
—
|
|
(1,337
|
)
|
|||||
|
Total other exit-related activities
|
1,790
|
|
—
|
|
1,790
|
|
|||||
|
Total restructuring charges and exit-related activities
|
$
|
7,501
|
|
$
|
311
|
|
$
|
7,812
|
|
||
|
Restructuring charges and other exit-related activities included in continuing operations
|
$
|
6,781
|
|
||||||||
|
Restructuring charges and other exit-related activities included in discontinued operations
|
$
|
1,031
|
|
||||||||
We do not include restructuring charges and other exit-related activities in the measurement of the performance of our reportable segments. The significant majority of restructuring charges require us to make cash payments.
See
Note 9
- Restructuring Charges and Other Exit-Related Activities in the Notes to the Consolidated Financial Statements in Part II, Item 8 of this report.
Interest Expense
Interest expense was
$9 million
,
$8 million
and
$9 million
for fiscal
2018, 2017 and 2016
, respectively. The impact on interest expense of reduced average borrowings under our bank credit facilities between each of fiscal 2018 and fiscal 2017 and fiscal 2017 and 2016 was offset by higher interest rates. For more information about our outstanding debt balances, see
Note 7
– Debt in the Notes to the Consolidated Financial Statements in Part II, Item 8 of this report.
Income Tax Expense
|
Year Ended August 31,
|
|||||||||||
|
2018
|
2017
|
2016
|
|||||||||
|
Income (loss) from continuing operations before income taxes
|
$
|
141,853
|
|
$
|
48,690
|
|
$
|
(15,505
|
)
|
||
|
Income tax (expense) benefit
|
$
|
17,590
|
|
$
|
(1,322
|
)
|
$
|
(735
|
)
|
||
|
Effective tax rate
|
(12.4
|
)%
|
2.7
|
%
|
(4.7
|
)%
|
|||||
On December 22, 2017, the President of the United States signed and enacted into law comprehensive tax legislation commonly referred to as the Tax Cuts and Jobs Act (“Tax Act”), which, except for certain provisions, is effective for tax years beginning on or after January 1, 2018. The Tax Act’s primary change is a reduction in the federal statutory corporate tax rate from 35% to 21%, resulting in a pro rata reduction of the Company’s tax rate from 35% to 25.7% for fiscal 2018. Other pertinent changes in the Tax Act effective for fiscal 2018 include, but are not limited to, acceleration of deductions for qualified property placed in service after September 27, 2017. In addition, effective for the Company’s fiscal 2019 year, the Tax Act also limits the deductibility of some executive compensation and eliminates the deduction for qualified domestic production activities. Changes in the Tax Act that did not significantly impact the Company upon enactment include the implementation of a modified territorial tax system and other modifications to how foreign earnings are subject to U.S. tax.
As a change in tax law is accounted for in the period of enactment, we recognized a provisional discrete benefit of $7 million in the second quarter of fiscal 2018 due to the revaluation of U.S. net deferred tax liabilities to reflect the lower statutory rate. Our effective tax rate in fiscal 2018 also reflects the Tax Act's lower federal statutory corporate tax rate.
Known and certain estimated effects based upon current interpretation of the Tax Act have been incorporated into our financial results beginning with the Quarterly Report on Form 10-Q for the quarterly period ended February 28, 2018. As additional clarification and implementation guidance is issued on the Tax Act, it may be necessary to adjust the provisional amounts.
39
/
Schnitzer Steel Industries, Inc. Form 10-K 2018
Table of Contents
SCHNITZER STEEL INDUSTRIES, INC.
Adjustments to provisional amounts could be material to our results of operations and cash flows. In addition, there is a risk that states or foreign jurisdictions may amend their tax laws in response to the Tax Act, which could have a material impact on our future results of operations and cash flows.
Our effective tax rate from continuing operations in fiscal
2018
was a benefit of
12.4%
, compared to an expense of
2.7%
in the prior year. We reported a tax benefit on pre-tax income for fiscal 2018 primarily due to the release of valuation allowances against certain deferred tax assets, resulting in recognition of discrete tax benefits totaling
$37 million
in fiscal 2018, and the impact of the Tax Act. The release of valuation allowances in fiscal 2018 was the result of sufficient positive evidence, including cumulative income in our U.S. and Canadian tax jurisdictions in recent years and projections of future taxable income based primarily on our improved financial performance, that it is more-likely-than-not that the deferred tax assets will be realized.
Our effective tax rate from continuing operations in fiscal 2017 was lower than the U.S. federal statutory rate at the time of 35% primarily due our full valuation allowance positions and federal income tax refund claims, partially offset by increases in deferred tax liabilities from indefinite-lived assets in all jurisdictions.
Our effective tax rate from continuing operations in fiscal 2016 was an expense of
4.7%
, which was lower than the U.S. federal statutory rate at the time of 35%. The effective tax rate was reduced for valuation allowances on deferred tax assets and the aggregate impact of foreign income taxed at different rates. Those reductions were partially offset by the realization of deductible foreign investment basis for tax purposes. Our income tax expense is composed primarily of the increase in deferred tax liabilities from indefinite-lived assets plus certain state cash tax expenses. The increase in valuation allowance on deferred tax assets was recognized as a result of negative evidence at the time, including recent losses in all tax jurisdictions, outweighing the more subjective positive evidence at the time, indicating that it was more likely than not that the associated tax benefit would not be realized.
We assess the realizability of our deferred tax assets on a quarterly basis through an analysis of potential sources of future taxable income, including prior year taxable income available to absorb a carryback of tax losses, reversals of existing taxable temporary differences, tax planning strategies, and forecasts of taxable income. We consider all negative and positive evidence, including the weight of the evidence, to determine if valuation allowances against deferred tax assets are required.
We continue to maintain valuation allowances against certain deferred tax assets related to certain jurisdictions as a result of negative objective evidence, including the effects of historical losses in these tax jurisdictions, outweighing positive objective and subjective evidence, indicating that it is more likely than not that the associated tax benefit will not be realized. Realization of the deferred tax assets is dependent upon generating sufficient taxable income in the associated tax jurisdictions in future years to benefit from the reversal of net deductible temporary differences and from the utilization of net operating losses. We will continue to regularly assess the realizability of deferred tax assets. Changes in historical earnings performance and future earnings projections, among other factors, may cause us to adjust our valuation allowance on deferred tax assets, which would impact our results of operations in the period we determine that these factors have changed.
See
Note 13
- Income Taxes in the Notes to the Consolidated Financial Statements in Part II, Item 8 of this report for further discussion.
Liquidity and Capital Resources
We rely on cash provided by operating activities as a primary source of liquidity, supplemented by current cash on hand and borrowings under our existing credit facilities.
Sources and Uses of Cash
We had cash balances of
$5 million
and
$7 million
as of
August 31, 2018
and
2017
, respectively. Cash balances are intended to be used primarily for working capital, capital expenditures, dividends, share repurchases, investments and acquisitions. We use excess cash on hand to reduce amounts outstanding under our credit facilities. As of
August 31, 2018
, debt was
$107 million
, compared to
$145 million
as of
August 31, 2017
, and debt, net of cash, was
$103 million
, compared to
$138 million
as of
August 31, 2017
(refer to Non-GAAP Financial Measures below).
Operating Activities
Net cash provided by operating activities in fiscal
2018
was
$160 million
, compared to
$100 million
in fiscal
2017
and
$99 million
in fiscal
2016
.
40
/
Schnitzer Steel Industries, Inc. Form 10-K 2018
Table of Contents
SCHNITZER STEEL INDUSTRIES, INC.
Net cash provided by operating activities in fiscal 2018 primarily benefited from improved operating performance compared to the prior year. Sources of cash other than from earnings in fiscal 2018 included a
$26 million
increase in accounts payable due to higher raw material purchase prices and timing of payments, and a
$11 million
combined increase in other accrued liabilities and accrued payroll and related liabilities primarily due to increased incentive compensation liabilities and higher legal accruals. Uses of cash in fiscal 2018 included a
$45 million
increase in accounts receivable primarily due to increases in recycled metal and finished steel selling prices and sales volumes, as well as the timing of sales and collections, and a
$24 million
increase in inventories due to higher raw material purchase prices, higher volumes on hand, and the timing of purchases and sales.
Sources of cash other than from earnings in fiscal 2017 included a $33 million increase in accounts payable primarily due to higher raw material purchase prices and the timing of payments, and a $12 million increase in accrued payroll and related liabilities due to increases in incentive compensation accruals resulting from improved financial performance. Uses of cash in fiscal 2017 included a $22 million increase in inventories due to higher raw material purchase prices, higher volumes on hand and the impact of timing of purchases and sales, and a $36 million increase in accounts receivable primarily due to increases in recycled metal selling prices and sales volumes, and the timing of sales and collections.
Sources of cash in fiscal 2016 included a $28 million decrease in inventories due to the impact of lower raw material prices and timing of purchases and sales, a $6 million decrease in refundable income taxes due to collection of tax refunds, and a $6 million insurance reimbursement. Uses of cash included a $11 million increase in accounts receivable due to the timing of sales and collections. A significant amount of cash generated by operating activities in fiscal 2016 stemmed from a reduction in net working capital primarily as a result of the declining price environment for ferrous and nonferrous scrap metal and finished steel and to a lesser extent lower inventory volumes, as well as positive operating performance.
Investing Activities
Net cash used in investing activities in fiscal
2018
was
$73 million
, compared to
$45 million
in fiscal
2017
and
$30 million
in fiscal
2016
.
Cash used in investing activities in fiscal
2018
,
2017
and
2016
included
$78 million
,
$45 million
and
$35 million
, respectively, in capital expenditures to upgrade our equipment and infrastructure and for additional investments in nonferrous processing technologies and environmental and safety-related assets. For all fiscal years presented, the significant majority of capital expenditures were associated with projects at AMR.
Financing Activities
Net cash used in financing activities for fiscal
2018
was
$88 million
, compared with
$75 million
in fiscal
2017
and
$65 million
in fiscal
2016
.
Cash used in financing activities in fiscal
2018
,
2017
and
2016
included
$21 million
for cash dividends in fiscal 2018 and $20 million for cash dividends in each of fiscal 2017 and 2016, and
$41 million
,
$48 million
and
$36 million
, respectively, in net repayments of debt. Refer to Non-GAAP Financial Measures below. Cash used in financing activities in fiscal 2018 also included
$17 million
for share repurchases, compared no share repurchases in fiscal 2017 and
$3 million
in fiscal 2016.
Following is a summary of our outstanding balances and availability on credit facilities and long-term debt, exclusive of capital lease obligations (in thousands):
|
Outstanding as of August 31, 2018
|
Remaining Availability
|
|||||||
|
Bank secured revolving credit facilities
(1)
|
$
|
100,000
|
|
$
|
601,663
|
|
||
|
Other debt obligations
|
$
|
589
|
|
N/A
|
|
|||
_____________________________
|
(1)
|
Remaining availability is net of
$10 million
of outstanding stand-by letters of credit as of
August 31, 2018
.
|
On August 24, 2018, we and certain of our subsidiaries entered into the First Amendment to the Third Amended and Restated Credit Agreement (the “Amended Credit Agreement”), by and among Schnitzer Steel Industries, Inc., as the U.S. borrower, Schnitzer Steel Canada Ltd., as a Canadian borrower, Bank of America, N.A., as administrative agent, and the other lenders party thereto, which amends and restates our existing credit agreement, dated as of April 6, 2016 (the “Prior Credit Agreement”). The Amended Credit Agreement provides for
$700 million
and C
$15 million
in senior secured revolving credit facilities maturing in August 2023. The
$700 million
credit facility includes a $50 million sublimit for letters of credit, a $25 million sublimit for swingline loans and a $50 million sublimit for multicurrency borrowings. The Prior Credit Agreement provided for $335 million
41
/
Schnitzer Steel Industries, Inc. Form 10-K 2018
Table of Contents
SCHNITZER STEEL INDUSTRIES, INC.
and C$15 million in senior secured credit facilities maturing in April 2021. We incurred $3 million in debt issuance costs in connection with the Amended Credit Agreement, which are amortized to interest expense over the five-year term of the arrangement.
Interest rates on outstanding indebtedness under the credit facilities are based, at our option, on either the London Interbank Offered Rate (“LIBOR”), or the Canadian equivalent for C$ loans, plus a spread of between
1.25%
and
2.75%
, with the amount of the spread based on a pricing grid tied to the Company’s consolidated funded debt to EBITDA ratio, or the greater of (a) the prime rate, (b) the federal funds rate plus
0.50%
, or (c) the daily rate equal to one-month LIBOR plus
1.75%
, in each case plus a spread of between
zero
and
1.50%
based on a pricing grid tied to the Company’s consolidated funded debt to EBITDA ratio. In addition, commitment fees are payable on the unused portion of the credit facilities at rates between
0.15%
and
0.45%
based on a pricing grid tied to the Company’s consolidated funded debt to EBITDA ratio.
We had borrowings outstanding under our credit facilities of
$100 million
and
$140 million
as of
August 31, 2018 and 2017
, respectively. The weighted average interest rate on amounts outstanding under our credit facilities was
3.57%
and
3.48%
as of
August 31, 2018 and 2017
, respectively.
We use the credit facilities to fund working capital, capital expenditures, dividends, share repurchases, investments and acquisitions. The Amended Credit Agreement contains various representations and warranties, events of default and financial and other customary covenants which limit (subject to certain exceptions) our ability to, among other things, incur or suffer to exist certain liens, make investments, incur or guaranty additional indebtedness, enter into consolidations, mergers, acquisitions, and sales of assets, make distributions and other restricted payments, change the nature of our business, engage in transactions with affiliates and enter into restrictive agreements, including agreements that restrict the ability of our subsidiaries to make distributions. The financial covenants under the Amended Credit Agreement include (a) a consolidated fixed charge coverage ratio, defined as the four-quarter rolling sum of consolidated adjusted EBITDA less defined maintenance capital expenditures and certain environmental expenditures divided by consolidated fixed charges and (b) a consolidated leverage ratio, defined as consolidated funded indebtedness divided by the sum of consolidated net worth and consolidated funded indebtedness.
As of
August 31, 2018
, we were in compliance with the financial covenants under the Amended Credit Agreement. The consolidated fixed charge coverage ratio was required to be no less than 1.50 to 1.00 and was
3.97
to 1.00 as of
August 31, 2018
. The consolidated leverage ratio was required to be no more than 0.55 to 1.00 and was
0.15
to 1.00 as of
August 31, 2018
.
The Company’s obligations under the Amended Credit Agreement are guaranteed by substantially all of our subsidiaries. The credit facilities and the related guarantees are secured by senior first priority liens on certain of our and our subsidiaries’ assets, including equipment, inventory and accounts receivable.
While we expect to remain in compliance with the financial covenants under the Amended Credit Agreement, there can be no assurances that we will be able to do so in the event market conditions or other negative factors which adversely impact our results of operations and financial position lead to a trend of consolidated net losses. If we do not maintain compliance with our financial covenants and are unable to obtain an amendment or waiver from our lenders, a breach of a financial covenant would constitute an event of default and allow the lenders to exercise remedies under the agreements, the most severe of which is the termination of the credit facility under our committed bank credit agreement and acceleration of the amounts owed under the agreement. In such case, we would be required to evaluate available alternatives and take appropriate steps to obtain alternative funds. There can be no assurances that any such alternative funds, if sought, could be obtained or, if obtained, would be adequate or on acceptable terms.
As of August 31, 2016, we had $8 million of tax-exempt economic development revenue bonds outstanding with the State of Oregon and scheduled to mature in January 2021. In August 2016, we exercised our option to redeem the bonds prior to maturity. We repaid the bonds in full in September 2016. The $8 million repayment is reported as a cash outflow from financing activities for the year ended August 31, 2017 on the Consolidated Statement of Cash Flows.
Capital Expenditures
Capital expenditures totaled
$78 million
,
$45 million
and
$35 million
for fiscal
2018, 2017 and 2016
, respectively. Capital expenditures in each of these years were primarily to upgrade our equipment, facilities and infrastructure, and for additional investments in nonferrous processing technologies and environmental and safety-related assets. We currently plan to invest in the range of
$80 million
in capital expenditures in fiscal
2019
, excluding capital expenditures for growth projects, using cash generated from operations and available credit facilities. Higher expenditures in fiscal
2018
and planned expenditures in fiscal 2019 reflect increased equipment replacement and upgrades, further investment in nonferrous processing technologies, and environmental projects.
42
/
Schnitzer Steel Industries, Inc. Form 10-K 2018
Table of Contents
SCHNITZER STEEL INDUSTRIES, INC.
Environmental Compliance
Building on our commitment to recycling and operating our business in an environmentally responsible manner, we continue to invest in facilities that improve our environmental presence in the communities in which we operate. As part of our capital expenditures discussed in the prior paragraph, we invested
$20 million
,
$17 million
and
$14 million
for environmental projects in fiscal
2018, 2017 and 2016
, respectively. We plan to invest in the range of $20 million in capital expenditures for environmental projects in fiscal 2019, excluding additional environmental projects currently under review. These projects include investments in storm water systems and equipment to ensure ongoing compliance with air quality and other environmental regulations.
We have been identified by the United States Environmental Protection Agency (“EPA”) as one of the potentially responsible parties that own or operate or formerly owned or operated sites which are part of or adjacent to the Portland Harbor Superfund site (the “Site”). See
Note 8
– Commitments and Contingencies in the Notes to the Consolidated Financial Statements in Part II, Item 8 of this report for a discussion of this matter, as well as other legacy environmental loss contingencies. We believe it is not possible to reasonably estimate the amount or range of costs which we are likely to or which it is reasonably possible that we will incur in connection with the Site, although such costs could be material to our financial position, results of operations, cash flows and liquidity. We have insurance policies that we believe will provide reimbursement for costs we incur for defense, remediation and mitigation for natural resource damages claims in connection with the Site, although there are no assurances that those policies will cover all of the costs which we may incur. Significant cash outflows in the future related to the Site could reduce the amounts available for borrowing that could otherwise be used for working capital, capital expenditures, dividends, share repurchases, investments and acquisitions and could result in our failure to maintain compliance with certain covenants in our debt agreements, and could adversely impact our liquidity.
Share Repurchase Program
Pursuant to our amended share repurchase program, as of
August 31, 2018
we have existing authorization to repurchase up to approximately
1.3 million
shares of our Class A common stock when we deem such repurchases to be appropriate. We evaluate short- and long-range forecasts as well as anticipated sources and uses of cash before determining the course of action in our share repurchase program. As of the beginning of fiscal 2016, we had repurchased approximately
7 million
shares of our Class A common stock under the program. We repurchased approximately
203 thousand
shares for a total of
$3 million
in open-market transactions in fiscal 2016 and approximately
516 thousand
shares for a total of
$17 million
in open-market transactions in fiscal 2018. We did not repurchase any shares in fiscal 2017.
Assessment of Liquidity and Capital Resources
Historically, our available cash resources, internally generated funds, credit facilities and equity offerings have financed our acquisitions, capital expenditures, working capital and other financing needs.
We generally believe our current cash resources, internally generated funds, existing credit facilities and access to the capital markets will provide adequate short-term and long-term liquidity needs for working capital, capital expenditures, dividends, share repurchases, investments and acquisitions, joint ventures, debt service requirements, environmental obligations and other contingencies. However, in the event of a sustained market deterioration, we may need additional liquidity, which would require us to evaluate available alternatives and take appropriate steps to obtain sufficient additional funds. There can be no assurances that any such supplemental funding, if sought, could be obtained or, if obtained, would be adequate or on acceptable terms.
Off-Balance Sheet Arrangements
None requiring disclosure pursuant to Item 303 of Regulation S-K under the Securities Exchange Act of 1934.
43
/
Schnitzer Steel Industries, Inc. Form 10-K 2018
Table of Contents
SCHNITZER STEEL INDUSTRIES, INC.
Contractual Obligations and Commitments
We have certain contractual obligations to make future payments. The following table summarizes these future obligations as of
August 31, 2018
(in thousands):
|
Payment Due by Period
|
|||||||||||||||||||||||||||
|
2019
|
2020
|
2021
|
2022
|
2023
|
Thereafter
|
Total
|
|||||||||||||||||||||
|
Contractual Obligations
|
|||||||||||||||||||||||||||
|
Long-term debt
(1)
|
$
|
98
|
|
$
|
90
|
|
$
|
48
|
|
$
|
50
|
|
$
|
100,054
|
|
$
|
249
|
|
$
|
100,589
|
|
||||||
|
Interest payments on long-term debt
(2)
|
3,601
|
|
3,594
|
|
3,590
|
|
3,588
|
|
3,516
|
|
40
|
|
17,929
|
|
|||||||||||||
|
Capital leases, including interest
|
1,732
|
|
1,712
|
|
1,528
|
|
1,430
|
|
1,304
|
|
1,643
|
|
9,349
|
|
|||||||||||||
|
Operating leases
|
21,004
|
|
18,741
|
|
13,219
|
|
10,453
|
|
8,170
|
|
19,435
|
|
91,022
|
|
|||||||||||||
|
Purchase obligations
(3)
|
88,565
|
|
11,865
|
|
3,347
|
|
1,919
|
|
622
|
|
3,087
|
|
109,405
|
|
|||||||||||||
|
Other
(4)
|
317
|
|
421
|
|
418
|
|
414
|
|
410
|
|
2,919
|
|
4,899
|
|
|||||||||||||
|
Total
|
$
|
115,317
|
|
$
|
36,423
|
|
$
|
22,150
|
|
$
|
17,854
|
|
$
|
114,076
|
|
$
|
27,373
|
|
$
|
333,193
|
|
||||||
|
(1)
|
Long-term debt represents the principal amounts of all outstanding long-term debt, maturities of which extend to 2027.
|
|
(2)
|
Interest payments on long-term debt are based on interest rates in effect as of
August 31, 2018
. As contractual interest rates and the amount of debt outstanding is variable in certain cases, actual cash payments may differ from the estimates provided.
|
|
(3)
|
Purchase obligations include all enforceable, legally binding agreements to purchase goods or services that specify all significant terms, regardless of the duration of the agreement.
|
|
(4)
|
Other contractual obligations consist of pension funding obligations and other accrued liabilities.
|
We maintain stand-by letters of credit to provide support for certain obligations, including workers’ compensation and performance bonds. At
August 31, 2018
, we had
$10 million
outstanding under these arrangements.
Critical Accounting Policies and Estimates
The preparation of financial statements in accordance with accounting principles generally accepted in the United States of America requires us to make certain judgments, estimates, and assumptions regarding uncertainties that affect the reported amounts of assets, liabilities, revenues and expenses, and related disclosure of contingent assets and liabilities. An accounting policy is deemed to be critical if it requires an accounting estimate to be made based on assumptions and judgments about matters that are inherently uncertain at the time the estimate is made, if different estimates reasonably could have been used, or if changes in the estimate that are reasonably likely to occur could materially impact our consolidated financial statements. We deem critical accounting policies to be those that are most important to the portrayal of our financial condition and results of operations. Because of the uncertainty inherent in these matters, actual results could differ from the estimates we use in applying the critical accounting policies. We are not currently aware of any reasonably likely events or circumstances that would result in materially different amounts being reported.
Our critical accounting estimates include those related to goodwill, long-lived assets, environmental costs, inventories, accounting for business combinations, revenue recognition, and income taxes.
Goodwill
We evaluate goodwill for impairment annually and upon the occurrence of certain triggering events or substantive changes in circumstances that indicate that the fair value of goodwill may be impaired. Impairment of goodwill is tested at the reporting unit level. A reporting unit is an operating segment or one level below an operating segment (referred to as a ‘component’).
When testing goodwill for impairment, we have the option to first assess qualitative factors to determine whether the existence of events or circumstances leads to a determination that it is more likely than not that the estimated fair value of a reporting unit is less than its carrying amount. If we elect to perform a qualitative assessment and determine that an impairment is more likely than not, we are then required to perform the quantitative impairment test, otherwise no further analysis is required. We also may elect not to perform the qualitative assessment and, instead, proceed directly to the quantitative impairment test.
As of the beginning of the third quarter of fiscal 2017, we early-adopted an accounting standard update that revises the quantitative goodwill impairment test with no impact to the Consolidated Financial Statements. Under the revised guidance, we apply a one-step quantitative test and record the amount of goodwill impairment as the excess of a reporting unit’s carrying amount over its fair value, not to exceed the total amount of goodwill allocated to that reporting unit.
44
/
Schnitzer Steel Industries, Inc. Form 10-K 2018
Table of Contents
SCHNITZER STEEL INDUSTRIES, INC.
We estimate the fair value of the reporting units using an income approach based on the present value of expected future cash flows utilizing a market-based weighted average cost of capital (“WACC”) determined separately for each reporting unit. To estimate the present value of the cash flows that extend beyond the final year of the discounted cash flow model, we employ a terminal value technique, whereby we use estimated operating cash flows minus capital expenditures, adjust for changes in working capital requirements in the final year of the model, and then discount these estimated cash flows by the WACC to establish the terminal value.
The determination of fair value using the income approach requires judgment and involves the use of significant estimates and assumptions about expected future cash flows derived from internal forecasts and the impact of market conditions on those assumptions. Critical assumptions primarily include revenue growth rates driven by future commodity prices and volume expectations, operating margins, capital expenditures, working capital requirements, tax rates, terminal growth rates, discount rates, benefits associated with a taxable transaction and synergistic benefits available to market participants.
We also use a market approach based on earnings multiple data and our Company’s market capitalization to corroborate our reporting units’ valuations. We reconcile the Company’s market capitalization to the aggregated estimated fair value of our reporting units, including consideration of a control premium representing the estimated amount a market participant would pay to obtain a controlling interest.
As a result of the inherent uncertainty associated with forming the estimates described above, actual results could differ from those estimates. Future events and changing market conditions may impact our assumptions as to future revenue and operating margin growth rates, market-based WACC, and other factors that may result in changes in our estimates of the reporting units’ fair value. Although we believe the assumptions used in testing our reporting units’ goodwill for impairment are reasonable, declines in market conditions from current levels, a trend of weaker than anticipated financial performance for the reporting unit with allocated goodwill, a decline in our share price from current levels for a sustained period of time, or an increase in the market-based WACC, among other factors, could significantly impact our impairment analysis and may result in future goodwill impairment charges that, if incurred, could have a material adverse effect on our financial condition and results of operations.
In the fourth quarter of fiscal
2018
, we performed the annual goodwill impairment test as of July 1,
2018
. As of the testing date, the balance of the Company’s goodwill of
$168 million
was carried by two reporting units within the AMR operating segment. We elected to first assess qualitative factors to determine whether the existence of events or circumstances led to a determination that it is more likely than not that the estimated fair value of each reporting unit is less than its carrying amount. As a result of the qualitative assessment, we concluded that it is not more likely than not that the fair value of each reporting unit is less than its carrying value as of the testing date and, therefore, no further impairment testing was required.
Long-Lived Assets
We test long-lived tangible and intangible assets for impairment at the asset group level, which is determined based on the lowest level for which identifiable cash flows are largely independent of the cash flows of other groups of assets and liabilities. For our metals recycling operations reported within AMR, an asset group generally consists of the regional shredding and export operation along with surrounding feeder yards. For regions with no shredding and export operations, each metals recycling yard is an asset group. For our auto parts operations, generally each auto parts store is an asset group. The combined steel manufacturing and metals recycling operations within CSS are a single asset group. We test our asset groups for impairment when certain triggering events or changes in circumstances indicate that the carrying value of the asset group may be impaired. If the carrying value of the asset group is not recoverable because it exceeds the estimate of future undiscounted cash flows from the use and eventual disposition of the asset group, an impairment loss is recognized by the amount the carrying value exceeds its fair value, if any. The impairment loss is allocated to the long-lived assets of the group on a pro rata basis using the relative carrying amounts of those assets, except that the loss allocated to an individual long-lived asset of the group shall not reduce the carrying amount of that asset below its fair value. Fair value is determined primarily using the cost and market approaches.
With respect to individual long-lived assets, changes in circumstances may merit a change in the estimated useful lives or salvage values of the assets, which are accounted for prospectively in the period of change. For such assets, the useful life is shortened based on our plans to dispose of or abandon the asset before the end of its original useful life and depreciation is accelerated beginning when that determination is made.
45
/
Schnitzer Steel Industries, Inc. Form 10-K 2018
Table of Contents
SCHNITZER STEEL INDUSTRIES, INC.
Environmental Costs
We operate in industries that inherently possess environmental risks. To manage these risks, we employ both our own environmental staff and outside consultants. Environmental staff and finance personnel meet regularly to discuss environmental risks. We estimate future costs for known environmental remediation requirements and accrue for them on an undiscounted basis when it is probable that we have incurred a liability and the related costs can be reasonably estimated but the timing of incurring the estimated costs is unknown. The regulatory and government management of these projects is complex, which is one of the primary factors that make it difficult to assess the cost of potential and future remediation. When only a wide range of estimated amounts can be reasonably established and no other amount within the range is better than any other, the low end of the range is recorded in the financial statements. If further developments or resolution of an environmental matter result in facts and circumstances that are significantly different than the assumptions used to develop these liabilities, the accrual for environmental remediation could be materially understated or overstated. Adjustments to these liabilities are made when additional information becomes available that affects the estimated costs to study or remediate any environmental issues or when expenditures for which accruals are established are made. The factors we consider in the recognition and measurement of environmental liabilities include:
|
•
|
Current regulations, both at the time the liability is established and during the course of the investigation or remediation process, which specify standards for acceptable remediation;
|
|
•
|
Information about the site which becomes available as the site is studied and remediated;
|
|
•
|
The professional judgment of senior level internal staff, who take into account similar, recent instances of environmental remediation issues, and studies of our sites, among other considerations;
|
|
•
|
Available technologies that can be used for remediation; and
|
|
•
|
The number and financial condition of other potentially responsible parties and the extent of their responsibility for the costs of study and remediation.
|
Our accrued environmental liabilities as of
August 31, 2018
included
$2 million
related to third party investigation costs for the Portland Harbor Superfund site. The Company believes that costs associated with certain pre-remedial design investigation and baseline sampling will be fully covered by existing insurance coverage and, thus, also had an insurance receivable recorded for $2 million as of
August 31, 2018
. Because there has not been a determination of the specific remediation actions that will be required, the amount of natural resource damages or the allocation of costs of the investigations and any remedy and natural resource damages among the PRPs, we believe it is not possible to reasonably estimate the amount or range of costs which we are likely or which it is reasonably possible that we may incur in connection with the Site, although such costs could be material to our financial position, results of operations, cash flows and liquidity. Therefore, no additional amounts have been accrued. Further, we have been notified that we are or may be a potentially responsible party at sites other than Portland Harbor which are currently or formerly owned or operated by us or at other sites where we may have responsibility for such costs due to past disposal or other activities. See Contingencies – Environmental in
Note 8
– Commitments and Contingencies in the Notes to the Consolidated Financial Statements in Part II, Item 8 of this report.
Inventories
Our inventories consist of processed and unprocessed scrap metal (ferrous, nonferrous, and nonferrous recovered joint products arising from the manufacturing process), semi-finished steel products (billets), finished steel products (primarily rebar, wire rod, and merchant bar), used and salvaged vehicles, and supplies. Inventories are stated at the lower of cost and net realizable value. We consider estimated future selling prices when determining the estimated net realizable value for our inventory. As we generally sell our recycled ferrous metal under contracts that provide for shipment within 30 to 60 days after the price is agreed, we utilize the selling prices under committed contracts and sales orders for determining the estimated market price of quantities on hand that will be shipped under these contracts and sales orders.
The accounting process we use to record scrap metal quantities relies on significant estimates. With respect to unprocessed scrap metal inventory, we rely on weighed quantities that are reduced by estimated amounts that are moved into production. This process utilizes estimated metal recoveries and yields that are based on historical trends. Over time, these estimates are reasonably reliable indicators of recycled scrap metal ultimately produced; however, actual recoveries and yields can vary depending on product quality, moisture content and source of the unprocessed metal. If ultimate recoveries and yields are significantly different than estimated, the value of our inventory could be materially overstated or understated. To assist in validating the reasonableness of these estimates, we periodically review shrink factors and perform monthly physical inventories. Due to the inherent nature of our scrap metal inventories, including variations in product density, holding period and production processes utilized to manufacture the products, physical inventories will not necessarily detect all variances for scrap metal inventory such that estimates of quantities are required. To mitigate this risk, we adjust our ferrous physical inventories when the volume of a commodity is low and a physical inventory count is deemed to more accurately estimate the remaining volume.
46
/
Schnitzer Steel Industries, Inc. Form 10-K 2018
Table of Contents
SCHNITZER STEEL INDUSTRIES, INC.
Revenue Recognition
We recognize revenue when we have a contract or purchase order from a customer with a fixed or determinable price, the title and risk of loss transfer to the buyer and collectibility is reasonably assured. Title for both metal and finished steel products transfers based on contract terms. A significant portion of our ferrous export sales of recycled metal are made with letters of credit, reducing credit risk. However, domestic recycled ferrous metal sales, nonferrous sales and sales of finished steel are generally made on open account. Nonferrous export sales typically require a deposit prior to shipment. All sales made on open account are evaluated for collectibility prior to revenue recognition. Additionally, when contractual terms support revenue recognition based on transfer of title and risk of loss we recognize revenues on partially loaded shipments, which requires an estimate of the product weight involved in any partial shipments at period end. Retail revenues are recognized when customers pay for parts. Historically, there have been very few sales returns and adjustments that impact the ultimate collection of revenues; therefore, no material provisions have been made when the sale is recognized. We present taxes assessed by governmental authorities collected from customers on a net basis. Therefore, the taxes are excluded from revenue and are shown as a liability on our Consolidated Balance Sheets until remitted. See the discussion on credit risk contained in Item 7A of this report.
Income Taxes
Tax Cuts and Jobs Act and SEC Staff Accounting Bulletin 118
On December 22, 2017, the President of the United States signed and enacted into law comprehensive tax legislation commonly referred to as the Tax Cuts and Jobs Act (“Tax Act”), which, except for certain provisions, is effective for tax years beginning on or after January 1, 2018. The Tax Act’s primary change is a reduction in the federal statutory corporate tax rate from 35% to 21%, resulting in a pro rata reduction of the Company’s tax rate from 35% to 25.7% for fiscal 2018. Other changes in the Tax Act effective for fiscal 2018 include, but are not limited to, acceleration of deductions for qualified property placed in service after September 27, 2017. In addition, effective for the Company's fiscal 2019 year, the Tax Act also limits the deductibility of some executive compensation and eliminates the deduction for qualified domestic production activities. Changes in the Tax Act that did not significantly impact us upon enactment include the implementation of a modified territorial tax system and other modifications to how foreign earnings are subject to U.S. tax.
As a change in tax law is accounted for in the period of enactment, we recognized a discrete benefit in the second quarter of fiscal 2018 due to the revaluation of U.S. net deferred tax liabilities to reflect the lower statutory rate. We also recorded a benefit in the second quarter of fiscal 2018 resulting from application of the lower federal statutory corporate tax rate to fiscal 2018 projected taxable income.
Also, on December 22, 2017, the Securities and Exchange Commission issued Staff Accounting Bulletin 118 (“SAB 118”), which provides guidance on accounting for the impacts of the Tax Act. SAB 118 provides a measurement period, not to exceed one year from the Tax Act enactment date, for companies to complete the accounting under Accounting Standards Codification Topic 740,
Income Taxes
(“ASC 740”)
.
In accordance with SAB 118, a company must reflect the income tax effects of those aspects of the Tax Act for which the accounting under ASC 740 is complete. To the extent that a company's accounting for certain income tax effects of the Tax Act is incomplete, but it is able to determine a reasonable estimate, it must record a provisional estimate in the financial statements. Provisional estimates are subject to adjustment during the measurement period until the accounting is complete. If a company cannot determine a provisional estimate to be included in the financial statements, it must continue to apply ASC 740 on the basis of the provisions of the tax laws that were in effect immediately before the enactment of the Tax Act.
Our accounting for the impacts of the Tax Act is incomplete, and the recorded amounts are provisional estimates as of
August 31, 2018
. While we were able to reasonably estimate the impact of the reduction in the corporate rate on our U.S. net deferred tax liabilities, it may be affected by other analyses related to the Tax Act including, but not limited to, changes in the underlying accounts to which the respective deferred tax assets and liabilities relate and the state tax effects of adjustments made to federal temporary differences. The provisional benefit resulting from application of the Tax Act's lower corporate tax rate to fiscal 2018 taxable income reflects reasonable estimates of the effects of the Tax Act including, but not limited to, capital expenditures for qualified property that will be placed in service as of the end of fiscal 2018. The Company has not recorded any material adjustments to the provision amounts recorded in the second quarter of fiscal 2018 related to the Tax Act.
Valuation Allowances
We assess the realizability of our deferred tax assets on a quarterly basis through an analysis of potential sources of future taxable income, including prior year taxable income available to absorb a carryback of tax losses, reversals of existing taxable temporary differences, tax planning strategies, and forecasts of taxable income. We consider all negative and positive evidence, including the weight of the evidence, to determine if valuation allowances against deferred tax assets are required. In fiscal 2018, we released valuation allowances against certain U.S., Canadian and state deferred tax assets resulting in discrete tax benefits totaling
$37 million
. The release of these valuation allowances was the result of sufficient positive evidence, including cumulative income in
47
/
Schnitzer Steel Industries, Inc. Form 10-K 2018
Table of Contents
SCHNITZER STEEL INDUSTRIES, INC.
recent years and projections of future taxable income based primarily on our improved financial performance, that it is more-likely-than-not that the deferred tax assets will be realized. We continue to maintain valuation allowances against certain U.S., Canadian and state and all Puerto Rican deferred tax assets.
Recently Issued Accounting Standards
For a description of recent accounting pronouncements that may have an impact on our financial condition, results of operations or cash flows, see
Note 3
– Recent Accounting Pronouncements in the Notes to the Consolidated Financial Statements in Part II, Item 8 of this report, and the following:
New Revenue Accounting Standard
In May 2014, an accounting standards update was issued that clarifies the principles for recognizing revenue from contracts with customers, which is effective for us as of September 1, 2018. The update supersedes the existing standard for recognizing revenue and the guidance is applicable to all contracts with customers regardless of industry-specific or transaction-specific fact patterns. The adoption of the standard is not expected to have a material impact on our financial position, net income or cash flows. However, we have identified certain scrap metal purchase and sale arrangements for which we currently recognize revenue for the gross amount of consideration we expect to be entitled from the customer (as principal), but for which under the new revenue standard we will recognize revenue as the net amount of consideration that we expect to retain after paying the scrap metal supplier (as agent). This change in the classification of the cost of scrap metal purchased under such arrangements will have the effect of reducing the amount of revenues reported in the financial statements, while having no impact on net income. Based on analysis performed to date and recent historical levels of such scrap metal purchase and sale arrangements, we estimate the decrease in our annual revenues as a result of implementing this change in fiscal 2019 will be between $30 million and $40 million with no impact on net income.
Non-GAAP Financial Measures
Debt, net of cash
Debt, net of cash is the difference between (i) the sum of long-term debt and short-term borrowings (i.e., total debt) and (ii) cash and cash equivalents. We believe that debt, net of cash is a useful measure for investors because, as cash and cash equivalents can be used, among other things, to repay indebtedness, netting this against total debt is a useful measure of our leverage.
The following is a reconciliation of debt, net of cash (in thousands):
|
August 31, 2018
|
August 31, 2017
|
August 31, 2016
|
|||||||||
|
Short-term borrowings
|
$
|
1,139
|
|
$
|
721
|
|
$
|
8,374
|
|
||
|
Long-term debt, net of current maturities
|
106,237
|
|
144,403
|
|
184,144
|
|
|||||
|
Total debt
|
107,376
|
|
145,124
|
|
192,518
|
|
|||||
|
Less: cash and cash equivalents
|
4,723
|
|
7,287
|
|
26,819
|
|
|||||
|
Total debt, net of cash
|
$
|
102,653
|
|
$
|
137,837
|
|
$
|
165,699
|
|
||
Net borrowings (repayments) of debt
Net borrowings (repayments) of debt is the sum of borrowings from long-term debt, repayments of long-term debt, proceeds from line of credit, and repayments of line of credit. We present this amount as the net change in our borrowings (repayments) for the period because we believe it is useful for investors as a meaningful presentation of the change in debt.
The following is a reconciliation of net borrowings (repayments) of debt (in thousands):
|
Fiscal 2018
|
Fiscal 2017
|
Fiscal 2016
|
|||||||||
|
Borrowings from long-term debt
|
$
|
515,480
|
|
$
|
433,336
|
|
$
|
152,311
|
|
||
|
Proceeds from line of credit
|
—
|
|
—
|
|
135,500
|
|
|||||
|
Repayments of long-term debt
|
(556,456
|
)
|
(481,757
|
)
|
(187,951
|
)
|
|||||
|
Repayments of line of credit
|
—
|
|
—
|
|
(135,500
|
)
|
|||||
|
Net repayments of debt
|
$
|
(40,976
|
)
|
$
|
(48,421
|
)
|
$
|
(35,640
|
)
|
||
48
/
Schnitzer Steel Industries, Inc. Form 10-K 2018
Table of Contents
SCHNITZER STEEL INDUSTRIES, INC.
Adjusted consolidated operating income (loss), adjusted AMR operating income, adjusted CSS operating income, adjusted net income (loss) from continuing operations attributable to SSI, and adjusted diluted earnings (loss) per share from continuing operations attributable to SSI
Management believes that providing these non-GAAP financial measures adds a meaningful presentation of our results from business operations excluding adjustments for goodwill impairment charges, other asset impairment charges net of recoveries, restructuring charges and other exit-related activities, recoveries related to the resale or modification of previously contracted shipments, the non-cash write-off of debt issuance costs, and income tax expense (benefit) allocated to these adjustments, items which are not related to underlying business operational performance, and improves the period-to-period comparability of our results from business operations. Adjusted operating results in fiscal 2015 excluded the impact from the resale or modification of the terms, each at significantly lower prices due to sharp declines in selling prices, of certain previously contracted bulk shipments for delivery during fiscal 2015. Recoveries resulting from settlements with the original contract parties, which began in fiscal 2016 and concluded in fiscal 2018, are reported within SG&A expense in the Consolidated Statements of Operations and are also excluded from the measures.
The following is a reconciliation of adjusted consolidated operating income (loss), adjusted AMR operating income, and adjusted CSS operating income (in thousands):
|
Fiscal 2018
|
Fiscal 2017
|
Fiscal 2016
|
|||||||||
|
Consolidated operating income (loss):
|
|||||||||||
|
As reported
|
$
|
148,988
|
|
$
|
56,013
|
|
$
|
(7,842
|
)
|
||
|
Goodwill impairment charges
|
—
|
|
—
|
|
8,845
|
|
|||||
|
Other asset impairment charges (recoveries), net
|
(1,021
|
)
|
(717
|
)
|
20,682
|
|
|||||
|
Restructuring charges and other exit-related activities
|
(661
|
)
|
(109
|
)
|
6,781
|
|
|||||
|
Resale or modification of previously contracted shipments, net of recoveries
|
(417
|
)
|
(1,144
|
)
|
(694
|
)
|
|||||
|
Adjusted
|
$
|
146,889
|
|
$
|
54,043
|
|
$
|
27,772
|
|
||
|
AMR operating income:
|
|||||||||||
|
As reported
|
$
|
169,120
|
|
$
|
91,405
|
|
$
|
23,168
|
|
||
|
Goodwill impairment charges
|
—
|
|
—
|
|
8,845
|
|
|||||
|
Other asset impairment charges (recoveries), net
|
(933
|
)
|
(184
|
)
|
16,411
|
|
|||||
|
Resale or modification of previously contracted shipments, net of recoveries
|
(417
|
)
|
(1,144
|
)
|
(694
|
)
|
|||||
|
Adjusted
|
$
|
167,770
|
|
$
|
90,077
|
|
$
|
47,730
|
|
||
|
CSS operating income:
|
|||||||||||
|
As reported
|
$
|
38,286
|
|
$
|
5,275
|
|
$
|
4,696
|
|
||
|
Other asset impairment charges (recoveries), net
|
(88
|
)
|
(533
|
)
|
4,192
|
|
|||||
|
Adjusted
|
$
|
38,198
|
|
$
|
4,742
|
|
$
|
8,888
|
|
||
49
/
Schnitzer Steel Industries, Inc. Form 10-K 2018
Table of Contents
SCHNITZER STEEL INDUSTRIES, INC.
The following is a reconciliation of adjusted net income (loss) from continuing operations attributable to SSI and adjusted diluted earnings (loss) per share from continuing operations attributable to SSI (in thousands, except per share data):
|
Fiscal 2018
|
Fiscal 2017
|
Fiscal 2016
|
|||||||||
|
Net income (loss) from continuing operations attributable to SSI:
|
|||||||||||
|
As reported
|
$
|
156,105
|
|
$
|
44,901
|
|
$
|
(18,061
|
)
|
||
|
Goodwill impairment charges
|
—
|
|
—
|
|
8,845
|
|
|||||
|
Other asset impairment charges (recoveries), net
|
(1,021
|
)
|
(717
|
)
|
20,682
|
|
|||||
|
Restructuring charges and other exit-related activities
|
(661
|
)
|
(109
|
)
|
6,781
|
|
|||||
|
Resale or modification of previously contracted shipments, net of recoveries
|
(417
|
)
|
(1,144
|
)
|
(694
|
)
|
|||||
|
Non-cash write-off of debt issuance costs
|
—
|
|
—
|
|
768
|
|
|||||
|
Income tax expense allocated to adjustments
(1)
|
5
|
|
—
|
|
529
|
|
|||||
|
Adjusted
|
$
|
154,011
|
|
$
|
42,931
|
|
$
|
18,850
|
|
||
|
Diluted earnings (loss) per share from continuing operations attributable to SSI:
|
|||||||||||
|
As reported
|
$
|
5.46
|
|
$
|
1.60
|
|
$
|
(0.66
|
)
|
||
|
Goodwill impairment charges, per share
|
—
|
|
—
|
|
0.32
|
|
|||||
|
Other asset impairment charges (recoveries), net, per share
|
(0.04
|
)
|
(0.03
|
)
|
0.76
|
|
|||||
|
Restructuring charges and other exit-related activities, per share
|
(0.02
|
)
|
—
|
|
0.25
|
|
|||||
|
Resale or modification of certain previously contracted shipments, net of recoveries, per share
|
(0.01
|
)
|
(0.04
|
)
|
(0.03
|
)
|
|||||
|
Non-cash write-off of debt issuance costs, per share
|
—
|
|
—
|
|
0.03
|
|
|||||
|
Income tax expense allocated to adjustments, per share
(1)
|
—
|
|
—
|
|
0.02
|
|
|||||
|
Adjusted
|
$
|
5.39
|
|
$
|
1.53
|
|
$
|
0.69
|
|
||
|
(1)
|
Income tax allocated to the aggregate adjustments reconciling reported and adjusted net income (loss) from continuing operations attributable to SSI and diluted earnings (loss) per share from continuing operations attributable to SSI is determined based on a tax provision calculated with and without the adjustments.
|
We believe that these non-GAAP financial measures allow for a better understanding of our operating and financial performance. These non-GAAP financial measures should be considered in addition to, but not as a substitute for, the most directly comparable U.S. GAAP measures. Although we find these non-GAAP financial measures useful in evaluating the performance of our business, our reliance on these measures is limited because the adjustments often have a material impact on our consolidated financial statements presented in accordance with GAAP. Therefore, we typically use these adjusted amounts in conjunction with our GAAP results to address these limitations.
50
/
Schnitzer Steel Industries, Inc. Form 10-K 2018
Table of Contents
SCHNITZER STEEL INDUSTRIES, INC.
Commodity Price Risk
We are exposed to commodity price risk, mainly associated with variations in the market price for ferrous and nonferrous metals, including scrap metal, finished steel products, autobodies and other commodities. The timing and magnitude of industry cycles are difficult to predict and are impacted by general economic conditions. We respond to increases and decreases in forward selling prices by adjusting purchase prices. We actively manage our exposure to commodity price risk and monitor the actual and expected spread between forward selling prices and purchase costs and processing and shipping expense. Sales contracts are based on prices negotiated with our customers, and generally orders are placed 30 to 60 days ahead of shipment date. However, financial results may be negatively impacted when forward selling prices fall more quickly than we can adjust purchase prices or when customers fail to meet their contractual obligations. We assess the net realizable value of inventory (“NRV”) each quarter based upon contracted sales orders and estimated future selling prices. Based on contracted sales and estimates of future selling prices, a 10% decrease in the selling price of inventory would not have had a material NRV impact on any of our reportable segments as of
August 31, 2018 and 2017
.
Interest Rate Risk
We are exposed to market risk associated with changes in interest rates related to our debt obligations. Our revolving credit facility is subject to variable interest rates and therefore have exposure to changes in interest rates. If market interest rates had changed 10% from actual interest rate levels in fiscal
2018
or
2017
, the effect on our interest expense and net income would not have been material.
Credit Risk
Credit risk relates to the risk of loss that might occur as a result of non-performance by counterparties of their contractual obligations to take delivery of scrap metal and finished steel products and to make financial settlements of these obligations, or to provide sufficient quantities of scrap metal or payment to settle advances, loans and other contractual receivables in connection with demolition and scrap extraction projects. We manage our exposure to credit risk through a variety of methods, including shipping ferrous scrap metal exports under letters of credit, collection of deposits prior to shipment for certain nonferrous export customers, establishment of credit limits for sales on open terms, credit insurance and designation of collateral and financial guarantees securing advances, loans and other contractual receivables.
Historically, we have shipped almost all of our large shipments of ferrous scrap metal to foreign customers under contracts supported by letters of credit issued or confirmed by banks deemed creditworthy. The letters of credit ensure payment by the customer. As we generally sell export recycled ferrous metal under contracts or orders that generally provide for shipment within 30 to 60 days after the price is agreed, our customers typically do not have difficulty obtaining letters of credit from their banks in periods of rising ferrous prices, as the value of the letters of credit are collateralized by the value of the inventory on the ship. However, in periods of significantly declining prices, our customers may not be able to obtain letters of credit for the full sales value of the inventory to be shipped.
As of August 31,
2018
and
2017
,
33%
of our trade accounts receivable balance were covered by letters of credit. Of the remaining balance,
99%
and
88%
was less than 60 days past due as of
August 31, 2018 and 2017
, respectively.
Foreign Currency Exchange Rate Risk
We are exposed to foreign currency exchange rate risk, mainly associated with sales transactions and related accounts receivable denominated in the U.S. Dollar by our Canadian subsidiary with a functional currency of the Canadian Dollar. In certain instances, we use derivatives to manage some portion of this risk. As of
August 31, 2018
, we did not have any derivative contracts.
51
/
Schnitzer Steel Industries, Inc. Form 10-K 2018
Table of Contents
SCHNITZER STEEL INDUSTRIES, INC.
Management’s Annual Report on Internal Control Over Financial Reporting
Management of the Company is responsible for establishing and maintaining adequate internal control over financial reporting, as such term is defined in Rules 13a-15(f) and 15d-15(f) under the Securities Exchange Act of 1934. The Company’s internal control over financial reporting is a process designed by, or under the supervision of, the Company’s principal executive and principal financial officers and effected by the Company’s Board of Directors, management and other personnel to provide reasonable assurance regarding the reliability of financial reporting and the preparation of financial statements for external purposes in accordance with generally accepted accounting principles.
The Company’s internal control over financial reporting includes policies and procedures that relate to the maintenance of records that, in reasonable detail, accurately and fairly reflect the transactions and dispositions of assets of the Company; provide reasonable assurance that transactions are recorded as necessary to permit the preparation of the Company’s consolidated financial statements in accordance with generally accepted accounting principles and that the receipts and expenditures of the Company are being made only in accordance with authorization of the Company’s management and directors; and provide reasonable assurance regarding prevention or timely detection of unauthorized acquisition, use or disposition of the Company’s assets that could have a material effect on the Company’s consolidated financial statements.
Because of its inherent limitations, internal control over financial reporting may not prevent or detect misstatements. Also, projection of any evaluation of effectiveness to future periods is subject to the risk that controls may become inadequate because of changes in conditions or that the degree of compliance with the policies and procedures may deteriorate.
Management of the Company assessed the effectiveness of the Company’s internal control over financial reporting using the criteria established in
Internal Control – Integrated Framework (2013)
issued by the Committee of Sponsoring Organizations of the Treadway Commission (“COSO”). Based on its assessment, management determined that the Company’s internal control over financial reporting was effective as of
August 31, 2018
.
PricewaterhouseCoopers LLP, the independent registered public accounting firm that audited the Company’s consolidated financial statements included in this Annual Report, also audited the effectiveness of the Company’s internal control over financial reporting as of
August 31, 2018
, as stated in their report included herein.
|
Tamara L. Lundgren
|
Richard D. Peach
|
|
|
President and Chief Executive Officer
|
Senior Vice President, Chief Financial Officer and Chief of Corporate Operations
|
|
|
October 24, 2018
|
October 24, 2018
|
|
52
/
Schnitzer Steel Industries, Inc. Form 10-K 2018
Table of Contents
SCHNITZER STEEL INDUSTRIES, INC.
Report of Independent Registered Public Accounting Firm
To the Board of Directors and Shareholders of Schnitzer Steel Industries, Inc.:
Opinions on the Financial Statements and Internal Control over Financial Reporting
We have audited the accompanying consolidated balance sheets of Schnitzer Steel Industries, Inc.
and its subsidiaries
as of
August 31, 2018 and 2017,
and the related consolidated statements of operations, comprehensive income (loss), equity and cash flows for each of the three years in the period ended August 31, 2018 including the related notes and financial statement schedule listed in the index appearing under Item 15(a)(2) (collectively referred to as the “consolidated financial statements”). We also have audited the Company's internal control over financial reporting as of August 31, 2018 based on criteria established in
Internal Control - Integrated Framework
(2013)
issued by the Committee of Sponsoring Organizations of the Treadway Commission (COSO).
In our opinion, the consolidated
financial statements referred to above present fairly, in all material respects, the financial position of the Company as of August 31, 2018 and 2017
,
and the results of its operations and its cash flows for each of the three years in the period ended August 31, 2018 in conformity with accounting principles generally accepted in the United States of America. Also in our opinion, the Company maintained, in all material respects, effective internal control over financial reporting as of August 31, 2018, based on criteria established in
Internal Control - Integrated Framework
(2013)
issued by the COSO.
Basis for Opinions
The Company's management is responsible for these consolidated financial statements, for maintaining effective internal control over financial reporting, and for its assessment of the effectiveness of internal control over financial reporting, included in the accompanying
Management’s Annual Report on Internal Control Over Financial Reporting. Our responsibility is to express opinions on the Company’s consolidated
financial statements and on the Company's internal control over financial reporting based on our audits. We are a public accounting firm registered with the Public Company Accounting Oversight Board (United States) (“PCAOB”) and are required to be independent with respect to the Company in accordance with the U.S. federal securities laws and the applicable rules and regulations of the Securities and Exchange Commission and the PCAOB.
We conducted our audits in accordance with the standards of the PCAOB. Those standards require that we plan and perform the audits to obtain reasonable assurance about whether the consolidated
financial statements are free of material misstatement, whether due to error or fraud, and whether effective internal control over financial reporting was maintained in all material respects.
Our audits of the consolidated financial statements included performing procedures to assess the risks of material misstatement of the consolidated financial statements, whether due to error or fraud, and performing procedures that respond to those risks. Such procedures included examining, on a test basis, evidence regarding the amounts and disclosures in the consolidated financial statements. Our audits also included evaluating the accounting principles used and significant estimates made by management, as well as evaluating the overall presentation of the consolidated financial statements. Our audit of internal control over financial reporting included obtaining an understanding of internal control over financial reporting, assessing the risk that a material weakness exists, and testing and evaluating the design and operating effectiveness of internal control based on the assessed risk. Our audits also included performing such other procedures as we considered necessary in the circumstances. We believe that our audits provide a reasonable basis for our opinions.
Definition and Limitations of Internal Control over Financial Reporting
A company’s internal control over financial reporting is a process designed to provide reasonable assurance regarding the reliability of financial reporting and the preparation of financial statements for external purposes in accordance with generally accepted accounting principles. A company’s internal control over financial reporting includes those policies and procedures that (i) pertain to the maintenance of records that, in reasonable detail, accurately and fairly reflect the transactions and dispositions of the assets of the company; (ii) provide reasonable assurance that transactions are recorded as necessary to permit preparation of financial statements in accordance with generally accepted accounting principles, and that receipts and expenditures of the company are being made only in accordance with authorizations of management and directors of the company; and (iii) provide reasonable assurance regarding prevention or timely detection of unauthorized acquisition, use, or disposition of the company’s assets that could have a material effect on the financial statements.
53
/
Schnitzer Steel Industries, Inc. Form 10-K 2018
Table of Contents
SCHNITZER STEEL INDUSTRIES, INC.
Because of its inherent limitations, internal control over financial reporting may not prevent or detect misstatements. Also, projections of any evaluation of effectiveness to future periods are subject to the risk that controls may become inadequate because of changes in conditions, or that the degree of compliance with the policies or procedures may deteriorate.
/s/ PricewaterhouseCoopers LLP
PricewaterhouseCoopers LLP
Portland, Oregon
October 24, 2018
We have served as the Company’s auditor since 1976, which includes periods before the Company became subject to SEC reporting requirements.
54
/
Schnitzer Steel Industries, Inc. Form 10-K 2018
SCHNITZER STEEL INDUSTRIES, INC.
(in thousands)
|
|
August 31,
|
||||||
|
|
2018
|
2017
|
|||||
|
Assets
|
|||||||
|
Current assets:
|
|||||||
|
Cash and cash equivalents
|
$
|
4,723
|
|
$
|
7,287
|
|
|
|
Accounts receivable, net
|
169,418
|
|
138,998
|
|
|||
|
Inventories
|
205,877
|
|
166,942
|
|
|||
|
Refundable income taxes
|
4,668
|
|
2,366
|
|
|||
|
Prepaid expenses and other current assets
|
63,673
|
|
22,357
|
|
|||
|
Total current assets
|
448,359
|
|
337,950
|
|
|||
|
Property, plant and equipment, net
|
415,711
|
|
390,629
|
|
|||
|
Investments in joint ventures
|
11,532
|
|
11,204
|
|
|||
|
Goodwill
|
168,065
|
|
167,835
|
|
|||
|
Intangibles, net
|
4,358
|
|
4,424
|
|
|||
|
Deferred income taxes
|
30,333
|
|
—
|
|
|||
|
Other assets
|
26,459
|
|
21,713
|
|
|||
|
Total assets
|
$
|
1,104,817
|
|
$
|
933,755
|
|
|
|
Liabilities and Equity
|
|||||||
|
Current liabilities:
|
|||||||
|
Short-term borrowings
|
$
|
1,139
|
|
$
|
721
|
|
|
|
Accounts payable
|
128,495
|
|
94,674
|
|
|||
|
Accrued payroll and related liabilities
|
46,410
|
|
41,593
|
|
|||
|
Environmental liabilities
|
6,682
|
|
2,007
|
|
|||
|
Accrued income taxes
|
—
|
|
9
|
|
|||
|
Other accrued liabilities
|
71,951
|
|
37,256
|
|
|||
|
Total current liabilities
|
254,677
|
|
176,260
|
|
|||
|
Deferred income taxes
|
11,742
|
|
19,147
|
|
|||
|
Long-term debt, net of current maturities
|
106,237
|
|
144,403
|
|
|||
|
Environmental liabilities, net of current portion
|
47,150
|
|
46,391
|
|
|||
|
Other long-term liabilities
|
14,901
|
|
10,061
|
|
|||
|
Total liabilities
|
434,707
|
|
396,262
|
|
|||
|
Commitments and contingencies (Note 8)
|
|
|
|||||
|
Schnitzer Steel Industries, Inc. (“SSI”) shareholders’ equity:
|
|||||||
|
Preferred stock – 20,000 shares $1.00 par value authorized, none issued
|
—
|
|
—
|
|
|||
|
Class A common stock – 75,000 shares $1.00 par value authorized,
|
|||||||
|
26,502 and 26,859 shares issued and outstanding
|
26,502
|
|
26,859
|
|
|||
|
Class B common stock – 25,000 shares $1.00 par value authorized,
|
|||||||
|
200 and 200 shares issued and outstanding
|
200
|
|
200
|
|
|||
|
Additional paid-in capital
|
36,929
|
|
38,050
|
|
|||
|
Retained earnings
|
639,684
|
|
503,770
|
|
|||
|
Accumulated other comprehensive loss
|
(37,237
|
)
|
(35,293
|
)
|
|||
|
Total SSI shareholders’ equity
|
666,078
|
|
533,586
|
|
|||
|
Noncontrolling interests
|
4,032
|
|
3,907
|
|
|||
|
Total equity
|
670,110
|
|
537,493
|
|
|||
|
Total liabilities and equity
|
$
|
1,104,817
|
|
$
|
933,755
|
|
|
See Notes to the Consolidated Financial Statements.
55
/
Schnitzer Steel Industries, Inc. Form 10-K 2018
SCHNITZER STEEL INDUSTRIES, INC.
(in thousands, except per share amounts)
|
|
Year Ended August 31,
|
||||||||||
|
|
2018
|
2017
|
2016
|
||||||||
|
Revenues
|
$
|
2,364,715
|
|
$
|
1,687,591
|
|
$
|
1,352,543
|
|
||
|
Operating expense:
|
|||||||||||
|
Cost of goods sold
|
2,010,485
|
|
1,464,508
|
|
1,175,988
|
|
|||||
|
Selling, general and administrative
|
208,877
|
|
171,570
|
|
148,908
|
|
|||||
|
(Income) from joint ventures
|
(1,953
|
)
|
(3,674
|
)
|
(819
|
)
|
|||||
|
Goodwill impairment charges
|
—
|
|
—
|
|
8,845
|
|
|||||
|
Other asset impairment charges (recoveries), net
|
(1,021
|
)
|
(717
|
)
|
20,682
|
|
|||||
|
Restructuring charges and other exit-related activities
|
(661
|
)
|
(109
|
)
|
6,781
|
|
|||||
|
Operating income (loss)
|
148,988
|
|
56,013
|
|
(7,842
|
)
|
|||||
|
Interest expense
|
(8,983
|
)
|
(8,081
|
)
|
(8,889
|
)
|
|||||
|
Other income, net
|
1,848
|
|
758
|
|
1,226
|
|
|||||
|
Income (loss) from continuing operations before income taxes
|
141,853
|
|
48,690
|
|
(15,505
|
)
|
|||||
|
Income tax benefit (expense)
|
17,590
|
|
(1,322
|
)
|
(735
|
)
|
|||||
|
Income (loss) from continuing operations
|
159,443
|
|
47,368
|
|
(16,240
|
)
|
|||||
|
Income (loss) from discontinued operations, net of tax
|
346
|
|
(390
|
)
|
(1,348
|
)
|
|||||
|
Net income (loss)
|
159,789
|
|
46,978
|
|
(17,588
|
)
|
|||||
|
Net income attributable to noncontrolling interests
|
(3,338
|
)
|
(2,467
|
)
|
(1,821
|
)
|
|||||
|
Net income (loss) attributable to SSI
|
$
|
156,451
|
|
$
|
44,511
|
|
$
|
(19,409
|
)
|
||
|
Net income (loss) per share attributable to SSI:
|
|||||||||||
|
Basic:
|
|||||||||||
|
Income (loss) per share from continuing operations attributable to SSI
|
$
|
5.65
|
|
$
|
1.63
|
|
$
|
(0.66
|
)
|
||
|
Income (loss) per share from discontinued operations attributable to SSI
|
0.01
|
|
(0.01
|
)
|
(0.05
|
)
|
|||||
|
Net income (loss) per share attributable to SSI
|
$
|
5.66
|
|
$
|
1.62
|
|
$
|
(0.71
|
)
|
||
|
Diluted:
|
|||||||||||
|
Income (loss) per share from continuing operations attributable to SSI
|
$
|
5.46
|
|
$
|
1.60
|
|
$
|
(0.66
|
)
|
||
|
Income (loss) per share from discontinued operations attributable to SSI
|
0.01
|
|
(0.01
|
)
|
(0.05
|
)
|
|||||
|
Net income (loss) per share attributable to SSI
(1)
|
$
|
5.47
|
|
$
|
1.58
|
|
$
|
(0.71
|
)
|
||
|
Weighted average number of common shares:
|
|||||||||||
|
Basic
|
27,645
|
|
27,537
|
|
27,229
|
|
|||||
|
Diluted
|
28,589
|
|
28,141
|
|
27,229
|
|
|||||
|
Dividends declared per common share
|
$
|
0.750
|
|
$
|
0.750
|
|
$
|
0.750
|
|
||
____________________________
|
(1)
|
May not foot due to rounding.
|
See Notes to the Consolidated Financial Statements.
56
/
Schnitzer Steel Industries, Inc. Form 10-K 2018
SCHNITZER STEEL INDUSTRIES, INC.
CONSOLIDATED STATEMENTS OF COMPREHENSIVE INCOME (LOSS)
(in thousands)
|
Year Ended August 31,
|
||||||||||||
|
2018
|
2017
|
2016
|
||||||||||
|
Net income (loss)
|
$
|
159,789
|
|
$
|
46,978
|
|
$
|
(17,588
|
)
|
|||
|
Other comprehensive income (loss), net of tax:
|
||||||||||||
|
Foreign currency translation adjustments
|
(2,301
|
)
|
2,711
|
|
(530
|
)
|
||||||
|
Cash flow hedges, net
|
—
|
|
—
|
|
240
|
|
||||||
|
Pension obligations, net
|
357
|
|
2,111
|
|
(1,303
|
)
|
||||||
|
Total other comprehensive income (loss), net of tax
|
(1,944
|
)
|
4,822
|
|
(1,593
|
)
|
||||||
|
Comprehensive income (loss)
|
157,845
|
|
51,800
|
|
(19,181
|
)
|
||||||
|
Less comprehensive income attributable to noncontrolling interests
|
(3,338
|
)
|
(2,467
|
)
|
(1,821
|
)
|
||||||
|
Comprehensive income (loss) attributable to SSI
|
$
|
154,507
|
|
$
|
49,333
|
|
$
|
(21,002
|
)
|
|||
See Notes to the Consolidated Financial Statements.
57
/
Schnitzer Steel Industries, Inc. Form 10-K 2018
SCHNITZER STEEL INDUSTRIES, INC.
CONSOLIDATED STATEMENTS OF EQUITY
(in thousands)
|
|
Common Stock
|
Additional
Paid-in
Capital
|
Retained
Earnings
|
Accumulated
Other
Comprehensive
Loss
|
Total SSI
Shareholders’ Equity |
Noncontrolling
Interests
|
Total
Equity
|
||||||||||||||||||||||||||||||
|
Class A
|
Class B
|
||||||||||||||||||||||||||||||||||||
|
Shares
|
Amount
|
Shares
|
Amount
|
||||||||||||||||||||||||||||||||||
|
Balance as of August 31, 2015
|
26,474
|
|
$
|
26,474
|
|
306
|
|
$
|
306
|
|
$
|
26,211
|
|
$
|
520,066
|
|
$
|
(38,522
|
)
|
$
|
534,535
|
|
$
|
4,016
|
|
$
|
538,551
|
|
|||||||||
|
Net income (loss)
|
—
|
|
—
|
|
—
|
|
—
|
|
—
|
|
(19,409
|
)
|
—
|
|
(19,409
|
)
|
1,821
|
|
(17,588
|
)
|
|||||||||||||||||
|
Other comprehensive loss, net of tax
|
—
|
|
—
|
|
—
|
|
—
|
|
—
|
|
—
|
|
(1,593
|
)
|
(1,593
|
)
|
—
|
|
(1,593
|
)
|
|||||||||||||||||
|
Distributions to noncontrolling interests
|
—
|
|
—
|
|
—
|
|
—
|
|
—
|
|
—
|
|
—
|
|
—
|
|
(2,126
|
)
|
(2,126
|
)
|
|||||||||||||||||
|
Share repurchases
|
(203
|
)
|
(203
|
)
|
—
|
|
—
|
|
(3,276
|
)
|
—
|
|
—
|
|
(3,479
|
)
|
—
|
|
(3,479
|
)
|
|||||||||||||||||
|
Restricted stock withheld for taxes
|
(132
|
)
|
(132
|
)
|
—
|
|
—
|
|
(2,081
|
)
|
—
|
|
—
|
|
(2,213
|
)
|
—
|
|
(2,213
|
)
|
|||||||||||||||||
|
Issuance of restricted stock
|
343
|
|
343
|
|
—
|
|
—
|
|
(343
|
)
|
—
|
|
—
|
|
—
|
|
—
|
|
—
|
|
|||||||||||||||||
|
Share-based compensation expense
|
—
|
|
—
|
|
—
|
|
—
|
|
10,437
|
|
—
|
|
—
|
|
10,437
|
|
—
|
|
10,437
|
|
|||||||||||||||||
|
Cash dividends
|
—
|
|
—
|
|
—
|
|
—
|
|
—
|
|
(20,557
|
)
|
—
|
|
(20,557
|
)
|
—
|
|
(20,557
|
)
|
|||||||||||||||||
|
Balance as of August 31, 2016
|
26,482
|
|
26,482
|
|
306
|
|
306
|
|
30,948
|
|
480,100
|
|
(40,115
|
)
|
497,721
|
|
3,711
|
|
501,432
|
|
|||||||||||||||||
|
Net income
|
—
|
|
—
|
|
—
|
|
—
|
|
—
|
|
44,511
|
|
—
|
|
44,511
|
|
2,467
|
|
46,978
|
|
|||||||||||||||||
|
Other comprehensive income, net of tax
|
—
|
|
—
|
|
—
|
|
—
|
|
—
|
|
—
|
|
4,822
|
|
4,822
|
|
—
|
|
4,822
|
|
|||||||||||||||||
|
Distributions to noncontrolling interests
|
—
|
|
—
|
|
—
|
|
—
|
|
—
|
|
—
|
|
—
|
|
—
|
|
(2,271
|
)
|
(2,271
|
)
|
|||||||||||||||||
|
Conversion of common stock
|
106
|
|
106
|
|
(106
|
)
|
(106
|
)
|
—
|
|
—
|
|
—
|
|
—
|
|
—
|
|
—
|
|
|||||||||||||||||
|
Restricted stock withheld for taxes
|
(148
|
)
|
(148
|
)
|
—
|
|
—
|
|
(3,326
|
)
|
—
|
|
—
|
|
(3,474
|
)
|
—
|
|
(3,474
|
)
|
|||||||||||||||||
|
Issuance of restricted stock
|
419
|
|
419
|
|
—
|
|
—
|
|
(419
|
)
|
—
|
|
—
|
|
—
|
|
—
|
|
—
|
|
|||||||||||||||||
|
Share-based compensation expense
|
—
|
|
—
|
|
—
|
|
—
|
|
10,847
|
|
—
|
|
—
|
|
10,847
|
|
—
|
|
10,847
|
|
|||||||||||||||||
|
Cash dividends
|
—
|
|
—
|
|
—
|
|
—
|
|
—
|
|
(20,841
|
)
|
—
|
|
(20,841
|
)
|
—
|
|
(20,841
|
)
|
|||||||||||||||||
|
Balance as of August 31, 2017
|
26,859
|
|
26,859
|
|
200
|
|
200
|
|
38,050
|
|
503,770
|
|
(35,293
|
)
|
533,586
|
|
3,907
|
|
537,493
|
|
|||||||||||||||||
|
Net income
|
—
|
|
—
|
|
—
|
|
—
|
|
—
|
|
156,451
|
|
—
|
|
156,451
|
|
3,338
|
|
159,789
|
|
|||||||||||||||||
|
Other comprehensive loss, net of tax
|
—
|
|
—
|
|
—
|
|
—
|
|
—
|
|
—
|
|
(1,944
|
)
|
(1,944
|
)
|
—
|
|
(1,944
|
)
|
|||||||||||||||||
|
Reclassification of stranded tax effects of the Tax Act
|
—
|
|
—
|
|
—
|
|
—
|
|
—
|
|
517
|
|
—
|
|
517
|
|
—
|
|
517
|
|
|||||||||||||||||
|
Distributions to noncontrolling interests
|
—
|
|
—
|
|
—
|
|
—
|
|
—
|
|
—
|
|
—
|
|
—
|
|
(2,796
|
)
|
(2,796
|
)
|
|||||||||||||||||
|
Purchase of noncontrolling interest
|
—
|
|
—
|
|
—
|
|
—
|
|
—
|
|
(183
|
)
|
—
|
|
(183
|
)
|
(417
|
)
|
(600
|
)
|
|||||||||||||||||
|
Share repurchases
|
(516
|
)
|
(516
|
)
|
—
|
|
—
|
|
(16,845
|
)
|
—
|
|
—
|
|
(17,361
|
)
|
—
|
|
(17,361
|
)
|
|||||||||||||||||
|
Restricted stock withheld for taxes
|
(103
|
)
|
(103
|
)
|
—
|
|
—
|
|
(2,979
|
)
|
—
|
|
—
|
|
(3,082
|
)
|
—
|
|
(3,082
|
)
|
|||||||||||||||||
|
Issuance of restricted stock
|
262
|
|
262
|
|
—
|
|
—
|
|
(262
|
)
|
—
|
|
—
|
|
—
|
|
—
|
|
—
|
|
|||||||||||||||||
|
Share-based compensation expense
|
—
|
|
—
|
|
—
|
|
—
|
|
18,965
|
|
—
|
|
—
|
|
18,965
|
|
—
|
|
18,965
|
|
|||||||||||||||||
|
Cash dividends
|
—
|
|
—
|
|
—
|
|
—
|
|
—
|
|
(20,871
|
)
|
—
|
|
(20,871
|
)
|
—
|
|
(20,871
|
)
|
|||||||||||||||||
|
Balance as of August 31, 2018
|
26,502
|
|
$
|
26,502
|
|
200
|
|
$
|
200
|
|
$
|
36,929
|
|
$
|
639,684
|
|
$
|
(37,237
|
)
|
$
|
666,078
|
|
$
|
4,032
|
|
$
|
670,110
|
|
|||||||||
See Notes to the Consolidated Financial Statements.
58
/
Schnitzer Steel Industries, Inc. Form 10-K 2018
SCHNITZER STEEL INDUSTRIES, INC.
(in thousands)
|
Year Ended August 31,
|
|||||||||||
|
2018
|
2017
|
2016
|
|||||||||
|
Cash flows from operating activities:
|
|||||||||||
|
Net income (loss)
|
$
|
159,789
|
|
$
|
46,978
|
|
$
|
(17,588
|
)
|
||
|
Adjustments to reconcile net income (loss) to cash provided by operating activities:
|
|||||||||||
|
Goodwill impairment charges
|
—
|
|
—
|
|
8,845
|
|
|||||
|
Other asset impairment charges (recoveries), net
|
(1,021
|
)
|
(717
|
)
|
20,682
|
|
|||||
|
Exit-related (gains), asset impairments and accelerated depreciation, net
|
(1,000
|
)
|
(407
|
)
|
1,790
|
|
|||||
|
Depreciation and amortization
|
49,672
|
|
49,840
|
|
54,630
|
|
|||||
|
Inventory write-downs
|
38
|
|
—
|
|
710
|
|
|||||
|
Deferred income taxes
|
(37,995
|
)
|
2,278
|
|
507
|
|
|||||
|
Undistributed equity in earnings of joint ventures
|
(1,953
|
)
|
(3,674
|
)
|
(819
|
)
|
|||||
|
Share-based compensation expense
|
18,965
|
|
10,847
|
|
10,437
|
|
|||||
|
Loss (gain) on the disposal of assets, net
|
56
|
|
448
|
|
(465
|
)
|
|||||
|
Unrealized foreign exchange (gain) loss, net
|
(104
|
)
|
361
|
|
(109
|
)
|
|||||
|
Bad debt expense, net
|
323
|
|
126
|
|
131
|
|
|||||
|
Write-off of debt issuance costs
|
—
|
|
—
|
|
768
|
|
|||||
|
Changes in assets and liabilities, net of acquisitions:
|
|||||||||||
|
Accounts receivable
|
(44,941
|
)
|
(36,195
|
)
|
(10,693
|
)
|
|||||
|
Inventories
|
(24,280
|
)
|
(22,207
|
)
|
27,504
|
|
|||||
|
Income taxes
|
(1,755
|
)
|
(1,086
|
)
|
5,861
|
|
|||||
|
Prepaid expenses and other current assets
|
(109
|
)
|
(1,704
|
)
|
(1,864
|
)
|
|||||
|
Other long-term assets
|
(1,620
|
)
|
537
|
|
266
|
|
|||||
|
Accounts payable
|
26,049
|
|
33,062
|
|
(763
|
)
|
|||||
|
Accrued payroll and related liabilities
|
4,889
|
|
12,389
|
|
3,633
|
|
|||||
|
Other accrued liabilities
|
6,066
|
|
5,073
|
|
(4,362
|
)
|
|||||
|
Environmental liabilities
|
3,053
|
|
1,884
|
|
(451
|
)
|
|||||
|
Other long-term liabilities
|
4,404
|
|
(1,101
|
)
|
30
|
|
|||||
|
Distributed equity in earnings of joint ventures
|
1,150
|
|
3,638
|
|
560
|
|
|||||
|
Net cash provided by operating activities
|
159,676
|
|
100,370
|
|
99,240
|
|
|||||
|
Cash flows from investing activities:
|
|||||||||||
|
Capital expenditures
|
(77,626
|
)
|
(44,940
|
)
|
(34,571
|
)
|
|||||
|
Purchase of cost method investment
|
—
|
|
(6,017
|
)
|
—
|
|
|||||
|
Acquisition
|
(2,300
|
)
|
—
|
|
—
|
|
|||||
|
Joint venture receipts (payments), net
|
11
|
|
405
|
|
(11
|
)
|
|||||
|
Proceeds from sale of assets
|
6,517
|
|
5,158
|
|
4,106
|
|
|||||
|
Net cash used in investing activities
|
(73,398
|
)
|
(45,394
|
)
|
(30,476
|
)
|
|||||
|
Cash flows from financing activities:
|
|||||||||||
|
Borrowings from long-term debt
|
515,480
|
|
433,336
|
|
152,311
|
|
|||||
|
Repayment of long-term debt
|
(556,456
|
)
|
(481,757
|
)
|
(187,951
|
)
|
|||||
|
Proceeds from line of credit
|
—
|
|
—
|
|
135,500
|
|
|||||
|
Repayment of line of credit
|
—
|
|
—
|
|
(135,500
|
)
|
|||||
|
Payment of debt issuance costs
|
(2,590
|
)
|
(112
|
)
|
(1,011
|
)
|
|||||
|
Repurchase of Class A common stock
|
(17,361
|
)
|
—
|
|
(3,479
|
)
|
|||||
|
Taxes paid related to net share settlement of share-based payment awards
|
(3,082
|
)
|
(3,474
|
)
|
(2,213
|
)
|
|||||
|
Distributions to noncontrolling interests
|
(2,796
|
)
|
(2,271
|
)
|
(2,126
|
)
|
|||||
|
Purchase of noncontrolling interest
|
(600
|
)
|
—
|
|
—
|
|
|||||
|
Dividends paid
|
(20,736
|
)
|
(20,396
|
)
|
(20,444
|
)
|
|||||
|
Net cash used in financing activities
|
(88,141
|
)
|
(74,674
|
)
|
(64,913
|
)
|
|||||
|
Effect of exchange rate changes on cash
|
(701
|
)
|
166
|
|
213
|
|
|||||
|
Net increase (decrease) in cash and cash equivalents
|
(2,564
|
)
|
(19,532
|
)
|
4,064
|
|
|||||
|
Cash and cash equivalents as of beginning of year
|
7,287
|
|
26,819
|
|
22,755
|
|
|||||
|
Cash and cash equivalents as of end of year
|
$
|
4,723
|
|
$
|
7,287
|
|
$
|
26,819
|
|
||
59
/
Schnitzer Steel Industries, Inc. Form 10-K 2018
|
Year Ended August 31,
|
|||||||||||
|
2018
|
2017
|
2016
|
|||||||||
|
SUPPLEMENTAL DISCLOSURES:
|
|||||||||||
|
Cash paid (received) during the year for:
|
|||||||||||
|
Interest
|
$
|
8,113
|
|
$
|
7,016
|
|
$
|
6,077
|
|
||
|
Income taxes paid (refunds received), net
|
$
|
17,203
|
|
$
|
148
|
|
$
|
(5,691
|
)
|
||
|
Schedule of noncash investing and financing transactions:
|
|||||||||||
|
Purchases of property, plant and equipment included in current liabilities
|
$
|
18,768
|
|
$
|
11,082
|
|
$
|
8,268
|
|
||
See Notes to the Consolidated Financial Statements.
60
/
Schnitzer Steel Industries, Inc. Form 10-K 2018
SCHNITZER STEEL INDUSTRIES, INC.
NOTES TO THE CONSOLIDATED FINANCIAL STATEMENTS
Note 1
– Nature of Operations
Founded in 1906, Schnitzer Steel Industries, Inc. (the “Company”), an Oregon corporation, is one of North America’s largest recyclers of ferrous and nonferrous scrap metal, including end-of-life vehicles, and a manufacturer of finished steel products.
The Company’s internal organizational and reporting structure includes
two
operating and reportable segments: the Auto and Metals Recycling (“AMR”) business and the Cascade Steel and Scrap (“CSS”) business.
AMR acquires and recycles ferrous and nonferrous scrap metal for sale to foreign and domestic metal producers, processors and brokers, and procures salvaged vehicles and sells serviceable used auto parts from these vehicles through a network of self-service auto parts stores. These auto parts stores also supply the Company’s shredding facilities with autobodies that are processed into saleable recycled scrap metal.
CSS operates a steel mini-mill that produces a range of finished steel long products using ferrous recycled scrap metal and other raw materials. CSS’s steel mill obtains substantially all of its scrap metal raw material requirements from its integrated metals recycling and joint venture operations. CSS’s metals recycling operations also sell recycled metal to external customers primarily in export markets.
As of
August 31, 2018
, all of the Company’s facilities were located in the United States (“U.S.”) and its territories and Canada.
Note 2
– Summary of Significant Accounting Policies
Principles of Consolidation
The Consolidated Financial Statements include the accounts of the Company and its majority-owned and wholly-owned subsidiaries. The equity method of accounting is used for investments in joint ventures over which the Company has significant influence but does not have effective control. The cost method of accounting is used for investments in entities over which the Company is not able to exercise significant influence. All significant intercompany account balances, transactions, profits and losses have been eliminated. All transactions and relationships with potential variable interest entities are evaluated to determine whether the Company is the primary beneficiary of the entities, therefore requiring consolidation. The Company does not have any variable interest entities requiring consolidation.
Accounting Changes
In July 2015, an accounting standards update was issued that requires an entity to measure certain types of inventory, including inventory that is measured using the first-in, first out (“FIFO”) or average cost method, at the lower of cost and net realizable value. The accounting standard in effect at the time of issuance of the update required an entity to measure inventory at the lower of cost or market, whereby market could be replacement cost, net realizable value, or net realizable value less an approximately normal profit margin. The amendments do not apply to inventory that is measured using the last-in, first-out (“LIFO”) or retail inventory method. The Company adopted the new requirement, which it applied prospectively, as of the beginning of the first quarter of fiscal 2018 with no impact to the Consolidated Financial Statements.
In March 2016, an accounting standards update was issued that amends several aspects of the accounting for share-based payments, including accounting for income taxes, forfeitures and statutory tax withholding requirements, and classification within the statement of cash flows. The Company adopted the new requirements as of the beginning of the first quarter of fiscal 2018 with no impact to the Consolidated Financial Statements, including no cumulative-effect adjustments to retained earnings, as of the date of adoption. On a prospective basis beginning with the date of adoption, the Company records all of the tax effects related to share-based payments through the income statement, subject to normal valuation allowance considerations, and all tax-related cash flows resulting from share-based payments are reported as operating activities in the statement of cash flows. Cash payments to taxing authorities made on behalf of Company employees for withheld shares are reported as financing activities in the statement of cash flows, consistent with the Company’s practice prior to adopting the new requirements. The Company has elected to continue the practice of estimating the forfeiture rate for the purpose of recognizing estimated compensation cost over the requisite service period.
In February 2018, an accounting standards update was issued that allows for a reclassification from accumulated other comprehensive income (“AOCI”) to retained earnings for stranded tax effects resulting from the Tax Cuts and Jobs Act (“Tax Act”) enacted on December 22, 2017. Stranded tax effects result from adjusting deferred tax liabilities and assets for the effect of a change in tax laws or rates to income from continuing operations, as required under existing accounting guidance, even in
61
/
Schnitzer Steel Industries, Inc. Form 10-K 2018
situations in which the adjustments relate to income tax effects reported within AOCI. If an entity elects to reclassify the stranded tax effects of the Tax Act, the amount of that reclassification shall include the effect of the change in the U.S. federal corporate income tax rate on the gross deferred tax amounts and related valuation allowances, if any, at the date of enactment of the Tax Act related to items remaining in AOCI, and other income tax effects of the Tax Act on items remaining in AOCI that an entity elects to reclassify. The Company early-adopted the foregoing accounting standards update in the second quarter of fiscal 2018 and elected to reclassify to retained earnings the effect of the change in the U.S. federal corporate income tax rate on items remaining in AOCI at the date of enactment of the Tax Act. The resulting aggregate reclassification from AOCI to retained earnings recorded in the second quarter of fiscal 2018 was
$1 million
, which is presented separately in the Consolidated Statements of Equity. Also see
Note 10
- Accumulated Other Comprehensive Loss for further detail.
In August 2018, an accounting standards update was issued that aligns the capitalization of implementation costs incurred in a cloud computing arrangement that is a service contract with the existing capitalization requirements for implementation costs incurred to develop or obtain internal-use software. The update requires the recognition of implementation costs for hosting services over the noncancellable term of the cloud computing arrangement plus any optional renewal periods that are reasonably certain to be exercised by the customer or in which exercise of the option is controlled by the service provider. The Company early-adopted the accounting standard update as of the beginning of the fourth quarter of fiscal 2018 with no impact to the Consolidated Financial Statements. The Company is applying the amendments prospectively to all arrangements entered into after adoption. The new requirement does not represent a substantial change from the Company’s accounting for implementation costs incurred in cloud computing arrangements prior to adoption.
Discontinued Operations
The results of discontinued operations are presented separately, net of tax, from the results of ongoing operations for all periods presented. The disposed components reflected in the results of discontinued operations during the periods presented consist of
six
auto parts stores for which the Company ceased operations in fiscal 2015. The expenses included in the results of discontinued operations are the direct operating expenses incurred by the disposed components that may be reasonably segregated from the costs of the ongoing operations of the Company. In fiscal 2016, the Company recorded impairment charges and accelerated depreciation of
$1 million
on the long-lived assets of discontinued auto parts stores. Impaired assets in fiscal 2016 consisted primarily of capital lease assets associated with the buildings on
two
leased properties.
Cash and Cash Equivalents
Cash and cash equivalents include short-term securities that are not restricted by third parties and have an original maturity date of
90
days or less. Included in accounts payable are book overdrafts representing outstanding checks in excess of funds on deposit of
$28 million
and
$21 million
as of
August 31, 2018 and 2017
, respectively.
Accounts Receivable, net
Accounts receivable represent amounts primarily due from customers on product and other sales. These accounts receivable, which are reduced by an allowance for doubtful accounts, are recorded at the invoiced amount and do not bear interest. The Company evaluates the collectibility of its accounts receivable based on a combination of factors, including whether sales were made pursuant to letters of credit or credit insurance is in place. In cases where management is aware of circumstances that may impair a customer’s ability to meet its financial obligations, management records a specific allowance against amounts due and reduces the receivable to the amount the Company believes will be collected. For all other customers, the Company maintains an allowance that considers the total receivables outstanding, historical collection rates and economic trends. Accounts are written off when all efforts to collect have been exhausted. The allowance for doubtful accounts was
$3 million
and
$2 million
as of
August 31, 2018 and 2017
, respectively.
Also included in accounts receivable are short-term advances to scrap metal suppliers used as a mechanism to acquire unprocessed scrap metal. The advances are generally repaid with scrap metal, as opposed to cash. Repayments of advances with scrap metal are treated as noncash operating activities in the Consolidated Statements of Cash Flows and totaled
$15 million
,
$12 million
and
$8 million
for the fiscal years ended August 31, 2018, 2017 and 2016, respectively.
Inventories
The Company’s inventories consist of processed and unprocessed scrap metal (ferrous, nonferrous, and nonferrous recovered joint products arising from the manufacturing process), semi-finished steel products (billets), finished steel products (primarily rebar, wire rod, and merchant bar), used and salvaged vehicles, and supplies. Inventories are stated at the lower of cost and net realizable value. The Company determines the cost of ferrous and nonferrous scrap metal inventories using the average cost method and capitalizes substantially all direct processing costs and yard costs into inventory. The Company allocates material and production costs to joint products using the gross margin method. AMR determines the cost of used and salvaged vehicle inventory at its auto
62
/
Schnitzer Steel Industries, Inc. Form 10-K 2018
parts stores, which is reported within finished goods, based on the average price the Company pays for a vehicle and capitalizes the vehicle cost and substantially all production costs into inventory. CSS determines the cost of its semi-finished and finished steel product inventories based on average costs and capitalizes all direct and indirect costs of manufacturing into inventory. Indirect costs of manufacturing include general plant costs, maintenance and yard costs. The Company determines the cost of its supplies inventory using the average cost method and reduces the carrying value for losses due to obsolescence. The Company considers estimated future selling prices when determining the estimated net realizable value of its inventory. As the Company generally sells its recycled ferrous metal under contracts that provide for shipment within
30
to
60
days after the price is agreed, it utilizes the selling prices under committed contracts and sales orders for determining the estimated market price of quantities on hand that will be shipped under these contracts and sales orders.
The accounting process the Company uses to record scrap metal quantities relies on significant estimates. With respect to unprocessed scrap metal inventory, the Company relies on weighed quantities that are reduced by estimated amounts that are moved into production. This process utilizes estimated metal recoveries and yields that are based on historical trends. Over time, these estimates are reasonably reliable indicators of recycled scrap metal ultimately produced; however, actual recoveries and yields can vary depending on product quality, moisture content and the source of the unprocessed metal. If ultimate recoveries and yields are significantly different than estimated, the value of the inventory could be materially overstated or understated. To assist in validating the reasonableness of these estimates, the Company periodically reviews shrink factors and performs monthly physical inventories. Due to the inherent nature of the Company’s scrap metal inventories, including variations in product density, holding period and production processes utilized to manufacture the products, physical inventories will not necessarily detect all variances for scrap metal inventory such that estimates of quantities are required. To mitigate this risk, the Company adjusts its ferrous physical inventories when the volume of a commodity is low and a physical inventory count is deemed to more accurately estimate the remaining volume.
Property, Plant and Equipment, net
Property, plant and equipment are recorded at cost. Expenditures for major additions and improvements are capitalized, while routine repair and maintenance costs are expensed as incurred. Interest related to the construction of qualifying assets is capitalized as part of the construction costs and was not material to any of the periods presented. When assets are retired or sold, the related cost and accumulated depreciation are removed from the accounts and resulting gains or losses are generally included in operating expense. Gains and losses from sales of assets related to an exit activity are reported within restructuring charges and other exit-related activities in the Consolidated Statements of Operations. Depreciation is recorded on a straight-line basis over the estimated useful lives of the assets. Upon idling an asset, depreciation continues to be recorded. Leasehold improvements are amortized over the shorter of their estimated useful lives or the remaining lease term.
As of
August 31, 2018
, the useful lives used for depreciation and amortization were as follows:
|
Useful Life
(in years)
|
|
|
Machinery and equipment
|
3 to 40
|
|
Land improvements
|
3 to 35
|
|
Buildings and leasehold improvements
|
5 to 40
|
|
Office equipment and other software licenses
|
3 to 10
|
|
Enterprise Resource Planning (“ERP”) systems
|
6 to 17
|
Prepaid Expenses
The Company’s prepaid expenses totaled
$22 million
and
$9 million
as of
August 31, 2018 and 2017
, respectively, and consisted primarily of prepaid insurance, prepaid services and deposits on capital purchases.
Other Assets
The Company’s other assets, exclusive of prepaid expenses, consist primarily of receivables from insurers, a cost method investment, debt issuance costs, and notes and other contractual receivables. Other assets are reported within either prepaid expenses and other current assets or other assets in the Consolidated Balance Sheets based on their expected use either during or beyond the current operating cycle of one year from the reporting date.
Receivables from insurers represent the portion of insured losses expected to be recovered from the Company’s insurance carriers. The receivable is recorded at an amount not to exceed the recorded loss and only if the terms of legally enforceable insurance contracts support that the insurance recovery will not be disputed and is deemed collectible. Receivables from insurers totaled
$36 million
and
$8 million
as of August 31, 2018 and 2017, respectively, with the increase in fiscal 2018 relating primarily to a
63
/
Schnitzer Steel Industries, Inc. Form 10-K 2018
contingent loss recorded during the year in connection with lawsuits arising from a motor vehicle collision for which the Company has insurance coverage. See “Contingencies – Other” in
Note 8
– Commitments and Contingencies for further discussion of the contingent loss.
During fiscal 2017, the Company invested
$6 million
in a privately-held waste and recycling entity. The Company’s influence over the operating and financial policies of the entity is not significant and, thus, the investment is accounted for under the cost method. Under the cost method, the investment is carried at cost and adjusted only for other-than-temporary impairments, certain distributions, and additional investments. The investment is presented as part of AMR and reported within other assets in the Consolidated Balance Sheets. The Company does not hold any other cost-method investments. The carrying value of the investment was
$6 million
as of
August 31, 2018 and 2017
. As of
August 31, 2018
, the Company had not identified any events or changes in circumstances that may have a significant adverse effect on the fair value of the investment or indicators of other-than-temporary impairment.
Debt issuance costs consist primarily of costs incurred by the Company to enter into or modify its credit facilities. The Company reports deferred debt issuance costs within other assets in the Consolidated Balance Sheets and amortizes them to interest expense on a straight-line basis over the contractual term of the arrangement.
Notes and other contractual receivables consist primarily of advances to entities in the business of extracting scrap metal through demolition and other activities, as well as receivables from counterparties to sales of equipment assets and to legal settlements. Repayment of these advances to suppliers is in either cash or scrap metal. The Company performs periodic reviews of its notes and other contractual receivables to identify credit risks and to assess the overall collectibility of the receivables, which typically involves consideration of the value of collateral which in the case of advances to suppliers is generally in the form of scrap metal extracted from demolition and construction projects. A note or other contractual receivable is considered impaired when, based on current information and events, it is probable that the Company will be unable to collect all amounts due in accordance with the contractual terms of the agreement. Once a note or other contractual receivable has been identified as impaired, it is measured based on the present value of payments expected to be received, discounted at the receivable’s contractual interest rate, or for arrangements that are solely dependent on collateral for repayment, the estimated fair value of the collateral less estimated costs to sell. If the carrying value of the receivable exceeds its recoverable amount, an impairment is recorded for the difference.
Assets Held for Sale
An asset is classified as held for sale upon meeting criteria specified in the accounting standards. An asset classified as held for sale is measured at the lower of its carrying amount or fair value less cost to sell with no further adjustments for depreciation. An impairment loss is recognized for any initial or subsequent write-down of the asset to its fair value less cost to sell. The Company generally determines fair value using Level 3 inputs under the fair value hierarchy consisting of information provided by brokers and other external sources along with management’s own assumptions. See the Asset Impairment Charges (Recoveries), net section of this Note below for tabular presentation of impairment charges recorded by the Company on assets held for sale during the periods presented, net of gains recognized from the subsequent sale of assets that had been classified as held for sale prior to being fully impaired. The Company did not have any assets held for sale as of
August 31, 2018 and 2017
.
Long-Lived Assets
The Company tests long-lived tangible and intangible assets for impairment at the asset group level, which is determined based on the lowest level for which identifiable cash flows are largely independent of the cash flows of other groups of assets and liabilities. For the Company’s metals recycling operations reported within AMR, an asset group generally consists of the regional shredding and export operation along with surrounding feeder yards. For regions with no shredding and export operations, each metals recycling yard is an asset group. For the Company’s auto parts operations, generally each auto parts store is an asset group. The combined steel manufacturing and metals recycling operations within CSS are a single asset group. The Company tests its asset groups for impairment when certain triggering events or changes in circumstances indicate that the carrying value of the asset group may be impaired. If the carrying value of the asset group is not recoverable because it exceeds the Company’s estimate of future undiscounted cash flows from the use and eventual disposition of the asset group, an impairment loss is recognized by the amount the carrying value exceeds its fair value, if any. The impairment loss is allocated to the long-lived assets of the group on a pro rata basis using the relative carrying amounts of those assets, except that the loss allocated to an individual long-lived asset of the group shall not reduce the carrying amount of that asset below its fair value. Fair value is determined primarily using the cost and market approaches. During fiscal 2016, the Company recorded impairment charges on long-lived asset groups associated with certain regional metals recycling operations and retail auto parts store locations.
With respect to individual long-lived assets, changes in circumstances may merit a change in the estimated useful lives or salvage values of the assets, which are accounted for prospectively in the period of change. For such assets, the useful life is shortened based on the Company’s plans to dispose of or abandon the asset before the end of its original useful life and depreciation is
64
/
Schnitzer Steel Industries, Inc. Form 10-K 2018
accelerated beginning when that determination is made. During the years presented in this report, the Company recognized accelerated depreciation primarily due to shortening the useful lives of idled and decommissioned machinery and equipment assets. During fiscal 2018, the Company sold long-lived assets consisting primarily of machinery and equipment for which it had previously recorded accelerated depreciation.
See the Asset Impairment Charges (Recoveries), net section of this Note for tabular presentation of long-lived asset impairment charges (recoveries) and accelerated depreciation. Long-lived asset impairment charges (recoveries) and accelerated depreciation are reported in the Consolidated Statements of Operations within (1) other asset impairment charges (recoveries), net; (2) restructuring charges and other exit-related activities if related to a site closure not qualifying for discontinued operations reporting; or (3) loss from discontinued operations, if related to a component of the Company qualifying for discontinued operations reporting.
Investments in Joint Ventures
As of
August 31, 2018
, the Company had
two
50%
-owned joint venture interests which were accounted for under the equity method of accounting.
One
of the joint venture interests is presented as part of AMR operations, and
one
interest is presented as part of CSS operations. The joint ventures sell recycled scrap metal to AMR and to CSS at prices that approximate local market rates, which produces intercompany profit. This intercompany profit is eliminated while the products remain in inventory and is not recognized until the finished products are sold to third parties. As of
August 31, 2018
, the Company’s investments in equity method joint ventures have generated
$9 million
in cumulative undistributed earnings.
A loss in value of an investment in a joint venture is recognized when the decline is other than temporary. Management considers all available evidence to evaluate the realizable value of its investments including the length of time and the extent to which the fair value has been less than cost, the financial condition and near-term prospects of the joint venture business, and the Company’s intent and ability to retain the investment for a period of time sufficient to allow for any anticipated recovery in fair value. Once management determines that an other-than-temporary impairment exists, the investment is written down to its fair value, which establishes a new cost basis. The Company determines fair value using Level 3 inputs under the fair value hierarchy using an income approach based on a discounted cash flow analysis. During fiscal
2017
and
2016
, the Company recorded impairment charges of
$1 million
and
$2 million
, respectively, related to its investments in joint ventures, which are reported within other asset impairment charges (recoveries), net in the Consolidated Statements of Operations.
During fiscal 2018, the Company declassified
two
of its
50%
joint venture interests from equity method classification as a result of the agreed-upon dissolution of the joint venture entities. The joint venture interests had previously been presented as part of AMR operations. Based on the Company’s claims to the net assets of the two joint venture entities and other consideration transferred in connection with the dissolutions, the Company recognized a gain of less than
$1 million
in fiscal 2018. During fiscal 2017, the Company sold
one
of its
50%
joint venture interests, presented as part of CSS operations, resulting in the recognition of a
$1 million
gain on the sale. The gains represent recoveries of impairments recorded against the investments in prior years and are reported within other asset impairment charges (recoveries), net.
During fiscal 2017,
one
of the Company’s joint venture interests sold real estate resulting in recognition of a
$6 million
gain by the joint venture,
$3 million
of which was attributable to the Company’s investment. The Company’s share of the gain is reported within (income) from joint ventures in the Consolidated Statements of Operations.
See
Note 15
- Related Party Transactions for further detail on transactions with joint ventures.
Asset Impairment Charges (Recoveries), net
The following asset impairment charges and subsequent recoveries, excluding goodwill impairment charges discussed below in this Note, were recorded in the Consolidated Statements of Operations (in thousands):
65
/
Schnitzer Steel Industries, Inc. Form 10-K 2018
|
Year Ended August 31,
|
|||||||||||
|
2018
|
2017
|
2016
|
|||||||||
|
Reported within other asset impairment charges (recoveries), net:
|
|||||||||||
|
Auto and Metals Recycling
|
|||||||||||
|
Long-lived assets
|
$
|
—
|
|
$
|
—
|
|
$
|
7,336
|
|
||
|
Accelerated depreciation
|
(1,040
|
)
|
—
|
|
6,208
|
|
|||||
|
Investments in joint ventures
|
(118
|
)
|
860
|
|
—
|
|
|||||
|
Assets held for sale
|
(642
|
)
|
(1,044
|
)
|
1,659
|
|
|||||
|
Other assets
|
867
|
|
—
|
|
1,208
|
|
|||||
|
Total Auto and Metals Recycling
|
(933
|
)
|
(184
|
)
|
16,411
|
|
|||||
|
Cascade Steel and Scrap
|
|||||||||||
|
Accelerated depreciation
|
(88
|
)
|
401
|
|
—
|
|
|||||
|
Investments in joint ventures
|
—
|
|
(934
|
)
|
1,968
|
|
|||||
|
Supplies inventory
|
—
|
|
—
|
|
2,224
|
|
|||||
|
Total Cascade Steel and Scrap
|
(88
|
)
|
(533
|
)
|
|
4,192
|
|
||||
|
Corporate - Other assets
|
—
|
|
—
|
|
79
|
|
|||||
|
(1,021
|
)
|
(717
|
)
|
20,682
|
|
||||||
|
Reported within restructuring charges and other exit-related activities:
|
|||||||||||
|
Long-lived assets
|
—
|
|
—
|
|
468
|
|
|||||
|
Accelerated depreciation
|
—
|
|
96
|
|
630
|
|
|||||
|
Supplies inventory
|
—
|
|
—
|
|
1,047
|
|
|||||
|
Other assets
|
—
|
|
62
|
|
35
|
|
|||||
|
Exit-related gains
|
(1,000
|
)
|
(565
|
)
|
(1,337
|
)
|
|||||
|
(1,000
|
)
|
(407
|
)
|
843
|
|
||||||
|
Reported within discontinued operations:
|
|||||||||||
|
Long-lived assets
|
—
|
|
—
|
|
673
|
|
|||||
|
Accelerated depreciation
|
—
|
|
—
|
|
274
|
|
|||||
|
—
|
|
—
|
|
947
|
|
||||||
|
Total
|
$
|
(2,021
|
)
|
$
|
(1,124
|
)
|
$
|
22,472
|
|
||
Goodwill and Other Intangible Assets, net
Goodwill represents the excess of the purchase price over the net amount of identifiable assets acquired and liabilities assumed in a business combination measured at fair value. The Company evaluates goodwill for impairment annually on July 1 and upon the occurrence of certain triggering events or substantive changes in circumstances that indicate that the fair value of goodwill may be impaired. Impairment of goodwill is tested at the reporting unit level. A reporting unit is an operating segment or one level below an operating segment (referred to as a ‘component’). A component of an operating segment is required to be identified as a reporting unit if the component is a business for which discrete financial information is available and segment management regularly reviews its operating results.
When testing goodwill for impairment, the Company has the option to first assess qualitative factors to determine whether the existence of events or circumstances leads to a determination that it is more likely than not that the estimated fair value of a reporting unit is less than its carrying amount. If the Company elects to perform a qualitative assessment and determines that an impairment is more likely than not, the Company is then required to perform the quantitative impairment test, otherwise no further analysis is required. The Company also may elect not to perform the qualitative assessment and, instead, proceed directly to the quantitative impairment test.
Under the accounting guidance in effect for the Company prior to the third quarter of fiscal 2017, in the first step of the two-step quantitative impairment test, the fair value of a reporting unit was compared to its carrying value. If the carrying value of a reporting unit exceeded its fair value, the second step of the impairment test was performed for purposes of measuring the impairment. In the second step, the fair value of the reporting unit was allocated to all of the assets and liabilities of the reporting unit to determine
66
/
Schnitzer Steel Industries, Inc. Form 10-K 2018
an implied goodwill value. If the carrying amount of the reporting unit’s goodwill exceeded the implied fair value of goodwill, an impairment loss was recognized in an amount equal to that excess.
As of the beginning of the third quarter of fiscal 2017, the Company adopted an accounting standard update that eliminates the second step of the two-step goodwill impairment test. Under the revised guidance, the Company applies a one-step quantitative test and records the amount of goodwill impairment as the excess of a reporting unit’s carrying amount over its fair value, not to exceed the total amount of goodwill allocated to that reporting unit. The new guidance does not amend the optional qualitative assessment of goodwill impairment.
When the Company is required to perform a quantitative goodwill impairment test, it estimates the fair value of its reporting units using an income approach based on the present value of expected future cash flows, including terminal value, utilizing a market-based weighted average cost of capital (“WACC”) determined separately for each reporting unit. The determination of fair value involves the use of significant estimates and assumptions, including revenue growth rates driven by future commodity prices and volume expectations, operating margins, capital expenditures, working capital requirements, tax rates, terminal growth rates, discount rates, benefits associated with a taxable transaction and synergistic benefits available to market participants. In addition, to corroborate the reporting units’ valuation, the Company uses a market approach based on earnings multiple data and a reconciliation of the Company’s estimate of the aggregate fair value of the reporting units to the Company’s market capitalization, including consideration of a control premium. See
Note 6
- Goodwill and Other Intangible Assets, net for further detail including the recognition of a goodwill impairment charge of
$9 million
during fiscal
2016
. There were
no
goodwill impairment charges recognized in fiscal 2018 or 2017.
The Company tests indefinite-lived intangible assets for impairment by first assessing qualitative factors to determine whether it is necessary to perform a quantitative impairment test. If the Company believes, as a result of its qualitative assessment, that it is more likely than not that the fair value of the indefinite-lived intangible asset is less than its carrying amount, the quantitative impairment test is required. Otherwise, no further testing is required. The Company did not record impairment charges on indefinite-lived intangible assets in any of the periods presented.
Acquisitions
The Company recognizes the assets acquired, the liabilities assumed, and any noncontrolling interest in the acquiree at the acquisition date, measured at their fair values as of that date. Contingent purchase consideration is recorded at fair value at the date of acquisition. Any excess purchase price over the fair value of the net assets acquired is recorded as goodwill. Within one year from the date of acquisition, the Company may update the value allocated to the assets acquired and liabilities assumed and the resulting goodwill balance as a result of information received regarding the valuation of such assets and liabilities that was not available at the time of purchase. Measuring assets and liabilities at fair value requires the Company to determine the price that would be paid by a third party market participant based on the highest and best use of the assets or interests acquired. Acquisition costs are expensed as incurred.
During fiscal 2018, the Company acquired certain assets of a metals recycling business in Columbus, Georgia. The acquisition was not material to the Company's financial position or results of operations. Pro forma operating results for this acquisition are not presented, since the aggregate results would not be significantly different than reported results. See
Note 6
- Goodwill and Other Intangible Assets, net for further details. The Company did not complete any acquisitions in fiscal 2017 and 2016.
Restructuring Charges
Restructuring charges consist of severance, contract termination and other restructuring-related costs. A liability for severance costs is typically recognized when the plan of termination has been communicated to the affected employees and is measured at its fair value at the communication date. Contract termination costs consist primarily of costs that will continue to be incurred under operating leases for their remaining terms without economic benefit to the Company. A liability for contract termination costs is recognized at the date the Company ceases using the rights conveyed by the lease contract and is measured at its fair value, which is determined based on the remaining contractual lease rentals reduced by estimated sublease rentals. A liability for other restructuring-related costs is measured at its fair value in the period in which the liability is incurred. See
Note 9
- Restructuring Charges and Other Exit-Related Activities for further detail.
Accrued Workers’ Compensation Costs
The Company is self-insured for the significant majority of workers’ compensation claims with exposure limited by various stop-loss insurance policies. The Company estimates the costs of workers’ compensation claims based on the nature of the injury incurred and on guidelines established by the applicable state. An accrual is recorded based upon the amount of unpaid claims as of the balance sheet date. Accrued amounts recorded for individual claims are reviewed periodically as treatment progresses and adjusted to reflect additional information that becomes available. The estimated cost of claims incurred but not reported is included
67
/
Schnitzer Steel Industries, Inc. Form 10-K 2018
in the accrual. The Company accrued
$8 million
and
$10 million
for the estimated cost of unpaid workers’ compensation claims as of
August 31, 2018 and 2017
, respectively, which are included in other accrued liabilities in the Consolidated Balance Sheets.
Environmental Liabilities
The Company estimates future costs for known environmental remediation requirements and accrues for them on an undiscounted basis when it is probable that the Company has incurred a liability and the related costs can be reasonably estimated but the timing of incurring the estimated costs is unknown. The Company considers various factors when estimating its environmental liabilities. Adjustments to the liabilities are recorded to selling, general and administrative expense in the Consolidated Statements of Operations when additional information becomes available that affects the estimated costs to study or remediate any environmental issues or when expenditures are made for which liabilities were established. Legal costs incurred in connection with environmental contingencies are expensed as incurred.
When only a wide range of estimated amounts can be reasonably established and no other amount within the range is a better estimate than another, the low end of the range is recorded in the financial statements. In a number of cases, it is possible that the Company may receive reimbursement through insurance or from other potentially responsible parties for a site or matter. In these situations, recoveries of environmental remediation costs from other parties are recognized when the claim for recovery is either realized or realizable. The amounts recorded for environmental liabilities are reviewed periodically as assessment and remediation progresses at individual sites or for particular matters and adjusted to reflect additional information that becomes available. Due to evolving remediation technology, changing regulations, possible third party contributions, the subjective nature of the assumptions used and other factors, amounts accrued could vary significantly from amounts paid. See “Contingencies – Environmental” in
Note 8
– Commitments and Contingencies for further detail.
Loss Contingencies
The Company is subject to certain legal proceedings and contingencies in addition to those related to environmental liabilities discussed above in this Note, the outcomes of which are subject to significant uncertainty. The Company accrues for estimated losses if it is probable that a liability has been incurred and the amount of the loss can be reasonably estimated. The Company uses judgment and evaluates whether a loss contingency arising from litigation or an unasserted claim should be disclosed or recorded. The outcome of legal proceedings and other contingencies is inherently uncertain and often difficult to estimate. Accrued legal contingencies are reported within other accrued liabilities in the Consolidated Balance Sheets. Amounts accrued, net of corresponding receivables from insurers reported within other current assets in the Consolidated Balance Sheets, were not material as of August 31, 2018 and 2017. See “Contingencies – Other” in
Note 8
– Commitments and Contingencies for further detail.
Financial Instruments
The Company’s financial instruments include cash and cash equivalents, accounts receivable, accounts payable, and debt. The Company uses the market approach to value its financial assets and liabilities, determined using available market information. The net carrying amounts of cash and cash equivalents, accounts receivable and accounts payable approximate fair value due to the short-term nature of these instruments. For long-term debt, which is primarily at variable interest rates, fair value is estimated using observable inputs (Level 2) and approximates its carrying value.
Fair Value Measurements
Fair value is measured using inputs from the
three
levels of the fair value hierarchy. Classification within the hierarchy is determined based on the lowest level input that is significant to the fair value measurement. The
three
levels are described as follows:
|
•
|
Level 1
– Unadjusted quoted prices in active markets for identical assets and liabilities.
|
|
•
|
Level 2
– Inputs other than quoted prices included within Level 1 that are observable for the determination of the fair value of the asset or liability, either directly or indirectly.
|
|
•
|
Level 3
– Unobservable inputs that are significant to the determination of the fair value of the asset or liability.
|
When developing the fair value measurements, the Company uses quoted market prices whenever available or seeks to maximize the use of observable inputs and minimize the use of unobservable inputs when quoted market prices are not available.
Derivatives
Derivative contracts for commodities used in normal business operations that are settled by physical delivery, among other criteria, are eligible for and may be designated as normal purchases and normal sales. Contracts that qualify as normal purchases or normal sales are not marked-to-market. The Company does not use derivative instruments for trading or speculative purposes.
68
/
Schnitzer Steel Industries, Inc. Form 10-K 2018
Foreign Currency Translation and Transactions
Assets and liabilities of the Company’s operations in Canada are translated into U.S. dollars at the period-end exchange rate, revenues and expenses of these operations are translated into U.S. dollars at the average exchange rate for the period, and cash flows of these operations are translated into U.S. dollars using the exchange rates in effect at the time of the cash flows. Translation adjustments are not included in determining net income (loss) for the period, but are recorded in accumulated other comprehensive income (loss), a separate component of shareholders’ equity. Foreign currency transaction gains and losses are generated from the effects of exchange rate changes on transactions denominated in a currency other than the functional currency. Gains and losses on foreign currency transactions are generally included in determining net income (loss) for the period. The Company reports these gains and losses within other income, net in the Consolidated Statements of Operations. Net realized and unrealized foreign currency transaction gains and losses were not material for fiscal years
2018, 2017 and 2016
.
Common Stock
Each share of Class A and Class B common stock is entitled to
one
vote. Additionally, each share of Class B common stock may be converted to
one
share of Class A common stock. As such, the Company reserves
one
share of Class A common stock for each share of Class B common stock outstanding. There are currently no meaningful distinctions between the rights of holders of Class A shares and Class B shares.
Share Repurchases
The Company accounts for the repurchase of stock at par value. All shares repurchased are deemed retired. Upon retirement of the shares, the Company records the difference between the weighted average cost of such shares and the par value of the stock as an adjustment to additional paid-in capital, with the excess recorded to retained earnings when additional paid-in capital is not sufficient.
Revenue Recognition
The Company recognizes revenue when it has a contract or purchase order from a customer with a fixed or determinable price, the title and risk of loss transfer to the buyer, and collectibility is reasonably assured. Title for both recycled scrap metal and finished steel products transfers based on contract terms. Historically, almost all of the Company’s ferrous export sales are made with letters of credit, reducing credit risk. However, ferrous domestic sales, nonferrous sales and sales of finished steel products are generally made on open account. Nonferrous export sales typically require a deposit prior to shipment. All sales made on open account are evaluated for collectibility prior to revenue recognition. Additionally, the Company recognizes revenue on partially loaded shipments of ferrous recycled scrap metal when contractual terms support revenue recognition based on transfer of title and risk of loss. The Company reports revenue net of the payments made to the supplier of scrap metal when the supplier, and not the Company, is primarily responsible for fulfillment, including the acceptability of the products purchased by the customer. Retail auto parts revenue is recognized when the customer pays for the part. Historically, there have been very few sales returns and adjustments that impact the ultimate collection of revenues; therefore, no material provisions for returns have been made when sales are recognized. The Company presents taxes assessed by governmental authorities collected from customers on a net basis. Therefore, the taxes are excluded from revenues and are shown as a liability on the Consolidated Balance Sheets until remitted.
Freight Costs
The Company classifies shipping and handling costs billed to customers as revenue and the related costs incurred as a component of cost of goods sold.
Advertising Costs
The Company expenses advertising costs when incurred. Advertising expense was
$6 million
in fiscal 2018 and 2017, and
$5 million
in fiscal
2016
.
Share-Based Compensation
The Company recognizes compensation cost relating to share-based payment transactions with employees and non-employee directors over the vesting period, with the cost measured based on the grant-date fair value of the equity instruments issued, net of an estimated forfeiture rate. See
Note 12
– Share-Based Compensation for further detail.
Income Taxes
Income taxes are accounted for using the asset and liability method. This requires the recognition of taxes currently payable or refundable and the recognition of deferred tax assets and liabilities for the future tax consequences of events that are recognized in one reporting period on the Consolidated Financial Statements but in a different reporting period on the tax returns. Tax credits
69
/
Schnitzer Steel Industries, Inc. Form 10-K 2018
are recognized as a reduction of income tax expense in the year the credit arises. Valuation allowances are recorded to reduce deferred tax assets when it is more likely than not that a tax benefit will not be realized. The Company assesses the realizability of its deferred tax assets on a quarterly basis through an analysis of potential sources of future taxable income, including prior year taxable income available to absorb a carryback of tax losses, reversals of existing taxable temporary differences, tax planning strategies, and forecasts of taxable income. The Company considers all negative and positive evidence, including the weight of the evidence, to determine if valuation allowances against deferred tax assets are required. Tax benefits arising from uncertain tax positions are recognized when it is more likely than not that the position will be sustained upon examination by the relevant tax authorities. The amount recognized in the financial statements is the largest amount of tax benefit that is greater than 50 percent likely of being realized upon ultimate settlement with a taxing authority that has full knowledge of all relevant information. The Company recognizes interest and penalties, if any, related to uncertain tax positions in income tax expense. See
Note 13
– Income Taxes for further detail.
Net Income (Loss) Per Share
Basic net income (loss) per share attributable to SSI is computed by dividing net income (loss) attributable to SSI by the weighted average number of outstanding common shares during the period presented including vested deferred stock units (“DSUs”) and restricted stock units (“RSUs”) meeting certain criteria. Diluted net income (loss) per share attributable to SSI is computed by dividing net income (loss) attributable to SSI by the weighted average number of common shares outstanding, assuming dilution. Potentially dilutive common shares include the assumed exercise of stock options and assumed vesting of performance share, RSU and DSU awards using the treasury stock method. Certain of the Company’s stock options and performance share and RSU awards were excluded from the calculation of diluted net income (loss) per share attributable to SSI because they were antidilutive; however, certain of these RSU and performance share awards could be dilutive in the future. Net income attributable to noncontrolling interests is deducted from income (loss) from continuing operations to arrive at income (loss) from continuing operations attributable to SSI for the purpose of calculating income (loss) per share from continuing operations attributable to SSI. Income (loss) per share from discontinued operations attributable to SSI is presented separately in the Consolidated Statements of Operations. See
Note 14
– Net Income (Loss) Per Share for further detail.
Use of Estimates
The preparation of the Company’s Consolidated Financial Statements in accordance with generally accepted accounting principles in the United States of America (“U.S. GAAP”) requires management to make estimates and assumptions that affect the reported amounts of assets and liabilities and disclosure of contingent assets and liabilities at the date of the Consolidated Financial Statements and reported amounts of revenue and expenses during the reporting period. Examples include revenue recognition; the allowance for doubtful accounts; estimates of contingencies, including environmental liabilities and other legal liabilities; goodwill, long-lived asset and indefinite-lived intangible asset valuation; valuation of equity method and cost method investments; valuation of certain share-based awards; other asset valuation; inventory measurement and valuation; pension plan assumptions; and the assessment of the valuation of deferred income taxes and income tax contingencies. Actual results may differ from estimated amounts.
Concentration of Credit Risk
Financial instruments that potentially subject the Company to significant concentration of credit risk consist primarily of cash and cash equivalents, accounts receivable, and notes and other contractual receivables. The majority of cash and cash equivalents is maintained with major financial institutions. Balances with these and certain other institutions exceeded the Federal Deposit Insurance Corporation insured amount of
$250,000
as of
August 31, 2018
. Concentration of credit risk with respect to accounts receivable is limited because a large number of geographically diverse customers make up the Company’s customer base. The Company controls credit risk through credit approvals, credit limits, credit insurance, letters of credit or other collateral, cash deposits and monitoring procedures. The Company is exposed to a residual credit risk with respect to open letters of credit by virtue of the possibility of the failure of a bank providing a letter of credit. The Company had
$58 million
and
$48 million
of open letters of credit as of
August 31, 2018 and 2017
, respectively.
Note 3
– Recent Accounting Pronouncements
In May 2014, an accounting standards update was issued that clarifies the principles for recognizing revenue from contracts with customers. The update supersedes the existing standard for recognizing revenue. Additional updates have been issued since May 2014 amending aspects of the initial update and providing implementation guidance. The guidance is applicable to all contracts with customers regardless of industry-specific or transaction-specific fact patterns. Further, the guidance requires improved disclosures to help users of financial statements better understand the nature, amount, timing, and uncertainty of revenue that is recognized. The Company will adopt the standard effective September 1, 2018 using the modified retrospective approach. The Company does not expect to recognize a cumulative effect adjustment to the opening balance of retained earnings in connection
70
/
Schnitzer Steel Industries, Inc. Form 10-K 2018
with the initial application of the standard. Further, the Company does not expect the adoption of the standard to have a material impact on its financial position, net income or cash flows. The Company has identified certain scrap metal purchase and sale arrangements for which it currently recognizes revenue for the gross amount of consideration it expects to be entitled from the customer (as principal), but for which under the new revenue standard it will recognize revenue as the net amount of consideration that it expects to retain after paying the scrap metal supplier (as agent). This change in the classification of the cost of scrap metal purchased under such arrangements will have the effect of reducing the amount of revenues reported in the financial statements, while having no impact on net income.
In January 2016, an accounting standards update was issued that amends certain aspects of the reporting model for financial instruments. Most prominent among the amendments is the requirement for equity investments, with certain exceptions including those accounted for under the equity method of accounting, to be measured at fair value with changes in fair value recognized in net income. An entity may choose to measure equity investments that do not have readily determinable fair values, such as certain cost method investments, at cost minus impairment, plus or minus changes resulting from observable price changes. The amendments also require a qualitative assessment to identify impairment of equity investments without readily determinable fair values. The standard is effective for the Company beginning in fiscal 2019, including interim periods within that fiscal year. The Company does not expect adoption to have a material impact on its consolidated financial position, results of operations and cash flows.
In February 2016, an accounting standard was issued that will supersede the existing lease standard and require a lessee to recognize a lease liability and a lease asset on its balance sheet for all leases, including those classified as operating leases under the existing lease standard. The update also expands the required quantitative and qualitative disclosures surrounding leases. Additional updates have been issued since February 2016 amending aspects of the initial update, including providing an additional and optional transition method for adoption. This standard is effective for the Company beginning in fiscal 2020, including interim periods within that fiscal year. The Company expects to initially apply the requirements by recognizing a cumulative-effect adjustment to the opening balance of retained earnings, if any, in the period of adoption. The Company is in the process of identifying its population of leases within the scope of the new accounting standard and documenting salient lease terms to support the initial and subsequent measurement of lease liabilities and lease assets. The Company is also assessing and implementing changes to its processes, systems, and internal controls as a result of the new guidance. The Company is evaluating the impact of adopting this standard on its financial position, results of operations, cash flows and disclosures, and it expects to recognize a material amount of lease assets and liabilities on its consolidated balance sheet upon adoption.
Note 4
– Inventories
Inventories consisted of the following as of August 31 (in thousands):
|
2018
|
2017
|
||||||
|
Processed and unprocessed scrap metal
|
$
|
111,658
|
|
$
|
88,441
|
|
|
|
Semi-finished goods
|
15,551
|
|
3,243
|
|
|||
|
Finished goods
|
39,809
|
|
40,462
|
|
|||
|
Supplies
|
38,859
|
|
34,796
|
|
|||
|
Inventories
|
$
|
205,877
|
|
$
|
166,942
|
|
|
Note 5
– Property, Plant and Equipment, net
Property, plant and equipment, net consisted of the following as of August 31 (in thousands):
|
2018
|
2017
|
||||||
|
Machinery and equipment
|
$
|
679,520
|
|
$
|
683,364
|
|
|
|
Land and improvements
|
269,382
|
|
260,854
|
|
|||
|
Buildings and leasehold improvements
|
108,882
|
|
111,077
|
|
|||
|
ERP systems
|
17,760
|
|
17,884
|
|
|||
|
Office equipment and other software licenses
|
43,175
|
|
48,517
|
|
|||
|
Construction in progress
|
28,553
|
|
25,427
|
|
|||
|
Property, plant and equipment, gross
|
1,147,272
|
|
1,147,123
|
|
|||
|
Less: accumulated depreciation
|
(731,561
|
)
|
(756,494
|
)
|
|||
|
Property, plant and equipment, net
|
$
|
415,711
|
|
$
|
390,629
|
|
|
71
/
Schnitzer Steel Industries, Inc. Form 10-K 2018
Depreciation expense for property, plant and equipment, which includes amortization expense for assets under capital leases, was
$49 million
for the years ended August 31, 2018 and 2017, and
$53 million
for the year ended August 31, 2016. The year-over-year decrease in accumulated depreciation was primarily due to the retirement of heavily aged equipment assets during fiscal 2018.
Note 6
– Goodwill and Other Intangible Assets, net
The Company evaluates goodwill for impairment annually on July 1 and upon the occurrence of certain triggering events or substantive changes in circumstances that indicate that the fair value of goodwill may be impaired.
In the second quarter of fiscal 2016, management identified the combination of sustained weak market conditions at such time, including the adverse effects of lower commodity selling prices and the constraining impact of the lower price environment on the supply of raw materials which negatively impacted volumes, the Company’s financial performance and a decline in the Company’s market capitalization at such time as a triggering event requiring an interim impairment test of goodwill allocated to its reporting units, which resulted in impairment of the entire carrying amount of goodwill allocated to a reporting unit within AMR totaling
$9 million
.
In the second quarter of fiscal 2018, the Company acquired certain assets of a metals recycling business in Columbus, Georgia for
$2 million
. The acquisition qualified as a business combination under the accounting rules and resulted in the recognition of
$1 million
of goodwill during the second quarter of fiscal 2018. The Company allocated the acquired goodwill to a reporting unit within the AMR operating segment. The reporting unit did not carry any goodwill immediately prior to the acquisition.
In the fourth quarter of fiscal
2018
, the Company performed the annual goodwill impairment test as of July 1,
2018
. As of the testing date, the balance of the Company’s goodwill of
$168 million
was carried by
two
reporting units within AMR. The Company elected to first assess qualitative factors to determine whether the existence of events or circumstances led to a determination that it is more likely than not that the estimated fair value of each reporting unit is less than its carrying amount. As a result of the qualitative assessment, the Company concluded that it is not more likely than not that the fair value of each reporting unit is less than its carrying value as of the testing date and, therefore, no further impairment testing was required.
The gross change in the carrying amount of goodwill for the years ended
August 31, 2018 and 2017
was as follows (in thousands):
|
Goodwill
|
|||
|
Balance as of August 31, 2016
|
$
|
166,847
|
|
|
Foreign currency translation adjustment
|
988
|
|
|
|
Balance as of August 31, 2017
|
167,835
|
|
|
|
Acquisition
|
1,118
|
|
|
|
Foreign currency translation adjustment
|
(888
|
)
|
|
|
Balance as of August 31, 2018
|
$
|
168,065
|
|
Accumulated goodwill impairment charges were
$471 million
as of
August 31, 2018 and 2017
.
The following table presents the Company’s intangible assets as of August 31 (in thousands):
|
|
2018
|
2017
|
|||||||||||||||||||||
|
Gross
Carrying
Amount
|
Accumulated
Amortization
|
Net
|
Gross
Carrying
Amount
|
Accumulated
Amortization
|
Net
|
||||||||||||||||||
|
Covenants not to compete
|
$
|
5,591
|
|
$
|
(2,596
|
)
|
$
|
2,995
|
|
$
|
6,094
|
|
$
|
(3,140
|
)
|
$
|
2,954
|
|
|||||
|
Other intangible assets subject to amortization
(1)
|
1,162
|
|
(880
|
)
|
282
|
|
1,162
|
|
(773
|
)
|
389
|
|
|||||||||||
|
Indefinite-lived intangibles
(2)
|
1,081
|
|
—
|
|
1,081
|
|
1,081
|
|
—
|
|
1,081
|
|
|||||||||||
|
Total
|
$
|
7,834
|
|
$
|
(3,476
|
)
|
$
|
4,358
|
|
$
|
8,337
|
|
$
|
(3,913
|
)
|
$
|
4,424
|
|
|||||
_____________________________
|
(1)
|
Other intangible assets subject to amortization include leasehold interests, permits and licenses.
|
|
(2)
|
Indefinite-lived intangibles include trade names, permits and licenses, and real property options.
|
72
/
Schnitzer Steel Industries, Inc. Form 10-K 2018
Total intangible asset amortization expense was
$1 million
in each of the years ended
August 31, 2018, 2017 and 2016
. Impairments of intangible assets were immaterial for all periods presented.
The estimated amortization expense, based on current intangible asset balances, during the next five fiscal years and thereafter is as follows (in thousands):
|
Years Ending August 31,
|
Estimated
Amortization
Expense
|
|||
|
2019
|
$
|
443
|
|
|
|
2020
|
350
|
|
||
|
2021
|
350
|
|
||
|
2022
|
350
|
|
||
|
2023
|
293
|
|
||
|
Thereafter
|
1,491
|
|
||
|
Total
|
$
|
3,277
|
|
|
Note 7
– Debt
Debt consisted of the following as of August 31 (in thousands):
|
2018
|
2017
|
||||||
|
Bank revolving credit facilities, interest at LIBOR plus a spread
|
$
|
100,000
|
|
$
|
140,000
|
|
|
|
Capital lease obligations due through February 2028
|
6,787
|
|
4,418
|
|
|||
|
Other debt obligations
|
589
|
|
706
|
|
|||
|
Total debt
|
107,376
|
|
145,124
|
|
|||
|
Less current maturities
|
(1,139
|
)
|
(721
|
)
|
|||
|
Debt, net of current maturities
|
$
|
106,237
|
|
$
|
144,403
|
|
|
On August 24, 2018, the Company and certain of its subsidiaries entered into the First Amendment to the Third Amended and Restated Credit Agreement (the “Amended Credit Agreement”) with Bank of America, N.A., as administrative agent, and the other lenders party thereto, which amends and restates the Company’s existing credit agreement. The Amended Credit Agreement provides for
$700 million
and C
$15 million
in senior secured revolving credit facilities maturing in August 2023. Prior to its amendment and renewal, the credit agreement provided for
$335 million
and C
$15 million
in senior secured revolving credit facilities. The Company incurred
$3 million
in debt issuance costs in connection with the Amended Credit Agreement, which are amortized to interest expense over the
five
-year term of the arrangement. As of
August 31, 2018 and 2017
, borrowings outstanding under the credit facilities were
$100 million
and
$140 million
, respectively. The weighted average interest rate on amounts outstanding under the credit facilities was
3.57%
and
3.48%
as of
August 31, 2018 and 2017
, respectively.
Interest rates on outstanding indebtedness under the Amended Credit Agreement are based, at the Company’s option, on either the London Interbank Offered Rate (“LIBOR”), or the Canadian equivalent, plus a spread of between
1.25%
and
2.75%
, with the amount of the spread based on a pricing grid tied to the Company’s consolidated funded debt to EBITDA ratio, or the greater of the prime rate, the federal funds rate plus
0.50%
or the daily rate equal to one-month LIBOR plus
1.75%
, in each case plus a spread of between
zero
and
1.50%
based on a pricing grid tied to the Company’s consolidated funded debt to EBITDA ratio. In addition, commitment fees are payable on the unused portion of the credit facilities at rates between
0.15%
and
0.45%
based on a pricing grid tied to the Company’s consolidated funded debt to EBITDA ratio.
The Amended Credit Agreement contains certain customary covenants, including covenants that limit the ability of the Company and its subsidiaries to enter into certain types of transactions. Financial covenants include covenants requiring maintenance of a minimum fixed charge coverage ratio and a maximum leverage ratio. The Company’s obligations under the Amended Credit Agreement are guaranteed by substantially all of its subsidiaries. The credit facilities and the related guarantees are secured by senior first priority liens on certain of the Company’s and its subsidiaries’ assets, including equipment, inventory and accounts receivable.
73
/
Schnitzer Steel Industries, Inc. Form 10-K 2018
As of August 31, 2016, the Company had
$8 million
of tax-exempt economic development revenue bonds outstanding with the State of Oregon and scheduled to mature in January 2021. In August 2016, the Company exercised its option to redeem the bonds prior to maturity. The Company repaid the bonds in full in September 2016. The
$8 million
repayment is reported as a cash outflow from financing activities for the fiscal year ended August 31, 2017 on the Consolidated Statement of Cash Flows.
Principal payments on long-term debt and capital lease obligations during the next five fiscal years and thereafter are as follows (in thousands):
|
Year Ending August 31,
|
Long-Term
Debt
|
Capital
Lease
Obligations
|
Total
|
|||||||||
|
2019
|
$
|
98
|
|
$
|
1,732
|
|
$
|
1,830
|
|
|||
|
2020
|
90
|
|
1,712
|
|
1,802
|
|
||||||
|
2021
|
48
|
|
1,528
|
|
1,576
|
|
||||||
|
2022
|
50
|
|
1,430
|
|
1,480
|
|
||||||
|
2023
|
100,054
|
|
1,304
|
|
101,358
|
|
||||||
|
Thereafter
|
249
|
|
1,643
|
|
1,892
|
|
||||||
|
Total
|
100,589
|
|
9,349
|
|
109,938
|
|
||||||
|
Amounts representing interest
|
—
|
|
(2,562
|
)
|
(2,562
|
)
|
||||||
|
Total less interest
|
$
|
100,589
|
|
$
|
6,787
|
|
$
|
107,376
|
|
|||
The Company maintains stand-by letters of credit to provide for certain obligations including workers’ compensation and performance bonds. The Company had
$10 million
outstanding under these arrangements as of
August 31, 2018
and 2017.
Note 8
– Commitments and Contingencies
Commitments
The Company leases a portion of its capital equipment and certain of its facilities under leases that expire at various dates through fiscal 2047. The majority of the Company’s facility lease agreements include renewal options and rent escalation clauses. Rent expense was
$27 million
,
$25 million
and
$24 million
for fiscal
2018
,
2017
and
2016
, respectively.
The table below sets forth the Company’s future minimum obligations under non-cancelable operating leases as of
August 31, 2018
(in thousands):
|
Year Ending August 31,
|
Operating
Leases
|
|||
|
2019
|
$
|
21,004
|
|
|
|
2020
|
18,741
|
|
||
|
2021
|
13,219
|
|
||
|
2022
|
10,453
|
|
||
|
2023
|
8,170
|
|
||
|
Thereafter
|
19,435
|
|
||
|
Total
|
$
|
91,022
|
|
|
Contingencies – Environmental
Changes in the Company’s environmental liabilities for the years ended
August 31, 2018 and 2017
were as follows (in thousands):
|
Balance 8/31/2016
|
Liabilities Established
(Released), Net |
Payments and Other
|
Ending Balance 8/31/2017
|
Liabilities Established
(Released),
Net
|
Payments and Other
|
Ending Balance 8/31/2018
|
Short-Term
|
Long-Term
|
||||||||||||||||||||||||||
|
$
|
46,350
|
|
$
|
2,560
|
|
$
|
(512
|
)
|
$
|
48,398
|
|
$
|
9,172
|
|
$
|
(3,738
|
)
|
$
|
53,832
|
|
$
|
6,682
|
|
$
|
47,150
|
|
||||||||
74
/
Schnitzer Steel Industries, Inc. Form 10-K 2018
Recycling Operations
As of
August 31, 2018
and
2017
, the Company’s recycling operations had environmental liabilities of
$54 million
and
$48 million
, respectively, for the potential remediation of locations where it has conducted business or has environmental liabilities from historical or recent activities. The liabilities relate to the investigation and potential future remediation of soil contamination, groundwater contamination, storm water runoff issues and other natural resource damages. Except for Portland Harbor and certain liabilities discussed under Other Legacy Environmental Loss Contingencies below, such liabilities were not individually material at any site.
Portland Harbor
In December 2000, the Company was notified by the United States Environmental Protection Agency (“EPA”) under the Comprehensive Environmental Response, Compensation and Liability Act (“CERCLA”) that it is one of the potentially responsible parties (“PRPs”) that own or operate or formerly owned or operated sites which are part of or adjacent to the Portland Harbor Superfund site (the “Site”). The precise nature and extent of cleanup of any specific areas within the Site, the parties to be involved, the timing of any specific remedial action and the allocation of the costs for any cleanup among responsible parties have not yet been determined. The process of site investigation, remedy selection, identification of additional PRPs and allocation of costs has been underway for a number of years, but significant uncertainties remain. It is unclear to what extent the Company will be liable for environmental costs or natural resource damage claims or third party contribution or damage claims with respect to the Site.
While the Company participated in certain preliminary Site study efforts, it was not party to the consent order entered into by the EPA with certain other PRPs, referred to as the “Lower Willamette Group” (“LWG”), for a remedial investigation/feasibility study (“RI/FS”). During fiscal 2007, the Company and certain other parties agreed to an interim settlement with the LWG under which the Company made a cash contribution to the LWG RI/FS. The LWG has indicated that it had incurred over
$115 million
in investigation-related costs over an approximately
10
year period working on the RI/FS. Following submittal of draft RI and FS documents which the EPA largely rejected, the EPA took over the RI/FS process.
The Company has joined with approximately
100
other PRPs, including the LWG members, in a voluntary process to establish an allocation of costs at the Site, including the costs incurred by the LWG in the RI/FS process. The LWG members have also commenced federal court litigation, which has been stayed, seeking to bring additional parties into the allocation process.
In January 2008, the Portland Harbor Natural Resource Trustee Council (“Trustee Council”) invited the Company and other PRPs to participate in funding and implementing the Natural Resource Injury Assessment for the Site. Following meetings among the Trustee Council and the PRPs, funding and participation agreements were negotiated under which the participating PRPs, including the Company, agreed to fund the first phase of the three-phase natural resource damage assessment. Phase 1, which included the development of the Natural Resource Damage Assessment Plan (“AP”) and implementation of several early studies, was substantially completed in 2010. In December 2017, the Company joined with other participating PRPs in agreeing to fund Phase 2 of the natural resource damage assessment, which includes the implementation of the AP to develop information sufficient to facilitate early settlements between the Trustee Council and Phase 2 participants and the identification of restoration projects to be funded by the settlements. In late May 2018, the Trustee Council published notice of its intent to proceed with Phase 3, which will involve the full implementation of the AP and the final injury and damage determination. The Company is proceeding with the process established by the Trustee Council regarding early settlements under Phase 2. It is uncertain whether the Company will enter into an early settlement for natural resource damages or what costs it may incur in any such early settlement.
On January 30, 2017, one of the Trustees, the Confederated Tribes and Bands of the Yakama Nation, which withdrew from the council in 2009, filed a suit against approximately
30
parties, including the Company, seeking reimbursement of certain past and future response costs in connection with remedial action at the Site and recovery of assessment costs related to natural resources damages from releases at and from the Site to the Multnomah Channel and the Lower Columbia River. The Company intends to defend against such claims and does not have sufficient information to determine the likelihood of a loss in this matter or to estimate the amount of damages being sought or the amount of such damages that could be allocated to the Company.
Estimates of the cost of remedial action for the cleanup of the in-river portion of the Site have varied widely in various drafts of the FS and in the EPA’s final FS issued in June 2016 ranging from approximately
$170 million
to over
$2.5 billion
(net present value), depending on the remedial alternative and a number of other factors. In comments submitted to the EPA, the Company and certain other stakeholders identified a number of serious concerns regarding the EPA’s risk and remedial alternatives assessments, cost estimates, scheduling assumptions and conclusions regarding the feasibility and effectiveness of remediation technologies.
75
/
Schnitzer Steel Industries, Inc. Form 10-K 2018
In January 2017, the EPA issued a Record of Decision (“ROD”) that identified the selected remedy for the Site. The selected remedy is a modified version of one of the alternative remedies evaluated in the EPA’s FS that was expanded to include additional work at a greater cost. The EPA has estimated the total cost of the selected remedy at
$1.7 billion
with a net present value cost of
$1.05 billion
(at a
7%
discount rate) and an estimated construction period of
13
years following completion of the remedial designs. In the ROD, the EPA stated that the cost estimate is an order-of-magnitude engineering estimate that is expected to be within +
50%
to -
30%
of the actual project cost and that changes in the cost elements are likely to occur as a result of new information and data collected during the engineering design. The Company has identified a number of concerns regarding the remedy described in the ROD, which is based on data that is more than a decade old, and the EPA’s estimates for the costs and time required to implement the selected remedy. Because of ongoing questions regarding cost effectiveness, technical feasibility, and the use of stale data, it is uncertain whether the ROD will be implemented as issued. In addition, the ROD did not determine or allocate the responsibility for remediation costs among the PRPs.
In the ROD, the EPA acknowledged that much of the data used in preparing the ROD was more than a decade old and would need to be updated with a new round of “baseline” sampling to be conducted prior to the remedial design phase. Accordingly, the ROD provided for additional pre-remedial design investigative work and baseline sampling to be conducted in order to provide a baseline of current conditions and delineate particular remedial actions for specific areas within the Site. This additional sampling needs to occur prior to proceeding with the next phase in the process which is the remedial design. The remedial design phase is an engineering phase during which additional technical information and data will be collected, identified and incorporated into technical drawings and specifications developed for the subsequent remedial action. Moreover, the ROD provided only Site-wide cost estimates and did not provide sufficient detail to estimate costs for specific sediment management areas within the Site. Following issuance of the ROD, EPA proposed that the PRPs, or a subgroup of PRPs, perform the additional investigative work identified in the ROD under a new consent order.
In December 2017, the Company and
three
other PRPs entered into a new Administrative Settlement Agreement and Order on Consent with EPA to perform such pre-remedial design investigation and baseline sampling over a
two
-year period. The Company estimates that its share of the costs of performing such work will be approximately
$2 million
, which it recorded to environmental liabilities and selling, general and administrative expense in the consolidated financial statements in fiscal 2018. The Company believes that such costs will be fully covered by existing insurance coverage and, thus, also recorded an insurance receivable for
$2 million
in fiscal 2018, resulting in no net impact to the Company’s consolidated results of operations.
Except for certain early action projects in which the Company is not involved, remediation activities are not expected to commence for a number of years. In addition, as discussed above, responsibility for implementing and funding the remedy will be determined in a separate allocation process. The Company does not expect the next major stage of the allocation process to proceed until after the additional pre-remedial design data is collected.
Because there has not been a determination of the specific remediation actions that will be required, the amount of natural resource damages or the allocation of costs of the investigations and any remedy and natural resource damages among the PRPs, the Company believes it is not possible to reasonably estimate the amount or range of costs which it is likely to or which it is reasonably possible that it will incur in connection with the Site, although such costs could be material to the Company’s financial position, results of operations, cash flows and liquidity. Among the facts currently being developed are detailed information on the history of ownership of and the nature of the uses of and activities and operations performed on each property within the Site, which are factors that will play a substantial role in determining the allocation of investigation and remedy costs among the PRPs. The Company has insurance policies that it believes will provide reimbursement for costs it incurs for defense (including the pre-remedial design investigative activities), remediation and mitigation for natural resource damages claims in connection with the Site, although there is no assurance that those policies will cover all of the costs which the Company may incur. As of
August 31, 2018
, the Company’s total liability for its estimated share of the costs of the investigation was
$2 million
.
The Oregon Department of Environmental Quality is separately providing oversight of voluntary investigations by the Company involving the Company’s sites adjacent to the Portland Harbor which are focused on controlling any current “uplands” releases of contaminants into the Willamette River. No liabilities have been established in connection with these investigations because the extent of contamination (if any) and the Company’s responsibility for the contamination (if any) have not yet been determined.
Other Legacy Environmental Loss Contingencies
The Company’s environmental loss contingencies as of
August 31, 2018
and
2017
, other than Portland Harbor, include actual or possible investigation and cleanup costs from historical contamination at sites currently or formerly owned or operated by the Company or at other sites where the Company may have responsibility for such costs due to past disposal or other activities (“legacy environmental loss contingencies”). These legacy environmental loss contingencies relate to the potential remediation of waterways and soil and groundwater contamination and may also involve natural resource damages, governmental fines and penalties and claims by third parties for personal injury and property damage. The Company has been notified that it is or may be
76
/
Schnitzer Steel Industries, Inc. Form 10-K 2018
a potentially responsible party at certain of these sites, and investigation and cleanup activities are ongoing or may be required in the future. The Company recognizes a liability for such matters when the loss is probable and can be reasonably estimated. Where investigation and cleanup activities are ongoing or where the Company has not yet been identified as having responsibility or the contamination has not yet been identified, it is reasonably possible that the Company may need to recognize additional liabilities in connection with such sites but the Company cannot currently reasonably estimate the possible loss or range of loss absent additional information or developments. Such additional liabilities, individually or in the aggregate, may have a material adverse effect on the Company’s results of operations, financial condition or cash flows.
During fiscal 2018, the Company accrued
$4 million
in expense at its Corporate division for the estimated costs related to remediation of shredder residue disposed of in or around the 1970s at third-party sites located near each other. Investigation activities have been conducted under oversight of the applicable state regulatory agency. It is reasonably possible that the Company may recognize additional liabilities in connection with this matter at the time such losses are probable and can be reasonably estimated. The Company estimates a range of reasonably possible losses related to this matter in excess of current accruals at between
zero
and
$28 million
based on a range of remedial alternatives and subject to development and approval by regulators of a specific remedy implementation plan. The Company is investigating whether a portion or all of the current and future losses related to this matter, if incurred, are covered by existing insurance coverage or may be offset by contributions from other responsible parties.
In addition, the Company’s environmental loss contingencies as of
August 31, 2018
include
$6 million
for the estimated costs related to remediation of soil and groundwater conditions including penalties in connection with a closed facility owned and previously operated by an indirectly wholly-owned subsidiary. Investigation activities have been conducted under the oversight of the applicable state regulatory agency, and the Company has also been working with local officials with respect to the protection of public water supplies. It is reasonably possible that the Company may recognize additional liabilities, including penalties, in connection with this matter at the time such losses are probable and can be reasonably estimated. However, the Company cannot reasonably estimate at this time the possible loss or range of possible losses associated with this matter pending completion of on-going studies and determination of remediation plans and pending further negotiations to settle the related enforcement matter.
Steel Manufacturing Operations
The Company’s steel manufacturing operations had
no
known environmental liabilities as of
August 31, 2018
and
2017
.
The steel mill’s electric arc furnace generates dust (“EAF dust”) that is classified as hazardous waste by the EPA because of its zinc and lead content. As a result, the Company captures the EAF dust and ships it in specialized rail cars to firms that apply treatments that allow for the ultimate disposal of the EAF dust.
The Company’s steel mill has an operating permit issued under Title V of the Clean Air Act Amendments of 1990, which governs air quality standards. The permit is based upon an annual production capacity of
950 thousand
tons. The Company’s permit was first issued in 1998 and has since been renewed through
February 1, 2018
. The permit renewal process occurs every five years, and the renewal process is underway; however, the existing permit is extended by administrative rule until the current renewal process is finalized.
Summary - Environmental Contingencies
Other than the Portland Harbor Superfund site and legacy environmental loss contingencies, which are discussed separately above, management currently believes that adequate provision has been made for the potential impact of these issues and that the ultimate outcomes will not have a material adverse effect on the Company’s consolidated financial statements as a whole. Historically, the amounts the Company has ultimately paid for such remediation activities have not been material in any given period, but there can be no assurance that such amounts paid will not be material in the future.
Contingencies - Other
Schnitzer Southeast, LLC (a wholly-owned subsidiary of the Company, “SSE”), an SSE employee, the Company and
one
of the Company’s insurance carriers had been named as defendants in
five
separate wrongful death lawsuits filed in the State of Georgia arising from an accident in 2016 in Alabama involving a tractor trailer driven by the SSE employee and owned by SSE. Subsequent to the Company’s fiscal 2018 year end, it settled
two
of the
five
lawsuits for a total of
$20 million
, which amount has been paid and was substantially covered by insurance. In addition to amounts accrued for the
two
lawsuits settled and paid after the Company’s year end, it accrued
$10 million
reflecting its estimate of the probable loss related to the
three
unresolved lawsuits and recorded a
$10 million
insurance receivable in fiscal 2018, resulting in no net impact to the Company’s consolidated results of operations. It is reasonably possible that the Company may recognize additional losses in connection with these unresolved lawsuits at the time such additional losses are probable and can be reasonably estimated. Such additional losses may be material to the Company’s consolidated financial statements. To the extent that circumstances change and the Company determines that an additional loss is
77
/
Schnitzer Steel Industries, Inc. Form 10-K 2018
reasonably possible, can be reasonably estimated, and is material, the Company would then disclose an estimate of the additional possible loss or range of loss. The Company believes that such additional losses, if incurred, would be substantially covered by existing insurance coverage.
The Company is a party to various legal proceedings arising in the normal course of business. The Company recognizes a liability for such matters when the loss is probable and can be reasonably estimated. The Company does not anticipate that the resolution of legal proceedings arising in the normal course of business, after taking into consideration expected insurance recoveries, will have a material adverse effect on its results of operations, financial condition, or cash flows.
Note 9
- Restructuring Charges and Other Exit-Related Activities
During the past several years, the Company has implemented a number of cost reduction, productivity improvement, and restructuring initiatives to more closely align its business with market conditions. These initiatives focused on decreasing the Company’s annual operating expenses by reorganizing its business to reduce organizational layers and streamline administrative and supporting services functions and optimizing its operating capacity by idling underutilized metals recycling assets and closing facilities. The restructuring charges incurred by the Company during the periods presented pertain primarily to the plan announced in the second quarter of fiscal 2015 and expanded in subsequent periods (the “Q2’15 Plan”). Charges relating to these initiatives were substantially complete by the end of fiscal 2017. However, the Company incurred in fiscal 2018 and may continue to incur additional restructuring charges as a result of remeasuring lease contract termination liabilities to reflect changes in contractual lease rentals and sublease rentals that are not currently estimable.
The Company’s consolidated operating results in fiscal 2018 included a net benefit from restructuring charges and other exit-related activities of
$1 million
, compared to a net benefit of less than
$1 million
in fiscal 2017 and charges of
$7 million
in fiscal 2016. Exit-related activities consisted of asset impairments and accelerated depreciation of assets in connection with closure of certain operations, net of gains on exit-related disposals. The benefits and charges incurred during the periods presented primarily pertain to the Q2’15 Plan. Consolidated operating results for the periods presented also reflect benefits from cost reduction and productivity improvement measures initiated prior to the second quarter of fiscal 2015 and an immaterial amount of associated costs.
Restructuring charges and other exit-related activities incurred in connection with the cost reduction and productivity improvement plans for the fiscal year ended August 31, 2016 comprise the following (in thousands):
|
2016
|
|||||||||||
|
Q2’15 Plan
|
All Other Plans
|
Total Charges
|
|||||||||
|
Restructuring charges:
|
|||||||||||
|
Severance costs
|
$
|
4,915
|
|
$
|
—
|
|
$
|
4,915
|
|
||
|
Contract termination costs
|
796
|
|
311
|
|
1,107
|
|
|||||
|
Total restructuring charges
|
5,711
|
|
311
|
|
6,022
|
|
|||||
|
Other exit-related activities:
|
|||||||||||
|
Asset impairments and accelerated depreciation
|
3,127
|
|
—
|
|
3,127
|
|
|||||
|
Gains on exit-related disposals
|
(1,337
|
)
|
—
|
|
(1,337
|
)
|
|||||
|
Total other exit-related activities
|
1,790
|
|
—
|
|
1,790
|
|
|||||
|
Total restructuring charges and other exit-related activities
|
$
|
7,501
|
|
$
|
311
|
|
$
|
7,812
|
|
||
|
Restructuring charges and other exit-related activities included in continuing operations
|
$
|
6,781
|
|
||||||||
|
Restructuring charges and other exit-related activities included in discontinued operations
|
$
|
1,031
|
|
||||||||
78
/
Schnitzer Steel Industries, Inc. Form 10-K 2018
Restructuring charges and other exit-related activities by reportable segment for the fiscal year ended August 31, 2016 were as follows (in thousands):
|
Fiscal 2016 Charges
|
||||
|
Restructuring charges:
|
||||
|
AMR and CSS
(1)
|
$
|
4,995
|
|
|
|
Unallocated (Corporate)
|
943
|
|
||
|
Discontinued operations
|
84
|
|
||
|
Total restructuring charges
|
6,022
|
|
||
|
Other exit-related activities:
|
||||
|
Asset impairments and accelerated depreciation:
|
||||
|
AMR
|
2,180
|
|
||
|
Discontinued operations
|
947
|
|
||
|
Total asset impairments and accelerated depreciation
|
3,127
|
|
||
|
Gains on exit-related disposals:
|
||||
|
AMR
|
(1,337
|
)
|
||
|
Total gains on exit-related disposals
|
(1,337
|
)
|
||
|
Total exit-related activities
|
1,790
|
|
||
|
Total restructuring charges and other exit-related activities
|
$
|
7,812
|
|
|
___________________________
|
(1)
|
CSS's steel manufacturing operations, formerly the SMB reportable segment, did not incur restructuring charges during fiscal 2016. CSS's metals recycling operations, formerly part of the AMR reportable segment, incurred an immaterial amount of restructuring charges during fiscal 2016. Therefore, the Company presents restructuring charges related to AMR and CSS on a combined basis.
|
The Company does not allocate restructuring charges and other exit-related activities to the segments’ operating results because management does not include this information in its measurement of the performance of the operating segments.
As of August 31, 2018, cumulative restructuring charges in connection with the Q2’15 Plan totaled
$15 million
, and restructuring liabilities, consisting entirely of lease contract termination liabilities, totaled less than
$1 million
.
79
/
Schnitzer Steel Industries, Inc. Form 10-K 2018
Note 10
– Accumulated Other Comprehensive Loss
The components of accumulated other comprehensive loss, net of tax, are as follows as of
August 31, 2018, 2017 and 2016
(in thousands):
|
Foreign Currency Translation Adjustments
|
Pension Obligations, net
|
Net Unrealized Gain (Loss) on Cash Flow Hedges
|
Total
|
||||||||||||
|
Balance as of August 31, 2015
|
$
|
(34,009
|
)
|
$
|
(4,273
|
)
|
$
|
(240
|
)
|
$
|
(38,522
|
)
|
|||
|
Other comprehensive loss before reclassifications
|
(530
|
)
|
(2,139
|
)
|
—
|
|
(2,669
|
)
|
|||||||
|
Income tax benefit
|
—
|
|
167
|
|
—
|
|
167
|
|
|||||||
|
Other comprehensive loss before reclassifications, net of tax
|
(530
|
)
|
(1,972
|
)
|
—
|
|
(2,502
|
)
|
|||||||
|
Amounts reclassified from accumulated other comprehensive loss
|
—
|
|
688
|
|
312
|
|
1,000
|
|
|||||||
|
Income tax benefit
|
—
|
|
(19
|
)
|
(72
|
)
|
(91
|
)
|
|||||||
|
Amounts reclassified from accumulated other comprehensive loss, net of tax
|
—
|
|
669
|
|
240
|
|
909
|
|
|||||||
|
Net periodic other comprehensive income (loss)
|
(530
|
)
|
(1,303
|
)
|
240
|
|
(1,593
|
)
|
|||||||
|
Balance as of August 31, 2016
|
(34,539
|
)
|
(5,576
|
)
|
—
|
|
(40,115
|
)
|
|||||||
|
Other comprehensive income before reclassifications
|
2,711
|
|
1,477
|
|
—
|
|
4,188
|
|
|||||||
|
Income tax expense
|
—
|
|
(194
|
)
|
—
|
|
(194
|
)
|
|||||||
|
Other comprehensive income before reclassifications, net of tax
|
2,711
|
|
1,283
|
|
—
|
|
3,994
|
|
|||||||
|
Amounts reclassified from accumulated other comprehensive loss
|
—
|
|
851
|
|
—
|
|
851
|
|
|||||||
|
Income tax benefit
|
—
|
|
(23
|
)
|
—
|
|
(23
|
)
|
|||||||
|
Amounts reclassified from accumulated other comprehensive loss, net of tax
|
—
|
|
828
|
|
—
|
|
828
|
|
|||||||
|
Net periodic other comprehensive income
|
2,711
|
|
2,111
|
|
—
|
|
4,822
|
|
|||||||
|
Balance as of August 31, 2017
|
(31,828
|
)
|
(3,465
|
)
|
—
|
|
(35,293
|
)
|
|||||||
|
Other comprehensive income (loss) before reclassifications
|
(2,301
|
)
|
64
|
|
—
|
|
(2,237
|
)
|
|||||||
|
Income tax benefit
|
—
|
|
172
|
|
—
|
|
172
|
|
|||||||
|
Other comprehensive income (loss) before reclassifications, net of tax
|
(2,301
|
)
|
236
|
|
—
|
|
(2,065
|
)
|
|||||||
|
Amounts reclassified from accumulated other comprehensive loss
|
—
|
|
536
|
|
—
|
|
536
|
|
|||||||
|
Income tax benefit
|
—
|
|
(415
|
)
|
—
|
|
(415
|
)
|
|||||||
|
Amounts reclassified from accumulated other comprehensive loss, net of tax
|
—
|
|
121
|
|
—
|
|
121
|
|
|||||||
|
Net periodic other comprehensive income (loss)
|
(2,301
|
)
|
357
|
|
—
|
|
(1,944
|
)
|
|||||||
|
Balance as of August 31, 2018
|
$
|
(34,129
|
)
|
$
|
(3,108
|
)
|
$
|
—
|
|
$
|
(37,237
|
)
|
|||
In the second quarter of fiscal 2018, the Company adopted an accounting standard update that allowed for a reclassification from AOCI to retained earnings for stranded tax effects resulting from the Tax Act enacted on December 22, 2017. Reclassifications from AOCI to retained earnings for stranded tax effects during the year ended
August 31, 2018
, both individually and in the aggregate, were not material. Reclassifications from AOCI to earnings, both individually and in the aggregate, were not material to the impacted captions in the Consolidated Statements of Operations in all periods presented.
80
/
Schnitzer Steel Industries, Inc. Form 10-K 2018
Note 11
– Employee Benefits
The Company and certain of its subsidiaries have or contribute to qualified and nonqualified retirement plans covering substantially all employees. These plans include a defined benefit pension plan, a supplemental executive retirement benefit plan (“SERBP”), multiemployer pension plans and defined contribution plans.
Defined Benefit Pension Plan and Supplemental Executive Retirement Benefit Plan
The Company maintains a qualified defined benefit pension plan for certain nonunion employees. Effective June 30, 2006, the Company froze this plan and ceased accruing further benefits for employee service. The Company reflects the funded status of the defined benefit pension plan as a net asset or liability in its Consolidated Balance Sheets. Changes in its funded status are recognized in comprehensive income (loss). The Company amortizes as a component of net periodic pension benefit cost a portion of the net gain or loss reported within accumulated other comprehensive loss if the beginning-of-year net gain or loss exceeds
5%
of the greater of the benefit obligation or the market value of plan assets. Net periodic pension benefit cost was not material for all periods presented in this report. The fair value of plan assets was
$17 million
and
$16 million
as of
August 31, 2018 and 2017
, respectively, and the projected benefit obligation was
$15 million
and
$13 million
as of
August 31, 2018 and 2017
, respectively. The plan was fully funded with the plan assets exceeding the projected benefit obligation by
$2 million
and
$3 million
as of
August 31, 2018 and 2017
, respectively. Plan assets comprised entirely Level 1 investments as of
August 31, 2018 and 2017
. Level 1 investments are valued based on quoted market prices of identical securities in the principal market.
No
contributions are expected to be made to the defined benefit pension plan in the future; however, changes in the discount rate or actual investment returns that are lower than the long-term expected return on plan assets could result in the need for the Company to make additional contributions. The assumed discount rate used to calculate the projected benefit obligation was
4.01%
and
3.68%
as of
August 31, 2018 and 2017
, respectively. The Company estimates future annual benefit payments to be between
$1 million
and
$3 million
per year.
The Company also has a nonqualified SERBP for certain executives. A restricted trust fund has been established with assets invested in life insurance policies that can be used for plan benefits, although the fund is subject to claims of the Company’s general creditors. The trust fund is included in other assets, the current portion of the pension liability is included in other accrued liabilities, and the noncurrent portion of the pension liability is included in other long-term liabilities in the Company’s Consolidated Balance Sheets. The trust fund was valued at
$4 million
as of
August 31, 2018
and
$3 million
as of August 31, 2017. The trust fund assets’ gains and losses are included in other income, net in the Company’s Consolidated Statements of Operations. The benefit obligation and the unfunded amount were
$4 million
as of
August 31, 2018 and 2017
. Net periodic pension cost under the SERBP was not material for the years ended
August 31, 2018, 2017 and 2016
.
Because the defined benefit pension plan and the SERBP are not material to the Consolidated Financial Statements, other disclosures required by U.S. GAAP have been omitted.
Multiemployer Pension Plans
The Company contributes to
14
multiemployer pension plans in accordance with its collective bargaining agreements. Multiemployer pension plans are defined benefit plans sponsored by multiple employers in accordance with one or more collective bargaining agreements. The plans are jointly managed by trustees that include representatives from both management and labor unions. Contributions to the plans are made based upon a fixed rate per hour worked and are agreed to by contributing employers and the unions in collective bargaining. Benefit levels are set by a joint board of trustees based on the advice of an independent actuary regarding the level of benefits that agreed-upon contributions can be expected to support. To the extent that the pension obligation of other participating employers is unfunded, the Company may be required to make additional contributions in the future to fund these obligations.
One of the multiemployer plans that the Company contributes to is the Steelworkers Western Independent Shops Pension Plan (“WISPP,” EIN 90-0169564, Plan No. 001) benefiting the union employees of the Company’s steel manufacturing operations, which are covered by a collective bargaining agreement that will expire on
March 31, 2019
. As of October 1, 2017, the WISPP was certified by the plan’s actuaries as being in the Green Zone, as defined by the Pension Protection Act of 2006. The Company contributed
$3 million
to the WISPP for each of the years ended
August 31, 2018, 2017 and 2016
. These contributions represented more than
5%
of total contributions to the WISPP for each year.
81
/
Schnitzer Steel Industries, Inc. Form 10-K 2018
In 2004, the Internal Revenue Service (“IRS”) approved a seven-year extension of the period over which the WISPP may amortize unfunded liabilities, conditioned upon maintenance of certain minimum funding levels. In 2014, the WISPP obtained relief from the specified funding requirements from the IRS, which requires that the WISPP meet a minimum funded percentage on each valuation date and achieve a funded percentage of 100% as of October 1, 2029. Based on the most recent actuarial valuation for the WISPP, the funded percentage using the valuation method prescribed by the IRS satisfied the minimum funded percentage requirement.
Company contributions to all of the multiemployer plans were
$5 million
for the year ended August 31, 2018 and
$4 million
for the years ended August 31, 2017 and 2016.
Defined Contribution Plans
The Company has several defined contribution plans covering certain employees. Company contributions to the defined contribution plans totaled
$4 million
for the year ended August 31, 2018 and
$3 million
for the years ended August 31, 2017 and 2016.
82
/
Schnitzer Steel Industries, Inc. Form 10-K 2018
Note 12
– Share-Based Compensation
The Company’s 1993 Stock Incentive Plan, as amended, (the “Plan”) was established for its employees, consultants and directors. There are
12.2 million
shares of Class A common stock reserved for issuance under the Plan, of which
3.9 million
are available for future grants as of
August 31, 2018
. Share-based compensation expense was
$19 million
,
$11 million
and
$10 million
for the years ended
August 31, 2018, 2017 and 2016
, respectively.
Restricted Stock Units
The Plan provides for the issuance of RSUs. The estimated fair value of the RSUs is based on the market closing price of the underlying Class A common stock on the date of grant. The compensation expense associated with RSUs is recognized over the respective requisite service period of the awards, net of estimated forfeitures.
During the years ended
August 31, 2018, 2017 and 2016
, the Compensation Committee granted
252,865
RSUs,
314,862
RSUs and
361,131
RSUs, respectively, to its key employees, officers and employee directors under the Plan. The RSUs generally vest
20%
per year over
five
years commencing October 31 of the year after grant. In addition, in the first quarter of fiscal 2016 the Compensation Committee granted
48,163
RSUs with a
two
-year vesting term and no retirement-eligibility provisions under the Plan. The estimated fair value of the RSUs granted during each of the years ended
August 31, 2018, 2017 and 2016
was
$7 million
.
A summary of the Company’s restricted stock unit activity is as follows:
|
Number of
Shares
(in thousands)
|
Weighted
Average Grant
Date Fair Value
|
Fair Value
(1)
|
||||||||
|
Outstanding as of August 31, 2015
|
485
|
|
$
|
27.21
|
|
|||||
|
Granted
|
409
|
|
$
|
18.28
|
|
|||||
|
Vested
|
(145
|
)
|
$
|
30.86
|
|
$
|
16.36
|
|
||
|
Forfeited
|
(14
|
)
|
$
|
22.61
|
|
|||||
|
Outstanding as of August 31, 2016
|
735
|
|
$
|
21.59
|
|
|||||
|
Granted
|
315
|
|
$
|
20.95
|
|
|||||
|
Vested
|
(218
|
)
|
$
|
22.94
|
|
$
|
23.50
|
|
||
|
Forfeited
|
—
|
|
$
|
23.55
|
|
|||||
|
Outstanding as of August 31, 2017
|
832
|
|
$
|
21.00
|
|
|||||
|
Granted
|
253
|
|
$
|
26.60
|
|
|||||
|
Vested
|
(259
|
)
|
$
|
21.39
|
|
$
|
29.74
|
|
||
|
Forfeited
|
(14
|
)
|
$
|
22.83
|
|
|||||
|
Outstanding as of August 31, 2018
|
812
|
|
$
|
22.59
|
|
|||||
____________________________
|
(1)
|
Amounts represent the weighted average value of the Company’s Class A common stock on the date that the restricted stock units vested.
|
The Company recognized compensation expense associated with RSUs of
$7 million
,
$6 million
and
$6 million
for the years ended
August 31, 2018, 2017 and 2016
, respectively. As of
August 31, 2018
, total unrecognized compensation costs related to unvested RSUs amounted to
$6 million
, which is expected to be recognized over a weighted average period of
2.5
years.
Performance Share Awards
The Plan authorizes performance-based awards to certain employees subject to certain conditions and restrictions. A participant generally must be employed by the Company on October 31 following the end of the performance period to receive an award payout, although adjusted awards will be paid if employment terminates earlier on account of death, disability, retirement, termination without cause after the first year of the performance period or a sale of the Company or the reportable segments for which the participant works. Awards will be paid in Class A common stock as soon as practicable after October 31 following the end of the performance period.
83
/
Schnitzer Steel Industries, Inc. Form 10-K 2018
The Company accrues compensation cost for performance share awards containing a performance condition based on the probable outcome of specified performance conditions, net of estimated forfeitures. The Company accrues compensation cost if it is probable that the performance conditions will be achieved. The Company reassesses whether achievement of the performance conditions is probable at each reporting date. If it is probable that the actual performance results will exceed the stated target performance conditions, the Company accrues additional compensation cost for the additional performance shares to be awarded. If, upon reassessment, it is no longer probable that the actual performance results will exceed the stated target performance conditions, or that it is no longer probable that the target performance conditions will be achieved, the Company reverses any recognized compensation cost for shares no longer probable of being issued. If the performance conditions are not achieved at the end of the service period, all related compensation cost previously recognized is reversed. The measurement and recognition of compensation cost for performance share awards containing a market condition are discussed below in this Note.
Fiscal 2015 – 2016 Performance Share Awards
The Compensation Committee approved performance-based awards under the Plan with a grant date of
November 25, 2014
. The performance targets are based on the Company’s EBITDA (weighted at
50%
) and return on equity (weighted at
50%
) for the
two
years of the performance period, with award payouts ranging from a threshold of
50%
to a maximum of
200%
for each portion of the awards.
Fiscal 2016 – 2018 (November) Performance Share Awards
In the first quarter of fiscal 2016, the Compensation Committee approved performance-based awards under the Plan with a grant date of
November 9, 2015
. The
201,702
performance share awards granted by the Compensation Committee comprise two separate and distinct awards with different vesting conditions.
The Compensation Committee granted
99,860
of the performance share awards based on a relative Total Shareholder Return (“TSR”) metric over a performance period spanning November 9, 2015 to August 31, 2018. Award share payouts range from a threshold of
50%
to a maximum of
200%
based on the relative ranking of the Company’s TSR among a designated peer group of
16
companies. The TSR award stipulates certain limitations to the payout in the event the payout reaches a defined ceiling level or the Company’s TSR is negative. The TSR awards contain a market condition and, therefore, once the award recipients complete the requisite service period, the related compensation expense based on the grant-date fair value is not changed, regardless of whether the market condition has been satisfied. The estimated fair value of the TSR awards at the date of grant was
$2 million
. The Company estimated the fair value of the TSR awards using a Monte-Carlo simulation model utilizing several key assumptions including expected Company and peer company share price volatility, correlation coefficients between peers, the risk-free rate of return, the expected dividend yield and other award design features.
The remaining
101,842
performance share awards have a
three
-year performance period consisting of the Company’s fiscal 2016, 2017 and 2018. The performance targets are based on the Company’s cash flow return on investment (“CFROI”) over the
three
-year performance period, with award payouts ranging from a threshold of
50%
to a maximum of
200%
. The fair value of the awards granted was based on the market closing price of the underlying Class A common stock on the grant date and totaled
$2 million
.
Fiscal 2016 – 2018 (April) Performance Share Awards
In the third quarter of fiscal 2016, the Compensation Committee approved the second half of the fiscal 2016 performance-based awards with a grant date of
April 27, 2016
. The Compensation Committee granted
152,221
performance share awards consisting of
73,546
TSR awards and
78,675
CFROI awards to the Company’s key employees and officers under the Plan with terms substantially similar to the awards granted in the first quarter of fiscal 2016, as described above in this Note, except that the performance period for the TSR awards started on
April 27, 2016
, and the performance period for the CFROI awards started on March 1, 2016. The estimated fair value of each of the TSR awards and CFROI awards at the date of grant was
$2 million
.
Fiscal 2017 – 2019 (November) Performance Share Awards
In the first quarter of fiscal 2017, the Compensation Committee approved performance-based awards under the Plan with a grant date of
November 1, 2016
. The
134,899
performance share awards granted by the Compensation Committee comprise two separate and distinct awards with different vesting conditions.
The Compensation Committee granted
65,506
performance share awards based on a relative TSR metric over a performance period spanning November 1, 2016 to August 31, 2019. Award share payouts range from a threshold of
50%
to a maximum of
200%
based on the relative ranking of the Company’s TSR among a designated peer group of
16
companies. The TSR award stipulates certain limitations to the payout in the event the payout reaches a defined ceiling level or the Company’s TSR is negative. The TSR awards contain a market condition and, therefore, once the award recipients complete the requisite service period, the related compensation expense based on the grant-date fair value is not changed, regardless of whether the market condition has been satisfied. The estimated fair value of the TSR awards at the date of grant was
$2 million
. The Company estimated the fair
84
/
Schnitzer Steel Industries, Inc. Form 10-K 2018
value of the TSR awards using a Monte-Carlo simulation model utilizing several key assumptions including expected Company and peer company share price volatility, correlation coefficients between peers, the risk-free rate of return, the expected dividend yield and other award design features.
The remaining
69,393
performance share awards have a
three
-year performance period consisting of the Company’s fiscal 2017, 2018 and 2019. The performance targets are based on the Company’s CFROI over the three-year performance period, with award payouts ranging from a threshold of
50%
to a maximum of
200%
. The fair value of the awards granted was based on the market closing price of the underlying Class A common stock on the grant date and totaled
$2 million
.
Fiscal 2017 – 2019 (April) Performance Share Awards
In the third quarter of fiscal 2017, the Compensation Committee approved the second half of the fiscal 2017 performance-based awards with a grant date of
April 27, 2017
. The Compensation Committee granted
167,358
performance share awards consisting of
81,262
TSR awards and
86,096
CFROI awards to the Company’s key employees and officers under the Plan with terms substantially similar to the awards granted in the first quarter of fiscal 2017, as described above in this Note, except that the performance period for the TSR awards started on April 27, 2017, and the performance period for the CFROI awards started on March 1, 2017. The estimated fair value of each of the TSR awards and CFROI awards at the date of grant was
$2 million
.
Fiscal 2018 – 2020 Performance Share Awards
In the first quarter of fiscal 2018, the Compensation Committee approved performance-based awards under the Plan with a grant date of November 14, 2017. The
246,161
performance share awards granted by the Compensation Committee comprise two separate and distinct awards with different vesting conditions.
The Compensation Committee granted
119,763
performance share awards based on a relative TSR metric over a performance period spanning November 14, 2017 to August 31, 2020. Award share payouts range from a threshold of
50%
to a maximum of
200%
based on the relative ranking of the Company’s TSR among a designated peer group of
16
companies. The TSR award stipulates certain limitations to the payout in the event the payout reaches a defined ceiling level or the Company’s TSR is negative. The TSR awards contain a market condition and, therefore, once the award recipients complete the requisite service period, the related compensation expense based on the grant-date fair value is not changed, regardless of whether the market condition has been satisfied. The estimated fair value of the TSR awards at the date of grant was
$3 million
. The Company estimated the fair value of the TSR awards using a Monte-Carlo simulation model utilizing several key assumptions including expected Company and peer company share price volatility, correlation coefficients between peers, the risk-free rate of return, the expected dividend yield and other award design features.
The remaining
126,398
performance share awards have a
three
-year performance period consisting of the Company’s 2018, 2019 and 2020 fiscal years. The performance targets are based on the Company’s return on capital employed over the
three
-year performance period, with award payouts ranging from a threshold of
50%
to a maximum of
200%
. The fair value of the awards granted was based on the market closing price of the underlying Class A common stock on the grant date and totaled
$3 million
.
85
/
Schnitzer Steel Industries, Inc. Form 10-K 2018
A summary of the Company’s performance-based awards activity is as follows:
|
Number of
Shares
(in thousands)
|
Weighted
Average Grant
Date Fair Value
|
Fair Value
(1)
|
||||||||
|
Outstanding as of August 31, 2015
|
635
|
|
$
|
26.92
|
|
|||||
|
Granted
|
364
|
|
$
|
19.19
|
|
|||||
|
Vested
|
(194
|
)
|
$
|
28.82
|
|
$
|
16.86
|
|
||
|
Forfeited
|
(210
|
)
|
$
|
28.48
|
|
|||||
|
Outstanding as of August 31, 2016
|
595
|
|
$
|
21.02
|
|
|||||
|
Granted
|
302
|
|
$
|
21.52
|
|
|||||
|
Vested
|
(163
|
)
|
$
|
24.02
|
|
$
|
24.15
|
|
||
|
Forfeited
|
(83
|
)
|
$
|
24.02
|
|
|||||
|
Outstanding as of August 31, 2017
|
651
|
|
$
|
20.12
|
|
|||||
|
Granted
|
246
|
|
$
|
27.32
|
|
|||||
|
Vested
|
—
|
|
$
|
—
|
|
$
|
—
|
|
||
|
Forfeited
|
(17
|
)
|
$
|
22.14
|
|
|||||
|
Outstanding as of August 31, 2018
|
880
|
|
$
|
22.09
|
|
|||||
_____________________________
|
(1)
|
Amounts represent the weighted average value of the Company’s Class A common stock on the date that the performance share awards vested.
|
Compensation expense associated with performance share awards not containing a market condition was calculated using management’s current estimate of the expected level of achievement of the performance targets under each award. Compensation expense for awards based on the Company’s financial performance was
$11 million
,
$3 million
and
$4 million
for the years ended
August 31, 2018, 2017 and 2016
, respectively. As of
August 31, 2018
, total unrecognized compensation costs related to unvested performance share awards amounted to
$10 million
, which is expected to be recognized over a weighted average period of
1.1
years.
Deferred Stock Units
The Deferred Compensation Plan for Non-Employee Directors (“DSU Plan”) provides for the issuance of DSUs to non-employee directors to be granted under the Plan. Each DSU gives the director the right to receive
one
share of Class A common stock at a future date. Immediately following the annual meeting of shareholders, each non-employee director will receive DSUs which will become fully vested on the day before the next annual meeting, subject to continued service on the Board. The compensation expense associated with the DSUs granted is recognized over the respective requisite service period of the awards.
The Company will issue Class A common stock to a director pursuant to vested DSUs in a lump sum in January of the first year after the director ceases to be a director of the Company, subject to the right of the director to elect an installment payment program under the DSU Plan.
DSUs granted during the years ended
August 31, 2018, 2017 and 2016
totaled
21,806
shares,
42,771
shares and
57,780
shares, respectively. The compensation expense associated with DSUs and the total value of shares vested during each of the years ended
August 31, 2018, 2017 and 2016
, as well as the unrecognized compensation expense as of
August 31, 2018
, were not material.
Stock Options
No
options were granted in fiscal
2018
,
2017
, and
2016
, and all of the options outstanding during the periods presented had expired as of August 31, 2017. Compensation expense associated with stock options, the total proceeds received from option exercises and the tax benefits realized from options exercised was
zero
for the years ended
August 31, 2018, 2017 and 2016
.
86
/
Schnitzer Steel Industries, Inc. Form 10-K 2018
A summary of the Company’s stock option activity and related information for fiscal years with outstanding stock options is as follows:
|
Options
(in thousands)
|
Weighted
Average
Exercise
Price
|
Weighted
Average
Remaining
Contractual
Term (in years)
|
Aggregate
Intrinsic Value
(in thousands)
(1)
|
||||||||||
|
Outstanding as of August 31, 2015
|
404
|
|
$
|
34.46
|
|
1.3
|
|
$
|
—
|
|
|||
|
Granted
|
—
|
|
$
|
—
|
|
||||||||
|
Exercised
|
—
|
|
$
|
—
|
|
||||||||
|
Canceled
|
(182
|
)
|
$
|
34.11
|
|
||||||||
|
Outstanding as of August 31, 2016
|
222
|
|
$
|
34.75
|
|
1.0
|
|
$
|
—
|
|
|||
|
Granted
|
—
|
|
$
|
—
|
|
||||||||
|
Exercised
|
—
|
|
$
|
—
|
|
||||||||
|
Canceled
|
(222
|
)
|
$
|
34.75
|
|
||||||||
|
Outstanding as of August 31, 2017
|
—
|
|
$
|
—
|
|
—
|
|
$
|
—
|
|
|||
____________________________
|
(1)
|
Represents the difference between the exercise price and the closing price of the Company’s stock on the last trading day of the corresponding fiscal year, multiplied by the number of in-the-money options, if any.
|
87
/
Schnitzer Steel Industries, Inc. Form 10-K 2018
Note 13
– Income Taxes
Income (loss) from continuing operations before income taxes was as follows for the years ended August 31 (in thousands):
|
2018
|
2017
|
2016
|
|||||||||
|
United States
|
$
|
131,518
|
|
$
|
43,871
|
|
$
|
(4,303
|
)
|
||
|
Foreign
|
10,335
|
|
4,819
|
|
(11,202
|
)
|
|||||
|
Total
|
$
|
141,853
|
|
$
|
48,690
|
|
$
|
(15,505
|
)
|
||
Income tax expense (benefit) from continuing operations consisted of the following for the years ended August 31 (in thousands):
|
|
2018
|
2017
|
2016
|
||||||||
|
Current:
|
|||||||||||
|
Federal
|
$
|
19,511
|
|
$
|
(1,130
|
)
|
$
|
23
|
|
||
|
State
|
894
|
|
190
|
|
180
|
|
|||||
|
Foreign
|
—
|
|
(16
|
)
|
25
|
|
|||||
|
Total current tax expense (benefit)
|
20,405
|
|
(956
|
)
|
228
|
|
|||||
|
Deferred:
|
|||||||||||
|
Federal
|
(5,700
|
)
|
2,046
|
|
502
|
|
|||||
|
State
|
(1,962
|
)
|
232
|
|
54
|
|
|||||
|
Foreign
|
(30,333
|
)
|
—
|
|
(49
|
)
|
|||||
|
Total deferred tax expense (benefit)
|
(37,995
|
)
|
2,278
|
|
507
|
|
|||||
|
Total income tax expense (benefit)
|
$
|
(17,590
|
)
|
$
|
1,322
|
|
$
|
735
|
|
||
A reconciliation of the difference between the federal statutory rate and the Company’s effective tax rate for the years ended August 31 is as follows:
|
|
2018
|
2017
|
2016
|
|||||
|
Federal statutory rate
|
25.7
|
%
|
35.0
|
%
|
35.0
|
%
|
||
|
State taxes, net of credits
|
0.4
|
|
1.8
|
|
1.3
|
|
||
|
Foreign income taxed at different rates
|
(0.5
|
)
|
(1.9
|
)
|
(12.0
|
)
|
||
|
Valuation allowance on deferred tax assets
|
(35.8
|
)
|
(31.2
|
)
|
(59.0
|
)
|
||
|
Federal rate change
|
(4.9
|
)
|
—
|
|
—
|
|
||
|
Non-deductible officers’ compensation
|
1.6
|
|
2.2
|
|
(2.0
|
)
|
||
|
Noncontrolling interests
|
(0.6
|
)
|
(1.8
|
)
|
4.1
|
|
||
|
Research and development credits
|
(0.6
|
)
|
(1.5
|
)
|
2.4
|
|
||
|
Unrecognized tax benefits
|
3.4
|
|
1.3
|
|
(3.6
|
)
|
||
|
Realized foreign investment basis
|
(0.2
|
)
|
(0.9
|
)
|
29.4
|
|
||
|
Non-deductible goodwill
|
—
|
|
—
|
|
(0.9
|
)
|
||
|
Other
|
(0.9
|
)
|
(0.3
|
)
|
0.6
|
|
||
|
Effective tax rate
|
(12.4
|
)%
|
2.7
|
%
|
(4.7
|
)%
|
||
On December 22, 2017, the President of the United States signed and enacted into law comprehensive tax legislation commonly referred to as the Tax Cuts and Jobs Act (“Tax Act”), which, except for certain provisions, is effective for tax years beginning on or after January 1, 2018. The Tax Act’s primary change is a reduction in the federal statutory corporate tax rate from
35%
to
21%
, resulting in a pro rata reduction of the Company’s tax rate from
35%
to
25.7%
for fiscal 2018. Other pertinent changes in the Tax Act effective for fiscal 2018 include, but are not limited to, acceleration of deductions for qualified property placed in service after September 27, 2017. In addition, effective for the Company’s fiscal 2019 year, the Tax Act also limits the deductibility of some executive compensation and eliminates the deduction for qualified domestic production activities. Changes in the Tax Act that did not significantly impact the Company upon enactment include the implementation of a modified territorial tax system and other modifications to how foreign earnings are subject to U.S. tax.
88
/
Schnitzer Steel Industries, Inc. Form 10-K 2018
As a change in tax law is accounted for in the period of enactment, the Company recognized a discrete benefit of
$7 million
in the second quarter of fiscal 2018 due to the revaluation of U.S. net deferred tax liabilities to reflect the lower statutory rate. The Company’s effective tax rate in fiscal 2018 also reflects the Tax Act's lower federal statutory corporate tax rate.
The Company’s effective tax rate from continuing operations in fiscal 2018 was a benefit of
12.4%
, compared to an expense of
2.7%
in the prior year. The Company reported a tax benefit on pre-tax income for fiscal 2018 primarily due to the release of valuation allowances against certain deferred tax assets, resulting in recognition of discrete tax benefits totaling
$37 million
in fiscal 2018, and the impact of the Tax Act.
The Company’s effective tax rate from continuing operations in fiscal 2017 was an expense of
2.7%
, which was lower than the U.S. federal statutory rate at the time of
35%
primarily due to the Company’s full valuation allowance positions and federal income tax refund claims, partially offset by increases in deferred tax liabilities from indefinite-lived assets in all jurisdictions.
The Company’s effective tax rate from continuing operations in fiscal 2016 was an expense of
4.7%
, which was lower than the U.S. federal statutory rate at the time of
35%
. The effective tax rate was reduced for valuation allowances on deferred tax assets and the aggregate impact of foreign income taxed at different rates. Those reductions were partially offset by the realization of deductible foreign investment basis for tax purposes. The Company’s income tax expense is composed primarily of the increase in deferred tax liabilities from indefinite-lived assets plus certain state cash tax expenses. The increase in valuation allowance on deferred tax assets was recognized as a result of negative evidence at the time, including recent losses in all tax jurisdictions, outweighing the more subjective positive evidence, indicating that it was more likely than not that the associated tax benefit will not be realized.
SEC Staff Accounting Bulletin 118 with respect to the Tax Act
On December 22, 2017, the Securities and Exchange Commission issued Staff Accounting Bulletin 118 (“SAB 118”), which provides guidance on accounting for the impacts of the Tax Act. SAB 118 provides a measurement period, not to exceed one year from the Tax Act enactment date, for companies to complete the accounting under Accounting Standards Codification Topic 740,
Income Taxes
(“ASC 740”)
.
In accordance with SAB 118, a company must reflect the income tax effects of those aspects of the Tax Act for which the accounting under ASC 740 is complete. To the extent that a company’s accounting for certain income tax effects of the Tax Act is incomplete, but it is able to determine a reasonable estimate, it must record a provisional estimate in the financial statements. Provisional estimates are subject to adjustment during the measurement period until the accounting is complete. If a company cannot determine a provisional estimate to be included in the financial statements, it must continue to apply ASC 740 on the basis of the provisions of the tax laws that were in effect immediately before the enactment of the Tax Act.
The Company’s accounting for the impacts of the Tax Act is incomplete, and the recorded amounts discussed above in this Note are provisional estimates as of
August 31, 2018
. While the Company was able to reasonably estimate the impact of the reduction in the U.S. federal corporate rate on its U.S. net deferred tax liabilities, it may be affected by other analyses related to the Tax Act including, but not limited to, changes in the underlying accounts to which the respective deferred tax assets and liabilities relate and the state tax effects of adjustments made to federal temporary differences. The provisional benefit resulting from application of the Tax Act’s lower corporate tax rate to fiscal 2018 taxable income reflects reasonable estimates of the effects of the Tax Act which include, but are not limited to, the amount of capital expenditures for qualified property placed in service as of the end of fiscal 2018. The Company has not recorded any material adjustments to the provisional amounts recorded in the second quarter of fiscal 2018 related to the Tax Act.
In addition, as of August 31, 2018, the Company had not made an accounting policy election with respect to the treatment of Global Intangible Low-Taxed Income (“GILTI”). The election options are (1) recognizing deferred taxes for basis differences expected to reverse as GILTI and (2) accounting for GILTI as period costs if and when incurred. The Company is evaluating each election option.
89
/
Schnitzer Steel Industries, Inc. Form 10-K 2018
Deferred tax assets and liabilities comprise the following as of August 31 (in thousands):
|
2018
|
2017
|
||||||
|
Deferred tax assets:
|
|||||||
|
Environmental liabilities
|
$
|
7,853
|
|
$
|
11,187
|
|
|
|
Employee benefit accruals
|
10,677
|
|
13,692
|
|
|||
|
State income tax and other
|
6,320
|
|
7,608
|
|
|||
|
Net operating loss carryforwards
|
7,206
|
|
9,243
|
|
|||
|
State credit carryforwards
|
8,243
|
|
6,678
|
|
|||
|
Inventory valuation methods
|
944
|
|
690
|
|
|||
|
Amortizable goodwill and other intangibles
|
27,433
|
|
38,767
|
|
|||
|
Valuation allowances
|
(16,484
|
)
|
(67,348
|
)
|
|||
|
Total deferred tax assets
|
$
|
52,192
|
|
$
|
20,517
|
|
|
|
Deferred tax liabilities:
|
|||||||
|
Accelerated depreciation and other basis differences
|
$
|
31,622
|
|
$
|
37,096
|
|
|
|
Prepaid expense acceleration
|
1,979
|
|
2,568
|
|
|||
|
Total deferred tax liabilities
|
33,601
|
|
39,664
|
|
|||
|
Net deferred tax asset (liability)
|
$
|
18,591
|
|
$
|
(19,147
|
)
|
|
As of
August 31, 2018
, foreign operating loss carryforwards were
$22 million
, which expire if not used between
2024
and
2033
. State credit carryforwards will expire if not used between
2019
and
2027
.
Valuation Allowances
The Company assesses the realizability of its deferred tax assets on a quarterly basis through an analysis of potential sources of future taxable income, including prior year taxable income available to absorb a carryback of tax losses, reversals of existing taxable temporary differences, tax planning strategies, and forecasts of taxable income. The Company considers all negative and positive evidence, including the weight of the evidence, to determine if valuation allowances against deferred tax assets are required. In fiscal 2018, the Company released valuation allowances against certain U.S., Canadian and state deferred tax assets resulting in discrete tax benefits totaling
$37 million
. The release of these valuation allowances was the result of sufficient positive evidence, including cumulative income in the Company’s U.S. and Canadian tax jurisdictions in recent years and projections of future taxable income based primarily on the Company's improved financial performance, that it is more-likely-than-not that the deferred tax assets will be realized. The Company continues to maintain valuation allowances against certain U.S., Canadian and state and all Puerto Rican deferred tax assets. Canadian deferred tax assets against which the Company continues to maintain a valuation allowance relate to indefinite-lived assets.
Accounting for Uncertainty in Income Taxes
The following table summarizes the activity related to the Company’s reserve for unrecognized tax benefits, excluding interest and penalties, for the years ended August 31 (in thousands):
|
2018
|
2017
|
2016
|
|||||||||
|
Unrecognized tax benefits, as of the beginning of the year
|
$
|
5,548
|
|
$
|
4,724
|
|
$
|
3,970
|
|
||
|
Additions (reductions) for tax positions of prior years
|
171
|
|
(120
|
)
|
(56
|
)
|
|||||
|
Additions for tax positions of the current year
|
596
|
|
944
|
|
810
|
|
|||||
|
Reduction attributable to federal tax reform
|
(1,261
|
)
|
—
|
|
—
|
|
|||||
|
Unrecognized tax benefits, as of the end of the year
|
$
|
5,054
|
|
$
|
5,548
|
|
$
|
4,724
|
|
||
The Company does not anticipate any material changes to the reserve in the next 12 months. The recognized amounts of tax-related penalties and interest were not material for all periods presented.
The Company files federal and state income tax returns in the U.S. and foreign tax returns in Puerto Rico and Canada. For U.S. federal income tax returns, fiscal years 2014 to 2017 remain subject to examination under the statute of limitations.
90
/
Schnitzer Steel Industries, Inc. Form 10-K 2018
Note 14
– Net Income (Loss) Per Share
The following table sets forth the information used to compute basic and diluted net income (loss) per share attributable to SSI for the years ended August 31 (in thousands):
|
2018
|
2017
|
2016
|
|||||||||
|
Income (loss) from continuing operations
|
$
|
159,443
|
|
$
|
47,368
|
|
$
|
(16,240
|
)
|
||
|
Net income attributable to noncontrolling interests
|
(3,338
|
)
|
(2,467
|
)
|
(1,821
|
)
|
|||||
|
Income (loss) from continuing operations attributable to SSI
|
156,105
|
|
44,901
|
|
(18,061
|
)
|
|||||
|
Income (loss) from discontinued operations, net of tax
|
346
|
|
(390
|
)
|
(1,348
|
)
|
|||||
|
Net income (loss) attributable to SSI
|
$
|
156,451
|
|
$
|
44,511
|
|
$
|
(19,409
|
)
|
||
|
Computation of shares:
|
|||||||||||
|
Weighted average common shares outstanding, basic
|
27,645
|
|
27,537
|
|
27,229
|
|
|||||
|
Incremental common shares attributable to dilutive performance share, RSU and DSU awards
|
944
|
|
604
|
|
—
|
|
|||||
|
Weighted average common shares outstanding, diluted
|
28,589
|
|
28,141
|
|
27,229
|
|
|||||
Common stock equivalent shares of
62,019
,
251,899
and
1,016,745
were considered antidilutive and were excluded from the calculation of diluted net income (loss) per share attributable to SSI for the years ended
August 31, 2018, 2017 and 2016
, respectively.
Note 15
– Related Party Transactions
The Company purchases recycled metal from its joint venture operations at prices that approximate fair market value. These purchases totaled
$16 million
,
$14 million
and
$12 million
for the years ended
August 31, 2018, 2017 and 2016
, respectively.
Note 16
– Segment Information
The accounting standards for reporting information about operating segments define an operating segment as a component of an enterprise that engages in business activities from which it may earn revenues and incur expenses for which discrete financial information is available that is evaluated regularly by the chief operating decision maker in deciding how to allocate resources and in assessing performance.
Prior to the fourth quarter of fiscal 2017, the Company’s internal organizational and reporting structure included
two
operating and reportable segments: AMR and the Steel Manufacturing Business (“SMB”). In the fourth quarter of fiscal 2017, in accordance with its plan announced in June 2017, the Company modified its internal organizational and reporting structure to combine its steel manufacturing operations, which had been reported as the SMB segment, with its Oregon metals recycling operations, which had been reported within the AMR segment, forming the CSS division. This resulted in a realignment of how the Chief Executive Officer, who is considered the Company’s chief operating decision maker, reviews performance and makes decisions on resource allocation. The Company began reporting under this new segment structure in the fourth quarter of fiscal 2017 as reflected in its Annual Report on Form 10-K for the year ended August 31, 2017. The segment data for the comparable periods presented prior to the segment change have been recast to conform to the current period presentation for all activities of the reorganized segments. Recasting this historical information did not have an impact on the Company’s consolidated financial performance for any of the periods presented.
AMR acquires and recycles ferrous and nonferrous scrap metal for sale to foreign and domestic metal producers, processors and brokers, and procures salvaged vehicles and sells serviceable used auto parts from these vehicles through a network of self-service auto parts stores. These auto parts stores also supply the Company’s shredding facilities with autobodies that are processed into saleable recycled scrap metal.
CSS operates a steel mini-mill that produces a range of finished steel long products using ferrous recycled scrap metal and other raw materials. CSS’s steel mill obtains substantially all of its scrap metal raw material requirements from its integrated metals recycling and joint venture operations. CSS’s metals recycling operations also sell recycled metal to external customers primarily in export markets.
The Company holds noncontrolling ownership interests in joint ventures, which are either in the metals recycling business or are suppliers of unprocessed metal. The Company’s allocable portion of the results of these joint ventures is reported within the
91
/
Schnitzer Steel Industries, Inc. Form 10-K 2018
segment results. The joint ventures sell recycled scrap metal to AMR and to CSS at prices that approximate local market rates, which produces intercompany profit. This intercompany profit is eliminated while the products remain in inventory and is not recognized until the finished products are sold to third parties. As of
August 31, 2018
, the Company had
two
50%
-owned joint venture interests,
one
presented as part of AMR operations, and
one
presented as part of CSS operations. During fiscal 2018,
two
of the Company’s
50%
joint venture interests presented as part of AMR operations dissolved. During fiscal 2017, the Company sold
one
of its
50%
joint venture interests presented as part of CSS operations.
Intersegment sales from AMR to CSS are made at prices that approximate local market rates. These intercompany sales tend to produce intercompany profit which is not recognized until the finished products are ultimately sold to third parties.
The information provided below is obtained from internal information that is provided to the Company’s chief operating decision maker for the purpose of corporate management. The Company uses segment operating income to measure segment performance. The Company does not allocate corporate interest income and expense, income taxes and other income to its reportable segments. Certain expenses related to shared services that support operational activities and transactions are allocated from Corporate to the segments. Unallocated Corporate expense consists primarily of expense for management and certain administrative services that benefit both reportable segments. In addition, the Company does not allocate certain items to segment operating income because management does not include the information in its measurement of the performance of the operating segments. Such unallocated items include restructuring charges and other exit-related activities, charges related to legacy environmental liabilities, and provisions for certain legal matters. Because of the unallocated income and expense, the operating income of each reportable segment does not reflect the operating income the reportable segment would report as a stand-alone business. The results of discontinued operations are excluded from segment operating income and are presented separately, net of tax, from the results of ongoing operations for all periods presented.
In the fourth quarter of fiscal 2018, the Company modified its measurement of segment operating income to classify all legacy environmental charges within Corporate in order to align the measures with how the Chief Executive Officer, who is considered the Company’s chief operating decision maker, reviews performance and makes decisions on resource allocation. The change has been applied prospectively beginning in the fourth quarter of fiscal 2018, and such legacy environmental charges incurred during the quarter are reported within the Corporate division. In the fourth quarter of fiscal 2018, the Company recorded
$1 million
of legacy environmental charges to the Corporate division that, prior to the change, would have been classified within AMR. Legacy environmental charges reflected in AMR’s operating results prior to the change are not material to the Consolidated Financial Statements either individually or in the aggregate. Environmental charges are reported within selling, general and administrative expense in the Consolidated Statements of Operations.
The following is a summary of the Company’s total assets as of August 31 (in thousands):
|
2018
|
2017
|
||||||
|
Total assets:
|
|||||||
|
Auto and Metals Recycling
(1)
|
$
|
1,485,626
|
|
$
|
1,298,757
|
|
|
|
Cascade Steel and Scrap
|
740,967
|
|
696,269
|
|
|||
|
Total segment assets
|
2,226,593
|
|
1,995,026
|
|
|||
|
Corporate and eliminations
(2)
|
(1,121,776
|
)
|
(1,061,271
|
)
|
|||
|
Total assets
|
$
|
1,104,817
|
|
$
|
933,755
|
|
|
|
Property, plant and equipment, net
(3)
|
$
|
415,711
|
|
$
|
390,629
|
|
|
_____________________________
|
(1)
|
AMR total assets include
$4 million
and
$5 million
as of
August 31, 2018 and 2017
, respectively, for investments in joint ventures. CSS total assets include
$8 million
and
$7 million
as of
August 31, 2018 and 2017
, respectively, for investment in joint ventures.
|
|
(2)
|
The substantial majority of Corporate and eliminations total assets consist of Corporate intercompany payables to the Company’s operating segments and intercompany eliminations.
|
|
(3)
|
Property, plant and equipment, net includes
$15 million
and
$17 million
as of
August 31, 2018 and 2017
, respectively, at the Company’s Canadian locations.
|
92
/
Schnitzer Steel Industries, Inc. Form 10-K 2018
The table below illustrates the Company’s results from continuing operations by reportable segment for the years ended August 31 (in thousands):
|
2018
|
2017
|
2016
|
|||||||||
|
AMR:
|
|||||||||||
|
Revenues
|
$
|
1,908,966
|
|
$
|
1,363,618
|
|
$
|
1,060,592
|
|
||
|
Less: Intersegment revenues
|
(24,892
|
)
|
(15,647
|
)
|
(12,081
|
)
|
|||||
|
AMR external customer revenues
|
1,884,074
|
|
1,347,971
|
|
1,048,511
|
|
|||||
|
CSS:
|
|||||||||||
|
Revenues
|
480,641
|
|
339,620
|
|
304,032
|
|
|||||
|
Total revenues
|
$
|
2,364,715
|
|
$
|
1,687,591
|
|
$
|
1,352,543
|
|
||
|
Depreciation and amortization:
|
|||||||||||
|
AMR
|
$
|
35,564
|
|
$
|
34,853
|
|
$
|
39,033
|
|
||
|
CSS
|
11,724
|
|
12,525
|
|
13,052
|
|
|||||
|
Segment depreciation and amortization
|
47,288
|
|
47,378
|
|
52,085
|
|
|||||
|
Corporate
|
2,384
|
|
2,462
|
|
2,545
|
|
|||||
|
Total depreciation and amortization
|
$
|
49,672
|
|
$
|
49,840
|
|
$
|
54,630
|
|
||
|
Capital expenditures:
|
|||||||||||
|
AMR
|
$
|
67,099
|
|
$
|
34,575
|
|
$
|
26,623
|
|
||
|
CSS
|
9,600
|
|
10,224
|
|
7,044
|
|
|||||
|
Segment capital expenditures
|
76,699
|
|
44,799
|
|
33,667
|
|
|||||
|
Corporate
|
927
|
|
141
|
|
904
|
|
|||||
|
Total capital expenditures
|
$
|
77,626
|
|
$
|
44,940
|
|
$
|
34,571
|
|
||
|
Reconciliation of the Company’s segment operating income to income (loss) from continuing operations before income taxes:
|
|||||||||||
|
AMR
(1)
|
$
|
169,120
|
|
$
|
91,405
|
|
$
|
23,168
|
|
||
|
CSS
(2)
|
38,286
|
|
5,275
|
|
4,696
|
|
|||||
|
Segment operating income
|
207,406
|
|
96,680
|
|
27,864
|
|
|||||
|
Restructuring charges and other exit-related activities
|
661
|
|
109
|
|
(6,781
|
)
|
|||||
|
Corporate and eliminations
|
(59,079
|
)
|
(40,776
|
)
|
(28,925
|
)
|
|||||
|
Operating income (loss)
|
148,988
|
|
56,013
|
|
(7,842
|
)
|
|||||
|
Interest expense
|
(8,983
|
)
|
(8,081
|
)
|
(8,889
|
)
|
|||||
|
Other income, net
|
1,848
|
|
758
|
|
1,226
|
|
|||||
|
Income (loss) from continuing operations before income taxes
|
$
|
141,853
|
|
$
|
48,690
|
|
$
|
(15,505
|
)
|
||
_____________________________
|
(1)
|
AMR operating income includes less than
$(1) million
,
$2 million
and less than
$1 million
in income (loss) from joint ventures accounted for by the equity method in fiscal
2018
,
2017
and
2016
, respectively. AMR operating income includes a goodwill impairment charge of
$9 million
in fiscal 2016, and other asset impairment charges (recoveries), net of
$(1) million
, less than
$(1) million
, and
$16 million
in fiscal
2018
,
2017
and
2016
, respectively.
|
|
(2)
|
CSS operating income includes
$2 million
,
$1 million
and less than
$1 million
in income from joint ventures accounted for by the equity method in fiscal
2018
,
2017
and
2016
, respectively. CSS operating income includes asset impairment charges (recoveries), net of less than
$(1) million
,
$(1) million
and
$4 million
in fiscal
2018
,
2017
and
2016
, respectively.
|
93
/
Schnitzer Steel Industries, Inc. Form 10-K 2018
The following revenues from external customers are presented based on the sales destination and by major product for the years ended August 31 (in thousands):
|
2018
|
2017
|
2016
|
|||||||||
|
Revenues based on sales destination:
|
|||||||||||
|
Foreign
|
$
|
1,354,460
|
|
$
|
894,265
|
|
$
|
683,569
|
|
||
|
Domestic
|
1,010,255
|
|
793,326
|
|
668,974
|
|
|||||
|
Total revenues from external customers
|
$
|
2,364,715
|
|
$
|
1,687,591
|
|
$
|
1,352,543
|
|
||
|
Major product information:
|
|||||||||||
|
Ferrous scrap metal
|
$
|
1,328,447
|
|
$
|
855,161
|
|
$
|
619,060
|
|
||
|
Nonferrous scrap metal
|
529,466
|
|
425,989
|
|
340,025
|
|
|||||
|
Retail and other
|
142,953
|
|
126,235
|
|
123,553
|
|
|||||
|
Finished steel products
|
363,849
|
|
280,206
|
|
269,355
|
|
|||||
|
Semi-finished steel products
|
—
|
|
—
|
|
550
|
|
|||||
|
Total revenues from external customers
|
$
|
2,364,715
|
|
$
|
1,687,591
|
|
$
|
1,352,543
|
|
||
In fiscal
2018, 2017 and 2016
, there were
no
external customers that accounted for more than
10%
of the Company’s consolidated revenues. Sales to customers in foreign countries are a significant part of the Company’s business. The schedule below identifies those foreign countries to which the Company’s sales exceeded
10%
of consolidated revenues in any of the last three years ended August 31 (in thousands):
|
2018
|
% of
Revenue
|
2017
|
% of
Revenue
|
2016
|
% of
Revenue
|
|||||||||||||||
|
Turkey
(1)
|
$
|
262,835
|
|
11
|
%
|
N/A
|
|
N/A
|
|
$
|
163,696
|
|
12
|
%
|
||||||
|
China
|
$
|
255,097
|
|
11
|
%
|
$
|
216,231
|
|
13
|
%
|
$
|
150,570
|
|
11
|
%
|
|||||
_____________________________
|
(1)
|
N/A = Sales were less than the 10% threshold.
|
94
/
Schnitzer Steel Industries, Inc. Form 10-K 2018
Quarterly Financial Data (Unaudited)
In the opinion of management, this unaudited quarterly financial summary includes all adjustments necessary for a fair statement of the results for the periods represented (in thousands, except per share amounts):
|
|
Fiscal 2018
|
||||||||||||||
|
|
First
|
Second
|
Third
|
Fourth
|
|||||||||||
|
Revenues
|
$
|
483,279
|
|
$
|
559,443
|
|
$
|
652,416
|
|
$
|
669,577
|
|
|||
|
Cost of goods sold
|
$
|
406,251
|
|
$
|
472,462
|
|
$
|
549,164
|
|
$
|
582,608
|
|
|||
|
Operating income
|
$
|
26,423
|
|
$
|
33,358
|
|
$
|
51,234
|
|
$
|
37,973
|
|
|||
|
Income (loss) from discontinued operations, net of tax
|
$
|
(35
|
)
|
$
|
164
|
|
$
|
(56
|
)
|
$
|
273
|
|
|||
|
Net income attributable to SSI
|
$
|
18,364
|
|
$
|
41,016
|
|
$
|
37,402
|
|
$
|
59,669
|
|
|||
|
Basic net income per share attributable to SSI
|
$
|
0.66
|
|
$
|
1.48
|
|
$
|
1.35
|
|
$
|
2.18
|
|
|||
|
Diluted net income per share attributable to SSI
|
$
|
0.64
|
|
$
|
1.42
|
|
$
|
1.31
|
|
$
|
2.09
|
|
|||
|
|
Fiscal 2017
|
||||||||||||||
|
|
First
|
Second
|
Third
|
Fourth
|
|||||||||||
|
Revenues
|
$
|
334,161
|
|
$
|
382,084
|
|
$
|
477,088
|
|
$
|
494,258
|
|
|||
|
Cost of goods sold
|
$
|
295,892
|
|
$
|
326,804
|
|
$
|
411,109
|
|
$
|
430,703
|
|
|||
|
Operating income
|
$
|
587
|
|
$
|
14,171
|
|
$
|
19,147
|
|
$
|
22,108
|
|
|||
|
Loss from discontinued operations, net of tax
|
$
|
(53
|
)
|
$
|
(95
|
)
|
$
|
(127
|
)
|
$
|
(114
|
)
|
|||
|
Net income (loss) attributable to SSI
|
$
|
(1,326
|
)
|
$
|
11,037
|
|
$
|
16,565
|
|
$
|
18,235
|
|
|||
|
Basic net income (loss) per share attributable to SSI
|
$
|
(0.05
|
)
|
$
|
0.40
|
|
$
|
0.60
|
|
$
|
0.66
|
|
|||
|
Diluted net income (loss) per share attributable to SSI
|
$
|
(0.05
|
)
|
$
|
0.40
|
|
$
|
0.60
|
|
$
|
0.64
|
|
|||
___________________________
The sum of quarterly amounts may not agree to the full-year equivalent due to rounding.
In the second quarter of fiscal 2018, results included an income tax benefit of
$7 million
related to the impacts of U.S. federal tax legislation enacted during the quarter, and a discrete income tax benefit of
$7 million
, related to the release of valuation allowances against certain U.S. and state deferred tax assets. In the fourth quarter of fiscal 2018, results included a discrete income tax benefit of
$30 million
related to the release of valuation allowances against certain deferred tax assets.
95
/
Schnitzer Steel Industries, Inc. Form 10-K 2018
Schedule II – Valuation and Qualifying Accounts
For the Years Ended August 31,
2018
,
2017
and
2016
(In thousands)
|
Column A
|
Column B
|
Column C
|
Column D
|
Column E
|
||||||||||||
|
Description
|
Balance at
Beginning
of Period
|
Charges to Cost
and Expenses
|
Deductions
|
Balance at
End of
Period
|
||||||||||||
|
Fiscal 2018
|
||||||||||||||||
|
Allowance for doubtful accounts
|
$
|
2,280
|
|
$
|
323
|
|
$
|
(17
|
)
|
$
|
2,586
|
|
||||
|
Deferred tax valuation allowance
|
$
|
67,348
|
|
$
|
—
|
|
$
|
(50,864
|
)
|
$
|
16,484
|
|
||||
|
Fiscal 2017
|
||||||||||||||||
|
Allowance for doubtful accounts
|
$
|
2,315
|
|
$
|
126
|
|
$
|
(161
|
)
|
$
|
2,280
|
|
||||
|
Deferred tax valuation allowance
|
$
|
83,891
|
|
$
|
690
|
|
$
|
(17,233
|
)
|
$
|
67,348
|
|
||||
|
Fiscal 2016
|
||||||||||||||||
|
Allowance for doubtful accounts
|
$
|
2,496
|
|
$
|
131
|
|
$
|
(312
|
)
|
$
|
2,315
|
|
||||
|
Deferred tax valuation allowance
|
$
|
75,278
|
|
$
|
8,613
|
|
$
|
—
|
|
$
|
83,891
|
|
||||
96
/
Schnitzer Steel Industries, Inc. Form 10-K 2018
None.
Disclosure Controls and Procedures
The Company maintains disclosure controls and procedures (as defined in Rules 13a-15(e) and 15d-15(e) of the Securities and Exchange Act of 1934, as amended (the “Exchange Act”)) that are designed to ensure that information required to be disclosed by the Company in the reports that it files or submits under the Exchange Act is recorded, processed, summarized and reported within the time periods specified by the Securities and Exchange Commission’s rules and forms and that such information is accumulated and communicated to management, including the Chief Executive Officer and Chief Financial Officer, as appropriate, to allow timely decisions regarding required disclosures. Any controls and procedures, no matter how well designed and operated, can only provide reasonable assurance of achieving the desired control objectives. The Company’s management, with the participation of the Chief Executive Officer and Chief Financial Officer, has completed an evaluation of the effectiveness of the design and operation of the Company’s disclosure controls and procedures as of
August 31, 2018
. Based on this evaluation, the Company’s Chief Executive Officer and Chief Financial Officer have concluded that, as of
August 31, 2018
, the Company’s disclosure controls and procedures were effective at the reasonable assurance level.
Management’s Annual Report on Internal Control Over Financial Reporting
Management’s Annual Report on Internal Control Over Financial Reporting is presented within Part II, Item 8 of this report and is incorporated herein by reference.
Changes in Internal Control Over Financial Reporting
There was no change in the Company’s internal control over financial reporting (as that term is defined in Rules 13a-15(f) and 15d-15(f) under the Exchange Act) during its most recent fiscal quarter that has materially affected, or is reasonably likely to materially affect, the Company’s internal control over financial reporting.
None.
97
/
Schnitzer Steel Industries, Inc. Form 10-K 2018
Information required by Item 401 of Regulation S-K regarding directors, and information required by Items 405, 407(c)(3), 407(d)(4) and 407(d)(5) of Regulation S-K, will be included under “Election of Directors,” “Corporate Governance” and “Section 16(a) Beneficial Ownership Reporting Compliance” in the Company’s Proxy Statement for its
2019
Annual Meeting of Shareholders and is incorporated herein by reference.
Executive Officers of the Registrant
|
Name
|
Age
|
Office
|
||
|
Tamara L. Lundgren
|
61
|
President and Chief Executive Officer
|
||
|
Richard D. Peach
|
55
|
Senior Vice President, Chief Financial Officer and Chief of Corporate Operations
|
||
|
Michael Henderson
|
59
|
Senior Vice President, Co-President, Auto and Metals Recycling, and Co-President, Cascade Steel and Scrap
|
||
|
Steven Heiskell
|
49
|
Senior Vice President and Co-President, Auto and Metals Recycling
|
||
|
Jeffrey Dyck
|
55
|
Senior Vice President and Co-President, Cascade Steel and Scrap
|
||
|
Peter Saba
|
57
|
Senior Vice President, General Counsel and Corporate Secretary
|
||
|
Stefano Gaggini
|
47
|
Vice President, Deputy Chief Financial Officer and Chief Accounting Officer
|
||
Tamara L. Lundgren
has been our President and Chief Executive Officer since December 2008. She joined the Company in September 2005 as Vice President and Chief Strategy Officer and held roles of increasing responsibility, including Executive Vice President and Chief Operating Officer. Prior to joining us, Ms. Lundgren was an investment banker and lawyer with 25 years of experience in the U.S. and Europe. She was a Managing Director in the Investment Banking Division of JPMorgan Chase, which she joined in 2001, and Deutsche Bank, which she joined in 1996. Earlier she was a partner in the Washington, DC law firm of Hogan Lovells (then Hogan & Hartson, LLP). Ms. Lundgren earned a B.A. degree from Wellesley College and a J.D. degree from the Northwestern University School of Law.
Richard D. Peach
joined us in March 2007 and was appointed Chief Financial Officer in December 2007. In September 2016, in addition to his responsibilities as Chief Financial Officer, Mr. Peach assumed the role of Chief of Corporate Operations. Prior to joining us, Mr. Peach was the Chief Financial Officer and Senior Vice President with the Western U.S. energy utility, PacifiCorp, from 2003 to 2006. From 1995 to 2002, he served in senior management positions with ScottishPower, the international energy company, including Group Controller, Managing Director of United Kingdom Customer Services and Director of Energy Supply Finance. Prior to joining ScottishPower, Mr. Peach was a senior manager with Coopers & Lybrand. Mr. Peach is a member of the Institute of Chartered Accountants of Scotland.
Michael Henderson
joined us in April 2012 and served as Chief Operating Officer and President of the Metals Recycling Business, prior to his promotion to Co-President of the Auto and Metals Recycling business in April 2015, and then Co-President of the Cascade Steel and Scrap business in June 2017. Prior to joining Schnitzer, he was Eastern Region President for Sims Metal Management where he was responsible for 26 facilities, including four shredders and five port locations. He began his career with Naparano Iron & Metal and has more than 30 years in the scrap industry, including expertise in both the ferrous and nonferrous sides of the business.
Steven Heiskell
joined us in August 2004 and served in a variety of capacities within our Auto Parts Business, including as Vice President Corporate Development, Chief Development Officer, General Manager and Vice President and Managing Director, prior to his promotion to Co-President of the Auto and Metals Recycling business in April 2015. Prior to joining us, Steven served in a variety of executive positions at Simpata, Inc., a venture capital backed internet startup in San Francisco, Enron, and BP/Amoco Oil.
Jeffrey Dyck
joined the Steel Manufacturing Business in February 1994 and served in a variety of positions, including Manager of the Rolling Mills and Director of Operations of the Steel Manufacturing Business, before his promotion to President of SMB in June 2005, and then Co-President of the Cascade Steel and Scrap business in June 2017.
98
/
Schnitzer Steel Industries, Inc. Form 10-K 2018
Peter Saba
joined us in July 2015 as Senior Vice President, General Counsel and Corporate Secretary. He is a member of the New York State, District of Columbia and U.S. Supreme Court Bar, not admitted in Oregon State. Prior to joining us, Peter was the Senior Vice President, General Counsel, Chief Compliance Officer and Corporate Secretary for Centrus Energy Corp. (formerly, USEC, Inc.), a global energy company that enriches uranium for nuclear fuel, which he joined in 2008. USEC, Inc. filed a voluntary petition for relief under Chapter 11 of the United States Bankruptcy Code in March 2014 and emerged from Chapter 11 as Centrus Energy Corp. on September 30, 2014. Over a 30-year career, Peter has worked in leading international law firms focusing on corporate and project finance, served as Chief Operating Officer and General Counsel at the Export-Import Bank of the United States and as the Principal Deputy Assistant Secretary for Domestic and International Energy Policy at the U.S. Department of Energy, and taught international business transactions as an Adjunct Professor at Georgetown Law School.
Stefano Gaggini
joined us in July 2011 as Senior Manager of SEC Reporting and Technical Accounting and became Director of SEC Reporting and Technical Accounting in March 2012. He became Vice President, Corporate Controller and Principal Accounting Officer in December 2013, and in September 2018 he was promoted to Deputy Chief Financial Officer and Chief Accounting Officer. Prior to joining Schnitzer, Mr. Gaggini was a senior manager at KPMG LLP, where he served in various auditing roles since 1998 in the Portland, Oregon and Zurich, Switzerland offices. He is licensed as a Certified Public Accountant in the State of Oregon.
Code of Ethics
On April 26, 2018, the Board of Directors approved a revised Company’s Code of Conduct that is applicable to all of its directors and employees. This document is posted under the caption “About Schnitzer – Ethics & Code of Conduct” on the Company’s internet website (www.schnitzersteel.com) and is available free of charge by calling the Company or submitting a request to ir@schn.com. The Company intends to satisfy its disclosure obligations with respect to any amendments to or waivers of the Code for directors, executive officers or Senior Financial Officers by posting such information on its internet website set forth above rather than by filing a Form 8-K.
The information required by Items 402, 407(e)(4) and 407(e)(5) of Regulation S-K will be included under “Compensation of Executive Officers,” “Compensation Discussion and Analysis,” “Director Compensation,” “Corporate Governance – Assessment of Compensation Risk” and “Compensation Committee Report” in the Company’s Proxy Statement to be filed for its
2019
Annual Meeting of Shareholders and is incorporated herein by reference.
Information with respect to security ownership of certain beneficial owners and management, as required by Item 403 of Regulation S-K, will be included under “Voting Securities and Principal Shareholders” in the Company’s Proxy Statement for its
2019
Annual Meeting of Shareholders and is incorporated herein by reference. Information with respect to securities authorized for issuance under equity compensation plans, as required by Item 201(d) of Regulation S-K, will be included under “Compensation Plan Information” in the Company’s Proxy Statement for its
2019
Annual Meeting of Shareholders and is incorporated herein by reference.
The information required by Items 404 and 407(a) of Regulation S-K will be included under “Certain Transactions” and “Corporate Governance – Director Independence” in the Company’s Proxy Statement for its
2019
Annual Meeting of Shareholders and is incorporated herein by reference.
Information regarding the Company’s principal accountant fees and services required by Item 9(e) of Schedule 14A will be included in the Company’s Proxy Statement for its
2019
Annual Meeting of Shareholders and is incorporated herein by reference.
99
/
Schnitzer Steel Industries, Inc. Form 10-K 2018
|
(a) 1
|
|
The following financial statements are filed as part of this report:
|
|
|
The Report of Independent Registered Public Accounting Firm, the Company’s Consolidated Financial Statements, the Notes thereto and the quarterly financial data (unaudited) are on pages 53 through 94 of this report.
|
|||
|
2
|
|
The following financial statement schedule is filed as part of this report:
|
|
|
Schedule II Valuation and Qualifying Accounts is on page 96 of this report.
|
|||
|
All other schedules are omitted as the information is either not applicable or is not required.
|
|||
|
3
|
|
The following exhibits are filed as part of this report:
|
|
|
3.1
|
|
||
|
3.2
|
|
||
|
10.1
|
|
Lease Agreement, dated September 1, 1988, between Schnitzer Investment Corp. and the Registrant, as amended, relating to the Portland Metals Recycling operation and which has terminated except for surviving indemnity obligations. Filed as Exhibit 10.3 to the Registrant’s Registration Statement on Form S-1 filed on September 24, 1993 (Commission File No. 33-69352), and incorporated herein by reference.
|
|
|
10.2
|
|
||
|
10.3
|
|
||
|
10.4
|
|
||
|
10.5
|
|
||
|
10.6
|
|
||
|
10.7
|
|
||
|
*10.8
|
|
||
|
*10.9
|
|
||
|
*10.10
|
|
||
100
/
Schnitzer Steel Industries, Inc. Form 10-K 2018
|
*10.11
|
||
|
*10.12
|
||
|
*10.13
|
||
|
*10.14
|
||
|
*10.15
|
||
|
*10.16
|
||
|
*10.17
|
||
|
*10.18
|
||
|
*10.19
|
||
|
*10.20
|
||
|
*10.21
|
||
|
*10.22
|
||
|
*10.23
|
||
|
*10.24
|
||
|
*10.25
|
||
|
*10.26
|
||
101
/
Schnitzer Steel Industries, Inc. Form 10-K 2018
|
*10.27
|
|
|
|
|
*10.28
|
|
||
|
*10.29
|
|
||
|
*10.30
|
|
||
|
*10.31
|
|
||
|
*10.32
|
|
||
|
*10.33
|
|
||
|
*10.34
|
|
||
|
*10.35
|
|
||
|
*10.36
|
|
||
|
21.1
|
|
||
|
23.1
|
|
||
|
24.1
|
|
||
|
31.1
|
|
||
|
31.2
|
|
||
|
32.1
|
|
||
|
32.2
|
|
||
|
101
|
|
The following financial information from Schnitzer Steel Industries, Inc.’s Annual Report on Form 10-K for the year ended August 31, 2018, formatted in XBRL (eXtensible Business Reporting Language): (i) Consolidated Statements of Operations for the years ended August 31, 2018, 2017 and 2016, (ii) Consolidated Balance Sheets as of August 31, 2018 and August 31, 2017, (iii) Consolidated Statements of Comprehensive Income (Loss) for the years ended August 31, 2018, 2017 and 2016, (iv) Consolidated Statements of Cash Flows for the years ended August 31, 2018, 2017 and 2016, and (v) the Notes to Consolidated Financial Statements.
|
|
102
/
Schnitzer Steel Industries, Inc. Form 10-K 2018
*Management contract or compensatory plan or arrangement.
The agreements and other documents filed as exhibits to this report are not intended to provide factual information or other disclosure other than with respect to the terms of the agreements or other documents themselves, and you should not rely on them for that purpose. In particular, any representations and warranties made by us in these agreements or other documents were made solely within the specific context of the relevant agreement or document as of the date they were made and may not describe the actual state of affairs for any other purpose or at any other time.
103
/
Schnitzer Steel Industries, Inc. Form 10-K 2018
None.
104
/
Schnitzer Steel Industries, Inc. Form 10-K 2018
SIGNATURES
Pursuant to the requirements of Section 13 or 15(d) of the Securities Exchange Act of 1934, the registrant has duly caused this report to be signed on its behalf by the undersigned, thereunto duly authorized.
|
SCHNITZER STEEL INDUSTRIES, INC.
|
|||
|
Dated: October 24, 2018
|
By:
|
/s/ RICHARD D. PEACH
|
|
|
Richard D. Peach
|
|||
|
Senior Vice President, Chief Financial Officer and Chief of Corporate Operations
|
|||
Pursuant to the requirements of the Securities Exchange Act of 1934, this report has been signed below by the following persons on behalf of the registrant on
October 24, 2018
in the capacities indicated.
|
Signature
|
Title
|
|
|
Principal Executive Officer:
|
||
|
/s/ TAMARA L. LUNDGREN
|
President and Chief Executive Officer and Director
|
|
|
Tamara L. Lundgren
|
||
|
Principal Financial Officer:
|
||
|
/s/ RICHARD D. PEACH
|
Senior Vice President, Chief Financial Officer and Chief of Corporate Operations
|
|
|
Richard D. Peach
|
||
|
Principal Accounting Officer:
|
||
|
/s/ STEFANO GAGGINI
|
Deputy Chief Financial Officer and Chief Accounting Officer
|
|
|
Stefano Gaggini
|
||
|
Directors:
|
||
|
*JOHN D. CARTER
|
Director
|
|
|
John D. Carter
|
||
|
*WAYLAND R. HICKS
|
Director
|
|
|
Wayland R. Hicks
|
||
|
*RHONDA D. HUNTER
|
Director
|
|
|
Rhonda D. Hunter
|
||
|
*DAVID L. JAHNKE
|
Director
|
|
|
David L. Jahnke
|
||
105
/
Schnitzer Steel Industries, Inc. Form 10-K 2018
|
Signature
|
Title
|
|
|
*JUDITH A. JOHANSEN
|
Director
|
|
|
Judith A. Johansen
|
||
|
*WILLIAM D. LARSSON
|
Director
|
|
|
William D. Larsson
|
||
|
*MICHAEL SUTHERLIN
|
Director
|
|
|
Michael Sutherlin
|
||
|
*By:
|
/s/ RICHARD D. PEACH
|
|||
|
Attorney-in-fact, Richard D. Peach
|
||||
106
/
Schnitzer Steel Industries, Inc. Form 10-K 2018
TABLE OF CONTENTS
Part IItem 1. BusinessItem 1A. Risk FactorsItem 1B. Unresolved Staff CommentsItem 2. PropertiesItem 3. Legal ProceedingsItem 4. Mine Safety DisclosuresPart IIItem 5. Market For Registrant S Common Equity, Related Stockholder Matters and Issuer Purchases Of Equity SecuritiesItem 6. Selected Financial DataItem 7. Management S Discussion and Analysis Of Financial Condition and Results Of OperationsItem 7A. Quantitative and Qualitative Disclosures About Market RiskItem 8. Financial Statements and Supplementary DataNote 1 Nature Of OperationsNote 2 Summary Of Significant Accounting PoliciesNote 3 Recent Accounting PronouncementsNote 4 InventoriesNote 5 Property, Plant and Equipment, NetNote 6 Goodwill and Other Intangible Assets, NetNote 7 DebtNote 8 Commitments and ContingenciesNote 9 - Restructuring Charges and Other Exit-related ActivitiesNote 10 Accumulated Other Comprehensive LossNote 11 Employee BenefitsNote 12 Share-based CompensationNote 13 Income TaxesNote 14 Net Income (loss) Per ShareNote 15 Related Party TransactionsNote 16 Segment InformationItem 9. Changes in and Disagreements with Accountants on Accounting and Financial DisclosureItem 9A. Controls and ProceduresItem 9B. Other InformationPart IIIItem 10. Directors, Executive Officers and Corporate GovernanceItem 11. Executive CompensationItem 12. Security Ownership Of Certain Beneficial Owners and Management and Related Stockholder MattersItem 13. Certain Relationships and Related Transactions, and Director IndependenceItem 14. Principal Accountant Fees and ServicesPart IVItem 15. Exhibits and Financial Statement SchedulesItem 16. Form 10-k Summary