SERVICE CORP INTERNATIONAL
10-Ks and 10-Qs
|
|
|
|
|
|
|
|
|
|
|
|
|
|
|
|
|
|
|
|
|
|
|
|
|
|
|
|
|
|
|
|
|
|
|
|
|
|
|
|
|
|
|
|
|
|
|
|
|
|
|
|
|
|
|
|
UNITED STATES SECURITIES AND EXCHANGE COMMISSION
Washington, D.C. 20549
Form 10-K
|
þ
|
|
ANNUAL REPORT PURSUANT TO SECTION 13 OR 15(d) OF THE SECURITIES EXCHANGE ACT OF 1934
For the fiscal year ended December 31, 2017
|
|
OR
|
||
|
o
|
|
TRANSITION REPORT PURSUANT TO SECTION 13 OR 15(d) OF THE SECURITIES EXCHANGE ACT OF 1934
For the transition period from to
|
Commission file number 1-6402-1
Service Corporation International
(Exact name of registrant as specified in its charter)
|
Texas
|
|
74-1488375
|
|
(State or other jurisdiction of
incorporation or organization)
|
|
(I.R.S. employer
identification no.)
|
|
1929 Allen Parkway
Houston, Texas
(Address of principal executive offices)
|
|
77019
(Zip code)
|
Registrant’s telephone number, including area code: 713-522-5141
Securities registered pursuant to Section 12(b) of the Act:
|
Title of Each Class
|
|
Name of Each Exchange on Which Registered
|
|
Common Stock ($1 par value)
|
|
New York Stock Exchange
|
Securities registered pursuant to Section 12(g) of the Act: None
Indicate by check mark if the registrant is a well-known seasoned issuer, as defined in Rule 405 of the Securities Act. Yes
þ
No
o
Indicate by check mark if the registrant is not required to file reports pursuant to Section 13 or Section 15(d) of the Act. Yes
o
No
þ
Indicate by check mark whether the registrant (1) has filed all reports required to be filed by Section 13 or 15(d) of the Securities Exchange Act of 1934 during the preceding 12 months (or for such shorter period that the registrant was required to file such reports), and (2) has been subject to such filing requirements for the past 90 days. Yes
þ
No
o
Indicate by check mark whether the registrant has submitted electronically and posted on its corporate Web site, if any, every Interactive Data File required to be submitted and posted pursuant to Rule 405 of Regulation S-T (§ 232.405 of this chapter) during the preceding 12 months (or for such shorter period that the registrant was required to submit and post such files). Yes
þ
No
o
Indicate by check mark if disclosure of delinquent filers pursuant to Item 405 of Regulation S-K is not contained herein, and will not be contained, to the best of registrant’s knowledge, in definitive proxy or information statements incorporated by reference in Part III of this Form 10-K or any amendment to this Form 10-K.
þ
Indicate by check mark whether the registrant is a large accelerated filer, an accelerated filer, a non-accelerated filer, a smaller reporting company, or an emerging growth company. See the definitions of “large accelerated filer,” “accelerated filer,” “smaller reporting company,” and "emerging growth company" in Rule 12b-2 of the Exchange Act. (Check one):
|
Large accelerated filer
þ
|
Accelerated filer
o
|
Non-accelerated filer
o
|
Smaller reporting company
o
|
Emerging growth company
o
|
|
(Do not check if smaller reporting company)
|
||||
If an emerging growth company, indicate by check mark if the registrant has elected not to use the extended transition period for complying with any new or revised financial accounting standards provided pursuant to Section 13(a) of the Exchange Act.
o
Indicate by check mark whether the registrant is a shell company (as defined in 12b-2 of the act). Yes
o
No
þ
The aggregate market value of the common stock held by non-affiliates of the registrant (assuming that the registrant’s only affiliates are its executive officers and directors) was $6,501,405,154 based upon a closing market price of $33.45 on
June 30, 2017
of a share of common stock as reported on the New York Stock Exchange.
The number of shares outstanding of the registrant’s common stock as of
February 12, 2018
was
185,008,791
(net of treasury shares).
DOCUMENTS INCORPORATED BY REFERENCE
Portions of the registrant’s Proxy Statement in connection with its 2018 Annual Meeting of Stockholders (Part III).
SERVICE CORPORATION INTERNATIONAL
INDEX
|
|
|
|
Page
|
|
|
|
|
|||
|
|
|
|||
|
|
|
|||
|
|
|
|||
|
|
|
|||
|
Mine Safety Disclosures
|
||||
|
|
|
|||
|
|
|
|||
|
|
|
|||
|
|
|
|||
|
|
|
|||
|
|
|
|||
|
|
|
|||
|
|
|
|||
|
|
|
|||
|
|
|
|||
|
|
|
|||
|
|
|
|||
|
|
|
|||
|
|
|
|||
|
|
|
|||
2
GLOSSARY
The following terms are common to the deathcare industry, are used throughout this report, and have the following meanings:
Atneed
— Funeral, including cremation, and cemetery arrangements sold once death has occurred.
Cancellation
— Termination of a preneed contract, which relieves us of the obligation to provide the goods and services included in the contract. Cancellations may be requested by the customer or be initiated by us for failure to comply with the contractual terms of payment. State or provincial laws govern the amount of refund, if any, owed to the customer.
Care Trust Corpus
— The deposits and net realized capital gains and losses included in a perpetual care trust that cannot be withdrawn. In certain states, some or all of the net realized capital gains can be distributed, so they are not included in the corpus.
Cemetery Merchandise and Services
— Stone and bronze memorials, markers, outer burial containers, floral placement, graveside services, merchandise installations, urns, and interments.
Cemetery Perpetual Care Trust or Endowment Care Fund (ECF)
— A trust fund established for the purpose of maintaining cemetery grounds and property into perpetuity. For these trusts, the corpus remains in the trust in perpetuity and the investment earnings or elected distributions are withdrawn regularly and are intended to defray our expenses incurred to maintain the cemetery. In certain states, some or all of the net realized capital gains can also be distributed. Additionally, some states allow a total return distribution that may contain elements of income, capital appreciation, and principal.
Cemetery Property
— Developed lots, lawn crypts, mausoleum spaces, niches, and cremation memorialization property items (constructed and ready to accept interments) and undeveloped land we intend to develop for the sale of interment rights. Includes the construction-in-progress balance during the pre-construction and construction phases of projects creating new developed property items.
Cemetery Property Amortization
— The non-cash recognized expenses of cemetery property interment rights, which are recorded by specific identification with the cemetery property revenue for each contract.
Cemetery Property Interment Rights
-The right to inter human remains in a specific cemetery property space. See also Cemetery Property Revenue below.
Cemetery Property Revenue
— Recognized sales of interment rights in cemetery property when a minimum of 10% of the sales price has been collected and the property has been constructed and is available for interment.
Cremation
— The reduction of human remains to bone fragments by intense heat.
Cremation Memorialization
— Products specifically designed to commemorate and honor the life of an individual that has been cremated. These products include cemetery property items that provide for the disposition of cremated remains within our cemeteries such as benches, boulders, statues, etc. They also include memorial walls and books where the name of the individual is inscribed but the remains have been scattered or kept by the family.
Funeral Merchandise and Services
— Merchandise such as burial caskets and related accessories, outer burial containers, urns and other cremation receptacles, casket and cremation memorialization products, flowers, and professional services relating to funerals including arranging and directing services, use of funeral facilities and motor vehicles, removal, preparation, embalming, cremations, memorialization, visitations, and catering.
Funeral Recognized Preneed Revenue
— Funeral merchandise and travel protection sold on a preneed contract and delivered before a death has occurred.
Funeral Services Performed
— The number of funeral services, including cremations, provided after the date of death, sometimes referred to as funeral volume.
General Agency (GA) Revenue
— Commissions we receive from third-party life insurance companies for life insurance policies sold to preneed customers for the purpose of funding preneed funeral arrangements. The commission rate paid is determined based on the product type sold, the length of payment terms, and the age of the insured/annuitant.
Interment
— The burial or final placement of human remains in the ground (interment), in mausoleums (entombment), in niches (inurnment), or in cremation memorialization property (inurnment).
Lawn Crypt
— An underground outer burial receptacle constructed of concrete and reinforced steel, which is usually pre-installed in predetermined designated areas.
Marker
— A method of identifying a deceased person in a particular burial space, crypt, niche, or cremation memorialization property. Permanent burial and cremation memorialization markers are usually made of bronze or stone.
3
Maturity
— When the underlying contracted merchandise is delivered or service is performed, typically at death. This is the point at which preneed funeral contracts are converted to atneed contracts (note — delivery of certain merchandise and services can occur prior to death).
Mausoleum
— An above ground structure that is designed to house caskets and/or cremation urns.
Merchandise and Service Trust
— A trust account established in accordance with state or provincial law into which we deposit the required percentage of customers’ payments for preneed funeral, cremation, or cemetery merchandise and services to be delivered or performed by us in the future. The amounts deposited can be withdrawn only after we have completed our obligations under the preneed contract or the cancellation of the contract. Also referred to as a preneed trust.
Outer Burial Container
— A reinforced container intended to inhibit the subsidence of the earth and house the casket after it is placed in the ground, also known as a burial vault.
Preneed
— Purchase of cemetery property interment rights or any merchandise and services prior to death occurring.
Preneed Backlog
— Future revenue from unfulfilled preneed funeral, cremation, and cemetery contractual arrangements.
Preneed Cemetery Production
— Sales of preneed or atneed cemetery contracts. These sales are recorded in
Deferred revenue
until the merchandise is delivered, the service is performed, or when a minimum of 10% of the property sales price has been collected and the property has been constructed and is available for interment.
Preneed Funeral Production
— Sales of preneed funeral trust-funded and insurance-funded contracts. Preneed funeral trust-funded contracts are recorded in
Deferred revenue
until the merchandise is delivered or the service is performed. We do not reflect the unfulfilled insurance-funded preneed funeral contract amounts in our Consolidated Balance Sheet. The proceeds of the life insurance policies will be reflected in revenue as these funerals are performed by us in the future.
Sales Average
— Average revenue per funeral service performed, excluding the impact of funeral recognized preneed revenue, GA revenue, and certain other revenue.
Travel Protection
— A product that provides shipment of remains to the servicing funeral home or cemetery of choice if the purchaser passes away outside of a certain radius of their residence, without any additional expense to the family.
Trust Fund Income
— Recognized investment earnings from our merchandise and service and perpetual care trust investments.
As used herein, “SCI”, “Company”, “we”, “our”, and “us” refer to Service Corporation International and companies owned directly or indirectly by Service Corporation International, unless the context requires otherwise.
4
|
Item 1.
|
Business.
|
General
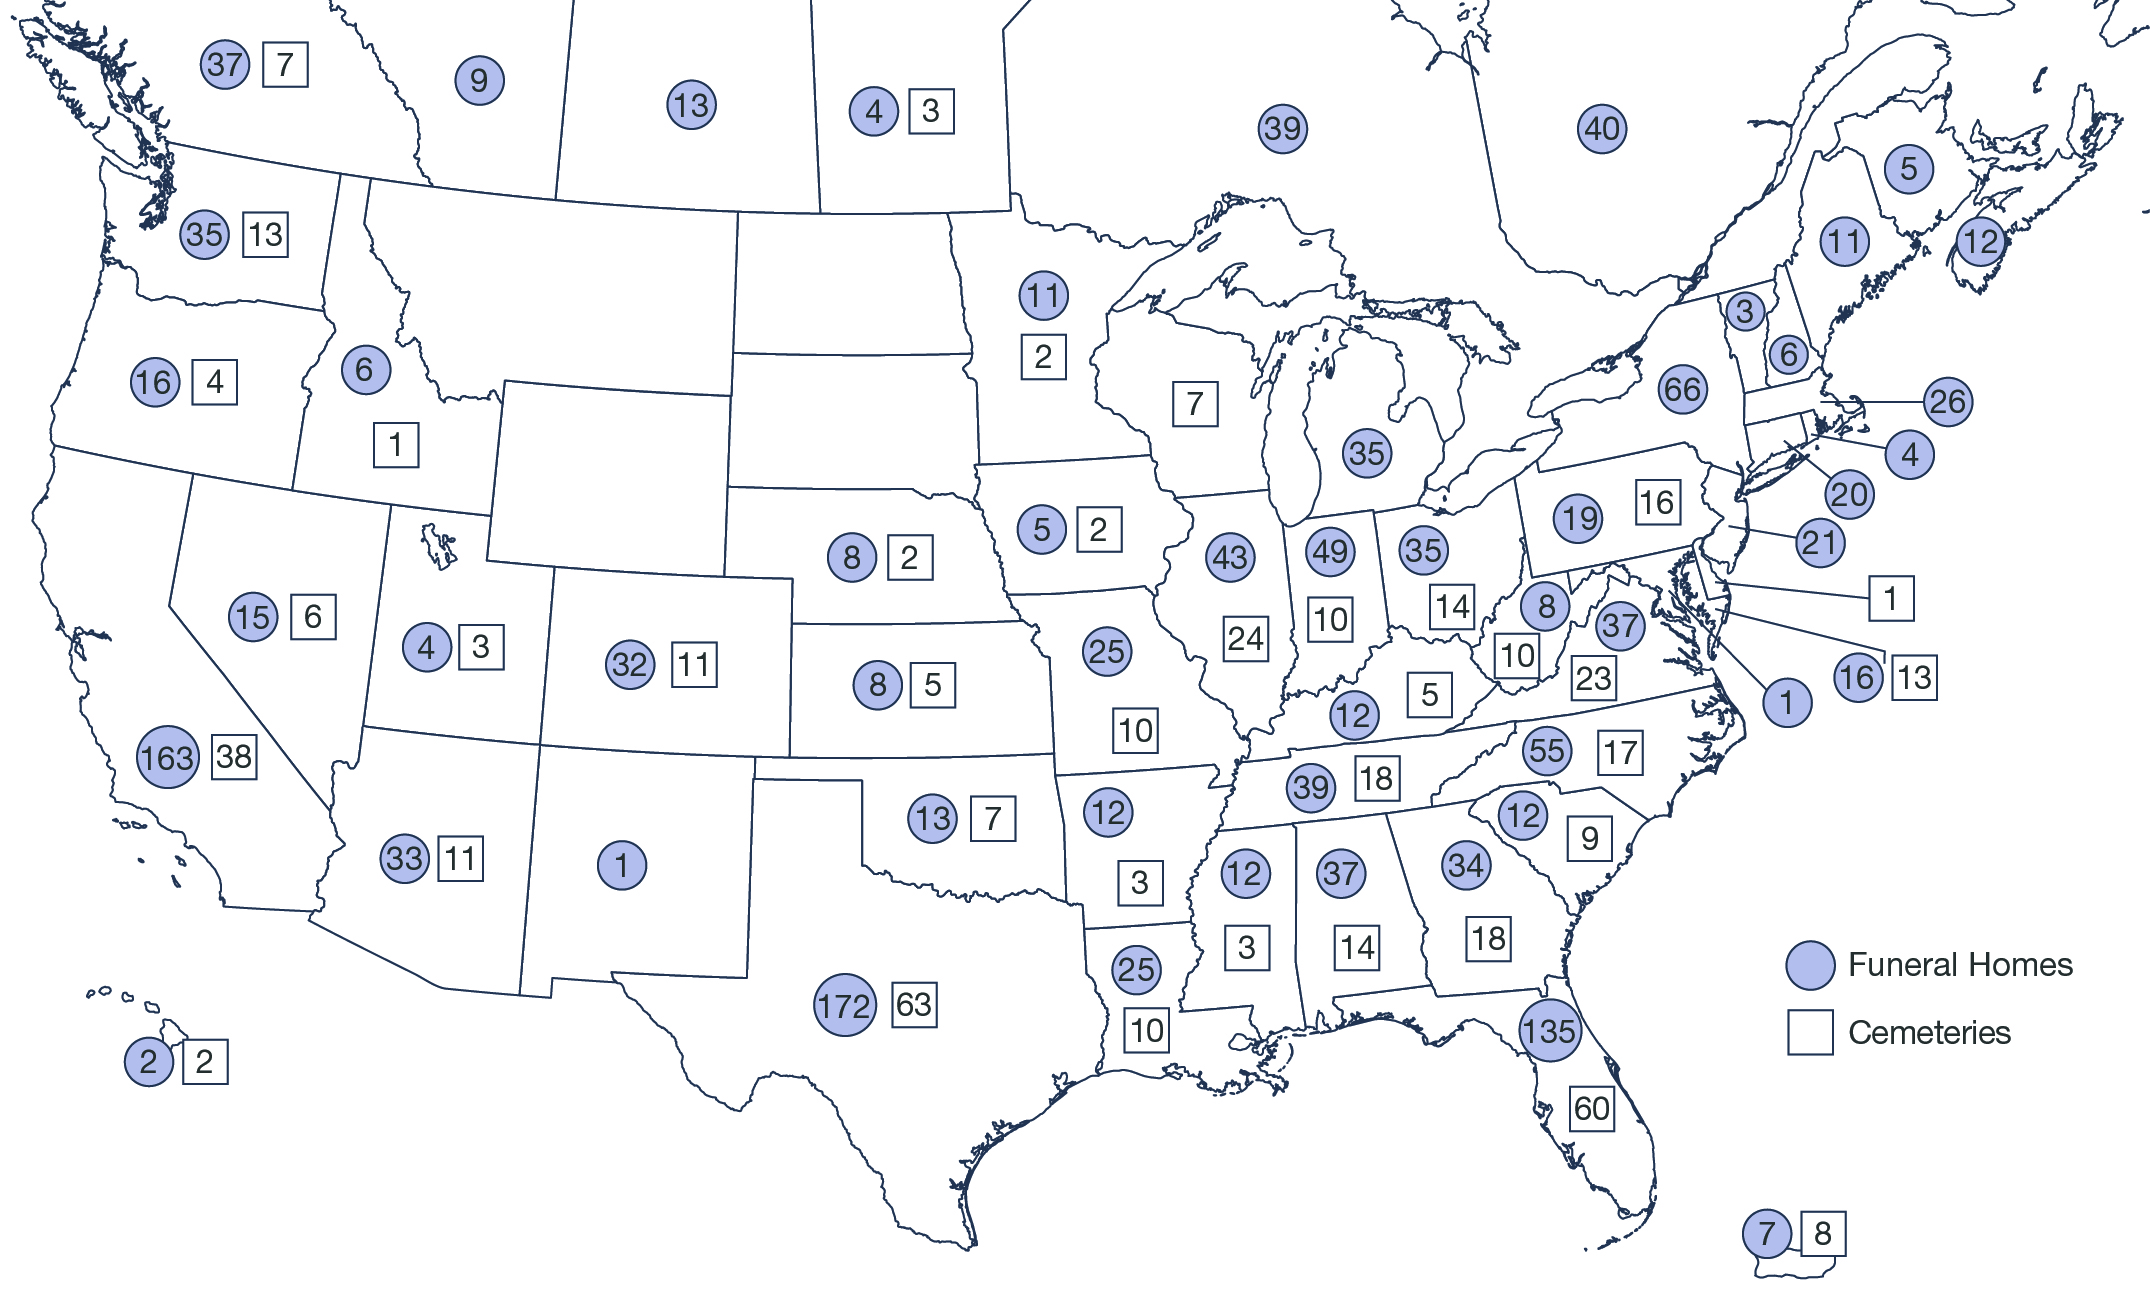
We are North America’s largest provider of deathcare products and services, with a network of funeral service locations and cemeteries unequaled in geographic scale and reach. At
December 31, 2017
, we operated
1,488
funeral service locations and
473
cemeteries (including
281
funeral service/cemetery combination locations), which are geographically diversified across
45
states,
eight
Canadian provinces, the District of Columbia, and Puerto Rico.
We are well known for our Dignity Memorial
®
brand, North America's first transcontinental brand of deathcare products and services. Our other brands are Dignity Planning
™
, National Cremation Society
®
, Advantage
®
Funeral and Cremation Services, Funeraria del Angel
™
, Making Everlasting Memories
®
, Neptune Society
™
and Trident Society
™
. Our funeral service and cemetery operations consist of funeral service locations, cemeteries, funeral service/cemetery combination locations, crematoria, and related businesses, which enable us to serve a wide array of customer needs. We sell cemetery property and funeral and cemetery merchandise and services at the time of need and on a preneed basis.
History
We were incorporated in Texas in
July of 1962
. Our original business plan was based on efficiencies of scale, specifically reducing overhead costs by sharing resources such as preparation services, accounting, transportation, and personnel among funeral service locations in a business “cluster.” After proving the plan’s effectiveness in Houston in the early
1960s
, we set out to apply this operating strategy through the acquisition of deathcare businesses in other markets over the next three decades. Beginning in
1993
, we expanded beyond North America, acquiring major deathcare companies in Australia, the United Kingdom, and France, plus smaller holdings in other European countries and South America.
During the mid to late
1990s
, acquisitions of deathcare facilities became extremely competitive, resulting in increased prices for acquisitions and substantially reduced returns on invested capital. In
1999
, we significantly reduced our level of acquisition activity and over the next several years implemented various initiatives to pay down debt, increase cash flow, reduce overhead costs, and increase efficiency. We divested our international businesses and many North American funeral service locations and cemeteries that were either underperforming or did not fit within our long-term strategy. At the same time, we began to capitalize on the strength of our network by introducing to North America the first transcontinental brand of deathcare services and products — Dignity Memorial
®
(see
www.dignitymemorial.com
). Information contained on our website is not part of this report.
In late
2006
, having arrived at a position of significant financial strength and improved operating efficiency, we acquired the then second largest company in the North American deathcare industry, Alderwoods Group. In early
2010
, we acquired the then fifth largest company in the North American deathcare industry, Keystone North America. In
June of 2011
, we acquired 70% of the outstanding shares of The Neptune Society, Inc. (Neptune), which is the nation's largest direct cremation organization, now known as SCI Direct. Subsequently, in 2013 and 2014, we acquired the remaining 30% of the outstanding shares of Neptune. In
December 2013
, we purchased Stewart Enterprises, Inc. (Stewart), the then second largest operator of funeral service locations and cemeteries in North America.
Funeral and Cemetery Operations
Our funeral service and cemetery operations consist of funeral service locations, cemeteries, funeral service/cemetery combination locations, crematoria, and other related businesses. See Note 12 in Part II, Item 8. Financial Statements and Supplementary Data, for financial information about our business segments and geographic areas.
We have the largest number of combination locations in North America. Funeral service/cemetery combination locations are those businesses in which a funeral service location is physically located within or adjoining a cemetery that we own. Combination locations allow certain facility, personnel, and equipment costs to be shared between the funeral service location and cemetery. Such combination facilities typically can be more cost competitive and have higher gross margins than if the funeral and cemetery operations are operated separately. Combination locations also create synergies between funeral and cemetery preneed sales force personnel and give families added convenience to purchase both funeral and cemetery merchandise and services at a single location.
Funeral service locations provide all professional services related to funerals and cremations, including the use of funeral home facilities and motor vehicles, arranging and directing services, removal, preparation, embalming, cremations, memorialization, and catering. Funeral merchandise, including burial caskets and related accessories, urns and other cremation receptacles, outer burial containers, flowers, online and video tributes, stationery products, casket and cremation memorialization products, travel protection, and other ancillary merchandise, is sold at funeral service locations.
Our cemeteries provide cemetery property interment rights, including developed lots, lawn crypts, mausoleum spaces, niches, and other cremation memorialization and interment options. Cemetery merchandise and services, including memorial
5
markers and bases, outer burial containers, flowers and floral placement, other ancillary merchandise, graveside services, merchandise installation, and interments, are sold at our cemeteries.
We also sell cemetery property interment rights and funeral and cemetery merchandise and services whereby a customer contractually agrees to the terms of certain products and services to be delivered and performed in the future. We define these sales as preneed sales. As a result of such preneed sales, our backlog of unfulfilled preneed funeral and cemetery contracts was
$10.7 billion
and
$10.0 billion
at
December 31, 2017
and
2016
, respectively.
The following table at
December 31, 2017
provides the number of our funeral service locations and cemeteries by country, and by state, territory, or province:
|
Country, State/Territory/Province
|
Number of Funeral Service Locations
|
Number of Cemeteries
|
Total
|
||||||
|
United States
|
|
|
|
|
|
|
|||
|
Alabama
|
37
|
|
14
|
|
51
|
|
|||
|
Arizona
|
33
|
|
11
|
|
44
|
|
|||
|
Arkansas
|
12
|
|
3
|
|
15
|
|
|||
|
California
|
163
|
|
38
|
|
201
|
|
|||
|
Colorado
|
32
|
|
11
|
|
43
|
|
|||
|
Connecticut
|
20
|
|
—
|
|
20
|
|
|||
|
Delaware
|
—
|
|
1
|
|
1
|
|
|||
|
District of Columbia
|
1
|
|
—
|
|
1
|
|
|||
|
Florida
|
135
|
|
60
|
|
195
|
|
|||
|
Georgia
|
34
|
|
18
|
|
52
|
|
|||
|
Hawaii
|
2
|
|
2
|
|
4
|
|
|||
|
Idaho
|
6
|
|
1
|
|
7
|
|
|||
|
Illinois
|
43
|
|
24
|
|
67
|
|
|||
|
Indiana
|
49
|
|
10
|
|
59
|
|
|||
|
Iowa
|
5
|
|
2
|
|
7
|
|
|||
|
Kansas
|
8
|
|
5
|
|
13
|
|
|||
|
Kentucky
|
12
|
|
5
|
|
17
|
|
|||
|
Louisiana
|
25
|
|
10
|
|
35
|
|
|||
|
Maine
|
11
|
|
—
|
|
11
|
|
|||
|
Maryland
|
16
|
|
13
|
|
29
|
|
|||
|
Massachusetts
|
26
|
|
—
|
|
26
|
|
|||
|
Michigan
|
35
|
|
—
|
|
35
|
|
|||
|
Minnesota
|
11
|
|
2
|
|
13
|
|
|||
|
Mississippi
|
12
|
|
3
|
|
15
|
|
|||
|
Missouri
|
25
|
|
10
|
|
35
|
|
|||
|
Nebraska
|
8
|
|
2
|
|
10
|
|
|||
|
Nevada
|
15
|
|
6
|
|
21
|
|
|||
|
New Hampshire
|
6
|
|
—
|
|
6
|
|
|||
|
New Jersey
|
21
|
|
—
|
|
21
|
|
|||
|
New Mexico
|
1
|
|
—
|
|
1
|
|
|||
|
New York
|
66
|
|
—
|
|
66
|
|
|||
|
North Carolina
|
55
|
|
17
|
|
72
|
|
|||
|
Ohio
|
35
|
|
14
|
|
49
|
|
|||
|
Oklahoma
|
13
|
|
7
|
|
20
|
|
|||
|
Oregon
|
16
|
|
4
|
|
20
|
|
|||
|
Pennsylvania
|
19
|
|
16
|
|
35
|
|
|||
|
Puerto Rico
|
7
|
|
8
|
|
15
|
|
|||
|
Rhode Island
|
4
|
|
—
|
|
4
|
|
|||
|
South Carolina
|
12
|
|
9
|
|
21
|
|
|||
|
Tennessee
|
39
|
|
18
|
|
57
|
|
|||
|
Texas
|
172
|
|
63
|
|
235
|
|
|||
|
Utah
|
4
|
|
3
|
|
7
|
|
|||
|
Vermont
|
3
|
|
—
|
|
3
|
|
|||
|
Virginia
|
37
|
|
23
|
|
60
|
|
|||
|
Washington
|
35
|
|
13
|
|
48
|
|
|||
6
|
West Virginia
|
8
|
|
10
|
|
18
|
|
|||
|
Wisconsin
|
—
|
|
7
|
|
7
|
|
|||
|
Canada
|
|
|
|
|
|
|
|||
|
Alberta
|
9
|
|
—
|
|
9
|
|
|||
|
British Columbia
|
37
|
|
7
|
|
44
|
|
|||
|
Manitoba
|
4
|
|
3
|
|
7
|
|
|||
|
New Brunswick
|
5
|
|
—
|
|
5
|
|
|||
|
Nova Scotia
|
12
|
|
—
|
|
12
|
|
|||
|
Ontario
|
39
|
|
—
|
|
39
|
|
|||
|
Quebec
|
40
|
|
—
|
|
40
|
|
|||
|
Saskatchewan
|
13
|
|
—
|
|
13
|
|
|||
|
Total
(1)
|
1,488
|
|
473
|
|
1,961
|
|
|||
|
(1)
|
Includes businesses held for sale at
December 31, 2017
.
|
We believe we have satisfactory title to the properties owned and used in our business, subject to various liens, encumbrances, and easements that are incidental to ownership rights and uses and do not materially detract from the value of the property. At
December 31, 2017
, we owned approximately 84% of the real estate and buildings used at our facilities, and the remainder of the facilities were leased under both capital and operating leases. At
December 31, 2017
, our
473
cemeteries contained a total of approximately 34,863 acres, of which approximately 66% was developed.
Our corporate headquarters are located at 1929 Allen Parkway, Houston, Texas 77019. The property consists of approximately 120,000 square feet of office space and 185,000 square feet of parking space. We own and utilize an additional building located in Houston, Texas for corporate activities containing a total of approximately 38,000 square feet of office space. We also lease approximately 29,000 square feet of office space in Houston, Texas, which we utilize for corporate activities. We own a building in Jefferson, Louisiana with approximately 98,200 square feet of office space that we use, in part, for corporate activities.
7
A map of our locations in North America is presented below:
Competition
Although there are several public companies that own funeral service locations and cemeteries, the majority of deathcare businesses in North America are locally-owned, independent operations. We estimate that our funeral and cemetery market share in North America is approximately 15%-
16%
based on estimated total industry revenue. The position of a single funeral service location or cemetery in any community is a function of the name, reputation, and location of that funeral service location or cemetery, although competitive pricing, professional service and attention, and well-maintained locations are also important.
We believe we have an unparalleled network of funeral service locations and cemeteries that offer high quality products and services at prices that are competitive with local competing funeral service locations, cemeteries, and retail locations. Within this network, the funeral service locations and cemeteries operate under various names as most operations were acquired as existing businesses. We have co-branded our funeral operations under the name Dignity Memorial
®
. We believe our transcontinental branding strategy gives us a strategic advantage and identity in the industry. While this branding process is intended to emphasize our seamless national network of funeral service locations and cemeteries, the original names associated with acquired operations, and their inherent goodwill and heritage, generally remain the same. For example, Geo. H. Lewis & Sons Funeral Directors is now Geo. H. Lewis & Sons Funeral Directors, a Dignity Memorial
®
provider.
Strategies for Growth
We believe we are well positioned for long-term profitable growth. We are the largest consolidated deathcare company in North America and are poised to benefit from the aging of the American population. The demographic landscape is a factor driving our company strategy. The average age of our preneed cemetery consumer is late fifties to early sixties. The average age of our preneed funeral consumer is late sixties to early seventies. And the average age of our atneed consumer is late seventies to early eighties. We know that the Baby Boomers are already impacting our business today through the growth in our preneed cemetery sales programs. We anticipate seeing a similar impact on our preneed funeral results, and then ultimately on our atneed results.
8
We have three core strategies designed to grow the company and enhance shareholder value: 1) grow revenue, 2) leverage our unparalleled scale, and 3) deploy capital. These strategies are centered on the consumer and our competitive advantages.
Grow Revenue
Our first core strategy is to grow revenue by remaining relevant to the customer and growing our preneed sales.
Remaining Relevant to the Customer.
Remaining relevant to our customer is key to generating revenue growth in a changing customer environment. We are constantly evolving to meet the varying preferences and needs of our customers. In our funeral segment, we focus on memorialization services that will be meaningful to the customers, family members, and friends. We continue to offer contemporary product and service offerings. We also focus on the religious, ethnic and cultural traditions important to our customers. Additionally, we are incorporating technology to aid in the visualization of our product and service offerings to ensure the selection process for the customer's experience is simple and transparent.
In our cemetery segment, we have created tiers within our cemetery product offerings to provide more choices for our customers. As with our funeral segment, we also cater to the religious, ethnic and cultural traditions important to our customers. We continue to develop innovative products such as recurring floral placements and customized cemetery property offerings. We have also simplified the decision-making process incorporating technology to enable visualization of our product offerings.
Growing Preneed Sales.
Our preneed sales program drives current year and future revenue growth in both segments of our business. We believe we have a unique competitive advantage in growing preneed sales due to our size and scale. Within the funeral segment, our preneed funeral program creates greater brand awareness, secures future market share, and diversifies our revenue stream. We leverage our scale through a highly trained preneed sales force of approximately 4,300 counselors who provide customers informed guidance about various service and merchandise options designed to fit the needs of today’s consumer.
Within the cemetery segment, we offer a variety of property, merchandise, and service options designed to meet the needs of various cultural, regional, or religious preferences. Over the past three years, we have substantially increased our property options by implementing a tiering strategy that might offer as many as five unique choices for ground burial, mausoleum, or cremation memorialization. Our scale enables us to synchronize the construction of contemporary inventory with customer demand.
Leverage Our Unparalleled Scale
We leverage our unparalleled scale by developing our sales organization, using our scale with our preneed backlog, as well as optimizing our network and deploying customer-facing technology. Our size and broad geographic network of businesses gives us a significant advantage in the industry.
Developing Our Sales Organization.
Over the past several years, we have invested in the infrastructure and training of our sales organization. We are continuing to develop our sales counselors through the use of technology. We have utilized a customer relationship management system (CRM) that has helped to increase sales production while managing costs. Our CRM system has enabled us to quickly respond to new leads, improving the efficiency and effectiveness of our sales counselors. We believe that our scale allows us to operate, finance, and expand our sales organization in a manner that our competitors cannot afford to replicate.
Using Our Scale with Our Preneed Backlog.
With our
$10.7 billion
backlog, we benefit from having access to well recognized financial partners in the industry. For our trust investments, we have access to preeminent money managers and lower fee structures, which we believe are low risk structures that will provide us with higher returns and lower costs of administration over time. We also enjoy favorable terms with our third party insurance provider. These arrangements with third party partners and the favorable terms we receive on our trust investments cannot be duplicated by the independent operator, and give us a competitive advantage in asset growth leading to enhanced profitability over time.
Optimizing Our Network and Deploying Customer-Facing Technology.
We continue to drive operating discipline and leverage our scale through standardizing processes and capitalizing on new technologies to improve the customer experience. We regularly examine our purchasing spend to look for opportunities to consolidate our supplier base, modify processes and policies for more efficient purchasing, and employ metrics to manage and improve supplier performance. Our advancements in technology are changing the way we present our product and service offerings to customers. Our new atneed customer system, HMIS+, uses a digital platform and photographs to create a seamless presentation of our products and services. Our newly implemented preneed sales system, Beacon, provides customers with the convenience of a mobile digital presentation. We also continue to refresh our websites to provide a better customer mobile experience and enhanced search engine capability. These customer-facing applications have resulted in favorable customer satisfaction ratings and increased package sales.
Deploy Capital
Our third core strategy is to maximize capital deployment opportunities in a disciplined and balanced manner to the highest and best use. Our strong liquidity and robust cash flow generation enables us to continue our long-standing commitment to use
9
capital deployment to grow our business and enhance shareholder value. Our priorities for capital deployment are: 1) investing in acquisitions and building new funeral service locations, 2) paying dividends, 3) repurchasing shares, and 4) repurchasing debt.
Investing in Acquisitions and Building New Funeral Homes.
We plan to use our capital to manage our footprint by focusing on strategic acquisitions and building new funeral homes where the expected returns are attractive and exceed our weighted average cost of capital. We target businesses with favorable customer dynamics and/or where we can achieve additional economies of scale. Within our funeral segment, we continue to pursue strategic acquisitions and to build new funeral homes in areas that provide us with the potential for scale in areas with the highest return customer categories and market traits. Within our cemetery segment, we plan to pursue strategic acquisitions to create more opportunities to sell to Baby Boomers through our customer-driven strategy. We believe our unparalleled business footprint and geographic diversity uniquely position us to benefit from the aging Baby Boomer population. We have a successful track record of integrating new businesses and achieving favorable returns on the capital deployed.
Paying Dividends.
Our quarterly dividend rate has steadily grown from
$0.025
per common share in 2005 to
$0.15
per common share at the end of
2017
. In February 2018, our Board of Directors approved a cash dividend increase to
$0.17
per common share. We target a payout ratio of 30% to 40% of earnings excluding special items and intend to grow our cash dividend commensurate with the growth in our business. While we intend to pay regular quarterly cash dividends for the foreseeable future, all future dividends are subject to limitations in our debt covenants and final determination by our Board of Directors each quarter upon review of our financial performance.
Repurchasing Shares.
Absent opportunities for strategic acquisitions, we expect to continue to repurchase shares of our common stock in the open market or through privately negotiated transactions, subject to market conditions, debt covenants, and normal trading restrictions. The velocity of our purchases is determined as we evaluate the opportunity to capture value for our shareholders. Since 2010, we have reduced the number of shares outstanding by 23%. In February 2018, our Board of Directors increased our repurchase authorization for up to
$400.0 million
.
Repurchasing Debt.
With a focus on maintaining liquidity and financial flexibility, we may seek to make open market debt repurchases when it is opportunistic to do so relative to other capital deployment opportunities to manage our near-term debt maturity profile.
Associates
At
December 31, 2017
, we employed
15,508
individuals on a full-time basis and
7,920
individuals on a part-time basis. Of the full-time associates,
13,403
were employed in the funeral and cemetery operations and
2,105
were employed in corporate or other overhead activities and services. All eligible associates in the United States who so elect are covered by our group health and life insurance plans. Associates covered by a collective bargaining agreement are typically covered by union health plans and are not eligible to participate in our health insurance plan. At
December 31, 2017
and
2016
, there were
8,154
and
9,491
associates, respectively, who had elected to participate in our group health insurance plans. Eligible associates in the United States are covered by retirement plans of SCI or various subsidiaries, while international associates are covered by other SCI (or SCI subsidiary) defined contribution or government-mandated benefit plans. Approximately
2.4%
of our associates are represented by unions. Although labor disputes occur from time to time, relations with associates are generally considered favorable.
Regulation
Our funeral operations are regulated by the Federal Trade Commission (the “FTC”) under the FTC’s Trade Regulation Rule on Funeral Industry Practices (the “Funeral Rule”), which went into effect in 1984. The Funeral Rule defines certain acts or practices as unfair or deceptive and contains certain requirements to prevent these acts or practices. The preventive measures require a funeral provider to give consumers accurate, itemized price information and various other disclosures about funeral merchandise and services and prohibit a funeral provider from: 1) misrepresenting legal, crematory, and cemetery requirements; 2) embalming for a fee without permission; 3) requiring the purchase of a casket for direct cremation; and 4) requiring consumers to buy certain funeral merchandise or services as a condition for furnishing other funeral merchandise or services.
Our operations are also subject to regulation, supervision, and licensing under numerous federal, state, and local laws and regulations as well as Canadian and provincial laws and regulations. For example, state laws impose licensing requirements for funeral service locations and funeral directors and regulate preneed sales including our preneed trust activities. Our facilities are subject to environmental, health, and safety regulations. We take various measures to comply with the Funeral Rule and all laws and regulations. For example, we have established and maintain policies, procedures, and business practices; we engage in training of our personnel; and we carry out ongoing reviews of our compliance efforts. We believe that we are in substantial compliance with the Funeral Rule and all laws and regulations.
Federal, state, and local legislative bodies and regulatory agencies (including Canadian legislative bodies and agencies) frequently propose new laws and regulations, some of which could have a material effect on our operations and on the
10
deathcare industry in general. We cannot accurately predict the outcome of any proposed legislation or regulation or the effect that any such legislation or regulation might have on us.
Other
We make available free of charge, on or through our website, our annual, quarterly, and current reports and any amendments to those reports, as soon as reasonably practicable after electronically filing such reports with the Securities and Exchange Commission (SEC). Our website is
http://www.sci-corp.com
and our telephone number is (713) 522-5141. The SEC also maintains an internet site at
http://www.sec.gov
that contains reports, proxy and information statements, and other information regarding issuers that file electronically. The public may read and copy any materials we file with the SEC at the SEC’s Public Reference Room at 100 F Street, N.E., Washington, DC 20549. Information on the operation of the Public Reference Room may be obtained by calling the SEC at 1-800-SEC-0330.
Each of our Board of Directors’ standing committee charters, our Corporate Governance Guidelines, our Code of Ethics for Board Members, and our Code of Conduct for Officers and Employees are available, free of charge, through our website or, upon request, in print. We will post on our internet website all waivers to or amendments of our Code of Conduct for Officers and Employees, which are required to be disclosed by applicable law and rules of the New York Stock Exchange listing standards. Information contained on our website is not part of this report.
Item 1A.
Risk Factors.
Cautionary Statement on Forward-Looking Statements
The statements in this Form 10-K that are not historical facts are forward-looking statements made in reliance on the safe harbor protections provided under the Private Securities Litigation Reform Act of 1995. These statements may be accompanied by words such as “believe”, “estimate”, “project”, “expect”, “anticipate”, or “predict” that convey the uncertainty of future events or outcomes. These statements are based on assumptions that we believe are reasonable; however, many important factors could cause our actual consolidated results in the future to differ materially from the forward-looking statements made herein and in any other documents or oral presentations made by, or on behalf of, the Company. These factors are discussed below. We assume no obligation and make no undertaking to publicly update or revise any forward-looking statements made herein or any other forward-looking statements made by the Company, whether as a result of new information, future events, or otherwise.
Our affiliated funeral and cemetery trust funds own investments in securities, which are affected by market conditions that are beyond our control.
In connection with our preneed merchandise and service sales, most affiliated trust funds own investments in equity securities, fixed income securities, commingled funds, money market funds, and mutual funds. The fair value of these investments and our earnings and investment gains and losses on these securities and funds are affected by financial market conditions that are beyond our control.
The following table summarizes our investment returns (realized and unrealized), excluding certain fees, on our trust funds for the years ended December 31:
|
2017
|
2016
|
2015
|
||||||
|
Preneed funeral merchandise and service trust funds
|
16.1
|
%
|
7.1
|
%
|
(1.5
|
)%
|
||
|
Preneed cemetery merchandise and service trust funds
|
16.8
|
%
|
7.2
|
%
|
(1.0
|
)%
|
||
|
Cemetery perpetual care trust funds
|
9.5
|
%
|
9.1
|
%
|
(0.3
|
)%
|
||
Generally, earnings or gains and losses on our trust investments are recognized and we withdraw cash when the underlying merchandise is delivered, service is performed, or upon contract cancellation. Our cemetery perpetual care trusts recognize earnings, and in certain states capital gains and losses or fixed percentage distributions. We withdraw allowable cash when we incur qualifying cemetery maintenance costs.
If the investments in our trust funds experience significant declines in
2018
or subsequent years, there could be insufficient funds in the trusts to cover the costs of delivering merchandise and services or maintaining cemeteries in the future. We may be required to cover any such shortfall with cash flows from operations, which could have a material adverse effect on our financial condition, results of operations, or cash flows. For more information related to our trust investments, see Note 3 in Part II, Item 8. Financial Statements and Supplementary Data.
If the fair value of these trusts, plus any other amount due to us upon delivery of the associated contracts, were to decline below the estimated costs to deliver the underlying products and services, we would record a charge to earnings to record a liability for the expected losses on the delivery of the associated contracts. As of
December 31, 2017
, no such charge was required. For additional information, see Critical Accounting Policies, Recent Accounting Pronouncements, and Accounting Changes
in Part II, Item 7. Management’s Discussion and Analysis of Financial Condition and Results of Operations.
11
We may be required to replenish our affiliated funeral and cemetery trust funds to meet minimum funding requirements, which would have a negative effect on our earnings and cash flow.
In certain states and provinces, we have withdrawn allowable distributable earnings, including unrealized gains, prior to the maturity or cancellation of the related contract. Additionally, some states have laws that either require replenishment of investment losses under certain circumstances or impose various restrictions on withdrawals of future earnings when trust fund values drop below certain prescribed amounts. In the event of market declines that result in a severe decrease in trust fund value, we may be required to replenish amounts in the respective trusts in some future period. As of
December 31, 2017
, we had unrealized losses of
$15.0 million
in the various trusts within these states. See Off-Balance Sheet Arrangements, Contractual Obligations, and Commercial and Contingent Commitments in Part II, Item 7.
Our ability to execute our strategic plan depends on many factors, some of which are beyond our control.
Our strategic plan is focused on growing our revenue, leveraging our scale, and deploying our capital. Many of the factors that impact our ability to execute our strategic plan, such as the number of deaths and general economic conditions, are beyond our control. Changes in operating conditions, such as supply disruptions and labor disputes, could negatively impact our operations. Our inability to leverage scale to drive cost savings, productivity improvements, preneed production, or earnings growth anticipated by management could affect our financial performance. Our inability to identify acquisition candidates and to complete acquisitions, divestitures, or strategic alliances as planned or to realize expected synergies and strategic benefits could impact our financial performance. Our inability to deploy capital to maximize shareholder value could impact our financial performance. We cannot give assurance that we will be able to execute any or all of our strategic plan. Failure to execute any or all of our strategic plan could have a material adverse effect on our financial condition, results of operations, and cash flows.
Our credit agreements contain covenants that may prevent us from engaging in certain transactions.
Our Bank Credit Facility contains, among other things, various affirmative and negative covenants that may prevent us from engaging in certain transactions that might otherwise be considered beneficial to us. The covenants limit, among other things, our and our subsidiaries’ ability to:
|
•
|
Incur additional indebtedness (including guarantee obligations);
|
|
•
|
Create liens on assets;
|
|
•
|
Engage in certain transactions with affiliates;
|
|
•
|
Enter into sale-leaseback transactions;
|
|
•
|
Engage in mergers, liquidations, and dissolutions;
|
|
•
|
Sell assets;
|
|
•
|
Pay dividends, distributions, and other payments in respect of our capital stock;
|
|
•
|
Purchase our capital stock in the open market;
|
|
•
|
Make investments, loans, or advances;
|
|
•
|
Repay indebtedness or amend the agreements relating thereto;
|
|
•
|
Create restrictions on our ability to receive distributions from subsidiaries; and
|
|
•
|
Change our lines of business.
|
Our Bank Credit Facility requires us to maintain certain leverage and interest coverage ratios. These covenants and coverage ratios may require us to take actions to reduce our indebtedness or act in a manner contrary to our strategic plan and business objectives. In addition, events beyond our control, including changes in general economic and business conditions, may affect our ability to satisfy these covenants. A breach of any of these covenants could result in a default of our indebtedness. If an event of default under our Bank Credit Facility occurs, and such event of default continues unremedied for 30 days after we receive notice thereof, the lenders party thereto could elect to declare all amounts outstanding thereunder, together with accrued interest, immediately due and payable. Any such declaration would also result in an event of default under our Senior Indenture governing our various senior notes. For additional information, see Financial Condition, Liquidity and Capital Resources in Part II, Item 7. Management’s Discussion and Analysis of Financial Condition and Results of Operations and Note 6 in Part II, Item 8. Financial Statements and Supplementary Data.
12
If we lost the ability to use surety bonding to support our preneed funeral and cemetery activities, we may be required to make material cash payments to fund certain trust funds.
We have entered into arrangements with certain surety companies whereby such companies agree to issue surety bonds on our behalf as financial assurance or as required by existing state and local regulations. The surety bonds are used for various business purposes; however, the majority of the surety bonds issued and outstanding have been issued to support our preneed funeral and cemetery activities. In the event all of the surety companies canceled or did not renew our surety bonds, which generally have twelve-month renewal periods, we would be required to either obtain replacement coverage or fund approximately
$166.0 million
into state-mandated trust accounts as of
December 31, 2017
. There can be no assurance that we would be able to obtain replacement coverage at a similar cost or at all.
The funeral and cemetery industry is competitive.
In North America, the funeral and cemetery industry is characterized by a large number of locally-owned, independent operations. To compete successfully, our funeral service locations and cemeteries must maintain good reputations and high professional standards, as well as offer attractive products and services at competitive prices. In addition, we must market ourselves in such a manner as to distinguish us from our competitors. We have historically experienced price competition from independent funeral service location and cemetery operators, monument dealers, casket retailers, low-cost funeral providers, and other nontraditional providers of merchandise and services. If we are unable to successfully compete, our financial condition, results of operations, and cash flows could be materially adversely affected.
Increasing death benefits related to preneed contracts funded through life insurance or annuity contracts may not cover future increases in the cost of providing a price-guaranteed service.
We sell price-guaranteed preneed contracts through various programs providing for future services at prices prevailing when the agreements are signed. For preneed contracts funded through life insurance or annuity contracts, we receive in cash a general agency commission from a third-party insurance company that typically averages approximately 25% of the total sale. Additionally, we receive an increasing death benefit associated with the contract of approximately 1% per year in cash at the time the service is performed. There is no guarantee that the increasing death benefit will cover future increases in the cost of providing a price-guaranteed service, and any such excess cost could be materially adverse to our financial condition, results of operations, and cash flows.
The financial condition of third-party insurance companies that fund our preneed contracts may impact our future revenue.
Where permitted, customers may arrange their preneed contract by purchasing a life insurance or annuity policy from third-party insurance companies. The customer/policy holder assigns the policy benefits to us as payment for their preneed contract at the time of need. If the financial condition of the third-party insurance companies were to deteriorate materially because of market conditions or otherwise, there could be an adverse effect on our ability to collect all or part of the proceeds of the life insurance policy, including the annual increase in the death benefit, if we fulfill the preneed contract at the time of need. Failure to collect such proceeds could have a material adverse effect on our financial condition, results of operations, and cash flows.
Unfavorable results of litigation could have a material adverse impact on our financial statements.
As discussed in Note 8 of Part II, Item 8. Financial Statements and Supplementary Data, we are subject to a variety of claims and lawsuits in the ordinary course of our business. Adverse outcomes in some or all of the pending cases may result in significant monetary damages or injunctive relief against us, as litigation and other claims are subject to inherent uncertainties. Any such adverse outcomes, in pending cases or other lawsuits that may arise in the future, could have a material adverse impact on our financial position, results of operations, and cash flows.
Unfavorable publicity could affect our reputation and business.
Since our operations relate to life events involving emotional stress for our client families, our business is dependent on customer trust and confidence. Unfavorable publicity about our business generally or in relation to any specific location could affect our reputation and customers’ trust and confidence in our products and services, thereby having an adverse impact upon our sales and financial results.
If the number of deaths in our markets decline, our cash flows and revenue may decrease.
If the number of deaths in our markets decline, the number of funeral services and interments performed by us could decrease and our financial condition, results of operations, and cash flows could be materially adversely affected. Variations in the death rate and seasonality of deaths throughout each year may also cause revenue to fluctuate between quarters or years.
13
If we are not able to respond effectively to changing consumer preferences, our market share, revenue, and/or profitability could decrease.
Future market share, revenue, and profit will depend in part on our ability to anticipate, identify, and respond to changing consumer preferences. We may not correctly anticipate or identify trends in consumer preferences, or we may identify them later than our competitors do. In addition, any strategies we may implement to address these trends may prove incorrect or ineffective.
The continuing upward trend in the number of cremations performed in North America could result in lower revenue, operating profit, and cash flows.
There is a continuing upward trend in the number of cremations performed in North America as an alternative to traditional funeral service dispositions. In our operations during
2017
,
53.5%
of the comparable services we performed were cremation cases compared to
52.6%
and
51.7%
performed in
2016
and
2015
, respectively. Our average revenue for cremations with service is lower than that for traditional burials. If we are unable to continue to expand our cremation memorialization products and services, and cremations remain a significant percentage of our services, our financial condition, results of operations, and cash flows could be materially adversely affected.
Our funeral and cemetery businesses are high fixed-cost businesses.
The majority of our operations are managed in groups called “markets”. Markets are geographical groups of funeral service locations and cemeteries that share common resources such as operating personnel, preparation services, clerical staff, motor vehicles, and preneed sales personnel. Personnel costs, the largest component of our operating expenses, are the cost components most beneficially affected by this grouping. We must incur many of these costs regardless of the number of services or interments performed. Because we cannot immediately decrease these costs when we experience lower sales volumes, a sales decline may cause our margin percentages to decline at a greater rate than the decline in revenue.
Regulation and compliance could have a material adverse impact on our financial results.
Our operations are subject to regulation, supervision, and licensing under numerous foreign, federal, state, and local laws, ordinances, and regulations, including extensive regulations concerning trust funds, preneed sales of funeral and cemetery merchandise and services, and various other aspects of our business. For example, the funeral industry is regulated at the federal level by the FTC, which requires funeral service locations to take actions designed to protect consumers. Our facilities are also subject to stringent health, safety, and environmental regulations. Our pay practices, including wage and hour overtime pay, are subject to federal and state regulations. Violations of applicable laws could result in fines or sanctions against us.
Businesses in general are subject to the impact of regulation and major legislation, including healthcare reform. We may experience significant increases in costs as a result of business regulations and laws, which are beyond our control, including increases in the cost of healthcare. Although we seek to control increases in these costs, continued upward pressure on costs could reduce the profitability of our business.
In addition, from time to time, governments and agencies propose to amend or add regulations or reinterpret existing regulations, which could increase costs and decrease cash flows. For example, foreign, federal, state, local, and other regulatory agencies have considered and may enact additional legislation or regulations that could affect the deathcare industry. These include regulations that require more liberal refund and cancellation policies for preneed sales of products and services, limit or eliminate our ability to use surety bonding, require the escheatment of trust funds, increase trust requirements, require the deposit of funds or collateral to offset unrealized losses of trusts, and/or prohibit the common ownership of funeral service locations and cemeteries in the same market. If adopted by the regulatory authorities of the jurisdictions in which we operate, these and other possible proposals could have a material adverse effect on our financial condition, results of operations, and cash flows.
Compliance with laws, regulations, industry standards, and customs concerning burial procedures and the handling and care of human remains is critical to the continued success of our business and any operations we may acquire. We are continually monitoring and reviewing our operations in an effort to ensure that we are in compliance with these laws, regulations, and standards and, where appropriate, taking appropriate corrective action. However, litigation and regulatory proceedings regarding these issues could have a material adverse effect on our financial condition, results of operations, and cash flows.
Cemetery burial practice claims could have a material adverse impact on our financial results.
Our cemetery practices have evolved and improved over time. Most of our cemeteries have been operating for decades and, therefore, may have used practices and procedures that are outdated in comparison to today's standards. When cemetery disputes occur, we may be subjected to litigation and liability for improper burial practices, including 1) burial practices of a different era that are judged today in hindsight as being outdated and 2) alleged violations of our practices and procedures by one or more of our associates. In addition, since most of our cemeteries were acquired through various acquisitions, we may be subject to litigation and liability based upon actions or events that occurred before we acquired or managed the cemeteries.
14
Claims or litigation based upon our cemetery burial practices could have a material adverse impact on our financial condition, results of operations, and cash flows.
We use a combination of insurance, self-insurance, and large deductibles in managing our exposure to certain inherent risks; therefore, we could be exposed to unexpected costs that could negatively affect our financial performance.
Our insurance coverage is subject to deductibles, self-insured retentions, limits of liability, and similar provisions that we believe are prudent based on our operations. Because we self-insure a significant portion of expected losses under our workers' compensation, auto, and general and professional liability insurance programs, unanticipated changes in any applicable actuarial assumptions, trends and interpretations, or management estimates underlying our recorded liabilities for these losses, including potential increases in costs, could result in materially different amounts of expense than expected under these programs. These unanticipated changes could have a material adverse effect on our financial condition, results of operations, or cash flows.
A number of years may elapse before particular tax matters, for which we have established accruals, are audited and finally resolved.
The number of tax years open to audit varies depending on the tax jurisdiction. We settled the tax years 1999-2005 with the IRS during the first quarter of 2017. The subsequent tax years remain open to review and adjustment by the IRS. Various state jurisdictions are auditing years 2000 through 2016. While it is often difficult to predict the final outcome or the timing of resolution of any particular tax matter, we believe that our accruals reflect the probable outcome of known tax contingencies. However, unfavorable settlement of any particular issue may reduce a deferred tax asset or require the use of cash, which may have a material adverse impact to our financial statements. Favorable resolution could result in reduced income tax expense reported in the financial statements in the future. See Note 5 of Part II, Item 8. Financial Statements and Supplementary Data
for additional information.
Changes in taxation as well as the inherent difficulty in quantifying potential tax effects of business decisions could have a material adverse effect on the results of our operations, financial condition, or cash flows.
We make judgments regarding the utilization of existing income tax credits and the potential tax effects of various financial transactions and results of operations to estimate our obligations to taxing authorities. Tax obligations include income, franchise, real estate, sales and use, and employment-related taxes. These judgments include reserves for potential adverse outcomes regarding tax positions that have been taken. Changes in federal, state, or local tax laws, adverse tax audit results, or adverse tax rulings on positions taken could have a material adverse effect on the results of our operations, financial condition, or cash flows.
The Budget Reconciliation Act, commonly referred to as the Tax Cuts and Jobs Act (hereinafter, “the Tax Act”), was signed into law on December 22, 2017 and is expected to have a favorable impact on our effective tax rate and net income as reported under generally accepted accounting principles both in the first fiscal quarter of 2018 and subsequent reporting periods to which the Tax Act is effective. However, we are still assessing the impact of the Tax Act and there can be no assurances that it will have a favorable impact. Investors should consult with their tax advisors with respect to the effect of the Tax Act and any other regulatory or administrative developments and proposals and their potential effect on their investments.
Declines in overall economic conditions beyond our control could reduce future potential earnings and cash flows and could result in future impairments to goodwill and/or other intangible assets.
In addition to an annual review, we assess the impairment of goodwill and/or other intangible assets whenever events or changes in circumstances indicate that the carrying value may be greater than fair value. Factors that could trigger an interim impairment review include, but are not limited to, a significant decline in our stock price, significant underperformance relative to historical or projected future operating results, and significant negative industry or economic trends. If these factors occur, we may have a triggering event, which could result in an impairment of our goodwill and/or other intangible assets. If economic conditions worsen causing deterioration in our operating revenue, operating margins, and cash flows, we may have a triggering event that could result in an impairment of our goodwill and/or other intangible assets. Our cemetery segment, which has a goodwill balance of
$306.2 million
as of
December 31, 2017
, is more sensitive to market conditions and goodwill impairments because it is more reliant on preneed sales, which are impacted by customer discretionary spending. For additional information, see Critical Accounting Policies, Recent Accounting Pronouncements, and Accounting Changes in Part II, Item 7. Management’s Discussion and Analysis of Financial Condition and Results of Operations.
15
Any failure to maintain the security of the information relating to our customers, their loved ones, our associates, and our vendors could damage our reputation, could cause us to incur substantial additional costs and to become subject to litigation, and could adversely affect our operating results, financial condition, or cash flow.
In the ordinary course of our business, we receive certain personal information, in both physical and electronic formats, about our customers, their loved ones, our associates, and our vendors. In addition, our online operations at our websites depend upon the secure transmission of confidential information over public networks, including information permitting electronic payments. We maintain substantial security measures and data backup systems to protect, store, and prevent unauthorized access to such information. Nevertheless, it is possible that computer hackers and others (through cyberattacks, which are rapidly evolving and becoming increasingly sophisticated, or by other means) might defeat our security measures in the future and obtain the personal information of customers, their loved ones, our associates, and our vendors that we hold. Further, our associates, contractors, or third parties with whom we do business may attempt to circumvent our security measures to misappropriate such information and may purposefully or inadvertently cause a breach, corruption, or data loss involving such information. A breach of our security measures or failure in our backup systems could adversely affect our reputation with our customers and their loved ones, our associates, and our vendors; as well as our operations, results of operations, financial condition, and cash flows; and could result in litigation against us or the imposition of penalties. Moreover, a security breach could require that we expend significant additional resources to upgrade further the security measures that we employ to guard such important personal information against cyberattacks and other attempts to access such information and could result in a disruption of our operations.
Our Canadian business exposes us to operational, economic, and currency risks.
Our Canadian operations represent a significant portion of our revenue. Our ability to successfully conduct operations in Canada is affected by many of the same risks we face in our U.S. operations, as well as unique costs and difficulties of managing Canadian operations. Our Canadian operations may be adversely affected by local laws, customs, and regulations, as well as political and economic conditions. Significant fluctuations in exchange rates between the U.S. dollar and the Canadian dollar may adversely affect our results of operations and cash flows.
Our level of indebtedness could adversely affect our ability to raise additional capital to fund our operations, limit our ability to react to changes in the economy or our industry, and may prevent us from fulfilling our obligations under our indebtedness.
We have a significant amount of indebtedness, which could have important consequences, including the following:
|
•
|
It may limit our ability to obtain additional debt or equity financing for working capital, capital expenditures, acquisitions, debt service requirements, and general corporate or other purposes.
|
|
•
|
A portion of our cash flows from operations will be dedicated to the payment of principal and interest on our indebtedness, including indebtedness we may incur in the future, and will not be available for other purposes, including to finance our working capital, capital expenditures, acquisitions, and general corporate costs or other purposes.
|
|
•
|
It could limit our flexibility in planning for, or reacting to, changes in our business and the industry in which we operate and place us at a competitive disadvantage compared to our competitors that have less debt.
|
|
•
|
It could make us more vulnerable to downturns in general economic or industry conditions or in our business, or prevent us from carrying out activities that are important to our growth.
|
|
•
|
It could increase our interest expense if interest rates in general increase because a portion of our indebtedness, including all of our indebtedness under our senior credit facilities, bears interest at floating rates.
|
|
•
|
It could make it more difficult for us to satisfy our obligations with respect to our indebtedness, and any failure to comply with the obligations of any of our debt instruments, including any financial and other restrictive covenants, could result in an event of default under the agreements governing our other indebtedness which, if not cured or waived, could result in the acceleration of our indebtedness.
|
Any of the above listed factors could materially affect our business, financial condition, results of operations, and cash flows.
In addition to our high level of indebtedness, we also have significant rental and other obligations under our operating and capital leases for funeral service locations, cemetery operating and maintenance equipment, and transportation equipment. These obligations could further increase the risks described above.
A failure of a key information technology system or process could disrupt and adversely affect our business.
We rely extensively on information technology systems, some of which are managed or provided by third-party service providers, to analyze, process, store, manage, and protect transactions and data. In managing our business, we also rely heavily on the integrity of, security of, and consistent access to this data for information such as sales, merchandise ordering, inventory
16
replenishment, and order fulfillment. For these information technology systems and processes to operate effectively, we or our service providers must periodically maintain and update them. Our systems and the third-party systems on which we rely are subject to damage or interruption from a number of causes, including power outages; computer and telecommunications failures; computer viruses; security breaches; cyber-attacks, including the use of ransomware; catastrophic events such as fires, floods, earthquakes, tornadoes, or hurricanes; acts of war or terrorism; and design or usage errors by our associates, contractors, or third-party service providers. Although we and our third-party service providers seek to maintain our respective systems effectively and to successfully address the risk of compromise of the integrity, security, and consistent operations of these systems, such efforts may not be successful. As a result, we or our service providers could experience errors, interruptions, delays, or cessations of service in key portions of our information technology infrastructure, which could significantly disrupt our operations and be costly, time consuming, and resource-intensive to remedy.
Failure to maintain effective internal control over financial reporting could adversely affect our results of operations, investor confidence, and our stock price.
The accuracy of our financial reporting depends on the effectiveness of our internal control over financial reporting. Internal control over financial reporting can provide only reasonable assurance with respect to the preparation and fair presentation of financial statements and may not prevent or detect misstatements because of its inherent limitations. If we do not maintain effective internal control over financial reporting or implement controls sufficient to provide reasonable assurance with respect to the preparation and fair presentation of our financial statements, we could be unable to file accurate financial reports on a timely basis, and our results of operations, investor confidence, and stock price could be materially adversely affected.
The application of unclaimed property laws by certain states to our preneed funeral and cemetery backlog could have a material adverse impact on our liquidity, cash flows, and our financial results.
In the ordinary course, our businesses have sold preneed funeral and cemetery contracts for decades. To the extent these contracts will not be funded with the assignment of the proceeds of life insurance policies, depending on applicable state laws, we could be responsible for escheatment of the portion of the funds paid that relate to contracts which we are unlikely to fulfill. For additional information, see Unclaimed Property Audit in Note 8 in Item 1 of Part 1 of this Form 10-K. The application of unclaimed property laws could have a material adverse effect on our liquidity, cash flows, and financial results.
Item 1B.
Unresolved Staff Comments.
None.
|
Item 2.
|
Properties.
|
Information regarding properties is set forth in Part I, Item 1. Business.
|
Item 3.
|
Legal Proceedings.
|
Information regarding legal proceedings is set forth in Note 8 of Part II, Item 8. Financial Statements and Supplementary Data.
EXECUTIVE OFFICERS OF THE COMPANY
The following table sets forth as of
February 14, 2018
, the name and age of each executive officer of the Company, the office held, and the year first elected an officer.
|
Officer Name
|
Age
|
Position
|
Year First
Became Officer |
|||||
|
Thomas L. Ryan
|
52
|
|
Chairman of the Board and Chief Executive Officer
|
1999
|
||||
|
Michael R. Webb
|
59
|
|
President and Chief Operating Officer
|
1998
|
||||
|
Eric D. Tanzberger
|
49
|
|
Senior Vice President, Chief Financial Officer
|
2000
|
||||
|
Gregory T. Sangalis
|
62
|
|
Senior Vice President, General Counsel and Secretary
|
2007
|
||||
|
Elisabeth G. Nash
|
56
|
|
Senior Vice President, Operations Services
|
2004
|
||||
|
Sumner J. Waring, III
|
49
|
|
Senior Vice President, Operations
|
2002
|
||||
|
Steven A. Tidwell
|
56
|
|
Senior Vice President, Sales and Merchandising
|
2010
|
||||
|
Tammy R. Moore
|
50
|
|
Vice President and Corporate Controller
|
2010
|
||||
|
R. L. Waltrip
|
87
|
|
Founder and Chairman Emeritus
|
1962
|
||||
Mr. Ryan was elected Chairman of the Board of SCI effective in January 2016 and, previously, he had been appointed Chief Executive Officer in February 2005. He joined the Company in 1996 and served in a variety of financial management
17
roles until November 2000, when he was asked to serve as Chief Executive Officer of European Operations based in Paris, France. In July 2002, Mr. Ryan returned to the United States where he was appointed President and Chief Operating Officer of SCI. Before joining SCI, Mr. Ryan was a certified public accountant with Coopers & Lybrand LLP for eight years. He holds a bachelor's degree in business administration from the University of Texas at Austin. Mr. Ryan serves as a member of the Board of Trustees of the United Way of Greater Houston. Mr. Ryan also serves on the Board of Directors of the Greater Houston Partnership, the Greater Houston Community Foundation Governing Council, the Board of Directors of Genesys Works, and the University of Texas McCombs Business School Advisory Council. Mr. Ryan is a member of the Board of Trust Managers of Weingarten Realty Investors (NYSE: WRI) and serves as a director of Chesapeake Energy (NYSE: CHK).
Mr. Webb was elected President and Chief Operating Officer of Service Corporation International in February 2016. Prior to that, he served as Executive Vice President and Chief Operating Officer beginning in February 2005. Mr. Webb joined the Company in 1991 when SCI acquired Arlington Corp., a regional funeral and cemetery consolidator, where he served as Chief Financial Officer. In 1993, Mr. Webb joined the Company's corporate development group, which he later led on a global basis. Prior to joining Arlington Corp., Mr. Webb held various executive financial and development roles at Days Inns of America and Telemundo Group Inc. He holds a bachelor's degree in business administration from the University of Georgia.
Mr. Tanzberger was appointed Senior Vice President and Chief Financial Officer in June 2006 and also served as Treasurer from July 2007 to February 2017. Mr. Tanzberger joined the Company in August 1996 and held various management positions prior to being promoted to Corporate Controller in August 2002. Before joining SCI, Mr. Tanzberger served as Assistant Corporate Controller at Kirby Marine Transportation Corp., an inland waterway barge and tanker company. He was also a certified public accountant with Coopers and Lybrand LLP. Mr. Tanzberger holds a bachelor's degree in business administration from the University of Notre Dame. He is a member of the Executive Committee of the Business Council of New Orleans and also serves on the Board of Directors of New Orleans Medical Mission Services. Additionally, he is a member of the Board of Trustees for the National Funeral Directors Association Funeral Service Foundation.
Mr. Sangalis joined the Company in 2007 as Senior Vice President, General Counsel and Secretary. In 2012, his responsibilities were expanded to include Human Resources. He previously served as Senior Vice President, Law and Administration for Team Inc., a leading provider of specialty industrial maintenance and construction services. Prior to that, Mr. Sangalis served as Managing Director and General Counsel of Main Street Equity Ventures II, a private equity investment firm, and as Senior Vice President, General Counsel and Secretary for Waste Management Inc., a leading provider of waste management services in North America. Mr. Sangalis holds a bachelor's degree in finance from Indiana University and a master's degree in business administration from the University of Minnesota. He earned his juris doctorate from the University of Minnesota Law School, where he graduated Cum Laude.
Ms. Nash was named Senior Vice President of Operations Services in 2010 and is currently responsible for a variety of support functions, including information technology, supply chain, centralized operations, and program management. Prior to that she was Vice President of Process Improvement and Technology, where she led the redefinition of our field and home office processes and systems. Before joining SCI, Ms. Nash served in various senior management accounting and financial positions with Pennzoil Corp. She holds a bachelor's degree in business administration in accounting from Texas A&M University.
Mr. Waring, Senior Vice President, is responsible for North American Operations. He joined SCI in 1996 as Area Vice President of Operations when SCI acquired his family's funeral business. He was appointed President of the Northeast Region in 1999 and President of the Pacific Region in September 2001. In September 2002, Mr. Waring was appointed Vice President, Western Operations, a position he held until May 2004 when he was appointed Vice President, Major Market Operations. He was promoted to Senior Vice President in 2006. In May 2015, Mr. Waring's responsibilities were expanded to include all operations in North America. Mr. Waring holds a bachelor's degree in business administration from Stetson University, a degree in mortuary science from Mount Ida College, and a master's degree in business administration from the University of Massachusetts Dartmouth. Mr. Waring serves on the Board of Directors of BankFive and the Board of Trustees of Tabor Academy.
Mr. Tidwell joined SCI as Vice President, Main Street Market Operations, in March 2010 and was promoted to Senior Vice President of Sales and Merchandising in 2012. As a co-founder of Keystone North America, Inc., Mr. Tidwell served as its President and Chief Executive Officer from May 2007 until it was acquired by SCI in March 2010. In his role, Mr. Tidwell worked closely with Keystone's Senior Leadership Team to develop and implement organic growth strategies as well as external growth and acquisition strategies. He began his career as a licensed funeral director and embalmer in Nashville, Tennessee, and has been actively involved in the funeral, and cemetery profession for thirty-five years. He holds an associate of arts degree from John A. Gupton College and has attended Executive Management and Leadership programs at the Harvard Business School, Vanderbilt University Owen Graduate School of Management, and the Center for Creative Leadership.
Mrs. Moore joined the Company in August 2002 as Manager of Financial Reporting. She was promoted to Director of Financial Reporting in 2004 and Managing Director and Assistant Controller in June 2006. In February 2010, she was promoted to Vice President and Corporate Controller and oversees trust, general accounting, internal and external reporting,
18
customer service, and strategic planning and analysis. Prior to joining the Company, Mrs. Moore was a certified public accountant with PricewaterhouseCoopers LLP. She holds a bachelor's degree in business administration in accounting from the University of Texas at San Antonio.
Mr. Waltrip was appointed the Founder and Chairman Emeritus of SCI effective in January 2016. Prior thereto, he was Chairman of the Board and provided invaluable leadership to the Company for over 50 years. A licensed funeral director, Mr. Waltrip grew up in his family's funeral business and assumed management of the firm in the 1950s. He began buying additional funeral service locations in the 1960s and achieved significant cost efficiencies through the “cluster” strategy of sharing pooled resources among numerous locations. At the end of 2017, the network he began had grown to include almost 2,000 funeral service locations and cemeteries. Mr. Waltrip took SCI public in 1969. Mr. Waltrip holds a bachelor's degree in business administration from the University of Houston.
|
Item 4.
|
Mine Safety Disclosures.
|
Not applicable.
|
Item 5.
|
Market for Registrant's Common Equity, Related Stockholder Matters, and Issuer Purchases of Equity Securities
|
Our common stock has been traded on the New York Stock Exchange since May 14, 1974. On
December 31, 2017
, there were
4,010
holders of record of our common stock. In calculating the number of stockholders, we consider clearing agencies and security position listings as one stockholder for each agency or listing. At
December 31, 2017
, we had
186,614,747
shares outstanding, net of
5,320,900
treasury shares.
In
2017
and
2016
we paid quarterly cash dividends totaling
$108.8 million
and
$98.4 million
, respectively. While we intend to pay regular quarterly cash dividends for the foreseeable future, all subsequent dividends are subject to limitations in our debt covenants and final determination by our Board of Directors each quarter after its review of our financial performance.
The table below shows our quarterly high and low closing common stock prices for the two years ended December 31:
|
|
2017
|
2016
|
|||||||||||||
|
|
High
|
Low
|
High
|
Low
|
|||||||||||
|
First quarter
|
$
|
31.75
|
|
$
|
28.81
|
|
$
|
25.66
|
|
$
|
21.65
|
|
|||
|
Second quarter
|
$
|
33.45
|
|
$
|
30.25
|
|
$
|
28.01
|
|
$
|
24.49
|
|
|||
|
Third quarter
|
$
|
35.80
|
|
$
|
32.99
|
|
$
|
28.67
|
|
$
|
25.99
|
|
|||
|
Fourth quarter
|
$
|
38.00
|
|
$
|
33.29
|
|
$
|
28.62
|
|
$
|
24.90
|
|
|||
Options in our common stock are primarily traded on the Boston Exchange, the Chicago Board Options Exchange, Philadelphia Stock Exchange, and the NASDAQ Options Market. Our common stock is traded on the New York Stock Exchange under the symbol SCI.
Stock Performance Graph.
The following graph assumes the total return on $100 invested on December 31, 2012, in SCI Common Stock, the S&P 500 Index, and a peer group selected by the Company (the “Peer Group”). The Peer Group comprises Carriage Services, Inc., Hillenbrand Inc., and Matthews International Corp. Stewart Enterprises, Inc. was included in the Peer Group until December 31, 2013 when it was acquired by us. Total return data assumes reinvestment of dividends.
19
TOTAL STOCKHOLDER RETURNS
INDEXED RETURNS
Years Ending
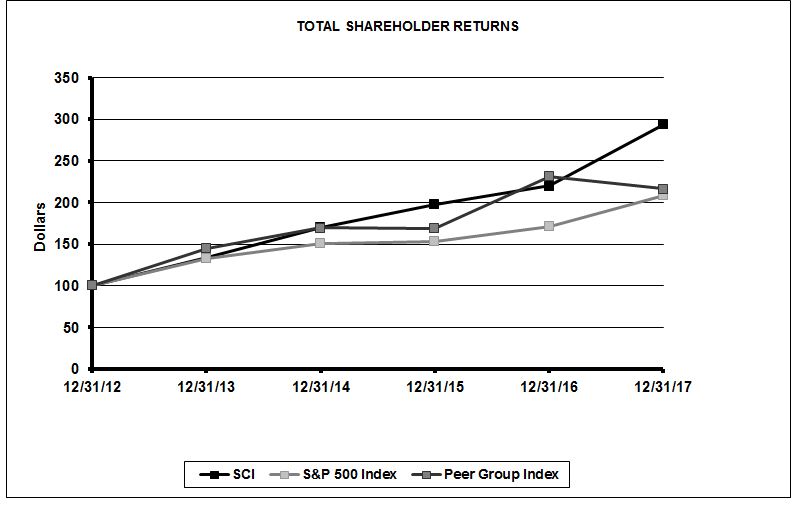
For equity compensation plan information, see Part III of this Form 10-K.
Under our share repurchase program, during the year ended
December 31, 2017
, we repurchased
6,210,606
shares at an aggregate cost of
$199.6 million
, which is an average cost per share of
$32.14
. During the year ended
December 31, 2016
, we repurchased
8,811,847
shares at an aggregate cost of
$227.9 million
, which is an average cost per share of
$25.87
.
In November
2016
, our Board of Directors increased our share repurchase authorization to
$400.0 million
. The remaining dollar value of shares authorized to be purchased under the share repurchase program was
$168.6 million
at
December 31, 2017
. As discussed in Item 1A, our Bank Credit Facility contains covenants that may restrict our ability to repurchase our common stock.
|
Period
|
Total Number of
Shares Purchased |
Average
Price Paid per Share |
Total Number
of Shares Purchased as Part of Publicly Announced Programs |
Dollar Value of
Shares That May Yet be Purchased Under the Program |
||||||||||
|
October 1, 2017 — October 31, 2017
|
476,613
|
|
$
|
34.41
|
|
476,613
|
|
$
|
202,998,778
|
|
||||
|
November 1, 2017 — November 30, 2017
|
399,783
|
|
$
|
35.54
|
|
399,783
|
|
188,792,046
|
|
|||||
|
December 1, 2017 — December 31, 2017
|
540,575
|
|
$
|
37.39
|
|
540,575
|
|
168,578,718
|
|
|||||
|
1,416,971
|
|
1,416,971
|
|
|||||||||||
Subsequent to
December 31, 2017
, we repurchased
429,859
shares for
$16.7 million
at an average cost per share of
$38.83
. In February 2018, our Board of Directors increased our repurchase authorization for up to
$400.0 million
.
|
Item 6.
|
Selected Financial Data.
|
The data set forth below should be read in conjunction with our consolidated financial statements and accompanying notes to these consolidated financial statements. This historical information is not necessarily indicative of future results. The table below contains selected consolidated financial data as of and for the years ended
December 31, 2013
through
December 31, 2017
.
20
|
|
|||||||||||||||||||
|
|
Years Ended December 31,
|
||||||||||||||||||
|
|
2017
|
2016
|
2015
|
2014
|
2013
|
||||||||||||||
|
|
(Dollars in millions, except per share amounts)
|
||||||||||||||||||
|
Selected Consolidated Statements of Operations Data:
|
|
|
|
|
|
|
|||||||||||||
|
Revenue
|
$
|
3,095.0
|
|
$
|
3,031.1
|
|
$
|
2,986.0
|
|
$
|
2,994.0
|
|
$
|
2,550.5
|
|
||||
|
Income from continuing operations
|
$
|
546.8
|
|
$
|
177.3
|
|
$
|
235.3
|
|
$
|
176.6
|
|
$
|
155.2
|
|
||||
|
Net income
|
$
|
546.8
|
|
$
|
177.3
|
|
$
|
234.9
|
|
$
|
178.8
|
|
$
|
152.6
|
|
||||
|
Net income attributable to noncontrolling interests
|
(0.2
|
)
|
(0.3
|
)
|
(1.2
|
)
|
(6.3
|
)
|
(5.3
|
)
|
|||||||||
|
Net income attributable to common stockholders
|
$
|
546.7
|
|
$
|
177.0
|
|
$
|
233.8
|
|
$
|
172.5
|
|
$
|
147.3
|
|
||||
|
Earnings per share:
|
|
|
|
|
|
|
|
|
|||||||||||
|
Income from continuing operations attributable to common stockholders
|
|||||||||||||||||||
|
Basic
|
$
|
2.91
|
|
$
|
0.92
|
|
$
|
1.17
|
|
$
|
0.81
|
|
$
|
0.70
|
|
||||
|
Diluted
|
$
|
2.84
|
|
$
|
0.90
|
|
$
|
1.14
|
|
$
|
0.80
|
|
$
|
0.68
|
|
||||
|
Net income attributable to common stockholders
|
|||||||||||||||||||
|
Basic
|
$
|
2.91
|
|
$
|
0.92
|
|
$
|
1.17
|
|
$
|
0.82
|
|
$
|
0.70
|
|
||||
|
Diluted
|
$
|
2.84
|
|
$
|
0.90
|
|
$
|
1.14
|
|
$
|
0.81
|
|
$
|
0.68
|
|
||||
|
Cash dividends declared per share
|
$
|
0.58
|
|
$
|
0.51
|
|
$
|
0.44
|
|
$
|
0.34
|
|
$
|
0.27
|
|
||||
|
Selected Consolidated Balance Sheet Data (at December 31):
|
|
|
|
|
|||||||||||||||
|
Total assets
|
$
|
12,864.5
|
|
$
|
12,038.1
|
|
$
|
11,676.4
|
|
$
|
11,923.6
|
|
$
|
12,833.6
|
|
||||
|
Long-term debt (less current maturities), including capital leases
|
$
|
3,135.3
|
|
$
|
3,196.6
|
|
$
|
3,037.6
|
|
$
|
2,963.8
|
|
$
|
3,125.5
|
|
||||
|
Equity
|
$
|
1,409.4
|
|
$
|
1,095.2
|
|
$
|
1,189.4
|
|
$
|
1,377.4
|
|
$
|
1,480.2
|
|
||||
|
Selected Consolidated Statement of Cash Flows Data:
|
|||||||||||||||||||
|
Net cash provided by operating activities
|
$
|
502.3
|
|
$
|
463.6
|
|
$
|
472.2
|
|
$
|
317.4
|
|
$
|
384.7
|
|
||||
|
Item 7.
|
Management’s Discussion and Analysis of Financial Condition and Results of Operations.
|
The Company
We are North America’s largest provider of deathcare products and services, with a network of funeral service locations and cemeteries unequaled in geographic scale and reach. At
December 31, 2017
, we operated
1,488
funeral service locations and
473
cemeteries (including
281
funeral service/cemetery combination locations), which are geographically diversified across
45
states,
eight
Canadian provinces, the District of Columbia, and Puerto Rico. Our funeral service and cemetery operations consist of funeral service locations, cemeteries, funeral service/cemetery combination locations, crematoria, and various other related businesses. We sell cemetery property and funeral and cemetery merchandise and services at the time of need and on a preneed basis.
Our financial position is enhanced by our
$10.7 billion
backlog of future revenue from both trust and insurance-funded preneed funeral and cemetery sales at
December 31, 2017
. Preneed selling provides us with a current opportunity to lock-in future market share while deterring the customer from going to a competitor in the future. We also believe it adds to the stability and predictability of our revenue and cash flows. While revenue on the majority of preneed merchandise and service sales is deferred until the time of need, sales of preneed cemetery property provide opportunities for full current revenue recognition (to the extent we collect 10% from the customer and the property is developed and available for interment).
We have adequate liquidity and a favorable debt maturity profile, which allows us to return capital to shareholders through share repurchases and dividends.
Factors affecting our operating results include: demographic trends in terms of population growth and average age, which impact death rates and number of deaths; establishing and maintaining leading market share positions supported by strong local heritage and relationships; effectively responding to increasing cremation trends by selling complementary services and merchandise; controlling salary and merchandise costs; and exercising pricing leverage related to our at-need revenue. The average revenue per funeral contract is influenced by the mix of traditional and cremation services because our average cremation service revenue is approximately half of the average revenue earned from a traditional burial service. To further enhance revenue opportunities, we have developed memorialization merchandise and services that specifically appeal to
21
cremation customers. We believe that these additional merchandise and services will help drive increases in the average revenue for a cremation in future periods.
For further discussion of our key operating metrics, see our Results of Operations and Cash Flow sections below.
Financial Condition, Liquidity, and Capital Resources
Capital Allocation Considerations
We rely on cash flow from operations as a significant source of liquidity. Our cash flow from operating activities provided
$502.3 million
in
2017
. In addition, as of
December 31, 2017
, we have
$966.7 million
in excess borrowing capacity under our Bank Credit Facility. As of
December 31, 2017
, we have
$337.3 million
in long-term debt current maturities, which primarily consist of current amounts due on the publicly traded notes, term loan, and capital leases. Our publicly traded note for
$250.0 million
, due in October 2018, was redeemed on January 12, 2018.
Our Bank Credit Facility requires us to maintain certain leverage and interest coverage ratios. As of
December 31, 2017
, we were in compliance with all of our debt covenants. Our financial covenant requirements and actual ratios as of
December 31, 2017
are as follows:
|
|
Per Credit Agreement
|
Actual
|
||
|
Leverage ratio
|
4.50 (Max)
|
3.72
|
|
|
|
Interest coverage ratio
|
3.00 (Min)
|
5.22
|
|
|
We believe our sources of liquidity can be supplemented by our ability to access the capital markets for additional debt or equity securities. In December 2017, we entered into a new
$1.7 billion
bank credit agreement due December 2022 with a syndicate of banks. The credit agreement consists of a
$1.0 billion
Bank Credit Facility and a
$675.0 million
Term Loan. We used
$675.0 million
of the Term Loan due December 2022 and
$442.5 million
of the Bank Credit Facility due December 2022 to repay
$647.5 million
outstanding borrowings on the Term Loan due March 2021 and
$470 million
outstanding borrowings on the Bank Credit Facility due March 2021. In December 2017, we issued
$550.0 million
unsecured 4.625% Senior Notes Due December 2027. We used the net proceeds from this offering to pay off the
$442.5 million
outstanding borrowings of the Bank Credit Facility due December 2022.
We believe we have the financial strength and flexibility to reward shareholders through share repurchases and dividends while maintaining a prudent capital structure and pursuing new opportunities for profitable growth.
We believe that our unencumbered cash on hand, future operating cash flows, and the available capacity under our bank credit agreement will give us adequate liquidity to meet our short-term needs as well as our long-term financial obligations. Due to cash balances residing in Canada and expected minimum operating cash in transit, a portion of our cash on hand is encumbered.
We consistently evaluate the best uses of our cash flow that will yield the highest value and return on capital. Our capital deployment strategy is prioritized as follows:
Invest in Acquisitions and New Builds.
We intend to make acquisitions of funeral service locations and cemeteries when pricing and terms are favorable. We expect an acquisition investment to earn an after-tax cash return that is in excess of our weighted average cost of capital with room for execution risk. We will also invest in the construction of additional funeral service locations. We target businesses with favorable customer categories and/or where we can achieve additional economies of scale.
Pay a Dividend.
Our quarterly dividend rate has steadily grown from
$0.025
per common share in 2005 to
$0.15
per common share at the end of 2017, a
15%
increase over the
$0.13
per common share at the end of 2016. We target a payout ratio of 30% to 40% of earnings excluding special items and intend to grow our cash dividend commensurate with the growth in our business. While we intend to pay regular quarterly cash dividends for the foreseeable future, all future dividends are subject to limitations in our debt covenants and final determination by our Board of Directors each quarter upon review of our financial performance.
Repurchase Shares.
Absent a strategic acquisition opportunity, we believe share repurchases are attractive at the appropriate price. During the year ended
December 31, 2017
, we repurchased
6,210,606
shares of common stock at an aggregate cost of
$199.6 million
, which is an average cost per share of
$32.14
. After these repurchases, the remaining dollar value of shares authorized to be purchased under our share repurchase program was
$168.6 million
at
December 31, 2017
. We intend to make purchases from time to time in the open market or through privately negotiated transactions, subject to market conditions, debt covenants, and normal trading restrictions. Our Bank Credit Facility contains covenants that limit our ability to repurchase our common stock. There can be no assurance that we will buy our common stock under our repurchase program in the future.
22
Repurchase Debt.
We will seek to make open market debt repurchases when it is opportunistic to do so relative to other capital deployment opportunities to manage our near-term debt maturity profile. We have a relatively consistent annual cash flow stream that is generally resistant to down economic cycles. This cash flow stream and our significant liquidity is available to substantially reduce our long-term debt maturities should we choose to do so. Furthermore, our capital expenditures are generally discretionary in nature and can be managed based on the availability of operating cash flow.
Cash Flow
We believe our ability to generate strong operating cash flow is one of our fundamental financial strengths and provides us with substantial flexibility in meeting operating and investing needs.
Operating Activities
Net cash provided by operating activities was $
502.3 million
, $
463.6 million
, and $
472.2 million
for the years ended
December 31, 2017
,
2016
, and
2015
respectively.
Included in operating cash flows are the following:
|
Years Ended December 31,
|
|||||||||||
|
2017
|
2016
|
2015
|
|||||||||
|
(In millions)
|
|||||||||||
|
Excess tax benefits from share-based awards
(1)
|
$
|
—
|
|
$
|
(12.7
|
)
|
$
|
(18.1
|
)
|
||
|
Payments related to tax structure changes
|
$
|
—
|
|
$
|
—
|
|
$
|
(10.5
|
)
|
||
|
Premiums paid on early extinguishment of debt
|
$
|
—
|
|
$
|
(20.5
|
)
|
$
|
(6.5
|
)
|
||
|
Acquisition, integration, and system transition costs
|
$
|
—
|
|
$
|
(11.7
|
)
|
$
|
(6.6
|
)
|
||
|
IRS tax settlement
(2)
|
$
|
(34.2
|
)
|
$
|
—
|
|
$
|
—
|
|
||
|
Pension settlement payment
|
$
|
(6.3
|
)
|
$
|
—
|
|
$
|
—
|
|
||
|
Legal settlement, net of insurance recoveries
|
$
|
(11.5
|
)
|
$
|
—
|
|
$
|
—
|
|
||
(1)
See discussion regarding the change in accounting treatment for excess tax benefits from share-based awards in Part II, Item 8. Financial Statements, Note 2.
(2)
See discussion regarding the IRS tax settlement in Part II, Item 8. Financial Statements, Note 5.
Excluding the above items, cash flow from operations increased $
45.8 million
for
2017
versus
2016
and decreased $5.4 million for
2016
versus
2015
. The
2017
increase comprises:
|
•
|
a $
74.4 million
increase in cash receipts from customers, and
|
|
•
|
a $
19.2 million
increase in net trust withdrawals, and
|
|
•
|
a
$6.3 million
increase in insurance proceeds; partially offset by
|
|
•
|
a
$5.3 million
decrease in General Agency (GA) and other receipts,
|
|
•
|
a $
23.4 million
increase in employee compensation,
|
|
•
|
a $
20.0 million
increase in cash tax payments primarily due to deferral from the previous quarter as part of hurricane relief (excluding the IRS tax settlement noted above),
|
|
•
|
a $
3.9 million
increase in cash interest paid, and
|
|
•
|
a
$1.5 million
increase in vendor and other payments.
|
The
2016
decrease comprises:
•
a $19.7 million increase in cash tax payments,
|
•
|
a $15.9 million increase in employee compensation, and
|
|
•
|
a $21.9 million increase in net trust deposits; partially offset by
|
|
•
|
a $29.9 million decrease in vendor and other payments,
|
|
•
|
a $7.8 million decrease in cash interest paid, and
|
|
•
|
a $14.4 million increase in cash receipts from customers.
|
Investing Activities
23
Cash flows from investing activities used
$235.9 million
, $
216.1 million
, and
$166.4 million
in
2017
,
2016
, and
2015
, respectively. The
$19.8 million
increase from
2017
over
2016
is primarily due to the following:
•
a
$21.1 million
increase in capital expenditures,primarily due to improvements at existing funeral homes,
•
a
$19.2 million
decrease in cash spent on acquisitions, and
•
a
$5.0 million
decrease in net withdrawals of restricted funds, partially offset by
|
•
|
a
$12.9 million
decrease in cash receipts from divestitures and asset sales.
|
The
$49.7 million
increase from
2016
over
2015
is primarily due to the following:
|
•
|
a
$42.5 million
increase in capital expenditures, primarily related to the development of contemporary cemetery property and the construction of new funeral homes,
|
|
•
|
a
$27.9 million
increase in cash spent on acquisitions; partially offset by
|
|
•
|
a
$24.5 million
increase in proceeds from divestitures and asset sales.
|
Financing Activities
Financing activities used
$136.4 million
in
2017
compared to using
$188.9 million
in
2016
and
$338.5 million
in
2015
. The
$52.5 million
decrease from
2017
over
2016
is primarily due to:
|
•
|
a
$28.3 million
decrease in purchase of Company common stock,
|
|
•
|
a
$26.8 million
increase in proceeds from the issuance of debt, net of payments, and
|
|
•
|
a
$15.9 million
increase in proceeds from exercises of stock options; partially offset by
|
|
•
|
a
$12.7 million
decrease in excess tax benefits from share-based awards (Part II, Item 8. Financial Statements, Note 2),
|
|
•
|
a
$10.3 million
increase in payments of dividends, and
|
|
•
|
a
$2.6 million
increase in purchases of noncontrolling interests to acquire the remaining 11% of the common stock of our consolidated subsidiary, Wilson Financial Group, Inc.
|
The
$149.6 million
decrease from
2016
over
2015
is primarily due to:
|
•
|
a
$117.3 million
decrease in purchase of Company common stock, and
|
|
•
|
a
$56.1 million
increase in proceeds from the issuance of debt, net of payments; partially offset by
|
|
•
|
a
$14.1 million
decrease in proceeds from exercises of stock options
|
|
•
|
a
$10.8 million
increase in payments of dividends, and
|
|
•
|
a
$5.4 million
decrease in excess tax benefits from share-based awards.
|
Off-Balance Sheet Arrangements, Contractual Obligations, and Commercial and Contingent Commitments
We have assumed various financial obligations and commitments in the ordinary course of conducting our business. We have contractual obligations requiring future cash payments under existing contractual arrangements, such as debt maturities, interest on long-term debt, operating lease agreements, and employment, consulting, and non-competition agreements. We also have commercial and contingent obligations that result in cash payments only if certain events occur requiring our performance pursuant to a funding commitment.
24
The following table details our known future cash payments (on an undiscounted basis) related to various contractual obligations as of
December 31, 2017
.
|
|
Payments Due by Period
|
|||||||||||||||||||
|
Contractual Obligations
|
2018
|
2019-2020
|
2021-2022
|
Thereafter
|
Total
|
|||||||||||||||
|
|
|
(In millions)
|
|
|||||||||||||||||
|
Debt maturities (including capital leases)
(1) (2) (3)
|
$
|
342.8
|
|
$
|
335.1
|
|
$
|
1,193.1
|
|
$
|
1,632.3
|
|
$
|
3,503.3
|
|
|||||
|
Interest obligation on long-term debt
(4)
|
160.1
|
|
288.8
|
|
226.2
|
|
264.4
|
|
939.5
|
|
||||||||||
|
Operating lease agreements
(5)
|
13.7
|
|
20.3
|
|
16.1
|
|
59.5
|
|
109.6
|
|
||||||||||
|
Employment and management, consulting, and non-competition agreements
(6)
|
7.4
|
|
10.9
|
|
5.3
|
|
4.2
|
|
27.8
|
|
||||||||||
|
Benefit cost obligation
(7)
|
3.3
|
|
5.9
|
|
4.8
|
|
9.4
|
|
23.4
|
|
||||||||||
|
Total contractual obligations
|
$
|
527.3
|
|
$
|
661.0
|
|
$
|
1,445.5
|
|
$
|
1,969.8
|
|
$
|
4,603.6
|
|
|||||
|
(1)
|
Our outstanding indebtedness contains standard provisions, such as payment delinquency default clauses and change of control clauses. In addition, our Bank Credit Facility contains a maximum leverage ratio and a minimum interest coverage ratio. See “Capital Allocation Considerations” and Note 6 in Part II, Item 8. Financial Statements and Supplementary Data, for additional details related to our long-term debt.
|
|
(2)
|
Excludes non-cash net premiums and original issuance discounts recorded on the debt. The unamortized balance of the net premiums and original issuance discounts at
December 31, 2017
is $
7.5 million
.
|
|
(3)
|
Excludes non-cash debt issuance costs on the debt. The unamortized balance of debt issuance costs at
December 31, 2017
is $
38.1 million
.
|
|
(4)
|
Approximately
75%
of our total debt is fixed rate debt for which the interest obligation was calculated at the stated rate. Future interest obligations on our floating rate debt are based on the current forward rate curve of the underlying index. See Note 6 in Part II, Item 8. Financial Statements and Supplementary Data, for additional information related to our future interest obligations.
|
|
(5)
|
The majority of our lease arrangements contain options to i) purchase the property at fair value on the exercise date, ii) purchase the property for a value determined at the inception of the leases, or iii) renew for the fair rental value at the end of the primary lease term. Our operating leases primarily relate to funeral and cemetery operating and maintenance equipment. See Note 8 in Part II, Item 8. Financial Statements and Supplementary Data, for additional details related to our leases.
|
|
(6)
|
We have entered into employment and management, consulting, and non-competition agreements that require us to make cash payments over the contractual period. The agreements have been primarily entered into with certain officers and employees and former owners of businesses acquired. Agreements with contractual periods less than one year are excluded. See Note 8 in Part II, Item 8. Financial Statements and Supplementary Data, for additional details related to these agreements.
|
|
(7)
|
See Note 11 in Part II, Item 8. Financial Statements and Supplementary Data, for discussion of our pension plans.
|
The following table details our known potential or possible future cash payments (on an undiscounted basis) related to various commercial and contingent obligations as of
December 31, 2017
.
|
|
Expiration by Period
|
|||||||||||||||||||
|
Commercial and Contingent Obligations
|
2018
|
2019-2020
|
2021-2022
|
Thereafter
|
Total
|
|||||||||||||||
|
|
|
(In millions)
|
|
|||||||||||||||||
|
Surety obligations
(1)
|
$
|
166.0
|
|
$
|
—
|
|
$
|
—
|
|
$
|
—
|
|
$
|
166.0
|
|
|||||
|
Long-term obligations related to uncertain tax positions
(2)
|
90.6
|
|
—
|
|
—
|
|
—
|
|
90.6
|
|
||||||||||
|
Letters of credit
(3)
|
33.5
|
|
—
|
|
—
|
|
—
|
|
33.5
|
|
||||||||||
|
Total commercial and contingent obligations
|
$
|
290.1
|
|
$
|
—
|
|
$
|
—
|
|
$
|
—
|
|
$
|
290.1
|
|
|||||
|
(1)
|
Represents the aggregate funding obligation associated with our surety bond arrangements assuming our surety partners did not renew any of our surety obligations and we could not find replacement surety assurance. See the section titled “Financial Assurances” following this table in this Form 10-K for more information related to our surety bonds.
|
|
(2)
|
We have recorded a liability for unrecognized tax benefits and related interest and penalties of $
90.6 million
as of
December 31, 2017
. See Note 5 in Part II, Item 8. Financial Statements and Supplementary Data, for additional information related to our uncertain tax positions.
|
|
(3)
|
We are occasionally required to post letters of credit, issued by a financial institution, to secure certain insurance programs or other obligations. Letters of credit generally authorize the financial institution to make a payment to the beneficiary upon the satisfaction of a certain event or the failure to satisfy an obligation. The letters of credit are generally posted for one-year terms and are usually automatically renewed upon maturity until such time as we have satisfied the commitment secured by the letter of credit. We are
|
25
obligated to reimburse the issuer only if the beneficiary collects on the letter of credit. We believe it is unlikely we will be required to fund a claim under our outstanding letters of credit. As of
December 31, 2017
,
$33.3 million
of our letters of credit were supported by our Bank Credit Facility, which expires in December 2022.
Not included in the above table are potential funding obligations related to our merchandise and service trusts. In certain states and provinces, we have withdrawn allowable distributable earnings including unrealized gains prior to the maturity or cancellation of the related contract. Additionally, some states have laws that either require replenishment of investment losses under certain circumstances or impose various restrictions when trust fund values drop below certain prescribed amounts. In the event that our trust investments do not recover from market declines, we may be required to deposit portions or all of these amounts into the respective trusts in some future period. As of
December 31, 2017
, we had unrealized losses of
$15.0 million
in the various trusts within these states.
Financial Assurances
In support of our operations, we have entered into arrangements with certain surety companies whereby such companies agree to issue surety bonds on our behalf as financial assurance and/or as required by existing state and local regulations. The surety bonds are used for various business purposes; however, the majority of the surety bonds issued and outstanding have been used to support our preneed sales activities. The obligations underlying these surety bonds are recorded on our Consolidated Balance Sheet as
Deferred revenue.
The breakdown of surety bonds between funeral and cemetery preneed arrangements, as well as surety bonds for other activities, is described below.
|
December 31, 2017
|
December 31, 2016
|
||||||
|
|
(In millions)
|
||||||
|
Preneed funeral
|
$
|
109.8
|
|
$
|
118.6
|
|
|
|
Preneed cemetery:
|
|
|
|
|
|||
|
Merchandise and services
|
132.2
|
|
141.6
|
|
|||
|
Pre-construction
|
11.9
|
|
7.8
|
|
|||
|
Bonds supporting preneed funeral and cemetery obligations
|
253.9
|
|
268.0
|
|
|||
|
Bonds supporting preneed business permits
|
4.5
|
|
4.5
|
|
|||
|
Other bonds
|
18.0
|
|
18.4
|
|
|||
|
Total surety bonds outstanding
|
$
|
276.4
|
|
$
|
290.9
|
|
|
When selling preneed contracts, we may post surety bonds where allowed by state law. We post the surety bonds in lieu of trusting a certain amount of funds received from the customer. The
$253.9 million
in bonds supporting preneed funeral and cemetery obligations differs from the
$166.0 million
potential funding obligation disclosed in our “Commercial and Contingent Obligations” table above because the amount of the bond posted is generally determined by the total amount of the preneed contract that would otherwise be required to be trusted, in accordance with applicable state law, at the time we enter into the contract. We would only be required to fund the trust for the portion of the preneed contract for which we have received payment from the customer, less any applicable retainage, in accordance with state law. For the years ended
December 31, 2017
,
2016
, and 2015, we had $22.6 million, $20.9 million, and $19.6 million of cash receipts from sales attributable to bonded contracts. These amounts do not consider reductions associated with taxes, obtaining costs, or other costs.
Surety bond premiums are paid annually and the bonds are automatically renewable until maturity of the underlying preneed contracts, unless we are given prior notice of cancellation. Except for cemetery pre-construction bonds (which are irrevocable), the surety companies generally have the right to cancel the surety bonds at any time with appropriate notice. In the event a surety company were to cancel the surety bond, we are required to obtain replacement surety assurance from another surety company or fund a trust for an amount generally less than the posted bond amount. Management does not expect that we will be required to fund material future amounts related to these surety bonds due to a lack of surety capacity or surety company non-performance.
Preneed Activities and Backlog of Contracts
In addition to selling our products and services to client families at the time of need, we sell price-guaranteed preneed contracts, which provide for future funeral or cemetery merchandise and services. Since preneed funeral and cemetery merchandise or services will generally not be provided until sometime in the future, most states and provinces require that all or a portion of the funds collected from customers on preneed contracts be paid into merchandise and service trusts until the merchandise is delivered or the service is performed. In certain situations, as described above, where permitted by state or provincial laws, we post a surety bond as financial assurance for a certain amount of the preneed contract in lieu of placing
26
funds into trust accounts. Where permitted by state or provincial law, customers may arrange their preneed contract by purchasing a life insurance or annuity policy from third-party insurance companies.
Trust-funded Preneed Contracts:
The funds collected from customers are deposited into trust and primarily invested by independent trustees in accordance with state and provincial laws. We retain any funds above the amounts required to be deposited into trust accounts and use them for working capital purposes, generally to offset the selling and administrative costs of our preneed programs.
Investment earnings associated with the trust investments are expected to mitigate the inflationary costs of providing the preneed funeral and cemetery merchandise and services in the future for the prices that were guaranteed at the time of sale. Our preneed funeral and cemetery trust assets are consolidated and recorded in our Consolidated Balance Sheet at fair value. Investment earnings on trust assets are generally accumulated in the trust and distributed as the revenue associated with the preneed funeral or cemetery contract is recognized or canceled by the customer. In certain states and provinces, the trusts are
allowed to distribute a portion of the investment earnings to us prior to that date.
If a preneed contract is canceled prior to delivery, state or provincial law determines the amount of the refund owed to the customer, if any, including the amount of the attributed investment earnings. Upon cancellation, we receive the amount of principal deposited to trust and previously undistributed net investment earnings and, where required, issue a refund to the customer. We retain excess funds, if any, and recognize the attributed investment earnings (net of any investment earnings payable to the customer) as trust fund income revenue in our Consolidated Statement of Operations. In certain jurisdictions, we
may be obligated to fund any shortfall if the amounts deposited by the customer exceed the funds in trust. Funds in trust assets exceeded customer deposits at
December 31, 2017
. See Off-Balance Sheet Arrangements, Contractual Obligations, and Commercial and Contingent Commitments for additional information about potential funding obligations related to our merchandise and service trusts. Based on our historical experience, we have included a cancellation reserve for preneed contracts in our Consolidated Balance Sheet of
$118.1 million
and
$116.9 million
as of
December 31, 2017
and
2016
,
respectively.
While the contract is outstanding, cash flow is provided by the amount retained from funds collected from the customer and any distributed investment earnings. At the time of death maturity, we receive the principal and undistributed investment earnings from the funeral trust and any remaining receivable due from the customer. At the time of delivery or storage of cemetery merchandise and service items for which we were required to deposit funds to trust, we receive the principal and undistributed investment earnings from the cemetery trust and any remaining receivable due from the customer. This cash flow at the time of service, delivery, or storage is generally less than the associated revenue recognized, thus reducing cash flow from operating activities.
27
The tables below detail our results of preneed production and maturities, excluding insurance contracts for the years ended
December 31, 2017
and
2016
.
|
Years Ended December 31,
|
|||||||
|
|
2017
|
2016
|
|||||
|
|
(Dollars in millions)
|
||||||
|
Funeral:
|
|
|
|
|
|||
|
Preneed trust-funded (including bonded):
|
|
|
|
|
|||
|
Sales production
|
$
|
319.3
|
|
$
|
285.5
|
|
|
|
Sales production (number of contracts)
|
94,603
|
|
89,529
|
|
|||
|
Maturities
|
$
|
265.8
|
|
$
|
239.4
|
|
|
|
Maturities (number of contracts)
|
68,683
|
|
65,047
|
|
|||
|
Cemetery:
|
|
|
|
|
|||
|
Sales production:
|
|
|
|
|
|||
|
Preneed
|
$
|
846.0
|
|
$
|
800.3
|
|
|
|
Atneed
|
316.6
|
|
305.7
|
|
|||
|
Total sales production
|
$
|
1,162.6
|
|
$
|
1,106.0
|
|
|
|
Sales production deferred to backlog:
|
|
|
|
|
|||
|
Preneed
|
$
|
380.8
|
|
$
|
369.3
|
|
|
|
Atneed
|
230.8
|
|
227.7
|
|
|||
|
Total sales production deferred to backlog
|
$
|
611.6
|
|
$
|
597.0
|
|
|
|
Revenue recognized from backlog:
|
|
|
|
|
|||
|
Preneed
|
$
|
305.1
|
|
$
|
294.6
|
|
|
|
Atneed
|
226.7
|
|
226.3
|
|
|||
|
Total revenue recognized from backlog
|
$
|
531.8
|
|
$
|
520.9
|
|
|
Insurance-funded Preneed Contracts:
Where permitted by state or provincial law, customers may arrange their preneed contract by purchasing a life insurance or annuity policy from third-party insurance companies, for which we earn a commission as general sales agent for the insurance company. These general agency commissions (GA revenue) are based on a percentage per contract sold and are recognized as revenue when the insurance purchase transaction between the customer and third-party insurance provider is complete. Direct selling costs incurred pursuant to the sale of insurance-funded preneed contracts are expensed as incurred. The policy amount of the insurance contract between the customer and the third-party insurance company generally equals the amount of the preneed contract. As the insurance contract is between the insurance company and the customer, we do not reflect the unfulfilled insurance-funded preneed contract amounts in our Consolidated Balance Sheet.
The table below details the results of insurance-funded preneed production and maturities and the number of contracts associated with those transactions.
|
|
Years Ended December 31,
|
||||||
|
|
2017
|
2016
|
|||||
|
|
(Dollars in millions)
|
||||||
|
Preneed insurance-funded:
|
|
|
|
|
|||
|
Sales production
(1)
|
$
|
510.0
|
|
$
|
552.0
|
|
|
|
Sales production (number of contracts)
|
84,962
|
|
90,395
|
|
|||
|
General agency revenue
|
$
|
121.0
|
|
$
|
135.8
|
|
|
|
Maturities
|
$
|
335.3
|
|
$
|
323.2
|
|
|
|
Maturities (number of contracts)
|
56,535
|
|
55,085
|
|
|||
|
(1)
|
Amounts are not included in our Consolidated Balance Sheet.
|
Backlog of Preneed Contracts:
The following table reflects our backlog of trust-funded deferred preneed contract revenue, including amounts related to
Deferred receipts held in trust
at
December 31, 2017
and
2016
. Additionally, the table reflects our
28
backlog of unfulfilled insurance-funded contracts (which are not included in our Consolidated Balance Sheet) at
December 31, 2017
and
2016
. The backlog amounts presented are reduced by an amount that we believe will cancel before maturity based on historical experience. The table does not include the backlog associated with businesses that are held for sale.
The table also reflects our preneed funeral and cemetery receivables and trust investments (fair value and cost bases) associated with the backlog of deferred preneed funeral and cemetery contract revenue, net of the estimated cancellation allowance. We believe that the table below is meaningful because it sets forth the aggregate amount of future revenue we expect to recognize as a result of maturities of preneed sales in the future, as well as the amount of assets associated with that revenue. Because the future revenue exceeds the asset amounts, future revenue will exceed the cash distributions actually received from the associated trusts.
|
December 31, 2017
|
December 31, 2016
|
||||||||||||||
|
|
Fair Value
|
Cost
|
Fair Value
|
Cost
|
|||||||||||
|
|
(In billions)
|
||||||||||||||
|
Deferred revenue
|
$
|
1.79
|
|
$
|
1.79
|
|
$
|
1.73
|
|
$
|
1.73
|
|
|||
|
Deferred receipts held in trust
|
3.48
|
|
3.18
|
|
3.10
|
|
3.05
|
|
|||||||
|
|
5.27
|
|
4.97
|
|
4.83
|
|
4.78
|
|
|||||||
|
Allowance for cancellation on trust investments
|
(0.27
|
)
|
(0.25
|
)
|
(0.25
|
)
|
(0.25
|
)
|
|||||||
|
Backlog of trust-funded deferred revenue
|
5.00
|
|
4.72
|
|
4.58
|
|
4.53
|
|
|||||||
|
Backlog of insurance-funded revenue
(1)
|
5.66
|
|
5.66
|
|
5.37
|
|
5.37
|
|
|||||||
|
Total backlog of deferred revenue
|
$
|
10.66
|
|
$
|
10.38
|
|
$
|
9.95
|
|
$
|
9.90
|
|
|||
|
Preneed receivables, net and trust investments
|
$
|
4.78
|
|
$
|
4.48
|
|
$
|
4.31
|
|
$
|
4.26
|
|
|||
|
Allowance for cancellation on trust investments
|
(0.27
|
)
|
(0.25
|
)
|
(0.25
|
)
|
(0.25
|
)
|
|||||||
|
Assets associated with backlog of trust-funded deferred revenue, net of estimated allowance for cancellation
|
4.51
|
|
4.23
|
|
4.06
|
|
4.01
|
|
|||||||
|
Insurance policies associated with insurance-funded deferred revenue, net of estimated allowance for cancellation
(1)
|
5.66
|
|
5.66
|
|
5.37
|
|
5.37
|
|
|||||||
|
Total assets associated with backlog of preneed revenue, net of estimated allowance for cancellation
|
$
|
10.17
|
|
$
|
9.89
|
|
$
|
9.43
|
|
$
|
9.38
|
|
|||
(1) Amounts are not included in our Consolidated Balance Sheet.
The fair value of our trust investments was based on a combination of quoted market prices, observable inputs such as interest rates or yield curves, reported net asset values, and appraisals. As of
December 31, 2017
, the difference between the backlog and asset market amounts represents
$0.25 billion
related to contracts for which we have posted surety bonds as financial assurance in lieu of trusting,
$0.03 billion
collected from customers that were not required to be deposited into trusts, and
$0.21 billion
in allowable cash distributions from trust assets. As of
December 31, 2017
, the fair value of the total backlog comprised
$2.81 billion
related to cemetery contracts and
$7.85 billion
related to funeral contracts. As of
December 31, 2017
, the fair value of the assets associated with the backlog of trust-funded deferred revenue comprised
$2.60 billion
related to cemetery contracts and
$1.91 billion
related to funeral contracts.
The table also reflects the amounts expected to be received from insurance companies through the assignment of policy proceeds related to insurance-funded contracts. We do not reflect the unfulfilled insurance-funded preneed amounts in our Consolidated Balance Sheet because they are not assets or liabilities as defined in Statement of Accounting Concepts No. 6 as we have no claim to the insurance proceeds until the contract is fulfilled and no obligation under the contract until the benefits are assigned to us after the time of need.
Trust Investments
In addition to selling our products and services to client families at the time of need, we enter into price-guaranteed preneed funeral and cemetery contracts, which provide for future funeral or cemetery merchandise and services. Since preneed funeral and cemetery merchandise or services will generally not be provided until sometime in the future, most states and provinces require that all or a portion of the funds collected from customers on preneed funeral and cemetery contracts be paid into trusts and/or escrow accounts until the merchandise is delivered or the service is performed. Investment earnings associated with the trust investments are expected to mitigate the inflationary costs of providing the preneed funeral and cemetery merchandise and services in the future at the prices that were guaranteed at the time of sale.
29
Also, we are required by state and provincial law to pay a portion of the proceeds from the preneed or atneed sale of cemetery property interment rights into perpetual care trusts. For these investments, the original corpus generally remains in the trust in perpetuity and the earnings or elected distributions are withdrawn as allowed to defray the expense to maintain the cemetery property. While many states require that net capital gains or losses be retained and added to the corpus, certain states allow the net realized capital gains and losses to be included in the earnings that are distributed. Additionally, some states allow a total return distribution that may contain elements of income, capital appreciation, and principal.
Independent trustees manage and invest the majority of the funds deposited into the funeral and cemetery merchandise and services trusts as well as the cemetery perpetual care trusts. The majority of the trustees are selected based on their respective geographic footprint and qualifications per state and provincial regulations. Most of the trustees engage the same independent investment managers. These trustees, with input from SCI's wholly-owned registered investment advisor, establish an investment policy that serves as an operating document to guide the investment activities of the trusts including asset allocation and manager selection. The investments are also governed by state and provincial guidelines. All of the trusts seek to control risk and volatility through a combination of asset classes, investment styles, and a diverse mix of investment managers.
Asset allocation is based on the liability structure of each funeral, cemetery, and perpetual care trust. Based on the various criteria set forth in the investment policy, the investment advisor recommends investment managers to the trustees. The primary investment objectives for the funeral and cemetery merchandise and service trusts include 1) preserving capital within acceptable levels of volatility and risk and 2) achieving growth of principal over time sufficient to preserve and increase the purchasing power of the assets. Preneed funeral and cemetery contracts generally take several years to mature; therefore, the funds associated with these contracts are often invested through several market cycles.
Historically, the cemetery perpetual care trusts' investment objectives, in accordance with state and provincial regulations, have emphasized providing a steady stream of current investment income with some capital appreciation in order to provide for the maintenance and beautification of cemetery properties. However, during 2016, SCI worked with several state legislatures to adjust laws and regulations to allow for a fixed distribution rate from cemetery perpetual care trusts' assets regardless of the level of ordinary income, similar to university endowments. As a result, beginning in 2017, a significant portion of our cemetery perpetual care trust assets were liquidated and reinvested in a more growth-oriented asset allocation with investment objectives similar to the funeral and cemetery merchandise and service trusts. As of
December 31, 2017
, the asset allocation is split approximately evenly between income and growth orientations. We expect this asset allocation shift to enhance asset growth and provide further protection to our customers. Additionally, we expect more states to adopt total return distribution legislation in the coming years.
As of
December 31, 2017
approximately 86% of our trusts were under the control and custody of three large financial institutions. The U.S. trustees primarily use four managed limited liability companies (LLCs), one for each merchandise and service trust type and two for the cemetery perpetual care trust type, each with an independent trustee as custodian. Each financial institution acting as trustee manages its allocation of trust assets in accordance with the investment policy through the purchase of the appropriate LLCs' units. For those accounts not eligible for participation in the LLCs or where a particular state's regulations contain other investment restrictions, the trustee utilizes institutional mutual funds that comply with our investment policy or with such state restrictions. The U.S. trusts include a modest allocation to alternative investments. These alternative investments are held in vehicles structured as LLCs and are managed by certain trustees. The trusts that are eligible to allocate a portion of their investments to alternative investments purchase units of the respective alternative investment LLCs.
Investment Structures
Each financial institution, acting as trustee, manages its allocation of trust assets in compliance with the investment policy primarily through the purchase one of four managed LLCs, matched to their trust type and each with a different, independent trustee acting as custodian. The managed LLCs use the following structures for investments:
Commingled Funds.
These funds allow the trusts to access, at a reduced cost, some of the same investment managers and strategies used elsewhere in the portfolios.
Mutual Funds.
The trust funds employ institutional share class mutual funds where operationally or economically efficient. These mutual funds are utilized to invest in various asset classes including U.S. equities, non-U.S. equities, corporate bonds, government bonds, high yield bonds, and commodities, all of which are governed by guidelines outlined in their individual prospectuses.
Separately Managed Accounts.
To reduce the costs to the investment portfolios, the trusts utilize separately managed accounts where appropriate.
Asset Classes
Fixed income investments
are intended to preserve principal, provide a source of current income, and reduce overall portfolio volatility. The majority of the fixed income allocation for the trusts is invested in institutional share class mutual
30
funds. Where the trusts have direct investments in individual fixed income securities, these are primarily in government and corporate instruments.
Canadian government fixed income securities are investments in Canadian federal and provincial government instruments. In many cases, regulatory restrictions mandate that the funds from the sales of preneed funeral and cemetery contracts sold in certain Canadian jurisdictions must be invested in these instruments.
Equity investments
have historically provided long-term capital appreciation in excess of inflation. The trusts have direct investments in individual equity securities primarily in domestic equity portfolios that include large, mid, and small capitalization companies of different investment styles (i.e., growth and value). The majority of the equity allocation is managed by institutional investment managers that specialize in an objective-specific area of expertise. Our equity securities are exposed to market risk; however, we believe these securities are well-diversified. As of
December 31, 2017
, the largest single equity position represented less than 1% of the total securities portfolio.
The objective of
private equity fund
investments is to provide high rates of return with reduced volatility and lower correlation. These investments are typically long term in duration. These investments are diversified by strategy, sector, manager, and vintage year. The investments consist of numerous limited partnerships, including but not limited to private equity, real estate, energy, infrastructure, transportation, distressed debt, and mezzanine financing. The trustees that have oversight of their respective alternative LLCs work closely with the investment advisor in making all investment decisions.
Trust Performance
During the year ended
December 31, 2017
, the Standard and Poor’s 500 Index increased 21.8% and the Barclay’s Aggregate Index increased 3.5%, while the combined SCI trust increased 14.1%.
SCI, the trustees, and the investment advisor monitor the capital markets and the trusts on an on-going basis. The trustees, with input from the investment advisor, take prudent action as needed to achieve the investment goals and objectives of the trusts.
Results of Operations — Years Ended
December 31, 2017
,
2016
, and
2015
Management Summary
In
2017
, we reported consolidated net income attributable to common stockholders of
$546.7 million
(
$2.84
per diluted share) compared to net income attributable to common stockholders in
2016
of
$177.0 million
(
$0.90
per diluted share) and net income attributable to common stockholders in
2015
of
$233.8 million
(
$1.14
per diluted share). These results were impacted by certain significant items including:
|
2017
|
2016
|
2015
|
|||||||||
|
|
(In millions)
|
||||||||||
|
Pre-tax gains (losses) from divestitures and impairment, net
(1)
|
$
|
7.0
|
|
$
|
(26.8
|
)
|
$
|
6.0
|
|
||
|
Pre-tax losses from the early extinguishment of debt
|
$
|
(0.3
|
)
|
$
|
(22.5
|
)
|
$
|
(6.9
|
)
|
||
|
Pre-tax acquisition, integration, and system transition costs
|
$
|
—
|
|
$
|
(17.5
|
)
|
$
|
(6.8
|
)
|
||
|
Pre-tax pension termination settlement
|
$
|
(12.8
|
)
|
$
|
(5.6
|
)
|
$
|
—
|
|
||
|
Pre-tax legal settlement, net of insurance recoveries
|
$
|
(11.5
|
)
|
$
|
—
|
|
$
|
—
|
|
||
|
Tax benefit from above items
|
$
|
5.7
|
|
$
|
17.2
|
|
$
|
2.3
|
|
||
|
Change in certain tax reserves and other
|
$
|
260.1
|
|
$
|
(20.9
|
)
|
$
|
(3.0
|
)
|
||
|
(1)
|
Includes
Net (loss) income from discontinued operations
and the portion of noncontrolling interest related to divestitures.
|
In addition to the above items, growth in cemetery revenue, higher recognized preneed funeral revenue, higher funeral services performed, and effective management of our back office overhead were partially offset by increases in cemetery selling commissions from higher sales production and increased cemetery administrative and maintenance costs.
31
Funeral Results
|
2017
|
2016
|
2015
|
|||||||||
|
|
(Dollars in millions, except average revenue per service)
|
||||||||||
|
Consolidated funeral revenue
|
$
|
1,868.2
|
|
$
|
1,869.1
|
|
$
|
1,889.1
|
|
||
|
Less: revenue associated with acquisitions/new construction
|
31.9
|
|
9.9
|
|
—
|
|
|||||
|
Less: revenue associated with divestitures
|
6.4
|
|
41.8
|
|
58.5
|
|
|||||
|
Comparable
(1)
funeral revenue
|
1,829.9
|
|
1,817.4
|
|
1,830.6
|
|
|||||
|
Less: comparable recognized preneed revenue
|
117.3
|
|
111.2
|
|
97.7
|
|
|||||
|
Less: comparable general agency and other revenue
|
117.0
|
|
126.5
|
|
129.4
|
|
|||||
|
Adjusted comparable funeral revenue
|
$
|
1,595.6
|
|
$
|
1,579.7
|
|
$
|
1,603.5
|
|
||
|
Comparable services performed
|
303,106
|
|
300,477
|
|
307,336
|
|
|||||
|
Comparable average revenue per service
(2)
|
$
|
5,264
|
|
$
|
5,257
|
|
$
|
5,217
|
|
||
|
Consolidated funeral operating profit
|
$
|
371.9
|
|
$
|
361.0
|
|
$
|
390.1
|
|
||
|
Less: operating profit associated with acquisitions/new construction
|
5.8
|
|
2.4
|
|
—
|
|
|||||
|
Less: operating (loss) profit associated with divestitures
|
(4.5
|
)
|
2.3
|
|
3.3
|
|
|||||
|
Comparable
(1)
funeral operating profit
|
$
|
370.6
|
|
$
|
356.3
|
|
$
|
386.8
|
|
||
|
(1)
|
We define comparable (or same store) operations as those funeral locations owned by us for the entire period beginning
January 1, 2016
and ending
December 31, 2017
.
|
|
(2)
|
We calculate comparable average revenue per service by dividing comparable funeral revenue, excluding general agency revenue, recognized preneed revenue, and other revenue to avoid distorting our average of normal funeral services revenue, by the comparable number of services performed during the period. Recognized preneed revenue is preneed sales of merchandise that is delivered at the time of sale, including memorial merchandise and travel protection, and excluded from our calculation of comparable average revenue per service because the associated service has not yet been performed.
|
Funeral Revenue
Consolidated revenue from funeral operations was
$1,868.2 million
for the year ended
December 31, 2017
, compared to
$1,869.1 million
for the same period in
2016
. This decrease is primarily attributable to the loss of
$35.4 million
in revenue contributed by properties that have been subsequently divested, partially offset by
$22.0 million
in revenue contributed by acquired properties and a
$12.5 million
increase in comparable revenue as described below.
Comparable revenue from funeral operations was
$1,829.9 million
for the year ended
December 31, 2017
compared to
$1,817.4 million
for the same period in
2016
. This increase was primarily due to a
0.9%
increase in comparable services performed and a
0.1%
increase in average revenue per service.
The increase in services performed comprises a
0.5%
increase in services performed by our funeral homes and a
3.5%
increase in cremation services performed by our non-funeral home channel.
Average revenue per funeral service increased
0.1%
for the year ended
December 31, 2017
compared to the same period in
2016
. Organic growth at the customer level of 0.6% was largely offset by the increase in our cremation mix. Our total comparable cremation rate increased to
53.5%
in
2017
from
52.6%
in
2016
as a result of an increase in both direct cremations and cremations with service.
Consolidated revenue from funeral operations decreased
$20.0 million
in
2016
compared to
2015
. This decrease is primarily attributable to the loss of
$16.7 million
in revenue contributed by properties that have been subsequently divested and a
$13.2 million
decrease in comparable revenue, partially offset by
$9.9 million
in revenue contributed by acquired properties. The decrease in comparable revenue was primarily due to a
2.2%
decrease in comparable services performed, partially offset by a
0.8%
increase in average revenue per service. Our comparable cremation rate increased to
52.6%
in
2016
from
51.7%
in
2015
as a result of an increase in cremations with service.
Funeral Operating Profit
Consolidated funeral operating profit increased
$10.9 million
, or
3.0%
in
2017
compared to
2016
. This increase is primarily attributable to an increase in comparable funeral operating profit of
$14.3 million
. Comparable funeral operating profit increased
$14.3 million
to
$370.6 million
and the operating margin percentage increased 70 basis points to
20.3%
, which was primarily the result of increased comparable revenue described above and effective cost management.
Consolidated funeral operating profit decreased
$29.1 million
, or
7.5%
, in
2016
as compared to
2015
. This decrease is primarily attributable to a decrease in comparable funeral operating profit of
$30.5 million
, which was primarily the result of
32
decreased comparable revenue described above and inflationary increases in fixed costs, partially offset by increased gross profit from recognized preneed revenue.
Cemetery Results
|
2017
|
2016
|
2015
|
|||||||||
|
|
(In millions)
|
||||||||||
|
Consolidated cemetery revenue
|
$
|
1,226.9
|
|
$
|
1,162.0
|
|
$
|
1,097.0
|
|
||
|
Less: revenue associated with acquisitions/new construction
|
6.2
|
|
0.3
|
|
—
|
|
|||||
|
Less: revenue associated with divestitures
|
0.7
|
|
0.9
|
|
2.0
|
|
|||||
|
Comparable
(1)
cemetery revenue
|
$
|
1,220.0
|
|
$
|
1,160.8
|
|
$
|
1,095.0
|
|
||
|
Consolidated cemetery operating profit
|
$
|
350.3
|
|
$
|
315.4
|
|
$
|
284.5
|
|
||
|
Less: operating profit associated with acquisitions/new construction
|
1.1
|
|
—
|
|
—
|
|
|||||
|
Less: operating (loss) profit associated with divestitures
|
(0.2
|
)
|
(0.8
|
)
|
0.2
|
|
|||||
|
Comparable
(1)
cemetery operating profit
|
$
|
349.4
|
|
$
|
316.2
|
|
$
|
284.3
|
|
||
|
(1)
|
We define comparable (or same store) operations as those cemetery locations owned by us for the entire period beginning
January 1, 2016
and ending
December 31, 2017
.
|
Cemetery Revenue
Consolidated revenue from our cemetery operations increased
$64.9 million
, or
5.6%
, in
2017
compared to
2016
primarily attributable to the
$59.2 million
increase in comparable revenue and
$5.9 million
in revenue contributed by acquired properties. The increase in comparable revenue is primarily the result of a
$43.2 million
increase in recognized preneed revenue from higher preneed sales production.
Consolidated revenue from our cemetery operations increased
$65.0 million
, or
5.9%
, in
2016
compared to
2015
primarily attributable to the increase in comparable revenue of
$65.8 million
partially offset by the loss of
$1.1 million
in properties that have been subsequently divested. Comparable cemetery revenue increased
$65.8 million
, or
6.0%
, primarily as a result of an increase in preneed sales production.
Cemetery Operating Profit
Consolidated cemetery operating profit increased
$34.9 million
, or
11.1%
, in
2017
compared to
2016
primarily attributable to the increase in comparable operating profit of
$33.2 million
, or
10.5%
. Comparable cemetery operating profit increased
$33.2 million
to
$349.4 million
and the operating margin percentage increased 140 basis points to
28.6%
driven by the increase in revenue described above coupled with effective cost management.
Consolidated cemetery operating profit increased
$30.9 million
, or
10.9%
in
2016
compared to
2015
primarily attributable to the increase in comparable operating profit of
$31.9 million
, or
11.2%
. Comparable cemetery operating profit increased
$31.9 million
to
$316.2 million
and the operating margin percentage increased 120 basis points driven by the increase in revenue described above, partially offset by increased selling commissions from higher sales production and increases in cemetery maintenance costs.
Other Financial Statement Items
General and Administrative Expenses
General and administrative expenses
were
$154.4 million
in
2017
compared to
$137.7 million
in
2016
and
$130.8 million
in
2015
. The
2017
amounts include
$11.5 million
related to a legal settlement and
$12.8 million
related to a pension termination settlement. The
2016
amounts include
$17.5 million
of acquisition costs and implementation of a new general ledger system and
$5.6 million
related to a pension termination settlement. The
2015
amounts include
$6.8 million
in acquisition, integration, and system transition costs. Excluding these costs, general and administrative expenses increased $15.5 million in
2017
compared to
2016
due to an increase in our self-insurance reserves and expenses related to updating our business location websites. The decrease in general and administrative expenses of $9.5 million in
2016
compared to
2015
was primarily due to effective back office expense management.
Gains (Losses) on Divestitures and Impairment Charges, Net
In
2017
, we recognized a
$7.0 million
net pre-tax gain on asset divestitures and impairments primarily as the result of asset divestitures, partially offset by impairment losses associated with non-strategic funeral and cemetery locations in the United States and Canada.
33
In
2016
, we recognized a
$26.8 million
net pre-tax loss on asset divestitures and impairments. This loss includes $31.2 million of impairment charges related to the divestiture of certain funeral homes in Los Angeles, California.
In
2015
, we recognized a
$6.5 million
net pre-tax gain on asset divestitures and impairments primarily as the result of asset divestitures, partially offset by impairment losses associated with non-strategic funeral and cemetery locations in the United States and Canada.
Hurricane Expense, Net
On August 26, 2017, Hurricane Harvey made landfall in Texas, causing significant damage across coastal Texas. In addition to damage caused directly by the storm itself, the region suffered massive damage from flooding as rainfall nearly exceeded the annual average. The main corporate headquarters sustained significant flood damage as did many of our Texas operations. On September 10, Irma made landfall in western Florida causing wind and flood damage to large parts of that state and the southeastern United States. On September 20, 2017, Maria made landfall in Puerto Rico causing significant wind and flood damage. During 2017, we began cleanup, repair and restoration of much of the damage in Texas, Florida, and in Puerto Rico related to Hurricanes Harvey, Irma, and Maria. We incurred $11.9 million in repair and cleanup costs and received $6.3 million of insurance proceeds related to these claims, which resulted in a
$5.6 million
unfavorable impact in our Consolidated Statement of Operations. We anticipate an immaterial amount of hurricane related expense in 2018.
Interest Expense
Interest expense
increased
$7.0 million
to
$169.1 million
in
2017
compared to
$162.1 million
in
2016
as we were impacted by increased rates on our floating rate debt as we continued to maintain our leverage ratio.
Interest expense
decreased
$10.8 million
to
$162.1 million
in
2016
compared to
$172.9 million
in
2015
. as we benefited from the debt refinancings over the past year by lowering interest on our Senior Notes and increasing our proportion of lower rate variable debt.
Losses on Early Extinguishment of Debt, Net
During
2016
, we paid an aggregate of
$310.0 million
on our Term Loan due July 2018,
$295.0 million
on our 7.0% Senior Notes due 2017,
$280.0 million
on our Bank Credit Facility due July 2018,
$26.3 million
on our Term Loan due March 2021, and
$10.0 million
on our Bank Credit Facility due March 2021. Certain of the above transactions resulted in the recognition of a loss of
$22.5 million
recorded in
Losses on early extinguishment of debt, net
in our Consolidated Statement of Operations.
During
2015
, we paid an aggregate of
$197.4 million
on our
6.75% Senior Notes due April 2016
,
$100.0 million
on our Bank Credit Facility, and
$60.0 million
on our Term Loan due
July 2018
. Certain of the above transactions resulted in the recognition of a loss of
$6.9 million
recorded in
Losses on early extinguishment of debt, net
in our Consolidated Statement of Operations.
Provision for Income Taxes
The Tax Act as enacted on December 22, 2017, makes broad and complex changes to the U.S. tax code by, among other things, reducing the federal corporate income tax rate, requiring payment of a one-time transition tax on unrepatriated earnings of foreign subsidiaries, generally eliminating U.S. federal income taxes on dividends from foreign subsidiaries, creating a new limitation on deductible interest expense, creating a bonus depreciation that will allow for full expensing on qualified property, and imposing a limitation on deductibility of certain executive compensation. For further information on the impacts of the Tax Act, see Note 5 in Part II, Item 8. Financial Statements and Supplementary Data.
The 2017 consolidated effective tax rate was a tax benefit of
36.6%
, compared to tax expense of
45.7%
and
36.5%
in 2016 and 2015, respectively. The lower effective tax rate was primarily due to the effects of the Tax Act discussed above, and the recent IRS audit settlement as well as the result of tax benefits recognized on the settlement of employee share-based awards. The higher effective tax rate for the twelve months ended
December 31, 2016
was a result of a valuation allowance recorded against foreign net deferred tax assets for which a future net benefit may not be realized, and non-deductible goodwill resulting from gains on divestitures.
Weighted Average Shares
The diluted weighted average number of shares outstanding was
192.2 million
in
2017
, compared to
196.0 million
in
2016
, and
204.5 million
in
2015
. The decrease in all years primarily reflects the impact of shares repurchased under our share repurchase program.
Critical Accounting Policies, Recent Accounting Pronouncements, and Accounting Changes
Our consolidated financial statements are impacted by the accounting policies used and the estimates and assumptions made by management during their preparation. See Note 2 in Part II, Item 8. Financial Statements and Supplementary Data, for more information. Estimates and assumptions affect the carrying values of assets and liabilities and disclosures of contingent
34
assets and liabilities at the balance sheet date. Actual results could differ from such estimates due to uncertainties associated with the methods and assumptions underlying our critical accounting measurements. The following is a discussion of our critical accounting policies pertaining to revenue recognition, valuation of goodwill, valuation of intangible assets, fair value measurements, loss contract analysis, and the use of estimates.
Revenue Recognition
Funeral revenue is recognized when funeral merchandise is delivered or funeral services are performed. Merchandise delivery and service performance generally take place shortly after the time of need. Delivery of some preneed items, primarily certain memorial merchandise and travel protection, are delivered prior to the time of need. We refer to these items as recognized preneed revenue. Our trade receivables primarily consist of amounts due for funeral services already performed.
Revenue associated with cemetery merchandise and services is recognized when merchandise is delivered or the service is performed. For non-personalized merchandise (such as outer burial containers) and services, we defer the revenue until the merchandise is delivered and the services are performed, generally immediately following the time of need. For personalized marker merchandise, with the customer’s direction generally obtained at the time of sale, we can choose to order, store, and transfer title to the customer. In situations in which we have no further obligation or involvement related to the merchandise, we recognize revenue and record the cost of sales upon the earlier of vendor storage of these items or delivery in our cemetery. Preneed sales of cemetery interment rights (cemetery property) are recognized when a minimum of 10% of the sales price has been collected and the property has been constructed and is available for interment.
Pursuant to state or provincial law, all or a portion of the proceeds from funeral and cemetery merchandise or services sold on a preneed basis may be required to be paid into trust funds. We defer investment earnings related to these merchandise and service trusts until the associated merchandise is delivered or services are performed.
Valuation of Goodwill
We record the excess of purchase price over the fair value of identifiable net assets acquired in business combinations as goodwill. Goodwill is tested annually during the fourth quarter for impairment by assessing the fair value of each of our reporting units.
Our goodwill impairment test involves certain estimates and management judgment. In the first step of our goodwill impairment test, we compare the fair value of a reporting unit to its carrying amount, including goodwill. We determine the fair value of each reporting unit using both a market and income approach. Our methodology considers discounted cash flows and multiples of EBITDA (earnings before interest, taxes, depreciation, and amortization). The discounted cash flow valuation uses projections of future cash flows and includes assumptions concerning future operating performance and economic conditions that may differ from actual future cash flows. We do not record an impairment of goodwill in instances where the fair value of a reporting unit exceeds its carrying amount. If the aggregate fair value is less than the related carrying amount for a reporting unit, we compare the implied fair value of goodwill to the carrying amount of goodwill. If the carrying amount of reporting unit goodwill exceeds the implied fair value of that goodwill, an impairment loss is recognized in an amount equal to that excess.
For our most recent annual impairment test performed in the fourth quarter, we used a
6.5%
discount rate, growth rates ranging from
1.2%
to
4.7%
over a five-year period, plus a terminal value determined using the constant growth method in projecting our future cash flows. Fair value was calculated as the sum of the projected discounted cash flows of our reporting units over the next five years plus terminal value at the end of those five years. Our terminal value was calculated using long-term growth rates of
2.5%
and
2.9%
for our funeral and cemetery reporting units, respectively.
In addition to our annual review, we assess the impairment of goodwill whenever certain events or changes in circumstances indicate that the carrying value may be greater than fair value. Factors that could trigger an interim impairment review include, but are not limited to, significant underperformance relative to historical or projected future operating results and significant negative industry or economic trends. No interim goodwill impairments reviews were performed in
2017
or
2016
. For more information on related to goodwill, see Note 4 in Part II, Item 8. Financial Statements and Supplementary Data.
Valuation of Intangible Assets
Our intangible assets include customer relationships, trademarks and tradenames, and other intangible assets primarily resulting from acquisitions. Our trademark and tradenames and certain other intangible assets are considered to have an indefinite life and are not subject to amortization. We test for impairment of intangible assets annually during the fourth quarter.
Our intangible asset impairment tests involve estimates and management judgment. For trademark and tradenames, our test uses the relief from royalty method whereby we determine the fair value of the assets by discounting the cash flows that represent a savings over having to pay a royalty fee for use of the trademark and tradenames. The discounted cash flow valuation uses projections of future cash flows and includes assumptions concerning future operating performance and economic conditions that may differ from actual future cash flows. For our most recent annual impairment test performed in the fourth quarter, we estimated that the pre-tax savings would range from 1.0% to 4.0% of the revenue associated with the
35
trademark and tradenames, based primarily on our research of intellectual property valuation and licensing databases. We also assumed a terminal growth rate of
2.5%
and
2.9%
for our funeral and cemetery segments, respectively, and discounted the cash flows at a
6.7%
discount rate based on the relative risk of these assets to our overall business.
In addition to our annual review, we assess the impairment of intangible assets whenever certain events or changes in circumstances indicate that the carrying value may be greater than the fair value. Factors that could trigger an interim impairment review include, but are not limited to, significant underperformance relative to historical or projected future operating results and significant negative industry or economic trends. No interim intangible impairment reviews were performed in
2017
or
2016
. For more information on related to intangible assets, see Note 4 in Part II, Item 8. Financial Statements and Supplementary Data.
Fair Value Measurements
We measure the available-for-sale securities held by our funeral merchandise and service, cemetery merchandise and service, and cemetery perpetual care trusts at fair value on a recurring basis. Fair value is the price that would be received to sell an asset or paid to transfer a liability in an orderly transaction between market participants at the measurement date. We utilize a three-level valuation hierarchy for disclosure of fair value measurements. The valuation hierarchy is based upon the transparency of inputs to the valuation of an asset or liability as of the measurement date. The three levels are defined as follows:
|
•
|
Where quoted prices are available in an active market, securities held by the trusts are classified as Level 1 investments.
|
|
•
|
Where quoted market prices are not available for the specific security, fair values are estimated by using either quoted prices of securities with similar characteristics or an income approach fair value model with observable inputs that include a combination of interest rates, yield curves, credit risks, prepayment speeds, ratings, and tax-exempt status. These securities are classified as Level 2 investments.
|
|
•
|
The valuation of other investments requires management judgment due to the absence of quoted market prices, inherent lack of liquidity, and the long-term nature of such assets. These securities are classified as Level 3 investments.
|
An asset’s or liability’s categorization within the valuation hierarchy is based upon the lowest level of input that is significant to the fair value measurement. Certain available-for-sale securities held by our funeral merchandise and service, cemetery merchandise and service, and cemetery perpetual care trusts have been classified in Level 3 of the hierarchy due to the significant management judgment required as a result of the absence of quoted market prices, inherent lack of liquidity, or the long-term nature of the securities. For additional disclosures for all of our available-for-sale securities, see Note 3 in Part II, Item 8. Financial Statements and Supplementary Data.
Loss Contract Analysis
We perform an analysis annually to determine whether our preneed contracts are in a loss position, which would necessitate a charge to earnings. For this analysis, we add the sales prices of the underlying contracts and net realized earnings, then subtract net unrealized losses to derive the net amount of estimated proceeds for contracts as of the balance sheet date. We consider unrealized gains and losses based on current market prices quoted for the investments, and we do not include future expected returns on the investments in our analysis. We compare our estimated proceeds to the estimated direct costs to deliver our contracts, which consist primarily of funeral and cemetery merchandise costs and salaries, supplies, and equipment related to the delivery of a preneed contract. If a deficiency were to exist, we would record a charge to earnings and a corresponding liability for the expected loss on delivery of those contracts from our backlog. As of
December 31, 2017
, no such charge was required. Due to the positive margins of our preneed contracts and the trust portfolio returns we have experienced in prior years, we believe there is currently capacity for additional market depreciation before a loss contract would result.
Use of Estimates
The preparation of financial statements in conformity with Generally Accepted Accounting Principles in the United States (GAAP) requires management to make certain estimates and assumptions. These estimates and assumptions affect the carrying values of assets and liabilities and disclosures of contingent assets and liabilities at the balance sheet date. Actual results could differ from such estimates due to uncertainties associated with the methods and assumptions underlying our critical accounting measurements. Key estimates used by management include:
Allowances.
We provide various allowances and/or cancellation reserves for our funeral and cemetery preneed and atneed receivables, as well as for our preneed funeral and preneed cemetery deferred revenue. These allowances are based on an analysis of historical trends and include, where applicable, collection and cancellation activity. We also record an estimate of general agency revenue that may be canceled in its first year and revenue would be charged back by the insurance company.
36
These estimates are impacted by a number of factors, including changes in economy, relocation, and demographic or competitive changes in our areas of operation.
Valuation of trust investments.
The trust investments include marketable securities that are classified as available-for-sale. When available, we use quoted market prices for specific securities. When quoted market prices are not available for the specific security, fair values are estimated by using either quoted market prices for securities with similar characteristics or a fair value model with observable inputs that include a combination of interest rates, yield curves, credit risks, prepayment terms, rating, and tax exempt status. The valuation of certain investments requires significant management judgment due to the absence of quoted market prices, inherent lack of liquidity, and the long-term nature of such assets.
Legal liability reserves.
Contingent liabilities, principally for legal matters, are recorded when it is probable that a liability has been incurred and the amount of the loss can be reasonably estimated. Liabilities accrued for legal matters require judgments regarding projected outcomes and a range of loss based on historical experience and recommendations of legal counsel. However, litigation is inherently unpredictable and excessive verdicts do occur. As disclosed in Note 8 in Part II, Item 8. Financial Statements and Supplementary Data, our legal exposures and the ultimate outcome of these legal proceedings could be material to operating results or cash flows in any given quarter or year.
Depreciation of long-lived assets.
We depreciate our long-lived assets ratably over their estimated useful lives. These estimates of useful lives may be affected by such factors as changing market conditions or changes in regulatory requirements.
Amortization of certain intangible assets.
We amortize certain intangible assets ratably over their estimated useful lives. These estimates of useful lives may be affected by such factors as contractual terms, changing market conditions, or changes in regulatory requirements.
Valuation of assets acquired and liabilities assumed.
Tangible and intangible assets acquired and liabilities assumed are recorded at their fair value and goodwill is recognized for any difference between the price of acquisition and our fair value determination. We have customarily estimated our purchase costs and other related transactions known to us at closing of the acquisition. To the extent that information not available to us at the closing date subsequently became available during the measurement period, we have adjusted our goodwill, assets, or liabilities associated with the acquisition.
Income taxes.
We compute income taxes using the liability method. Our ability to realize the benefit of our deferred tax assets requires us to achieve certain future earnings levels. We have established a valuation allowance against a portion of our deferred tax assets and we could be required to further adjust that valuation allowance in the near term if market conditions change materially and future earnings are, or are projected to be, significantly different than our current estimates. An increase in the valuation allowance would result in additional income tax expense in such period.
As of December 31, 2017, foreign withholding taxes have not been provided on the estimated $195 million of undistributed earnings and profits ("E&P") of our foreign subsidiaries as we intend to permanently reinvest these foreign E&P in those businesses outside the U.S. However, if we were to repatriate such foreign E&P, the foreign withholding tax liability is estimated to be $10 million. We have calculated our best estimate of the impact of this provision in accordance with our understanding of the Tax Act and guidance available.
We file income tax returns, including tax returns for our subsidiaries, with federal, state, local, and foreign jurisdictions. We consider the United States to be our most significant jurisdiction; however, all tax returns are subject to routine compliance review by the taxing authorities in the jurisdictions in which we file tax returns in the ordinary course of business.
Tax years subsequent to 2005 remain open to review and adjustment by the IRS. Moreover, various state jurisdictions are auditing years 2000 through 2016. It is reasonably possible that the amount of unrecognized tax benefits could significantly decrease over the next 12 months. However, since the years to which uncertain tax positions relate remain subject to review by the tax authorities, a current estimate of the range of decrease that may occur within the next 12 months cannot be made.
Retirement plans.
Certain retirement plans are frozen with no benefits accruing to participants except interest. Benefit costs and liabilities are actuarially determined based on certain assumptions, including the discount rate used to compute future benefit obligations. Weighted-average discount rates used to determine net periodic benefit cost were
3.86%
and
3.96%
as of
December 31, 2017
and
2016
, respectively. We verify the reasonableness of the discount rate by comparing our rate to the rate earned on high-quality fixed income investments, such as the Moody’s Aa index. See Note 11 in Part II, Item 8. Financial Statements and Supplementary Data for more information.
Insurance loss reserves.
We purchase comprehensive general liability, morticians and cemetery professional liability, automobile liability, and workers’ compensation insurance coverages structured with high deductibles. This high-deductible insurance program means we are primarily self-insured for claims and associated costs and losses covered by these policies. Historical insurance industry experience indicates a high degree of inherent variability in assessing the ultimate amount of losses associated with casualty insurance claims. This is especially true with respect to liability and workers’ compensation exposures due to the extended period of time that transpires between when the claim might occur and the full settlement of such claim, which is often many years. We continually evaluate loss estimates associated with claims and losses related to these
37
insurance coverages falling within the deductible of each coverage. Assumptions based on factors such as claim settlement patterns, claim development trends, claim frequency and severity patterns, inflationary trends, and data reasonableness will generally affect the analysis and determination of the “best estimate” of the projected ultimate claim losses. The results of these evaluations are used to both analyze and adjust our insurance loss reserves.
As of
December 31, 2017
, reported losses for workers’ compensation, general liability, and auto liability incurred during the period May 1, 1991 through
December 31, 2017
were approximately $552.7 million over 26.7 years. The selected fully developed ultimate settlement value estimated was $608.0 million for the same period. Paid losses were $529.8 million indicating a reserve requirement of
$78.2 million
.
Recent Accounting Pronouncements and Accounting Changes
For discussion of recent accounting pronouncements and accounting changes, see Note 2 in Part II, Item 8. Financial Statements and Supplementary Data.
|
Item 7A.
|
Quantitative and Qualitative Disclosures About Market Risk.
|
The market risk inherent in our financial instruments and positions includes the price risk associated with the marketable equity and debt securities included in our portfolio of trust investments, the interest rate risk associated with our floating rate debt, and the currency risk associated with our Canadian operations. Our market-sensitive instruments and positions are considered to be “other-than-trading”. Our exposure to market risk as discussed below includes forward-looking statements and represents an estimate of possible changes in fair value or future earnings that might occur, assuming hypothetical changes in equity markets, interest rates, and currencies. Our views on market risk are not necessarily indicative of actual results that may occur, and they do not represent the maximum possible gains or losses that may occur. Actual fair value movements related to changes in equity markets, interest rates, and currencies, along with the timing of such movements, may differ from those estimated.
Marketable Equity and Debt Securities — Price Risk
In connection with our preneed funeral operations and preneed cemetery merchandise and service sales, the related funeral and cemetery trust funds own investments in equity and debt securities and mutual funds, which are sensitive to current market prices.
Cost and market values as of
December 31, 2017
are presented in Note 3 in Part II, Item 8, Financial Statements and Supplementary Data. Also, see Item 7, Management’s Discussion and Analysis of Financial Condition and Results of Operations,
Financial Conditions, Liquidity, and Capital Resources
, for discussion of trust investments.
Market-Rate Sensitive Instruments — Interest Rate Risk
At
December 31, 2017
and
2016
, approximately
75%
and
63%
, respectively, of our total debt consisted of fixed rate debt at a weighted average rate of
4.73%
and
4.68%
, respectively. The fair value of our debt was $164.6 million more than its carrying value at
December 31, 2017
. A hypothetical 10% increase in interest rates associated with our floating rate debt would increase our interest expense by $1.5 million. See Notes 6 and 7 in Part II, Item 8. Financial Statements and Supplementary Data, for additional information.
Market-Rate Sensitive Instruments — Currency Risk
At
December 31, 2017
and
2016
, our foreign currency exposure was primarily associated with the Canadian dollar. A hypothetical 10% adverse change in the strength of the U.S. dollar relative to our foreign currency instruments would have negatively affected our income from our continuing operations, on an annual basis, by $5.8 million and $4.1 million for the years ended
December 31, 2017
and
2016
.
At
December 31, 2017
, approximately 4% of our stockholders’ equity and debt and 12% of our operating income was denominated in the Canadian dollar. Approximately 6% of our stockholders’ equity and debt and 10% of our operating income was denominated in foreign currencies, primarily the Canadian dollar, at
December 31, 2016
. We do not have an investment in foreign operations considered to be in highly inflationary economies.
38
|
Item 8.
|
Financial Statements and Supplementary Data.
|
INDEX TO FINANCIAL STATEMENTS AND RELATED SCHEDULE
|
|
Page
|
|
Financial Statements:
|
|
|
Report of Independent Registered Public Accounting Firm
|
|
|
Consolidated Statement of Operations for the years ended December 31, 2017, 2016, and 2015
|
|
|
Consolidated Statement of Comprehensive Income for the years ended December 31, 2017, 2016, and 2015
|
|
|
Consolidated Balance Sheet as of December 31, 2017 and 2016
|
|
|
Consolidated Statement of Cash Flows for the years ended December 31, 2017, 2016, and 2015
|
|
|
Consolidated Statement of Equity for the years ended December 31, 2017, 2016, and 2015
|
|
|
Notes to Consolidated Financial Statements
|
|
|
1. Nature of Operations
|
|
|
2. Summary of Significant Accounting Policies
|
|
|
3. Preneed Activities
|
|
|
4. Goodwill and Intangible Assets
|
|
|
5. Income Taxes
|
|
|
6. Debt
|
|
|
7. Credit Risk and Fair Value of Financial Instruments
|
|
|
8. Commitments and Contingencies
|
|
|
9. Equity
|
|
|
10. Share-Based Compensation
|
|
|
11. Retirement Plans
|
|
|
12. Segment Reporting
|
|
|
13. Supplementary Information
|
|
|
14. Earnings Per Share
|
|
|
15. Acquisitions
|
|
|
16. Divestiture-Related Activities
|
|
|
17. Quarterly Financial Data (Unaudited)
|
|
|
Financial Statement Schedule:
|
|
|
II — Valuation and Qualifying Accounts for the years ended December 31, 2017, 2016, and 2015
|
|
All other schedules have been omitted because the required information is not applicable or is not present in amounts sufficient to require submission or because the information required is included in the consolidated financial statements or the related notes thereto.
39
Report of Independent Registered Public Accounting Firm
To the Board of Directors and Stockholders of Service Corporation International
Opinions on the Financial Statements and Internal Control over Financial Reporting
We have audited the accompanying consolidated balance sheets of Service Corporation International and its subsidiaries as of December 31, 2017 and 2016, and the related consolidated statements of operations, comprehensive income, equity and cash flows for each of the three years in the period ended December 31, 2017, including the related notes and financial statement schedule listed in the accompanying index (collectively referred to as the “consolidated financial statements”). We also have audited the Company's internal control over financial reporting as of December 31, 2017, based on criteria established in
Internal Control - Integrated Framework
(2013) issued by the Committee of Sponsoring Organizations of the Treadway Commission (COSO).
In our opinion, the consolidated financial statements referred to above present fairly, in all material respects, the financial position of the Company as of December 31, 2017 and 2016, and the results of their operations and their cash flows for each of the three years in the period ended December 31, 2017 in conformity with accounting principles generally accepted in the United States of America. Also in our opinion, the Company maintained, in all material respects, effective internal control over financial reporting as of December 31, 2017, based on criteria established in
Internal Control - Integrated Framework
(2013) issued by the COSO.
Basis for Opinions
The Company's management is responsible for these consolidated financial statements, for maintaining effective internal control over financial reporting, and for its assessment of the effectiveness of internal control over financial reporting, included in Management’s Report on Internal Control over Financial Reporting appearing under Item 9A. Our responsibility is to express opinions on the Company’s consolidated financial statements and on the Company's internal control over financial reporting based on our audits. We are a public accounting firm registered with the Public Company Accounting Oversight Board (United States) ("PCAOB") and are required to be independent with respect to the Company in accordance with the U.S. federal securities laws and the applicable rules and regulations of the Securities and Exchange Commission and the PCAOB.
We conducted our audits in accordance with the standards of the PCAOB. Those standards require that we plan and perform the audits to obtain reasonable assurance about whether the consolidated financial statements are free of material misstatement, whether due to error or fraud, and whether effective internal control over financial reporting was maintained in all material respects.
Our audits of the consolidated financial statements included performing procedures to assess the risks of material misstatement of the consolidated financial statements, whether due to error or fraud, and performing procedures that respond to those risks. Such procedures included examining, on a test basis, evidence regarding the amounts and disclosures in the consolidated financial statements. Our audits also included evaluating the accounting principles used and significant estimates made by management, as well as evaluating the overall presentation of the consolidated financial statements. Our audit of internal control over financial reporting included obtaining an understanding of internal control over financial reporting, assessing the risk that a material weakness exists, and testing and evaluating the design and operating effectiveness of internal control based on the assessed risk. Our audits also included performing such other procedures as we considered necessary in the circumstances. We believe that our audits provide a reasonable basis for our opinions.
Definition and Limitations of Internal Control over Financial Reporting
A company’s internal control over financial reporting is a process designed to provide reasonable assurance regarding the reliability of financial reporting and the preparation of financial statements for external purposes in accordance with generally accepted accounting principles. A company’s internal control over financial reporting includes those policies and procedures that (i) pertain to the maintenance of records that, in reasonable detail, accurately and fairly reflect the transactions and dispositions of the assets of the company; (ii) provide reasonable assurance that transactions are recorded as necessary to permit preparation of financial statements in accordance with generally accepted accounting principles, and that receipts and expenditures of the company are being made only in accordance with authorizations of management and directors of the company; and (iii) provide reasonable assurance regarding prevention or timely detection of unauthorized acquisition, use, or disposition of the company’s assets that could have a material effect on the financial statements.
40
Because of its inherent limitations, internal control over financial reporting may not prevent or detect misstatements. Also, projections of any evaluation of effectiveness to future periods are subject to the risk that controls may become inadequate because of changes in conditions, or that the degree of compliance with the policies or procedures may deteriorate.
/s/ PricewaterhouseCoopers LLP
Houston, Texas
February 14, 2018
We have served as the Company’s auditor since 1993.
41
|
SERVICE CORPORATION INTERNATIONAL
CONSOLIDATED STATEMENT OF OPERATIONS
|
|||||||||||
|
|
Years Ended December 31,
|
||||||||||
|
|
2017
|
2016
|
2015
|
||||||||
|
|
(In thousands, except per share amounts)
|
||||||||||
|
Revenue
|
$
|
3,095,031
|
|
|
$
|
3,031,137
|
|
$
|
2,986,041
|
|
|
|
Costs and expenses
|
(2,372,842
|
)
|
|
(2,354,703
|
)
|
(2,311,452
|
)
|
||||
|
Operating profit
|
722,189
|
|
|
676,434
|
|
674,589
|
|
||||
|
General and administrative expenses
|
(154,423
|
)
|
|
(137,730
|
)
|
(130,813
|
)
|
||||
|
Gains (losses) on divestitures and impairment charges, net
|
7,015
|
|
|
(26,819
|
)
|
6,522
|
|
||||
|
Hurricane expense, net
|
(5,584
|
)
|
—
|
|
—
|
|
|||||
|
Operating income
|
569,197
|
|
511,885
|
|
550,298
|
|
|||||
|
Interest expense
|
(169,125
|
)
|
|
(162,093
|
)
|
(172,897
|
)
|
||||
|
Losses on early extinguishment of debt, net
|
(274
|
)
|
|
(22,503
|
)
|
(6,918
|
)
|
||||
|
Other income (expense), net
|
460
|
|
|
(631
|
)
|
(132
|
)
|
||||
|
Income from continuing operations before income taxes
|
400,258
|
|
326,658
|
|
370,351
|
|
|||||
|
Benefit from (provision for) income taxes
|
146,589
|
|
|
(149,353
|
)
|
(135,027
|
)
|
||||
|
Income from continuing operations
|
546,847
|
|
|
177,305
|
|
235,324
|
|
||||
|
Net loss from discontinued operations, net of tax
|
—
|
|
|
—
|
|
(390
|
)
|
||||
|
Net income
|
546,847
|
|
|
177,305
|
|
234,934
|
|
||||
|
Net income attributable to noncontrolling interests
|
(184
|
)
|
|
(267
|
)
|
(1,162
|
)
|
||||
|
Net income attributable to common stockholders
|
$
|
546,663
|
|
|
$
|
177,038
|
|
$
|
233,772
|
|
|
|
Basic earnings per share:
|
|
|
|
|
|
|
|||||
|
Net income attributable to common stockholders
|
$
|
2.91
|
|
$
|
0.92
|
|
$
|
1.17
|
|
||
|
Basic weighted average number of shares
|
187,630
|
|
|
193,086
|
|
200,356
|
|
||||
|
Diluted earnings per share:
|
|
|
|
|
|
|
|||||
|
Net income attributable to common stockholders
|
$
|
2.84
|
|
$
|
0.90
|
|
$
|
1.14
|
|
||
|
Diluted weighted average number of shares
|
192,246
|
|
|
196,042
|
|
204,450
|
|
||||
|
Dividends declared per share
|
$
|
0.58
|
|
$
|
0.51
|
|
$
|
0.44
|
|
||
(See notes to consolidated financial statements)
42
SERVICE CORPORATION INTERNATIONAL
|
Years Ended December 31,
|
|||||||||||
|
2017
|
2016
|
2015
|
|||||||||
|
(In thousands)
|
|||||||||||
|
Net income
|
$
|
546,847
|
|
$
|
177,305
|
|
$
|
234,934
|
|
||
|
Other comprehensive income:
|
|||||||||||
|
Foreign currency translation adjustments
|
25,462
|
|
10,331
|
|
(53,283
|
)
|
|||||
|
Total comprehensive income
|
572,309
|
|
187,636
|
|
181,651
|
|
|||||
|
Total comprehensive income attributable to noncontrolling interests
|
(195
|
)
|
(270
|
)
|
(1,129
|
)
|
|||||
|
Total comprehensive income attributable to common stockholders
|
$
|
572,114
|
|
$
|
187,366
|
|
$
|
180,522
|
|
||
(See notes to consolidated financial statements)
43
|
SERVICE CORPORATION INTERNATIONAL
CONSOLIDATED BALANCE SHEET
|
|||||||
|
|
December 31,
|
||||||
|
|
2017
|
2016
|
|||||
|
|
(In thousands, except share amounts)
|
||||||
|
ASSETS
|
|||||||
|
Current assets:
|
|
|
|
|
|||
|
Cash and cash equivalents
|
$
|
330,039
|
|
$
|
194,986
|
|
|
|
Receivables, net
|
90,304
|
|
98,455
|
|
|||
|
Inventories
|
25,378
|
|
26,431
|
|
|||
|
Other
|
35,575
|
|
34,524
|
|
|||
|
Total current assets
|
481,296
|
|
354,396
|
|
|||
|
Preneed receivables, net and trust investments
|
4,778,842
|
|
4,305,165
|
|
|||
|
Cemetery property
|
1,791,989
|
|
1,776,935
|
|
|||
|
Property and equipment, net
|
1,873,044
|
|
1,827,587
|
|
|||
|
Goodwill
|
1,805,981
|
|
1,799,081
|
|
|||
|
Deferred charges and other assets
|
601,184
|
|
567,520
|
|
|||
|
Cemetery perpetual care trust investments
|
1,532,167
|
|
1,407,465
|
|
|||
|
Total assets
|
$
|
12,864,503
|
|
$
|
12,038,149
|
|
|
|
LIABILITIES & EQUITY
|
|||||||
|
Current liabilities:
|
|
|
|
|
|||
|
Accounts payable and accrued liabilities
|
$
|
489,172
|
|
$
|
439,936
|
|
|
|
Current maturities of long-term debt
|
337,337
|
|
89,974
|
|
|||
|
Income taxes payable
|
2,470
|
|
7,960
|
|
|||
|
Total current liabilities
|
828,979
|
|
537,870
|
|
|||
|
Long-term debt
|
3,135,316
|
|
3,196,616
|
|
|||
|
Deferred revenue
|
1,789,776
|
|
1,731,417
|
|
|||
|
Deferred tax liability
|
283,765
|
|
454,638
|
|
|||
|
Other liabilities
|
410,982
|
|
510,322
|
|
|||
|
Deferred receipts held in trust
|
3,475,430
|
|
3,103,796
|
|
|||
|
Care trusts’ corpus
|
1,530,818
|
|
1,408,243
|
|
|||
|
Commitments and contingencies (Note 8)
|
|
|
|
|
|||
|
Equity:
|
|||||||
|
Common stock, $1 per share par value, 500,000,000 shares authorized, 191,935,647 and 195,403,644 shares issued, respectively, and 186,614,747 and 189,405,244 shares outstanding, respectively
|
186,615
|
|
189,405
|
|
|||
|
Capital in excess of par value
|
970,468
|
|
990,203
|
|
|||
|
Retained earnings (accumulated deficit)
|
210,364
|
|
(103,387
|
)
|
|||
|
Accumulated other comprehensive income
|
41,943
|
|
16,492
|
|
|||
|
Total common stockholders’ equity
|
1,409,390
|
|
1,092,713
|
|
|||
|
Noncontrolling interests
|
47
|
|
2,534
|
|
|||
|
Total equity
|
1,409,437
|
|
1,095,247
|
|
|||
|
Total liabilities and equity
|
$
|
12,864,503
|
|
$
|
12,038,149
|
|
|
(See notes to consolidated financial statements)
44
|
SERVICE CORPORATION INTERNATIONAL
CONSOLIDATED STATEMENT OF CASH FLOWS
|
|||||||||||
|
|
Years Ended December 31,
|
||||||||||
|
|
2017
|
2016
|
2015
|
||||||||
|
(In thousands)
|
|
||||||||||
|
Cash flows from operating activities:
|
|
|
|
|
|
|
|
||||
|
Net income
|
$
|
546,847
|
|
$
|
177,305
|
|
|
$
|
234,934
|
|
|
|
Adjustments to reconcile net income to net cash provided by operating activities:
|
|
|
|
|
|
|
|
||||
|
Loss from discontinued operations, net of tax
|
—
|
|
—
|
|
|
390
|
|
||||
|
Losses on early extinguishment of debt, net
|
274
|
|
22,503
|
|
|
6,918
|
|
||||
|
Premiums paid on early extinguishment of debt
|
—
|
|
(20,524
|
)
|
|
(6,549
|
)
|
||||
|
Depreciation and amortization
|
153,141
|
|
147,233
|
|
|
141,456
|
|
||||
|
Amortization of intangibles
|
27,650
|
|
30,956
|
|
|
31,459
|
|
||||
|
Amortization of cemetery property
|
68,102
|
|
66,745
|
|
|
62,407
|
|
||||
|
Amortization of loan costs
|
5,859
|
|
5,826
|
|
|
9,434
|
|
||||
|
Provision for doubtful accounts
|
9,980
|
|
10,776
|
|
|
6,083
|
|
||||
|
(Benefit) provision for deferred income taxes
|
(317,838
|
)
|
7,490
|
|
|
18,048
|
|
||||
|
(Gains) losses on divestitures and impairment charges, net
|
(7,015
|
)
|
26,819
|
|
|
(6,522
|
)
|
||||
|
Share-based compensation
|
14,788
|
|
14,056
|
|
|
13,843
|
|
||||
|
Excess tax benefits from share-based awards
|
—
|
|
(12,685
|
)
|
|
(18,123
|
)
|
||||
|
Change in assets and liabilities, net of effects from acquisitions and dispositions:
|
|
|
|
|
|
|
|
||||
|
(Increase) decrease in receivables
|
(9,740
|
)
|
(14,198
|
)
|
|
464
|
|
||||
|
(Increase) decrease in other assets
|
(15,385
|
)
|
17,855
|
|
|
2,457
|
|
||||
|
Increase in payables and other liabilities
|
81,763
|
|
47,888
|
|
|
20,567
|
|
||||
|
Effect of preneed sales production and maturities:
|
|
|
|
|
|
|
|
||||
|
Increase in preneed receivables, net and trust investments
|
(63,994
|
)
|
(73,394
|
)
|
|
(48,120
|
)
|
||||
|
Increase in deferred revenue
|
31,182
|
|
34,775
|
|
|
67,159
|
|
||||
|
Decrease in deferred receipts held in trust
|
(23,274
|
)
|
(25,831
|
)
|
|
(64,119
|
)
|
||||
|
Net cash provided by operating activities
|
502,340
|
|
463,595
|
|
|
472,186
|
|
||||
|
Cash flows from investing activities:
|
|
|
|
|
|
|
|
||||
|
Capital expenditures
|
(214,501
|
)
|
(193,446
|
)
|
|
(150,986
|
)
|
||||
|
Acquisitions, net of cash acquired
|
(49,988
|
)
|
(69,146
|
)
|
|
(41,258
|
)
|
||||
|
Proceeds from divestitures and sales of property and equipment
|
28,429
|
|
41,310
|
|
|
16,772
|
|
||||
|
Net withdrawals of restricted funds and other
|
175
|
|
5,150
|
|
|
8,066
|
|
||||
|
Net cash used in investing activities from continuing operations
|
(235,885
|
)
|
(216,132
|
)
|
|
(167,406
|
)
|
||||
|
Net cash provided by investing activities from discontinued operations
|
—
|
|
—
|
|
|
987
|
|
||||
|
Net cash used in investing activities
|
(235,885
|
)
|
(216,132
|
)
|
|
(166,419
|
)
|
||||
|
Cash flows from financing activities:
|
|
|
|
|
|
|
|
||||
|
Proceeds from issuance of long-term debt
|
1,787,500
|
|
1,060,000
|
|
|
446,250
|
|
||||
|
Debt issuance costs
|
(12,939
|
)
|
(5,232
|
)
|
|
(6,025
|
)
|
||||
|
Scheduled payments of debt
|
(468,973
|
)
|
(36,414
|
)
|
|
(160,220
|
)
|
||||
|
Early payments of debt
|
(1,117,512
|
)
|
(875,110
|
)
|
|
(197,377
|
)
|
||||
|
Principal payments on capital leases
|
(51,106
|
)
|
(33,119
|
)
|
|
(28,601
|
)
|
||||
|
Proceeds from exercise of stock options
|
33,611
|
|
17,662
|
|
|
31,809
|
|
||||
|
Excess tax benefits from share-based awards
|
—
|
|
12,685
|
|
|
18,123
|
|
||||
|
Purchase of Company common stock
|
(199,637
|
)
|
(227,928
|
)
|
|
(345,261
|
)
|
||||
|
Payments of dividends
|
(108,750
|
)
|
(98,418
|
)
|
|
(87,570
|
)
|
||||
|
Purchase of noncontrolling interest
|
(4,580
|
)
|
(1,961
|
)
|
|
(2,075
|
)
|
||||
|
Bank overdrafts and other
|
5,959
|
|
(1,095
|
)
|
|
(7,531
|
)
|
||||
|
Net cash used in financing activities
|
(136,427
|
)
|
(188,930
|
)
|
|
(338,478
|
)
|
||||
|
Effect of foreign currency
|
5,025
|
|
1,854
|
|
(10,025
|
)
|
|||||
|
Net increase (decrease) in cash and cash equivalents
|
135,053
|
|
60,387
|
|
(42,736
|
)
|
|||||
|
Cash and cash equivalents at beginning of period
|
194,986
|
|
134,599
|
|
177,335
|
|
|||||
|
Cash and cash equivalents at end of period
|
$
|
330,039
|
|
$
|
194,986
|
|
$
|
134,599
|
|
||
(See notes to consolidated financial statements)
45
|
Common
Stock
|
Treasury
Stock,
Par Value
|
Capital in
Excess of
Par Value
|
(Accumulated
Deficit) Retained Earnings
|
Accumulated
Other
Comprehensive
Income
|
Noncontrolling
Interest
|
Total
|
|||||||||||||||||||||
|
|
(In thousands, except per share amounts)
|
||||||||||||||||||||||||||
|
Balance at December 31, 2014
|
$
|
205,458
|
|
$
|
(591
|
)
|
$
|
1,186,304
|
|
$
|
(81,859
|
)
|
$
|
59,414
|
|
$
|
8,652
|
|
$
|
1,377,378
|
|
||||||
|
Comprehensive income
|
—
|
|
—
|
|
—
|
|
233,772
|
|
(53,250
|
)
|
1,129
|
|
181,651
|
|
|||||||||||||
|
Dividends declared on common stock ($.44 per share)
|
—
|
|
—
|
|
(87,570
|
)
|
—
|
|
—
|
|
—
|
|
(87,570
|
)
|
|||||||||||||
|
Stock option exercises
|
3,054
|
|
—
|
|
28,877
|
|
—
|
|
—
|
|
—
|
|
31,931
|
|
|||||||||||||
|
Restricted stock award, net of forfeitures and other
|
254
|
|
(9
|
)
|
(245
|
)
|
—
|
|
—
|
|
—
|
|
—
|
|
|||||||||||||
|
Employee share-based compensation earned
|
—
|
|
—
|
|
13,843
|
|
—
|
|
—
|
|
—
|
|
13,843
|
|
|||||||||||||
|
Purchase of Company common stock
|
—
|
|
(12,455
|
)
|
(71,664
|
)
|
(261,264
|
)
|
—
|
|
—
|
|
(345,383
|
)
|
|||||||||||||
|
Tax benefits of share-based awards
|
—
|
|
—
|
|
18,123
|
|
—
|
|
—
|
|
—
|
|
18,123
|
|
|||||||||||||
|
Purchase of noncontrolling interest
|
—
|
|
—
|
|
2,775
|
|
—
|
|
—
|
|
(4,850
|
)
|
(2,075
|
)
|
|||||||||||||
|
Noncontrolling interest payments
|
—
|
|
—
|
|
—
|
|
—
|
|
—
|
|
(222
|
)
|
(222
|
)
|
|||||||||||||
|
Retirement of treasury shares
|
(7,969
|
)
|
7,969
|
|
—
|
|
—
|
|
—
|
|
—
|
|
—
|
|
|||||||||||||
|
Other
|
62
|
|
—
|
|
1,663
|
|
—
|
|
—
|
|
—
|
|
1,725
|
|
|||||||||||||
|
Balance at December 31, 2015
|
$
|
200,859
|
|
$
|
(5,086
|
)
|
$
|
1,092,106
|
|
$
|
(109,351
|
)
|
$
|
6,164
|
|
$
|
4,709
|
|
$
|
1,189,401
|
|
||||||
|
|
|
|
|
|
|
|
|
|
|
|
|
|
|
||||||||||||||
|
Comprehensive income
|
—
|
|
—
|
|
—
|
|
177,038
|
|
10,328
|
|
270
|
|
187,636
|
|
|||||||||||||
|
Dividends declared on common stock ($.51 per share)
|
—
|
|
—
|
|
(98,418
|
)
|
—
|
|
—
|
|
—
|
|
(98,418
|
)
|
|||||||||||||
|
Stock option exercises
|
2,108
|
|
—
|
|
15,554
|
|
—
|
|
—
|
|
—
|
|
17,662
|
|
|||||||||||||
|
Restricted stock awards, net of forfeitures
|
241
|
|
(1
|
)
|
(240
|
)
|
—
|
|
—
|
|
—
|
|
—
|
|
|||||||||||||
|
Employee share-based compensation earned
|
—
|
|
—
|
|
14,056
|
|
—
|
|
—
|
|
—
|
|
14,056
|
|
|||||||||||||
|
Purchase of Company common stock
|
—
|
|
(8,812
|
)
|
(48,042
|
)
|
(171,074
|
)
|
—
|
|
—
|
|
(227,928
|
)
|
|||||||||||||
|
Tax benefits related to share-based awards
|
—
|
|
—
|
|
12,685
|
|
—
|
|
—
|
|
—
|
|
12,685
|
|
|||||||||||||
|
Purchase of noncontrolling interest
|
—
|
|
—
|
|
364
|
|
—
|
|
—
|
|
(2,325
|
)
|
(1,961
|
)
|
|||||||||||||
|
Noncontrolling interest payments
|
—
|
|
—
|
|
—
|
|
—
|
|
—
|
|
(120
|
)
|
(120
|
)
|
|||||||||||||
|
Retirement of treasury shares
|
(7,901
|
)
|
7,901
|
|
—
|
|
—
|
|
—
|
|
—
|
|
—
|
|
|||||||||||||
|
Other
|
96
|
|
—
|
|
2,138
|
|
—
|
|
—
|
|
—
|
|
2,234
|
|
|||||||||||||
|
Balance at December 31, 2016
|
$
|
195,403
|
|
$
|
(5,998
|
)
|
$
|
990,203
|
|
$
|
(103,387
|
)
|
$
|
16,492
|
|
$
|
2,534
|
|
$
|
1,095,247
|
|
||||||
|
|
|
|
|
|
|
|
|
|
|
|
|
|
|
||||||||||||||
|
Comprehensive income
|
—
|
|
—
|
|
—
|
|
546,663
|
|
25,451
|
|
195
|
|
572,309
|
|
|||||||||||||
|
Dividends declared on common stock ($.58 per share)
|
—
|
|
—
|
|
(37,011
|
)
|
(71,739
|
)
|
—
|
|
—
|
|
(108,750
|
)
|
|||||||||||||
|
Stock option exercises
|
2,759
|
|
—
|
|
30,852
|
|
—
|
|
—
|
|
—
|
|
33,611
|
|
|||||||||||||
|
Restricted stock awards, net of forfeitures
|
209
|
|
(2
|
)
|
(207
|
)
|
—
|
|
—
|
|
—
|
|
—
|
|
|||||||||||||
|
Employee share-based compensation earned
|
—
|
|
—
|
|
14,788
|
|
—
|
|
—
|
|
—
|
|
14,788
|
|
|||||||||||||
|
Purchase of Company common stock
|
—
|
|
(6,211
|
)
|
(32,253
|
)
|
(161,173
|
)
|
—
|
|
—
|
|
(199,637
|
)
|
|||||||||||||
|
Purchase of noncontrolling interest
|
—
|
|
—
|
|
(2,258
|
)
|
—
|
|
—
|
|
(2,322
|
)
|
(4,580
|
)
|
|||||||||||||
|
Noncontrolling interest payments
|
—
|
|
—
|
|
—
|
|
—
|
|
—
|
|
(360
|
)
|
(360
|
)
|
|||||||||||||
|
Retirement of treasury shares
|
(6,890
|
)
|
6,890
|
|
—
|
|
—
|
|
—
|
|
—
|
|
—
|
|
|||||||||||||
|
Other
|
455
|
|
—
|
|
6,354
|
|
—
|
|
—
|
|
—
|
|
6,809
|
|
|||||||||||||
|
Balance at December 31, 2017
|
$
|
191,936
|
|
$
|
(5,321
|
)
|
$
|
970,468
|
|
$
|
210,364
|
|
$
|
41,943
|
|
$
|
47
|
|
$
|
1,409,437
|
|
||||||
(See notes to consolidated financial statements)
46
SERVICE CORPORATION INTERNATIONAL
NOTES TO CONSOLIDATED FINANCIAL STATEMENTS
|
1.
|
Nature of Operations
|
We are North America’s largest provider of deathcare products and services, with a network of funeral service locations and cemeteries operating in the United States and Canada. Our funeral service and cemetery operations consist of funeral service locations, cemeteries, funeral service/cemetery combination locations, crematoria, and other related businesses, which enable us to serve a wide array of customer needs. We sell cemetery property and funeral and cemetery merchandise and services at the time of need and on a preneed basis.
Funeral service locations provide all professional services relating to funerals and cremations, including the use of funeral facilities and motor vehicles, arranging and directing services, removal, preparation, embalming, cremations, memorialization, travel protection, and catering. Funeral merchandise, including burial caskets and related accessories, urns and other cremation receptacles, outer burial containers, flowers, online and video tributes, stationery products, casket and cremation memorialization products, and other ancillary merchandise, is sold at funeral service locations.
Our cemeteries provide cemetery property interment rights, including developed lots, lawn crypts, mausoleum spaces, niches, and other cremation memorialization and interment options. Cemetery merchandise and services, including memorial markers and bases, outer burial containers, flowers and floral placement, other ancillary merchandise, graveside services, merchandise installation, and interments, are sold at our cemeteries.
|
2.
|
Summary of Significant Accounting Policies
|
Principles of Consolidation and Basis of Presentation
Our consolidated financial statements include the accounts of Service Corporation International (SCI) and all subsidiaries in which we hold a controlling financial interest. Intercompany balances and transactions have been eliminated in consolidation.
Our financial statements also include the accounts of the merchandise and service trusts and cemetery perpetual care trusts in which we have a variable interest and are the primary beneficiary. We have retained the specialized industry accounting principles when consolidating the trusts. Our trusts are variable interest entities, for which we have determined that we are the primary beneficiary as we absorb a majority of the losses and returns associated with these trusts. Although we consolidate the trusts, it does not change the legal relationships among the trusts, us, or our customers. The customers are the legal beneficiaries of these trusts; therefore, their interests in these trusts represent a liability to us.
Reclassifications to Prior Period Financial Statements and Adjustments
Certain reclassifications have been made to prior period amounts to conform to the current period financial statement presentation with no effect on our previously reported results of operations, consolidated financial position, or cash flows. In 2017, we moved certain of our crematories from the cemetery segment to the funeral segment and recast prior period amounts to reflect this change in organization structure. For the year 2016, we recorded in
General and administrative expenses
an out-of-period expense of
$5.5 million
for previously improperly capitalized acquisition costs. Such amounts are immaterial to both current and prior period financial statements.
Use of Estimates in the Preparation of Financial Statements
The preparation of the consolidated financial statements in conformity with accounting principles generally accepted in the United States of America requires management to make estimates and assumptions that may affect the reported amounts of assets and liabilities and disclosure of contingent assets and liabilities at the date of the consolidated financial statements and the reported amounts of revenue and expenses during the reporting period. As a result, actual results could differ from these estimates.
Cash and Cash Equivalents
We consider all highly liquid investments with an original maturity of three months or less to be cash equivalents. The carrying amounts of our cash and cash equivalents approximate fair value due to the short-term nature of these instruments.
Accounts Receivable and Allowance for Doubtful Accounts
Our trade receivables primarily consist of amounts due for funeral services already performed. We provide various allowances and cancellation reserves for our preneed and atneed receivables and the related deferred revenue. These allowances are based on an analysis of historical trends of collection and cancellation activity. Atneed funeral and cemetery receivables are considered past due after 30 days. Collections are generally managed by the locations or third party agencies acting on behalf of the locations, until a receivable is 180 days delinquent at which time it is fully reserved and sent to a
47
collection agency. These estimates are impacted by a number of factors, including changes in the economy, and demographic or competitive changes in our areas of operation.
Inventories and Cemetery Property
Funeral and cemetery merchandise are stated at the lower of average cost or net realizable value. Cemetery property is recorded at cost. Inventory costs and cemetery property are relieved using specific identification in performance of a contract. Cemetery property amortization was
$68.1 million
,
$66.7 million
, and
$62.4 million
for the years ended
December 31, 2017
,
2016
, and
2015
, respectively.
Property and Equipment, Net
Property and equipment are recorded at cost. Maintenance and repairs are charged to expense, whereas renewals and major replacements that extend the assets useful lives are capitalized. Depreciation is recognized ratably over the estimated useful lives of the various classes of assets. Buildings are depreciated over a period ranging from
seven
to
forty
years, equipment is depreciated over a period from
three
to
eight
years, and leasehold improvements are depreciated over the shorter of the lease term or
ten
years. Depreciation and amortization expense related to property and equipment was
$153.1 million
,
$147.2 million
, and
$141.5 million
for the years ended
December 31, 2017
,
2016
, and
2015
, respectively. When property is sold or retired, the cost and related accumulated depreciation are removed from the Consolidated Balance Sheet; resulting gains and losses are included in the Consolidated Statement of Operations in the period of sale or disposal.
Leases
We have lease arrangements related to funeral service locations and transportation equipment that were primarily classified as capital leases at
December 31, 2017
. Lease terms related to funeral service locations generally range from
one
to
40
years with options to renew at varying terms. Lease terms related to transportation equipment generally range from
one
to
five
years with options to renew at varying terms. We calculate operating lease expense ratably over the lease term. We consider reasonably assured renewal options and fixed escalation provisions in our calculation. For more information related to leases, see Note 8.
Goodwill
The excess of purchase price over the fair value of identifiable net assets acquired in business combinations is recorded as goodwill. Goodwill is tested annually during the fourth quarter for impairment by assessing the fair value of each of our reporting units.
Our goodwill impairment test involves estimates and management judgment. In order to perform our goodwill impairment test, we compare the fair value of a reporting unit to its carrying amount, including goodwill. We determine fair value of each reporting unit using both a market and income approach. Our methodology considers discounted cash flows and multiples of EBITDA (earnings before interest, taxes, depreciation, and amortization). The discounted cash flow valuation uses projections of future cash flows and includes assumptions concerning future operating performance and economic conditions that may differ from actual future cash flows. We do not record an impairment of goodwill in instances where the fair value of a reporting unit exceeds its carrying amount. If the aggregate fair value is less than the related carrying amount for a reporting unit, we compare the implied fair value of goodwill to the carrying amount of goodwill. If the carrying amount of reporting unit goodwill exceeds the implied fair value of that goodwill, an impairment loss is recognized in an amount equal to that excess.
For our most recent annual impairment test performed in the fourth quarter, we used a
6.5%
discount rate, growth rates ranging from
1.2%
to
4.7%
over a five-year period, plus a terminal value determined using the constant growth method in projecting our future cash flows. Fair value was calculated as the sum of the projected discounted cash flows of our reporting units over the next five years plus terminal value at the end of those five years. Our terminal value was calculated using a long-term growth rate of
2.5%
and
2.9%
for our funeral and cemetery reporting units, respectively.
In addition to our annual review, we assess the impairment of goodwill whenever certain events or changes in circumstances indicate that the carrying value may be greater than fair value. Factors that could trigger an interim impairment review include, but are not limited to, significant underperformance relative to historical or projected future operating results and significant negative industry or economic trends. No interim goodwill impairment reviews were required in
2017
or
2016
. For more information related to goodwill, see Note 4.
Other Intangible Assets
Our intangible assets include customer relationships, trademarks and tradenames, and other intangible assets primarily resulting from acquisitions. Our trademark and tradenames and certain other intangible assets are considered to have an
48
indefinite life and are not subject to amortization. We test for impairment of intangible assets annually during the fourth quarter.
Our intangible asset impairment tests involve estimates and management judgment. For trademark and tradenames, our test uses the relief from royalty method whereby we determine the fair value of the assets by discounting the cash flows that represent a savings over having to pay a royalty fee for use of the trademark and tradenames. The discounted cash flow valuation uses projections of future cash flows and includes assumptions concerning future operating performance and economic conditions that may differ from actual future cash flows. For our most recent annual impairment test performed in the fourth quarter, we estimated that the pre-tax savings would range from
1.0%
to
4.0%
of the revenue associated with the trademark and tradenames, based primarily on our research of intellectual property valuation and licensing databases. We also assumed a terminal growth rate of
2.5%
and
2.9%
for our funeral and cemetery segments, respectively, and discounted the cash flows at a
6.7%
discount rate based on the relative risk of these assets to our overall business.
In addition to our annual review, we assess the impairment of intangible assets whenever certain events or changes in circumstances indicate that the carrying value may be greater than the fair value. Factors that could trigger an interim impairment review include, but are not limited to, significant under-performance relative to historical or projected future operating results and significant negative industry or economic trends. No interim intangible impairment reviews were required in
2017
or
2016
.
Certain of our intangible assets associated with prior acquisitions are relieved using specific identification in performance of a contract. We amortize all other finite-lived intangible assets on a straight-line basis over their estimated useful lives, which range from
two
to
forty
years. For more information related to intangible assets, see Note 4.
Fair Value Measurements
We measure the available-for-sale securities held by our funeral merchandise and service, cemetery merchandise and service, and cemetery perpetual care trusts at fair value on a recurring basis. Fair value is the price that would be received to sell an asset or paid to transfer a liability in an orderly transaction between market participants at the measurement date. We utilize a three-level valuation hierarchy for disclosure of fair value measurements. The valuation hierarchy is based upon the transparency of inputs to the valuation of an asset or liability as of the measurement date. The three levels are defined as follows:
|
•
|
Where quoted prices are available in an active market, securities held by the trusts are classified as Level 1 investments.
|
|
•
|
Where quoted market prices are not available for the specific security, fair values are estimated by using either quoted prices of securities with similar characteristics or an income approach fair value model with observable inputs that include a combination of interest rates, yield curves, credit risks, prepayment speeds, ratings, and tax-exempt status. These securities are classified as Level 2 investments.
|
|
•
|
The valuation of other investments requires management judgment due to the absence of quoted market prices, inherent lack of liquidity, and the long-term nature of such assets. These securities are classified as Level 3 investments.
|
An asset’s or liability’s categorization within the valuation hierarchy is based upon the lowest level of input that is significant to the fair value measurement.
Fixed income commingled funds, money market funds, and private equity investments are measured at net asset value. Fixed income commingled funds and money market funds are redeemable for net asset value with two weeks' notice and immediately, respectively. Our private equity investments include several funds that invest in limited partnerships, distressed debt, real estate, and mezzanine financing. These investments can never be redeemed by the funds. Instead, due to the nature of the investments in this category, distributions are received through the liquidation of the underlying assets of the funds. We estimate that the underlying assets will be liquidated over the next 2 to 10 years.
Valuation policies and procedures are determined by our Trust Services department, which reports to our Chief Financial Officer. Additionally, valuations are reviewed quarterly by the Investment Committee of the Board of Directors.
We assess our trust investments for other-than-temporary declines in fair value on a quarterly basis. Impairment charges resulting from this assessment are recognized as investment losses in
Other income (expense), net
. These investment losses, if any, are offset by the corresponding reclassification in
Other income/(expense),
related to
Deferred receipts held in trust, net
. For the years ended December 31,
2017
,
2016
, and
2015
, we recorded a
$28.9 million
, a
$11.9 million
, and a
$9.6 million
, respectively, impairment charge for other-than-temporary declines in fair value related to certain investments.
49
Treasury Stock
We make treasury stock purchases in the open market or through privately negotiated transactions subject to market conditions and normal trading restrictions. We account for the repurchase of our common stock under the par value method. We canceled
6.9 million
,
7.9 million
, and
8.0 million
shares of common stock held in our treasury in
2017
,
2016
, and
2015
, respectively. These retired treasury shares were changed to authorized but unissued status.
Foreign Currency Translation
All assets and liabilities of Canadian subsidiaries are translated into U.S. dollars at exchange rates in effect as of the end of the reporting period. Revenue and expense items are translated at the average exchange rates for the reporting period. The resulting translation adjustments are included in
Equity
as a component of
Accumulated other comprehensive income
in the Consolidated Statement of Equity and Consolidated Balance Sheet.
The functional currency of SCI and its subsidiaries is the respective local currency. The transactional currency gains and losses that arise from transactions denominated in currencies other than the functional currencies of our operations are recorded in
Other income/(expense), net
in the Consolidated Statement of Operations. We do not have any investments in foreign operations considered to be in highly inflationary economies.
Funeral and Cemetery Operations
Revenue is recognized when merchandise is delivered or services are performed. Revenue associated with sales of preneed cemetery property interment rights is deferred until the property is constructed and a minimum of 10% of the sales price is collected. Sales taxes collected are recognized on a net basis in our consolidated financial statements.
We sell price-guaranteed preneed contracts through various programs providing for future merchandise and services at prices prevailing when the agreements are signed. Revenue associated with sales of preneed contracts is deferred until merchandise is delivered or the services are performed, generally at the time of need. Travel protection and certain memorialization merchandise sold on a preneed basis are delivered to the customer at the time of sale and are recognized at the time delivery occurs. For personalized marker merchandise, with the customer’s direction generally obtained at the time of sale, we may order, store, and transfer title to the customer. In situations in which we have no further obligation or involvement related to the merchandise, we recognize revenue and record the cost of sales upon the earlier of vendor storage of these items or delivery in our cemetery.
The total consideration received for these arrangements is allocated to each item based on relative selling price determined using either vendor specific objective evidence of the selling price or third-party evidence of selling price. Vendor specific objective evidence of the selling price is determined based on the price we sell the items for on a stand-alone basis. Third-party evidence of selling price is based on the price of our largely interchangeable products that are sold in stand-alone sales to similarly situated customers. There is no general right of return for delivered items.
Pursuant to state or provincial law, all or a portion of the proceeds from merchandise or services sold on a preneed basis may be required to be deposited into trust funds. When we receive payments from the customer, we deposit the amount required by law into the merchandise and service trusts and reclassify the corresponding amount from
Deferred revenue
into
Deferred receipts held in trust
. Amounts are withdrawn from the merchandise and service trusts when the contract obligations are performed. We defer investment earnings related to these merchandise and service trusts until the associated merchandise is delivered or services are performed. Fees charged by our wholly-owned registered investment advisor are also included in revenue in the period in which they are earned. In addition, we are entitled to retain, in certain jurisdictions, a portion of collected customer payments when a customer cancels a preneed contract; these amounts are also recognized in revenue.
A portion of the proceeds from the sale of cemetery property interment rights is required by state or provincial law to be paid into perpetual care trust funds. Investment earnings from these trusts are distributed to us regularly, are recognized in current cemetery revenue, and are intended to defray cemetery maintenance costs, which are expensed as incurred. The principal of such perpetual care trust funds generally cannot be withdrawn.
Costs related to sales of merchandise and services are charged to expense when merchandise is delivered or services are performed. Costs related to the sale of property interment rights include the property and construction costs specifically identified by project. Property and construction costs are charged to expense when the revenue is recognized by specific identification in the performance of a contract.
Insurance-funded preneed contracts
Not included in our Consolidated Balance Sheet are insurance-funded preneed contracts that will be funded by life insurance or annuity contracts issued by third party insurers. Where permitted by state or provincial law, customers may arrange their preneed contract by purchasing a life insurance or annuity policy from third-party insurance companies, for which we earn a commission as general sales agent for the insurance company. These general agency commissions (GA
50
revenue) are based on a percentage per contract sold and are recognized as funeral revenue when the insurance purchase transaction between the customer and third-party insurance provider is completed. GA revenue recognized in
2017
,
2016
, and
2015
was
$121.0 million
,
$135.8 million
, and
$137.0 million
, respectively. Direct selling costs incurred pursuant to the sale of insurance-funded preneed contracts are expensed as incurred. The policy amount of the insurance contract between the customer and the third-party insurance company generally equals the amount of the preneed contract. We do not reflect the unfulfilled insurance-funded preneed contract amounts in our Consolidated Balance Sheet. The proceeds of the life insurance policies or annuity contracts will be reflected in funeral revenue as we perform these funerals.
Preneed Funeral and Cemetery Receivables
We sell preneed contracts whereby the customer enters into arrangements for future merchandise and services prior to the time of need. As these contracts are entered into prior to the delivery of the related merchandise and services, the preneed funeral and cemetery receivables are offset by a comparable deferred revenue amount. These receivables have an interest component for which interest income is recorded when the interest amount is considered collectible and realizable, which typically coincides with cash payment. We do not accrue interest on financing receivables that are not paid in accordance with the contractual payment date given the nature of our merchandise and services, the nature of our contracts with customers, and the timing of the delivery of our services. We do not consider receivables to be past due until the merchandise or services are required to be delivered at which time the preneed receivable is paid or reclassified as a trade receivable with payment terms of less than 30 days. As the preneed funeral and cemetery receivables are offset by comparable deferred revenue amounts, we have no risk of loss related to these receivables.
If a preneed contract is canceled prior to delivery, state or provincial law determines the amount of the refund owed to the customer, if any, including the amount of the attributed investment earnings. Upon cancellation, we receive the amount of principal deposited to the trust and previously undistributed net investment earnings and, where required, issue a refund to the customer. We retain excess funds, if any, and recognize the attributed investment earnings (net of any investment earnings payable to the customer) as revenue in the Consolidated Statement of Operations. In certain jurisdictions, we may be obligated to fund any shortfall if the amount deposited for the customer exceeds the funds in trust. Based on our historical experience, we have provided an allowance for cancellation of these receivables, which is recorded as a reduction in receivables with a corresponding offset to deferred revenue.
Income Taxes
We compute income taxes using the liability method. Our ability to realize the benefit of our deferred tax assets requires us to achieve certain future earnings levels. We have established a valuation allowance against a portion of our deferred tax assets. We could be required to further adjust that valuation allowance in the near term if market conditions change materially and future earnings are, or are projected to be, significantly different than our current estimates. An increase in the valuation allowance would result in additional income tax expense in such period. All deferred tax assets and liabilities, along with any related valuation allowances are classified as non-current on our Consolidated Balance Sheet.
On December 22, 2017, the U.S. government enacted comprehensive tax legislation commonly referred to as the Tax Act. The Tax Act makes broad and complex changes to the U.S. tax code by, among other things, reducing the federal corporate income tax rate, requiring payment of a one-time transition tax on unrepatriated earnings of foreign subsidiaries, generally eliminating U.S. federal income taxes on dividends from foreign subsidiaries, creating a new limitation on deductible interest expense, creating bonus depreciation that will allow for full expensing on qualified property, and imposing limitations on deductibility of certain executive compensation.
The SEC staff issued Staff Accounting Bulletin No. 118 (“SAB 118”) to address the application of U.S. GAAP in situations when a registrant does not have the necessary information available, prepared, or analyzed (including computations) in reasonable detail to complete the accounting for certain income tax effects of the Tax Act. SAB 118 provides a measurement period that should not extend beyond one year from the Tax Act enactment date for companies to complete the accounting for the income tax effects of certain elements of the Tax Act. In accordance with SAB 118, we have recognized the provisional tax impacts related to deemed repatriated earnings and the remeasurement of deferred tax assets and liabilities and included these amounts in our consolidated financial statements for the year ended December 31, 2017. The ultimate impact may differ from these provisional amounts, possibly materially, due to, among other things, additional analysis, changes in interpretations and assumptions we have made, additional regulatory guidance that may be issued, and actions we may take as a result of the Tax Act. For further information on the impacts of the Tax Act, see Note 5 in Part II, Item 8. Financial Statements and Supplementary Data.
51
Accounting Standards Adopted in 2017
Stock Compensation
In March 2016, the FASB amended "
Stock Compensation
", modifying certain aspects of the accounting for share-based payment transactions, which requires the tax effects related to share-based payments to be recorded through the statement of operations, simplifies the accounting requirements for forfeitures and employers' tax withholding requirements, and modifies the presentation of certain items on the statement of cash flows. The guidance requires the tax effect related to the settlement of share-based awards be included in income tax benefit or expense in the statement of operations rather than in additional paid-in-capital. This guidance also eliminates the requirement to reclassify excess tax benefits from operating activities to financing activities within the statement of cash flows. We adopted the new guidance in the first quarter of 2017, as required, and the impact of the restricted stock deliveries and option exercises for the year ended December 31, 2017 was a reduction to our provision for income taxes of
$18.6 million
. Prior periods have not been retrospectively adjusted for adoption of this guidance. The remaining amendments to this standard, as noted above, are either not applicable or do not change our current accounting practices and thus do not impact our consolidated financial statements, including our consolidated statement of cash flows.
Inventory
In July 2015, the FASB amended "
Inventory
" to state that an entity using an inventory method other than last-in, first out ("LIFO") or the retail inventory method should measure inventory at the lower of cost or net realizable value. The new guidance clarifies that net realizable value is the estimated selling price in the ordinary course of business, less reasonably predictable costs of completion, disposal, and transportation. The new guidance was effective for us on January 1, 2017 and our adoption did not materially impact our consolidated results of operations, consolidated financial position, or cash flows.
Recently Issued Accounting Standards
Revenue Recognition
In May 2014, the FASB issued
"Revenue from Contracts with Customers",
which replaces most existing revenue recognition guidance. During 2016, the FASB made several amendments to the new standard that clarified guidance on several matters, including principal vs. agent considerations, identifying performance obligations, sales taxes, and licensing.
The new standard, as amended, requires that we recognize revenue in the amount to which we expect to be entitled for delivery of promised goods and services to our customers. The new standard will also result in enhanced revenue-related disclosures, including any significant judgments and changes in judgments. Additionally, the new standard requires the deferral of incremental selling costs to the period in which the underlying revenue is recognized.
We established a cross-functional implementation team and analyzed the impact on our contract portfolio by reviewing our revenue streams and our current policies and procedures to identify potential differences that would result from applying the requirements of the new standard to our contracts. The implementation team reported findings and progress of the project to management on a frequent basis. Through this process, we have identified and made appropriate changes to our processes, systems, and controls to support recognition and disclosure under the new standard.
During 2017, we evaluated the potential changes from adopting the new standard on our future reporting and disclosures. We also reviewed our contracts and developed a process for the systematic application of the standard to existing undelivered performance obligations at adoption. Additionally, we made programming changes to our point-of-sale system to accommodate recognition and disclosure requirements under the new standard. Finally, we identified and designed additional controls around new processes that were implemented upon adoption of the new standard.
The standard primarily impacts the manner in which we recognize a) certain nonrefundable up-front fees and b) incremental costs to acquire new preneed funeral trust contracts and preneed and atneed cemetery contracts (i.e., selling costs). The nonrefundable fees will be deferred and recognized as revenue when the underlying goods and services are delivered to the customer. The incremental selling costs will be deferred and amortized by specific identification to the delivery of the underlying goods and services. Additionally, the amounts due from customers for undelivered performance obligations on cancelable preneed contracts represent contract assets, which are required to be netted with
Deferred revenue
, instead of
Preneed receivables, net and trust investments
on our Consolidated Balance Sheet.
We will continue to expense costs to acquire new preneed funeral insurance contracts in the period incurred. The insurance contracts are not and will not be reflected in our Consolidated Balance Sheet because they do not represent assets or liabilities as we have no claim to the insurance proceeds until the contract is fulfilled and no obligation under the contract until the benefits are assigned to us after the time of need.
We adopted the standard as of January 1, 2018 using the modified retrospective approach, which recognizes the cumulative effect of adoption on that date.
52
Financial Instruments
In January 2016, the FASB amended
"Financial Instruments"
to provide additional guidance on the recognition and measurement of financial assets and liabilities. The amendment requires investments in equity instruments to be measured at fair value with changes in fair value reflected in net income. These changes in fair value will be offset by a corresponding change in the fair value of
Deferred receipts held in trust
or
Care trusts' corpus.
The new guidance was effective for us on January 1, 2018 and our adoption did not materially impact our consolidated results of operations, consolidated financial position, or cash flows.
Stock Compensation
In May 2017, the FASB amended "
Stock Compensation
" to clarify which changes in terms and conditions of share-based awards require accounting for as modifications. Under the new guidance, modification accounting is required only if the fair value, vesting conditions, or the classification of the award (as equity or liability) changes as a result of the change in terms or conditions. The new guidance was effective for us on January 1, 2018, and our adoption did not materially impact our consolidated results of operations, consolidated financial position, or cash flows.
Cash Flow
In August and November 2016, the FASB amended
"Statement of Cash Flows"
to clarify guidance on the classification of certain cash receipts and cash payments. Additionally, the guidance requires that the statement of cash flows reflect changes in restricted cash in addition to cash and cash equivalents. As a result of the amended guidance, we will reclassify premiums paid on early extinguishment of debt from cash flows from operating activities to cash flows from financing activities and both proceeds from insurance claims and premium payments on company-owned life insurance from cash flows from operating activities to cash flows from investing activities. The guidance requires these presentation changes to be made retrospectively and is effective for us beginning in 2018.
Retirement Plans
In March 2017, the FASB amended "
Retirement Plans
" to improve the presentation of net periodic pension cost and net periodic postretirement benefit cost by requiring the classification of interest costs and actuarial gains and losses separately from operating income on the consolidated statement of operations. We intend to apply the practical expedient of reclassifying the amounts disclosed as "total net periodic benefit cost" in Note 11 from operating income to other income in future filings as the guidance requires these presentation changes to be made retrospectively and is effective for us beginning in 2018.
Financial Instruments
In June 2016, the FASB amended
"Financial Instruments"
to provide financial statement users with more decision-useful information about the expected credit losses on debt instruments and other commitments to extend credit held by a reporting entity at each reporting date. This amendment replaces the incurred loss impairment methodology in the current standard with a methodology that reflects expected credit losses and requires consideration of a broader range of reasonable and supportable information to inform credit loss estimates. The new guidance is effective for us on January 1, 2020, and we are still evaluating the impact of adoption on our consolidated results of operations, consolidated financial position, and cash flows.
Leases
In February 2016, the FASB amended
"Leases"
to increase transparency and comparability among organizations. Under the new standard, an entity will be required to recognize lease assets and liabilities on its balance sheet and disclose key information about leasing arrangements. In addition, the new standard offers specific accounting guidance for a lessee, a lessor, and sale and leaseback transactions. Lessees and lessors are required to disclose qualitative and quantitative information about leasing arrangements to enable a user of the financial statements to assess the amount, timing, and uncertainty of cash flows arising from leases. This new standard will be effective for us on January 1, 2019. We are still evaluating the impact of adoption on our consolidated results of operations, consolidated financial position, and cash flows.
Goodwill
In January 2017, the FASB amended
"Goodwill"
to simplify the subsequent measurement of goodwill. Amended guidance eliminates Step 2 from the goodwill impairment test. Instead, impairment is defined as the amount by which the carrying value of the reporting unit exceeds its fair value, up to the total amount of goodwill. The new guidance is effective for us on January 1, 2020, and we are evaluating the impact on our consolidated results of operations, consolidated financial position, and cash flows.
53
|
3.
|
Preneed Activities
|
Preneed receivables, net and trust investments
The components of
Preneed receivables, net and trust investments
in our Consolidated Balance Sheet at
December 31
were as follows:
|
2017
|
2016
|
||||||
|
|
(In thousands)
|
||||||
|
Preneed funeral receivables
|
$
|
336,925
|
|
$
|
312,556
|
|
|
|
Preneed cemetery receivables
|
1,118,146
|
|
1,038,592
|
|
|||
|
Preneed receivables from customers
|
1,455,071
|
|
1,351,148
|
|
|||
|
Unearned finance charge
|
(45,515
|
)
|
(45,989
|
)
|
|||
|
Allowance for cancellation
|
(107,749
|
)
|
(104,740
|
)
|
|||
|
Preneed receivables, net
|
1,301,807
|
|
1,200,419
|
|
|||
|
Trust investments, at market
|
4,749,548
|
|
4,240,963
|
|
|||
|
Assets associated with business held for sale
|
(5,660
|
)
|
—
|
|
|||
|
Insurance-backed fixed income securities and other
|
265,314
|
|
271,248
|
|
|||
|
Trust investments
|
5,009,202
|
|
4,512,211
|
|
|||
|
Less: Cemetery perpetual care trust investments
|
(1,532,167
|
)
|
(1,407,465
|
)
|
|||
|
Preneed trust investments
|
3,477,035
|
|
3,104,746
|
|
|||
|
Preneed receivables, net and trust investments
|
$
|
4,778,842
|
|
$
|
4,305,165
|
|
|
The table below sets forth certain investment-related activities associated with trusts for the years ended
December 31
:
|
2017
|
2016
|
2015
|
|||||||||
|
|
|
(In thousands)
|
|
||||||||
|
Deposits
|
$
|
371,234
|
|
$
|
321,232
|
|
$
|
313,244
|
|
||
|
Withdrawals
|
$
|
415,283
|
|
$
|
350,379
|
|
$
|
364,314
|
|
||
|
Purchases of available-for-sale securities
|
$
|
2,057,348
|
|
$
|
1,462,900
|
|
$
|
1,326,398
|
|
||
|
Sales of available-for-sale securities
|
$
|
1,999,918
|
|
$
|
1,393,728
|
|
$
|
1,261,777
|
|
||
|
Realized gains from sales of available-for-sale securities
(1)(2)
|
$
|
256,413
|
|
$
|
100,284
|
|
$
|
100,477
|
|
||
|
Realized losses from sales of available-for-sale securities
(1)
|
$
|
(76,963
|
)
|
$
|
(113,806
|
)
|
$
|
(79,203
|
)
|
||
|
(1)
|
All realized gains and losses are recognized in
Other income (expense), net
for our trust investments and are offset by a corresponding reclassification in
Other income (expense), net
to
Deferred receipts held in trust
and
Care trusts’ corpus
|
|
(2)
|
Given the positive performance of the financial markets in 2017 and a significant realignment of certain portions of our trust portfolio, we experienced a substantial increase in our realized gains during the year.
|
54
The activity in
Preneed receivables, net and trust investments
for the years ended
December 31
was as follows:
|
2017
|
2016
|
2015
|
|||||||||
|
|
|
(In thousands)
|
|
||||||||
|
Beginning balance — Preneed receivables, net and trust investments
|
$
|
4,305,165
|
|
$
|
4,078,464
|
|
$
|
4,149,692
|
|
||
|
Net preneed contract sales
|
1,257,288
|
|
1,159,194
|
|
1,083,424
|
|
|||||
|
Cash receipts from customers, net of refunds
|
(1,109,380
|
)
|
(1,030,703
|
)
|
(951,099
|
)
|
|||||
|
Deposits to trust
|
328,241
|
|
279,782
|
|
274,361
|
|
|||||
|
Acquisitions of businesses, net
|
8,153
|
|
1,477
|
|
5,804
|
|
|||||
|
Net undistributed investment earnings (losses)
(1)
|
384,512
|
|
145,511
|
|
(80,699
|
)
|
|||||
|
Maturities and distributed earnings
|
(411,452
|
)
|
(337,912
|
)
|
(364,367
|
)
|
|||||
|
Change in cancellation allowance
|
(528
|
)
|
3,329
|
|
741
|
|
|||||
|
Effect of foreign currency and other
|
16,843
|
|
6,023
|
|
(39,393
|
)
|
|||||
|
Ending balance — Preneed receivables net, and trust investments
|
$
|
4,778,842
|
|
$
|
4,305,165
|
|
$
|
4,078,464
|
|
||
|
(1)
|
Includes both realized and unrealized investment earnings.
|
The cost and market values associated with trust investments recorded at market value at
December 31, 2017
and
2016
are detailed below. Cost reflects the investment (net of redemptions) of control holders in the trusts. Market value represents the value of the underlying securities held by the trusts.
|
|
December 31, 2017
|
|||||||||||||||
|
Fair Value Hierarchy Level
|
Cost
|
Unrealized
Gains
|
Unrealized
Losses
|
Value
|
||||||||||||
|
|
|
(In thousands)
|
|
|||||||||||||
|
Fixed income securities:
|
|
|
|
|
|
|
|
|
||||||||
|
U.S. Treasury
|
2
|
$
|
48,805
|
|
$
|
14
|
|
$
|
(117
|
)
|
$
|
48,702
|
|
|||
|
Canadian government
|
2
|
81,500
|
|
160
|
|
(1,089
|
)
|
80,571
|
|
|||||||
|
Corporate
|
2
|
13,540
|
|
327
|
|
(170
|
)
|
13,697
|
|
|||||||
|
Residential mortgage-backed
|
2
|
3,279
|
|
16
|
|
(14
|
)
|
3,281
|
|
|||||||
|
Asset-backed
|
2
|
320
|
|
15
|
|
(10
|
)
|
325
|
|
|||||||
|
Equity securities:
|
|
|
||||||||||||||
|
Preferred stock
|
2
|
7,834
|
|
385
|
|
(139
|
)
|
8,080
|
|
|||||||
|
Common stock:
|
|
|
||||||||||||||
|
United States
|
1
|
1,161,015
|
|
266,822
|
|
(24,739
|
)
|
1,403,098
|
|
|||||||
|
Canada
|
1
|
30,762
|
|
12,545
|
|
(522
|
)
|
42,785
|
|
|||||||
|
Other international
|
1
|
63,510
|
|
13,174
|
|
(2,834
|
)
|
73,850
|
|
|||||||
|
Mutual funds:
|
|
|
||||||||||||||
|
Equity
|
1
|
613,934
|
|
59,100
|
|
(4,312
|
)
|
668,722
|
|
|||||||
|
Fixed income
|
1
|
1,230,196
|
|
11,897
|
|
(23,943
|
)
|
1,218,150
|
|
|||||||
|
Other
|
3
|
5,953
|
|
3,114
|
|
—
|
|
9,067
|
|
|||||||
|
Trust investments, at fair value
|
3,260,648
|
|
367,569
|
|
(57,889
|
)
|
3,570,328
|
|
||||||||
|
Commingled funds
|
||||||||||||||||
|
Fixed income
|
454,242
|
|
235
|
|
(5,860
|
)
|
448,617
|
|
||||||||
|
Equity
|
214,000
|
|
12,826
|
|
—
|
|
226,826
|
|
||||||||
|
Money market funds
|
287,435
|
|
—
|
|
—
|
|
287,435
|
|
||||||||
|
Private equity
|
166,860
|
|
51,631
|
|
(2,149
|
)
|
216,342
|
|
||||||||
|
Trust investments, at net asset value
|
1,122,537
|
|
64,692
|
|
(8,009
|
)
|
1,179,220
|
|
||||||||
|
Trust investments, at market
|
$
|
4,383,185
|
|
$
|
432,261
|
|
$
|
(65,898
|
)
|
$
|
4,749,548
|
|
||||
55
|
|
December 31, 2016
|
|||||||||||||||
|
Fair Value Hierarchy Level
|
Cost
|
Unrealized
Gains
|
Unrealized
Losses
|
Value
|
||||||||||||
|
|
|
(In thousands)
|
|
|||||||||||||
|
Fixed income securities:
|
|
|
|
|
|
|
|
|
||||||||
|
U.S. Treasury
|
2
|
$
|
145,315
|
|
$
|
884
|
|
$
|
(838
|
)
|
$
|
145,361
|
|
|||
|
Canadian government
|
2
|
79,141
|
|
409
|
|
(222
|
)
|
79,328
|
|
|||||||
|
Corporate
|
2
|
18,934
|
|
295
|
|
(227
|
)
|
19,002
|
|
|||||||
|
Residential mortgage-backed
|
2
|
333
|
|
1
|
|
(1
|
)
|
333
|
|
|||||||
|
Asset-backed
|
2
|
448
|
|
16
|
|
(31
|
)
|
433
|
|
|||||||
|
Equity securities:
|
|
|
||||||||||||||
|
Preferred stock
|
2
|
2,907
|
|
83
|
|
(156
|
)
|
2,834
|
|
|||||||
|
Common stock:
|
|
|
||||||||||||||
|
United States
|
1
|
1,107,942
|
|
151,146
|
|
(35,542
|
)
|
1,223,546
|
|
|||||||
|
Canada
|
1
|
25,708
|
|
10,030
|
|
(455
|
)
|
35,283
|
|
|||||||
|
Other international
|
1
|
83,238
|
|
4,995
|
|
(10,632
|
)
|
77,601
|
|
|||||||
|
Mutual funds:
|
|
|
||||||||||||||
|
Equity
|
1
|
688,120
|
|
19,962
|
|
(56,857
|
)
|
651,225
|
|
|||||||
|
Fixed income
|
1
|
875,615
|
|
6,203
|
|
(46,219
|
)
|
835,599
|
|
|||||||
|
Other
|
3
|
4,712
|
|
2,468
|
|
(17
|
)
|
7,163
|
|
|||||||
|
Trust investments, at fair value
|
3,032,413
|
|
196,492
|
|
(151,197
|
)
|
3,077,708
|
|
||||||||
|
Fixed income commingled funds
|
692,434
|
|
8,524
|
|
(12,234
|
)
|
688,724
|
|
||||||||
|
Money market funds
|
304,055
|
|
—
|
|
—
|
|
304,055
|
|
||||||||
|
Private equity
|
175,881
|
|
9,812
|
|
(15,217
|
)
|
170,476
|
|
||||||||
|
Trust investments, at net asset value
|
1,172,370
|
|
18,336
|
|
(27,451
|
)
|
1,163,255
|
|
||||||||
|
Trust investments, at market
|
$
|
4,204,783
|
|
$
|
214,828
|
|
$
|
(178,648
|
)
|
$
|
4,240,963
|
|
||||
As of
December 31, 2017
, our unfunded commitment for our private equity and other investments was
$129.4 million
which, if called, would be funded by the assets of the trusts.
The change in our market-based trust investments with significant unobservable inputs (Level 3) is as follows for the years ended
December 31
:
|
2017
|
2016
|
2015
|
||||||||||
|
(In thousands)
|
||||||||||||
|
Fair value, beginning balance at January 1
|
$
|
7,163
|
|
$
|
8,162
|
|
$
|
6,650
|
|
|||
|
Net unrealized gains included in
Accumulated other comprehensive income
(1)
|
912
|
|
463
|
|
152
|
|
||||||
|
Net realized losses included in
Other income (expense), net
(2)
|
—
|
|
(212
|
)
|
—
|
|
||||||
|
Purchases
|
1,945
|
|
89
|
|
1,360
|
|
||||||
|
Sales
|
(953
|
)
|
(1,339
|
)
|
—
|
|
||||||
|
Fair value, ending balance at December 31
|
$
|
9,067
|
|
$
|
7,163
|
|
$
|
8,162
|
|
|||
|
(1)
|
All unrealized gains recognized in
Accumulated other comprehensive income
for our trust investments are attributable to our preneed customers and are offset by a corresponding reclassification in
Accumulated other comprehensive income
to
Deferred receipts held in trust
.
|
|
(2)
|
All losses recognized in
Other income (expense), net
for our trust investments are attributable to our preneed customers and are offset by a corresponding reclassification in
Other income (expense) income, net
to
Deferred receipts held in trust.
|
Maturity dates of our fixed income securities range from
2017
to
2040
. Maturities of fixed income securities at
December 31, 2017
are estimated as follows:
56
|
|
Fair Value
|
||
|
|
(In thousands)
|
||
|
Due in one year or less
|
$
|
75,831
|
|
|
Due in one to five years
|
61,283
|
|
|
|
Due in five to ten years
|
9,101
|
|
|
|
Thereafter
|
361
|
|
|
|
Total estimated maturities of fixed income securities
|
$
|
146,576
|
|
Recognized trust fund income (realized and unrealized) related to our preneed trust investments was
$112.6 million
,
$94.4 million
, and
$98.4 million
for the years ended
December 31, 2017
,
2016
, and
2015
, respectively. Recognized trust fund income (realized and unrealized) related to our cemetery perpetual care trust investments was
$62.9 million
,
$67.6 million
, and
$59.6 million
for the years ended
December 31, 2017
,
2016
, and
2015
, respectively.
We have determined that the unrealized losses in our trust investments are considered temporary in nature, as the unrealized losses were due to temporary fluctuations in interest rates and equity prices. The investments are diversified across multiple industry segments using a balanced allocation strategy to minimize long-term risk. We believe that none of the securities are other-than-temporarily impaired based on our analysis of the investments. Our analysis included a review of the portfolio holdings and discussions with the individual money managers as to the sector exposures, credit ratings, and the severity and duration of the unrealized losses. Our trust investment unrealized losses, their associated fair values, and the duration of unrealized losses for the years ended
December 31, 2017
and
2016
, are shown in the following tables:
|
|
December 31, 2017
|
||||||||||||||||||||||
|
In Loss Position
Less Than 12 Months
|
In Loss Position
Greater Than 12 Months
|
Total
|
|||||||||||||||||||||
|
Fair
Market
Value
|
Unrealized
Losses
|
Fair
Market
Value
|
Unrealized
Losses
|
Fair
Market
Value
|
Unrealized
Losses
|
||||||||||||||||||
|
|
|
|
(In thousands)
|
|
|
||||||||||||||||||
|
Fixed income securities:
|
|
|
|
|
|
|
|
|
|
|
|
|
|||||||||||
|
U.S. Treasury
|
$
|
29,014
|
|
$
|
(115
|
)
|
$
|
106
|
|
$
|
(2
|
)
|
$
|
29,120
|
|
$
|
(117
|
)
|
|||||
|
Canadian government
|
20,947
|
|
(639
|
)
|
6,370
|
|
(450
|
)
|
27,317
|
|
(1,089
|
)
|
|||||||||||
|
Corporate
|
2,423
|
|
(31
|
)
|
4,453
|
|
(139
|
)
|
6,876
|
|
(170
|
)
|
|||||||||||
|
Residential mortgage-backed
|
2,880
|
|
(12
|
)
|
151
|
|
(2
|
)
|
3,031
|
|
(14
|
)
|
|||||||||||
|
Asset-backed
|
—
|
|
—
|
|
74
|
|
(10
|
)
|
74
|
|
(10
|
)
|
|||||||||||
|
Equity securities:
|
|
|
|
|
|||||||||||||||||||
|
Preferred stock
|
1,106
|
|
(92
|
)
|
248
|
|
(47
|
)
|
1,354
|
|
(139
|
)
|
|||||||||||
|
Common stock:
|
|
|
|
|
|||||||||||||||||||
|
United States
|
184,973
|
|
(20,561
|
)
|
18,542
|
|
(4,178
|
)
|
203,515
|
|
(24,739
|
)
|
|||||||||||
|
Canada
|
1,307
|
|
(224
|
)
|
1,314
|
|
(298
|
)
|
2,621
|
|
(522
|
)
|
|||||||||||
|
Other international
|
19,070
|
|
(2,499
|
)
|
2,327
|
|
(335
|
)
|
21,397
|
|
(2,834
|
)
|
|||||||||||
|
Mutual funds:
|
|
|
|
|
|||||||||||||||||||
|
Equity
|
32,348
|
|
(1,193
|
)
|
21,140
|
|
(3,119
|
)
|
53,488
|
|
(4,312
|
)
|
|||||||||||
|
Fixed income
|
225,766
|
|
(1,402
|
)
|
294,980
|
|
(22,541
|
)
|
520,746
|
|
(23,943
|
)
|
|||||||||||
|
Trust investments, at fair value
|
519,834
|
|
(26,768
|
)
|
349,705
|
|
(31,121
|
)
|
869,539
|
|
(57,889
|
)
|
|||||||||||
|
Commingled funds
|
|||||||||||||||||||||||
|
Fixed income
|
215,295
|
|
(988
|
)
|
181,358
|
|
(4,872
|
)
|
396,653
|
|
(5,860
|
)
|
|||||||||||
|
Private equity
|
—
|
|
—
|
|
11,752
|
|
(2,149
|
)
|
11,752
|
|
(2,149
|
)
|
|||||||||||
|
Trust investments, at net asset value
|
215,295
|
|
(988
|
)
|
193,110
|
|
(7,021
|
)
|
408,405
|
|
(8,009
|
)
|
|||||||||||
|
Total temporarily impaired securities
|
$
|
735,129
|
|
$
|
(27,756
|
)
|
$
|
542,815
|
|
$
|
(38,142
|
)
|
$
|
1,277,944
|
|
$
|
(65,898
|
)
|
|||||
57
|
|
December 31, 2016
|
||||||||||||||||||||||
|
In Loss Position
Less Than 12 Months
|
In Loss Position
Greater Than 12 Months
|
Total
|
|||||||||||||||||||||
|
Fair
Market
Value
|
Unrealized
Losses
|
Fair
Market
Value
|
Unrealized
Losses
|
Fair
Market
Value
|
Unrealized
Losses
|
||||||||||||||||||
|
|
|
|
(In thousands)
|
|
|
||||||||||||||||||
|
Fixed income securities:
|
|
|
|
|
|
|
|
|
|
|
|
|
|||||||||||
|
U.S. Treasury
|
$
|
41,409
|
|
$
|
(838
|
)
|
$
|
—
|
|
$
|
—
|
|
$
|
41,409
|
|
$
|
(838
|
)
|
|||||
|
Canadian government
|
2,913
|
|
(31
|
)
|
3,344
|
|
(191
|
)
|
6,257
|
|
(222
|
)
|
|||||||||||
|
Corporate
|
2,107
|
|
(22
|
)
|
6,162
|
|
(205
|
)
|
8,269
|
|
(227
|
)
|
|||||||||||
|
Residential mortgage-backed
|
303
|
|
(1
|
)
|
—
|
|
—
|
|
303
|
|
(1
|
)
|
|||||||||||
|
Asset backed
|
28
|
|
(22
|
)
|
156
|
|
(9
|
)
|
184
|
|
(31
|
)
|
|||||||||||
|
Equity securities:
|
|
|
|
|
|||||||||||||||||||
|
Preferred stock
|
971
|
|
(53
|
)
|
515
|
|
(103
|
)
|
1,486
|
|
(156
|
)
|
|||||||||||
|
Common stock:
|
|
|
|
|
|||||||||||||||||||
|
United States
|
271,433
|
|
(23,168
|
)
|
50,923
|
|
(12,374
|
)
|
322,356
|
|
(35,542
|
)
|
|||||||||||
|
Canada
|
3,318
|
|
(383
|
)
|
1,078
|
|
(72
|
)
|
4,396
|
|
(455
|
)
|
|||||||||||
|
Other international
|
19,274
|
|
(4,139
|
)
|
24,525
|
|
(6,493
|
)
|
43,799
|
|
(10,632
|
)
|
|||||||||||
|
Mutual funds:
|
|
|
|
|
|||||||||||||||||||
|
Equity
|
234,714
|
|
(9,825
|
)
|
276,504
|
|
(47,032
|
)
|
511,218
|
|
(56,857
|
)
|
|||||||||||
|
Fixed income
|
323,917
|
|
(5,941
|
)
|
425,614
|
|
(40,278
|
)
|
749,531
|
|
(46,219
|
)
|
|||||||||||
|
Other
|
26
|
|
(2
|
)
|
1,160
|
|
(15
|
)
|
1,186
|
|
(17
|
)
|
|||||||||||
|
Trust investments, at fair value
|
900,413
|
|
(44,425
|
)
|
789,981
|
|
(106,772
|
)
|
1,690,394
|
|
(151,197
|
)
|
|||||||||||
|
Fixed income commingled funds
|
473,550
|
|
(11,714
|
)
|
20,587
|
|
(520
|
)
|
494,137
|
|
(12,234
|
)
|
|||||||||||
|
Private equity
|
22,677
|
|
(750
|
)
|
73,100
|
|
(14,467
|
)
|
95,777
|
|
(15,217
|
)
|
|||||||||||
|
Trust investments, at net asset value
|
496,227
|
|
(12,464
|
)
|
93,687
|
|
(14,987
|
)
|
589,914
|
|
(27,451
|
)
|
|||||||||||
|
Total temporarily impaired securities
|
$
|
1,396,640
|
|
$
|
(56,889
|
)
|
$
|
883,668
|
|
$
|
(121,759
|
)
|
$
|
2,280,308
|
|
$
|
(178,648
|
)
|
|||||
Deferred revenue
At
December 31, 2017
and
2016
,
Deferred revenue
, net of allowance for cancellation, represents future revenue, including distributed trust investment earnings associated with unperformed trust-funded preneed contracts that are not held in trust accounts. Future revenue and net trust investment earnings that are held in trust accounts are included in
Deferred receipts held in trust.
The following table summarizes the activity in
Deferred revenue
for the years ended December 31:
|
2017
|
2016
|
2015
|
|||||||||
|
|
(In thousands)
|
||||||||||
|
Beginning balance — Deferred revenue
|
$
|
1,731,417
|
|
$
|
1,677,898
|
|
$
|
1,602,545
|
|
||
|
Net preneed contract sales
|
900,037
|
|
847,848
|
|
794,527
|
|
|||||
|
Acquisitions (divestitures) of businesses, net
|
10,488
|
|
193
|
|
(538
|
)
|
|||||
|
Net investment earnings (losses)
(1)
|
381,436
|
|
146,103
|
|
(80,014
|
)
|
|||||
|
Recognized deferred revenue
|
(876,857
|
)
|
(823,319
|
)
|
(780,423
|
)
|
|||||
|
Change in cancellation allowance
|
(165
|
)
|
5,396
|
|
3,627
|
|
|||||
|
Change in deferred receipts held in trust
|
(361,499
|
)
|
(124,923
|
)
|
142,401
|
|
|||||
|
Effect of foreign currency and other
|
4,919
|
|
2,221
|
|
(4,227
|
)
|
|||||
|
Ending balance — Deferred revenue
|
$
|
1,789,776
|
|
$
|
1,731,417
|
|
$
|
1,677,898
|
|
||
|
(1)
|
Includes both realized and unrealized investment earnings.
|
58
|
4.
|
Goodwill and Intangible Assets
|
The changes in the carrying amounts of goodwill for our funeral and cemetery reporting units are as follows: (in thousands):
|
|
2017
|
2016
|
|||||||||||||||||||||
|
|
Funeral
|
Cemetery
|
Total
|
Funeral
|
Cemetery
|
Total
|
|||||||||||||||||
|
(In thousands)
|
|||||||||||||||||||||||
|
Balance as of January 1
|
$
|
1,493,655
|
|
$
|
305,426
|
|
$
|
1,799,081
|
|
$
|
1,490,502
|
|
$
|
305,838
|
|
$
|
1,796,340
|
|
|||||
|
Increase (decrease) in goodwill related to acquisitions
|
8,013
|
|
1,215
|
|
9,228
|
|
26,809
|
|
(151
|
)
|
26,658
|
|
|||||||||||
|
Reduction of goodwill related to divestitures
|
(5,413
|
)
|
(224
|
)
|
(5,637
|
)
|
(26,554
|
)
|
(270
|
)
|
(26,824
|
)
|
|||||||||||
|
Held for sale
|
(3,082
|
)
|
(177
|
)
|
(3,259
|
)
|
—
|
|
—
|
|
—
|
|
|||||||||||
|
Effect of foreign currency
|
6,568
|
|
—
|
|
6,568
|
|
2,898
|
|
9
|
|
2,907
|
|
|||||||||||
|
Activity
|
6,086
|
|
814
|
|
6,900
|
|
3,153
|
|
(412
|
)
|
2,741
|
|
|||||||||||
|
Balance as of December 31
|
$
|
1,499,741
|
|
$
|
306,240
|
|
$
|
1,805,981
|
|
$
|
1,493,655
|
|
$
|
305,426
|
|
$
|
1,799,081
|
|
|||||
The components of intangible assets at
December 31
were as follows:
|
|
Useful Life
|
||||||||||
|
|
Minimum
|
Maximum
|
2017
|
2016
|
|||||||
|
(Years)
|
(In thousands)
|
||||||||||
|
Amortizing intangibles:
|
|||||||||||
|
Covenants-not-to-compete
|
2
|
-
|
20
|
$
|
214,628
|
|
$
|
211,549
|
|
||
|
Customer relationships
|
10
|
-
|
20
|
129,516
|
|
146,876
|
|
||||
|
Tradenames
|
5
|
-
|
5
|
9,150
|
|
9,150
|
|
||||
|
Other
|
5
|
-
|
40
|
11,927
|
|
11,927
|
|
||||
|
365,221
|
|
379,502
|
|
||||||||
|
Less: accumulated amortization:
|
|||||||||||
|
Covenants-not-to-compete
|
192,296
|
|
186,430
|
|
|||||||
|
Customer relationships
|
61,321
|
|
71,903
|
|
|||||||
|
Tradenames
|
7,320
|
|
5,490
|
|
|||||||
|
Other
|
4,830
|
|
4,238
|
|
|||||||
|
265,767
|
|
268,061
|
|
||||||||
|
Amortizing intangibles, net
|
99,454
|
|
111,441
|
|
|||||||
|
Non-amortizing intangibles:
|
|||||||||||
|
Tradenames
|
Indefinite
|
263,880
|
|
245,984
|
|
||||||
|
Other
|
Indefinite
|
10,765
|
|
10,640
|
|
||||||
|
Non-amortizing intangibles
|
274,645
|
|
256,624
|
|
|||||||
|
Intangible assets, net
|
$
|
374,099
|
|
$
|
368,065
|
|
|||||
59
As part of our annual recoverability testing process during 2017, we recognized
$0.6 million
of impairment on tradenames. Amortization expense for intangible assets was
$27.7 million
,
$31.0 million
, and
$31.5 million
for the years ended
December 31, 2017
,
2016
, and
2015
, respectively. The following is estimated amortization expense, excluding certain intangibles for which we are unable to provide an estimate because they are amortized based on specific identification in the performance of a preneed contract, for the five years subsequent to
December 31, 2017
(in thousands):
|
2018
|
$
|
11,718
|
|
|
2019
|
9,100
|
|
|
|
2020
|
7,371
|
|
|
|
2021
|
6,613
|
|
|
|
2022
|
5,554
|
|
|
|
Total estimated amortization expense
|
$
|
40,356
|
|
|
5.
|
Income Taxes
|
The provision or benefit for income taxes includes U.S. federal income taxes (determined on a consolidated return basis), foreign income taxes, and state income taxes.
On December 22, 2017, the U.S. government enacted comprehensive tax legislation commonly referred to as the Tax Cuts and Jobs Act ("the Tax Act”). The Tax Act makes broad and complex changes to the U.S. tax code by, among other things, reducing the federal corporate income tax rate, requiring payment of a one-time transition tax on unrepatriated earnings of foreign subsidiaries, generally eliminating U.S. federal income taxes on dividends from foreign subsidiaries, creating a new limitation on deductible interest expense, creating a bonus depreciation that will allow for full expensing on qualified property, and imposing limitation on deductibility of certain executive compensation.
The Tax Act reduces the U.S. corporate income tax rate from a maximum of
35%
to a flat
21%
rate, effective January 1, 2018. As a result of the reduction in the U.S. corporate income tax rate, we re-measured our ending net deferred tax liabilities at December 31, 2017 at the rate at which they are expected to reverse in the future and recognized a provisional tax benefit of
$168.4 million
. We are still analyzing certain aspects of the Tax Act, which could potentially affect the measurement of these balances or potentially give rise to new deferred tax amounts.
The Tax Act provided for a one-time deemed mandatory repatriation of post-1986 undistributed foreign E&P through the year ended December 31, 2017. We had an estimated
$195.1 million
of undistributed foreign E&P subject to the deemed mandatory repatriation and recognized a provisional
$22.2 million
of income tax expense, payable over eight years. As of December 31, 2017, foreign withholding taxes have not been provided on the undistributed E&P of our foreign subsidiaries as we intend to permanently reinvest these foreign earnings in those businesses outside the U.S. However, if we were to repatriate such foreign E&P, the foreign withholding tax liability is estimated to be
$10 million
. We have calculated our best estimate of the impact of this provision in accordance with our understanding of the Tax Act and guidance available as of the date of this filing.
Beginning in 2018, the Tax Act includes a new U.S. tax base erosion provision designed to tax the global intangible low-taxed income (“GILTI”). The GILTI provisions require us to include in our U.S. income tax return foreign subsidiary earnings in excess of an allowable return on the foreign subsidiary’s tangible assets. We do not expect GILTI to be material in the future. We have not yet adopted an accounting policy for GILTI pursuant to the recent guidance under SAB 118.
In accordance with SAB 118, we have recognized the provisional tax impacts related to deemed repatriated earnings and the remeasurement of deferred tax assets and liabilities and included these amounts in our consolidated financial statements for the year ended December 31, 2017. The ultimate impact may differ from these provisional amounts, possibly materially, due to, among other things, additional analysis, changes in interpretations and assumptions we have made, additional regulatory guidance that may be issued, and actions we may take as a result of the Tax Act.
Income from continuing operations before income taxes for the years ended
December 31
was composed of the following components:
|
2017
|
2016
|
2015
|
|||||||||
|
|
(In thousands)
|
||||||||||
|
United States
|
$
|
347,680
|
|
$
|
287,946
|
|
$
|
331,622
|
|
||
|
Foreign
|
52,578
|
|
38,712
|
|
38,729
|
|
|||||
|
|
$
|
400,258
|
|
$
|
326,658
|
|
$
|
370,351
|
|
||
60
Income tax (benefit) provision for the years ended
December 31
consisted of the following:
|
2017
|
2016
|
2015
|
|||||||||
|
(In thousands)
|
|||||||||||
|
Current:
|
|
|
|
|
|
|
|||||
|
United States
|
$
|
154,128
|
|
$
|
113,629
|
|
$
|
94,502
|
|
||
|
Foreign
|
12,187
|
|
12,084
|
|
9,270
|
|
|||||
|
State
|
4,934
|
|
16,150
|
|
13,207
|
|
|||||
|
Total current income taxes
|
171,249
|
|
141,863
|
|
116,979
|
|
|||||
|
Deferred:
|
|
|
|
|
|
|
|||||
|
United States
|
$
|
(314,389
|
)
|
$
|
(19,496
|
)
|
$
|
15,918
|
|
||
|
Foreign
|
618
|
|
22,708
|
|
(878
|
)
|
|||||
|
State
|
(4,067
|
)
|
4,278
|
|
3,008
|
|
|||||
|
Total deferred income taxes
|
(317,838
|
)
|
7,490
|
|
18,048
|
|
|||||
|
Total income taxes
|
$
|
(146,589
|
)
|
$
|
149,353
|
|
$
|
135,027
|
|
||
We made income tax payments of
$170.2 million
,
$115.0 million
, and
$105.4 million
in
2017
,
2016
, and
2015
, respectively, and received refunds of
$3.4 million
,
$2.4 million
, and
$1.9 million
, respectively. The income tax payments for 2017 include
$34.2 million
settlement payments to the IRS.
The differences between the U.S. federal statutory income tax rate and our effective tax rate for the years ended
December 31
were as follows:
|
2017
|
2016
|
2015
|
|||||||||
|
|
(In thousands)
|
||||||||||
|
Computed tax provision at the applicable federal statutory income tax rate
|
$
|
140,090
|
|
$
|
114,331
|
|
$
|
129,623
|
|
||
|
State and local taxes, net of federal income tax benefits
|
8,216
|
|
13,279
|
|
10,542
|
|
|||||
|
Foreign jurisdiction differences
|
(6,782
|
)
|
(2,557
|
)
|
(5,183
|
)
|
|||||
|
Permanent differences associated with divestitures
|
1,925
|
|
9,267
|
|
2,909
|
|
|||||
|
Changes in uncertain tax positions and audit settlements
|
(105,821
|
)
|
5,669
|
|
4,046
|
|
|||||
|
Foreign valuation allowance, net of federal income tax benefits
|
1,186
|
|
15,850
|
|
—
|
|
|||||
|
Enactment of US Tax Reform
|
(146,160
|
)
|
—
|
|
—
|
|
|||||
|
Excess tax benefit from share-based compensation
|
(18,521
|
)
|
—
|
|
—
|
|
|||||
|
Other
|
(20,722
|
)
|
(6,486
|
)
|
(6,910
|
)
|
|||||
|
(Benefit from) Provision for income taxes
|
$
|
(146,589
|
)
|
$
|
149,353
|
|
$
|
135,027
|
|
||
|
Total consolidated effective tax rate
|
(36.6
|
)%
|
45.7
|
%
|
36.5
|
%
|
|||||
The lower effective tax rate for the twelve months ended December 31, 2017 was primarily due to the effects of the Tax Act discussed above, and the recent IRS audit settlement as well as the result of tax benefits recognized on the settlement of employee share-based awards from the adoption of new accounting guidance in the first quarter of 2017 (See Note 2 for further information). The higher effective tax rate for the twelve months ended December 31, 2016 was a result of a valuation allowance recorded against foreign net deferred tax assets for which a future net benefit may not be realized, and non-deductible goodwill resulting from gains on divestitures.
61
Deferred taxes are determined based on differences between the financial reporting and tax bases of assets and liabilities and are measured using the enacted tax rates. The tax effects of temporary differences and carryforwards that give rise to significant portions of deferred tax assets and liabilities as of
December 31
consisted of the following:
|
2017
|
2016
|
||||||
|
|
(In thousands)
|
||||||
|
Inventories and cemetery property
|
$
|
(222,431
|
)
|
$
|
(335,795
|
)
|
|
|
Property and equipment
|
(109,631
|
)
|
(149,450
|
)
|
|||
|
Intangibles
|
(194,159
|
)
|
(294,251
|
)
|
|||
|
Other
|
(4,902
|
)
|
(6,980
|
)
|
|||
|
Deferred tax liabilities
|
(531,123
|
)
|
(786,476
|
)
|
|||
|
Loss and tax credit carryforwards
|
170,979
|
|
157,795
|
|
|||
|
Deferred revenue on preneed funeral and cemetery contracts
|
155,679
|
|
223,174
|
|
|||
|
Accrued liabilities
|
62,727
|
|
84,230
|
|
|||
|
Deferred tax assets
|
389,385
|
|
465,199
|
|
|||
|
Less: Valuation allowance
|
(141,154
|
)
|
(132,500
|
)
|
|||
|
Net deferred income tax liability
|
$
|
(282,892
|
)
|
$
|
(453,777
|
)
|
|
Deferred tax assets and deferred income tax liabilities are recognized in our Consolidated Balance Sheet at
December 31
as follows:
|
2017
|
2016
|
||||||
|
(In thousands)
|
|||||||
|
Non-current deferred tax assets
|
$
|
873
|
|
$
|
861
|
|
|
|
Non-current deferred tax liabilities
|
(283,765
|
)
|
(454,638
|
)
|
|||
|
Net deferred income tax liability
|
$
|
(282,892
|
)
|
$
|
(453,777
|
)
|
|
The following table summarizes the activity related to our gross unrecognized tax benefits from
January 1, 2015
to
December 31, 2017
(in thousands):
|
|
Federal, State, and Foreign Tax
|
||
|
|
(In thousands)
|
||
|
Balance at December 31, 2014
|
$
|
191,680
|
|
|
Additions to tax positions related to the current year
|
3,235
|
|
|
|
Reductions to tax positions related to prior years
|
(12,370
|
)
|
|
|
Balance at December 31, 2015
|
$
|
182,545
|
|
|
Reduction to tax positions related to prior years
|
(4,219
|
)
|
|
|
Balance at December 31, 2016
|
$
|
178,326
|
|
|
Reductions to tax positions as a result of audit settlement
|
(30,333
|
)
|
|
|
Reductions to tax positions related to prior years
|
$
|
(68,538
|
)
|
|
Balance at December 31, 2017
|
$
|
79,455
|
|
Our total unrecognized tax benefits that, if recognized, would affect our effective tax rates were
$79.5 million
,
$161.8 million
, and
$157.2 million
as of
December 31, 2017
,
2016
, and
2015
, respectively.
We include potential accrued interest and penalties related to unrecognized tax benefits within our income tax provision account. We have accrued
$11.1 million
,
$57.3 million
, and
$51.6 million
for the payment of interest, net of tax benefits, and penalties as of
December 31, 2017
,
2016
, and
2015
, respectively. We recorded a decrease of interest and penalties of
$46.2 million
, and an increase of
$5.7 million
, and
$4.0 million
for the years ended
December 31, 2017
,
2016
, and
2015
, respectively. To the extent interest and penalties are not assessed with respect to uncertain tax positions or the uncertainty of deductions in the future, amounts accrued will be reduced and reflected as a reduction of the overall income tax provision.
62
We file income tax returns, including tax returns for our subsidiaries, with federal, state, local, and foreign jurisdictions. We consider the United States to be our most significant jurisdiction; however, all tax returns are subject to routine compliance review by the taxing authorities in the jurisdictions in which we file tax returns in the ordinary course of business.
In March 2017, we received from the IRS Office of Appeals the fully executed Form 870-AD for the years 1999-2005,
which effectively settled the issues under audit for those years. As a result of this resolution, we recognized a reduction in our
unrecognized tax benefits of
$143.0 million
, of which
$102.5 million
was recognized as an income tax benefit for the matters
that were effectively settled with an increase in our taxes payable of
$40.5 million
. In June 2017, we made
$34.2 million
in
settlement payments and associated interest to the IRS. Tax years subsequent to 2005 remain open to review and adjustment by the IRS. Moreover, various state jurisdictions are auditing years 2000 through 2016. It is reasonably possible that the amount of unrecognized tax benefits could significantly decrease over the next 12 months. However, since the years to which uncertain tax positions relate remain subject to review by the tax authorities, a current estimate of the range of decrease that may occur within the next 12 months cannot be made.
Various subsidiaries have state and foreign loss carryforwards in the aggregate of
$3.8 billion
with expiration dates through
2032
. Such loss carryforwards will expire as follows:
|
Federal
|
State
|
Foreign
|
Total
|
||||||||||||
|
|
(In thousands)
|
||||||||||||||
|
2018
|
$
|
—
|
|
$
|
108,312
|
|
$
|
—
|
|
$
|
108,312
|
|
|||
|
2019
|
—
|
|
127,914
|
|
—
|
|
127,914
|
|
|||||||
|
2020
|
—
|
|
176,591
|
|
—
|
|
176,591
|
|
|||||||
|
2021
|
—
|
|
158,672
|
|
—
|
|
158,672
|
|
|||||||
|
Thereafter
|
—
|
|
3,232,606
|
|
7,151
|
|
3,239,757
|
|
|||||||
|
Total
|
$
|
—
|
|
$
|
3,804,095
|
|
$
|
7,151
|
|
$
|
3,811,246
|
|
|||
In addition to the above loss carryforwards, we have
$58.4 million
of foreign losses that have an indefinite expiration.
In assessing the usefulness of deferred tax assets, we consider whether it is more likely than not that some portion or all of the net deferred tax assets will not be realized. The ultimate realization of net deferred tax assets is dependent upon the generation of future taxable income during the periods in which those temporary differences become deductible. During 2017, we recorded a net
$3.2 million
increase in state valuation allowance, due primarily to the reduction of federal benefit related to the new lower federal tax rate, partially offset by state net operating loss expirations. We also recorded a
$4.8 million
increase in foreign valuation allowance, due primarily to the effects of the federal tax rate reduction. The valuation allowances can be affected in future periods by changes to tax laws, changes to statutory tax rates, and changes in estimates of future taxable income.
At
December 31, 2017
, our loss and tax credit carryforward deferred tax assets and related valuation allowances by jurisdiction are as follows (presented net of federal benefit):
|
Federal
|
State
|
Foreign
|
Total
|
||||||||||||
|
|
|
(In thousands)
|
|
||||||||||||
|
Loss and tax credit carryforwards
|
$
|
—
|
|
$
|
150,031
|
|
$
|
20,948
|
|
$
|
170,979
|
|
|||
|
Valuation allowance
|
$
|
—
|
|
$
|
104,637
|
|
$
|
36,517
|
|
$
|
141,154
|
|
|||
63
Debt as of
December 31
was as follows:
|
2017
|
2016
|
||||||
|
|
(In thousands)
|
||||||
|
7.625% Senior Notes due October 2018
|
250,000
|
|
250,000
|
|
|||
|
4.5% Senior Notes due November 2020
|
200,000
|
|
200,000
|
|
|||
|
8.0% Senior Notes due November 2021
|
150,000
|
|
150,000
|
|
|||
|
5.375% Senior Notes due January 2022
|
425,000
|
|
425,000
|
|
|||
|
5.375% Senior Notes due May 2024
|
850,000
|
|
850,000
|
|
|||
|
7.5% Senior Notes due April 2027
|
200,000
|
|
200,000
|
|
|||
|
4.625% Senior Notes due December 2027
|
550,000
|
|
—
|
|
|||
|
Term Loan due December 2022
|
675,000
|
|
—
|
|
|||
|
Term Loan due March 2021
|
—
|
|
673,750
|
|
|||
|
Bank Credit Facility due March 2021
|
—
|
|
350,000
|
|
|||
|
Obligations under capital leases
|
197,232
|
|
208,758
|
|
|||
|
Mortgage notes and other debt, maturities through 2050
|
6,036
|
|
3,753
|
|
|||
|
Unamortized premiums (discounts) and other, net
|
7,456
|
|
8,313
|
|
|||
|
Unamortized debt issuance costs
|
(38,071
|
)
|
(32,984
|
)
|
|||
|
Total debt
|
3,472,653
|
|
3,286,590
|
|
|||
|
Less: Current maturities of long-term debt
|
(337,337
|
)
|
(89,974
|
)
|
|||
|
Total long-term debt
|
$
|
3,135,316
|
|
$
|
3,196,616
|
|
|
Current maturities of debt at
December 31, 2017
include amounts due within one year on publicly traded notes, our term loan, and capital leases. The publicly traded notes are a $
250.0 million
7.625% Senior notes due October 2018, which were redeemed on January 12, 2018.
Our consolidated debt had a weighted average interest rate of
4.73%
and
4.68%
at
December 31, 2017
and
2016
, respectively. Approximately
75%
and
63%
of our total debt had a fixed interest rate at
December 31, 2017
and
2016
, respectively.
The following table summarizes the aggregate maturities of our debt for the five years subsequent to
December 31, 2017
and thereafter, excluding unamortized premiums (discounts) and debt issuance costs (in thousands):
|
2018
|
$
|
342,786
|
|
|
2019
|
64,665
|
|
|
|
2020
|
270,423
|
|
|
|
2021
|
216,731
|
|
|
|
2022
|
976,331
|
|
|
|
2023 and thereafter
|
1,632,332
|
|
|
|
Total debt maturities
|
$
|
3,503,268
|
|
Bank Credit Facility
In December 2017, we entered into a new
$1.7 billion
bank credit agreement due
December 2022
with a syndicate of banks. The
$1.7 billion
bank credit agreement comprises a
$1.0 billion
Bank Credit Facility and a
$0.7 billion
Term Loan, both due
December 2022
, including a sublimit of $
100 million
for letters of credit.
As of
December 31, 2017
, we have no outstanding borrowings under our Bank Credit Facility and have issued
$33.3 million
of letters of credit. The Bank Credit Facility provides us with flexibility, if needed, and is guaranteed by a majority of our domestic subsidiaries. The subsidiary guaranty is a guaranty of payment of the outstanding amount of the total lending commitment, including letters of credit. The Bank Credit Facility contains certain financial covenants, including a minimum interest coverage ratio, a maximum leverage ratio, and certain dividend and share repurchase restrictions. As of
December 31, 2017
, we are in compliance with all covenants. We pay a quarterly fee on the unused commitment, which was
0.25%
at
December 31, 2017
. As of
December 31, 2017
, we have
$966.7 million
in borrowing capacity under the facility.
64
As of December 31, 2016, we had a $
673.8 million
Term Loan and $
350 million
Bank Credit Facility due March 2021 with a syndicate of financial institutions, including a sublimit of $
100 million
for letters of credit; which were replaced by the new bank credit agreement in December 2017.
Debt Issuances and Additions
During the year ended December 31, 2017, we borrowed $
675.0 million
on our Term Loan due December 2022, $
562.5 million
on our Bank Credit Facilities, and issued $
550.0 million
unsecured 4.625% Senior Notes Due December 2027 to make the 2017 debt payments described below, to fund acquisition activity, and for general corporate purposes. These transactions resulted in an additional $
12.9 million
of debt issuance costs.
Debt Extinguishments and Reductions
During the year ended
December 31, 2017
, we made debt payments of $
1.6 billion
for scheduled and early payments including:
|
•
|
$
647.5 million
in aggregate principal of our Term Loan due March 2021;
|
|
•
|
$
470.0 million
in aggregate principal of our Bank Credit Facility due March 2021;
|
|
•
|
$
442.5 million
in aggregate principal of our Bank Credit Facility due December 2022;
|
|
•
|
$
26.3 million
in aggregate principal of our Term Loan due March 2021 as a scheduled payment; and
|
|
•
|
$0.2 million
in other debt.
|
During the year ended December 31, 2016, we made debt payments of $
911.5 million
for scheduled and early extinguishment payments including:
|
•
|
$310.0 million
in aggregate principal of our Term Loan due to July 2018;
|
|
•
|
$295.0 million
in aggregate principal of our 7.0% Senior Notes due 2017;
|
|
•
|
$280.0 million
in aggregate principal of our Bank Credit Facility due July 2018; and
|
|
•
|
$26.3 million
in aggregate principal of our Term Loan due March 2021.
|
|
•
|
$0.2 million
in other debt.
|
Certain of the above transactions resulted in the recognition of a loss of
$22.5 million
recorded in
Losses on early extinguishment of debt
in our Consolidated Statement of Operations for the year ended December 31, 2016.
Additional Debt Disclosures
At
December 31, 2017
and
2016
, we had deposits of
$3.7 million
and
$4.7 million
, respectively, in restricted, interest-bearing accounts that were pledged as collateral for various credit instruments and commercial commitments. These deposits are included in
Other current assets
and
Deferred charges and other assets
in our Consolidated Balance Sheet.
We had assets of approximately
$1.2 million
and
$1.4 million
pledged as collateral for the mortgage notes and other debt at
December 31, 2017
and
2016
, respectively.
Cash interest payments for the three years ended
December 31
were as follows (in thousands):
|
Payments in 2017
|
$
|
160,843
|
|
|
Payments in 2016
|
$
|
156,950
|
|
|
Payments in 2015
|
$
|
164,748
|
|
Expected cash interest payments for the five years subsequent to
December 31, 2017
and thereafter are as follows (in thousands):
|
Payments in 2018
|
$
|
160,076
|
|
|
Payments in 2019
|
144,948
|
|
|
|
Payments in 2020
|
143,879
|
|
|
|
Payments in 2021
|
133,972
|
|
|
|
Payments in 2022
|
92,235
|
|
|
|
Payments in 2023 and thereafter
|
264,398
|
|
|
|
Total expected cash interest payments
|
$
|
939,508
|
|
65
Subsequent Events
In January 2018, we drew $
175.0 million
on our Bank Credit Facility due December 2022 to repay our $
250.0 million
7.625% Senior notes due October 2018.
|
7.
|
Credit Risk and Fair Value of Financial Instruments
|
Fair Value Estimates
The fair value estimates of the following financial instruments have been determined using available market information and appropriate valuation methodologies. The carrying values of cash and cash equivalents, trade receivables, and trade payables approximate the fair values of those instruments due to the short-term nature of the instruments. The carrying values of receivables on preneed funeral and cemetery contracts approximate fair value due to the diverse number of individual contracts with varying terms.
The fair value of our debt instruments at
December 31
was as follows:
|
2017
|
2016
|
||||||
|
|
(In thousands)
|
||||||
|
7.625% Senior Notes due October 2018
|
$
|
259,563
|
|
$
|
272,353
|
|
|
|
4.5% Senior Notes due November 2020
|
199,590
|
|
205,000
|
|
|||
|
8.0% Senior Notes due November 2021
|
175,313
|
|
175,500
|
|
|||
|
5.375% Senior Notes due January 2022
|
436,178
|
|
444,614
|
|
|||
|
5.375% Senior Notes due May 2024
|
892,118
|
|
884,000
|
|
|||
|
4.625% Senior Notes due December 2027
|
558,250
|
|
—
|
|
|||
|
7.5% Senior Notes due April 2027
|
238,004
|
|
231,590
|
|
|||
|
Term Loan due March 2021
|
—
|
|
673,750
|
|
|||
|
Bank Credit Facility due March 2021
|
—
|
|
350,000
|
|
|||
|
Term Loan due December 2022
|
675,000
|
|
—
|
|
|||
|
Mortgage notes and other debt, maturities through 2050
|
6,036
|
|
3,753
|
|
|||
|
Total fair value of debt instruments
|
$
|
3,440,052
|
|
$
|
3,240,560
|
|
|
The fair values of our long-term, fixed rate loans were estimated using market prices for those loans, and therefore they are classified within Level 2 of the fair value measurements hierarchy. The Term Loan, Bank Credit Facility agreement, and the mortgage and other debt are classified within Level 3 of the fair value measurements hierarchy. The fair values of these instruments have been estimated using discounted cash flow analysis based on our incremental borrowing rate for similar borrowing arrangements. An increase (decrease) in the inputs results in a directionally opposite change in the fair value of the instruments.
Credit Risk Exposure
Our cash deposits, some of which exceed insured limits, are distributed among various market and national banks in the jurisdictions in which we operate. In addition, we regularly invest excess cash in financial instruments that are not insured, such as commercial paper that is offered by corporations with quality credit ratings and money market funds and Eurodollar time deposits that are offered by a variety of reputable financial institutions. We believe that the credit risk associated with such instruments is minimal.
We grant credit to customers in the normal course of business. The credit risk associated with our funeral, cemetery, and preneed funeral and preneed cemetery receivables due from customers is generally considered minimal because of the diversification of the customers served. Furthermore, bad debts have not been significant relative to the volume of deferred revenue. Customer payments on preneed funeral or preneed cemetery contracts that are either placed into state-regulated trusts or used to pay premiums on life insurance contracts generally do not subject us to collection risk. Insurance-funded contracts are subject to supervision by state insurance departments and are protected in the majority of states by insurance guaranty acts.
|
8.
|
Commitments and Contingencies
|
Leases
Our leases principally relate to funeral home facilities and transportation equipment. The majority of our lease arrangements contain options to (i) purchase the property at fair value on the exercise date, (ii) purchase the property for a value determined at the inception of the lease, or (iii) renew the lease for the fair rental value at the end of the primary lease term. Rental expense for operating leases was
$30.5 million
,
$31.9 million
, and
$33.3 million
for the years ended
December 31,
66
2017
,
2016
, and
2015
, respectively. As of
December 31, 2017
, future minimum lease payments for non-cancelable operating and capital leases exceeding one year were as follows:
|
Operating
|
Capital
|
||||||
|
|
(In thousands)
|
||||||
|
2018
|
$
|
13,683
|
|
$
|
58,678
|
|
|
|
2019
|
10,889
|
|
30,528
|
|
|||
|
2020
|
9,461
|
|
36,344
|
|
|||
|
2021
|
8,404
|
|
32,690
|
|
|||
|
2022
|
7,739
|
|
11,044
|
|
|||
|
2023 and thereafter
|
59,473
|
|
27,948
|
|
|||
|
Total
|
$
|
109,649
|
|
$
|
197,232
|
|
|
|
Less: Interest on capital leases
|
(30,694
|
)
|
|||||
|
Total principal payable on capital leases
|
|
|
$
|
166,538
|
|
||
Employment and Management, Consulting, and Non-Competition Agreements
We have entered into employment and management, consulting, and non-competition agreements, generally for
five
to
ten
years, with certain officers and employees and former owners of businesses that we acquired. At
December 31, 2017
, the maximum estimated future cash commitments under agreements with remaining commitment terms, and with original terms of more than one year, were as follows:
|
Employment and Management
|
Consulting
|
Non-Competition
|
Total
|
||||||||||||
|
|
(In thousands)
|
||||||||||||||
|
2018
|
$
|
1,796
|
|
$
|
412
|
|
$
|
5,230
|
|
$
|
7,438
|
|
|||
|
2019
|
1,257
|
|
367
|
|
4,822
|
|
6,446
|
|
|||||||
|
2020
|
609
|
|
258
|
|
3,594
|
|
4,461
|
|
|||||||
|
2021
|
307
|
|
217
|
|
2,554
|
|
3,078
|
|
|||||||
|
2022
|
51
|
|
146
|
|
1,935
|
|
2,132
|
|
|||||||
|
2023 and thereafter
|
—
|
|
255
|
|
3,977
|
|
4,232
|
|
|||||||
|
Total
|
$
|
4,020
|
|
$
|
1,655
|
|
$
|
22,112
|
|
$
|
27,787
|
|
|||
Insurance Loss Reserves
We purchase comprehensive general liability, morticians and cemetery professional liability, automobile liability, and workers’ compensation insurance coverage structured with high deductibles. The high-deductible insurance program means we are primarily self-insured for claims and associated costs and losses covered by these policies. As of
December 31, 2017
and
2016
, we have self-insurance reserves of
$78.2 million
and
$78.0 million
, respectively.
Litigation and Regulatory Matters
We are a party to various litigation and regulatory matters, investigations, and proceedings. Some of the more frequent routine litigations incidental to our business are based on burial practices claims and employment-related matters, including discrimination, harassment, and wage and hour laws and regulations. For each of our outstanding legal matters, we evaluate the merits of the case, our exposure to the matter, possible legal or settlement strategies, and the likelihood of an unfavorable outcome. We intend to vigorously defend ourselves in the matters described herein; however, if we determine that an unfavorable outcome is probable and can be reasonably estimated, we establish the necessary accruals. We hold certain insurance policies that may reduce cash outflows with respect to an adverse outcome of certain of these matters. We accrue such insurance recoveries when they become probable of being paid and can be reasonably estimated.
Wage and Hour Claims
. We are named a defendant in various lawsuits alleging violations of federal and state laws regulating wage and hour pay, including but not limited to the Samborsky, Vasquez, Romano, and Horton lawsuits described below.
67
Charles Samborsky, et al, individually and on behalf of those persons similarly situated, v. SCI California Funeral Services, Inc., et al ;
Case No. BC544180; in the Superior Court of the State of California for the County of Los Angeles, Central District-Central Civil West Courthouse. This lawsuit was filed in April 2014 against an SCI subsidiary and purports to have been brought on behalf of employees who worked as family service counselors in California since April 2010. The plaintiffs allege causes of action for various violations of state laws regulating wage and hour pay. The plaintiffs seek unpaid wages, compensatory and punitive damages, attorneys’ fees and costs, interest, and injunctive relief. The claims have been sent to arbitration. In July 2017, the arbitrator entered an award rejecting the plantiffs' claims, ruling that they did not sue the correct party. We cannot quantify our ultimate liability, if any, in this lawsuit.
Adrian Mercedes Vasquez, an individual and on behalf of others similarly situated, v. California Cemetery and Funeral Services, LLC, et al;
Case No. BC58837; in the Superior Court of the State of California for the County of Los Angeles. This lawsuit was filed in July 2015 against SCI subsidiaries and purports to be brought on behalf of current and former non-exempt California employees of defendants during the four years preceding the filing of the complaint. The plaintiff alleges numerous causes of action for alleged wage and hour pay violations. The plaintiff seeks unpaid wages, compensatory and punitive damages, attorneys’ fees and costs, interest, and injunctive relief. The claims have been ordered to arbitration and the arbitrator has determined that the claims will proceed as a bilateral proceeding. In addition, the plaintiff filed an unfair labor practice charge against defendants with the National Labor Relations Board alleging that by enforcing a mandatory arbitration provision, defendants allegedly violated the National Labor Relations Act. We cannot quantify our ultimate liability, if any, in this lawsuit.
Nicole Romano, individually and on behalf of all others similarly situated v. SCI Direct, Inc., et al;
Case No. BC656654; in the Superior Court of California for the County of Los Angeles. This lawsuit was filed in April 2017 against an SCI subsidiary and purports to have been brought on behalf of persons who worked as independent sales representatives in the U.S. during the four years preceding the filing of the complaint. The plaintiff alleges numerous causes of action for alleged wage and hour pay violations, including misclassifying the independent sales representatives as independent contractors instead of employees. The plaintiff seeks unpaid wages, compulsory and punitive damages, attorneys’ fees and costs, interest, and injunctive relief. We cannot quantify our ultimate liability, if any, in the lawsuit.
Felicia Horton, an individual and on behalf of other aggrieved employees v. SCI Direct, Inc., et al;
Case No. 37-2016-00039356-CU-OE-CTL; in the Superior Court of California for the County of San Diego. This lawsuit was filed in November 2016 on behalf of the plaintiff who worked as an independent sales representative of our subsidiary in California. In addition, this lawsuit asserts claims under California Private Attorney General Act (“PAGA”) provisions on behalf of other similarly situated California persons. The lawsuit alleges causes of action and seeks damages and relief similar to those in the Romano case described above. The attorneys in the Horton case have also filed additional lawsuits alleging individual and PAGA claims similar to those alleged in the Horton case. The additional lawsuits are styled
Jandy Quismundo v. SCI Direct, Inc., et al;
Case No. 37-2017-00031825-CU-OE-CTL; in the Superior Court of California for the County of San Diego, and
Jaime Kallweit v. SCI Direct, Inc., et al;
Case No. 37-2017-00037186-CU-OE-CTL; in the Superior Court for the State of California for the County of San Diego. We cannot quantify our ultimate liability, if any, in the lawsuits.
Claims Regarding the Acquisition of Stewart Enterprises
. We are involved in the following lawsuit.
Karen Moulton, Individually and on behalf of all others similarly situated v. Stewart Enterprises, Inc., Service Corporation International and others ;
Case No. 2013-5636; in the Civil District Court Parish of New Orleans. This case was filed as a class action in June 2013 against SCI and our subsidiary in connection with SCI's acquisition of Stewart Enterprises, Inc. The plaintiffs allege that SCI aided and abetted breaches of fiduciary duties by Stewart Enterprises and its board of directors in negotiating the combination of Stewart Enterprises with a subsidiary of SCI. The plaintiffs seek damages concerning the combination. We filed exceptions to the plaintiffs’ complaint that were granted in June 2014. Thus, subject to appeals, SCI will no longer be party to the suit. The case has continued against our subsidiary, Stewart Enterprises, and its former individual directors. However, in October 2016, the court entered a judgment dismissing all of plaintiffs’ claims. Plaintiffs have filed documents indicating that they are appealing the dismissal. We cannot quantify our ultimate liability, if any, for the payment of damages.
Operational Claims.
We are named a defendant in various lawsuits alleging operational claims, including but not limited to the Allard and Schaefer lawsuits described below.
Linda Allard, on behalf of herself and all others similarly situated v. SCI Direct, Inc.,
Case No 16-1033; in the United States District Court, Middle District of Tennessee. This case was filed in June 2016 as a class action under the Telephone Consumer Protection Act (the Act). Plaintiff alleges she received telemarketing telephone calls that were made with a
68
prerecorded voice or made by an automatic telephone dialing system in violation of the Act. Plaintiff seeks actual and statutory damages, as well as attorney’s fees and costs. The parties reached a settlement of the lawsuit as reported in our Form 8-K filed on August 30, 2017. The settlement agreement is subject to court approval and notice to the class. The financial terms of the settlement call for SCI Direct to pay $15.0 million, of which $3.5 million will be paid by its insurer. As of December 31, 2017, the Company has met all obligations under the settlement agreement.
Caroline Bernstein, on behalf of herself and Marla Urofsky on behalf of Rhea Schwartz, and both on behalf of all others similarly situated v. SCI Pennsylvania Funeral Services, Inc. and Service Corporation International
, Case No. 2:17-cv-04960-GAM; in the United States District Court Eastern District of Pennsylvania. This case was filed in November 2017 as a purported national or alternatively as a Pennsylvania class action regarding our Forest Hills/Shalom Memorial Park in Huntingdon Valley, Pennsylvania and our Roosevelt Memorial Park Cemetery in Trevose, Pennsylvania. Plaintiffs allege wrongful burial and sales practices. Plaintiffs seek compensatory, consequential and punitive damages, attorneys’ fees and costs, interest, and injunctive relief. We cannot quantify our ultimate liability, if any, in this matter.
Unclaimed Property Audit.
We are involved in the following matter.
We have received notices from third party auditors representing unclaimed property departments of certain states regarding preneed funeral and cemetery contracts that were not funded by the purchase and assignment of the proceeds of insurance policies. The auditor claims that we are subject to the laws of those states concerning escheatment of unclaimed funds. The auditor seeks escheatment of funds from the portion of such contracts for which it claims that we will probably not be required to provide services or merchandise in the future. No actual audits have commenced at this time. We cannot quantify our ultimate liability, if any, in this matter.
The ultimate outcome of the matters described above cannot be determined at this time. We intend to vigorously defend all of the above matters; however, an adverse decision in one or more of such matters could have a material effect on us, our financial condition, results of operations, and cash flows.
|
9.
|
Equity
|
(All shares reported in whole numbers)
Share Authorization
We are authorized to issue
1,000,000
shares of preferred stock,
$1
per share par value. No preferred shares were issued as of
December 31, 2017
or
2016
. At
December 31, 2017
and
2016
,
500,000,000
common shares of
$1
par value were authorized.
We had
191,935,647
and
195,403,644
shares issued and
186,614,747
and
189,405,244
outstanding at par at
December 31, 2017
and
2016
, respectively.
69
Accumulated Other Comprehensive Income
Our components of
Accumulated other comprehensive income
are as follows:
|
Foreign
Currency
Translation
Adjustment
|
Unrealized
Gains and
Losses
|
Accumulated
Other
Comprehensive
(Loss) Income
|
|||||||||
|
|
(In thousands)
|
||||||||||
|
Balance at December 31, 2014
|
$
|
59,414
|
|
$
|
—
|
|
$
|
59,414
|
|
||
|
Activity in 2015
|
(53,250
|
)
|
—
|
|
(53,250
|
)
|
|||||
|
Net unrealized losses associated with available-for-sale securities of the trusts, net of taxes
|
—
|
|
(85,140
|
)
|
(85,140
|
)
|
|||||
|
Reclassification of net unrealized losses activity attributable to the
Deferred receipts held in trust and Care trusts’ corpus,
net of taxes
|
—
|
|
85,140
|
|
85,140
|
|
|||||
|
Balance at December 31, 2015
|
$
|
6,164
|
|
$
|
—
|
|
$
|
6,164
|
|
||
|
Activity in 2016
|
10,328
|
|
—
|
|
10,328
|
|
|||||
|
Net unrealized gains associated with available-for-sale securities of the trusts, net of taxes
|
|
|
120,573
|
|
120,573
|
|
|||||
|
Reclassification of net unrealized gains activity attributable to the
Deferred receipts held in trust and Care trusts’ corpus,
net of taxes
|
—
|
|
(120,573
|
)
|
(120,573
|
)
|
|||||
|
Balance at December 31, 2016
|
$
|
16,492
|
|
$
|
—
|
|
$
|
16,492
|
|
||
|
Activity in 2017
|
25,451
|
|
—
|
|
25,451
|
|
|||||
|
Net unrealized gains associated with available-for-sale securities of the trusts, net of taxes
|
—
|
|
243,677
|
|
243,677
|
|
|||||
|
Reclassification of net unrealized gains activity attributable to the
Deferred receipts held in trust
and
Care trusts’ corpus,
net of taxes
|
—
|
|
(243,677
|
)
|
(243,677
|
)
|
|||||
|
Balance at December 31, 2017
|
$
|
41,943
|
|
$
|
—
|
|
$
|
41,943
|
|
||
The assets and liabilities of foreign operations are translated into U.S. dollars using the current exchange rate. The U.S. dollar amount that arises from such translation, as well as exchange gains and losses on intercompany balances of a long-term investment nature, are included in the cumulative currency translation adjustments in
Accumulated other comprehensive income.
Share Repurchase Program
Subject to market conditions, normal trading restrictions, and limitations in our debt covenants, we may make purchases in the open market or through privately negotiated transactions under our share repurchase program. In
2017
, we repurchased
6,210,606
shares of common stock at an aggregate cost of
$199.6 million
, which is an average cost per share of
$32.14
. During
2016
, we repurchased
8,811,847
shares of common stock at an aggregate cost of $
227.9 million
, which is an average cost per share of
$25.87
. During November
2016
, our Board of Directors increased our share repurchase authorization to
$400.0 million
. After these repurchases and increase in authorization, the remaining dollar value of shares authorized to be purchased under the share repurchase program was
$168.6 million
at
December 31, 2017
.
Subsequent to
December 31, 2017
, we repurchased
429,859
shares for
$16.7 million
at an average cost per share of
$38.83
. In February 2018, our Board of Directors increased our repurchase authorization for up to
$400.0 million
.
Cash Dividends
On
February 13, 2018
our Board of Directors approved a cash dividend of
$0.17
per common share payable on
March 30, 2018
to stockholders of record as of
March 15, 2018
.
|
10.
|
Share-Based Compensation
|
Stock Benefit Plans
We maintain benefit plans whereby shares of our common stock may be issued pursuant to the exercise of stock options or restricted stock granted to officers and key employees. Our Amended and Restated Incentive Plan reserves
44,000,000
shares of common stock for outstanding and future awards of stock options, restricted stock, and other share based awards to officers and key employees. In
May 2017
, our shareholders approved the amended 2016 Equity Incentive Plan that reserves
13,404,404
shares of common stock for outstanding and future awards of stock options, restricted stock, and other awards to officers and key employees. On
August 25, 2017
, we issued
340,510
deferred common stock equivalents, or units, pursuant to provisions regarding our 2016 Equity Incentive Plan. The
63,894
remaining shares left available under grant from the Director Fee Plan were merged into the 2016 Equity Incentive Plan.
Our benefit plans allow for options to be granted as either non-qualified or incentive stock options. The options historically have been granted annually, or upon hire, as approved by the Compensation Committee of the Board of Directors. The options are granted with an exercise price equal to the market price of our common stock on the date of the grant, as approved by the Compensation Committee of the Board of Directors. The options are generally exercisable at a rate of 33
1
/
3
% each year unless alternative vesting methods are approved by the Compensation Committee of the Board of Directors. Outstanding options will expire, if not exercised or forfeited, within ten years from the date of grant. Restricted shares are generally expensed ratably over the period during which the restrictions lapse, which is typically 33
1
/
3
% each year. At
December 31, 2017
and
2016
,
10,125,235
and
12,171,075
shares, respectively, were reserved for future option and restricted share grants under our stock benefit plans.
We utilize the Black-Scholes option valuation model for estimating the fair value of our stock options. This model allows the use of a range of assumptions related to volatility, risk-free interest rate, expected holding period, and dividend yield. The expected volatility utilized in the valuation model is based on the historical volatility of our stock price. The dividend yield and expected holding period are based on historical experience and management’s estimate of future events. The risk-free interest rate is derived from the U.S. Treasury yield curve based on the expected life of the option in effect at the time of grant. The fair values of our stock options are calculated using the following weighted average assumptions, based on the methods described above for the years ended December 31:
|
Assumptions
|
2017
|
2016
|
2015
|
|||
|
Dividend yield
|
2.0%
|
2.0%
|
1.8%
|
|||
|
Expected volatility
|
19.0%
|
19.7%
|
23.3%
|
|||
|
Risk-free interest rate
|
1.6%
|
1.0%
|
1.3%
|
|||
|
Expected holding period (years)
|
4.0
|
4.0
|
4.0
|
|||
The following table summarizes certain information with respect to stock option and restricted share compensation as included in our Consolidated Statement of Operations for the years ended December 31:
|
|
2017
|
2016
|
2015
|
||||||||
|
|
(In thousands)
|
||||||||||
|
Total pretax employee share-based compensation expense included in net income
|
$
|
14,788
|
|
$
|
14,056
|
|
$
|
13,843
|
|
||
|
Income tax benefit related to share-based compensation included in net income
|
$
|
5,416
|
|
$
|
6,427
|
|
$
|
5,068
|
|
||
70
Stock Options
The following table sets forth stock option activity for the year ended
December 31, 2017
:
(Shares reported in whole numbers)
|
Options
|
Weighted-Average
Exercise Price
|
|||||
|
Outstanding at December 31, 2016
|
10,775,136
|
|
$
|
16.49
|
|
|
|
Granted
|
1,524,860
|
|
$
|
29.25
|
|
|
|
Exercised
|
(2,759,309
|
)
|
$
|
12.18
|
|
|
|
Canceled
|
(20,388
|
)
|
$
|
24.59
|
|
|
|
Outstanding at December 31, 2017
|
9,520,299
|
|
$
|
19.77
|
|
|
|
Exercisable at December 31, 2017
|
6,190,827
|
|
$
|
16.64
|
|
|
The aggregate intrinsic value for stock options outstanding and exercisable was
$167.1 million
and
$128.1 million
, respectively, at
December 31, 2017
.
Set forth below is certain information related to stock options outstanding and exercisable at
December 31, 2017
:
(Shares reported in whole numbers)
|
|
Options Outstanding
|
Options Exercisable
|
||||||||||||||
|
Range of Exercise Price
|
Number
Outstanding at
December 31, 2017
|
Weighted-Average Remaining Contractual Life
(in years)
|
Weighted-
Average Exercise Price
|
Number
Exercisable at
December 31, 2017
|
Weighted-
Average Exercise Price
|
|||||||||||
|
$ 5.00 — 10.00
|
725,074
|
|
1.1
|
$
|
9.09
|
|
725,074
|
|
$
|
9.09
|
|
|||||
|
$10.01 — 15.00
|
938,630
|
|
2.1
|
$
|
11.18
|
|
938,630
|
|
$
|
11.18
|
|
|||||
|
$15.01 — 20.00
|
2,757,306
|
|
3.7
|
$
|
16.56
|
|
2,757,306
|
|
$
|
16.56
|
|
|||||
|
$20.01 — 25.00
|
3,580,379
|
|
5.6
|
$
|
22.63
|
|
1,769,817
|
|
$
|
22.75
|
|
|||||
|
$25.01 — 30.00
|
1,518,910
|
|
7.1
|
$
|
29.25
|
|
—
|
|
$
|
—
|
|
|||||
|
$ 5.00 — 30.00
|
9,520,299
|
|
4.6
|
$
|
19.77
|
|
6,190,827
|
|
$
|
16.64
|
|
|||||
Other information pertaining to stock option activity during the years ended December 31 is as follows:
|
2017
|
2016
|
2015
|
|||||||||
|
Weighted average grant-date fair value of stock options granted
|
$
|
3.90
|
|
$
|
4.01
|
|
$
|
3.79
|
|
||
|
Total fair value of stock options vested (in thousands)
|
$
|
7,425
|
|
$
|
7,690
|
|
$
|
7,973
|
|
||
|
Total intrinsic value of stock options exercised (in thousands)
|
$
|
56,946
|
|
$
|
37,284
|
|
$
|
52,513
|
|
||
For the years ended
December 31, 2017
,
2016
, and
2015
, cash received from the exercise of stock options was $
33.6 million
, $
17.7 million
, and $
31.8 million
, respectively. We recognized compensation expense of
$6.9 million
,
$7.6 million
, and
$7.9 million
related to stock options for the years ended
December 31, 2017
,
2016
, and
2015
, respectively. As of
December 31, 2017
, the unrecognized compensation expense related to stock options of
$7.1 million
is expected to be recognized over a weighted average period of
1.3
years.
71
Restricted Shares
Restricted share award activity was as follows:
(Shares reported in whole numbers)
|
Restricted
Share Awards
|
Weighted-Average
Grant-Date
Fair Value
|
|||||
|
Nonvested restricted share awards at December 31, 2016
|
500,744
|
|
$
|
21.48
|
|
|
|
Granted
|
208,933
|
|
$
|
29.28
|
|
|
|
Vested
|
(265,733
|
)
|
$
|
20.56
|
|
|
|
Forfeited and other
|
(2,133
|
)
|
$
|
25.04
|
|
|
|
Nonvested restricted share awards at December 31, 2017
|
441,811
|
|
$
|
25.70
|
|
|
The fair value of our restricted share awards, as determined on the grant date, is being amortized and charged to income (with an offsetting credit to
Capital in excess of par value
) generally over the average period during which the restrictions lapse. At
December 31, 2017
, unrecognized compensation expense of
$6.3 million
related to restricted share awards is expected to be recognized over a weighted average period of
1.7
years. We recognized compensation expense of
$5.6 million
,
$5.6 million
, and
$5.9 million
during the years ended
December 31, 2017
,
2016
, and
2015
, respectively, related to our restricted share awards. The weighted-average grant date fair value for nonvested restricted stock granted during the year
2017
,
2016
, and
2015
was
$29.28
,
$22.28
and
$23.00
, respectively. The total fair market value of restricted share awards that vested during the years ended
December 31, 2017
,
2016
and
2015
was
$5.5 million
,
$5.7 million
and
$6.3 million
, respectively. During the years 2017,
2016
, and
2015
the aggregate intrinsic value of restricted share awards vested was
$4.5 million
,
$3.2 million
and
$4.9 million
, respectively.
Restricted share units activity was as follows:
(Shares reported in whole numbers)
|
Restricted
Share Units
|
Weighted-Average
Grant-Date
Fair Value
|
|||||
|
Nonvested restricted share units at December 31, 2016
|
123,510
|
|
$
|
25.72
|
|
|
|
Granted
|
95,780
|
|
$
|
27.94
|
|
|
|
Vested
|
(48,136
|
)
|
$
|
25.86
|
|
|
|
Forfeited and other
|
(4,124
|
)
|
$
|
27.01
|
|
|
|
Nonvested restricted share units at December 31, 2017
|
167,030
|
|
$
|
26.92
|
|
|
At
December 31, 2017
, the unrecognized compensation expense related to restricted share units of $
3.0 million
to be recognized over a weighted average period of
1.7
years. We recognized compensation expense of $
2.0 million
and
$0.8 million
for the years ended
December 31, 2017
and
2016
related to our restricted share units. The weighted-average grant date fair value for nonvested restricted share units granted during
December 31, 2017
and
2016
was
$27.94
and
$25.72
, respectively. The total fair market value of restricted share units that vested during the year ended
December 31, 2017
and
2016
was
$1.2 million
and
$50.2 thousand
, respectively. During the years 2017 and
2016
, the aggregate intrinsic value of restricted share units vested was
$0.6 million
and
$5.2 thousand
, respectively.
|
11.
|
Retirement Plans
|
We currently have a supplemental retirement plan for certain current and former key employees (SERP), a supplemental retirement plan for officers and certain key employees (Senior SERP), a retirement plan for certain non-employee directors (Directors’ Plan), a Retirement Plan for Rose Hills
®
Trustees, a Rose Hills
®
Supplemental Retirement Plan, and a Stewart Supplemental Retirement Plan (collectively, the “Plans”). We also provide a 401(k) employee savings plan. All of our Plans have a measurement date of
December 31
.
The Plans are frozen; therefore, the participants do not earn incremental benefits from additional years of service, and we do not incur any additional service cost.
72
Retirement benefits under the SERP are based on years of service and average monthly compensation, reduced by benefits under Social Security. The Senior SERP provides retirement benefits based on years of service and position. The Directors’ Plan provides for an annual benefit to directors following retirement, based on a vesting schedule.
We recognize pension related gains and losses in our Consolidated Statement of Operations in the year such gains and losses are incurred. The components of the Plans’ net periodic benefit cost for the years ended
December 31
were as follows:
|
2017
|
2016
|
2015
|
|||||||||
|
|
(In thousands)
|
||||||||||
|
Interest cost on projected benefit obligation
|
$
|
1,067
|
|
$
|
1,179
|
|
$
|
1,198
|
|
||
|
Recognized net actuarial losses (gains)
|
879
|
|
259
|
|
(1,327
|
)
|
|||||
|
Total net periodic benefit cost
|
$
|
1,946
|
|
$
|
1,438
|
|
$
|
(129
|
)
|
||
The Plans’ funded status at December 31 was as follows:
|
2017
|
2016
|
||||||
|
|
(In thousands)
|
||||||
|
Change in Benefit Obligation:
|
|
|
|
|
|||
|
Benefit obligation at beginning of year
|
$
|
30,078
|
|
$
|
32,305
|
|
|
|
Interest cost
|
1,067
|
|
1,179
|
|
|||
|
Actuarial gain
|
879
|
|
259
|
|
|||
|
Benefits paid
|
(3,343
|
)
|
(3,665
|
)
|
|||
|
Benefit obligation at end of year
|
$
|
28,681
|
|
$
|
30,078
|
|
|
|
Change in Plan Assets:
|
|
|
|
|
|||
|
Fair value of plan assets at beginning of year
|
$
|
—
|
|
$
|
—
|
|
|
|
Employer contributions
|
3,343
|
|
3,665
|
|
|||
|
Benefits paid, including expenses
|
(3,343
|
)
|
(3,665
|
)
|
|||
|
Fair value of plan assets at end of year
|
$
|
—
|
|
$
|
—
|
|
|
|
Funded status of plan
|
$
|
(28,681
|
)
|
$
|
(30,078
|
)
|
|
|
Funding Summary:
|
|
|
|
|
|||
|
Projected benefit obligations
|
$
|
28,681
|
|
$
|
30,078
|
|
|
|
Accumulated benefit obligation
|
$
|
28,681
|
|
$
|
30,078
|
|
|
|
Amounts Recognized in the Consolidated Balance Sheet:
|
|
|
|
|
|||
|
Accounts payable and accrued liabilities
|
$
|
(3,265
|
)
|
$
|
(3,448
|
)
|
|
|
Accrued benefit costs - included in
Other liabilities
|
(25,416
|
)
|
(26,630
|
)
|
|||
|
Total accrued benefit liability
|
$
|
(28,681
|
)
|
$
|
(30,078
|
)
|
|
The retirement benefits under the Plans are unfunded obligations of the Company. We have purchased various life insurance policies on the participants in the Plans with the intent to use the proceeds or any cash value buildup from these policies to assist in meeting, at least to the extent of such assets, the Plans' funding requirements. The face value of these insurance policies at
December 31, 2017
and
2016
was
$46.5 million
and
$47.5 million
, respectively, and the cash surrender value was
$36.4 million
and
$37.0 million
, respectively. The outstanding loans against the policies are minimal and there are no restrictions in the policies regarding loans.
The Plans’ weighted-average assumptions used to determine the benefit obligation and net benefit cost are as follows:
|
2017
|
2016
|
2015
|
||||||
|
Weighted-average discount rate used to determine obligations
|
3.41
|
%
|
3.76
|
%
|
3.86
|
%
|
||
|
Weighted-average discount rate used to determine net periodic pension cost
|
3.86
|
%
|
3.96
|
%
|
2.47
|
%
|
||
We base our discount rate used to compute future benefit obligations using an analysis of expected future benefit payments. The reasonableness of our discount rate is verified by comparing the rate to the rate earned on high-quality fixed income investments, such as the Moody’s Aa index, plus
50
basis points. The assumed rate of return on plan assets was not
73
applicable as we pay plan benefits as they come due. As all Plans are curtailed, the assumed rate of compensation increase is
zero
.
The following benefit payments are expected to be paid in future years related to our Plans (in thousands):
|
2018
|
$
|
3,265
|
|
|
2019
|
3,192
|
|
|
|
2020
|
2,760
|
|
|
|
2021
|
2,447
|
|
|
|
2022
|
2,369
|
|
|
|
Years 2023 through 2027
|
9,379
|
|
|
|
Total expected benefit payments
|
$
|
23,412
|
|
We also have an employee savings plan that qualifies under Section 401(k) of the Internal Revenue Code for the exclusive benefit of our United States employees. Under the plan, participating employees may contribute a portion of their pretax and/or after-tax income in accordance with specified guidelines up to a maximum of
50
%.
During
2017
,
2016
, and
2015
, we matched a percentage of the employee contributions through contributions of cash. For these years, our matching contribution was based upon the following:
|
Years of Vesting Service
|
|
Percentage of Deferred Compensation
|
|
0 — 5 years
|
|
75% of the first 6% of deferred compensation
|
|
6 — 10 years
|
|
100% of the first 6% of deferred compensation
|
|
11 or more years
|
|
125% of the first 6% of deferred compensation
|
The amount of our matched contributions in
2017
,
2016
, and
2015
was
$33.2 million
,
$32.5 million
, and
$30.8 million
, respectively.
|
12.
|
Segment Reporting
|
Our operations are both product based and geographically based, and the reportable operating segments presented below include our funeral and cemetery operations. Our geographic areas include United States and Canada. We conduct both funeral and cemetery operations in the United States and Canada.
74
Our reportable segment information is as follows:
|
Reportable Segments
|
|||||||||||||||
|
Funeral
|
Cemetery
|
Corporate
|
Consolidated
|
||||||||||||
|
|
(In thousands)
|
||||||||||||||
|
2017
|
|
|
|
|
|
|
|||||||||
|
Revenue from external customers
|
$
|
1,868,152
|
|
$
|
1,226,879
|
|
$
|
—
|
|
$
|
3,095,031
|
|
|||
|
Interest expense
|
$
|
3,986
|
|
$
|
401
|
|
$
|
164,738
|
|
$
|
169,125
|
|
|||
|
Depreciation and amortization
|
$
|
109,965
|
|
$
|
32,815
|
|
$
|
10,361
|
|
$
|
153,141
|
|
|||
|
Amortization of intangibles
|
$
|
17,871
|
|
$
|
9,696
|
|
$
|
83
|
|
$
|
27,650
|
|
|||
|
Operating profit
|
$
|
371,853
|
|
$
|
350,336
|
|
$
|
—
|
|
$
|
722,189
|
|
|||
|
Amortization of cemetery property
|
$
|
—
|
|
$
|
68,102
|
|
$
|
—
|
|
$
|
68,102
|
|
|||
|
Capital expenditures
|
$
|
83,241
|
|
$
|
118,699
|
|
$
|
12,561
|
|
$
|
214,501
|
|
|||
|
Total assets
|
$
|
5,393,205
|
|
$
|
6,946,351
|
|
$
|
524,947
|
|
$
|
12,864,503
|
|
|||
|
2016
|
|
|
|
|
|
|
|
|
|||||||
|
Revenue from external customers
|
$
|
1,869,111
|
|
$
|
1,162,026
|
|
$
|
—
|
|
$
|
3,031,137
|
|
|||
|
Interest expense
|
$
|
3,906
|
|
$
|
105
|
|
$
|
158,082
|
|
$
|
162,093
|
|
|||
|
Depreciation and amortization
|
$
|
106,602
|
|
$
|
31,081
|
|
$
|
9,550
|
|
$
|
147,233
|
|
|||
|
Amortization of intangibles
|
$
|
20,444
|
|
$
|
10,438
|
|
$
|
74
|
|
$
|
30,956
|
|
|||
|
Operating profit
|
$
|
361,022
|
|
$
|
315,412
|
|
$
|
—
|
|
$
|
676,434
|
|
|||
|
Amortization of cemetery property
|
$
|
—
|
|
$
|
66,745
|
|
$
|
—
|
|
$
|
66,745
|
|
|||
|
Capital expenditures
|
$
|
68,666
|
|
$
|
113,163
|
|
$
|
11,617
|
|
$
|
193,446
|
|
|||
|
Total assets
|
$
|
5,158,700
|
|
$
|
6,481,761
|
|
$
|
397,688
|
|
$
|
12,038,149
|
|
|||
|
2015
|
|
|
|
|
|
|
|
|
|||||||
|
Revenue from external customers
|
$
|
1,889,055
|
|
$
|
1,096,986
|
|
$
|
—
|
|
$
|
2,986,041
|
|
|||
|
Interest expense
|
$
|
4,230
|
|
$
|
450
|
|
$
|
168,217
|
|
$
|
172,897
|
|
|||
|
Depreciation and amortization
|
$
|
103,272
|
|
$
|
29,448
|
|
$
|
8,736
|
|
$
|
141,456
|
|
|||
|
Amortization of intangibles
|
$
|
22,638
|
|
$
|
8,746
|
|
$
|
75
|
|
$
|
31,459
|
|
|||
|
Operating profit
|
$
|
390,101
|
|
$
|
284,488
|
|
$
|
—
|
|
$
|
674,589
|
|
|||
|
Amortization of cemetery property
|
$
|
—
|
|
$
|
62,407
|
|
$
|
—
|
|
$
|
62,407
|
|
|||
|
Capital expenditures
|
$
|
53,422
|
|
$
|
83,803
|
|
$
|
13,761
|
|
$
|
150,986
|
|
|||
The following table reconciles operating profit from reportable segments shown above to our consolidated income from continuing operations before income taxes:
|
2017
|
2016
|
2015
|
|||||||||
|
|
(In thousands)
|
||||||||||
|
Operating profit from reportable segments
|
$
|
722,189
|
|
$
|
676,434
|
|
$
|
674,589
|
|
||
|
General and administrative expenses
|
(154,423
|
)
|
(137,730
|
)
|
(130,813
|
)
|
|||||
|
Gains (losses) on divestitures and impairment charges, net
|
7,015
|
|
(26,819
|
)
|
6,522
|
|
|||||
|
Hurricane expense, net
|
(5,584
|
)
|
—
|
|
—
|
|
|||||
|
Operating income
|
569,197
|
|
511,885
|
|
550,298
|
|
|||||
|
Interest expense
|
(169,125
|
)
|
(162,093
|
)
|
(172,897
|
)
|
|||||
|
Losses on early extinguishment of debt, net
|
(274
|
)
|
(22,503
|
)
|
(6,918
|
)
|
|||||
|
Other income (expense), net
|
460
|
|
(631
|
)
|
(132
|
)
|
|||||
|
Income from continuing operations before income taxes
|
$
|
400,258
|
|
$
|
326,658
|
|
$
|
370,351
|
|
||
75
Our geographic area information was as follows:
|
United States
|
Canada
|
Total
|
|||||||||
|
|
(In thousands)
|
||||||||||
|
2017
|
|
|
|
|
|
|
|||||
|
Revenue from external customers
|
$
|
2,889,463
|
|
$
|
205,568
|
|
$
|
3,095,031
|
|
||
|
Interest expense
|
$
|
168,956
|
|
$
|
169
|
|
$
|
169,125
|
|
||
|
Depreciation and amortization
|
$
|
143,932
|
|
$
|
9,209
|
|
$
|
153,141
|
|
||
|
Amortization of intangibles
|
$
|
27,092
|
|
$
|
558
|
|
$
|
27,650
|
|
||
|
Amortization of cemetery property
|
$
|
61,307
|
|
$
|
6,795
|
|
$
|
68,102
|
|
||
|
Operating income
|
$
|
500,919
|
|
$
|
68,278
|
|
$
|
569,197
|
|
||
|
Gains on divestitures and impairment charges, net
|
$
|
61
|
|
$
|
6,954
|
|
$
|
7,015
|
|
||
|
Long-lived assets
|
$
|
5,786,063
|
|
$
|
286,135
|
|
$
|
6,072,198
|
|
||
|
2016
|
|
|
|
|
|
|
|||||
|
Revenue from external customers
|
$
|
2,848,876
|
|
$
|
182,261
|
|
$
|
3,031,137
|
|
||
|
Interest expense (income)
|
$
|
162,341
|
|
$
|
(248
|
)
|
$
|
162,093
|
|
||
|
Depreciation and amortization
|
$
|
138,560
|
|
$
|
8,673
|
|
$
|
147,233
|
|
||
|
Amortization of intangibles
|
$
|
30,427
|
|
$
|
529
|
|
$
|
30,956
|
|
||
|
Amortization of cemetery property
|
$
|
61,449
|
|
$
|
5,296
|
|
$
|
66,745
|
|
||
|
Operating income
|
$
|
460,387
|
|
$
|
51,498
|
|
$
|
511,885
|
|
||
|
(Losses) gains on divestitures and impairment charges, net
|
$
|
(27,658
|
)
|
$
|
839
|
|
$
|
(26,819
|
)
|
||
|
Long-lived assets
|
$
|
5,705,070
|
|
$
|
266,053
|
|
$
|
5,971,123
|
|
||
|
2015
|
|
|
|
|
|
|
|||||
|
Revenue from external customers
|
$
|
2,805,407
|
|
$
|
180,634
|
|
$
|
2,986,041
|
|
||
|
Interest expense
|
$
|
172,697
|
|
$
|
200
|
|
$
|
172,897
|
|
||
|
Depreciation and amortization
|
$
|
132,393
|
|
$
|
9,063
|
|
$
|
141,456
|
|
||
|
Amortization of intangibles
|
$
|
30,856
|
|
$
|
603
|
|
$
|
31,459
|
|
||
|
Amortization of cemetery property
|
$
|
58,429
|
|
$
|
3,978
|
|
$
|
62,407
|
|
||
|
Operating income
|
$
|
498,634
|
|
$
|
51,664
|
|
$
|
550,298
|
|
||
|
Gains on divestitures and impairment charges, net
|
$
|
1,778
|
|
$
|
4,744
|
|
$
|
6,522
|
|
||
76
|
13.
|
Supplementary Information
|
The detail of certain balance sheet accounts is as follows:
|
|
December 31,
|
||||||
|
|
2017
|
2016
|
|||||
|
|
(In thousands)
|
||||||
|
Cash and cash equivalents:
|
|
|
|
|
|||
|
Cash
|
$
|
260,281
|
|
$
|
146,684
|
|
|
|
Commercial paper and temporary investments
|
69,758
|
|
48,302
|
|
|||
|
|
$
|
330,039
|
|
$
|
194,986
|
|
|
|
Receivables, net:
|
|
|
|
|
|||
|
Notes receivable
|
$
|
1,605
|
|
$
|
1,259
|
|
|
|
Atneed funeral receivables, net of allowances of
$1,845
and $1,881, respectively
|
44,536
|
|
46,917
|
|
|||
|
Atneed cemetery receivables, net of allowances of
$245
and $1,514, respectively
|
16,556
|
|
17,765
|
|
|||
|
Other
|
27,607
|
|
32,514
|
|
|||
|
|
$
|
90,304
|
|
$
|
98,455
|
|
|
|
Other current assets:
|
|
|
|
|
|||
|
Income tax receivable
|
$
|
8,576
|
|
$
|
3,609
|
|
|
|
Prepaid insurance
|
4,419
|
|
4,437
|
|
|||
|
Restricted cash
(1)
|
8,625
|
|
11,978
|
|
|||
|
Other
|
13,955
|
|
14,500
|
|
|||
|
|
$
|
35,575
|
|
$
|
34,524
|
|
|
|
Cemetery property:
|
|
|
|
|
|||
|
Undeveloped land
|
$
|
1,181,920
|
|
$
|
1,184,710
|
|
|
|
Developed lots, lawn crypts, mausoleum spaces, cremation niches, and cremation memorialization property
|
610,069
|
|
592,225
|
|
|||
|
|
$
|
1,791,989
|
|
$
|
1,776,935
|
|
|
|
Property and equipment:
|
|
|
|
|
|||
|
Land
|
$
|
605,735
|
|
$
|
595,096
|
|
|
|
Buildings and improvements
|
1,996,123
|
|
1,879,553
|
|
|||
|
Operating equipment
|
557,278
|
|
549,879
|
|
|||
|
Leasehold improvements
|
34,607
|
|
33,900
|
|
|||
|
Capital leases
|
254,260
|
|
234,411
|
|
|||
|
|
3,448,003
|
|
3,292,839
|
|
|||
|
Less: Accumulated depreciation
|
(1,430,695
|
)
|
(1,328,262
|
)
|
|||
|
Less: Accumulated amortization of capital leases
|
(144,264
|
)
|
(136,990
|
)
|
|||
|
|
$
|
1,873,044
|
|
$
|
1,827,587
|
|
|
|
Deferred charges and other assets:
|
|
|
|
|
|||
|
Intangible assets, net
|
$
|
374,099
|
|
$
|
368,065
|
|
|
|
Restricted cash
(1)
|
1,937
|
|
4,542
|
|
|||
|
Deferred tax assets
|
873
|
|
861
|
|
|||
|
Notes receivable, net of allowances of $10,946 and $11,334, respectively
|
9,624
|
|
9,598
|
|
|||
|
Cash surrender value of insurance policies
|
139,494
|
|
119,819
|
|
|||
|
Other
|
75,157
|
|
64,635
|
|
|||
|
|
$
|
601,184
|
|
$
|
567,520
|
|
|
77
|
|
December 31,
|
||||||
|
|
2017
|
2016
|
|||||
|
|
(In thousands)
|
||||||
|
Accounts payable and accrued liabilities:
|
|
|
|
|
|||
|
Accounts payable
|
$
|
173,685
|
|
$
|
155,802
|
|
|
|
Accrued benefits
|
95,233
|
|
88,392
|
|
|||
|
Accrued interest
|
30,415
|
|
27,991
|
|
|||
|
Accrued property taxes
|
10,541
|
|
12,883
|
|
|||
|
Self-insurance reserves
|
78,227
|
|
77,993
|
|
|||
|
Bank overdrafts
|
27,243
|
|
20,927
|
|
|||
|
Other accrued liabilities
|
73,828
|
|
55,948
|
|
|||
|
|
$
|
489,172
|
|
$
|
439,936
|
|
|
|
Other liabilities:
|
|
|
|
|
|||
|
Accrued benefit costs
|
$
|
25,416
|
|
$
|
26,630
|
|
|
|
Deferred compensation
|
120,782
|
|
105,013
|
|
|||
|
Customer refund obligation reserve
|
51,767
|
|
52,068
|
|
|||
|
Tax liability
|
111,000
|
|
235,625
|
|
|||
|
Payable to perpetual care fund
|
83,015
|
|
77,148
|
|
|||
|
Other
|
19,002
|
|
13,838
|
|
|||
|
|
$
|
410,982
|
|
$
|
510,322
|
|
|
(1) Restricted cash in both periods primarily consists of proceeds from divestitures deposited into escrow accounts under IRS code section 1031 and collateralized obligations under certain insurance policies.
Revenue and Costs and Expenses
The detail of certain income statement accounts is as follows for the years ended
December 31
:
|
2017
|
2016
|
2015
|
|||||||||
|
|
(In thousands)
|
||||||||||
|
Property and merchandise revenue:
|
|
|
|
|
|
|
|||||
|
Funeral
|
$
|
619,804
|
|
$
|
611,440
|
|
$
|
608,266
|
|
||
|
Cemetery
|
968,828
|
|
912,778
|
|
849,250
|
|
|||||
|
Total property and merchandise revenue
|
1,588,632
|
|
1,524,218
|
|
1,457,516
|
|
|||||
|
Services revenue:
|
|
|
|
|
|
|
|||||
|
Funeral
|
1,129,510
|
|
1,126,703
|
|
1,146,205
|
|
|||||
|
Cemetery
|
227,155
|
|
218,825
|
|
217,240
|
|
|||||
|
Total services revenue
|
1,356,665
|
|
1,345,528
|
|
1,363,445
|
|
|||||
|
Other revenue
|
149,734
|
|
161,391
|
|
165,080
|
|
|||||
|
Total revenue
|
$
|
3,095,031
|
|
$
|
3,031,137
|
|
$
|
2,986,041
|
|
||
|
Property and merchandise costs and expenses:
|
|
|
|
|
|
|
|||||
|
Funeral
|
$
|
282,048
|
|
$
|
287,414
|
|
$
|
290,663
|
|
||
|
Cemetery
|
512,677
|
|
488,997
|
|
457,613
|
|
|||||
|
Total cost of property and merchandise
|
794,725
|
|
776,411
|
|
748,276
|
|
|||||
|
Services costs and expenses:
|
|
|
|
|
|
|
|||||
|
Funeral
|
621,102
|
|
627,156
|
|
624,310
|
|
|||||
|
Cemetery
|
108,102
|
|
106,534
|
|
105,038
|
|
|||||
|
Total cost of services
|
729,204
|
|
733,690
|
|
729,348
|
|
|||||
|
Overhead and other expenses
|
848,913
|
|
844,602
|
|
833,828
|
|
|||||
|
Total cost and expenses
|
$
|
2,372,842
|
|
$
|
2,354,703
|
|
$
|
2,311,452
|
|
||
78
Certain Non-Cash Investing and Financing Transactions
|
|
Years Ended December 31,
|
||||||||||
|
|
2017
|
2016
|
2015
|
||||||||
|
|
(In thousands)
|
||||||||||
|
Net change in capital expenditure accrual
|
$
|
223
|
|
$
|
(1,435
|
)
|
$
|
5,571
|
|
||
|
Options exercised by attestation
|
$
|
—
|
|
$
|
—
|
|
$
|
122
|
|
||
|
Shares repurchased
|
$
|
—
|
|
$
|
—
|
|
$
|
(122
|
)
|
||
|
Non-cash acquisition of capital leases
|
$
|
54,087
|
|
$
|
41,609
|
|
$
|
55,941
|
|
||
|
14.
|
Earnings Per Share
|
Basic earnings per common share (EPS) excludes dilution and is computed by dividing
Net income attributable to common stockholders
by the weighted average number of common shares outstanding for the period. Diluted EPS reflects the potential dilution that could occur if securities or other obligations to issue common stock were exercised or converted into common stock or resulted in the issuance of common stock that shared in our earnings.
A reconciliation of the numerators and denominators of basic and diluted EPS for the three years ended
December 31
is presented below:
|
2017
|
2016
|
2015
|
|||||||||
|
|
(In thousands, except per share amounts)
|
||||||||||
|
Amounts attributable to common stockholders:
|
|
|
|
|
|
|
|||||
|
Income from continuing operations — basic
|
$
|
546,663
|
|
$
|
177,038
|
|
$
|
234,162
|
|
||
|
After tax interest on convertible debt
|
52
|
|
43
|
|
50
|
|
|||||
|
Income from continuing operations — diluted
|
$
|
546,715
|
|
$
|
177,081
|
|
$
|
234,212
|
|
||
|
Loss from discontinued operations, net of tax
|
$
|
—
|
|
$
|
—
|
|
$
|
(390
|
)
|
||
|
Net income — basic
|
$
|
546,663
|
|
$
|
177,038
|
|
$
|
233,772
|
|
||
|
After tax interest on convertible debt
|
52
|
|
43
|
|
50
|
|
|||||
|
Net income — diluted
|
$
|
546,715
|
|
$
|
177,081
|
|
$
|
233,822
|
|
||
|
Weighted average shares:
|
|
|
|
|
|
|
|||||
|
Weighted average shares — basic
|
187,630
|
|
193,086
|
|
200,356
|
|
|||||
|
Stock options
|
4,396
|
|
2,823
|
|
3,973
|
|
|||||
|
Restricted share units
|
99
|
|
12
|
|
—
|
|
|||||
|
Convertible debt
|
121
|
|
121
|
|
121
|
|
|||||
|
Weighted average shares — diluted
|
192,246
|
|
196,042
|
|
204,450
|
|
|||||
|
Amounts attributable to common stockholders:
|
|||||||||||
|
Income from continuing operations per share:
|
|||||||||||
|
Basic
|
$
|
2.91
|
|
$
|
0.92
|
|
$
|
1.17
|
|
||
|
Diluted
|
$
|
2.84
|
|
$
|
0.90
|
|
$
|
1.14
|
|
||
|
Net income per share:
|
|
|
|
|
|
|
|||||
|
Basic
|
$
|
2.91
|
|
$
|
0.92
|
|
$
|
1.17
|
|
||
|
Diluted
|
$
|
2.84
|
|
$
|
0.90
|
|
$
|
1.14
|
|
||
The computation of diluted earnings per share excludes outstanding stock options in certain periods in which the inclusion of such options would be antidilutive to the periods presented. Total options not currently included in the computation of dilutive EPS are as follows (in shares):
|
|
2017
|
2016
|
2015
|
|||||
|
(In thousands)
|
||||||||
|
Antidilutive options
|
911
|
|
982
|
|
3
|
|
||
79
|
15.
|
Acquisitions
|
We spent
$76.2 million
,
$72.9 million
, and
$68.9 million
for several smaller, tuck-in acquisitions for the three years ended December 31,
2017
,
2016
, and
2015
, respectively. These amounts include the use of
$26.2 million
,
$3.7 million
, and
$27.7 million
in 1031 exchange funds for the three years ended December 31,
2017
,
2016
, and
2015
, respectively.
Wilson Financial Group
During the three years ended December 31, 2017, we spent a total of
$8.6 million
(
$4.6 million
in
2017
,
$1.9 million
in
2016
, and
$2.1 million
in
2015
) to acquire the remaining
46%
of common stock of our consolidated subsidiary, Wilson Financial Group, Inc.
|
16.
|
Divestiture-Related Activities
|
As divestitures occur in the normal course of business, gains or losses on the sale of such locations are recognized in the income statement line item
Gains (losses) on divestitures and impairment charges, net,
which consist of the following for the years ended
December 31
:
|
2017
|
2016
|
2015
|
|||||||||
|
|
(In thousands)
|
||||||||||
|
Gains on divestitures, net
|
$
|
29,053
|
|
$
|
7,829
|
|
$
|
13,363
|
|
||
|
Impairment losses
|
(22,038
|
)
|
(34,648
|
)
|
(6,841
|
)
|
|||||
|
Gains (losses) on divestitures and impairment charges, net
|
$
|
7,015
|
|
$
|
(26,819
|
)
|
$
|
6,522
|
|
||
During 2016, we incurred $31.2 million of impairment charges related to the divestiture of certain funeral homes in Los Angeles, California.
80
|
17.
|
Quarterly Financial Data (Unaudited)
|
Quarterly financial data for
2017
and
2016
is as follows:
|
First
Quarter
|
Second
Quarter
|
Third
Quarter
|
Fourth
Quarter
|
||||||||||||
|
|
(In thousands, except per share amounts)
|
||||||||||||||
|
2017
|
|
|
|
|
|
|
|
|
|||||||
|
Revenue
|
$
|
777,710
|
|
$
|
773,242
|
|
$
|
731,346
|
|
$
|
812,733
|
|
|||
|
Costs and expenses
|
$
|
(600,545
|
)
|
$
|
(589,797
|
)
|
$
|
(581,644
|
)
|
$
|
(600,856
|
)
|
|||
|
Operating profit
|
$
|
177,165
|
|
$
|
183,445
|
|
$
|
149,702
|
|
$
|
211,877
|
|
|||
|
Operating income
|
$
|
139,596
|
|
$
|
143,608
|
|
$
|
109,056
|
|
$
|
176,937
|
|
|||
|
Income from continuing operations before income taxes
(1)
|
$
|
98,526
|
|
$
|
101,518
|
|
$
|
66,578
|
|
$
|
133,636
|
|
|||
|
Benefit from (provision for) income taxes
|
$
|
76,223
|
|
$
|
(32,956
|
)
|
$
|
(10,437
|
)
|
$
|
113,759
|
|
|||
|
Net income
|
$
|
174,749
|
|
$
|
68,562
|
|
$
|
56,141
|
|
$
|
247,395
|
|
|||
|
Net (income) loss attributable to noncontrolling interests
|
$
|
(47
|
)
|
$
|
(81
|
)
|
$
|
23
|
|
$
|
(79
|
)
|
|||
|
Net income attributable to common stockholders
|
$
|
174,702
|
|
$
|
68,481
|
|
$
|
56,164
|
|
$
|
247,316
|
|
|||
|
Net income attributable to common stockholders per share
(2)
:
|
|
|
|
|
|
|
|
|
|||||||
|
Basic — EPS
|
$
|
0.93
|
|
$
|
0.37
|
|
$
|
0.30
|
|
$
|
1.32
|
|
|||
|
Diluted — EPS
|
$
|
0.91
|
|
$
|
0.36
|
|
$
|
0.29
|
|
$
|
1.29
|
|
|||
|
2016
|
|
|
|
|
|
|
|
|
|||||||
|
Revenue
|
$
|
749,219
|
|
$
|
751,398
|
|
$
|
721,467
|
|
$
|
809,053
|
|
|||
|
Costs and expenses
|
$
|
(586,296
|
)
|
$
|
(589,409
|
)
|
$
|
(580,722
|
)
|
$
|
(598,276
|
)
|
|||
|
Operating profit
|
$
|
162,923
|
|
$
|
161,989
|
|
$
|
140,745
|
|
$
|
210,777
|
|
|||
|
Operating income
|
$
|
123,672
|
|
$
|
94,498
|
|
$
|
114,386
|
|
$
|
179,329
|
|
|||
|
Income from continuing operations before income taxes
(1)
|
$
|
79,767
|
|
$
|
32,639
|
|
$
|
74,963
|
|
$
|
139,289
|
|
|||
|
Benefit from (provision for) income taxes
|
$
|
(32,313
|
)
|
$
|
(16,746
|
)
|
$
|
(27,422
|
)
|
$
|
(72,872
|
)
|
|||
|
Net income
|
$
|
47,454
|
|
$
|
15,893
|
|
$
|
47,541
|
|
$
|
66,417
|
|
|||
|
Net (income) loss attributable to noncontrolling interests
|
$
|
(9
|
)
|
$
|
(273
|
)
|
$
|
186
|
|
$
|
(171
|
)
|
|||
|
Net income attributable to common stockholders
|
$
|
47,445
|
|
$
|
15,620
|
|
$
|
47,727
|
|
$
|
66,246
|
|
|||
|
Net income attributable to common stockholders per share
(2)
:
|
|
|
|
|
|
|
|
|
|||||||
|
Basic — EPS
|
$
|
0.24
|
|
$
|
0.08
|
|
$
|
0.25
|
|
$
|
0.35
|
|
|||
|
Diluted — EPS
|
$
|
0.24
|
|
$
|
0.08
|
|
$
|
0.24
|
|
$
|
0.34
|
|
|||
|
(1)
|
Includes
Gains (losses) on divestitures and impairment charges, net
, as described in Note 16.
|
|
(2)
|
Net income per share is computed independently for each of the quarters presented. Therefore, the sum of the quarters’ net income per share may not equal the total computed for the year.
|
81
|
SERVICE CORPORATION INTERNATIONAL
SCHEDULE II — VALUATION AND QUALIFYING ACCOUNTS
Three Years Ended December 31, 2017
|
||||||||||||||||
|
Description
|
Balance at
Beginning
of Period
|
Charged
(Credited) to
Costs and
Expenses
|
Charged
(Credited) to
Write-offs & Other
Accounts
|
Balance at
End of
Period
|
||||||||||||
|
|
||||||||||||||||
|
Current Provision:
|
|
|
|
|
|
|
|
|
||||||||
|
Allowance For Doubtful Accounts:
|
|
|
|
|
|
|
|
|
||||||||
|
Year Ended December 31, 2017
|
$
|
3,395
|
|
$
|
9,980
|
|
$
|
(11,285
|
)
|
$
|
2,090
|
|
||||
|
Year Ended December 31, 2016
|
$
|
5,496
|
|
$
|
10,776
|
|
$
|
(12,877
|
)
|
$
|
3,395
|
|
||||
|
Year Ended December 31, 2015
|
$
|
8,546
|
|
$
|
6,083
|
|
$
|
(9,133
|
)
|
$
|
5,496
|
|
||||
|
Due After One Year:
|
|
|
|
|
|
|
|
|
||||||||
|
Allowance For Doubtful Accounts:
|
|
|
|
|
|
|
|
|
||||||||
|
Year Ended December 31, 2017
|
$
|
11,334
|
|
$
|
—
|
|
$
|
(388
|
)
|
$
|
10,946
|
|
||||
|
Year Ended December 31, 2016
|
$
|
11,334
|
|
$
|
—
|
|
$
|
—
|
|
$
|
11,334
|
|
||||
|
Year Ended December 31, 2015
|
$
|
11,259
|
|
$
|
—
|
|
$
|
75
|
|
$
|
11,334
|
|
||||
|
Preneed Receivables, Net
|
|
|
|
|
|
|
|
|
||||||||
|
Asset Allowance For Cancellation:
|
|
|
|
|
|
|
|
|
||||||||
|
Year Ended December 31, 2017
|
$
|
104,740
|
|
$
|
1,105
|
|
$
|
1,904
|
|
$
|
107,749
|
|
||||
|
Year Ended December 31, 2016
|
$
|
105,773
|
|
$
|
1,411
|
|
$
|
(2,444
|
)
|
$
|
104,740
|
|
||||
|
Year Ended December 31, 2015
|
$
|
107,040
|
|
$
|
5,016
|
|
$
|
(6,283
|
)
|
$
|
105,773
|
|
||||
|
Deferred Revenue
|
|
|
|
|
|
|
|
|
||||||||
|
Revenue Allowance For Cancellation:
|
|
|
|
|
|
|
|
|
||||||||
|
Year Ended December 31, 2017
|
$
|
(116,913
|
)
|
$
|
—
|
|
$
|
(1,186
|
)
|
$
|
(118,099
|
)
|
||||
|
Year Ended December 31, 2016
|
$
|
(121,548
|
)
|
$
|
—
|
|
$
|
4,635
|
|
$
|
(116,913
|
)
|
||||
|
Year Ended December 31, 2015
|
$
|
(125,030
|
)
|
$
|
—
|
|
$
|
3,482
|
|
$
|
(121,548
|
)
|
||||
|
Deferred Tax Valuation Allowance:
|
|
|
|
|
|
|
|
|
||||||||
|
Year Ended December 31, 2017
|
$
|
132,500
|
|
$
|
8,035
|
|
$
|
619
|
|
$
|
141,154
|
|
||||
|
Year Ended December 31, 2016
|
$
|
126,654
|
|
$
|
6,336
|
|
$
|
(490
|
)
|
$
|
132,500
|
|
||||
|
Year Ended December 31, 2015
|
$
|
134,201
|
|
$
|
(5,988
|
)
|
$
|
(1,559
|
)
|
$
|
126,654
|
|
||||
82
|
Item 9.
|
Changes In and Disagreements with Accountants on Accounting and Financial Disclosure
|
None.
|
Item 9A.
|
Controls and Procedures.
|
Evaluation of Disclosure Controls and Procedures
We have established disclosure controls and procedures that are designed to ensure that the information required to be disclosed by the Company in the reports that it files or submits under the Securities Exchange Act of 1934, as amended (the “Exchange Act”) is recorded, processed, summarized, and reported within the time periods specified in SEC rules and forms and that such information is accumulated and communicated to management, including our principal executive officer and principal financial officer (who are our Chief Executive Officer and Chief Financial Officer, respectively) as appropriate to allow timely decisions regarding required disclosure. In designing and evaluating our disclosure controls and procedures, management recognized that disclosure controls and procedures can provide only reasonable, not absolute, assurance that the objectives of the disclosure controls and procedures are met.
In connection with the preparation of this Annual Report on Form 10-K for the year ended
December 31, 2017
, an evaluation was performed under the supervision and with the participation of management, including the Chief Executive Officer and Chief Financial Officer, of the effectiveness of the Company's disclosure controls and procedures. Based on that evaluation, the Chief Executive Officer and Chief Financial Officer have concluded that the Company's disclosure controls and procedures as defined in Rules 13a-15(c) and 15d-15(e) were effective as of
December 31, 2017
to provide reasonable assurance that information required to be disclosed by the Company in reports that it files or submits under the Exchange Act is (i) recorded, processed, summarized and reported within the time periods specified in the SEC rules and forms and (ii) accumulated and communicated to the Company’s management, including its principal executive officer and principal financial officer, as appropriate to allow timely decisions regarding required disclosure.
Management’s Report on Internal Control Over Financial Reporting
Management is responsible for establishing and maintaining adequate internal control over financial reporting, as such term is defined in Exchange Act Rules 13a-15(f) and 15d-15(f). The Company's internal control over financial reporting includes those policies and procedures that (i) pertain to the maintenance of records that, in reasonable detail, accurately and fairly reflect the transactions and dispositions of assets of the Company; (ii) provide reasonable assurance that transactions are recorded as necessary to permit preparation of financial statements in accordance with generally accepted accounting principles, and that receipts and expenditures of the Company are being made only in accordance with authorizations of management and directors of the Company; and (iii) provide reasonable assurance regarding prevention or timely detection of unauthorized acquisition, use, or disposition of the Company’s assets that could have a material effect on the financial statements.
Internal control over financial reporting is designed to provide reasonable assurance regarding the reliability of financial reporting and the preparation of financial statements prepared for external purposes in accordance with generally accepted accounting principles. Because of its inherent limitations, internal control over financial reporting may not prevent or detect misstatements. Also, projections of any evaluation of effectiveness to future periods are subject to the risk that controls may become inadequate because of changes in conditions or that the degree of compliance with the policies or procedures may deteriorate.
Our management, with the participation of our Chief Executive Officer and Chief Financial Officer, assessed the effectiveness of our internal control over financial reporting as of
December 31, 2017
using the criteria established in
Internal Control - Integrated Framework
(2013) issued by the Committee of Sponsoring Organizations of the Treadway Commission (COSO). Based on this assessment and those criteria, management concluded that our internal control over financial reporting was effective as of
December 31, 2017
.
The effectiveness of the Company's internal control over financial reporting as of
December 31, 2017
, has been audited by PricewaterhouseCoopers LLP, an independent registered public accounting firm, as stated in their report, which is included in Item 8, "Financial Statements and Supplementary Data" of this Annual Report on Form 10-K.
Changes in Internal Control Over Financial Reporting
No changes in our internal control over financial reporting occurred during the quarter ended December 31, 2017 that have materially affected, or are reasonably likely to materially affect, our internal control over financial reporting.
83
Item 9B.
Other Information.
Effective as of February 14, 2018, the Company’s Board approved and amended certain provisions of the Bylaws to, among other things, (1) permit the Lead Director to call a special meeting of the Board and preside over Board meetings in the absence of the Board Chair, (2) remove the power of the President to (a) call a special meeting of the shareholders, the Directors or the executive committee of the Board, and to (b) preside over either of the shareholders or Director meetings, and (3) permit the chair of the nominating and corporate governance committee of the Board to preside over Board meetings in the absence of the Board Chair, Lead Director and the Chief Executive Officer. The foregoing description of the amended terms of the Bylaws does not purport to be complete and is subject to, and qualified in its entirety by reference to, the amended Bylaws, which are filed herewith as Exhibit 3.4.
|
Item 10.
|
Directors, Executive Officers, and Corporate Governance
|
|
Item 11.
|
Executive Compensation
|
|
Item 12.
|
Security Ownership of Certain Beneficial Owners and Management and Related Stockholder Matters
|
|
Item 13.
|
Certain Relationships and Related Transactions
and Director Independence
|
|
Item 14.
|
Principal Accountant Fees and Services
|
The information required by each of Items 10, 11, 12, 13 and 14, except as included below, is incorporated herein by reference to the Service Corporation International Proxy Statement for our
2018
Annual Meeting of shareholders.
The information regarding our executive officers called for by Item 401 of Regulation S-K and the information regarding our code of ethics called for by Item 406 of Regulation S-K has been included in PART I of this report. The information regarding our equity compensation plan information called for by Item 201(d) of Regulation S-K is set forth below.
Equity Compensation Plan Information at
December 31, 2017
:
|
Number of Securities to be
Issued upon Exercise of
Outstanding Options,
Warrants, and Rights
|
Weighted-Average
Exercise Price of
Outstanding Options,
Warrants, and Rights
|
Number of Securities
Remaining Available for
Future Issuance Under
Equity Compensation Plans
(Excluding Securities
Reflected in Column (a))
|
||||||||
|
Plan Category
|
(a)
|
(b)
|
(c)
|
|||||||
|
Equity compensation plans approved by security holders
|
9,520,299
|
|
$
|
19.77
|
|
10,125,235
|
|
|||
|
Item 15.
|
Exhibits and Financial Statement Schedule
|
(a)(1)-(2)
Financial Statements and Schedule:
The financial statements and schedule are listed in the accompanying Index to Financial Statements and Related Schedule on page 39 of this report.
(3)
Exhibits:
EXHIBIT INDEX
PURSUANT TO ITEM 601 OF REG. S-K
|
Exhibit Number
|
|
Description
|
|||
|
|
—
|
|
|||
|
|
—
|
|
|||
|
|
—
|
|
|||
|
|
—
|
|
|||
84
|
|
—
|
|
|||
|
|
—
|
|
|||
|
|
—
|
|
|||
|
|
—
|
|
|||
|
|
—
|
|
|||
|
|
—
|
|
|||
|
|
—
|
|
|||
|
|
—
|
|
|||
|
|
—
|
|
|||
|
|
—
|
|
|||
|
|
—
|
|
|||
|
|
—
|
|
|||
|
|
—
|
|
|||
|
|
—
|
|
|||
|
|
—
|
|
|||
|
|
—
|
|
|||
|
|
—
|
|
|||
|
|
—
|
|
|||
|
|
—
|
|
|||
|
|
—
|
|
|||
|
|
—
|
|
|||
|
|
—
|
|
|||
|
|
—
|
|
|||
|
|
—
|
|
|||
|
|
—
|
|
|||
|
|
—
|
|
|||
|
|
—
|
|
|||
|
|
—
|
|
|||
85
|
|
—
|
|
|||
|
|
—
|
|
|||
|
|
—
|
|
|||
|
|
—
|
|
|||
|
|
—
|
|
|||
|
|
—
|
|
|||
|
|
—
|
|
|||
|
|
—
|
|
|||
|
|
—
|
|
|||
|
101
|
|
—
|
|
Interactive data file.
|
|
In the above list, the management contracts or compensatory plans or arrangements are set forth in Exhibits 10.1 through 10.26.
Pursuant to Item 601(b)(4) of Regulation S-K, certain instruments on a consolidated basis are not filed as exhibits to this report with respect to long-term debt under which the total amount of securities authorized thereunder does not exceed 10 percent of the total assets of Registrant and its subsidiaries. Registrant agrees to furnish a copy of any such instrument to the Commission upon request.
(b)
Included in (a) above.
(c)
Included in (a) above.
|
Item 16.
|
Form 10-K Summary
|
None.
86
SIGNATURES
Pursuant to the requirements of Section 13 or 15(d) of the Securities Exchange Act of 1934, the Registrant, Service Corporation International, has duly caused this report to be signed on its behalf by the undersigned, thereunto duly authorized.
|
SERVICE CORPORATION INTERNATIONAL
|
||
|
|
By:
|
/s/ GREGORY T. SANGALIS
|
|
(Gregory T. Sangalis,
Senior Vice President, General
Counsel, and Secretary ) |
||
Dated:
February 14, 2018
Pursuant to the requirements of the Securities Exchange Act of 1934, this report has been signed below by the following persons on behalf of the Registrant and in the capacities and on the date indicated.
|
Signature
|
|
Title
|
|
Date
|
||
|
|
|
|
|
|
||
|
/s/ THOMAS L. RYAN*
|
|
Chairman of the Board and Chief Executive Officer (Principal Executive Officer)
|
|
February 14, 2018
|
||
|
(Thomas L. Ryan)
|
|
|
|
|||
|
/s/ ERIC D. TANZBERGER*
|
|
Senior Vice President, Chief Financial Officer (Principal Financial Officer)
|
|
February 14, 2018
|
||
|
(Eric D. Tanzberger)
|
|
|
|
|||
|
/s/ TAMMY R. MOORE*
|
|
Vice President and Corporate Controller (Principal Accounting Officer)
|
|
February 14, 2018
|
||
|
(Tammy R. Moore)
|
|
|
|
|||
|
/s/ R. L. WALTRIP*
|
|
Founder and Chairman Emeritus, Director
|
|
February 14, 2018
|
||
|
(R. L. Waltrip)
|
|
|
|
|||
|
/s/ ANTHONY L. COELHO*
|
|
Lead Director
|
|
February 14, 2018
|
||
|
(Anthony L. Coelho)
|
|
|
|
|
||
|
/s/ ALAN R. BUCKWALTER, III*
|
|
Director
|
|
February 14, 2018
|
||
|
(Alan R. Buckwalter, III)
|
|
|
|
|
||
|
/s/ VICTOR L. LUND*
|
|
Director
|
|
February 14, 2018
|
||
|
(Victor L. Lund)
|
|
|
|
|
||
|
/s/ JOHN W. MECOM, JR.*
|
|
Director
|
|
February 14, 2018
|
||
|
(John W. Mecom, Jr.)
|
||||||
|
/s/ CLIFTON H. MORRIS, JR.*
|
Director
|
February 14, 2018
|
||||
|
(Clifton H. Morris, Jr.)
|
||||||
|
/s/ ELLEN OCHOA*
|
Director
|
February 14, 2018
|
||||
|
(Ellen Ochoa)
|
||||||
|
/s/ W. BLAIR WALTRIP*
|
Director
|
February 14, 2018
|
||||
|
(W. Blair Waltrip)
|
||||||
|
/s/ MARCUS A. WATTS*
|
Director
|
February 14, 2018
|
||||
|
(Marcus A. Watts)
|
||||||
|
/s/ EDWARD E. WILLIAMS*
|
Director
|
February 14, 2018
|
||||
|
(Edward E. Williams)
|
||||||
|
*By
|
/s/ GREGORY T. SANGALIS
|
February 14, 2018
|
||||
|
(Gregory T. Sangalis, as
Attorney-In-Fact for each of the Persons indicated) |
||||||
87
TABLE OF CONTENTS
Part IItem 1. BusinessItem 1A. Risk FactorsItem 1B. Unresolved Staff CommentsItem 2. PropertiesItem 3. Legal ProceedingsItem 4. Mine Safety DisclosuresPart IIItem 5. Market For Registrant's Common Equity, Related Stockholder Matters, and Issuer Purchases Of Equity SecuritiesItem 6. Selected Financial DataItem 7. Management S Discussion and Analysis Of Financial Condition and Results Of OperationsItem 7A. Quantitative and Qualitative Disclosures About Market RiskItem 8. Financial Statements and Supplementary DataItem 9. Changes in and Disagreements with Accountants on Accounting and Financial DisclosureItem 9A. Controls and ProceduresItem 9B. Other InformationPart IIIItem 10. Directors, Executive Officers, and Corporate GovernanceItem 11. Executive CompensationItem 12. Security Ownership Of Certain Beneficial Owners and Management and Related Stockholder MattersItem 13. Certain Relationships and Related Transactions and Director IndependenceItem 14. Principal Accountant Fees and ServicesPart IVItem 15. Exhibits and Financial Statement ScheduleItem 16. Form 10-k Summary