SCYNEXIS INC
10-Ks and 10-Qs
|
|
|
|
|
|
|
|
|
|
|
|
|
|
|
|
|
|
|
|
|
|
|
|
|
|
|
|
|
|
|
|
|
|
|
|
|
|
|
|
|
|
|
|
|
|
|
|
|
|
|
|
|
UNITED STATES
SECURITIES AND EXCHANGE COMMISSION
WASHINGTON, D.C. 20549
FORM 10-K
(Mark One)
|
ý
|
ANNUAL REPORT PURSUANT TO SECTION 13 OR 15(d) OF THE SECURITIES EXCHANGE ACT OF 1934
|
FOR THE FISCAL YEAR ENDED
DECEMBER 31, 2014
OR
|
¨
|
TRANSITION REPORT PURSUANT TO SECTION 13 OR 15(d) OF THE SECURITIES EXCHANGE ACT OF 1934
|
FOR THE TRANSITION PERIOD FROM TO
Commission File Number 001-36365
SCYNEXIS, Inc.
(Exact name of registrant as specified in its charter)
|
Delaware
|
|
56-2181648
|
|
(State or other jurisdiction of
incorporation or organization)
|
|
(I.R.S. Employer
Identification No.)
|
|
3501 C Tricenter Boulevard
Durham, North Carolina
|
|
27713
|
|
(Address of principal executive offices)
|
|
(Zip Code)
|
(919) 544-8600
(Registrant’s telephone number, including area code)
Securities registered pursuant to Section 12(b) of the Act:
|
Title of Each Class
|
|
Name of Each Exchange on Which Registered
|
|
Common Stock, par value $0.001 per share
|
|
The NASDAQ Stock Market LLC
|
|
Securities registered pursuant to section 12(g) of the Act: None
|
||
Indicate by check mark if the registrant is a well-known seasoned issuer, as defined in Rule 405 of the Securities Act. Yes
¨
No
ý
Indicate by check mark if the registrant is not required to file reports pursuant to Section 13 or 15(d) of the Act. Yes
¨
No
ý
Indicate by check mark whether the registrant (1) has filed all reports required to be filed by Section 13 or 15(d) of the Securities Exchange Act of 1934 during the preceding 12 months (or for such shorter period that the registrant was required to file such reports), and (2) has been subject to such filing requirements for the past 90 days. Yes
ý
No
¨
Indicate by check mark whether the registrant has submitted electronically and posted on its corporate Web site, if any, every Interactive Data File required to be submitted and posted pursuant to Rule 405 of Regulation S-T (§232.405 of this chapter) during the preceding 12 months (or for such shorter period that the registrant was required to submit and post such files). Yes
ý
No
¨
Indicate by check mark if disclosure of delinquent filers pursuant to Item 405 of Regulation S-K (§ 229.405 of this chapter) is not contained herein, and will not be contained, to the best of registrant’s knowledge, in definitive proxy or information statements incorporated by reference in Part III of this Form 10-K or any amendment to this Form 10-K.
¨
Indicate by check mark whether the registrant is a large accelerated filer, an accelerated filer, a non-accelerated filer, or a smaller reporting company. See the definitions of “large accelerated filer,” “accelerated filer” and “smaller reporting company” in Rule 12b-2 of the Exchange Act.
|
Large accelerated filer
|
|
¨
|
|
Accelerated filer
|
|
¨
|
|
Non-accelerated filer
|
¨
(Do not check if a smaller reporting company)
|
|
Smaller reporting company
|
|
ý
|
|
Indicate by check mark whether the registrant is a shell company (as defined in Rule 12b-2 of the Exchange Act). Yes
¨
No
ý
The aggregate market value of the voting and non-voting common equity held by non-affiliates of the registrant based upon the closing price of its Common Stock on the Nasdaq Global Market on June 30, 2014 was
$27,042,903
. Excludes 5,130,122 shares of the registrant's Common Stock held by executive officers, directors and any stockholders whose ownership exceeds 5% of registrant's Common Stock outstanding at June 30, 2014. Exclusion of such shares should not be construed to indicate that any such person possesses the power, direct or indirect, to direct or cause the direction of the management or policies of the registrant or that such person is controlled by or under common control with the registrant.
As of
March 1, 2015
, there were
8,512,103
shares of the registrant’s Common Stock outstanding.
Documents Incorporated by Reference
Portions of the registrant’s proxy statement to be filed with the Securities and Exchange Commission pursuant to Regulation 14A in connection with the registrant’s 2015 Annual Meeting of Stockholders, which will be filed subsequent to the date hereof, are incorporated by reference into Part III, Item 14 of this Form 10-K. Such proxy statement will be filed with the Securities and Exchange Commission not later than 120 days following the end of the registrant’s fiscal year ended December 31, 2014.
SCYNEXIS, INC.
ANNUAL REPORT ON FORM 10-K
FOR THE FISCAL YEAR ENDED
DECEMBER 31, 2014
TABLE OF CONTENTS
|
Item 1.
|
||
|
Item 1A.
|
||
|
Item 1B.
|
||
|
Item 2.
|
||
|
Item 3.
|
||
|
Item 4.
|
||
|
Item 5.
|
||
|
Item 6.
|
||
|
Item 7.
|
||
|
Item 7A.
|
||
|
Item 8.
|
||
|
Item 9.
|
||
|
Item 9A.
|
||
|
Item 9B.
|
||
|
Item 10.
|
||
|
Item 11.
|
||
|
Item 12.
|
||
|
Item 13.
|
||
|
Item 14.
|
||
|
Item 15.
|
||
2
SPECIAL NOTE REGARDING FORWARD-LOOKING STATEMENTS
This Annual Report on Form 10-K contains forward-looking statements within the meaning of Section 27A of the Securities Act of 1933, as amended, and Section 21E of the Securities Exchange Act of 1934, as amended, which are subject to the “safe harbor” created by those sections. Forward-looking statements are based on our management’s beliefs and assumptions and on information currently available to our management. In some cases, you can identify forward-looking statements by terms such as “may,” “will,” “should,” “could,” “would,” “expect,” “plan,” “anticipate,” “believe,” “estimate,” “project,” “predict,” “potential” and similar expressions intended to identify forward-looking statements. These statements involve known and unknown risks, uncertainties and other factors which may cause our actual results, performance, time frames or achievements to be materially different from any future results, performance, time frames or achievements expressed or implied by the forward-looking statements. We discuss many of these risks, uncertainties and other factors in this Annual Report on Form 10-K in greater detail under the heading “Risk Factors.” Given these risks, uncertainties and other factors, you should not place undue reliance on these forward-looking statements. Also, these forward-looking statements represent our estimates and assumptions only as of the date of this filing. You should read this Annual Report on Form 10-K completely and with the understanding that our actual future results may be materially different from what we expect. We hereby qualify our forward-looking statements by our cautionary statements. Except as required by law, we assume no obligation to update these forward-looking statements publicly, or to update the reasons actual results could differ materially from those anticipated in these forward-looking statements, even if new information becomes available in the future.
|
ITEM 1.
|
BUSINESS
|
Overview
SCYNEXIS is a pharmaceutical company committed to the discovery, development and commercialization of novel anti-infectives to address significant unmet therapeutic needs. We are developing our lead product candidate, SCY-078, as a novel oral and intravenous (IV) drug for the treatment of serious and life-threatening invasive fungal infections in humans. SCY-078 has been shown to be effective
in vitro
and
in vivo
in animal studies against a broad range of
Candida
and
Aspergillus
species, including drug resistant strains. These important pathogens account for approximately 85% of invasive fungal infections in the United States and Europe. SCY-078 was shown to be sufficiently safe and well-tolerated in multiple Phase 1 studies to support progression to Phase 2 studies. We have opened multiple trial sites, are actively screening patients, and recently enrolled the first patient in March 2015 in a Phase 2 study with the oral formulation of SCY-078 for the treatment of invasive
Candida
infection, a common and often fatal invasive fungal infection. We anticipate beginning Phase 1 studies with an IV formulation of SCY-078 in the second half of 2015. In addition to pursuing the development of SCY-078, we have additional compounds similar to SCY-078 and related expertise that we may use to expand our antifungal portfolio. We also provide contract research and development services primarily in the field of animal health, which currently generate substantially all of our revenue. Our previous drug discovery initiatives produced clinical and preclinical programs based on the use of cyclophilin inhibitors to treat viral diseases, which we have licensed to a partner for continued development and commercialization.
As a spinout from Aventis S.A., or Aventis in 2000, we began as a chemistry and animal health services company, providing contract research services to third parties. Through the provision of these contract research and development services, we built significant expertise in parasitic infections and drug discovery. Since our formation, we have expanded our animal health capabilities and have discovered a number of proprietary compounds primarily within our cyclophilin inhibitor platform. Our two lead compounds from our cyclophilin inhibitor platform include SCY-641, a compound licensed to Dechra Ltd. in 2012 for clinical development for the treatment of dog dry eye, and SCY-635, a compound licensed to Waterstone Pharmaceutical (HK Limited), or Waterstone, in October 2014 for the treatment of viral diseases in humans.
In 2013, we exclusively licensed SCY-078 from Merck Sharp & Dohme, or Merck, in the field of human health, and Merck transferred to us the investigational new drug application on file with the U.S. Food and Drug Administration, or the FDA, as well as all data Merck had developed for the compound, plus active pharmaceutical ingredient and tablets. In 2014, Merck assigned the patents to us related to SCY-078 that it had exclusively licensed to us. We are focusing our resources on the development of SCY-078.
On May 7, 2014, we completed an initial public offering of our common stock, which we refer to as our IPO. We sold an aggregate of 6,200,000 shares of common stock under the registration statement on Form S-1 declared effective by the SEC on May 2, 2014, at a public offering price of $10.00 per share. Net proceeds to us were $54.6 million, after deducting underwriting discounts and commissions and offering expenses. Upon the completion of our IPO, all our outstanding shares of convertible
preferred stock were automatically converted into 1,691,884 shares of common stock and substantially all outstanding common stock warrants were exercised for an additional 275,687 shares of common stock with net proceeds to us of $0.1 million. In connection with the consummation of the IPO, we repaid outstanding debt with a principal balance of $15 million, plus all accrued interest, to the holder of such debt, which was outstanding pursuant to a credit agreement referred to herein as the 2013 Credit Agreement.
We are an emerging growth company. Under the Jumpstart Our Business Startups Act of 2012, or JOBS Act, emerging growth companies can delay adopting new or revised accounting standards until such time of those standards apply to private companies. We have irrevocably elected not to adopt this exemption from new or revised accounting standards, and therefore, we will be subject to the same new or revised accounting standards as other public companies that are not “emerging growth companies.”
Market Opportunity
We estimate that the annual worldwide market for systemic antifungal therapeutics, where we will target SCY-078, is approximately $3.6 billion. Each year there are estimated to be over 600,000 confirmed cases of invasive fungal infections caused by various species of
Candida
and
Aspergillus
, the two most common invasive fungal pathogens in the United States and Europe. The rapid progression of disease and high mortality rates associated with documented invasive fungal infections often result in antifungal therapy being administered in suspected (unconfirmed) cases or as a preventative measure in patients at high risk. For example, we estimate the total number of patients treated for suspected invasive
Candida
infections to be approximately three to four times the number of confirmed cases. Also, the increasingly widespread use of immune suppressive drugs as cancer chemotherapy or for organ transplantation or treatment of autoimmune disease has resulted in an increasing population of patients at risk for invasive fungal infections. Furthermore, the limited number of antifungal drug classes, consisting of azoles, echinocandins and polyenes, and their widespread use, has led to increased numbers of, and infections with, drug-resistant strains. The resulting pattern of infection, followed by treatment, followed by the development of resistance, followed by more infections is familiar to the medical community, as it has faced these same issues with multi-drug resistant bacterial infections such as methicillin-resistant
Staphylococcus aureus
, commonly known as MRSA.
SCY-078 represents a new chemical class of drugs designed to block an established target in infectious fungi. SCY-078 has shown potent
in vitro
activity against a large collection of medically relevant strains of
Candida
and
Aspergillus
, including multi-drug resistant strains that have been isolated from infected patients. We have conducted studies of SCY-078 using animal models that were used in the development of previously approved antifungal drugs where these models were proven to be predictive of efficacy in humans. Using these well-established animal models, SCY-078 was shown to be highly active against
Candida
and
Aspergillus.
SCY-078 blood concentrations were measured in a subset of the studies in the murine model of candidiasis to determine levels required for efficacy. In subsequent Phase 1 studies, in approximately 100 healthy human volunteers, blood concentrations of SCY-078 were achieved that met the levels predicted to be effective in treating invasive
Candida
infections and, at these exposures, was sufficiently safe and well tolerated to support progression to Phase 2 studies.
SCY-078 Development
We are developing both an IV and oral formulation of SCY-078 because patients with invasive
Candida
infections are typically prescribed IV treatment in hospitals, and then are switched, or “stepped down,” to oral formulations when the patient shows sufficient improvement of symptoms.The availability of SCY-078 in both oral and IV formulations would allow patients to remain within the same drug class and potentially be discharged from the hospital sooner.
Our current focus for development of SCY-078 is the continued execution of a randomized Phase 2 study with the oral formulation of SCY-078. This is a three arm study comparing two doses of SCY-078 to current standard of care in patients with invasive
Candida
infections following initial therapy with an IV echinocandin class antifungal drug. We have opened multiple trial sites, we are actively screening patients for enrollment, and we enrolled the first patient in March 2015. We amended the study protocol's enrollment criteria in February 2015 in order to enhance and expedite recruitment and we are currently preparing further enhancements to the study's protocol. We believe that these changes to enrollment criteria will improve the Phase 2 study's overall progress without affecting the interpretability of the study. We expect to report complete data from the Phase 2 study in the first half of 2016.
We are also currently developing an IV formulation of SCY-078 and intend to initiate Phase 1 studies with an IV formulation in the second half of 2015. The next planned study evaluating the efficacy and safety of SCY-078 in patients will include the option of stepping down from IV to oral SCY-078.
If approved, we intend to market SCY-078 to hospitals and major medical centers, where physicians specializing in critical care, infectious disease specialists, and physicians treating immune-compromised patients, such as oncologists and those performing solid organ transplants and stem cell transplants, are likely to be found and where invasive fungal infections are more prevalent.
4
Despite the increasing availability of generic azole drugs and the eventual availability of generic echinocandin drugs, we believe SCY-078, once commercialized, will achieve market acceptance at prices comparable to that of the top selling branded hospital-based antibiotics. We believe we can achieve branded pricing even with the increasing availability of generic drugs because we anticipate positioning SCY-078 for use in patients infected with multi-drug resistant strains and as an alternative to echinocandins. Our positioning strategies are as follows:
|
•
|
Drug resistant strains.
There are many invasive fungal strains resistant to azole drugs. High rates of morbidity and mortality, and extended hospital stays associated with infections from drug resistant strains, will make a strong argument for use of a branded-priced antifungal drug which is effective against these resistant strains.
|
|
•
|
Alternative to echinocandins.
Physicians are reluctant to prescribe azoles in hospitals where azole resistance is prevalent, as an ineffective course of therapy can compromise the patient’s survival. Thus, in these settings, physicians often prescribe echinocandins; but echinocandins are only available in IV formulation. Subsequent step down to an oral azole to allow release from the hospital risks relapse of an azole resistant infection if the original pathogen was not identified and susceptibility determined, leading some physicians to keep patients on IV echinocandins for the full course of therapy. If successfully developed, SCY-078 would provide an attractive alternative to echinocandin therapy by offering an IV-to-oral step-down within a single therapeutic class, thereby facilitating earlier discharge from the hospital and the resultant reduced exposure to the risk of hospital-acquired infections.
|
Our Corporate Strategy
Key elements of our strategy include:
|
•
|
further develop SCY-078 to obtain regulatory approval in major commercial markets;
|
|
•
|
commercialize SCY-078 in the United States through a focused hospital-based sales force;
|
|
•
|
contract with commercial partners to develop and commercialize SCY-078 outside of the United States; and
|
|
•
|
leverage our strong scientific team and extensive in-house expertise in human and animal drug development to pursue the development of proprietary compounds.
|
Overview of the Antifungal Market
Background of Fungal Diseases
Candida
and
Aspergillus
species are responsible for approximately 85% of all invasive fungal infections in the United States and Europe. Infections caused by
Candida
rank as the fourth most common hospital-acquired bloodstream infection in the United States. There are approximately 400,000 confirmed cases of invasive
Candida
infections annually worldwide. Invasive
Candida
infections result in a mortality rate ranging from 27% to 42% depending on the immune status of the patient. Globally, an estimated 200,000 patients develop confirmed invasive
Aspergillus
infections annually and about 50% of these patients die, even with treatment.
Hospital-acquired fungal infections due to
Candida
and
Aspergillus
species are becoming an increasing problem for the healthcare system. The increases in invasive fungal infections are due to the increased use of immune-suppressing chemotherapies and transplant drugs, and in-dwelling catheters, among other factors. Confirmed cases of invasive
Candida
infections rose in the United States by 52% between 2000 and 2005. In addition, the increase in use of broad spectrum antibiotics has been shown to contribute significantly to the risk of developing invasive fungal infections. Confirmed cases of invasive
Aspergillus
infections nearly doubled in the United States among patients receiving hematopoetic stem cell transplants between 2002 and 2005.
We believe confirmed cases of
Candida
blood infections account for only approximately one-quarter to one-third of
Candida
treatments. We further believe therapy prior to diagnosis, based on the presence of symptoms, represents a majority of the non-confirmed
Candida
treatments. This “empiric” therapy is clinically warranted because invasive
Candida
infections can be difficult to diagnose and the diagnosis is often available only after the patient has become too ill to recover. Initiation of therapy within the first twelve hours following suspicion of fungal infection reduces the risk of death threefold. In addition, increased numbers of patients are undergoing procedures, such as chemotherapy and solid organ and stem cell transplants, that cause or result in immune-suppression and therefore put patients at high risk of invasive
Candida
infections. As a result, we believe antifungal therapy as preventative treatment accounts for the remaining
Candida
treatments.
Current therapeutic options
Invasive fungal infections are currently treated using three main classes of antifungal drugs that target fungal cell membranes or cell walls. Each of these antifungal drugs has its own limitations that reduce its clinical usefulness.
5
Azoles.
Azoles, which block biosynthesis of a fungal cell membrane component, are the most frequently used class for treatment of invasive fungal infections and are available in IV and oral formulations. Azoles are used extensively for prevention and in unconfirmed cases. However, while azole-sensitive species have been well-treated, this has permitted azole-resistant infections, with species such as
Candida glabrata,
to become more prevalent. Further, cross resistance among the azoles exists, which means that once an azole has been tried and failed, another azole may not be effective. Despite these limitations, annual sales of azoles exceeded $2.1 billion in 2011. Voriconazole, the leading azole, generated revenues of $754 million in 2012.
Echinocandins.
Echinocandins block biosynthesis of fungal cell walls by inhibiting a glucan synthase enzyme, an enzyme not found in human cells. The clinical success of echinocandins, particularly in azole resistant infections, combined with their good tolerability profile, has resulted in these compounds being increasingly used in the treatment of invasive
Candida
infections. However, echinocandins are only available in IV formulation. To allow for discharge from the hospital as quickly as possible, preferred medical practice is to transition eligible patients from IV to oral therapy. Without the availability of an oral echinocandin, physicians are forced to choose between administering oral azoles as a step down therapy and thereby risk re-emergence of an infection which may be azole resistant, or keeping the patient on an IV therapy, which may require continued hospitalization. Despite limitations as an IV-only therapy, annual sales of echinocandins were approximately $1.1 billion in 2011. Caspofungin, the leading echinocandin, generated revenues of $619 million in 2012.
Polyenes
. Polyenes disrupt fungal cell membranes. The primary commercial polyene, amphotericin B, is used to treat a wide variety of fungi, including rare and difficult-to-treat species. However, polyenes have serious side effects including acute, potentially fatal kidney and heart injury. As a result, polyenes are typically used as a drug of last resort for treating invasive
Candida
and
Aspergillus
infections. Despite this toxicity, annual sales of lipid amphotericin B alone were approximately $450 million in 2012.
Antifungal Drug Resistance
Broad use of azole drugs has resulted in an increasing incidence of drug resistant
Candida
infections. At hospitals performing medically intensive procedures such as transplantation, rates of reduced azole susceptibility have reached 15-20%. We believe the rising level of azole resistance is driven by the reduction in prevalence of susceptible species such as
Candida albicans
and the resultant increase in prominence of infections caused by species inherently resistant to azoles, such as
Candida glabrata
and
Candida krusei
. Declining azole efficacy in
Candida
infections has caused echinocandins to emerge as drugs of first choice for most patients with invasive
Candida
infections. However, a recent study reported echinocandin resistance for
Candida glabrata
at an incidence rate exceeding 10%. Of the echinocandin resistant strains, the majority are also resistant to azoles, making these strains multi-drug resistant.
Broad use of azole drugs has also fostered resistance in
Aspergillus
species. In a 2010 study, two U.S. laboratories reported resistance rates of approximately 50% in the
Aspergillus fumigatus
species, which accounts for the majority of
Aspergillus
fungal infections in the United States. These results were corroborated in another study, in which azole-resistant mutations were observed in approximately half of the
Aspergillus
samples evaluated from patients diagnosed with invasive
Aspergillus
lung infections.
Our Product Candidate: SCY-078
SCY-078 Overview
We discovered and developed SCY-078 through a research collaboration with Merck Sharp & Dohme Corp., or Merck, a subsidiary of Merck & Co., Inc., and in May 2013 acquired worldwide rights to SCY-078 in the field of human health. The compound is derived, by chemical modification, from a natural product and shows antifungal activity against
Candida
and
Aspergillus
through inhibition of glucan synthesis, like the echinocandin class. SCY-078 was shown to exhibit fungicidal activity against
Candida albicans
, the most common cause of invasive fungal infections among the
Candida
species, consistent with that of the echinocandins. In addition, SCY-078 has shown potent
in vitro
activity against approximately 650 laboratory and clinically important strains of
Candida
and
Aspergillus
, including strains that are resistant to azoles and echinocandins. Activity against the majority of echinocandin resistant strains suggests that SCY-078 represents a new class of antifungal agents (a novel enfumafungin antifungal agent) that acts on a validated antifungal target in a manner distinct from the echinocandins.
In animal models of invasive fungal infections used to test other drugs that have proven to be effective in humans, SCY-078 was shown to be highly active against
Candida
. Further studies performed in these animal models allowed for the determination of the drug concentrations in blood required to achieve efficacy. These correlations of drug exposure to drug activity, or PK/PD, have been used to identify the predicted human exposure of SCY-078 believed to be required to achieve efficacy.
In Phase 1 studies, SCY-078 has been shown to be sufficiently safe and well-tolerated in approximately 100 healthy human subjects at initial oral doses of up to 1800mg in one day and doses up to 800mg per day for 28 consecutive days to
6
support progression into Phase 2 studies. Furthermore, oral dosing of the compound results in sustained blood concentrations in the range predicted from preclinical PK/PD studies to be required for efficacy.
We are currently conducting a randomized Phase 2 study with the oral formulation of SCY-078. We are also currently developing an IV formulation of SCY-078 and intend to initiate Phase 1 studies with an IV formulation in the second half of 2015.

In connection with our acquisition of the worldwide rights to SCY-078, Merck transferred to us responsibility for the investigational new drug application, or IND, for SCY-078, including all related technical documents, preclinical data, data from the seven Phase 1 trials conducted by Merck, and drug product and drug substance. The drug supplies included sufficient amounts of SCY-078 to complete the ongoing Phase 2 clinical trial for the oral formulation. Merck also transferred additional quantities of active pharmaceutical ingredient, which we believe will be sufficient to support development and manufacture of an IV formulation for our planned Phase 1 clinical studies and provide material for additional toxicology studies.
The Generating Antibiotics Incentives Now Act, or GAIN Act, was enacted in July 2012 to encourage the development of novel anti-infective drugs in the face of increasing drug resistance. Before the passage of the GAIN Act, the FDA traditionally required sponsors of novel antifungal drugs to use non-life threatening fungal infections, such as esophageal
Candida
infections, for a proof-of-concept study in preparation for Phase 3 studies in invasive disease. This approach added time and cost to the process of developing novel drugs for invasive fungal infections. In order to encourage the development of treatments for serious or life-threatening infections, the GAIN Act required the FDA to review and ensure clear guidelines for clinical development of antibacterial and antifungal drugs. After receiving rights to SCY-078 in May 2013, in September 2013 we met with the FDA which recommended we proceed with a smaller scale Phase 2 study directly in patients with invasive
Candida
infections, our intended patient population, without first conducting studies of esophageal
Candida
infections. These changes, we believe, may significantly reduce the time and expense associated with progressing SCY-078 through Phase 2 and Phase 3 studies.
The FDA has designated the oral tablet formulation of SCY-078 as a Qualified Infectious Disease Product, or QIDP, under the GAIN Act and has also granted fast track designation. We will submit applications to have the IV formulation of SCY-078 designated as a QIDP and as a fast track product. The QIDP designation provides, among other benefits, eligibility for fast track designation. The FDA’s fast track drug development program is a process designed to facilitate the development and expeditious review of drugs to treat serious conditions and fill an unmet medical need. This designation allows for companies to interact with the FDA review team frequently to discuss critical development issues such as study design, required safety data necessary to support approval, and structure and content of an NDA. Additionally, should the FDA determine that a fast track product may be effective after their preliminary evaluation of clinical data submitted by a sponsor, the FDA may also consider reviewing portions of a marketing application before the sponsor submits the complete application, known as a “rolling” NDA. If SCY-078 is approved for its proposed use and awarded five years of exclusivity as a new chemical entity, SCY-078 will be eligible for a ten-year period of data exclusivity, comprising five years of NCE exclusivity plus an additional five years as a designated QIDP. This exclusivity period should protect SCY-078 from being subject to competition from an abbreviated new drug application, or ANDA, for a generic drug, or a 505(b)(2) new drug application for a follow-on product until the expiration of the exclusivity period.
SCY-078 is protected by an issued composition of matter patent in the United States which expires in 2030. We have licensed rights to develop and commercialize SCY-078 in the field of human health in Russia and certain smaller non-core markets to R-Pharm, CJSC, or R-Pharm, a leading supplier of hospital drugs in Russia, in exchange for an upfront payment, royalties, and their expertise and financial assistance in developing the compound, as more completely described under the heading “Collaborations and Licensing Agreements” as set forth below.
SCY-078 Target Product Profile
We believe that there is significant commercial opportunity for a new antifungal drug that has potent activity against azole and echinocandin susceptible and resistant
Candida
and
Aspergillus
strains, available in both oral and IV formulations, and has a favorable safety and tolerability profile. SCY-078 has the potential to address all of these needs and could be used as follows:
Treatment of invasive Candida infections
. If SCY-078 is proven safe and effective for the treatment of invasive
Candida
infections, we believe that it could overtake the echinocandins as the drug of choice for these infections because it will be
7
available as both an IV and oral form. More than mere convenience, an orally effective antifungal would allow patients to be transitioned more easily from hospital-based care to outpatient care which may reduce, or eliminate, expensive hospital stays.
Treatment of infections due to drug resistant Candida
. SCY-078 has been shown to be effective preclinically against
Candida
species resistant to azoles, such as
Candida glabrata
and
Candida krusei
. In addition, SCY-078 has been shown to be effective in vitro against the majority of echinocandin-resistant
Candida
strains tested. SCY-078 has the potential to provide a first line treatment against invasive
Candida
infections including those known to be resistant to currently available azoles and echinocandins.
Treatment of invasive Aspergillus infections
. If SCY-078 is proven safe and effective in treating invasive
Aspergillus
infections, we believe the drug would offer significant advantages over the current first line azole therapy of voriconazole due to the numerous drug interactions and adverse events associated with the use of voriconazole. Furthermore, SCY-078 has been shown to be effective
in vitro
against all azole-resistant strains of
Aspergillus
tested. SCY-078 could provide a first line treatment against invasive
Aspergillus
infections known to be resistant to currently available azoles.
Prevention of Candida and Aspergillus infections.
If proven to be safe and effective when used as a preventative treatment for
Candida
and
Aspergillus
infections, SCY-078 has the potential to offer advantages over current prophylactic drugs because of its activity against fungal strains that are resistant to azoles.
Preclinical Characterization of SCY-078
SCY-078 has broad antifungal activity based on a proven mechanism of action
SCY-078 is a potent inhibitor of the synthesis of the polymer beta 1,3 D glucan, an essential component of the fungal cell wall of
Candida
and
Aspergillus
species. Glucan synthesis inhibition is a clinically proven antifungal mechanism, as demonstrated by the echinocandin class of antifungal agents. Activity of SCY-078 observed against the majority of echinocandin-resistant strains suggests that SCY-078 acts in a manner distinct from the echinocandins.
SCY-078 is active in vitro against a broad spectrum of Candida and Aspergillus species
SCY-078 has been shown to have potent activity
in vitro
against over 500 strains from eleven
Candida
species and 150 strains from four
Aspergillus
species. The charts below summarize the
in vitro
activity of SCY-078 against a collection of “wild-type” strains (
i.e.
, those having no known drug resistance) of
Candida
and
Aspergillus
. Drug activity was measured as the minimum concentration of drug which inhibits replication of
Candida
or growth of
Aspergillus
by more than 50% relative to untreated cultures (MIC
50
and MEC
50
, respectively). Each data point represents the average activity value for all strains tested at a single laboratory. Four laboratories were used for evaluation of
Candida
and three laboratories were used for evaluation of
Aspergillus
to confirm reproducibility of results among independent test sites. The potency of SCY-078 against these
Candida
and
Aspergillus
strains is comparable, within assay variability, to that of caspofungin, the current leading echinocandin.

SCY-078 is active in vitro against azole-resistant Candida and Aspergillus strains
Widespread use of azole drugs has resulted in azole-resistant strains of
Candida
and
Aspergillus
becoming increasingly prevalent, leading to treatment failures. Cross resistance among azoles means that once an azole has been tried and failed, another azole may not be effective. SCY-078 was active against all azole-resistant
Candida
strains tested, with activity comparable to that observed against wild-type strains. As shown in the graph below, the
in vitro
activity of SCY-078 was comparable to that of the leading echinocandin against
Candida albicans
resistant to fluconazole, a leading azole.
8

SCY-078 was also active against all azole-resistant
Aspergillus
strains tested, with the range of MEC
50
values comparable to those observed against wild-type strains.
SCY-078 is active in vitro against a majority of echinocandin-resistant Candida species
Echinocandin resistance is increasing in prevalence, particularly among azole-resistant species such as
Candida glabrata
. As illustrated in the figure below, SCY-078 retained
in vitro
activity against a majority of echinocandin-resistant
Candida glabrata
strains tested when defined as minimum inhibitory concentrations (MICs) similar to those seen in wild type
Candida
. Similar results were observed for echinocandin-resistant strains of other
Candida
species. Thus, SCY-078 may offer a therapeutic option against multi-drug resistant strains such as those that have emerged in
Candida glabrata.

Nonclinical toxicology studies determined safety parameters to monitor in SCY-078 in clinical studies
The preclinical safety of SCY-078 has been evaluated in nine exploratory and two GLP, or Good Laboratory Practice, studies in rats, dogs, rabbits, and nonhuman primates. The longest duration of oral dosing was 28 days.
In these studies, at the highest tested doses, at exposures seven fold the targeted efficacious exposure, very slight to moderate toxicities were observed in two animal species. The two major organs impacted were the stomach (degeneration of the stomach lining) and the liver (single cell necrosis). In rats, the degeneration of the stomach lining was reversible after cessation of dosing. Degeneration of the stomach lining observed in preclinical toxicology studies was not seen in healthy subjects in the Phase 1 multiple dose study where individuals who received 800mg SCY-078 daily for 28 days had pre- and post-treatment endoscopy with gastric biopsy. In preliminary developmental and reproductive toxicity studies, SCY-078 did not cause any developmental toxicity in two animal species up to the maximum tolerated dose. In safety pharmacology studies, there were no clinically significant effects of SCY-078 on markers of cardiovascular, respiratory or central nervous system function.
Preclinical pharmacokinetic and drug metabolism properties of SCY-078 support effective oral administration and limited drug-drug interactions
9
SCY-078 has been evaluated broadly in preclinical pharmacokinetic and drug metabolism studies at exposure levels that were higher than those expected to be required to effectively treat infections in humans. SCY-078 was orally bioavailable in all four animal species studied.
Many patients with, or at risk of, invasive fungal infections are taking other medications, making it important to consider drug-drug interactions. The leading azoles have significant effects on the metabolism of many medications, which can lead to over-dosing or toxicity from co-administration of drugs. In vitro, SCY-078 interacts with few drug metabolizing enzymes, and does not induce CYP3A4 (the major drug metabolizing enzyme), thus it may cause fewer clinically relevant drug-drug interactions. The propensity for SCY-078 to be involved in drug-drug interactions will be studied in Phase 1 clinical studies.
In vivo animal studies predict that SCY-078 can be effective in treating invasive fungal infections
Mouse models of
Candida
and
Aspergillus
infections have been predictive of clinical efficacy for the approved glucan synthesis inhibitors. SCY-078 was evaluated in multiple studies in
Candida albicans-
infected mice. In these studies, SCY-078 treated animals had no measurable
Candida
in organs tested following doses which resulted in drug levels in the blood similar to those that have been safely achieved in humans. Comparable results were observed in mice infected with other
Candida
species, including
Candida glabrata
.
The
in vivo
efficacy of SCY-078 was also evaluated against
Aspergillus fumigatus
in multiple studies. When infected with
Aspergillus,
mice with partially deficient immune defenses develop aggressive infections that generally result in death. However, SCY-078-treated mice exhibited dose-dependent increases in survival rates up to 90%, as measured in the first 21 days after infection.
In summary, SCY-078 demonstrated potent
in vivo
antifungal activity in mouse models of
Candida
and
Aspergillus
infection studied, supporting our expectation of clinical efficacy for SCY-078.
Clinical Experience with SCY-078
To date, seven Phase 1 safety and pharmacokinetic studies have been completed using SCY-078. Four of the seven studies evaluated a single oral dose while three evaluated multiple oral doses of SCY-078.
SCY-078 consistently showed sufficient safety and tolerability in Phase 1 studies to support progression into Phase 2 studies
Approximately 100 healthy subjects have received at least one dose of SCY-078 in seven Phase 1 studies. SCY-078 was generally well tolerated at initial oral doses of up to 1800mg in one day and doses up to 800mg per day for 28 consecutive days. The majority of reported adverse events have been generally transient and primarily mild to moderate in intensity.
The preliminary safety and PK data from the completed Phase 1 studies are summarized in the following table:
|
Design/Objective
|
|
Clinical Endpoints
|
|
Subject
Population
|
|
Dosing Regimen
|
|
Results
|
|
Phase 1, randomized, double-blind, placebo-controlled, single ascending-dose, safety, tolerability, and PK study
|
|
Safety and tolerability by physical examination, vital signs, ECGs and laboratory safety evaluations (hematology, chemistry, urinalysis), gastrin levels;
PK data in fasted state and after high fat meal
|
|
16 healthy males (18–45 years)
|
|
Panel A: 8 subjects: single doses 10, 40, 150, 600, and 1600mg SCY-078
(6 active / 2 placebo for each dose)
Panel B: 8 subjects: single doses 20, 80, 300, and 800mg SCY-078
(6 active / 2 placebo for each dose)
|
|
Safety: SCY-078 up to 1600mg was generally safe and well tolerated; no serious adverse events (SAEs) reported.
Statistical analysis of PK parameters [AUC (“area under the curve”, a measure of cumulative drug exposure over a defined post-dose time interval), Tmax (time of maximum circulating drug concentration) and Cmax (maximum circulating drug exposure)] indicated that:
1) Dose proportionality was observed for doses up to 1600 mg
2) Dosing SCY-078 drug-filled capsules with a high fat meal increased drug exposure levels by ~20% compared to levels observed in fasted subjects, which was within intersubject variability
|
|
Phase 1, double-blind randomized, single dose study to evaluate the safety, tolerability, and PK in elderly subjects
|
|
Safety and tolerability by physical examination, vital signs, ECGs and laboratory safety evaluations (hematology, chemistry, urinalysis);
PK data
|
|
17 healthy males and females (65–85 years)
|
|
Panel A: 500 mg SCY-078/Placebo
Panel B: Placebo/500 mg SCY-078
(6 active / 2 placebo for each panel)
|
|
Safety: SCY-078 generally well tolerated. One non-drug -related SAE of metastatic carcinoid tumor was reported. The most common adverse events (AEs) were gastrointestinal disorders and nervous system disorders.
Statistical analysis of PK parameters (AUC, Tmax and Cmax) indicated that exposure levels were ~30% higher in elderly patients compared to young males.
|
10
|
Design/Objective
|
|
Clinical Endpoints
|
|
Subject
Population
|
|
Dosing Regimen
|
|
Results
|
|
Phase 1, Open label biocomparison study of two formulations of SCY-078 and a pantoprazole interaction study with SCY-078 in healthy subjects
|
|
Safety, tolerability and PK of fit-for-purpose (FFP) drug filled capsules compared to FFP compressed tablets; impact of multiple doses of a proton pump inhibitor on single doses of SCY-078; impact of high fat meal on FFP compressed tablets
|
|
16 healthy males (18–45 years)
|
|
Periods 1 and 2: Single doses of 500 mg SCY-078 (as five 100mg FFP dry filled capsules or two 250mg FFP compressed tablets)
Period 3: Pantoprazole 40mg X 5 days and 500 mg SCY-078 (two 250mg FFP compressed tablets)
Period 4: 500 mg SCY-078 (two 250mg FFP compressed tablets) administered after a high fat meal
|
|
Safety: SCY-078 generally well tolerated. One SAE of elevated liver enzymes that led to discontinuation was reported. The most common AEs were gastrointestinal disorders.
Statistical analysis of PK parameters (AUC, Tmax and Cmax) indicated that:
1) Exposure levels in patients who received compressed tablets were ~20% higher than in those who received drug filled capsules
2) Exposure levels of SCY-078 in patients were approximately 25% lower when administered with the proton pump inhibitor pantoprazole compared to SCY-078 administered alone
3) Dosing SCY-078 tablets with a high fat meal increased drug exposure levels by ~50%–60% compared to levels observed in fasted subjects
|
|
Phase 1, randomized, double-blind, placebo-controlled, multiple ascending-dose safety, tolerability and PK study
|
|
Safety and tolerability by physical examination, vital signs, ECGs and laboratory safety evaluations (hematology, chemistry, urinalysis), gastrin levels and gastric histology;
Plasma PK data and concentrations of intact drug in urine after multiple doses of SCY-078
|
|
32 healthy males (18–45 years)
|
|
300, 600, and 800 mg SCY-078 or matching placebo once daily for 10 days, or
800 mg SCY-078 or matching placebo once daily for 28 days.
(6 active /2 placebo in each panel)
|
|
Safety: SCY-078 was generally safe and well tolerated. Most common AEs were headache, lack of energy, dizziness, and gastrointestinal disorders.
Statistical analysis of PK parameters (AUC, Tmax and Cmax) indicated that:
1) The target drug exposure level (AUC of 17µM.hr) was approached after 10 days of dosing at 600mg per day
2) Two weeks were needed to reach steady state concentrations in many subjects
3) Exposure levels were ~2.3 fold (Cmax) to 3.3 fold (AUC) higher after 26 days of dosing compared to the first day
Insignificant concentrations of SCY-078 were found in urine.
|
|
Design/Objective
|
|
Clinical Endpoints
|
|
Subject
Population
|
|
Dosing Regimen
|
|
Results
|
|
Phase 1, randomized, partially-blind, placebo-controlled study of multiple doses of ketoconazole on single dose PK of SCY-078
|
|
Safety and tolerability of SCY-078
Single dose PK profile of SCY-078 after multiple doses of ketoconazole
|
|
12 healthy males (18–45 years)
|
|
Period 1: 100 mg SCY-078 or matching placebo
Period 2: Ketoconazole 400 mg once daily for 15 days starting on Day -1 with a single dose of 100 mg SCY-078 (or placebo) coadministered on Day 1.
12 Subjects (10 active / 2 placebo)
|
|
Safety: SCY-078 was generally well tolerated when dosed alone or with ketoconazole. The most common AEs were headache and increased ALT/AST.
Statistical analysis of PK parameters (AUC, Tmax and Cmax) indicated that in the presence of ketoconzaole
1) Drug exposure as measured by AUC was ~5.7 fold higher
2) Cmax increased 2.5 fold
|
|
Phase 1, randomized, double-blind, placebo controlled multiple dose study to assess the safety, tolerability, and PK of a loading dose of SCY-078
|
|
Safety and tolerability of SCY-078; PK profile of SCY-078 after a loading dose on day 1
|
|
8 healthy males (18–45 years)
|
|
1800 mg SCY-078 (or placebo) administered as 600 mg TID (three times a day) on Day 1, followed by 500 mg SCY-078 (or placebo) QD (once daily) on Days 2-7.
8 Subjects (6 active / 2 placebo)
|
|
Safety: SCY-078 was generally well tolerated. No SAEs or discontinuations. The most common AE was diarrhea; 1 subject had elevated bilirubin.
Statistical analysis of PK parameters (AUC, Tmax and Cmax) indicated that the loading dose on day 1 achieved a target drug exposure (AUC of ~20.8µM.hr). Drug exposures observed under the QD maintenance dosing regimen were ~20.8µM.hr on Day 3 and ~16µM.hr on Day 7.
|
|
Phase 1, open-label, fixed-sequence, multiple-dose study investigating the effect of diltiazem on the PK and safety of SCY-078 in healthy subjects
|
|
Safety and tolerability of SCY-078; PK profile of SCY-078 after multiple doses of diltiazem
|
|
16 males
(20-45 years)
|
|
Treatment A (Period 1), 200 mg SCY-078 q6h (total dose of 600 mg) on Day 1 and 100 mg SCY-078 QD Days 2 to 14.
Treatment B (Period 2), 240 mg of diltiazem QD on Days 1 to 14, 200 mg of SCY-078 q6h (total dose of 600 mg) on Day 1, and 100 mg SCY-078 QD Days 2 to 14.
|
|
Safety: SCY-078 generally well tolerated. The most common AE was headache. No SAEs; 1 discontinuation due to first degree heart block following administration of diltiazem only
Statistical analysis of PK parameters (AUC, Tmax and Cmax) indicates that in the presence of diltiazem:
1) Drug exposures as measured by AUC were ~2.5 fold higher
2) Cmax was increased 2 fold
|
The most frequently reported adverse events have been gastrointestinal. In multiple dose studies, these included diarrhea, abdominal pain or discomfort, and vomiting. These gastrointestinal side effects were not considered serious in nature and only one subject discontinued dosing with SCY-078 when he withdrew consent due to gastrointestinal adverse events. In one study six subjects who received 800mg SCY-078 daily for 28 days underwent pre-treatment and end-of-treatment gastric endoscopy
11
with biopsy, with no evidence of stomach lining degeneration or other significant clinical finding observed. None of the 66 subjects receiving SCY-078 in the four Phase 1 studies in which serum gastrin levels were monitored exhibited levels outside the normal range.
One subject experienced significant liver function test increases after first dose and discontinued SCY-078 due to this serious adverse event, deemed by the investigator to be study drug related. However, markers of liver injury (ALT and AST) were already increasing prior to the subject receiving SCY-078 and pre-treatment levels of ALT had increased above the upper limit of normal. Other markers of liver injury remained within the normal range. ALT/AST levels decreased over the 48-hour period post-dose and this subject’s liver function tests returned to the normal range without intervention. This 27 year old man had no significant medical history and received 500mg of SCY-078. Evaluation revealed no clear etiology for the transaminase elevations. One other serious adverse event was reported: the subject was diagnosed with metastatic carcinoid tumor after one dose of SCY-078 and this was deemed not related to the study drug.
SCY-078 exhibits favorable pharmacokinetic properties in humans
As a result of seven Phase 1 studies of SCY-078, we believe that SCY-078 can be sufficiently well absorbed as an oral medication to achieve the drug levels necessary to be effective in treating patients. The half life of ~20 hours supports once daily dosing and a loading dose on day 1 should result in therapeutic concentrations being achieved on the first day of treatment. Drug exposure increased proportionally and in a predictable manner with doses up to the maximum dose tested (1600mg in single dose studies). There were no major differences in the pharmacokinetics or safety of SCY-078 in healthy elderly subjects relative to younger adults, an important consideration since many patients experiencing invasive fungal infections are elderly.
Results from clinical studies conducted to determine the potential for clinical drug-drug interactions confirmed that SCY-078 can likely be used, with suitable dose adjustments, in combination with moderate inhibitors of the most common drug metabolizing enzyme (CYP3A). The drug interaction studies were performed with ketoconazole (strong inhibitor of CYP3A4) and diltiazem (moderate inhibitor of CYP3A4). Results of these studies indicate that a dose reduction of SCY-078 will be required with moderate CYP3A inhibitors and co-administration with strong inhibitors will not be recommended.
A drug interaction study was also conducted with pantoprazole, a proton pump inhibitor. In this study, SCY-078 concentrations with pantoprazole were ~25% lower than SCY-078 alone; the results met the hypothesis that exposures of SCY-078 with or without a proton pump inhibitor were similar. Other studies to evaluate the potential of drug-drug interactions with SCY-078 are planned.
A biocomparison study was conducted between drug filled capsules that were used in early Phase 1 studies and compressed tablets which will be used in future studies. Compressed tablets had concentrations that were ~20% higher than capsules. The effect of a high fat meal on SCY-078 when dosed as compressed tablets indicated exposures that were ~50 to 60% higher than when administered in a fasted state.
Our clinical data, together with mouse efficacy data, support therapeutic activity for SCY-078
Correlations of circulating drug levels to drug efficacy in preclinical mouse infection models can be translated into human patients and are an established tool in the development of antifungal drugs. The efficacious drug levels determined for SCY-078 in the mouse models indicate that the levels achieved in the human Phase 1 clinical trials are predictive of efficacy in infected patients. Specifically, in human subjects who received SCY-078 as a loading oral dose of 600mg three times per day (1800mg/day) followed by a maintenance daily dose of 500mg, the circulating levels of SCY-078 exceeded those that cured the infection in the mouse models of invasive
Candida
infections. These results indicate that SCY-078 can be administered to patients with invasive
Candida
infections at doses that are predicted to be effective and generally well tolerated.
Current SCY-078 Clinical Development Activities
Based on results from studies to date, we believe that SCY-078 has the potential to offer a new therapeutic option to treat invasive fungal infections. The goal of the clinical development plan for SCY-078 is to provide sufficient safety and efficacy data for submission and FDA approval of an NDA.
We anticipate that our initial NDA submission filing would seek approval for an indication for oral and IV formulations of SCY-078 for the treatment of invasive
Candida
infections (or invasive candidiasis). We expect additional Phase 3 and post-market studies, and supplemental NDAs, to expand the list of indications to include treatment of invasive
Aspergillus
infections, and prevention of invasive fungal infections.
12

Development of an Intravenous Formulation of SCY-078
IND enabling studies for the IV formulation of SCY-078 are currently underway. We plan to complete 14 day GLP toxicity studies and file an IND to support a first in man study of the IV formulation of SCY-078 that is planned to begin in the second half of 2015. The study is planned as a two-part, double-blind, randomized, placebo-controlled, alternating panel, rising single intravenous dose study in healthy male subjects. It is designed to evaluate the safety, tolerability, and pharmacokinetics of IV SCY-078.
SCY-078 Phase 2 studies
SCY-078 as an Oral Step-Down in the Treatment of Invasive Candida Infections:
A Phase 2 study to evaluate the pharmacokinetics, safety and efficacy of oral SCY-078 as step-down therapy after IV echinocandin in patients with invasive
Candida
infections is ongoing. The study commenced in June 2014, when we entered into an agreement with a third-party clinical research organization. Following the transfer by Merck to us of ownership and responsibility for the clinical development and IND related to SCY-078, we assessed the regulatory history and initiated discussions with the FDA to obtain clarity on several open questions regarding the clinical development plan for SCY-078. The original Phase 2 protocol was finalized in July 2014. We have opened multiple trial sites, we are actively screening patients for enrollment, and the first patient was enrolled in March 2015. We amended the study protocol's enrollment criteria in February 2015 in order to enhance and expedite recruitment and we are currently preparing further enhancements to the study's protocol. We believe that these changes to enrollment criteria will improve the Phase 2 study's overall progress without affecting the interpretability of the study. We expect to report complete data from the Phase 2 study in the first half of 2016. The study’s identification number on www.ClinicalTrials.gov is NCT02244606.
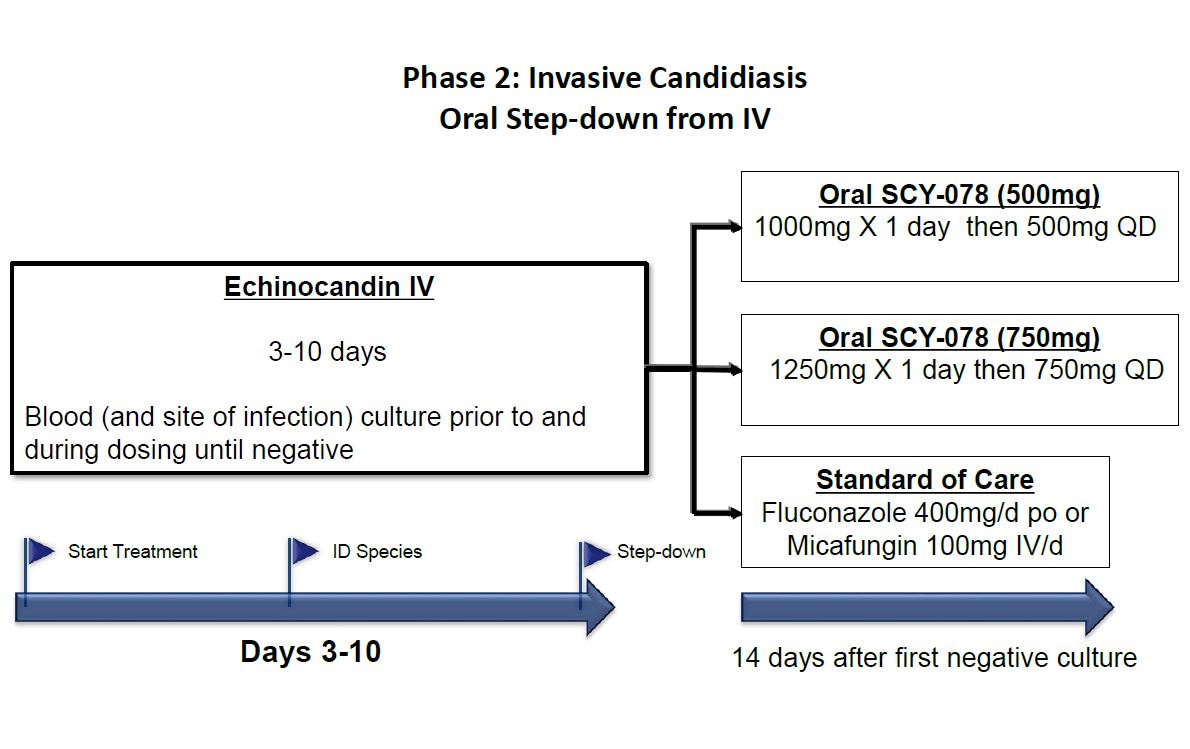
Under this Phase 2 study, SCY-078 will be used as an oral step-down agent following initial therapy with IV echinocandin in patients with invasive
Candida
infections. The open label study will recruit approximately 120 patients. This will be a three arm study comparing step-down oral therapy with two doses of SCY-078 to current standard of care based on current Infectious Disease Society of America Practice Guidelines. All patients will receive initial therapy with an IV echinocandin for three to ten days. Based on clinical and microbiological response, patients will be switched to randomized therapy. Patients in arm one will switch to oral SCY-078 dosed at 1000mg on day one followed by once daily dosing of SCY-078 500mg. Patients in arm two will switch to oral SCY-078 dosed at 1250mg on day one followed by once daily dosing of SCY-078 750mg. Patients in arm three will receive standard of care. Current standard of care calls for a switch to oral
13
therapy with fluconazole 400mg/day after loading dose of 800mg on day 1, unless the patient is infected with a
Candida
strain that is not susceptible to fluconazole in which case the patient will be maintained on IV micafungin, for the remainder of therapy. Antifungal treatment will be continued for at least 14 days after the first negative culture for
Candida
and resolution of signs and symptoms of infection.
SCY-078 (IV and Oral) for the Treatment of Invasive Candida Infections:
The next study to evaluate the efficacy and safety of SCY-078 in patients with invasive
Candida
infections will include both the IV and oral formulations. The focus will be on infections that are refractory to or intolerant of standard therapy (azoles and echinocandins). This study will evaluate SCY-078 in infections where there is unmet need and has the potential to show differentiation from available therapies for invasive
Candida
infections (invasive candidiasis). If the IV formulation is granted QIDP designation, it is possible that compelling data in this study could result in streamlined development to an initial NDA for a restricted indication.
SCY-078 Phase 3 study
As noted above, we are planning to seek an initial indication for SCY-078 as an oral/IV drug for the treatment of invasive
Candida
infections. We plan to conduct a Phase 3 noninferiority study of SCY-078 vs. standard of care as primary therapy for patients with invasive
Candida
infections.
Acquisition of SCY-078 from Merck
In May 2013 Merck transferred to us all development and commercialization rights for SCY-078 (also known as MK-3118). This decision was made following a review and prioritization of Merck’s infectious disease portfolio. Under the terms of the agreement, we received all human health rights to SCY-078, including all related technical documents, preclinical data, data from the seven Phase 1 trials conducted by Merck, and drug product and drug substance. Merck also transferred additional quantities of active pharmaceutical ingredient, which we believe will be sufficient to support development and manufacture of an IV formulation for clinical studies and provide material for additional toxicology studies. The agreement continues until expiration of all royalty obligations. The agreement may be terminated if either party is in material breach and fails to remedy the breach after receiving written notice. In January 2014, Merck assigned the patents to us related to SCY-078 that it had exclusively licensed to us. Under the terms of the patent assignment, Merck no longer has responsibility to maintain the patents. Merck is eligible to receive milestones upon initiation of a Phase 3 clinical study, NDA filing and marketing approvals in each of the United States, major European markets and Japan that could total up to $19 million. In addition, Merck
14
will receive tiered royalties based on worldwide sales of SCY-078. The aggregate royalties are in the single digit percentages of net sales, and we expect to pay royalties on net sales of SCY-078 to Merck for no more than ten years from first commercial launch, on a country-by-country basis.
In December 2014, we entered into an amendment to the license agreement with Merck that defers the remittance of a milestone payment due to Merck, such that no amount will be due upon initiation of the first phase 2 clinical trial of a product containing the SCY-078 compound (the "Deferred Milestone"). The amendment also increases, in an amount equal to the Deferred Milestone, the milestone payment that will be due upon initiation of the first Phase 3 clinical trial of a product containing the SCY-078 compound. Except as described above, all other terms and provisions of the license agreement remain in full force and effect.
Commercialization, Marketing and Sales of SCY-078
Given our stage of development, we have not yet established a commercial organization or distribution capabilities.
We expect that prescribing physicians for the treatment of invasive fungal infections will be located at major medical centers, where physicians specializing in critical care, infectious disease specialists, and physicians treating immune-compromised or immune-suppressed patients, such as oncologists and those performing solid organ transplants and stem cell transplants, are likely to be found.
We intend to form our own focused hospital-based sales and marketing force to target physicians in the United States. Outside of the United States, subject to obtaining necessary marketing approvals, we likely will seek to commercialize SCY-078 through distribution or other collaboration arrangements. We have already entered into an agreement pursuant to which we licensed to R-Pharm rights to develop and commercialize SCY-078 in the field of human health in Russia and certain smaller non-core markets.
Competition for SCY-078
Our competitors include large pharmaceutical and biotechnology companies, and specialty pharmaceutical and generic drug companies. The three leading branded antifungal drugs represent one from each main class; V-fend
®
(voriconazole), an azole marketed by Pfizer ($754 million in 2012); Cancidas
®
(caspofungin), an echinocandin marketed by Merck ($619 million in 2012); and AmBisome
®
(liposomal amphotericerin B), a polyene sold by Gilead in Europe, by Astellas in the United States and by Dainippon-Sumitomo in Japan ($450 million in 2012). Pfizer also markets the echinocandin Eraxis
®
(anidulafungin), Merck also markets the azole Noxafil
®
(posaconazole), Astellas also markets the echinocandin Mycamine
®
(micafungin) and has the marketing rights to isavuconazole that was under development by Basilea. Pfizer, Merck and Astellas are all large pharmaceutical companies with significant experience and financial resources in the marketing and sale of specialty pharmaceuticals. Various other producers market and sell generic oral voriconazole, fluconazole and itraconazole. Further, we expect that product candidates currently in clinical development, or that could enter clinical development in the near future, may represent significant competition, if approved. These include VT-1161 being developed by Viamet and the echinocandin CD101 IV being developed by Cidara Therapeutics, Inc. These companies may have significantly greater resources than we have.
The key competitive factors affecting the success of SCY-078, if approved, are likely to be its efficacy, safety, convenience, price, use in out-patient settings, the level of generic competition and the availability of reimbursement from government and other third-party payors. If approved, we believe that SCY-078’s features, including its oral dosing and efficacy against resistant strains, will differentiate it from competing products. We believe that SCY-078 will compete favorably against competing products in efficacy, safety, convenience and use in out-patient settings, allowing us to price SCY-078 at a premium to generics and other competing products.
Our commercial opportunity could be reduced or eliminated if our competitors develop and commercialize products that are safer, more effective, have fewer or less severe side effects, are more convenient or are less expensive than any products that we may develop. Our competitors also may obtain FDA or other regulatory approval for their products more rapidly than we may obtain approval for ours. In addition, our ability to compete may be affected because in many cases insurers or other third-party payors seek to encourage the use of generic products. In the azole class, fluconazole, itraconazole, and oral voriconazole are generic. There is currently no generic echinocandin, but caspofungin, the largest selling echinocandin, is expected to become available on a generic basis over the coming years and perhaps prior to the launch of SCY-078. If approved, we believe SCY-078 will be capable of delivering value supportive of premium pricing over competitive generic products.
Manufacturing and Supply of SCY-078
We have an in-house facility capable of supplying kilogram quantities of drug substance, and we can develop analytical procedures to support the preparation of clinical batches. However, we do not own or operate and do not expect to own or
15
operate facilities for manufacturing, storage and distribution, or testing of drug substance or drug product for late stage clinical trials or commercial manufacture. In the past, we have relied on third-party contract manufacturers for large scale synthesis of our clinical compounds and manufacture of drug product. We expect to continue to rely on these manufacturers to supply SCY-078 for ongoing and planned clinical trials and commercial sale.
SCY-078 is a semi-synthetic natural product. Thus, the manufacturing process for SCY-078 involves fermentation and synthetic chemical steps. The process begins with fermentation to produce the natural product enfumafungin, which has been conducted by a third-party vendor on a scale sufficient to provide greater than 60kg of this starting material. Enfumafungin is then converted to SCY-078 in a series of chemical steps that proceed efficiently with an average yield of almost 90%. Approximately 20kg of drug substance has been manufactured. The overall process does not require any specialized equipment and uses readily sourced intermediates. At commercial launch, we expect cost of goods for SCY-078 to be similar to that of other small molecule drugs. We are negotiating agreements with large scale suppliers to produce both drug product and drug substance for planned clinical trials. In the future, we plan to validate the process with selected vendors and secondary suppliers to establish a secure supply chain.
We expect the tablets currently on hand to be sufficient to complete our Phase 2 trial of oral SCY-078 that is currently ongoing. They have shown good stability for approximately three years at five degrees centigrade storage condition. An IV formulation is currently under development and we expect it will be completed and available to support a first in man study of the IV formulation of SCY-078 that is planned to begin in the second half of 2015.
A drug manufacturing program subject to extensive governmental regulations requires robust quality assurance systems and experienced personnel with the relevant technical and regulatory expertise as well as strong project management skills. We have a team that we believe is capable of managing these activities, and it successfully supported SCY-635, our clinical drug for Hepatitis C Virus (HCV) that we licensed to Waterstone in October 2014, as well as numerous such programs for clients in our contract business. Our internal facilities have been FDA audited on two separate occasions with no notice of non-compliance.
Our Cyclophilin Inhibitor Platform
We have developed a proprietary platform for cyclophilin inhibitors. Cyclophilins are a family of enzymes found in all mammalian cells which play a key role in a number of important cellular functions. Inhibiting cyclophilins show promise as treatments for a range of diseases. To date, our cyclophilin inhibitor platform has produced two clinical stage compounds, described below.
SCY-635 is a novel, orally available cyclophilin inhibitor that has demonstrated clinical activity against HCV as a single agent and when dosed in combination with pegylated interferon and ribavirin. In these clinical studies, SCY-635 modified patients’ immune responses to HCV. These observations implicate cyclophilins in viral evasion of immune responses. HCV and Hepatitis B Virus are two of the most widespread global infections, with more than 170 million and 240 million chronic carriers respectively, and are leading causes of liver cirrhosis, liver cancer and liver transplantation. In October 2014, we granted Waterstone, an international pharmaceutical business, exclusive worldwide rights to development and commercialization of SCY-635, and two additional compounds at Waterstone’s option, for the treatment of viral diseases in humans, under which we are entitled to receive potential milestones and royalties. Under the terms of our SCY-635 license agreement with Waterstone, we agreed that during the term of the agreement, we would not develop or commercialize, or grant any right or license to any third party to develop or commercialize, in Asia (excluding Japan), any cyclophilin inhibitor for treatment of viral diseases in humans.
SCY-641 is a novel cyclophilin inhibitor with activity similar to cyclosporine, the active ingredient in Restasis
®
and Optimmune
®
, drugs currently approved for dry eye disease in humans and dogs, respectively. The global human dry eye syndrome therapeutics market was valued at $1.8 billion in 2010 and the market value is expected to grow to $2.8 billion in 2017. Sales of Restasis
®
in 2012 were $792 million. SCY-641 has significantly improved water solubility compared to cyclosporine which we believe will lead to improved tolerability and ease of use for treatment of dry eye disease,
i.e.
, does not sting when applied and with anticipated required dosing of no more than twice daily. In August 2012, we licensed worldwide animal health rights for SCY-641 to Dechra Ltd., while retaining rights for human health indications. We intend to identify a development and commercial partner for the human health uses of SCY-641.
We have a library of more than 1,000 other cyclophilin inhibitor compounds that could be effective against a wide variety of human and animal diseases. We may enter into corporate partnerships to use our cyclophilin inhibitor platform to discover and develop new drug candidates for unmet needs in human and animal health, with the exception of the previously described fields and territories under the terms of our license agreement with Waterstone.
The key terms of our licensing agreements with Dechra and Waterstone are disclosed in the section below titled “Collaborations and Licensing Agreements.”
16
Our Contract Research and Development Services
As a spinout from Aventis in 2000, we began as a chemistry and animal health services company, providing contract research services to third parties. Through this business, we built significant expertise in parasitic infections and drug discovery. Since our formation, we have expanded our animal health capabilities and have discovered a number of proprietary compounds.
The market for parasiticides was estimated to be more than $5.5 billion globally in 2011. We have more than 30 unique, broad spectrum screens, and proprietary protocols and algorithms, deemed to be trade secrets. Our antiparasitic drug discovery platform has enabled us to discover drugs for our partners and has traditionally produced substantially all of our revenues.
In partnership with Merial, the animal health division of Sanofi, we have discovered two new drug candidates to treat parasitic infections. In addition, in a collaboration sponsored by the Bill & Melinda Gates Foundation, we discovered a drug, SCY-7158 that is now in Phase 1 studies for the treatment of “sleeping sickness,” a fatal disease transmitted to humans by biting flies in Sub-Saharan Africa. We have also leveraged our expertise and our cyclophilin inhibitor platform to discover SCY-641, a compound licensed to Dechra Ltd. in 2012 for clinical development for the treatment of dog dry eye, and SCY-635, a compound licensed to Waterstone in 2014 for the treatment of viral diseases in humans.
As described in the "Recent Developments" section of Item 7 of this annual report, we are currently considering the divestiture of our contract research and development services business as part of our strategic objective to focus our resources on the development of SCY-078.
Research and Development Expenses
A significant portion of our operating expenses is related to research and development and we intend to maintain our strong commitment to research and development. See "Item 8. Financial Statements and Supplementary Data" of this Annual Report on Form 10-K for costs and expenses related to research and development, and other financial information for each of the fiscal years 2014 and 2013.
Collaborations and Licensing Agreements
We have a number of licensing and collaboration agreements with partners in human and animal health, including the following:
Merck
We have a termination and license agreement with Merck, as described under “Acquisition of SCY-078 from Merck” above.
Merial
Merial, a wholly owned subsidiary of Sanofi, is one of the largest animal health businesses in the world and has been a significant partner in animal health since 2003. During 2014, we provided contract research and development services for Merial on a fee-for-service basis under an agreement that expired on December 31, 2014. We signed a new agreement with Merial effective December 2014 under which we provide contract research and screening services in the field of animal health that primarily target parasites. Our services will include primary and secondary screening of compounds in Merial’s libraries, the development of new and proprietary screens in therapeutic indications of interest to Merial, and the support and coordination of chemical syntheses services being performed by Merial’s other service providers. Consistent with the previous agreement, this is a non-exclusive arrangement in the animal health field and is on a fee-for-service basis, meaning we will not receive any contingent payments based on the progression to development and commercialization of any compounds arising from this agreement. Under the new agreement, any intellectual property created in connection our performance of the services shall be the sole property of Merial. The term of this agreement is two years, beginning January 1, 2015 and ending on December 31, 2016, and the total service fee due from Merial over the term of the agreement is $7.9 million, payable in equal quarterly installments. The agreement also provides for an option to extend the term for one additional year.
Either party may terminate the agreement in the event of breach of material obligation by the other party if such breach is not remedied after written notice from the non-breaching party. Either party may terminate this agreement if the other party makes an assignment for the benefit of creditors, becomes subject to bankruptcy proceedings, subject to appointment of a receiver, or admits inability to pay its debts. Further, within six months of any change of control our company, Merial shall either (i) consent to continue the agreement pursuant to its terms, (ii) agree to an assignment of the agreement to a third-party acceptable to Merial, or (iii) the parties shall implement another solution acceptable to Merial, provided, however, if no resolution acceptable to Merial has been implemented within six months of the change of control, Merial may terminate the agreement immediately. If Merial believes in good faith that we acted in any way that may subject Merial to liability under anti-
17
corruption laws, Merial shall have the unilateral right to terminate this agreement. At termination or expiration of the agreement for any reason, upon Merial’s request, we must transfer all agreement intellectual property to Merial.
In 2014, we received
$7.3 million
from Merial under the research services agreement which terminated on December 31, 2014. Merial accounted for
38%
of our revenues in the year ended December 31, 2014. No other customer, except for Elanco Animal Health, accounted for 10% or more of our revenues during 2014.
R-Pharm
In August 2013 we entered into an agreement with R-Pharm, a leading supplier of hospital drugs in Russia, granting them exclusive rights to develop and commercialize SCY-078 in the field of human health in Russia, Turkey, and certain Balkan, Central Asian, Middle Eastern and Northern African countries. We retained the right to commercialize SCY-078 in the Americas, Europe, and Asia. We received an upfront payment of $1.5 million and are entitled to receive up to $18 million in payments for development milestones and sales-based payments. We are also entitled to single digit percent royalty payments for products that do not fall under the patents and a royalty percentage in the teens for products that do fall under the patents. This agreement expires upon R-Pharm’s last royalty payment, which is the later of twelve years from the first registration of the product in the countries where R-Pharm’s license rights exist under this agreement, or the last to expire of the patents in such countries. Either party may terminate this agreement if the other party breaches, and fails to remedy the breach after receiving notice from the non-breaching party. We have the ability to terminate this agreement if we determine that R-Pharm fails to make reasonable progress in the development and commercialization of SCY-078. If we give R-Pharm notice of failure to make reasonable progress, R-Pharm will have the opportunity to correct the deficiencies.
The original agreement also included terms whereby R-Pharm would reimburse us for certain research and development costs associated with Phase 2 and Phase 3 clinical trials of oral SCY-078 and the development of an IV formulation of SCY-078. However, these cost reimbursement terms required that the clinical trials and the IV formulation development follow a global development plan that was agreed upon by both parties in August 2013. Subsequent to August 2013, modifications were made to the global development plan that caused the clinical trial cost reimbursement terms in the original agreement to no longer be enforceable. Further, the IV formulation development cost reimbursement terms in the original agreement did not specify which IV formulation and development costs were reimbursable by R-Pharm. In November 2014, we entered into a supplemental arrangement with R-Pharm, whereby R-Pharm was informed of the modified IV formulation development plan and R-Pharm agreed to reimburse us for specifically identified IV formulation development and manufacturing costs incurred by us. The specifically identified costs were defined as all costs incurred by us under a separate arrangement we have with a third-party service provider, whereby the third-party service provider is performing certain IV formulation and development services for us. We estimate that total reimbursable costs pursuant to the original agreement and supplemental arrangement with R-Pharm will be approximately $1.0 to $1.6 million.
Dechra
In August 2012 we signed an agreement with Dechra Ltd., a UK listed international veterinary pharmaceutical business, granting Dechra rights to SCY-641 for use in the field of animal health, including the treatment of canine keratoconjunctivitis sicca, or dry eye in dogs. Dechra was granted worldwide animal health rights and is responsible for the remaining clinical development and commercialization of SCY-641 in the animal health field. We retained the human health rights to the compound, including the right to use preclinical data generated by Dechra to support further human clinical development. Under the agreement, Dechra must use reasonable efforts to commercialize SCY-641. We received an upfront fee and are eligible to receive potential milestone payments up to £0.4 million as well as a royalty percentage in the low teens to the low twenties on the total net sales of product sales. Dechra’s obligations to pay royalties shall continue, on a product-by-product and country by country basis, until the later to expire of (i) all valid claims in such country and (ii) twelve years after the first commercial sale of such product in such country. This agreement expires when Dechra has completed all royalty payment obligations. If either party is in breach, and the breach continues after notice given by the non-breaching party, the non-breaching party may terminate the agreement. If we terminate the agreement because Dechra is in breach, Dechra must return all information required to be returned under the license agreement, free of charge, to us. If Dechra reasonably believes it is impossible to carry out further development or marketing of animal health products, Dechra may terminate this agreement at anytime by giving us at least six months prior written notice. In November 2013, we amended this license agreement with Dechra in which we agreed to perform certain services for Dechra.
Aventis
In May 2005, we entered into a license agreement with Aventis Pharma S.A., a leading global healthcare company, pursuant to which Aventis granted us a world-wide license (with a right to sub-license) to certain of Aventis’s know-how, compounds and patents concerning cyclosporine derivatives exclusively in the field of treatment and prevention of HIV/AIDS and non-exclusively in all fields outside the treatment and prevention of HIV/AIDS. Under the terms of the agreement, we are obligated to maintain reasonable efforts to develop and commercialize a marketable product containing the subject compound and Aventis is responsible for maintaining and protecting the underlying patent rights. The agreement expires on a country by
18
country basis at the end of the underlying intellectual property claims, and the expiration of the U.S. patent is December 23, 2017. We may terminate the agreement at any time, without cause, by giving Aventis 90 days notice. Aventis may terminate this agreement only if we commit a serious breach and fail to remedy the breach within 90 days of notice. Upon expiration of the agreement, we will have a fully paid-up, royalty free, world-wide, exclusive license in the field of treatment and prevention of HIV/AIDS and a non-exclusive license outside this field. We are obligated to pay Aventis up to an aggregate of $1.35 million in payments upon the achievement of certain milestones. In addition, on an annual basis, we will be obligated to pay a single digit percentage royalty on direct sales by us of all products developed under the agreement and we will pay a low single digit percentage of royalty on any sales by a sub-licensee of all products developed under the agreement. Pursuant to the terms of our October 2014 license agreement with Waterstone, Waterstone has agreed to reimburse us for any of the aforementioned milestone payments that may become due to Aventis.
C-Chem
In June 2005, we entered into an assignment agreement with C-Chem AG pursuant to which C-Chem assigned certain inventions, patents and know-how concerning cyclosporine derivatives for us to research, develop, manufacture and commercialize a product. Under the agreement, C-Chem has assigned to us all rights, title and interest in the subject patents as well as assigned all rights, title and interest to certain know-how with exclusive right to use and disclose the know-how for any purpose. Under the agreement, we must exercise reasonable commercial efforts to develop and commercialize a product using the licensed intellectual property and we are responsible for maintaining the licensed patents until the end of their lifetime. The U.S. patent on SCY-641 expires on June 10, 2019, and this agreement expires when no valid claim remains with respect to the underlying patents. C-Chem may terminate the agreement if an order by a court is made appointing a custodian, receiver, liquidator, assignee or trustee for us or if a court orders the winding up or liquidation of our affairs. We can terminate the agreement at any time by thirty (30) days written notice to C-Chem. If either party breaches any term or condition of the agreement, then the non-breaching party can terminate the agreement if notice is given to the breaching party and the breach is not remedied in sixty (60) days. Upon expiration of the agreement, we will have a fully paid-up, royalty free, world-wide exclusive license, and the right to grant sub-licenses, under the know-how and ancillary rights to commercialize and supply products. If the agreement is terminated by either party, we are obligated to reassign the patents, the know-how and the ancillary rights to C-Chem, return any intellectual property to C-Chem, and cease all activities which would require a license under the subject patents. We paid C-Chem an initial payment of $0.3 million and a one-time $0.2 million milestone payment, and are obligated to pay C-Chem up to $0.95 million in payments upon the achievement of certain milestones. In addition, we will be obligated to pay a low single digit percentage royalty on direct sales by us of all products developed under the agreement and we will pay less than a 1% royalty on any sales by a licensee of all products developed under the agreement.
Elanco Animal Health
In December, 2013, we entered into a license, development, and commercialization agreement with Elanco Animal Health, the animal health division of Eli Lilly Company, an American global pharmaceutical company, pursuant to which we will perform research services and grant to Elanco a world-wide license (with a right to sub-license) to certain of our know-how, compounds, and patents exclusively for applications and uses of parasiticides for animals (companion or food), animal products, animal feed, human food, or the food chain. Under the terms of the agreement, both parties must use reasonable commercial efforts to collaboratively research and commercialize products. After the completion of the first half of the research phase, either party may terminate the research component of the agreement upon advance notice if the research is not progressing to the satisfaction of either party. We anticipate the research phase will expire on December 23, 2017. The term of the agreement will survive until the expiration of the last remaining royalty term with respect to each product, which shall occur on the later of the expiration of the last patent underlying such product or nine years after the first commercial sale of such product, provided, however, that Elanco may terminate the agreement upon advance written notice to us any time after termination or expiration of the research services term. In the event Elanco terminates the agreement, Elanco will grant us a fully paid-up, royalty free, world-wide non-exclusive license in the field with respect to any compound or product developed for Elanco under the agreement. Either party may terminate the agreement in an event of default of the other party, which includes a material breach of the agreement, failure on the part of Elanco to make any payments due, or the bankruptcy, insolvency or dissolution of either party. Elanco will pay us $2.75 million for the first two years and $3.0 million for the second two years for performing research services during the research services term. As of December 31, 2014, Elanco has paid us $2.75 million under the agreement. In addition, upon the achievement of certain milestones with respect to each compound developed under the agreement, we may be entitled to receive additional payments if a compound that is developed under this agreement reaches on applicable stage. We will also be entitled to receive quarterly royalty payments in the low to mid single digit on the net sales of each product developed and commercialized under the agreement.
Waterstone
On October 29, 2014, we entered into a license agreement with Waterstone, under which we granted Waterstone an exclusive, worldwide license to develop and commercialize SCY-635 for the treatment of viral diseases in humans. In addition, under the same agreement, we granted Waterstone an option for an exclusive, worldwide license to develop and commercialize
19
two additional compounds of ours, SCY-575 and SCY-116, for the treatment of viral diseases in humans. The option is exercisable for a period of 18 months from the date of the agreement. In addition, we agreed that during the term of the agreement, we would not develop or commercialize, or grant any right or license to any third party to develop or commercialize, in Asia (excluding Japan), any cyclophilin inhibitor for treatment of viral diseases in humans.
The agreement expires upon Waterstone’s last royalty payment, which is the later of ten years from the last registration of the product, or the last to expire of the patents. Either party may terminate the agreement if the other party breaches and fails to remedy the breach after receiving notice from the nonbreaching party. Specifically, we have the ability to terminate the agreement if we determine that Waterstone failed to make reasonable progress in the development and commercialization of SCY-635 or the optioned compounds. If we give Waterstone notice of failure to make reasonable progress, Waterstone will have the opportunity to correct the deficiencies. If Waterstone fails to do so, we have the right to terminate the license.
We received an upfront license fee payment of $1.0 million in November 2014 for SCY-635, and we may receive an additional upfront payment of $0.5 million if Waterstone exercises its option for the two additional compounds. We are also entitled to receive certain payments on contingent future events, including 1) a development milestone payment of $4.0 million upon the first registration of a product, and 2) royalties based on a specified percentage of net sales (which percentage is in the mid-single digits), varying based on whether the product contains SCY-635 or one of the two additional compounds.
In January 2015, we entered into a patent assignment agreement with Waterstone under which a total of 18 patents and patent applications owned by Scynexis and relating to SCY-635 were assigned to Waterstone. Following this assignment, Waterstone assumed responsibility for maintenance, prosecution and enforcement of these patents and patent applications. We continue to remain the exclusive licensee of the aforementioned Aventis Pharma patents, which continue to be exclusively sub-licensed to Waterstone, but were not assigned to Waterstone under the patent assignment agreement entered into in January 2015.
Government Regulation and Product Approval
Government regulation
Government authorities in the United States, at the federal, state and local level, and in other countries extensively regulate, among other things, the research, development, testing, manufacture, including any manufacturing changes, packaging, storage, recordkeeping, labeling, advertising, promotion, distribution, marketing, import and export of pharmaceutical products such as those we are developing. The processes for obtaining regulatory approvals in the United States and in foreign countries, along with subsequent compliance with applicable statutes and regulations, require the expenditure of substantial time and financial resources.
U.S. drug approval process
In the United States, the FDA regulates drugs under the Federal Food, Drug, and Cosmetic Act, or FDCA, and implementing regulations. The process of obtaining regulatory approvals and the subsequent compliance with appropriate federal, state, local and foreign statutes and regulations requires the expenditure of substantial time and financial resources. Failure to comply with the applicable U.S. requirements at any time during the product development process, approval process or after approval, may subject an applicant to a variety of administrative or judicial sanctions, such as the FDA’s refusal to approve pending NDAs, withdrawal of an approval, imposition of a clinical hold, issuance of warning letters, product recall requests, product seizures, total or partial suspension of production or distribution, injunctions, refusals of government contracts, restitution, disgorgement or civil or criminal penalties.
The process required by the FDA before a drug may be marketed in the United States generally involves the following:
|
•
|
completion of preclinical laboratory tests, animal studies and formulation studies in compliance with the FDA’s good laboratory practice, or GLP, regulations;
|
|
•
|
submission to the FDA of an investigational new drug application, or IND, which must become effective before human clinical trials may begin;
|
|
•
|
approval by an independent institutional review board, or IRB, at each clinical site before each trial may be initiated;
|
|
•
|
performance of adequate and well-controlled human clinical trials in accordance with good clinical practices, or GCP, to establish the safety and efficacy of the proposed drug for each indication;
|
|
•
|
submission to the FDA of an NDA;
|
|
•
|
satisfactory completion of an FDA advisory committee review, if applicable;
|
20
|
•
|
satisfactory completion of an FDA inspection of the manufacturing facility or facilities at which the product is produced to assess compliance with cGMP, and to assure that the facilities, methods and controls are adequate to preserve the drug’s identity, strength, quality and purity; and
|
|
•
|
FDA review and approval of the NDA.
|
Preclinical studies
Preclinical studies include laboratory evaluation of product chemistry, toxicity and formulation, as well as animal studies to assess potential safety and efficacy. An IND sponsor must submit the results of the preclinical tests, together with manufacturing information, analytical data and any available clinical data or literature, among other things, to the FDA as part of an IND. Some preclinical testing may continue even after the IND is submitted. An IND automatically becomes effective 30 days after receipt by the FDA, unless before that time the FDA raises concerns or questions related to one or more proposed clinical trials and places the clinical trial on a clinical hold. In such a case, the IND sponsor and the FDA must resolve any outstanding concerns before the clinical trial can begin. As a result, submission of an IND may not result in the FDA allowing clinical trials to commence.
Clinical trials
Clinical trials involve the administration of the investigational new drug to human subjects under the supervision of qualified investigators in accordance with GCP requirements, which include the requirement that all research subjects provide their informed consent in writing for their participation in any clinical trial. Clinical trials are conducted under protocols detailing, among other things, the objectives of the study, the parameters to be used in monitoring safety, and the effectiveness criteria to be evaluated. A protocol for each clinical trial and any subsequent protocol amendments must be submitted to the FDA as part of the IND. In addition, an IRB at each institution participating in the clinical trial must review and approve the plan for any clinical trial before it commences at that institution. Information about certain clinical trials must be submitted within specific timeframes to the National Institutes of Health, or NIH, for public dissemination on their ClinicalTrials.gov website.
Human clinical trials are typically conducted in three sequential phases, which may overlap or be combined:
Phase 1: The drug is initially introduced into healthy human subjects or patients with the target disease or condition and tested for safety, dosage tolerance, absorption, metabolism, distribution, excretion and, if possible, to gain an early indication of its effectiveness.
Phase 2: The drug is administered to a limited patient population with the target disease to identify possible adverse effects and safety risks, to preliminarily evaluate the efficacy of the product for specific targeted diseases and to determine dosage tolerance and optimal dosage.
Phase 3: The drug is administered to an expanded patient population with the target disease, generally at geographically dispersed clinical trial sites, in well-controlled clinical trials to generate enough data to statistically evaluate the efficacy and safety of the product for approval, to establish the overall risk-benefit profile of the product, and to provide adequate information for the labeling of the product.
Progress reports detailing the results of the clinical trials must be submitted at least annually to the FDA and more frequently if serious adverse events occur. Phase 1, Phase 2 and Phase 3 clinical trials may not be completed successfully within any specified period, or at all. Furthermore, the FDA or the sponsor may suspend or terminate a clinical trial at any time on various grounds, including a finding that the research subjects are being exposed to an unacceptable health risk. Similarly, an IRB can suspend or terminate approval of a clinical trial at its institution if the clinical trial is not being conducted in accordance with the IRB’s requirements or if the drug has been associated with unexpected serious harm to patients.
In some cases, the FDA may condition approval of an NDA for a product candidate on the sponsor’s agreement to conduct additional clinical trials to further assess the drug’s safety and effectiveness after NDA approval. Such post-approval trials are typically referred to as Phase 4 studies.
In some circumstances, the FDA may also order a sponsor to conduct post-marketing clinical trials after approval of the product, if new safety information arises raising questions about the drug’s risk-benefit profile. Those clinical trials are typically referred to as Post-Marketing Requirements, or PMRs.
Marketing approval
Assuming successful completion of the required clinical testing, the results of the preclinical and clinical studies, together with detailed information relating to the product’s chemistry, manufacture, controls and proposed labeling, among other things, are submitted to the FDA as part of an NDA requesting approval to market the product for one or more indications. In most cases, the submission of an NDA is subject to a substantial application user fee. Under the Prescription Drug User Fee Act guidelines that are currently in effect, the FDA has a goal of twelve months from the date of the receipt of a
21
standard non-priority NDA to review and act on the submission for a drug considered to be a new molecular entity, or eight months for a priority NDA for such drug.
In addition, under the Pediatric Research Equity Act of 2003, an NDA or supplement to an NDA must contain data that are adequate to assess the safety and effectiveness of the drug for the claimed indications in all relevant pediatric subpopulations, and to support dosing and administration for each pediatric subpopulation for which the product is safe and effective. The FDA may, on its own initiative or at the request of the applicant, grant deferrals for submission of some or all pediatric data until after approval of the product for use in adults, or full or partial waivers from the pediatric data requirements.
The FDA also may require submission of a risk evaluation and mitigation strategy, or REMS, plan to mitigate any identified or suspected serious risks. The REMS could include medication guides, physician communication plans, assessment plans, and elements to assure safe use, such as restricted distribution methods, patient registries, or other risk minimization tools.
The FDA conducts a preliminary review of all NDAs within the first 60 days after submission, before accepting them for filing, to determine whether they are sufficiently complete to permit substantive review. The FDA may request additional information rather than accept an NDA for filing. In this event, the application must be resubmitted with the additional information. The resubmitted application is also subject to review before the FDA accepts it for filing. Once the submission is accepted for filing, the FDA begins an in-depth substantive review. The FDA reviews an NDA to determine, among other things, whether the drug is safe and effective and the facility in which it is manufactured, processed, packaged or held meets standards designed to assure the product’s continued safety, quality and purity. The FDA is required to refer an application for a novel drug to an advisory committee or explain why such referral was not made. An advisory committee is a panel of independent experts, including clinicians and other scientific experts, that reviews, evaluates and provides a recommendation as to whether the application should be approved and under what conditions. The FDA is not bound by the recommendations of an advisory committee, but it considers such recommendations carefully when making decisions.
Before approving an NDA, the FDA typically will inspect the facility or facilities where the product is manufactured. The FDA will not approve an application unless it determines that the manufacturing processes and facilities are in compliance with cGMP requirements and adequate to assure consistent production of the product within required specifications. Additionally, before approving an NDA, the FDA will typically inspect one or more clinical sites to assure compliance with GCP.
The testing and approval process requires substantial time, effort and financial resources, and each may take several years to complete. Data obtained from clinical activities are not always conclusive and may be susceptible to varying interpretations, which could delay, limit or prevent regulatory approval. The FDA may not grant approval on a timely basis, or at all.
If the FDA’s evaluation of the NDA and inspection of the manufacturing facilities are favorable, the FDA may issue an approval letter, or, in some cases, a complete response letter. A complete response letter generally contains a statement of specific conditions that must be met to secure final approval of the NDA and may require additional clinical or preclinical testing for the FDA to reconsider the application. Even with submission of this additional information, the FDA ultimately may decide that the application does not satisfy the regulatory criteria for approval. If and when those conditions have been met to the FDA’s satisfaction, the FDA will typically issue an approval letter. An approval letter authorizes commercial marketing of the drug with specific prescribing information for specific indications.
Even if the FDA approves a product, it may limit the approved indications for use for the product, require that contraindications, warnings or precautions be included in the product labeling, require that post-approval studies, including Phase 4 clinical trials, be conducted to further assess a drug’s safety after approval, require testing and surveillance programs to monitor the product after commercialization, or impose other conditions, including distribution restrictions or other risk management mechanisms, which can materially affect the potential market and profitability of the product. The FDA may prevent or limit further marketing of a product based on the results of post-marketing studies or surveillance programs. After approval, some types of changes to the approved product, such as adding new indications, manufacturing changes, and additional labeling claims, are subject to further testing requirements and FDA review and approval.
GAIN Act
The FDA has various programs, including fast track designation and priority review, that are intended to expedite or simplify the process for the development and FDA review of drugs that meet certain qualifications. The purpose of these programs is to provide important new drugs to patients earlier than under standard FDA review procedures.
The GAIN Act is intended to encourage development of new antibacterial and antifungal drugs for the treatment of serious or life-threatening infections by providing certain benefits to sponsors, including extended exclusivity periods, fast track and priority review. To be eligible for these benefits a product in development must seek and be awarded designation as a QIDP.
22
To qualify as a QIDP according to the criteria established in the GAIN Act a product must be an antibacterial or antifungal drug for human use intended to treat serious or life-threatening infections, including, those:
|
(1)
|
caused by an antifungal resistant pathogen, including novel or emerging infectious pathogens; or
|
|
(2)
|
qualifying pathogens listed by the FDA in accordance with the GAIN Act.
|
In January 2014 the FDA designated the oral tablet formulation of SCY-078 as a QIDP. The FDA granted fast track designation to the oral tablet formulation in December 2014. We will submit QIDP and fast track applications for the IV formulation of SCY-078 in 2015.
Fast Track Designation
The FDA is required to facilitate the development, and expedite the review, of drugs that are intended for the treatment of a serious or life-threatening disease or condition for which there is no effective treatment and which demonstrate the potential to address unmet medical needs for the condition. Under the Fast Track program, the sponsor of a new drug candidate may request that the FDA designate the drug candidate for a specific indication as a Fast Track drug concurrent with, or after, the filing of the IND for the drug candidate. The FDA must determine if the drug candidate qualifies for Fast Track Designation within 60 days of receipt of the sponsor's request.
If a submission is granted Fast Track Designation, the sponsor may engage in more frequent interactions with the FDA, and the FDA may review sections of the NDA before the application is complete. This rolling review is available if the applicant provides, and the FDA approves, a schedule for the submission of the remaining information and the applicant pays applicable user fees. However, the FDA's time period goal for reviewing an application does not begin until the last section of the NDA is submitted. Additionally, Fast Track Designation may be withdrawn by the FDA if the FDA believes that the designation is no longer supported by data emerging in the clinical trial process.
Post-approval requirements
Drugs manufactured or distributed pursuant to FDA approvals are subject to extensive and continuing regulation by the FDA, including, among other things, requirements relating to recordkeeping, periodic reporting, product sampling and distribution, advertising and promotion and reporting of adverse experiences with the product. After approval, most changes to the approved product, such as adding new indications or other labeling claims are subject to prior FDA review and approval. There also are continuing, annual user fee requirements for any marketed products and the establishments at which such products are manufactured, as well as new application fees for supplemental applications with clinical data.
The FDA may impose a number of post-approval requirements as a condition of approval of an NDA. For example, the FDA may require post-marketing testing, including Phase 4 clinical trials, and surveillance to further assess and monitor the product’s safety and effectiveness after commercialization.
In addition, drug manufacturers and other entities involved in the manufacture and distribution of approved drugs are required to register their establishments with the FDA and state agencies, and are subject to periodic unannounced inspections by the FDA and these state agencies for compliance with cGMP requirements. Changes to the manufacturing process are strictly regulated and often require prior FDA approval before being implemented. FDA regulations also require investigation and correction of any deviations from cGMP and impose reporting and documentation requirements upon the sponsor and any third-party manufacturers that the sponsor may decide to use. Accordingly, manufacturers must continue to expend time, money, and effort in the area of production and quality control to maintain cGMP compliance.
Once an approval is granted, the FDA may withdraw the approval if compliance with regulatory requirements and standards is not maintained or if problems occur after the product reaches the market. Later discovery of previously unknown problems with a product, including adverse events of unanticipated severity or frequency, or with manufacturing processes, or failure to comply with regulatory requirements, may result in revisions to the approved labeling to add new safety information; imposition of post-market studies or clinical trials to assess new safety risks; or imposition of distribution or other restrictions under a REMS program. Other potential consequences include, among other things:
|
•
|
restrictions on the marketing or manufacturing of the product, complete withdrawal of the product from the market or product recalls;
|
|
•
|
warning letters or holds on post-approval clinical trials;
|
|
•
|
refusal of the FDA to approve pending NDAs or supplements to approved NDAs, or suspension or revocation of product license approvals;
|
|
•
|
product seizure or detention, or refusal to permit the import or export of products; or
|
|
•
|
injunctions or the imposition of civil or criminal penalties.
|
23
The FDA strictly regulates marketing, labeling, advertising and promotion of products that are placed on the market. Drugs may be promoted only for the approved indications and in accordance with the provisions of the approved label. The FDA and other agencies actively enforce the laws and regulations prohibiting the promotion of off-label uses, and a company that is found to have improperly promoted off-label uses may be subject to significant liability.
In addition, the distribution of prescription pharmaceutical products is subject to the Prescription Drug Marketing Act, or PDMA, which regulates the distribution of drugs and drug samples at the federal level, and sets minimum standards for the registration and regulation of drug distributors by the states. Both the PDMA and state laws limit the distribution of prescription pharmaceutical product samples and impose requirements to ensure accountability in distribution.
Exclusivity and approval of competing products
Hatch-Waxman exclusivity
Market and data exclusivity provisions under the FDCA can delay the submission or the approval of certain applications for competing products, namely, abbreviated new drug applications, or ANDAs, for proposed generic drugs and 505(b)(2) NDAs for products that rely at least in part on FDA’s prior approval of another drug product. Section 505(b)(2) generally include a clinically significant change from the previously approved drug product. Section 505(b)(2) permits the applicant to rely upon FDA’s approval of certain preclinical or clinical studies conducted for an approved product. The FDA typically requires companies to perform additional, sometimes extensive, clinical studies and analyses to support the change from the approved product. The FDA may then approve the new product candidate for all or some of the label indications for which the referenced product has been approved, as well as for any new indication sought by the Section 505(b)(2) applicant.
The FDCA provides a five-year period of non-patent data exclusivity within the United States to the first applicant to gain approval of an NDA for a new chemical entity. A drug is a new chemical entity if the FDA has not previously approved any other new drug containing the same active moiety. The active moiety of a drug is the molecule or ion responsible for the action of the drug substance, excluding any salts, esters or non-covalent derivatives that may be appended to the molecule or ion. During the exclusivity period for a new chemical entity, the FDA may not accept for review ANDA or a 505(b)(2) NDA submitted by another company that references the previously approved drug. However, an ANDA or 505(b)(2) NDA may be submitted after four years if it contains a certification of patent invalidity or non-infringement.
The FDCA also provides three years of marketing exclusivity for an NDA, 505(b)(2) NDA, or supplement to an existing NDA or 505(b)(2) NDA if new clinical investigations, other than bioavailability studies, that were conducted or sponsored by the applicant, are deemed by the FDA to be essential to the approval of the application, for example, for new indications, dosages, strengths or dosage forms of an existing drug. This three-year exclusivity covers only the conditions of use associated with the new clinical investigations and, as a general matter, does not prohibit the FDA from approving ANDAs or 505(b)(2) NDAs for generic versions of the original, unmodified drug product. Five-year and three-year exclusivity will not delay the submission or approval of a full NDA; however, an applicant submitting a full NDA would be required to conduct or obtain a right of reference to all of the preclinical studies and adequate and well-controlled clinical trials necessary to demonstrate safety and effectiveness.
Pediatric exclusivity
Pediatric exclusivity is another type of non-patent marketing exclusivity in the United States and, if granted, provides for the attachment of an additional six months of regulatory protection to the term of any existing exclusivity, including the non-patent exclusivity periods described above, and to the regulatory term of any patent that has been submitted to FDA for the approved drug product. This six-month exclusivity may be granted based on the voluntary completion of a pediatric study or studies in accordance with an FDA-issued “Written Request” for such a study or studies.
Qualified Infectious Disease Product exclusivity
We received QIDP designation and fast track designation for the oral tablet formulation of SCY-078 in 2014 and we will submit QIDP and fast track applications for the IV form of SCY-078 in 2015. If the NDA to be submitted for SCY-078 is approved by the FDA, the FDA will extend by an additional five years any non-patent marketing exclusivity period awarded, such as a five-year exclusivity period awarded for a new chemical entity. This extension is in addition to any pediatric exclusivity extension awarded. Eligibility for the extension will be denied if the product is approved for uses that would not meet the definition of a QIDP.
24
Foreign regulation
To market any product outside of the United States, we would need to comply with numerous and varying regulatory requirements of other countries regarding safety and efficacy and governing, among other things, clinical trials, marketing authorization, commercial sales and distribution of our products. Whether or not we obtain FDA approval for a product, we would need to obtain the necessary approvals by the comparable regulatory authorities of foreign countries before we can commence clinical trials or marketing of the product in those countries. The approval process varies from country to country and can involve additional product testing and additional administrative review periods. The time required to obtain approval in other countries might differ from and be longer than that required to obtain FDA approval. Regulatory approval in one country does not ensure regulatory approval in another, but a failure or delay in obtaining regulatory approval in one country may negatively impact the regulatory process in others.
Pharmaceutical coverage, pricing and reimbursement
Significant uncertainty exists as to the coverage and reimbursement status of any drug products for which we may obtain regulatory approval. Sales of any of our product candidates which may be ultimately approved, including SCY-078, will depend, in part, on the extent to which the costs of the products will be covered by third-party payors, including government health programs such as Medicare and Medicaid, and commercial health insurers. The process for determining whether a payor will provide coverage for a drug product is separate from the process for determining the reimbursement rate for the drug product once coverage is approved. Third-party payors may limit coverage to specific drug products on an approved list, or formulary, which might not include all of the approved drugs for a particular indication or may apply utilization management requirements such as prior authorization to restrict access to certain approved drugs for a particular indication.
To secure coverage and reimbursement for any product that might be approved by the FDA for sale, we may need to conduct expensive pharmacoeconomic studies to demonstrate the medical necessity and cost-effectiveness of the product, in addition to the costs required to obtain FDA or other comparable regulatory approvals. Our product candidates may not be considered medically necessary or cost-effective by government or private third-party payor decision makers. A payor’s decision to provide coverage for a drug product does not mean that the product will be adequately reimbursed. Third-party reimbursement may not be sufficient to enable us to realize an appropriate return on our investment in product development.
The containment of healthcare costs has become a priority of federal, state and foreign governments, and the prices of drugs have been a focus in this effort. Third-party payors are increasingly challenging the prices of medical products and corresponding services and examining the medical necessity and cost-effectiveness of medical products and services, in addition to their safety and efficacy. If these third-party payors do not consider products to be cost-effective compared to other available therapies, they may not provide coverage for our products after approval as a benefit under their health insurance plans or, if they do, the reimbursement rates may not be adequate to allow recovery of product development and production costs. In addition, and to be considered for coverage and reimbursement, all third-party payors in the United States require that healthcare providers use unique codes to identify the product and service rendered when billing for such products and services. Codes unique to a pharmaceutical product for use in a physician’s office, such as our lead product candidate, are only available after a twelve-month coding application and review process by the Centers for Medicare and Medicaid Services, or CMS, which commences in January of each year post FDA approval of the product. Codes for use in hospital outpatient departments may be created mid-year, but there may be delay between launch and issuance of a code. In the absence of a unique code for a pharmaceutical product post commercial launch, and in the interim, it is standard practice for healthcare providers in the United States to use a temporary code when billing third-party payors to describe the pharmaceutical product rendered.
The U.S. government, state legislatures and foreign governments have shown significant interest in implementing cost-containment programs to limit the growth of government-paid health care costs, including price controls, restrictions on reimbursement and requirements for substitution of generic products for branded prescription drugs. Adoption of such controls and measures, and tightening of restrictive policies in jurisdictions with existing controls and measures, could limit payments for pharmaceuticals such as the drug product candidates that we are developing and could adversely affect our net revenue and results.
Pricing and reimbursement requirements vary widely from country to country. Some countries provide that drug products may be marketed only after a reimbursement price has been agreed. Some countries may require the completion of additional studies that compare the cost-effectiveness of a particular product candidate to currently available therapies. For example, the European Union provides options for its member states to restrict the range of drug products for which their national health insurance systems provide reimbursement and to control the prices of medicinal products for human use. European Union member states may approve a specific price for a drug product or it may instead adopt a system of direct or indirect controls on our profitability in placing the drug product on the market. Other member states allow companies to fix their own prices for drug products, but monitor and control company profits. The downward pressure on health care costs in general, particularly prescription drugs, has become intense. As a result, increasingly high barriers are being erected to the entry of new products. In addition, in some countries, cross-border imports from low-priced markets exert competitive pressure that
25
may reduce pricing within a country. There can be no assurance that any country that has price controls or reimbursement limitations for drug products will allow favorable reimbursement and pricing arrangements for any of our products.
The marketability and adoption of any products for which we receive regulatory approval for commercial sale may suffer if the government and private third-party payors fail to provide adequate coverage and reimbursement. In addition, emphasis on managed care in the United States has increased and we expect will continue to increase the pressure on drug pricing. Coverage policies, third-party payment rates and drug pricing regulation may change at any time. In particular, in March 2010, the Patient Protection and Affordable Care Act, as amended by the Health Care and Education Affordability Reconciliation Act of 2010, together the Affordable Care Act, was adopted in the United States. This law substantially changes the way healthcare is financed by both governmental and private insurers, and significantly impacts the pharmaceutical industry. Changes that may affect our business if we or our partners commercialize our products in the future include those governing enrollment in federal healthcare programs, reimbursement changes, rules regarding prescription drug benefits under the health insurance exchanges, and fraud and abuse and enforcement. In addition, continued implementation of the Affordable Care Act may result in the expansion of new programs such as Medicare payment for performance initiatives, and may impact existing government healthcare programs, such as by improving the physician quality reporting system and feedback program.
Additional provisions of the Affordable Care Act may negatively affect our revenues from products that we commercialize in the future. For example, as part of the Affordable Care Act’s provisions closing a coverage gap that currently exists in the Medicare Part D prescription drug program, manufacturers of branded prescription drugs are required to provide a 50% discount on branded prescription drugs dispensed to beneficiaries within this coverage gap. Medicare Part D is a prescription drug benefit available to all Medicare beneficiaries. It is a voluntary benefit that is implemented through private plans under contractual arrangements with the federal government. Similar to pharmaceutical coverage through private health insurance, Part D plans negotiate discounts from drug manufacturers and pass on some of those savings to Medicare beneficiaries. Rebates are also due on the drug utilization of Medicaid managed care organizations. With regard to the amount of the rebates owed, the Affordable Care Act increased the minimum Medicaid rebate for all drugs; changed the calculation of the rebate for certain innovator products that qualify as line extensions of existing drugs; and capped the total rebate amount for innovator drugs at 100% of the average manufacturer price, or AMP. In addition, the Affordable Care Act and subsequent legislation changed the definition of AMP. Finally, since 2011, the Affordable Care Act has required pharmaceutical manufacturers of branded prescription drugs to pay a new branded prescription drug fee to the federal government.
Even if favorable coverage and adequate payment status attained for one or more products for which we receive regulatory approval, less favorable coverage policies and payment rates may be implemented in the future.
Healthcare law and regulation
Healthcare providers, physicians and third-party payors often play a primary role in the recommendation and prescription of any product candidates for which we may obtain marketing approval. Our future arrangements with third-party payors and customers may expose us to broadly applicable fraud and abuse and other healthcare laws and regulations that may constrain the business or financial arrangements and relationships through which we market, sell and distribute our products for which we obtain marketing approval. Restrictions under applicable federal and state healthcare laws and regulations, include the following:
|
•
|
The federal healthcare anti-kickback statute prohibits, among other things, persons from knowingly and willfully soliciting, offering, receiving or providing remuneration, directly or indirectly, in cash or in kind, to induce or reward either the referral of an individual for, or the purchase, order or recommendation of, any good or service, for which payment may be made, in whole or in part, under federally funded healthcare programs such as Medicare and Medicaid. This statute has been interpreted to apply to arrangements between pharmaceutical manufacturers on the one hand and prescribers, purchasers and formulary managers on the other. Violations of the federal anti-kickback statute are punishable by imprisonment, criminal fines, civil monetary penalties and exclusion from participation in federal healthcare programs. The Affordable Care Act clarified that a person or entity need not have actual knowledge of the federal anti-kickback statute or specific intent to violate it. In addition, the Affordable Care Act amended the federal civil False Claims Act to provide that a claim that includes items or services resulting from a violation of the federal anti-kickback statute constitutes a false or fraudulent claim for purposes of the federal civil False Claims Act. There are a number of statutory exceptions and regulatory safe harbors protecting certain common activities from prosecution or other regulatory sanctions, however, the exceptions and safe harbors are drawn narrowly, and practices that do not fit squarely within an exception or safe harbor may be subject to scrutiny.
|
|
•
|
The federal civil False Claims Act imposes civil penalties, and provides for whistleblower or qui tam actions, against individuals or entities for knowingly presenting, or causing to be presented, claims for payment of government funds that are false or fraudulent or knowingly making, or causing to be made, a false record or statement material to a false or fraudulent claim to avoid, decrease or conceal an obligation to pay money to the
|
26
federal government. Several pharmaceutical and other healthcare companies have faced enforcement actions under these laws for allegedly inflating drug prices they report to pricing services, which in turn were used by the government to set Medicare and Medicaid reimbursement rates, and for allegedly providing free product to customers with the expectation that the customers would bill federal programs for the product. In addition, federal anti-kickback statute violations and certain marketing practices, including off-label promotion, may also implicate the federal civil False Claims Act. Federal civil False Claims Act violations may result in civil monetary damages and penalties and exclusion from participation in federal healthcare programs. There are also criminal penalties, including imprisonment and criminal fines, for making or presenting a false, fictitious or fraudulent claim to the federal government.
|
•
|
The federal Health Insurance Portability and Accountability Act of 1996, as amended by the Health Information Technology for Economic and Clinical Health Act, imposes criminal and civil liability for executing a scheme to defraud any healthcare benefit program and also imposes obligations, including mandatory contractual terms, with respect to safeguarding the privacy, security and transmission of individually identifiable health information.
|
|
•
|
The federal criminal false statements statute prohibits knowingly and willfully falsifying, concealing or covering up a material fact, making any materially false, fictitious, or fraudulent statement or representation, or making or using any false writing or document knowing the same to contain any materially false, fictitious or fraudulent statement or entry in connection with the delivery of or payment for healthcare benefits, items or services.
|
|
•
|
The federal Physician Payment Sunshine Act, being implemented as the Open Payments Program, requires applicable pharmaceutical manufacturers of covered drugs to engage in extensive tracking of physician and teaching hospital payments, maintenance of a payments database, and public reporting of the payment data. Pharmaceutical manufacturers with products for which payment is available under Medicare, Medicaid or the State Children’s Health Insurance Program must perform such tracking and provide annual reports through the Open Payments Program. CMS posts such manufacturer disclosures on a searchable public website. Failure to comply with the reporting obligations may result in civil monetary penalties.
|
|
•
|
Analogous state laws and regulations, such as state anti-kickback and false claims laws, may apply to sales or marketing arrangements and claims involving healthcare items or services reimbursed by Medicaid or other state programs or, in several states, apply regardless of the payor. Several state laws require pharmaceutical companies to report expenses relating to the marketing and promotion of pharmaceutical products in those states and to report gifts and payments to individual health care providers in those states. Some of these states also prohibit certain marketing related activities including the provision of gifts, meals or other items to certain health care providers. In addition, California, Connecticut, Nevada, and Massachusetts require pharmaceutical companies to implement compliance programs or marketing codes.
|
Regulation of preclinical research services
Preclinical research to support FDA submissions is subject to Good Laboratory Practices, or GLP, regulation and as a result the services we provide to third parties are subject to these regulations. Non-compliance with GLP can result in disqualification of the testing facility, and allows FDA to ignore the results of any study conducted by the disqualified facility. Although we do not directly conduct animal studies, such studies which we may facilitate or contract to third parties are subject to GLP and the Animal Welfare Act which among other things sets minimum standards of care for certain animals used in research. The Animal and Plant Health Inspection Service of the U.S. Department of Agriculture administers the Animal Welfare Act.
Intellectual Property
We strive to protect the proprietary technology that we believe is important to our business, including seeking and maintaining patents intended to cover our product candidates and compositions, their methods of use and processes for their manufacture and other inventions that are commercially important to the development of our business. We also rely on trade secrets to protect aspects of our business that are not amenable to, or that we do not consider appropriate for, patent protection.
As of March 20, 2015, we are the owner of 12 issued U.S. patents and 107 issued non-U.S. patents with claims to novel compounds, compositions containing them, processes for their preparation, their uses as pharmaceutical agents and test methods, with terms expiring between 2016 and 2031. Of these patents, one U.S. patent relates to SCY-078. We are actively pursuing five U.S. patent applications (provisional and non-provisional), three international (PCT) patent applications and 48 non-U.S. patent applications in at least 28 jurisdictions.
27
We are the exclusive licensee from Aventis Pharma of two issued U.S. patents and 8 issued non-U.S. patents, with claims to novel compounds, compositions containing them, processes for their preparation, and their uses as pharmaceutical agents, with terms expiring between 2017 and 2019. These include patents covering our lead cyclophilin inhibitor compound, SCY-635, which, in October 2014 was exclusively licensed to Waterstone for the treatment of viral diseases in humans (as described in the section above titled “Collaborations and Licensing Arrangements”). The agreement granted Waterstone an exclusive license or sub-license for human viral diseases to certain patents and patent applications owned by or exclusively licensed to Scynexis relating to SCY‑635. In January 2015, we entered into a patent assignment agreement with Waterstone under which a total of 18 patents and patent applications owned by SCYNEXIS and relating to SCY-635 were assigned to Waterstone. Following this assignment, Waterstone assumed responsibility for maintenance, prosecution and enforcement of these patents and patent applications. We continue to remain the exclusive licensee of aforementioned Aventis Pharma patents, which continue to be exclusively sub-licensed to Waterstone, but were not assigned to Waterstone under the patent assignment agreement entered into in January 2015.
Our success will depend significantly on our ability to obtain and maintain patents and other proprietary protection for commercially important technology, inventions and know-how related to our business, defend and enforce our patents, maintain our licenses to use intellectual property owned by third parties, preserve the confidentiality of our trade secrets and operate without infringing the valid and enforceable patents and other proprietary rights of third parties. We also rely on know-how, continuing technological innovation and in-licensing opportunities to develop, strengthen, and maintain our proprietary position in the field of antifungal agents.
We believe that we have a strong intellectual property position and substantial know-how relating to the development and commercialization of SCY-078, including patents or patent applications covering inventions that we have co-invented with Merck. We cannot be sure that patents will be granted with respect to any of our pending patent applications or with respect to any patent applications filed by us in the future, nor can we be sure that any of our existing patents or any patents that may be granted to us in the future will be commercially useful in protecting our technology.
Our objective is to continue to expand our intellectual property estate by filing patent applications directed to SCY-078 or derivatives thereof, our cyclophilin platform and our contract research and development services. We intend to pursue, maintain, and defend patent rights, whether developed internally or licensed from third parties, and to protect the technology, inventions, and improvements that are commercially important to the development of our business.
SCY-078
The patent portfolio for SCY-078 is directed to cover compositions of matter, formulation, methods of use and precursors or intermediaries in its preparation. This patent portfolio includes an issued U.S. patent and corresponding foreign national and regional counterpart patents and patent applications. The patents and patent applications relating to SCY-078 include patents and patent applications that were initially assigned to us and Merck Sharp & Dohme Corp, a subsidiary of Merck & Co., Inc. Merck Sharp & Dohme Corp. subsequently assigned to us all of its rights in these patents and patent applications relating to SCY-078. The issued composition of matter patent (U.S. Patent No. 8,188,085), if the appropriate maintenance, renewal, annuity, and other governmental fees are paid, is expected to expire in 2030. Based on our current development plan, we believe that an additional term of up to five years for the SCY-078 U.S. patent may result from the patent term extension provision of the Drug Price Competition and Patent Term Restoration Act of 1984 (the Hatch-Waxman Act). We expect that the patent applications in this portfolio, if issued, and if appropriate maintenance, renewal, annuity, and other governmental fees are paid, would expire between 2029 and 2035, including any additional term from patent term adjustment or patent term extension. The patent term calculation method and the provisions under the Hatch-Waxman Act are described in the “Patent Term” section below. We are not currently aware of any third-party patents (other than patents we have licensed) encompassing SCY-078.
The terms of issued SCY-078 composition of matter patents in other jurisdictions (Algeria, Armenia, Australia, Azerbaijan, Belarus, Colombia, Europe, Indonesia, Japan, Lebanon, Kazakhstan, Kyrgyzstan, Mexico, Moldova, Morocco, New Zealand, Russia, Singapore, South Africa, Taiwan, Tajikistan, Tunisia, Turkmenistan and Ukraine), if the appropriate maintenance, renewal, annuity, and other government fees are paid, are expected to expire in 2029. These patents and patent applications (if applicable), depending on the national laws, may benefit from extension of patent term in individual countries. In some European countries, for example, a supplementary protection certificate, if obtained, provides a maximum five years of market exclusivity. The duration of the supplementary protection certificate may be extended to five and a half years when the supplementary protection certificate relates to a human medicinal product for which data from clinical trials conducted in accordance with an agreed Pediatric Investigation Plan, or PIP, have been submitted. Likewise, in Japan, the term of a patent may be extended by a maximum of five years in certain circumstances.
SCY-641
The patent portfolio for SCY-641 is directed to cover compositions of matter, formulation, and methods of use. This patent portfolio includes issued U.S. patents and corresponding foreign national and regional counterpart patents and patent
28
applications. The patents and patent applications relating to SCY-641 include patents and patent applications owned by us. The issued composition of matter patent (U.S. Patent No. 6,583,265), if the appropriate maintenance, renewal, annuity, and other government fees are paid, is expected to expire in 2019. The issued methods of use patents (U.S. Patent Nos. 8,188,052 and 8,551,952), if the appropriate maintenance, renewal, annuity, and other government fees are paid, are expected to expire in 2029 or 2027, respectively. We believe that the term for up to five years for one of the SCY-641 U.S. patents may be extended under the patent term extension provision of the Hatch-Waxman Act. We expect that the patent applications in this portfolio, if issued, and if appropriate maintenance, renewal, annuity, and other governmental fees are paid, would expire between 2019 and 2034, including any additional term from patent term adjustment or patent term extension, assuming that five year extension is granted. The patent term calculation method and the provisions under the Hatch-Waxman Act are described in the “Patent Term” section below.
The term of issued SCY-641 composition of matter patents in other jurisdictions (Australia, Canada, China, Europe and Japan) and methods of use patents and patent applications (if applicable) relating to SCY-641 (in Australia, Canada, China, Europe, Japan and South Africa), if the appropriate maintenance, renewal, annuity, and other government fees are paid, are expected to expire between 2019 and 2027. The patents and patent applications (if applicable), covering SCY-641, depending on the national laws, may also benefit from extension of patent term in individual countries.
Other product candidates
In addition to SCY-078, SCY-635 and SCY-641, we have a chemical library of more than 1,000 macrocyclic compounds generated by the research team at SCYNEXIS. This library includes compounds which are covered by patents or patent applications filed by us, but also includes novel chemical compounds which could form the basis for future patent applications.
Patent Term
The term of individual patents and patent applications will depend upon the legal term of the patents in the countries in which they are obtained. Generally, the patent term is 20 years from the date of filing of the patent application (or earliest filed parent application, if applicable).
Under the Hatch-Waxman Act, the term of a patent that claims an FDA-approved drug may also be eligible for patent term extension, or PTE. Eligibility for a PTE is based, in part, on whether the FDA approval of the drug represents the first permitted commercial marketing or use of the drug. Drugs that are considered to be new chemical entities under FDA’s regulations are generally eligible for PTE.
PTE permits patent term restoration of a U.S. patent as partial compensation for patent term lost during the FDA regulatory review process, which includes both the testing period while the drug is being investigated under an IND and the approval period while FDA is reviewing a marketing application. The length of the patent term extension is half the testing period plus all of the approval period, with certain limitations. The Hatch-Waxman Act permits a patent term extension of up to five years beyond the expiration of the patent; however, a patent term extension cannot in any event extend the remaining term of a patent beyond a total of 14 years from the date of product approval; only one patent that claims an approved drug may be extended; and the applicable approval must be the first approval of the product under the provision of law authorizing the approval. During the extension period, the patent holder’s rights under the patent are generally limited to approved uses of the product. Similar provisions may be available in Europe and certain other foreign jurisdictions to extend the term of a patent that covers an approved drug. When possible, depending upon the length of clinical trials and other factors involved in the filing of an NDA we expect to apply for patent term extensions for patents covering SCY-078 and its use in treating various diseases. As a specific example, if we are awarded the maximum length of PTE, our U.S. granted composition of matter patents relating to SCY-078 would have an expected expiration date of the earlier of fourteen years from product approval or August 28, 2035. However, depending on any changes in our clinical path and the date of FDA approval, the PTE may not be granted, or may be less than the maximum.
Proprietary rights and processes
We may rely, in some circumstances, on proprietary technology and processes (including trade secrets) to protect our technology. However, these can be difficult to protect. We seek to protect our proprietary technology and processes, in part, by entering into confidentiality agreements with our employees, consultants, scientific advisors, contractors, and collaborators. We also seek to preserve the integrity and confidentiality of our proprietary technology and processes by maintaining physical security of our premises and physical and electronic security of our information technology systems. While we have confidence in these individuals, organizations and systems, agreements or security measures may be breached, and we may not have adequate remedies for any breach. In addition, our proprietary technology and processes may otherwise become known or be independently discovered by competitors. To the extent that our employees, consultants, scientific advisors, contractors, or collaborators use intellectual property owned by others in their work for us, disputes may arise as to the rights in related or resulting know-how and inventions. For this and more comprehensive risks related to our proprietary technology and processes, please see the section on “Risk Factors—Risks Relating to Our Intellectual Property.”
29
Legal Proceedings
From time to time, we are involved in various legal proceedings arising in the ordinary course of our business. We are not currently a party to any legal proceedings the outcome of which, if determined adversely to us, would individually or in the aggregate have a material effect on our business, operating results, financial condition or cash flows.
Employees
As of March 1, 2015, we had 87 employees, all of whom were employed on a full-time basis. Our employees are engaged in administration, finance, clinical development, manufacturing, sales and marketing, and business development functions. Thirty-three of our employees have Ph.D. degrees in the sciences and are focused on human and animal drug development. We believe our relations with our employees are good.
Corporate Information
We were incorporated in the State of Delaware on November 4, 1999. Our corporate headquarters are located at 3501 C Tricenter Boulevard, Suite 340, Durham, North Carolina 27713.
Our corporate website address is www.scynexis.com. The information contained on, or that can be accessed through, our website is not part of this Annual Report, and the inclusion of our website address in this Annual Report is an inactive textual reference only.
Facilities
Our corporate headquarters are located in Durham, North Carolina in a leased facility consisting of approximately 90,000 square feet of office space. The lease for this facility expires in March 2019, and includes a renewal option to extend the lease through March 2024.
|
ITEM 1A.
|
RISK FACTORS
|
In evaluating our business, you should carefully consider the following risks, as well as the other information contained in this Annual Report on Form 10-K. These risk factors could cause our actual results to differ materially from those contained in forward-looking statements we have made in this Annual Report on Form 10-K and those we may make from time to time. If any of the following risks actually occurs, our business, financial condition and operating results could be harmed. The risks and uncertainties described below are not the only ones facing us. Additional risks and uncertainties not presently known to us, or that we currently see as immaterial, may also harm our business.
Risks Relating to Our Financial Condition and Need for Additional Capital
We have never been profitable, we have no products approved for commercial sale, and to date we have not generated any revenue from product sales. As a result, our ability to curtail our losses and reach profitability is unproven, and we may never achieve or sustain profitability.
We are not profitable and do not expect to be profitable in the foreseeable future. We have incurred net losses in each year since our inception, including a net loss of approximately
$4.2 million
for the year ended
December 31, 2014
. As of
December 31, 2014
, we had an accumulated deficit of approximately
$117.5 million
. Although we have generated revenues through our contract research and development services, these revenues have not been sufficient to support our business, and so in addition we have financed our operations through the sale of convertible preferred stock, convertible debt, and common stock. We intend to devote a majority of our financial resources to the development of SCY-078, our lead product candidate. We have not generated any revenue from product sales. Although we successfully completed an IPO and have repaid all of our debt, there can be no assurances that we will be able to continue our operations on a long-term basis. We have suffered substantial losses from operations and may require additional financing.
We expect to continue to incur significant expenses and increasing operating losses for the foreseeable future. The net losses we incur may fluctuate significantly from year to year. We anticipate that our expenses will increase substantially as we:
|
•
|
continue the development of SCY-078;
|
30
|
•
|
conduct ongoing and initiate new clinical trials for SCY-078;
|
|
•
|
seek marketing approvals for SCY-078;
|
|
•
|
establish a sales, marketing and distribution infrastructure to commercialize any products for which we may obtain marketing approval;
|
|
•
|
maintain, expand and protect our intellectual property portfolio;
|
|
•
|
hire additional clinical, quality control and scientific personnel; and
|
|
•
|
maintain and create additional infrastructure to support our operations as a public company.
|
In addition, our expenses could increase if we are required by the U.S. Food and Drug Administration, or the FDA, to perform studies in addition to, or that are larger than, those that we currently expect.
As a result of the foregoing, we expect to experience net losses and negative cash flows for the foreseeable future, and we are unable to predict when, or if, we will be able to achieve profitability. Our losses and negative cash flows have had, and will continue to have, an adverse effect on our stockholders’ equity, financial position and working capital.
We expect a number of factors to cause our operating results to fluctuate on a quarterly and annual basis, which may make it difficult to predict our future performance.
Our financial condition and operating results have varied significantly in the past and will continue to fluctuate from quarter to quarter or year to year due to a variety of factors, many of which are beyond our control. The following factors relating to our business, as well as factors described elsewhere in this annual report, may contribute to these fluctuations:
|
•
|
the costs associated with developing SCY-078, which are difficult for us to predict;
|
|
•
|
any delays in regulatory review and approval of SCY-078;
|
|
•
|
delays in the timing of submission of a new drug application, or NDA, as well as commencement, enrollment and the timing of clinical testing, of SCY-078 or any other product candidates we may seek to develop;
|
|
•
|
our ability to commercialize product candidates, both in the United States and overseas, if we are able to obtain regulatory approval to do so;
|
|
•
|
the costs associated with obtaining and maintaining regulatory approval and ongoing company compliance and product compliance for SCY-078;
|
|
•
|
the success of our providing contract research and development services;
|
|
•
|
market acceptance of SCY-078 and any future product candidates we may seek to develop;
|
|
•
|
changes in regulations and regulatory policies;
|
|
•
|
competition from existing products or new products that may emerge;
|
|
•
|
the ability of patients or healthcare providers to obtain coverage of, or sufficient reimbursement for, any products we are able to develop;
|
|
•
|
our ability to establish or maintain collaborations, licensing or other arrangements;
|
|
•
|
costs related to, and outcomes of, potential litigation;
|
|
•
|
potential product liability claims; and
|
|
•
|
potential liabilities associated with hazardous materials.
|
Due to the various factors mentioned above, and others, the results of any quarterly or annual periods should not be relied upon as indications of future operating performance.
We may continue to require substantial additional capital, and if we are unable to raise capital when needed we would be forced to delay, reduce or eliminate our development program for SCY-078.
Developing pharmaceutical products, including conducting preclinical studies and clinical trials, is expensive. If the FDA requires that we perform additional studies beyond those that we currently expect, our expenses could increase beyond what we currently anticipate, the timing of the submission of the NDA could be delayed, and any potential product approval
31
could be delayed. In May 2014, we raised net proceeds of approximately $54.6 in connection with our IPO after deducting underwriting discounts and commissions of $3.3 million and offering expenses payable by us of $4.1 million. In addition, we paid off $15 million in principal and all accrued interest on our credit facility with HSBC Bank on May 7, 2014. We believe that the net proceeds from our IPO will be sufficient to meet our anticipated operating requirements
into the first quarter of 2016
; provided, however, that changing circumstances may cause us to consume capital more rapidly than we currently anticipate. We may need to raise additional funds from the issuance of equity and/or debt securities or otherwise obtain funding through strategic alliances or collaborations with third parties. In any event, we will require additional capital to complete development of, to seek regulatory approval for and, if approval is obtained, to commercialize SCY-078 and any future product candidates we may seek to develop. Raising funds in the current economic environment, when the capital markets have been affected by the global recession, may present additional challenges.
When we are required to secure additional financing, the additional fundraising efforts may divert our management from our day-to-day activities, which may adversely affect our ability to develop and commercialize SCY-078 and any future product candidates we may seek to develop. In addition, we cannot guarantee that financing will be available in sufficient amounts or on terms acceptable to us, if at all. If we are unable to raise additional capital when required or on acceptable terms, we may be required to:
|
•
|
significantly delay, scale back or discontinue the development or commercialization of SCY-078 and any future product candidates we may seek to develop;
|
|
•
|
seek strategic alliances for research and development programs at an earlier stage than otherwise would be desirable or on terms that are less favorable than might otherwise be available; or
|
|
•
|
relinquish or license on unfavorable terms our rights to any product candidates that we otherwise would seek to develop or commercialize ourselves.
|
If we are required to conduct additional fundraising activities and we are unable to raise additional capital in sufficient amounts or on terms acceptable to us, we will be prevented from pursuing development and commercialization efforts, which will have a material adverse effect on our business, operating results and prospects.
Risks Relating to the Development, Regulatory Approval and Commercialization
of Our Product Candidates For Human Use
Historically we have been primarily a contract research and development services company devoting a majority of our resources and efforts to providing research and development services to other companies, and we are only now shifting our focus to developing our own drug candidate SCY-078.
We were spun out from Aventis in 2000 as a chemistry and animal health services company, providing contract research services to third parties. Since then, we have derived substantially all of our revenue from providing these services to human and animal health companies to assist them in developing their own drug candidates. In the course of providing these services, we have leveraged this expertise to develop our own proprietary compounds, including a platform of cyclophilin inhibitors, among them SCY-635, which we exclusively licensed to Waterstone in October 2014. In 2013, under our contract with Merck Sharp & Dohme Corp., or Merck, a subsidiary of Merck & Co., Inc., Merck exclusively licensed SCY-078 to us in the field of human health and in conjunction with that license transferred to us the investigational new drug application on file with the FDA and related regulatory responsibilities, as well as all data Merck had developed for the compound, plus active pharmaceutical ingredients and tablets. In 2014, Merck assigned the patents to us related to SCY-078 that it had exclusively licensed to us.
Although we have conducted Phase 1 and Phase 2 studies of SCY-635, our cyclophilin inhibitor that we exclusively licensed to Waterstone in October 2014, we only acquired the rights to develop SCY-078, our lead drug candidate for the treatment of invasive fungal infections, in May 2013. We do not have a significant history of developing our own drug candidates, and we have not brought any drug candidates to market, which makes it difficult to assess our ability to develop and commercialize SCY-078 and any future product candidates we may seek to develop or commercialize.
We cannot be certain that SCY-078 will receive regulatory approval, and without regulatory approval we will not be able to market SCY-078. Regulatory approval is a lengthy, expensive and uncertain process.
32
Our ability to generate significant revenue related to SCY-078 sales will depend on the successful development and regulatory approval of SCY-078. We expect that the earliest that we could obtain regulatory approval of SCY-078 and commence commercialization of SCY-078 will be several years from now, if at all.
We currently have no products approved for sale and we cannot guarantee that we will ever have marketable products. The development and commercialization of a product candidate, including preclinical and clinical testing, manufacturing, quality systems, labeling, approval, record-keeping, selling, promotion, marketing and distribution of products, is subject to extensive regulation by the FDA in the United States and regulatory authorities in other countries, with regulations differing from country to country. We are not permitted to market product candidates in the United States until and unless we receive approval of an NDA from the FDA. We have not submitted an NDA for SCY-078. Obtaining approval of an NDA is a lengthy, expensive and uncertain process. An NDA must include extensive preclinical and clinical data and supporting information to establish the product candidate’s safety and effectiveness for each indication. The approval application must also include significant information regarding the chemistry, manufacturing and controls for the product. The product development and regulatory review process typically takes years to complete, involves numerous uncertainties and the potential for concerns to emerge late in the development process, and approval is never guaranteed. Even if a product is approved, the FDA may limit the indications for which the product may be used, include extensive warnings on the product labeling or require costly ongoing requirements for post-marketing clinical studies and surveillance or other risk management measures to monitor the safety or efficacy of the product candidate, including the imposition of a REMS. Markets outside of the United States also have requirements for approval of drug candidates with which we must comply prior to marketing. Obtaining regulatory approval for marketing of a product candidate in one country does not ensure we will be able to obtain regulatory approval in other countries, but a failure or delay in obtaining regulatory approval in one country may have a negative effect on the regulatory process in other countries. Also, any regulatory approval of a product candidate, once obtained, may be withdrawn. If SCY-078 or any of our other wholly-owned or partnered product candidates do not receive timely regulatory approval, or fail to maintain that regulatory approval, we may not be able to generate sufficient revenue to become profitable or to continue our operations. Moreover, the filing of our NDA or the receipt of regulatory approval does not assure commercial success of any approved product.
Although the oral form of SCY-078 has been granted Qualified Infectious Disease Product status, this does not guarantee that the length of the FDA review process will be significantly shorter than otherwise, or that SCY-078 will ultimately be approved by the FDA.
We applied to the FDA for, and received, the designation of the oral tablet formulation of SCY-078 as a Qualified Infectious Disease Product, or QIDP, under the Generating Antibiotic Incentives Now Act, or GAIN Act. We also applied to the FDA for, and were granted, fast track product designation. We will be submitting applications to have the IV formulation of SCY-078 designated as a QIDP and as a fast track product. There is no guarantee that the IV form of SCY-078 will be granted QIDP or fast track status. We anticipate that the QIDP designation will provide, among other benefits, eligibility for fast track designation, which allows for companies to interact with the FDA review team frequently to discuss critical development issues such as study design, required safety data necessary to support approval, and structure and content of an NDA. Additionally, should the FDA determine that a fast track product may be effective after their preliminary evaluation of clinical data submitted by a sponsor, the FDA may also consider reviewing portions of a marketing application before the sponsor submits the complete application, a process known as rolling review. If SCY-078 is approved for its proposed use and awarded five years of exclusivity as a new chemical entity, or NCE, SCY-078 will be eligible for a ten year period of data exclusivity, comprising five years of NCE exclusivity plus an additional five years as a designated QIDP. This exclusivity period should protect SCY-078 from being referenced in an abbreviated new drug application, or ANDA, in support of a generic drug, or a 505(b)(2) new drug application for a follow-on product until the expiration of the exclusivity period (which may be shortened by one year if an ANDA or 505(b)(2) applicant seeks to challenge any of the patents that claim SCY-078). However, the primary framework of the GAIN Act became effective July 9, 2012, and as a relatively new law there is limited precedent for the way in which it will be implemented. Receipt of QIDP designation in practice may not result in a faster development process, review or approval compared to drugs considered for approval under conventional FDA procedures and does not assure ultimate approval by the FDA or related exclusivity benefits.
Delays in the commencement, enrollment and completion of clinical trials could result in increased costs to us and delay or limit our ability to obtain regulatory approval for SCY-078 or any future product candidates.
We do not know whether clinical trials of SCY-078 or any future product candidates we may seek to develop will be allowed to commence or, if commenced, will be completed on schedule or at all. The commencement, enrollment and completion of clinical trials can be delayed for a variety of reasons, including:
33
|
•
|
inability to reach agreements on acceptable terms with prospective clinical research organizations, or CROs, and trial sites, the terms of which can be subject to extensive negotiation and may vary significantly among different CROs and trial sites;
|
|
•
|
difficulty identifying and engaging qualified clinical investigators;
|
|
•
|
regulatory objections to commencing a clinical trial or proceeding to the next phase of investigation, including inability to reach agreement with the FDA or non-U.S. regulators regarding the scope or design of our clinical trials or for other reasons such as safety concerns that might be identified during preclinical development or early stage clinical trials;
|
|
•
|
inability to identify and maintain a sufficient number of eligible trial sites, many of which may already be engaged in other clinical trial programs, including some that may be for the same indication as our product candidates;
|
|
•
|
withdrawal of clinical trial sites from our clinical trials as a result of changing standards of care;
|
|
•
|
inability to obtain institutional review board (or ethics review committee) approval to conduct a clinical trial at prospective sites;
|
|
•
|
difficulty identifying, recruiting and enrolling eligible patients to participate in clinical trials for a variety of reasons, including meeting the enrollment criteria for our study and competition from other clinical trial programs for the same indication as product candidates we seek to commercialize;
|
|
•
|
inability to retain patients in clinical trials due to the treatment protocol, personal issues, side effects from the therapy or lack of efficacy; and
|
|
•
|
inability to obtain sufficient funding to commence a clinical trial.
|
In addition, a clinical trial may be suspended or terminated by us, our current or any future partners, an institutional review board, the FDA or other regulatory authorities due to a number of factors, including:
|
•
|
failure by us, CROs or clinical investigators to conduct the clinical trial in accordance with regulatory requirements or our clinical protocols;
|
|
•
|
failed inspection of the clinical trial operations or trial sites by the FDA or other regulatory authorities;
|
|
•
|
unforeseen safety or efficacy issues or any determination that a clinical trial presents unacceptable health risks; or
|
|
•
|
lack of adequate funding to continue the clinical trial due to unforeseen costs resulting from enrollment delays, requirements to conduct additional trials and studies, increased expenses associated with the services of our CROs and other third parties, or other reasons.
|
If we are required to conduct additional clinical trials or other testing of SCY-078 or any future product candidates we may seek to develop, we may be delayed in obtaining, or may not be able to obtain, marketing approval for these product candidates.
In addition, if our current or any future partners have rights to and responsibility for development of SCY-078 or any future product candidates, they may fail to meet their obligations to develop and commercialize the product candidates, including clinical trials for these product candidates.
Changes in regulatory requirements and guidance may occur and we or any of our partners may be required by appropriate regulatory authorities to amend clinical trial protocols to reflect these changes. Amendments may require us or any of our partners to resubmit clinical trial protocols to independent review boards for re-examination, which may impact the costs, timing or successful completion of a clinical trial. If we or any of our partners experience delays in the completion of, or if we or our partners terminate, clinical trials, the commercial prospects for SCY-078 and any future product candidates we may seek to develop will be harmed, and our ability to generate revenue from sales of these product candidates will be prevented or delayed. In addition, many of the factors that cause, or lead to, a delay in the commencement or completion of clinical trials may also ultimately lead to the denial of regulatory approval of a product candidate.
34
Clinical failure can occur at any stage of clinical development. Because the results of earlier clinical trials are not necessarily predictive of future results, any product candidate we or our current or potential future partners advance through clinical trials may not have favorable results in later clinical trials or receive regulatory approval.
Clinical failure can occur at any stage of clinical development. Clinical trials may produce negative or inconclusive results, and we or our partners may decide, or regulators may require us, to conduct additional clinical or preclinical testing. In addition, data obtained from tests are susceptible to varying interpretations, and regulators may not interpret data as favorably as we do, which may delay, limit or prevent regulatory approval. Success in preclinical testing and early clinical trials does not ensure that later clinical trials will generate the same results or otherwise provide adequate data to demonstrate the efficacy and safety of a product candidate. Frequently, product candidates that have shown promising results in early clinical trials have subsequently suffered significant setbacks in later clinical trials. In addition, the design of a clinical trial can determine whether its results will support approval of a product application, or approval of a supplemental application to add a new indication or other changes and flaws or shortcomings in the design of a clinical trial may not become apparent until the clinical trial is well advanced. We have limited experience in designing clinical trials and may be unable to design and execute a clinical trial to support regulatory approval, or approval of supplemental applications for new indications or other changes. Further, clinical trials of potential products often reveal that it is not practical or feasible to continue development efforts. If SCY-078 or any future product candidates are found to be unsafe or lack efficacy, we or our collaborators will not be able to obtain regulatory approval for them and our business would be harmed. For example, if the results of our ongoing or planned Phase 2 and Phase 3 clinical trials of SCY-078 do not achieve, to the satisfaction of regulators, the primary efficacy endpoints and demonstrate an acceptable level of safety, the prospects for approval of SCY-078 would be materially and adversely affected. A number of companies in the pharmaceutical industry, including those with greater resources and experience than us, have suffered significant setbacks in Phase 2 and Phase 3 clinical trials, even after seeing promising results in earlier clinical trials.
In some instances, there can be significant variability in safety and/or efficacy results between different trials of the same product candidate due to numerous factors, including differences in trial protocols and design, differences in size and type of the patient populations, adherence to the dosing regimen and the rate of dropout among clinical trial participants. Further, the patients taking SCY-078 often have other significant medical issues, such as organ transplants, cancer or other conditions in which their immune systems are supressed, which makes it difficult to measure the effect of SCY-078 in the presence of these medical issues. We do not know whether any Phase 2, Phase 3 or other clinical trials we or any partners may conduct will demonstrate consistent and/or adequate efficacy and safety to obtain regulatory approval to market SCY-078 and any future product candidates we may seek to develop.
We have limited experience in conducting clinical trials and have never submitted an NDA before, and we may be unable to do so for SCY-078 or any future product candidate we may seek to develop.
Merck completed seven Phase 1 clinical trials of SCY-078, and we are planning to conduct Phase 1, Phase 2, and Phase 3 clinical trials of SCY-078. The conduct of successful Phase 2 and Phase 3 clinical trials is essential in obtaining regulatory approval, and the submission of a successful NDA is a complicated process. We have limited experience in preparing and submitting regulatory filings, have previously only sponsored one Phase 2 clinical trial, and have not previously sponsored any Phase 3 clinical trials nor have we ever submitted an NDA before. Consequently, we may be unable to successfully and efficiently execute and complete these planned clinical trials in a way that is acceptable to the FDA and leads to an NDA submission, acceptance and approval of SCY-078 or any future product candidate we may seek to develop. We may require more time and incur greater costs than our competitors and may not succeed in obtaining regulatory approvals of product candidates that we may seek to develop. In addition, failure to commence or complete, or delays in, our planned clinical trials would prevent us from or delay us in commercializing SCY-078 or any future product candidate we may develop.
The environment in which our regulatory submissions may be reviewed changes over time, which may make it more difficult to obtain regulatory approval of any of our product candidates we may seek to develop or commercialize.
The environment in which regulatory submissions are reviewed changes over time. For example, average review times at the FDA for NDAs have fluctuated over the last ten years, and we cannot predict the review time for any submission with any regulatory authorities. Review times can be affected by a variety of factors, including budget and funding levels and statutory, regulatory and policy changes. Moreover, in light of widely publicized events concerning the safety risk of certain drug products, regulatory authorities, members of Congress, the Government Accountability Office, medical professionals and the general public have raised concerns about potential drug safety issues. These events have resulted in the withdrawal of drug products, revisions to drug labeling that further limit use of the drug products and establishment of risk evaluation and mitigation strategies that may, for instance, restrict distribution of drug products. The increased attention to drug safety issues may result in a more cautious approach by the FDA to clinical trials. Data from preclinical studies and clinical trials may receive greater scrutiny with respect to safety, which may make the FDA or other regulatory authorities more likely to terminate
35
clinical trials before completion, or require longer or additional clinical trials that may result in substantial additional expense, a delay or failure in obtaining approval or approval for a more limited indication or conditions of use than originally sought.
In addition, data obtained from preclinical studies and clinical trials are subject to different interpretations, which could delay, limit or prevent regulatory review or approval of product candidates. Changes in FDA personnel responsible for review of our submissions could also impact the manner in which our data are viewed. Furthermore, regulatory attitudes towards the data and results required to demonstrate safety and efficacy can change over time and can be affected by many factors, such as the emergence of new information, including information on other products, policy changes and agency funding, staffing and leadership. We do not know whether future changes to the regulatory environment will be favorable or unfavorable to our business prospects.
If SCY-078 or any other future product candidates for which we receive regulatory approval do not achieve broad market acceptance, the revenue that is generated from their sales will be limited.
The commercial success of SCY-078 or any other product candidates we may seek to develop will depend upon the acceptance of these product candidates among physicians, patients, the medical community and healthcare payors. The degree of market acceptance of product candidates will depend on a number of factors, including:
|
•
|
limitations or warnings contained in the FDA-approved labeling;
|
|
•
|
changes in the standard of care for the targeted indications;
|
|
•
|
limitations in the approved indications;
|
|
•
|
availability of alternative therapies with potentially advantageous results, or other products with similar results at similar or lower cost, including generics and over-the-counter products;
|
|
•
|
lower demonstrated clinical safety or efficacy compared to other products;
|
|
•
|
occurrence of significant adverse side effects;
|
|
•
|
ineffective sales, marketing and distribution support;
|
|
•
|
lack of availability of reimbursement from managed care plans and other third-party payors;
|
|
•
|
timing of market introduction and perceived effectiveness of competitive products;
|
|
•
|
lack of cost-effectiveness;
|
|
•
|
adverse publicity about our product candidates or favorable publicity about competitive products;
|
|
•
|
lack of convenience and ease of administration; and
|
|
•
|
potential product liability claims.
|
If SCY-078 or any future product candidates we may seek to develop are approved, but do not achieve an adequate level of acceptance by physicians, healthcare payors and patients, sufficient revenue may not be generated from these product candidates, and we may not become or remain profitable. In addition, efforts to educate the medical community and third-party payors on the benefits of our product candidates may require significant resources and may never be successful.
A significant use of antifungal drugs consists of treatment due to the presence of symptoms before diagnosis of the invasive fungal infections, and if recently approved diagnostic tools, or additional tools currently under development, for the quick diagnosis of invasive fungal infections are broadly used in the marketplace, the number of treatments using antifungal drugs may decrease significantly, decreasing the potential market for SCY-078.
We believe that a large portion of the treatments using antifungal drugs are administered when symptoms of invasive fungal infections are present but a diagnosis of the infection has not yet been made, due to the rapid and potentially fatal progression of invasive fungal infections. Diagnostic tools recently approved by the FDA, or currently under development, for the rapid diagnosis of invasive fungal infections may significantly diminish the need to treat patients in advance of diagnosis of invasive fungal infections, which will reduce the potential market for SCY-078 in the event that we are able to obtain FDA approval of SCY-078. Moreover, if a rapid and accurate test of the susceptibility of a fungal infection to generically available treatments is developed and widely adopted, the market for SCY-078 may suffer.
36
If resistance to SCY-078 develops quickly or cross resistance with echinocandins becomes more common, our business will be harmed.
We recognize that, over time, resistance develops against every antibacterial and antifungal drug. One or more strains of fungal pathogens may develop resistance to SCY-078 more rapidly than we currently expect, either because our hypothesis of the mechanism of action is incorrect or because a strain of fungi undergoes some unforeseen genetic mutation that permits it to survive. Since we expect lower resistance relative to other antifungal drug classes to be a major factor in the commercialization of SCY-078, rapid development of such resistance or development of cross resistance with echinocandins would have a major adverse impact on the acceptability and sales of SCY-078.
If we are unable to develop a formulation of SCY-078 that is delivered by intravenous, or IV, therapy, or develop a suboptimal formulation, SCY-078 may not achieve broad market acceptance and sales will be limited.
Current treatment regimens for invasive fungal infections typically involve initial administration as an IV infusion, with a switch to an oral formulation of the same or a similar medication to complete the course of treatment on an out-patient basis. We believe that providing both the IV and oral formulations will be beneficial to doctors who prefer to start treatment of patients in a hospital setting with an IV therapy and then switch them to an oral formulation of the same medication. We currently have an oral form of SCY-078 and we are currently developing an IV formulation. If we are unable to successfully develop and achieve regulatory approval for our IV formulation of SCY-078, or are delayed in developing and obtaining regulatory approval for our IV formulation of SCY-078, our lead product candidate may not achieve, or may be delayed in achieving, broad market acceptance and sales will be limited.
Our product candidates may have undesirable side effects that may delay or prevent marketing approval, or, if approval is received, require them to be taken off the market or otherwise limit their sales.
It is impossible to predict when or if SCY-078 or any other product candidate we may seek to develop will prove effective or safe or will receive marketing approval. Unforeseen side effects from any product candidates could arise either during clinical development or, if approved, after the product has been marketed. For example, the most frequently noted adverse effects reported as associated with SCY-078 treatment in the seven Phase 1 studies of SCY-078 conducted to date were diarrhea, abdominal pain, headache, nausea, fatigue, increased orthostatic heart rate, abnormal GI sounds, vomiting and dizziness. To date there have been two serious adverse events reported in clinical trials of SCY-078: one subject was diagnosed with a metastatic carcinoid tumor which was not considered to be related to SCY-078 by the investigator; and one subject experienced significant liver function test increases which were considered to be related to SCY-078. Preclinical findings in the future could trigger the need to evaluate or monitor for specific potential safety concerns in clinical trials. The results of future clinical trials may show that SCY-078 and any future product candidates we may seek to develop cause undesirable or unacceptable side effects, which could interrupt, delay or halt clinical trials, resulting in delay of, or failure to obtain, marketing approval from the FDA and other regulatory authorities, or may lead us to abandon their development altogether.
Even if SCY-078 or any future product candidate we may seek to develop receives marketing approval, we or others may subsequently identify undesirable or unacceptable side effects caused by these products, in which case:
|
•
|
regulatory authorities may require the addition of labeling statements, specific warnings, precautions, contraindications or field alerts to physicians and pharmacies;
|
|
•
|
we may be required to change the way the product is administered, conduct additional clinical trials or change the labeling of the product;
|
|
•
|
we may have limitations on how we promote the product;
|
|
•
|
sales of the product may decrease significantly;
|
|
•
|
regulatory authorities may require us to take our approved product off the market;
|
|
•
|
we may be subject to litigation or product liability claims; and
|
|
•
|
our reputation may suffer.
|
Any of these events could prevent us or our current or potential future partners from achieving or maintaining market acceptance of the affected product or could substantially increase commercialization costs and expenses, which in turn could delay or prevent us from generating significant revenue from the sale of products.
37
We have never marketed a drug before, and if we are unable to establish an effective sales force and marketing infrastructure or enter into acceptable third-party sales and marketing or licensing arrangements, we may not be able to successfully commercialize SCY-078 and any future product candidates we may seek to develop.
We currently do not have any sales, distribution and marketing capabilities, the development of which will require substantial resources and will be time consuming. The costs incurred in the development of these capabilities, either internally or through a third-party contract sales organization, would be incurred in advance of any approval of a product candidate. In addition, we may not be able to hire a sales force in the United States that is sufficient in size or has adequate expertise in the medical markets that we intend to target. If we are unable to establish our sales force and marketing capability, our operating results may be adversely affected. In addition, we plan to enter into sales and marketing or licensing arrangements with third parties for international sales of any approved products. If we are unable to enter into or maintain any such arrangements on acceptable terms, or at all, we may be unable to market and sell SCY-078 or any future product candidates we may seek to develop in these markets.
We expect that SCY-078 and any future product candidates we may seek to develop will face competition, and most of our competitors have significantly greater resources than we do.
The pharmaceutical industry is highly competitive, with a number of established, large pharmaceutical companies, as well as many smaller companies. There are many foreign and domestic pharmaceutical companies, biotechnology companies, public and private universities, government agencies and research organizations actively engaged in research and development of products that may target the same markets as SCY-078 and any future product candidates we may seek to develop. We expect any products we develop to compete on the basis of, among other things, product efficacy, price, lack of significant adverse side effects and convenience and ease of treatment. For example, SCY-078 will compete against current leading antifungal drugs, including voriconazole from the azole class, caspofungin from the echinocandin class, and liposomal amphotericin B from the polyenes class, many of which are currently available in generic form, or expected to be available in generic form at the time SCY-078 might be approved.
Compared to us, many of our competitors in the antifungal market have, and potential competitors for any future product candidates we may seek to develop may have, substantially greater:
|
•
|
resources, including capital, personnel and technology;
|
|
•
|
research and development capability;
|
|
•
|
clinical trial expertise;
|
|
•
|
regulatory expertise;
|
|
•
|
intellectual property portfolios;
|
|
•
|
expertise in prosecution of intellectual property rights;
|
|
•
|
manufacturing and distribution expertise; and
|
|
•
|
sales and marketing expertise.
|
As a result of these factors, our competitors and potential competitors may obtain regulatory approval of their products more rapidly than we do. Our competitors and potential competitors may also develop drugs that are more effective, more widely used and less costly than ours and may also be more successful than us in manufacturing and marketing their products and maintaining compliance with ongoing regulatory compliance.
Reimbursement decisions by third-party payors may have an adverse effect on pricing and market acceptance in the United States. If there is not sufficient reimbursement for our products, it is less likely that our products will be purchased by patients and/or providers.
Successful commercialization of pharmaceutical products usually depends on the availability of adequate coverage and reimbursement from third-party payors, including commercial insurers and, under certain circumstances, federal and state healthcare programs. Patients and/or healthcare providers who purchase drugs generally rely on third-party payors to reimburse all or part of the costs associated with such products. As such, adequate coverage and reimbursement from third-party payors can be essential to new product acceptance and may have an effect on pricing.
38
Because SCY-078 is not currently commercially available, we do not know the extent to which it will be reimbursed if it is approved by the FDA. If we choose to bring other product candidates to market, they will be subject to similar uncertainty. We believe that SCY-078 and any other product candidates that are brought to market are less likely to be purchased by patients and/or providers if they are not adequately reimbursed by third-party payors.
Furthermore, the market for our product candidates may depend on access to third-party payors’ drug formularies, or lists of medications for which third-party payors provide coverage and reimbursement. Industry competition to be included in such formularies results in downward pricing pressures on pharmaceutical companies. Third-party payors may refuse to include a particular branded drug in their formularies when a competing generic product is available. The adoption of certain payment methodologies by third-party payors may limit our ability to profit from the sale of SCY-078. For example, under Medicare, hospitals are reimbursed under an inpatient prospective payment system. This pricing methodology provides a single payment amount to hospitals based on a given diagnosis-related group. As a result, with respect to Medicare reimbursement for services in the hospital inpatient setting, hospitals could have a financial incentive to use the least expensive drugs for the treatment of invasive fungal infections, particularly the IV formulations of these drugs, as they are typically administered in the hospital, which may significantly impact our ability to charge a premium for SCY-078.
All third-party payors, whether governmental or commercial, are developing increasingly sophisticated methods of controlling healthcare costs, including mechanisms to encourage the use of generic drugs. Congress has also considered policies to lower the reimbursement formulas in federal and state healthcare programs. Furthermore, coverage of, and reimbursement for, drugs can differ significantly from payor to payor and may require significant time and resources to obtain. In addition, new laws or regulations could impact future coverage and reimbursement.
Healthcare policy changes, including the Affordable Care Act, may have a material adverse effect on us.
In recent years, there have been numerous initiatives on the federal and state levels for comprehensive reforms affecting the payment for, the availability of and reimbursement for healthcare services in the United States, including pharmaceutical products. These initiatives have ranged from proposals to fundamentally change federal and state healthcare reimbursement programs, including providing comprehensive healthcare coverage to the public under governmental funded programs, to minor modifications to existing programs.
In March 2010, Congress enacted the Patient Protection and Affordable Care Act, as amended by the Health Care and Education Reconciliation Act, or the Affordable Care Act. The Affordable Care Act is designed to expand access to affordable health insurance, control healthcare spending, and improve healthcare quality. The law includes provisions to tie Medicare provider reimbursement to healthcare quality and incentives, mandatory compliance programs, enhanced transparency disclosure requirements, increased funding and initiatives to address fraud and abuse, and incentives to state Medicaid programs to expand their coverage and services. It also imposes an annual tax on pharmaceutical manufacturers or importers who sell “branded prescription drugs.” Implementation of the Affordable Care Act is occurring on an ongoing basis, and it is unclear what effect the Affordable Care Act or other state proposals may have on our business.
In addition to the Affordable Care Act, there will continue to be proposals by legislators at both the federal and state levels, regulators and third-party payors to keep drug costs down. Certain of these changes could impose limitations on the prices we will be able to charge for any products that are approved or the amounts of reimbursement available for these products from governmental agencies or third-party payors or may increase the tax requirements for life sciences companies such as ours. We anticipate that the Affordable Care Act and other future healthcare reform proposals could have a material adverse effect on our industry, and may limit our ability to commercialize SCY-078 and any future product candidates we may seek to develop and/or invest in new development.
We expect that a portion of the market for SCY-078 and any other product candidates we may seek to develop will be outside the United States. However, our product candidates may never receive approval or be commercialized outside of the United States.
Before we or any commercial partners can market and commercialize any product candidates outside of the United States, there are numerous and varying regulatory requirements of other countries that will apply. Research and marketing authorization procedures vary among countries and can involve additional product testing and administrative review periods. The marketing authorization process in other countries may include all of the risks detailed above regarding failure to obtain FDA approval in the United States as well as other risks. Regulatory approval in one country does not ensure regulatory approval in another, but a failure or delay in obtaining regulatory approval in one country, or identification of potential safety concerns in one country, may have a negative effect on the regulatory process in others. Failure to obtain regulatory approval in
39
other countries or any delay or setback in obtaining such approval could have the same adverse effects detailed above regarding FDA approval in the United States. As described above, such effects include the risks that:
|
•
|
SCY-078 and any future product candidates we may seek to develop may not generate preclinical or clinical data that are deemed sufficient by regulators in a given jurisdiction;
|
|
•
|
SCY-078 may not be approved for all indications requested, or any indications at all, in a given jurisdiction which could limit the uses of SCY-078 and any future product candidates we may seek to develop and have an adverse effect on product sales and potential royalties; and
|
|
•
|
such approval in a given jurisdiction may be subject to limitations on the indicated uses for which the product may be marketed or require costly post-marketing follow-up studies.
|
Foreign countries may have requirements for marketing authorization holders or distributors to have a legal or physical presence in that country, and consideration of and compliance with these requirements may result in additional time and expense before we can pursue or obtain marketing authorization in foreign jurisdictions. If we do receive approval in other countries, we may enter into sales and marketing arrangements with third parties for international sales of any approved products.
Even if SCY-078 or any other future product candidates we may seek to develop receive regulatory approval, we may still face future development and regulatory difficulties.
Even if regulatory approval is obtained for SCY-078 or any other future product candidates we may seek to develop, regulatory authorities may still impose significant restrictions on a product’s indicated uses or marketing or impose ongoing requirements for potentially costly post-approval studies. Given the number of high profile adverse events with certain drug products, regulatory authorities may require, as a condition of approval, costly risk evaluation and mitigation strategies, which may include safety surveillance, restricted distribution and use, patient education, enhanced labeling, expedited reporting of certain adverse events, pre-approval of promotional materials and restrictions on direct-to-consumer advertising. For example, any labeling approved for any of our product candidates may include a restriction on the term of its use, or it may not include one or more intended indications. Furthermore, any new legislation addressing drug safety issues could result in delays or increased costs during the period of product development, clinical trials and regulatory review and approval, as well as increased costs to assure compliance with any new post-approval regulatory requirements. Any of these restrictions or requirements could force us or our partners to conduct costly studies.
SCY-078 and any other future product candidates we may seek to develop will also be subject to ongoing regulatory requirements for the packaging, storage, advertising, promotion, record-keeping and submission of safety and other post-market information on the drug. In addition, approved products, manufacturers and manufacturers’ facilities are required to comply with extensive FDA requirements, including ensuring that quality control and manufacturing procedures conform to current Good Manufacturing Practices, or cGMP. As such, we and our contract manufacturers, which we will be responsible for overseeing and monitoring for compliance, are subject to continual review and periodic inspections to assess compliance with cGMP. Accordingly, we and others with whom we work must continue to expend time, money and effort in all areas of regulatory compliance, including manufacturing, production and quality control. The FDA may hold us responsible for any deficiencies or noncompliance of our contract manufacturers in relation to SCY-078 and any other future product candidates we may seek to develop. Failure to follow cGMP can result in products being deemed adulterated, which carries significant legal implications. We will also be required to engage in pharmacovigilance activities and report certain adverse reactions and production problems, if any, to the FDA and to comply with certain requirements concerning advertising and promotion for products. Promotional communications with respect to prescription drugs are subject to a variety of legal and regulatory restrictions and must be consistent with the information in the product’s approved label. As such, we may not promote products for indications or uses for which they do not have approval. Failure to comply with FDA advertising and promotion standards, which are often subject to interpretation by regulators, may result in a wide range of exposure and liability for us.
If a regulatory agency discovers previously unknown problems with a product, such as adverse events of unanticipated severity or frequency, or problems with the facility where the product is manufactured or disagrees with the promotion, marketing or labeling of a product, a regulatory agency may impose restrictions on that product or us, including requiring withdrawal of the product from the market. If the manufacturing or marketing of products fail to comply with applicable regulatory requirements, a regulatory agency may:
|
•
|
issue warning letters;
|
40
|
•
|
mandate modifications to promotional materials or require us to provide corrective information to healthcare practitioners;
|
|
•
|
require us or our partners to enter into a consent decree, which can include imposition of various fines, reimbursements for inspection costs, required due dates for specific actions and penalties for noncompliance;
|
|
•
|
impose other civil or criminal penalties;
|
|
•
|
suspend regulatory approval;
|
|
•
|
suspend any ongoing clinical trials;
|
|
•
|
refuse to approve pending applications or supplements to approved applications filed by us, our partners or our potential future partners;
|
|
•
|
impose restrictions on operations, including costly new manufacturing requirements; or
|
|
•
|
seize or detain products or require a product recall.
|
Non-compliance may also open a company to potential whistleblower lawsuits, and the potential for liability under the False Claims Act.
Pharmaceutical companies are subject to significant ongoing regulatory obligations and oversight, which may result in significant additional expense and limit our ability to commercialize our products.
We are subject to regulation by other regional, national, state and local agencies, including the Department of Justice, the Office of Inspector General of the U.S. Department of Health and Human Services and other regulatory bodies. Violations of any of the foregoing requirements could result in penalties being assessed against us.
The federal Anti-Kickback Statute prohibits, among other things, knowingly and willfully offering, paying, soliciting, or receiving remuneration to induce or in return for purchasing, leasing, ordering or arranging for the purchase, lease or order of any healthcare item or service reimbursable under Medicare, Medicaid or other federally financed healthcare programs. This statute has been interpreted to apply to arrangements between pharmaceutical companies on one hand and prescribers, purchasers and formulary managers on the other. The Affordable Care Act, among other things, clarified that a person or entity need not have actual knowledge of the federal Anti-Kickback Statute or specific intent to violate it. In addition, the Affordable Care Act amended the federal civil False Claims Act to provide that a claim that includes items or services resulting from a violation of the federal anti-kickback statute, constitutes a false or fraudulent claim for purposes of the federal civil False Claims Act. There are a number of statutory exceptions and regulatory safe harbors protecting certain common activities from prosecution or other regulatory sanctions, however, the exceptions and safe harbors are drawn narrowly, and practices that do not fit squarely within an exception or safe harbor may be subject to scrutiny.
The federal civil False Claims Act prohibits any person from knowingly presenting, or causing to be presented, claims for payment of government funds that are false or fraudulent or knowingly making, or causing to be made, a false record or statement material to a false or fraudulent claim to avoid, decrease or conceal an obligation to pay money to the federal government. Many pharmaceutical and other healthcare companies have been investigated and have reached substantial financial settlements with the federal government under these laws for a variety of alleged marketing activities, including providing free product to customers with the expectation that the customers would bill federal programs for the product; providing consulting fees, grants, free travel, and other benefits to physicians to induce them to prescribe the company’s products; and inflating prices reported to private price publication services, which are used to set drug payment rates under government healthcare programs. Companies have been prosecuted for causing false claims to be submitted because of the marketing of their products for unapproved uses. Pharmaceutical and other healthcare companies have also been prosecuted on other legal theories of Medicare and Medicaid fraud.
The majority of states also have statutes or regulations similar to the federal Anti-Kickback Statute and federal civil False Claims Act, which apply to items and services reimbursed under Medicaid and other state programs, or, in several states, apply regardless of the payor. Some of these states also prohibit certain marketing related activities including the provision of gifts, meals, or other items to certain health care providers. In addition, California, Connecticut, Nevada, and Massachusetts require pharmaceutical companies to implement compliance programs or marketing codes.
Compliance with various federal and state laws is difficult and time consuming, and companies that violate them may face substantial penalties. The potential sanctions include civil monetary penalties, exclusion of a company’s products from reimbursement under government programs, criminal fines and imprisonment. Because of the breadth of these laws and the
41
lack of extensive legal guidance in the form of regulations or court decisions, it is possible that some of our business activities or those of our commercial partners could be subject to challenge under one or more of these laws. Such a challenge could have a material adverse effect on our business and financial condition and growth prospects.
We could become subject to government investigations and related subpoenas. Such subpoenas are often associated with previously filed qui tam actions, or lawsuits filed under seal under the federal civil False Claims Act. Qui tam actions are brought by private plaintiffs suing on behalf of the federal government for alleged federal civil False Claims Act violations. The time and expense associated with responding to such subpoenas, and any related qui tam or other actions may be extensive, and we cannot predict the results of our review of the responsive documents and underlying facts or the results of such actions. Responding to government investigations, defending any claims raised, and any resulting fines, restitution, damages and penalties, settlement payments or administrative actions, as well as any related actions brought by stockholders or other third parties, could have a material impact on our reputation, business and financial condition and divert the attention of our management from operating our business.
The number and complexity of both federal and state laws continues to increase, and additional governmental resources are being added to enforce these laws and to prosecute companies and individuals who are believed to be violating them. In particular, the Affordable Care Act includes a number of provisions aimed at strengthening the government’s ability to pursue federal Anti-Kickback Statute and federal False Claims Act cases against pharmaceutical manufacturers and other healthcare entities, including substantially increased funding for healthcare fraud enforcement activities, enhanced investigative powers, and amendments to the federal False Claims Act that make it easier for the government and whistleblowers to pursue cases for alleged kickback and false claim violations. Responding to a government investigation or enforcement action would be expensive and time-consuming, and could have a material adverse effect on our business and financial condition and growth prospects.
If we fail to comply with applicable federal, state, or local regulatory requirements, we could be subject to a range of regulatory actions that could affect our ability to commercialize our products and could harm or prevent sales of any affected products that we are able to commercialize, or could substantially increase the costs and expenses of commercializing and marketing our products. Any threatened or actual government enforcement action could also generate adverse publicity and require that we devote substantial resources that could otherwise be used in other aspects of our business.
Regulations, guidelines and recommendations published by various government agencies and organizations may affect the use of SCY-078 and any future product candidates we may seek to develop.
Government agencies may issue regulations and guidelines directly applicable to us, our partners or our potential future partners and our product candidates. In addition, professional societies, practice management groups, private health/science foundations and organizations involved in various diseases from time to time publish guidelines or recommendations to the healthcare and patient communities. These various sorts of recommendations may relate to such matters as product usage, dosage, and route of administration and use of related or competing therapies. Changes to these recommendations or other guidelines advocating alternative therapies could result in decreased use of SCY-078 and any future product candidates we may seek to develop, which may adversely affect our results of operations.
Risks Relating to Our Contract Research and Development Services
We are substantially dependent on our research and development agreement with Merial for generation of our revenues.
We have a research services contract with Merial Limited, or Merial, under which we perform research and screening services for Merial. During 2014, we provided contract research and development services for Merial on a fee-for-service basis under an agreement that expired on December 31, 2014. Revenues from this contract have accounted for
38%
and 43% of our total revenues for the years ending December 31, 2014 and 2013, respectively. We signed a new agreement with Merial effective December 2014 whereby we will continue providing contract research and screening services on a fee-for-service basis. The term of this new agreement is two years, beginning January 1, 2015, and ending on December 31, 2016, and the total service fee due from Merial over the term of the agreement is $7.9 million, payable in equal quarterly installments. If this contract were to terminate prior to December 31, 2016, our ability to generate revenues prior to the commercialization of SCY-078, and the value of our contract research and development services business, would be significantly impaired. Merial may also terminate the agreement prior to December 31, 2016, under specified circumstances, including in the event of breach by us of a material obligation if such breach is not remedied after written notice from Merial, or if Merial believes in good faith that we have acted in any way that may subject Merial to liability under anti-corruption laws. Under the new agreement with
42
Merial that is effective in December 2014, any intellectual property created in connection our performance of the services shall be the sole property of Merial, which could also significantly impair our ability to generate revenue from our contract research and development services, or impair the value of our contract research and development services business, should this contract terminate.
We face potential liability and exposure as a result of the performance of our contract research and development services, and if successful claims are brought against us, we may incur substantial liability, which may exceed the revenues we have received for the performance of our contract research and development services.
To date substantially all of our revenue has been generated from the provision of our contract research and development services. In the event that a regulator asserts that we have conducted activities in a non-compliant manner or a customer asserts that we have conducted our contract research and development services negligently, or otherwise asserts that as a result of the performance of our contract research and development services for that client we have somehow harmed their business or the prospects of their product candidates, we could be subject to litigation, which could divert management’s attention from the operation of our business, including the development of SCY-078. Further, if such litigation is successful, or if we determine that we must settle the litigation, we could be forced to pay substantial damages, which could be more than the revenues that we generated from that customer, as the services that we perform are only a small portion of the development efforts of our customers. Even if we are successful in defending any such claims, we could incur substantial legal costs to do so. Further, publicity of any such litigation or claims could hurt the reputation of our ability to perform contract research and development services, which could cause revenue generated from our contract research and development services to decline. Any such litigation against us could result in substantial costs and divert our management’s attention from other business concerns, which could seriously harm our business.
Risks Related to Our Dependence on Third Parties
We are dependent on our existing third-party collaboration with R-Pharm to commercialize SCY-078 in the Russian Federation and certain other countries, and if R-Pharm is not successful in commercializing SCY-078 in those countries, we will lose a significant source of revenue.
We currently have a development license and supply agreement with R-Pharm, CJSC, or R-Pharm, a leading supplier of hospital drugs in Russia, pursuant to which we license to R-Pharm rights to develop and commercialize SCY-078 in the field of human health in Russia and certain smaller non-core markets. R-Pharm will pay us milestone payments upon the achievement of specified milestones, including registration of SCY-078 in a country and upon the achievement of specified levels of sales. In addition, R-Pharm will pay us royalties upon sales of SCY-078 by R-Pharm. We are relying on R-Pharm to commercialize SCY-078 in the countries covered by our agreement with it, and if R-Pharm is not able to commercialize SCY-078 in those countries, or determines not to pursue commercialization of SCY-078 in those countries, we will not receive any milestone or royalty payments under the agreement.
We are dependent on other third-party collaborations to develop and commercialize product candidates we have outlicensed, and if our third-party collaborators are not successful in developing and commercializing product candidates we have outlicensed, we will not receive any revenue from these collaborations.
A significant portion of our strategy is to license to third parties rights to develop and commercialize product candidates we have discovered other than SCY-078, and if these third parties do not perform under our agreements with them, we will not receive any revenue from these collaborations. For example, we currently have a license agreement with Dechra Ltd., or Dechra, pursuant to which we license to Dechra rights to develop and commercialize SCY-641 for use in animal health, and will receive royalties from Dechra on sales of SCY-641. We are relying on Dechra to commercialize SCY-641, and if Dechra is not able to commercialize SCY-641, or determines not to pursue commercialization of SCY-641, we will not receive any royalty payments under the agreement. If our third-party collaborators under this and any future agreements we enter into do not perform under these agreements, we will not receive the benefits we expect under these agreements.
We are dependent on our existing third-party collaborations in animal health to fund additional development opportunities and expect to continue to expend resources in our current collaborations, and if these collaborations fail, then we will lose a significant source of revenues.
We provide contract research and development services in the field of animal health which is a source of significant revenues to us. For example, we have an agreement with Merial, pursuant to which we provide contract research and screening services that primarily target parasites, which includes primary and secondary screening of compounds in Merial’s libraries, the development of new and proprietary screens in therapeutic indications of interest to Merial, and the support and coordination of
43
chemical syntheses services being performed by Merial’s other service providers. If we are not able to continue to perform under these services agreements, we will lose the ability to generate significant revenues.
We may not be successful in establishing and maintaining development and commercialization collaborations, which could adversely affect our ability to develop and commercialize product candidates.
Developing pharmaceutical products, conducting clinical trials, obtaining regulatory approval, establishing manufacturing capabilities and marketing approved products is expensive. Consequently, we plan to establish collaborations for development and commercialization of product candidates and research programs. For example, we currently have a development license and supply agreement with R-Pharm, pursuant to which we license to R-Pharm rights to develop and commercialize SCY-078 in the field of human health in Russia and certain smaller non-core markets, and if SCY-078 receives marketing approval, we may enter into additional sales and marketing arrangements with third parties for international sales. If we are unable to enter into any of these arrangements on acceptable terms, or at all, we may be unable to market and sell SCY-078 and any future product candidates we may seek to develop in certain markets. We expect to face competition in seeking appropriate collaborators. Moreover, collaboration arrangements are complex and time consuming to negotiate, document and implement and they may require substantial resources to maintain. We may not be successful in our efforts to establish and implement collaborations or other alternative arrangements for the development of product candidates. When we partner with a third party for development and commercialization of a product candidate, we can expect to relinquish to the third party some or all of the control over the future success of that product candidate. Our collaboration partner may not devote sufficient resources to the commercialization of product candidates or may otherwise fail in their commercialization. The terms of any collaboration or other arrangement that we establish may not be favorable to us. In addition, any collaboration that we enter into may be unsuccessful in the development and commercialization of product candidates. In some cases, we may be responsible for continuing preclinical and initial clinical development of a partnered product candidate or research program, and the payment we receive from our collaboration partner may be insufficient to cover the cost of this development. If we are unable to reach agreements with suitable collaborators for product candidates, we could face increased costs, we may be forced to limit the number of product candidates we can commercially develop or the territories in which we commercialize them and we might fail to commercialize products or programs for which a suitable collaborator cannot be found. If we fail to achieve successful collaborations, our operating results and financial condition will be materially and adversely affected.
We depend on third-party contractors for a substantial portion of our drug development activities and may not be able to control their work as effectively as if we performed these functions ourselves.
We outsource, and intend to continue to outsource, substantial portions of our drug development activities to third-party service providers, including manufacturing and the conduct of our clinical trials and various preclinical studies. Our agreements with third-party service providers and CROs are and will be on a study-by-study basis and typically short-term. In all cases, we expect to be able to terminate the agreements with notice and be responsible for the supplier’s previously incurred costs.
Because we rely on third parties, our internal capacity to perform these functions is limited. Outsourcing these functions involves risk that third parties may not perform to our standards, may not produce results in a timely manner or may fail to perform at all. Even if we outsource activities, in most cases regulators will hold us responsible for the compliance of the activities performed, and hold us responsible for oversight and monitoring of the activities. In addition, the use of third-party service providers requires us to disclose our proprietary information to these parties, which could increase the risk that this information will be misappropriated. There are a limited number of third-party service providers that have the expertise required to achieve our business objectives. Identifying, qualifying and managing performance of third-party service providers can be difficult and time consuming and could cause delays in our development programs. We currently have a small number of employees devoted to clinical development activities, which limits the internal resources we have available to identify and monitor our third-party providers. To the extent we are unable to identify, retain and successfully manage the performance of third-party service providers in the future, our business may be adversely affected.
We have no experience manufacturing product candidates on a large clinical or commercial scale. As a result, we are and will be dependent on third parties for the manufacture of SCY-078 and any future product candidates we may seek to develop, and if we experience problems with any of these third parties, the commercial manufacturing of SCY-078 and any future product candidates we may seek to develop could be delayed.
We have a small number of personnel with experience in drug product manufacturing. If SCY-078 is approved, the inability to manufacture sufficient commercial supplies of the drug product could adversely affect product commercialization. We do not currently have any agreements with third-party manufacturers for the long-term commercial supply of our product candidates, including SCY-078. We may encounter technical difficulties or delays in the transfer of SCY-078 manufacturing on
44
a commercial scale to a third-party manufacturer, or may be unable to enter into agreements for commercial supply with third-party manufacturers, or may be unable to do so on acceptable terms.
We may not be able to establish additional sources of supply for SCY-078 and any future product candidates we may seek to develop. These suppliers are subject to regulatory requirements covering manufacturing, testing, quality control and record keeping relating to product candidates and are also subject to ongoing inspections by the regulatory agencies. Failure by any of our suppliers to comply with applicable regulations may result in long delays and interruptions to our product candidate supply while we seek to secure another supplier that meets all regulatory requirements.
Reliance on third-party manufacturers entails risks to which we would not be subject if we manufactured product candidates ourselves, including:
|
•
|
the possible breach of the manufacturing agreements or violation of regulatory standards by the third parties because of factors beyond our control; and
|
|
•
|
the possibility of termination or nonrenewal of the agreements by the third parties because of our breach of the manufacturing agreement or based on their own business priorities.
|
Any of these factors could result in delays or higher costs in connection with our clinical trials, regulatory submissions, required approvals or commercialization of SCY-078 and any future product candidates we may seek to develop.
If we fail to establish or lose our relationships with CROs, our drug development efforts could be delayed.
We are substantially dependent on third-party vendors and CROs for preclinical studies and clinical trials related to our drug discovery and development efforts. If we fail to establish or lose our relationship with any one or more of these providers, we could experience a significant delay in both identifying another comparable provider and then contracting for its services, which could adversely affect our development efforts. We may be unable to retain an alternative provider on reasonable terms, or at all. Even if we locate an alternative provider, it is likely that this provider will need additional time to respond to our needs and may not provide the same type or level of services as the original provider. In addition, any contract research organization that we retain will be subject to the FDA’s regulatory requirements and similar foreign standards and we do not have control over compliance with these regulations by these providers. Consequently, if these practices and standards are not adhered to by these providers, the development and commercialization of SCY-078 and any future product candidates we may seek to develop could be delayed, which could severely harm our business and financial condition.
Risks Relating to Our Intellectual Property
We were dependent on Merck for the establishment of our intellectual property rights related to SCY-078, and if Merck did not establish our intellectual property rights with sufficient scope to protect SCY-078, we may have limited or no ability to assert intellectual property rights to SCY-078.
Under our agreement with Merck, Merck was responsible for establishing the intellectual property rights to SCY-078. As we were not responsible for the establishment of our intellectual property rights to SCY-078, we have less visibility into the strength of our intellectual property rights to SCY-078 than if we had been responsible for the establishment of these rights. If Merck did not establish those rights such that they are of sufficient scope to protect SCY-078, then we may not be able to prevent others from using or commercializing SCY-078, and others may be able to assert intellectual property rights in SCY-078 and prevent us from further pursuing the development and commercialization of SCY-078.
It is difficult and costly to protect our proprietary rights, and we may not be able to ensure their protection.
Our commercial success will depend in part on obtaining and maintaining patent protection and trade secret protection of SCY-078 and any future product candidates we may seek to develop and the methods used to manufacture them, as well as successfully defending these patents against third-party challenges. Our ability to stop third parties from making, using, selling, offering to sell or importing SCY-078 and any future product candidates we may seek to develop is dependent upon the extent to which we have rights under valid and enforceable patents or trade secrets that cover these activities.
The patent positions of pharmaceutical companies can be highly uncertain and involve complex legal and factual questions for which important legal principles remain unresolved. No absolute policy regarding the breadth of claims allowed in pharmaceutical patents has emerged to date in the United States or in many foreign jurisdictions. Changes in either the patent laws or in interpretations of patent laws in the United States and foreign jurisdictions may diminish the value of our intellectual
45
property. Accordingly, we cannot predict the breadth of claims that may be enforced in the patents that we currently own or that may be issued from the applications we have filed or may file in the future or that we have licensed or may license from third parties, including Merck for SCY-078. Further, if any patents we obtain or license are deemed invalid or unenforceable, it could impact our ability to commercialize or license our technology.
The degree of future protection for our proprietary rights is uncertain because legal means afford only limited protection and may not adequately protect our rights or permit us to gain or keep our competitive advantage. For example:
|
•
|
others may be able to make compounds that are similar to SCY-078 and any future product candidates we may seek to develop but that are not covered by the claims of our patents;
|
|
•
|
if we encounter delays in our clinical trials, the period of time during which we could market our drug candidates under patent protection would be reduced;
|
|
•
|
we might not have been the first to conceive, make or disclose the inventions covered by our patents or pending patent applications;
|
|
•
|
we might not have been the first to file patent applications for these inventions;
|
|
•
|
any patents that we obtain may be invalid or unenforceable or otherwise may not provide us with any competitive advantages; or
|
|
•
|
the patents of others may have a material adverse effect on our business.
|
Due to the patent laws of a country, or the decisions of a patent examiner in a country, or our own filing strategies, we may not obtain patent coverage for all of the product candidates that may be disclosed or methods involving these candidates that may be disclosed in the parent patent application. We plan to pursue divisional patent applications and/or continuation patent applications in the United States and many other countries to obtain claim coverage for inventions that were disclosed but not claimed in the parent patent application, but may not succeed in these efforts.
Composition of matter patents on the active pharmaceutical ingredient are generally considered to be the strongest form of intellectual property protection for pharmaceutical products, as such patents generally provide protection without regard to any method of use. We cannot be certain that the claims in our patent applications covering composition-of-matter of our drug candidates will be considered patentable by the U.S. Patent and Trademark Office, or USPTO, courts in the United States or by the patent offices and courts in foreign countries. Method of use patents protect the use of a product for the method recited in the claims. This type of patent does not prevent a competitor from making and marketing a product that is identical to our product for an indication that is outside the scope of the patented method. Moreover, even if competitors do not actively promote their product for our targeted indications, physicians may prescribe these products “off-label.” Although off-label prescriptions may infringe or contribute to or induce the infringement of method of use patents, the practice is common and such infringement is difficult to prevent or prosecute. Interference or derivation proceedings provoked by third parties or brought by the USPTO may be necessary to determine the priority of inventions with respect to our patents or patent applications or those of our collaborators or licensors. An unfavorable outcome could require us to cease using the related technology or to attempt to license rights to it from the prevailing party. Our business could be harmed if the prevailing party does not offer us a license on commercially reasonable terms. Litigation, interference or derivation proceedings may fail, resulting in harm to our business, and, even if successful, may result in substantial costs and distract our management and other employees.
There have been numerous changes to the patent laws and proposed changes to the rules of the USPTO, which may have a significant impact on our ability to protect our technology and enforce our intellectual property rights. For example, in September 2011, President Obama signed the America Invents Act that codifies several significant changes to the U.S. patent laws, including, among other things, changing from a “first to invent” to a “first inventor to file” system, limiting where a patent holder may file a patent suit, replacing interference or “first to invent” proceedings with derivation proceedings and creating inter partes review and post-grant opposition proceedings to challenge the validity of patents after they have been issued. The effects of these changes are currently unclear as the USPTO only recently has adopted regulations implementing the changes, the courts have yet to address most of these provisions, and the applicability of the act and new regulations on specific patents and patent applications discussed herein have not been determined and would need to be reviewed.
Periodic maintenance fees on any issued patent are due to be paid to the USPTO and foreign patent agencies in several stages over the lifetime of the patent. The USPTO and various foreign governmental patent agencies require compliance with a number of procedural, documentary, fee payment and other similar provisions during the patent application process. While an inadvertent lapse can in many cases be cured by payment of a late fee or by other means in accordance with the applicable
46
rules, there are situations in which noncompliance can result in abandonment or lapse of the patent or patent application, resulting in partial or complete loss of patent rights in the relevant jurisdiction. Noncompliance events that could result in abandonment or lapse of a patent or patent application include, but are not limited to, failure to respond to official actions within prescribed time limits, non-payment of fees and failure to properly legalize and submit formal documents. In such an event, our competitors might be able to enter the market in the relevant country or region, which could have a material adverse effect on our business.
We also rely on trade secrets to protect our technology, especially where we do not believe patent protection is appropriate or obtainable. However, trade secrets are difficult to protect. Although we use reasonable efforts to protect our trade secrets, our employees, consultants, contractors, licensees, licensors, outside scientific collaborators and other advisors may unintentionally or willfully disclose our information such that our competitors may obtain it. Enforcing a claim that a third party illegally obtained and is using any of our trade secrets is expensive and time consuming, and the outcome is unpredictable. Moreover, our competitors may independently develop equivalent knowledge, methods and know-how, such as new therapies, including therapies for the indications we are targeting. If others seek to develop similar therapies, their research and development efforts may inhibit our ability to conduct research in certain areas and to expand our intellectual property portfolio, and also have a material adverse effect on our business.
We may incur substantial costs as a result of litigation or other proceedings relating to patent and other intellectual property rights and we may be unable to enforce or protect our rights to, or use, our technology.
If we choose to go to court to stop another party from using the inventions claimed in any patents we obtain, that individual or company has the right to ask the court to rule that such patents are invalid or should not be enforced. These lawsuits are expensive and would consume time and resources and divert the attention of managerial and scientific personnel even if we were successful in stopping the infringement of such patents or sustaining their validity and enforceability. In addition, there is a risk that the court will decide that such patents are not valid or that we do not have the right to enforce them. There is also the risk that, even if the validity of such patents is upheld, the court will refuse to stop the other party on the grounds that such other party’s activities do not infringe such patents. In addition, the United States Court of Appeals for the Federal Circuit and the Supreme Court of the United States continue to address issues under the United States patent laws, and the decisions of those and other courts could adversely affect our ability to sustain the validity of our issued or licensed patents and obtain new patents.
Furthermore, a third party may claim that we or our manufacturing or commercialization partners or customers are using inventions covered by the third party’s patent rights and may go to court to stop us or our partners and/or customers from engaging in our operations and activities, including making or selling SCY-078 and any future product candidates we may seek to develop. These lawsuits are costly and could affect our results of operations and divert the attention of managerial and scientific personnel. There is a risk that a court would decide that we or our commercialization partners or customers are infringing the third party’s patents and would order us or our partners or customers to stop the activities covered by the patents. In that event, we or our commercialization partners or customers may not have a viable way around the patent and may need to halt commercialization or use of the relevant product. In addition, there is a risk that a court will order us or our partners or customers to pay the other party damages for having violated the other party’s patents or obtain one or more licenses from third parties, which may be impossible or require substantial time and expense. We cannot predict whether any license would be available at all or whether it would be available on commercially reasonable terms. Furthermore, even in the absence of litigation, we may need to obtain licenses from third parties to advance our research or allow commercialization of our drug candidates, and we have done so from time to time. We may fail to obtain any of these licenses at a reasonable cost or on reasonable terms, if at all. In such events, we would be unable to further develop and commercialize one or more of our drug candidates, which could harm our business significantly. In the future, we may agree to indemnify our commercial partners and/or customers against certain intellectual property infringement claims brought by third parties which could increase our financial expense, increase our involvement in litigation and/or otherwise materially adversely affect our business.
Because of the substantial amount of discovery required in connection with intellectual property litigation, there is a risk that some of our confidential information could be compromised by disclosure during this type of litigation, which could adversely affect our intellectual property rights and our business. In addition, there could be public announcements of the results of hearings, motions or other interim proceedings or developments. If securities analysts or investors perceive these results to be negative, it could have a substantial adverse effect on the price of our common stock.
The pharmaceutical and biotechnology industries have produced a proliferation of patents, and it is not always clear to industry participants, including us, which patents cover various types of products or methods of use. The coverage of patents is subject to interpretation by the courts, and the interpretation is not always uniform. For example, we are aware of the existence of other patents relating to the treatment of Hepatitis C Virus which, if the compositions or methods claimed in the patents we
47
assigned to Waterstone are practiced and determined to infringe, may limit Waterstone’s ability to fully commercialize SCY-635 and, as a result, may limit potential milestone and royalty payments due to us from Waterstone upon commercialization of SCY-635. If we are sued for patent infringement, we would need to demonstrate that our products or methods either do not infringe the patent claims of the relevant patent or that the patent claims are invalid or unenforceable, and we may not be able to do this. Proving invalidity or unenforceability is difficult. For example, in the United States, proving invalidity requires a showing of clear and convincing evidence to overcome the presumption of validity enjoyed by issued patents.
Because some patent applications in the United States may be maintained in secrecy until the patents are issued, because patent applications in the United States and many foreign jurisdictions are typically not published until eighteen months after filing, because searches and examinations of patent applications by the USPTO and other patent offices may not be comprehensive, and because publications in the scientific literature often lag behind actual discoveries, we cannot be certain that others have not filed patent applications for technology covered by our patents or pending applications. Our competitors may have filed, and may in the future file, patent applications and may have obtained patents covering technology similar to ours. Any such patents or patent application may have priority over our patent applications, which could further require us to obtain or license rights to issued patents covering such technologies. If another party has obtained a U.S. patent or filed a U.S. patent application on inventions similar to ours, we may have to participate in a proceeding before the USPTO or in the courts to determine which patent or application has priority. The costs of these proceedings could be substantial, and it is possible that our application or patent could be determined not to have priority, which could adversely affect our intellectual property rights and business.
We have received confidential and proprietary information from collaborators, prospective licensees and other third parties. In addition, we employ individuals who were previously employed at other biotechnology or pharmaceutical companies. We may be subject to claims that we or our employees, consultants or independent contractors have improperly used or disclosed confidential information of these third parties or our employees’ former employers. Litigation may be necessary to defend against these claims. Even if we are successful in defending against these claims, litigation could result in substantial cost and be a distraction to our management and employees. If we are not successful, our ability to continue our operations and our business could be materially, adversely affected.
Some of our competitors may be able to sustain the costs of complex intellectual property litigation more effectively than we can because they have substantially greater resources. In addition, any uncertainties resulting from the initiation and continuation of any litigation could have a material adverse effect on our ability to raise the funds necessary to continue our operations, on our ability to hire or retain employees, or otherwise on our business.
Risks Related to Employee Matters and Managing Growth
We may not be able to manage our business effectively if we are unable to attract and retain key personnel.
We may not be able to attract or retain qualified management, finance, scientific and clinical personnel in the future due to the intense competition for qualified personnel among biotechnology, pharmaceutical and other businesses, particularly in the Research Triangle Park area in North Carolina, where we have our offices and research facilities. Stock-based awards are critical to our ability to recruit, retain and motivate highly skilled talent. However, the trading price of our common stock as listed on the NASDAQ Global Market has traded at or below the exercise price of a significant portion of the stock options currently held by our executive officers and key employees. This may reduce the retention value of these options and we may need to grant additional stock options, make further amendments to the terms of existing option awards, or provide alternative compensation and retention programs to continue to retain our employees, especially our key employees and executive officers. If we are not able to attract and retain necessary personnel to accomplish our business objectives, we may experience constraints that will significantly impede the achievement of our development objectives, our ability to raise additional capital and our ability to implement our business strategy. Recently our Chief Medical Officer has terminated services with us and Yves Ribeill, who has served as our President and Chief Executive Officer since 1999, has agreed to step down from the position of Chief Executive Officer. If we are unable to replace or retain our executive officers and key employees our ability to implement our business strategy successfully could be seriously harmed.
We may need to expand our operations and increase the size of our company, and we may experience difficulties in managing growth.
As we advance SCY-078 through preclinical studies, clinical trials and commercialization, we will need to increase our product development, scientific, marketing, sales and administrative headcount to manage these efforts. Our management,
48
personnel and systems currently in place may not be adequate to support this future growth. Our need to effectively manage our operations, growth and various projects requires that we:
|
•
|
successfully attract and recruit new employees with the expertise and experience we will require;
|
|
•
|
manage our clinical programs effectively, which we anticipate being conducted at numerous clinical sites;
|
|
•
|
develop a marketing and sales infrastructure; and
|
|
•
|
continue to develop our operational, financial and management controls, reporting systems and procedures.
|
If we are unable to successfully manage this growth, our business may be adversely affected.
Other Risks Relating to Our Business
We face potential product liability exposure, and if successful claims are brought against us, we may incur substantial liability for a product candidate and may have to limit its commercialization.
The use of product candidates in clinical trials and the sale of any products for which we may obtain marketing approval expose us to the risk of product liability claims. Product liability claims may be brought against us or our partners by participants enrolled in our clinical trials, patients, healthcare providers or others using, administering or selling products. If we cannot successfully defend ourselves against any such claims, we would incur substantial liabilities. Regardless of merit or eventual outcome, product liability claims may result in:
|
•
|
withdrawal of clinical trial participants;
|
|
•
|
termination of clinical trial sites or entire trial programs;
|
|
•
|
costs of related litigation;
|
|
•
|
substantial monetary awards to patients or other claimants;
|
|
•
|
decreased demand for product candidates and loss of revenue;
|
|
•
|
impairment of our business reputation;
|
|
•
|
diversion of management and scientific resources from our business operations; and
|
|
•
|
the inability to commercialize product candidates.
|
We have obtained limited product liability insurance coverage for our clinical trials domestically and in selected foreign countries where we are conducting clinical trials. Our coverage is currently limited to $5.0 million per occurrence and $5.0 million in the aggregate per year, as well as additional local country product liability coverage for trials conducted outside of the United States as required by the local country regulations. As such, our insurance coverage may not reimburse us or may not be sufficient to reimburse us for any expenses or losses we may suffer. Moreover, insurance coverage is becoming increasingly expensive and, in the future, we may not be able to maintain insurance coverage at a reasonable cost or in sufficient amounts to protect us against losses due to product liability. We intend to expand our insurance coverage for products to include the sale of commercial products if we obtain marketing approval for product candidates, but we may be unable to obtain commercially reasonable product liability insurance for any products approved for marketing. Large judgments have been awarded in class action lawsuits based on drugs that had unanticipated side effects. A successful product liability claim or series of claims brought against us, particularly if judgments exceed our insurance coverage, could decrease our cash necessary to develop SCY-078 and any future product candidates we may seek to develop and adversely affect our business.
Our internal computer systems, or those used by our contract research organizations or other contractors or consultants, may fail or suffer security breaches.
Despite the implementation of security measures, our internal computer systems and those of our contract research organizations and other contractors and consultants are vulnerable to damage from computer viruses, unauthorized access, natural disasters, terrorism, war and telecommunication and electrical failures. While we have not experienced any such system failure, accident or security breach to date, if such an event were to occur and cause interruptions in our operations, it could result in a material disruption of our product candidate development programs. For example, the loss of clinical study data from
49
completed or ongoing clinical studies for a product candidate could result in delays in our regulatory approval efforts and significantly increase our costs to recover or reproduce the data. To the extent that any disruption or security breach was to result in a loss of or damage to our data or applications, or inappropriate disclosure of confidential or proprietary information, we could incur liability and the further development of any product candidates could be delayed.
Our operations involve hazardous materials, which could subject us to significant liabilities.
Our research and development processes involve the controlled use of hazardous materials, including chemicals. Our operations produce hazardous waste products. We cannot eliminate the risk of accidental contamination or discharge or injury from these materials. Federal, state and local laws and regulations govern the use, manufacture, storage, handling and disposal of these materials. We could be subject to civil damages in the event of exposure of individuals to hazardous materials. In addition, claimants may sue us for injury or contamination that results from our use of these materials and our liability may exceed our total assets. We have general liability insurance coverage of up to $1.0 million per occurrence, with an annual aggregate limit of $2.0 million, which excludes pollution liability. This coverage may not be adequate to cover all claims related to our biological or hazardous materials. Furthermore, if we were to be held liable for a claim involving our biological or hazardous materials, this liability could exceed our insurance coverage, if any, and our other financial resources. Compliance with environmental and other laws and regulations may be expensive and current or future regulations may impair our research, development or production efforts. In addition, failure to comply with these laws and regulations also may result in substantial fines, penalties or other sanctions.
Our insurance policies are expensive and protect us only from some business risks, which will leave us exposed to significant uninsured liabilities.
We do not carry insurance for all categories of risk that our business may encounter. Some of the policies we currently maintain include general liability, employment practices liability, property, auto, workers’ compensation, products liability and directors’ and officers’ insurance. We do not know, however, if we will be able to maintain existing insurance with adequate levels of coverage. Any significant uninsured liability may require us to pay substantial amounts, which would adversely affect our cash position and results of operations.
Our research and development activities could be affected or delayed as a result of possible restrictions on animal testing.
Certain laws and regulations require us to test our product candidates on animals before initiating clinical trials involving humans. Animal testing activities have been the subject of controversy and adverse publicity. Animal rights groups and other organizations and individuals have attempted to stop animal testing activities by pressing for legislation and regulation in these areas and by disrupting these activities through protests and other means. To the extent the activities of these groups are successful, our research and development activities may be interrupted, delayed or become more expensive.
Risks Relating to Owning Our Common Stock
The market price of our common stock may be highly volatile.
The trading price of our common stock may be volatile. The following factors, in addition to other factors described in this “Risk Factors” section and elsewhere in this annual report, may have a significant impact on the market price of our common stock:
|
•
|
the results of our preclinical testing or clinical trials;
|
|
•
|
the ability to obtain additional funding;
|
|
•
|
any delay in filing an NDA or similar foreign applications for SCY-078 and any future product candidate we may seek to develop or any adverse development or perceived adverse development with respect to the FDA’s review of that NDA or a foreign regulator’s review of a similar applications;
|
|
•
|
maintenance of our existing collaborations or ability to enter into new collaborations;
|
|
•
|
our collaboration partners’ election to develop or commercialize product candidates under our collaboration agreements or the termination of any programs under our collaboration agreements;
|
|
•
|
any intellectual property infringement actions in which we or our licensors and collaboration partners may become involved;
|
|
•
|
our ability to successfully develop and commercialize future product candidates;
|
50
|
•
|
changes in laws or regulations applicable to future products;
|
|
•
|
adverse regulatory decisions;
|
|
•
|
introduction of new products, services or technologies by our competitors;
|
|
•
|
achievement of financial projections we may provide to the public;
|
|
•
|
achievement of the estimates and projections of the investment community;
|
|
•
|
the perception of the pharmaceutical industry by the public, legislatures, regulators and the investment community;
|
|
•
|
announcements of significant acquisitions, strategic partnerships, joint ventures or capital commitments by us, our collaboration partners or our competitors;
|
|
•
|
disputes or other developments relating to proprietary rights, including patents, litigation matters and our ability to obtain patent protection for our technologies;
|
|
•
|
legislation or regulation that mandates or encourages the use of generic products;
|
|
•
|
additions or departures of key scientific or management personnel;
|
|
•
|
significant lawsuits, including patent or stockholder litigation;
|
|
•
|
changes in the market valuations of similar companies;
|
|
•
|
general economic and market conditions and overall fluctuations in the U.S. equity markets;
|
|
•
|
sales of our common stock by us, our executive officers and directors or our stockholders in the future; and
|
|
•
|
trading volume of our common stock.
|
In addition, companies trading in the stock market in general, and the NASDAQ Global Market in particular, have experienced extreme price and volume fluctuations that have often been unrelated or disproportionate to the operating performance of these companies. Broad market and industry factors may negatively affect the market price of our common stock, regardless of our actual operating performance.
Our executive officers, directors and principal stockholders own a significant percentage of our stock and will be able to exert significant control over matters submitted to our stockholders for approval.
As of March 1, 2015, our executive officers, directors and stockholders who own more than 5% of our outstanding common stock, together own shares representing approximately
66%
of our common stock. Therefore, these stockholders will have the ability to influence us through this ownership position. These stockholders may be able to influence matters requiring stockholder approval. For example, these stockholders, acting together, may be able to control elections of directors, amendments to our organizational documents, or approval of any merger, sale of assets, or other major corporate action. This may prevent or discourage unsolicited acquisition proposals or offers for our common stock that you may believe are in your best interest as one of our stockholders.
We may identify material weaknesses in our internal controls over financial reporting.
Maintaining effective internal controls over financial reporting is necessary for us to produce accurate financial statements on a timely basis. We have previously identified material weaknesses in our internal control over financial reporting and may again identify material weaknesses in the future. Our previously identified material weaknesses were remediated as of December 31, 2014, through the design and implementation of new procedures and controls. Our remediation efforts progressed throughout the 2014 fiscal year, starting with the hiring of a director of SEC reporting in the second quarter of 2014, who supported management to design, implement, execute, and monitor new and improved accounting systems, policies, processes and internal controls over financial reporting. In the third and fourth quarters of 2014, we designed and implemented certain additional control activities that, when operating in conjunction with our previously existing control activities, we believe effectively mitigate risks of material misstatement in certain accounting and disclosure identification processes. Management continues to devote significant time, attention, and resources to maintaining and improving our internal controls. We expect to continue to incur costs associated with implementing appropriate processes and internal controls, which could include new employee compensation costs and fees for additional audit and consulting services, which could negatively affect our financial condition and operating results.
The requirements associated with being a public company will require significant company resources and management attention.
We have recently completed our IPO and have become subject to the reporting requirements of the Securities Exchange Act of 1934, as amended, or the Exchange Act, the Sarbanes-Oxley Act of 2002, or the Sarbanes-Oxley Act, the listing requirements of the NASDAQ Global Market and other applicable securities rules and regulations. The Exchange Act requires
51
that we file annual, quarterly and current reports with respect to our business and financial condition and maintain effective disclosure controls and procedures and internal control over financial reporting. In addition, subsequent rules implemented by the SEC and the NASDAQ Stock Market may also impose various additional requirements on public companies. As a result, we will incur additional legal, accounting and other expenses that we did not incur as a nonpublic company, particularly after we are no longer an “emerging growth company” as defined in the JOBS Act. Further, the need to establish the corporate infrastructure demanded of a public company may divert management’s attention from implementing our growth strategy. We have made, and will continue to make, changes to our corporate governance standards, disclosure controls and financial reporting and accounting systems to meet our reporting obligations. However, the measures we take may not be sufficient to satisfy our obligations as a public company, which could subject us to delisting of our common stock, fines, sanctions and other regulatory action and potentially civil litigation.
Section 404(a) of the Sarbanes-Oxley Act requires annual management assessments of the effectiveness of our internal control over financial reporting, starting with the second annual report that we would expect to file with the SEC, and we are required to disclose material changes made in our internal controls and procedures on a quarterly basis. Company responsibilities required by the Sarbanes-Oxley Act include establishing corporate oversight and adequate internal control over financial reporting and disclosure controls and procedures. Effective internal controls are necessary for us to produce reliable financial reports and are important to help prevent financial fraud. However, our independent registered public accounting firm will not be required to attest to the effectiveness of our internal control over financial reporting pursuant to Section 404(b) of the Sarbanes-Oxley Act until the later of the year following our first annual report required to be filed with the SEC or the date we are no longer an “emerging growth company” as defined in the JOBS Act, because we are taking advantage of the exemptions contained in the JOBS Act.
To build the infrastructure to allow us to assess the effectiveness of our internal control over financial reporting, we hired our director of SEC reporting in the second quarter of 2014 to assist us in improving our accounting systems, disclosure policies, procedures and controls, which will be costly and time consuming. In the third and fourth quarters of 2014, we designed and implemented certain additional control activities that, when operating in conjunction with our previously existing control activities, we believe effectively mitigate risks of material misstatement in certain accounting and disclosure identification processes. We believe our previously identified material weaknesses were remediated as of December 31, 2014 through the design and implementation of new procedures and controls. If we are unsuccessful in maintaining an appropriate accounting infrastructure, we may not be able to prepare and disclose, in a timely manner, our financial statements and other required disclosures, or comply with existing or new reporting requirements.
If we identify one or more material weaknesses in our internal control over financial reporting, we will be unable to assert that our internal control over financial reporting is effective. We cannot assure you that there will not be material weaknesses in our internal control over financial reporting in the future. Any failure to maintain internal control over financial reporting could severely inhibit our ability to accurately report our financial condition, results of operations or cash flows. If we are unable to achieve effective internal control over financial reporting, or if our independent registered public accounting firm determines we have a material weakness in our internal control over financial reporting, we could lose investor confidence in the accuracy and completeness of our financial reports, the market price of our common stock could decline, and we could be subject to sanctions or investigations by the NASDAQ Stock Market, the SEC or other regulatory authorities. Failure to remedy any material weakness in our internal control over financial reporting, or to implement or maintain other effective control systems required of public companies, could also restrict our future access to the capital markets.
The recently enacted JOBS Act will allow us to postpone the date by which we must comply with some of the laws and regulations intended to protect investors and to reduce the amount of information we provide in our reports filed with the SEC, which could undermine investor confidence in our company and adversely affect the market price of our common stock.
For so long as we remain an “emerging growth company” as defined in the JOBS Act, we may take advantage of certain exemptions from various requirements that are applicable to public companies that are not “emerging growth companies” including:
|
•
|
the provisions of Section 404(b) of the Sarbanes-Oxley Act requiring that our independent registered public accounting firm provide an attestation report on the effectiveness of our internal control over financial reporting;
|
|
•
|
the obligation to provide three years of audited financial statements;
|
|
•
|
the “say on pay” provisions, requiring a non-binding stockholder vote to approve compensation of certain executive officers, and the “say on golden parachute” provisions, requiring a non-binding stockholder vote to
|
52
approve golden parachute arrangements for certain executive officers in connection with mergers and certain other business combinations, of the Dodd-Frank Act and some of the disclosure requirements of the Dodd-Frank Act relating to compensation of our chief executive officer;
|
•
|
the requirement to provide detailed compensation discussion and analysis in proxy statements and reports filed under the Exchange Act, and instead provide a reduced level of disclosure concerning executive compensation; and
|
|
•
|
any rules that may be adopted by the Public Company Accounting Oversight Board requiring mandatory audit firm rotation or a supplement to the auditor’s report on the financial statements.
|
We currently intend to take advantage of some of the reduced regulatory and reporting requirements that will be available to us under the JOBS Act so long as we qualify as an “emerging growth company.”
Future sales and issuances of our common stock or rights to purchase common stock could result in additional dilution of the percentage ownership of our stockholders and could cause our stock price to fall.
We expect that significant additional capital will be needed in the future to continue our planned operations. To the extent we raise additional capital by issuing equity securities, our stockholders may experience substantial dilution. We may sell common stock, convertible securities or other equity securities in one or more transactions at prices and in a manner we determine from time to time. These sales may also result in new investors gaining rights superior to our existing stockholders.
Because we do not intend to declare cash dividends on our shares of common stock in the foreseeable future, stockholders must rely on appreciation of the value of our common stock for any return on their investment.
We currently anticipate that we will retain future earnings for the development, operation and expansion of our business and do not anticipate declaring or paying any cash dividends in the future. As a result, we expect that only appreciation of the price of our common stock, if any, will provide a return to our investors for the foreseeable future. Investors seeking cash dividends should not invest in our common stock.
If securities or industry analysts do not publish or cease publishing research or reports about us, our business or our market, or if they change their recommendations regarding our common stock adversely, the price of our common stock and trading volume could decline.
The trading market for our common stock will be influenced by the research and reports that securities or industry analysts may publish about us, our business, our market or our competitors. If any of the analysts who may cover us change their recommendation regarding our common stock adversely, or provide more favorable relative recommendations about our competitors, the price of our common stock would likely decline. If any analyst who may cover us were to cease coverage of our company or fail to regularly publish reports on us, we could lose visibility in the financial markets, which in turn could cause the price of our common stock or trading volume to decline.
We may be subject to securities litigation, which is expensive and could divert management attention.
Our share price may be volatile, and in the past, companies that have experienced volatility in the market price of their stock have been subject to securities class action litigation. We may be the target of this type of litigation in the future. Litigation of this type could result in substantial costs and diversion of management’s attention and resources, which could seriously harm our business. Any adverse determination in litigation could also subject us to significant liabilities.
Anti-takeover provisions in our charter documents and under Delaware law could make an acquisition of us, which may be beneficial to our stockholders, more difficult and may prevent attempts by our stockholders to replace or remove our current management.
Provisions in our amended and restated certificate of incorporation and our bylaws may delay or prevent an acquisition of us, including the ability of our board of directors to establish new series of preferred stock and issue shares of these new series, which could be used by our board of directors to oppose a hostile takeover attempt, which some stockholders may believe would be in the best interests of stockholders. In addition, these provisions may frustrate or prevent any attempts by our stockholders to replace or remove our current management by making it more difficult for stockholders to replace members of our board of directors, which is responsible for appointing the members of our management, including the elimination of cumulative voting, inability of our stockholders to call special meetings or take action by written consent, ability of our board of directors to fill board vacancies, and ability of our board of directors to determine the size of the board of directors. In
53
addition, we are subject to Section 203 of the Delaware General Corporation Law, which generally prohibits stockholders owning in excess of 15% of our outstanding voting stock from merging or combining with us. Finally, our charter documents establish advance notice requirements for nominations for election to our board of directors and for proposing matters that can be acted upon at stockholder meetings. Although we believe these provisions together provide for an opportunity to receive higher bids by requiring potential acquirers to negotiate with our board of directors, they would apply even if the offer may be considered beneficial by some stockholders.
|
ITEM 1B.
|
UNRESOLVED STAFF COMMENTS
|
None.
|
ITEM 2.
|
PROPERTIES
|
Our corporate headquarters are located at 3501 C Tricenter Boulevard, Suite 340, Durham, North Carolina 27713 in a leased facility consisting of approximately 90,000 square feet of office space. The lease for this facility expires in March 2019, and includes a renewal option to extend the lease through March 2024.
|
ITEM 3.
|
LEGAL PROCEEDINGS
|
None.
|
ITEM 4.
|
MINE SAFETY DISCLOSURES
|
Not applicable.
|
ITEM 5.
|
MARKET FOR REGISTRANT'S COMMON EQUITY, RELATED STOCKHOLDER MATTERS AND ISSUER PURCHASES OF EQUITY SECURITIES
|
Market Information
Our common stock began trading on the NASDAQ Global Market on May 2, 2014 under the symbol “SCYX.” Prior to such time, there was no public market for our common stock. The following table sets forth the high and low sales prices per share of our common stock as reported on the NASDAQ Global Market for the periods indicated. Such quotations represent inter-dealer prices without retail markup, markdown or commission and may not necessarily represent actual transactions.
|
Year Ended December 31, 2014
|
High
|
Low
|
||||||
|
Second Quarter (beginning May 2, 2014)
|
$
|
9.89
|
|
$
|
7.78
|
|
||
|
Third Quarter
|
$
|
8.34
|
|
$
|
5.10
|
|
||
|
Fourth Quarter
|
$
|
11.98
|
|
$
|
5.70
|
|
||
Stockholders
As of March 1, 2015, there were approximately 127 stockholders of record of our common stock, which excludes stockholders whose shares were held in nominee or street name by brokers. The actual number of common stockholders is greater than the number of record holders, and includes stockholders who are beneficial owners, but whose shares are held in street name by brokers and other nominees. This number of holders of record also does not include stockholders whose shares may be held in trust by other entities.
Dividend Policy
We have never declared or paid any cash dividends on our common stock. We currently intend to retain all available funds and any future earnings to support our operations and finance the growth and development of our business. We do not intend to pay cash dividends on our common stock for the foreseeable future. Any future determination related to our dividend policy will be made at the discretion of our board of directors and will depend upon, among other factors, our results of operations, financial condition, capital requirements, contractual restrictions, business prospects and other factors our board of directors may deem relevant.
Use of Proceeds
54
On May 2, 2014, our registration statement on Form S-1 (File No. 333-194192) was declared effective for our initial public offering of 6,200,000 shares of our common stock at a price of $10.00 per share for aggregate gross proceeds of $62.0 million to us. As a result of our IPO, which closed on May 7, 2014, we received net proceeds of approximately $54.6 after deducting underwriting discounts and commissions of $3.3 million and offering expenses payable by us of $4.1 million. RBC Capital Markets, LLC, and Canaccord Genuity Inc. acted as managing underwriters in the IPO.
There has been no material change in the planned use of proceeds from our initial public offering as described in our prospectus effective May 2, 2014, filed with the SEC pursuant to Rule 424(b) of the Securities Act. Through
December 31, 2014
,
$22.3 million
of the net proceeds had been used for the purposes set forth in our prospectus, including $15.0 million to pay off the balance and all accrued interest on our credit facility with HSBC Bank on May 7, 2014, and
$7.3 million
for the development of our lead product candidate SCY-078 and to fund working capital, capital expenditures and other general corporate purposes.
Recent Sales of Unregistered Securities
None.
Purchases of Equity Securities by the Issuer and Affiliated Purchasers
We did not purchase any of our registered securities during the period covered by this Annual Report.
|
ITEM 6.
|
SELECTED FINANCIAL DATA
|
As a Smaller Reporting Company, we are not required to provide the disclosure required by this Item.
|
ITEM 7.
|
MANAGEMENT'S DISCUSSION AND ANALYSIS OF FINANCIAL CONDITION AND RESULTS OF OPERATIONS
|
Operating results for the year ended
December 31, 2014
, are not necessarily indicative of results that may occur in future interim periods or future fiscal years. Some of the statements under in this “Management’s Discussion and Analysis of Financial Condition and Results of Operations” are forward-looking statements. These forward-looking statements are based on management’s beliefs and assumptions and on information currently available to our management and involve significant elements of subjective judgment and analysis. Words such as “expects,” “will,” “anticipates,” “targets,” “goals,” “projects,” “intends,” “plans,” “believes,” “seeks,” “estimates,” “potential,” “should,” “could,” variations of such words, and similar expressions are intended to identify forward-looking statements. Our actual results and the timing of events may differ significantly from the results discussed in the forward-looking statements. Factors that might cause such a difference include those discussed under the caption “Special Note Regarding Forward Looking Statements” and in “Risk Factors” and elsewhere in this Annual Report on Form 10-K. These and many other factors could affect our future financial and operating results. We undertake no obligation to update any forward-looking statement to reflect events after the date of this Annual Report.
Overview
We are a pharmaceutical company committed to the discovery, development and commercialization of novel anti-infectives to address significant unmet therapeutic needs. We are developing our lead product candidate, SCY-078, as a novel oral and intravenous (IV) drug for the treatment of serious and life-threatening invasive fungal infections in humans. SCY-078 has been shown to be effective
in vitro
and
in vivo
in animal models against a broad range of
Candida
and
Aspergillus
species, including drug resistant strains. These important pathogens account for approximately 85% of invasive fungal infections in the United States and Europe. SCY-078 was shown to be sufficiently safe and well-tolerated in multiple Phase 1 studies to support progression to Phase 2 studies. We have opened multiple trial sites, are actively screening patients, and recently enrolled the first patient in March 2015 in a Phase 2 study with the oral formulation of SCY-078 for the treatment of invasive
Candida
infection, a common and often fatal invasive fungal infection. We anticipate beginning Phase 1 studies with an IV formulation of SCY-078 in the second half of 2015. In addition to pursuing the development of SCY-078, we have additional compounds similar to SCY-078 and related expertise that we may use to expand our antifungal portfolio.
As a spinout from Aventis S.A., or Aventis in 2000, we began as a chemistry and animal health services company, providing contract research services to third parties. Through the provision of these contract research and development services, we built significant expertise in parasitic infections and drug discovery. Since our formation, we have expanded our animal health capabilities and have discovered a number of proprietary compounds primarily within our cyclophilin inhibitor platform.
55
Our two lead compounds from our cyclophilin inhibitor platform include SCY-641, a compound licensed to Dechra Ltd. in 2012 for clinical development for the treatment of dog dry eye, and SCY-635, a compound licensed to Waterstone in October 2014 for the treatment of viral diseases in humans. The successful monetization of these two lead compounds from our cyclophilin inhibitor platform will allow us to focus our resources on the development of SCY-078.
In 2013, we exclusively licensed SCY-078 from Merck Sharp & Dohme, or Merck, in the field of human health, and Merck transferred to us the investigational new drug application on file with the U.S. Food and Drug Administration, or the FDA, as well as all data Merck had developed for the compound, plus active pharmaceutical ingredient and tablets. In 2014, Merck assigned the patents to us related to SCY-078 that it had exclusively licensed to us. We are focusing our resources on the development of SCY-078.
On May 7, 2014, we completed an initial public offering of our common stock, which we refer to as our IPO. We sold an aggregate of 6,200,000 shares of common stock under the registration statement on Form S-1 declared effective by the SEC on May 2, 2014, at a public offering price of $10.00 per share. Net proceeds to us were $54.6 million, after deducting underwriting discounts and commissions and offering expenses. Upon the completion of our IPO, all our outstanding shares of convertible preferred stock were automatically converted into 1,691,884 shares of common stock and substantially all outstanding common stock warrants were exercised for an additional 275,687 shares of common stock with net proceeds to us of $0.1 million. In connection with the consummation of the IPO, we repaid outstanding debt with a principal balance of $15 million, plus all accrued interest, to the holder of such debt, which was outstanding pursuant to a credit agreement referred to herein as the 2013 Credit Agreement.
We are an emerging growth company. Under the Jumpstart Our Business Startups Act of 2012, or JOBS Act, emerging growth companies can delay adopting new or revised accounting standards until such time of those standards apply to private companies. We have irrevocably elected not to adopt this exemption from new or revised accounting standards, and therefore, we will be subject to the same new or revised accounting standards as other public companies that are not “emerging growth companies.”
Recent Developments
SCY-078 Development
We are currently conducting a randomized Phase 2 study with the oral formulation of SCY-078. We have opened multiple trial sites, we are actively screening patients for enrollment, and we enrolled the first patient in March 2015. We amended the study protocol's enrollment criteria in February 2015 in order to enhance and expedite recruitment and we are currently preparing further enhancements to the study's protocol. We believe that these changes to enrollment criteria will improve the Phase 2 study's overall progress without affecting the interpretability of the study. We expect to report complete data from the Phase 2 study in the first half of 2016.
We are also currently developing an IV formulation of SCY-078. IND enabling studies for the IV formulation of SCY-078 are currently underway. We plan to complete 14 day GLP toxicity studies and file an IND to support a first in man study of the IV formulation planned to begin in the second half of 2015.
The FDA granted fast track designation to the oral formulation of SCY-078 in December 2014. This fast track designation, coupled with our prior receipt of QIDP designation, allows for a potentially accelerated path to approval and underscores the FDA's understanding of the critical need for new and varied treatments for life-threatening invasive fungal infections. We expect to submit QIDP and fast track designation requests for the IV formulation of SCY-078 in 2015.
The development efforts summarized above are being performed by our own personnel, CROs, vendors, consultants and other third parties. We have and will continue to enter into contracts in the normal course of business with various third parties who support our clinical trials, support our preclinical research studies, and provide other services related to our development efforts. Our most significant agreement, entered into in June 2014, is with a third-party CRO that is conducting our Phase 2 clinical trial for the oral formulation of SCY-078. The total fees and expenses under the agreement are projected to be approximately
$6.3 million
during the term of the agreement. The scope of the services under the agreement can be modified at any time, and the agreement can be terminated by either party 30 days after receipt of written notice.
As described in the Item 1. "Business" section of this annual report, we are developing SCY-078 under an exclusive license agreement with Merck. In December 2014, we entered into an amendment to our license agreement with Merck that defers the remittance of a milestone payment due to Merck, such that no amount will be due upon initiation of the first phase 2 clinical trial of a product containing the SCY-078 compound (the "Deferred Milestone"). The amendment also increases, in an amount equal to the Deferred Milestone, the milestone payment that will be due upon initiation of the first Phase 3 clinical trial of a product containing the SCY-078 compound. Except as described above, all other terms and provisions of the license agreement remain in full force and effect.
56
Contract Research and Development Services
As part of our strategic objective to focus our resources on the development of SCY-078, our board of directors has directed our management to explore the divestiture of our contract research and development services business (the "service business"). A divestiture of the service business will simplify our business model and allow our new Chief Executive Officer to focus on the execution of our strategic objectives. A third party firm has been engaged and is actively assisting us in evaluating several divestiture options (a third-party sale, spin-off, management buy-out transaction, or shut-down process). In the event that we are able to successfully complete a divestiture transaction with a third-party, we are obligated to pay a success fee to a third party firm equal to the greater of $0.5 million or 4% of the transaction consideration. We may incur other costs in connection with a divestiture transaction that we cannot reasonably estimate at this time, including but not limited to employee compensation and severance costs, exit and disposal costs, and other transaction costs.
Merial, a wholly owned subsidiary of Sanofi, is one of the largest animal health businesses in the world and has been a significant partner in animal health since 2003. During 2014, we provided contract research and development services for Merial on a fee-for-service basis under an agreement that expired on December 31, 2014. We signed a new agreement with Merial effective December 2014 under which we will provide contract research and screening services in the field of animal health that primarily target parasites. Our services will include primary and secondary screening of compounds in Merial’s libraries, the development of new and proprietary screens in therapeutic indications of interest to Merial, and the support and coordination of chemical syntheses services being performed by Merial’s other service providers. Consistent with the previous agreement, this is a non-exclusive arrangement in the animal health field and is on a fee-for-service basis, meaning we will not receive any contingent payments based on the progression to development and commercialization of any compounds arising from this agreement. Under the new agreement, any intellectual property created in connection our performance of the services shall be the sole property of Merial. The term of this agreement is two years, beginning January 1, 2015 and ending on December 31, 2016, and the total service fee due from Merial over the term of the agreement is $7.9 million, payable in equal quarterly installments. The agreement also provides for an option to extend the term for one additional year.
In 2014, we recognized revenues of $7.3 million, or 38% of our total revenue, from Merial under the research services agreement that expired on December 31, 2014. No other customer, except for Elanco Animal Health, accounted for 10% or more of our revenues during 2014. Under the scope of the new agreement with Merial effective December 2014, we expect our annual revenue will be approximately $4.0 million, which is a reduction of approximately $3.3 million, or 45%, compared to revenue recognized in 2014 under the previous agreement with Merial. If we are not able to secure new research and development services contracts with other customers that allow us to utilize our resources that supported the previous Merial agreement that expired on December 31, 2014, we may have to reduce our resources and incur related severance costs.
Also in 2014, revenues related to discovery and drug metabolism and pharmacokinetics (DMPK) services declined by
$1.4 million
when compared to 2013. This decrease occurred because we made the strategic decision to stop actively pursuing business development efforts related to discovery and DMPK services. Our 2014 discovery and DMPK services revenue included approximately $1.0 million of revenue related to services agreements that expired in 2014 and are not expected to be renewed or replaced in 2015. Resources that previously supported these service agreements in 2014 are being utilized on other service agreements or are supporting our SCY-078 research and development efforts and we do not currently expect any material effect on our operating costs in 2015.
We expect the aforementioned developments pertaining to our contract research and development services business to have an adverse effect on our reported revenues in 2015 and may have an adverse effect on our net loss in 2015.
Cyclophilin Inhibitor Platform
In October 2014, we entered into a license agreement with Waterstone, granting exclusive, worldwide rights to develop and commercialize SCY-635 for the treatment of viral diseases in humans. In addition, under the same agreement, we granted Waterstone an option for an exclusive, worldwide license to develop and commercialize two of our additional cyclophilin inhibitor compounds, SCY-575 and SCY-116, for the treatment of viral diseases in humans. The key terms of our license agreement with Waterstone are described within Note 18 of our audited financial statements for the year ended December 31, 2014 included in this annual report. In November 2014, we received a $1.0 million non-refundable upfront payment from Waterstone for the license of SCY-635. We recognized revenue of $1.0 million from this non-refundable upfront payment in the year ended December 31, 2014 because all deliverables were satisfied and we have no continuing performance obligations under the agreement. With the successful monetization of SCY-635 through the license agreement with Waterstone, we are able to focus our efforts and resources on the development of SCY-078.
Components of Operating Results
Revenue
57
To date, we have derived substantially all of our revenue from the provision of our contract research and development services. In addition, we have received upfront and milestone payments in connection with our collaboration and licensing agreements. The developments described in the "Recent Developments" section above pertaining to our contract research and development services business are expected to have an adverse effect on our reported revenues in 2015. Further, we expect that any revenue we generate will fluctuate from quarter to quarter as a result of the variability in the amount of our contract research and development services provided, the achievement of collaboration milestones, and the consummation of new licensing arrangements. We do not expect to generate revenue from product sales for at least the next several years. If we or our collaborators fail to complete the development of product candidates in a timely manner or obtain their regulatory approval, our ability to generate future revenue, and our results of operations and financial position, would be materially adversely affected.
Our revenue recognition policy is described within the "Critical Accounting Policies and Significant Judgments and Estimates" section below, as well as in Note 2 to our audited financial statements for the year ended December 31, 2014 included in this annual report.
Cost of Revenue
Cost of revenue primarily consists of salaries and personnel-related costs, including employee benefits and any stock-based compensation. Additional expenses include facilities and equipment costs directly associated with generating revenue, allocated overhead, materials, contracted consultants and other direct costs.
We allocate expenses associated with our facilities, information technology costs, and depreciation and amortization, between cost of revenue and operating expenses. Allocations are based on employee headcount or facility square footage utilization, and are determined by the nature of work performed.
Research and Development Expense
Research and development expense consists of expenses incurred while performing research and development activities to discover, develop, or improve potential product candidates we seek to develop. This includes conducting preclinical studies and clinical trials, manufacturing and other development efforts, and activities related to regulatory filings for product candidates. We recognize research and development expenses as they are incurred. Our research and development expense primarily consists of:
|
•
|
costs related to executing preclinical and clinical trials, including related drug formulation, manufacturing and other development;
|
|
•
|
salaries and personnel-related costs, including benefits and any stock-based compensation for personnel in research and development functions;
|
|
•
|
fees paid to CROs, vendors, consultants and other third parties who support our product candidate development and intellectual property protection;
|
|
•
|
other costs in seeking regulatory approval of our products; and
|
|
•
|
allocated overhead.
|
The table below summarizes the total costs incurred for each of our key research and development projects during the periods presented:
|
|
For the Year Ended December 31,
|
||||||
|
|
2014
|
2013
|
|||||
|
|
(dollars in thousands)
|
||||||
|
SCY-078
|
$
|
7,050
|
|
$
|
1,404
|
|
|
|
Cyclophilin Inhibitor Platform
|
1,237
|
|
2,953
|
|
|||
|
Other
|
—
|
|
6
|
|
|||
|
Total Research and Development
|
$
|
8,287
|
|
$
|
4,363
|
|
|
Our SCY-078 and cyclophilin inhibitor platform projects were the only key research and development projects during the periods presented. We plan to increase our research and development expense for the foreseeable future as we continue our effort to develop SCY-078 and potentially to develop our other product candidates, subject to the availability of additional
58
funding. We do not expect to incur any substantial research and development expenses related to our cyclophilin inhibitor platform in the near future.
The successful development of product candidates is highly uncertain. At this time, we cannot reasonably estimate the nature, timing or costs required to complete the remaining development of any product candidates. This is due to the numerous risks and uncertainties associated with the development of product candidates.
Selling, General and Administrative Expense
Selling, general and administrative expense consists primarily of salaries and personnel-related costs, including employee benefits and any stock-based compensation. This includes personnel in executive, finance, sales, human resources and administrative support functions. Other expenses include facility-related costs not otherwise allocated to cost of revenue or research and development expense, professional fees for accounting, auditing, tax and legal services, consulting costs for general and administrative purposes, information systems maintenance and marketing efforts.
We expect that our selling, general and administrative expense will continue to increase as we operate as a public reporting company and develop and commercialize SCY-078. These anticipated increased costs include director and officer liability insurance, costs related to the hiring of additional personnel, and increased fees for outside consultants, lawyers and accountants. We also expect to continue to incur increased costs to comply with corporate governance, internal controls, investor relations, disclosure and similar requirements applicable to public reporting companies.
Gain on Insurance Recovery
In the quarter ended June 30, 2014, our insurance carrier reimbursed us for the replacement cost of a fixed asset that was damaged by severe weather. The asset’s net book value was reduced upon occurrence of the damage. The proceeds received from the insurance recovery exceeded the net book value of the asset in the amount of $0.2 million, which we recognized as a gain during the quarter ended June 30, 2014.
Gain on Sale of Asset
In May 2012, we sold the rights to internally developed research software to a third-party for $4.5 million. We received an initial payment of $3.5 million in May 2012, and two subsequent payments of $0.5 million each in February and May of 2013, which completed the sale transaction. We recorded these payments as a gain on sale of asset within total operating expenses in the period payment was received, net of transaction expenses.
Other (Income) Expense
Substantially all of our other (income) expense consists of costs associated with:
|
•
|
a related party guarantee of our outstanding credit facility;
|
|
•
|
interest on related party convertible debt;
|
|
•
|
interest expense related to a beneficial conversion feature associated with the conversion of related party convertible debt in December 2013;
|
|
•
|
fair value adjustments to our derivative liability for warrants issued in conjunction with the related party convertible debt; and
|
|
•
|
a loss on the extinguishment of debt.
|
Interest paid on our outstanding bank debt composed substantially all of the remaining other (income) expense.
In April 2010, we entered into a $15.0 million credit facility agreement with HSBC Bank USA, National Association, or HSBC, which we refer to as the 2010 Credit Agreement. This 2010 Credit Agreement was guaranteed by a related party. We concluded that the guarantee represented a deemed contribution and recognized the value of the guarantee as deferred financing costs. The value of the guarantee was determined based on the difference between the 2010 Credit Agreement’s stated interest rate and the interest rate that would apply if there had been no guarantee from the related party. The value was determined to be $6.3 million at the time the 2010 Credit Agreement was established and was amortized over the life of the 2010 Credit Agreement. On March 8, 2013, the 2010 Credit Agreement and related party guarantee were extended through 2014, under an amendment referred to as the 2013 Credit Agreement. At the time of the extension, we concluded that the value of the new guarantee was $3.9 million. This amount was recorded as deferred financing costs and was being amortized through the year 2014.
59
Upon completion of our IPO on May 7, 2014, the entire outstanding balance of the 2013 Credit Agreement, amounting to $15.0 million plus accrued interest, was paid in full using the proceeds from the IPO. We recorded a loss on the extinguishment of debt of $1.4 million in the three month period ended June 30, 2014, as the remaining deferred financing costs associated with the 2013 Credit Agreement were written off. We had no outstanding debt as of
December 31, 2014
.
From December 2011 through June 2013, we issued convertible promissory notes totaling $12.3 million to related parties. These notes accrued interest at a rate of 8% per year. The purchasers of the convertible notes also received warrants to purchase common stock. The promissory notes, and accrued interest, were converted into preferred stock in December 2013. In connection with the conversion, the original conversion price on the promissory notes was reduced from
$4.3125
to
$1.40
, and as a result, we recorded additional interest expense of
$10.8 million
in December 2013 as a result of the beneficial conversion for the antidilution adjustment on the Series D-1 convertible preferred stock and the Series D-2 convertible preferred stock. The warrant fair values were accounted for as a debt discount and amortized over the stated term of the convertibles notes. We concluded that the warrants qualified as a derivative liability and the fair value of the warrants should be adjusted at each reporting period. The amortization of the debt discount was recorded in amortization of deferred financing costs and debt discount and the change in the derivative liability was recorded in derivative fair value adjustment.
The warrants to purchase common stock accounted for as derivatives were exercised in connection with the IPO. The combined fair values of the common stock warrant derivative liabilities was $2.7 million as of May 2, 2014, and this amount was reclassified to additional paid-in capital.
The accounting for these transactions are described in Notes 7, 9 and 10 to our audited financial statements included in Item 8 of this annual report.
Income Tax (Expense) Benefit
Income tax expense consists of U.S. federal and state income taxes. To date, we have not been required to pay U.S. federal income taxes because of our current and accumulated net operating losses.
60
Results of Operations for the Years Ended December 31, 2014 and 2013
The following table summarizes our results of operations for the
year ended
December 31, 2014
and
2013
, together with the changes in those items in dollars and percentage (dollars in thousands):
|
|
Year Ended
|
|||||||||||||||||||
|
|
December 31, 2014
|
December 31, 2013
|
Period-to-Period
Change
|
|||||||||||||||||
|
|
Amount
|
Percentage of
Revenue
|
Amount
|
Percentage of
Revenue
|
Amount
|
Percentage
|
||||||||||||||
|
Total revenue
|
$
|
19,024
|
|
100.0
|
%
|
$
|
16,857
|
|
100.0
|
%
|
$
|
2,167
|
|
12.9
|
%
|
|||||
|
Cost of revenue
|
15,446
|
|
81.2
|
%
|
16,305
|
|
96.7
|
%
|
(859
|
)
|
(5.3
|
)%
|
||||||||
|
Gross profit
|
3,578
|
|
18.8
|
%
|
552
|
|
3.3
|
%
|
3,026
|
|
548.2
|
%
|
||||||||
|
Operating expenses:
|
|
|
||||||||||||||||||
|
Research and development
|
8,287
|
|
43.6
|
%
|
4,363
|
|
25.9
|
%
|
3,924
|
|
89.9
|
%
|
||||||||
|
Selling, general and administrative
|
7,568
|
|
39.8
|
%
|
4,381
|
|
26.0
|
%
|
3,187
|
|
72.7
|
%
|
||||||||
|
Gain on insurance recovery
|
(165
|
)
|
(0.9
|
)%
|
—
|
|
—
|
|
(165
|
)
|
*
|
|
||||||||
|
Gain on sale of asset
|
—
|
|
—
|
|
(988
|
)
|
(5.9
|
)%
|
988
|
|
(100.0
|
)%
|
||||||||
|
Total operating expenses
|
15,690
|
|
82.5
|
%
|
7,756
|
|
46.0
|
%
|
7,934
|
|
102.3
|
%
|
||||||||
|
Loss from operations
|
(12,112
|
)
|
(63.7
|
)%
|
(7,204
|
)
|
(42.7
|
)%
|
(4,908
|
)
|
68.1
|
%
|
||||||||
|
Other (income) expense:
|
|
|
|
|
||||||||||||||||
|
Amortization of deferred financing costs and debt discount
|
755
|
|
4.0
|
%
|
3,485
|
|
20.7
|
%
|
(2,730
|
)
|
(78.3
|
)%
|
||||||||
|
Loss on extinguishment of debt
|
1,389
|
|
7.3
|
%
|
—
|
|
—
|
|
1,389
|
|
*
|
|
||||||||
|
Interest expense on beneficial conversion feature
|
—
|
|
—
|
|
10,802
|
|
64.1
|
%
|
(10,802
|
)
|
(100.0
|
)%
|
||||||||
|
Interest expense — related party
|
—
|
|
—
|
|
892
|
|
5.3
|
%
|
(892
|
)
|
(100.0
|
)%
|
||||||||
|
Interest expense
|
48
|
|
—
|
|
192
|
|
1.1
|
%
|
(144
|
)
|
(75.0
|
)%
|
||||||||
|
Derivative fair value adjustment
|
(10,080
|
)
|
(53.0
|
)%
|
7,886
|
|
—
|
|
(17,966
|
)
|
(227.8
|
)%
|
||||||||
|
Other expense
|
10
|
|
0.1
|
%
|
—
|
|
—
|
|
10
|
|
*
|
|
||||||||
|
Total other (income) expense
|
(7,878
|
)
|
(41.4
|
)%
|
23,257
|
|
138.0
|
%
|
(31,135
|
)
|
(133.9
|
)%
|
||||||||
|
Net Loss
|
$
|
(4,234
|
)
|
(22.3
|
)%
|
$
|
(30,461
|
)
|
(180.7
|
)%
|
$
|
26,227
|
|
(86.1
|
)%
|
|||||
*
Not applicable or meaningful
Revenue.
For the
year ended
December 31, 2014
, revenue increased to
$19.0 million
compared to
$16.9 million
of revenue for the
year ended
December 31, 2013
. The increase of
$2.2 million
, or
12.9%
, was the result of a $1.9 million increase in animal health services, a $1.3 million increase associated with revenue from licensing agreement upfront payments, and a $0.2 million increase in materials revenue. These increases were partially offset by a
$1.4 million
decrease in discovery and drug metabolism and pharmacokinetics (DMPK) services revenue. The animal health services revenue increase was primarily related to services performed for Elanco Animal Health, or Elanco, beginning in January 2014, under a licensing and research services agreement executed in December 2013. We expect to continue to provide animal health services through the term of the existing agreement with Elanco, which extends through 2017. The majority of our licensing revenue in 2014 was associated with a $1.0 million upfront non-refundable payment received from Waterstone in the fourth quarter of 2014. We recognized the $1.0 million payment as revenue because we satisfied all deliverables associated with the payment prior to December 31, 2014 and have no remaining substantive performance obligations. Although our revenue increased from 2013 to 2014, the
61
developments described in the "Recent Developments" section above pertaining to our contract research and development services business are expected to have an adverse effect on our reported revenues in 2015.
Cost of Revenue.
For the
year ended
December 31, 2014
, cost of revenue decreased to
$15.4 million
compared to
$16.3 million
for the
year ended
December 31, 2013
. The decrease of
$0.9 million
, or
5.3%
, was primarily the result of a $0.5 million decrease due to operating cost saving measures taken in 2014, a $0.3 million decrease in laboratory materials and third-party scientific contract labor services, and a $0.6 million decrease due to scientific personnel devoting more time to SCY-078 development in 2014, which results in the associated salaries and personnel-related costs for this effort being included in research and development expense in 2014, rather than cost of revenue. These decreases were partially offset by a $0.6 million increase in employee compensation expense, which was primarily due to an accrual of estimated annual employee bonus compensation in 2014.
Research and Development.
For the
year ended
December 31, 2014
, research and development expenses increased to
$8.3 million
from
$4.4 million
for the
year ended
December 31, 2013
. The increase of
$3.9 million
, or
89.9%
, was primarily the result of a $1.7 million increase in employee compensation expense and a $2.2 million increase in third-party development services related to the SCY-078 Phase 2 clinical trial and the preclinical development of intravenous SCY-078. The increase in employee compensation was due to new research and development personnel hired in 2014 to manage and support the development of SCY-078, stock compensation expense associated with option grants to our research and development personnel, an accrual of estimated annual employee bonus compensation in 2014, an accrual of employee severance costs associated with workforce reduction activities in June 2014, and scientific services personnel devoting more time and effort to SCY-078 development in 2014, which results in the associated salaries and personnel-related costs for this effort being included in research and development expense in 2014, rather than cost of revenue.
Selling, General & Administrative
. For the
year ended
December 31, 2014
, selling, general and administrative expenses increased to
$7.6 million
from
$4.4 million
for the
year ended
December 31, 2013
. The increase of
$3.2 million
, or
72.7%
, was a result of a $0.5 million payment to a related party advisor who assisted us in evaluating potential strategic financing alternatives to an IPO, a $0.2 million increase in other professional services expenses indirectly associated with our IPO, a $0.7 million increase in professional services expenses directly associated with our continuing operations as a regulated, publicly traded company, a $1.2 million increase in employee compensation, and a $0.6 million increase in other general and administrative expenses. The increase in employee compensation was primarily due to a $0.5 million increase in stock compensation expense associated with an option award modification and additional option grants, a $0.5 million accrual of estimated annual employee bonus compensation in 2014. The remaining increase to employee compensation expense was associated with an increase in officer and employee salaries that became effective in June 2014, and an accrual of employee severance costs associated with workforce reduction activities in June 2014.
Gain on Insurance Recovery
. For the
year ended
December 31, 2014
, we recognized a
$0.2 million
gain on insurance recovery as our insurance carrier reimbursed us for the replacement cost of a damaged fixed asset. The insurance proceeds of $0.2 million exceeded the carrying value of the damaged asset.
Gain on Sale of Assets
. For the
year ended
December 31, 2014
, gain on sale of asset decreased to
zero
compared to
$1.0 million
in the
year ended
December 31, 2013
. The amount recorded during the 2013 period represents the final two payments received on the 2012 sale of proprietary software.
Amortization of Deferred Financing Costs and Debt Discount.
For the
year ended
December 31, 2014
, amortization of deferred financing costs decreased to
$0.8 million
compared to
$3.5 million
in the
year ended
December 31, 2013
. The decrease of
$2.7 million
, or
78.3%
, was primarily associated with the conversion of our convertible promissory notes in December 2013 and the repayment of our 2013 Credit Agreement in May 2014. During the
year ended
December 31, 2013
, we amortized debt discounts associated with our convertible promissory notes issued from December 2011 through June 2013 and deferred financing costs associated with our 2013 Credit Agreement. All of our convertible promissory notes were converted into preferred stock in December 2013 and, therefore, no amortization of promissory notes debt discount was incurred in 2014. Upon completion of our IPO in May 2014, the entire outstanding balance of the 2013 Credit Agreement amounting to $15.0 million plus accrued interest was paid in full using the proceeds from the IPO. The remaining unamortized balance of the deferred financing costs on the debt settlement date of $1.4 million was recognized as a loss on the extinguishment of debt in the
year ended
December 31, 2014
. This loss on extinguishment of debt is presented separately in the accompanying statements of operations.
Loss on Extinguishment of Debt.
For the
year ended
December 31, 2014
, loss on extinguishment of debt was
$1.4 million
compared to
zero
for the
year ended
December 31, 2013
. As described in the preceding paragraph, upon completion of our IPO in May 2014, the entire outstanding balance of the 2013 Credit Agreement amounting to $15.0 million plus accrued
62
interest was paid in full using the proceeds from the IPO. The remaining unamortized balance of the deferred financing costs on the debt settlement date of $1.4 million was immediately recognized as a loss on the extinguishment of debt in the
year ended
December 31, 2014
.
Interest Expense on Beneficial Conversion Feature.
For the
year ended
December 31, 2014
, interest expense on beneficial conversion feature was
zero
compared to
$10.8 million
in the
year ended
December 31, 2013
. The noncash expense recognized in the year ended
December 31, 2013
is a beneficial conversion feature associated with the conversion of related-party convertible promissory notes into preferred stock in December 2013. As the promissory notes were converted in 2013, no such interest expense was incurred in the
year ended
December 31, 2014
.
Interest Expense — Related Party.
For the
year ended
December 31, 2014
, interest expense — related party was
zero
compared to
$0.9 million
in the
year ended
December 31, 2013
. There was no interest expense — related party recognized in the
year ended
December 31, 2014
, because the outstanding principal and interest of all convertible promissory notes issued to related parties were converted into preferred stock in December 2013.
Derivative Fair Value Adjustment
. For the
year ended
December 31, 2014
, derivative fair value adjustment was a
$10.1 million
gain compared to a
$7.9 million
loss in the
year ended
December 31, 2013
. The gain in 2014 was due to the decrease in the fair value of our common stock, from an estimate of $47.74 per share as of December 31, 2013, to the estimated fair value of $10.00 per share as of May 2, 2014. The loss in 2013 was due to the issuance of warrants to purchase our common stock during the year ended December 31, 2013.
Liquidity and Capital Resources
Sources of Liquidity
Through
December 31, 2014
, we have funded our operations through revenue from the provision of contract research and development services and from debt and equity issuances. As of
December 31, 2014
, we had cash and cash equivalents of approximately
$32.2 million
, compared to
$1.4 million
as of
December 31, 2013
. The increase in our cash and cash equivalents was primarily due to our recently completed IPO in May 2014.
We have incurred net losses since our inception, including the year ended
December 31, 2014
. As of
December 31, 2014
, our accumulated deficit was
$117.5 million
. We anticipate that we will continue to incur losses for at least the next several years. We expect that our research and development and selling, general and administrative expenses will continue to increase and, as a result, we will need additional capital to fund our operations, which we may obtain through one or more equity offerings, debt financings, or other third-party funding, strategic alliances and licensing or collaboration arrangements.
As described in Note 7 to our financial statements for the year ended December 31, 2014, included in this annual report, our 2013 Credit Agreement comprised a $5.0 million term loan and a $10.0 million revolving credit facility, provided for interest-only payments through December 31, 2014, and required repayment of the loan on December 31, 2014. The 2013 Credit Agreement was guaranteed by a related party that had an investment in our company. The full amounts of both the $5.0 million term loan and the $10.0 million revolving credit facility were outstanding as of
December 31, 2013
. There was no outstanding balance under the 2013 Credit Agreement as of
December 31, 2014
, because all principal and accrued interest was repaid on May 7, 2014 using proceeds from our IPO. The weighted-average interest rate was
1.19%
and
1.20%
for the years ended
December 31, 2014
and
2013
.
In January 2014, we issued shares of our convertible Series D-2 Preferred Stock and warrants to purchase shares of our common stock to existing investors in our company and received net proceeds of $0.5 million.
On May 7, 2014, we completed our IPO of our common stock pursuant to a registration statement that was declared effective on May 2, 2014. We sold 6,200,000 shares of our common stock at a price of $10.00 per share. As a result of the IPO, we raised a total of $54.6 million in net proceeds after deducting underwriting discounts and commissions of $3.3 million and offering expenses of $4.1 million. A related party who guaranteed our 2013 Credit Agreement invested $15.0 million during the IPO. Costs directly associated with our IPO were capitalized and recorded as deferred offering costs prior to the completion of the IPO. These costs were recorded as a reduction of the proceeds received in arriving at the amount to be recorded in additional paid-in capital. Upon completion of the IPO, all outstanding shares of our preferred stock were converted into 1,691,884 shares of our common stock. In addition, we issued 275,687 shares of common stock in relation to the warrants to purchase our common stock that were exercised.
63
On May 7, 2014, $15.0 million of the proceeds received from the IPO was used to pay in full the outstanding principal and all accrued interest under the 2013 Credit Agreement. This payment fully settled our obligations, and released the related party guarantor from all obligations, under and in relation to the 2013 Credit Agreement.
Cash Flows
The following table sets forth the significant sources and uses of cash for the
year ended
December 31, 2014
and
2013
:
|
|
For the Year Ended December 31,
|
||||||
|
|
2014
|
2013
|
|||||
|
|
(unaudited; dollars in thousands)
|
||||||
|
Net cash used in operating activities
|
$
|
(9,472
|
)
|
$
|
(4,307
|
)
|
|
|
Net cash (used in) provided by investing activities
|
(488
|
)
|
557
|
|
|||
|
Net cash provided by financing activities
|
40,801
|
|
2,767
|
|
|||
|
Net increase (decrease) in cash and cash equivalents
|
$
|
30,841
|
|
$
|
(983
|
)
|
|
Operating Activities
Net cash used in operating activities of
$9.5 million
for the
year ended
December 31, 2014
, was a result of our ongoing research and development activities, and primarily consisted of the
$12.1 million
loss from operations, which was offset in part by a favorable change in operating assets and liabilities of
$0.6 million
, and adjustments for non-cash charges that included depreciation of
$1.2 million
and stock-based compensation expense of
$1.2 million
. Net cash used in operating activities of
$4.3 million
for the
year ended
December 31, 2013
, primarily consisted of a
$7.2 million
loss from operations, offset in part by a favorable change in operating assets and liabilities of
$3.5 million
, an adjustment for a non-cash charge for depreciation of
$1.3 million
and an adjustment for a gain on sale of asset of $1.0 million. The losses from operations in both the 2014 and 2013 periods exclude certain non-cash other income and expense items that have been described in the "Components of Operating Results" section above.
The
$5.2 million
increase in net cash used in operating activities for the
year ended
December 31, 2014
, as compared to the
year ended
December 31, 2013
, was primarily due to increases in costs associated with SCY-078 development efforts and public reporting company operations. We expect that the increases in these costs will continue as we continue to operate as a public reporting company and focus our efforts on the development of SCY-078.
Investing Activities
Net cash used in investing activities of
$0.5 million
for the
year ended
December 31, 2014
, primarily consisted of purchases of property and equipment of
$0.7 million
, offset partially by the proceeds from an insurance recovery of
$0.2 million
.
Net cash provided by investing activities of
$0.6 million
for the
year ended
December 31, 2013
primarily consisted of proceeds of
$1.0 million
from the sale of proprietary software assets, offset partially by purchases of property and equipment of
$0.4 million
.
Financing Activities
Net cash provided by financing activities of
$40.8 million
for the
year ended
December 31, 2014
, consisted of
$62.0 million
of gross proceeds received from our IPO in May 2014 and
$0.5 million
in proceeds raised from the issuance of shares of our D-2 preferred stock in January 2014, offset partially by a
$15.0 million
payment to settle all outstanding borrowings under our 2013 Credit Agreement and
$6.9 million
of payments for deferred offering costs and underwriting discounts and commissions associated with our May 2014 IPO.
Net cash provided by financing activities of
$2.8 million
for the
year ended
December 31, 2013
, primarily consisted of
$0.9 million
of proceeds from the issuance of our June 2013 Notes and
$2.5 million
of proceeds from the issuance of Series D-2 convertible preferred stock in December 2013, offset partially by
$0.5 million
of payments for deferred offering costs and underwriting discounts and commissions associated with our May 2014 IPO.
Future Funding Requirements
To date, we have not generated any revenue from product sales. We do not know when, or if, we will generate any revenue from product sales. We do not expect to generate significant revenue from product sales unless and until we obtain regulatory approval of and commercialize SCY-078. We do not expect our contract research and development services to support our funding needs associated with the development of SCY-078. In addition, we expect our expenses to increase in
64
connection with our ongoing development activities, particularly as we continue the research, development and clinical trials of, and seek regulatory approval for, product candidates. We anticipate that we will need substantial additional funding in connection with our continuing operations.
Based upon our current operating plan, we believe that our existing cash and cash equivalents, which include the net proceeds from our recently completed IPO, will enable us to fund our operating expenses and capital expenditure requirements
into the first quarter of 2016
. We have based our estimates on assumptions that may prove to be wrong, and we may use our available capital resources sooner than we currently expect. Because of the numerous risks and uncertainties associated with the development and commercialization of product candidates, we are unable to estimate the amounts of increased capital outlays and operating expenditures necessary to complete the development of product candidates.
Our future capital requirements will depend on many factors, including:
|
•
|
the progress, costs, and the clinical development of SCY-078;
|
|
•
|
the outcome, costs and timing of seeking and obtaining FDA and any other regulatory approvals;
|
|
•
|
the ability of product candidates to progress through clinical development successfully;
|
|
•
|
our need to expand our research and development activities;
|
|
•
|
the costs associated with our continuing to support our ability to provide contract research and development services;
|
|
•
|
the costs associated with securing, establishing and maintaining commercialization and manufacturing capabilities;
|
|
•
|
our ability to maintain, expand and defend the scope of our intellectual property portfolio, including the amount and timing of any payments we may be required to make, or that we may receive, in connection with the licensing, filing, prosecution, defense and enforcement of any patents or other intellectual property rights;
|
|
•
|
our need and ability to hire additional management and scientific and medical personnel;
|
|
•
|
our need to implement additional internal systems and infrastructure, including financial and reporting systems; and
|
|
•
|
the economic and other terms, timing and success of our existing licensing arrangements and any collaboration, licensing or other arrangements into which we may enter in the future.
|
Until such time, if ever, as we can generate substantial revenue from product sales, we expect to finance our cash needs through a combination of equity offerings, debt financings, or other third-party funding, cash generated from the provision of contract research and development services, marketing and distribution arrangements, or other collaborations, strategic alliances or licensing arrangements. In addition, we may determine to sell certain of our assets, as we did in May 2012, when we sold the rights to internally developed research software to a third party for $4.5 million. To the extent that we raise additional capital through the sale of equity or convertible debt securities, the ownership interests of our common stockholders will be diluted, and the terms of these securities may include liquidation or other preferences that adversely affect the rights of our common stockholders. Debt financing, if available, may involve agreements that include covenants limiting or restricting our ability to take specific actions, such as incurring additional debt, making capital expenditures or declaring dividends. If we raise additional funds through sales of assets, other third-party funding, marketing and distribution arrangements or other collaborations, strategic alliances or licensing arrangements with third parties, we may have to relinquish valuable rights to our technologies, future revenue streams, research programs or product candidates or to grant licenses on terms that may not be favorable to us.
Contractual Obligations, Commitments and Contingencies
Our commitments and contingencies, including payment obligations under license agreements that are contingent upon future events such as our achievement of specified development, regulatory and commercial milestones, have been disclosed in Note 8 of our audited financial statements for the year ended December 31, 2014 included in this annual report.
In addition to those obligations, commitments and contingencies set forth in Note 8, we have and will continue to enter into contracts in the normal course of business with various third parties who support our clinical trials, support our preclinical research studies, and provide other services related to our operating purposes. These contracts generally provide for termination or cancellation within 30 days of notice.
65
Off-Balance Sheet Arrangements
During the periods presented we did not have, nor do we currently have, any off-balance sheet arrangements as defined under SEC rules.
Critical Accounting Policies and Significant Judgments and Estimates
Our management’s discussion and analysis of our financial condition and results of operations is based on our financial statements, which we have prepared in accordance with accounting principles generally accepted in the United States, or GAAP. The preparation of our financial statements requires us to make estimates and assumptions that affect the reported amounts of assets and liabilities and the disclosure of contingent assets and liabilities at the date of our financial statements, as well as the reported revenues and expenses during the reported periods. We evaluate these estimates and judgments on an ongoing basis. We base our estimates on historical experience and on various other factors that we believe are reasonable under the circumstances, the results of which form the basis for making judgments about the carrying value of assets and liabilities that are not readily apparent from other sources. Actual results may differ from these estimates under different assumptions or conditions.
While our significant accounting policies are more fully described in Note 2 to our financial statements for the year ended December 31, 2014, included in this annual report, we believe that the following accounting policies are critical to the process of making significant judgments and estimates in the preparation of our financial statements and understanding and evaluating our reported financial results.
Revenue Recognition and Deferred Revenue
We have historically derived substantially all of our revenue from contract research and development services performed under fee for service arrangements. We have also entered into collaboration and licensing agreements in which multiple elements exist, including the sale of licenses and the provision of services, in exchange for non-refundable upfront payments and consideration as services are performed. Under these arrangements, we are also entitled to receive development milestones and royalties in the form of a designated percentage of product sales. We classify non-refundable upfront payments, milestone payments and royalties received under collaboration and licensing agreements as revenues within our statements of operations because we view such activities as being central to our business operations.
We recognize revenue when there is persuasive evidence of an arrangement, delivery has occurred or we have provided the service, the fees are fixed and determinable and collectability is reasonably assured. We record amounts received prior to satisfying the above revenue recognition criteria as deferred revenue until all applicable revenue recognition criteria are met.
Non-refundable upfront fees are recorded as deferred revenue and recognized into revenue as license fees from collaborations on a straight-line basis over the estimated period of our substantive performance obligations. If we do not have substantive performance obligations, we recognize non-refundable upfront fees into revenue through the date the deliverable is satisfied. Analyzing the arrangement to identify deliverables requires the use of judgment, and each deliverable may be an obligation to deliver services, a right or license to use an asset, or another performance obligation.
We will recognize a milestone payment when earned if it is substantive and we have no ongoing performance obligations related to the milestone. A milestone payment is considered substantive if it: 1) is commensurate with either our performance to achieve the milestone or the enhanced value of the delivered item as a result of a specific outcome from our performance to achieve the milestone; 2) relates solely to past performance; and 3) is reasonable relative to all of the deliverables and payment terms, including other potential milestone consideration, within the arrangement.
We have received several non-refundable upfront payments under certain licensing and collaboration arrangements that contain substantive performance obligations that we are providing to our licensees or collaboration partners over defined or estimated service or relationship periods. Because these arrangements contained substantive performance obligations, the non-refundable upfront payments are being recognized over the service periods of each respective arrangement. Revenue recognized under these non-refundable upfront payments are described further in Note 2 to our audited financial statements for the year ended December 31, 2014 included in this annual report.
In November 2014, we received a $1.0 million non-refundable upfront payment from Waterstone under our license agreement with Waterstone (described in Note 18 to our audited financial statements for the year ended December 31, 2014 included in this annual report). We analyzed the arrangement and concluded we have no remaining substantive obligations to perform under the arrangement after December 31, 2014. As a result, we recognized revenue of $1.0 million from this non-
66
refundable upfront payment in the year ended December 31, 2014. The development milestone payment and the royalties potentially due to us under the arrangement will be recognized as revenue if and when we receive the payments.
Research & Development Accruals
We are required to estimate our expenses resulting from our obligations under contracts with clinical research organizations, clinical site agreements, vendors, and consultants in connection with conducting SCY-078 clinical trials and preclinical development. The financial terms of these contracts are subject to negotiations which vary from contract to contract, and may result in payment flows that do not match the periods over which materials or services are provided to us under such contracts. Our objective is to reflect the appropriate development and trial expenses in our financial statements by matching those expenses with the period in which the services and efforts are expended by our service providers.
For clinical trials, we account for these expenses according to the progress of the trial as measured by actual hours expended by CRO personnel, investigator performance or completion of specific tasks, patient progression, or timing of various aspects of the trial. For preclinical development services performed by outside service providers, we determine accrual estimates through financial models, taking into account development progress data received from outside service providers and discussions with our knowledgeable internal personnel and service provider personnel. During the course of a clinical trial or preclinical development project, we adjust our rate of trial or project expense recognition if actual results differ from our estimates. We make estimates of our accrued expenses as of each balance sheet date in our financial statements based on the facts and circumstances known to us at that time. Our understanding of the status and timing of services performed relative to the actual status and timing of services performed may vary and may result in our reporting changes in estimates in any particular period. We have not experienced any significant adjustments to our estimates to date.
Stock-Based Compensation
We record the fair value of stock options issued as of the grant date as compensation expense. We recognize compensation expense over the requisite service period, which is equal to the vesting period.
Stock-based compensation expense has been reported in our statements of operations as follows:
|
|
Years Ended
December 31,
|
||||||
|
|
2014
|
2013
|
|||||
|
|
(in thousands)
|
||||||
|
Cost of revenue
|
$
|
159
|
|
$
|
45
|
|
|
|
Research and development
|
394
|
|
28
|
|
|||
|
Selling, general and administrative
|
648
|
|
107
|
|
|||
|
Total
|
$
|
1,201
|
|
$
|
180
|
|
|
On
December 31, 2014
, the aggregate intrinsic value of outstanding options to purchase shares of our common stock was
$0.3 million
, based upon the $9.98 closing sales price per share of our common stock as reported on the NASDAQ Global Market on that date.
Determination of the Fair Value of Stock-based Compensation Grants
We calculate the fair value of stock-based compensation arrangements using the Black-Scholes option-pricing model. The Black-Scholes option-pricing model requires the use of subjective assumptions, including volatility of our common stock, the expected term of our stock options, the risk free interest rate for a period that approximates the expected term of our stock options, and the fair value of the underlying common stock on the date of grant. In applying these assumptions, we considered the following factors:
|
•
|
we do not have sufficient history to estimate the volatility of our common stock price. We calculate expected volatility based on reported data for selected reasonably similar publicly traded companies for which the historical information is available. For the purpose of identifying peer companies, we consider characteristics such as industry, length of trading history, similar vesting terms and in-the-money option status. We plan to continue to use the guideline peer group volatility information until the historical volatility of our common stock is relevant to measure expected volatility for future option grants;
|
|
•
|
the assumed dividend yield is based on our expectation of not paying dividends for the foreseeable future;
|
|
•
|
we determine the average expected life of stock options based on the simplified method in accordance with SEC Staff Accounting Bulletin Nos. 107 and 110, as our common stock to date has not been publicly traded. We expect to use the simplified method until we have sufficient historical exercise data to provide a reasonable basis upon which to estimate expected term;
|
67
|
•
|
we determine the risk-free interest rate by reference to implied yields available from U.S. Treasury securities with a remaining term equal to the expected life assumed at the date of grant; and
|
|
•
|
we estimate forfeitures based on our historical analysis of actual stock option forfeitures.
|
As described in Note 11 to our audited financial statements for the year ending December 31, 2014, included in this annual report, we recognized additional compensation expense in connection with certain stock option award term modifications that were approved by our board of directors in June 2014 and by our shareholders in September 2014. The additional compensation expense was determined in accordance with FASB ASC Topic 718,
Compensation--Stock Compensation
, and we calculated the incremental fair value of the modified option awards using the Black-Scholes option-pricing model. We considered the same previously described factors when we identified the appropriate assumptions used in the Black-Scholes option-pricing model to determine incremental fair value of the modified option awards.
The assumptions used in the Black-Scholes option-pricing model for the
years ended December 31, 2014 and 2013
, are set forth below:
|
Employee Stock Options
|
Year Ended
December 31, |
||
|
|
2014
|
|
2013
|
|
Weighted average risk-free interest rate
|
2.05%
|
2.41%
|
|
|
Weighted average expected term (in years)
|
6.04
|
6.49
|
|
|
Weighted average expected volatility
|
68.57%
|
65.49%
|
|
|
Expected dividend yield
|
—%
|
—%
|
|
|
Forfeiture rate
|
5.00%
|
5.00%
|
|
|
Non-Employee Stock Options
|
Year Ended
December 31, |
||
|
|
2014
|
2013
|
|
|
Weighted average risk-free interest rate
|
1.75%
|
2.37%
|
|
|
Weighted average expected term (in years)
|
5.30
|
5.00
|
|
|
Weighted average expected volatility
|
64.10%
|
65.49%
|
|
|
Expected dividend yield
|
—%
|
—%
|
|
|
Forfeiture rate
|
5.00%
|
5.00%
|
|
Determination of the Fair Value of Common Stock on Grant Dates
Historically, we have granted stock options at exercise prices not less than the fair value of our common stock. Prior to our IPO in May 2014, we were a private company with no active public market for our common stock. Therefore, our board of directors estimated per share fair value of our common stock at each grant date using recently prepared valuations performed in accordance with the guidance outlined in the American Institute of Certified Public Accountants Practice Aid,
Valuation of Privately-Held Company Equity Securities Issued as Compensation
, also known as the Practice Aid. In conducting these valuations, our board of directors considered all objective and subjective factors that it believed to be relevant, including its and management’s best estimate of our business condition, prospects and operating performance at each grant date. In reaching these fair value determinations, our board of directors and management considered a range of objective and subjective factors and assumptions including, among others:
|
•
|
our results of operations, financial position, status of our research and development efforts, stage of development and business strategy;
|
|
•
|
external market conditions affecting the life sciences and biotechnology industry sectors;
|
|
•
|
the prices at which we sold shares of convertible preferred stock to third-party investors;
|
|
•
|
the superior rights and preferences of the convertible preferred stock relative to our common stock at the time of each grant;
|
|
•
|
our stage of development and business strategy and the material risks related to our business and industry;
|
|
•
|
the valuation of publicly traded companies in the life sciences and biotechnology sectors, as well as recently completed mergers and acquisitions of peer companies;
|
68
|
•
|
the lack of an active public market for our common stock and convertible preferred stock;
|
|
•
|
the likelihood of achieving a liquidity event in light of prevailing market conditions, such as an initial public offering or sale of our company; and
|
|
•
|
any recent contemporaneous valuations prepared in accordance with methodologies outlined in the Practice Aid.
|
Estimating the fair value of our common stock prior to our IPO in May 2014 was highly complex and subjective because our shares were not publicly traded. We used a probability-weighted expected return method, or PWERM, to estimate the fair value of common stock prior to our IPO. Significant inputs for the PWERM included an estimate of our equity value, a weighted average cost of capital, and an estimated probability and timing for each valuation scenario.
For all grants of stock options made following the completion of our IPO, we have determined, and will determine in the future, fair value based on the closing price of our common stock on the Nasdaq Global Market on the date of determination. As a result, the fair value of our common stock no longer requires a highly complex and subjective estimation process.
Fair Value Adjustments to Warrant Liability
We issued warrants to purchase our common stock in connection with the issuances of convertible notes and the issuance of Series D-2 convertible preferred stock. In connection with the consummation of the IPO in May 2014, substantially all outstanding common stock warrants were exercised at an exercise price of
$0.20
per share and the holders received
275,687
shares of common stock.
We calculated the fair value of common stock warrants at their intrinsic value, which was the estimated fair value of the common stock less the exercise price for the warrant. We estimated fair value of our common stock using the methodology described in the previous section, titled "Determination of the Fair Value of our Common Stock on Grant Dates." As described in Note 7 to our audited financial statements for the year ending December 31, 2014 included in this annual report, at the date of issuance, the fair value of the warrants issued with convertible notes was recognized as a debt discount to the convertible notes, which was amortized to expense over the stated term of the related notes. As described in Note 9 to our audited financial statements included in this annual report, at the date of issuance, the fair value of the warrants issued with the Series D-2 convertible preferred stock was recognized as a discount to the Series D-2 convertible preferred stock, which was accreted to additional paid-in capital.
As described in Note 10 to our audited financial statements included in this annual report, the warrants issued in connection with both the convertible notes and the convertible preferred stock were also classified as a long-term derivative liability, which was adjusted at each reporting period to reflect its fair value calculated based on the estimated fair value of our common stock. The combined fair value of the common stock warrant derivative liabilities, including warrants issued with the sale of Series D-2 Preferred, was
$2.7 million
as of May 2, 2014, and this amount was settled to additional paid in capital on that date. The combined fair value of the common stock warrant derivative liabilities was
$12.2 million
as of
December 31, 2013
, which was recorded as a long-term derivative liability in the accompanying balance sheet. The fair value adjustment of the long-term derivative liability was recorded as other (income) expense in the amount of
$(10.4) million
and
$8.0 million
for
years ended December 31, 2014 and 2013
, respectively. As described in Note 9 to our audited financial statements for the year ending December 31, 2014 included in this annual report, the fair value of the warrants issued in connection with our Series D-2 Preferred offering in January 2014 was
$0.4 million
above the face amount of the Series D-2 Preferred. This excess was expensed in the
year ended
December 31, 2014
, and, as a result, the net fair value adjustment presented in the accompanying statements of operations for the
year ended
December 31, 2014
was income of
$10.1 million
.
|
ITEM 7A.
|
QUANTITATIVE AND QUALITATIVE DISCLOSURE ABOUT MARKET RISK
|
Not applicable.
69
|
ITEM 8.
|
FINANCIAL STATEMENTS AND SUPPLEMENTARY DATA
|
INDEX TO FINANCIAL STATEMENTS
70
REPORT OF INDEPENDENT REGISTERED PUBLIC ACCOUNTING FIRM
To the Board of Directors and Stockholders of
SCYNEXIS, Inc.
Durham, North Carolina
We have audited the accompanying balance sheets of SCYNEXIS, Inc. (the “Company”) as of December 31, 2014 and 2013, and the related statements of operations, changes in convertible preferred stock and stockholders’ equity (deficit), and cash flows for each of the two years in the period ended December 31, 2014. These financial statements are the responsibility of the Company’s management. Our responsibility is to express an opinion on these financial statements based on our audits.
We conducted our audits in accordance with the standards of the Public Company Accounting Oversight Board (United States). Those standards require that we plan and perform the audit to obtain reasonable assurance about whether the financial statements are free of material misstatement. The Company is not required to have, nor were we engaged to perform, an audit of its internal control over financial reporting. Our audits included consideration of internal control over financial reporting as a basis for designing audit procedures that are appropriate in the circumstances, but not for the purpose of expressing an opinion on the effectiveness of the Company’s internal control over financial reporting. Accordingly, we express no such opinion. An audit also includes examining, on a test basis, evidence supporting the amounts and disclosures in the financial statements, assessing the accounting principles used and significant estimates made by management, as well as evaluating the overall financial statement presentation. We believe that our audits provide a reasonable basis for our opinion.
In our opinion, such financial statements present fairly, in all material respects, the financial position of SCYNEXIS, Inc., as of December 31, 2014 and 2013, and the results of its operations and its cash flows for each of the two years in the period ended December 31, 2014, in conformity with accounting principles generally accepted in the United States of America.
/s/ Deloitte & Touche LLP
Raleigh, North Carolina
March 30, 2015
71
SCYNEXIS, INC.
(in thousands, except share and per share data)
The accompanying notes are an integral part of the financial statements.
|
December 31, 2014
|
December 31, 2013
|
||||||
|
Assets
|
|||||||
|
Current assets:
|
|||||||
|
Cash and cash equivalents
|
$
|
32,243
|
|
$
|
1,402
|
|
|
|
Accounts receivable, net
|
1,118
|
|
719
|
|
|||
|
Unbilled services
|
383
|
|
343
|
|
|||
|
Prepaid expenses and other current assets
|
992
|
|
489
|
|
|||
|
Total current assets
|
34,736
|
|
2,953
|
|
|||
|
Property and equipment, net of accumulated depreciation
|
4,835
|
|
5,401
|
|
|||
|
Deferred financing costs
|
—
|
|
2,144
|
|
|||
|
Other assets
|
101
|
|
114
|
|
|||
|
Deferred offering costs
|
—
|
|
1,775
|
|
|||
|
Total assets
|
$
|
39,672
|
|
$
|
12,387
|
|
|
|
Liabilities, convertible preferred stock, and stockholders’ equity (deficit)
|
|||||||
|
Current liabilities:
|
|||||||
|
Accounts payable
|
$
|
855
|
|
$
|
1,932
|
|
|
|
Accrued expenses
|
2,497
|
|
1,058
|
|
|||
|
Deferred revenue, current portion
|
449
|
|
487
|
|
|||
|
Current portion of long-term debt
|
—
|
|
15,000
|
|
|||
|
Total current liabilities
|
3,801
|
|
18,477
|
|
|||
|
Deferred revenue, net of current portion
|
1,146
|
|
1,144
|
|
|||
|
Derivative liability
|
—
|
|
12,237
|
|
|||
|
Deferred rent
|
1,294
|
|
1,481
|
|
|||
|
Total liabilities
|
6,241
|
|
33,339
|
|
|||
|
Commitments and contingencies (Note 8)
|
|
|
|||||
|
Series A convertible preferred stock, $0.001 par value, authorized 0 and 31,410 shares as of December 31, 2014, and December 31, 2013; 0 and 31,407 shares issued and outstanding as of December 31, 2014, and December 31, 2013
|
—
|
|
250
|
|
|||
|
Series B convertible preferred stock, $0.001 par value, authorized 0 and 711,987 shares as of December 31, 2014, and December 31, 2013; 0 and 467,814 shares issued and outstanding as of December 31, 2014, and December 31, 2013
|
—
|
|
4,215
|
|
|||
|
Series C convertible preferred stock, $0.001 par value, authorized 0 and 2,967,678 shares as of December 31, 2014, and December 31, 2013; 0 and 2,770,633 shares issued and outstanding as of December 31, 2014, and December 31, 2013
|
—
|
|
28,121
|
|
|||
|
Series C-2 convertible preferred stock, $0.001 par value, authorized 0 and 2,347,826 shares as of December 31, 2014, and December 31, 2013; 0 and 2,347,826 shares issued and outstanding as of December 31, 2014, and December 31, 2013
|
—
|
|
13,500
|
|
|||
|
Series D-1 convertible preferred stock, $0.001 par value, authorized 0 and 10,000,000 shares as of December 31, 2014, and December 31, 2013; 0 and 6,054,255 shares issued and outstanding as of December 31, 2014, and December 31, 2013
|
—
|
|
16,952
|
|
|||
|
Series D-2 convertible preferred stock, $0.001 par value, authorized 0 and 10,000,000 shares as of December 31, 2014, and December 31, 2013; 0 and 5,742,697 shares issued and outstanding as of December 31, 2014, and December 31, 2013
|
—
|
|
24,119
|
|
|||
|
Stockholders’ equity (deficit):
|
|||||||
|
Common stock, $0.001 par value, authorized 125,000,000 and 70,000,000 shares as of December 31, 2014, and December 31, 2013; 8,512,103 and 334,068 shares issued and outstanding as of December 31, 2014, and December 31, 2013
|
8
|
|
—
|
|
|||
|
Additional paid-in capital
|
150,934
|
|
5,168
|
|
|||
|
Accumulated deficit
|
(117,511
|
)
|
(113,277
|
)
|
|||
|
Total stockholders’ equity (deficit)
|
33,431
|
|
(108,109
|
)
|
|||
|
Total liabilities, convertible preferred stock, and stockholders’ equity (deficit)
|
$
|
39,672
|
|
$
|
12,387
|
|
|
72
SCYNEXIS, INC.
(in thousands, except share and per share data)
|
|
Year Ended December 31,
|
||||||
|
|
2014
|
2013
|
|||||
|
Revenue — related party
|
$
|
7,288
|
|
$
|
7,288
|
|
|
|
Revenue
|
11,736
|
|
9,569
|
|
|||
|
Total revenue
|
19,024
|
|
16,857
|
|
|||
|
Cost of revenue
|
15,446
|
|
16,305
|
|
|||
|
Gross profit
|
3,578
|
|
552
|
|
|||
|
Operating expenses:
|
|||||||
|
Research and development
|
8,287
|
|
4,363
|
|
|||
|
Selling, general and administrative
|
7,568
|
|
4,381
|
|
|||
|
Gain on insurance recovery
|
(165
|
)
|
—
|
|
|||
|
Gain on sale of asset
|
—
|
|
(988
|
)
|
|||
|
Total operating expenses
|
15,690
|
|
7,756
|
|
|||
|
Loss from operations
|
(12,112
|
)
|
(7,204
|
)
|
|||
|
Other (income) expense:
|
|||||||
|
Amortization of deferred financing costs and debt discount
|
755
|
|
3,485
|
|
|||
|
Loss on extinguishment of debt
|
1,389
|
|
—
|
|
|||
|
Interest expense on beneficial conversion feature
|
—
|
|
10,802
|
|
|||
|
Interest expense — related party
|
—
|
|
892
|
|
|||
|
Interest expense
|
48
|
|
192
|
|
|||
|
Derivative fair value adjustment
|
(10,080
|
)
|
7,886
|
|
|||
|
Other expense
|
10
|
|
—
|
|
|||
|
Total other (income) expense:
|
(7,878
|
)
|
23,257
|
|
|||
|
Net loss
|
$
|
(4,234
|
)
|
$
|
(30,461
|
)
|
|
|
Deemed dividend for beneficial conversion feature on Series D-2 preferred stock
|
(909
|
)
|
(4,232
|
)
|
|||
|
Deemed dividend for antidilution adjustments to convertible preferred stock
|
(214
|
)
|
(6,402
|
)
|
|||
|
Accretion of convertible preferred stock
|
(510
|
)
|
(5,714
|
)
|
|||
|
Net loss attributable to common stockholders - basic
|
$
|
(5,867
|
)
|
$
|
(46,809
|
)
|
|
|
Derivative fair value adjustment
|
(10,080
|
)
|
—
|
|
|||
|
Net loss attributable to common stockholders - diluted
|
(15,947
|
)
|
(46,809
|
)
|
|||
|
Net loss per share attributable to common stockholders:
|
|||||||
|
Basic
|
$
|
(1.04
|
)
|
$
|
(139.47
|
)
|
|
|
Diluted
|
$
|
(2.69
|
)
|
$
|
(139.47
|
)
|
|
|
Weighted average common shares outstanding:
|
|||||||
|
Basic
|
5,663,311
|
|
335,612
|
|
|||
|
Diluted
|
5,937,087
|
|
335,612
|
|
|||
The accompanying notes are an integral part of the financial statements.
73
SCYNEXIS, INC.
STATEMENTS OF CHANGES IN CONVERTIBLE PREFERRED STOCK AND STOCKHOLDERS' EQUITY (DEFICIT)
(in thousands)
|
|
Series A
Convertible
Preferred
Stock
|
|
Series B
Convertible
Preferred
Stock
|
|
Series C
Convertible
Preferred
Stock
|
|
Series C-1
Convertible
Preferred
Stock
|
|
Series C-2
Convertible
Preferred
Stock
|
|
Series D-1
Convertible
Preferred
Stock
|
|
Series D-2
Convertible
Preferred
Stock
|
|
|
Common
Stock
|
|
Additional
Paid-in
Capital
|
|
Accumulated
Deficit
|
|
Total
Stockholders’
Equity (Deficit)
|
||||||||||||||||||||||
|
Balance as of December 31, 2012
|
$
|
250
|
|
$
|
4,215
|
|
$
|
28,121
|
|
$
|
—
|
|
$
|
13,500
|
|
—
|
|
—
|
|
$
|
—
|
|
$
|
17,401
|
|
$
|
(82,816
|
)
|
$
|
(65,415
|
)
|
|||||||||||||
|
Net loss
|
—
|
|
—
|
|
—
|
|
—
|
|
—
|
|
—
|
|
—
|
|
—
|
|
—
|
|
(30,461
|
)
|
(30,461
|
)
|
||||||||||||||||||||||
|
Exercise of stock options
|
—
|
|
—
|
|
—
|
|
—
|
|
—
|
|
—
|
|
—
|
|
—
|
|
5
|
|
—
|
|
5
|
|
||||||||||||||||||||||
|
Stock-based compensation expense
|
—
|
|
—
|
|
—
|
|
—
|
|
—
|
|
—
|
|
—
|
|
—
|
|
180
|
|
—
|
|
180
|
|
||||||||||||||||||||||
|
Deemed contribution on debt guarantee
|
—
|
|
—
|
|
—
|
|
—
|
|
—
|
|
—
|
|
—
|
|
—
|
|
3,930
|
|
—
|
|
3,930
|
|
||||||||||||||||||||||
|
Sale of preferred stock, net of issuance costs of $95 (Note 9)
|
—
|
|
—
|
|
—
|
|
—
|
|
—
|
|
—
|
|
2,405
|
|
—
|
|
—
|
|
—
|
|
—
|
|
||||||||||||||||||||||
|
Conversion of convertible notes into preferred stock (Note 7)
|
—
|
|
—
|
|
—
|
|
—
|
|
—
|
|
8,476
|
|
5,540
|
|
—
|
|
—
|
|
—
|
|
—
|
|
||||||||||||||||||||||
|
Reclassification of warrants issued with preferred stock to derivative liability (Note 9)
|
—
|
|
—
|
|
—
|
|
—
|
|
—
|
|
—
|
|
(2,500
|
)
|
—
|
|
—
|
|
—
|
|
—
|
|
||||||||||||||||||||||
|
Beneficial conversion feature for antidilution adjustment (Note 9)
|
—
|
|
594
|
|
4,748
|
|
—
|
|
1,060
|
|
—
|
|
—
|
|
—
|
|
(6,402
|
)
|
—
|
|
(6,402
|
)
|
||||||||||||||||||||||
|
Beneficial conversion feature on sale of preferred stock (Note 9)
|
—
|
|
—
|
|
—
|
|
—
|
|
—
|
|
—
|
|
4,232
|
|
—
|
|
(4,232
|
)
|
—
|
|
(4,232
|
)
|
||||||||||||||||||||||
|
Beneficial conversion feature on conversion of convertible notes (Note 7)
|
—
|
|
—
|
|
—
|
|
—
|
|
—
|
|
6,998
|
|
3,804
|
|
—
|
|
—
|
|
—
|
|
—
|
|
||||||||||||||||||||||
|
Adjustment of preferred stock to liquidation value (Note 9)
|
—
|
|
(594
|
)
|
(4,748
|
)
|
—
|
|
(1,060
|
)
|
1,478
|
|
10,638
|
|
—
|
|
(5,714
|
)
|
—
|
|
(5,714
|
)
|
||||||||||||||||||||||
|
Balance as of December 31, 2013
|
$
|
250
|
|
$
|
4,215
|
|
$
|
28,121
|
|
$
|
—
|
|
$
|
13,500
|
|
$
|
16,952
|
|
$
|
24,119
|
|
$
|
—
|
|
$
|
5,168
|
|
$
|
(113,277
|
)
|
$
|
(108,109
|
)
|
|||||||||||
|
Net loss
|
—
|
|
—
|
|
—
|
|
—
|
|
—
|
|
—
|
|
—
|
|
—
|
|
—
|
|
(4,234
|
)
|
(4,234
|
)
|
||||||||||||||||||||||
|
Exercise of stock options
|
—
|
|
—
|
|
—
|
|
—
|
|
—
|
|
—
|
|
—
|
|
—
|
|
9
|
|
—
|
|
9
|
|
||||||||||||||||||||||
74
|
Stock-based compensation expense
|
—
|
|
—
|
|
—
|
|
—
|
|
—
|
|
—
|
|
—
|
|
—
|
|
1,201
|
|
—
|
|
1,201
|
|
||||||||||||||||||||||
|
Sale of preferred stock(Note 9)
|
—
|
|
—
|
|
—
|
|
—
|
|
—
|
|
—
|
|
544
|
|
—
|
|
—
|
|
—
|
|
—
|
|
||||||||||||||||||||||
|
Reclassification of warrants issued with preferred stock to derivative liability (Note 9)
|
—
|
|
—
|
|
—
|
|
—
|
|
—
|
|
—
|
|
(544
|
)
|
—
|
|
—
|
|
—
|
|
—
|
|
||||||||||||||||||||||
|
Beneficial conversion feature for sale of preferred stock (Note 9)
|
—
|
|
—
|
|
—
|
|
—
|
|
—
|
|
—
|
|
909
|
|
—
|
|
(909
|
)
|
—
|
|
(909
|
)
|
||||||||||||||||||||||
|
Beneficial conversion feature for antidilution adjustment (Note 9)
|
—
|
|
18
|
|
153
|
|
—
|
|
43
|
|
—
|
|
—
|
|
—
|
|
(214
|
)
|
—
|
|
(214
|
)
|
||||||||||||||||||||||
|
Adjustment of preferred stock to liquidation value
|
—
|
|
(18
|
)
|
(153
|
)
|
—
|
|
(43
|
)
|
—
|
|
724
|
|
—
|
|
(510
|
)
|
—
|
|
(510
|
)
|
||||||||||||||||||||||
|
Issuance of common stock from the IPO, net of underwriting discounts and commissions and offering expenses (Note 1)
|
—
|
|
—
|
|
—
|
|
—
|
|
—
|
|
—
|
|
—
|
|
6
|
|
54,577
|
|
—
|
|
54,583
|
|
||||||||||||||||||||||
|
Conversion of preferred stock into shares of common stock (Note 9)
|
(250
|
)
|
(4,215
|
)
|
(28,121
|
)
|
—
|
|
(13,500
|
)
|
(16,952
|
)
|
(25,752
|
)
|
2
|
|
88,788
|
|
—
|
|
88,790
|
|
||||||||||||||||||||||
|
Warrant derivative liability reclassified to additional paid-in capital (Note 10)
|
—
|
|
—
|
|
—
|
|
—
|
|
—
|
|
—
|
|
—
|
|
—
|
|
2,701
|
|
—
|
|
2,701
|
|
||||||||||||||||||||||
|
Exercise of common stock warrants (Note 10)
|
—
|
|
—
|
|
—
|
|
—
|
|
—
|
|
—
|
|
—
|
|
—
|
|
55
|
|
—
|
|
55
|
|
||||||||||||||||||||||
|
Issuance of common stock - ESPP
|
—
|
|
—
|
|
—
|
|
—
|
|
—
|
|
—
|
|
—
|
|
—
|
|
68
|
|
—
|
|
68
|
|
||||||||||||||||||||||
|
Balance as of December 31, 2014
|
$
|
—
|
|
$
|
—
|
|
$
|
—
|
|
$
|
—
|
|
$
|
—
|
|
$
|
—
|
|
$
|
—
|
|
$
|
8
|
|
$
|
150,934
|
|
$
|
(117,511
|
)
|
$
|
33,431
|
|
|||||||||||
The accompanying notes are an integral part of the financial statements.
75
SCYNEXIS, INC.
(in thousands)
The accompanying notes are an integral part of the financial statements.
|
|
Year Ended December 31,
|
||||||
|
|
2014
|
2013
|
|||||
|
Cash flows from operating activities:
|
|||||||
|
Net loss
|
$
|
(4,234
|
)
|
$
|
(30,461
|
)
|
|
|
Adjustments to reconcile net loss to net cash used in operating activities:
|
|||||||
|
Beneficial conversion feature on convertible notes — related party
|
—
|
|
10,802
|
|
|||
|
Gain on insurance recovery
|
(165
|
)
|
—
|
|
|||
|
Gain on sale of asset, net of transaction expenses
|
—
|
|
(988
|
)
|
|||
|
Loss on extinguishment of debt
|
1,389
|
|
—
|
|
|||
|
Allowance for bad debts
|
—
|
|
(10
|
)
|
|||
|
Depreciation
|
1,238
|
|
1,329
|
|
|||
|
Stock-based compensation expense
|
1,201
|
|
180
|
|
|||
|
Amortization of deferred financing costs and debt discount
|
755
|
|
3,485
|
|
|||
|
Change in fair value of derivative liability
|
(10,080
|
)
|
7,886
|
|
|||
|
Changes in deferred rent
|
(187
|
)
|
(53
|
)
|
|||
|
Changes in operating assets and liabilities:
|
|||||||
|
Accounts receivable and unbilled services
|
(439
|
)
|
1,366
|
|
|||
|
Prepaid expenses, other assets, and deferred costs
|
(490
|
)
|
(102
|
)
|
|||
|
Accounts payable and accrued expenses
|
1,575
|
|
(82
|
)
|
|||
|
Interest payable — related party
|
—
|
|
892
|
|
|||
|
Deferred revenue
|
(35
|
)
|
1,449
|
|
|||
|
Net cash used in operating activities
|
(9,472
|
)
|
(4,307
|
)
|
|||
|
Cash flows from investing activities:
|
|||||||
|
Proceeds from insurance recovery
|
216
|
|
—
|
|
|||
|
Proceeds from sale of asset, net of transaction expenses
|
—
|
|
988
|
|
|||
|
Purchases of property and equipment
|
(704
|
)
|
(431
|
)
|
|||
|
Net cash (used in) provided by investing activities
|
(488
|
)
|
557
|
|
|||
|
Cash flows from financing activities:
|
|||||||
|
Proceeds from initial public offering
|
62,000
|
|
|
|
|||
|
Proceeds from issuance of convertible notes
|
—
|
|
899
|
|
|||
|
Proceeds from sale of preferred stock
|
544
|
|
2,500
|
|
|||
|
Preferred stock issuance costs
|
—
|
|
(95
|
)
|
|||
|
Repayment of debt
|
(15,000
|
)
|
|
|
|||
|
Payments of deferred offering costs and underwriting discounts and commissions
|
(6,875
|
)
|
(542
|
)
|
|||
|
Proceeds from employee stock purchase plan issuance
|
68
|
|
—
|
|
|||
|
Proceeds from exercise of stock warrants
|
55
|
|
—
|
|
|||
|
Proceeds from exercise of stock options
|
9
|
|
5
|
|
|||
|
Net cash provided by financing activities
|
40,801
|
|
2,767
|
|
|||
|
Net increase (decrease) in cash and cash equivalents
|
30,841
|
|
(983
|
)
|
|||
|
Cash and cash equivalents, beginning of period
|
1,402
|
|
2,385
|
|
|||
|
Cash and cash equivalents, end of period
|
$
|
32,243
|
|
$
|
1,402
|
|
|
|
Supplemental cash flow information:
|
|||||||
|
Cash paid for interest
|
$
|
49
|
|
$
|
197
|
|
|
|
Noncash financing and investing activities:
|
|||||||
|
Conversion of convertible notes into preferred stock
|
$
|
—
|
|
$
|
14,016
|
|
|
|
Beneficial conversion feature on sale of Series D-2 preferred stock
|
$
|
909
|
|
$
|
4,232
|
|
|
|
Beneficial conversion feature for antidilution adjustment
|
$
|
214
|
|
$
|
6,402
|
|
|
|
Adjustment of preferred stock to redemption value
|
$
|
510
|
|
$
|
5,714
|
|
|
|
Issuance of warrants allocated to debt discount
|
$
|
906
|
|
$
|
1,168
|
|
|
|
Deemed contribution of a loan guarantee
|
$
|
—
|
|
$
|
3,930
|
|
|
|
Issuance of warrants with preferred stock
|
$
|
—
|
|
$
|
2,500
|
|
|
|
Equipment purchase in accounts payable and accrued expenses
|
$
|
34
|
|
$
|
15
|
|
|
|
Impairment of fixed asset
|
$
|
51
|
|
$
|
—
|
|
|
|
Deferred offering costs included in accounts payable
|
$
|
—
|
|
$
|
1,233
|
|
|
|
Deferred offering costs reclassified to additional paid-in capital
|
$
|
4,126
|
|
$
|
—
|
|
|
|
Warrant derivative liability reclassified to additional paid-in capital
|
$
|
2,701
|
|
$
|
—
|
|
|
|
Conversion of convertible preferred stock to common stock
|
$
|
88,790
|
|
$
|
—
|
|
|
76
SCYNEXIS, INC.
NOTES TO THE FINANCIAL STATEMENTS
(in thousands, except percentage, share and per share data)
|
1.
|
Description of Business and Basis of Preparation
|
Organization
SCYNEXIS, Inc. (“SCYNEXIS” or the “Company”) is a Delaware corporation formed on
November 4, 1999
. SCYNEXIS is a pharmaceutical company, headquartered in Durham, North Carolina, committed to the discovery, development and commercialization of novel anti-infectives to address significant unmet therapeutic needs. The Company also offers its services in drug discovery and development, primarily in the form of integrated research teams consisting of medicinal, computational, analytical, and process scientists working on a collaborative basis with its customers on research projects.
Use of Estimates
The preparation of financial statements in conformity with US GAAP requires the Company to make estimates and assumptions that affect the reported amounts of assets and liabilities and disclosure of contingent assets and liabilities as of the date of the financial statements and the reported amounts of revenues and expenses during the reporting period. Actual results could differ from those estimates. Significant estimates include: the accounts receivable allowance; the valuation of the related-party deemed contribution; the fair value of the Company’s common stock used to measure stock-based compensation for options granted to employees and nonemployees and to determine the fair value of common stock warrants; the fair value of convertible preferred stock; the fair value of the Company’s derivative liability; the estimate of services and effort expended by third-party research and development service providers used to recognize research and development expense; and the estimated useful lives of property and equipment.
Reverse Stock-splits
On March 17, 2014, the Company amended its amended and restated certificate of incorporation to implement a
1-for-4 reverse stock split
of its common stock. The reverse stock split did not cause an adjustment to the par value or the authorized shares of the common stock. As a result of the reverse stock split, the Company adjusted the share amounts under its employee incentive plans, outstanding options and common stock warrant agreements with third parties.
On April 25, 2014, the Company amended its amended and restated certificate of incorporation to implement an additional
1-for-5.1 reverse stock split
of its common stock. The reverse stock split did not cause an adjustment to the par value or the authorized shares of the common stock. As a result of the reverse stock split, the Company further adjusted the share amounts under its employee incentive plans, outstanding options and common stock warrant agreements with third parties.
All disclosures of common shares and per common share data in the accompanying financial statements and related notes reflect these two reverse stock splits for all periods presented.
Initial Public Offering
On May 7, 2014, the Company completed an initial public offering (“IPO”) of its common stock. The Company sold an aggregate of
6,200,000
shares of common stock under the registration statement on Form S-1 declared effective by the SEC on May 2, 2014, at a public offering price of
$10.00
per share. Net proceeds were
$54,583
, after deducting underwriting discounts and commissions of
$3,290
and offering expenses of
$4,127
. Upon the completion of the IPO, all outstanding shares of the Company’s convertible preferred stock were automatically converted into
1,691,884
shares of common stock and certain outstanding warrants were exercised for an additional
275,687
shares of common stock. In connection with the consummation of the IPO, the Company repaid outstanding debt with a principal balance of
$15,000
, plus all accrued interest, to the holder of such debt, which was outstanding pursuant to a credit agreement referred to herein as the 2013 Credit Agreement. The significant increase in the shares outstanding beginning in May 2014 has impacted the comparability of the Company's net loss per share calculations between 2013 and 2014 periods.
77
|
2.
|
Summary of Significant Accounting Policies
|
Concentration of Credit Risk
Financial instruments, which potentially expose the Company to concentrations of credit risk, consist principally of cash on deposit with a bank, which exceeds insured limits, and accounts receivable and unbilled services. Ongoing credit evaluations of customer’s financial condition are performed by the Company and collateral is not required.
One customer represented
31%
and another customer represented
15%
of accounts receivable and unbilled services at
December 31, 2014
. Two customers each represented
16%
and one customer represented
14%
of accounts receivable and unbilled services at
December 31, 2013
. No other customer accounted for
10%
or more of accounts receivable and unbilled services.
One
customer, which is a related-party (Note 14), accounted for
38%
and
43%
of the Company’s total revenues in the years ended
December 31, 2014
and
2013
, respectively. Another customer accounted for
16%
of the Company's total revenues in the year ended
December 31, 2014
. No other customer accounted for more than 10% of the Company’s total revenues in
2014
or
2013
.
Cash and Cash Equivalents
The Company considers any highly liquid investments with a remaining maturity of three months or less when purchased to be cash and cash equivalents.
Accounts Receivable and Unbilled Services
Accounts receivable and unbilled services consist of amounts billed and unbilled under the Company’s service contracts with its customers. The Company extends credit to customers without requiring collateral. Accounts receivable are stated at net realizable value. On a periodic basis, the Company evaluates its accounts receivable and establishes an allowance based on its history of collections and write-offs and the current status of all receivables. The Company does not accrue interest on trade receivables.
Property and Equipment
Property and equipment are stated at cost, less accumulated depreciation. Depreciation is determined on a straight-line basis over the estimated useful lives of the assets, which generally range from three to seven years. Leasehold improvements are amortized over the shorter of the useful life of the asset or the term of the related lease. Maintenance and repairs are charged against expense as incurred.
Deferred Financing Costs
Deferred financing costs were transaction costs associated with issuing debt as well as costs related to a deemed contribution for a guarantee from a related party. The Company recognized these costs in the balance sheet as noncurrent assets. Deferred financing costs were amortized over the life of the related debt.
Other Assets
Other assets consist primarily of the refundable long-term deposit on the leased building facility and the refundable amount held by the Company’s employee dental plan insurance provider as required by its agreement.
Deferred Offering Costs
Deferred offering costs were expenses directly related to the IPO. These costs consisted of legal, accounting, printing, and filing fees that the Company capitalized, including fees incurred by the independent registered public accounting firm directly related to the offering. The deferred offering costs were offset against the IPO proceeds in May 2014 and were reclassified to additional paid-in capital upon completion of the IPO. As of
December 31, 2014
and
2013
, the amount capitalized as deferred offering costs was
$0
and
$1,775
, respectively.
Impairment of Long-Lived Assets
Long-lived assets to be held and used are reviewed for impairment whenever events or changes in circumstances indicate that the carrying amount of the asset may not be recoverable. When such events occur, the Company compares the carrying amounts of the assets to their undiscounted expected future cash flows. If the undiscounted cash flows are insufficient to recover the carrying value, an impairment loss is recorded for the difference between the carrying value and fair value of the asset. To date, no such impairment has occurred.
Revenue Recognition and Deferred Revenue
78
The Company derives the majority of its revenue from providing contract research and development services under fee for service arrangements. The Company also has entered into collaboration arrangements in exchange for non-refundable upfront payments and consideration as services are performed. These arrangements include multiple elements, such as the sale of licenses and the provision of services. Under these arrangements, the Company also is entitled to receive development milestone payments and royalties in the form of a designated percentage of product sales. The Company classifies non-refundable upfront payments, milestone payments and royalties received under collaboration and licensing agreements as revenues within its statements of operations because the Company views such activities as being central to its business operations.
Revenue is recognized when all of the following conditions are met: (i) persuasive evidence of an arrangement exists, (ii) delivery has occurred or services have been rendered, (iii) fees are fixed or determinable, and (iv) collection of fees is reasonably assured. The Company’s contract research and development services revenue is recognized in the period in which the services are performed.
When entering into an arrangement, the Company first determines whether the arrangement includes multiple deliverables and is subject to accounting guidance in ASC subtopic 605-25,
Multiple-Element Arrangements
. If the Company determines that an arrangement includes multiple elements, it determines whether the arrangement should be divided into separate units of accounting and how the arrangement consideration should be measured and allocated among the separate units of accounting. An element qualifies as a separate unit of accounting when the delivered element has standalone value to the customer. The Company’s arrangements do not include a general right of return relative to delivered elements. Any delivered elements that do not qualify as separate units of accounting are combined with other undelivered elements within the arrangement as a single unit of accounting. If the arrangement constitutes a single combined unit of accounting, the Company determines the revenue recognition method for the combined unit of accounting and recognizes the revenue over the period from inception through the date the last deliverable within the single unit of accounting is delivered.
Non-refundable upfront license fees are recorded as deferred revenue and recognized into revenue on a straight-line basis over the estimated period of the Company’s substantive performance obligations. If the Company does not have substantive performance obligations, the Company recognizes non-refundable upfront fees into revenue through the date the deliverable is satisfied. Analyzing the arrangement to identify deliverables requires the use of judgment and each deliverable may be an obligation to deliver services, a right or license to use an asset, or another performance obligation. In arrangements that include license rights and other non-contingent deliverables, such as participation in a steering committee, these deliverables do not have standalone value because the non-contingent deliverables are dependent on the license rights. That is, the non-contingent deliverables would not have value without the license rights, and only the Company can perform the related services. Upfront license rights and non-contingent deliverables, such as participation in a steering committee, do not have standalone value as they are not sold separately and they cannot be resold. In addition, when non-contingent deliverables are sold with upfront license rights, the license rights do not represent the culmination of a separate earnings process. As such, the Company accounts for the license and the non-contingent deliverables as a single combined unit of accounting. In such instances, the license revenue in the form of non-refundable upfront payments is deferred and recognized over the applicable relationship period, which historically has been the estimated period of the Company’s substantive performance obligations or the period the rights granted are in effect. The Company recognizes contingent event-based payments under license agreements when the payments are received. The Company has not received any royalty payments to date.
The Company will recognize a milestone payment when earned if it is substantive and the Company has
no
ongoing performance obligations related to the milestone. A milestone payment is considered substantive if it: 1) is commensurate with either the Company’s performance to achieve the milestone or the enhanced value of the delivered item as a result of a specific outcome from the Company’s performance to achieve the milestone; 2) relates solely to past performance; and 3) is reasonable relative to all of the deliverables and payment terms, including other potential milestone consideration, within the arrangement.
Amounts received prior to satisfying all revenue recognition criteria are recorded as deferred revenue in the accompanying balance sheets.
The Company’s deferred revenue includes non-refundable upfront payments received under certain licensing and collaboration arrangements that contain substantive performance obligations that the Company is providing over respective defined service or estimated relationship periods. Such non-refundable upfront payments are recognized over these defined service or estimated relationship periods. The Company received non-refundable upfront payments of
$313
,
$1,500
and
$500
in August 2012, August 2013 and January 2014, respectively, which are recognized over periods of
six
months,
70
months and
48
months, respectively. The Company recognized revenue from these non-refundable upfront payments of
$378
and
$157
for the
years ended December 31, 2014 and 2013
, respectively.
79
Collaboration Arrangements
The Company assesses its contractual arrangements, and presents costs incurred and payments received under contractual arrangements, in accordance with FASB ASC 808,
Collaborative Arrangements
(Topic 808), when the Company determines that the contractual arrangement incudes a joint operating activity, has active participation by both parties, and both parties are subject to significant risks and rewards under the arrangement. When reimbursement payments are due to the Company under a collaborative arrangement within the scope of Topic 808, the Company determines the appropriate classification for each specific reimbursement payment in the statements of operations by considering (i) the nature of the arrangement, (ii) the nature of the Company’s business operations, and (iii) the contractual terms of the arrangement.
The Company has concluded that the August 2013 development, license, and supply agreement with R-Pharm, CJSC (“R-Pharm”), combined with the supplemental arrangement in November 2014, is a collaborative arrangement pursuant to Topic 808 and the Company’s previously described accounting policy. This agreement and supplemental arrangement is further described in Note 18. The reimbursements due from R-Pharm for specified research and development costs incurred by the Company are classified as a reduction to research and development expense in the accompanying statements of operations. The reimbursements due to the Company are recorded as a reduction of expense when (i) the reimbursable expenses have been incurred by the Company, (ii) persuasive evidence of a cost reimbursement arrangement exists, (iii) reimbursable costs are fixed or determinable, and (iv) the collection of the reimbursement payment is reasonably assured. Unpaid reimbursement amounts due from R-Pharm at period end are presented as an other current asset in the accompanying balance sheets.
Research and Development
Major components of research and development costs include clinical trial activities and services, including related drug formulation, manufacturing, and other development, preclinical studies, cash compensation, stock-based compensation, fees paid to consultants and other entities that conduct certain research and development activities on the Company’s behalf, materials and supplies, legal services, and regulatory compliance.
The Company is required to estimate its expenses resulting from its obligations under contracts with clinical research organizations, clinical site agreements, vendors, and consultants in connection with conducting SCY-078 clinical trials and preclinical development. The financial terms of these contracts are subject to negotiations which vary from contract to contract, and may result in payment flows that do not match the periods over which materials or services are provided to the Company under such contracts. The Company’s objective is to reflect the appropriate development and trial expenses in its financial statements by matching those expenses with the period in which the services and efforts are expended. For clinical trials, the Company accounts for these expenses according to the progress of the trial as measured by actual hours expended by CRO personnel, investigator performance or completion of specific tasks, patient progression, or timing of various aspects of the trial. For preclinical development services performed by outside service providers, the Company determines accrual estimates through financial models, taking into account development progress data received from outside service providers and discussions with applicable Company and service provider personnel.
Reimbursements of certain research and development costs by parties under collaborative arrangements have been recorded as a reduction of research and development expense presented within the statement of operations. Such reimbursements were made under the collaboration arrangement with R-Pharm, CJSC (“R-Pharm”), which is further described in Note 18. Information about the Company’s research and development expenses and reimbursements due under collaboration arrangements for the years ended December 31, 2014 and 2013 is presented as follows:
|
Year Ended December 31,
|
||||||||
|
2014
|
2013
|
|||||||
|
Research and development expense, gross
|
$
|
8,513
|
|
$
|
4,363
|
|
||
|
Less: Reimbursement of research and development expense
|
226
|
|
—
|
|
||||
|
Research and development expense, net of reimbursements
|
$
|
8,287
|
|
$
|
4,363
|
|
||
Patent Expenses
Costs related to filing and pursuing patent applications, as well as costs related to maintaining the Company's existing patent portfolio, are recorded as expense as incurred since recoverability of such expenditures is uncertain.
Fair Value of Financial Instruments
80
Fair value is defined as the price that would be received to sell an asset or paid to transfer a liability in an orderly transaction between market participants at the measurement date, based on the Company’s principal or, in absence of a principal, most advantageous market for the specific asset or liability.
The Company uses a three-tier fair value hierarchy to classify and disclose all assets and liabilities measured at fair value on a recurring basis, as well as assets and liabilities measured at fair value on a non-recurring basis, in periods subsequent to their initial measurement. The hierarchy requires the Company to use observable inputs when available, and to minimize the use of unobservable inputs when determining fair value. The three tiers are defined as follows:
|
•
|
Level 1 — Observable inputs that reflect quoted market prices (unadjusted) for identical assets or liabilities in active markets;
|
|
•
|
Level 2 — Observable inputs other than quoted prices in active markets that are observable either directly or indirectly in the marketplace for identical or similar assets and liabilities; and
|
|
•
|
Level 3 — Unobservable inputs that are supported by little or no market data, which require the Company to develop its own assumptions about the assumptions market participants would use in pricing the asset or liability based on the best information available in the circumstances.
|
Amortization of Deferred Financing Costs and Debt Discount
Amortization of deferred financing costs and debt discount includes the amortization of debt discount related to the warrants issued with the convertible notes (Note 7), the amortization of issuance costs related to the convertible notes, and amortization of the deferred financing costs related to a deemed contribution for a guarantee from a related party.
Comprehensive Loss
The Company has no items of comprehensive income or loss other than net loss.
Income Taxes
The Company provides for deferred income taxes under the asset and liability method, whereby deferred income taxes result from temporary differences between the tax bases of assets and liabilities and their reported amounts in the financial statements. Valuation allowances are established when necessary to reduce deferred tax assets to the amount that the Company believes is more likely than not to be realized. The Company recognizes uncertain tax positions when the positions will be more likely than not sustained based solely upon the technical merits of the positions.
Stock-Based Compensation
The Company measures and recognizes compensation expense for all stock-based payment awards made to employees, officers, and directors based on the estimated fair values of the awards as of grant date. The value of the portion of the award that is ultimately expected to vest is recorded as expense over the requisite service periods.
The Company also accounts for equity instruments issued to non-employees using a fair value approach. The Company values equity instruments and stock options granted to employees using the Black-Scholes valuation model. The measurement of non-employee share-based compensation is subject to periodic adjustments as the underlying equity instruments vest and is recognized as an expense over the term of the related financing or the period over which services are received. The Company estimated the fair value of common stock warrants granted to lenders at their intrinsic value, which was the estimated fair value of the common stock less the exercise price for the warrant.
Deferred Rent
The Company recognizes rent expense on a straight-line basis over the non-cancelable term of its operating lease and records the difference between cash rent payments and the recognition of rent expense as a deferred rent liability. The Company also records landlord-funded lease incentives, such as reimbursable leasehold improvements, as a deferred rent liability, which is amortized as a reduction of rent expense over the non-cancelable term of its operating lease.
Basic and Diluted Net Loss per Share of Common Stock
The Company uses the two-class method to compute net loss per share because the Company has issued securities, other than common stock, that contractually entitle the holders to participate in dividends and earnings of the Company. The two-class method requires earnings for the period to be allocated between common stock and participating securities based upon their respective rights to receive distributed and undistributed earnings. Holders of each series of the Company’s convertible preferred stock were entitled to participate in dividends, when and if declared by the SCYNEXIS Board of Directors (the "board of directors" or the "board"), that were made to common stockholders, and as a result were considered participating securities.
81
Under the two-class method, for periods with net income, basic net income per common share is computed by dividing the net income attributable to common stockholders by the weighted average number of shares of common stock outstanding during the period. Net income attributable to common stockholders is computed by subtracting from net income the portion of current year earnings that the participating securities would have been entitled to receive pursuant to their dividend rights had all of the year’s earnings been distributed. No such adjustment to earnings is made during periods with a net loss, as the holders of the participating securities have no obligation to fund losses. Diluted net loss per common share is computed under the two-class method by using the weighted average number of shares of common stock outstanding, plus, for periods with net income attributable to common stockholders, the potential dilutive effects of stock options and warrants. In addition, the Company analyzes the potential dilutive effect of the outstanding participating securities when calculating diluted earnings per share. Under the “treasury stock” method, it is assumed that the warrants and options were exercised at the beginning of the period and that the funds obtained from the exercise were used to reacquire the Company’s common stock at the average market price for the period and includes those securities when they are dilutive. Under the “if-converted” method, it is assumed that the outstanding participating securities convert into common stock at the beginning of the period. The Company reports the more dilutive of the approaches as its diluted net income or net loss per share during the period.
Segment and Geographic Information
Operating segments are defined as components of an enterprise (business activity from which it earns revenue and incurs expenses) about which discrete financial information is available and regularly reviewed by the chief operating decision maker in deciding how to allocate resources and in assessing performance. The Company’s chief operating decision maker (“CODM”) is the Chief Executive Officer. The CODM reviews consolidated operating results to make decisions about allocating resources and assessing performance for the entire Company. The Company views its operations and manages its business as one operating segment. All assets of the Company were held in the United States for the years ended
December 31, 2014
and
2013
.
Although all operations are based in the United States, the Company generated a portion of its revenue from customers outside of the United States. Information about the Company’s revenue from different geographic regions for the years ended
December 31, 2014
and
2013
is presented as follows:
|
|
Year Ended December 31,
|
||||||||||||
|
|
2014
|
2013
|
|||||||||||
|
United States
|
$
|
16,422
|
|
86
|
%
|
$
|
15,126
|
|
90
|
%
|
|||
|
Europe
|
1,235
|
|
7
|
%
|
1,626
|
|
10
|
%
|
|||||
|
Other non-US
|
1,367
|
|
7
|
%
|
105
|
|
—
|
|
|||||
|
Total
|
$
|
19,024
|
|
100
|
%
|
$
|
16,857
|
|
100
|
%
|
|||
All sales, including sales outside of the United States, are denominated in United States dollars.
Effect of Recent Accounting Pronouncements
In April 2014, the FASB issued ASU 2014-08,
Reporting Discontinued Operations and Disclosures of Disposals of Components of an Entity
, or ASU 2014-08. Under ASU 2014-08, only disposals representing a strategic shift in operations that have a major effect on the Company’s operations and financial results should be presented as discontinued operations. Additionally, ASU 2014-08 requires expanded disclosures about discontinued operations that will provide financial statement users with more information about the assets, liabilities, income, and expenses of discontinued operations. The amendments in ASU 2014-08 are effective for fiscal years, and interim periods within those years, beginning after December 15, 2014. However, ASU 2014-08 should not be applied to a component that is classified as held for sale before the effective date even if the component is disposed of after the effective date. Early adoption is permitted, but only for disposals (or classifications as held for sale) that have not been reported in financial statements previously issued. The effects of ASU 2014-08 will depend on any future disposals by the Company.
In May 2014, the Financial Accounting Standards Board (FASB) issued ASU No. 2014-09,
Revenue from Contracts with Customers: Topic 606,
or ASU 2014-09. ASU 2014-09 establishes the principles for recognizing revenue and develops a common revenue standard for U.S. GAAP. The standard outlines a single comprehensive model for entities to use in accounting for revenue arising from contracts with customers and supersedes the most current revenue recognition guidance. This guidance is effective for fiscal years and interim periods within those years beginning after December 15, 2016, which is effective for the Company for the year ending December 31, 2017. The Company is currently evaluating the impact that the implementation of ASU 2014-09 will have on the Company’s financial statements.
In August 2014, the FASB issued ASU No. 2014-15,
Disclosure of Uncertainties about an Entity’s Ability to Continue as a Going Concern
, or ASU 2014-15. ASU 2014-15 will explicitly require management to assess an entity’s ability to continue as a going concern, and to provide related footnote disclosure in certain circumstances. The new standard will be effective for all entities in the first annual period ending after December 15, 2016. Earlier adoption is permitted. The Company is not early
82
adopting ASU 2014-15. The Company is currently evaluating the impact that the implementation of ASU 2014-15 will have on the Company’s financial statements.
A summary of activity in the allowance for bad debts for the years ended
December 31, 2014
and
2013
is as follows:
|
Balance at
Beginning of
Period
|
Additions
Charged
to Expense
|
Deductions
|
Balance at
End of
Period
|
||||||||||||
|
Year ended December 31, 2013
|
$
|
251
|
|
$
|
—
|
|
$
|
(88
|
)
|
$
|
163
|
|
|||
|
Year ended December 31, 2014
|
$
|
163
|
|
$
|
—
|
|
$
|
(163
|
)
|
$
|
—
|
|
|||
4. Prepaid Expenses and Other Current Assets
Prepaid expenses and other current assets consist of the following:
|
|
December 31,
|
||||||
|
|
2014
|
2013
|
|||||
|
Prepaid SCY-078 development services
|
$
|
149
|
|
$
|
—
|
|
|
|
Prepaid service contracts
|
67
|
|
86
|
|
|||
|
Prepaid insurance
|
295
|
|
97
|
|
|||
|
Other prepaid expenses
|
252
|
|
301
|
|
|||
|
Other receivable due from R-Pharm
|
226
|
|
—
|
|
|||
|
Other current assets
|
3
|
|
5
|
|
|||
|
$
|
992
|
|
$
|
489
|
|
||
|
5.
|
Property and Equipment
|
Property and equipment consists of the following:
|
December 31,
2014 |
December 31,
2013 |
||||||
|
Equipment
|
$
|
8,552
|
|
$
|
9,577
|
|
|
|
Furniture and fixtures
|
375
|
|
378
|
|
|||
|
Leasehold improvements
|
13,193
|
|
13,115
|
|
|||
|
Total property and equipment
|
22,120
|
|
23,070
|
|
|||
|
Less accumulated depreciation
|
17,285
|
|
17,669
|
|
|||
|
Property and equipment, net
|
$
|
4,835
|
|
$
|
5,401
|
|
|
Depreciation expense was
$1,238
and
$1,329
for the years ended
December 31, 2014
and
2013
, respectively.
In the quarter ended June 30, 2014, the Company’s insurance carrier remitted proceeds for the replacement cost of a fixed asset that was damaged by severe weather. The asset’s net book value was reduced upon occurrence of the damage. The proceeds received from the insurance recovery exceeded the net book value of the asset by
$165
, which was recognized as a
83
gain during the quarter ended June 30, 2014. The replacement asset was delivered, installed and placed in service during the quarter ended September 30, 2014.
6. Accrued Expenses
Accrued expenses consist of the following:
|
|
December 31,
|
||||||
|
|
2014
|
2013
|
|||||
|
Accrued research and development expenses
|
$
|
293
|
|
$
|
102
|
|
|
|
Accrued employee bonus compensation
|
1,464
|
|
—
|
|
|||
|
Interest payable
|
—
|
|
23
|
|
|||
|
Employee withholdings
|
156
|
|
61
|
|
|||
|
Other accrued expenses
|
584
|
|
872
|
|
|||
|
$
|
2,497
|
|
$
|
1,058
|
|
||
Severance Costs
In June 2014, the Company reduced its workforce in an effort to reduce operating costs. Employee severance costs associated with this action were
$379
, which were expensed in the quarter ended June 30, 2014. The severance costs are being paid out through the Company's normal payroll disbursements on a monthly basis from July 2014 to January 2015. As of
December 31, 2014
,
$362
had been paid out and the remaining costs of
$17
are included in accrued expenses in the accompanying balance sheets.
|
7.
|
Debt Obligations
|
Credit Facility Agreement
In April 2010, the Company entered into a
$15,000
credit facility agreement with HSBC Bank (the “2010 Credit Agreement”). The agreement comprised a
$5,000
term loan and a
$10,000
revolving credit facility. Borrowings under the 2010 Credit Agreement carried interest at a rate of London InterBank Offered Rate plus
0.95%
per annum. The 2010 Credit Agreement required interest-only payments through March 2013 and was guaranteed by a related party that has an investment in the Company. All outstanding borrowings under the agreement were originally due on March 11, 2013. The 2010 Credit Agreement contained no financial covenants.
At the inception of the 2010 Credit Agreement, a deemed contribution in relation to the guarantee of the 2010 Credit Agreement was recognized as deferred financing costs and amortized over the life of the loan. The value of the guarantee was determined based on the difference between the loan’s stated interest rate and the interest rate that would apply if there had been no guarantee from the related party. The Company determined the value of the 2010 Credit Agreement guarantee to be
$6,338
, which was amortized over the original life of the loan.
On March 8, 2013, the Company entered into an agreement to amend the 2010 Credit Agreement with HSBC Bank (the “2013 Credit Agreement”). The 2013 Credit Agreement required interest-only payments through December 2014 when all outstanding borrowings were due. Other significant terms of the 2010 Credit Agreement remained the same, which included the guarantee made by a related party that has an investment in the Company. The 2013 Credit Agreement represented a new loan, and the Company determined the value of the extended guarantee under the 2013 Credit Agreement to be
$3,930
, which was amortized over the term of the 2013 Credit Agreement. As of
December 31, 2013
, both the
$5,000
term loan and the
$10,000
revolving credit facility were outstanding under the 2013 Credit Agreement.
Pursuant to an addendum dated April 29, 2014, upon completion of the IPO on May 7, 2014, the entire outstanding balance of the 2013 Credit Agreement, amounting to
$15,000
plus accrued interest, was paid in full using the proceeds from the IPO. The payment on May 7, 2014, released the related party guarantor from all obligations under and in relation to the 2013 Credit Agreement. The Company recorded a loss on the extinguishment of debt of
$1,389
in the three month period ended June 30, 2014 as the remaining deferred financing costs associated with the 2013 Credit Agreement were written off. The Company had
no
outstanding debt as of
December 31, 2014
.
84
Amortization of deferred financing costs associated with the 2010 Credit Agreement and 2013 Credit Agreement was
$755
and
$2,317
for the years ended
December 31, 2014
and
2013
, respectively.
The weighted-average interest rate was
1.19%
and
1.20%
for the years ended
December 31, 2014
and
2013
, respectively. Interest expense was
$48
and
$192
for the years ended
December 31, 2014
and
2013
, respectively.
Note and Warrant Purchase Agreements
In December 2011, the Company executed a Note and Warrant Purchase Agreement (the “December 2011 Note and Warrant Agreement”) to issue convertible notes in an aggregate amount not to exceed
$15,000
. In 2011 and 2012, under the December 2011 Note and Warrant Agreement, the Company issued convertible notes (the “2011-2012 Notes”) with a total principal amount of
$11,444
to related parties that held investments in the Company. The 2011-2012 Notes included warrants to purchase
26,000
shares of the Company’s common stock at
$0.20
per share. The 2011-2012 Notes were convertible into shares of the Company’s stock under various methods as stipulated in the agreement.
In June 2013, the Company executed another Note and Warrant Purchase Agreement (the “June 2013 Note and Warrant Agreement”) with certain existing lenders. Under the June 2013 Note and Warrant Agreement, the lenders agreed to loan to the Company up to
$1,500
in exchange for convertible notes (the “June 2013 Notes”). The Company issued June 2013 Notes for an aggregate amount of
$899
. In addition, the Company agreed to issue warrants to purchase shares of the Company’s common stock upon the request of a majority of the noteholders. The June 2013 Notes were convertible into shares of the Company’s stock using methods described in the agreement. In addition, the June 2013 Notes included conversion of the entire outstanding principal and interest balance into equity securities upon the closing of any equity financing at the option of the noteholders.
The 2011-2012 Notes and June 2013 Notes carried interest at a rate of
8%
per annum and contained no financial covenants. The outstanding principal amount and unpaid accrued interest on the convertible notes issued under the December 2011 Note and Warrant Agreement and the June 2013 Note and Warrant Agreement were originally due on December 31, 2012 and December 31, 2013, respectively, contingent upon (i) the prior written consent of holders of at least
70%
of the outstanding aggregated principal amount of the convertible notes issued under the same agreement, and (ii) the prior written consent of HSBC Bank for so long as any of the principal and interest related to the 2010 Credit Agreement or the 2013 Credit Agreement remained outstanding.
On the date of issuance, the fair value of warrants issued in the year ended December 31, 2012 under the December 2011 Note and Warrant Agreement was
$328
. The fair value of these warrants was accounted for as debt discount and amortized to expense over the stated term of the 2011-2012 Notes. The fair value of the obligation to issue warrants in connection with the June 2013 Notes was
$1,168
. The fair value of the obligation to issue warrants was
$269
above the face value of the June 2013 Notes and this excess was expensed at issuance. The
$899
remaining amount of the fair value of the obligation to issue warrants was accounted for as a debt discount and was amortized to expense over the term of the June 2013 Notes. The amount of the discount related to the 2011-2012 Notes’ warrants and the June 2013 Notes’ obligation to issue warrants that was amortized to expense was
$0
and
$1,168
for the years ended
December 31, 2014
and
2013
, respectively.
On December 11, 2013, the noteholders elected to convert the June 2013 Notes into shares of Series D-2 convertible preferred stock. Under the election, the outstanding principal and accrued interest balance of
$899
and
$33
, respectively, was converted into
665,542
shares of Series D-2 convertible preferred stock at a conversion price of
$1.40
per share. Consistent with the original terms of the June 2013 Notes, the conversion price was adjusted to
$1.40
per share because the Company adjusted the conversion price of the 2011-2012 Notes in connection with the sale and issuance of shares of Series D-2 convertible preferred stock on December 11, 2013 (Note 9).
Also on December 11, 2013, the noteholders elected to convert the 2011-2012 Notes into shares of Series D-1 and Series D-2 convertible preferred stock. Under the election, the outstanding principal and accrued interest balance of
$11,444
and
$1,640
, respectively, was converted into
6,054,255
shares of Series D-1 convertible preferred stock and
3,291,443
shares of Series D-2 preferred stock at a conversion price of
$1.40
per share. The conversion price of the 2011-2012 Notes was adjusted to
$1.40
per share in connection with the sale and issuance of shares of Series D-2 convertible preferred stock on December 11, 2013 (Note 9).
Because the Company adjusted the original conversion price on the 2011-2012 Notes and the June 2013 Notes from
$4.3125
to
$1.40
, the Company recorded additional interest expense of
$10,802
as a result of the beneficial conversion for the antidilution adjustment on the Series D-1 convertible preferred stock and the Series D-2 convertible preferred stock. The intrinsic value of the beneficial conversion feature was calculated by multiplying the incremental number of shares of Series D-1 and Series D-2 convertible preferred stock the investors received (as a result of the Company reducing the conversion price to
$1.40
) by the estimated fair value of the Series D-1 and the Series D-2 convertible preferred stock on the
85
commitment date. Because the intrinsic value of the beneficial conversion feature was greater than the proceeds allocated to the 2011-2012 Notes and the June 2013 Notes, the amount recognized for the beneficial conversion feature was limited by the amount of the proceeds allocated to the convertible notes.
Due to the previously described conversions to Series D-1 Preferred and Series D-2 Preferred, there was
no
outstanding principal or accrued interest associated with the 2011-2012 Notes and June 2013 Notes as of December 31, 2013 and as of December 31, 2014.
|
8.
|
Commitments and Contingencies
|
Leases
The Company leases its facilities and certain office equipment under long-term non-cancelable operating leases. The Company’s lease for its primary North Carolina facility expires in
2019
. The lease agreement includes a renewal option to extend the lease through
March 31, 2024
.
Rent expense was approximately
$952
and
$906
for the years ended
December 31, 2014
and
2013
, respectively. Future minimum lease payments for all operating leases as of
December 31, 2014
are as follows:
|
2015
|
$
|
1,075
|
|
|
2016
|
1,104
|
|
|
|
2017
|
1,123
|
|
|
|
2018
|
1,156
|
|
|
|
2019
|
291
|
|
|
|
Thereafter
|
—
|
|
|
|
Total
|
$
|
4,749
|
|
License Arrangements with Potential Future Expenditures
As of
December 31, 2014
, the Company had a license arrangement with Merck Sharp & Dohme Corp., or Merck, as amended, that involves potential future expenditures. Under the license arrangement, the Company exclusively licensed from Merck its rights to SCY-078 in the field of human health. SCY-078 is the Company's lead product candidate. Pursuant to the terms of the license agreement, Merck is eligible to receive milestone payments from the Company that could total
$19,000
upon occurrence of specific events, including initiation of a phase 3 clinical study, new drug application, and marketing approvals in each of the U.S., major European markets and Japan. In addition, Merck is eligible to receive tiered royalties from the Company based on a percentage of worldwide net sales of SCY-078. The aggregate royalties are mid- to high-single digits.
In December 2014, the Company and Merck entered into an amendment to the license agreement that defers the remittance of a milestone payment due to Merck, such that no amount will be due upon initiation of the first phase 2 clinical trial of a product containing the SCY-078 compound (the "Deferred Milestone"). The amendment also increases, in an amount equal to the Deferred Milestone, the milestone payment that will be due upon initiation of the first Phase 3 clinical trial of a product containing the SCY-078 compound. Except as described above, all other terms and provisions of the license agreement remain in full force and effect.
The Company has
two
additional licensing agreements for other compounds that could require it to make payments of up to
$2,300
upon achievement of certain milestones by the Company.
Clinical Development Arrangement
In June 2014, the Company entered into an agreement with a third-party clinical research organization to conduct a Phase 2 clinical trial for SCY-078. The Company had
no
such commitments as of
December 31, 2013
. The scope of the services under the agreement can be modified at any time, and the agreement can be terminated by either party
30
days after receipt of written notice.
Other Arrangements
The Company entered into an agreement with a third party firm to assist the Company in exploring the divestiture of its contract research and development services business (Note 19). Pursuant to the terms of the agreement, in the event that the
86
Company is able to complete a divestiture of its contract research and development services business to a third-party, the Company is obligated to pay a success fee to the third party firm for the greater of
$500
or
4%
of the transaction consideration.
|
9.
|
Convertible Preferred Stock
|
The Company issued multiple series of convertible preferred stock between 2000 and January 2014. Each issuance is briefly described as follows:
Series A Convertible Preferred Stock (“Series A Preferred”)
In 2000, the Company issued
31,407
shares of Series A Preferred at
$7.96
per share to its initial employees and consultants.
Series B Convertible Preferred Stock (“Series B Preferred”)
In 2000, the Company issued
600,999
shares of Series B Preferred at
$9.01
per share in exchange for
$2,200
in equipment, intellectual property, and conversion of existing debt, and
$3,215
in cash, and incurred issuance costs of
$43
. Subsequently in 2000, the Company issued an additional
110,988
shares of Series B Preferred at
$9.01
per share for cash. As part of the issuance of the Series C convertible preferred stock in June 2002, the holders of Series B Preferred agreed to modify the redemption feature of the Series B Preferred to eliminate this feature. As described below,
244,173
shares of Series B Preferred were mandatorily converted into common stock during 2012.
Series C Convertible Preferred Stock (“Series C Preferred”) and Warrants
The Company issued warrants to purchase
100,524
shares of Series C Preferred in conjunction with certain bridge loan financings during 2001 and the subsequent 2002 Series C Preferred financing. The warrants were issued with an exercise price of
$0.01
per share. Two of the investors exercised such warrants during 2003.
In 2002, the Company issued
2,867,154
shares of Series C Preferred for
$24,000
in cash and the conversion of approximately
$4,513
of
4.5%
convertible notes and accrued interest, less issuance costs of approximately
$86
. As described below,
197,045
shares of Series C Preferred were mandatorily converted into common stock during 2012. In January 2005, the remaining warrants to purchase
23,911
shares of Series C Preferred shares were exercised.
Series C-1 Convertible Preferred Stock (“Series C-1 Preferred”) and Warrants
In August 2004, the Company received cash of
$3,200
for the issuance of
984,615
shares of Series C-1 Preferred. As described below, these Series C-1 Preferred shares were mandatorily converted into common stock during 2012.
Series C-2 Convertible Preferred Stock (“Series C-2 Preferred”)
In March 2008, the Company received cash of
$13,500
for the issuance of
2,347,826
shares of Series C-2 Preferred.
December 2013 Issuances of Series D-1 Convertible Preferred Stock (“Series D-1 Preferred) and Series D-2 Convertible Preferred Stock (“Series D-2 Preferred”)
On December 11, 2013, the Company entered into an agreement to sell
1,785,712
shares of Series D-2 Convertible Preferred Stock ("Series D-2 Preferred") at
$1.40
per share for an aggregate price of
$2,500
(the “Series D-2 Purchase Agreement”), less issuance costs of
$95
.
The Series D-2 Preferred was convertible into shares of common stock at a conversion price of
$28.56
per share and the fair value of the common stock on December 11, 2013 was
$48.35
. A convertible financial instrument includes a beneficial conversion feature if its conversion price is lower than the Company’s stock price (i.e., it’s in the money) at the commitment date. Therefore, the Company determined that the sale of the Series D-2 Preferred resulted in a beneficial conversion feature with an intrinsic value of
$4,232
, which the Company recorded as a reduction to additional paid-in capital upon the sale of the Series D-2 Preferred. The Company calculated the intrinsic value of the beneficial conversion feature as the difference between the estimated fair value of the common stock on December 11, 2013 of
$48.35
per share and the effective conversion price per share of
$0
multiplied by the number of shares of common stock issuable upon conversion of
87,532
.
Concurrent with the sale of the Series D-2 Preferred, the Company modified the terms of the 2011-2012 Notes and the related warrants and the June 2013 Notes and related warrants (Note 7). Under the amendments, the outstanding principal and accrued interest balance was converted into Series D-1 Preferred and Series D-2 Preferred at a conversion price of
$1.40
per share. As a result of the conversions, the Company issued
6,054,255
shares of Series D-1 Preferred and
3,956,985
shares of Series D-2 Preferred.
87
January 2014 Issuance of Series D-2 Preferred
On January 31, 2014, the Company sold
388,641
shares of Series D-2 Preferred to related parties under the Series D-2 Purchase Agreement at
$1.40
per share, for an aggregate price of
$544
. The Series D-2 Preferred was convertible into shares of common stock at a conversion price of
$28.56
per share and the fair value of the common stock on January 31, 2014 was
$47.74
. A convertible financial instrument includes a beneficial conversion feature if its conversion price is lower than the Company’s stock price (i.e., it’s in the money) at the commitment date. Therefore, the Company determined that the sale of the Series D-2 Preferred resulted in a beneficial conversion feature with an intrinsic value of
$909
, which the Company recorded as a reduction to additional paid-in capital upon the sale of the Series D-2 Preferred. The Company calculated the intrinsic value of the beneficial conversion feature as the difference between the estimated fair value of the common stock on January 31, 2014 of
$47.74
per share and the effective conversion price per share of
$0
multiplied by the number of shares of common stock issuable upon conversion of
19,048
.
Conversion of Convertible Preferred Stock In Conjunction with IPO
In March 2014, the Company amended its amended and restated certificate of incorporation to require the automatic conversion of all series of convertible preferred stock into common stock upon the completion of a public offering of common stock with gross proceeds of at least
$20,000
. There were no other changes in significant terms of the convertible preferred stock during the
year ended December 31, 2014
. In May 2014, upon completion of the IPO, all outstanding shares of convertible preferred stock were converted into an aggregate of
1,691,884
shares of common stock at their conversion prices.
Warrants Associated with Preferred Stock Issuances
In July 2006, the Company issued warrants to purchase
196,923
shares of Series C-1 Preferred with an exercise price of
$3.25
per share of Series C-1 Preferred. As of
December 31, 2014
, these warrants are equivalent to warrants to purchase
14,033
shares of common stock at an exercise price of
$45.61
per share of common stock. These warrants remain outstanding as of
December 31, 2014
and will expire on
July 14, 2016
. The fair value at the date of grant for these instruments was
$459
, which was recorded as a debt discount. The debt discount related to these warrants was fully amortized as of December 31, 2010. The Company determined that the warrants should be recorded as a derivative liability and stated at fair value at each reporting period. The Company recorded other income associated with the fair value adjustment for these warrants of
$37
and
$121
for the years ended
December 31, 2014
and
2013
, respectively.
The December 11, 2013 Series D-2 Purchase Agreement included warrants to purchase
87,532
shares of the Company’s common stock at
$0.20
per share. The fair value of the warrants on the date of issuance was
$4,214
, which was recorded as a discount to the Series D-2 Preferred. The fair value of the warrants was
$1,714
above the face amount of the Series D-2 Preferred and this excess was expensed to derivative fair value adjustment at issuance. As described in Note 10, the warrants were classified as a derivative liability and were stated at fair value at each reporting period end date prior to being exercised in May 2014 (in conjunction with the Company’s IPO).
The sale of Series D-2 Preferred on January 31, 2014 included warrants to purchase
19,048
shares of the Company’s common stock at
$0.20
per share. The fair value of the warrants on the date of issuance was
$906
. The fair value of the warrants was
$362
above the face amount of the Series D-2 Preferred and this excess was expensed to derivative fair value adjustment at issuance. As described in Note 10, the warrants were classified as a derivative liability and were stated at fair value at each reporting period end date prior to being exercised in May 2014 (in conjunction with the Company’s IPO).
Authorized, Issued, and Outstanding Convertible Preferred Shares Prior to IPO
The following table summarizes authorized, issued and outstanding preferred shares as of May 7, 2014, immediately prior to the automatic conversion to shares of common stock:
|
Authorized
|
Issued and
Outstanding
|
||||
|
Series A Preferred
|
31,410
|
|
31,407
|
|
|
|
Series B Preferred
|
711,987
|
|
467,814
|
|
|
|
Series C Preferred
|
2,967,678
|
|
2,770,633
|
|
|
|
Series C-1 Preferred
|
3,076,923
|
|
—
|
|
|
|
Series C-2 Preferred
|
2,347,826
|
|
2,347,826
|
|
|
|
Series D-1 Preferred
|
10,000,000
|
|
6,054,255
|
|
|
|
Series D-2 Preferred
|
10,000,000
|
|
6,131,338
|
|
|
|
Total
|
29,135,824
|
|
17,803,273
|
|
|
88
Convertible Preferred Stock Activity
The following table summarizes convertible preferred stock activity for the years ended
December 31, 2014
and
2013
:
|
|
Shares of
|
|||||||||||||||||||
|
|
Series A
Convertible
Preferred
Stock
|
Series B
Convertible
Preferred
Stock
|
Series C
Convertible
Preferred
Stock
|
Series C-1
Convertible
Preferred
Stock
|
Series C-2
Convertible
Preferred
Stock
|
Series D-1
Convertible
Preferred
Stock
|
Series D-2
Convertible
Preferred
Stock
|
|||||||||||||
|
Balance, December 31, 2012
|
31,407
|
|
467,814
|
|
2,770,633
|
|
—
|
|
2,347,826
|
|
—
|
|
—
|
|
||||||
|
Issuance of Series D-2 Preferred
|
—
|
|
—
|
|
—
|
|
—
|
|
—
|
|
—
|
|
1,785,712
|
|
||||||
|
Conversion of notes payable
|
—
|
|
—
|
|
—
|
|
—
|
|
—
|
|
6,054,255
|
|
3,956,985
|
|
||||||
|
Balance, December 31, 2013
|
31,407
|
|
467,814
|
|
2,770,633
|
|
—
|
|
2,347,826
|
|
6,054,255
|
|
5,742,697
|
|
||||||
|
Issuance of Series D-2 Preferred
|
—
|
|
—
|
|
—
|
|
—
|
|
—
|
|
—
|
|
388,641
|
|
||||||
|
Automatic conversion to common stock
|
(31,407
|
)
|
(467,814
|
)
|
(2,770,633
|
)
|
—
|
|
(2,347,826
|
)
|
(6,054,255
|
)
|
(6,131,338
|
)
|
||||||
|
Balance, December 31, 2014
|
—
|
|
—
|
|
—
|
|
—
|
|
—
|
|
—
|
|
—
|
|
||||||
Significant terms of the convertible preferred stock, prior to the automatic conversion in conjunction with the IPO, were as follows:
Voting rights
Each share had the right to vote equal to the number of shares of common stock into which it was convertible. Additionally, the approval of
65%
of the Series B Preferred, Series C Preferred, and Series C-2 Preferred stockholders, voting as separate classes, was required to change any bylaws; issue stock or securities with a preference to Series B Preferred, Series C Preferred, and Series C-2 Preferred; change any rights, preferences and privileges of Series B Preferred, Series C Preferred, and Series C-2 Preferred; or change the number of directors outside a range. Furthermore, the approval of
65%
of the Series C Preferred stockholders was required to liquidate, sell, or merge the Company.
Approval of
70%
of the Series D-1 Preferred and the Series D-2 Preferred (the “Series D Preferred”) stockholders, voting as a separate class, was required to change any bylaws; issue stock or securities with a preference to Series D Preferred; enter into a merger without loss of control by existing shareholders of the Company; or change any rights, preferences and privileges of Series D Preferred.
Dividend rights
Holders of Series D Preferred were entitled to receive
8%
of the original issue price per annum as a dividend on a “when and if” declared basis in preference to any dividend paid to other convertible preferred or common stockholders. Such dividends were payable only when, and if, declared by the board of directors and were noncumulative.
After payment of the
8%
Series D Preferred dividend, holders of all series of convertible preferred stock were entitled to receive dividends declared by the board of directors in preference to any dividend paid to common stockholders. Each share of preferred stock was entitled to the same amount as would have been declared or paid thereon had the holder thereof elected to convert the same into shares of common stock.
Liquidation rights
Holders of Series D-1 Preferred and Series D-2 Preferred had a liquidation preference of
two
and
three
times the original issue price plus all declared and unpaid dividends adjusted for events of dilution, respectively. Holders of Series A Preferred, Series B Preferred, Series C Preferred, Series C-1 Preferred, and Series C-2 Preferred had liquidation preferences of
$7.96
,
$9.01
,
$10.15
,
$3.25
, and
$5.75
per share, plus declared but unpaid dividends adjusted for events of dilution, respectively. Upon occurrence of a liquidation event, Series D-1 Preferred and Series D-2 Preferred would participate pari passu; then Series C-2 Preferred, Series C-1 Preferred, and Series C Preferred would participate pari passu; then Series B Preferred; then Series A Preferred would receive their liquidation preference; and the remaining assets would be distributed ratably to the preferred and common stockholders on an “as converted” basis.
89
Conversion rights
Each share of Series A Preferred was convertible into
0.20
shares of common stock. Each share of Series B Preferred and Series C Preferred was convertible into
0.28
shares of common stock as of the date of the IPO in May 2014. Each share of Series C-1 Preferred and Series C-2 Preferred was convertible into
0.07
shares of common stock as of the date of the IPO. Each share of Series D-1 Preferred and Series D-2 Preferred was convertible into
0.05
shares of common stock as of the date of the IPO.
Series A Preferred, Series B Preferred, Series C Preferred, Series C-1 Preferred, Series C-2 Preferred, and Series D Preferred would all convert automatically into common stock at their respective conversion prices upon completion of a public offering of the common stock of the Company. The conversion price for Series B Preferred, Series C Preferred, Series C-1 Preferred, Series C-2 Preferred, and Series D Preferred were subject to adjustment if the Company issued additional shares of common stock at a price less than the Series B Preferred, Series C Preferred, Series C-1 Preferred, Series C-2 Preferred, and Series D Preferred conversion prices in effect at the time of the sale.
With the sale of the Series D-2 Preferred on December 11, 2013 at a price of
$1.40
per share, the antidilution provisions associated with the Series B Preferred, the Series C Preferred, the Series C-1 Preferred, and the Series C-2 Preferred were triggered. As of December 11, 2013, the conversion price of the Series B Preferred, the Series C Preferred, the Series C-1 Preferred, and the Series C-2 Preferred were reduced from
$45.95
,
$51.77
,
$66.30
, and
$117.30
, respectively, to
$32.2912
,
$36.2386
,
$46.1101
, and
$78.9623
, respectively.
In December 2013, the Company recorded a deemed dividend as a reduction to additional paid-in capital of
$6,402
as a result of the beneficial conversion for the antidilution adjustment on the outstanding shares of Series B Preferred, Series C Preferred, and Series C-2 Preferred. The intrinsic value of the beneficial conversion feature was calculated by multiplying the incremental number of shares of the respective convertible preferred stock the investors received (as a result of the Company reducing the original conversion price) by the estimated fair value of the common stock on the issuance date of the respective convertible preferred stock. A deemed dividend for the beneficial conversion feature on the conversion of the 2011-2012 Notes into shares of Series D-1 Preferred was recorded as additional interest expense (Note 7). No shares of Series C-1 Preferred are outstanding and, therefore, no beneficial conversion feature was recognized for the Series C-1 Preferred.
With the sale of the Series D-2 Preferred on January 31, 2014 at a price of
$1.40
per share, the antidilution provisions associated with the Series B Preferred, the Series C Preferred, the Series C-1 Preferred, and the Series C-2 Preferred were triggered again. As of January 31, 2014, the conversion price of the Series B Preferred, the Series C Preferred, the Series C-1 Preferred, and the Series C-2 Preferred were further reduced to
$32.0076
,
$35.8917
,
$45.6062
, and
$77.9382
, respectively.
In January 2014, the Company recorded another deemed dividend as a reduction to additional paid-in capital of
$214
as a result of the beneficial conversion for the antidilution adjustment on the outstanding shares of Series B Preferred, Series C Preferred, and Series C-2 Preferred. The intrinsic value of the beneficial conversion feature was calculated by multiplying the incremental number of shares of the respective convertible preferred stock the investors received (as a result of the Company reducing the original conversion price) by the estimated fair value of the common stock on the issuance date of the respective convertible preferred stock. No shares of Series C-1 Preferred are outstanding and, therefore, no beneficial conversion feature was recognized for the Series C-1 Preferred.
In conjunction with the issuance of the 2011-2012 Notes and related warrants, the Company implemented a special mandatory conversion provision. Under this provision, preferred stockholders that met certain ownership criteria who elected not to purchase their pro rata amount of the convertible note round had their preferred shares converted into common stock in 2012.
Redemption
Upon liquidation, dissolution, or winding up of the Company, the holders of the Series D-2 Preferred would receive an amount equal to three times the original issue price plus all declared and unpaid dividends; the holders of the Series D-1 Preferred would receive an amount equal to two times the original issue price plus all declared and unpaid dividends; and the holders of the Series C-2 Preferred, Series C-1 Preferred, Series C Preferred, Series B Preferred, and the Series A Preferred would receive an amount equal to the original issue price plus all declared and unpaid dividends. In addition, after receiving their liquidation preference, the holders of all series of preferred stock share ratably with holders of common stock on an as-if-converted to common stock basis. An asset transfer or acquisition of the Company is a deemed liquidation event in that holders of all series of preferred stock are treated in the same manner as upon liquidation, dissolution, or winding up of the Company. As a result of the existence of this deemed liquidation feature, the Company determined that all series of preferred stock are redeemable. They are carried at liquidation value at each reporting period and excluded from stockholders’ deficit in the accompanying balance sheets.
90
|
10.
|
Common Stock
|
Authorized, Issued, and Outstanding Common Shares
The Company’s common stock has a par value of
$0.001
per share and consists of
125,000,000
authorized shares and
70,000,000
authorized shares at
December 31, 2014
, and
December 31, 2013
, respectively;
8,512,103
and
334,068
shares were issued and outstanding at
December 31, 2014
, and
December 31, 2013
, respectively. The following table summarizes common stock share activity for the
years ended December 31, 2014 and 2013
:
|
|
Shares of
Common Stock
|
|
|
Balance, December 31, 2012
|
335,782
|
|
|
Exercise of stock options
|
220
|
|
|
Repurchase of common stock
|
(1,934
|
)
|
|
Balance, December 31, 2013
|
334,068
|
|
|
Exercise of stock options
|
416
|
|
|
Conversion of preferred stock
|
1,691,884
|
|
|
Exercise of common stock warrants
|
275,687
|
|
|
Common stock issued through IPO
|
6,200,000
|
|
|
Common stock issued through employee stock purchase plan
|
10,048
|
|
|
Balance, December 31, 2014
|
8,512,103
|
|
Shares Reserved for Future Issuance
The Company had reserved shares of common stock for future issuance as follows:
|
As of
|
As of
|
||||
|
|
December 31,
2014 |
December 31,
2013 |
|||
|
For conversion of Series A Preferred, Series B Preferred, Series C Preferred, Series C-2 Preferred, Series D-1 Preferred, and Series D-2 Preferred and exercise of warrants to purchase Series C-1 Preferred and subsequent conversion of the shares purchased
|
—
|
|
1,675,812
|
|
|
|
Outstanding stock options
|
615,322
|
|
137,610
|
|
|
|
Outstanding common stock warrants
|
—
|
|
257,242
|
|
|
|
Outstanding Series C-1 convertible preferred stock warrants
|
14,033
|
|
13,879
|
|
|
|
For possible future issuance under stock option plan
|
180,610
|
|
49,734
|
|
|
|
For possible future issuance under employee stock purchase plan
|
37,746
|
|
—
|
|
|
|
Total common shares reserved for future issuance
|
847,711
|
|
2,134,277
|
|
|
Liquidation Rights
In the event of any liquidation or dissolution of the Company, the holders of the common stock are entitled to share ratably with holders of the series of outstanding preferred stock, on an as-if-converted to common stock basis, in the remaining assets of the Company legally available for distribution after the payment of the full liquidation preference for all series of the outstanding preferred stock.
Dividends and Voting Rights
The holders of the common stock are entitled to receive dividends if and when declared by the Company, but not until all dividends on the preferred stock have been either (i) paid or (ii) declared and the Company has set aside the funds to pay those dividends declared. The holders of the common stock have the right to one vote per share.
Common Stock Warrants
91
The Company had outstanding common stock warrants issued in connection with the Note and Warrant Purchase Agreements (Note 7) and in connection with certain convertible preferred stock agreements (Note 9).
The December 2011 Note and Warrant Purchase Agreement included warrants to purchase
26,000
shares of the Company’s common stock at
$0.20
per share. The warrants could be exercised for shares of common stock, in accordance with their terms. The number of shares of common stock that could be purchased by exercising the warrants would vary based on the event that occurred and would be calculated in accordance with the December 2011 Note and Warrant Purchase Agreements (Note 7).
On December 11, 2013, holders of the June 2013 Notes exercised their rights under the June 2013 Note and Warrant Agreement to receive warrants to purchase shares of the Company’s common stock. As a result of this exercise, the Company issued warrants to purchase
88,987
shares of the Company’s common stock to the holders of the June 2013 Notes at an exercise price of
$0.20
per share. These warrants were exercisable until
June 28, 2018
, and would terminate unless exercised prior to an IPO.
On December 11, 2013, in connection with the first Series D-2 Preferred offering, the Company issued warrants to purchase
87,532
shares of the Company’s common stock at an exercise price of
$0.20
per share. These warrants were exercisable until
December 11, 2018
, and would terminate unless exercised prior to an IPO. In addition, as a result of the conversion of the principal and interest outstanding on the 2011-2012 Notes into Series D-1 Preferred and Series D-2 Preferred (Note 7), in accordance with the amended terms of the agreement, the number of common shares underlying the warrants issued in connection with the 2011-2012 Notes was increased by
54,120
to a total of
80,120
.
On January 31, 2014, in connection with the second Series D-2 Preferred offering, the Company issued warrants to purchase
19,048
shares of the Company’s common stock at
$0.20
per share.
In connection with the consummation of the IPO in May 2014, substantially all outstanding common stock warrants were exercised at an exercise price of
$0.20
per share and the holders received
275,687
shares of common stock.
All previously described warrants met the definition of a derivative financial instrument and were accounted for as derivatives. The combined fair value of the common stock warrant derivative liabilities, including warrants issued with the sale of Series D-2 Preferred, was
$2,701
as of May 2, 2014, and this amount was settled to additional paid in capital on that date. The combined fair value of the common stock warrant derivative liabilities was
$12,200
as of
December 31, 2013
, which was recorded as a long-term derivative liability in the accompanying balance sheet. The fair value adjustment of the long-term derivative liability was recorded as other (income) expense in the amount of
$(10,442)
and
$8,007
for
years ended December 31, 2014 and 2013
, respectively. As discussed in Note 9, the fair value of the warrants issued in connection with the Company’s Series D-2 Preferred offering in January 2014 was
$362
above the face amount of the Series D-2 Preferred. This excess was expensed in the
year ended
December 31, 2014
, and, as a result, the net fair value adjustment presented in the accompanying statements of operations for the
year ended
December 31, 2014
was income of
$10,080
.
|
11.
|
Stock-based Compensation
|
2009 Stock Option Plan
The Company had a share-based compensation plan (the “2009 Stock Option Plan”) under which the Company granted options to purchase shares of common stock to employees, directors, and consultants as either incentive stock options or nonqualified stock options. Incentive stock options could be granted with exercise prices not less than
100%
to
110%
of the fair market value of the common stock. Options granted under the plan generally vest over
three
to
four
years and expire in
10
years from the date of grant.
2014 Equity Incentive Plan
In February 2014, the Company’s board of directors adopted the 2014 Equity Incentive Plan, or the 2014 Plan, which was subsequently ratified by its stockholders and became effective on
May 2, 2014
(the “Effective Date”). The 2014 Plan is the successor to and continuation of the 2009 Stock Option Plan. As of the Effective Date,
no
additional awards will be granted under the 2009 Stock Option Plan, but all stock awards granted under the 2009 Stock Option Plan prior to the Effective Date will remain subject to the terms of the 2009 Stock Option Plan. All awards granted on and after the Effective Date will be subject to the terms of the 2014 Plan. The 2014 Plan provides for the grant of the following awards: (i) incentive stock options, (ii) nonstatutory stock options, (iii) stock appreciation rights, (iv) restricted stock awards, (v) restricted stock unit awards, and (vi) other stock awards. Employees, directors, and consultants are eligible to receive awards.
Under the 2014 Plan, the aggregate number of shares of common stock that could be issued from and after the Effective Date (the “share reserve”) could not exceed the sum of (i)
257,352
new shares, (ii) the shares that represented the 2009 Stock
92
Option Plan’s available reserve on the Effective Date, and (iii) any returning shares from the 2009 Stock Option Plan. Under the 2014 Plan, the share reserve will automatically increase on January 1
st
of each year, for a period of not more than
10
years, commencing on January 1, 2015 and ending on January 1, 2024, in an amount equal to
4.0%
of the total number of shares of capital stock outstanding on December 31
st
of the preceding calendar year. The board of directors may act prior to January 1
st
of a given year to provide that there will be
no
increase in the share reserve or that the increase will be a lesser number of shares than would otherwise occur.
On June 18, 2014, the Company’s board of directors and compensation committee approved an amendment of the 2014 Plan, subject to stockholder approval, to increase the aggregate number of shares of the Company’s common stock that may be issued under the 2014 Plan by an additional
351,653
shares. All other material terms of the 2014 Plan remained unchanged. The Company’s stockholders approved the 2014 Plan amendment on September 11, 2014.
As of
December 31, 2014
, there were
180,610
shares of common stock available for future issuance under the 2014 Plan. See Note 20 for certain events occurring after December 31, 2014 that affected the number of shares of common stock available for future issuance under the 2014 Plan.
Option Valuation Method
The fair value of a stock option is estimated using an option-pricing model that takes into account as of the grant date the exercise price and expected life of the option, the current price of the underlying stock and its expected volatility, expected dividends on the stock, and the risk-free interest rate for the expected term of the option. The Company has used the simplified method in calculating the expected term of all option grants based on the vesting period. Compensation costs related to share-based payment transactions are recognized in the financial statements upon satisfaction of the requisite service or vesting requirements. Forfeitures are estimated at the time of grant and revised, if necessary, in subsequent periods if actual forfeitures differ from those estimates. The Company based its estimated forfeiture rate on historical forfeitures of all stock option grants.
The Company has elected to use the Black-Scholes option-pricing model. The Black-Scholes option-pricing model was developed for use in estimating the fair value of traded options that have no vesting restrictions and are fully transferable rather than for use in estimating the fair value of stock options subject to vesting and transferability restrictions. Using the Black-Scholes option-pricing model, the weighted-average fair value of options granted during 2014 and 2013 was
$6.24
and
$25.09
per option, respectively. The aggregate fair value of options granted during 2014 and 2013 was
$3,249
and
$290
, respectively. The assumptions used to estimate fair value and the resulting grant date fair values are as follows:
|
|
Employees
|
Nonemployees
|
|||||
|
|
Year Ended December 31,
|
Year Ended December 31,
|
|||||
|
|
2014
|
2013
|
2014
|
2013
|
|||
|
Expected dividend yield
|
—
|
—
|
—
|
—
|
|||
|
Weighted average expected volatility
|
68.57%
|
65.49%
|
64.10%
|
65.49%
|
|||
|
Weighted average risk-free interest rate
|
2.05%
|
2.41%
|
1.75%
|
2.37%
|
|||
|
Weighted average expected term (in years)
|
6.04
|
6.49
|
5.30
|
5.00
|
|||
|
Forfeiture rate
|
5.00%
|
5.00%
|
5.00%
|
5.00%
|
|||
The activity of the plan for the years ended December 31, 2014 and 2013 is summarized as follows:
93
|
Number
of
Shares
|
Weighted-
Average
Exercise
Price
|
Weighted-
Average
Remaining
Contractual
Life (in years)
|
Aggregate
Intrinsic
Value
|
|||||||||
|
Outstanding — January 1, 2013
|
154,277
|
|
$
|
23.05
|
|
5.02
|
$
|
213
|
|
|||
|
Granted
|
11,525
|
|
50.39
|
|
||||||||
|
Exercised
|
(220
|
)
|
21.01
|
|
||||||||
|
Canceled
|
(27,972
|
)
|
20.81
|
|
||||||||
|
Outstanding — December 31, 2013
|
137,610
|
|
$
|
25.86
|
|
5.23
|
$
|
3,097
|
|
|||
|
Exercisable — December 31, 2013
|
115,475
|
|
$
|
23.26
|
|
4.50
|
$
|
2,898
|
|
|||
|
Vested or expected to vest — December 31, 2013
|
136,002
|
|
$
|
25.70
|
|
5.18
|
$
|
3,084
|
|
|||
|
Outstanding — January 1, 2014
|
137,610
|
|
$
|
25.86
|
|
5.23
|
$
|
3,097
|
|
|||
|
Granted
|
520,887
|
|
$
|
9.53
|
|
(1)
|
||||||
|
Exercised
|
(416
|
)
|
$
|
20.40
|
|
|||||||
|
Canceled
|
(42,759
|
)
|
$
|
9.57
|
|
|||||||
|
Outstanding — December 31, 2014
|
615,322
|
|
$
|
9.55
|
|
9.48
|
$
|
265
|
|
|||
|
Exercisable — December 31, 2014
|
192,916
|
|
$
|
9.44
|
|
9.48
|
$
|
88
|
|
|||
|
Vested or expected to vest —December 31, 2014
|
572,926
|
|
$
|
9.55
|
|
9.48
|
$
|
247
|
|
|||
|
(1)
|
The weighted average exercise price table takes into consideration the effect of the option award modifications approved by the Company's board of directors on June 18, 2014, and approved by the Company's shareholders on September 11, 2014. These option award modifications are described in further detail below.
|
The intrinsic values in the table above represent the total intrinsic value (the difference between the Company’s estimated fair value of common stock as of December 31, 2014 and 2013, and the exercise price multiplied by the number of options). The intrinsic value amounts presented above can be positive or negative based on the average exercise price being greater or less than the estimated fair value of common stock as of December 31, 2014 and 2013.
Information as of December 31, 2014, concerning currently outstanding and vested options is as follows:
|
|
Outstanding
|
Exercisable
|
||||||||
|
Exercise
Price
|
Number
of Shares
|
Weighted-
Average
Remaining
Contractual
Life (in years)
|
Number
of Shares
|
Weighted-
Average
Remaining
Contractual
Life (in years)
|
||||||
|
$6.77
|
8,000
|
|
9.47
|
—
|
|
0.00
|
||||
|
7.70
|
5,944
|
|
9.76
|
5,944
|
|
9.76
|
||||
|
8.03
|
5,700
|
|
9.50
|
5,700
|
|
9.50
|
||||
|
8.73
|
35,114
|
|
9.45
|
3,494
|
|
9.45
|
||||
|
9.64
|
543,374
|
|
9.47
|
176,248
|
|
9.47
|
||||
|
10.81
|
17,190
|
|
9.93
|
1,530
|
|
9.93
|
||||
|
615,322
|
|
|
192,916
|
|
|
|||||
The total fair value of shares vested during the years ended
December 31, 2014
and
2013
was
$458
and
$801
, respectively.
Unvested shares as of
December 31, 2014
and
2013
are as follows:
94
|
As of December 31, 2014
|
As of December 31, 2013
|
|||||||
|
Exercise
Price
|
Number of
Unvested Shares
|
Exercise
Price
|
Number of
Unvested Shares
|
|||||
|
$6.77
|
8,000
|
|
$20.40
|
563
|
|
|||
|
7.70
|
—
|
|
24.48
|
7,318
|
|
|||
|
8.03
|
—
|
|
25.50
|
—
|
|
|||
|
8.73
|
31,620
|
|
25.91
|
—
|
|
|||
|
9.64
|
367,127
|
|
30.60
|
4,307
|
|
|||
|
10.81
|
15,660
|
|
55.08
|
9,947
|
|
|||
|
422,407
|
|
22,135
|
|
|||||
As of December 31, 2014 and 2013, there was approximately
$2,683
and
$404
, respectively, of total unrecognized compensation cost related to unvested share-based compensation arrangements granted under the plan. That cost is expected to be recognized over weighted-average periods of
3.2
and
1.8
years for the years ended December 31, 2014 and 2013, respectively. The aggregate intrinsic value of the options exercised during the years ended December 31, 2014 and 2013 was
$11
and
$6
, respectively.
Option Grants
On June 18, 2014, the Company’s board of directors approved the grant of options to purchase
396,573
shares of common stock at a per share exercise price of
$9.64
to certain of the Company’s executive officers and employees.
No
compensation cost associated with these option grants was recognized during the three month period ended June 30, 2014 because the grants were subject to and contingent upon stockholder approval of the previously described June 18, 2014 amendment to the 2014 Plan. The Company did not believe stockholder approval was perfunctory. The Company’s stockholders approved the 2014 Plan amendment on September 11, 2014, which was considered to be the measurement date for the determination of stock compensation expense. The fair value of each option grant award was estimated using the Black-Scholes option-pricing model, consistent with and in accordance with the Company’s existing accounting policy for stock compensation. Using the Black-Scholes option-pricing model, the fair value of all September 11, 2014 option grants was
$3.76
per option. The aggregate fair value of options granted on September 11, 2014 was determined to be
$1,490
, which is being recognized as expense, after adjusting for estimated pre-vesting forfeitures, over a
45
month vesting period.
Option Amendments
During the
year ended
December 31, 2014
, the Company's board of directors approved the following with respect to the 2009 Stock Option Plan:
|
•
|
On April 29, 2014, the exercise price per share of certain options to purchase
53,404
shares of common stock under the 2009 Stock Option Plan was lowered to an amount equal to
$10.00
per share. The original exercise prices of such options ranged from
$20.40
to
$61.20
per share, with a weighted average exercise price of
$54.87
per share.
|
|
•
|
On June 18, 2014, the exercise price per share of all outstanding options to purchase shares of common stock under the 2009 Stock Option Plan was lowered to an amount equal to
$9.64
per share, the closing stock price on June 18, 2014. This modification lowered the exercise price of outstanding options to purchase
110,346
shares of common stock, including those options to purchase common stock that were previously modified on April 29, 2014. These outstanding stock options had exercise prices that ranged from
$20.40
to
$61.20
per share, with a weighted average exercise price of
$41.87
per share.
|
|
•
|
Also on June 18, 2014, the contractual term of all outstanding options to purchase shares of common stock under the 2009 Stock Option Plan was extended to June 17, 2024.
|
The Company determined the additional compensation cost associated with the previously described modifications pursuant to applicable guidance in FASB ASC Topic 718,
Compensation—Stock Compensation
. The additional compensation cost was determined by calculating the difference between (a) the estimated fair value of each option award immediately prior to the modifications and (b) the estimated fair value of each option award immediately after the modifications. The fair value of each option award immediately prior to and immediately after modification was estimated using the Black-Scholes option-pricing model, consistent with and in accordance with the Company’s existing accounting policy for stock compensation. Using the Black-Scholes option-pricing model, the weighted-average fair value of outstanding 2009 Stock Option Plan option awards was
$3.08
per option immediately prior to modification on June 18, 2014 and was
$5.87
per option immediately after
95
modification. The additional compensation cost was determined to be
$293
, of which
$130
was associated with services previously performed and, therefore, was expensed in the quarter ended June 30, 2014. The remaining additional compensation cost is being recognized as remaining services are performed.
Also on June 18, 2014, the board of directors approved modifications to the exercise price and contractual term of all outstanding option awards under the Company’s Stock Option Plan previously adopted by the Company in 1999 (the “1999 Stock Option Plan”). The modifications to the exercise price and contractual term are consistent with those previously described for outstanding options under the 2009 Stock Option Plan. In addition, the 1999 Stock Option Plan option awards were modified to provide that the holder may exercise vested shares under the option for the contractual term of the option even in the event the holder terminates services with the Company other than for cause. The modifications lowered the exercise price of outstanding options to purchase
73,087
shares of common stock, which had exercise prices that ranged from
$20.40
to
$25.50
per share, with a weighted average exercise price of
$21.50
per share.
Pursuant to the terms of the 1999 Stock Option Plan, any amendments that modify the terms of the options awards require approval or consent of the Company’s shareholders.
No
additional compensation cost associated with the options under the 1999 Stock Option Plan was recognized during the quarter ended June 30, 2014 because the amendments were subject to and contingent upon stockholder approval. The Company did not believe stockholder approval was perfunctory. The Company’s stockholders approved the 1999 Stock Option Plan modifications on September 11, 2014, which was considered to be the measurement date for the determination of additional stock compensation expense. Consistent with the accounting guidance and methodology previously described for the 2009 Plan amendment, the Company determined the additional compensation cost associated with the 1999 Stock Option Plan modifications pursuant to FASB ASC Topic 718. The weighted-average fair value of outstanding 1999 Stock Option Plan option awards was
$0.78
per option immediately prior to modification on September 11, 2014 and was
$3.78
per option immediately after modification. The additional compensation cost was determined to be
$225
, all of which was associated with services previously performed and, therefore, was fully expensed in the quarter ended September 30, 2014.
2014 Employee Stock Purchase Plan
In February 2014, the Company’s board of directors adopted the 2014 Employee Stock Purchase Plan (“ESPP”), which was subsequently ratified by the Company’s stockholders and became effective on
May 2, 2014
. The purpose of the ESPP is to provide means by which eligible employees of the Company and of certain designated related corporations may be given an opportunity to purchase shares of the Company’s common stock, and to seek and retain services of new and existing employees and to provide incentives for such persons to exert maximum efforts for the success of the Company. Common stock that may be issued under the ESPP will not exceed
47,794
shares, plus the number of shares of common stock that are automatically added on January 1
st
of each year for a period of
ten
years, commencing on January 1, 2015 and ending on January 1, 2024, in an amount equal to the lesser of (i)
0.8%
of the total number of shares of outstanding common stock on December 31 of the preceding calendar year, and (ii)
29,411
shares of common stock. Similar to the 2014 Plan, the board of directors may act prior to January 1
st
of a given year to provide that there will be
no
increase in the share reserve or that the increase will be a lesser number of shares than would otherwise occur. The ESPP is intended to qualify as an “employee stock purchase plan” within the meaning of Section 423 of the Internal Revenue Code.
In September 2014, the Company issued
10,048
shares of common stock under the ESPP. As of
December 31, 2014
, there were
37,746
shares of common stock available for future issuance under the ESPP.
Compensation Cost
The compensation cost that has been charged against income for stock awards under the 2009 Stock Option Plan, the 2014 Plan, and the ESPP was
$1,201
and
$180
for the
years ended December 31, 2014 and 2013
, respectively. The total income tax benefit recognized in the statements of operations for share-based compensation arrangements was
$0
for both the
years ended December 31, 2014 and 2013
. Cash received from options exercised was
$9
and
$5
for the
years ended December 31, 2014 and 2013
, respectively.
Stock-based compensation expense related to stock options is included in the following line items in the accompanying statements of operations:
96
|
|
Year Ended December 31,
|
|||||||
|
|
2014
|
2013
|
||||||
|
Cost of revenue
|
$
|
159
|
|
$
|
45
|
|
||
|
Research and development
|
394
|
|
28
|
|
||||
|
Selling, general and administrative
|
648
|
|
107
|
|
||||
|
$
|
1,201
|
|
$
|
180
|
|
|||
|
12.
|
Income Taxes
|
The Company’s financial statements include a total tax expense of
$0
on a net loss of
$4,234
and
$30,461
for the
years ended December 31, 2014 and 2013
, respectively. A reconciliation of the difference between the benefit for income taxes and income taxes at the statutory U.S. federal income tax rate is as follows:
|
|
Year Ended December 31,
|
||||||||||||
|
|
2014
|
2013
|
|||||||||||
|
|
Amount
|
Percent of
Pretax Income
|
Amount
|
Percent of
Pretax Income
|
|||||||||
|
Income taxes at statutory rate
|
$
|
(1,440
|
)
|
34.0
|
%
|
$
|
(10,356
|
)
|
34.0
|
%
|
|||
|
State income taxes
|
(467
|
)
|
11.0
|
%
|
(127
|
)
|
0.5
|
%
|
|||||
|
Beneficial conversion feature on convertible notes
|
—
|
|
—
|
%
|
3,673
|
|
(12.1
|
)%
|
|||||
|
Stock warrant derivative liability
|
(3,427
|
)
|
80.9
|
%
|
2,686
|
|
(8.8
|
)%
|
|||||
|
Debt discount amortization
|
—
|
|
—
|
%
|
392
|
|
(1.3
|
)%
|
|||||
|
Deemed contribution interest
|
—
|
|
—
|
%
|
1,516
|
|
(5.0
|
)%
|
|||||
|
Provision to return adjustments
|
—
|
|
—
|
%
|
(184
|
)
|
0.6
|
%
|
|||||
|
Stock compensation
|
322
|
|
(7.6
|
)%
|
57
|
|
(0.2
|
)%
|
|||||
|
Expiration of capital loss carryforward.
|
—
|
|
—
|
%
|
1,511
|
|
(5.0
|
)%
|
|||||
|
Change in statutory state income tax rate
|
—
|
|
—
|
%
|
1,000
|
|
(3.3
|
)%
|
|||||
|
Change in reserve for uncertain tax positions
|
—
|
|
—
|
%
|
623
|
|
(2.0
|
)%
|
|||||
|
R&D tax credits
|
(320
|
)
|
7.6
|
%
|
—
|
|
—
|
%
|
|||||
|
Other
|
57
|
|
(1.3
|
)%
|
3
|
|
—
|
%
|
|||||
|
Increase in valuation allowance
|
5,275
|
|
(124.6
|
)%
|
(794
|
)
|
2.6
|
%
|
|||||
|
$
|
—
|
|
—
|
|
$
|
—
|
|
—
|
|
||||
97
The components of deferred tax assets and liabilities are as follows:
|
|
December 31,
|
||||||
|
|
2014
|
2013
|
|||||
|
Current deferred tax assets (liabilities):
|
|||||||
|
Accrued expenses
|
$
|
1,701
|
|
$
|
1,286
|
|
|
|
Stock-based compensation
|
336
|
|
241
|
|
|||
|
Other
|
16
|
|
88
|
|
|||
|
2,053
|
|
1,615
|
|
||||
|
Noncurrent deferred tax assets (liabilities)
|
|||||||
|
Net operating loss carryforwards
|
29,981
|
|
26,286
|
|
|||
|
Research and development credits
|
2,684
|
|
2,373
|
|
|||
|
Depreciation
|
1,232
|
|
1,201
|
|
|||
|
Deferred financing costs
|
—
|
|
(800
|
)
|
|||
|
33,897
|
|
29,060
|
|
||||
|
Total deferred tax assets
|
35,950
|
|
30,675
|
|
|||
|
Valuation allowance
|
(35,950
|
)
|
(30,675
|
)
|
|||
|
Net deferred tax asset
|
$
|
—
|
|
$
|
—
|
|
|
As of
December 31, 2014
and
2013
, the Company had federal net operating loss (NOL) carryforwards of approximately
$81,687
and
$71,757
, respectively, North Carolina net economic loss (NEL) carryforwards of approximately
$85,790
and
$75,990
, respectively, and Pennsylvania NOL carryforwards of approximately
$0
and
$80
, respectively. The federal NOL and North Carolina NEL carryforwards begin to expire in
2020
and
2015
, respectively. At
December 31, 2014
, the Company had federal research and development credit carryforwards of
$2,371
and North Carolina credit carryforwards of
$150
, which begin to expire in
2020
and
2015
, respectively.
At
December 31, 2014
and
2013
, the Company has concluded that it is more likely than not that the Company will not realize the benefit of its deferred tax assets due to its history of losses. Accordingly, the net deferred tax assets have been fully reserved.
In accordance with Section 382 of the Internal Revenue Code of 1986, as amended, a change in equity ownership of greater than 50% within a three-year period results in an annual limitation on the Company’s ability to utilize its NOL carryforwards created during the tax periods prior to the change in ownership. The Company has determined that ownership changes have occurred and as a result, a portion of the Company’s NOL carryforwards are limited.
Because the Company has incurred cumulative net operating losses since inception, all tax years remain open to examination by U.S. federal and state income tax authorities.
The Company adopted FASB Accounting Standards Codification 740-10-25-5,
Income Taxes
, formerly FASB Interpretation No. 48,
Accounting for Uncertainty in Income Taxes
, as amended, on January 1, 2009. The difference between the tax benefit recognized in the financial statements and the tax benefit claimed in the tax return is referred to as an unrecognized tax benefit.
The following is a tabular reconciliation of the total amounts of unrecognized tax benefits:
|
|
December 31,
|
||||||
|
|
2014
|
|
2013
|
||||
|
Unrecognized tax benefit—January 1
|
$
|
623
|
|
$
|
—
|
|
|
|
Additions for tax positions of current period
|
—
|
|
333
|
|
|||
|
Additions for tax positions of prior periods
|
—
|
|
290
|
|
|||
|
Other
|
—
|
|
—
|
|
|||
|
Unrecognized tax benefit—December 31
|
$
|
623
|
|
$
|
623
|
|
|
98
None
of the unrecognized tax benefits would, if recognized, affect the effective tax rate because the Company has recorded a valuation allowance to fully offset federal and state deferred tax assets. The Company has
no
tax positions for which it is reasonably possible that the total amount of unrecognized tax benefits will significantly increase or decrease within the coming year. The Company has
$0
provided for interest and penalties associated with uncertain tax positions.
|
13.
|
Net Loss Per Share
|
The following table summarizes the computation of basic and diluted net loss per share attributable to the Company’s common stockholders:
|
|
Year Ended
December 31, |
||||||
|
|
2014
|
2013
|
|||||
|
Net loss
|
$
|
(4,234
|
)
|
$
|
(30,461
|
)
|
|
|
Deemed dividend for beneficial conversion feature on Series D-2 Preferred
|
(909
|
)
|
(4,232
|
)
|
|||
|
Deemed dividend for antidilution adjustments to convertible preferred stock
|
(214
|
)
|
(6,402
|
)
|
|||
|
Accretion of convertible preferred stock
|
(510
|
)
|
(5,714
|
)
|
|||
|
Net loss attributable to common stock - basic
|
$
|
(5,867
|
)
|
$
|
(46,809
|
)
|
|
|
Derivative fair value adjustment
|
(10,080
|
)
|
—
|
|
|||
|
Net loss attributable to common stock - diluted
|
$
|
(15,947
|
)
|
$
|
(46,809
|
)
|
|
|
Weighted-average common shares outstanding - basic
|
5,663,311
|
|
335,612
|
|
|||
|
Incremental shares from assumed exercise of common stock warrants
|
273,776
|
|
—
|
|
|||
|
Weighted-average of outstanding common stock - diluted
|
5,937,087
|
|
335,612
|
|
|||
|
Net loss per share
|
|||||||
|
Basic
|
$
|
(1.04
|
)
|
$
|
(139.47
|
)
|
|
|
Diluted
|
$
|
(2.69
|
)
|
$
|
(139.47
|
)
|
|
The following securities, presented on a common stock equivalent basis, have been excluded from the calculation of weighted average common shares outstanding because their effect is anti-dilutive. As discussed in Note 9, in May 2014, upon completion of the IPO, all outstanding shares of the convertible preferred stock were converted into shares of common stock at their conversion prices. Therefore, as of
December 31, 2014
, the convertible preferred stock securities were no longer outstanding and will have no impact on net income or net loss per share.
|
|
Year Ended
December 31, |
||||
|
|
2014
|
2013
|
|||
|
Convertible preferred stock:
|
|||||
|
Series A Preferred
|
6,149
|
|
6,149
|
|
|
|
Series B Preferred
|
131,685
|
|
130,529
|
|
|
|
Series C Preferred
|
783,515
|
|
776,016
|
|
|
|
Series C-2 Preferred
|
173,213
|
|
170,967
|
|
|
|
Series D-1 Preferred
|
296,773
|
|
296,773
|
|
|
|
Series D-2 Preferred
|
300,549
|
|
281,500
|
|
|
|
Warrants to purchase Series C-1 Preferred
|
14,033
|
|
13,878
|
|
|
|
Warrants to purchase common stock
|
—
|
|
257,242
|
|
|
|
Stock options
|
615,322
|
|
137,610
|
|
|
|
ESPP
|
65,401
|
|
—
|
|
|
|
Convertible notes
|
—
|
|
—
|
|
|
99
|
14.
|
Related-Party Transactions
|
The Company had transactions with related parties as follows:
|
|
Year Ended December 31,
|
||||||
|
|
2014
|
2013
|
|||||
|
Revenue
|
$
|
7,288
|
|
$
|
7,288
|
|
|
|
Selling, general and administrative expense
|
500
|
|
—
|
|
|||
Research Services Agreement with a Related-Party
Sanofi owns
100%
of a subsidiary, Merial, which is a customer of the Company. Both Sanofi and the subsidiary have an investment in the Company. The Company’s related-party revenue with Merial composed
38%
and
43%
of total revenue for the
years ended December 31, 2014 and 2013
, respectively. This related-party revenue was recognized in connection with contract research and development services the Company provided to Merial on a fee-for-service basis under an agreement that expired on December 31, 2014. As described in Note 18, the Company entered into a new agreement with Merial in December 2014 under which the Company will provide contract research and screening services on a fee-for-service basis over a term of
two
years, ending on December 31, 2016.
Success Fee Paid to a Related-Party
In 2013, Burrill Securities, an affiliate of Burrill Biotechnology Capital Fund, L.P., a holder of the Company’s capital stock, assisted the Company with the identification of certain strategic alternatives to an IPO. Pursuant to the related engagement letter, as amended, the Company was required to pay Burrill Securities a success fee if the Company consummated a strategic transaction or an IPO prior to November 17, 2014. In May 2014, in connection with the closing of the Company's IPO, it paid a
$500
success fee to Burrill Securities and the fee was recognized as general and administrative expense in the accompanying statements of operations.
15. Employee Benefit Plan
The Company has a 401(k) retirement plan, which covers all U.S. employees scheduled for and working more than
20
hours per week. The Company may provide a discretionary match with a maximum amount of
50%
of the first
6%
of eligible participant’s compensation, which vests ratably over
four years
. Contributions under the plan during were approximately
$239
during both years ended December 31,
2014
and
2013
.
16. Gain on Sale of Asset
On May 17, 2012, the Company sold the rights to its HEOS software to a third party for consideration of
$4,500
. The Company received
$3,500
on May 17, 2012 and recorded a gain on sale of asset of
$3,412
within total operating expenses, net of transaction expenses. The remaining balance of
$1,000
was held in escrow by the buyer until certain conditions were met.
On May 17, 2013, the Company met all the contractual conditions and collected the
$1,000
held in escrow. The Company recognized
$988
, which is net of transaction expenses, as a gain on sale of asset within total operating expenses.
|
17.
|
Fair Value Measurements
|
The carrying amounts of certain financial instruments, including cash and cash equivalents, accounts receivable, unbilled services, prepaid expenses and other current assets, accounts payable, and accrued expenses approximate their respective fair values due to the short-term nature of such instruments.
As of December 31, 2013, the Company estimated that the fair value of its obligation under the 2013 Credit Agreement was
$13,023
. The fair value of debt fell within Level 3 of the fair value hierarchy as it was significantly driven by the creditworthiness of the Company, which was an unobservable input.
Assets and Liabilities Measured at Fair Value on a Recurring Basis
100
The Company evaluates its financial assets and liabilities subject to fair value measurements on a recurring basis to determine the appropriate level in which to classify them for each reporting period. This determination requires significant judgments to be made.
As of
December 31, 2014
, there were no assets or liabilities measured at fair value on a recurring basis.
The following table summarizes the conclusions reached as of
December 31, 2013
:
|
Balance as of
December 31, 2013
|
Quoted Prices in
Active Markets for
Identical Assets
(Level 1)
|
Significant Other
Observable Inputs
(Level 2)
|
Significant
Unobservable
Inputs
(Level 3)
|
||||||||||||
|
Derivative liability — Series C-1 warrants
|
$
|
37
|
|
$
|
—
|
|
$
|
—
|
|
$
|
37
|
|
|||
|
Derivative liability — common stock warrants
|
12,200
|
|
—
|
|
—
|
|
12,200
|
|
|||||||
|
Total derivative liability
|
$
|
12,237
|
|
$
|
—
|
|
$
|
—
|
|
$
|
12,237
|
|
|||
The Company’s derivative liabilities were the only balance sheet amounts that were measured at fair value on a recurring basis. The fair value of these warrant derivatives was based on a valuation of the Company’s common stock. In order to determine the fair value of the Company’s common stock, the Company used a probability-weighted expected return method, or PWERM. Significant inputs for the PWERM included an estimate of the Company’s equity value, a weighted average cost of capital and an estimated probability and timing for each valuation scenario.
A reconciliation of the beginning and ending balances for liabilities measured at fair value on a recurring basis using significant unobservable inputs (Level 3) is as follows:
|
Year Ended December 31,
|
|||||||
|
|
2014
|
2013
|
|||||
|
Balance at beginning of period
|
$
|
12,237
|
|
$
|
683
|
|
|
|
Issuance of warrants
|
544
|
|
5,382
|
|
|||
|
Excess of fair value of warrants over proceeds
|
362
|
|
(1,714
|
)
|
|||
|
Adjustment to fair value
|
(10,442
|
)
|
7,886
|
|
|||
|
Reclassification to additional paid-in capital upon exercise of warrants
|
(2,701
|
)
|
—
|
|
|||
|
Balance at end of period
|
$
|
—
|
|
$
|
12,237
|
|
|
|
18.
|
Significant Agreements
|
R-Pharm Collaboration Arrangement
In August 2013, the Company entered into a development, license, and supply agreement (the “original agreement”) with R-Pharm, granting it exclusive rights to develop and commercialize SCY-078, the Company's lead antifungal compound, in the field of human health in Russia and certain smaller non-core markets. The Company received an upfront payment of
$1,500
, which composes the substantial majority of its deferred revenue balance as of December 31, 2013, and is entitled to receive payments on contingent events, including 1) a development milestone payment of
$3,000
upon the first registration of SCY-078 in any country covered by the agreement; 2) sales-based payments of up to
$15,000
upon R-Pharm’s achievement of specified targets for cumulative net sales of SCY-078; and 3) percentage royalties of up to the mid-teens on SCY-078 net sales.
The Company deferred the upfront payment received and is recognizing it over the estimated relationship period of
70
months, which includes the product development period and an additional period during which the Company is required to participate in a product development committee. The development milestone payment is considered substantive and will be recognized when R-Pharm achieves certain specified milestones.
The sales-based payments will not be recognized until the Company 1) receives the payments, and 2) has no continuing performance obligations. If the Company has any continuing performance obligations when the sales-based payments are received, those payments will be deferred and recognized over the remaining period of continuing performance obligations. Royalties will be recognized when payment is received.
The original agreement also included terms whereby R-Pharm would reimburse the Company for certain research and development costs associated with Phase 2 and Phase 3 clinical trials of oral SCY-078 and the development of an IV
101
formulation of SCY-078. However, these cost reimbursement terms required that the clinical trials and the IV formulation development follow a global development plan that was agreed upon by both parties in August 2013. Subsequent to August 2013, modifications were made to the global development plan that caused the clinical trial cost reimbursement terms in the original agreement to no longer be enforceable. As a result, the Company concluded that persuasive evidence of a cost reimbursement arrangement did not exist under the original agreement with R-Pharm. Further, the IV formulation development cost reimbursement terms in the original agreement did not specify which IV formulation and development costs were reimbursable by R-Pharm. Because of this lack of specificity, the Company concluded that the reimbursable fees due from R-Pharm were not determinable under the original agreement.
In November 2014, the Company entered into a supplemental arrangement with R-Pharm, whereby R-Pharm was informed of the modified IV formulation development plan and R-Pharm agreed to reimburse the Company for specifically identified IV formulation development and manufacturing costs incurred by the Company. The specifically identified costs were defined as all costs incurred by the Company under a separate arrangement between the Company and a third-party service provider, whereby the third-party service provider is performing certain IV formulation and development services. The Company concluded that the original agreement, when combined with the November 2014 supplemental arrangement, provided persuasive evidence of a cost reimbursement arrangement between the Company and R-Pharm as of December 31, 2014. Therefore, the Company recognized a
$226
receivable due from R-Pharm for reimbursable costs incurred by the Company during the year ended December 31, 2014. The presentation and disclosure associated with this cost reimbursement receivable is in accordance with the Company's research and development expenses accounting policy described in Note 2.
Elanco Licensing Agreement
The Company entered into a licensing agreement with Elanco Animal Health (Elanco) in December 2013. The agreement includes an upfront payment of
$500
and multi-year contract research and development services with fees of
$2,750
annually for the first
two years
and
$3,000
annually for the second
two years
, and entitles the Company to 1) development milestone payments of up to
$1,500
for each compound Elanco and the Company decide to develop; 2) a one-time payment of up to
$2,000
for the first regulatory approval of any product in the U.S.; 3) a one-time payment of
$4,000
for the first commercial sale of a product in the U.S. and a one-time payment of
$1,500
for the first commercial sale of a product in the European Union; 4) one-time payments of up to
$15,000
for reaching specified annual sales of a product; and 5) mid-single-digit percentage royalties on net annual sales. The Company has deferred the upfront payment, which it received in January 2014, and is recognizing the revenue over the research and development period of
four years
.
Waterstone Licensing Agreement
On October 29, 2014, the Company entered into a license agreement with Waterstone Pharmaceutical (HK Limited), or Waterstone, under which the Company granted Waterstone an exclusive, worldwide license to develop and commercialize SCY-635 for the treatment of viral diseases in humans. In addition, under the same agreement, the Company granted Waterstone an option for an exclusive, worldwide license to develop and commercialize two additional compounds of the Company, SCY-575 and SCY-116, for the treatment of viral diseases in humans. The option is exercisable for a period of
18
months from the date of the agreement. In addition, the Company agreed that during the term of the agreement, it would not develop or commercialize, or grant any right or license to any third party to develop or commercialize, in Asia (excluding Japan), any cyclophilin inhibitor for treatment of viral diseases in humans.
The agreement expires upon Waterstone’s last royalty payment, which is the later of ten years from the last registration of the product, or the last to expire of the patents. Either party may terminate the agreement if the other party breaches and fails to remedy the breach after receiving notice from the nonbreaching party. Specifically, the Company has the ability to terminate the agreement if the Company determines that Waterstone failed to make reasonable progress in the development and commercialization of SCY-635 or the optioned compounds. If the Company gives Waterstone notice of failure to make reasonable progress, Waterstone will have the opportunity to correct the deficiencies. If Waterstone fails to do so, the Company has the right to terminate the license.
The Company received a non-refundable upfront license fee payment of
$1,000
in November 2014 for SCY-635, and may receive an additional upfront payment of
$500
if Waterstone exercises its option for the two additional compounds. The Company is also entitled to receive certain payments on contingent future events, including 1) a development milestone payment of
$4,000
upon the first registration of a product, and 2) royalties based on a specified percentage of net sales (which percentage is in the mid-single digits), varying based on whether the product contains SCY-635 or one of the two additional compounds.
The Company analyzed the license agreement and concluded that, as of December 31, 2014, it had no remaining substantive obligations to perform under the arrangement. As a result, the Company recognized revenue of $
1,000
from the non-refundable upfront payment in the year ended December 31, 2014. The development milestone payment and the royalties will be recognized as revenue if and when the Company receives the payments.
102
Merial Research Services Agreement
In December 2014, the Company entered into an agreement with Merial, a related party (Note 14), under which the Company will provide contract research and screening services in the field of animal health that primarily target parasites. Prior to the execution of this agreement, the Company provided contract research and development services for Merial on a fee-for-service basis under a separate agreement that expired on December 31, 2014. The agreement is a non-exclusive arrangement in the animal health field and is on a fee-for-service basis. The Company will not receive any contingent payments based on the progression to development and commercialization of any compounds arising from this agreement. Any intellectual property created in connection the Company's performance of the services shall be the sole property of Merial. The term of the agreement is
two
years, beginning January 1, 2015 and ending on December 31, 2016, and the total service fee due from Merial over the term of the agreement is
$7,900
, payable in equal quarterly installments. The agreement also provides for an option to extend the term for
one
additional year.
Either party may terminate the agreement in the event of breach of material obligation by the other party if such breach is not remedied after written notice from the non-breaching party. Either party may terminate this agreement if the other party makes an assignment for the benefit of creditors, becomes subject to bankruptcy proceedings, subject to appointment of a receiver, or admits inability to pay its debts. Further, within six months of any change of control the Company, Merial shall either (i) consent to continue the agreement pursuant to its terms, (ii) agree to an assignment of the agreement to a third-party acceptable to Merial, or (iii) the parties shall implement another solution acceptable to Merial, provided, however, if no resolution acceptable to Merial has been implemented within six months of the change of control, Merial may terminate the agreement immediately. If Merial believes in good faith that the Company acted in any way that may subject Merial to liability under anti-corruption laws, Merial shall have the unilateral right to terminate this agreement. At termination or expiration of the agreement for any reason, upon Merial’s request, the Company must transfer all agreement intellectual property to Merial.
|
19.
|
Assessment of Strategic Alternatives
|
As part of the Company's strategic objective to focus its resources on the development of SCY-078, the Company's board of directors has directed the Company's management to explore the divestiture of the Company's contract research and development services business (the "service business"). A divestiture of the service business will simplify the Company's business model and will allow the Company's new Chief Executive Officer to focus on the execution of the Company's strategic objectives. The Company has engaged a third-party firm to assist in the evaluation of several divestiture options (a third-party sale, spin-off, management buy-out or shut-down process).
The Company did not meet the relevant criteria for reporting the service business as held for sale as of December 31, 2014, pursuant to FASB Topic 205-20,
Presentation of Financial Statements--Discontinued Operations
, and FASB Topic 360,
Property, Plant, and Equipment
. The Company will continue to evaluate the criteria for reporting the service business as held for sale during 2015, as the Company's exploration activities progress and are evaluated by the board of directors.
|
20.
|
Subsequent Events
|
2014
Equity Incentive Plan Activity
The following events occurred with respect to the 2014 Plan subsequent to December 31, 2014.
|
•
|
Pursuant to the terms of the 2014 Plan (Note 11), on January 1, 2015, the Company automatically added
340,484
shares to the total number shares of common stock available for future issuance under the 2014 Plan.
|
|
•
|
In connection with the resignation of the Company's Chief Medical Officer, Dr. Carole Sable, effective as of February 20, 2015, the Company returned
57,452
shares to the total number shares of common stock available for future issuance under the 2014 Plan. The returned shares represent Dr. Sable's unvested shares as of the effective date of her resignation.
|
|
•
|
In February 2015, the board of directors appointed Dr. Marco Taglietti as Chief Executive Officer of the Company, effective as of April 1, 2015. In connection with Dr. Taglietti’s appointment as Chief Executive Officer, Dr. Taglietti will be granted an option to purchase
330,000
shares of the Company's common stock, subject to approval by the board of directors. The option shall be granted as of the effective date of Dr. Taglietti's employment, shall have a ten-year term and one-fourth of the shares subject to the option shall vest on the one-year anniversary of the date of grant with the remainder vesting in equal monthly installments for thirty-six
|
103
months thereafter, provided Dr. Taglietti continues to provide service to the Company. In addition, on the first anniversary of the Dr. Taglietti’s employment, subject to the approval of the board of directors, Dr. Taglietti will be granted an additional option to purchase
80,000
shares of the Company's common stock. The additional option shall have a ten-year term and the shares subject to the option shall vest in equal monthly installments for forty-eight months as measured from the date of grant, provided Dr. Taglietti continues to provide service to the Company.
|
•
|
On February 25, 2015, the Company's board of directors approved an amendment of the 2014 Plan, subject to stockholder approval at the Company's 2015 annual meeting of stockholders, to increase the aggregate number of shares of common stock that may be issued pursuant to awards under the 2014 Plan by an additional
510,726
shares. All other material terms of the 2014 Plan otherwise remain unchanged.
|
Inducement Award Plan Approval
On March 26, 2015, the Company's board of directors adopted the 2015 Inducement Plan, or the 2015 Plan. The 2015 Plan provides for the grant of nonstatutory stock options, stock appreciation rights, restricted stock awards, restricted stock unit awards, and other forms of equity compensation (collectively, stock awards), all of which may be granted to persons not previously employees or directors of the Company, or following a bona fide period of non-employment, as an inducement material to the individuals’ entering into employment with the Company within the meaning of NASDAQ Listing Rule 5635(c)(4). The 2015 Plan has a share reserve covering
450,000
shares of common stock.
|
ITEM 9.
|
CHANGES IN AND DISAGREEMENTS WITH ACCOUNTANTS ON ACCOUNTING AND FINANCIAL DISCLOSURE
|
None.
|
ITEM 9A.
|
CONTROLS AND PROCEDURES
|
Management’s Evaluation of our Disclosure Controls and Procedures
We maintain disclosure controls and procedures that are designed to ensure that information required to be disclosed in the reports that we file or submit under the Securities Exchange Act of 1934 is (1) recorded, processed, summarized, and reported within the time periods specified in the SEC’s rules and forms and (2) accumulated and communicated to our management, including our principal executive officer and principal financial officer, to allow timely decisions regarding required disclosure.
As of
December 31, 2014
, our management, with the participation of our principal executive officer and principal financial officer, evaluated the effectiveness of our disclosure controls and procedures (as defined in Rules 13a-15(e) and 15d-15(e) under the Securities Exchange Act of 1934). Our management recognizes that any controls and procedures, no matter how well designed and operated, can provide only reasonable assurance of achieving their objectives, and management necessarily applies its judgment in evaluating the cost-benefit relationship of possible controls and procedures. Our principal executive officer and principal financial officer have concluded based upon the evaluation described above that, as of
December 31, 2014
, our disclosure controls and procedures were effective at the reasonable assurance level.
Management’s Report on Internal Control over Financial Reporting
This Annual Report on Form 10-K does not include a report of management’s assessment regarding internal control over financial reporting or an attestation report of our independent registered public accounting firm due to a transition period established by the rules of the SEC for newly public companies. We are an “emerging growth company” as defined in the Jumpstart Our Business Startups Act, or the JOBS Act. After the initial transition period provided for newly public companies, for as long as we remain an “emerging growth company”, we are exempt from the auditor attestation requirement in the assessment of the effectiveness of our internal control over financial reporting through the end of the fiscal year following the fifth anniversary of our IPO.
Changes in Internal Control Over Financial Reporting
During the quarter ended December 31, 2014, we experienced changes in our internal control over financial reporting, as such term is defined in Rules 13a-15(f) and 15(d)-15(f) promulgated under the Securities Exchange Act of 1934, that have materially affected, or are reasonably likely to materially affect, our internal control over financial reporting. As disclosed in our registration statement on Form S-1 declared effective by the SEC on May 2, 2014, we previously identified material weaknesses related to our internal control over financial reporting as of December 31, 2013. These material weaknesses related to (i) a lack of sufficient internal resources commensurate with the complexity of our financial reporting requirements, (ii) insufficient review controls over account reconciliations and journal entries, and (iii) review controls that did not operate at a
104
level of precision to detect misstatements in the financial statements. Our remediation efforts began in the second quarter of 2014, when we hired our director of SEC reporting to increase the level of technical accounting and financial reporting experience within our organization. Our director of SEC reporting has also assisted us in improving our accounting systems, disclosure policies, procedures and controls. In the third and fourth quarters of 2014, we designed and implemented certain additional control activities that, when operating in conjunction with our previously existing control activities, we believe effectively mitigate risks of material misstatement in certain accounting and disclosure identification processes. Specifically, we (i) formalized and increased the level of precision of our journal entry and account reconciliation review controls, (ii) implemented additional control activities within our revenue recognition and research and development expense recognition processes, (iii) implemented improved financial reporting disclosure controls and procedures. In the fourth quarter of 2014, after allowing the previously described control activities to operate for a sufficient period, we concluded that the control activities were operating effectively and, as of December 31, 2014, had remediated the previously described material weaknesses. There were no other changes to our internal control over financial reporting during the quarter ended December 31, 2014.
105
|
ITEM 9B.
|
OTHER INFORMATION
|
Executive Management and Board Composition
In November 2014, the SCYNEXIS board of directors (the "Board") appointed Guy Macdonald and Marco Taglietti, M.D. as members of the Board, effective November 27, 2014. Further, Mr. Macdonald was appointed as a member of the Compensation Committee and Dr. Taglietti was appointed as a member of the Nominating and Governance Committee. Mr. Macdonald and Dr. Taglietti will serve until the SCYNEXIS 2015 Annual Meeting of Stockholders or until a successor for each is duly elected and qualified. By appointing Mr. Macdonald and Dr. Taglietti, our Board gained a wealth of experience in drug development and commercialization, including anti-infectives and antifungals. On the same date, Mounia Chaoui, Ph.D. resigned from the Board, effective immediately.
In February 2015, our Board appointed Marco Taglietti, M.D., as our Chief Executive Officer, effective April 1, 2015. Dr. Taglietti will succeed Yves Ribeill, Ph.D., who will remain our President and will continue to serve on the Board. Dr. Taglietti was appointed to the Board in November 2014. He previously served as Executive Vice President, Research and Development and Chief Medical Officer of Forest Laboratories, Inc. and also as President of the Forest Research Institute until the company was acquired by Actavis, plc. Prior to joining Forest Labs, Dr. Taglietti was Senior Vice President, Head of Global Research and Development at Stiefel Laboratories, Inc. and held various positions with Schering-Plough Corporation where he served as Vice President, Worldwide Clinical Research for Anti-infectives, Oncology, CNS, Endocrinology and Dermatology. He received his medical degree and his Board Certification in Infectious Diseases from the University of Pavia in Italy. The transition from Dr. Ribeill to Dr. Taglietti as our CEO aligns with the progression in our business, as we transition from a drug discovery organization that has brought the SCY-078 compound into clinical development to an organization focused on the clinical development and commercialization of SCY-078. In an unrelated matter, Carole Sable, M.D., our Chief Medical Officer, stepped down effective February 20, 2015.
On February 25, 2015, our Board appointed Steven C. Gilman, Ph.D. as a member of the Board, effective February 25, 2015. Further, Dr. Gilman was appointed as a member of the Audit Committee and as a member of the Nominating and Governance Committee.
In a meeting of our Board on March 26, 2015, the Board determined to submit all current members as nominees, other than Pamela J. Kirby, Ph.D., Laurent Arthaud and Jean-Yves Nothias, Ph.D., to be elected by our stockholders at our 2015 annual meeting, to serve on our Board until the 2016 annual meeting.
|
ITEM 10.
|
DIRECTORS, EXECUTIVE OFFICERS AND CORPORATE GOVERNANCE
|
Directors and Officers
The following table sets forth information regarding our directors and officers:
|
Name
|
Age
|
Position
|
||
|
Yves J. Ribeill, Ph.D.*
|
55
|
President, Chief Executive Officer and Director (4)
|
||
|
Charles F. Osborne, Jr.*
|
49
|
Chief Financial Officer
|
||
|
Pamela J. Kirby, Ph.D.
|
61
|
Chairman of our Board of Directors (5)
|
||
|
Laurent Arthaud
|
52
|
Director (1)(2)(5)
|
||
|
Steven C. Gilman, Ph.D.
|
62
|
Director (1)(3)(6)
|
||
|
Ann F. Hanham, Ph.D.
|
62
|
Director (1)(3)
|
||
|
Patrick J. Langlois, Ph.D.
|
69
|
Director (1)(2)
|
||
|
Guy Macdonald
|
55
|
Director (2)
|
||
|
Jean-Yves Nothias, Ph.D.
|
53
|
Director (3)(5)
|
||
|
Edward E. Penhoet, Ph.D.
|
74
|
Director (2)(3)
|
||
|
Marco Taglietti, M.D.
|
55
|
Director (7)
|
||
* Executive Officer
106
|
(1)
|
Member of the audit committee
|
|
(2)
|
Member of the compensation committee
|
|
(3)
|
Member of the nominating and corporate governance committee
|
|
(4)
|
Dr. Ribeill is expected to resign as our Chief Executive Officer effective as of April 1, 2015 and continue employment with us as our President and a member of our board of directors.
|
|
(5)
|
In a meeting of our board of directors on March 26, 2015, the board determined to submit all current members as nominees, other than Pamela J. Kirby, Ph.D., Laurent Arthaud and Jean-Yves Nothias, Ph.D., to be elected by our stockholders at our 2015 annual meeting, to serve on our board until the 2016 annual meeting.
|
|
(6)
|
In February 2015, our board of directors appointed Dr. Gilman as a member of the board of directors, effective February 25, 2015.
|
|
(7)
|
In February 2015, our board of directors appointed Dr. Taglietti as our Chief Executive Officer, effective April 1, 2015.
|
Executive Officers
Yves J. Ribeill, Ph.D.
Dr. Ribeill has served as our President and Chief Executive Officer and a member of our board of directors since November 1999. From 1982 to 2000, Dr. Ribeill held various positions during a 20-year international pharmaceutical career with Aventis Pharma S.A. and its predecessor Rhône-Poulenc Rorer. His roles with those companies included Discovery Chemistry Group Leader for Anti-Viral Research. He also served as a member of the Central Nervous System Group and as Director of Chemistry for the Anti-Infective Group. He was involved in all phases of the drug discovery and development effort that resulted in FDA approval of the anti-bacterial Synercid
®
in 1999. Dr. Ribeill is the author of 24 scientific publications and 15 patents. He was a member of the Scientific Advisory Committee of the World Health Organization. Dr. Ribeill has a Ph.D. in Chemistry from the University of Montpellier in France. Because of Dr. Ribeill’s extensive knowledge of our company, the pharmaceutical industry and our competitors, we believe he is able to make valuable contributions to our board of directors.
Charles F. Osborne, Jr.
Mr. Osborne, a certified public accountant, has served as our Chief Financial Officer since November 2003. From 1999 to 2003, he was Chief Financial Officer of Nobex Corporation in Durham, North Carolina. At Nobex, Mr. Osborne completed two venture capital rounds totaling more than $60 million. He also was involved in structuring and negotiating corporate licenses and research agreements with global pharmaceutical companies, including GlaxoSmithKline plc. From 1992 to 1998, he was Vice President of Finance for International Murex Technologies Co. While at Murex, he ran the worldwide finance group while based in London and was involved with the sale of the company to Abbott Laboratories. He holds a B.S. in Accounting from the University of North Carolina at Chapel Hill.
Non-Employee Directors
Pamela J. Kirby, Ph.D.
Dr. Kirby has served as the Chairman of our board of directors since January 2006 and has served as a director since December 2004. She brings over 25 years of experience in the pharmaceutical and biotechnology industries. Dr. Kirby served as a director of Novo Nordisk A/S, a global healthcare company, from 2008 to 2011, as a member of the board of Simmons & Simmons LLP, an international law firm, from 2011 to 2013, as a director of Smith and Nephew plc (LSE: SN), a multinational medical equipment manufacturing company, from 2002 to 2014, as a director of Informa plc (LSE: INF), a multinational publishing and conference company, from 2004 to 2014, as a director of, Victrex plc (LSE: VCT), a producer of high performance polymers, since 2011, as a director of DCC plc, a diversified investments group headquartered in Ireland, since 2013, as a director of Hikman Pharmaceuticals plc, a manufacturer of branded and non-branded generic and in-licensed products based in London, since November 2014 and Reckitt Benckiser Group plc (LSE: RB), a multinational consumer health goods company headquartered in England, since February 2015. From 2001 to 2003, Dr. Kirby was the Chief Executive Officer of Quintiles Transnational Corporation. From 1998 to 2001, she served as Director of Global Strategic Marketing and Business Development in the pharmaceutical division of Hoffmann-La Roche Ltd. From 1996 to 1998, she served as Commercial Director at British Biotech plc (now Vernalis plc). From 1979 to 1996, Dr. Kirby was with Astra AB (now AstraZeneca AB), rising through various senior management positions, being named Vice President of Corporate Strategy, Marketing and Business Development in 1994. She has a BSc in Pharmacology and a Ph.D. in Clinical Pharmacology from the University of London. Because of Dr. Kirby’s experience in senior executive positions within pharmaceutical and clinical research organizations and her extensive board experience we believe she is able to make valuable contributions to our board of directors
Laurent Arthaud.
Mr. Arthaud has served as a member of our board of directors since April 2007. Since 2006 he has served as a General Partner with Bpifrance Investissement, formerly CDC Entreprises, a private equity firm based in Paris,
107
responsible for investments in the biotech field. From 2004 to 2006, he was managing partner with Pharmavent Partners, also headquartered in Paris, and from 1999 to 2004, Mr. Arthaud was in charge of the venture capital activities of Aventis and managed the venture capital fund F.C.P.R. Genavent. Mr. Arthaud started his career in 1986 at the INSEE (French Economic Statistics Institute), and then at the Forecasts Department of the French Ministry of Finances. In 1995, he joined the cabinet of French Prime Minister Alain Juppé as Technical Advisor in charge of workforce and unemployment matters. He joined Rhône-Poulenc Group in 1997 as Scientific Board General Secretary. Mr. Arthaud is a graduate from the Ecole Polytechnique of Paris and from the Ecole Nationale de la Statistique et de l’Administration Economique. Because of Mr. Arthaud’s extensive experience, both in the pharmaceutical industry and in the domain of investments in biotechnology companies, we believe he is able to make valuable contributions to our board of directors.
Steven C. Gilman, Ph
.
D
.
joined our board on February 25
,
2015. He most recently served as the Executive Vice President, Research & Development and Chief Scientific Officer at Cubist Pharmaceuticals until its acquisition by Merck & Co in January 2015. Prior to joining Cubist
,
Dr. Gilman served as Chairman of the Board of Directors and CEO of ActivBiotics from March 2004 to October 2007. Prior to ActivBiotics, Dr. Gilman worked at Millennium Pharmaceuticals, Inc
.
, from October 2000 to March 2004 where he held a number of senior leadership roles including Vice President and General Manager
,
Inflammation
.
Prior to Millennium, he was Group Director at Pfizer Global Research and Development. He has also held scientific, business and academic appointments at Wyeth
,
Cytogen Corporation
,
Temple Medical School and Connecticut College. Dr. Gilman currently serves on the board of directors of Vericel Corporation (NASDAQ: VCEL), on the board of directors of the Massachusetts Biotechnology Association, Inhibikase, Inc. and the Penn State University Biotechnology Advisor Board
.
Dr. Gilman received his Ph.D
.
and MS degrees in microbiology form Pennsylvania State University, his post-doctoral training at Scripps Clinical and Research Foundation and received a B.A. in microbiology from Miami University of Ohio.
Ann F. Hanham, Ph.D.
Dr. Hanham has served as a member of our board of directors since December 2008. Prior to becoming a Founding Partner and Managing Director of BAR Capital Management in December 2013, she was a General Partner with Burrill & Company, a life sciences venture capital firm from 2000 to 2013. From 1998 to 2000, Dr. Hanham was a co-founder and Vice President of Clinical & Regulatory Affairs at InterMune, Inc. From 1995 to 1998, she served as the Senior Director for Oncology Product Development at Otsuka Pharmaceuticals and from 1991 to 1995 as the Medical Director for Celtrix Pharmaceuticals. From 1988 to 1991, Dr. Hanham worked for Becton Dickinson in both regulatory and clinical affairs for the monoclonal antibody program, and from 1984 to 1988 as a regulatory toxicologist with the Health Protection Branch of Health and Welfare Canada. She has served as a member of the board of directors of AliveCor since 2013, Endocyte, Inc. (NASDAQ: ECYT) since 2004, NewBridge since 2013 and Waterstone Pharmaceuticals, Inc. since 2008. She previously served as a member of the boards of directors of
Acusphere Inc. (OTCMKTS: ACUS), Biomimetic Therapeutics Inc. (NASDAQ: BMTI ), Biotie Therapies Corp. (Nordic List: BTH1V), Immunicon Corp. (NASDAQ: IMMC ), Targacept Inc. (NASDAQ: TRGT), and TLC (Taiwan Liposome Company, Inc.) (GreTai Sec M: 1452:TT)
. Dr. Hanham holds a Ph.D. from the University of British Columbia, an MSc from Simon Fraser University, and a BSc from the University of Toronto. She was also Board Certified in Toxicology in 1986. Because of Dr. Hanham’s extensive clinical and regulatory experience, as well as her extensive experience in working with development stage biotechnology companies, we believe she is able to make valuable contributions to our board of directors.
Patrick J. Langlois, Ph.D.
Dr. Langlois has served as a member of our board of directors since April 2006. Since March 2005, Dr. Langlois has served as the General Partner of PJL Conseils, a consulting firm specializing in strategy, corporate development and mergers and acquisitions. From 2002 to 2004, he served as Vice Chairman of the Management Board and Chief Financial Officer at Aventis S.A., and from 1999 to 2002 as its Executive Vice President and Chief Financial Officer. At Aventis, Dr. Langlois was responsible for finance and corporate development functions, as well as three global businesses: dermatology, protein therapeutics and animal health. From 1990 to 1999, Dr. Langlois was employed by Rhône-Poulenc Group, most recently as Chief Financial Officer and a Member of the Executive Committee. From 1990 to 1996, he was employed by Rhône-Poulenc Rorer, a NYSE-listed pharmaceutical company, most recently as Chief Financial Officer. Dr. Langlois received a License degree from the University of Rennes, a Ph.D. degree in Economics from the University of Rennes and was awarded a Diploma in Higher Banking Studies from the Centre d’Etudes Supérieures de Banque in France. Because of Dr. Langlois’ extensive experience in the healthcare sector, including an executive position as chief financial officer of a NYSE-listed company as well as his relationships with institutional investors and investment banks in the United States and Europe, we believe he is able to make valuable contributions to our board of directors.
Guy Macdonald
Mr. Macdonald has served as a member of our board of directors since November 2014. He has served as the President and Chief Executive Officer and a member of the board of directors of Tetraphase Pharmaceuticals, Inc. since January 2008. From August 2003 until January 2008, Mr. Macdonald served as Executive Vice President of Operations of Idenix Pharmaceuticals, Inc., a biopharmaceutical company. From 1981 to 2003 he served in various positions at Merck & Co., Inc., most recently serving as the Vice President for Anti-Infective and Hospital Products. In addition to his role on the Board of
108
Tetraphase, Mr. Macdonald currently serves as Chairman of the board of directors of Spring Bank Pharmaceuticals, Inc., a privately held company. Mr. Macdonald received an Honors Degree in biochemistry from Dundee University in Dundee, Scotland.
Jean-Yves Nothias, Ph.D.
Dr. Nothias has served as a member of our board of directors since August 2000. Since 2012, Dr. Nothias has served as a Director of Genomic Vision SA, a biotechnology company headquartered in Paris. Since 2012, Dr. Nothias is Founder and President of a fund management company Vesale Partners, managing its Biotechnology Fund. From 2000 to 2011, Dr. Nothias served as a Managing Director of SG Asset Management, where he headed the Venture Capital Biotechnology Team. Since 2005, he has served as a director of GenomeQuest Inc., and since 2012 he has served as a director of Bioforce Nanoscience Inc. Since 2009 he has served as an observer of the boards of directors of Somalogic Inc. and Pulmagen Therapeutics. From 1999 to 2000, he was a biotechnology corporate analyst for Oddo & Cie, a French brokerage firm. From 1996 to 1998, he was a sales side biotechnology analyst for Hambrecht & Quist based in Paris. Dr. Nothias holds a thesis in Molecular Biology from Université Pierre & Marie Curie and a master’s degree in management from Université Paris Sorbonne. Because of Dr. Nothias’s extensive biotechnology fund manager and board member experience, we believe he is able to make valuable contributions to our board of directors.
Edward E. Penhoet, Ph.D.
Dr. Penhoet has served as a member of our board of directors since June 2002. Since 2000, he has served as a Director of Alta Partners, a life sciences venture capital firm. Since 2009, he has served on President Obama’s Council of Advisors on Science and Technology, an advisory group comprising 20 of the nation’s leading scientists and engineers who directly advise the President and the Executive Office of the President. From 2005 to 2010, he served as Vice-Chair of the governing board of the Independent Citizens Oversight Committee for the California Institute of Regenerative Medicine. From 2004 to 2008, he served as the President of the Gordon and Betty Moore Foundation. From 1998 to 2002, he served as the Dean of the School of Public Health at the University of California at Berkeley. Dr. Penhoet was a co-founder of Chiron Corporation, where he served as President and Chief Executive Officer from 1981 to 1998. From 1971 to 1981, he was a faculty member of the Biochemistry Department of the University of California at Berkeley. Dr. Penhoet has served as a member of the board of directors of Cymabay Therapeutics, Inc. since 2004 (NASDAQ: CBAY), and served as a member of the boards of directors of ChemoCentryx, Inc (NASDAQ: CCXI) from 2007 to 2013, Corcept Therapeutics Incorporated (NASDAQ: CORT) from 2008 to 2010 and ZymoGenetics, Inc. (NASDAQ: ZGEN) from 2000 to 2010. He is a member of both the Institute of Medicine of the National Academies and the American Academy of Arts and Sciences and has co-authored more than 50 scientific articles and papers. Dr. Penhoet earned his A.B. in Biology from Stanford University and his Ph.D. in Biochemistry from the University of Washington. He was a post-doctoral fellow at the University of California, San Diego, from 1968 to 1970. Because of Dr. Penhoet’s extensive experience as an investor in life science companies, we believe he is able to make valuable contributions to our board of directors.
Marco Taglietti, M.D
.
Dr. Taglietti has served as a member of our board of directors since November 2014. He served as Executive Vice President, Research and Development, and Chief Medical Officer of Forest Laboratories, Inc. and also as President of the Forest Research Institute from August 2007 until August 2014, after Forest Laboratories was acquired by Actavis plc. Prior to joining Forest Laboratories, Inc. in 2007, Dr. Taglietti held the position of Senior Vice President, Head of Global Research and Development, at Stiefel Laboratories, Inc. for three years. He joined Stiefel Laboratories, Inc. after 12 years at Schering-Plough Corporation where he last held the position of Vice President, Worldwide Clinical Research for Anti-Infectives, Oncology, CNS, Endocrinology and Dermatology. Dr. Taglietti began his career at Marion Merrell Dow Research Institute. Dr. Taglietti currently serves on the Board of Directors of NephroGenex, Inc. (NASDAQ: NRX) and of Delcath System, Inc. (NASDAQ: DCTH). He received his medical degree and board certifications from the University of Pavia in Italy.
Each of our executive officers serves at the discretion of our board of directors and holds office until his or her successor is duly elected and qualified or until his or her earlier resignation or removal. There are no family relationships among any of our directors or executive officers.
Board Composition and Election of Directors
Our business and affairs are managed under the direction of our board of directors, which currently consists of ten members. The members of our board of directors were elected in compliance with the provisions of our amended and restated certificate of incorporation.
Director Independence
Our board of directors has undertaken a review of its composition, the composition of its committees, and the independence of each director. Based upon information requested from and provided by each director concerning his or her background, employment, and affiliations, including family relationships, our board of directors has determined that all
109
members of our board of directors except Dr. Ribeill do not have a relationship that would interfere with the exercise of independent judgment in carrying out the responsibilities of a director and that each of these directors is “independent” as that term is defined under the applicable rules and regulations of the SEC and the listing requirements and rules of the NASDAQ Stock Market. In making this determination, our board of directors considered the current and prior relationships that each non-employee director has with our company and all other facts and circumstances our board of directors deemed relevant in determining their independence, including the beneficial ownership of our capital stock by each non-employee director. Dr. Taglietti is currently determined to be “independent” as determined by the SEC and the NASDAQ Stock Market, but shall cease to be deemed to be independent for these purposes upon the commencement of his services as our Chief Executive Officer which is expected to occur on April 1, 2015.
Board Committees
Our board of directors has the authority to appoint committees to perform certain management and administration functions. Our board of directors has an audit committee, a compensation committee and a nominating and corporate governance committee. The composition and responsibilities of each committee are described below. Members will serve on these committees until their resignation or until otherwise determined by our board of directors. The charters for each of these committees are currently available on our website at www.scynexis.com.
Audit Committee
Our audit committee currently consists of Patrick J. Langlois, Ph.D., Ann F. Hanham, Ph.D., Steven C. Gilman, Ph.D., and until our 2015 annual meeting of stockholders, Laurent Arthaud, each of whom satisfies the independence requirements under the NASDAQ Global Market listing standards and Rule 10A-3(b)(1) of the Securities Exchange Act of 1934, or the Exchange Act. Our board of directors has determined that Dr. Langlois is an “audit committee financial expert” within the meaning of SEC regulations. Each member of our audit committee can read and understand fundamental financial statements in accordance with audit committee requirements. In arriving at this determination, our board of directors has examined each audit committee member’s scope of experience and the nature of their employment in the corporate finance sector.
Our audit committee oversees our corporate accounting and financial reporting process. The audit committee has the following responsibilities, among others things, as set forth in the audit committee charter:
|
•
|
reviewing and pre-approving the engagement of our independent registered public accounting firm to perform audit services and any permissible non-audit services;
|
|
•
|
evaluating the performance of our independent registered public accounting firm and deciding whether to retain their services;
|
|
•
|
reviewing our annual and quarterly financial statements and reports and discussing the statements and reports with our independent registered public accounting firm and management, including a review of disclosures under the section of this annual report titled “Management’s Discussion and Analysis of Financial Condition and Results of Operations;”
|
|
•
|
considering and approving or disapproving of all related party transactions;
|
|
•
|
preparing the audit committee report required by the SEC to be included in our annual proxy statement;
|
|
•
|
reviewing, with our independent registered public accounting firm and management, significant issues that may arise regarding accounting principles and financial statement presentation, as well as matters concerning the scope, adequacy and effectiveness of our financial controls;
|
|
•
|
conducting an annual assessment of the performance of the audit committee and its members, and the adequacy of its charter; and
|
|
•
|
establishing procedures for the receipt, retention and treatment of complaints received by us regarding financial controls, accounting or auditing matters.
|
Compensation Committee
Our compensation committee currently consists of Patrick J. Langlois, Ph.D., Edward E. Penhoet, Ph.D., Guy Macdonald and until our 2015 annual meeting of stockholders, Laurent Arthaud, each of whom our board of directors has determined to be independent under the NASDAQ Global Market listing standards and an “outside director” as that term is defined in Section 162(m) of the Internal Revenue Code.
110
Our compensation committee reviews and recommends policies relating to compensation and benefits of our officers and employees. The compensation committee has the following responsibilities, among other things, as set forth in the compensation committee’s charter:
|
•
|
determining the compensation and other terms of employment of our chief executive officer and our other executive officers and reviewing and approving corporate performance goals and objectives relevant to the compensation;
|
|
•
|
reviewing and recommending to the full board of directors the compensation of our non-employee directors;
|
|
•
|
evaluating, adopting and administering the equity incentive plans, compensation plans, and similar programs advisable for us, as well as modification or termination of existing plans and programs;
|
|
•
|
establishing policies with respect to equity compensation arrangements;
|
|
•
|
reviewing and discussing annually with management our “Compensation Discussion and Analysis” if required by SEC rules;
|
|
•
|
preparing the compensation committee report if required by the SEC to be included in our annual proxy statement; and
|
|
•
|
reviewing and evaluating, at least annually, the performance of the compensation committee and the adequacy of its charter.
|
Nominating and Corporate Governance Committee
Our nominating and corporate governance committee currently consists of Ann F. Hanham, Ph.D., Edward E. Penhoet, Ph.D., Steven C. Gilman, Ph.D. and until our 2015 annual meeting of stockholders, Jean-Yves Nothias, Ph.D., each of whom our board of directors has determined to be independent under the NASDAQ Global Market listing standards.
Our nominating and corporate governance committee makes recommendations regarding corporate governance, the composition of our board of directors, identification, evaluation and nomination of director candidates and the structure and composition of committees of our board of directors. The nominating and corporate governance committee has the following responsibilities, among other things, as set forth in the nominating and corporate governance committee’s charter:
|
•
|
reviewing periodically and evaluating director performance on our board of directors and its applicable committees, and recommending to our board of directors and management areas for improvement;
|
|
•
|
interviewing, evaluating, nominating and recommending individuals for membership on our board of directors;
|
|
•
|
reviewing and recommending to our board of directors any amendments to our corporate governance policies; and
|
|
•
|
reviewing and assessing, at least annually, the performance of the nominating and corporate governance committee and the adequacy of its charter.
|
Code of Business Conduct and Ethics
We have adopted a code of business conduct and ethics that applies to all of our employees, officers and directors, including those officers responsible for financial reporting. Our code of business conduct and ethics is currently available on our website at www.scynexis.com. We will disclose any amendments to the code, or any waivers of its requirements, on our website to the extent required by the applicable rules and exchange requirements.
Section 16(A) Beneficial Ownership Reporting Compliance
Section 16(a) of the Securities Exchange Act of 1934 requires our executive officers, directors and persons who beneficially own more than 10% of our common stock to file initial reports of ownership and reports of changes in ownership with the SEC. These persons are required by SEC regulations to furnish us with copies of all Section 16(a) forms that they file.
To our knowledge, based solely on review of the forms furnished to us and written representations that no other reports were required during the fiscal year ended December 31, 2014, we believe that all Section 16(a) filing requirements applicable to the executive officers, directors and persons who beneficially own more than 10% of our common stock were complied with
111
in 2014, with the exception of statements of changes in beneficial ownership filed on Form 4 on October 2, 2014, for each of Pamela J. Kirby, Ann F. Hanham and Jean-Yves Nothias.
|
ITEM 11.
|
EXECUTIVE COMPENSATION
|
Summary Compensation Table
The following table provides information regarding the compensation of our principal executive officer, principal financial officer and our other highest paid executive officer during the fiscal years ended December 31, 2014 and December 31, 2013. We refer to these executive officers in this annual report as our named executive officers.
|
Name and
Principal Position
|
Year
|
Salary
|
Bonus
|
Option
awards (1)
|
All other
compensation
|
Total
|
||||||||||||||||||||
|
Yves J. Ribeill, Ph.D.
|
2014
|
$
|
337,556
|
|
$
|
195,600
|
|
$
|
798,432
|
|
(2)
|
$
|
9,654
|
|
(5)
|
$
|
1,341,242
|
|
||||||||
|
President and Chief Executive Officer
|
2013
|
250,146
|
|
—
|
|
—
|
|
11,904
|
|
262,050
|
|
|||||||||||||||
|
Charles F. Osborne, Jr.
|
2014
|
272,127
|
|
59,999
|
|
237,771
|
|
(3)
|
9,172
|
|
579,069
|
|
||||||||||||||
|
Chief Financial Officer
|
2013
|
250,205
|
|
—
|
|
—
|
|
8,955
|
|
259,160
|
|
|||||||||||||||
|
Carole Sable
|
2014
|
336,762
|
|
86,520
|
|
1,579,657
|
|
(4)
|
4,483
|
|
2,007,422
|
|
||||||||||||||
|
Chief Medical Officer (6)
|
2013
|
—
|
|
—
|
|
—
|
|
—
|
|
—
|
|
|||||||||||||||
|
(1)
|
The amounts in this column reflect the aggregate grant date fair value of each option award granted during the fiscal year, as computed in accordance with FASB ASC Topic 718. The amounts in this column also reflect the aggregate incremental fair value of all option awards modified during the fiscal year, as computed in accordance with FASB ASC Topic 718. The term modifications, which were approved by our board of directors on June 18, 2014 and by our shareholders on September 11, 2014, were made to all option awards granted pursuant to the 2009 Plan and 1999 Plan. The modified terms, the valuation methodologies, and assumptions used in determining grant date fair value or incremental fair value, are described in Note 11 to our financial statements included in this annual report.
|
|
(2)
|
This amount represents the sum of (i) $702,789, the aggregate grant date fair value of an option award granted during the fiscal year and (ii) $95,643, the aggregate incremental fair value of all option awards modified during the fiscal year. The grant date fair value per share of the option award granted during the fiscal year was $3.76 and the weighted average incremental fair value per share of option awards modified during the fiscal year was $3.10. Includes an option granted June 18, 2014, with an exercise price equal to $9.64 per share, of which 2.08% of the shares subject to the option vest monthly for 48 months as measured from the date of grant, provided executive continues to provide continuous services to us.
|
|
(3)
|
This amount represents the sum of (i) $215,738, the aggregate grant date fair value of an option award granted during the fiscal year and (ii) $22,033, the aggregate incremental fair value of all option awards modified during the fiscal year. The grant date fair value per share of the option award granted during the fiscal year was $3.76 and the weighted average incremental fair value per share of option awards modified during the fiscal year was $2.77. Includes an option granted June 18, 2014, with an exercise price equal to $9.64 per share, of which 2.08% of the shares subject to the option vest monthly for 48 months as measured from the date of grant, provided executive continues to provide continuous services to us.
|
|
(4)
|
This amount represents the sum of (i) $1,422,640, the aggregate grant date fair value of all option awards granted during the fiscal year and (ii) $157,017, the aggregate incremental fair value of an option award modified during the fiscal year. The weighted average grant date fair value of the option awards granted during the fiscal year was $19.33 and the incremental fair value per share of the option award modified during the fiscal year was $3.37. Includes an option granted January 16, 2014, and an option granted June 18, 2014. Both option grants have an exercise price equal to $9.64 per share, of which 2.08% of the shares subject to the option vest monthly for 48 months as measured from the date of grant, provided executive continues to provide continuous services to us.
|
|
(5)
|
Includes tax preparation payments in the amount of $600, short term/long term disability premiums in the amount of $1,130 and life insurance premiums in the amount of $420. Also includes $7,504 contributed to his 401(k) plan account.
|
|
(6)
|
Dr. Sable terminated her employment with us effective February 20, 2015.
|
112
Our executive officers may receive discretionary annual cash bonuses based on a percentage of their respective annual salaries upon achievement of performance goals as established by our board of directors or compensation committee and agreed to by our executive officers which are more completely described below under the heading “Employment Agreements.”
Outstanding Equity Awards as of December 31, 2014
The following table provides information regarding outstanding equity awards held by our named executive officers as of December 31, 2014.
|
|
Number of Securities Underlying
Unexercised options
|
|
Option
exercise
Price
|
Option
expiration
Date
|
||||||||
|
Name
|
Exercisable(1)
|
Unexercisable
|
|
|||||||||
|
Yves J. Ribeill, Ph.D.
|
7,352
|
|
—
|
|
$
|
9.64
|
|
6/17/2024
|
||||
|
7,352
|
|
—
|
|
$
|
9.64
|
|
6/17/2024
|
|||||
|
931
|
|
—
|
|
$
|
9.64
|
|
6/17/2024
|
|||||
|
3,676
|
|
—
|
|
$
|
9.64
|
|
6/17/2024
|
|||||
|
2,941
|
|
—
|
|
$
|
9.64
|
|
6/17/2024
|
|||||
|
3,676
|
|
—
|
|
$
|
9.64
|
|
6/17/2024
|
|||||
|
2,941
|
|
—
|
|
$
|
9.64
|
|
6/17/2024
|
|||||
|
1,960
|
|
—
|
|
$
|
9.64
|
|
6/17/2024
|
|||||
|
27,278
|
|
159,774
|
|
(2)
|
$
|
9.64
|
|
6/17/2024
|
||||
|
Charles F. Osborne, Jr.
|
960
|
|
$
|
9.64
|
|
6/17/2024
|
||||||
|
934
|
|
$
|
9.64
|
|
6/17/2024
|
|||||||
|
490
|
|
$
|
9.64
|
|
6/17/2024
|
|||||||
|
1,225
|
|
$
|
9.64
|
|
6/17/2024
|
|||||||
|
808
|
|
$
|
9.64
|
|
6/17/2024
|
|||||||
|
1,225
|
|
$
|
9.64
|
|
6/17/2024
|
|||||||
|
1,470
|
|
$
|
9.64
|
|
6/17/2024
|
|||||||
|
833
|
|
$
|
9.64
|
|
6/17/2024
|
|||||||
|
8,373
|
|
49,047
|
|
(2)
|
$
|
9.64
|
|
6/17/2024
|
||||
|
Carole Sable, M.D.
|
—
|
|
46,636
|
|
(3)
|
$
|
9.64
|
|
6/17/2024
|
|||
|
3,933
|
|
23,037
|
|
(2)
|
$
|
9.64
|
|
6/17/2024
|
||||
|
(1)
|
The options listed are fully vested or are subject to an early exercise right and may be exercised in full prior to vesting of the shares underlying such options. Vesting of all options is subject to continued service on the applicable vesting date.
|
|
(2)
|
2.08% of the shares subject to the option vest monthly for 48 months as measured from the date of grant provided executive continues to provide continuous services to us.
|
|
(3)
|
25% of the shares subject to this option vested on January 16, 2015, and 6.25% of the shares subject to the option vest for each of the next 12 quarterly anniversaries thereafter, provided executive continues to provide continuous services to us. Dr. Sable terminated her employment with us effective February 20, 2015.
|
Change in Control Severance Benefits
We have entered into employment agreements with each of our named executive officers, as well as Dr. Taglietti that contain severance provisions providing for continued payment of salary and provision of benefits for a specified period of time in connection with termination of employment under various circumstances, including involuntary termination by us or termination by the employee for good reason.
113
The actual amounts that would be paid or distributed to an eligible executive officer as a result of a termination of employment occurring in the future may be different than those presented below, as many factors will affect the amount of any payments and benefits upon a termination of employment. For example, some of the factors that could affect the amounts payable include the executive officer’s base salary and the market price of our common stock. Although we have entered into a written agreement to provide severance payments and benefits in connection with a termination of employment under particular circumstances, we may mutually agree with the executive officers to provide payments and benefits on terms that vary from those currently contemplated. In addition to the amounts presented below, each executive officer is eligible to receive any benefits accrued under our broad-based benefit plans, such as accrued vacation pay, in accordance with those plans and policies.
To receive any of the severance benefits under these agreements, the executive officer must execute a release of claims against us and comply with further cooperation, confidentiality and noncompetition provisions.
Severance Payments
In the event of a termination without “just cause” by us or an executive officer’s resignation for “good reason” at any time during the period that is within twelve months following a “change in control,” which termination we refer to as a Change in Control Termination, the executive officer is eligible to receive the following payments and benefits:
|
•
|
a cash amount equal to a portion (twelve months as was the case for Dr. Sable and is the case for Mr. Osborne, or 24 months in the case of Dr. Ribeill and Dr. Taglietti, upon his commencement of services as our CEO) of the executive officer’s then current base salary, which shall be paid over twelve months (as was the case for Dr. Sable and is the case for Mr. Osborne) or 24 months (in the case of Dr. Ribeill and Dr. Taglietti, upon his commencement of services as our CEO) commencing with the first payroll period following the termination date; and
|
|
•
|
payment of the same percentage of the COBRA premiums for continued medical, dental, and vision group health coverage as we paid prior to the executive officers termination, until the earlier of (a) twelve months (as was the case or Dr. Sable and is the case for Mr. Osborne) or 24 months (in the case of Dr. Ribeill and Dr. Taglietti, upon his commencement of services as our CEO) after termination of employment, (b) such time as the executive officer becomes enrolled in the group health insurance plan of another employer or (c) the executive officer becomes entitled to Medicare after the COBRA election.
|
In the event of a termination without “just cause” by us or an executive officer’s resignation for “good reason” at any time other than during the twelve month period following a “change in control,” which we refer to as a Covered Termination, the executive officer is eligible to receive the following payments and benefits:
|
•
|
a cash amount equal to a portion (six months as was the case for Dr. Sable and is the case for Mr. Osborne or twelve months in the case of Dr. Ribeill and Dr. Taglietti, upon his commencement of services as our CEO) of the executive officer’s then current base salary, which shall be paid over six months (as was the case or Dr. Sable and is the case for Mr. Osborne) or twelve months (in the case of Dr. Ribeill and Dr. Taglietti, upon his commencement of services as our CEO) commencing with the first payroll period following the termination date; and
|
|
•
|
payment of the same percentage of the COBRA premiums for continued medical, dental, and vision group health coverage as we paid prior to the executive officers termination, until the earlier of (a) six months (as was the case or Dr. Sable and is the case for Mr. Osborne) or twelve months (in the case of Dr. Ribeill and Dr. Taglietti, upon his commencement of services as our CEO) after termination of employment, (b) such time as the executive officer becomes enrolled in the group health insurance plan of another employer or (c) the executive officer becomes entitled to Medicare after the COBRA election.
|
Treatment of Equity Awards
In the event of a Change in Control Termination, the vesting and exercisability of all outstanding options to purchase our common stock held by an eligible executive officer will be accelerated in full, and any repurchase rights held by us respect to our common stock issued or issuable pursuant to any other stock award granted to such executive officer will lapse.
114
In the event of a Covered Termination, the vesting and exercisability of all outstanding options to purchase our common stock held by an eligible executive officer will be accelerated, and any repurchase rights held by us with respect to our common stock issued or issuable pursuant to any other stock award granted to such executive officer will lapse, with respect to the same number of shares if the executive officer had continued employment for an additional six months (as was the case for Dr. Sable and is the case for Mr. Osborne) or twelve months (in the case of Dr. Ribeill and Dr. Taglietti, upon his commencement of services as our CEO).
Parachute Payments
If any payment or benefit received by Dr. Ribeill, Mr. Osborne Dr, Sable, or Dr. Taglietti upon his commencement of services as our CEO, under his or her employment agreement or otherwise would constitute a “parachute payment” within the meaning of Section 280G of the Internal Revenue Code and the payments would be subject to the excise tax imposed by Section 4999 of the Internal Revenue Code, then the payments will either be (1) provided to the executive officer in full or (2) reduced to such lesser amount that would result in no portion of such payments being subject to the excise tax, whichever amount after taking into account all applicable taxes, including the excise tax, would result in the executive officer’s receipt, on an after-tax basis, of the greatest amount of such payments.
For purposes of these agreements, the term “change in control” generally means the occurrence of any of the following: (a) our company being party to any merger, consolidation or other similar transaction that results in our stockholders immediately before the merger, consolidation or other similar transaction owning less than 50% of the equity, or possessing less than 50% of the voting control, of us or the successor entity in the merger, consolidation or similar transaction; (b) any liquidation, dissolution or other sale or disposition of all or substantially all of our assets; or (c) our stockholders sell or otherwise dispose of our capital stock in a single transaction or series of related transactions such that the stockholders immediately before such transaction or related transactions own less than 50% of the equity, and possess less than the voting power, of our capital stock; provided, however, that an initial public offering or subsequent public offering of our common stock does not constitute a “change in control.”
For purposes of these agreements, the term “just cause” generally means any of the following: (a) the executive officer’s willful and material breach of his or her employment agreement and the executive officer’s continued failure to cure such breach to the reasonable satisfaction of our board of directors within thirty days following written notice of such breach from our board of directors; (b) the executive officer’s conviction of, or entry of a plea of guilty or nolo contendere to a felony or a misdemeanor involving moral turpitude; (c) the executive officer’s willful commission of an act of fraud, breach of trust or dishonesty, including without limitation embezzlement or an act that results in material damage or harm to our business, financial condition or assets; (d) the executive officer’s intentional damage or destruction of substantial property of SCYNEXIS; or (e) the executive officer’s breach of the terms of his or her confidentiality agreement with us.
For purposes of these agreements, the term “good reason” generally means any of the following without the executive officer’s express written consent: (a) assignment to, or withdrawal from, the executive officer of any duties or responsibilities that results in a material diminution in the executive officer’s authority, duties or responsibilities as in effect immediately prior to such change; (b) a material diminution in the authority, duties or responsibilities of the supervisor to whom the executive officer is required to report, including (if applicable) a requirement that the executive officer report to a corporate officer or employee instead of reporting directly to our board of directors; (c) a material reduction by us of the executive officer’s annual base salary; (d) a relocation of the executive officer or our principal executive offices if the executive officer’s principal office is at such offices, to a location more than 60 miles from the location at which the executive officer is then performing his or her duties; or (e) a material breach by us of any provision of the executive officer’s employment agreement or any other enforceable written agreement between us and the executive officer.
Before an executive officer may terminate employment for “good reason,” the executive officer must notify us in writing within 90 days following the occurrence of the event constituting good reason, we must fail to remedy or cure the alleged “good reason” within 30 days following receipt of such written notice and the executive officer must then terminate employment within 12 months following the expiration of the time period.
Employment Agreements
We have entered into agreements with each of the named executive officers in connection with his or her employment with us. These agreements generally provide for “at will” employment and set forth the terms and conditions of employment of each named executive officer, including base salary, target annual bonus opportunity, standard employee benefit plan participation, initial stock option grant and vesting provisions with respect to the initial stock option grant. These employment agreements were each subject to execution of our standard confidential information and invention assignment agreement.
115
Employment agreement with Dr. Ribeill
. We entered into an employment agreement with Dr. Ribeill in December 2001 setting forth the terms of Dr. Ribeill’s employment. Pursuant to the agreement, Dr. Ribeill was initially paid a salary of $125,000 and was eligible to receive a performance bonus based on a target amount of 30% of his base salary and certain stock options under our 2009 Plan. We entered into an amended and restated employment agreement with Dr. Ribeill in December 2012, which replaced and superseded his prior employment agreement, effective in December 2012. Pursuant to this agreement, Dr. Ribeill receives an annual salary, which is currently $400,000, as such may be amended by our board of directors from time to time, and is eligible to receive a performance bonus based on a target amount of 50% of his base salary, as determined by our board of directors based upon the achievement of performance objectives mutually agreed upon by Dr. Ribeill and our board of directors.
Employment agreement with Mr. Osborne
. We entered into an employment agreement with Mr. Osborne in November 2003 setting forth the terms of Mr. Osborne’s employment. Pursuant to the agreement, Mr. Osborne was initially paid an annual salary of $220,000 and was eligible to receive a performance bonus based on a target amount of 30% of his base salary and certain stock options under our 2009 Plan. We entered into an amended and restated employment agreement with Mr. Osborne in December 2012, which replaced and superseded his prior employment agreement, effective in December 2012. Pursuant to this agreement, Mr. Osborne receives an annual salary, which is currently $287,818, as such may be amended by our board of directors from time to time, and is eligible to receive a performance bonus based on a target amount of 30% of his base salary, as determined by our board of directors based upon the achievement of performance objectives mutually agreed upon by Mr. Osborne and our board of directors.
Employment agreement with Dr. Sable.
We entered into an employment agreement with Dr. Sable in January, 2014 setting forth the terms of Dr. Sable’s employment. Pursuant to the agreement, Dr. Sable received an annual salary of $350,000 and was eligible to receive a performance bonus based on a target amount of 40% of her base salary, as determined by our board of directors based upon the achievement of performance objectives mutually agreed upon by Dr. Sable and our board of directors. Dr. Sable terminated her services with the Company effective as of February 20, 2015.
Employment agreement with Dr. Taglietti.
We entered into an employment agreement with Dr. Taglietti on February 5, 2015, effective as of April 1, 2015 setting forth the terms of Dr. Taglietti’s employment as our Chief Executive Officer. Pursuant to the agreement, Dr. Taglietti will be entitled to receive an annual salary of $480,000 and will be eligible to receive a performance bonus based on a target amount of 50% of his base salary, as determined by our board of directors based upon the achievement of performance objectives mutually agreed upon by Dr. Taglietti and our board of directors. Dr. Taglietti is currently expected to commence services as our Chief Executive Officer effective as of April 1, 2015.
Dr. Ribeill, Mr. Osborne, Dr. Sable, and Dr. Taglietti are, or were, entitled to certain severance payments and benefits under their respective employment agreements, the terms of which are described above.
Equity Incentive Plans
2014 Equity Incentive Plan
Our board of directors adopted the 2014 Equity Incentive Plan, or the 2014 Plan, on February 11, 2014, and our stockholders approved the 2014 Plan on February 26, 2014. Our board of directors further amended the 2014 Plan on June 18, 2014 to increase the available shares reserve under the 2014 Plan by an aggregate of 351,653 shares and our stockholders approved the amendment to the 2014 Plan on September 11, 2014. The 2014 Plan is the successor to and continuation of our 2009 Stock Option Plan, or the 2009 Plan, which is described below.
Stock Awards
. The 2014 Plan provides for the grant of incentive stock options, nonstatutory stock options, stock appreciation rights, restricted stock awards, restricted stock unit awards, performance-based stock awards and other forms of equity compensation (collectively, stock awards), all of which may be granted to eligible employees, non-employee directors and consultants of us and our affiliates. Additionally, the 2014 Plan provides for the grant of performance cash awards. Incentive stock options may be granted only to our employees. All other awards may be granted to employees and to non-employee directors and consultants.
Share Reserve
. The aggregate number of shares of our common stock that may be issued pursuant to stock awards under the 2014 Plan is the sum of: (1) 609,005 shares; (2) the number of shares reserved for issuance under our 2009 Plan at the time the 2014 Plan became effective; and (3) any shares subject to outstanding stock options or other stock awards that would have otherwise returned to our 2009 Stock Option Plan (such as upon the expiration or termination of a stock option granted under such plan prior to vesting). Additionally, the number of shares of our common stock reserved for issuance under the 2014 Plan will automatically increase on January 1 of each year, and continuing through and including January 1, 2024, by 4.0% of the
116
total number of shares of our capital stock outstanding on December 31 of the preceding calendar year, or a lesser number of shares as determined by our board of directors. On January 1, 2015 the available shares reserve under the 2014 Plan was increased by an aggregate of 340,484 shares by operation of the preceding sentence. The maximum number of shares that may be issued upon the exercise of incentive stock options under our 2014 Plan is 3,676,470 shares.
If a stock award granted under the 2014 Plan expires or otherwise terminates without all of the shares covered by the stock award having been issued, or is settled in cash, the shares of our common stock not acquired pursuant to the stock award again will become available for subsequent issuance under the 2014 Plan. In addition, the following types of shares under the 2014 Plan may become available for the grant of new stock awards under the 2014 Plan: (1) shares that are forfeited to or repurchased by us prior to become fully vested; (2) shares withheld to satisfy income or employment withholding taxes; or (3) shares used to pay the exercise price or purchase price of a stock award. Shares issued under the 2014 Plan may be previously unissued shares or reacquired shares bought by us on the open market. As of March 1, 2015, stock awards exercisable for
442,137
shares of our common stock were outstanding.
2009 Stock Option Plan
Our board of directors adopted the 2009 Stock Option Plan, or the 2009 Plan, on October 22, 2009. Our 2009 Plan provides for the grant of incentive stock options to our employees, and for the grant of nonstatutory stock options to our employees, directors and consultants. No additional options or stock awards will be issued under our 2009 Plan following the date on which our 2014 Plan became effective. However, any outstanding options granted under the 2009 Plan remain outstanding, subject to the terms of our 2009 Plan, and the applicable stock option agreements, until such outstanding options are exercised or until they terminate or expire by their terms. Our board of directors or a duly authorized committee of our board of directors administers our 2009 Plan. Each option issued and outstanding under the 2009 Plan is evidenced by an option award agreement and was granted with an exercise price at least equal to 100% of the fair market value of our common stock on the date the option was granted (or at least 110% of the fair market value if the option is an incentive stock option granted to a participant who owned more than 10% of the total combined voting power of all classes of our outstanding stock, or a ten percent stockholder). As of March 1, 2015, stock awards exercisable for
60,366
shares of our common stock were outstanding.
1999 Stock Option Plan
Our board of directors adopted the Stock Option Plan, or the 1999 Plan, on November 4, 1999. The 1999 Plan was last amended by our board of directors on June 18, 2014 and approved by our stockholders on September 11, 2014, the purpose of which was to effectuate certain amendments to options previously granted to our employees, officers, directors and consultants under our 1999 Plan (a) to reduce the exercise price per share of each outstanding option to $9.64 per share, (b) to extend the term of each outstanding option until June 17, 2024, and (c) to provide that the holders of such options may exercise the vested portion of such options for the remaining term of the options in the event the holder terminates services with us (other than for cause). Our 1999 Plan provides for the grant of incentive stock options to our employees, and for the grant of nonstatutory stock options to our employees, directors and consultants. Our 1999 Plan expired by its terms in November 2009, and we have not granted any options under our 1999 Plan since such date. However, outstanding options granted under the 1999 Plan remain subject to the terms of our 1999 Plan until such options are exercised or until they terminate or expire by their terms. As of March 1, 2015, stock awards exercisable for
72,965
shares of our common stock were outstanding.
2014 Employee Stock Purchase Plan
Our board of directors adopted the 2014 Employee Stock Purchase Plan, or ESPP, on February 11, 2014, and our stockholders approved the ESPP on February 26, 2014. The purpose of the ESPP is to secure the services of new employees, to retain the services of existing employees and to provide incentives for such individuals to exert maximum efforts toward our success and that of our affiliates. The ESPP is intended to qualify as an “employee stock purchase plan” within the meaning of Section 423 of the Internal Revenue Code. The ESPP authorizes the issuance of 47,794 shares of our common stock pursuant to purchase rights granted to our employees or to employees of any of our designated affiliates. The number of shares of our common stock reserved for issuance will automatically increase on January 1 of each calendar year, through January 1, 2024, by the lesser of (1) 0.8% of the total number of shares of our common stock outstanding on December 31 of the preceding calendar year, and (2) 29,411 shares; provided, that prior to the date of any such increase, our board of directors may determine that such increase will be less than the amount set forth in clauses (1) and (2). On January 1, 2015 the available shares reserve under the ESPP was increased by an aggregate of 29,411 shares by operation of the preceding sentence. As of March 1, 2015,
10,048
shares of our common stock have been purchased under the ESPP.
117
2015 Inducement Plan
Our board of directors adopted the 2015 Inducement Plan, or the 2015 Plan, on March 26, 2015. The 2015 Plan provides for the grant of nonstatutory stock options, stock appreciation rights, restricted stock awards, restricted stock unit awards, and other forms of equity compensation (collectively, stock awards), all of which may be granted to persons not previously employees or directors of SCYNEXIS, or following a bona fide period of non-employment, as an inducement material to the individuals’ entering into employment with the Company within the meaning of NASDAQ Listing Rule 5635(c)(4). The 2015 Plan has a share reserve covering 450,000 shares of our common stock. If a stock award granted under the 2015 Plan expires or otherwise terminates without all of the shares covered by the stock award having been issued, or is settled in cash, or shares are withheld to satisfy tax withholding obligations, then the shares of our common stock not acquired or withheld pursuant to the stock award again will become available for subsequent issuance under the 2015 Plan.
401(k) Plan
We maintain a tax-qualified retirement plan that provides eligible U.S. employees with an opportunity to save for retirement on a tax advantaged basis. Eligible employees are able to defer eligible compensation subject to applicable annual Internal Revenue Code limits. We have the ability to make discretionary contributions to the 401(k) plan and currently provide a $0.50 match for every dollar our employees elect to defer up to 6% of their eligible compensation. Employees’ pre-tax contributions are allocated to each participant’s individual account and are then invested in selected investment alternatives according to the participants’ directions. Employees are immediately and fully vested in their contributions, and matching contributions made by us vest in four equal annual installments over a period of four years. The 401(k) plan is intended to be qualified under Section 401(a) of the Internal Revenue Code with the 401(k) plan’s related trust intended to be tax exempt under Section 501(a) of the Internal Revenue Code. As a tax-qualified retirement plan, contributions to the 401(k) plan and earnings on those contributions are not taxable to the employees until distributed from the 401(k) plan.
Director Compensation
The following table sets forth information regarding compensation earned by our non-employee directors during the fiscal year ended December 31, 2014.
|
Name
|
Fees Earned or Paid in Cash
|
Option Award(s) (1)
|
Total
|
|||||||||||
|
Pamela J. Kirby, Ph.D.
|
$
|
—
|
|
$
|
92,573
|
|
(4)
|
$
|
92,573
|
|
||||
|
Laurent Arthaud
|
27,666
|
|
27,544
|
|
(5)
|
55,210
|
|
|||||||
|
Mounia Chaoui, Ph.D. (2)
|
20,000
|
|
17,121
|
|
(6)
|
37,121
|
|
|||||||
|
Steven C. Gilman, Ph.D. (3)
|
—
|
|
—
|
|
—
|
|
||||||||
|
Ann F. Hanham, Ph.D.
|
—
|
|
39,921
|
|
(7)
|
39,921
|
|
|||||||
|
Patrick J. Langlois, Ph.D.
|
30,000
|
|
41,536
|
|
(8)
|
71,536
|
|
|||||||
|
Guy Macdonald
|
11,250
|
|
46,255
|
|
(9)
|
57,505
|
|
|||||||
|
Jean-Yves Nothias, Ph.D.
|
—
|
|
35,471
|
|
(10)
|
35,471
|
|
|||||||
|
Edward E. Penhoet, Ph.D.
|
27,000
|
|
17,121
|
|
(11)
|
44,121
|
|
|||||||
|
Marco Taglietti, Ph.D.
|
—
|
|
55,068
|
|
(12)
|
55,068
|
|
|||||||
|
(1)
|
The amounts in this column reflect the aggregate grant date fair value of each option award granted during the fiscal year, as computed in accordance with FASB ASC Topic 718. Additionally, for certain directors indicated in the following footnotes, the amounts in this column also reflect the aggregate incremental fair value of all option awards modified during the fiscal year, as computed in accordance with FASB ASC Topic 718. The valuation methodologies and assumptions used in determining such amounts are described in Note 11 to our financial statements included in this annual report. The table below lists the aggregate number of shares and additional information with respect to the outstanding option awards held by each of our non-employee directors as of December 31, 2014.
|
|
(2)
|
Dr. Chaoui resigned from the board of directors effective November 27, 2014.
|
|
(3)
|
Dr. Gilman was appointed to our board of directors effective February 25, 2015.
|
|
(4)
|
This amount represents the sum of (i) $50,701, the grant date fair value of all option awards granted during the fiscal year and (ii) $41,870, the aggregate incremental fair value of all option awards modified during the fiscal year. The
|
118
weighted average grant date fair value per share of option awards granted during the fiscal year was $4.63 and the weighted average incremental fair value per share of option awards modified during the fiscal year was $2.77. Includes the aggregate grant date fair value of $25,020 for options, exercisable for an aggregate of 5,724 shares of our common stock issued in lieu of cash payments made on June 11, 2014, July 1, 2014, and October 1, 2014 pursuant to our non-employee director compensation policy as more completely described below.
|
(5)
|
This amount represents the sum of (i) $17,121, the grant date fair value of an option award granted during the fiscal year and (ii) $10,423, the aggregate incremental fair value of all option awards modified during the fiscal year. The grant date fair value per share of the option award granted during the fiscal year was $4.92 and the weighted average incremental fair value per share of option awards modified during the fiscal year was $2.36.
|
|
(6)
|
This amount represents the grant date fair value of an option award granted during the fiscal year pursuant to our non-employee director compensation policy as more completely described below. The grant date fair value per share of the option award granted during the fiscal year was $4.92.
|
|
(7)
|
This amount represents the grant date fair value of all option awards granted during the fiscal year. The weighted average grant date fair value per share of option awards granted during the fiscal year was $4.59. Includes the aggregate grant date fair value of $22,800 for options, exercisable for an aggregate of 5,216 shares of our common stock issued in lieu of cash payments made on June 11, 2014, July 1, 2014, and October 1, 2014 pursuant to our non-employee director compensation policy as more completely described below.
|
|
(8)
|
This amount represents the sum of (i) $17,121, the grant date fair value of all option awards granted during the fiscal year pursuant to our non-employee director compensation policy as more completely described below and (ii) $24,415, the aggregate incremental fair value of all option awards modified during the fiscal year. The grant date fair value per share of the option award granted during the fiscal year was $4.92 and the weighted average incremental fair value per share of option awards modified during the fiscal year was $2.43.
|
|
(9)
|
This amount represents the grant date fair value of an option award granted during the fiscal year pursuant to our non-employee director compensation policy as more completely described below. The grant date fair value per share of the option award granted during the fiscal year was $5.91.
|
|
(10)
|
This amount represents the grant date fair value of all option awards granted during the fiscal year pursuant to our non-employee director compensation policy as more completely described below. The weighted average grant date fair value per share of option awards granted during the fiscal year was $4.62. Includes the aggregate grant date fair value of $18,350 for options, exercisable for an aggregate of 4,198 shares of our common stock issued in lieu of cash payments made on June 11, 2014, July 1, 2014, and October 1, 2014 pursuant to our non-employee director compensation policy as more completely described below.
|
|
(11)
|
This amount represents the grant date fair value of an option award granted during the fiscal year pursuant to our non-employee director compensation policy as more completely described below. The grant date fair value per share of the option award granted during the fiscal year was $4.92.
|
|
(12)
|
This amount represents the grant date fair value of all option awards granted during the fiscal year. The weighted average grant date fair value per share of option awards granted during the fiscal year was $5.88. Includes the aggregate grant date fair value of $8,812 for options, exercisable for an aggregate of 1,530 shares of our common stock issued in lieu of cash payments made on December 2, 2014 pursuant to our non-employee director compensation policy as more completely described below.
|
The following table sets forth information regarding the number of shares of our common stock subject to outstanding options held by our non-employee directors as of December 31, 2014.
119
|
Name
|
Number of shares subject to outstanding options as of December 31, 2014
|
||
|
Pamela J. Kirby, Ph.D.
|
26,037
|
|
|
|
Laurent Arthaud
|
7,890
|
|
|
|
Mounia Chaoui, Ph.D. (1)
|
3,480
|
|
|
|
Steven C. Gilman, Ph.D. (2)
|
—
|
|
|
|
Ann F. Hanham, Ph.D.
|
8,696
|
|
|
|
Patrick J. Langlois, Ph.D.
|
13,525
|
|
|
|
Guy Macdonald
|
7,830
|
|
|
|
Jean-Yves Nothias, Ph.D.
|
7,678
|
|
|
|
Edward E. Penhoet, Ph.D.
|
3,480
|
|
|
|
Marco Taglietti, Ph.D.
|
9,360
|
|
|
|
(1)
|
Dr. Chaoui resigned from the board of directors effective November 27, 2014.
|
|
(2)
|
Dr. Gilman was appointed to our board of directors effective February 25, 2015.
|
Our non-employee directors are compensated in accordance with the following policy:
Each non-employee director receives an annual base cash retainer of $35,000 for such service, to be paid quarterly. In addition, the chairman of the Board receives an additional annual base cash retainer of $10,000, to be paid quarterly. If a new non-employee director joins the Board, the new director will receive an annual base cash retainer of $40,000 for such service, to be paid quarterly. In addition, if the new director is appointed as chairman of the Board, the new director receives an additional annual base cash retainer of $20,000, to be paid quarterly.
In addition, each member of a committee receives compensation for service on a committee as follows:
|
a.
|
The chairperson of the audit committee receives an annual cash retainer of $15,000 for this service, paid quarterly, and each of the other members of the audit committee receives an annual cash retainer of $7,000, paid quarterly.
|
|
b.
|
The chairperson of the compensation committee receives an annual cash retainer of $10,000 for this service, paid quarterly, and each of the other members of the compensation committee receive an annual cash retainer of $5,000, paid quarterly.
|
|
c.
|
The chairperson of the nominating and corporate governance committee receive an annual cash retainer of $7,000 for this service, paid quarterly, and each of the other members of the nominating and corporate governance committee receive an annual cash retainer of $3,500, paid quarterly.
|
Each year on the date of the SCYNEXIS annual meeting of stockholders, each non-employee director will automatically be granted an option to purchase 3,480 shares of common stock, and the chairman will be granted an additional option to purchase 1,740 shares of common stock. If a new board member joins the Board, the director will be granted an initial option to purchase 7,830 shares of common stock, and if a new chairman joins the Board, the chairman will be granted an additional initial option to purchase 3,480 shares of common stock. Annual option grants and initial option grants to new board members will have an exercise price per share equal to the fair market value of a share of common stock on the date of grant and will vest in full on the earlier of the next annual meeting of stockholders to occur in the year following the date of grant and the one year anniversary of the date of grant; provided, that the non-employee director is providing continuous services on the applicable vesting date.
In addition, each non-employee director may elect to receive nonstatutory stock options in lieu of all or a portion of the cash compensation to which the non-employee director would otherwise be entitled to, as described above. Each non-employee director shall make their election prior to the period in which the compensation is to be earned. For each non-employee director electing to receive a nonstatutory stock option in lieu of such cash compensation, the date on which the nonstatutory stock
120
options will be granted will be the date on which the cash compensation would otherwise have been paid, which is generally the first business day of each fiscal quarterly period, and the number of shares underlying such stock option will be determined by (i) dividing the cash compensation that the non-employee director elects to forgo in exchange for such nonstatutory stock options by 0.65, and (ii) dividing the result by the fair market value of a share of common stock on the date of grant. Each nonstatutory stock option granted in lieu of cash compensation pursuant to a non-employee director’s election will be 100% vested on the date of grant. After a non-employee director has elected to receive nonstatutory stock options in lieu of cash compensation, the option grants made to that non-employee director are awarded automatically pursuant to the previously described policy and no further action is required by the our Board.
|
ITEM 12.
|
SECURITY OWNERSHIP OF CERTAIN BENEFICIAL OWNERS AND MANAGEMENT AND RELATED STOCKHOLDER MATTERS
|
The following table sets forth information regarding the beneficial ownership of our common stock as of January 31, 2015, by the following:
|
•
|
each of our directors and named executive officers;
|
|
•
|
all of our directors and executive officers as a group; and
|
|
•
|
each person, or group of affiliated persons, who is known by us to beneficially own more than 5% of our common stock.
|
Unless otherwise indicated, the address of each beneficial owner listed in the table below is c/o SCYNEXIS, Inc., 3501 C Tricenter Boulevard, Durham, North Carolina 27713.
|
Name of Beneficial Owner
|
Number of Shares
Beneficially Owned
|
Percentage Total
|
|||
|
5% Stockholders:
|
|||||
|
Alta BioPharma Partners II, L.P. and
affiliate (1) |
1,286,311
|
|
15.11
|
%
|
|
|
Deerfield Management Company, L.P. (2)
|
500,000
|
|
5.87
|
%
|
|
|
Foresite Capital Fund II, L.P. (3)
|
662,945
|
|
7.79
|
%
|
|
|
GlaxoSmithKline plc (4)
|
545,009
|
|
6.40
|
%
|
|
|
RA Capital Management, LLC (5)
|
840,000
|
|
9.87
|
%
|
|
|
Sanofi (6)
|
1,677,057
|
|
19.70
|
%
|
|
|
Named Executive Officers and Directors:
|
|||||
|
Yves J. Ribeill, Ph.D. (7)
|
92,860
|
|
1.09
|
%
|
|
|
Charles F. Osborne, Jr.(8)
|
30,469
|
|
*
|
|
|
|
Carole Sable (9)
|
17,839
|
|
*
|
|
|
|
Pamela J. Kirby, Ph.D. (10)
|
48,045
|
|
*
|
|
|
|
Laurent Arthaud (11)
|
9,652
|
|
*
|
|
|
|
Steven C. Gilman, Ph.D. (12)
|
—
|
|
—
|
%
|
|
|
Ann F. Hanham, Ph.D. (13)
|
7,263
|
|
*
|
|
|
|
Patrick J. Langlois, Ph.D. (14)
|
21,417
|
|
*
|
|
|
|
Guy MacDonald (15)
|
1,738
|
|
*
|
|
|
|
Jean-Yves Nothias, Ph.D. (16)
|
300,549
|
|
3.53
|
%
|
|
|
Edward E. Penhoet, Ph.D.
|
—
|
|
—
|
%
|
|
|
Marco Taglietti (17)
|
3,190
|
|
*
|
|
|
|
All executive officers and directors as a group (12 persons)(18)
|
533,022
|
|
6.26
|
%
|
|
121
* Less than 1% of the outstanding shares of common stock
|
(1)
|
Based on a Schedule 13G filed with the SEC on May 14, 2014, reporting beneficial ownership as of May 7, 2014. Alta BioPharma Partners II, L.P. (“ABPII”) has sole voting and dispositive control over 1,240,575 shares, except that Alta BioPharma Management II, LLC (“ABMII”), the general partner of ABPII, and Farah Champsi (“Champsi”), the director of ABMII, may be deemed to share the right to direct the voting and dispositive control over such stock. Alta Embarcadero BioPharma Partners II, LLC (“AEBPII”) has sole voting and dispositive control over 45,736 shares of Common Stock, except that Champsi, the managing director of AEBPII, may be deemed to share the right to direct the voting and dispositive control over such stock. Champsi shares voting and dispositive control over the 1,240,575 shares of common stock beneficially owned by ABPII, and the 45,736 shares of Common Stock beneficially owned by AEBPII. The address for Alta Partners II, Inc. is One Embarcadero Center, 37th Floor, San Francisco, California 94111.
|
|
(2)
|
Based on a Schedule 13G filed with the SEC on February 17, 2015, reporting beneficial ownership as of December 31, 2014. Deerfield Mgmt, L.P. has shared voting investment power with respect to 500,000 shares, Deerfield Management Company, L.P. has shared voting investment power with respect to 500,000 shares, Deerfield Partners, L.P. has shared voting investment power with respect to 0 shares, Deerfield Special Situations Fund, L.P. has shared voting investment power with respect to 273,000 shares, Deerfield International Master Fund, L.P. has shared voting investment power with respect to 0 shares, Deerfield Special Situations International Master Fund, L.P. has shared voting investment power with respect to 227,000 shares, and James E. Flynn has shared voting and dispositive power with respect to 500,000 shares. The address for Deerfield Management Company is 780 Third Avenue, 37th Floor, New York, NY 10017.
|
|
(3)
|
Based on a Schedule 13G filed with the SEC on February 11, 2015, reporting beneficial ownership as of May 2, 2014. Foresite Capital Fund II, L.P. has sole voting investment power with respect to 662,945 shares, except that Foresite Capital Management II, LLC, the general partner of FCF II, may be deemed to have sole power to vote these shares, and James Tanabaum, the managing member of FCM II, may be deemed to have sole power to vote these shares. The address for Foresite Capital Management is 101 California Street, Suite 4100, San Francisco, 94111.
|
|
(4)
|
Based on a Schedule 13G filed with the SEC on May 15, 2014, reporting beneficial ownership as of May 7, 2014. Shares are held of record by S.R. One, Limited, an indirect, wholly-owned subsidiary. The address for GlaxoSmithKline plc is 980 Great West Road, Brentford, Middlesex, TW8 9GS England.
|
|
(5)
|
Based on a Schedule 13G filed with the SEC on February 17, 2015, reporting beneficial ownership as of December 31, 2014. RA Capital Management, LLC has shared voting investment power with respect to 840,000 shares, Peter Kolchinsky has shared voting investment power with respect to 840,000 shares, and RA Capital Healthcare Fund, L.P. has shared voting investment power with respect to 699,720 shares. Each of the Reporting Persons disclaims beneficial ownership of the shares reported herein except to the extent of its or his pecuniary interest therein. The address for RA Capital Management is 980 Great West Road, Brentford, Middlesex, TW8 9GS England.
|
|
(6)
|
Based on a Schedule 13G filed with the SEC on February 13, 2015, reporting beneficial ownership as of December 31, 2014. The address for Sanofi is 54 Rue La Boetie, 75008 Paris, France.
|
|
(7)
|
Includes 73,695 shares of common stock issuable upon exercise of options exercisable within 60 days of January 31, 2015.
|
|
(8)
|
Includes 21,103 shares of common stock issuable upon exercise of options exercisable within 60 days of January 31, 2015.
|
|
(9)
|
Includes 17,839 shares of common stock issuable upon exercise of options exercisable within 60 days of January 31, 2015. Dr. Sable’s employment with us terminated on February 20, 2015.
|
|
(10)
|
Includes 22,555 shares of common stock issuable upon exercise of options exercisable within 60 days of January 31, 2015.
|
|
(11)
|
Includes 4,410 shares of common stock issuable upon exercise of options exercisable within 60 days of January 31, 2015, and 4,507 shares held by Mr. Arthaud’s spouse.
|
|
(12)
|
Dr. Gillman was appointed to our board of directors on February 25, 2015.
|
|
(13)
|
Includes 7,263 shares of common stock issuable upon exercise of options exercisable within 60 days of January 31, 2015.
|
|
(14)
|
Consists of shares held by DFC Langlois and includes 10,914 shares of common stock issuable upon exercise of options exercisable within 60 days of January 31, 2015 held by Dr. Langlois. Dr. Langlois is a general partner of DFC Langlois
|
122
and holds sole voting and dispositive authority over the shares held by DFC Langlois. The address for DFC Langlois is 6 Avenue Frederic Le Play 75007 Paris, France.
|
(15)
|
Includes 1,738 shares of common stock issuable upon exercise of options exercisable within 60 days of January 31, 2015.
|
|
(16)
|
Consists of shares held by FCPR Biotechnology and includes 5,472 shares of common stock issuable upon exercise of options exercisable within 60 days of January 31, 2015 held by Dr. Nothias. Dr. Nothias disclaims beneficial ownership of the shares held by FCPR Biotechnology, except to the extent of his ability to direct the voting or disposition of such shares or his pecuniary interest therein.
|
|
(17)
|
Includes 3,190 shares of common stock issuable upon exercise of options exercisable within 60 days of January 31, 2015.
|
|
(18)
|
Consists of shares held by each executive officer and director, including the shares described in footnotes 7 through 17 above.
|
Securities Authorized for Issuance Under Equity Compensation Plans
The following table provides information with respect to all of our equity compensation plans in effect as of December 31, 2014.
|
Plan Category
|
|
Number of
Securities to
be Issued upon Exercise of Outstanding Options |
|
Weighted Average
Exercise Price of Outstanding Options |
|
Number of Securities
Remaining Available for Future Issuances under Equity Compensation Plans (excluding securities reflected in column (a)) |
||||
|
|
|
(a)
|
|
(b)
|
|
(c)
|
||||
|
Equity Compensation Plans approved by security holders
|
|
615,322
|
|
9.55
|
|
218,356
|
|
(1)(2)
|
||
|
Equity Compensation Plans not approved by security holders
|
|
—
|
|
—
|
|
—
|
|
|||
|
Total
|
|
615,322
|
|
9.55
|
|
218,356
|
|
|||
|
(1)
|
Pursuant to terms of the SCYNEXIS, Inc. 2014 Equity Incentive Plan, the share reserve will automatically increase on January 1st of each year, for a period of not more than ten years, commencing on January 1, 2015, and ending on (and including) January 1, 2024, in an amount equal to 4.0% of the total number of shares of capital stock outstanding on December 31st of the preceding calendar year. Notwithstanding the foregoing, the Board may act prior to January 1st of a given year to provide that there will be no January 1st increase in the Share Reserve for such year or that the increase in the share reserve for such year will be a lesser number of shares of common stock than would otherwise occur pursuant to the preceding sentence. On January 1, 2015, pursuant to the previously described terms, the share reserve was increased by 340,484 shares.
|
|
(2)
|
Pursuant to terms of the SCYNEXIS, Inc. 2014 Employee Stock Purchase Plan, the maximum number of common stock shares available under the plan will automatically increase on January 1 of each year for a period of up to ten years, commencing on the first January 1 following the IPO Date and ending on (and including) January 1, 2024, in an amount equal to the lesser of (i) 0.8% of the total number of shares of Capital Stock outstanding on December 31 of the preceding fiscal year, and (ii) 29,411 shares of Common Stock. Notwithstanding the foregoing, the Board may act prior to the first day of any fiscal year to provide that there will be no January 1 increase in the share reserve for such fiscal year or that the increase in the share reserve for such fiscal year will be a lesser number of shares of common stock than would otherwise occur pursuant to the preceding sentence. On January 1, 2015, pursuant to the previously described terms, the maximum number of common stock shares available under the plan was increased by 29,411 shares.
|
|
ITEM 13.
|
CERTAIN RELATIONSHIPS AND RELATED TRANSACTIONS, AND DIRECTOR INDEPENDENCE
|
Other than compensation arrangements for our directors and named executive officers as described elsewhere in this annual report, since January 1, 2012, the following are the transactions to which we were a party or will be a party, in which:
123
|
•
|
the amounts involved exceeded or will exceed $120,000; and
|
|
•
|
any of our directors, executive officers, holders of more than 5% of our capital stock, or any affiliate of our directors, executive officers and holders of more than 5% of our capital stock, had or will have a direct or indirect material interest.
|
Initial Public Offering
In May 2014, in connection with the consummation of our initial public offering, which we refer to as our IPO, we sold
217,163
shares of our common stock to 5 of our existing investors pursuant to the exercise of warrants previously issued in our 2011 Bridge Financing, 2013 Bridge Financings and 2013 Series D-2 Financing, more completely described below, for aggregate proceeds of $
43,433
.
|
Purchasers (1)
|
Warrant Shares
|
Aggregate Purchase Price
|
|||||
|
Alta BioPharma Partners II, LP(2)
|
91,558
|
|
$
|
18,312
|
|
||
|
Alta Embarcadero BioPharma Partners II, LLC(2)
|
3,382
|
|
676
|
|
|||
|
F.C.P.R. Genavent
|
14,005
|
|
2,801
|
|
|||
|
FCPR Biotechnology Fund(3)
|
36,503
|
|
7,301
|
|
|||
|
Ventech Capital II(4)
|
71,715
|
|
14,343
|
|
|||
|
(1)
|
See “Security Ownership Of Certain Beneficial Owners And Management And Related Stockholder Matters” for more information about these directors, executive officers, holders of more than 5% of our capital stock, and their affiliates.
|
|
(2)
|
Entities affiliated with Alta BioPharma Partners II, LP (“ABP II”) and Alta Embarcadero BioPharma Partners II, LLC (“AEBP II”) are holders of more than 5% of our capital stock. Dr. Penhoet, a member of our board of directors, is a director of Alta BioPharma Management II, LLC, the general partner of ABP II and manager of AEBP II.
|
|
(3)
|
FCPR Biotechnology Fund was a holder of more than 5% of our capital stock. Dr. Nothias, a member of our board of directors, is a member of the investment board of FCPR Biotechnology Fund.
|
|
(4)
|
Ventech Capital II was a holder of more than 5% of our capital stock. Dr. Chaoui, was a member of our board of directors and was a venture partner of Ventech Capital II.
|
Series D-2 Preferred Stock Financing
In December 2013, we sold 1,785,712 shares of our Series D-2 preferred stock and warrants exercisable for 87,532 shares of our common stock to five of our existing investors for aggregate proceeds of $2.5 million, which we refer to as our 2013 financing, as follows.
|
Purchasers(1)
|
Shares
Purchased
|
Warrant
Shares
|
Aggregate
Purchase Price
|
|||||||
|
Alta BioPharma Partners II, LP(2)
|
1,205,648
|
|
59,100
|
|
$
|
1,687,907
|
|
|||
|
Alta Embarcadero BioPharma Partners II, LLC(2)
|
44,352
|
|
2,174
|
|
62,093
|
|
||||
|
F.C.P.R. Genavent
|
71,428
|
|
3,501
|
|
99,999
|
|
||||
|
FCPR Biotechnology Fund(3)
|
107,142
|
|
5,251
|
|
149,999
|
|
||||
|
Ventech Capital II(4)
|
357,142
|
|
17,506
|
|
499,999
|
|
||||
|
(1)
|
See “Security Ownership Of Certain Beneficial Owners And Management And Related Stockholder Matters” for more information about these directors, executive officers, holders of more than 5% of our capital stock, and their affiliates.
|
|
(2)
|
Entities affiliated with Alta BioPharma Partners II, LP (“ABP II”) and Alta Embarcadero BioPharma Partners II, LLC (“AEBP II”) are holders of more than 5% of our capital stock. Dr. Penhoet, a member of our board of directors, is a director of Alta BioPharma Management II, LLC, the general partner of ABP II and manager of AEBP II.
|
124
|
(3)
|
FCPR Biotechnology Fund was a holder of more than 5% of our capital stock. Dr. Nothias, a member of our board of directors, is a member of the investment board of FCPR Biotechnology Fund.
|
|
(4)
|
Ventech Capital II was a holder of more than 5% of our capital stock. Dr. Chaoui, was a member of our board of directors and was a venture partner of Ventech Capital II.
|
In January 2014, in connection with our 2013 Series D-2 Financing, we sold 379,284 shares of our Series D-2 Preferred Stock, on a pre-reverse split basis, and warrants exercisable for 18,591 shares of our common stock to two members of our board of directors and our chief executive officer, as follows:
|
Purchasers (1)
|
Shares
Purchased
|
Warrant
Shares
|
Aggregate
Purchase Price
|
|||||||
|
Pamela Kirby, Ph.D.
|
260,000
|
|
12,745
|
|
$
|
364,000
|
|
|||
|
DFC Langlois(2)
|
107,142
|
|
5,251
|
|
$
|
149,999
|
|
|||
|
Yves J. Ribeill, Ph.D.
|
12,142
|
|
595
|
|
$
|
16,999
|
|
|||
|
(1)
|
See “Security Ownership Of Certain Beneficial Owners And Management And Related Stockholder Matters” for more information about these directors and executive officers.
|
|
(2)
|
Patrick J. Langlois, Ph.D. is a member of our board of directors and is the general partner of DFC Langlois.
|
In December 2013, we issued 6,054,255 shares of Series D-1 preferred stock and 3,956,985 shares of Series D-2 preferred stock, on a pre-reverse split basis, in connection with the conversion of all outstanding principal and interest on the convertible promissory notes previously issued in our 2011 Bridge Financing and 2013 Bridge Financing, each as described below. In addition, pursuant to the terms of our 2011 Bridge Financing and 2013 Bridge Financing, we issued warrants exercisable for 80,120 shares and 88,987 shares of our common stock, respectively, with an exercise price of $0.20 per share. The following table sets forth the aggregate number of shares our Series D-1 preferred stock, Series D-2 preferred stock and warrants exercisable for shares of our common stock issued to our directors, executive officers, holders of more than 5% of our capital stock, and their affiliates in connection with the conversion of all outstanding principal and interest on the convertible promissory notes issued in our 2011 Bridge Financing and our 2013 Bridge Financing, as follows:
|
Purchasers(1)
|
Series D-1
Shares
|
Series D-2
Shares
|
Warrant
Shares
|
||||||
|
Alta BioPharma Partners II, LP(2)
|
1,024,876
|
|
211,667
|
|
32,456
|
|
|||
|
Alta Embarcadero BioPharma Partners II, LLC(2)
|
37,702
|
|
9,563
|
|
1,207
|
|
|||
|
Burrill Biotechnology Capital Fund(3)
|
885,481
|
|
94,712
|
|
8,402
|
|
|||
|
F.C.P.R. Genavent
|
955,215
|
|
270,028
|
|
10,502
|
|
|||
|
FCPR Biotechnology Fund(4)
|
863,672
|
|
516,738
|
|
31,249
|
|
|||
|
Ventech Capital II(5)
|
809,584
|
|
2,653,665
|
|
54,208
|
|
|||
|
S.R. One, Limited
|
762,944
|
|
185,570
|
|
24,609
|
|
|||
|
(1)
|
See “Security Ownership Of Certain Beneficial Owners And Management And Related Stockholder Matters” for more information about these directors, executive officers, holders of more than 5% of our capital stock, and their affiliates.
|
|
(2)
|
Entities affiliated with Alta BioPharma Partners II, LP (“ABP II”) and Alta Embarcadero BioPharma Partners II, LLC (“AEBP II”) are holders of more than 5% of our capital stock. Dr. Penhoet, a member of our board of directors, is a director of Alta BioPharma Management II, LLC, the general partner of ABPII and manager of AEBP II.
|
|
(3)
|
Burrill Biotechnology Capital Fund, L.P. was a holder of more than 5% of our capital stock. Dr. Hanham, a member of our board of directors, is a former Managing Director and General Partner with Burrill & Company, an affiliate of Burrill Biotechnology Capital Fund, L.P.
|
|
(4)
|
FCPR Biotechnology Fund was a holder of more than 5% of our capital stock. Dr. Nothias, a member of our board of directors, is a member of the investment board of FCPR Biotechnology Fund.
|
|
(5)
|
Ventech Capital II was a holder of more than 5% of our capital stock. Dr. Chaoui, was a member of our board of directors and was a venture partner of Ventech Capital II.
|
125
Convertible Note and Warrant Issuances
In December 2011, January 2012 and May 2012, we collectively issued and sold (a) an aggregate principal amount of $11.4 million of convertible promissory notes and (b) warrants to purchase an aggregate of 26,000 shares of our common stock with an exercise price of $0.20 per share, to eleven investors, which we refer to as our 2011 Bridge Financing. In connection with our 2013 financing, these warrants were adjusted to be exercisable for an aggregate of 80,120 shares of our common stock with no additional proceeds to us. The following table sets forth the aggregate principal amount of such convertible promissory notes and warrants exercisable for shares of our common stock issued to our directors, executive officers, holders of more than 5% of our capital stock, and their affiliates:
|
Purchasers(1)
|
Principal
Amount of
Notes
|
Initial
Warrant
Shares
|
Warrant Shares
After
Adjustment
|
||||||
|
Alta BioPharma Partners II, LP(2)
|
$
|
1,300,000
|
|
2,954
|
|
9,102
|
|
||
|
Alta Embarcadero BioPharma Partners II, LLC(2)
|
50,000
|
|
112
|
|
348
|
|
|||
|
Burrill Biotechnology Capital Fund, L.P.(3)
|
1,200,000
|
|
2,726
|
|
8,402
|
|
|||
|
F.C.P.R. Genavent
|
1,500,000
|
|
3,408
|
|
10,502
|
|
|||
|
FCPR Biotechnology Fund(4)
|
1,500,000
|
|
3,408
|
|
10,502
|
|
|||
|
Ventech Capital II(5)
|
4,000,000
|
|
9,092
|
|
28,010
|
|
|||
|
S.R. One, Limited
|
1,000,000
|
|
2,272
|
|
7,002
|
|
|||
|
(1)
|
See “Security Ownership Of Certain Beneficial Owners And Management And Related Stockholder Matters” for more information about these directors, executive officers, holders of more than 5% of our capital stock, and their affiliates.
|
|
(2)
|
Entities affiliated with Alta BioPharma Partners II, LP (“ABP II”) and Alta Embarcadero BioPharma Partners II, LLC (“AEBP II”) are holders of more than 5% of our capital stock. Dr. Penhoet, a member of our board of directors, is a managing director of Alta BioPharma Management II, LLC, the general partner of ABPII and manager of AEBP II.
|
|
(3)
|
Burrill Biotechnology Capital Fund, L.P. was a holder of more than 5% of our capital stock. Dr. Hanham, a member of our board of directors, is a former Managing Director and General Partner with Burrill & Company, an affiliate of Burrill Biotechnology Capital Fund, L.P.
|
|
(4)
|
FCPR Biotechnology Fund was a holder of more than 5% of our capital stock. Dr. Nothias, a member of our board of directors, is a member of the investment board of FCPR Biotechnology Fund.
|
|
(5)
|
Ventech Capital II was a holder of more than 5% of our capital stock. Dr. Chaoui, was a member of our board of directors and was a venture partner of Ventech Capital II.
|
In June 2013, we issued and sold an aggregate principal amount of $0.9 million of convertible promissory notes to six investors, which we refer to as our 2013 Bridge Financing. The following table sets forth the aggregate principal amount of such convertible promissory notes and warrants issued on December 11, 2013, pursuant to the 2013 Bridge Financing and exercisable for shares of our common stock issued to our directors, executive officers, holders of more than 5% of our capital stock, and their affiliates:
|
Purchaser(1)
|
Principal Amount
of Notes
|
Warrant
Shares
|
||||
|
Alta BioPharma Partners II, LP(2)
|
$
|
235,949
|
|
23,354
|
|
|
|
Alta Embarcadero BioPharma Partners II, LLC(2)
|
8,680
|
|
859
|
|
||
|
FCPR Biotechnology Fund(3)
|
209,609
|
|
20,747
|
|
||
|
Ventech Capital II(4)
|
264,676
|
|
26,198
|
|
||
|
S.R. One, Limited
|
177,889
|
|
17,607
|
|
||
126
|
(1)
|
See “Security Ownership Of Certain Beneficial Owners And Management And Related Stockholder Matters” for more information about these directors, executive officers, holders of more than 5% of our capital stock, and their affiliates.
|
|
(2)
|
Entities affiliated with Alta BioPharma Partners II, LP (“ABP II”) and Alta Embarcadero BioPharma Partners II, LLC (“AEBP II”) are holders of more than 5% of our capital stock. Dr. Penhoet, a member of our board of directors, is a director of Alta BioPharma Management II, LLC, the general partner of ABP II and manager of AEBP II.
|
|
(3)
|
FCPR Biotechnology Fund is a holder of more than 5% of our capital stock. Dr. Nothias, a member of our board of directors, is a member of the investment board of FCPR Biotechnology Fund.
|
|
(4)
|
Ventech Capital II was a holder of more than 5% of our capital stock. Dr. Chaoui, was a member of our board of directors and was a venture partner of Ventech Capital II.
|
Investor Rights Agreement
We are party to an investor rights agreement that provides holders of our prior convertible preferred stock and shares of our common stock into which those shares have been converted at the closing of our IPO, including certain holders of 5% of our capital stock and entities affiliated with certain of our directors, with certain registration rights, including the right to demand that we file a registration statement or request that their shares be covered by a registration statement that we are otherwise filing.
Indemnification Agreements
Our amended and restated certificate of incorporation contains provisions limiting the liability of directors, and our amended and restated bylaws provide that we will indemnify each of our directors and executive officers to the fullest extent permitted under Delaware law. Our amended and restated certificate of incorporation and amended and restated bylaws also provide our board of directors with discretion to indemnify our other officers and employees when determined appropriate by our board of directors. In addition, we have entered and expect to continue to enter into agreements to indemnify our directors and executive officers.
Loan Guarantee and Related Matters with Sanofi and Merial
Sanofi is the parent corporation of Merial, and a holder of more than 5% of our capital stock. In connection with our 2010 Credit Agreement with HSBC Bank USA, National Association, in April 2010, we entered into a Stand Alone First Demand Guarantee, which we refer to as the Sanofi Guarantee, and a Reimbursement and General Security Agreement, which we refer to as the Sanofi Reimbursement Agreement, with Sanofi, both of which were amended in March 2013, which we refer to as our 2013 Credit Facility. The Sanofi Guarantee provides that Sanofi has agreed to guarantee our loan obligations under the 2010 Credit Agreement, and the Sanofi Reimbursement Agreement provides that we will reimburse Sanofi for any payment it makes to the lender under the Sanofi Guarantee. In connection with the Sanofi Reimbursement Agreement, we also entered into a side letter in April 2010, which provides that we will either (1) subject to the prior written request of Sanofi, apply the net proceeds of certain capital-raising activities to repay all amounts owed under our 2010 Credit Agreement to fully release Sanofi from its obligations under the Sanofi Guarantee, or (2) provide Sanofi with a waiver from HSBC Bank USA, National Association fully releasing Sanofi from its obligations under the Sanofi Guarantee. The amendments to the Sanofi Guarantee and Sanofi Reimbursement Agreement entered into in March 2013 provide that the terms of these agreements extend until January 30, 2015.
On March 17, 2014, we entered into an amendment to that certain Sanofi Reimbursement Agreement, dated April 9, 2010, with Sanofi pursuant to which we have agreed to the following: (1) to use $7.5 million of the proceeds raised in connection with our IPO to repay a portion of our outstanding loan with HSBC Bank USA, National Association, no later than June 30, 2014, (2) to amend our loan agreement with HSBC Bank USA, National Association to reduce the aggregate amount we may borrow under our credit facility to $7.5 million, no later than June 30, 2014, and (3) to repay all amounts owned to HSBC Bank USA, National Association under our credit facility no later than December 31, 2014.
On April 29, 2014, we entered into another addendum to the Sanofi Reimbursement Agreement. Under this addendum and conditioned upon the closing of our IPO and Sanofi’s investment of $15.0 million in the IPO, the parties agreed to terminate our obligations made under the addendum dated March 17, 2014 and we agreed that to the extent Sanofi invests up to $15.0 million in our IPO the amount to be invested by Sanofi will be used to pay down the outstanding balance under our 2013 Credit Facility. We repaid the full amount owed under the 2013 Credit Facility with HSBC Bank USA, National Association in May, 2014.
127
In March 2013, we entered into a Board Observation Rights Agreement with Sanofi and Merial which provides Sanofi and Merial with the right to designate one observer to attend meetings of our board of directors. This agreement was terminated in March 2014.
Research Services Agreement with Merial
We entered into a Research Services Agreement with Merial effective in January 2012, under which we perform research services for Merial, including the synthesis, purification, and characterization of individual or libraries of compounds, phenotypic screening of compounds, and further testing and optimizing of compounds for the use of commercializing animal health products. In 2013 and 2014, we received
$7.3 million
and
$7.3 million
, respectively, from Merial under this agreement. This agreement expired on December 31, 2014. On December 31, 2014, we entered into a multi-year Research Services Agreement with Merial, effective December 24, 2014, under which we will continue to provide Merial with contract research and screening services in the field of animal health on a fee-for-service basis. See “Business-Collaborations and Licensing Agreements” for more information.
Engagement Letters with Burrill Securities
In March 2013, we entered into an engagement letter with Burrill Securities, an affiliate of Burrill Biotechnology Capital Fund, L.P., a prior holder of more than 5% of our capital stock, and an entity with which one of our directors, Dr. Hanham, was affiliated at the time. Pursuant to the letter, we engaged Burrill Securities to assist us with the identification of certain strategic alternatives. Under the letter, we would have owed Burrill Securities a success fee of $1.0 million upon the closing of specified strategic transactions during the term of the letter or within twelve months after the end of the term of the letter. The term of the letter expired on September 6, 2013.
In May 2013, we entered into an engagement letter with Burrill Securities. Pursuant to the letter, we engaged Burrill Securities to assist us with the identification of certain strategic alternatives. Under the letter, we would have owed Burrill Securities a success fee of 5% of the transaction value of any strategic transaction or financing transaction resulting from the engagement and closed during the term of the letter or within twelve months after the end of the term of the letter. The term of the letter expired on November 17, 2013. In December 2013, we entered into an amendment to the engagement letter that provided that notwithstanding anything to the contrary in the engagement letter, in the event we consummated a public offering of our common stock prior to November 17, 2014, we would pay Burrill Securities a success fee of $500,000 as payment in full for all our obligations under the engagement letter. In May 2014, we paid the
$500,000
success fee to Burrill Securities pursuant to the engagement letter, as amended.
Participation in Initial Public Offering
The following holders, who held more than 5% of our capital stock at the time of our IPO, purchased shares of our common stock in our IPO at the public offering price in varying amounts: Alta BioPharma Partners II, LP and its affiliate, which are affiliated with Edward E. Penhoet, Ph.D., a director of SCYNEXIS; S.R. One, Limited; FCPR Biotechnology Fund, which is affiliated with Jean-Yves Nothias, Ph.D., a director of SCYNEXIS; Ventech Capital and its affiliates, which were affiliated with Mounia Chaoui, Ph.D., a director of SCYNEXIS; and F.C.P.R. Genavent. The aggregate amount that these entities purchased in the IPO was approximately $9.4 million of shares of our common stock. In addition, Sanofi, the parent company of Merial, a holder of more than 5% of our capital stock, purchased $15.0 million of shares of our common stock in connection with our IPO.
Policies and Procedures for Related Person Transactions
In February 2014, our board of directors adopted a policy that our executive officers, directors, nominees for election as a director, beneficial owners of more than 5% of any class of our common stock and any members of the immediate family of any of the foregoing persons are not permitted to enter into a related person transaction with us without the prior consent of our audit committee. Any request for us to enter into a transaction with an executive officer, director, nominee for election as a director, beneficial owner of more than 5% of any class of our common stock or any member of the immediate family of any of the foregoing persons in which the amount involved exceeds $120,000 and such person would have a direct or indirect interest must first be presented to our audit committee for review, consideration and approval. In approving or rejecting any such proposal, our audit committee is to consider the material facts of the transaction, including, but not limited to, whether the transaction is on terms no less favorable than terms generally available to an unaffiliated third party under the same or similar circumstances and the extent of the related person’s interest in the transaction. While we did not have a formal review and approval policy for related party transactions until February 2014, all of the transactions described above were entered into after presentation, consideration and approval by, or were ratified by, our board of directors or a committee of our board of directors.
128
Director Independence
See Item 10 “Directors, Executive Officers and Corporate Governance” and “Board Committees” for more information about the independence of our directors as required by the SEC and the NASDAQ Stock Market.
|
ITEM 14.
|
PRINCIPAL ACCOUNTING FEES AND SERVICES
|
The information required by this item will be set forth in our 2015 Proxy Statement under the caption “Principal Accountant Fees and Services” and is incorporated herein by reference.
|
ITEM 15.
|
EXHIBITS, FINANCIAL STATEMENT SCHEDULES
|
Documents filed as part of this report:
|
1.
|
List of Financial Statements
|
The financial statements required by this item are listed in Item 8, “Financial Statements and Supplementary Data” herein.
|
2.
|
List of Financial Statement Schedules
|
All schedules are omitted because they are not applicable, not required or the required information is shown in the consolidated financial statements or notes thereto.
|
3.
|
List of Exhibits
|
See the Exhibit Index which follows the signature page of this Annual Report on Form 10-K, which is incorporated herein by reference.
129
SIGNATURES
Pursuant to the requirements of Section 13 or 15(d) of the Securities Exchange Act of 1934, the registrant has duly caused this report to be signed on its behalf by the undersigned, thereunto duly authorized.
|
SCYNEXIS, INC.
|
||
|
By:
|
|
/s/ Yves J. Ribeill
|
|
|
Yves J. Ribeill
|
|
|
|
Chief Executive Officer
(Principal Executive Officer)
|
|
|
Date:
|
|
March 30, 2015
|
Pursuant to the requirements of the Securities Exchange Act of 1934, as amended, this report has been signed below by the following persons on behalf of the registrant and in the capacities and on the dates indicated.
|
Signature
|
Title
|
Date
|
||
|
/s/ Yves J. Ribeill
|
Chief Executive Officer
|
March 30, 2015
|
||
|
Yves J. Ribeill
|
(Principal Executive Officer)
|
|||
|
/s/ Charles F. Osborne, Jr.
|
Chief Financial Officer
|
March 30, 2015
|
||
|
Charles F. Osborne, Jr.
|
(Principal Financial and Accounting Officer)
|
|||
|
/s/ Pamela J. Kirby, Ph.D.
|
Director
|
March 30, 2015
|
||
|
Pamela J. Kirby, Ph.D.
|
||||
|
/s/ Laurent Arthaud
|
Director
|
March 30, 2015
|
||
|
Laurent Arthaud
|
||||
|
/s/ Guy Macdonald
|
Director
|
March 30, 2015
|
||
|
Guy Macdonald
|
||||
|
/s/ Ann F. Hanham, Ph.D.
|
Director
|
March 30, 2015
|
||
|
Ann F. Hanham, Ph.D.
|
||||
|
/s/ Patrick J. Langlois, Ph.D.
|
Director
|
March 30, 2015
|
||
|
Patrick J. Langlois, Ph.D.
|
||||
|
/s/ Marco Taglietti
|
Director
|
March 30, 2015
|
||
|
Marco Taglietti
|
||||
|
/s/ Jean-Yves Nothias, Ph.D.
|
Director
|
March 30, 2015
|
||
|
Jean-Yves Nothias, Ph.D.
|
||||
|
/s/ Edward E. Penhoet, Ph.D.
|
Director
|
March 30, 2015
|
||
|
Edward E. Penhoet, Ph.D.
|
||||
|
/s/ Steven C. Gilman, Ph.D.
|
Director
|
March 30, 2015
|
||
|
Steven C. Gilman, Ph.D.
|
||||
INDEX TO EXHIBITS
|
Exhibit
Number
|
|
Description of Document
|
|
3.1
|
Amended and Restated Certificate of Incorporation. (Filed with the SEC as Exhibit 3.1 to our Current Report on Form 8-K, filed with the SEC on May 12, 2014, SEC File No. 001-36365).
|
|
|
3.3
|
Amended and Restated Bylaws, as amended and as currently in effect. (Filed with the SEC as Exhibit 3.4 to our Registration Statement on Form S-1, filed with the SEC on February 27, 2014, SEC File No. 333-194192).
|
|
|
4.1
|
Reference is made to Exhibits 3.1 and 3.2
|
|
|
4.2
|
Fifth Amended and Restated Investor Rights Agreement, dated December 11, 2013 (Filed with the SEC as Exhibit 10.21 to our Registration Statement on Form S-1, filed with the SEC on February 27, 2014, SEC File No. 333-194192).
|
|
|
10.1
|
Form of Indemnity Agreement between the Registrant and its directors and officers. (Filed with the SEC as Exhibit 10.1 to our Amendment No. 1 to Registration Statement on Form S-1, filed with the SEC on March 19, 2014, SEC File No. 333-194192).
|
|
|
10.2*
|
SCYNEXIS, Inc. Stock Option Plan, as amended, and Forms of Stock Option Grant Notice, Stock Option Agreement and Notice of Stock Option Exercise. (Filed with the SEC as Annex B to our Proxy Statement on Schedule 14A, filed with the SEC on August 1, 2014, SEC File No. 001-36365).
|
|
|
10.3*
|
SCYNEXIS, Inc. 2009 Stock Option Plan, as amended, and Forms of Stock Option Grant Notice, Stock Option Agreement and Notice of Stock Option Exercise. (Filed with the SEC as Exhibit 10.3 to our Amendment No. 1 to Registration Statement on Form S-1, filed with the SEC on March 19, 2014, SEC File No. 333-194192).
|
|
|
10.4*
|
SCYNEXIS, Inc. 2014 Equity Incentive Plan (Filed with the SEC as Annex A to our Proxy Statement on Schedule 14A, filed with the SEC on August 1, 2014, SEC File No. 001-36365).
|
|
|
10.5*
|
SCYNEXIS, Inc. 2014 Employee Stock Purchase Plan. (Filed with the SEC as Exhibit 99.4 to our Registration Statement on Form 8, filed with the SEC on May 16, 2014, SEC File No. 333-196007).
|
|
|
10.6*
|
Non-Employee Director Compensation Policy. (Filed with the SEC as Exhibit 10.1 to our Form 8-K, filed with the SEC on March 3, 3015, SEC File No. 001-36365).
|
|
|
10.7*
|
Amended and Restated Employment Agreement, dated December 7, 2012, between SCYNEXIS, Inc. and Charles F. Osborne, Jr. (Filed with the SEC as Exhibit 10.7 to our Registration Statement on Form S-1, filed with the SEC on February 27, 2014, SEC File No. 333-194192).
|
|
|
10.8*
|
Form of Stock Option Agreement and Form of Stock Option Grant Notice under the SCYNEXIS, Inc. 2014 Equity Incentive Plan (Filed with the SEC as Exhibit 99.3 to our Registration Statement on Form S-8, filed with the SEC on May 16, 2014, SEC File No. 333-196007).
|
|
|
10.9*
|
Amended and Restated Employment Agreement, dated December 7, 2012, between SCYNEXIS, Inc. and Yves J. Ribeill. (Filed with the SEC as Exhibit 10.9 to our Registration Statement on Form S-1, filed with the SEC on February 27, 2014, SEC File No. 333-194192).
|
|
|
10.10#
|
Development, License and Supply Agreement, dated August 1, 2013, between SCYNEXIS, Inc. and R-Pharm, CJSC. (Filed with the SEC as Exhibit 10.10 to our Amendment No. 1 to Registration Statement on Form S-1, filed with the SEC on March 19, 2014, SEC File No. 333-194192).
|
|
|
10.11#
|
License Agreement, dated August 7, 2012, as amended, between SCYNEXIS, Inc. and Dechra Ltd. (Filed with the SEC as Exhibit 10.11 to our Amendment No. 1 to Registration Statement on Form S-1, filed with the SEC on March 19, 2014, SEC File No. 333-194192).
|
|
|
10.12#
|
Termination and License Agreement, dated May 24, 2013, between SCYNEXIS. Inc. and Merck Sharp & Dohme Corp. (Filed with the SEC as Exhibit 10.12 to our Amendment No. 1 to Registration Statement on Form S-1, filed with the SEC on March 19, 2014, SEC File No. 333-194192).
|
|
|
10.13#
|
Agreement for the Assignment of Patents and Know How concerning Cyclosporin Derivatives, dated June 10, 2005, between SCYNEXIS, Inc. and C-CHEM AG. (Filed with the SEC as Exhibit 10.13 to our Amendment No. 1 to Registration Statement on Form S-1, filed with the SEC on March 19, 2014, SEC File No. 333-194192).
|
|
|
10.14#
|
Research Services Agreement, dated December 19, 2011 between SCYNEXIS, Inc. and Merial Limited. (Filed with the SEC as Exhibit 10.14 to our Amendment No. 1 to Registration Statement on Form S-1, filed with the SEC on March 19, 2014, SEC File No. 333-194192).
|
|
|
10.15#
|
Exclusive Worldwide License Agreement, dated May 10, 2005, between SCYNEXIS, Inc. and Aventis Pharma S.A. (Filed with the SEC as Exhibit 10.15 to our Amendment No. 1 to Registration Statement on Form S-1, filed with the SEC on March 19, 2014, SEC File No. 333-194192).
|
|
|
10.16
|
Amendment No. 1 to Exclusive Worldwide License Agreement, dated October 26, 2006, between SCYNEXIS, Inc. and Aventis Pharma S.A. (Filed with the SEC as Exhibit 10.16 to our Registration Statement on Form S-1, filed with the SEC on February 27, 2014, SEC File No. 333-194192).
|
|
|
10.17
|
Letter Agreement, dated April 9, 2010, as amended, between SCYNEXIS, Inc. and HSBC Bank USA, National Association. (Filed with the SEC as Exhibit 10.17 to our Registration Statement on Form S-1, filed with the SEC on February 27, 2014, SEC File No. 333-194192).
|
|
|
10.18
|
Stand Alone First Demand Guarantee, dated April 9, 2010, as amended, by the Guarantee Extension Agreement, dated March 5, 2013, by and between Sanofi-Aventis S.A. and HSBC Bank USA, National Association. (Filed with the SEC as Exhibit 10.18 to our Registration Statement on Form S-1, filed with the SEC on February 27, 2014, SEC File No. 333-194192).
|
|
|
10.19
|
Reimbursement & General Security Agreement, dated April 9, 2010, as amended, by the Guarantee Extension Agreement, dated March 5, 2013, between SCYNEXIS, Inc. and Sanofi-Aventis S.A. (Filed with the SEC as Exhibit 10.19 to our Registration Statement on Form S-1, filed with the SEC on February 27, 2014, SEC File No. 333-194192).
|
|
|
10.20
|
Guarantee Extension Agreement, dated March 5, 2013, between SCYNEXIS, Inc. and Sanofi-Aventis S.A. (Filed with the SEC as Exhibit 10.20 to our Amendment No. 1 to Registration Statement on Form S-1, filed with the SEC on March 19, 2014, SEC File No. 333-194192).
|
|
|
10.22
|
Industrial Building Lease, dated as of July 1, 2007, as amended, between SCYNEXIS, Inc. and Durham Research Tri-Center, LLC. (Filed with the SEC as Exhibit 10.22 to our Registration Statement on Form S-1, filed with the SEC on February 27, 2014, SEC File No. 333-194192).
|
|
|
10.23#
|
Amended and Restated License, Development and Commercialization Agreement, dated December 23, 2013, between SCYNEXIS, Inc. and Elanco Animal Health. (Filed with the SEC as Exhibit 10.23 to our Amendment No. 1 to Registration Statement on Form S-1, filed with the SEC on March 19, 2014, SEC File No. 333-194192).
|
|
|
10.24*
|
Employment Agreement, dated January 2014, between SCYNEXIS, Inc. and Carole A. Sable. (Filed with the SEC as Exhibit 10.24 to our Registration Statement on Form S-1, filed with the SEC on February 27, 2014, SEC File No. 333-194192).
|
|
|
10.25*
|
Offer Letter, dated September 29, 2013, from SCYNEXIS, Inc. to Vivian W. Doelling. (Filed with the SEC as Exhibit 10.25 to our Registration Statement on Form S-1, filed with the SEC on February 27, 2014, SEC File No. 333-194192).
|
|
|
10.26
|
Board Observation Rights Agreement, dated March 5, 2013, between SCYNEXIS, Inc. and Sanofi-Aventis S.A. (Filed with the SEC as Exhibit 10.26 to our Registration Statement on Form S-1, filed with the SEC on February 27, 2014, SEC File No. 333-194192).
|
|
|
10.27*
|
Employment Agreement, dated February 5, 2015, between SCYNEXIS, Inc. and Dr. Marco Taglietti.
|
|
|
10.28
|
Patent Assignment, dated January 28, 2014, between SCYNEXIS, Inc. and Merck Sharpe & Dohme Corp. (Filed with the SEC as Exhibit 3.4 to our Registration Statement on Form S-1, filed with the SEC on February 27, 2014, SEC File No. 333-194192).
|
|
|
10.29#
|
Research Services Agreement, dated December 24, 2014, between SCYNEXIS, Inc. and Merial Inc.
|
|
|
10.30
|
Series C-2 Preferred Stock Purchase Agreement, dated March 11, 2008 by and among SCYNEXIS, Inc., Merial Limited and S.R. One Limited. (Filed with the SEC as Exhibit 10.30 to our Amendment No. 1 to Registration Statement on Form S-1, filed with the SEC on March 19, 2014, SEC File No. 333-194192).
|
|
|
10.31
|
Addendums to Reimbursement Agreement, dated April 9, 2010, March 17, 2014 and April 29, 2014, between SCYNEXIS, Inc. and Sanofi. (Filed with the SEC as Exhibit 10.31 to our Amendment No. 3 to Registration Statement on Form S-1, filed with the SEC on April 30, 2014, SEC File No. 333-194192).
|
|
|
10.32#
|
Exclusive License Agreement, dated October 29, 2014, between SCYNEXIS, Inc. and Waterstone Pharmaceutical (HK Limited).
|
|
|
10.33#
|
Amendment to Termination and License Agreement, dated December 15, 2014, between SCYNEXIS, Inc. and Merck Sharp & Dohme Corp.
|
|
|
23.1
|
Consent of Independent Registered Public Accounting Firm.
|
|
|
31.1
|
Certification of Chief Executive Officer pursuant to Rule 13a-14(a)/15d-14(a)
|
|
|
31.2
|
Certification of Chief Financial Officer pursuant to Rule 13(a)-14(a)/15d-14(a)
|
|
|
32.1
|
Certification of Chief Executive Officer and Chief Financial Officer pursuant to 18 U.S.C. Section 1350 as Adopted pursuant to Section 906 of the Sarbanes-Oxley Act of 2002.
|
|
|
101.INS
|
|
XBRL Instance Document
|
|
101.SCH
|
|
XBRL Taxonomy Schema Linkbase Document
|
|
101.CAL
|
|
XBRL Taxonomy Calculation Linkbase Document
|
|
101.DEF
|
|
XBRL Taxonomy Definition Linkbase Document
|
|
101.LAB
|
|
XBRL Taxonomy Labels Linkbase Document
|
|
101.PRE
|
|
XBRL Taxonomy Presentation Linkbase Document
|
|
# Portions of this exhibit have been omitted pursuant to a request for confidential treatment, which portions were omitted and filed separately with the Securities and Exchange Commission.
|
||
|
*Designates management contract or compensatory plan or arrangement.
|
||
TABLE OF CONTENTS
Part IItem 1. BusinessItem 1A. Risk FactorsItem 1B. Unresolved Staff CommentsItem 2. PropertiesItem 3. Legal ProceedingsItem 4. Mine Safety DisclosuresPart IIItem 5. Market For Registrant's Common Equity, Related Stockholder Matters and Issuer Purchases Of Equity SecuritiesItem 6. Selected Financial DataItem 7. Management's Discussion and Analysis Of Financial Condition and Results Of OperationsItem 7A. Quantitative and Qualitative Disclosure About Market RiskItem 8. Financial Statements and Supplementary DataItem 9. Changes in and Disagreements with Accountants on Accounting and Financial DisclosureItem 9A. Controls and ProceduresItem 9B. Other InformationPart IIIItem 10. Directors, Executive Officers and Corporate GovernanceItem 11. Executive CompensationItem 12. Security Ownership Of Certain Beneficial Owners and Management and Related Stockholder MattersItem 13. Certain Relationships and Related Transactions, and Director IndependenceItem 14. Principal Accounting Fees and ServicesPart IVItem 15. Exhibits, Financial Statement Schedules