SANDRIDGE ENERGY INC
10-Ks and 10-Qs
|
|
|
|
|
|
|
|
|
|
|
|
|
|
|
|
|
|
|
|
|
|
|
|
|
|
|
|
|
|
|
|
|
|
|
|
|
|
|
|
|
|
|
|
|
|
|
|
|
|
|
|
|
|
|
|
UNITED STATES
SECURITIES AND EXCHANGE COMMISSION
Washington, D.C. 20549
|
Form 10-K
|
||||
(Mark One)
|
þ
|
ANNUAL REPORT PURSUANT TO SECTION 13 OR 15(d) OF THE SECURITIES EXCHANGE ACT OF 1934
|
For the fiscal year ended December 31,
2014
OR
|
¨
|
TRANSITION REPORT PURSUANT TO SECTION 13 OR 15(d) OF THE SECURITIES EXCHANGE ACT OF 1934
|
For the transition period from to
Commission File Number: 001-33784
|
SANDRIDGE ENERGY, INC.
|
||||
|
(Exact name of registrant as specified in its charter)
|
||||
|
Delaware
|
20-8084793
|
|||
|
(State or other jurisdiction of
incorporation or organization)
|
(I.R.S. Employer
Identification No.)
|
|||
|
123 Robert S. Kerr Avenue
Oklahoma City, Oklahoma
|
73102
|
|||
|
(Address of principal executive offices)
|
(Zip Code)
|
|||
|
(405) 429-5500
|
||||
|
(Registrant’s telephone number, including area code)
|
||||
|
Securities registered pursuant to Section 12(b) of the Act:
|
||||
|
Title of Each Class
|
Name of Each Exchange on Which Registered
|
|||
|
Common Stock, $0.001 par value
|
New York Stock Exchange
|
|||
|
Securities registered pursuant to Section 12(g) of the Act:
|
||||
|
None
|
||||
Indicate by check mark if the registrant is a well-known seasoned issuer, as defined in Rule 405 of the Securities Act. Yes
þ
No
¨
Indicate by check mark if the registrant is not required to file reports pursuant to Section 13 or Section 15(d) of the Act. Yes
¨
No
þ
Indicate by check mark whether the registrant (1) has filed all reports required to be filed by Section 13 or 15(d) of the Securities Exchange Act of 1934 during the preceding 12 months (or for such shorter period that the registrant was required to file such reports), and (2) has been subject to such filing requirements for the past 90 days. Yes
þ
No
¨
Indicate by check mark whether the registrant has submitted electronically and posted on its corporate website, if any, every Interactive Data File required to be submitted and posted pursuant to Rule 405 of Regulation S-T during the preceding 12 months (or for such shorter period that the registrant was required to submit and post such files). Yes
þ
No
¨
Indicate by check mark if disclosure of delinquent filers pursuant to Item 405 of Regulation S-K is not contained herein, and will not be contained, to the best of registrant’s knowledge, in definitive proxy or information statements incorporated by reference in Part III of this Form 10-K or any amendment to this Form 10-K.
þ
Indicate by check mark whether the registrant is a large accelerated filer, an accelerated filer, a non-accelerated filer, or a smaller reporting company. See the definitions of “large accelerated filer,” “accelerated filer” and “smaller reporting company” in Rule 12b-2 of the Exchange Act. (Check one):
|
Large accelerated filer
þ
|
Accelerated filer
o
|
|
Non-accelerated filer
o
(Do not check if smaller reporting company)
|
Smaller reporting company
o
|
Indicate by check mark whether the registrant is a shell company (as defined in Rule 12b-2 of the Exchange Act). Yes
¨
No
þ
The aggregate market value of our common stock held by non-affiliates on
June 30, 2014
was approximately
$3.4 billion
based on the closing price as quoted on the New York Stock Exchange. As of
February 20, 2015
, there were
483,839,301
shares of our common stock outstanding.
DOCUMENTS INCORPORATED BY REFERENCE
Portions of the Company’s definitive proxy statement for the
2015
Annual Meeting of Stockholders are incorporated by reference in Part III.
SANDRIDGE ENERGY, INC.
2014
ANNUAL REPORT ON FORM 10-K
TABLE OF CONTENTS
|
Item
|
|
Page
|
|
PART I
|
||
|
1.
|
||
|
1A.
|
||
|
1B.
|
||
|
2.
|
||
|
3.
|
||
|
4.
|
||
|
PART II
|
||
|
5.
|
||
|
6.
|
||
|
7.
|
||
|
7A.
|
||
|
8.
|
||
|
9.
|
||
|
9A.
|
||
|
9B.
|
||
|
PART III
|
||
|
10.
|
||
|
11.
|
||
|
12.
|
||
|
13.
|
||
|
14.
|
||
|
PART IV
|
||
|
15.
|
||
Certain Defined Terms
References in this report to the “Company” and “SandRidge” mean SandRidge Energy, Inc., including its consolidated subsidiaries and variable interest entities of which it is the primary beneficiary. In addition, this report includes terms commonly used in the oil and natural gas industry, which are defined in the “Glossary of Oil and Natural Gas Terms” beginning on page 26.
Information Regarding Forward-Looking Statements
Various statements contained in this report, including those that express a belief, expectation, or intention, as well as those that are not statements of historical fact, are forward-looking statements within the meaning of Section 27A of the Securities Act of 1933, as amended (the “Securities Act”), and Section 21E of the Securities Exchange Act of 1934, as amended (the “Exchange Act”). These statements generally are accompanied by words that convey projected future events or outcomes. These forward-looking statements may include projections and estimates concerning the Company’s capital expenditures, liquidity, capital resources and debt profile, pending dispositions, the timing and success of specific projects, outcomes and effects of litigation, claims and disputes, elements of the Company’s business strategy, compliance with governmental regulation of the oil and natural gas industry, including environmental regulations, acquisitions and divestitures and the effects thereof on the Company’s financial condition and other statements concerning the Company’s operations, financial performance and financial condition. Forward-looking statements are generally accompanied by words such as “estimate,” “assume,” “target,” “project,” “predict,” “believe,” “expect,” “anticipate,” “potential,” “could,” “may,” “foresee,” “plan,” “goal,” “should,” “intend” or other words that convey the uncertainty of future events or outcomes. The Company has based these forward-looking statements on its current expectations and assumptions about future events. These statements are based on certain assumptions and analyses made by the Company in light of its experience and perception of historical trends, current conditions and expected future developments as well as other factors the Company believes are appropriate under the circumstances. The actual results or developments anticipated may not be realized or, even if substantially realized, may not have the expected consequences to or effects on the Company’s business or results. Such statements are not guarantees of future performance and actual results or developments may differ materially from those projected in such forward-looking statements. These forward-looking statements speak only as of the date hereof. The Company disclaims any obligation to update or revise these forward-looking statements unless required by law, and it cautions readers not to rely on them unduly. While the Company’s management considers these expectations and assumptions to be reasonable, they are inherently subject to significant business, economic, competitive, regulatory and other risks, contingencies and uncertainties relating to, among other matters, the risks and uncertainties discussed in “Risk Factors” in Item 1A of this report, including the following:
|
•
|
risks associated with drilling oil and natural gas wells;
|
|
•
|
the volatility of oil, natural gas and NGL prices;
|
|
•
|
uncertainties in estimating oil, natural gas and NGL reserves;
|
|
•
|
the need to replace the oil, natural gas and NGLs the Company produces;
|
|
•
|
the Company’s ability to execute its growth strategy by drilling wells as planned;
|
|
•
|
the amount, nature and timing of capital expenditures, including future development costs, required to develop the Company’s undeveloped areas;
|
|
•
|
concentration of operations in the Mid-Continent region of the United States;
|
|
•
|
economic viability of certain natural gas production in west Texas due to high CO
2
content;
|
|
•
|
risks associated with obligations to deliver minimum volumes of natural gas and/or CO
2
under long-term contracts, including the risk that the Company will incur significant monetary penalties for under-delivery;
|
|
•
|
limitations of seismic data;
|
|
•
|
the potential adverse effect of commodity price declines on the carrying value of the Company’s oil and natural properties;
|
|
•
|
severe or unseasonable weather that may adversely affect production;
|
|
•
|
availability of satisfactory oil, natural gas and NGL marketing and transportation;
|
|
•
|
availability and terms of capital to fund capital expenditures;
|
|
•
|
amount and timing of proceeds of asset monetizations;
|
|
•
|
substantial existing indebtedness and limitations on operations resulting from debt restrictions and financial covenants;
|
|
•
|
potential financial losses or earnings reductions from commodity derivatives;
|
|
•
|
potential elimination or limitation of tax incentives;
|
|
•
|
competition in the oil and natural gas industry;
|
|
•
|
general economic conditions, either internationally or domestically or in the areas where the Company operates;
|
|
•
|
costs to comply with current and future governmental regulation of the oil and natural gas industry, including environmental, health and safety laws and regulations, and regulations with respect to hydraulic fracturing and the disposal of produced water; and
|
|
•
|
the need to maintain adequate internal control over financial reporting.
|
Item 1.
Business
GENERAL
SandRidge Energy, Inc. is an oil and natural gas company with a principal focus on exploration and production activities in the Mid-Continent region of the United States. The Company owns and operates additional interests in west Texas and also owned interests in the Gulf of Mexico and Gulf Coast until February 2014, as discussed under “2014 Divestiture” below.
As of
December 31, 2014
, the Company had
4,486
gross (
3,381.2
net) producing wells, a substantial portion of which it operates, and approximately
2,176,000
gross (
1,558,000
net) total acres under lease. As of
December 31, 2014
, the Company had
35
rigs drilling in the Mid-Continent. Total estimated proved reserves as of
December 31, 2014
were
515.9
MMBoe, of which approximately
65%
were proved developed.
The Company also operates businesses and infrastructure systems that are complementary to its primary exploration and production activities, including gas gathering and processing facilities, marketing operations, a saltwater gathering and disposal system, an electrical transmission system and a drilling and related oil field services business. As of
December 31, 2014
, the Company’s drilling rig fleet consisted of
25
operational rigs. These complementary businesses provide the Company with operational flexibility and an advantageous cost structure by reducing its dependence on third parties for the services provided by these businesses.
The Company’s principal executive offices are located at 123 Robert S. Kerr Avenue, Oklahoma City, Oklahoma 73102 and the Company’s telephone number is (405) 429-5500. SandRidge makes available free of charge on its website at
www.sandridgeenergy.com
its annual reports on Form 10-K, quarterly reports on Form 10-Q, current reports on Form 8-K and amendments to those reports as soon as reasonably practicable after the Company electronically files such material with, or furnishes it to, the Securities and Exchange Commission (“SEC”). Any materials that the Company has filed with the SEC may be read and copied at the SEC’s Public Reference Room at 100 F Street, N.E., Room 1580, Washington D.C. 20549 or accessed via the SEC’s website address at
www.sec.gov.
BUSINESS STRATEGY
SandRidge’s mission is to become a high-return, growth-oriented resource conversion company focused in the Mid-Continent region of the United States. In pursuit of its mission, the Company focuses on the following strategies:
|
•
|
Concentrate in Core Operating Area.
The Company’s primary area of operation is the Mid-Continent area of Oklahoma and Kansas. By concentrating in this core area, the Company is able to (i) further build and utilize its technical expertise in order to interpret geological and operational opportunities, (ii) achieve economies of scale and breadth of operations, both of which help to control costs, (iii) take advantage of investments in infrastructure including electrical delivery and saltwater gathering and disposal systems and (iv) opportunistically grow its holdings through acquisitions, farmouts and operations in this area to achieve production and reserve growth. Additionally, as operator of a majority of its wells, the Company has flexibility to utilize these competitive advantages to deliver strong, sustainable returns.
|
|
•
|
Preservation of Capital in Depressed Commodity Pricing Environment.
Volatility of pricing can significantly impact the amount of revenue received for oil and natural gas production and the level of economic returns the Company receives for amounts invested in its exploration and development activities. Over time, costs to drill, complete and operate wells typically adjust to prevailing commodity price levels, resulting in improved and more certain returns; however, during periods of depressed oil and natural gas pricing, such as was experienced during the second half of 2014 and is currently being experienced, the Company preserves capital and liquidity by contracting its capital expenditures budget and high-grading locations for development. During such times, the Company uses its decreased budgeted funds to capitalize on in place infrastructure, such as the Company’s saltwater gathering and disposal and electrical systems, by focusing drilling efforts on locations that can most effectively make use of this existing infrastructure. Additionally, exploration programs are conducted within a high-graded inventory of locations that have a greater certainty of economic returns. The Company’s 2015 capital expenditures budget is approximately $660 million, with approximately $610 million designated for exploration and production activities. This compares to 2014 total capital expenditures of approximately $1.6 billion and exploration and development capital expenditures of approximately $1.5 billion.
|
1
|
•
|
Focus on Cost Efficiency and Capital Allocation
. By leveraging its experienced workforce, scalable operational structure and infrastructure systems, the Company is able to achieve cost efficiencies and sustainable returns in the Mid-Continent area. With a focus on lower-risk, high rate of return and repeatable drilling opportunities with long economic lives, the Company has made improvements in its completion designs, well site production facilities, utilization of pad drilling and spud-to-spud cycle time to further reduce its cost structure in the Mid-Continent. Further, due to the low pressure and shallow characteristics of the reservoirs the Company develops, the Company is able to maintain a low-cost operating structure and manage service costs.
|
|
•
|
Mitigate Commodity Price Risk
. The Company enters into derivative contracts to mitigate a portion of the commodity price volatility inherent in the oil and natural gas industry. By increasing the predictability of cash inflows for a portion of its future production, as it has for 2015, the Company is better able to mitigate funding risks for its longer term development plans and lock-in rates of return on its capital projects.
|
|
•
|
Asset Monetization.
The Company periodically evaluates its properties to identify opportunities to monetize assets and may use proceeds realized from such transactions to fund the drilling and development of its core area, for general corporate purposes or to retire corporate debt.
|
|
•
|
Develop Key Infrastructure Systems.
By constructing a saltwater gathering and disposal system and electrical delivery system to service its Mid-Continent properties, the Company is able to produce oil and natural gas more efficiently and, therefore, more economically, giving it a competitive advantage over other operators in this rural area.
|
|
•
|
Focus on Reservoirs with Known Hydrocarbon Production
. The Company focuses its development efforts primarily in conventional, shallow, low-cost, permeable carbonate reservoirs with decades of production history. The nature of these reservoirs allows the Company to execute low-risk, repeatable drilling programs.
|
|
•
|
Maintain Flexibility.
The Company has multi-year inventories of both oil and natural gas drilling locations within its core operating area. Additionally, the Company maintains its own fleet of drilling rigs through its wholly owned drilling rig business. Maintaining inventories of both oil and natural gas drilling locations as well as its own drilling rigs allows the Company to efficiently direct capital toward projects with the most attractive returns.
|
|
•
|
Pursue Opportunistic Acquisitions
. The Company periodically reviews acquisition targets to complement its existing asset base. The Company selectively identifies such targets based on several factors including relative value, hydrocarbon mix and location and, when appropriate, seeks to acquire them at a discount to other opportunities.
|
2013 Divestiture
Sale of Permian Properties.
On February 26, 2013, the Company sold its oil and natural gas properties in the Permian Basin area of west Texas, excluding the assets associated with the SandRidge Permian Trust area of mutual interest (the “Permian Properties”) for net proceeds of
$2.6 billion
, including post-closing adjustments that were finalized in the third quarter of 2013. The Company used a portion of the sale proceeds to fund the redemption of approximately $1.1 billion aggregate principal amount of outstanding senior notes and used the remaining proceeds to fund capital expenditures in the Mid-Continent and for general corporate purposes. Including final post-closing adjustments, the Company recorded a non-cash loss on the sale of
$398.9 million
, of which
$71.7 million
was allocated to noncontrolling interests. Additionally, the Company settled a portion of its existing oil derivative contracts in February 2013 prior to their contractual maturities to reduce volumes hedged in proportion to the anticipated reduction in daily production volumes due to the sale, which resulted in a loss on settlement of approximately $
29.6 million
.
2014 Divestiture
Sale of Gulf of Mexico and Gulf Coast Properties.
On February 25, 2014, the Company sold certain of its subsidiaries that owned the Company’s Gulf of Mexico and Gulf Coast oil and natural gas properties (collectively, the “Gulf Properties”), for
$702.6 million
, net of working capital adjustments and post-closing adjustments, and the buyer’s assumption of approximately
$366.0 million
of related asset retirement obligations. The Company is using the proceeds from the sale to fund its drilling in the Mid-Continent. Additionally, the Company settled a portion of its existing oil derivative contracts in January and February 2014 prior to their respective maturities to reduce volumes hedged in proportion to the anticipated reduction in daily production volumes due to the sale, which resulted in the Company making cash payments of approximately $69.6 million. The Company retained a 2% overriding royalty interest in certain exploration prospects.
2
In accordance with the terms of the sale, the Company agreed to guarantee on behalf of the buyer certain plugging and abandonment obligations associated with the Gulf Properties for a period of up to one year from the date of closing. Additionally, the buyer agreed to indemnify the Company for any costs it may incur as a result of the guarantee. The Company did not incur any plugging or abandonment costs as a result of this guarantee, which expired February 25, 2015.
BUSINESS SEGMENTS AND PRIMARY OPERATIONS
The Company operates in three business segments: exploration and production, drilling and oil field services and midstream services. Financial information regarding each segment is provided in Item 7 “Management’s Discussion and Analysis of Financial Condition and Results of Operations” and “Note
22
—Business Segment Information” to the Company’s consolidated financial statements in Item 8 of this report. The information below includes the activities of SandRidge Mississippian Trust I (the “Mississippian Trust I”), SandRidge Permian Trust (the “Permian Trust”) and SandRidge Mississippian Trust II (the “Mississippian Trust II”) (collectively, the “Royalty Trusts”), including amounts attributable to noncontrolling interest, all of which are included in the exploration and production segment.
Exploration and Production
The Company explores for, develops and produces oil and natural gas, with a primary focus on increasing its reserves and production in the Mid-Continent. The Company operates substantially all of its wells in this area and also operates wells and owns leasehold positions in west Texas, and owned interests in the Gulf of Mexico and Gulf Coast until February 2014.
The following table presents information concerning the Company’s exploration and production activities by geographic area of operation as of
December 31, 2014
, unless otherwise noted.
|
Estimated Net
Proved
Reserves
(MMBoe)
|
PV-10
(In millions)(1)
|
Daily
Production
(MBoe/d)(2)
|
Reserves/
Production
(Years)(3)
|
Gross
Acreage
|
Net
Acreage
|
Capital Expenditures (In millions) (4)
|
||||||||||||||||
|
Area
|
||||||||||||||||||||||
|
Mid-Continent
|
454.4
|
|
$
|
5,071.0
|
|
79.3
|
|
15.7
|
|
2,077,875
|
|
1,486,504
|
|
$
|
1,292.4
|
|
||||||
|
West Texas
|
61.5
|
|
445.4
|
|
10.5
|
|
16.0
|
|
98,286
|
|
71,490
|
|
191.2
|
|
||||||||
|
Total
|
515.9
|
|
$
|
5,516.4
|
|
89.8
|
|
15.7
|
|
2,176,161
|
|
1,557,994
|
|
$
|
1,483.6
|
|
||||||
|
(1)
|
For a reconciliation of PV-10 to Standardized Measure, see “—Proved Reserves.” The Company’s total Standardized Measure was
$4.1 billion
at
December 31, 2014
.
|
|
(2)
|
Average daily net production for the month of December 2014.
|
|
(3)
|
Estimated net proved reserves as of
December 31, 2014
divided by production for the month of December 2014 annualized.
|
|
(4)
|
Capital expenditures for the year ended
December 31, 2014
on an accrual basis.
|
Properties
Mid-Continent
The Company held interests in approximately
2,078,000
gross (
1,487,000
net) leasehold acres primarily in Oklahoma and Kansas at
December 31, 2014
. Associated proved reserves at
December 31, 2014
totaled
454.4
MMBoe, 62% of which were proved developed reserves, based on estimates prepared by Cawley, Gillespie & Associates, Inc., (“CG&A”) and the Company’s internal engineers. The Company’s interests in the Mid-Continent as of
December 31, 2014
included
2,437
gross (
1,384.5
net) producing wells with an average working interest of 57%. The Company had
35
rigs operating in the Mid-Continent as of
December 31, 2014
, of which 31 were drilling horizontal wells and four were drilling saltwater disposal wells. The Company drilled a total of 439 horizontal wells, three vertical wells and 40 saltwater disposal wells in this area during 2014.
Mississippian Formation.
A key target for exploration and development within the Mid-Continent area is the Mississippian formation, which is an expansive carbonate hydrocarbon system located on the Anadarko Shelf in northern Oklahoma and southern Kansas. The top of this formation is encountered between approximately 4,000 and 7,000 feet and lies stratigraphically between various formations of Pennsylvanian age and Morrow formation and the Devonian-aged Woodford Shale formation. The Mississippian formation can reach 1,000 feet in gross thickness and have targeted porosity
3
zone(s) ranging between 20 and 150 feet in thickness. At
December 31, 2014
, the Company had approximately 1,988,000 gross (1,432,000 net) acres under lease in the Mississippian formation, of which approximately 48,000 gross (38,000 net) acres were included in the Mississippian Trust II area of mutual interest. The Company fulfilled its drilling obligation to the Mississippian Trust I in April 2013 after which the associated area of mutual interest terminated.
The Company has drilled approximately 1,545 wells in this formation as of
December 31, 2014
. From December 31, 2013 to December 31, 2014, the number of the Company’s producing horizontal wells in the Mississippian formation increased from 1,167 to 1,555. Of the wells the Company drilled in the Mississippian formation during 2014, four wells are subject to the royalty interests of the Mississippian Trust II.
Other Formations.
The Company drilled 35 wells in the Chester formation and eight wells in the Woodford formation in 2014 in order to determine commerciality and initiate development of these productive formations. Of the wells the Company drilled in the Chester formation during 2014, two wells are subject to the royalty interests of the Mississippian Trust II.
Historically drilled with vertical wells, the Chester formation in the Northern Mid-Continent is currently being targeted for horizontal development. The formation, which lies beneath various Pennsylvanian-aged formations and above the Mississippian formation, is composed of stacked low permeability sandstone and carbonate layers interbedded with shale. The top of the formation occurs at about 5,600 feet and ranges in thickness from less than 100 to over 1,000 feet. Individual target zones within the formation range from 15 to 50 feet in thickness.
Long regarded as the primary source rock for most Mid-Continent reservoirs, the Woodford formation is now itself being developed horizontally across much of Oklahoma. The Devonian-aged formation, which lies beneath the Mississippian formation and above various Lower Paleozoic formations and is stratigraphically equivalent to the Marcellus Shale in the Appalachian Basin and the Bakken Shale in the Williston Basin, is composed of alternating layers of organic-rich shale and less organic-rich siliceous or carbonate-rich shale. The top of the formation in the exploration and development area ranges from 6,200 to 10,000 feet, and the thickness of the formation ranges from less than 50 to over 100 feet.
Gathering and Disposal and Electrical Systems.
The Company’s saltwater gathering and disposal system, constructed beginning in 2007, and electrical infrastructure, constructed beginning in 2009, assist in the economically efficient production of oil and natural gas in the Mid-Continent. The saltwater gathering and disposal system, which included more than 190 active wells and approximately 1,050 miles of gathering lines at
December 31, 2014
, reduces the overall cost of water disposal, which directly reduces production costs. The system has a current injection capacity of over 2.8 million barrels of water per day. The Company’s electrical infrastructure, which consisted of approximately 1,000 miles of power lines and six substations at
December 31, 2014
, coordinates the delivery of electricity to the Company’s Mid-Continent operations at a lower cost than electricity provided by on-site generation. Additionally, by building its own infrastructure in these rural areas, the Company has been able to provide sufficient electricity to its operations. The Company is also able to obtain lower electrical rates based on aggregated volumes.
West Texas
The Company’s west Texas oil and natural gas properties include properties in the West Texas Overthrust (“WTO”) and the Permian Basin. The WTO is an area located in Pecos and Terrell Counties in west Texas and is associated with the Marathon-Ouachita fold and thrust belt that extends east-northeast across the United States into the Appalachian Mountain Region. The Permian Basin extends throughout southwestern Texas and southeastern New Mexico and is one of the largest, most active and longest-producing oil basins in the United States. In February 2013, the Company sold all of its oil and natural gas properties in the Permian Basin, other than those assets attributable to the Permian Trust’s area of mutual interest.
The Company held interests in approximately
98,000
gross (
71,000
net) leasehold acres in west Texas at
December 31, 2014
. Associated proved reserves at
December 31, 2014
were
61.5
MMBoe, 92% of which were proved developed reserves. The Company’s interests in west Texas as of
December 31, 2014
included
2,049
gross (
1,996.7
net) producing wells with an average working interest of 97%. The Company had no rigs operating in west Texas as of
December 31, 2014
. The Company drilled 187 wells in this area during 2014, of which 183 were drilled within the Permian Trust’s area of mutual interest and subject to the Permian Trust’s royalty interest. The Company fulfilled its drilling obligation to the Permian Trust in November 2014 after which the associated area of mutual interest terminated.
4
During 2014, low natural gas prices continued to limit development activity in the WTO, primarily a natural gas-producing region. Due to the sensitivity of drilling activity to market prices for natural gas, drilling activity in the WTO will likely remain very limited if natural gas prices remain low. Pursuant to a 30-year treating agreement with Occidental Petroleum Corporation (“Occidental”), the Company delivers natural gas produced in the WTO to Occidental’s CO
2
treatment plant in Pecos County, Texas (the “Century Plant”), and Occidental removes CO
2
from natural gas volumes delivered by the Company. The Company retains all methane gas after treatment. Under the agreement, the Company is required to deliver a total of approximately
3,200
Bcf of CO
2
during the agreement period. The Company is obligated to pay Occidental
$0.25
per Mcf to the extent minimum annual CO
2
volume requirements are not met and
$0.70
per Mcf to the extent the total contract delivery requirement is not met by the end of the contract term. See further discussion of the CO
2
treating agreement in “Liquidity and Capital Resources - Contractual Obligations and Off-Balance Sheet Arrangements” included in Item 7 of this report.
Proved Reserves
Preparation of
Reserve Estimates
The estimates of oil, natural gas and NGL reserves in this report are based on reserve reports, the substantial majority of which were prepared by independent petroleum engineers. To achieve reasonable certainty, the Company’s engineers relied on technologies that have been demonstrated to yield results with consistency and repeatability. The technologies and economic data used to estimate the Company’s proved reserves include, but are not limited to, well logs, geological maps, seismic data, well test data, production data, historical price and cost information and property ownership interests. This data was reviewed by various levels of management for accuracy, before consultation with independent petroleum engineers. Such consultation included review of properties, assumptions and any new data available. Internal reserves estimates and methodologies were compared to those prepared by independent petroleum engineers to test the reserves estimates and conclusions before the reserves estimates were included in this report. The accuracy of the reserve estimates is dependent on many factors, including the following:
|
•
|
the quality and quantity of available data and the engineering and geological interpretation of that data;
|
|
•
|
estimates regarding the amount and timing of future costs, which could vary considerably from actual costs;
|
|
•
|
the accuracy of economic assumptions such as the future price of oil and natural gas; and
|
|
•
|
the judgment of the personnel preparing the estimates.
|
SandRidge’s Senior Vice President—Corporate Reservoir Engineering is the technical professional primarily responsible for overseeing the preparation of the Company’s reserves estimates. He has a Bachelor of Science degree in Petroleum Engineering with over 30 years of practical industry experience, including over 29 years of estimating and evaluating reserve information. In addition, SandRidge’s Senior Vice President—Corporate Reservoir Engineering has been a certified professional engineer in the state of Oklahoma since 2007 and a member of the Society of Petroleum Engineers since 1980.
SandRidge’s Reservoir Engineering Department continually monitors asset performance, making reserves estimate adjustments, as necessary, to ensure the most current reservoir information is reflected in reserves estimates. Reserve information includes production histories as well as other geologic, economic, ownership and engineering data. The corporate Reservoir department currently has a total of 15 full-time employees, comprised of five degreed engineers and 10 engineering and business analysts with a minimum of a four-year degree in mathematics, finance or other business or science field.
The Company maintains a continuous education program for its engineers and analysts on new technologies and industry advancements and also offers refresher training on basic skill sets.
In order to ensure the reliability of reserves estimates, internal controls within the reserve estimation process include:
|
•
|
no employee’s compensation is tied to the amount of reserves recorded.
|
|
•
|
reserves estimates are prepared by experienced reservoir engineers or under their direct supervision.
|
|
•
|
the Senior Vice President—Corporate Reservoir Engineering reports directly to the Company’s Chief Executive Officer.
|
5
|
•
|
the Reservoir Engineering Department follows comprehensive SEC-compliant internal policies to determine and report proved reserves including:
|
|
•
|
confirming that reserves estimates include all properties owned and are based upon proper working and net revenue interests;
|
|
•
|
reviewing and using in the estimation process data provided by other departments within the Company such as Accounting; and
|
|
•
|
comparing and reconciling internally generated reserves estimates to those prepared by third parties.
|
Each quarter, the Senior Vice President—Corporate Reservoir Engineering presents the status of the Company’s reserves to a committee of executives, which subsequently approves all changes. In the event the quarterly updated reserves estimates are disclosed, the aforementioned review process is evidenced by signatures from the Senior Vice President—Corporate Reservoir Engineering and the Chief Financial Officer.
The Reservoir Engineering Department works closely with its independent petroleum consultants at each fiscal year end to ensure the integrity, accuracy and timeliness of annual independent reserves estimates. These independently developed reserves estimates are reviewed by the Audit Committee, as well as the Chief Financial Officer, Senior Vice President of Accounting, Director of Internal Audit, Vice President of Financial Reporting and General Counsel and are approved as the Company’s corporate reserves. In addition to reviewing the independently developed reserve reports, the Audit Committee annually meets with the principal engineers who are primarily responsible for the reserve reports. The Audit Committee also periodically meets with the other independent petroleum consultants that prepare estimates of proved reserves.
The table below shows the percentage of the Company’s total proved reserves for which each of the independent petroleum consultants prepared reports of estimated proved reserves of oil, natural gas and NGLs for the years shown.
|
|
December 31,
|
|||||||
|
|
2014
|
2013
|
2012
|
|||||
|
Cawley, Gillespie & Associates, Inc.
|
82.4
|
%
|
64.6
|
%
|
—
|
%
|
||
|
Netherland, Sewell & Associates, Inc.
|
3.7
|
%
|
21.5
|
%
|
72.7
|
%
|
||
|
Lee Keeling and Associates, Inc.
|
—
|
%
|
—
|
%
|
24.9
|
%
|
||
|
Total
|
86.1
|
%
|
86.1
|
%
|
97.6
|
%
|
||
The remaining
13.9%
,
13.9%
and
2.4%
of the Company’s estimated proved reserves as of
December 31, 2014
,
2013
and
2012
, respectively, were based on internally prepared estimates.
Copies of the reports issued by the Company’s independent petroleum consultants with respect to the Company’s oil, natural gas and NGL reserves for the substantial majority of all geographic locations as of
December 31, 2014
are filed with this report as Exhibits 99.1 and 99.2. The geographic location of the Company’s estimated proved reserves prepared by each of the independent petroleum consultants as of
December 31, 2014
is presented below.
|
Geographic Locations—by Area by State
|
|
|
Cawley, Gillespie & Associates, Inc.
|
Mid-Continent - KS, OK
|
|
Netherland, Sewell & Associates, Inc.
|
Permian Basin—TX
|
The qualifications of the technical personnel at each of these firms primarily responsible for overseeing the firm’s preparation of the Company’s reserves estimates included in this report are set forth below. These qualifications meet or exceed the Society of Petroleum Engineers’ standard requirements to be a professionally qualified Reserve Estimator and Auditor.
Cawley, Gillespie & Associates, Inc.
|
•
|
more than 27 years of practical experience in petroleum engineering and more than 25 years of experience estimating and evaluating reserve information;
|
|
•
|
a registered professional engineer in the state of Texas; and
|
|
•
|
a Bachelor of Science Degree in Petroleum Engineering.
|
6
Netherland, Sewell & Associates, Inc.
|
•
|
practicing consulting petroleum engineering since 2013 and over 14 years of prior industry experience;
|
|
•
|
licensed professional engineers in the state of Texas; and
|
|
•
|
Bachelor of Science Degree in Chemical Engineering
|
Lee Keeling and Associates, Inc.
|
•
|
more than 58 years of practical experience in petroleum engineering and more than 54 years estimating and evaluating reserve information;
|
|
•
|
a registered professional engineer in the state of Oklahoma; and
|
|
•
|
a Bachelor of Science Degree in Petroleum Engineering.
|
Technologies
Under SEC rules, proved reserves are those quantities of oil, natural gas and NGLs, which, by analysis of geoscience and engineering data, can be estimated with reasonable certainty to be economically producible, based on prices used to estimate reserves, from a given date forward from known reservoirs, and under existing economic conditions, operating methods, and government regulations prior to the time at which contracts providing the right to operate expire, unless evidence indicates that renewal is reasonably certain. The term “reasonable certainty” implies a high degree of confidence that the quantities of oil, natural gas and/or NGLs actually recovered will equal or exceed the estimate. Reasonable certainty can be established using techniques that have been proved effective by actual production from projects in the same reservoir or an analogous reservoir or by other evidence using reliable technology that establishes reasonable certainty. Reliable technology is a grouping of one or more technologies (including computational methods) that have been field tested and have been demonstrated to provide reasonably certain results with consistency and repeatability in the formation being evaluated or in an analogous formation.
The area of a reservoir considered proved includes (i) the area identified by drilling and limited by fluid contacts, if any, and (ii) adjacent undrilled portions of the reservoir that can, with reasonable certainty, be judged to be continuous with it and to contain economically producible oil, natural gas or NGLs on the basis of available geoscience and engineering data. In the absence of data on fluid contacts, proved quantities in a reservoir are limited by the lowest known hydrocarbons as seen in a well penetration unless geoscience, engineering or performance data and reliable technology establish a lower contact with reasonable certainty.
Where direct observation from well penetrations has defined a highest known oil elevation and the potential exists for an associated gas cap, proved oil reserves may be assigned in the structurally higher portions of the reservoir only if geoscience, engineering or performance data and reliable technology establish the higher contact with reasonable certainty.
Reserves that can be produced economically through application of improved recovery techniques (such as fluid injection) are included in the proved classification when (i) successful testing by a pilot project in an area of the reservoir with properties no more favorable than in the reservoir as a whole, the operation of an installed program in the reservoir, or an analogous reservoir, or other evidence using reliable technology establishes the reasonable certainty of the engineering analysis on which the project or program was based and (ii) the project has been approved for development by all necessary parties and entities, including governmental entities.
Existing economic conditions include prices and costs at which economic producibility from a reservoir is to be determined. In determining the amount of proved reserves, the price used must be the average price during the 12-month period prior to the ending date of the period covered by the reserve report, determined as an unweighted arithmetic average of the first-day-of-the-month price for each month within such period, unless prices are defined by contractual arrangements, excluding escalations based upon future conditions.
The estimates of proved developed reserves included in the reserve report were prepared using decline curve analysis to determine the reserves of individual producing wells. After estimating the reserves of each proved developed well, it was determined that a reasonable level of certainty exists with respect to the reserves that can be expected from close offset undeveloped wells in the field.
7
Reporting of Natural Gas Liquids
Natural gas liquids, or NGLs, are produced as a result of the processing of a portion of the Company’s natural gas production stream. At
December 31, 2014
, NGLs comprised approximately 18% of the Company’s total proved reserves on a barrel equivalent basis and represented volumes to be produced from properties where the Company has contracts in place for the extraction and separate sale of NGLs. NGLs are products sold by the gallon. In reporting proved reserves and production of NGLs, the Company has included production and reserves in barrels. The extraction of NGLs in the processing of natural gas reduces the volume of natural gas available for sale. All production information related to natural gas is reported net of the effect of any reduction in natural gas volumes resulting from the processing and extraction of NGLs.
8
Reserve Quantities, PV-10 and Standardized Measure
The following estimates of proved oil, natural gas and NGL reserves are based on reserve reports as of
December 31, 2014
,
2013
and
2012
, the substantial majority of which were prepared by independent petroleum engineers. The estimates include reserves attributable to the Royalty Trusts, including amounts associated with noncontrolling interest. The PV-10 values shown in the table below are not intended to represent the current market value of the Company’s estimated proved reserves as of the dates shown. The reserve reports were based on the Company’s drilling schedule and the average price during the 12-month periods ended
December 31, 2014
,
2013
and
2012
, using first-day-of-the-month prices for each month. Such prices are not reflective of actual prices at December 31, 2014 or current prices. See further discussion of prices in “Risk Factors” included in Item 1A of this report. At December 31, 2014, the Company estimated that approximately 100% of its current proved undeveloped reserves will be developed by the end of 2017. See “Critical Accounting Policies and Estimates” in Item 7 of this report for further discussion of uncertainties inherent to the reserves estimates.
|
|
December 31,
|
||||||||||
|
|
2014
|
2013
|
2012
|
||||||||
|
Estimated Proved Reserves(1)
|
|||||||||||
|
Developed
|
|||||||||||
|
Oil (MMBbls)
|
79.0
|
|
83.9
|
|
136.6
|
|
|||||
|
NGL (MMBbls)
|
56.8
|
|
35.8
|
|
33.8
|
|
|||||
|
Natural gas (Bcf)
|
1,203.4
|
|
951.6
|
|
896.7
|
|
|||||
|
Total proved developed (MMBoe)
|
336.4
|
|
278.3
|
|
319.9
|
|
|||||
|
Undeveloped
|
|||||||||||
|
Oil (MMBbls)
|
47.0
|
|
58.7
|
|
125.4
|
|
|||||
|
NGL (MMBbls)
|
35.0
|
|
23.3
|
|
34.2
|
|
|||||
|
Natural gas (Bcf)
|
584.8
|
|
438.8
|
|
518.3
|
|
|||||
|
Total proved undeveloped (MMBoe)
|
179.5
|
|
155.1
|
|
246.0
|
|
|||||
|
Total Proved
|
|||||||||||
|
Oil (MMBbls)
|
126.0
|
|
142.6
|
|
262.0
|
|
|||||
|
NGL (MMBbls)
|
91.8
|
|
59.1
|
|
68.0
|
|
|||||
|
Natural gas (Bcf)
|
1,788.2
|
|
1,390.4
|
|
1,415.0
|
|
|||||
|
Total proved (MMBoe)(2)
|
515.9
|
|
433.4
|
|
565.9
|
|
|||||
|
PV-10 (in millions)(3)
|
$
|
5,516.4
|
|
$
|
5,191.6
|
|
$
|
7,488.4
|
|
||
|
Standardized Measure of Discounted Net Cash Flows (in millions)(2)(4)
|
$
|
4,087.8
|
|
$
|
4,017.6
|
|
$
|
5,840.4
|
|
||
|
(1)
|
The Company’s estimated proved reserves and the future net revenues, PV-10 and Standardized Measure were determined using prices calculated as a 12-month unweighted average of the first-day-of-the-month index price for each month of each year. All prices are held constant throughout the lives of the properties. The index prices and the equivalent weighted average wellhead prices used in the Company’s reserve reports are shown in the table below.
|
|
|
Index prices (a)
|
Weighted average
wellhead prices (b)
|
|||||||||||||||||
|
|
Oil
(per Bbl) |
Natural gas
(per Mcf) |
Oil
(per Bbl)(c)
|
NGL (per Bbl)
|
Natural gas
(per Mcf)
|
||||||||||||||
|
December 31, 2014
|
$
|
91.48
|
|
$
|
4.35
|
|
$
|
91.65
|
|
$
|
32.79
|
|
$
|
3.61
|
|
||||
|
December 31, 2013
|
$
|
93.42
|
|
$
|
3.67
|
|
$
|
95.67
|
|
$
|
31.40
|
|
$
|
3.65
|
|
||||
|
December 31, 2012
|
$
|
91.21
|
|
$
|
2.76
|
|
$
|
91.65
|
|
$
|
32.64
|
|
$
|
2.29
|
|
||||
|
(a)
|
Index prices are based on average West Texas Intermediate posted prices for oil and average Henry Hub spot market prices for natural gas.
|
|
(b)
|
Average adjusted volume-weighted wellhead product prices reflect adjustments for transportation, quality, gravity, and regional price differentials.
|
|
(c)
|
At December 31, 2013 and 2012, the weighted average wellhead oil price is significantly higher than the index price as a result of favorable location differentials for production in the Gulf of Mexico.
|
9
|
(2)
|
Estimated total proved reserves and Standardized Measure include amounts attributable to noncontrolling interests, as shown in the following table:
|
|
|
Estimated Proved
Reserves
(MMBoe)
|
Standardized Measure
(In millions)
|
||||
|
December 31, 2014
|
27.6
|
|
$
|
643.3
|
|
|
|
December 31, 2013
|
29.9
|
|
$
|
781.6
|
|
|
|
December 31, 2012
|
38.2
|
|
$
|
952.7
|
|
|
See “Note
24
—Supplemental Information on Oil and Natural Gas Producing Activities” to the Company’s consolidated financial statements in Item 8 of this report for additional information regarding reserve and Standardized Measure amounts attributable to noncontrolling interests.
|
(3)
|
PV-10 is a non-GAAP financial measure and represents the present value of estimated future cash inflows from proved oil, natural gas and NGL reserves, less future development and production costs, discounted at 10% per annum to reflect timing of future cash flows and using 12-month average prices for the years ended
December 31, 2014
,
2013
and
2012
. PV-10 differs from Standardized Measure because it does not include the effects of income taxes on future net revenues. Neither PV-10 nor Standardized Measure represents an estimate of fair market value of the Company’s oil and natural gas properties. PV-10 is used by the industry and by the Company’s management as an arbitrary reserve asset value measure to compare against past reserve bases and the reserve bases of other business entities. It is useful because its calculation is not dependent on the taxpaying status of the entity. The following table provides a reconciliation of the Company’s Standardized Measure to PV-10:
|
|
|
December 31,
|
||||||||||
|
|
2014
|
2013
|
2012
|
||||||||
|
|
(In millions)
|
||||||||||
|
Standardized Measure of Discounted Net Cash Flows
|
$
|
4,087.8
|
|
$
|
4,017.6
|
|
$
|
5,840.4
|
|
||
|
Present value of future income tax discounted at 10%
|
1,428.6
|
|
1,174.0
|
|
1,648.0
|
|
|||||
|
PV-10
|
$
|
5,516.4
|
|
$
|
5,191.6
|
|
$
|
7,488.4
|
|
||
|
(4)
|
Standardized Measure represents the present value of estimated future cash inflows from proved oil, natural gas and NGL reserves, less future development and production costs, and income tax expenses, discounted at 10% per annum to reflect timing of future cash flows and using the same pricing assumptions used to calculate PV-10. Standardized Measure differs from PV-10 as Standardized Measure includes the effect of future income taxes.
|
Proved Reserves - Mid-Continent
. Proved reserves in the Mid-Continent, primarily the Mississippian formation, increased from 235.8 MMBoe at December 31, 2012 to 302.3 MMBoe at December 31, 2013 and to
454.4
MMBoe at December 31, 2014, comprising a significant portion of the additions to the Company’s proved reserves for the three-year period. The reserves attributable to producing wells and the continuity of the formation over the development area further support proved undeveloped classification of locations within close proximity to the producing wells. Data from both the Company and operators of offset wells with which it has exchanged technical data demonstrate a consistency in this formation and the fluids in place over an area much larger than the development area. In addition, direct measurement from other producing wells was also used to confirm consistency in reservoir properties such as porosity, thickness and stratigraphic conformity. These wells all encountered proven reserves in the Mississippian formation. The proved undeveloped locations within the development area are generally parallel offsets to the horizontal wells drilled and producing to date.
Proved Reserves - West Texas.
In 2014, proved reserves decreased by 9 MMBoe, primarily from revisions to proved undeveloped reserves in the Permian Basin, due largely to the removal of proved undeveloped drilling locations not expected to be drilled within a five year period. In 2013, the Company sold the Permian Properties as discussed in “2013 Divestiture” above. As a result, proved reserves in the Permian Basin decreased by 198.9 MMBoe from December 31, 2012 to December 31, 2013. The Permian Basin provides access to shallow, permeable carbonate reservoirs with decades of production history and predictable production profiles.
10
Proved Undeveloped Reserves.
The following table summarizes activity associated with proved undeveloped reserves during the periods presented:
|
Year Ended December 31,
|
||||||||||||
|
2014
|
2013
|
2012
|
||||||||||
|
Reserves converted from proved undeveloped to proved developed (MMBoe)
|
31.4
|
|
44.6
|
|
42.6
|
|
||||||
|
Drilling capital expended to convert proved undeveloped reserves to proved developed reserves (in millions)
|
$
|
343.6
|
|
$
|
437.6
|
|
$
|
718.2
|
|
|||
Excluding asset sales, the Company recognized a net addition to oil, natural gas and NGL reserves associated with proved undeveloped properties of 73 MMBoe for the year ended December 31, 2014. Reserves added from extensions and discoveries totaled 67 MMBoe, primarily from horizontal drilling in the Mississippian formation in the Mid-Continent, which includes 10 MMBoe of proved undeveloped reserves booked and converted during 2014. Net positive revisions of 6 MMBoe were recognized and were comprised of 16 MMBoe in increases from the Mid-Continent primarily from an improved overall Mississippian proved undeveloped type curve, partially offset by negative 10 MMBoe revisions primarily from the removal of Permian Basin proved undeveloped drilling locations not expected to be drilled within a five year period. Approximately 21 MMBoe of proved undeveloped reserves at December 31, 2013 were converted to proved developed reserves during 2014.
Excluding asset sales, the Company recognized a net addition to oil, natural gas and NGL reserves associated with proved undeveloped properties of 42 MMBoe for the year ended December 31, 2013. Reserves added from extensions and discoveries totaled 67 MMBoe, primarily from horizontal drilling in the Mississippian formation in the Mid-Continent, which includes 10 MMBoe of proved undeveloped reserves booked and converted during 2013. These additions were offset by downward reserve revisions of 25 MMBoe, primarily from the Mississippian formation, due to the removal of proved undeveloped drilling locations not expected to be drilled within a five year period. These revisions were a result of the Company’s ongoing efforts to optimize its drilling plan within the Mississippian formation and reevaluating anticipated drilling locations. Approximately 35 MMBoe of proved undeveloped reserves at December 31, 2012 were converted to proved developed reserves during 2013.
The Company recognized a net addition to oil, natural gas and NGL reserves associated with proved undeveloped properties, excluding asset sales and purchases of reserves, for the year ended December 31, 2012. Additional reserves attributable to extensions and discoveries, primarily in the Mid-Continent area and Permian Basin area in west Texas, were a result of successful drilling. These additions were partially offset by downward revisions of reserve quantities primarily from the Piñon Field in the WTO as a result of lower natural gas index prices, and, to a lesser extent, downward revisions of reserve quantities due to well performance in the Mid-Continent during 2012. The 12-month average natural gas index price of $4.12 per Mcf for 2011 decreased to $2.76 per Mcf for 2012.
For additional information regarding changes in the Company’s proved reserves during the three years ended
December 31, 2014
, 2013 and 2012 see “Note
24
—Supplemental Information on Oil and Natural Gas Producing Activities” to the Company’s consolidated financial statements in Item 8 of this report.
11
Significant Fields
Oil, natural gas and NGL production for fields containing more than 15% of the Company’s total proved reserves at each year end are presented in the table below. The Mississippi Lime Horizontal and Fuhrman-Mascho fields each contained more than 15% of the Company’s total proved reserves at December 31, 2014, 2013 or
2012
.
|
|
Oil
(MBbls)
|
NGL (MBbls)
|
Natural Gas
(MMcf)
|
Total
(MBoe)
|
|||||||
|
Year Ended December 31, 2014
|
|||||||||||
|
Mississippi Lime Horizontal
|
8,234
|
|
3,470
|
|
65,839
|
|
22,677
|
|
|||
|
Year Ended December 31, 2013
|
|||||||||||
|
Mississippi Lime Horizontal
|
6,901
|
|
1,311
|
|
52,618
|
|
16,982
|
|
|||
|
Year Ended December 31, 2012
|
|||||||||||
|
Mississippi Lime Horizontal
|
4,536
|
|
100
|
|
33,034
|
|
10,142
|
|
|||
|
Fuhrman-Mascho
|
4,104
|
|
561
|
|
1,768
|
|
4,960
|
|
|||
Mississippi Lime Horizontal Field.
The Mississippi Lime Horizontal Field is located on the Anadarko Shelf in northern Oklahoma and Kansas and produces from the Mississippian formation. The Company’s interests in the Mississippi Lime Horizontal Field as of
December 31, 2014
included 1,779 gross (1,067.8 net) producing wells and a 60% average working interest in the producing area.
Fuhrman-Mascho Field.
The Fuhrman-Mascho Field is located near the center of the Central Basin Platform in the Permian Basin and produces from the Grayburg-San Andres formation from average depths of approximately 4,500 to 5,000 feet. The Company sold properties located in the Fuhrman-Mascho field and elsewhere in the Permian Basin in February 2013 as discussed in “2013 Divestiture” above.
Production and Price History
The following tables set forth information regarding the Company’s net oil, natural gas and NGL production and certain price and cost information for each of the periods indicated.
|
|
Year Ended December 31,
|
||||||||||
|
|
2014
|
2013
|
2012
|
||||||||
|
Production Data
|
|||||||||||
|
Oil (MBbls)
|
10,876
|
|
14,279
|
|
15,868
|
|
|||||
|
NGL (MBbls)
|
3,794
|
|
2,291
|
|
2,094
|
|
|||||
|
Natural gas (MMcf)
|
85,697
|
|
103,233
|
|
93,549
|
|
|||||
|
Total volumes (MBoe)
|
28,953
|
|
33,776
|
|
33,553
|
|
|||||
|
Average daily total volumes (MBoe/d)
|
79.3
|
|
92.5
|
|
91.7
|
|
|||||
|
Average Prices(1)
|
|||||||||||
|
Oil (per Bbl)
|
$
|
89.86
|
|
$
|
97.58
|
|
$
|
91.79
|
|
||
|
NGL (per Bbl)
|
$
|
33.41
|
|
$
|
35.16
|
|
$
|
33.10
|
|
||
|
Natural gas (per Mcf)
|
$
|
3.70
|
|
$
|
3.36
|
|
$
|
2.49
|
|
||
|
Total (per Boe)
|
$
|
49.08
|
|
$
|
53.89
|
|
$
|
52.43
|
|
||
____________________
|
(1)
|
Prices represent actual average prices for the periods presented and do not include effects of derivative transactions.
|
12
|
|
Year Ended December 31,
|
||||||||||
|
|
2014
|
2013
|
2012
|
||||||||
|
Expenses per Boe
|
|||||||||||
|
Lease operating expenses
|
|||||||||||
|
Transportation
|
$
|
1.23
|
|
$
|
1.29
|
|
$
|
0.89
|
|
||
|
Processing, treating and gathering(1)
|
1.16
|
|
1.05
|
|
1.18
|
|
|||||
|
Other lease operating expenses(2)
|
9.27
|
|
12.60
|
|
11.56
|
|
|||||
|
Total lease operating expenses
|
$
|
11.66
|
|
$
|
14.94
|
|
$
|
13.63
|
|
||
|
Production taxes(3)
|
$
|
1.10
|
|
$
|
0.96
|
|
$
|
1.41
|
|
||
|
Ad valorem taxes
|
$
|
0.29
|
|
$
|
0.35
|
|
$
|
0.59
|
|
||
|
(1)
|
Includes costs attributable to gas treatment to remove CO
2
and other impurities from natural gas.
|
|
(2)
|
The years ended
December 31, 2014
,
2013
and 2012 include
$33.9 million
,
$32.7 million
and $8.5 million, respectively, for amounts related to the Company’s shortfall in meeting its annual CO
2
delivery obligations under a CO
2
treating agreement as described under “—Properties—West Texas” above.
|
|
(3)
|
Net of severance tax refunds.
|
Productive Wells
The following table sets forth the number of productive wells in which the Company owned a working interest at
December 31, 2014
. Productive wells consist of producing wells and wells capable of producing, including oil wells awaiting connection to production facilities and natural gas wells awaiting pipeline connections to commence deliveries. Gross wells are the total number of producing wells in which the Company has a working interest and net wells are the sum of the Company’s fractional working interests owned in gross wells.
|
|
Oil
|
Natural Gas
|
Total
|
||||||||||||||
|
|
Gross
|
Net
|
Gross
|
Net
|
Gross
|
Net
|
|||||||||||
|
Area
|
|||||||||||||||||
|
Mid-Continent
|
1,922
|
|
1,158.3
|
|
515
|
|
226.2
|
|
2,437
|
|
1,384.5
|
|
|||||
|
West Texas
|
1,268
|
|
1,246.4
|
|
781
|
|
750.3
|
|
2,049
|
|
1,996.7
|
|
|||||
|
Total
|
3,190
|
|
2,404.7
|
|
1,296
|
|
976.5
|
|
4,486
|
|
3,381.2
|
|
|||||
Developed and Undeveloped Acreage
The following table sets forth information regarding the Company’s developed and undeveloped acreage at
December 31, 2014
:
|
|
Developed Acreage
|
Undeveloped Acreage
|
|||||||||
|
|
Gross
|
Net
|
Gross
|
Net
|
|||||||
|
Area
|
|||||||||||
|
Mid-Continent
|
634,701
|
|
416,010
|
|
1,443,174
|
|
1,070,494
|
|
|||
|
West Texas
|
56,120
|
|
49,871
|
|
42,166
|
|
21,619
|
|
|||
|
Total
|
690,821
|
|
465,881
|
|
1,485,340
|
|
1,092,113
|
|
|||
13
Many of the leases comprising the undeveloped acreage set forth in the table above will expire at the end of their respective primary terms unless production from the leasehold acreage is established prior to such date, in which event the lease will remain in effect until production has ceased. The following table sets forth as of
December 31, 2014
, the expiration periods of the gross and net acres that are subject to leases in the undeveloped acreage summarized in the above table.
|
|
Acres Expiring
|
||||
|
|
Gross
|
Net
|
|||
|
Twelve Months Ending
|
|||||
|
December 31, 2015
|
390,675
|
|
280,021
|
|
|
|
December 31, 2016
|
576,271
|
|
423,579
|
|
|
|
December 31, 2017
|
341,661
|
|
264,902
|
|
|
|
December 31, 2018 and later
|
13,735
|
|
11,528
|
|
|
|
Other(1)
|
162,998
|
|
112,083
|
|
|
|
Total
|
1,485,340
|
|
1,092,113
|
|
|
|
(1)
|
Leases remaining in effect until development efforts or production on the developed portion of the particular lease has ceased.
|
Included in the acreage set to expire during the 12 months ending December 31, 2015, as presented in the table above, are approximately 382,025 gross (277,537 net) acres in the Mid-Continent area. The Company has options to extend the leases on a portion of this acreage set to expire in the Mid-Continent in 2015 and expects to exercise such options or hold by production a substantial portion of such acreage based on current drilling and operational plans.
Drilling Activity
The following table sets forth information with respect to wells the Company completed during the periods indicated. The information presented is not necessarily indicative of future performance, and should not be interpreted to present any correlation between the number of productive wells drilled and quantities or economic value of reserves found. Productive wells are those that produce commercial quantities of hydrocarbons, regardless of whether they produce a reasonable rate of return. Gross wells refer to the total number of wells in which the Company had a working interest and net wells are the sum of the Company’s fractional working interests owned in gross wells. As of
December 31, 2014
, the Company had 32 gross (21.6 net) operated wells drilling, completing or awaiting completion.
|
|
2014
|
2013
|
2012
|
||||||||||||||||||||||||||||||||
|
|
Gross
|
Percent
|
Net
|
Percent
|
Gross
|
Percent
|
Net
|
Percent
|
Gross
|
Percent
|
Net
|
Percent
|
|||||||||||||||||||||||
|
Completed Wells
|
|||||||||||||||||||||||||||||||||||
|
Development
|
|||||||||||||||||||||||||||||||||||
|
Productive
|
626
|
|
97.5
|
%
|
482.3
|
|
97.4
|
%
|
607
|
|
98.1
|
%
|
482.3
|
|
98.1
|
%
|
1,054
|
|
99.8
|
%
|
930.9
|
|
99.8
|
%
|
|||||||||||
|
Dry
|
16
|
|
2.5
|
%
|
13.0
|
|
2.6
|
%
|
12
|
|
1.9
|
%
|
9.5
|
|
1.9
|
%
|
2
|
|
0.2
|
%
|
1.7
|
|
0.2
|
%
|
|||||||||||
|
Total
|
642
|
|
100.0
|
%
|
|
495.3
|
|
100.0
|
%
|
619
|
|
100.0
|
%
|
491.8
|
|
100.0
|
%
|
1,056
|
|
100.0
|
%
|
932.6
|
|
100.0
|
%
|
||||||||||
|
Exploratory
|
|||||||||||||||||||||||||||||||||||
|
Productive
|
6
|
|
60.0
|
%
|
4.6
|
|
60.5
|
%
|
44
|
|
80.0
|
%
|
31.0
|
|
79.3
|
%
|
32
|
|
97.0
|
%
|
24.3
|
|
96.0
|
%
|
|||||||||||
|
Dry
|
4
|
|
40.0
|
%
|
3.0
|
|
39.5
|
%
|
11
|
|
20.0
|
%
|
8.1
|
|
20.7
|
%
|
1
|
|
3.0
|
%
|
1.0
|
|
4.0
|
%
|
|||||||||||
|
Total
|
10
|
|
|
100.0
|
%
|
|
7.6
|
|
100.0
|
%
|
55
|
|
100.0
|
%
|
39.1
|
|
100.0
|
%
|
33
|
|
100.0
|
%
|
25.3
|
|
100.0
|
%
|
|||||||||
|
Total
|
|||||||||||||||||||||||||||||||||||
|
Productive
|
632
|
|
96.9
|
%
|
486.9
|
|
96.8
|
%
|
651
|
|
96.6
|
%
|
513.3
|
|
96.7
|
%
|
1,086
|
|
99.7
|
%
|
955.2
|
|
99.7
|
%
|
|||||||||||
|
Dry
|
20
|
|
3.1
|
%
|
16.0
|
|
3.2
|
%
|
23
|
|
3.4
|
%
|
17.6
|
|
3.3
|
%
|
3
|
|
0.3
|
%
|
2.7
|
|
0.3
|
%
|
|||||||||||
|
Total
|
652
|
|
|
100.0
|
%
|
|
502.9
|
|
100.0
|
%
|
674
|
|
100.0
|
%
|
530.9
|
|
100.0
|
%
|
1,089
|
|
100.0
|
%
|
957.9
|
|
100.0
|
%
|
|||||||||
The following table sets forth information with respect to all rigs operating on the Company’s acreage as of
December 31, 2014
.
|
Owned
|
Third-Party
|
Total
|
||||||
|
Mid-Continent
|
10
|
|
25
|
|
35
|
|
||
14
Marketing and Customers
The Company sells oil, natural gas and NGLs to a variety of customers, including utilities, oil and natural gas companies and trading and energy marketing companies. The Company had two customers that individually accounted for more than 10% of its total revenue during 2014. See “Note
22
—Business Segment Information” to the Company’s consolidated financial statements in Item 8 of this report for additional information on its major customers. The number of readily available purchasers for the Company’s products and the demand for such commodity products makes it unlikely that the loss of a single customer in the areas in which the Company sells its products would materially affect its sales. The Company does not have any material commitments to deliver fixed and determinable quantities of oil and natural gas in the future under existing sales contracts or sales agreements.
Title to Properties
As is customary in the oil and natural gas industry, the Company initially conducts a preliminary review of the title to its properties for which it does not have proved reserves. Prior to the commencement of drilling operations on those properties, the Company conducts a thorough title examination and performs curative work with respect to significant defects. To the extent drilling title opinions or other investigations reflect title defects on those properties, the Company is typically responsible for curing any title defects at its expense. The Company generally will not commence drilling operations on a property until it has cured any material title defects on such property. In addition, prior to completing an acquisition of producing oil and natural gas leases, the Company performs title reviews on the most significant leases, and depending on the materiality of properties, the Company may obtain a drilling title opinion or review previously obtained title opinions. To date, the Company has obtained drilling title opinions on substantially all of its producing properties and believes that it has good and defensible title to its producing properties. The Company’s oil and natural gas properties are subject to customary royalty and other interests, liens for current taxes and other burdens, which the Company believes do not materially interfere with the use of, or affect its carrying value of, the properties.
Drilling and Oil Field Services
The Company historically has drilled for its own account in northwestern Oklahoma, Kansas and west Texas and for other oil and gas companies, primarily in west Texas, through its drilling and oil field services subsidiary. The Company believes that drilling with its own rigs allows it to control costs and maintain operating flexibility. The Company’s rig fleet is designed to drill in its specific areas of operation and has an average of over 800 horsepower and an average depth capacity of greater than 10,500 feet. As of
December 31, 2014
, the Company’s drilling rig fleet consisted of
25
operational rigs with
10
of these rigs working on Company-owned properties in the Mid-Continent. Additionally, the Company’s oil field services business provides pulling units, trucking, rental tools, location and road construction and roustabout services that, together with its drilling services, complement its exploration and production business.
Demand for the Company’s drilling and oilfield services in the Permian region declined significantly in the latter half of 2014 as a result of the Company’s fulfillment of its drilling obligation with the Permian Trust and the downward trend in oil prices that began during that period. At December 31, 2014, the Company determined the future use of its drilling and oilfield services assets in this region was limited and recorded an impairment of
$24.3 million
on these assets. In the first quarter of 2015, the Company decided to discontinue all remaining drilling and oil field services operations in the Permian region. During 2014 and 2013, the Company also recorded impairments of approximately $
3.1
million and $11.1 million, respectively, on certain drilling assets identified for sale in order to adjust their carrying values to fair value.
The Company obtains its drilling contracts through either competitive bidding or direct negotiations with customers. The Company’s drilling contracts generally provide for compensation on a daywork or footage basis. Contract terms offered by the Company generally depend on the complexity and risk of operations, the on-site drilling conditions, the type of equipment used, the anticipated duration of the work to be performed and prevailing market rates.
Customers
During 2014, the Company performed approximately
61%
of its drilling and oil field services in support of its exploration and production business. For the years ended
December 31, 2014
,
2013
and
2012
, the Company generated revenues of
$76.1 million
,
$66.6 million
and
$116.6 million
, respectively, for drilling and oil field services performed for third parties.
15
Capital Expenditures
The Company’s capital expenditures for 2014 related to its drilling and oil field services were
$18.4 million
. The Company has budgeted approximately $5.0 million in capital expenditures in 2015 for its drilling and oil field services segment.
Midstream Services
The Company’s midstream services segment primarily provides gathering, compression and treating services of natural gas in west Texas and coordinates the delivery of electricity to the Company’s exploration and production operations in the Mid-Continent area. The Company’s midstream operations and assets serve its exploration and production business as well as other oil and natural gas companies as described below.
Marketing
Through Integra Energy, L.L.C., a wholly owned subsidiary, the Company buys and sells natural gas from wells it operates and wells operated by third parties within its west Texas area of operations. The Company generally buys and sells natural gas on simultaneous contracts using a portfolio of baseload and spot sales agreements. Identical volumes are bought and sold on monthly and daily contracts using a combination of published pricing indices to eliminate price exposure.
The Company conducts thorough credit checks of all potential purchasers and minimizes its exposure by contracting with multiple parties each month. The Company does not engage in any hedging activities with respect to these contracts. The Company manages several interruptible natural gas transportation agreements in order to take advantage of price differentials or to secure available markets when necessary. The Company currently has 50,000 MMBtu per day of firm transportation service subscribed on the Mid-Continent Express Pipeline through July 2019. See “Note
15
—Commitments and Contingencies” to the Company’s consolidated financial statements in Item 8 of this report for additional information on the contractual fees associated with the firm transportation service.
Mid-Continent
The Company has constructed an electrical transmission system in the Mid-Continent area to coordinate the delivery of electricity to the Company’s operations in the area. See discussion of the electrical transmission system under “—Properties—Mid-Continent.”
West Texas Gas Treating Plants
The Company owns the Pike’s Peak gas treating plant and the Grey Ranch gas treating plant, both located in Pecos County, Texas. During 2013 and 2012, the Company recorded impairments of
$9.9 million
and
$79.3 million
, respectively, on these plants and the Company’s CO
2
compression facilities due to the anticipation that their future use would be limited. There was no impairment recorded for these assets during the year ended December 31, 2014. Throughout 2012, the Company diverted its high CO
2
natural gas production from its gas treating plants to the Century Plant while it was being tested and commissioned. Upon substantial completion of the Century Plant in late 2012, natural gas volumes delivered by the Company for processing at the Century Plant became subject to the terms of the 30-year treating agreement with Occidental, which contains minimum CO
2
delivery requirements. All natural gas produced in the WTO during 2014 and 2013 was processed at the Century Plant. See further discussion of the treating agreement under “—Properties—West Texas” above and in “Management’s Discussion and Analysis—Liquidity and Capital Resources—Contractual Obligations and Off-Balance Sheet Arrangements.” Due to the continued decline in natural gas production in the WTO resulting from the lack of drilling activity in the area, volumes currently produced in the WTO and delivered to the Century Plant for processing are not sufficient to use all of the available treating capacity at the Century Plant. Due to the sensitivity of drilling activity to market prices for natural gas, drilling activity in the WTO will likely remain very limited if natural gas prices remain low.
The Company is party to a gas gathering agreement and an operations and maintenance agreement with Piñon Gathering Company, LLC (“PGC”) related to the Company’s properties located in the Piñon Field in west Texas. Under the gas gathering agreement, the Company has dedicated the Piñon Field acreage for priority gathering services for a period of 20 years and will pay a fee for such services. See “Note
15
—Commitments and Contingencies” to the Company’s consolidated financial statements in Item 8 of this report for additional information on the contractual fees associated with this gas gathering agreement.
16
Customers
During 2014, the Company performed approximately
61%
of its midstream services in support of its exploration and production business. For the years ended
December 31, 2014
,
2013
and
2012
, the Company generated revenues of
$55.4 million
,
$56.1 million
and
$38.8 million
, respectively, from midstream services performed for third parties.
Capital Expenditures
The growth of the Company’s midstream assets is driven by its oil and natural gas exploration and production operations. Historically, pipeline and facility expansions are made when warranted by an increase in production or the development of additional acreage. During 2014, the Company spent
$44.6 million
in capital expenditures primarily to install electrical and compression infrastructure. The Company has budgeted approximately $30.0 million in 2015 capital expenditures for its midstream services segment.
COMPETITION
The Company believes that its leasehold acreage position, drilling and oil field services businesses, midstream assets, geographic concentration of operations, vertical integration and technical and operational capabilities enable it to compete effectively with other exploration and production operations. However, the oil and natural gas industry is intensely competitive, and the Company faces competition in each of its business segments.
The Company competes with major oil and natural gas companies and independent oil and natural gas companies for leases, equipment, personnel and markets for the sale of oil, natural gas and NGLs. Many of these competitors are financially stronger than the Company, but even financially troubled competitors can affect the market because of their need to sell oil, natural gas and NGLs at any price to maintain cash flow. Certain companies may be able to pay more for producing properties and undeveloped acreage. In addition, these companies may have a greater ability to continue exploration activities during periods of low oil, natural gas and NGL prices. The Company’s larger or fully integrated competitors may be able to absorb the burden of existing and any future federal, state and local laws and regulations more easily than the Company can, which would adversely affect its competitive position. The Company’s ability to acquire additional properties and to discover reserves in the future depends on its ability to evaluate and select suitable properties and to consummate transactions in a highly competitive environment. In addition, because the Company has fewer financial and human resources than many companies in its industry, the Company may be at a disadvantage in bidding for exploratory prospects and producing oil and natural gas properties.
Oil, natural gas and NGLs compete with other forms of energy available to customers, primarily based on price. These alternate forms of energy include electricity, coal and fuel oils. Changes in the availability or price of oil, natural gas and NGLs or other forms of energy, as well as business conditions, conservation, legislation, regulations and the ability to convert to alternate fuels and other forms of energy may affect the demand for oil, natural gas and NGLs.
With respect to the Company’s drilling business, the Company believes the type, age and condition of its drilling rigs, the quality of its crews and the responsiveness of its management generally enable the Company to compete effectively. However, to the extent the Company drills for third parties, it encounters substantial competition from other drilling contractors. The Company’s primary market area is highly competitive. The drilling contracts for which the Company competes are usually awarded on the basis of competitive bids. The Company may, based on the economic environment at the time, determine that market conditions and profit margins are such that contract drilling for third parties is not a beneficial use of its resources.
The Company believes pricing and rig availability are the primary factors its potential customers consider in determining which drilling contractor to select. While the Company must be competitive in its pricing, its competitive strategy generally emphasizes the quality of its equipment and the experience of its rig crews to differentiate it from its competitors. This strategy is less effective when demand for drilling services is weak or there is an oversupply of rigs. These conditions usually result in increased price competition, which makes it more difficult for the Company to compete on the basis of factors other than price. Many of the Company’s competitors have greater financial, technical and other resources than the Company does enabling them to better withstand industry downturns and retain skilled rig personnel.
The Company believes its geographic concentration of operations enables it to compete effectively in its midstream business. Most of the Company’s midstream assets are integrated with its production. However, with respect to third-party natural gas and acquisitions, the Company competes with companies that have greater financial and personnel resources than it does. These companies may have a greater ability to price their services below the Company’s prices for similar services.
17
SEASONAL NATURE OF BUSINESS
Generally, demand for oil and natural gas decreases during the summer months and increases during the winter months. Certain natural gas users utilize natural gas storage facilities and purchase some of their anticipated winter requirements during the summer, which can lessen seasonal demand fluctuations. Seasonal weather conditions and lease stipulations can limit the Company’s drilling and producing activities and other oil and natural gas operations in a portion of its operating areas. These seasonal anomalies can pose challenges for meeting the Company’s well drilling objectives, can delay the installation of production facilities, and can increase competition for equipment, supplies and personnel during certain times of the year, which could lead to shortages and increase costs or delay the Company’s operations.
ENVIRONMENTAL REGULATIONS
General
The exploration, development and production of oil and natural gas are subject to stringent and comprehensive federal, state, tribal, regional and local laws and regulations that are intended to protect the environment. These laws and regulations may, among other things, require permits to conduct drilling, water withdrawal and waste disposal operations; govern the amounts and types of substances that may be disposed or released into the environment and the manner of any such disposal or release; limit or prohibit construction or drilling activities or require formal mitigation measures in sensitive areas such as wetlands, wilderness areas or areas inhabited by endangered or threatened species; require investigatory and remedial actions to mitigate pollution conditions arising from the Company’s operations or attributable to former operations; impose restrictions designed to protect employees from exposure to hazardous or dangerous substances; and impose obligations to reclaim and abandon well sites and pits. Failure to comply with these laws and regulations may result in the assessment of sanctions, including monetary penalties, the imposition of remedial obligations and the issuance of orders enjoining operations in affected areas. Pursuant to such laws, regulations and permits, the Company may be subject to operational restrictions and has made, and will continue to make, capital and other compliance expenditures.
Increasingly, restrictions and limitations are being placed on activities that may affect the environment. Any changes in environmental laws and regulations or re-interpretation of enforcement policies that result in more stringent and costly construction, drilling, water management, completion, waste handling, storage, transport, disposal, or remediation requirements or emission or discharge limits could have a material adverse effect on the Company. Moreover, accidental releases or spills may occur in the course of the Company’s operations, and there can be no assurance that the Company will not incur significant costs and liabilities as a result of such releases or spills, including any third-party claims for damage to property and natural resources or personal injury.
The following is a summary of the more significant existing environmental and employee, health and safety laws and regulations applicable to the oil and natural gas industry and for which compliance may have a material adverse impact on the Company.
18
Hazardous Substances and Wastes
The Company currently owns, leases, or operates, and in the past has owned, leased, or operated, properties that have been used to explore for and produce oil and natural gas. The Company believes it has utilized operating and disposal practices that were standard in the industry at the applicable time, but hydrocarbons and wastes may have been disposed or released on or under the properties owned, leased, or operated by the Company or on or under other locations where these hydrocarbons and wastes have been taken for treatment or disposal. In addition, certain of these properties have been operated by third parties whose treatment and disposal or release of hydrocarbons and wastes were not under the Company’s control. These properties and wastes disposed thereon may be subject to the Comprehensive Environmental Response, Compensation, and Liability Act, as amended (“CERCLA”), the Resource Conservation and Recovery Act, as amended (“RCRA”) and analogous state laws. Under these laws, the Company could be required to remove or remediate previously disposed wastes, to investigate and clean up contaminated property and to perform remedial operations to prevent future contamination or to pay some or all of the costs of any such action.
CERCLA, also known as the Superfund law, and comparable state laws may impose joint and several liability without regard to fault or legality of conduct on certain classes of persons who are considered to be responsible for the release of a “hazardous substance” into the environment. These persons include current and prior owners or operators of the site where the release of a hazardous substance occurred as well as entities that disposed or arranged for the disposal of the hazardous substances. Under CERCLA, these “responsible persons” may be subject to strict, joint and several liability for the costs of cleaning up sites where the hazardous substances were released, including damages to natural resources resulting from the release and for the costs of certain environmental and health studies. Additionally, landowners and other third parties may file claims for personal injury and natural resource and property damage allegedly caused by the release of hazardous substances into the environment. CERCLA also authorizes the U.S. Environmental Protection Agency (“EPA”) and, in some instances, third parties to act in response to threats to the public health or the environment from a hazardous substance release and to pursue steps to recover costs incurred for those actions from responsible parties. Certain products used by the Company in the course of its exploration, development and production operations may be regulated as CERCLA hazardous substances. To date, no Company-owned or operated site has been designated as a Superfund site, and the Company has not been identified as a responsible party for any Superfund site.
The Company also generates wastes that are subject to the requirements of RCRA and comparable state statutes. RCRA imposes strict “cradle-to-grave” requirements on the generation, transportation, treatment, storage, disposal and cleanup of hazardous and non-hazardous wastes. Drilling fluids, produced waters and other wastes associated with the exploration, production and/or development of crude oil and natural gas are currently exempt from regulation as hazardous wastes under RCRA. However, it is possible that these wastes could be classified as hazardous wastes in the future. In September 2010, the Natural Resources Defense Council filed a petition with the EPA requesting reconsideration of the exemption for exploration, development and production wastes under RCRA. To date, the EPA has not taken any formal action in response to the petition. Any change in the exemption for such wastes could potentially result in an increase in costs to manage and dispose of wastes. In the course of the Company’s operations, it generates petroleum hydrocarbon wastes and ordinary industrial wastes that are subject to regulation under the RCRA. The Company believes it is in substantial compliance with all regulations regarding the handling and disposal of oil and natural gas wastes from its operations.
Air Emissions
The Clean Air Act, as amended, and comparable state laws and regulations restrict the emission of air pollutants from many sources and also impose various permitting, monitoring and reporting requirements. These laws and regulations may require the Company to obtain pre-approval for the construction or modification of certain projects or facilities expected to produce or significantly increase air emissions, obtain and strictly comply with air permit requirements or utilize specific equipment or technologies to control emissions. Obtaining permits has the potential to delay the development of oil and natural gas projects. The Company may be required to incur certain capital expenditures for air pollution control equipment or other air emissions-related issues as a result of such requirements. Additionally, violations of lease conditions or regulations related to air emissions can result in civil and criminal penalties, as well as potential court injunctions curtailing operations and canceling leases. Such enforcement liabilities can result from either governmental or citizen prosecution.
In August 2012, the EPA issued final regulations that established new air emission controls for oil and natural gas production and natural gas processing, including, among other things, new source performance standards for volatile organic compounds that would apply to newly hydraulically fractured wells, existing wells that are re-fractured, compressors, pneumatic controllers, storage vessels and natural gas processing plants placed in service after August 2011. On December 19, 2014, the EPA finalized updates and clarifications to its 2012 New Source Performance Standards for the oil and natural
19
gas industry. The updates provide additional detail on requirements of handling of gas and liquids during well completion operations, clarify requirements for storage tanks, define low-pressure wells, clarify certain requirements for leak detection at natural gas processing plants and update requirements for reciprocating compressors. The EPA has also implemented an engine emission testing program to ensure certain categories of engines, depending on the date manufactured, meet the EPA emission standards. The Company currently has an engine testing plan in place.
Water Discharges
The Federal Clean Water Act, as amended (the “CWA”), including analogous state laws and implementing regulations, impose restrictions and strict controls regarding the discharge of pollutants into waters of the United States as well as state waters. Pursuant to these laws and regulations, the discharge of pollutants is prohibited unless it is permitted by the EPA or an analogous state agency. The Company does not presently discharge pollutants associated with the exploration, development and production of oil and natural gas into federal or state waters. The CWA including analogous state laws and regulations also impose restrictions and controls regarding the discharge of sediment via storm water run-off to waters of the United States and state waters from a wide variety of construction activities. Such activities are generally prohibited from discharging sediment unless it is permitted by the EPA or an analogous state agency. However, pursuant to the Federal Energy Policy Act of 2005, storm water discharges related to oil and gas exploration, development and production are exempt from the provisions of the CWA. Nevertheless, the Company employs certain controls whenever construction activities commence to prevent the discharge of sediment into nearby water bodies. Finally, the CWA requires measures to be taken to prevent the accidental discharge of oil into waters of the United States from onshore production facilities. These measures include inspection and maintenance programs to minimize spills from oil storage and conveyance systems: the use of secondary containment systems to prevent spills from reaching nearby water bodies; and the development and implementation of spill prevention, control and countermeasure (“SPCC”) plans to prevent and respond to oil spills. The Company has developed SPCC plans for properties that are subject to the CWA.
The CWA further imposes certain duties and liabilities on “responsible parties” related to the prevention of oil spills and damages resulting from such spills in, or threatening, United States waters, including the Outer Continental Shelf or adjoining shorelines. A liable responsible party includes the owner or operator of an onshore facility, vessel, or pipeline that is a source, or a potential threat, of an oil discharge or, in the case of offshore facilities, the lessee or permittee of the area in which a discharging facility is located. The CWA assigns joint and several strict liability, without regard to fault, to each liable party for all containment and oil removal costs and a variety of public and private damages including, but not limited to, the costs of responding to a release of oil, natural resource damages, and economic damages suffered by persons adversely affected by an oil spill. Although defenses exist to the liability imposed by the CWA, they are limited. If an oil discharge or substantial threat of discharge were to occur, the Company may be liable for costs and damages, which costs and damages could be material to its results of operations and financial position.
Climate Change
In December 2009, the EPA published its findings that emissions of CO
2
, methane and certain other greenhouse gases (“GHGs”) present an endangerment to public health and the environment because emissions of such gases are, according to the EPA, contributing to warming of the earth’s atmosphere and other climatic changes. These findings allow the EPA to adopt and implement regulations that restrict emissions of GHGs under existing provisions of the Clean Air Act. Accordingly, the EPA has adopted rules that require a reduction in emissions of GHGs from motor vehicles and also trigger Clean Air Act construction and operating permit review for GHG emissions from certain stationary sources. The EPA’s endangerment finding and GHG rules were upheld by the United States Court of Appeals for the D.C. Circuit in a June 2012 decision, and a petition for review of the case by the entire D.C. Circuit was denied in December 2012. While somewhat limiting the EPA's regulatory reach, the Supreme Court in 2014 upheld the finding that the EPA reasonably interpreted the Clean Air Act to require sources that would need permits based on their emission of conventional pollutants to comply with “best available control technology” for greenhouse gases.
The EPA has also adopted rules requiring the reporting of GHG emissions from oil and natural gas production and processing facilities in the United States on an annual basis. The Company believes it has complied with all applicable reporting requirements to date. However, the adoption and implementation of any regulations imposing reporting obligations on, or limiting emissions of GHG gases from, the Company’s equipment and operations could require it to incur additional costs to reduce emissions of GHGs associated with its operations or could adversely affect demand for the oil and natural gas it produces. Finally, to the extent increasing concentrations of GHGs in the Earth’s atmosphere may produce climate changes that have significant physical effects, such as increased frequency and severity of storms, droughts, floods and other climatic
20
events, such events could have a material adverse effect on the Company and potentially subject the Company to further regulation.
In addition, Congress has considered legislation to reduce emissions of GHGs and more than one-half of the states have begun taking actions to control and/or reduce emissions of GHGs, primarily through the adoption of a climate change action plan, completion of GHG emission inventories and/or regional GHG cap and trade programs. Any future federal laws or implemented regulations that may be adopted to address GHG emissions could require the Company to incur increased operating costs, adversely affect demand for the oil and natural gas that the Company produces and have a material adverse effect on the Company’s business, financial condition and results of operations.
The United States is also engaged in negotiations, through the United Nations, to develop a successor international agreement to the Kyoto Protocol of the United Nations Framework Convention on Climate Change. These efforts are scheduled to continue, with an aim to accomplishing an agreed upon approach in Paris in December 2015. While the contours of any agreement are still subject to negotiation, the existence of commitments by the United States could increase the domestic effort at reducing GHG emissions, including through further regulation of emissions from oil and gas production or from enhanced efficiency efforts designed to limit demand for oil and gas product, all potentially materially affecting the company's financial position.
Endangered or Threatened Species
The Endangered Species Act (the “ESA”) restricts activities that may affect endangered or threatened species or their habitats. While the Company believes its operations are in substantial compliance with the ESA, exploration and production operations in areas where threatened or endangered species or their habitat are known to exist may require the Company to incur increased costs to implement mitigation or protective measures and also may delay, restrict or preclude drilling activities in those areas or during certain seasons, such as breeding and nesting seasons. If endangered species are located in areas of the underlying properties where the Company wishes to conduct seismic surveys, development activities or abandonment operations, the work could be prohibited or delayed or expensive mitigation may be required. Moreover, as a result of a settlement approved by the U.S. District Court for the District of Columbia on September 9, 2011, the U.S. Fish and Wildlife Service (the “FWS”) is required to consider listing more than 250 species as endangered under the ESA. Under the September 9, 2011 settlement, the federal agency is required to make a determination on listing of the species as endangered or threatened over the six-year period ending with the agency’s 2017 fiscal year. The designation of previously unprotected species as threatened or endangered in areas where underlying property operations are conducted, such as the March 2014 designation of the lesser prairie chicken as a threatened species, could cause the Company to incur increased costs arising from species protection measures or could result in limitations on its exploration and production activities that could have an adverse impact on its ability to develop and produce reserves.
On March 27, 2014, the FWS announced the listing of the lesser prairie chicken, whose habitat is over a five-state region, including Oklahoma, Kansas and Texas, where the Company operates, as a threatened species under the ESA. Listing of the lesser prairie chicken as threatened imposes restrictions on disturbances to critical habitat by landowners and drilling companies that would harass, harm or otherwise result in a “taking” of this species. However, the FWS also announced a final rule that will limit regulatory impacts on landowners and businesses from the listing if those landowners and businesses have entered into certain range-wide conservation planning agreements, such as those developed by the Western Association of Fish and Wildlife Agencies (the “WAFWA”) pursuant to which such parties agreed to take steps to protect the lesser prairie chicken’s habitat and to pay a mitigation fee if its actions harm the lesser prairie chicken’s habitat. The listing of the lesser prairie chicken as a threatened species and entry into certain range-wide conservation planning agreements, such as those developed by WAFWA, could result in increased costs to the Company from species protection measures, as well as delays and restrictions on their drilling program activities.
The Company is an active participant on various agency and industry committees that are developing or addressing various EPA and other federal and state agency programs to minimize potential impacts to business activity relating to the protection of any endangered or threatened species.
Employee Health and Safety
The Company’s operations are subject to a number of federal and state laws and regulations, including the Federal Occupational Safety and Health Act, as amended (“OSHA”), and comparable state statutes, whose purpose is to protect the health and safety of workers. In addition, the OSHA Hazardous Communication Standard requires that information be maintained concerning hazardous materials used or produced in the Company’s operations and that this information be provided
21
to employees. Pursuant to the Federal Emergency Planning and Community Right-to-Know Act, also known as Title III of the Federal Superfund Amendment and Reauthorization Act, facilities that store threshold amounts of chemicals that are subject to OSHA’s Hazardous Communication Standard above certain threshold quantities must submit information regarding those chemicals by March 1 of each year to state and local authorities in order to facilitate emergency planning and response. That information is generally available to the public. The Company believes that it is in substantial compliance with all applicable laws and regulations relating to worker health and safety.
State Regulation
The states in which the Company operates, along with some municipalities and Native American tribal areas, regulate some or all of the following activities: the drilling for, and the production and gathering of, oil and natural gas, including requirements relating to drilling permits, the location, spacing and density of wells, unitization and pooling of interests, the method of drilling, casing and equipping of wells, the protection of fresh water sources, the orderly development of common sources of supply of oil and natural gas, the operation of wells, allowable rates of production, the use of fresh water in oil and natural gas operations, saltwater injection and disposal operations, the plugging and abandonment of wells and the restoration of surface properties, the prevention of waste of oil and natural gas resources, the protection of the correlative rights of oil and natural gas owners and, where necessary to avoid unfair, unjust or discriminatory service, the fees, terms and conditions for the gathering of natural gas. These regulations may affect the number and location of the Company’s wells and the amounts of oil and natural gas that may be produced from the Company’s wells, and increase the costs of the Company’s operations.
Hydraulic Fracturing
Oil and natural gas may be recovered from certain of the Company’s oil and natural gas properties through the use of hydraulic fracturing, combined with sophisticated drilling. Hydraulic fracturing, which involves the injection of water, sand and chemicals under pressure into formations to fracture the surrounding rock and stimulate production, is typically regulated by state oil and gas commissions. However, the EPA has asserted federal regulatory authority over certain hydraulic fracturing practices, including the use of diesel, kerosene and similar compounds in the fracturing fluid. In August 2012, the EPA issued final Clean Air Act regulations governing performance standards, including for the capture of air emissions released during hydraulic fracturing.
Among other actions, EPA in a recent Fact Sheet announced plans to expand its New Source Performance Standards for the oil and gas sector to reduce methane emissions and to further restrict emissions of volatile organic compounds. EPA indicates that it intends to issue a proposed rule in late summer 2015 and a final rule in 2016. EPA also announced plans to provide state air permitting agencies with special “guidelines” for controlling volatile organic compound emissions from existing oil and gas sources located in ozone nonattainment areas and the Ozone Transport Region.
Also, federal legislation previously was introduced, but not enacted, to provide for federal regulation of hydraulic fracturing and to require disclosure of the chemicals used in the fracturing process. In May 2012, the Bureau of Land Management within the U.S. Department of the Interior issued a proposed rule containing disclosure requirements and other mandates for hydraulic fracturing on federal lands, but in January 2013 it announced that it would be submitting a revised rule proposal. That revised proposed rule was published for public comment in May 2013. The final rule would provide for disclosure to the public of chemicals used in hydraulic fracturing on public land and Indian land, strengthen regulations related to well-bore integrity, and address issues related to recovered water. The Department of the Interior is now analyzing the comments and is expected to promulgate a final rule sometime in 2015. In addition, BLM has announced that it will update standards to reduce wasteful venting, flaring and leaks of natural gas, which is primarily methane, from oil and gas wells. These standards, to be proposed in the spring of 2015, will address both new and existing oil and gas wells on public lands, in operational aspects not covered by EPA's proposed rule.
Certain states in which the Company operates, including Texas, Kansas and Oklahoma, and municipalities therein, have adopted, or are considering adopting, regulations that have imposed, or that could impose, more stringent permitting, disclosure, disposal and well construction requirements on hydraulic fracturing operations. For example, in February 2012, the Railroad Commission of Texas implemented the Fracturing Disclosure Rule requiring public disclosure of all the chemicals in fluids used in the hydraulic fracturing process. Local ordinances or other regulations may regulate or prohibit the performance of well drilling in general and hydraulic fracturing in particular, including imposing certain setback requirements. If new laws or regulations that significantly restrict hydraulic fracturing are adopted at either the state or federal level, the Company’s fracturing activities could become subject to additional permit requirements, reporting requirements or operational restrictions and also to associated permitting delays and potential increases in costs. These delays or additional costs could adversely
22
affect the determination of whether a well is commercially viable. Restrictions on hydraulic fracturing could also reduce the amount of oil and natural gas that the Company is ultimately able to produce in commercial quantities.
In addition to asserting regulatory authority, a number of federal entities are analyzing, or have been requested to review, a variety of environmental issues associated with hydraulic fracturing. In April 2012, President Obama issued an executive order that established a working group for the purpose of coordinating policy, information sharing and planning across federal agencies and offices regarding “unconventional natural gas production,” including hydraulic fracturing. In December 2012, the EPA issued an initial progress report on a study begun in 2011 of the potential environmental effects of hydraulic fracturing on drinking water and groundwater, with a draft final report expected to be issued for peer review and comment during 2015.
The EPA is developing a proposed rule to amend the Effluent Limitations Guidelines and Standards for the Oil and Gas Extraction Category. The proposed rule is scheduled for publication in early 2015. The proposal would address discharges of wastewater pollutants from onshore unconventional oil and gas extraction facilities to publicly-owned treatment works. The EPA continues to collect and analyze information and will examine a variety of options for these discharges. The EPA has also published an Advance Notice of Proposed Rulemaking under the Toxic Substances Control Act. The notice will begin the public participation process and seek public comment on the types of chemical information that could be reported and disclosed under the Toxic Substances Control Act and the approaches to obtain this information on chemicals and mixtures used in hydraulic fracturing activities, including non-regulatory approaches.
Additionally, a committee of the United States House of Representatives has conducted an investigation of hydraulic fracturing practices, and certain members of Congress have called upon the U.S. Government Accountability Office to investigate how hydraulic fracturing might adversely affect water resources; the SEC to investigate the natural gas industry and any possible misleading of investors or the public regarding the economic feasibility of pursuing natural gas deposits in shales by means of hydraulic fracturing; and the U.S. Energy Information Administration to provide a better understanding of that agency’s estimates regarding natural gas reserves, including reserves from shale formations, as well as uncertainties associated with those estimates. The studies and initiatives described above, depending on their degree of pursuit and any meaningful results obtained, could spur efforts to further regulate hydraulic fracturing under the Safe Drinking Water Act or other regulatory mechanisms.
The Company diligently reviews best practices and industry standards, serves on industry association committees and complies with all regulatory requirements in the protection of potable water sources. Protective practices include, but are not limited to, setting multiple strings of protection pipe across the potable water sources and cementing these pipes from setting depth to surface, continuously monitoring the hydraulic fracturing process in real time and disposing of all non-commercially produced fluids in certified disposal wells at depths below the potable water sources. There have not been any incidents, citations or suits related to the Company’s hydraulic fracturing activities involving environmental concerns.
OTHER REGULATION OF THE OIL AND NATURAL GAS INDUSTRY
The oil and natural gas industry is extensively regulated by numerous federal, state, local, and regional authorities, as well as Native American tribes. Legislation affecting the oil and natural gas industry is under constant review for amendment or expansion, frequently increasing the regulatory burden. Also, numerous departments and agencies, both federal and state, and Native American tribes are authorized by statute to issue rules and regulations affecting the oil and natural gas industry and its individual members, some of which carry substantial penalties for noncompliance. Although the regulatory burden on the oil and natural gas industry increases the Company’s cost of doing business and, consequently, affects its profitability, these burdens generally do not affect the Company any differently or to any greater or lesser extent than they affect other companies in the industry with similar types, quantities and locations of production.
The availability, terms and cost of transportation significantly affect sales of oil and natural gas. The interstate transportation and sale for resale of oil and natural gas is subject to federal regulation, including regulation of the terms, conditions and rates for interstate transportation, storage and various other matters, primarily by the Federal Energy Regulatory Commission (“FERC”). Federal and state regulations govern the price and terms for access to oil and natural gas pipeline transportation. The FERC’s regulations for interstate oil and natural gas transmission in some circumstances may also affect the intrastate transportation of oil and natural gas.
In July 2014, the U.S. Department of Transportation released the details of a comprehensive rulemaking proposal to improve the safe transportation of large quantities of flammable materials by rail, particularly crude oil and ethanol. The Advance Notice of Proposed Rulemaking proposes enhanced tank car standards, a classification and testing program for
23
mined gases and liquids and new operational requirements for high-hazard flammable trains that include braking controls and speed restrictions. Specifically, within two years, it proposes the phase out of the use of older DOT 111 tank cars for the shipment of packing group I flammable liquids, including most Bakken crude oil, unless the tank cars are retrofitted to comply with new tank car design standards. An accompanying Advance Notice of Proposed Rulemaking seeks further information on expanding comprehensive oil spill response planning requirements for shipments of flammable materials.
Sales of oil, natural gas and NGLs are not currently regulated and are made at market prices. Although oil, natural gas and NGL prices are currently unregulated, Congress historically has been active in the area of oil and natural gas regulation. The Company cannot predict whether new legislation to regulate oil, natural gas and NGLs might be proposed, what proposals, if any, might actually be enacted by Congress or the various state legislatures, and what effect, if any, the proposals might have on the Company’s operations.
Drilling and Production
The Company’s operations are subject to various types of regulation at federal, state, local and Native American tribal levels. These types of regulation include requiring permits for the drilling of wells, drilling bonds and reports concerning operations. Most states, and some counties, municipalities and Native American tribal areas where the Company operates also regulate one or more of the following activities:
|
•
|
the location of wells;
|
|
•
|
the method of drilling and casing wells;
|
|
•
|
the timing of construction or drilling activities;
|
|
•
|
the rates of production, or “allowables”;
|
|
•
|
the use of surface or subsurface waters;
|
|
•
|
the surface use and restoration of properties upon which wells are drilled;
|
|
•
|
the plugging and abandoning of wells; and
|
|
•
|
the notice to surface owners and other third parties.
|
State laws regulate the size and shape of drilling and spacing units or proration units governing the pooling of oil and natural gas properties. Some states allow forced pooling or integration of tracts to facilitate exploration while other states rely on voluntary pooling of lands and leases. In some instances, forced pooling or unitization may be implemented by third parties and may reduce the Company’s interest in the unitized properties. In addition, state conservation laws establish maximum rates of production from oil and natural gas wells, generally prohibit the venting or flaring of natural gas and impose requirements regarding the ratability of production. These laws and regulations may limit the amount of oil and natural gas the Company can produce from its wells or limit the number of wells or the locations at which the Company can drill. Moreover, each state generally imposes a production or severance tax with respect to the production and sale of oil, natural gas, and natural gas liquids within its jurisdiction.
The Oil Conservation Division of the New Mexico Energy, Minerals and Natural Resources Department requires the posting of financial assurance for owners and operators on privately owned or state land within New Mexico in order to provide for abandonment restoration and remediation of wells. The Railroad Commission of Texas imposes financial assurance requirements on operators. The United States Army Corps of Engineers (“ACOE”) and many other state and local authorities also have regulations for plugging and abandonment, decommissioning and site restoration.
Natural Gas Sales and Transportation
Historically, federal legislation and regulatory controls have affected the price of the natural gas the Company produces and the manner in which the Company markets its production. FERC has jurisdiction over the transportation and sale for resale of natural gas in interstate commerce by natural gas companies under the Natural Gas Act of 1938 and the Natural Gas Policy Act of 1978. Various federal laws enacted since 1978 have resulted in the removal of all price and non-price controls for sales of domestic natural gas sold in first sales, which include all of the Company’s sales of its own production. Under the Energy Policy Act of 2005, FERC has substantial enforcement authority to prohibit the manipulation of natural gas markets and enforce its rules and orders, including the ability to assess substantial civil penalties.
24
FERC also regulates interstate natural gas transportation rates and service conditions and establishes the terms under which the Company may use interstate natural gas pipeline capacity, which affects the marketing of natural gas that the Company produces, as well as the revenues it receives for sales of its natural gas and release of its natural gas pipeline capacity. Commencing in 1985, FERC promulgated a series of orders, regulations and rule makings that significantly fostered competition in the business of transporting and marketing gas. Today, interstate pipeline companies are required to provide nondiscriminatory transportation services to producers, marketers and other shippers, regardless of whether such shippers are affiliated with an interstate pipeline company. FERC’s initiatives have led to the development of a competitive, open access market for natural gas purchases and sales that permits all purchasers of natural gas to buy gas directly from third-party sellers other than pipelines. However, the natural gas industry historically has been very heavily regulated; therefore, the Company cannot guarantee that the less stringent regulatory approach currently pursued by FERC and Congress will continue indefinitely into the future nor can the Company determine what effect, if any, future regulatory changes might have on the Company’s natural gas related activities.
Under FERC’s current regulatory regime, transmission services must be provided on an open-access, nondiscriminatory basis at cost-based rates or at market-based rates if the transportation market at issue is sufficiently competitive. Gathering service, which occurs upstream of jurisdictional transmission services, is regulated by the states onshore and in-state waters. Although its policy is still in flux, in the past FERC has reclassified certain jurisdictional transmission facilities as non-jurisdictional gathering facilities, which has the tendency to increase the Company’s cost of transporting gas to point-of-sale locations.
Subsurface Injections
Our underground injection operations are subject to the Safe Drinking Water Act, or SDWA, as well as analogous state laws and regulations. Under the SDWA, the EPA established the Underground Injection Control, or UIC, program, which established the minimum program requirements for state and local programs regulating underground injection activities. The UIC program includes requirements for permitting, testing, monitoring, record keeping and reporting of injection well activities, as well as a prohibition against the migration of fluid containing any contaminant into underground sources of drinking water. State regulations require the Company to obtain a permit from the applicable regulatory agencies to operate the Company’s underground injection wells. Although the Company monitors the injection process of its wells, any leakage from the subsurface portions of the injection wells could cause degradation of fresh groundwater resources, potentially resulting in suspension of the Company’s UIC permit, issuance of fines and penalties from governmental agencies, incurrence of expenditures for remediation of the affected resource and imposition of liability by third-parties claiming damages for alternative water supplies, property damages and personal injuries. Additionally, some states, including Texas, have considered laws mandating the recycling of flowback and produced water. If such laws are passed, the Company’s operating costs may increase significantly.
EMPLOYEES
As of
December 31, 2014
, the Company had
1,878
full-time employees, including
164
geologists, geophysicists, petroleum engineers, technicians, land and regulatory professionals. Of the Company’s
1,878
employees,
661
were located at the Company’s headquarters in Oklahoma City, Oklahoma at
December 31, 2014
, and the remaining employees work in the Company’s various field offices and drilling sites.
25
GLOSSARY OF OIL AND NATURAL GAS TERMS
The following is a description of the meanings of certain oil and natural gas industry terms used in this report.
2-D seismic or 3-D seismic.
Geophysical data that depict the subsurface strata in two dimensions or three dimensions, respectively. 3-D seismic typically provides a more detailed and accurate interpretation of the subsurface strata than 2-D seismic.
Bbl.
One stock tank barrel, or 42 U.S. gallons liquid volume, used in this report in reference to oil or other liquid hydrocarbons.
Bcf.
Billion cubic feet of natural gas.
Boe.
Barrels of oil equivalent, with six thousand cubic feet of natural gas being equivalent to one barrel of oil. Although an equivalent barrel of condensate or natural gas may be equivalent to a barrel of oil on an energy basis, it is not equivalent on a value basis as there may be a large difference in value between an equivalent barrel and a barrel of oil. For example, based on the commodity prices used to prepare the estimate of the Company’s reserves at year-end 2014 of
$91.48
/Bbl for oil and
$4.35
/Mcf for natural gas, the ratio of economic value of oil to gas was approximately 21 to 1, even though the ratio for determining energy equivalency is 6 to 1.
Boe/d.
Boe per day.
Btu or British thermal unit.
The quantity of heat required to raise the temperature of one pound of water by one degree Fahrenheit.
Completion.
The process of treating a drilled well followed by the installation of permanent equipment for the production of oil or natural gas, or in the case of a dry well, the reporting to the appropriate authority that the well has been abandoned.
Condensate.
A mixture of hydrocarbons that exists in the gaseous phase at original reservoir temperature and pressure, but that, when produced, is in the liquid phase at surface pressure and temperature.
CO
2
.
Carbon dioxide.
Developed acreage.
The number of acres that are assignable to productive wells.
Developed oil, natural gas and NGL reserves.
Reserves of any category that can be expected to be recovered (i) through existing wells with existing equipment and operating methods or in which the cost of the required equipment is relatively minor compared to the cost of a new well and (ii) through installed extraction equipment and infrastructure operational at the time of the reserves estimate if the extraction is by means not involving a well.
Development costs.
Costs incurred to obtain access to proved reserves and to provide facilities for extracting, treating, gathering and storing the oil and natural gas. More specifically, development costs, including depreciation and applicable operating costs of support equipment and facilities and other costs of development activities, are costs incurred to (i) gain access to and prepare well locations for drilling, including surveying well locations for the purpose of determining specific development drilling sites, clearing ground, draining, road building and relocating public roads, gas lines and power lines, to the extent necessary in developing the proved reserves, (ii) drill and equip development wells, development-type stratigraphic test wells and service wells, including the costs of platforms and of well equipment such as casing, tubing, pumping equipment, and the wellhead assembly, (iii) acquire, construct and install production facilities such as lease flow lines, separators, treaters, heaters, manifolds, measuring devices and production storage tanks, natural gas cycling and processing plants, and central utility and waste disposal systems, and (iv) provide improved recovery systems.
Development well.
A well drilled within the proved area of an oil or natural gas reservoir to the depth of a stratigraphic horizon known to be productive.
Dry well.
An exploratory, development or extension well that proves to be incapable of producing either oil or natural gas in sufficient quantities to justify completion as an oil or natural gas well.
Environmental Assessment (“EA”).
A study to determine whether an action significantly affects the environment, which federal or state agencies may be required by the National Environmental Policy Act or similar state statutes to undertake
26
prior to the commencement of activities that would constitute federal or state actions, such as permitting oil and natural gas exploration and production activities.
Environmental Impact Statement.
A more detailed study of the environmental effects of an undertaking and its alternatives than an EA, which may be required by the National Environmental Policy Act or similar state statutes, either after the EA has been prepared and determined that the environmental consequences of a proposed federal undertaking, such as permitting oil and natural gas exploration and production activities, may be significant, or without the initial preparation of an EA if a federal or state agency anticipates that a proposed undertaking may significantly impact the environment.
Exploratory well.
A well drilled to find a new field or to find a new reservoir in a field previously found to produce oil or natural gas in another reservoir.
Field.
An area consisting of a single reservoir or multiple reservoirs all grouped on or related to the same individual geological structural feature and/or stratigraphic condition. There may be two or more reservoirs in a field which are separated vertically by intervening impervious strata, or laterally by local geological barriers, or both. Reservoirs that are associated by being in overlapping or adjacent fields may be treated as a single or common operational field. The geological terms “structural feature” and “stratigraphic condition” are intended to identify localized geological features as opposed to the broader terms of basins, trends, provinces, plays, areas of interest, etc.
Gross acres or gross wells.
The total acres or wells, as the case may be, in which a working interest is owned.
High CO
2
gas.
Natural gas that contains more than 10% CO
2
by volume.
Imbricate stacking.
A geological formation characterized by multiple layers lying lapped over each other.
MBbls.
Thousand barrels of oil or other liquid hydrocarbons.
MBoe.
Thousand barrels of oil equivalent.
Mcf.
Thousand cubic feet of natural gas.
MMBbls.
Million barrels of oil or other liquid hydrocarbons.
MMBoe.
Million barrels of oil equivalent.
MMBtu.
Million British Thermal Units.
MMcf.
Million cubic feet of natural gas.
MMcf/d.
MMcf per day.
Net acres or net wells.
The sum of the fractional working interest owned in gross acres or gross wells, as the case may be.
NGL.
Natural gas liquids, such as ethane, propane, butanes and natural gasoline that are extracted from natural gas production streams.
NYMEX.
The New York Mercantile Exchange.
Plugging and abandonment.
Refers to the sealing off of fluids in the strata penetrated by a well so that the fluids from one stratum will not escape into another or to the surface. Regulations of all states require plugging of abandoned wells.
Present value of future net revenues (“PV-10”).
The present value of estimated future revenues to be generated from the production of proved reserves, before income taxes, calculated in accordance with SEC guidelines, net of estimated production and future development costs, using prices and costs as of the date of estimation without future escalation and without giving effect to hedging activities, non-property related expenses such as general and administrative expenses, debt service and depreciation, depletion and amortization. PV-10 is calculated using an annual discount rate of 10%.
27
Production costs.
|
(i)
|
Costs incurred to operate and maintain wells and related equipment and facilities, including depreciation and applicable operating costs of support equipment and facilities and other costs of operating and maintaining those wells and related equipment and facilities. They become part of the cost of oil and gas produced. Examples of production costs (sometimes called lifting costs) are:
|
|
(A)
|
Costs of labor to operate the wells and related equipment and facilities.
|
|
(B)
|
Repairs and maintenance.
|
|
(C)
|
Materials, supplies, and fuel consumed and supplies utilized in operating the wells and related equipment and facilities.
|
|
(D)
|
Property taxes and insurance applicable to proved properties and wells and related equipment and facilities.
|
|
(E)
|
Severance taxes.
|
|
(ii)
|
Some support equipment or facilities may serve two or more oil and gas producing activities and may also serve transportation, refining and marketing activities. To the extent that the support equipment and facilities are used in oil and gas producing activities, their depreciation and applicable operating costs become exploration, development or production costs, as appropriate. Depreciation, depletion and amortization of capitalized acquisition, exploration, and development costs are not production costs but also become part of the cost of oil and gas produced along with production (lifting) costs identified above.
|
Productive well.
A well that is found to be capable of producing oil or natural gas in sufficient quantities to justify completion as an oil or natural gas well.
Prospect.
A specific geographic area that, based on supporting geological, geophysical or other data and also preliminary economic analysis using reasonably anticipated prices and costs, is deemed to have potential for the discovery of commercial hydrocarbons.
Proved developed reserves.
Reserves that are both proved and developed.
Proved oil, natural gas and NGL reserves.
Has the meaning given to such term in Rule 4-10(a)(22) of Regulation S-X, which defines proved reserves as:
Those quantities of oil and natural gas which, by analysis of geoscience and engineering data, can be estimated with reasonable certainty to be economically producible from a given date forward, from known reservoirs, and under existing economic conditions, operating methods, and government regulations, prior to the time at which contracts providing the right to operate expire, unless evidence indicates that renewal is reasonably certain, regardless of whether deterministic or probabilistic methods are used for estimation. The project to extract the hydrocarbons must have commenced or the operator must be reasonably certain that it will commence the project within a reasonable time.
The area of a reservoir considered proved includes (i) the area identified by drilling and limited by fluid contacts, if any, and (ii) adjacent undrilled portions of the reservoir that can, with reasonable certainty, be judged to be continuous with it and to contain economically producible oil or gas on the basis of available geoscience and engineering data. In the absence of data on fluid contacts, proved quantities in a reservoir are limited by the lowest known hydrocarbons as seen in a well penetration unless geoscience, engineering or performance data and reliable technology establish a lower contact with reasonable certainty.
Where direct observation from well penetrations has defined a highest known oil elevation and the potential exists for an associated gas cap, proved oil reserves may be assigned in the structurally higher portions of the reservoir only if geoscience, engineering or performance data and reliable technology establish the higher contact with reasonable certainty.
Reserves that can be produced economically through application of improved recovery techniques (including, but not limited to, fluid injection) are included in the proved classification when (i) successful testing by a pilot project in an area of the reservoir with properties no more favorable than in the reservoir as a whole, the operation of an installed program in the reservoir, or an analogous reservoir, or other evidence using reliable technology establishes the reasonable certainty of the engineering analysis on which the project or program was based and (ii) the project has been approved for development by all necessary parties and entities, including governmental entities.
28
Existing economic conditions include prices and costs at which economic producibility from a reservoir is to be determined. The price shall be the average price during the 12-month period prior to the ending date of the period covered by the report, determined as an unweighted arithmetic average of the first-day-of-the-month price for each month within such period, unless prices are defined by contractual arrangements, excluding escalations based upon future conditions.
Proved undeveloped reserves.
Reserves that are both proved and undeveloped.
Pulling units.
Pulling units are used in connection with completions and workover operations.
PV-10.
See “Present value of future net revenues” above.
Rental tools.
A variety of rental tools and equipment, ranging from trash trailers to blowout preventers to sand separators, for use in the oil field.
Reserves.
Estimated remaining quantities of oil and natural gas and related substances anticipated to be economically producible by application of development projects to known accumulations. In addition, there must exist, or there must be a reasonable expectation that there will exist, the legal right to produce or a revenue interest in the production, installed means of delivering oil and natural gas or related substances to market, and all permits and financing required to implement the project.
Reserves should not be assigned to adjacent reservoirs isolated by major, potentially sealing, faults until those reservoirs are penetrated and evaluated as economically producible. Reserves should not be assigned to areas that are clearly separated from a known accumulation by a non-productive reservoir (
i.e.,
absence of reservoir, structurally low reservoir, or negative test results). Such areas may contain prospective resources (
i.e.
, potentially recoverable resources from undiscovered accumulations).
Reservoir.
A porous and permeable underground formation containing a natural accumulation of producible oil and/or natural gas that is confined by impermeable rock or water barriers and is individual and separate from other reservoirs.
Roustabout services.
The provision of manpower to assist in conducting oil field operations.
Standardized measure or standardized measure of discounted future net cash flows.
The present value of estimated future cash inflows from proved oil, natural gas and NGL reserves, less future development and production costs and future income tax expenses, discounted at 10% per annum to reflect timing of future cash flows and using the same pricing assumptions as were used to calculate PV-10. Standardized Measure differs from PV-10 because Standardized Measure includes the effect of future income taxes on future net revenues.
Trucking.
The provision of trucks to move the Company’s drilling rigs from one well location to another and to deliver water and equipment to the field.
Undeveloped acreage.
Lease acreage on which wells have not been drilled or completed to a point that would permit the production of economic quantities of oil or natural gas regardless of whether such acreage contains proved reserves.
Undeveloped oil, natural gas and NGL reserves.
Reserves of any category that are expected to be recovered from new wells on undrilled acreage, or from existing wells where a relatively major expenditure is required for recompletion.
|
(i)
|
Reserves on undrilled acreage are limited to those directly offsetting development spacing areas that are reasonably certain of production when drilled, unless evidence using reliable technology exists that establishes reasonable certainty of economic producibility at greater distances.
|
|
(ii)
|
Undrilled locations are classified as having undeveloped reserves only if a development plan has been adopted indicating that they are scheduled to be drilled within five years, unless the specific circumstances justify a longer time.
|
|
(iii)
|
Under no circumstances shall estimates for undeveloped reserves be attributable to any acreage for which an application of fluid injection or other improved recovery technique is contemplated, unless such techniques have been proved effective by actual projects in the same reservoir or an analogous reservoir or by other evidence using reliable technology establishing reasonable certainty.
|
Working interest.
The operating interest that gives the owner the right to drill, produce and conduct operating activities on the property and receive a share of production and requires the owner to pay a share of the costs of drilling and production operations.
29
Item 1A.
Risk Factors
Drilling for and producing oil and natural gas are high risk activities with many uncertainties that could adversely affect the Company’s business, financial condition or results of operations.
Drilling for oil and natural gas can be unprofitable if dry wells are drilled and if productive wells do not produce sufficient revenues to return a profit. Furthermore, even if sufficient amounts of oil or natural gas exist, the Company may damage the potentially productive hydrocarbon bearing formation or experience mechanical difficulties while drilling or completing the well, resulting in a reduction in production from the well or abandonment of the well. Decisions to develop properties depend in part on the evaluation of data obtained through geophysical and geological analyses, production data and engineering studies, the results of which are often inconclusive or subject to varying interpretations. The estimated cost of drilling, completing and operating wells is uncertain before drilling commences. Overruns in budgeted expenditures are common risks that can make a particular project uneconomical. In addition, the Company’s drilling and producing operations may be curtailed, delayed or canceled as a result of various factors, including the following:
|
•
|
reductions in oil, natural gas and NGL prices;
|
|
•
|
delays imposed by or resulting from compliance with regulatory requirements including permitting;
|
|
•
|
unusual or unexpected geological formations and miscalculations;
|
|
•
|
shortages of or delays in obtaining equipment and qualified personnel;
|
|
•
|
shortages of or delays in obtaining water for hydraulic fracturing operations;
|
|
•
|
equipment malfunctions, failures or accidents;
|
|
•
|
lack of available gathering facilities or delays in construction of gathering facilities;
|
|
•
|
lack of available capacity on interconnecting transmission pipelines;
|
|
•
|
lack of adequate electrical infrastructure and water disposal capacity;
|
|
•
|
unexpected operational events and drilling conditions;
|
|
•
|
pipe or cement failures and casing collapses;
|
|
•
|
pressures, fires, blowouts and explosions;
|
|
•
|
lost or damaged drilling and service tools;
|
|
•
|
loss of drilling fluid circulation;
|
|
•
|
uncontrollable flows of oil, natural gas, brine, water or drilling fluids;
|
|
•
|
natural disasters;
|
|
•
|
environmental hazards, such as oil and natural gas leaks, pipeline ruptures and discharges of toxic gases or well fluids;
|
|
•
|
adverse weather conditions such as extreme cold, fires caused by extreme heat or lack of rain, and severe storms, tornadoes or hurricanes;
|
|
•
|
oil and natural gas property title problems; and
|
|
•
|
market limitations for oil, natural gas and NGLs.
|
Certain of these risks can cause substantial losses, including personal injury or loss of life, damage to or destruction of property, natural resources and equipment, environmental contamination or loss of wells and regulatory fines or penalties.
30
Oil, natural gas and NGL prices can fluctuate widely due to a number of factors that are beyond the Company’s control. Continued depressed or further declining oil, natural gas or NGL prices could significantly affect the Company’s financial condition and results of operations.
The Company’s revenues, profitability and cash flow are highly dependent upon the prices it realizes from the sale of oil, natural gas and NGLs. The markets for these commodities are very volatile and have experienced significant decline during the latter half of 2014. Oil, natural gas and NGL prices can move quickly and fluctuate widely in response to a variety of factors that are beyond the Company’s control. These factors include, among others:
|
•
|
changes in regional, domestic and foreign supply of, and demand for, oil, natural gas and NGLs, as well as perceptions of supply of, and demand for, oil, natural gas and NGLs generally;
|
|
•
|
the price and quantity of foreign imports;
|
|
•
|
the ability of other companies to complete and commission liquefied natural gas export facilities in the U.S.;
|
|
•
|
U.S. and worldwide political and economic conditions;
|
|
•
|
weather conditions and seasonal trends;
|
|
•
|
anticipated future prices of oil, natural gas and NGLs, alternative fuels and other commodities;
|
|
•
|
technological advances affecting energy consumption and energy supply;
|
|
•
|
the proximity, capacity, cost and availability of pipeline infrastructure, treating, transportation and refining capacity;
|
|
•
|
natural disasters and other extraordinary events;
|
|
•
|
domestic and foreign governmental regulations and taxation;
|
|
•
|
energy conservation and environmental measures; and
|
|
•
|
the price and availability of alternative fuels.
|
For oil, from January 1, 2010 through
December 31, 2014
, the highest monthly NYMEX settled price was
$113.93
per Bbl and the lowest was
$53.27
per Bbl. For natural gas, from January 1, 2010 through
December 31, 2014
, the highest monthly NYMEX settled price was
$6.06
per MMBtu and the lowest was
$2.04
per MMBtu. In addition, the market price of oil and natural gas is generally higher in the winter months than during other months of the year due to increased demand for oil and natural gas for heating purposes during the winter season.
Oil prices dropped sharply during the latter half of 2014 and have continued to decline in early 2015, to as low as $44.45 per Bbl in January 2015. Continued low oil, natural gas or NGL prices will decrease the Company’s cash flows and revenues, and also may ultimately reduce the amount of oil, natural gas and NGLs that it can produce economically, causing the Company to make substantial downward adjustments to its estimated proved reserves and having a material adverse effect on its financial condition and results of operations.
Unless the Company replaces its oil, natural gas and NGL reserves, its reserves and production will decline, which would adversely affect the Company’s business, financial condition and results of operations.
The Company's future oil, natural gas and NGL reserves and production, and therefore its cash flow and income, are highly dependent on its success in efficiently developing and exploiting its current reserves and finding or acquiring additional economically recoverable reserves. Declining cash flows from operations, as a result of lower commodity prices, could require the Company to reduce expenditures to develop and acquire additional reserves. Further, the Company may not be able to develop, find or acquire additional reserves to replace its current and future production at acceptable costs, which could adversely affect its business, financial condition and results of operations.
Future price declines may result in reductions of the asset carrying values of the Company’s oil and natural gas properties.
The Company utilizes the full cost method of accounting for costs related to its oil and natural gas properties. Under this accounting method, all costs for both productive and nonproductive properties are capitalized and amortized on an aggregate basis over the estimated lives of the properties using the unit-of-production method. However, the amount of these costs that can be carried as capitalized assets is subject to a ceiling, which limits such pooled costs to the aggregate of the present value of future net revenues of proved oil, natural gas and NGL reserves attributable to proved properties, discounted at 10%, plus the lower of cost or market value of unevaluated properties. The full cost ceiling is evaluated at the end of each quarter using the most recent 12-month average prices for oil and natural gas, adjusted for the impact of derivatives accounted for as cash flow hedges. The Company incurred a full cost ceiling impairment charge of $
164.8 million
for the year ended
December 31, 2014
, and had cumulative full cost ceiling impairment charges of
$3.7 billion
and $3.5 billion at
December 31, 2014
and
2013
, respectively. The Company
31
had
no
full cost ceiling impairments during the years ended December 31,
2013
or
2012
. If oil, natural gas and NGL prices fail to recover significantly in the near term, and without other mitigating circumstances, the Company will experience additional losses of future net revenues, including losses attributable to quantities that cannot be economically produced at lower prices, which would likely cause the Company to record additional write-downs of capitalized costs of its oil and natural gas properties and non-cash charges against future earnings. The amount of such future write-downs and non-cash charges could be substantial. Further, the borrowing base under the Company’s senior credit facility is calculated by reference to the value of the Company’s oil and natural gas reserves, as determined by the lenders under the senior credit facility, and declines in the value of such reserves as a result of sustained low commodity prices could reduce the amount available to be borrowed by the Company under its senior credit facility.
The Company has a substantial amount of indebtedness and other obligations and commitments, which may adversely affect its cash flow and its ability to operate its business.
As of
December 31, 2014
, the Company’s total indebtedness was
$3.2 billion
and the Company had preferred stock outstanding with an aggregate liquidation preference of
$565.0 million
. The Company’s substantial level of indebtedness and the dividends associated with its outstanding preferred stock increases the possibility that it may be unable to generate cash sufficient to pay, when due, the principal of, interest on or other amounts due in respect of the Company’s indebtedness and/or the preferred stock dividends. Declining cash flows from operations, as a result of declines in oil and natural gas prices, may increase the Company’s borrowing needs under its senior credit facility to fund working capital. The Company’s indebtedness and outstanding preferred stock, combined with its lease and other financial obligations and contractual commitments, such as its obligations to drill wells for the Mississippian Trust II, could have other important consequences to the Company. For example, it could:
|
•
|
make the Company more vulnerable to adverse changes in general economic, industry and competitive conditions and adverse changes in government regulation;
|
|
•
|
require the Company to dedicate an even greater portion of its cash flow from operations to payments on its indebtedness, thereby reducing the availability of the Company’s cash flows to fund working capital, capital expenditures, acquisitions and other general corporate purposes;
|
|
•
|
require the Company to finance an increasing portion of its working capital and capital expenditures with cash on hand and borrowing under its senior credit facility;
|
|
•
|
limit the Company’s flexibility in planning for, or reacting to, changes in its business and the industry in which it operates;
|
|
•
|
place the Company at a disadvantage compared to its competitors that are less leveraged and, therefore, may be able to take advantage of opportunities that the Company’s indebtedness prevents it from pursuing; and
|
|
•
|
limit the Company’s ability to borrow additional amounts for working capital, capital expenditures, acquisitions, debt service requirements, execution of its business strategy or other purposes.
|
Any of the above listed factors could have a material adverse effect on the Company’s business, financial condition and results of operations.
The Company’s estimated reserves are based on many assumptions that may turn out to be inaccurate. Any significant inaccuracies in these reserve estimates or underlying assumptions could materially affect the quantities and present value of the Company’s reserves. The Company’s current estimates of reserves could change, potentially in material amounts, in the future.
The process of estimating oil, natural gas and NGL reserves is complex and inherently imprecise, requiring interpretations of available technical data and many assumptions, including assumptions relating to production rates and economic factors such as historic oil and natural gas prices, drilling and operating expenses, capital expenditures, the assumed effect of governmental regulation and availability of funds for development expenditures. Inaccuracies in these interpretations or assumptions could materially affect the estimated quantities and present value of the Company’s reserves. See “Business—Business Segments and Primary Operations” in Item 1 of this report for information about the Company’s oil, natural gas and NGL reserves.
Actual future production, oil, natural gas and NGL prices, revenues, taxes, development expenditures, operating expenses and quantities of recoverable oil, natural gas and NGL reserves will vary and could vary significantly from the Company’s estimates shown in this report, which in turn could have a negative effect on the value of the Company’s assets. In addition, from time to time in the future, the Company will adjust estimates of proved reserves, potentially in material amounts, to reflect production history, results of exploration and development, changes in oil, natural gas and NGL prices and other factors, many of which are beyond the Company’s control.
32
The present value of future net cash flows from the Company’s proved reserves calculated in accordance with SEC guidelines
are not the same as the current market value of its estimated oil, natural gas and NGL reserves.
The Company bases the estimated discounted future net cash flows from its proved reserves on 12-month average index prices and costs, as is required by SEC rules and regulations. Oil prices fell sharply in the latter half of 2014 and remain at very low levels. Accordingly, if the Company had prepared its December 31, 2014 reserve reports based on the last month-end posted index prices at that time (which were $49.75 and $3.00 at December 31, 2014) instead of the 12-month average index prices (which were $91.48 and $4.35), the PV-10 value of its estimated proved reserves would necessarily have been lower. Actual future net cash flows from the Company’s oil and natural gas properties will be affected by actual prices the Company receives for oil, natural gas and NGLs, as well as other factors such as:
|
•
|
the accuracy of the Company’s reserve estimates;
|
|
•
|
the actual cost of development and production expenditures;
|
|
•
|
the amount and timing of actual production;
|
|
•
|
supply of and demand for oil, natural gas and NGLs; and
|
|
•
|
changes in governmental regulation or taxation.
|
The timing of both the Company’s production and its incurrence of expenses in connection with the development and production of oil and natural gas properties will affect the timing of actual future net cash flows from proved reserves, and thus their actual present value. In addition, the Company uses a 10% discount factor when calculating discounted future net cash flows, which may not be the most appropriate discount factor based on interest rates in effect from time to time and risks associated with the Company or the oil and natural gas industry in general.
The Company will not know conclusively prior to drilling whether oil or natural gas will be present in sufficient quantities to be economically producible.
The cost of drilling, completing and operating any well is often uncertain, and new wells may not be productive or may suffer from declining production faster than anticipated. The use of seismic data and other technologies and the study of producing fields in the same area do not enable the Company to know conclusively prior to drilling whether oil or natural gas will be present or, if present, whether oil or natural gas will be present in sufficient quantities to be economically viable. During 2014, the Company completed a total of
652
gross wells, of which
20
were identified as dry wells. If the Company drills additional wells that it identifies as dry wells in its current and future prospects, its drilling success rate may decline and materially harm its business.
Production of oil, natural gas and NGLs could be materially and adversely affected by natural disasters or severe weather.
Production of oil, natural gas and NGLs could be materially and adversely affected by natural disasters or severe weather. Repercussions of natural disasters or severe weather conditions may include:
|
•
|
evacuation of personnel and curtailment of operations;
|
|
•
|
damage to drilling rigs or other facilities, resulting in suspension of operations;
|
|
•
|
inability to deliver materials to worksites; and
|
|
•
|
damage to, or shutting in of, pipelines and other transportation facilities.
|
In addition, the Company’s hydraulic fracturing operations require significant quantities of water. Regions in which the Company operates have recently experienced drought conditions. Any diminished access to water for use in hydraulic fracturing, whether due to usage restrictions or drought or other weather conditions, could curtail the Company’s operations or otherwise result in delays in operations or increased costs.
The capital markets could be volatile, and such volatility could adversely affect the Company’s ability to obtain capital, cause it to incur additional financing expense or affect the value of certain assets.
During and following the recent global financial crisis, financial and capital markets were volatile due to multiple factors, including significant losses in the financial services sector and uncertain and rapidly changing economic conditions both in the U.S. and globally. In some cases, financial markets produced downward pressure on stock prices and credit capacity for certain issuers without regard to those issuers’ underlying financial and/or operating strength. Volatility in the capital markets can significantly increase the cost of raising money in the debt and equity capital markets. Future market volatility, generally, and persistent weakness in commodity prices may adversely affect the Company’s ability to access capital and credit markets or to
33
obtain funds at low interest rates or on other advantageous terms. These factors may adversely affect the Company’s business, results of operations or liquidity.
These factors may also adversely affect the value of certain of the Company’s assets and its ability to draw on its senior secured revolving credit facility (“senior credit facility”). Adverse credit and capital market conditions may require the Company to reduce the carrying value of assets associated with derivative contracts to account for non-performance by, or increased credit risk from, counterparties to those contracts. If financial institutions that have extended credit commitments to the Company are adversely affected by volatile conditions of the U.S. and international capital markets, they may become unable to fund borrowings under their credit commitments to the Company, which could have a material adverse effect on its financial condition and its ability to borrow additional funds, if needed, for working capital, capital expenditures and other corporate purposes.
Properties acquired by the Company may not produce as projected, and the Company may be unable to determine reserve potential, identify liabilities associated with the properties or obtain protection from sellers against them.
The Company’s initial technical reviews of properties it acquires are necessarily limited because an in-depth review of every individual property involved in each acquisition generally is not feasible. Even a detailed review of records and properties may not necessarily reveal existing or potential problems, nor will it permit a buyer to become sufficiently familiar with the properties to assess fully their deficiencies and potential. Inspections may not always be performed on every well and environmental problems, such as soil or ground water contamination, are not necessarily observable even when an inspection is undertaken. Even when problems are identified, the Company may assume certain environmental and other risks and liabilities in connection with acquired properties, and such risks and liabilities could have a material adverse effect on its results of operations and financial condition.
The development of the Company’s proved undeveloped reserves may take longer and may require higher levels of capital expenditures than the Company currently anticipates.
As of
December 31, 2014
,
35%
of the Company’s total reserves were proved undeveloped reserves. Development of these reserves may take longer and require higher levels of capital expenditures than the Company currently anticipates. Therefore, recoveries from these fields may not match current expectations. Delays in the development of the Company’s reserves or increases in costs to drill and develop such reserves will reduce the PV-10 value of the Company’s estimated proved undeveloped reserves and future net revenues estimated for such reserves.
A significant portion of the Company’s operations are located in the Mid-Continent region, making it vulnerable to risks associated with operating in a limited number of major geographic areas.
As of
December 31, 2014
, approximately
88%
of the Company’s proved reserves and approximately
80.9%
of its annual production was located in the Mid-Continent. This concentration could disproportionately expose the Company to operational and regulatory risk in these areas. This relative lack of diversification in location of its key operations could expose the Company to adverse developments in these areas or the oil and natural gas markets, including, for example, transportation or treatment capacity constraints, curtailment of production due to weather, electrical outages, treatment plant closures for scheduled maintenance or other factors. These factors could have a significantly greater impact on the Company’s financial condition, results of operations and cash flows than if the Company’s properties were more diversified.
34
The Company’s development and exploration operations require substantial capital, and the Company may be unable to obtain needed capital or financing on satisfactory terms, which could lead to a loss of properties and a decline in the Company’s oil, natural gas and NGL reserves.
The oil and natural gas industry is capital intensive. The Company makes substantial capital expenditures in its business and operations for the exploration, development, production and acquisition of oil, natural gas and NGL reserves. Historically, the Company has financed capital expenditures primarily with proceeds from asset sales and from the sale of equity and debt securities and cash generated by operations. In particular, the Company had cash flow from operations of
$621.1 million
,
$868.6 million
and
$783.2 million
, for the years ended December 31, 2014, 2013 and 2012, respectively. The Company expects to finance its future capital expenditures with cash on hand, cash flow from operations, asset sales and available borrowing capacity under its senior credit facility. The Company’s cash flow from operations and access to capital are subject to a number of variables, including:
|
•
|
the prices at which oil, natural gas and NGLs are sold;
|
|
•
|
the Company’s proved reserves;
|
|
•
|
the level of oil, natural gas and NGLs it is able to produce from existing wells;
|
|
•
|
the Company’s ability to acquire, locate and produce new reserves; and
|
|
•
|
the Company’s capital and operating costs.
|
Oil prices fell sharply in the latter half of 2014, and continued low prices will reduce the Company’s revenues and cash flow from operations. Reductions in the Company’s revenues and cash flow from operations, whether as a result of lower oil, natural gas and NGL prices, lower production, declines in reserves or for any other reason, may limit the Company’s ability to obtain the capital necessary to sustain its operations at desired levels. In order to fund capital expenditures, the Company may seek additional financing. However, the Company’s senior credit facility contains covenants limiting its ability to incur additional indebtedness, and the Company’s lenders may withhold their consent to exceed the limitations in such covenants at their sole discretion. The Company’s senior note indentures also contain covenants that may restrict the Company’s ability to incur additional indebtedness if it does not satisfy certain financial metrics. The Company significantly lowered its capital expenditures plan for 2015 due, in part, to sustained low commodity prices. If prices remain at low levels and the Company is unable to obtain additional financing, it may be necessary for the Company to further reduce or even suspend its capital expenditures.
Disruptions in the global financial and capital markets also could adversely affect the Company’s ability to obtain debt or equity financing on favorable terms, or at all. The failure to obtain additional financing could result in a curtailment of the Company’s operations relating to exploration and development of its prospects, which in turn could lead to a possible loss of properties and a decline in the Company’s oil, natural gas and NGL reserves.
The agreements governing the Company’s existing indebtedness have restrictions, financial covenants and borrowing base redeterminations, which could adversely affect its operations.
The Company’s senior credit facility and the indentures governing its senior notes restrict the Company’s ability to, among other things, obtain additional financing, make investments, lease equipment, sell assets and engage in business combinations. The senior credit facility also requires the Company to comply with certain financial covenants and ratios. On February 23, 2015, the Company and its lenders amended the credit agreement to address the risk that, in light of depressed oil and natural gas prices, the Company would breach certain financial covenants in 2015. See additional discussion of the senior credit agreement amendment under “
Cash Flows-Senior Credit Facility.
” Persistent depressed oil or natural gas prices or further decline in such prices, without other mitigating circumstances, could prevent the Company from complying with the financial covenants under its amended senior credit facility. The Company’s failure to comply with any of the restrictions and covenants under the senior credit facility, senior notes or other debt financings could result in a default under those instruments, which, if left uncured, could lead to an event of default. Such an event of default could, among other things, result in all of its existing indebtedness to be immediately due and payable. Additionally, an event of default under one of the Company’s financing instruments could trigger cross-default provisions under the Company’s other financing instruments. The application of the remedies under the financing instruments could have a material adverse effect on the Company’s financial position.
The Company’s senior credit facility limits the amounts it can borrow to a borrowing base amount. The borrowing base is subject to review semi-annually; however, the lenders reserve the right to have one additional redetermination of the borrowing base per calendar year. Unscheduled redeterminations may be made at the Company’s request, but are limited to two requests per year. Borrowing base determinations are based upon proved developed producing reserves, proved developed non-producing reserves and proved undeveloped reserves. Outstanding borrowings exceeding the borrowing base must be repaid promptly, or the Company must pledge other oil and natural gas properties as additional collateral. The Company may not have the financial resources in the future to make any mandatory principal prepayments under the senior credit facility, which are required, for
35
example, when the committed line of credit is exceeded, proceeds of asset sales in new oil and natural gas properties are not reinvested, or indebtedness that is not permitted by the terms of the senior credit facility is incurred. If the indebtedness under the Company’s senior credit facility and senior notes were to be accelerated, the Company’s assets may not be sufficient to repay such indebtedness in full.
The Company’s derivative activities could result in financial losses and reduce earnings.
To achieve a more predictable cash flow and to reduce its exposure to adverse fluctuations in the prices of oil and natural gas, the Company currently has entered, and may in the future enter, into derivative contracts for a portion of its future oil and natural gas production, including fixed price swaps, collars and basis swaps. The Company has not designated and does not plan to designate any of its derivative contracts as hedges for accounting purposes and, as a result, records all derivative contracts on its balance sheet at fair value with changes in the fair value recognized in current period earnings. Accordingly, the Company’s earnings may fluctuate significantly as a result of changes in the fair value of its derivative contracts. Derivative contracts also expose the Company to the risk of financial loss in some circumstances, including when:
|
•
|
production is less than expected;
|
|
•
|
the counterparty to the derivative contract defaults on its contract obligations; or
|
|
•
|
the actual differential between the underlying price in the derivative contract and actual prices received is materially different from that expected.
|
In addition, these types of derivative contracts can limit the benefit the Company would receive from increases in the prices for oil and natural gas.
The Company’s drilling and services revenues depend on the needs of other companies in the oil and natural gas industry.
Companies to which the Company provides drilling and related services are affected by the oil and natural gas industry risks mentioned above. Market prices of oil, natural gas and NGLs, limited access to capital and reductions in capital expenditures could result in oil and natural gas companies canceling or curtailing their drilling programs, which could reduce the demand for the Company’s drilling and related services. Any prolonged reduction in the overall level of exploration and development activities, whether resulting from changes in oil, natural gas and NGL prices or otherwise, could impact the Company’s drilling and services segment by negatively affecting:
|
•
|
revenues, cash flow and profitability;
|
|
•
|
the Company’s ability to retain skilled rig personnel whom it would need in the event of an upturn in the demand for drilling and related services; and
|
|
•
|
the fair value of the Company’s rig fleet.
|
Oil and natural gas wells are subject to operational hazards that can cause substantial losses for which the Company may not be adequately insured.
There are a variety of operating risks inherent in oil, natural gas and NGL production and associated activities, such as fires, leaks, explosions, mechanical problems, major equipment failures, blowouts, uncontrollable flow of oil, natural gas and NGLs, water or drilling fluids, casing collapses, abnormally pressurized formations and natural disasters. The occurrence of any of these or similar accidents that temporarily or permanently halt the production and sale of oil, natural gas and NGLs at any of the Company’s properties could have a material adverse impact on its business activities, financial condition and results of operations.
Additionally, if any of such risks or similar accidents occur, the Company could incur substantial losses as a result of injury or loss of life, severe damage or destruction of property, natural resources and equipment, regulatory investigation and penalties and environmental damage and clean-up responsibility. If the Company experiences any of these problems, its ability to conduct operations could be adversely affected. While the Company maintains insurance coverage that it deems appropriate for these risks, its operations may result in liabilities exceeding such insurance coverage or liabilities not covered by insurance.
Shortages or increases in costs of equipment, services and qualified personnel could adversely affect the Company’s ability to execute its exploration and development plans on a timely basis and within its budget.
The demand for qualified and experienced personnel to conduct field operations, geologists, geophysicists, engineers and other professionals in the oil and natural gas industry can fluctuate significantly, often in correlation with oil and natural gas prices, causing periodic shortages. Additionally, higher oil and natural gas prices generally stimulate demand and result in increased prices
36
for drilling rigs, crews and associated supplies, equipment and services. Shortages of field personnel and equipment or price increases could significantly affect the Company’s ability to execute its exploration and development plans as projected.
Market conditions or operational impediments may hinder the Company’s access to oil, natural gas and NGL markets or delay production of oil, natural gas and NGLs.
Market conditions or a lack of satisfactory oil and natural gas transportation arrangements may hinder the Company’s access to oil, natural gas and NGL markets or delay production of oil, natural gas and NGLs. The availability of a ready market for the Company’s oil, natural gas and NGL production depends on a number of factors, including the demand for and supply of oil, natural gas and NGLs and the proximity of reserves to pipelines and terminal facilities. The Company’s ability to market its production depends, in substantial part, on the availability and capacity of gathering systems, pipelines and treating facilities for oil, natural gas and NGLs as well as gathering systems, treating facilities and disposal wells for water produced alongside the hydrocarbons. The Company’s failure to obtain such services on acceptable terms in the future or to expand its midstream assets could have a material adverse effect on its business. The Company may be required to shut in wells for a lack of a market or because access to natural gas pipelines, gathering system capacity, treating facilities or disposal wells may be limited or unavailable. The Company would be unable to realize revenue from any shut-in wells until production arrangements were made to deliver the production to market.
Competition in the oil and natural gas industry is intense, which may adversely affect the Company’s ability to succeed.
The oil and natural gas industry is intensely competitive, and the Company competes with many companies that have greater financial and other resources than it does. Many of these companies not only explore for and produce oil and natural gas, but also conduct refining operations and market petroleum and other products on a regional, national or worldwide basis. These companies may be able to pay more for productive oil and natural gas properties and exploratory prospects or identify, evaluate, bid for and purchase a greater number of properties and prospects than the Company’s financial or human resources permit. In addition, these companies may have a greater ability to continue exploration activities during periods of low oil and natural gas market prices. The Company’s larger competitors may be able to absorb the burden of present and future federal, state, local and other laws and regulations more easily than it can, which would adversely affect its competitive position.
The Company’s use of 2-D and 3-D seismic data is subject to interpretation and may not accurately identify the presence of oil and natural gas. In addition, the use of such technology requires greater predrilling expenditures, which could adversely affect the results of the Company’s drilling operations.
A significant aspect of the Company’s exploration and development plan involves seismic data. Even when properly used and interpreted, 2-D and 3-D seismic data and visualization techniques are only tools used to assist geoscientists in identifying subsurface structures and hydrocarbon indicators and do not enable the interpreter to know whether hydrocarbons are present in those structures. Other geologists and petroleum professionals, when studying the same seismic data, may have significantly different interpretations than the Company’s professionals. The Company’s drilling activities may not be geologically successful or economical, and its overall drilling success rate or its drilling success rate for activities in a particular area may not improve as a result of using 2-D and 3-D seismic data.
The use of 2-D and 3-D seismic and other advanced technologies requires greater predrilling expenditures than traditional drilling strategies, and the Company could incur losses due to such expenditures. In addition, the Company may often gather 2-D and 3-D seismic data over large areas. The Company’s interpretation of seismic data delineates for it those portions of an area that it believes are desirable for drilling. Therefore, the Company may choose not to acquire option or lease rights prior to acquiring seismic data, and in many cases, the Company may identify hydrocarbon indicators before seeking option or lease rights in the location. If the Company is not able to lease those locations on acceptable terms, it will have made substantial expenditures to acquire and analyze 2-D and 3-D seismic data without having an opportunity to attempt to benefit from those expenditures.
Low levels of natural gas production in the WTO, due to declines in production from existing wells and, depressed commodity prices, currently adversely affect, and could in the future adversely affect, revenues and cash flow from the Company’s midstream services segment, and are likely to adversely affect the Company’s ability to satisfy certain contractual obligations.
The Company has entered into long-term gas gathering agreements with each of PGC and Occidental. These agreements require the Company to annually deliver certain minimum volumes of natural gas to PGC through June 30, 2029 and CO
2
to Occidental through December 31, 2041 and to compensate PGC and Occidental to the extent it does not satisfy the contractual delivery requirements. Decreased production in the WTO, where the applicable natural gas assets are located, has resulted in, and is likely to continue to result in, a decline in the volume of natural gas and CO
2
delivered to PGC and Occidental, respectively, and to its own pipelines and facilities for gathering, transporting and treating. The Company has no control over many factors affecting production activity in the WTO, including prevailing and projected natural gas prices, demand for hydrocarbons, the
37
level of reserves, geological considerations, governmental regulation and the availability and cost of capital. As a result of these factors, the Company has not produced and delivered, and may continue to not produce and deliver, sufficient quantities of natural gas or CO
2
to meet its contractual delivery obligations to PGC and Occidental. The Company is required to compensate PGC and Occidental for shortfalls in its contractual delivery obligations. The Company accrued
$33.9 million
for its
2014
shortfalls under its contract with Occidental and expects to accrue between approximately
$31.0 million
and
$38.0 million
during the year ending December 31, 2015 for amounts related to the Company’s anticipated shortfall in meeting its 2015 annual delivery obligations to Occidental based on current projected natural gas production levels. In future years, amounts payable to PGC and/or Occidental for such shortfalls could be material. In addition, if the Company fails to connect new wells to its gathering systems, the amount of natural gas it gathers, transports and treats will decline substantially over time and could, upon exhaustion of the current wells, cause the Company to abandon its gathering systems and, possibly cease gathering, transporting and treating operations.
The Company is subject to complex federal, state, local and other laws and regulations that could adversely affect the cost, manner or feasibility of conducting its operations or expose it to significant liabilities.
The Company’s oil and natural gas exploration, production, transportation and treatment operations are subject to complex and stringent laws and regulations. In order to conduct its operations in compliance with these laws and regulations, the Company must obtain and maintain numerous permits, approvals and certificates from various federal, state and local governmental authorities. The Company may incur substantial costs in order to maintain compliance with these laws and regulations. As well as recent incidents involving the release of oil and natural gas and fluids as a result of drilling activities in the United States, there have been a variety of regulatory initiatives at the federal and state levels to restrict oil and natural gas drilling operations in certain locations. Any increased regulation or suspension of oil and natural gas exploration and production, or revision or reinterpretation of existing laws and regulations, that arises out of these incidents or otherwise could result in delays and higher operating costs. Such costs or significant delays could have a material adverse effect on the Company’s business, financial condition and results of operations. The Company must also comply with laws and regulations prohibiting fraud and market manipulations in energy markets. To the extent the Company is a shipper on interstate pipelines, it must comply with the tariffs of such pipelines and with federal policies related to the use of interstate capacity.
Laws and regulations governing oil and natural gas exploration and production may also affect production levels. The Company is required to comply with federal and state laws and regulations governing conservation matters, including provisions related to the unitization or pooling of the oil and natural gas properties; the establishment of maximum rates of production from wells; the spacing of wells; and the plugging and abandonment of wells. These and other laws and regulations can limit the amount of oil and natural gas the Company can produce from its wells, limit the number of wells it can drill, or limit the locations at which it can conduct drilling operations.
New laws or regulations, or changes to existing laws or regulations, may unfavorably impact the Company, could result in increased operating costs and could have a material adverse effect on the Company’s financial condition and results of operations. For example, Congress has recently considered, and may continue to consider, legislation that, if adopted in its proposed form, would subject companies involved in oil and natural gas exploration and production activities to, among other items, additional regulation of and restrictions on hydraulic fracturing of wells, and the elimination of certain U.S. federal tax preferences available with respect to oil and natural gas exploration and production activities. In addition, the Dodd-Frank Wall Street Reform and Consumer Protection Act (the “Dodd-Frank Act”) and rules promulgated thereunder could reduce trading positions in the energy futures or swaps markets and materially reduce hedging opportunities for the Company, which could adversely affect its revenues and cash flows during periods of low commodity prices, and which could adversely affect the Company’s ability to restructure its hedges when it might be desirable to do so.
Additionally, state and federal regulatory authorities may expand or alter applicable pipeline safety laws and regulations, compliance with which may increase capital costs for the Company and third-party downstream oil and natural gas transporters. These and other potential regulations could increase the Company’s operating costs, reduce its liquidity, delay its operations, increase direct and third-party post production costs or otherwise alter the way the Company conducts its business, which could have a material adverse effect on its financial condition, results of operations and cash flows and which could reduce cash received by or available for distribution, including any amounts paid by the Company for transportation on downstream interstate pipelines.
The Company’s operations are subject to environmental laws and regulations that could adversely affect the cost, manner or feasibility of conducting operations or result in significant costs and liabilities.
The Company’s oil and natural gas exploration and production operations are subject to stringent and comprehensive federal, state and local laws and regulations governing the discharge of materials into the environment or otherwise relating to environmental protection. These laws and regulations may impose numerous obligations that are applicable to operations, including the acquisition of a permit before conducting drilling; water withdrawal or waste disposal activities; the restriction of types,
38
quantities and concentration of materials that can be released into the environment; the limitation or prohibition of drilling activities on certain lands lying within wilderness, wetlands and other protected areas; the imposition of regulations designed to protect employees from exposure to hazardous substances; and the imposition of substantial liabilities for pollution resulting from operations. Numerous governmental authorities, such as the EPA and analogous state agencies, have the power to enforce compliance with these laws and regulations and the permits issued under them, often requiring difficult and costly actions. Failure to comply with these laws and regulations may result in litigation; the assessment of administrative, civil or criminal penalties; the imposition of investigatory or remedial obligations; and the issuance of injunctions limiting or preventing some or all of the Company’s operations.
There is inherent risk of incurring significant environmental costs and liabilities in the performance of the Company’s operations due to its handling of petroleum hydrocarbons and wastes, because of air emissions and wastewater discharges related to its operations, and as a result of historical industry operations and waste disposal practices. Under certain environmental laws and regulations, the Company could be subject to joint and several strict liability for the investigation, removal or remediation of previously released materials or property contamination regardless of whether it was responsible for the release or contamination or whether the operations were in compliance with all applicable laws at the time those actions were taken. Private parties, including the owners of properties upon which the Company’s wells are drilled and facilities where its petroleum hydrocarbons or wastes are taken for reclamation or disposal may also have the right to pursue legal actions to enforce compliance, as well as to seek damages for contamination even in the absence of non-compliance, with environmental laws and regulations or for personal injury, natural resources damage or property damage.
In addition, the risk of accidental spills or releases could expose the Company to significant liabilities that could have a material adverse effect on the Company’s financial condition or results of operations. Certain laws related to oil spills impose joint and several strict liability, without regard to fault, for all containment and oil removal costs and a variety of public and private damages including, but not limited to, the costs of responding to a release of oil, natural resource damages, and economic damages suffered by persons adversely affected by an oil spill. Although defenses exist to the liability imposed by those laws, they are limited. If an oil discharge or substantial threat of discharge were to occur, the Company may be liable for costs and damages, which costs and damages could be material to its results of operations and financial position.
Changes in environmental laws and regulations occur frequently, and any changes that result in more stringent or costly construction, drilling, water management, completion, waste handling, storage, transport, disposal or cleanup requirements could require significant expenditures by the Company to attain and maintain compliance and may otherwise have a material adverse effect on its results of operations, competitive position or financial condition. The Company may not be able to recover some or any of these costs from insurance. As a result of any increased cost of compliance, the Company may decide to discontinue drilling.
Recent listing of the lesser prairie chicken as a threatened species under the federal Endangered Species Act may serve to delay or limit the operations of the Company.
The Endangered Species Act, or ESA, and analogous state laws regulate activities that could have an adverse effect on threatened and endangered species. Exploratory and producing operations in areas where threatened or endangered species or their habitat are known to exist may require the Company to incur increased costs to implement mitigation or protective measures and also may delay, restrict or preclude drilling activities in those areas or during certain seasons, such as breeding and nesting seasons. On March 27, 2014, the Fish and Wildlife Service, or FWS, announced the listing of the lesser prairie chicken, whose habitat is over a five-state region, including Oklahoma, Kansas and Texas, where the Company operates, as a threatened species under the ESA. Listing of the lesser prairie chicken as threatened imposes restrictions on disturbances to critical habitat by landowners and drilling companies that would harass, harm or otherwise result in a “taking” of this species. However, the FWS also announced a final rule that will limit regulatory impacts on landowners and businesses from the listing if those landowners and businesses have entered into certain range-wide conservation planning agreements, such as those developed by the Western Association of Fish and Wildlife Agencies, (“WAFWA”), pursuant to which such parties agreed to take steps to protect the lesser prairie chicken’s habitat and to pay a mitigation fee if its actions harm the lesser prairie chicken’s habitat. The listing of the lesser prairie chicken as a threatened species, and entry into certain range-wide conservation planning agreements, could result in increased costs to the Company from species protection measures, as well as delays and restrictions on their drilling program activities.
Federal and state legislative and regulatory initiatives as well as governmental reviews relating to hydraulic fracturing could result in increased costs and additional operating restrictions or delays as well as adversely affect the Company’s level of production.
Hydraulic fracturing is an important and common practice that is used to stimulate production of hydrocarbons from tight formations, such as shales. The process involves the injection of water, sand and chemicals under pressure into formations to fracture the surrounding rock and stimulate production. Hydraulic fracturing is typically regulated by state oil and gas commissions. However, several federal agencies have asserted regulatory authority over certain aspects of the process. For example, the EPA
39
has issued final Clean Air Act regulations governing performance standards, including standards for the capture of air emissions released during hydraulic fracturing; announced its intent to propose by early 2015 effluent limit guidelines that waste water from shale gas extraction operations must meet before going to a treatment plant; and issued in May 2014 a prepublication of its Advance Notice of Proposed Rulemaking regarding Toxic Substances Control Act reporting of the chemical substances and mixtures used in hydraulic fracturing. Also, in May 2013, the Bureau of Land Management within the U.S. Department of the Interior issued a revised proposed rule containing disclosure requirements and other mandates for hydraulic fracturing on federal lands and the Department of the Interior is now analyzing comments to the proposed rulemaking and is expected to promulgate a final rule sometime in 2015. Also, from time to time, legislation has been introduced, but not enacted, in Congress to provide for federal regulation of hydraulic fracturing, including the underground disposal of fluids or propping agents associated with such fracturing activities and to require disclosure of the chemicals used in the fracturing process.
Certain states in which the Company operates, including Texas, Kansas and Oklahoma, and municipalities have adopted, or are considering adopting, regulations that have imposed, or that could impose, more stringent permitting, disclosure, disposal and well construction requirements on hydraulic fracturing operations. For example, in February 2012, the Railroad Commission of Texas implemented the Fracturing Disclosure Rule, requiring public disclosure of all the chemicals in fluids used in the hydraulic fracturing process. Local ordinances or other regulations may regulate or prohibit the performance of well drilling in general and hydraulic fracturing in particular. If new laws or regulations that significantly restrict or regulate hydraulic fracturing are adopted at either the state or the federal level, the Company’s fracturing activities could become subject to additional permit requirements, reporting requirements or operational restrictions and also to associated permitting delays, or additional costs could adversely affect the determination of whether a well is commercially viable. Restrictions on hydraulic fracturing could also reduce the amount of oil and natural gas that the Company is ultimately able to produce in commercial quantities.
In addition to asserting regulatory authority, a number of federal entities are analyzing, or have been requested to review, a variety of environmental issues associated with hydraulic fracturing. In April 2012, President Obama issued an executive order that established a working group for the purpose of coordinating policy, information sharing, and planning among federal agencies and offices regarding “unconventional natural gas production,” including hydraulic fracturing. In December 2012, the EPA issued an initial progress report on a study begun in 2011 of the potential environmental effects of hydraulic fracturing on drinking water and groundwater, with a draft final report expected to be issued for peer review and comment during 2015. The studies and initiatives described above, depending on their degree of pursuit and any meaningful results obtained, could spur efforts to further regulate hydraulic fracturing under the Safe Drinking Water Act or other regulatory mechanisms.
Legislation or regulatory initiatives intended to address seismic activity could restrict the Company’s ability to dispose of saltwater produced alongside the Company’s hydrocarbons, which could limit the Company’s ability to produce oil and gas economically.
The Company disposes of large volumes of saltwater produced alongside oil and natural gas in connection with its drilling and production operations, pursuant to permits issued to the Company by governmental authorities overseeing such disposal activities. While these permits are issued pursuant to existing laws and regulations, these legal requirements are subject to change, which could result in the imposition of more stringent operating constraints or new monitoring and reporting requirements, owing to, among other things, concerns of the public or governmental authorities regarding such gathering or disposal activities.
There exists a growing concern that the injection of saltwater into belowground disposal wells triggers seismic activity in certain areas, including Oklahoma, Kansas and Texas, where the Company operates. In response to these concerns, regulators in some states are pursuing initiatives designed to impose additional requirements in the permitting of saltwater disposal wells or otherwise to assess any relationship between seismicity and the use of such wells. For example, on October 28, 2014, the Texas Railroad Commission, or TRC, published a new rule governing permitting or re-permitting of disposal wells that would require, among other things, the submission of information on seismic events occurring within a specified radius of the disposal well location, as well as logs, geologic cross sections and structure maps relating to the disposal area in question. If the permittee or an applicant of a disposal well permit fails to demonstrate that the saltwater or other fluids are confined to the disposal zone or if scientific data indicates such a disposal well is likely to be or determined to be contributing to seismic activity, then the TRC may deny, modify, suspend or terminate the permit application or existing operating permit for that well.
Additionally, the governor of Kansas has established a task force composed of various administrative agencies to study and develop an action plan for addressing seismic activity in the state. The Task Force issued a recommended Seismic Action Plan calling for enhanced seismic monitoring and the development of a seismic response plan, and in November 2014, the governor of Kansas announced a plan to enhance seismic monitoring in the state. Similarly, in September 2014, the governor of Oklahoma announced the creation of a Coordinating Council on Seismic Activity, which is intended to help researchers, policymakers, regulators and oil and natural gas industry study seismicity in the state. The Utility and Environment Committee of the Oklahoma House of Representatives also held an interim study to examine what, if any, correlations exist between wastewater disposal wells
40
and seismic activity in the state. Although the committee did not recommend any policies, procedures or legislative items on the basis of the interim study, this does not foreclose the possibility of new law or regulations in the future. Finally, the Oklahoma Corporation Commission, or OCC, has exercised its regulatory authority to request that saltwater disposal wells be shut-in pending further review on two occasions, one of which was with respect to one of the Company’s disposal wells. There is no assurance that these wells will be allowed to resume disposal at any time, and the OCC may take similar action with respect to additional wells in the future.
The adoption and implementation of any new laws or regulations that restrict the Company’s ability to dispose of saltwater, by limiting volumes, disposal rates, disposal well locations or otherwise, or requiring the Company to shut down disposal wells, which could require the Company to shut in a substantial number of its oil and natural gas wells or otherwise have a material adverse effect on the Company’s ability to produce oil and gas economically and, accordingly, could materially and adversely affect the Company’s business, financial condition and results of operations.
Climate change laws and regulations restricting emissions of “greenhouse gases” could result in increased operating costs and reduced demand for the oil and natural gas that the Company produces while the physical effects of climate change could disrupt the Company’s production and cause the Company to incur significant costs in preparing for or responding to those effects.
In December 2009, the EPA published its findings that emissions of GHGs present a danger to public health and the environment because such gases are contributing to warming of the Earth’s atmosphere and other climatic changes. These findings allow the EPA to adopt and implement regulations that would restrict emissions of GHGs under existing provisions of the Clean Air Act. Accordingly, the EPA has adopted rules that require a reduction in emissions of GHGs from motor vehicles and also trigger Clean Air Act construction and operating permit review for GHG emissions from certain stationary sources. The EPA’s endangerment finding and GHG rules were upheld by the United States Court of Appeals for the D.C. Circuit in a June 2012 decision, and a petition for review of the case by the entire D.C. Circuit was denied in December 2012.
The EPA also has adopted rules requiring the reporting of GHG emissions from oil and natural gas production and processing facilities in the United States on an annual basis. The Company believes it has complied with all applicable reporting requirements to date. However, the adoption and implementation of any regulations imposing reporting obligations on, or limiting emissions of GHGs from, the Company’s equipment and operations could require it to incur additional costs to monitor, report and potentially reduce emissions of GHGs associated with its operations or could adversely affect demand for the oil and natural gas that it produces. Finally, to the extent increasing concentrations of GHGs in the Earth’s atmosphere may produce climate changes that could have significant physical effects, such as increased frequency and severity of storms, droughts, floods and other climatic events, such events could have a material adverse effect on the Company’s assets and operations, and potentially subject the Company to greater regulation.
In addition, Congress has considered legislation to reduce emissions of GHGs and more than half of the states have begun taking actions to control and/or reduce emissions of GHGs, primarily through the adoption of a climate change action plan, completion of GHG emission inventories and/or regional GHG cap and trade programs. Any future federal laws or implemented regulations that may be adopted to address GHG emissions could require the Company to incur increased operating costs, adversely affect demand for the oil and natural gas that the Company produces and have a material adverse effect on the Company’s business, financial condition and results of operations.
Repercussions from terrorist activities or armed conflict could harm the Company’s business.
Terrorist activities, anti-terrorist efforts or other armed conflict involving the United States or its interests abroad may adversely affect the United States and global economies and could prevent the Company from meeting its financial and other obligations. If events of this nature occur and persist, the attendant political instability and societal disruption could reduce overall demand for oil and natural gas, potentially putting downward pressure on prevailing oil and natural gas prices and causing a reduction in the Company’s revenues. Oil and natural gas production facilities, transportation systems and storage facilities could be direct targets of terrorist attacks, and/or operations could be adversely impacted if infrastructure integral to the Company’s operations is destroyed by such an attack. Costs for insurance and other security may increase as a result of these threats, and some insurance coverage may become more difficult to obtain, if available at all.
The Company’s failure to maintain an adequate system of internal control over financial reporting, could adversely affect its ability to accurately report its results.
Management is responsible for establishing and maintaining adequate internal control over financial reporting. The Company’s internal control over financial reporting is a process designed to provide reasonable assurance regarding the reliability of financial reporting and the preparation of financial statements in accordance with generally accepted accounting principles. A
41
material weakness is a deficiency, or a combination of deficiencies, in the Company’s internal control over financial reporting that results in a reasonable possibility that a material misstatement of the annual or interim financial statements will not be prevented or detected on a timely basis. Effective internal controls are necessary for the Company to provide reliable financial reports and deter and detect any material fraud. If the Company cannot provide reliable financial reports or prevent material fraud, its reputation and operating results would be harmed. The Company did not maintain effective internal control over financial reporting as of December 31, 2014, as further described in Item 9A—Controls and Procedures. The Company’s efforts to develop and maintain its internal controls and to remediate material weaknesses in its controls may not be successful, and it may be unable to maintain adequate controls over its financial processes and reporting in the future, including future compliance with the obligations under Section 404 of the Sarbanes-Oxley Act of 2002. Any failure to develop or maintain effective controls, or difficulties encountered in their implementation, including those related to acquired businesses, or other effective improvement of the Company’s internal controls could harm its operating results. Ineffective internal controls could also cause investors to lose confidence in the Company’s reported financial information.
Certain U.S. federal income tax preferences currently available with respect to oil and natural gas production may be eliminated as a result of future legislation.
The Obama administration’s budget proposals in recent years, including the budget proposal for fiscal year 2016, have included provisions eliminating certain key U.S. federal income tax preferences currently available to companies involved in oil and natural gas exploration and production. If enacted into law, these provisions would repeal certain incentives and credits applicable to taxpayers engaged in the exploration or production of oil and natural gas. These provisions include, but are not limited to (i) the repeal of current expensing of intangible drilling and development costs, (ii) the repeal of the percentage depletion allowance for oil and natural gas properties, (iii) the repeal of domestic manufacturing deduction for oil and natural gas production and (iv) the increase in the amortization period from two years to seven years for geological and geophysical costs paid or incurred in connection with the exploration for, or development of, oil and natural gas within the United States. It is unclear whether any similar provisions will be included in future budget proposals, whether such provisions will actually be enacted or how soon any such provisions would become effective if enacted. The passage of any legislation relating to such proposals or any other similar changes in U.S. federal income tax laws could negatively affect the Company’s financial condition and results of operations.
New derivatives legislation and regulation could adversely affect the Company’s ability to hedge risks associated with its business.
The Dodd-Frank Act created a new regulatory framework for oversight of derivatives transactions by the Commodity Futures Trading Commission (the “CFTC”) and the SEC. Among other things, the Dodd-Frank Act subjects certain swap participants to new capital, margin and business conduct standards. In addition, the Dodd-Frank Act contemplates that where appropriate in light of outstanding exposures, trading liquidity and other factors, swaps (broadly defined to include most hedging instruments other than futures) will be required to be cleared through a registered clearing facility and traded on a designated exchange or swap execution facility, unless the “end-user” exception from clearing applies. The Dodd-Frank Act also established a new Energy and Environmental Markets Advisory Committee to make recommendations to the CFTC regarding matters of concern to exchanges, firms, end users and regulators with respect to energy and environmental markets and also expands the CFTC’s power to impose position limits on specific categories of swaps (excluding swaps entered into for
bona fide
hedging purposes).
There are some exceptions to these requirements for entities that use swaps to hedge or mitigate commercial risk. However, although the Company may qualify for exceptions, its derivatives counterparties may be subject to new capital, margin and business conduct requirements imposed as a result of the Dodd-Frank Act, which may increase the Company’s transaction costs or make it more difficult for the Company to enter into hedging transactions on favorable terms. The Company’s inability to enter into hedging transactions on favorable terms, or at all, could increase its operating expenses and put it at increased exposure to risks of adverse changes in oil and natural gas prices, which could adversely affect the predictability of cash flows from sales of oil and natural gas.
In November 2011, the CFTC finalized rules to establish a position limits regime on certain “core” physical-delivery contracts and their economically equivalent derivatives, some of which reference major energy commodities, including oil and natural gas. However, in September 2012, the District Court of the District of Columbia vacated the CFTC’s rulemaking and remanded to the CFTC for further proceedings. On November 6, 2013, the CFTC re-proposed rules to establish a position limits regime on 28 “core” physical commodity contracts and their “economically equivalent” futures, options, and swaps, some of which reference major energy commodities, including oil and natural gas (“Position Limits Re-Proposal”), as well as amending the rules governing the aggregation of positions. Notably, the Position Limits Re-Proposal provides limited enumerated hedge exemptions from the position limits and a prescriptive process for requiring an exemption for non-enumerated hedges. The most recent comment period for the Position Limits Re-Proposal closed on January 22, 2015, but the final rules related to position limits are not yet in effect. To the extent the Position Limits Re-Proposal is finalized, such regulations could subject the Company or its derivatives
42
counterparties to limits on commodity positions and thereby have an adverse effect on its ability to hedge risks associated with its business or on the cost of its hedging activity.
Cyber-attacks or other failures in telecommunications or IT systems could result in information theft, data corruption and significant disruption of the Company’s business operations.
In recent years, the Company has increasingly relied on information technology (“IT”) systems and networks in connection with its business activities, including certain of its exploration, development and production activities. The Company relies on digital technology, including information systems and related infrastructure, as well as cloud applications and services, to, among other things, estimate quantities of oil and gas reserves, analyze seismic and drilling information, process and record financial and operating data and communicate with employees and third parties. As dependence on digital technologies has increased, cyber incidents, including deliberate attacks and attempts to gain unauthorized access to computer systems and networks, have increased in frequency and sophistication. These threats pose a risk to the security of the Company’s systems and networks, the confidentiality, availability and integrity of its data and the physical security of its employees and assets. The Company has experienced, and expects to continue to confront, attempts from hackers and other third parties to gain unauthorized access to its IT systems and networks. Although prior cyber-attacks have not had a material adverse impact on the Company’s operations or financial performance. There can be no assurance that the Company will be successful in preventing cyber-attacks or successfully mitigating their effect. Any cyber-attack could have a material adverse effect on the Company’s reputation, competitive position, business, financial condition and results of operations. Cyber-attacks or security breaches also could result in litigation or regulatory action, as well as significant additional expense to implement further data protection measures.
In addition to the risks presented to the Company’s systems and networks, cyber-attacks affecting oil and gas distribution systems maintained by third parties, or the networks and infrastructure on which they rely, could delay or prevent delivery to markets. A cyber-attack of this nature would be outside the Company’s ability to control, but could have a material, adverse effect on the Company’s business, financial condition and results of operations.
43
Item 1B.
Unresolved Staff Comments
None.
44
Item 2.
Properties
Information regarding the Company’s properties is included in Item 1.
45
Item 3.
Legal Proceedings
On April 5, 2011, Wesley West Minerals, Ltd. and Longfellow Ranch Partners, LP filed suit against the Company and SandRidge Exploration and Production, LLC (collectively, the “SandRidge Entities”) in the 83rd District Court of Pecos County, Texas. The plaintiffs, who have leased mineral rights to the SandRidge Entities in Pecos County, allege that the SandRidge Entities have not properly paid royalties on all volumes of natural gas and CO
2
produced from the acreage leased from the plaintiffs. The plaintiffs also allege that the SandRidge Entities have inappropriately failed to pay royalties on CO
2
produced from the plaintiffs’ acreage that results from the treatment of natural gas at the Century Plant. The plaintiffs seek approximately
$45.5 million
in actual damages for the period of time between January 2004 and December 2011, punitive damages and a declaration that the SandRidge Entities must pay royalties on CO
2
produced from the plaintiffs’ acreage that results from treatment of natural gas at the Century Plant. The Commissioner of the General Land Office of the State of Texas (“GLO”) is named as an additional defendant in the lawsuit as some of the affected oil and natural gas leases described in the plaintiffs’ allegations cover mineral classified lands in which the GLO is entitled to one-half of the royalties attributable to such leases. The GLO has filed a cross-claim against the SandRidge Entities asserting the same claims as the plaintiffs with respect to the leases covering mineral classified lands and seeking approximately
$13.0 million
in actual damages, inclusive of penalties and interest. On February 5, 2013, the Company received a favorable summary judgment ruling that effectively removes a majority of the plaintiffs’ and GLO’s claims. On April 29, 2013, the court entered an order allowing for an interlocutory appeal of its summary judgment ruling.
The plaintiffs appealed the rulings to the Texas Court of Appeals in El Paso. On November 19, 2014, that Court issued its opinion, which affirmed the trial court’s summary judgment rulings in part, but reversing them in part. The Court of Appeals affirmed the summary judgment rulings in the SandRidge Entities’ favor against the GLO. The Court also affirmed the summary judgment rulings in the SandRidge Entities’ favor against Wesley West Minerals, Ltd., on the largest oil and gas lease involved in the case, which accounted for much of the total damages the plaintiffs are claiming. The Court reversed certain rulings on other leases, thus deciding those matters for the plaintiffs. It is anticipated that the plaintiffs will seek rehearing by the Court of Appeals and possibly petition the Supreme Court of Texas for review of the Court of Appeals’ decision.
The Company intends to continue to defend the remaining issues in the trial court, as well as future appellate proceedings. At the time of the rulings on summary judgment, the lawsuit was still in the discovery stage and, accordingly, an estimate of reasonably possible losses, if any, associated with the remaining causes of action and those rulings reversed by the Court of Appeals cannot be made until all of the facts, circumstances and legal theories relating to such claims and the SandRidge Entities’ defenses are fully disclosed and analyzed. The Company has not established any reserves relating to this action.
On August 4, 2011, Patriot Exploration, LLC, Jonathan Feldman, Redwing Drilling Partners, Mapleleaf Drilling Partners, Avalanche Drilling Partners, Penguin Drilling Partners and Gramax Insurance Company Ltd. filed a lawsuit against the Company, SandRidge Exploration and Production, LLC (“SandRidge E&P”) and certain current and former directors and senior executive officers of the Company (collectively, the “defendants”) in the U.S. District Court for the District of Connecticut. On October 28, 2011, the plaintiffs filed an amended complaint alleging substantially the same allegations as those contained in the original complaint. The plaintiffs allege that the defendants made false and misleading statements to U.S. Drilling Capital Management LLC and to the plaintiffs prior to the entry into a participation agreement among Patriot Exploration, LLC, U.S. Drilling Capital Management LLC and SandRidge E&P, which provided for the investment by the plaintiffs in certain of SandRidge E&P’s oil and natural gas properties. To date, the plaintiffs have invested approximately
$16.0 million
under the participation agreement. The plaintiffs seek compensatory and punitive damages and rescission of the participation agreement. On November 28, 2011, the defendants filed a motion to dismiss the amended complaint. On June 29, 2013, the court granted in part and denied in part the defendants’ motion. The Company and the other defendants intend to defend this lawsuit vigorously and believe the plaintiffs’ claims are without merit. This lawsuit is in the early stages and, accordingly, an estimate of reasonably possible losses associated with this action, if any, cannot be made until the facts, circumstances and legal theories relating to the plaintiffs' claims and the defendants’ defenses are fully disclosed and analyzed. The Company has not established any reserves relating to this action.
Between December 2012 and March 2013, seven putative shareholder derivative actions were filed in state and federal court in Oklahoma:
|
•
|
Arthur I. Levine v. Tom L. Ward, et al., and SandRidge Energy, Inc., Nominal Defendant - filed on December 19, 2012 in the U.S. District Court for the Western District of Oklahoma
|
|
•
|
Deborah Depuy v. Tom L. Ward, et al., and SandRidge Energy, Inc., Nominal Defendant - filed on January 22, 2013 in the U.S. District Court for the Western District of Oklahoma
|
|
•
|
Paul Elliot, on Behalf of the Paul Elliot IRA R/O, v. Tom L. Ward, et al., and SandRidge Energy, Inc., Nominal Defendant - filed on January 29, 2013 in the U.S. District Court for the Western District of Oklahoma
|
46
|
•
|
Dale Hefner v. Tom L. Ward, et al., and SandRidge Energy, Inc., Nominal Defendant - filed on January 4, 2013 in the District Court of Oklahoma County, Oklahoma
|
|
•
|
Rocky Romano v. Tom L. Ward, et al., and SandRidge Energy, Inc., Nominal Defendant - filed on January 22, 2013 in the District Court of Oklahoma County, Oklahoma
|
|
•
|
Joan Brothers v. Tom L. Ward, et al., and SandRidge Energy, Inc., Nominal Defendant - filed on February 15, 2013 in the U.S. District Court for the Western District of Oklahoma
|
|
•
|
Lisa Ezell, Jefferson L. Mangus, and Tyler D. Mangus v. Tom L. Ward, et al., and SandRidge Energy, Inc., Nominal Defendant - filed on March 22, 2013 in the U.S. District Court for the Western District of Oklahoma
|
Each lawsuit identified above was filed derivatively on behalf of the Company and names as defendants current and former directors of the Company. The Hefner lawsuit also names as defendants certain current and former directors and senior executive officers of the Company. All seven lawsuits assert overlapping claims - generally that the defendants breached their fiduciary duties, mismanaged the Company, wasted corporate assets, and engaged in, facilitated or approved self-dealing transactions in breach of their fiduciary obligations. The Depuy lawsuit also alleges violations of federal securities laws in connection with the Company allegedly filing and distributing certain misleading proxy statements. The lawsuits seek, among other relief, injunctive relief related to the Company’s corporate governance and unspecified damages.
On April 10, 2013, the U.S. District Court for the Western District of Oklahoma consolidated the Levine, Depuy, Elliot, Brothers, and Ezell actions (the “Federal Shareholder Derivative Litigation”) under the caption “In re SandRidge Energy, Inc. Shareholder Derivative Litigation,” appointed a lead plaintiff and lead counsel, and ordered the lead plaintiff to file a consolidated complaint by May 1, 2013. On June 3, 2013, the Company and the individual defendants filed their respective motions to dismiss the consolidated complaint. On September 11, 2013, the court granted the defendants’ respective motions to dismiss the consolidated complaint without prejudice, and granted plaintiffs leave to file an amended consolidated complaint. The plaintiffs filed an amended consolidated complaint on October 9, 2013, in which plaintiffs allege that: (i) the Company’s former Chief Executive Officer (“CEO”), Tom Ward, breached his fiduciary duties by usurping corporate opportunities, (ii) certain of the Company’s current and former directors breached their fiduciary duties of care, (iii) Mr. Ward and certain of the Company’s current and former directors wasted corporate assets, (iv) certain entities allegedly affiliated with Mr. Ward aided and abetted Mr. Ward’s breaches of fiduciary duties, (v) Mr. Ward and entities allegedly affiliated with Mr. Ward misappropriated the Company’s confidential and proprietary information, and (vi) entities allegedly affiliated with Mr. Ward were unjustly enriched. On November 15, 2013, the Company and the individual defendants filed their respective motions to dismiss the amended consolidated complaint. On September 22, 2014, the court denied the motion to dismiss filed on behalf of the Company and the director defendants. The court also granted in part and denied in part the respective motions to dismiss filed on behalf of the other defendants.
On September 26, 2014, the Board of Directors for the Company formed a Special Litigation Committee (“SLC”), composed of two independent and disinterested Company directors, and delegated absolute and final authority to the SLC to review and investigate the claims alleged by the plaintiffs in the Federal Shareholder Derivative Litigation and in the Hefner action, and to determine whether and how those claims should be asserted on the Company’s behalf.
The Company and the individual defendants in the Hefner and Romano actions (the “State Shareholder Derivative Litigation”) moved to stay each of the actions in favor of the Federal Shareholder Derivative Litigation, in order to avoid duplicative proceedings, and also requested, in the alternative, the dismissal of the State Shareholder Derivative Litigation.
On June 19, 2013, the court stayed the Hefner action until at least November 29, 2013. The court subsequently lifted its stay for purposes of hearing and deciding the defendants’ respective motions to dismiss. On September 18, 2013, the court denied the defendants’ motions to dismiss. The parties have agreed to stay this action pending the review and investigation by the SLC of the claims alleged by the plaintiffs in the Federal Shareholder Derivative Litigation and in this action, and to determine whether and how those claims should be asserted on the Company’s behalf.
On May 8, 2013, the court stayed the Romano action pending further order of the court. On October 31, 2013, the plaintiff filed a motion to lift the stay, which was denied by the court on February 7, 2014. On October 29, 2014, the court granted plaintiff’s application to dismiss the action without prejudice.
47
Because the Federal Shareholder Derivative Litigation and the State Shareholder Derivative Litigation are in the early stages, an estimate of reasonably possible losses associated with each of them, if any, cannot be made until the facts, circumstances and legal theories relating to the plaintiffs’ claims and the defendants’ defenses are fully disclosed and analyzed. The Company has not established any reserves relating to these actions.
On December 5, 2012, James Glitz and Rodger A. Thornberry, on behalf of themselves and all other similarly situated stockholders, filed a putative class action complaint in the U.S. District Court for the Western District of Oklahoma against SandRidge Energy, Inc. and certain current and former executive officers of the Company. On January 4, 2013, Louis Carbone, on behalf of himself and all other similarly situated stockholders, filed a substantially similar putative class action complaint in the same court and against the same defendants. On March 6, 2013, the court consolidated these two actions under the caption “In re SandRidge Energy, Inc. Securities Litigation” (the “Securities Litigation”) and appointed a lead plaintiff and lead counsel. On July 23, 2013, plaintiffs filed a consolidated amended complaint, which asserts a variety of federal securities claims against the Company and certain of its current and former officers and directors, among other defendants, on behalf of a putative class of (a) purchasers of SandRidge common stock during the period from February 24, 2011 to November 8, 2012, (b) purchasers of common units of the Mississippian Trust I in or traceable to its initial public offering on or about April 12, 2011, and (c) purchasers of common units of the Mississippian Trust II (together with the Mississippian Trust I, the “Mississippian Trusts”) in or traceable to its initial public offering on or about April 23, 2012. The claims are based on allegations that the Company, certain of its current and former officers and directors, and the Mississippian Trusts, among other defendants, are responsible for making false and misleading statements, and omitting material information, concerning a variety of subjects, including oil and natural gas reserves, the Company’s capital expenditures, and certain transactions entered into by companies allegedly affiliated with the Company’s former CEO Tom Ward. The defendants have filed respective motions to dismiss the consolidated amended complaint, which are pending before the court. Because the Securities Litigation is in the early stages, an estimate of reasonably possible losses associated with it, if any, cannot be made until the facts, circumstances and legal theories relating to the plaintiffs’ claims and the defendants’ defenses are fully disclosed and analyzed. The Company has not established any reserves relating to the Securities Litigation. Each of the Mississippian Trusts has requested that the Company indemnify it for any losses it may incur in connection with the Securities Litigation.
On July 15, 2013, James Hart and 15 other named plaintiffs filed an amended complaint in the United States District Court for the District of Kansas in an action undertaken individually and on behalf of others similarly situated against SandRidge Energy, Inc., SandRidge Operating Company, SandRidge E&P, SandRidge Midstream, Inc., and Lariat Services, Inc. In their Amended Complaint, plaintiffs allege that the defendants failed to properly calculate overtime pay for the plaintiffs and for other similarly situated current and former employees. The plaintiffs further allege that the defendants required the plaintiffs and other similarly situated current and former employees to engage in work-related activities without pay. The plaintiffs assert claims against the defendants for (i) violations of the Fair Labor Standards Act, (ii) violations of the Kansas Wage Payment Act, (iii) breach of contract, and (iv) fraud, and seek to recover unpaid wages and overtime pay, liquidated damages, statutory penalties, economic damages, compensatory and punitive damages, attorneys’ fees and costs, and both pre- and post-judgment interest.
On October 3, 2013, the plaintiffs filed a Motion for Conditional Collective Action Certification and for Judicial Notice to the Class and a Motion to Toll the Statute of Limitations. On October 11, 2013, the defendants filed a Motion to Dismiss and a Motion to Transfer Venue to the United States District Court for the Western District of Oklahoma. All of these motions are pending before the court.
On April 2, 2014, the court granted the defendants’ Motion to Dismiss and granted plaintiffs leave to file an amended complaint by April 16, 2014, which they did on such date. On July 1, 2014, the court granted plaintiffs’ Motion for Conditional Collective Action Certification and for Judicial Notice to the Class, and denied plaintiffs’ Motion to Toll the Statute of Limitations. The Company and the other defendants intend to defend this lawsuit vigorously. This lawsuit is in the early stages and, accordingly, an estimate of reasonably possible losses associated with this action, if any, cannot be made until the facts, circumstances and legal theories relating to the plaintiffs’ claims and the defendants’ defenses are fully disclosed and analyzed. The Company has not established any reserves relating to this action.
On
December 18, 2013
,
the Company received a subpoena duces tecum from the U.S. Department of Justice in connection with an ongoing
investigation of possible violations of antitrust laws in connection with the purchase or lease of land, oil or natural gas rights. The Company is cooperating with the investigation.
On November 10, 2014, a class action complaint was filed in the U. S. District Court for the Western District of Oklahoma against certain current and former directors and officers of the Company in the case styled Steve Surbaugh vs. SandRidge Energy, Inc., Tom L. Ward, James D. Bennett, Eddie M. LeBlanc, and Randall D. Cooley. The complaint asserts a federal securities class action on behalf of a putative class consisting of all persons other than defendants who purchased SandRidge securities between March 1, 2013, through November 4, 2014, seeking to recover damages allegedly caused by the defendants’ violations of federal
48
securities laws under Sections 10(b) and 20(a) of the Securities Exchange Act of 1934, and Rule 10b-5 promulgated thereunder. The complaint alleges that, throughout the class period, the defendants made materially false and misleading statements regarding SandRidge’s business, operations and future prospects because such statements failed to properly account for the penalties SandRidge accrued under its treating agreement with Occidental Petroleum Corporation and, as a result, SandRidge’s financial statements were materially false and misleading during the class period. An estimate of reasonably possible losses associated with this action cannot be made at this time. The Company has not established any reserves relating to this action.
On November 11, 2014, a class action complaint was filed in the U. S. District Court for the Western District of Oklahoma against certain current and former directors and officers of the Company in the case styled Steven T. Dakil vs. SandRidge Energy, Inc., Tom L. Ward, James D. Bennett, and Eddie M. LeBlanc. The complaint asserts a federal securities class action on behalf of a putative class consisting of all persons other than defendants who purchased or otherwise acquired SandRidge securities between February 28, 2013, and November 3, 2014, seeking to recover damages allegedly caused by the defendants’ violations of federal securities laws under Sections 10(b) and 20(a) of the Securities Exchange Act of 1934, and Rule 10b-5 promulgated thereunder. The complaint alleges that, throughout the class period, defendants made materially false and misleading statements regarding SandRidge’s business, operational and compliance policies. Specifically, plaintiff alleges that defendants made false and/or misleading statements and/or failed to disclose that: (i) SandRidge was improperly accounting for penalties owed to Occidental Petroleum Corp. under a treating agreement on an annual basis when it was required to do so on a quarterly basis; (ii) SandRidge's quarterly and annual financial and operating results for the periods ending December 31, 2012 through June 30, 2014, were overstated and required restatement; (iii) defendant Ward engaged in improper related party transactions; (iv) SandRidge lacked proper internal controls over financial reporting; and (v) as a result of the foregoing, SandRidge’s financial statements were materially false and misleading during the class period. An estimate of reasonably possible losses associated with this action cannot be made at this time. The Company has not established any reserves relating to this action.
In addition to the litigation described above, the Company is a defendant in lawsuits from time to time in the normal course of business. While the results of litigation and claims cannot be predicted with certainty, the Company believes the reasonably possible losses of such matters, individually and in the aggregate, are not material. Additionally, the Company believes the probable final outcome of such matters will not have a material adverse effect on the Company’s consolidated financial position, results of operations, cash flows or liquidity.
49
Item 4.
Mine Safety Disclosures
Not applicable.
50
|
Item 5.
|
Market for Registrant’s Common Equity, Related Stockholder Matters and Issuer Purchases of Equity Securities
|
PRICE RANGE OF COMMON STOCK
The Company’s common stock is listed on the New York Stock Exchange (“NYSE”) under the symbol “SD.” The range of high and low sales prices for its common stock for the periods indicated, as reported by the NYSE, is as follows:
|
High
|
Low
|
||||||
|
2014
|
|||||||
|
Fourth Quarter
|
$
|
4.80
|
|
$
|
1.50
|
|
|
|
Third Quarter
|
$
|
7.20
|
|
$
|
4.10
|
|
|
|
Second Quarter
|
$
|
7.43
|
|
$
|
6.07
|
|
|
|
First Quarter
|
$
|
6.75
|
|
$
|
5.59
|
|
|
|
2013
|
|||||||
|
Fourth Quarter
|
$
|
6.96
|
|
$
|
5.21
|
|
|
|
Third Quarter
|
$
|
5.99
|
|
$
|
4.72
|
|
|
|
Second Quarter
|
$
|
5.60
|
|
$
|
4.52
|
|
|
|
First Quarter
|
$
|
7.47
|
|
$
|
5.05
|
|
|
On
February 20, 2015
, there were
278
record holders of the Company’s common stock.
The Company has neither declared nor paid any cash dividends on its common stock, and it does not anticipate declaring any dividends on its common stock in the foreseeable future. The Company expects to retain cash for the operation and expansion of its business, including exploration, development and production activities. In addition, the terms of the Company’s indebtedness restrict its ability to pay dividends to holders of its common stock. Accordingly, if the Company’s dividend policy were to change in the future, its ability to pay dividends would be subject to these restrictions and the Company’s then-existing conditions, including its results of operations, financial condition, contractual obligations, capital requirements, business prospects and other factors deemed relevant by its Board of Directors.
51
PERFORMANCE GRAPH
The following graph compares the cumulative total return to stockholders on SandRidge common stock relative to the cumulative total returns of the S&P Oil and Gas Exploration and Production Index and the S&P 500 Index from January 1, 2010 through December 31, 2014. The graph assumes that the value of the investment in the Company’s common stock and in each of the indexes was $100.00 on January 1, 2010.
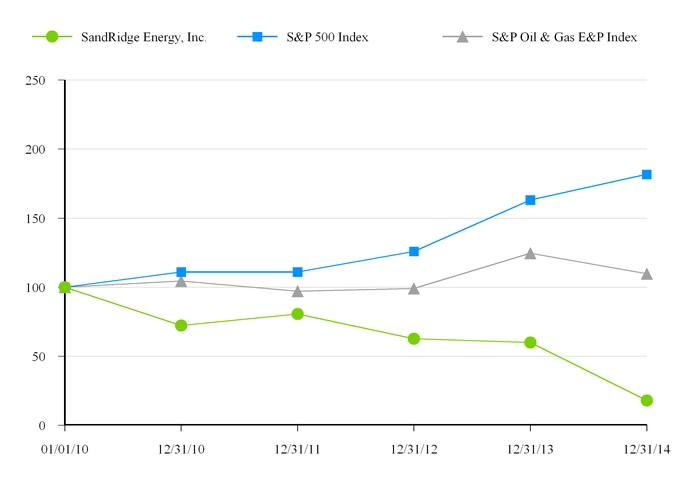
The performance graph above is furnished and not filed for purposes of Section 18 of the Exchange Act and will not be incorporated by reference into any registration statement filed under the Securities Act unless specifically identified therein as being incorporated therein by reference. The performance graph is not soliciting material subject to Regulation 14A.
52
ISSUER PURCHASES OF EQUITY SECURITIES
The following table presents a summary of share repurchases made by the Company during the three-month period ended
December 31, 2014
.
|
Total Number of Shares Purchased(1)(2)
|
Average Price
Paid per Share
|
Total Number of Shares Purchased as Part of Publicly Announced Program(2)
|
Maximum Approximate Dollar Value of Shares that May Yet Be Purchased Under the Program (In millions)
|
||||||||||
|
Period
|
|||||||||||||
|
October 1, 2014 — October 31, 2014
|
23,919,390
|
|
$
|
3.92
|
|
23,911,000
|
|
$
|
88.7
|
|
|||
|
November 1, 2014 — November 30, 2014
|
7,488
|
|
$
|
3.90
|
|
N/A
|
|
N/A
|
|
||||
|
December 1, 2014 — December 31, 2014
|
14,642
|
|
$
|
1.93
|
|
N/A
|
|
N/A
|
|
||||
|
Total
|
23,941,520
|
|
23,911,000
|
|
|||||||||
____________________
|
(1)
|
Includes shares of common stock tendered by employees in order to satisfy tax withholding requirements upon vesting of their stock awards. Shares withheld are initially recorded as treasury shares, then immediately retired. For the three-month period ended
December 31, 2014
,
30,520
shares were reacquired at a weighted average price per share of
$3.02
to satisfy tax obligations for vested employee stock awards.
|
|
(2)
|
Includes shares of common stock repurchased pursuant to a program approved by the Company’s Board of Directors and announced on September 4, 2014. Under the terms of the program, the Company may repurchase up to $200.0 million of the Company’s common stock. There is no fixed termination date for this repurchase program, which may be suspended or discontinued at any time.
|
53
Item 6.
Selected Financial Data
The following table sets forth, as of the dates and for the periods indicated, the Company’s selected financial information. The Company’s financial information is derived from its audited consolidated financial statements for such periods. The financial data includes the results of the Company’s acquisitions and divestitures, including the divestiture of the Gulf Properties in February 2014, the divestiture of the Permian Properties in February 2013, the acquisition of oil and natural gas properties in the Gulf of Mexico in June 2012, the acquisition of oil and natural gas properties in the Gulf of Mexico from Dynamic Offshore Resources LLC (the “Dynamic Acquisition”) in April 2012 and the acquisition of Arena Resources, Inc. in July 2010. The information should be read in conjunction with “Management’s Discussion and Analysis of Financial Condition and Results of Operations” in Item 7 of this report and the Company’s consolidated financial statements and notes thereto contained in “Financial Statements and Supplementary Data” in Item 8 of this report. The following information is not necessarily indicative of the Company’s future results.
|
|
Year Ended December 31,
|
||||||||||||||||||
|
|
2014
|
2013
|
2012
|
2011
|
2010
|
||||||||||||||
|
|
(In thousands, except per share data)
|
||||||||||||||||||
|
Statement of Operations Data
|
|||||||||||||||||||
|
Revenues
|
$
|
1,558,758
|
|
$
|
1,983,388
|
|
$
|
1,934,642
|
|
$
|
1,415,213
|
|
$
|
931,736
|
|
||||
|
Expenses
|
|||||||||||||||||||
|
Production
|
346,088
|
|
516,427
|
|
477,154
|
|
322,877
|
|
237,863
|
|
|||||||||
|
Production taxes
|
31,731
|
|
32,292
|
|
47,210
|
|
46,069
|
|
29,170
|
|
|||||||||
|
Cost of sales
|
56,155
|
|
57,118
|
|
68,227
|
|
65,654
|
|
22,368
|
|
|||||||||
|
Midstream and marketing
|
49,905
|
|
53,644
|
|
39,669
|
|
66,007
|
|
90,149
|
|
|||||||||
|
Construction contract
|
—
|
|
23,349
|
|
—
|
|
—
|
|
—
|
|
|||||||||
|
Depreciation and depletion—oil and natural gas
|
434,295
|
|
567,732
|
|
568,029
|
|
317,246
|
|
265,914
|
|
|||||||||
|
Depreciation and amortization—other
|
59,636
|
|
62,136
|
|
60,805
|
|
53,630
|
|
50,776
|
|
|||||||||
|
Accretion of asset retirement obligations
|
9,092
|
|
36,777
|
|
28,996
|
|
9,368
|
|
9,421
|
|
|||||||||
|
Impairment
|
192,768
|
|
26,280
|
|
316,004
|
|
2,825
|
|
—
|
|
|||||||||
|
General and administrative(1)
|
122,865
|
|
330,425
|
|
241,682
|
|
148,643
|
|
179,565
|
|
|||||||||
|
(Gain) loss on derivative contracts
|
(334,011
|
)
|
47,123
|
|
(241,419
|
)
|
(44,075
|
)
|
50,872
|
|
|||||||||
|
Loss (gain) on sale of assets
|
10
|
|
399,086
|
|
3,089
|
|
(2,044
|
)
|
2,424
|
|
|||||||||
|
Total expenses
|
968,534
|
|
|
2,152,389
|
|
1,609,446
|
|
986,200
|
|
938,522
|
|
||||||||
|
Income (loss) from operations
|
590,224
|
|
|
(169,001
|
)
|
325,196
|
|
429,013
|
|
(6,786
|
)
|
||||||||
|
Other income (expense)
|
|||||||||||||||||||
|
Interest expense
|
(244,109
|
)
|
(270,234
|
)
|
(303,349
|
)
|
(237,332
|
)
|
(247,442
|
)
|
|||||||||
|
Bargain purchase gain
|
—
|
|
—
|
|
122,696
|
|
—
|
|
—
|
|
|||||||||
|
Loss on extinguishment of debt
|
—
|
|
(82,005
|
)
|
(3,075
|
)
|
(38,232
|
)
|
—
|
|
|||||||||
|
Other income, net
|
3,490
|
|
12,445
|
|
4,741
|
|
3,122
|
|
2,558
|
|
|||||||||
|
Total other expense
|
(240,619
|
)
|
|
(339,794
|
)
|
(178,987
|
)
|
(272,442
|
)
|
(244,884
|
)
|
||||||||
|
Income (loss) before income taxes
|
349,605
|
|
|
(508,795
|
)
|
146,209
|
|
156,571
|
|
(251,670
|
)
|
||||||||
|
Income tax (benefit) expense
|
(2,293
|
)
|
5,684
|
|
(100,362
|
)
|
(5,817
|
)
|
(446,680
|
)
|
|||||||||
|
Net income (loss)
|
351,898
|
|
|
(514,479
|
)
|
246,571
|
|
162,388
|
|
195,010
|
|
||||||||
|
Less: net income attributable to noncontrolling interest
|
98,613
|
|
39,410
|
|
105,000
|
|
54,323
|
|
4,445
|
|
|||||||||
|
Net income (loss) attributable to SandRidge Energy, Inc.
|
253,285
|
|
|
(553,889
|
)
|
141,571
|
|
108,065
|
|
190,565
|
|
||||||||
|
Preferred stock dividends
|
50,025
|
|
55,525
|
|
55,525
|
|
55,583
|
|
37,442
|
|
|||||||||
|
Income available (loss applicable) to SandRidge Energy, Inc. common stockholders
|
$
|
203,260
|
|
|
$
|
(609,414
|
)
|
$
|
86,046
|
|
$
|
52,482
|
|
$
|
153,123
|
|
|||
|
Earnings (loss) per share
|
|||||||||||||||||||
|
Basic
|
$
|
0.42
|
|
$
|
(1.27
|
)
|
$
|
0.19
|
|
$
|
0.13
|
|
$
|
0.52
|
|
||||
|
Diluted
|
$
|
0.42
|
|
$
|
(1.27
|
)
|
$
|
0.19
|
|
$
|
0.13
|
|
$
|
0.52
|
|
||||
|
Weighted average number of common shares outstanding
|
|||||||||||||||||||
|
Basic
|
479,644
|
|
481,148
|
|
453,595
|
|
398,851
|
|
291,869
|
|
|||||||||
|
Diluted
|
499,743
|
|
481,148
|
|
456,015
|
|
406,645
|
|
315,349
|
|
|||||||||
____________________
|
(1)
|
Includes employee termination benefits.
|
54
|
|
As of December 31,
|
||||||||||||||||||
|
|
2014
|
2013
|
2012
|
2011
|
2010
|
||||||||||||||
|
|
(In thousands)
|
||||||||||||||||||
|
Balance Sheet Data
|
|||||||||||||||||||
|
Cash and cash equivalents
|
$
|
181,253
|
|
$
|
814,663
|
|
$
|
309,766
|
|
$
|
207,681
|
|
$
|
5,863
|
|
||||
|
Property, plant and equipment, net
|
$
|
6,215,057
|
|
$
|
6,307,675
|
|
$
|
8,479,977
|
|
$
|
5,389,424
|
|
$
|
4,733,865
|
|
||||
|
Total assets
|
$
|
7,259,225
|
|
$
|
7,684,795
|
|
$
|
9,790,731
|
|
$
|
6,219,609
|
|
$
|
5,231,448
|
|
||||
|
Total debt
|
$
|
3,195,436
|
|
$
|
3,194,907
|
|
$
|
4,301,083
|
|
$
|
2,814,176
|
|
$
|
2,909,086
|
|
||||
|
Total equity
|
$
|
3,209,820
|
|
$
|
3,175,627
|
|
$
|
3,862,455
|
|
$
|
2,548,950
|
|
$
|
1,547,483
|
|
||||
|
Total liabilities and equity
|
$
|
7,259,225
|
|
$
|
7,684,795
|
|
$
|
9,790,731
|
|
$
|
6,219,609
|
|
$
|
5,231,448
|
|
||||
There have been no cash dividends declared or paid on the Company’s common stock.
55
Item 7.
Management’s Discussion and Analysis of Financial Condition and Results of Operations
The following discussion and analysis is intended to help the reader understand the Company’s business, financial condition, results of operations, liquidity and capital resources. This discussion and analysis should be read in conjunction with other sections of this report, including: “Business” in Item 1, “Selected Financial Data” in Item 6 and “Financial Statements and Supplementary Data” in Item 8. The Company’s discussion and analysis includes the following subjects:
|
•
|
Overview;
|
|
•
|
Results by Segment;
|
|
•
|
Consolidated Results of Operations;
|
|
•
|
Liquidity and Capital Resources;
|
|
•
|
Valuation Allowance; and
|
|
•
|
Critical Accounting Policies and Estimates.
|
Overview
SandRidge Energy, Inc. is an oil and natural gas company with a principal focus on exploration and production activities in the Mid-Continent region of the United States. The Company’s mission is to become a high-return, growth-oriented resource conversion company in the Mid-Continent where it has determined it has competitive advantages, such as an industry leading cost structure, subsurface knowledge, existing infrastructure and broader infrastructure capabilities and size and scale. As discussed further below under “Divestitures” the Company sold the majority of its Permian Basin assets in 2013 and its Gulf Properties in 2014 and has used the proceeds from those transactions to reduce outstanding long-term debt and fund drilling and development in its core area of focus.
The Company also operates businesses and infrastructure systems that are complementary to its primary exploration and production activities, including gas gathering and processing facilities, marketing operations, a saltwater gathering and disposal system, an electrical transmission system and a drilling and related oil field services business.
Divestitures
Permian Properties.
On February 26, 2013, the Company sold the Permian Properties for
$2.6 billion
. The Company used a portion of the sale proceeds to fund the redemption of approximately $1.1 billion aggregate principal amount of outstanding senior notes, discussed in “Liquidity and Capital Resources,” and used the remaining proceeds to fund its capital expenditures in the Mid-Continent and for general corporate purposes. The Company recorded a non-cash loss on the sale of
$398.9 million
, of which
$71.7 million
was allocated to noncontrolling interests. Additionally, the Company settled a portion of its existing oil derivative contracts in February 2013 prior to their respective maturities to reduce volumes hedged in proportion to the anticipated reduction in daily production volumes due to the sale, which resulted in the Company making cash payments of approximately $
29.6 million
.
Production, revenues and direct operating expenses of the Permian Properties were as follows as of and for the years ended December 31, 2013 and 2012:
|
Year Ended December 31,
|
|||||||
|
2013(1)
|
2012
|
||||||
|
Production (MBoe)
|
1,148
|
|
8,667
|
|
|||
|
Revenues (in thousands)
|
$
|
68,027
|
|
$
|
566,075
|
|
|
|
Direct operating expenses (in thousands)
|
$
|
17,453
|
|
$
|
130,337
|
|
|
_________________
(1) Includes activity through February 26, 2013, the date of sale.
56
Gulf of Mexico and Gulf Coast Properties.
On February 25, 2014, the Company sold subsidiaries that owned the Gulf Properties, for approximately
$702.6 million
, net of working capital adjustments and post-closing adjustments, and the buyer’s assumption of approximately
$366.0 million
of related asset retirement obligations. The Company retained a 2% overriding royalty interest in certain exploration prospects. The Company is using the proceeds from the sale to fund its drilling in the Mid-Continent.
Additionally, the Company settled a portion of its existing oil derivative contracts in January and February 2014 prior to their respective maturities to reduce volumes hedged in proportion to the anticipated reduction in daily production volumes due to the sale, which resulted in the Company making cash payments of approximately $69.6 million. Without regard to same-counterparty netting, these derivative contracts were in a liability position at December 31, 2013 of $72.4 million. This transaction did not result in a significant alteration of the relationship between the Company’s capitalized costs and proved reserves and, accordingly, the Company recorded the proceeds as a reduction of its full cost pool with no gain or loss on the sale.
Production, revenues and expenses, including direct operating expenses, depletion, accretion of asset retirement obligations and general and administrative expenses, for the Gulf Properties included in the Company’s results for the years ended
December 31, 2014
,
2013
and 2012 were as follows:
|
Year Ended December 31,
|
|||||||||||
|
2014(1)
|
2013
|
2012
|
|||||||||
|
Production (MBoe)
|
1,321
|
|
10,082
|
|
8,110
|
|
|||||
|
Revenues (in thousands)
|
$
|
90,920
|
|
$
|
627,236
|
|
$
|
449,420
|
|
||
|
Expenses (in thousands)
|
$
|
63,674
|
|
$
|
491,991
|
|
$
|
360,209
|
|
||
_______________
(1) Includes activity through February 25, 2014, the date of sale.
2014 Operational Highlights
Operational highlights for 2014 include the following:
|
•
|
Drilled 442 wells, excluding salt water disposal wells, in the Mid-Continent area. Mid-Continent properties contributed approximately
23.4
MMBoe, or
80.9%
, of the Company’s total production in 2014 compared to approximately
17.8
MMBoe, or
52.7%
, in 2013.
|
|
•
|
Gulf Properties divested in February 2014, as discussed below, contributed production of approximately
1.3
MMBoe, or
4.6%
of the Company’s total production in 2014 compared to approximately
10.1
MMBoe, or
29.8%
of total production in 2013.
|
|
•
|
Total production for 2014 was comprised of approximately
37.6%
oil,
49.3%
natural gas and
13.1%
NGLs compared to
42.3%
oil,
50.9%
natural gas and
6.8%
NGLs in 2013.
|
Outlook
Oil prices fell sharply in the latter half of 2014 and remain at very low levels. Accordingly, the Company’s 2015 capital expenditures budget is approximately
$700.0 million
, with approximately
$650.0 million
designated for exploration and production activities. These amounts reflect a decrease from 2014 capital expenditures of 56% and
57%
, respectively. In 2015, the Company plans to capitalize on its in place saltwater gathering and disposal and electrical systems by focusing its drilling efforts on locations that can most effectively make use of this existing infrastructure, while also continuing its multilateral program within a high-graded inventory of locations including newly-targeted formations such as the Chester and Woodford formations. To that end, the Company intends to invest only in projects that are expected to have a positive return at recent strip pricing. Additionally, the Company expects costs industry-wide to align more closely with the current commodity pricing environment throughout 2015, resulting in improved and more certain returns.
In light of current commodity prices and the Company’s leverage, the Company is analyzing a variety of transactions and mechanisms designed to reduce debt and/or increase net income, including opportunistic acquisitions, the monetization of non-income producing assets, the retirement or purchase of outstanding debt securities through cash purchases and/or exchanges for other Company securities in open market purchases, privately negotiated transactions or otherwise. Such transactions, if any, will depend on prevailing market conditions, the Company’s liquidity requirements, contractual restrictions and other factors.
57
Results by Segment
The Company operates in three reportable business segments: exploration and production, drilling and oil field services and midstream services. These segments represent the Company’s three main business units, each offering different products and services. The exploration and production segment is engaged in the exploration and production of oil and natural gas properties and includes the activities of the Royalty Trusts. The drilling and oil field services segment is engaged in the contract drilling of oil and natural gas wells and provides various oil field services. The midstream services segment is engaged in the purchasing, gathering, treating and selling of natural gas and coordinates the delivery of electricity for the Company’s exploration and production operations in the Mid-Continent.
Management evaluates the performance of the Company’s business segments based on income (loss) from operations. Results of these measurements provide important information to the Company about the activity, profitability and contributions of each of the Company’s lines of business. Results for the Company’s business segments for the years ended
December 31, 2014
,
2013
and
2012
are discussed below.
Exploration and Production Segment
The Company generates the majority of its consolidated revenues and cash flow from the production and sale of oil, natural gas and NGLs. The Company’s revenues, profitability and future growth depend substantially on prevailing prices for oil, natural gas and NGLs and on the Company’s ability to find and economically develop and produce its reserves. The primary factors affecting the financial results of the Company’s exploration and production segment are the quantity of oil, natural gas and NGLs it produces, the prices the Company receives for its production and changes in the fair value of its commodity derivative contracts. Prices for oil, natural gas and NGLs fluctuate widely and are difficult to predict. To provide information on the general trend in pricing, the average annual NYMEX prices for oil and natural gas during the years ended
December 31, 2014
,
2013
,
2012
, 2011 and 2010 are presented in the table below:
|
Year Ended December 31,
|
|||||||||||||||||||
|
2014
|
2013
|
2012
|
2011
|
2010
|
|||||||||||||||
|
Oil (per Bbl)
|
$
|
92.91
|
|
$
|
98.05
|
|
$
|
94.15
|
|
$
|
95.11
|
|
$
|
79.61
|
|
||||
|
Natural gas (per Mcf)
|
$
|
4.26
|
|
$
|
3.73
|
|
$
|
2.83
|
|
$
|
4.03
|
|
$
|
4.38
|
|
||||
In order to reduce the Company’s exposure to price fluctuations, the Company enters into commodity derivative contracts for a portion of its anticipated future oil and natural gas production as discussed in “Item 7A. Quantitative and Qualitative Disclosures About Market Risk.” Reducing the Company’s exposure to price volatility helps mitigate the risk that it will not have adequate funds available for its capital expenditure programs.
58
Set forth in the table below is financial, production and pricing information for the exploration and production segment for the years ended
December 31, 2014
,
2013
and
2012
.
|
Year Ended December 31,
|
|||||||||||
|
2014
|
2013
|
2012
|
|||||||||
|
Results (in thousands)
|
|||||||||||
|
Revenues
|
|||||||||||
|
Oil
|
$
|
977,269
|
|
$
|
1,393,360
|
|
$
|
1,456,590
|
|
||
|
NGL
|
126,759
|
|
80,555
|
|
69,306
|
|
|||||
|
Natural gas
|
316,851
|
|
346,363
|
|
233,386
|
|
|||||
|
Other
|
2,194
|
|
14,202
|
|
15,939
|
|
|||||
|
Inter-segment revenue
|
(173
|
)
|
(320
|
)
|
(403
|
)
|
|||||
|
Total revenues
|
1,422,900
|
|
1,834,160
|
|
1,774,818
|
|
|||||
|
Operating expenses
|
|||||||||||
|
Production
|
348,387
|
|
519,546
|
|
480,001
|
|
|||||
|
Production taxes
|
31,731
|
|
32,292
|
|
47,210
|
|
|||||
|
Depreciation and depletion—oil and natural gas
|
434,295
|
|
567,732
|
|
568,029
|
|
|||||
|
Accretion of asset retirement obligations
|
9,092
|
|
36,777
|
|
28,996
|
|
|||||
|
Impairment
|
164,779
|
|
—
|
|
235,396
|
|
|||||
|
(Gain) loss on derivative contracts
|
(334,011
|
)
|
47,123
|
|
(241,419
|
)
|
|||||
|
(Gain) loss on sale of assets
|
(39
|
)
|
398,543
|
|
3,499
|
|
|||||
|
Other operating expenses
|
54,950
|
|
169,638
|
|
|
134,962
|
|
||||
|
Total operating expenses
|
709,184
|
|
1,771,651
|
|
1,256,674
|
|
|||||
|
Income from operations
|
$
|
713,716
|
|
$
|
62,509
|
|
$
|
518,144
|
|
||
|
Production data
|
|||||||||||
|
Oil (MBbls)
|
10,876
|
|
14,279
|
|
15,868
|
|
|||||
|
NGL (MBbls)
|
3,794
|
|
2,291
|
|
2,094
|
|
|||||
|
Natural gas (MMcf)
|
85,697
|
|
103,233
|
|
93,549
|
|
|||||
|
Total volumes (MBoe)
|
28,953
|
|
33,776
|
|
33,553
|
|
|||||
|
Average daily total volumes (MBoe/d)
|
79.3
|
|
92.5
|
|
91.7
|
|
|||||
|
Average prices—as reported(1)
|
|||||||||||
|
Oil (per Bbl)
|
$
|
89.86
|
|
$
|
97.58
|
|
$
|
91.79
|
|
||
|
NGL (per Bbl)
|
$
|
33.41
|
|
$
|
35.16
|
|
$
|
33.10
|
|
||
|
Natural gas (per Mcf)
|
$
|
3.70
|
|
$
|
3.36
|
|
$
|
2.49
|
|
||
|
Total (per Boe)
|
$
|
49.08
|
|
$
|
53.89
|
|
$
|
52.43
|
|
||
|
Average prices—including impact of derivative contract settlements(2)
|
|||||||||||
|
Oil (per Bbl)
|
$
|
94.18
|
|
$
|
98.90
|
|
$
|
97.53
|
|
||
|
NGL (per Bbl)
|
$
|
33.41
|
|
$
|
35.16
|
|
$
|
33.10
|
|
||
|
Natural gas (per Mcf)
|
$
|
3.58
|
|
$
|
3.46
|
|
$
|
2.46
|
|
||
|
Total (per Boe)
|
$
|
50.36
|
|
$
|
54.79
|
|
$
|
55.04
|
|
||
____________________
|
(1)
|
Prices represent actual average prices for the periods presented and do not include the impact of derivative transactions.
|
|
(2)
|
Excludes settlements of commodity derivative contracts prior to their contractual maturity.
|
For a discussion of reserves, PV-10 and reconciliation to Standardized Measure, see “Business—Business Segments and Primary Operations—Proved Reserves” in Item 1 of this report.
59
The table below presents production by area of operation for the years ended
December 31, 2014
,
2013
and
2012
and illustrates the impact of (i) the Company’s continued development of its Mid-Continent assets, (ii) the Company’s sale in February 2014 of the Gulf Properties, the majority of which were purchased during the second quarter of 2012 in the Dynamic Acquisition and (iii) the sale of the Permian Properties in February 2013.
|
Year Ended December 31,
|
|||||||||||||||||
|
2014
|
2013
|
2012
|
|||||||||||||||
|
Production (MBoe)
|
% of Total Production
|
Production (MBoe)
|
% of Total Production
|
Production (MBoe)
|
% of Total Production
|
||||||||||||
|
Mid-Continent
|
23,423
|
|
80.9
|
%
|
17,783
|
|
52.7
|
%
|
11,039
|
|
32.9
|
%
|
|||||
|
Gulf of Mexico / Gulf Coast
|
1,321
|
|
4.6
|
%
|
10,082
|
|
29.8
|
%
|
8,110
|
|
24.2
|
%
|
|||||
|
Permian Basin
|
2,076
|
|
7.2
|
%
|
3,366
|
|
10.0
|
%
|
10,963
|
|
32.6
|
%
|
|||||
|
Other - west Texas
|
2,133
|
|
7.3
|
%
|
2,545
|
|
7.5
|
%
|
3,441
|
|
10.3
|
%
|
|||||
|
Total
|
28,953
|
|
100.0
|
%
|
33,776
|
|
100.0
|
%
|
33,553
|
|
100.0
|
%
|
|||||
Revenues
Exploration and production segment revenues from oil, natural gas and NGL sales decreased by a combined
$399.4 million
, or
21.9%
for the year ended
December 31, 2014
compared to
2013
. Approximately $337.9 million of the total net decrease resulted from a
4.8
MMBoe, or
14.3%
decrease in combined production, stemming largely from a decrease in production due to the sale of the Gulf Properties in February 2014. As illustrated in the table above, the decrease in production resulting from the sale of the Gulf Properties was partially offset by increased production in the Mid-Continent as the Company focused its development efforts in this area. The remainder of the decrease in exploration and production segment revenues was primarily due to a decline in the average price received for oil production.
Exploration and production segment revenues from oil, natural gas and NGL sales increased by a combined
$61.0 million
, or
3.5%
for the year ended December 31, 2013 compared to 2012, primarily as a result of increases in average prices received for oil and natural gas, and an increase in natural gas production of
9.7
Bcf, or
10.4%
. Total production remained relatively unchanged in 2013 compared to 2012; however, natural gas comprised a larger portion of total production in 2013 as production from the Mid-Continent and Gulf of Mexico, which contains a higher percentage of natural gas than production from the Permian Basin, comprised a larger percentage of total production in 2013.
Operating Expenses
Production expense includes the costs associated with the Company’s exploration and production activities, including, but not limited to, lease operating expense and treating costs. Production expenses decreased
$171.2 million
, or
32.9%
, in 2014 compared to
2013
, primarily due to the decrease in total production as described above and a decrease in production costs per Boe. For the year ended
December 31, 2014
, production expense was
$12.03
per Boe, down from the rate for
2013
of
$15.38
per Boe, primarily as a result of the sale of the Gulf Properties in February 2014, which had higher production costs inherent with offshore operations. Production expenses increased
$39.5 million
, or
8.2%
, in 2013 from 2012, primarily due to $32.7 million in CO
2
under delivery
penalties incurred for the year ended December 31, 2013 under a treating agreement with Occidental that became effective in the fourth quarter of 2012. See further discussion of the treating agreement with Occidental in “Liquidity and Capital Resources - Contractual Obligations and Off-Balance Sheet Arrangements.” Production expense for 2013 was $15.38 per Boe, up from the rate of $14.31 per Boe in 2012. This increase is primarily a result of the under delivery penalties and, to a lesser extent, higher costs associated with production from properties located in the Gulf of Mexico, which comprised a larger percentage of total production in 2013 than in 2012.
Production taxes as a percentage of oil, natural gas and NGL revenue increased to approximately
2.2%
for 2014 from
1.8%
for
2013
as taxable production from the Mid-Continent partially replaced non-taxable production from the Gulf Properties sold in February 2014. Production taxes decreased by approximately $14.9 million, or 31.6% for 2013 compared to 2012, as production from the Mid-Continent and Gulf Properties comprised approximately 82.5% of total 2013 production compared to approximately 57.1% of 2012 production. Production from the Gulf of Mexico is not subject to production taxes. Additionally, wells drilled in the Mississippian formation in Oklahoma are part of a tax credit incentive program that reduces the combined statutory rates applicable to the first four years of production from such wells.
Depreciation and depletion for the Company’s oil and natural gas properties decreased by
$133.4 million
for the year ended
December 31, 2014
, compared to
2013
. This decrease is largely a result of the decrease in the Company’s combined production volumes for the 2014 period as well as a decrease in the depreciation and depletion rate per Boe to
$15.00
for 2014
60
from
$16.81
in 2013. The decrease in the depreciation and depletion rate is primarily due to (i) the sale of the Gulf Properties in February 2014 (ii) full cost ceiling impairment recorded in the first quarter of 2014 and (iii) changes in future production and planned capital expenditures. Depreciation and depletion for the Company’s oil and natural gas properties was consistent for the years ended December 31, 2013 and 2012.
Accretion of asset retirement obligations decreased
$27.7 million
for the year ended
December 31, 2014
, compared to 2013, primarily due to the assumption by the buyer of asset retirement obligations associated with the Gulf Properties sold in February 2014. Accretion of asset retirement obligations increased
$7.8 million
for the year ended December 31,
2013
from
2012
, primarily as a result of the increase in future plugging and abandonment obligations associated with the oil and natural gas properties located in the Gulf of Mexico that were acquired during the second quarter of 2012.
Impairment of
$164.8 million
for the year ended
December 31, 2014
was incurred in the first quarter of 2014 and was due to a full cost ceiling limitation resulting from the divestiture of the Gulf Properties as the present value of future net revenues associated with the Gulf Properties exceeded the associated reduction to the full cost pool. There was no full cost ceiling impairment for the year ended December 31, 2013. During the year ended December 31, 2012, the Company recorded a
$235.4 million
impairment to the carrying value of goodwill. Primarily as a result of a decrease in the Company’s probable reserves as of December 31, 2012, which is a significant component in the determination of the fair value of the applicable reporting unit, the carrying value of the reporting unit exceeded its fair value such that the entire carrying value of the Company’s goodwill was impaired. For additional information regarding the goodwill impairment, see “Note
8
—Impairment” to the Company’s consolidated financial statements in Item 8 of this report.
The Company recorded a (gain) loss on commodity derivative contracts of
$(334.0) million
,
$47.1 million
and
$(241.4) million
for the years ended
December 31, 2014
,
2013
and
2012
, respectively, as reflected in income from operations for the exploration and production segment, which include net cash payments (receipts) upon settlement of
$32.3 million
,
$(0.8) million
and
$(91.4) million
, respectively. Included in these net cash payments for the years ended December 31, 2014 and 2013 are
$69.6 million
and
$29.6 million
, respectively, of cash payments related to settlements of commodity derivative contracts with contractual maturities after the year in which they were settled (“early settlements”) as a result of the sale of the Gulf Properties in February 2014 and the Permian Properties in February 2013, respectively. For the year ended December 31, 2012, the gain on commodity derivative contracts is net of a non-cash loss of $117.1 million resulting from the amendment of certain 2012 derivative contracts to contracts maturing in 2014 and 2015.
The Company’s derivative contracts are not designated as accounting hedges and, as a result, gains or losses on commodity derivative contracts are recorded each quarter as a component of operating expenses. Internally, management views the settlement of derivative contracts at contractual maturity as adjustments to the price received for oil and natural gas production to determine “effective prices.” Gains or losses on early settlements and losses related to amendments of contracts are not considered in the calculation of effective prices. In general, cash is received on settlement of contracts due to lower oil and natural gas prices at the time of settlement compared to the contract price for the Company’s oil and natural gas price swaps, and cash is paid on settlement of contracts due to higher oil and natural gas prices at the time of settlement compared to the contract price for the Company’s oil and natural gas price swaps.
The Company recorded a loss on the sale of assets of $398.9 million for the year ended December 31, 2013 as a result of the sale of the Permian Properties in February 2013. No gain or loss was recognized for the sale of the Gulf Properties in February 2014. See “Note
3
—Acquisitions and Divestitures” to the Company’s consolidated financial statements in Item 8 of this report for additional discussion of these transactions.
See “Consolidated Results of Operations” below for a discussion of other operating expenses.
Drilling and Oil Field Services Segment
The financial results of the Company’s drilling and oil field services segment depend primarily on demand and prices that can be charged for its services. On a consolidated basis, drilling and oil field service revenues earned and expenses incurred in performing services for third parties, including third-party working interests in wells the Company operates, are included in drilling and services revenues and cost of sales. Drilling and oil field service revenues earned and expenses incurred in performing services for the Company’s own account are eliminated in consolidation. The primary factors affecting the results of the Company’s drilling and oil field services segment are the rates received on rigs drilling for third parties, the number of days drilling for third parties and the amount of oil field services provided to third parties.
61
Set forth in the table below is financial and operational information for the drilling and oil field services segment for the years ended
December 31, 2014
,
2013
and
2012
.
|
Year Ended December 31,
|
|||||||||||
|
2014
|
2013
|
2012
|
|||||||||
|
Results (in thousands)
|
|||||||||||
|
Revenues
|
$
|
192,944
|
|
$
|
187,456
|
|
$
|
379,345
|
|
||
|
Inter-segment revenue
|
(116,856
|
)
|
(120,815
|
)
|
(262,712
|
)
|
|||||
|
Total revenues
|
76,088
|
|
66,641
|
|
116,633
|
|
|||||
|
Operating expenses
|
86,225
|
|
95,692
|
|
104,722
|
|
|||||
|
Impairment
|
27,427
|
|
11,104
|
|
—
|
|
|||||
|
(Loss) income from operations
|
$
|
(37,564
|
)
|
$
|
(40,155
|
)
|
$
|
11,911
|
|
||
|
|
|
||||||||||
|
Drilling rig statistics
|
|||||||||||
|
Average number of operational rigs owned during the period
|
27.0
|
|
29.0
|
|
30.0
|
|
|||||
|
Average number of rigs working for third parties
|
4.8
|
|
4.4
|
|
9.4
|
|
|||||
|
Number of days drilling for third parties
|
1,749
|
|
1,603
|
|
2,613
|
|
|||||
|
Average drilling revenue per day per rig drilling for third parties(1)
|
$
|
14,985
|
|
$
|
14,610
|
|
$
|
16,919
|
|
||
|
Rig status as of December 31
|
|||||||||||
|
Working for SandRidge
|
10
|
|
11
|
|
14
|
|
|||||
|
Working for third parties(2)
|
—
|
|
6
|
|
10
|
|
|||||
|
Idle (3)
|
15
|
|
10
|
|
6
|
|
|||||
|
Total operational
|
25
|
|
27
|
|
30
|
|
|||||
|
Non-operational(4)
|
2
|
|
3
|
|
1
|
|
|||||
|
Total rigs
|
27
|
|
30
|
|
31
|
|
|||||
____________________
|
(1)
|
Represents revenues from rigs working for third parties, excluding stand-by revenue, divided by the total number of days such drilling rigs were used by third parties during the period, excluding revenues for related rental equipment.
|
|
(2)
|
Includes five rigs receiving stand-by rates from third parties at December 31, 2012.
|
|
(3)
|
The company’s rigs are primarily intended to drill for its own account; as such, the number of idle rigs does not significantly impact the consolidated results of operations.
|
|
(4)
|
Non-operational rigs at December 31, 2014 and 2012 were stacked. Non-operational rigs at December 31, 2013 were held for sale.
|
Drilling and oil field services segment revenues increased
$9.4 million
for the year ended
December 31, 2014
compared to
2013
, primarily due to an increase in revenue from third party working interest for work performed on wells in which the Company also has an interest, as well as an increase in the average number of rigs working for third parties. Drilling and oil field services segment operating expenses decreased
$9.5 million
during the year ended
December 31, 2014
compared to
2013
due primarily to an increased focus on capital discipline by management as well as the closure of the drilling fluids services business in the Permian region during the fourth quarter of 2014 upon fulfillment of the Permian Trust drilling obligation.
Demand for the Company’s drilling and oilfield services in the Permian region declined significantly in the latter half of 2014 as a result of the Company’s fulfillment of its drilling obligation with the Permian Trust and the downward trend in oil prices that began during that period. At December 31, 2014, the Company determined the future use of its drilling and oilfield services assets in this region was limited and recorded an impairment of
$24.3 million
on these assets. In the first quarter of 2015, the Company decided to discontinue all remaining drilling and oil field services operations in the Permian region. The Company also recorded an impairment of approximately $
3.1
million in the second quarter of 2014 on certain drilling assets identified for sale in order to adjust their carrying values to fair value. These impairments, while partially offset by an increase in revenue, resulted in a loss from operations of
$37.6 million
for the year ended
December 31, 2014
.
Drilling and oil field services segment revenues decreased $50.0 million for the year ended December 31, 2013 compared to 2012. The decrease in revenues was primarily attributable to a decrease in the average number of rigs working for third parties and a decrease in supplies sold to, and oil field services work performed for, wells that had been operated by the Company in the
62
Permian Basin prior to their sale. Drilling and oil field services segment operating expenses decreased $9.0 million during the year ended December 31, 2013 compared to 2012 due primarily to the decrease in work performed in the Permian Basin, which was significantly offset by costs associated with maintenance performed on rigs that were stacked as a result of the sale of the Permian Properties. For the year ended December 31, 2013, the Company recorded an impairment of approximately $11.1 million on certain drilling assets identified for sale in order to adjust their carrying values to fair value. The impairment and decrease in revenue resulted in a loss from operations of $40.2 million for the year ended December 31, 2013.
Midstream Services Segment
Midstream services segment revenues consist primarily of revenue from gas marketing, which is a very low-margin business, and revenues from coordinating the delivery of electricity to the Company’s exploration and production operations in the Mid-Continent area. The primary factors affecting the results of the Company’s midstream services segment are the quantity of natural gas the Company gathers, treats and markets and the prices it pays and receives for natural gas as well as the rates charged and volumes delivered by the electrical transmission system.
Gas Marketing.
On a consolidated basis, midstream and marketing revenues include natural gas sold to third parties and the fees the Company charges to gather, compress and treat this natural gas. Gas marketing operating costs represent payments made to third parties for the proceeds from the sale of natural gas owned by such parties, net of any applicable margin, and actual costs the Company charges to gather, compress and treat the natural gas. In general, natural gas purchased and sold by the Company’s midstream services segment is priced at a published daily or monthly index price. Midstream gas services are primarily undertaken to realize incremental margins on natural gas purchased at the wellhead and to provide value-added services to customers.
Provision of Electricity.
The Company constructed an electrical transmission system in the Mid-Continent area to provide electricity for use in the Company’s exploration and production operations at a lower cost than electricity provided by on-site generation. On a consolidated basis, revenues and expenses from the electrical transmission system relate to electricity provided to third-party working interest owners in Company operated wells in the Mid-Continent.
Gas Treating Plants.
The Company owns and operates two gas treating plants in west Texas, which remove CO
2
from natural gas production and deliver residue gas to nearby pipelines. Throughout 2012, the Company diverted its high CO
2
natural gas production from its gas treating plants to the Century Plant while it was being tested and commissioned. Upon substantial completion of the Century Plant in late 2012, natural gas volumes delivered by the Company for processing at the Century Plant became subject to the terms of the 30-year treating agreement with Occidental, which contains minimum CO
2
delivery requirements. All natural gas produced in the WTO during 2013 and 2014 was processed at the Century Plant. Due to the continued decline in natural gas production in the WTO resulting from the lack of drilling activity in the area, volumes currently produced in the WTO and delivered to the Century Plant for processing are not sufficient to use all of the available treating capacity at the Century Plant. Due to the sensitivity of drilling to market prices for natural gas, drilling activity in the WTO will likely remain very limited if natural gas prices remain low. As a result, the Company currently anticipates little to no use of its treating plants in future periods. See further discussion of the CO
2
treating agreement in “Liquidity and Capital Resources—Contractual Obligations and Off-Balance Sheet Arrangements.”
63
Set forth in the table below is financial information for the midstream services segment for the years ended
December 31, 2014
,
2013
and
2012
.
|
Year Ended December 31,
|
|||||||||||
|
2014
|
2013
|
2012
|
|||||||||
|
Results (in thousands)
|
|||||||||||
|
Operating revenues
|
$
|
142,987
|
|
$
|
156,640
|
|
$
|
116,659
|
|
||
|
Construction contract
|
—
|
|
23,349
|
|
—
|
|
|||||
|
Inter-segment revenue
|
(87,593
|
)
|
(100,529
|
)
|
(77,824
|
)
|
|||||
|
Total revenues
|
55,394
|
|
79,460
|
|
38,835
|
|
|||||
|
Operating expenses
|
63,927
|
|
73,744
|
|
52,179
|
|
|||||
|
Construction contract
|
—
|
|
23,349
|
|
—
|
|
|||||
|
Impairment
|
561
|
|
3,934
|
|
59,683
|
|
|||||
|
Loss from operations
|
$
|
(9,094
|
)
|
$
|
(21,567
|
)
|
$
|
(73,027
|
)
|
||
|
Gas Marketed
|
|||||||||||
|
Volumes (MMcf)
|
7,343
|
|
8,006
|
|
9,367
|
|
|||||
|
Price
|
$
|
4.18
|
|
$
|
3.56
|
|
$
|
2.63
|
|
||
Midstream services segment operating revenues and expenses, excluding construction contract revenue and expenses, decreased
$0.7 million
and
$9.8 million
, respectively, for the year ended
December 31, 2014
compared to the same period in
2013
. These decreases were primarily due to a change in the fee structure for electrical usage during the second quarter of 2014. The decrease in revenues during 2014 compared to 2013 due to the fee structure change was partially offset by (i) an increase in electrical transmission services provided to third-party working interest owners in the Mid-Continent, (ii) an increase of
$0.62
per Mcf in the average price received for natural gas purchased and marketed in west Texas, and (iii) an increase in gas compressor and generator rentals.
Midstream services segment operating revenues and expenses, excluding construction contract revenue and expenses, increased $17.3 million and $21.6 million, respectively, for the year ended December 31, 2013 compared to the same period in 2012. These increases in operating revenue and expenses were due to an increase of $0.95 per Mcf in the average price received for natural gas purchased and marketed in west Texas during the year ended December 31, 2013 and an increase in revenue from and expenses related to electrical transmission services provided by the Company’s expanded electrical infrastructure in the Mid-Continent to third-party working interest owners. These increases were slightly offset by a 1.4 Bcf decrease in third-party volumes processed and marketed for the year ended December 31, 2013 compared to 2012 as a result of decreased natural gas production in west Texas.
During the second quarter of 2013, the Company substantially completed the construction of a series of electrical transmission expansion and upgrade projects for a third party and, as a result, recognized construction contract revenue and costs equal to $23.3 million. For more information about these projects, see “Note
11
— Construction Contracts” to the Company’s consolidated financial statements in Item 8 of this report.
Midstream services segment expenses for the years ended December 31, 2013 and 2012 include impairments of
$3.9 million
and
$59.7 million
, respectively, on its natural gas treating plants in west Texas due to the anticipation that their future use would be limited as discussed under
Gas Treating Plants
above.
64
Consolidated Results of Operations
Revenues
The Company’s consolidated revenues for the years ended
December 31, 2014
,
2013
and
2012
are presented in the table below.
|
|
Year Ended December 31,
|
||||||||||
|
|
2014
|
2013
|
2012
|
||||||||
|
|
(In thousands)
|
||||||||||
|
Revenues
|
|||||||||||
|
Oil, natural gas and NGL
|
$
|
1,420,879
|
|
$
|
1,820,278
|
|
$
|
1,759,282
|
|
||
|
Drilling and services
|
76,088
|
|
66,586
|
|
116,633
|
|
|||||
|
Midstream and marketing
|
55,658
|
|
58,304
|
|
40,486
|
|
|||||
|
Construction contract
|
—
|
|
23,349
|
|
—
|
|
|||||
|
Other
|
6,133
|
|
14,871
|
|
18,241
|
|
|||||
|
Total revenues(1)
|
$
|
1,558,758
|
|
$
|
1,983,388
|
|
$
|
1,934,642
|
|
||
___________________
|
(1)
|
Includes
$150.4 million
,
$199.3 million
and
$181.2 million
of revenues attributable to noncontrolling interests in consolidated variable interest entities (“VIEs”), after considering the effects of intercompany eliminations, for the years ended
December 31, 2014
,
2013
and
2012
, respectively.
|
The Company’s primary sources of revenue are discussed in “Results by Segment.” See discussion of oil, natural gas and NGL revenues under “Results by Segment—Exploration and Production Segment,” discussion of drilling and services revenues under “Results by Segment—Drilling and Oil Field Services Segment” and discussion of significant midstream and marketing and construction contract revenues under “Results by Segment—Midstream Services Segment.”
Expenses
The Company’s consolidated expenses for the years ended
December 31, 2014
,
2013
and
2012
are presented below.
|
|
Year Ended December 31,
|
||||||||||
|
|
2014
|
2013
|
2012
|
||||||||
|
|
(In thousands)
|
||||||||||
|
Expenses
|
|||||||||||
|
Production
|
$
|
346,088
|
|
$
|
516,427
|
|
$
|
477,154
|
|
||
|
Production taxes
|
31,731
|
|
32,292
|
|
47,210
|
|
|||||
|
Cost of sales
|
56,155
|
|
57,118
|
|
68,227
|
|
|||||
|
Midstream and marketing
|
49,905
|
|
53,644
|
|
39,669
|
|
|||||
|
Construction contract
|
—
|
|
23,349
|
|
—
|
|
|||||
|
Depreciation and depletion—oil and natural gas
|
434,295
|
|
567,732
|
|
568,029
|
|
|||||
|
Depreciation and amortization—other
|
59,636
|
|
62,136
|
|
60,805
|
|
|||||
|
Accretion of asset retirement obligations
|
9,092
|
|
36,777
|
|
28,996
|
|
|||||
|
Impairment
|
192,768
|
|
26,280
|
|
316,004
|
|
|||||
|
General and administrative
|
113,991
|
|
207,920
|
|
241,682
|
|
|||||
|
Employee termination benefits
|
8,874
|
|
122,505
|
|
—
|
|
|||||
|
(Gain) loss on derivative contracts
|
(334,011
|
)
|
47,123
|
|
(241,419
|
)
|
|||||
|
Loss on sale of assets
|
10
|
|
399,086
|
|
3,089
|
|
|||||
|
Total expenses(1)
|
$
|
968,534
|
|
$
|
2,152,389
|
|
$
|
1,609,446
|
|
||
___________________
|
(1)
|
Includes
$51.0 million
,
$157.0 million
and
$75.4 million
of expenses attributable to noncontrolling interests in consolidated VIEs, after considering the effects of intercompany eliminations, for the years ended
December 31, 2014
,
2013
and
2012
, respectively. The expenses attributable to noncontrolling interest in consolidated VIEs include
$29.9
|
65
million
of allocated full cost ceiling impairment for the year ended
December 31, 2014
and
$71.7 million
of allocated loss on sale of assets associated with the sale of the Permian Properties for the year ended December 31, 2013.
See discussion of production expenses, production taxes, depreciation and depletion—oil and natural gas, accretion of asset retirement obligations, impairment, (gain) loss on derivative contracts and loss on sale of assets under “Results by Segment—Exploration and Production Segment,” discussion of cost of sales and impairment under “Results by Segment— Drilling and Oil Field Services Segment” and discussion of midstream and marketing and construction contract expense and impairment under “Results by Segment—Midstream Services Segment.”
Other impairment expense not discussed within “Results by Segment” for the year ended December 31, 2013, primarily consists of a $2.9 million impairment of a corporate asset based on plans to sell these assets in 2013 and 2014, and an $8.3 million impairment on certain pipe inventory, natural gas compressors, and a CO
2
compressor station after determining that their future use was limited. Other impairment expense for the year ended December 31, 2012 consists primarily of a $19.6 million impairment of the Company’s CO
2
compression facilities recorded in connection with the completion of the Century Plant. See “Note
8
—Impairment” to the Company’s consolidated financial statements in Item 8 of this report for additional information regarding the Company’s impairments.
General and administrative expenses decreased
$93.9 million
, or
45.2%
, for the year ended
December 31, 2014
compared to
2013
due to a decrease of $22.2 million in costs related to a stockholder consent solicitation that occurred in 2013, as well as decreases of (i) $44.5 million in compensation, (ii) $9.8 million in professional services costs, (iii) $3.8 million in promotional and advertising costs, and (iv) $5.5 million in other corporate support costs primarily as a result of corporate cost cutting measures and a decrease in headcount during 2014.
General and administrative expenses decreased $33.8 million, or 14.0% for the year ended December 31, 2013 from 2012, primarily due to decreases of (i) $23.5 million in legal settlement costs, (ii) $12.0 million in acquisition costs, (iii) $6.8 million in promotional and advertising costs as a result of corporate cost cutting measures and a decrease in headcount during 2013, and (iv) a decrease of $5.6 million in legal and other professional services costs. These decreases were partially offset by a $20.4 million increase in costs related to a stockholder consent solicitation.
Employee termination benefits of
$8.9 million
for the year ended
December 31, 2014
represent severance costs incurred primarily in conjunction with the sale of the Gulf Properties. Employee termination benefits of
$122.5 million
for the year ended December 31, 2013 represent severance costs associated with former Company executives. Of the total employee termination benefits in 2013, approximately $99.3 million, including amounts associated with the accelerated vesting of restricted stock awards, were attributable to the Company’s former Chairman and CEO.
Other Income (Expense), Taxes and Net Income Attributable to Noncontrolling Interest
The Company’s other income (expense), taxes and net income attributable to noncontrolling interest for the years ended
December 31, 2014
,
2013
and
2012
are reflected in the table below.
|
|
Year Ended December 31,
|
||||||||||
|
|
2014
|
2013
|
2012
|
||||||||
|
|
(In thousands)
|
||||||||||
|
Other income (expense)
|
|||||||||||
|
Interest expense
|
$
|
(244,109
|
)
|
$
|
(270,234
|
)
|
$
|
(303,349
|
)
|
||
|
Bargain purchase gain
|
—
|
|
—
|
|
122,696
|
|
|||||
|
Loss on extinguishment of debt
|
—
|
|
(82,005
|
)
|
(3,075
|
)
|
|||||
|
Other income, net
|
3,490
|
|
12,445
|
|
4,741
|
|
|||||
|
Total other expense
|
(240,619
|
)
|
(339,794
|
)
|
(178,987
|
)
|
|||||
|
Income (loss) before income taxes
|
349,605
|
|
(508,795
|
)
|
146,209
|
|
|||||
|
Income tax (benefit) expense
|
(2,293
|
)
|
5,684
|
|
(100,362
|
)
|
|||||
|
Net income (loss)
|
351,898
|
|
(514,479
|
)
|
246,571
|
|
|||||
|
Less: net income attributable to noncontrolling interest
|
98,613
|
|
39,410
|
|
105,000
|
|
|||||
|
Net income
(loss) attributable to SandRidge Energy, Inc.
|
$
|
253,285
|
|
$
|
(553,889
|
)
|
$
|
141,571
|
|
||
66
Interest expense for the years ended
December 31, 2014
,
2013
and
2012
consisted of the following:
|
Year Ended December 31,
|
|||||||||||
|
2014
|
2013
|
2012
|
|||||||||
|
(In thousands)
|
|||||||||||
|
Interest expense
|
|||||||||||
|
Interest expense on debt
|
$
|
254,475
|
|
$
|
277,746
|
|
$
|
290,560
|
|
||
|
Amortization of debt issuance costs, discounts and premium
|
9,954
|
|
11,127
|
|
16,980
|
|
|||||
|
Dynamic Acquisition committed financing fee
|
—
|
|
—
|
|
10,875
|
|
|||||
|
Loss on interest rate swaps
|
—
|
|
14
|
|
1,189
|
|
|||||
|
Capitalized interest
|
(19,718
|
)
|
(16,691
|
)
|
(14,789
|
)
|
|||||
|
Total
|
244,711
|
|
272,196
|
|
304,815
|
|
|||||
|
Less: interest income
|
(602
|
)
|
(1,962
|
)
|
(1,466
|
)
|
|||||
|
Total interest expense
|
$
|
244,109
|
|
$
|
270,234
|
|
$
|
303,349
|
|
||
Total interest expense decreased
$26.1 million
for the year ended
December 31, 2014
compared to
2013
, primarily due to a reduction in interest expense associated with the senior notes repurchased and redeemed in the first quarter of
2013
. Total interest expense decreased $33.1 million for the year ended December 31, 2013 compared to 2012, primarily as a result of a reduction in interest expense associated with the senior notes repurchased and redeemed in 2012 and in the first quarter of 2013, which was partially offset by the incurrence of interest on the senior notes issued in 2012 for the full year of 2013. In addition, committed financing fees of $10.9 million associated with the Dynamic Acquisition were expensed during the year ended December 31, 2012 when the Company chose to issue senior notes to fund the cash portion of the purchase price rather than to utilize previously secured committed financing. See “Note
12
—Long-Term Debt” to the Company’s consolidated financial statements in Item 8 of this report for additional discussion of the Company’s long-term debt transactions.
The bargain purchase gain recorded during the year ended December 31, 2012 resulted from the excess of net assets acquired over consideration paid in the Dynamic Acquisition in April 2012. The Company was able to acquire Dynamic for less than the estimated fair value of its net assets due to their offshore location resulting in less bidding competition.
In connection with the March 2013 redemption of the Company’s 9.875% Senior Notes due 2016 and 8.0% Senior Notes due 2018, the Company recognized a loss on extinguishment of debt of $82.0 million for the year ended December 31, 2013. The Company recognized a loss on extinguishment of debt of $3.1 million for the year ended December 31, 2012 in connection with the tender offer to repurchase the Company’s Senior Floating Rate Notes due 2014 in August 2012. The losses on extinguishment represent the premium paid to purchase the notes and the expense incurred to write off of the remaining unamortized debt issuance costs associated with the notes.
The Company’s income tax benefit of
$2.3 million
for the year ended
December 31, 2014
is primarily related to a reduction in the amount of $1.3 million in the Company’s gross unrecognized tax benefits following a favorable outcome pertaining to the Company’s state income tax audits and a reduction in the amount of $1.2 million in federal alternative minimum tax (“AMT”) associated with the tax year ended December 31,
2013
. With respect to the AMT, the Company reduced the current liability and a corresponding deferred tax asset each upon finalizing and filing the Company’s federal income tax return for the year ended December 31,
2013
. As a result of reducing the deferred tax asset, the Company decreased its valuation allowance against its net deferred tax asset by $1.2 million. The Company reported income tax expense of $5.7 million for the year ended December 31, 2013, primarily related to AMT associated with the tax year ended December 31, 2013. The Company recorded a current liability and a corresponding deferred tax asset each in the amount of approximately $3.8 million at December 31, 2013. As a result of recording this deferred tax asset, the Company increased its valuation allowance against its net deferred tax asset by approximately $3.8 million. Also included in the income tax expense for the year ended December 31, 2013, is $2.4 million of current state income tax, which is partially offset by a reduction to the liability associated with unrecognized tax benefits. The Company reported an income tax benefit of $100.4 million for the year ended December 31, 2012. The benefit was primarily attributable to the release of a portion of the Company’s valuation allowance against its net deferred tax asset during the period. A net deferred tax liability of $100.3 million recorded as a result of the Dynamic Acquisition reduced the Company’s existing net deferred tax asset position, resulting in a corresponding reduction in the valuation allowance against the net deferred tax asset.
Net income attributable to noncontrolling interest represents the portion of net income attributable to third-party ownership in the Company’s consolidated VIEs and subsidiaries. Net income attributable to noncontrolling interest increased to
$98.6 million
for the year ended
December 31, 2014
compared to
$39.4 million
in
2013
due primarily to (i) net gains recognized on the Royalty
67
Trusts’ derivative contracts during 2014 compared to net losses recognized during
2013
and (ii) the recognition of a full cost ceiling impairment attributable to noncontrolling interest of
$29.9 million
in 2014 compared to the recognition of a loss on the sale of the Permian Properties attributable to noncontrolling interest of
$71.7 million
in 2013. These increases were partially offset by a decrease in revenues in 2014 compared to 2013 largely as a result of declining production for the Mississippian Trust I and the Mississippian Trust II.
Net income attributable to noncontrolling interest decreased to $39.4 million for the year ended December 31, 2013 from $105.0 million in 2012 due primarily to the $71.7 million loss on the sale of the Permian Properties attributable to noncontrolling interest during 2013. Additionally, net losses were recognized on the Royalty Trusts’ derivative contracts in the 2013 period compared to net gains recognized during 2012. These decreases were partially offset by the inclusion of a full year of operating income for 2013 from the Mississippian Trust II, which completed its initial public offering in April 2012.
Liquidity and Capital Resources
The Company’s primary sources of liquidity and capital resources are cash flows from operating activities, borrowings under the senior credit facility, proceeds from monetizations of assets and the issuance of equity and debt securities. As described in Item 1 “Business—Divestitures,” the Company received proceeds of approximately
$702.6 million
, net of working capital adjustments and post-closing adjustments, for the sale of its Gulf Properties in February 2014 and received proceeds of approximately
$2.6 billion
, for the sale of its Permian Properties in February 2013. The recent decline in oil and natural gas prices has had a negative effect on the Company’s cash flows from operations and sustained low oil prices will require the Company to incur additional indebtedness under its senior credit facility to fund planned capital expenditures and other operations. Continued low oil and natural gas prices, or further declines in such prices, could also adversely affect the Company’s ability to incur additional indebtedness or access the capital markets on favorable terms, or at all.
The Company’s primary uses of capital are expenditures related to its oil and natural gas properties, such as costs related to the drilling and completion of wells, the acquisition of oil and natural gas properties and other fixed assets, the payment of dividends on its outstanding convertible perpetual preferred stock, interest payments on its outstanding debt, the repurchase of shares of the Company’s outstanding common stock and, from time to time, the repayment of long-term debt.
The Company’s 2015 plan for capital expenditures, including expenditures related to the Company’s drilling program for the Mississippian Trust II, is approximately $
700.0 million
, representing a 56% reduction from the Company’s actual capital expenditures in 2014. The Company expects to fund its near term capital and debt service requirements and working capital needs with cash flow from operations, and available borrowing capacity under its senior credit facility. The senior credit facility, which has a borrowing base of $900.0 million, was undrawn at December 31, 2014 and had
$100 million
drawn at
February 20, 2015
. On each such date, the Company had, $
11.6 million
and
$11.3 million
in outstanding letters of credit secured by the senior credit facility, which reduce availability under the senior credit facility on a dollar for dollar basis. The Company has no maturities of long-term debt prior to 2020, and may choose to issue new long-term debt, subject to market availability, as an alternative to borrowing under its senior credit facility. Alternatively, the Company may issue equity or other non-debt securities in the capital markets, depending on market conditions, to address its funding requirements. In the longer term, the Company expects an increasing portion of its funding needs to be covered by cash flows from operations and may issue long-term debt or equity or monetize assets to cover any difference between cash flow from operations and capital needs. The Company’s capital expenditures could be further curtailed if the Company’s cash flows decline from expected levels. Because production from existing oil and natural gas wells declines over time, further reductions of capital expenditures used to drill and complete new oil and natural gas wells would likely result in lower levels of oil and natural gas production in the future.
The Company’s revenue, profitability and future growth are substantially dependent upon the prevailing and future prices for oil and natural gas, each of which depend on numerous factors beyond the Company’s control such as overall oil and natural gas production and inventories in relevant markets, economic conditions, the global political environment, regulatory developments and competition from other energy sources. Oil and natural gas prices historically have been volatile and may be subject to significant fluctuations in the future. For example, prices for West Texas Intermediate light sweet crude oil (“WTI”), have declined from over $107.00 per Bbl in June 2014 to as low as $44.45 per Bbl in January 2015. Henry Hub natural gas prices declined from over $8.15 per MMBtu in February 2014 to $2.74 per MMBtu in December 2014. The Company’s derivative arrangements serve to mitigate a portion of the effect of this price volatility on its cash flows. The Company has in place fixed price swap and collar contracts for a majority of its anticipated oil production and a portion of its natural gas production in 2015 and for a portion of its anticipated oil production in 2016.
If the current depressed oil or natural gas prices persist for a prolonged period or further decline, they would have a material adverse effect on the Company’s financial position, results of operations, cash flows and quantities of oil, natural gas and NGL reserves that may be economically produced, likely resulting in a full cost pool ceiling impairment. In addition, continued
68
low oil and natural gas prices or further declines in such prices could result in a reduction in the size of the borrowing base under the senior credit facility, which would limit borrowings to fund capital expenditures. On February 23, 2015, the Company and its lenders further amended the credit agreement to address the risk that, in light of depressed oil and natural gas prices, the Company would breach certain financial covenants in 2015. See additional discussion of the senior credit agreement amendment under “
Cash Flows
—
Senior Credit Facility.
” There is significant risk that the Company will be unable to comply with the financial covenants under its amended senior credit facility if the current levels of oil or natural gas prices continue for a prolonged period or if there are further sustained declines in such prices, without other mitigating circumstances. The failure to comply with such covenants, absent a waiver or amendment of the applicable provisions of the credit agreement by the lenders under the credit facility, could result in a default, which, if left uncured, could lead to an event of default under the credit facility. Such an event of default would permit the lenders under the senior credit facility to, among other things, terminate the commitments of each lender, require cash collateralization of outstanding letters of credit, and/or declare all outstanding loans immediately due and payable. An event of default would trigger cross-default under certain of the Company’s other financing instruments, including the indentures governing its senior notes. The application of any of the lender remedies under the credit facility could have a material adverse effect on the Company’s financial position.
In light of current commodity prices and the Company’s leverage position, the Company is analyzing a variety of transactions and mechanisms designed to reduce debt and/or increase net income, including the monetization of non-income producing assets, the retirement or purchase of its outstanding debt securities through cash purchases and/or exchanges for equity or other Company securities in open market purchases, privately negotiated transactions or otherwise and opportunistic acquisitions. Such transactions, if any, will depend on prevailing market conditions, the Company’s liquidity requirements, contractual restrictions and other factors.
As of
December 31, 2014
, the Company’s cash and cash equivalents were $
181.3 million
, including
$9.4 million
attributable to the Company’s consolidated VIEs which is available to satisfy only obligations of the VIEs. The Company had approximately
$3.2 billion
in total debt outstanding and $
11.6 million
in outstanding letters of credit with no amount outstanding under its senior credit facility at
December 31, 2014
. As of and for the year ended
December 31, 2014
, the Company was in compliance with applicable covenants under its senior credit facility and outstanding senior notes. As of
February 20, 2015
, the Company’s cash and cash equivalents were approximately
$52.9 million
, including $
52.8 million
attributable to the Company’s consolidated VIEs. Additionally, there was $
100.0 million
outstanding under the Company’s senior credit facility and
$11.3 million
in outstanding letters of credit.
The Company and one of its wholly owned subsidiaries are parties to a development agreement with the Mississippian Trust II that obligates the Company to drill, or cause to be drilled, a specified number of wells within a specific area of mutual interest for the Royalty Trust by December 31, 2016. The Company fulfilled its drilling obligations to the Mississippian Trust I during the second quarter of 2013 and to the Permian Trust in the fourth quarter of 2014 and expects to satisfy its drilling obligation to the Mississippian Trust II in the first quarter of 2015. In addition, production targets contained in certain gathering and treating arrangements require the Company to incur capital expenditures or make associated shortfall payments. See additional discussion of these commitments under “
Contractual Obligations and Off-Balance Sheet Arrangements
.”
Working Capital
The Company’s working capital balance fluctuates as a result of changes in the fair value of its outstanding commodity derivative instruments and due to fluctuations in the timing and amount of its collection of receivables and payment of expenditures related to its exploration and production operations.
At
December 31, 2014
, the Company had a working capital surplus of
$47.5 million
compared to a surplus of
$308.0 million
at
December 31, 2013
. Current assets and current liabilities at December 31, 2014,
decreased
by
$409.9 million
and
$149.4 million
, respectively, compared to
December 31, 2013
. The decrease in current assets is primarily due to a
$633.4 million
decrease in cash and cash equivalents, resulting largely from cash used in operations, capital expenditures during 2014 and for common stock repurchases, which were partially offset by an
increase
of
$278.6 million
in the net asset position of the Company’s current derivative contracts. The decrease in current liabilities is primarily due to (a) a
decrease
of
$129.1 million
in accounts payable and accrued expenses largely due to (i) applying drilling prepayments made by third parties in 2013 against costs incurred during 2014, (ii) the sale of the Gulf Properties, and (iii) other changes due primarily to fluctuations in the timing and amount of the payment of expenditures related to exploration and production operations during the year ended
December 31, 2014
, (b) a
decrease
of
$87.1 million
in the current asset retirement obligation resulting from the sale of the Gulf Properties and (c) a decrease of
$34.3 million
in the net liability position of the Company’s current derivative contracts. This decrease was partially offset by an increase of $95.8 million in the current deferred tax liability, which resulted primarily from the increase in value of the Company’s derivative contracts.
69
Cash Flows
The Company’s cash flows for the years ended
December 31, 2014
,
2013
and
2012
are presented in the following table and discussed below:
|
|
Year Ended December 31,
|
||||||||||
|
|
2014
|
2013
|
2012
|
||||||||
|
|
(In thousands)
|
||||||||||
|
Cash flows provided by operating activities
|
$
|
621,114
|
|
$
|
868,630
|
|
$
|
783,160
|
|
||
|
Cash flows (used in) provided by investing activities
|
(857,241
|
)
|
1,070,356
|
|
(2,555,945
|
)
|
|||||
|
Cash flows (used in) provided by financing activities
|
(397,283
|
)
|
(1,434,089
|
)
|
1,874,870
|
|
|||||
|
Net (decrease) increase in cash and cash equivalents
|
$
|
(633,410
|
)
|
$
|
504,897
|
|
$
|
102,085
|
|
||
Cash Flows from Operating Activities
The Company’s operating cash flow is primarily influenced by the prices the Company receives for its oil, natural gas and NGLs, the quantity of oil, natural gas and NGLs it sells, settlements of derivative contracts, and third-party demand for its drilling rigs and oil field services and the rates it is able to charge for these services. The Company’s cash flows from operating activities are also impacted by changes in working capital.
Net cash provided by operating activities for the year ended
December 31, 2014
decreased by $247.5 million, or 28.5% compared to 2013 primarily due to a decrease in oil and natural gas production resulting from the sale of the Gulf Properties in February 2014, as well as changes in operating assets and liabilities during 2014, primarily related to the timing of cash receipts and disbursements.
Net cash provided by operating activities for the year ended December 31, 2013 increased $85.5 million, or 10.9% compared to 2012 due in part to an increase in prices received for oil and natural gas production. Also contributing to the increase were changes in operating assets and liabilities during 2013, primarily related to the timing of cash receipts and disbursements. These changes included a decrease in accounts receivable which was partially offset by an increase in cash paid to settle the Company’s plugging and abandonment obligations, primarily on Gulf of Mexico properties acquired during the second quarter of 2012.
Cash Flows from Investing Activities
The Company dedicates and expects to continue to dedicate a substantial portion of its capital expenditure program toward the exploration for and production of oil and natural gas. These capital expenditures are necessary to offset inherent declines in production and proven reserves, which is typical in the capital-intensive oil and natural gas industry.
Cash flows used in investing activities were $
857.2 million
for the year ended
December 31, 2014
compared to cash flows provided by investing activities of $
1.1 billion
for the year ended December 31, 2013. During 2014, the Company had capital expenditures, excluding acquisitions of
$1.6 billion
, which were partially offset by proceeds from the sale of assets of
$714.5 million
, primarily as a result of the sale of the Gulf Properties. During 2013, the Company received proceeds of $2.6 billion from the sale of the Permian Properties, which were partially offset by capital expenditures during the period. Cash flows used by investing activities of
$2.6 billion
for the year ended December 31, 2012 primarily reflect capital expenditures incurred in the continued development of the Company’s oil properties, primarily in the Mid-Continent, and the acquisition of oil and natural gas properties located in the Gulf of Mexico, which were partially offset by proceeds from the sale of assets during 2012.
70
Capital Expenditures.
The Company’s capital expenditures, on an accrual basis, by segment for the years ended
December 31, 2014
,
2013
and
2012
are summarized below:
|
|
Year Ended December 31,
|
||||||||||
|
|
2014
|
2013
|
2012
|
||||||||
|
|
(In thousands)
|
||||||||||
|
Capital expenditures
|
|||||||||||
|
Exploration and production
|
$
|
1,508,100
|
|
$
|
1,319,012
|
|
$
|
2,001,490
|
|
||
|
Drilling and oil field services
|
18,385
|
|
7,125
|
|
27,527
|
|
|||||
|
Midstream services
|
44,606
|
|
55,706
|
|
80,413
|
|
|||||
|
Other
|
37,798
|
|
42,040
|
|
114,552
|
|
|||||
|
Capital expenditures, excluding acquisitions
|
1,608,889
|
|
1,423,883
|
|
2,223,982
|
|
|||||
|
Acquisitions
|
18,384
|
|
17,028
|
|
840,740
|
|
|||||
|
Total
|
$
|
1,627,273
|
|
$
|
1,440,911
|
|
$
|
3,064,722
|
|
||
Capital expenditures, excluding acquisitions, increased by
$185.0 million
for the year ended
December 31, 2014
compared to
2013
, primarily due to an increase in drilling and leasehold expenditures in the Mid-Continent area.
Capital expenditures, excluding acquisitions, decreased by $800.1 million for the year ended December 31,
2013
compared to
2012
, primarily as a result of an increased focus on capital discipline by the Company’s management.
During the years ended
December 31, 2014
and
2013
, the Company received payments for drilling carries from Atinum and Repsol of approximately
$205.6 million
and
$408.0 million
, respectively, which directly offset the Company’s capital expenditures for the respective periods. As of
December 31, 2014
, both Atinum and Repsol had fully funded their drilling carry commitments.
Cash Flows from Financing Activities
The Company’s financing activities used
$397.3 million
in cash for the year ended
December 31, 2014
compared to using $
1.4 billion
of cash in
2013
. This decrease is due primarily to the redemption of $1.1 billion of senior notes as well as the $62.0 million premium paid in connection with the redemption of these notes during the year ended December 31, 2013, and a decrease of $24.3 million in treasury stock purchases as a result of a reduction in shares of restricted stock that were traded for taxes upon vesting during 2014 compared to 2013. Partially offsetting these decreases were payments in 2014 of
$111.3 million
, net of
$0.5 million
in broker fees and commissions, to repurchase shares of the Company’s common stock, as noted below, and $44.1 million for the early settlement of financing derivatives as a result of the sale of the Gulf Properties.
The Company’s financing activities used $1.4 billion in cash for the year ended
December 31, 2013
compared to providing $1.9 billion of cash in the same period in
2012
. This change was primarily due to making cash payments in 2013 for the redemption of the 9.875% Senior Notes due 2016 and 8.0% Senior Notes due 2018, as noted above, compared to receiving net proceeds in 2012 of (i) $1.1 billion from the issuance of the 7.5% Senior Notes due 2023 and additional 7.5% Senior Notes due 2021, (ii) $730.1 million from the issuance of the 8.125% Senior Notes due 2022, (iii) $587.1 million from the issuance of common units by the Mississippian Trust II, and (iv) $139.4 million from the sale of Mississippian Trust I and Permian Trust common units owned by the Company.
Share Repurchase Program.
On September 4, 2014, the Company announced that its Board of Directors had approved a program to repurchase up to $200.0 million of the Company's common stock. Payments for shares repurchased under the program have been funded using the Company's working capital. During the year ended December 31, 2014,
27.4 million
shares were repurchased under the program for approximately
$111.3 million
, excluding broker fees and commissions, and were immediately retired. See “Note
16
—Equity” to the Company’s consolidated financial statements in Item 8 of this report for additional discussion of the share repurchase program.
71
Indebtedness
Long-term debt consists of the following at
December 31, 2014
(in thousands):
|
8.75% Senior Notes due 2020, net of $4,598 discount
|
$
|
445,402
|
|
|
7.5% Senior Notes due 2021, including premium of $3,486
|
1,178,486
|
|
|
|
8.125% Senior Notes due 2022
|
750,000
|
|
|
|
7.5% Senior Notes due 2023, net of $3,452 discount
|
821,548
|
|
|
|
Total debt
|
$
|
3,195,436
|
|
The indentures governing the senior notes contain covenants imposing certain restrictions on the Company’s activities, including, but not limited to, limitations on the incurrence of indebtedness, payment of dividends, investments, asset sales, certain asset purchases, transactions with related parties and consolidations or mergers. As of and during the year ended
December 31, 2014
, the Company was in compliance with all of the covenants contained in the indentures governing its outstanding Senior Notes.
Senior Credit Facility.
The amount the Company may borrow under its senior credit facility is limited to a borrowing base, and is subject to periodic redeterminations. The Company’s borrowing base is generally redetermined in April and October of each year. The borrowing base is determined based upon the discounted present value of future cash flows attributable to the Company’s proved reserves. Because the value of the Company’s proved reserves is a key factor in determining the amount of the borrowing base, a decrease in such value, whether due to declining commodity prices or a reduction in the Company’s development of reserves would likely cause a reduction in the borrowing base. In connection with the amendment and restatement of the senior credit facility in October 2014, the Company’s borrowing base was increased to $1.2 billion from $775.0 million, and the availability of the borrowing base limited to a facility amount of $900.0 million. On February 23, 2015, in connection with an amendment to the senior credit agreement, the borrowing base was reduced to $900.0 million from $1.2 billion. The next scheduled redetermination is expected to take place in October 2015. Quarterly, the Company pays a commitment fee assessed at an annual rate ranging from
0.375%
to
0.5%
on any available portion of the senior credit facility. The borrowing base is determined based upon the discounted present value of future cash flows attributable to the Company’s proved reserves.
At
December 31, 2014
, the Company had
no
amount outstanding under the senior credit facility and
$11.6 million
in outstanding letters of credit, which reduced the availability under the senior credit facility to
$888.4 million
at
December 31, 2014
. As of and during the year ended
December 31, 2014
, the Company was in compliance with all applicable financial covenants under the senior credit facility.
On November 14, 2014, the Company and its lenders amended the senior credit agreement to waive certain defaults that may have arisen as a result of the Company’s failure to timely deliver its quarterly financial statements for the quarter ended September 30, 2014 and extend the period for delivering the unaudited condensed consolidated statements for such interim period.
On February 23, 2015, the Company and its lenders further amended the credit agreement to address the risk that, in light of depressed oil and natural gas prices, the Company would breach certain financial covenants in 2015. The amendment, among other things, (i) temporarily suspends until June 30, 2016 the financial covenant requiring maintenance of certain levels for the ratio of total net debt to EBITDA, (ii) adopts the financial covenants described below, (iii) permits the incurrence of additional junior debt, which may be secured, in an amount not to exceed $500.0 million, and (iv) increases the applicable margin used in the calculation of interest under the senior credit facility.
The amended senior credit facility is available to be drawn on subject to limitations based on its terms and certain financial covenants, including maintenance of agreed upon levels for the (i) ratio of total debt secured by assets of the Company and certain of its subsidiaries to EBITDA, which may not exceed 2.25:1.00 at each quarter end, calculated using the last four completed fiscal quarters, (ii) ratio of EBITDA to interest expense, which must be at least 2.00:1.00 at March 31, 2015 and June 30, 2015, 1.75:1.00 at September 30, 2015, 1.50:1.00 at each quarter end from December 31, 2015 to September 30, 2016, and 2.00:1.00 at December 31, 2016 and thereafter, calculated using the last four completed fiscal quarters, (iii) ratio of current assets to current liabilities, which must be at least 1.00:1.00 at each quarter end, and (iv) ratio of total net debt to EBITDA, which may not exceed 6.25:1.00 at June 30, 2016, 6.00:1.00 at September 30, 2016 and December 31, 2016, 5.50:1.00 at March 31, 2017 and June 30, 2017, 5.00:1.00 at September 30, 2017 and December 31, 2017 and 4.50:1.00 at March 31, 2018 and thereafter, calculated using annualized EBITDA for the fiscal quarter ended June 30, 2016 and the two subsequent fiscal quarters and otherwise calculated using the last four completed fiscal quarters. If no amounts are drawn under the senior credit facility when calculating the ratio of total net debt to EBITDA, the Company’s debt is reduced by its cash balance in excess of $10.0 million. In the current ratio calculation, any amounts available to be drawn under the senior credit facility are included in current assets, and unrealized assets and liabilities
72
resulting from mark-to-market adjustments on the Company’s derivative contracts are disregarded.
Additionally, the amended senior credit agreement permits the Company and certain of its subsidiaries to incur additional indebtedness in an aggregate principal amount not to exceed $500.0 million, which may be secured solely by collateral securing the senior credit facility on a junior lien basis. Any junior lien debt shall be subject to the terms and conditions set forth in an intercreditor agreement, the terms of which are subject to the approval of the lenders, and shall mature no earlier than January 21, 2020. The borrowing base under the senior credit facility will be reduced by $0.25 for every $1.00 of junior debt incurred. At February 23, 2015, the Company had neither incurred junior debt nor entered into any intercreditor agreement.
Redemption of Senior Notes.
In March 2013, the Company redeemed
$365.5 million
aggregate principal amount of its 9.875% Senior Notes due 2016 and
$750.0 million
aggregate principal amount of its 8.0% Senior Notes due 2018 for total consideration of
$1,061.34
per
$1,000
principal amount and
$1,052.77
per
$1,000
principal amount, respectively. The premium paid to redeem these notes and the expense incurred to write off the remaining associated unamortized debt issuance costs resulted in a loss on extinguishment of debt of
$82.0 million
for the year ended December 31, 2013. The redemption was funded by a portion of the proceeds received from the sale of the Permian Properties.
For more information about the senior credit facility and Senior Notes, see “Note
12
—Long-Term Debt” to the Company’s consolidated financial statements in Item 8 of this report. For information on the future maturities of the Company’s long-term debt, see the table below under “Contractual Obligations and Off-Balance Sheet Arrangements.”
Contractual Obligations and Off-Balance Sheet Arrangements
As of
December 31, 2014
, the Company had future contractual payment commitments under various agreements which are not recorded in the accompanying consolidated balance sheets. A summary of the Company’s contractual obligations as of
December 31, 2014
is provided in the following table (in thousands):
|
|
Payments Due by Period
|
||||||||||||||||||
|
|
Total
|
Less than
1 year
|
1-3 years
|
3-5 years
|
More than
5 years
|
||||||||||||||
|
|
(In thousands)
|
||||||||||||||||||
|
Long-term debt obligations(1)
|
$
|
4,923,076
|
|
$
|
250,313
|
|
$
|
500,625
|
|
$
|
500,625
|
|
$
|
3,671,513
|
|
||||
|
Gas gathering agreement(2)
|
292,719
|
|
42,334
|
|
84,263
|
|
83,528
|
|
82,594
|
|
|||||||||
|
Transportation and throughput agreements
|
71,159
|
|
12,467
|
|
24,965
|
|
21,055
|
|
12,672
|
|
|||||||||
|
Third-party drilling rig agreements(3)
|
31,683
|
|
30,009
|
|
1,674
|
|
—
|
|
—
|
|
|||||||||
|
Asset retirement obligations
|
54,402
|
|
—
|
|
—
|
|
—
|
|
54,402
|
|
|||||||||
|
Operating leases and other(4)
|
35,264
|
|
5,691
|
|
4,740
|
|
1,884
|
|
22,949
|
|
|||||||||
|
Total
|
$
|
5,408,303
|
|
$
|
340,814
|
|
$
|
616,267
|
|
$
|
607,092
|
|
$
|
3,844,130
|
|
||||
|
(1)
|
Includes interest on long-term debt.
|
|
(2)
|
Consists of a gas gathering agreement to deliver certain minimum volumes of natural gas to PGC, an unconsolidated variable interest entity. Pursuant to the agreement, the base fee for gathering services can be reduced if certain criteria are met. The amounts above are based on the base fee per the agreement.
|
|
(3)
|
Includes drilling contracts with third-party drilling rig operators at specified day or footage rates and termination fees associated with the Company’s hydraulic fracturing services agreements. All of the Company’s drilling rig contracts contain operator performance conditions that allow for pricing adjustments or early termination for operator nonperformance.
|
|
(4)
|
Includes the Company’s obligation for the employee and employer match contributions to the participants of its non-qualified deferred compensation plan for eligible highly compensated employees who elect to defer income exceeding the IRS annual limitations on qualified 401(k) retirement plans.
|
In addition to the contractual obligations included in the table above, the Company has a development agreement with the Mississippian Trust II and a treating agreement commitment with Occidental, the future effects of which are not reflected in its consolidated balance sheet at
December 31, 2014
, and are described below.
Development Agreements with Royalty Trusts.
The Company’s development agreement with the Mississippian Trust II obligates the Company to drill, or cause to be drilled, a specified number of wells within an area of mutual interest by December 31,
73
2016. The Company fulfilled its drilling obligation to the Mississippian Trust I during the second quarter of 2013 and fulfilled its drilling obligation to the Permian Trust during the fourth quarter of 2014. The estimated cost to fulfill the drilling obligation remaining at
December 31, 2014
totaled approximately
$8.8 million
.
Treating Agreement
. The Company is required to deliver a total of approximately
3,200
Bcf of CO
2
during the term of a treating agreement with Occidental, which ends in 2041. The Company is obligated to pay Occidental
$0.25
per Mcf to the extent minimum annual CO
2
volume requirements are not met. Through
December 31, 2014
, the Company had delivered to Occidental
54.7
Bcf of CO
2
, which is
300.1
Bcf less than the cumulative minimum for the same period and had accrued associated annual shortfall penalties of approximately
$75.0 million
. Based on current projected natural gas production levels, the Company expects to accrue between approximately
$31.0 million
and
$38.0 million
during the year ending December 31, 2015 for amounts related to the Company’s anticipated shortfall in meeting its 2015 annual delivery obligations. If such under delivered volumes are not made up with commensurate over deliveries in the future, the Company will be obligated to pay Occidental $0.70 per Mcf (approximately
$210.1 million
total) in 2041, which amount has not been accrued as the Company does not currently believe such payment is probable.
If CO
2
volumes delivered to Occidental do not materially increase from current levels, the Company will have the right, beginning in 2020, to reduce future minimum annual CO
2
volume requirements under the agreement by paying Occidental an amount equal to the present value of $0.70 multiplied by such reduced CO
2
volume requirements as designated by the Company. As of
December 31, 2014
, if the Company were to cease delivering natural gas for processing and made no future CO
2
deliveries from such date until 2020, the Company would be required to pay annual delivery shortfall penalties, in the aggregate, of approximately
$292.6 million
for the contract years 2012 through 2019, which includes
$75.0 million
for penalties incurred through
December 31, 2014
. Further, by paying approximately
$291.4 million
in 2020, which includes the present value of $0.70 multiplied by delivery shortfalls incurred through such date, the Company could adjust the future CO
2
volume requirements to zero. This amount will continue to decrease as future deliveries of CO
2
are made. The Company also may terminate the treating agreement at any time, which would require a termination payment by the Company to Occidental of an amount equal to (a) the present value of $0.70 multiplied by the remaining CO
2
volumes required to be delivered under the agreement, plus (b) Occidental’s current net book value of the Century Plant.
The Company has first priority on daily available processing capacity for properly nominated and delivered volumes; however, based on cumulative delivered volumes as of the balance sheet date, if the Company makes no further deliveries from that date until 2025, beginning in 2025 the Century Plant, even if fully utilized, would not have adequate capacity to allow the Company to deliver CO
2
volumes attributable to previously incurred delivery shortfalls at that time.
Valuation Allowance
In 2008 and 2009, the Company recorded full cost ceiling impairments totaling $3.5 billion on its oil and natural gas assets, resulting in the Company being in a net deferred tax asset position. Management considered all available evidence and concluded that it was more likely than not that some or all of the deferred tax assets would not be realized and established a valuation allowance against the Company’s net deferred tax asset in the period ending December 31, 2008. This valuation allowance has been maintained since 2008. See “Note
18
—Income Taxes” to the Company’s consolidated financial statements in Item 8 of this report for more discussion on the establishment of the valuation allowance against the Company’s net deferred tax asset.
Management continues to closely monitor all available evidence in considering whether to maintain a valuation allowance on its net deferred tax asset. Factors considered are, but not limited to, the reversal periods of existing deferred tax liabilities and deferred tax assets, the historical earnings of the Company and the prospects of future earnings. For purposes of the valuation allowance analysis, “earnings” is defined as pre-tax earnings as adjusted for permanent tax adjustments.
The Company was in a cumulative negative earnings position until the 36-month period ended December 31, 2012 at which time it reached cumulative positive earnings. However, as a result of the Company closing the sale of the Permian Properties on February 26, 2013, the Company reverted back to a cumulative negative earnings position for the 36-month period ended March 31, 2013. See “Note
3
- Acquisitions and Divestitures” to the Company’s consolidated financial statements in Item 8 of this report for discussion of the sale of the Permian Properties. Based on net book value, historical costs and proved reserves as of February 26, 2013, the Company recorded a loss on the sale of
$398.9 million
, which caused the Company to report a loss for the year ended December 31, 2013. The Company remains in a cumulative negative earnings position through the 36-month period ended December 31, 2014. The resulting cumulative negative earnings are not a definitive factor in determining to maintain a valuation allowance as all available evidence should be considered, but it is a significant piece of negative evidence in management’s analysis.
The Company’s revenue, profitability and future growth are substantially dependent upon prevailing and future prices
74
for oil and natural gas. The markets for these commodities continue to be volatile. Relatively modest drops in prices can significantly affect the Company’s financial results and impede its growth. Changes in oil and natural gas prices have a significant impact on the value of the Company’s reserves and on its cash flow. Prices for oil and natural gas may fluctuate widely in response to relatively minor changes in the supply of and demand for oil and natural gas and a variety of additional factors that are beyond the Company’s control. Due to these factors, management has placed a lower weight on the prospects of future earnings in its overall analysis of the valuation allowance.
In determining whether to maintain the valuation allowance, management concluded that the objectively verifiable negative evidence of cumulative negative earnings for the 36-month period ending
December 31, 2014
, is difficult to overcome with any forms of positive evidence that may exist. Accordingly, management has not changed its judgment regarding the need for a full valuation allowance against its net deferred tax asset. The valuation allowance against the Company’s net deferred tax asset at
December 31, 2014
was $594.5 million.
Additionally, at
December 31, 2014
, the Company has valuation allowances totaling $55.1 million against specific deferred tax assets for which management has determined it is more likely than not that such deferred tax assets will not be realized for various reasons. The valuation allowance against these specific deferred tax assets would not be impacted by the foregoing discussion.
Critical Accounting Policies and Estimates
The discussion and analysis of the Company’s financial condition and results of operations are based upon the Company’s consolidated financial statements, which have been prepared in accordance with accounting principles generally accepted in the United States of America. The preparation of the Company’s financial statements requires the Company to make assumptions and prepare estimates that affect the reported amounts of assets, liabilities, revenues and expenses and the disclosure of contingent assets and liabilities. The Company bases its estimates on historical experience and various other assumptions that the Company believes are reasonable; however, actual results may differ significantly. Estimates of oil, natural gas and NGL reserves and their values, future production rates and future costs and expenses are inherently uncertain for numerous reasons, including many factors beyond the Company’s control. Reservoir engineering is a subjective process of estimating underground accumulations of oil and natural gas that cannot be measured in an exact manner. The accuracy of any reserve estimate is a function of the quality of data available and of engineering and geological interpretation and judgment. In addition, estimates of reserves may be revised based on actual production, results of subsequent exploration and development activities, prevailing commodity prices, operating costs and other factors. These revisions may be material and could materially affect the Company’s future depletion, depreciation and amortization expenses. The Company’s critical accounting policies and additional information on significant estimates used by the Company are discussed below. See “Note
1
—Summary of Significant Accounting Policies” to the Company’s consolidated financial statements in Item 8 of this report for additional discussion of the Company’s significant accounting policies.
Derivative Financial Instruments.
To manage risks related to fluctuations in prices attributable to its expected oil and natural gas production, the Company enters into oil and natural gas derivative contracts. The Company may also, from time to time, enter into interest rate swaps in order to manage risk associated with its exposure to variable interest rates.
The Company recognizes its derivative instruments as either assets or liabilities at fair value with changes in fair value recognized in earnings unless designated as a hedging instrument with specific hedge accounting criteria having been met. The Company has elected not to designate price risk management activities as accounting hedges under applicable accounting guidance, and, accordingly, accounts for its commodity derivative contracts at fair value with changes in fair value reported currently in earnings. Accordingly, the Company’s earnings may fluctuate significantly as a result of changes in fair value. The Company nets derivative assets and liabilities whenever it has a legally enforceable master netting agreement with the counterparty to a derivative contract. The related cash flow impact of the Company’s derivative activities are reflected as cash flows from operating activities unless the derivative contract contains a significant financing element, in which case, cash settlements are classified as cash flows from financing activities in the consolidated statements of cash flows.
Fair values of the substantial majority of the Company’s commodity derivative financial instruments are determined primarily by using discounted cash flow calculations or option pricing models, and are based upon inputs that are either readily available in the public market, such as oil and natural gas futures prices, volatility factors, interest rates and discount rates, or can be corroborated from active markets. Estimates of future prices are based upon published forward commodity price curves for oil and natural gas instruments. Valuations also incorporate adjustments for the nonperformance risk of the Company or its counterparties, as applicable.
Proved Reserves.
Approximately
86.1%
of the Company’s reserves were estimated by independent petroleum engineers for the year ended
December 31, 2014
. Estimates of proved reserves are based on the quantities of oil, natural gas and NGLs that
75
geological and engineering data demonstrate, with reasonable certainty, to be recoverable in future years from known reservoirs under existing economic and operating conditions. However, there are numerous uncertainties inherent in estimating quantities of proved reserves and in projecting future revenues, rates of production and timing of development expenditures, including many factors beyond the Company’s control. Estimating reserves is a complex process and relies on assumptions and subjective interpretations of available geologic, geophysical, engineering and production data, and the accuracy of reserve estimates is a function of the quality and quantity of available data, engineering and geological interpretation and judgment. In addition, as a result of volatility and changing market conditions, commodity prices and future development costs will change from period to period, causing estimates of proved reserves to change, as well as causing estimates of future net revenues to change. For the years ended
December 31, 2014
,
2013
and
2012
, the Company revised its proved reserves from prior years’ reports by approximately
20.3
MMBoe,
(19.2)
MMBoe and
(112.0)
MMBoe, respectively, due to market prices during or at the end of the applicable period, production performance indicating more (or less) reserves in place, larger (or smaller) reservoir size than initially estimated or additional proved reserve bookings within the original field boundaries. Estimates of proved reserves are key components of the Company’s most significant financial estimates used to determine depreciation and depletion on oil and natural gas properties and its full cost ceiling limitation. Future revisions to estimates of proved reserves may be material and could materially affect the Company’s future depreciation and depletion expenses.
Method of Accounting for Oil and Natural Gas Properties.
The Company’s business is subject to accounting rules that are unique to the oil and natural gas industry. There are two allowable methods of accounting for oil and natural gas business activities: the successful efforts method and the full cost method. The Company uses the full cost method to account for its oil and natural gas properties. All direct costs and certain indirect costs associated with the acquisition, exploration and development of oil and natural gas properties are capitalized. Exploration and development costs include dry well costs, geological and geophysical costs, direct overhead related to exploration and development activities and other costs incurred for the purpose of finding oil, natural gas and NGL reserves. Amortization of oil and natural gas properties is calculated using the unit-of-production method based on estimated proved oil, natural gas and NGL reserves. Sales and abandonments of oil and natural gas properties being amortized are accounted for as adjustments to the full cost pool, with no gain or loss recognized, unless the adjustments would significantly alter the relationship between capitalized costs and proved oil, natural gas and NGL reserves. A significant alteration would not ordinarily be expected to occur upon the sale of reserves involving less than 25% of the proved reserve quantities of a cost center.
Under the successful efforts method, geological and geophysical costs and costs of carrying and retaining undeveloped properties are charged to expense as incurred. Costs of drilling exploratory wells that do not result in proved reserves are charged to expense. Depreciation, depletion and impairment of oil and natural gas properties are generally calculated on a well by well, lease or field basis versus the aggregated “full cost” pool basis. Additionally, gain or loss is generally recognized on all sales of oil and natural gas properties under the successful efforts method. As a result, the Company’s financial statements will differ from companies that apply the successful efforts method since the Company will generally reflect a higher level of capitalized costs as well as a higher oil and natural gas depreciation and depletion rate, and the Company will not have exploration expenses that successful efforts companies frequently have.
Impairment of Oil and Natural Gas Properties.
In accordance with full cost accounting rules, capitalized costs are subject to a limitation. The capitalized cost of oil and natural gas properties, net of accumulated depreciation, depletion and impairment, less related deferred income taxes, may not exceed an amount equal to the present value of future net revenues from proved oil, natural gas and NGL reserves, discounted at 10% per annum, plus the lower of cost or fair value of unproved properties, plus estimated salvage value, less related tax effects (the “ceiling limitation”). The Company calculates its full cost ceiling limitation using the 12-month average oil and natural gas prices for the most recent 12 months as of the balance sheet date and adjusted for basis or location differential, held constant over the life of the reserves. If capitalized costs exceed the ceiling limitation, the excess must be charged to expense. Once incurred, a write-down is not reversible at a later date. The Company recorded a full cost ceiling impairment of
$164.8 million
for the year ended
December 31, 2014
. There were no full cost ceiling impairments recorded during the years ended December 31,
2013
or
2012
.
Unproved Properties.
The balance of unproved properties consists primarily of costs to acquire unproved acreage. These costs are initially excluded from the Company’s amortization base until it is known whether proved reserves will or will not be assigned to the property. The Company assesses all properties, on an individual basis or as a group if properties are individually insignificant, classified as unproved on a quarterly basis for possible impairment or reduction in value. The assessment includes consideration of various factors, including, but not limited to, the following: intent to drill; remaining lease term; geological and geophysical evaluations; drilling results and activity; assignment of proved reserves; and economic viability of development if proved reserves are assigned. During any period in which these factors indicate an impairment, all or a portion of the associated leasehold costs are transferred to the full cost pool and become subject to amortization. Costs of seismic data are allocated to various unproved leaseholds and transferred to the amortization base with the associated leasehold costs on a specific project basis. The Company estimates that substantially all of its costs classified as unproved as of the balance sheet date will be evaluated and
76
transferred within a 10-year period from the date of acquisition, contingent on the Company’s capital expenditures and drilling program.
Property, Plant and Equipment, Net.
Other capitalized costs, including drilling equipment, natural gas gathering and treating equipment, transportation equipment and other property and equipment are carried at cost. Renewals and improvements are capitalized while repairs and maintenance are expensed. Depreciation of such property and equipment is computed using the straight-line method over the estimated useful lives of the assets, which range from 10 to 39 years for buildings and 3 to 30 years for equipment. When property and equipment components are disposed of, the cost and the related accumulated depreciation are removed and any resulting gain or loss is reflected in operations. Realization of the carrying value of property and equipment is reviewed for possible impairment whenever events or changes in circumstances indicate that the carrying value of such asset or asset group may not be recoverable. Assets are considered to be impaired if a forecast of undiscounted estimated future net operating cash flows directly related to the asset or asset group including disposal value if any, is less than the carrying amount of the asset or asset group. If an asset or asset group is determined to be impaired, the impairment loss is measured as the amount by which the carrying amount of the asset or asset group exceeds its fair value. Fair value may be estimated using comparable market data, a discounted cash flow method, or a combination of the two as considered appropriate based on the circumstances. The Company may also determine fair value by using the present value of estimated future cash inflows and/or outflows, or third-party offers or prices of comparable assets with consideration of current market conditions to value its non-financial assets and liabilities when circumstances dictate determining fair value is necessary. Changes in such estimates could cause the Company to reduce the carrying value of property and equipment.
See “Note
8
—Impairment” to the Company’s consolidated financial statements in Item 8 of this report for a discussion of the Company’s impairments.
Asset Retirement Obligations.
Asset retirement obligations represent the estimate of fair value of the cost to plug, abandon and remediate the Company’s wells at the end of their productive lives, in accordance with applicable federal and state laws. The Company estimates the fair value of an asset’s retirement obligation in the period in which the liability is incurred, if a reasonable estimate can be made. Estimating future asset retirement obligations requires management to make estimates and judgments regarding timing, existence of a liability and what constitutes adequate restoration. The Company employs a present value technique to estimate the fair value of an asset retirement obligation, which reflects certain assumptions and requires significant judgment, including an inflation rate, its credit-adjusted, risk-free interest rate, the estimated settlement date of the liability and the estimated current cost to settle the liability based on third-party quotes and current actual costs. Inherent in the present value calculation rates are the timing of settlement and changes in the legal, regulatory, environmental and political environments, which are subject to change. Changes in timing or to the original estimate of cash flows will result in changes to the carrying amount of the liability.
Revenue Recognition and Natural Gas Balancing.
Oil, natural gas and NGL revenues are recorded when title of production sold passes to the customer, net of royalties, discounts and allowances, as applicable. Taxes assessed by governmental authorities on oil, natural gas and NGL sales are presented separately from such revenues and included in production tax expense in the consolidated statements of operations.
The Company accounts for natural gas production imbalances using the sales method, whereby it recognizes revenue on all natural gas sold to its customers notwithstanding the fact that its ownership may be less than 100% of the natural gas sold. Liabilities are recorded for imbalances greater than the Company’s proportionate share of remaining estimated natural gas reserves.
The Company accounted for its construction contract, discussed in “Note
11
—Construction Contracts” to the Company’s consolidated financial statements in Item 8 of this report, using the completed-contract method, under which contract revenues and costs are recognized when work under the contract is completed or substantially completed and assets have been transferred. In the interim, costs incurred on and billings related to contracts in process are accumulated on the consolidated balance sheets. Contract losses are recorded at the time it is determined that a loss will be incurred. Contract gains, if any, are recorded upon substantial completion of the construction project.
The Company recognizes revenues and expenses generated from daywork and footage drilling contracts as the services are performed as the Company does not bear the risk of completion of the well. The Company may receive lump-sum fees for the mobilization of equipment and personnel. Mobilization fees received and costs incurred to mobilize a rig from one location to another are recognized at the time mobilization services are performed.
In general, natural gas purchased and sold by the midstream business is priced at a published daily or monthly index price. Sales to wholesale customers typically incorporate a premium for managing their transmission and balancing requirements. Midstream services revenues are recognized upon delivery of natural gas to customers and/or when services are rendered, pricing is determined and collectability is reasonably assured. Revenues from third-party midstream services are presented on a gross
77
basis, since the Company acts as a principal by taking ownership of the natural gas purchased and taking responsibility of fulfillment for natural gas volumes sold.
Income Taxes.
Deferred income taxes are recorded for temporary differences between financial statement and income tax bases. Temporary differences are differences between the amounts of assets and liabilities reported for financial statement purposes and their tax basis. Deferred tax assets are recognized for temporary differences that will be deductible in future years’ tax returns and for operating loss and tax credit carryforwards. Deferred tax assets are reduced by a valuation allowance if it is deemed more likely than not that some or all of the deferred tax assets will not be realized. Deferred tax liabilities are recognized for temporary differences that will be taxable in future years’ tax returns. As of
December 31, 2014
, the Company continued to have a full valuation allowance against its net deferred tax asset. The valuation allowance serves to reduce the tax benefits recognized from the net deferred tax asset to an amount that is more likely than not to be realized based on the weight of all available evidence.
Variable Interest Entities.
An entity is referred to as a VIE if it possesses one of the following criteria: (i) it is thinly capitalized, (ii) the residual equity holders do not control the entity, (iii) the equity holders are shielded from economic losses, (iv) the equity holders do not participate fully in the entity’s residual economics, or (v) the entity was established with non-substantive voting interests. The Company consolidates a VIE when it has determined it is the primary beneficiary, which requires significant judgment. The primary beneficiary of a VIE is that variable interest holder possessing a controlling financial interest through (i) its power to direct the activities of the VIE that most significantly impact the VIE’s economic performance and (ii) its obligation to absorb losses or its right to receive benefits from the VIE that could potentially be significant to the VIE. In order to determine whether the Company owns a variable interest in a VIE and the significance of the variable interest, the Company performs a qualitative analysis of the entity’s design, organizational structure, primary decision makers and related financial agreements. In addition to the VIEs that the Company consolidates, the Company also holds a variable interest in another VIE that is not consolidated as it was determined that the Company is not the primary beneficiary. The Company monitors both consolidated and unconsolidated VIEs to determine if any events have occurred that could cause the primary beneficiary to change. See “Note
4
—Variable Interest Entities” to the Company’s consolidated financial statements in Item 8 of this report for a discussion of the Company’s VIEs.
Allocation of Purchase Price in Business Combinations.
Accounting for the acquisition of a business requires the allocation of the purchase price to the various assets and liabilities of the acquired business and recording deferred taxes for any differences between the allocated values and tax bases of assets and liabilities. Any excess of the purchase price over the amounts assigned to assets and liabilities is recorded as goodwill.
The purchase price allocation is accomplished by recording each asset and liability at its estimated fair value. Estimated deferred taxes are based on available information concerning the tax basis of the acquired company’s assets and liabilities and tax-related carryforwards at the acquisition date, although such estimates may change in the future as additional information becomes known. The amount of goodwill recorded in any particular business combination can vary significantly depending upon the values attributed to assets acquired and liabilities assumed relative to the total acquisition cost.
In estimating the fair values of assets acquired and liabilities assumed, the Company makes various assumptions. The most significant assumptions relate to the estimated fair values assigned to proved and unproved oil and natural gas properties. To estimate the fair values of these properties, the Company prepares estimates of oil, natural gas and NGL reserves and applies a discount for reserve categories based on industry factors applicable to each acquisition. The prices utilized in the reserves estimates are based upon forward commodity strip prices. Future cash flows are discounted using an industry weighted average cost of capital rate. Estimated fair values assigned to assets acquired can have a significant effect on results of operations in the future. See “Note
3
—Acquisitions and Divestitures” to the Company’s consolidated financial statements in Item 8 of this report for a discussion of the Company’s acquisitions.
New Accounting Pronouncements.
For a discussion of recently adopted accounting standards and recent accounting standards not yet adopted, see “Note
1
—Summary of Significant Accounting Policies” to the Company’s consolidated financial statements in Item 8 of this report.
78
Item 7A.
Quantitative and Qualitative Disclosures About Market Risk
General
This discussion provides information about the financial instruments the Company uses to manage commodity prices and interest rate volatility, including instruments used to manage commodity prices for production attributable to the Royalty Trusts. All contracts are settled in cash and do not require the actual delivery of a commodity at settlement.
Commodity Price Risk.
The Company’s most significant market risk relates to the prices it receives for oil, natural gas and NGLs. Due to the historical price volatility of these commodities, the Company periodically has entered into, and expects in the future to enter into, derivative arrangements for the purpose of reducing the variability of oil and natural gas prices the Company receives for its production. From time to time, the Company enters into commodity pricing derivative contracts for a portion of its anticipated oil and natural gas production volumes depending upon management’s view of opportunities under the then-prevailing current market conditions. The Company’s senior credit facility limits its ability to enter into derivative transactions to 85% of expected production volumes from estimated proved reserves.
The Company uses, and may continue to use, a variety of commodity-based derivative contracts, including fixed price swaps, collars and basis swaps. At
December 31, 2014
, the Company’s commodity derivative contracts consisted of fixed price swaps and collars, which are described below:
|
Fixed price swaps
|
The Company receives a fixed price for the contract and pays a floating market price to the counterparty over a specified period for a contracted volume.
|
|
Basis swaps
|
The Company receives a payment from the counterparty if the settled price differential is greater than the stated terms of the contract and pays the counterparty if the settled price differential is less than the stated terms of the contract, which guarantees the Company a price differential for oil or natural gas from a specified delivery point.
|
|
Collars
|
Two-way collars contain a fixed floor price (put) and a fixed ceiling price (call). If the market price exceeds the call strike price or falls below the put strike price, the Company receives the fixed price and pays the market price. If the market price is between the call and the put strike price, no payments are due from either party.
|
|
Three-way collars have two fixed floor prices (a purchased put and a sold put) and a fixed ceiling price (call). The purchased put establishes a minimum price unless the market price falls below the sold put, at which point the minimum price would be NYMEX plus the difference between the purchased put and the sold put strike price. The call establishes a maximum price (ceiling) the Company will receive for the volumes under the contract.
|
|
The Company’s oil fixed price swap transactions are settled based upon the average daily prices for the calendar month or quarter of the contract period. The Company’s three-way oil collars are settled based upon the arithmetic average of NYMEX oil prices during the calculation period for the relevant contract. The Company’s natural gas fixed price swap transactions are settled based upon the NYMEX prices on the final commodity business day for the relevant contract, and the Company’s natural gas collars are settled based upon the NYMEX prices on the penultimate commodity business day for the relevant contract. The Company’s gas basis swap transactions are settled based upon the differential between the NYMEX Henry Hub price and Platts Inside FERC Panhandle Eastern Pipe Line price. Settlement for oil derivative contracts occurs in the succeeding month or quarter and natural gas derivative contracts are settled in the production month or quarter.
At
December 31, 2014
, the Company’s open commodity derivative contracts consisted of the following:
Oil Price Swaps
|
Notional (MBbls)
|
Weighted Average
Fixed Price
|
|||||
|
January 2015 - December 2015
|
5,588
|
|
$
|
92.44
|
|
|
|
January 2016 - December 2016
|
1,464
|
|
$
|
88.36
|
|
|
79
Natural Gas Price Swaps
|
Notional (MMcf)
|
Weighted Average
Fixed Price
|
|||||
|
January 2015 - December 2015
|
19,900
|
|
$
|
4.51
|
|
|
Natural Gas Basis Swaps
|
Notional (MMcf)
|
Weighted Average
Fixed Price
|
|||||
|
January 2015 - December 2015
|
21,900
|
|
$
|
(0.27
|
)
|
|
Oil Collars - Three-way
|
Notional (MBbls)
|
Sold Put
|
Purchased Put
|
Sold Call
|
|||||||||||
|
January 2015 - December 2015
|
4,576
|
|
$
|
76.56
|
|
$
|
90.28
|
|
$
|
103.48
|
|
|||
|
January 2016 - December 2016
|
2,556
|
|
$
|
83.14
|
|
$
|
90.00
|
|
$
|
100.85
|
|
|||
Natural Gas Collars
|
Notional (MMcf)
|
Collar Range
|
|||||
|
January 2015 - December 2015
|
1,010
|
|
$4.00
|
—
|
$8.55
|
|
Because the Company has not designated any of its derivative contracts as hedges for accounting purposes, changes in fair values of the Company’s derivative contracts are recognized as gains and losses in current period earnings. As a result, the Company’s current period earnings may be significantly affected by changes in the fair value of its commodity derivative contracts. Changes in fair value are principally measured based on future prices as of period-end compared to the contract price.
The Company recorded (gain) loss on commodity derivative contracts of
$(334.0) million
,
$47.1 million
and
$(241.4) million
for the years ended
December 31, 2014
,
2013
and
2012
, respectively, as reflected in the accompanying consolidated statements of operations, which includes net cash payments (receipts) upon settlement of
$32.3 million
,
$(0.8) million
and
$(91.4) million
, respectively. Included in these net cash payments are
$69.6 million
and
$29.6 million
of cash payments related to settlements of commodity derivative contracts with contractual maturities after the year in which they were settled primarily as a result of the sale of the Gulf Properties in February 2014 and the Permian Properties in February 2013, respectively. For the year ended December 31,
2012
, the gain on commodity derivative contracts is net of a non-cash loss of
$117.1 million
resulting from the amendment of certain 2012 derivative contracts to contracts maturing in 2014 and 2015.
See “Note
13
—Derivatives” to the Company’s consolidated financial statements in Item 8 of this report for additional information regarding the Company’s commodity derivatives.
Credit Risk.
All of the Company’s derivative transactions have been carried out in the over-the-counter market. The use of derivative transactions in over-the-counter markets involves the risk that the counterparties may be unable to meet the financial terms of the transactions. The counterparties for all of the Company’s derivative transactions have an “investment grade” credit rating. The Company monitors on an ongoing basis the credit ratings of its derivative counterparties and considers its counterparties’ credit default risk ratings in determining the fair value of its derivative contracts. The Company’s derivative contracts are with multiple counterparties to minimize its exposure to any individual counterparty.
A default by the Company under its senior credit facility constitutes a default under its derivative contracts with counterparties that are lenders under the senior credit facility. The Company does not require collateral or other security from counterparties to support derivative instruments. The Company has master netting agreements with all of its derivative contract counterparties, which allow the Company to net its derivative assets and liabilities with the same counterparty. As a result of the netting provisions, the Company’s maximum amount of loss under derivative transactions due to credit risk is limited to the net amounts due from the counterparties under the derivative contracts. The Company’s loss is further limited as any amounts due from a defaulting counterparty that is a lender under the senior credit facility can be offset against amounts owed, if any, to such counterparty under the Company’s senior credit facility. As of
December 31, 2014
, all of the Company’s open derivative contracts are with counterparties that share in the collateral supporting the Company’s senior credit facility. As a result, the Company is not
80
required to post additional collateral under its derivative contracts. To secure their obligations under the derivative contracts novated by the Company, the Permian Trust and Mississippian Trust II have each given the counterparties to such contracts a lien on their royalty interests. See “Note
4
—Variable Interest Entities” to the Company’s consolidated financial statements in Item 8 of this report for additional information on the Permian Trust’s and Mississippian Trust II’s derivative contracts.
The Company’s ability to fund its capital expenditure budget is partially dependent upon the availability of funds under its senior credit facility. In order to mitigate the credit risk associated with individual financial institutions committed to participate in the senior credit facility, the Company’s bank group currently consists of
27
financial institutions with commitments ranging from
0.15% to 6.00%
of the borrowing base.
Interest Rate Risk.
The Company is exposed to interest rate risk on its long-term fixed rate debt and will be exposed to variable interest rates if it draws on its senior credit facility. Fixed rate debt, where the interest rate is fixed over the life of the instrument, exposes the Company to (i) changes in market interest rates reflected in the fair value of the debt and (ii) the risk that the Company may need to refinance maturing debt with new debt at a higher rate. Variable rate debt, where the interest rate fluctuates, exposes the Company to short-term changes in market interest rates as the Company’s interest obligations on these instruments are periodically redetermined based on prevailing market interest rates, primarily the LIBOR and the federal funds rate. The Company had no outstanding variable rate debt as of
December 31, 2014
.
Prior to its maturity on April 1, 2013, the Company had a $350.0 million notional interest rate swap agreement, which effectively fixed the variable interest rate on the Senior Floating Rate Notes at an annual rate of 6.69% for periods prior to their repurchase and redemption in the third quarter of 2012. The interest rate swap was not designated as a hedge.
The Company recorded an insignificant loss on its interest rate swaps for the year ended December 31, 2013 and recorded a loss of
$1.2 million
for the year ended December 31,
2012
, which are included in interest expense in the consolidated statements of operations. Included in the loss for the years ended December 31,
2013
and
2012
are cash payments upon contract settlement of
$2.4 million
and
$9.2 million
, respectively.
81
Item 8.
Financial Statements and Supplementary Data
The Company’s consolidated financial statements required by this item are included in this report beginning on page F-1.
82
Item 9.
Changes in and Disagreements with Accountants on Accounting and Financial Disclosure
Not applicable.
83
Item 9A.
Controls and Procedures
Disclosure Controls and Procedures
The Company maintains disclosure controls and procedures, as defined in Rules 13a-15(e) and 15d-15(e) of the Securities Exchange Act of 1934, as amended (the “Exchange Act”), consisting of controls and other procedures designed to give reasonable assurance that information the Company is required to disclose in the reports filed or submitted under the Exchange Act is recorded, processed, summarized and reported within the time periods specified in the Securities and Exchange Commission’s rules and forms and that such information is accumulated and communicated to management, including the Company’s Chief Executive Officer and Chief Financial Officer, to allow timely decisions regarding such required disclosure.
As a result of the determination of a material weakness in the Company’s internal control over financial reporting, as further described in Item 8 “Management’s Report on Internal Control over Financial Reporting,” the Company’s Chief Executive Officer and Chief Financial Officer have concluded that the Company’s disclosure controls and procedures were not effective as of
December 31, 2014
.
Remediation Plan
The Company is remediating this material weakness by revising, clarifying and implementing accounting policies and controls related to the shortfall penalty and, among other things, implementing controls for enhanced review of the Occidental penalty to determine if an accrual is appropriate during each interim period. These accounts are subject to ongoing senior management review and Audit Committee oversight. Management believes the foregoing efforts will effectively remediate the material weakness. As the Company continues to evaluate and work to improve its internal control over financial reporting, management may execute additional measures to address the material weakness or modify the remediation plan described and will continue to review and make necessary changes to the overall design of its internal controls.
Management’s Report on Internal Control over Financial Reporting and Report of Independent Registered Public Accounting Firm
The information required to be filed pursuant to this item is set forth under the captions “Management’s Report on Internal Control over Financial Reporting” and “Report of Independent Registered Public Accounting firm” in Item 8 of this report.
Changes in Internal Control over Financial Reporting
There were no changes in the Company’s internal control over financial reporting during the quarter ended
December 31, 2014
that have materially affected, or are reasonably likely to materially affect, the Company’s internal control over financial reporting.
84
Item 9B.
Other Information
On February 23, 2015, the Company and its lenders amended the senior credit facility. Among other things, the amendment:
|
•
|
temporarily suspends until June 30, 2016 the financial covenant requiring maintenance of certain levels for the ratio of total net debt to EBITDA, following which the ratio may not exceed 6.25:1.00 at June 30, 2016, 6.00:1.00 at September 30, 2016 and December 31, 2016, 5.50:1.00 at March 31, 2017 and June 30, 2017, 5.00:1.00 at September 30, 2017 and December 31, 2017 and 4.50:1.00 at March 31, 2018 and thereafter, calculated using annualized EBITDA for the fiscal quarter ended June 30, 2016 and the two subsequent fiscal quarters and otherwise calculated using the last four completed fiscal quarters;
|
|
•
|
adopts additional financial covenants requiring the maintenance of agreed upon levels for the (a) ratio of total debt secured by assets of the Company and certain of its subsidiaries to EBITDA, which may not exceed 2.25:1.00 at each quarter end, calculated using the last four completed fiscal quarters, and (b) ratio of EBITDA to interest expense, which must be at least 2.00:1.00 at March 31, 2015 and June 30, 2015, 1.75:1.00 at September 30, 2015, 1.50:1.00 at each quarter end from December 31, 2015 to September 30, 2016, and 2.00:1.00 at December 31, 2016 and thereafter, calculated using the last four completed fiscal quarters;
|
|
•
|
increases the applicable margin used in the calculation of interest under the senior credit facility to (a) between 1.750% and 2.750% for interest determined by reference to LIBOR, and (b) between 0.750% and 1.750% for interest determined by reference to the base rate;
|
|
•
|
permits the Company and certain of its subsidiaries to incur additional indebtedness in an aggregate principal amount not to exceed $500.0 million, which may be secured solely by collateral securing the senior credit facility on a junior lien basis, provided that such junior debt shall (a) if secured, be subject to the terms and conditions set forth in an intercreditor agreement, (b) mature no earlier than January 21, 2020 and (c) reduce the borrowing base under the senior credit facility by $0.25 for every $1.00 of junior debt incurred; and
|
|
•
|
limits the Company’s ability to make certain restricted payments by (a) reducing the amount of the basket exception to $200.0 million from $400.0 million and (b) requiring that the ratio of total net debt to EBITDA not exceed 4.5:1.0.
|
The amendment also makes other conforming and related changes. In connection with the amendment to the senior credit agreement, the borrowing base was reduced to $900.0 million from $1.2 billion.
The description above is a summary only and is qualified in its entirety by reference to Amendment No. 2 and Scheduled Determination of the Borrowing Base, dated as of February 23, 2015, to the Third Amended and Restated Credit Agreement, filed as Exhibit 10.5.3 and incorporated herein by reference.
85
Item 10.
Directors, Executive Officers and Corporate Governance
The information required by this item is incorporated herein by reference to the following sections of the Company’s definitive proxy statement, which will be filed no later than
April 30, 2015
: “Director Biographical Information,” “Executive Officers,” “Compliance with Section 16(a) of the Exchange Act” and “Corporate Governance Matters.”
86
Item 11.
Executive Compensation
The information required by this item is incorporated herein by reference to the following sections of the Company’s definitive proxy statement, which will be filed no later than
April 30, 2015
: “Director Compensation,” “Outstanding Equity Awards” and “Executive Officers and Compensation.”
87
Item 12.
Security Ownership of Certain Beneficial Owners and Management and Related Stockholder Matters
The information required by this item is incorporated herein by reference to the following sections of the Company’s definitive proxy statement, which will be filed no later than
April 30, 2015
: “Equity Compensation Plan Information” and “Security Ownership of Certain Beneficial Owners and Management.”
88
Item 13.
Certain Relationships and Related Transactions and Director Independence
The information required by this item is incorporated herein by reference to the following sections of the Company’s definitive proxy statement, which will be filed no later than
April 30, 2015
: “Related Party Transactions” and “Corporate Governance Matters.”
89
Item 14.
Principal Accounting Fees and Services
The information required by this item is incorporated herein by reference to the section captioned “Ratification of Selection of Independent Registered Public Accounting Firm” in the Company’s definitive proxy statement, which will be filed no later than
April 30, 2015
.
90
Item 15.
Exhibits and Financial Statement Schedules
The following documents are filed as a part of this report:
(1)
Consolidated Financial Statements
Reference is made to the Index to Consolidated Financial Statements appearing on page F-1.
(2)
Financial Statement Schedules
All financial statement schedules have been omitted because they are not applicable or the required information is presented in the consolidated financial statements or notes thereto.
(3)
Exhibits
91
INDEX TO CONSOLIDATED FINANCIAL STATEMENTS
|
|
Page(s)
|
F-1
Management’s Report on Internal Control over Financial Reporting
Management of SandRidge Energy, Inc. is responsible for establishing and maintaining adequate internal control over financial reporting as defined in Rules 13a-15(f) and 15d-15(f) under the Securities Exchange Act of 1934, as amended (the “Exchange Act”). Internal control over financial reporting is a process designed by, or under the supervision of, the Company’s Chief Executive Officer and Chief Financial Officer to provide reasonable assurance regarding the reliability of financial reporting and the preparation of the Company’s financial statements for external purposes in accordance with generally accepted accounting principles.
Management assessed the effectiveness of the Company’s internal control over financial reporting as of December 31, 2014. In making this assessment, management used the criteria established in
Internal Control-Integrated Framework
issued by the Committee of Sponsoring Organizations of the Treadway Commission (2013) (the COSO criteria). Based on management’s assessment using the COSO criteria, management concluded the Company’s internal control over financial reporting was not effective as of December 31, 2014 due to the material weakness in internal control over financial reporting described below.
A material weakness is a deficiency, or a combination of deficiencies, in internal control over financial reporting, such that there is a reasonable possibility that a material misstatement of the Company’s annual or interim financial statements will not be prevented or detected on a timely basis.
We did not design and maintain effective internal controls because of the absence of a control over the accounting and valuation related to the appropriate interim period in which to record an amount, if any, for the annual CO
2
delivery shortfall penalty under the Company’s 30-year treating agreement with Occidental. Specifically, based on the prior method of accounting for such annual shortfall penalty, management did not evaluate whether an accrual for some or all of such annual penalty was needed within each quarterly period prior to the fourth quarter. Management concluded that this deficiency constituted a material weakness as defined in the Securities and Exchange Commission regulations. This material weakness resulted in the misstatement of accounts payable and accrued expenses and production expense in prior interim period financial statements and caused the Company to restate the unaudited interim financial statements for the periods ended June 30, 2014 and March 31, 2014 and for the unaudited interim financial statements for each of the interim periods in the year ended December 31, 2013. Additionally, this material weakness could result in a misstatement of the aforementioned account balances or disclosures that would result in a material misstatement to the interim consolidated financial statements that would not be prevented or detected.
The effectiveness of the Company’s internal control over financial reporting as of December 31, 2014 has been audited by PricewaterhouseCoopers LLP an independent registered public accounting firm, as stated in its report which appears herein.
|
/s/ J
AMES
D. B
ENNETT
|
|
/s/ E
DDIE
M. L
E
B
LANC
|
|
James D. Bennett
President and Chief Executive Officer
|
|
Eddie M. LeBlanc
Executive Vice President and Chief Financial Officer
|
F-2
Report of Independent Registered Public Accounting Firm
To the Board of Directors and Stockholders of SandRidge Energy, Inc.:
In our opinion, the accompanying consolidated balance sheets and the related consolidated statements of operations, changes in stockholders’ equity and cash flows present fairly, in all material respects, the financial position of SandRidge Energy, Inc. and its subsidiaries at December 31, 2014 and 2013, and the results of their operations and their cash flows for each of the three years in the period ended December 31, 2014
in conformity with accounting principles generally accepted in the United States of America. Also in our opinion, the Company did not maintain, in all material respects, effective internal control over financial reporting as of December 31, 2014, based on criteria established in
Internal Control - Integrated Framework
(2013)
issued by the Committee of Sponsoring Organizations of the Treadway Commission (COSO) because a material weakness in internal control over financial reporting related to the absence of a control over the accounting and valuation related to the appropriate interim period in which to record an amount, if any, for the annual CO
2
delivery shortfall penalty under the Company’s 30-year treating agreement with Occidental existed as of that date. A material weakness is a deficiency, or a combination of deficiencies, in internal control over financial reporting, such that there is a reasonable possibility that a material misstatement of the annual or interim financial statements will not be prevented or detected on a timely basis. The material weakness referred to above is described in the accompanying Management's Report on Internal Control over Financial Reporting. We considered this material weakness in determining the nature, timing, and extent of audit tests applied in our audit of the 2014 consolidated financial statements and our opinion regarding the effectiveness of the Company’s internal control over financial reporting does not affect our opinion on those consolidated financial statements. The Company's management is responsible for these financial statements, for maintaining effective internal control over financial reporting and for its assessment of the effectiveness of internal control over financial reporting included in management's report referred to above. Our responsibility is to express opinions on these financial statements, and on the Company's internal control over financial reporting based on our integrated audits. We conducted our audits in accordance with the standards of the Public Company Accounting Oversight Board (United States). Those standards require that we plan and perform the audits to obtain reasonable assurance about whether the financial statements are free of material misstatement and whether effective internal control over financial reporting was maintained in all material respects. Our audits of the financial statements included examining, on a test basis, evidence supporting the amounts and disclosures in the financial statements, assessing the accounting principles used and significant estimates made by management, and evaluating the overall financial statement presentation. Our audit of internal control over financial reporting included obtaining an understanding of internal control over financial reporting, assessing the risk that a material weakness exists, and testing and evaluating the design and operating effectiveness of internal control based on the assessed risk. Our audits also included performing such other procedures as we considered necessary in the circumstances. We believe that our audits provide a reasonable basis for our opinions.
A company’s internal control over financial reporting is a process designed to provide reasonable assurance regarding the reliability of financial reporting and the preparation of financial statements for external purposes in accordance with generally accepted accounting principles. A company’s internal control over financial reporting includes those policies and procedures that (i) pertain to the maintenance of records that, in reasonable detail, accurately and fairly reflect the transactions and dispositions of the assets of the company; (ii) provide reasonable assurance that transactions are recorded as necessary to permit preparation of financial statements in accordance with generally accepted accounting principles, and that receipts and expenditures of the company are being made only in accordance with authorizations of management and directors of the company; and (iii) provide reasonable assurance regarding prevention or timely detection of unauthorized acquisition, use, or disposition of the company’s assets that could have a material effect on the financial statements.
Because of its inherent limitations, internal control over financial reporting may not prevent or detect misstatements. Also, projections of any evaluation of effectiveness to future periods are subject to the risk that controls may become inadequate because of changes in conditions, or that the degree of compliance with the policies or procedures may deteriorate.
|
/s/ PricewaterhouseCoopers LLP
|
|
|
PricewaterhouseCoopers LLP
|
|
|
Oklahoma City, Oklahoma
|
|
|
February 27, 2015
|
|
F-3
SandRidge Energy, Inc. and Subsidiaries
|
|
December 31,
|
||||||
|
|
2014
|
2013
|
|||||
|
|
(In thousands, except per share data)
|
||||||
|
ASSETS
|
|||||||
|
Current assets
|
|||||||
|
Cash and cash equivalents
|
$
|
181,253
|
|
$
|
814,663
|
|
|
|
Accounts receivable, net
|
330,077
|
|
349,218
|
|
|||
|
Derivative contracts
|
291,414
|
|
12,779
|
|
|||
|
Prepaid expenses
|
7,981
|
|
39,253
|
|
|||
|
Other current assets
|
21,193
|
|
25,910
|
|
|||
|
Total current assets
|
831,918
|
|
1,241,823
|
|
|||
|
Oil and natural gas properties, using full cost method of accounting
|
|||||||
|
Proved (includes development and project costs excluded from amortization of
$53.6
million and $45.6 million at December 31, 2014 and 2013, respectively)
|
11,707,147
|
|
10,972,816
|
|
|||
|
Unproved
|
290,596
|
|
531,606
|
|
|||
|
Less: accumulated depreciation, depletion and impairment
|
(6,359,149
|
)
|
(5,762,969
|
)
|
|||
|
5,638,594
|
|
5,741,453
|
|
||||
|
Other property, plant and equipment, net
|
576,463
|
|
566,222
|
|
|||
|
Derivative contracts
|
47,003
|
|
14,126
|
|
|||
|
Other assets
|
165,247
|
|
121,171
|
|
|||
|
Total assets
|
$
|
7,259,225
|
|
$
|
7,684,795
|
|
|
The accompanying notes are an integral part of these consolidated financial statements.
F-4
SandRidge Energy, Inc., and Subsidiaries
Consolidated Balance Sheets—Continued
|
|
December 31,
|
||||||
|
|
2014
|
2013
|
|||||
|
|
(In thousands, except per share data)
|
||||||
|
LIABILITIES AND EQUITY
|
|||||||
|
Current liabilities
|
|||||||
|
Accounts payable and accrued expenses
|
$
|
683,392
|
|
$
|
812,488
|
|
|
|
Derivative contracts
|
—
|
|
34,267
|
|
|||
|
Asset retirement obligations
|
—
|
|
87,063
|
|
|||
|
Deferred tax liability
|
95,843
|
|
—
|
|
|||
|
Other current liabilities
|
5,216
|
|
—
|
|
|||
|
Total current liabilities
|
784,451
|
|
933,818
|
|
|||
|
Long-term debt
|
3,195,436
|
|
3,194,907
|
|
|||
|
Derivative contracts
|
—
|
|
20,564
|
|
|||
|
Asset retirement obligations
|
54,402
|
|
337,054
|
|
|||
|
Other long-term obligations
|
15,116
|
|
22,825
|
|
|||
|
Total liabilities
|
4,049,405
|
|
4,509,168
|
|
|||
|
Commitments and contingencies (Note 15)
|
|
|
|||||
|
Equity
|
|||||||
|
SandRidge Energy, Inc. stockholders’ equity
|
|||||||
|
Preferred stock, $0.001 par value, 50,000 shares authorized
|
|||||||
|
8.5% Convertible perpetual preferred stock; 2,650 shares issued and outstanding at December 31, 2014 and 2013; aggregate liquidation preference of $265,000
|
3
|
|
3
|
|
|||
|
6.0% Convertible perpetual preferred stock; 2,000 shares issued and outstanding with aggregate liquidation preference of $200,000 at December 31, 2013
|
—
|
|
2
|
|
|||
|
7.0% Convertible perpetual preferred stock; 3,000 shares issued and outstanding at December 31, 2014 and 2013; aggregate liquidation preference of $300,000
|
3
|
|
3
|
|
|||
|
Common stock, $0.001 par value, 800,000 shares authorized; 485,932 issued and 484,819 outstanding at December 31, 2014 and 491,609 issued and 490,290 outstanding at December 31, 2013
|
477
|
|
483
|
|
|||
|
Additional paid-in capital
|
5,204,024
|
|
5,298,301
|
|
|||
|
Additional paid-in capital—stockholder receivable
|
(2,500
|
)
|
(3,750
|
)
|
|||
|
Treasury stock, at cost
|
(6,980
|
)
|
(8,770
|
)
|
|||
|
Accumulated deficit
|
(3,257,202
|
)
|
(3,460,462
|
)
|
|||
|
Total SandRidge Energy, Inc. stockholders’ equity
|
1,937,825
|
|
1,825,810
|
|
|||
|
Noncontrolling interest
|
1,271,995
|
|
1,349,817
|
|
|||
|
Total equity
|
3,209,820
|
|
3,175,627
|
|
|||
|
Total liabilities and equity
|
$
|
7,259,225
|
|
$
|
7,684,795
|
|
|
The accompanying notes are an integral part of these consolidated financial statements.
F-5
SandRidge Energy, Inc. and Subsidiaries
|
|
Years Ended December 31,
|
||||||||||
|
|
2014
|
2013
|
2012
|
||||||||
|
|
(In thousands, except per share amounts)
|
||||||||||
|
Revenues
|
|||||||||||
|
Oil, natural gas and NGL
|
$
|
1,420,879
|
|
$
|
1,820,278
|
|
$
|
1,759,282
|
|
||
|
Drilling and services
|
76,088
|
|
66,586
|
|
116,633
|
|
|||||
|
Midstream and marketing
|
55,658
|
|
58,304
|
|
40,486
|
|
|||||
|
Construction contract
|
—
|
|
23,349
|
|
—
|
|
|||||
|
Other
|
6,133
|
|
14,871
|
|
18,241
|
|
|||||
|
Total revenues
|
1,558,758
|
|
1,983,388
|
|
1,934,642
|
|
|||||
|
Expenses
|
|||||||||||
|
Production
|
346,088
|
|
516,427
|
|
477,154
|
|
|||||
|
Production taxes
|
31,731
|
|
32,292
|
|
47,210
|
|
|||||
|
Cost of sales
|
56,155
|
|
57,118
|
|
68,227
|
|
|||||
|
Midstream and marketing
|
49,905
|
|
53,644
|
|
39,669
|
|
|||||
|
Construction contract
|
—
|
|
23,349
|
|
—
|
|
|||||
|
Depreciation and depletion—oil and natural gas
|
434,295
|
|
567,732
|
|
568,029
|
|
|||||
|
Depreciation and amortization—other
|
59,636
|
|
62,136
|
|
60,805
|
|
|||||
|
Accretion of asset retirement obligations
|
9,092
|
|
36,777
|
|
28,996
|
|
|||||
|
Impairment
|
192,768
|
|
26,280
|
|
316,004
|
|
|||||
|
General and administrative
|
113,991
|
|
207,920
|
|
241,682
|
|
|||||
|
Employee termination benefits
|
8,874
|
|
122,505
|
|
—
|
|
|||||
|
(Gain) loss on derivative contracts
|
(334,011
|
)
|
47,123
|
|
(241,419
|
)
|
|||||
|
Loss on sale of assets
|
10
|
|
399,086
|
|
3,089
|
|
|||||
|
Total expenses
|
968,534
|
|
2,152,389
|
|
1,609,446
|
|
|||||
|
Income (loss) from operations
|
590,224
|
|
(169,001
|
)
|
325,196
|
|
|||||
|
Other income (expense)
|
|||||||||||
|
Interest expense
|
(244,109
|
)
|
(270,234
|
)
|
(303,349
|
)
|
|||||
|
Bargain purchase gain
|
—
|
|
—
|
|
122,696
|
|
|||||
|
Loss on extinguishment of debt
|
—
|
|
(82,005
|
)
|
(3,075
|
)
|
|||||
|
Other income, net
|
3,490
|
|
12,445
|
|
4,741
|
|
|||||
|
Total other expense
|
(240,619
|
)
|
(339,794
|
)
|
(178,987
|
)
|
|||||
|
Income (loss) before income taxes
|
349,605
|
|
(508,795
|
)
|
146,209
|
|
|||||
|
Income tax (benefit) expense
|
(2,293
|
)
|
5,684
|
|
(100,362
|
)
|
|||||
|
Net income (loss)
|
351,898
|
|
(514,479
|
)
|
246,571
|
|
|||||
|
Less: net income attributable to noncontrolling interest
|
98,613
|
|
39,410
|
|
105,000
|
|
|||||
|
Net income (loss) attributable to SandRidge Energy, Inc.
|
253,285
|
|
(553,889
|
)
|
141,571
|
|
|||||
|
Preferred stock dividends
|
50,025
|
|
55,525
|
|
55,525
|
|
|||||
|
Income available (loss applicable) to SandRidge Energy, Inc. common stockholders
|
$
|
203,260
|
|
$
|
(609,414
|
)
|
$
|
86,046
|
|
||
|
Earnings (loss) per share
|
|||||||||||
|
Basic
|
$
|
0.42
|
|
$
|
(1.27
|
)
|
$
|
0.19
|
|
||
|
Diluted
|
$
|
0.42
|
|
$
|
(1.27
|
)
|
$
|
0.19
|
|
||
|
Weighted average number of common shares outstanding
|
|||||||||||
|
Basic
|
479,644
|
|
481,148
|
|
453,595
|
|
|||||
|
Diluted
|
499,743
|
|
481,148
|
|
456,015
|
|
|||||
The accompanying notes are an integral part of these consolidated financial statements.
F-6
SandRidge Energy, Inc. and Subsidiaries
Consolidated Statements of Changes in Stockholders’ Equity
|
|
Convertible
Perpetual
Preferred Stock
|
Common Stock
|
Additional
Paid-In
Capital
|
Treasury
Stock
|
Accumulated
Deficit
|
Non-controlling
Interest
|
Total
|
||||||||||||||||||||||||||
|
|
Shares
|
Amount
|
Shares
|
Amount
|
|||||||||||||||||||||||||||||
|
|
(In thousands)
|
||||||||||||||||||||||||||||||||
|
Balance at December 31, 2011
|
7,650
|
|
$
|
8
|
|
411,953
|
|
$
|
399
|
|
$
|
4,568,856
|
|
$
|
(6,158
|
)
|
$
|
(2,937,094
|
)
|
$
|
922,939
|
|
$
|
2,548,950
|
|
||||||||
|
Issuance of units by royalty trusts
|
—
|
|
—
|
|
—
|
|
—
|
|
—
|
|
—
|
|
—
|
|
587,086
|
|
587,086
|
|
|||||||||||||||
|
Sale of royalty trust units
|
—
|
|
—
|
|
—
|
|
—
|
|
79,056
|
|
—
|
|
—
|
|
60,304
|
|
139,360
|
|
|||||||||||||||
|
Distributions to noncontrolling interest owners
|
—
|
|
—
|
|
—
|
|
—
|
|
—
|
|
—
|
|
—
|
|
(181,727
|
)
|
(181,727
|
)
|
|||||||||||||||
|
Issuance of common stock in acquisition
|
—
|
|
—
|
|
73,962
|
|
74
|
|
542,064
|
|
—
|
|
—
|
|
—
|
|
542,138
|
|
|||||||||||||||
|
Purchase of treasury stock
|
—
|
|
—
|
|
—
|
|
—
|
|
—
|
|
(11,312
|
)
|
—
|
|
—
|
|
(11,312
|
)
|
|||||||||||||||
|
Retirement of treasury stock
|
—
|
|
—
|
|
—
|
|
—
|
|
(11,312
|
)
|
11,312
|
|
—
|
|
—
|
|
—
|
|
|||||||||||||||
|
Stock distributions, net of purchases, - retirement plans
|
—
|
|
—
|
|
(345
|
)
|
—
|
|
2,146
|
|
(2,444
|
)
|
—
|
|
—
|
|
(298
|
)
|
|||||||||||||||
|
Stock-based compensation
|
—
|
|
—
|
|
—
|
|
—
|
|
47,228
|
|
—
|
|
—
|
|
—
|
|
47,228
|
|
|||||||||||||||
|
Stock-based compensation excess tax benefit
|
—
|
|
—
|
|
—
|
|
—
|
|
(16
|
)
|
—
|
|
—
|
|
—
|
|
(16
|
)
|
|||||||||||||||
|
Issuance of restricted stock awards, net of cancellations
|
—
|
|
—
|
|
4,789
|
|
3
|
|
(3
|
)
|
—
|
|
—
|
|
—
|
|
—
|
|
|||||||||||||||
|
Net income
|
—
|
|
—
|
|
—
|
|
—
|
|
—
|
|
—
|
|
141,571
|
|
105,000
|
|
246,571
|
|
|||||||||||||||
|
Convertible perpetual preferred stock dividends
|
—
|
|
—
|
|
—
|
|
—
|
|
—
|
|
—
|
|
(55,525
|
)
|
—
|
|
(55,525
|
)
|
|||||||||||||||
|
Balance at December 31, 2012
|
7,650
|
|
8
|
|
490,359
|
|
476
|
|
5,228,019
|
|
(8,602
|
)
|
(2,851,048
|
)
|
1,493,602
|
|
3,862,455
|
|
|||||||||||||||
|
Sale of royalty trust units
|
—
|
|
—
|
|
—
|
|
—
|
|
7,289
|
|
—
|
|
—
|
|
21,696
|
|
28,985
|
|
|||||||||||||||
|
Distributions to noncontrolling interest owners
|
—
|
|
—
|
|
—
|
|
—
|
|
—
|
|
—
|
|
—
|
|
(206,470
|
)
|
(206,470
|
)
|
|||||||||||||||
|
Contributions from noncontrolling interest owners
|
—
|
|
—
|
|
—
|
|
—
|
|
—
|
|
—
|
|
—
|
|
1,579
|
|
1,579
|
|
|||||||||||||||
|
Purchase of treasury stock
|
—
|
|
—
|
|
—
|
|
—
|
|
—
|
|
(30,126
|
)
|
—
|
|
—
|
|
(30,126
|
)
|
|||||||||||||||
|
Retirement of treasury stock
|
—
|
|
—
|
|
—
|
|
—
|
|
(30,126
|
)
|
30,126
|
|
—
|
|
—
|
|
—
|
|
|||||||||||||||
|
Stock distributions, net of purchases, - retirement plans
|
—
|
|
—
|
|
(99
|
)
|
—
|
|
(267
|
)
|
(168
|
)
|
—
|
|
—
|
|
(435
|
)
|
|||||||||||||||
|
Stock-based compensation
|
—
|
|
—
|
|
—
|
|
—
|
|
88,397
|
|
—
|
|
—
|
|
—
|
|
88,397
|
|
|||||||||||||||
|
Stock-based compensation excess tax benefit
|
—
|
|
—
|
|
—
|
|
—
|
|
(4
|
)
|
—
|
|
—
|
|
—
|
|
(4
|
)
|
|||||||||||||||
|
Payment received on shareholder receivable
|
—
|
|
—
|
|
—
|
|
—
|
|
1,250
|
|
—
|
|
—
|
|
—
|
|
1,250
|
|
|||||||||||||||
|
Issuance of restricted stock awards, net of cancellations
|
—
|
|
—
|
|
30
|
|
7
|
|
(7
|
)
|
—
|
|
—
|
|
—
|
|
—
|
|
|||||||||||||||
|
Net (loss) income
|
—
|
|
—
|
|
—
|
|
—
|
|
—
|
|
—
|
|
(553,889
|
)
|
39,410
|
|
(514,479
|
)
|
|||||||||||||||
|
Convertible perpetual preferred stock dividends
|
—
|
|
—
|
|
—
|
|
—
|
|
—
|
|
—
|
|
(55,525
|
)
|
—
|
|
(55,525
|
)
|
|||||||||||||||
|
Balance at December 31, 2013
|
7,650
|
|
8
|
|
490,290
|
|
483
|
|
5,294,551
|
|
(8,770
|
)
|
(3,460,462
|
)
|
1,349,817
|
|
3,175,627
|
|
|||||||||||||||
|
Sale of royalty trust units
|
—
|
|
—
|
|
—
|
|
—
|
|
4,091
|
|
—
|
|
—
|
|
18,028
|
|
22,119
|
|
|||||||||||||||
|
Distributions to noncontrolling interest owners
|
—
|
|
—
|
|
—
|
|
—
|
|
—
|
|
—
|
|
—
|
|
(193,807
|
)
|
(193,807
|
)
|
|||||||||||||||
|
Purchase of treasury stock
|
—
|
|
—
|
|
—
|
|
—
|
|
—
|
|
(6,373
|
)
|
—
|
|
—
|
|
(6,373
|
)
|
|||||||||||||||
|
Retirement of treasury stock
|
—
|
|
—
|
|
—
|
|
—
|
|
(6,373
|
)
|
6,373
|
|
—
|
|
—
|
|
—
|
|
|||||||||||||||
|
Stock purchases, net of distributions - retirement plans
|
—
|
|
—
|
|
206
|
|
—
|
|
(1,781
|
)
|
1,790
|
|
—
|
|
—
|
|
9
|
|
|||||||||||||||
|
Stock-based compensation
|
—
|
|
—
|
|
—
|
|
—
|
|
23,665
|
|
—
|
|
—
|
|
—
|
|
23,665
|
|
|||||||||||||||
|
Stock-based compensation excess tax benefit
|
—
|
|
—
|
|
—
|
|
—
|
|
14
|
|
—
|
|
—
|
|
—
|
|
14
|
|
|||||||||||||||
|
Payment received on shareholder receivable
|
—
|
|
—
|
|
—
|
|
—
|
|
1,250
|
|
—
|
|
—
|
|
—
|
|
1,250
|
|
|||||||||||||||
|
Issuance of restricted stock awards, net of cancellations
|
—
|
|
—
|
|
3,311
|
|
3
|
|
(3
|
)
|
—
|
|
—
|
|
—
|
|
—
|
|
|||||||||||||||
|
Acquisition of ownership interest
|
—
|
|
—
|
|
—
|
|
—
|
|
(2,074
|
)
|
—
|
|
—
|
|
(656
|
)
|
(2,730
|
)
|
|||||||||||||||
|
Repurchase of common stock
|
—
|
|
—
|
|
(27,411
|
)
|
(27
|
)
|
(111,800
|
)
|
—
|
|
—
|
|
—
|
|
(111,827
|
)
|
|||||||||||||||
|
Conversion of 6% preferred stock
|
(2,000
|
)
|
(2
|
)
|
18,423
|
|
18
|
|
(16
|
)
|
—
|
|
—
|
|
—
|
|
—
|
|
|||||||||||||||
|
Net income
|
—
|
|
—
|
|
—
|
|
—
|
|
—
|
|
—
|
|
253,285
|
|
98,613
|
|
351,898
|
|
|||||||||||||||
|
Convertible perpetual preferred stock dividends
|
—
|
|
—
|
|
—
|
|
—
|
|
—
|
|
—
|
|
(50,025
|
)
|
—
|
|
(50,025
|
)
|
|||||||||||||||
|
Balance at December 31, 2014
|
5,650
|
|
$
|
6
|
|
484,819
|
|
$
|
477
|
|
$
|
5,201,524
|
|
$
|
(6,980
|
)
|
$
|
(3,257,202
|
)
|
$
|
1,271,995
|
|
$
|
3,209,820
|
|
||||||||
The accompanying notes are an integral part of these consolidated financial statements.
F-7
SandRidge Energy, Inc. and Subsidiaries
|
|
Years Ended December 31,
|
||||||||||
|
|
2014
|
2013
|
2012
|
||||||||
|
|
(In thousands)
|
||||||||||
|
CASH FLOWS FROM OPERATING ACTIVITIES
|
|||||||||||
|
Net income (loss)
|
$
|
351,898
|
|
$
|
(514,479
|
)
|
$
|
246,571
|
|
||
|
Adjustments to reconcile net income (loss) to net cash provided by operating activities
|
|||||||||||
|
Depreciation, depletion and amortization
|
493,931
|
|
629,868
|
|
628,834
|
|
|||||
|
Accretion of asset retirement obligations
|
9,092
|
|
36,777
|
|
28,996
|
|
|||||
|
Impairment
|
192,768
|
|
26,280
|
|
316,004
|
|
|||||
|
Debt issuance costs amortization
|
9,425
|
|
10,091
|
|
14,388
|
|
|||||
|
Amortization of discount, net of premium, on long-term debt
|
529
|
|
1,036
|
|
2,592
|
|
|||||
|
Bargain purchase gain
|
—
|
|
—
|
|
(122,696
|
)
|
|||||
|
Loss on extinguishment of debt
|
—
|
|
82,005
|
|
3,075
|
|
|||||
|
Deferred income tax provision (benefit)
|
—
|
|
3,842
|
|
(100,288
|
)
|
|||||
|
(Gain) loss on derivative contracts
|
(334,011
|
)
|
47,123
|
|
(241,419
|
)
|
|||||
|
Cash received (paid) on settlement of derivative contracts
|
11,796
|
|
(5,879
|
)
|
125,932
|
|
|||||
|
Loss on sale of assets
|
10
|
|
399,086
|
|
3,089
|
|
|||||
|
Stock-based compensation
|
19,994
|
|
85,270
|
|
42,795
|
|
|||||
|
Other
|
407
|
|
3,929
|
|
1,387
|
|
|||||
|
Changes in operating assets and liabilities (decreasing) increasing cash
|
|||||||||||
|
Receivables
|
(63,492
|
)
|
90,048
|
|
(141,534
|
)
|
|||||
|
Costs in excess of billings
|
—
|
|
11,229
|
|
(11,229
|
)
|
|||||
|
Prepaid expenses
|
9,549
|
|
(7,934
|
)
|
(5,952
|
)
|
|||||
|
Other current assets
|
3,164
|
|
(3,269
|
)
|
(1,586
|
)
|
|||||
|
Other assets and liabilities, net
|
(1,132
|
)
|
5,777
|
|
34,447
|
|
|||||
|
Accounts payable and accrued expenses
|
(66,492
|
)
|
101,453
|
|
44,115
|
|
|||||
|
Asset retirement obligations
|
(16,322
|
)
|
(133,623
|
)
|
(84,361
|
)
|
|||||
|
Net cash provided by operating activities
|
621,114
|
|
868,630
|
|
783,160
|
|
|||||
|
CASH FLOWS FROM INVESTING ACTIVITIES
|
|||||||||||
|
Capital expenditures for property, plant and equipment
|
(1,553,332
|
)
|
(1,496,731
|
)
|
(2,146,372
|
)
|
|||||
|
Acquisitions of assets
|
(18,384
|
)
|
(17,028
|
)
|
(840,740
|
)
|
|||||
|
Proceeds from sale of assets
|
714,475
|
|
2,584,115
|
|
431,167
|
|
|||||
|
Net cash (used in) provided by investing activities
|
(857,241
|
)
|
1,070,356
|
|
(2,555,945
|
)
|
|||||
|
CASH FLOWS FROM FINANCING ACTIVITIES
|
|||||||||||
|
Proceeds from borrowings
|
—
|
|
—
|
|
1,850,344
|
|
|||||
|
Repayments of borrowings
|
—
|
|
(1,115,500
|
)
|
(366,029
|
)
|
|||||
|
Premium on debt redemption
|
—
|
|
(61,997
|
)
|
(844
|
)
|
|||||
|
Debt issuance costs
|
(3,947
|
)
|
(91
|
)
|
(48,538
|
)
|
|||||
|
Proceeds from issuance of royalty trust units
|
—
|
|
—
|
|
587,086
|
|
|||||
|
Proceeds from the sale of royalty trust units
|
22,119
|
|
28,985
|
|
139,360
|
|
|||||
|
Noncontrolling interest distributions
|
(193,807
|
)
|
(206,470
|
)
|
(181,727
|
)
|
|||||
|
Noncontrolling interest contributions
|
—
|
|
1,579
|
|
—
|
|
|||||
|
Acquisition of ownership interest
|
(2,730
|
)
|
—
|
|
—
|
|
|||||
|
Stock-based compensation excess tax benefit
|
14
|
|
(4
|
)
|
(16
|
)
|
|||||
|
Purchase of treasury stock
|
(8,702
|
)
|
(32,976
|
)
|
(14,723
|
)
|
|||||
|
Repurchase of common stock
|
(111,827
|
)
|
—
|
|
—
|
|
|||||
|
Dividends paid—preferred
|
(55,525
|
)
|
(55,525
|
)
|
(55,525
|
)
|
|||||
|
Payment received on shareholder receivable
|
1,250
|
|
1,250
|
|
—
|
|
|||||
|
Cash (paid) received on settlement of financing derivative contracts
|
(44,128
|
)
|
6,660
|
|
(34,518
|
)
|
|||||
|
Net cash (used in) provided by financing activities
|
(397,283
|
)
|
(1,434,089
|
)
|
1,874,870
|
|
|||||
|
NET (DECREASE) INCREASE IN CASH AND CASH EQUIVALENTS
|
(633,410
|
)
|
504,897
|
|
102,085
|
|
|||||
|
CASH AND CASH EQUIVALENTS, beginning of year
|
814,663
|
|
309,766
|
|
207,681
|
|
|||||
|
CASH AND CASH EQUIVALENTS, end of year
|
$
|
181,253
|
|
$
|
814,663
|
|
$
|
309,766
|
|
||
The accompanying notes are an integral part of these consolidated financial statements.
F-8
SandRidge Energy, Inc. and Subsidiaries
Notes to Consolidated Financial Statements
1. Summary of Significant Accounting Policies
Nature of Business.
SandRidge Energy, Inc. is an oil and natural gas company with a principal focus on exploration and production activities in the Mid-Continent region of the United States. The Company owns and operates additional interests in west Texas. The Company also operates businesses and infrastructure systems that are complementary to its primary exploration and production activities, including gas gathering and processing facilities, marketing operations, a saltwater gathering and disposal system, an electrical transmission system and a drilling and related oil field services business.
Principles of Consolidation.
The consolidated financial statements include the accounts of the Company and its wholly owned or majority owned subsidiaries and variable interest entities (“VIEs”) for which the Company is the primary beneficiary. Noncontrolling interest represents third-party ownership interests in the Company’s subsidiaries and consolidated VIEs and is included as a component of equity in the consolidated balance sheets and consolidated statements of changes in equity. All significant intercompany accounts and transactions have been eliminated in consolidation.
Variable Interest Entities.
An entity is referred to as a VIE if it possesses one of the following criteria: (i) it is thinly capitalized, (ii) the residual equity holders do not control the entity, (iii) the equity holders are shielded from economic losses, (iv) the equity holders do not participate fully in the entity’s residual economics, or (v) the entity was established with non-substantive voting interests. The Company consolidates a VIE when it has determined it is the primary beneficiary, which requires significant judgment. The primary beneficiary of a VIE is that variable interest holder possessing a controlling financial interest through (i) its power to direct the activities of the VIE that most significantly impact the VIE’s economic performance and (ii) its obligation to absorb losses or its right to receive benefits from the VIE that could potentially be significant to the VIE. In order to determine whether the Company owns a variable interest in a VIE and the significance of the variable interest, the Company performs a qualitative analysis of the entity’s design, organizational structure, primary decision makers and related financial agreements. In addition to the VIEs that the Company consolidates, the Company also holds a variable interest in another VIE that is not consolidated as it was determined that the Company is not the primary beneficiary. The Company monitors both consolidated and unconsolidated VIEs to determine if any events have occurred that could cause the primary beneficiary to change. See Note
4
for discussion of the Company’s significant associated VIEs.
Use of Estimates.
The preparation of the consolidated financial statements in conformity with accounting principles generally accepted in the United States of America (“GAAP”) requires management to make estimates and assumptions that affect the reported amounts of assets and liabilities and disclosure of contingent assets and liabilities at the date of the financial statements and the reported amounts of revenues and expenses during the reporting period.
The more significant areas requiring the use of assumptions, judgments and estimates include: oil, natural gas and NGL reserves; cash flow estimates used in impairment tests of long-lived assets; depreciation, depletion and amortization; asset retirement obligations; assignments of fair value and allocations of purchase price in connection with business combinations; determinations of significant alterations to the full cost pool and related estimates of fair value for allocations of divested oil and natural gas properties that result in substantial economic differences between the properties divested and the properties remaining; income taxes; valuation of derivative instruments; contingencies; and accrued revenue and related receivables. Although management believes these estimates are reasonable, actual results could differ significantly.
Cash and Cash Equivalents.
The Company considers all highly-liquid instruments with an original maturity of three months or less to be cash equivalents as these instruments are readily convertible to known amounts of cash and bear insignificant risk of changes in value due to their short maturity period.
Accounts Receivable, Net.
The Company has receivables for sales of oil, natural gas and NGLs, as well as receivables related to the exploration, production and treating services for oil and natural gas. An allowance for doubtful accounts has been established based on management’s review of the collectability of the receivables in light of historical experience, the nature and volume of the receivables and other subjective factors. Accounts receivable are charged against the allowance, upon approval by management, when they are deemed uncollectible. Refer to Note
6
for further information on the Company’s accounts receivable and allowance for doubtful accounts.
F-9
SandRidge Energy, Inc. and Subsidiaries
Notes to Consolidated Financial Statements - (Continued)
Fair Value of Financial Instruments.
Certain of the Company’s financial assets and liabilities are measured at fair value. Fair value represents the price that would be received to sell an asset or paid to transfer a liability in an orderly transaction between market participants. The Company’s financial instruments, not otherwise recorded at fair value, consist primarily of cash, trade receivables, trade payables and long-term debt. The carrying value of cash, trade receivables and trade payables are considered to be representative of their respective fair values due to the short-term maturity of these instruments. See Note
5
for further discussion of the Company’s fair value measurements.
Fair Value of Non-financial Assets and Liabilities.
The Company also applies fair value accounting guidance to initially, or as events dictate, measure non-financial assets and liabilities such as those obtained through business acquisitions, property, plant and equipment and asset retirement obligations. These assets and liabilities are subject to fair value adjustments only in certain circumstances and are not subject to recurring revaluations. Fair value may be estimated using comparable market data, a discounted cash flow method, or a combination of the two as considered appropriate based on the circumstances. Under the discounted cash flow method, estimated future cash flows are based on management’s expectations for the future and include estimates of future oil and natural gas production or other applicable sales estimates, operational costs and a risk-adjusted discount rate. The Company may use the present value of estimated future cash inflows and/or outflows or third-party offers or prices of comparable assets with consideration of current market conditions to value its non-financial assets and liabilities when circumstances dictate determining fair value is necessary. Given the significance of the unobservable nature of a number of the inputs, these are considered Level 3 on the fair value hierarchy discussed in Note
5
.
Derivative Financial Instruments.
To manage risks related to fluctuations in prices attributable to its expected oil and natural gas production, the Company enters into oil and natural gas derivative contracts. The Company may also, from time to time, enter into interest rate swaps in order to manage risk associated with its exposure to variable interest rates.
The Company recognizes its derivative instruments as either assets or liabilities at fair value with changes in fair value recognized in earnings unless designated as a hedging instrument with specific hedge accounting criteria having been met. The Company has elected not to designate price risk management activities as accounting hedges under applicable accounting guidance, and, accordingly, accounts for its commodity derivative contracts at fair value with changes in fair value reported currently in earnings. The Company nets derivative assets and liabilities whenever it has a legally enforceable master netting agreement with the counterparty to a derivative contract. The related cash flow impact of the Company’s derivative activities are reflected as cash flows from operating activities unless the derivative contract contains a significant financing element, in which case, cash settlements are classified as cash flows from financing activities in the consolidated statements of cash flows. See Note
13
for further discussion of the Company’s derivatives.
Oil and Natural Gas Operations.
The Company uses the full cost method to account for its oil and natural gas properties. Under full cost accounting, all costs directly associated with the acquisition, exploration and development of oil, natural gas and NGL reserves are capitalized into a full cost pool. These capitalized costs include costs of all unproved properties and internal costs directly related to the Company’s acquisition, exploration and development activities and capitalized interest. The Company capitalized internal costs of
$55.4 million
,
$74.7 million
and
$61.3 million
to the full cost pool in
2014
,
2013
and
2012
, respectively. Capitalized costs are amortized using the unit-of-production method. Under this method, depreciation and depletion is computed at the end of each quarter by multiplying total production for the quarter by a depletion rate. The depletion rate is determined by dividing the total unamortized cost base plus future development costs by net equivalent proved reserves at the beginning of the quarter.
Costs associated with unproved properties are excluded from the amortizable cost base until a determination has been made as to the existence of proved reserves. Unproved properties are reviewed at the end of each quarter to determine whether the costs incurred should be reclassified to the full cost pool and, thereby, subjected to amortization. The costs associated with unproved properties relate primarily to costs to acquire unproved acreage. Unproved leasehold costs are transferred to the amortization base with the costs of drilling the related well upon determination of the existence of proved reserves or upon impairment of a lease. All items classified as unproved property are assessed, on an individual basis or as a group if properties are individually insignificant, on a quarterly basis for possible impairment or reduction in value. The assessment includes consideration of various factors, including, but not limited to, the following: intent to drill; remaining lease term; geological and geophysical evaluations; drilling results and activity; assignment of proved reserves; and economic viability of development if proved reserves are assigned. During any period in which these factors indicate an impairment, all or a portion of the associated leasehold costs are transferred to the full cost pool and become subject to amortization. Costs of seismic data are allocated to various unproved leaseholds and transferred to the amortization base with the associated leasehold costs on a specific project basis.
Under the full cost method of accounting, total capitalized costs of oil and natural gas properties, net of accumulated depreciation, depletion and impairment, less related deferred income taxes may not exceed an amount equal to the present value of future net revenues from proved reserves, discounted at 10% per annum, plus the lower of cost or fair value of unproved properties, plus estimated salvage value, less the related tax effects (the “ceiling limitation”). A ceiling limitation calculation is
F-10
SandRidge Energy, Inc. and Subsidiaries
Notes to Consolidated Financial Statements - (Continued)
performed at the end of each quarter. If total capitalized costs, net of accumulated depreciation, depletion and impairment, less related deferred taxes are greater than the ceiling limitation, a write-down or impairment of the full cost pool is required. A write-down of the carrying value of the full cost pool is a non-cash charge that reduces earnings and impacts stockholders’ equity in the period of occurrence and typically results in lower depreciation and depletion expense in future periods. Once incurred, a write-down is not reversible at a later date.
The ceiling limitation calculation is prepared using the 12-month oil and natural gas average price for the most recent 12 months as of the balance sheet date and as adjusted for basis or location differentials, held constant over the life of the reserves (“net wellhead prices”). If applicable, these net wellhead prices would be further adjusted to include the effects of any fixed price arrangements for the sale of oil and natural gas. Derivative contracts that qualify and are designated as cash flow hedges are included in estimated future cash flows, although the Company historically has not designated any of its derivative contracts as cash flow hedges and has therefore not included its derivative contracts in estimating future cash flows. The future cash outflows associated with future development or abandonment of wells are included in the computation of the discounted present value of future net revenues for purposes of the ceiling limitation calculation.
Sales and abandonments of oil and natural gas properties being amortized are accounted for as adjustments to the full cost pool, with no gain or loss recognized, unless the adjustments would significantly alter the relationship between capitalized costs and proved oil, natural gas and NGL reserves. A significant alteration would not ordinarily be expected to occur upon the sale of reserves involving less than
25%
of the proved reserve quantities of a cost center.
Property, Plant and Equipment, Net.
Other capitalized costs, including drilling equipment, natural gas gathering and treating equipment, transportation equipment and other property and equipment are carried at cost. Renewals and improvements are capitalized while repairs and maintenance are expensed. Depreciation of such property and equipment is computed using the straight-line method over the estimated useful lives of the assets, which range from
10
to
39
years for buildings and
3
to
30
years for equipment. When property and equipment components are disposed of, the cost and the related accumulated depreciation are removed and any resulting gain or loss is reflected in the consolidated statements of operations.
Realization of the carrying value of property and equipment is reviewed for possible impairment whenever events or changes in circumstances indicate that the carrying value of such asset may not be recoverable. Assets are considered to be impaired if a forecast of undiscounted estimated future net operating cash flows directly related to the asset or asset group including disposal value, if any, is less than the carrying amount of the asset or asset group. If an asset or asset group is considered to be impaired, the impairment loss is measured as the amount by which the carrying amount of the asset or asset group exceeds its fair value. See Note
8
for further discussion of impairments.
Capitalized Interest.
Interest is capitalized on assets being made ready for use using a weighted average interest rate based on the Company’s borrowings outstanding during that time. During
2014
,
2013
and
2012
, interest of approximately
$14.7 million
,
$11.7 million
and
$10.1 million
, respectively, was capitalized on unproved properties that were not currently being depreciated or depleted and on which exploration activities were in progress. Additionally, interest of
$5.0 million
,
$4.9 million
and
$4.7 million
was capitalized in
2014
,
2013
and
2012
, respectively, on midstream and corporate assets which were under construction.
Debt Issuance Costs.
The Company amortizes debt issuance costs related to its long-term debt as interest expense over the scheduled maturity period of the related debt. The Company includes unamortized debt issuance costs in other assets in the consolidated balance sheets. Upon retirement of debt, any unamortized costs are written off and included in the determination of the gain or loss on extinguishment of debt.
Restricted Deposits
. Restricted deposits represent bank trust and escrow accounts required by the Bureau of Ocean Energy Management, Bureau of Safety and Environmental Enforcement, surety bond underwriters, purchase agreements or other settlement agreements to satisfy the Company’s eventual responsibility to plug and abandon wells and remove structures when certain offshore fields are no longer in use. Such restricted deposits are included in other assets in the accompanying consolidated balance sheet as of December 31, 2013. The Company did not have restricted deposits as of December 31, 2014.
Goodwill.
During the year ended December 31, 2012, the Company impaired goodwill previously recorded and assigned to its exploration and production segment in conjunction with an acquisition in 2010. See Note
8
for further discussion of the goodwill impairment test performed.
Investments.
Investments in marketable equity securities have been designated as available for sale and measured at fair value pursuant to the fair value option which requires unrealized gains and losses be reported in earnings.
Asset Retirement Obligations.
The Company owns oil and natural gas properties that require expenditures to plug, abandon and remediate wells at the end of their productive lives, in accordance with applicable federal and state laws. Liabilities for these
F-11
SandRidge Energy, Inc. and Subsidiaries
Notes to Consolidated Financial Statements - (Continued)
asset retirement obligations are recorded in the period in which the liability is incurred (at the time the wells are drilled or acquired) at the estimated present value at the asset’s inception, with the offsetting increase to property cost. These property costs are depreciated on a unit-of-production basis within the full cost pool. The liability accretes each period until it is settled or the well is sold, at which time the liability is removed. Both the accretion and the depreciation are included in the consolidated statement of operations. The Company determines its asset retirement obligations by calculating the present value of estimated expenses related to the liability. Estimating future asset retirement obligations requires management to make estimates and judgments regarding timing, existence of a liability and what constitutes adequate restoration. Inherent in the present value calculation rates are the timing of settlement and changes in the legal, regulatory, environmental and political environments, which are subject to change. See Note
14
for further discussion of the Company’s asset retirement obligations.
In certain instances, the Company may be required to maintain deposits to escrow accounts for future plugging and abandonment obligations. See
Restricted Deposits
discussed above.
Revenue Recognition and Natural Gas Balancing.
Sales of oil, natural gas and NGLs are recorded when title of oil, natural gas and NGL production passes to the customer, net of royalties, discounts and allowances, as applicable. Taxes assessed by governmental authorities on oil, natural gas and NGL sales are presented separately from such revenues and included in production tax expense in the consolidated statements of operations.
The Company accounts for natural gas production imbalances using the sales method, whereby it recognizes revenue on all natural gas sold to its customers notwithstanding the fact that its ownership may be less than 100% of the natural gas sold. Liabilities are recorded for imbalances greater than the Company’s proportionate share of remaining estimated natural gas reserves. The Company has recorded a liability for natural gas imbalance positions related to natural gas properties with insufficient proved reserves of
$1.4 million
and
$2.6 million
at
December 31, 2014
and
2013
, respectively. The Company includes the gas imbalance positions in other long-term obligations in the consolidated balance sheets.
The Company accounted for its construction contract, discussed in Note
11
, using the completed-contract method, under which contract revenues and costs are recognized when work under the contract is completed or substantially completed and assets have been transferred. In the interim, costs incurred on and billings related to contracts in process are accumulated on the balance sheet. Contract losses are recorded at the time it is determined that a loss will be incurred. Contract gains, if any, are recorded upon substantial completion of the construction project.
The Company recognizes revenues and expenses generated from daywork and footage drilling contracts as the services are performed as the Company does not bear the risk of completion of the well. The Company may receive lump-sum fees for the mobilization of equipment and personnel. Mobilization fees received and costs incurred to mobilize a rig from one location to another are recognized at the time mobilization services are performed.
In general, natural gas purchased and sold by the midstream business is priced at a published daily or monthly index price. Sales to wholesale customers typically incorporate a premium for managing their transmission and balancing requirements. Midstream services revenues are recognized upon delivery of natural gas to customers and/or when services are rendered, pricing is determined and collectability is reasonably assured. Revenues from third-party midstream services are presented on a gross basis, since the Company acts as a principal by taking ownership of the natural gas purchased and taking responsibility of fulfillment for natural gas volumes sold.
Stock-Based Compensation.
The Company grants restricted stock awards to members of its Board of Directors (the “Board”) and its employees. Such awards and the related stock-based compensation cost are measured based on the calculated fair value of the award on the grant date. The expense, net of estimated forfeitures, is recognized on a straight-line basis over the employee’s requisite service period, generally the vesting period of the award. To the extent stock-based compensation cost relates to employees directly involved in exploration and development activities, such amounts are capitalized to oil and natural gas properties. Amounts not capitalized are recognized as general and administrative expense, production expense, cost of sales and midstream and marketing expense in the consolidated statements of operations. The related excess tax benefit received upon vesting of restricted stock, if any, is reflected in the consolidated statements of cash flows as a financing activity. The related excess tax expense due upon vesting of restricted stock, if any, is reflected in the consolidated statements of cash flows as an operating activity.
Performance Unit Compensation.
The Company awards performance units, which contain a market-based performance component with cash settlement at the end of the performance period, to certain members of senior management. The Company recognizes a liability and expense for performance unit compensation for the portion earned over the requisite service period in an amount equal to the fair value of the performance units granted. Changes in the fair value of the units for which service has been met are recognized as compensation expense with a corresponding adjustment to the liability. To the extent performance unit compensation cost relates to those directly involved in exploration and development activities, such amounts are capitalized
F-12
SandRidge Energy, Inc. and Subsidiaries
Notes to Consolidated Financial Statements - (Continued)
to oil and natural gas properties. Amounts not capitalized are recognized as general and administrative expense, production expense, cost of sales and midstream and marketing expense in the consolidated statements of operations.
Advertising Costs.
The Company expenses advertising costs as incurred. Advertising and promotional costs were
$1.3 million
,
$5.1 million
, and
$11.8 million
, respectively, during the years ended December 31,
2014
,
2013
and
2012
.
Income Taxes.
Deferred income taxes reflect the net tax effects of temporary differences between the amounts of assets and liabilities reported for financial statement purposes and their tax basis. Deferred tax assets are reduced by a valuation allowance if it is deemed more likely than not that some or all of the deferred tax assets will not be realized.
The Company has elected an accounting policy in which interest and penalties on income taxes are presented as a component of the income tax provision, rather than as a component of interest expense. Interest and penalties resulting from the underpayment or the late payment of income taxes due to a taxing authority and interest and penalties accrued relating to income tax contingencies, if any, are presented, on a net of tax basis, as a component of the income tax provision.
Earnings per Share.
Basic earnings per common share is calculated by dividing earnings available to common stockholders by the weighted average number of common shares outstanding during the period. Diluted earnings per common share is calculated by dividing earnings available to common stockholders by the weighted average number of diluted common shares outstanding, which includes the effect of potentially dilutive securities. Potentially dilutive securities for the diluted earnings per share calculation consist of unvested restricted stock awards, using the treasury method, and convertible preferred stock. When a loss exists, all potentially dilutive securities are anti-dilutive and are therefore excluded from the computation of diluted earnings per share. See Note
19
for the Company’s earnings per share calculation.
Commitments and Contingencies.
Liabilities for loss contingencies arising from claims, assessments, litigation or other sources are recorded when it is probable that a liability has been incurred and the amount can be reasonably estimated. Environmental expenditures are expensed or capitalized, as appropriate, depending on future economic benefit. Expenditures that relate to an existing condition caused by past operations and that have no future economic benefit are expensed. Liabilities related to future costs are recorded on an undiscounted basis when environmental assessments and/or remediation activities are probable and costs can be reasonably estimated. See Note
15
for discussion of the Company’s commitments and contingencies.
Concentration of Risk.
All of the Company’s derivative transactions have been carried out in the over-the-counter market. The entry into derivative transactions in the over-the-counter market involves the risk that the counterparties may be unable to meet the financial terms of the transactions. The counterparties for all of the Company’s derivative transactions have an “investment grade” credit rating. The Company monitors on an ongoing basis the credit ratings of its derivative counterparties and considers its counterparties’ credit default risk ratings in determining the fair value of its derivative contracts. The Company’s derivative contracts are with multiple counterparties to minimize its exposure to any individual counterparty.
A default by the Company under its senior secured revolving credit facility (the “senior credit facility”) constitutes a default under its derivative contracts with counterparties that are lenders under the senior credit facility. The Company does not require collateral or other security from counterparties to support derivative instruments. The Company has master netting agreements with all of its derivative counterparties, which allow the Company to net its derivative assets and liabilities with the same counterparty. As a result of the netting provisions, the Company’s maximum amount of loss under derivative transactions due to credit risk is limited to the net amounts due from the counterparties under the derivative contracts. The Company’s loss is further limited as any amounts due from a defaulting counterparty that is a lender under the senior credit facility can be offset against amounts owed, if any, to such counterparty under the Company’s senior credit facility.
The Company operates a substantial portion of its oil and natural gas properties. As the operator of a property, the Company makes full payment for costs associated with the property and seeks reimbursement from the other working interest owners in the property for their share of those costs. The Company’s joint interest partners consist primarily of independent oil and natural gas producers. If the oil and natural gas exploration and production industry in general was adversely affected, the ability of the joint interest partners to reimburse the Company could be adversely affected.
The purchasers of the Company’s oil, natural gas and NGL production consist primarily of independent marketers, major oil and natural gas companies and gas pipeline companies. See Note
22
for information regarding the Company’s major customers. The Company believes alternate purchasers are available in its areas of operations and does not believe the loss of any one purchaser would materially affect the Company’s ability to sell the oil, natural gas and NGLs it produces.
Recent Accounting Pronouncements Not Yet Adopted.
In April 2014, the FASB issued Accounting Standards Update (“ASU”) 2014-08, “Reporting Discontinued Operations and Disclosures of Disposals of Components of an Entity”, which amends the definition of a discontinued operations to elevate the threshold for a disposal transaction to qualify as a discontinued operation and requires entities to provide additional disclosures for disposal transactions that do not meet the discontinued operations criteria.
F-13
SandRidge Energy, Inc. and Subsidiaries
Notes to Consolidated Financial Statements - (Continued)
The guidance is effective prospectively for all disposals (except disposals classified as held for sale before the adoption date) or components initially classified as held for sale in periods beginning on or after December 15, 2014, with early adoption permitted. The guidance will be adopted January 1, 2015 and the Company is currently evaluating the impact of the adoption on its classification of future dispositions as discontinued operations.
In May 2014, the FASB issued ASU 2014-09, “Revenue from Contracts with Customers,” which outlines a single comprehensive model for entities to use in accounting for revenue arising from contracts with customers and supersedes most current revenue recognition guidance, including industry-specific guidance. The core principle requires that an entity recognize revenue to depict the transfer of promised goods or services to customers in an amount that reflects the consideration to which the entity expects to be entitled in exchange for those goods or services. Certain of the provisions also amend or supersede existing guidance applicable to the recognition of a gain or loss on transfers of nonfinancial assets that are not an output of an entity’s ordinary activities, including sales of property, plant and equipment and real estate. The requirements of the guidance is effective for annual reporting periods beginning after December 15, 2016, including interim periods within that reporting period with an option of using either a full retrospective or a modified approach for adoption. The Company is currently evaluating the effect, if any, that the updated standard will have on its consolidated financial statements and related disclosures.
In August 2014, the FASB issued ASU 2014-15, “Disclosure of Uncertainties about an Entity’s Ability to Continue as a Going Concern,” which provides guidance on determining when and how to disclose going-concern uncertainties in the financial statements. The new standard requires management to perform interim and annual assessments of an entity’s ability to continue as a going concern within one year of the date the financial statements are issued. An entity must provide certain disclosures if “conditions or events raise substantial doubt about the entity’s ability to continue as a going concern.” The guidance is effective for annual periods ending after December 15, 2016, and interim periods thereafter, with early adoption permitted. The Company is currently evaluating the effect the guidance will have on its related disclosures.
In February 2015, the FASB issued ASU 2015-02, "Amendments to the Consolidation Analysis," which makes changes to both the variable interest model and the voting model, affecting all reporting entities involved with limited partnerships or similar entities, particularly industries such as the oil and gas, transportation and real estate sectors. In addition to reducing the number of consolidation models from four to two, the guidance simplifies and improves current guidance by placing more emphasis on risk of loss when determining a controlling financial interest and reducing the frequency of the application of related-party guidance when determining a controlling financial interest in a VIE. The requirements of the guidance are effective for annual reporting periods beginning after December 15, 2015, including interim periods within that reporting period, with early adoption permitted. The Company is currently evaluating the effect, if any, that the updated standard will have on its consolidated financial statements and related disclosures.
2
. Supplemental Cash Flow Information
Supplemental disclosures to the consolidated statements of cash flows are presented below:
|
|
Years Ended December 31,
|
||||||||||
|
|
2014
|
2013
|
2012
|
||||||||
|
|
(In thousands)
|
||||||||||
|
Supplemental Disclosure of Cash Flow Information
|
|||||||||||
|
Cash paid for interest, net of amounts capitalized
|
$
|
(235,793
|
)
|
$
|
(274,850
|
)
|
$
|
(257,152
|
)
|
||
|
Cash received (paid) for income taxes
|
$
|
1,928
|
|
$
|
(4,610
|
)
|
$
|
(1,324
|
)
|
||
|
Supplemental Disclosure of Noncash Investing and Financing Activities
|
|||||||||||
|
Deposit on pending sale
|
$
|
—
|
|
$
|
(255,000
|
)
|
$
|
255,000
|
|
||
|
Change in accrued capital expenditures
|
$
|
(55,557
|
)
|
$
|
72,848
|
|
$
|
(77,610
|
)
|
||
|
Asset retirement costs capitalized
|
$
|
4,968
|
|
$
|
5,078
|
|
$
|
7,479
|
|
||
|
Common stock issued in connection with acquisition
|
$
|
—
|
|
$
|
—
|
|
$
|
542,138
|
|
||
F-14
SandRidge Energy, Inc. and Subsidiaries
Notes to Consolidated Financial Statements - (Continued)
3
. Acquisitions and Divestitures
2012 Acquisitions and Divestitures
Sale of Working Interests and Associated Drilling Carry Commitment.
In January 2012, the Company completed a transaction whereby it sold working interests in the Mississippian formation to Repsol E&P USA, Inc. (“Repsol”). The Company received cash proceeds of
$272.5 million
for the sale of working interests and received a drilling carry commitment to fund a portion of its future drilling and completion costs within an area of mutual interest in the amount of
$750.0 million
. Proceeds received from this transaction were reflected as a reduction of oil and gas properties with
no
gain or loss recognized. See additional discussion of the associated drilling carry under this agreement and a similar agreement entered into in 2011 with Atinum MidCon I, LLC (“Atinum”) in Note 7.
Dynamic Acquisition.
The Company acquired
100%
of the equity interests of Dynamic Offshore Resources, LLC (“Dynamic”) in April 2012 for total consideration of approximately
$1.2 billion
, comprised of approximately
$680.0 million
in cash and approximately
74 million
shares of SandRidge common stock (the “Dynamic Acquisition”). The Dynamic Acquisition expanded the Company’s presence in the Gulf of Mexico, adding oil, natural gas and NGL reserves and production to its existing asset base in this area.
F-15
SandRidge Energy, Inc. and Subsidiaries
Notes to Consolidated Financial Statements - (Continued)
In the second quarter of 2013, the Company completed its valuation of the Dynamic Acquisition with no adjustments in 2013 to the valuation of assets acquired and liabilities assumed, which are included in the following table (in thousands, except stock price):
|
Consideration(1)
|
|
||
|
Shares of SandRidge common stock issued
|
73,962
|
|
|
|
SandRidge common stock price
|
$
|
7.33
|
|
|
Fair value of common stock issued
|
542,138
|
|
|
|
Cash consideration(2)
|
680,000
|
|
|
|
Cash balance adjustment(3)
|
13,091
|
|
|
|
Total purchase price
|
$
|
1,235,229
|
|
|
Fair Value of Liabilities Assumed
|
|||
|
Current liabilities
|
$
|
129,363
|
|
|
Asset retirement obligations(4)
|
315,922
|
|
|
|
Long-term deferred tax liability(5)
|
100,288
|
|
|
|
Other long-term liabilities
|
4,469
|
|
|
|
Amount attributable to liabilities assumed
|
550,042
|
|
|
|
Total purchase price plus liabilities assumed
|
1,785,271
|
|
|
|
Fair Value of Assets Acquired
|
|||
|
Current assets
|
142,027
|
|
|
|
Oil and natural gas properties(6)
|
1,746,753
|
|
|
|
Other property, plant and equipment
|
1,296
|
|
|
|
Other non-current assets
|
17,891
|
|
|
|
Amount attributable to assets acquired
|
1,907,967
|
|
|
|
Bargain purchase gain(7)
|
$
|
(122,696
|
)
|
|
(1)
|
Consideration paid by the Company consisted of
74 million
shares of SandRidge common stock and cash of approximately
$680.0 million
. The value of the stock consideration is based upon the closing price of
$7.33
per share of SandRidge common stock on April 17, 2012, which was the closing date of the Dynamic Acquisition. Under the acquisition method of accounting, the purchase price is determined based on the total cash paid and the fair value of SandRidge common stock issued on the acquisition date.
|
|
(2)
|
Cash consideration paid, including amounts paid to retire Dynamic’s long-term debt, was funded through a portion of the net proceeds from the Company’s issuance of
$750.0 million
of unsecured
8.125%
Senior Notes due 2022.
|
|
(3)
|
In accordance with the acquisition agreement, the Company remitted to the seller a cash payment equal to Dynamic’s average daily cash balance for the 30-day period ending on the second day prior to closing. This resulted in an additional cash payment by the Company of
$13.1 million
at closing.
|
|
(4)
|
The estimated fair value of the acquired asset retirement obligations was determined using the Company’s credit adjusted risk-free rate.
|
|
(5)
|
The net deferred tax liability is primarily a result of the difference between the estimated fair value and the Company’s expected tax basis in the assets acquired and liabilities assumed. The net deferred tax liability also includes the effects of deferred tax assets associated with net operating losses and other tax attributes acquired as a result of the Dynamic Acquisition.
|
|
(6)
|
The fair value of oil and natural gas properties acquired was estimated using a discounted cash flow model, with future cash flows estimated based upon projections of oil and natural gas reserve quantities and weighted average oil and natural gas prices of
$113.62
per barrel of oil and
$3.83
per Mcf of natural gas, after adjustment for transportation fees and regional price differentials. The commodity prices utilized were based upon commodity strip prices as of April 17, 2012 for the first
four
years and escalated for inflation at a rate of
2.0%
annually beginning with the fifth year through the end of production. Future cash flows were discounted using an industry weighted average cost of capital rate.
|
|
(7)
|
The bargain purchase gain resulted from the excess of the fair value of net assets acquired over consideration paid. To validate the bargain purchase gain on this acquisition, the Company reviewed its initial identification and valuation of assets acquired and liabilities assumed. The Company believes it was able to acquire Dynamic for less than the estimated fair value of its net assets due to their offshore location resulting in less bidding competition.
|
F-16
SandRidge Energy, Inc. and Subsidiaries
Notes to Consolidated Financial Statements - (Continued)
Market assumptions of future commodity prices, projections of estimated quantities of oil, natural gas and NGL reserves, expectations for timing and amount of future development and operating costs, projections of future rates of production, expected recovery rates and risk-adjusted discount rates were used by the Company to estimate the fair market value of the oil and natural gas properties acquired. Based on the unobservable nature of certain of these assumptions, the valuation is considered Level 3 under the fair value hierarchy, as described in Note
5
.
The following unaudited pro forma combined results of operations for the year ended December 31, 2012 are presented as though the Dynamic Acquisition had been completed as of January 1, 2011. The pro forma combined results of operations for the year ended December 31, 2012 have been prepared by adjusting the historical results of the Company to include the historical results of Dynamic, certain reclassifications to conform Dynamic’s presentation and accounting policies to the Company’s and to exclude the bargain purchase gain, the partial valuation allowance release and certain acquisition costs. The supplemental pro forma results of operations are provided for illustrative purposes only and do not purport to be indicative of the actual results that would have been achieved by the combined company for the periods presented. The pro forma results of operations do not include any cost savings or other synergies that resulted from the Dynamic Acquisition or any estimated costs incurred to integrate Dynamic.
|
|
Year Ended December 31, 2012(1)
|
||
|
|
(In thousands, except per share data)
|
||
|
(Unaudited)
|
|||
|
Revenues
|
$
|
2,112,576
|
|
|
Net income
|
$
|
39,563
|
|
|
Loss applicable to SandRidge Energy, Inc. common stockholders
|
$
|
(120,962
|
)
|
|
Loss per common share
|
|||
|
Basic
|
$
|
(0.25
|
)
|
|
Diluted
|
$
|
(0.25
|
)
|
____________________
|
(1)
|
Pro forma net income, loss applicable to SandRidge Energy, Inc. common stockholders and loss per common share exclude a
$122.7 million
bargain purchase gain, a
$100.3 million
partial valuation allowance release included in income tax benefit,
$10.9 million
of fees incurred to secure financing for the Dynamic Acquisition included in interest expense and
$13.0 million
of transaction costs incurred and included in general and administrative expense in the accompanying consolidated statement of operations for the year ended December 31, 2012.
|
Revenues of
$365.0 million
and income from operations of
$81.5 million
associated with Dynamic are included in the accompanying consolidated statement of operations for the year ended December 31, 2012. Additionally, the Company incurred
$13.0 million
in acquisition-related costs for the Dynamic Acquisition, which are included in general and administrative expense in the accompanying consolidated statement of operations for the year ended December 31, 2012.
Sale of Tertiary Recovery Properties.
In June 2012, the Company sold its tertiary recovery properties located in the Permian Basin area of west Texas for approximately
$130.8 million
, net of post-closing adjustments. The sale of the acreage and working interests in wells was accounted for as an adjustment to the full cost pool with
no
gain or loss recognized.
Acquisition of Gulf of Mexico Properties.
In June 2012, the Company acquired oil and natural gas properties in the Gulf of Mexico (the “Gulf of Mexico Properties”) for approximately
$43.3 million
, net of purchase price and post-closing adjustments. This acquisition expanded the Company’s presence in the Gulf of Mexico, adding oil, natural gas and NGL reserves and production to its existing asset base in this area.
This acquisition qualified as a business combination for accounting purposes and, as such, the Company estimated the fair value of the acquired properties as of June 20, 2012, which was the date on which the Company obtained control of the properties. The fair value was estimated using a discounted cash flow model based upon market assumptions of future commodity prices, projections of estimated quantities of oil, natural gas and NGL reserves, expectations for timing and amount of future development and operating costs, projections of future rates of production, expected recovery rates and risk-adjusted discount rates. Based on the unobservable nature of certain of these assumptions, the valuation is considered Level 3 under the fair value hierarchy, as described in Note
5
.
The Company estimated the consideration paid for these properties approximated the consideration that would be paid by a typical market participant. As a result, no goodwill or bargain purchase gain was recognized in conjunction with the purchase of these properties.
F-17
SandRidge Energy, Inc. and Subsidiaries
Notes to Consolidated Financial Statements - (Continued)
The Company completed its valuation of assets acquired and liabilities assumed related to the acquired Gulf of Mexico Properties in the first quarter of 2013 and updated estimates used in the preliminary purchase price allocation with respect to certain accruals, resulting in an adjustment of
$4.8 million
to proved developed and undeveloped properties. The following table summarizes the consideration paid to acquire the properties and the final valuation of assets acquired and liabilities assumed as of June 20, 2012 (in thousands):
|
Consideration paid
|
|
||
|
Cash, net of purchase price adjustments
|
$
|
43,282
|
|
|
Fair value of identifiable assets acquired and liabilities assumed
|
|
||
|
Proved developed and undeveloped properties
|
$
|
98,725
|
|
|
Asset retirement obligations
|
(55,443
|
)
|
|
|
Total identifiable net assets
|
$
|
43,282
|
|
The following unaudited pro forma combined results of operations for the year ended December 31, 2012 are presented as though the Company acquired the Gulf of Mexico Properties as of January 1, 2011. The pro forma combined results of operations for the year ended December 31, 2012 have been prepared by adjusting the historical results of the Company to include the historical results of the acquired properties and estimates of the effect of the transaction on the combined results. The supplemental pro forma results of operations are provided for illustrative purposes only and do not purport to be indicative of the actual results that would have been achieved had the transaction been in effect for the periods presented.
|
|
Year Ended December 31, 2012
|
||
|
|
(In thousands, except per share data)
|
||
|
(Unaudited)
|
|||
|
Revenues
|
$
|
1,963,058
|
|
|
Net income
|
$
|
247,035
|
|
|
Income available to SandRidge Energy, Inc. common stockholders
|
$
|
86,510
|
|
|
Earnings per common share
|
|||
|
Basic
|
$
|
0.19
|
|
|
Diluted
|
$
|
0.19
|
|
Revenues of
$26.2 million
and earnings of
$19.1 million
generated by the acquired properties are included in the accompanying consolidated statement of operations for the year ended December 31, 2012. The Company incurred
$0.2 million
in acquisition-related costs in conjunction with the transaction which are included in general and administrative expense in the accompanying consolidated statement of operations for the year ended December 31, 2012.
2013 Divestiture
Sale of Permian Properties.
On February 26, 2013, the Company sold its oil and natural gas properties in the Permian Basin area of west Texas, excluding the assets associated with the SandRidge Permian Trust area of mutual interest (the “Permian Properties”) for
$2.6 billion
, including certain post-closing adjustments that were finalized in the third quarter of 2013. This transaction resulted in a significant alteration of the relationship between the Company’s capitalized costs and proved reserves and, accordingly, the Company recorded a
$398.9 million
loss on the sale. The loss is included in loss on sale of assets in the accompanying consolidated statement of operations for the year ended December 31, 2013. The loss was calculated based on a comparison of proceeds received and the asset retirement obligations attributable to the Permian Properties that were assumed by the buyer to the sum of (i) an allocation of the historical net book value of the Company’s proved oil and natural gas properties attributable to the Permian Properties, (ii) the historical cost of unproved acreage sold and (iii) costs incurred by the Company to sell these properties. The allocated net book value attributable to the Permian Properties was calculated based on the relative fair value of the Permian Properties and the remaining proved oil and natural gas properties retained by the Company as of the date of sale. A portion of the loss totaling
$71.7 million
was allocated to noncontrolling interests and is reflected in net income attributable to noncontrolling interest in the accompanying consolidated statement of operations for the year ended December 31, 2013.
F-18
SandRidge Energy, Inc. and Subsidiaries
Notes to Consolidated Financial Statements - (Continued)
The following table presents revenues and direct operating expenses of the Permian Properties included in the accompanying consolidated statements of operations for the years ended December 31, 2013 and 2012 (in thousands):
|
Year Ended December 31,
|
||||||||
|
2013(1)
|
2012
|
|||||||
|
Revenues
|
$
|
68,027
|
|
$
|
566,075
|
|
||
|
Direct operating expenses
|
$
|
17,453
|
|
$
|
130,337
|
|
||
____________________
|
(1)
|
Includes revenues and direct operating expenses through February 26, 2013, the date of sale.
|
2014 Divestiture
Sale of Gulf of Mexico and Gulf Coast Properties.
On
February 25, 2014
, the Company sold subsidiaries that owned the Company’s Gulf of Mexico and Gulf Coast oil and natural gas properties (the “Gulf Properties”) for approximately
$702.6 million
, net of working capital adjustments and post-closing adjustments, and the buyer’s assumption of approximately
$366.0 million
of related asset retirement obligations to Fieldwood Energy LLC (“Fieldwood”). This transaction did not result in a significant alteration of the relationship between the Company’s capitalized costs and proved reserves and, accordingly, the Company recorded the proceeds as a reduction of its full cost pool with no gain or loss on the sale. See Note
20
for discussion of Fieldwood’s related party affiliation with the Company.
In accordance with the terms of the sale, the Company agreed to guarantee on behalf of Fieldwood certain plugging and abandonment obligations associated with the Gulf Properties for a period of up to one year from the date of closing. The Company recorded a liability equal to the fair value of these guarantees, or
$9.4 million
, at the time the transaction closed. As of
December 31, 2014
, the fair value of the guarantees was approximately
$5.1 million
. See Note
5
for additional discussion of the determination of the guarantees’ fair value. The guarantees do not include a limit on the potential future payments for which the Company could be obligated; however, Fieldwood agreed to indemnify the Company for any costs it may incur as a result of the guarantees and to use its best efforts to pay any amounts sought from the Company by the Bureau of Ocean Energy Management that may arise prior to the expiration of the guarantees. Additionally, Fieldwood agreed to maintain, for a period of up to one year from the closing date, restricted deposits totaling approximately
$28.0 million
held in escrow for plugging and abandonment obligations associated with the Gulf Properties. At the one year anniversary of the closing date, the Company was scheduled to receive payment from Fieldwood for half of such restricted deposits, or approximately
$14.0 million
. A receivable for this amount is included in other current assets in the accompanying consolidated balance sheet at
December 31, 2014
. The Company has not incurred any costs as a result of this guarantee, which, as of February 25, 2015, it was permitted to terminate under the terms of the agreement with Fieldwood, and expects to receive approximately $14.0 million from Fieldwood for half of the restricted deposits associated with the Gulf Properties in the first quarter of 2015.
The following table presents revenues and expenses, including direct operating expenses, depletion, accretion of asset retirement obligations and general and administrative expenses, for the Gulf Properties included in the accompanying consolidated statements of operations for the years ended
December 31, 2014
,
2013
and
2012
(in thousands):
|
|
Year Ended December 31,
|
||||||||||
|
|
2014(1)
|
2013
|
2012
|
||||||||
|
Revenues
|
$
|
90,920
|
|
$
|
627,236
|
|
$
|
449,420
|
|
||
|
Expenses
|
$
|
63,674
|
|
$
|
491,991
|
|
$
|
360,209
|
|
||
|
(1)
|
Includes revenues and expenses through
February 25, 2014
, the date of the sale.
|
4
. Variable Interest Entities
The Company’s significant associated VIEs, including those for which the Company has determined it is the primary beneficiary and those for which it has determined it is not, are described below.
Royalty Trusts
SandRidge owns beneficial interests in the SandRidge Mississippian Trust I (the “Mississippian Trust I”), the Permian Trust and SandRidge Mississippian Trust II (the “Mississippian Trust II”) (each individually, a “Royalty Trust” and collectively, the “Royalty Trusts”). The Royalty Trusts are considered VIEs due to the lack of voting or similar decision-making rights of the Royalty Trusts’ equity holders regarding activities that have a significant effect on the economic success of the Royalty Trusts.
F-19
SandRidge Energy, Inc. and Subsidiaries
Notes to Consolidated Financial Statements - (Continued)
The Company has determined it is the primary beneficiary of the Royalty Trusts as it has (a) the power to direct the activities that most significantly impact the economic performance of the Royalty Trusts through (i) its participation in the creation and structure of the Royalty Trusts, (ii) the manner in which it fulfilled or will fulfill its drilling obligations to the Royalty Trusts as discussed below and (iii) its operation of a majority of the oil and natural gas properties that are subject to the conveyed royalty interests and marketing of the associated production, and (b) the obligation to absorb losses and right to receive residual returns, through its variable interests in the Royalty Trusts, including ownership of common and/or subordinated units, that could potentially be significant to the Royalty Trusts. As a result, the Company consolidates the activities of the Royalty Trusts. The common units of the Royalty Trusts owned by third parties are reflected as noncontrolling interest in the consolidated financial statements.
Common and subordinated units outstanding as of
December 31, 2014
for each Royalty Trust are as follows:
|
Mississippian Trust I (1)
|
Permian Trust
|
Mississippian Trust II
|
|||||||
|
Total outstanding common units(1)
|
28,000,000
|
|
39,375,000
|
|
37,293,750
|
|
|||
|
Total outstanding subordinated units(2)
|
—
|
|
13,125,000
|
|
12,431,250
|
|
|||
____________________
|
(1)
|
The Mississippian Trust I’s previously outstanding subordinated units, all of which were held by SandRidge, converted to common units on July 1, 2014.
|
|
(2)
|
All outstanding subordinated units are owned by SandRidge.
|
The Company’s beneficial interest in the Royalty Trusts at December 31, 2014 and 2013 were as follows:
|
December 31,
|
|||||
|
2014
|
2013
|
||||
|
Mississippian Trust I
|
26.9
|
%
|
26.9
|
%
|
|
|
Permian Trust
|
25.0
|
%
|
28.5
|
%
|
|
|
Mississippian Trust II
|
37.6
|
%
|
37.6
|
%
|
|
Royalty Interests.
Concurrent with the closing of the Mississippian Trust I and the Permian Trust initial public offerings in 2011 and the closing of the Mississippian Trust II initial public offering in 2012, the Company conveyed certain royalty interests to each Royalty Trust in exchange for (i) the net proceeds of the offering and (ii) common and subordinated units representing beneficial interests in the Royalty Trust. Royalty interests conveyed to the Royalty Trusts were in certain existing wells and wells to be drilled on oil and natural gas properties leased by the Company in defined areas of mutual interest. Proceeds from the Mississippian Trust II initial public offering of
$587.1 million
are included as cash flows from financing activities in the accompanying consolidated statement of cash flows for the year ended December 31, 2012.
Pursuant to the agreements governing the Royalty Trusts, the Mississippian Trust I will terminate in 2030 and the Permian Trust and Mississippian Trust II will terminate in 2031. Upon termination,
50%
of the royalty interests conveyed to the Royalty Trust will automatically revert to the Company, and the remaining
50%
will be sold, with the proceeds distributed to the Royalty Trust unitholders.
Drilling Obligations.
The Company and one of its wholly owned subsidiaries entered into a development agreement with each Royalty Trust upon conveyance of the royalty interests that obligated the Company to drill, or cause to be drilled, a specified number of wells which are also subject to the royalty interests within respective areas of mutual interest by a specified date. One of the Company’s wholly owned subsidiaries also granted to each Royalty Trust a lien on the Company’s interests in the properties where the development wells were to be drilled in order to secure the estimated amount of drilling costs for the Royalty Trust’s interests in the wells. The total amount that may be recovered by each Royalty Trust under its respective lien has been proportionately reduced as the Company has drilled and completed the associated development wells. The Company fulfilled its drilling obligation to the Mississippian Trust I in the second quarter of 2013 and fulfilled its obligation to the Permian Trust in the fourth quarter of 2014 and the related liens were released. As of
December 31, 2014
, the total maximum amount recoverable by the Mississippian Trust II under the remaining lien was approximately
$19.5 million
. The Company is obligated to fulfill its drilling obligation to the Mississippian Trust II by December 31, 2016.
Distributions.
The Royalty Trusts make quarterly cash distributions to unitholders based on calculated distributable income. Outstanding subordinated units, which constitute
25%
of each Royalty Trust’s total outstanding units during the subordination period as described below, are entitled to receive pro rata distributions from the Royalty Trusts each quarter if and to the extent there is sufficient cash to provide a cash distribution on the common units that is no less than the applicable quarterly
F-20
SandRidge Energy, Inc. and Subsidiaries
Notes to Consolidated Financial Statements - (Continued)
subordination threshold. If there is not sufficient cash to fund such a distribution on all common units, the distribution to be made with respect to the subordinated units is reduced or eliminated for such quarter in order to make a distribution, to the extent possible, of up to the subordination threshold amount on all common units, including common units held by the Company. As holder of the subordinated units, SandRidge is entitled to receive incentive distributions equal to
50%
of the amount by which the cash available for distribution on all of the Royalty Trust units exceeds the applicable quarterly incentive threshold.
Quarterly distributions declared and paid by the Royalty Trusts during the years ended
December 31, 2014
,
2013
and
2012
as follows (in thousands):
|
Year Ended December 31,
|
||||||||||||
|
2014(1)
|
2013(2)
|
2012(3)
|
||||||||||
|
Total distributions
|
$
|
234,326
|
|
$
|
299,674
|
|
$
|
274,979
|
|
|||
|
Distributions to third-party unitholders
|
$
|
193,807
|
|
$
|
206,470
|
|
$
|
181,727
|
|
|||
____________________
|
(1)
|
Subordination thresholds were not met for the Mississippian Trust I’s first or second quarter 2014 distributions, the Permian Trust’s second, third or fourth quarter 2014 distributions or for the Mississippian Trust II’s distributions for the year ended December 31, 2014, resulting in reduced distributions to the Company on its subordinated units for these periods.
|
|
(2)
|
Subordination thresholds were not met for the Mississippian Trust I’s second, third or fourth quarter 2013 distributions, the Permian Trust’s second quarter 2013 distribution or for the Mississippian Trust II’s fourth quarter 2013 distribution, resulting in reduced distributions to the Company on its subordinated units for this period.
|
|
(3)
|
The Company received incentive distributions from the Mississippian Trust I during the first and second quarters of 2012.
|
See Note
21
for discussion of the Royalty Trusts’ distributions announced in January 2015.
Following the end of the fourth full calendar quarter subsequent to the Company’s satisfaction of its drilling obligation (the “subordination period”), the subordinated units of each Royalty Trust automatically convert into common units on a one-for-one basis and the Company’s right to receive incentive distributions terminates. In the third quarter of 2014, the Mississippian Trust I’s subordinated units, all of which were held by SandRidge, converted to common units. Beginning with the distribution made in November 2014, all of the Mississippian Trust I’s common units share equally in its distribution. The Company continues to consolidate the activities of the Mississippian Trust I as its primary beneficiary subsequent to this conversion due to the Company’s original participation in the design of the Mississippian Trust I and continued (a) power to direct the activities that most significantly impact the economic performance of the Royalty Trust and (b) obligation to absorb losses and right to receive residual returns through its variable interests in the Royalty Trust, including ownership of common units, that could potentially be significant to the Mississippian Trust I.
Loan Commitment.
Pursuant to the agreements governing the Royalty Trusts, the Company has committed to loan funds to each Royalty Trust on an unsecured basis, with terms substantially the same as would be obtained in an arm’s length transaction between the Company and an unaffiliated party, if at any time the Royalty Trust’s cash is not sufficient to pay ordinary course administrative expenses as they become due. Any funds loaned may not be used to satisfy indebtedness of the Royalty Trust or to make distributions. There were
no
amounts outstanding under the loan commitments at
December 31, 2014
or
2013
.
Administrative Services.
The Company is party to an administrative services agreement with each Royalty Trust, pursuant to which the Company provides certain administrative services to the Royalty Trust, including hedge management services to the Permian Trust and the Mississippian Trust II.
F-21
SandRidge Energy, Inc. and Subsidiaries
Notes to Consolidated Financial Statements - (Continued)
Derivatives Agreements.
The Company has a derivatives agreement with each Royalty Trust, pursuant to which the Company provides to the Royalty Trust the economic effects of certain of the Company’s derivative contracts. Substantially concurrent with the execution of the derivatives agreements with the Permian Trust and the Mississippian Trust II, the Company novated certain of the derivative contracts underlying the respective derivatives agreements to the Permian Trust and the Mississippian Trust II. The Company novated certain additional derivative contracts underlying the derivatives agreements to the Permian Trust in April 2012 and to the Permian Trust and the Mississippian Trust II in March 2013. Additionally, the Company reset certain derivative contracts underlying the derivative agreements with the Permian Trust in March 2014 and with the Mississippian Trust II in April 2014. The tables below present the open oil and natural gas commodity derivative contracts at
December 31, 2014
underlying the derivatives agreements. The combined volume in the tables below reflects the total volume of the Royalty Trusts’ open oil and natural gas commodity derivative contracts.
Oil Price Swaps
Underlying the Royalty Trust Derivatives Agreements
|
Notional (MBbls)
|
Weighted Average
Fixed Price
|
|||||
|
January 2015 — December 2015
|
904
|
|
$
|
97.78
|
|
|
Natural Gas Collars Underlying the Royalty Trust Derivatives Agreements
|
Notional (MMcf)
|
Collar Range
|
|||||||||
|
January 2015 — December 2015
|
1,010
|
|
$
|
4.00
|
|
—
|
$
|
8.55
|
|
|
Oil Price Swaps Underlying the Derivatives Agreements and Novated to the Royalty Trusts
|
Notional (MBbls)
|
Weighted Average
Fixed Price
|
|||||
|
January 2015 — March 2015
|
141
|
|
$
|
100.90
|
|
|
See Note
13
for further discussion of the derivatives agreement between the Company and each Royalty Trust.
Assets and Liabilities.
Each Royalty Trust’s assets can be used to settle only that Royalty Trust’s obligations and not other obligations of the Company or another Royalty Trust. The Royalty Trusts’ creditors have no contractual recourse to the general credit of the Company. Although the Royalty Trusts are included in the Company’s consolidated financial statements, the Company’s legal interest in the Royalty Trusts’ assets is limited to its ownership of the Royalty Trusts’ units. At
December 31, 2014
and
2013
,
$1.3 billion
of noncontrolling interest in the accompanying consolidated balance sheets were attributable to the Royalty Trusts. The Royalty Trusts’ assets and liabilities, after considering the effects of intercompany eliminations, included in the accompanying consolidated balance sheets at
December 31, 2014
and
2013
consisted of the following (in thousands):
|
December 31,
|
|||||||
|
2014
|
2013
|
||||||
|
Cash and cash equivalents(1)
|
$
|
9,387
|
|
$
|
7,912
|
|
|
|
Accounts receivable
|
17,660
|
|
22,540
|
|
|||
|
Derivative contracts
|
6,589
|
|
4,983
|
|
|||
|
Total current assets
|
33,636
|
|
35,435
|
|
|||
|
Investment in royalty interests(2)
|
1,325,942
|
|
1,325,942
|
|
|||
|
Less: accumulated depletion
|
(284,094
|
)
|
(186,095
|
)
|
|||
|
1,041,848
|
|
1,139,847
|
|
||||
|
Derivative contracts
|
—
|
|
1,476
|
|
|||
|
Total assets
|
$
|
1,075,484
|
|
$
|
1,176,758
|
|
|
|
Accounts payable and accrued expenses
|
$
|
2,852
|
|
$
|
3,393
|
|
|
|
Total liabilities
|
$
|
2,852
|
|
$
|
3,393
|
|
|
____________________
|
(1)
|
Includes
$3.0 million
held by the trustee at
December 31, 2014
and
2013
as reserves for future general and administrative expenses.
|
|
(2)
|
Investment in royalty interests is included in oil and natural gas properties in the accompanying consolidated balance sheets.
|
F-22
SandRidge Energy, Inc. and Subsidiaries
Notes to Consolidated Financial Statements - (Continued)
See Note
15
for discussion of the Company’s legal proceedings to which the Mississippian Trust I and Mississippian Trust II are also parties.
Sales of Common Units.
During 2014, 2013 and 2012, the Company sold Royalty Trust common units it owned in transactions exempt from registration pursuant to Rule 144 under the Securities Act, which further reduced its beneficial interest in the Royalty Trusts. Total proceeds from such transactions were
$22.1 million
,
$29.0 million
and
$139.4 million
for the years ended
December 31, 2014
,
2013
and
2012
, respectively. The unit sales were accounted for as equity transactions with no gain or loss recognized. The Company continues to be the primary beneficiary of the Royalty Trusts, after consideration of these transactions and, accordingly, continues to consolidate the activities of the Royalty Trusts.
Grey Ranch Plant, L.P.
Primarily engaged in treating and transportation of natural gas, Grey Ranch Plant, L.P. (“GRLP”) was a limited partnership that operated the Company’s Grey Ranch plant (the “Plant”) located in Pecos County, Texas. As of December 31, 2013, the Company owned a
50%
interest in GRLP, which represented a variable interest. Income or loss of GRLP was allocated to the partners based on ownership percentage and any operating or cash shortfalls require contributions from the partners. GRLP was considered a VIE because certain equity holders lacked the ability to participate in decisions impacting GRLP. Agreements related to the ownership and operation of GRLP provide for GRLP to pay management fees to the Company to operate the Plant and lease payments for the Plant. Under the operating agreements, lease payments were reduced if throughput volumes were below those expected. The Company determined that it was the primary beneficiary of GRLP as it has both (i) the power, as operator of the Plant, to direct the activities of GRLP that most significantly impact its economic performance and (ii) the obligation to absorb losses, as a result of the operating and gathering agreements, that could potentially be significant to GRLP and, therefore, consolidated the activity of GRLP in its consolidated balance sheets. The
50%
ownership interest not held by the Company as of December 31, 2013 is presented as noncontrolling interest in the consolidated financial statements. In the first quarter of 2014, one of the Company’s wholly owned subsidiaries acquired from a third party the remaining
50%
ownership interest of GRLP. Because the Company was the primary beneficiary and consolidated GRLP, the acquisition of additional ownership interest was recorded as an equity transaction with no gain or loss recognized. Additionally, as a wholly owned subsidiary of the Company, GRLP is no longer considered a VIE for reporting purposes.
Prior to the Company’s acquisition of the remaining ownership of GRLP in the first quarter of 2014, GRLP’s assets could only be used to settle its own obligations and not other obligations of the Company and GRLP’s creditors had no recourse to the general credit of the Company. At
December 31, 2013
,
$0.7 million
of noncontrolling interest in the accompanying consolidated balance sheet was related to GRLP. GRLP’s assets and liabilities, after considering the effects of intercompany eliminations, included in the accompanying consolidated balance sheet at
December 31, 2013
consisted of the following (in thousands):
|
December 31, 2013
|
|||
|
Cash and cash equivalents
|
$
|
132
|
|
|
Accounts receivable, net
|
16
|
|
|
|
Prepaid expenses
|
32
|
|
|
|
Other current assets
|
109
|
|
|
|
Total current assets
|
289
|
|
|
|
Other property, plant and equipment, net
|
1,163
|
|
|
|
Total assets
|
$
|
1,452
|
|
|
Accounts payable and accrued expenses
|
$
|
129
|
|
|
Total liabilities
|
$
|
129
|
|
Grey Ranch Plant Genpar, LLC
As of December 31, 2013, the Company owned a
50%
interest in Grey Ranch Plant Genpar, LLC (“Genpar”), the managing partner and
1%
owner of GRLP. The Company served as Genpar’s administrative manager. Genpar’s ownership interest in GRLP was its only asset. As managing partner of GRLP, Genpar had the sole right to manage, control and conduct the business of GRLP. However, Genpar was restricted from making certain major decisions, including the decision to remove the Company as operator of the Plant. The rights afforded the Company under the Plant operating agreement and the restrictions on Genpar limited Genpar’s ability to make decisions on behalf of GRLP. Therefore, Genpar was considered a VIE. Although both the Company and Genpar’s other equity owner shared equally in Genpar’s economic losses and benefits and also had agreements that may be considered
F-23
SandRidge Energy, Inc. and Subsidiaries
Notes to Consolidated Financial Statements - (Continued)
variable interests, the Company determined it was the primary beneficiary of Genpar due to (i) its ability, as administrative manager and operator of the Plant, to direct the activities of Genpar that most significantly impacted its economic performance and (ii) its obligation or right, as operator of the Plant, to absorb the losses of or receive benefits from Genpar that could potentially have been significant to Genpar. As the primary beneficiary, the Company consolidated Genpar’s activity. However, its sole asset, the investment in GRLP, was eliminated in consolidation. Genpar had
no
liabilities. In the first quarter of 2014, one of the Company’s wholly owned subsidiaries acquired from a third party the remaining
50%
ownership interest of Genpar. Because the Company was the primary beneficiary and consolidated Genpar, the acquisition of additional ownership interest was recorded as an equity transaction with no gain or loss recognized. Additionally, as a wholly owned subsidiary of the Company, Genpar is no longer considered a VIE for reporting purposes.
Piñon Gathering Company, LLC
The Company has a gas gathering and operations and maintenance agreement with Piñon Gathering Company, LLC (“PGC”) through
June 30, 2029
. Under the gas gathering agreement, the Company is required to compensate PGC for any throughput shortfalls below a required minimum volume. By guaranteeing a minimum throughput, the Company absorbs the risk that lower than projected volumes will be gathered by the gathering system. Therefore, PGC is a VIE. Other than as required under the gas gathering and operations and maintenance agreements, the Company has not provided any support to PGC. While the Company operates the assets of PGC as directed under the operations and management agreement, the member and managers of PGC have the authority to directly control PGC and make substantive decisions regarding PGC’s activities including terminating the Company as operator without cause. As the Company does not have the ability to control the activities of PGC that most significantly impact PGC’s economic performance, the Company is not the primary beneficiary of PGC. Therefore, the results of PGC’s activities are not consolidated into the Company’s financial statements.
Amounts due from and due to PGC as of
December 31, 2014
and
2013
included in the accompanying consolidated balance sheets are as follows (in thousands):
|
December 31,
|
|||||||
|
2014
|
2013
|
||||||
|
Accounts receivable due from PGC
|
$
|
1,141
|
|
$
|
741
|
|
|
|
Accounts payable due to PGC
|
$
|
4,163
|
|
$
|
3,634
|
|
|
5
. Fair Value Measurements
The Company measures and reports certain assets and liabilities on a fair value basis and has classified and disclosed its fair value measurements using the following levels of the fair value hierarchy:
|
Level 1
|
|
Unadjusted quoted prices in active markets that are accessible at the measurement date for identical, unrestricted assets or liabilities.
|
|
Level 2
|
|
Quoted prices in markets that are not active, or inputs which are observable, either directly or indirectly, for substantially the full term of the asset or liability.
|
|
Level 3
|
|
Measurement based on prices or valuation models that require inputs that are both significant to the fair value measurement and less observable for objective sources (
i.e.,
supported by little or no market activity).
|
Assets and liabilities that are measured at fair value are classified based on the lowest level of input that is significant to the fair value measurement. The Company’s assessment of the significance of a particular input to the fair value measurement requires judgment, which may affect the valuation of the fair value of assets and liabilities and their placement within the fair value hierarchy levels. The determination of the fair values, stated below, considers the market for the Company’s financial assets and liabilities, the associated credit risk and other factors. The Company considers active markets as those in which transactions for the assets or liabilities occur in sufficient frequency and volume to provide pricing information on an ongoing basis. The Company has assets and liabilities classified in each level of the hierarchy as of
December 31, 2014
or
2013
, as described below.
Level 1 Fair Value Measurements
Restricted deposits.
The fair value of restricted deposits invested in mutual funds or municipal bonds is based on quoted market prices. For restricted deposits held in savings accounts, carrying value approximates fair value. Restricted deposits are
F-24
SandRidge Energy, Inc. and Subsidiaries
Notes to Consolidated Financial Statements - (Continued)
included in other assets in the accompanying consolidated balance sheet as of December 31, 2013. The Company did not have restricted deposits as of December 31, 2014.
Investments.
The fair value of investments, consisting of assets attributable to the Company’s non-qualified deferred compensation plan, is based on quoted market prices. Investments are included in other assets in the accompanying consolidated balance sheets.
Level 2 Fair Value Measurements
Derivative contracts.
The fair values of the Company’s oil and natural gas fixed price swaps and oil and natural gas collars are based upon inputs that are either readily available in the public market, such as oil and natural gas futures prices, volatility factors, interest rates and discount rates, or can be corroborated from active markets. Fair value is determined through the use of a discounted cash flow model or option pricing model using the applicable inputs, discussed above. The Company applies a weighted average credit default risk rating factor for its counterparties or gives effect to its credit default risk rating, as applicable, in determining the fair value of these derivative contracts. Credit default risk ratings are based on current published credit default swap rates.
Level 3 Fair Value Measurements
Guarantees.
As discussed in Note
3
, the Company has guaranteed on Fieldwood’s behalf certain plugging and abandonment obligations associated with the Gulf Properties. The fair value of these guarantees is based on the present value of estimated future payments for plugging and abandonment obligations associated with the Gulf Properties, adjusted for the cumulative probability of Fieldwood’s default prior to February 25, 2015, the date the Company was permitted to terminate the guarantee under the terms of the agreement with Fieldwood (
3.71%
at
December 31, 2014
). The discount and probability of default rates are based upon inputs that are readily available in the public market, such as historical option adjusted spreads of the Company’s senior notes, which are publicly traded, and historical default rates of publicly traded companies with credit ratings similar to Fieldwood. The significant unobservable input used in the fair value measurement of the guarantees is the estimate of future payments for plugging and abandonment, which was developed based upon third-party quotes and current actual costs. Significant increases (decreases) in the estimate of these payments could result in a significantly higher (lower) fair value measurement. The significant unobservable input used in the fair value measurement of the Company’s financial guarantee liability at
December 31, 2014
is included in the table below (in thousands).
|
Unobservable Input
|
||||
|
Estimated future payments for plugging and abandonment
|
$
|
372,034
|
|
|
Derivative contracts.
The fair value of the Company’s natural gas and oil basis swaps were based upon quotes obtained from counterparties to the derivative contracts. These values were reviewed for reasonableness through the use of a discounted cash flow model using non-exchange traded regional pricing information. Additionally, the Company applied a weighted average credit default risk rating factor for its counterparties or gave effect to its credit risk, as applicable, in determining the fair value of these derivative contracts. The significant unobservable input used in the fair value measurement of the Company’s natural gas and oil basis swaps is the estimate of future natural gas and oil basis differentials. Significant increases (decreases) in natural gas and oil basis differentials could result in a significantly higher (lower) fair value measurement. The significant unobservable inputs and the range and weighted average of these inputs used in the fair value measurements of the Company’s natural gas basis swaps at
December 31, 2014
are included in the table below. All of the outstanding oil basis swaps contractually matured during December 31, 2013.
|
Unobservable Input
|
Range
|
Weighted Average
|
Fair Value
|
|||||||||||||
|
(Price per Mcf)
|
(In thousands)
|
|||||||||||||||
|
December 31, 2014
|
||||||||||||||||
|
Natural gas basis differential forward curve
|
$
|
(0.03
|
)
|
–
|
$
|
(0.38
|
)
|
$
|
(0.29
|
)
|
$
|
350
|
|
|||
F-25
SandRidge Energy, Inc. and Subsidiaries
Notes to Consolidated Financial Statements - (Continued)
The following tables summarize the Company’s assets and liabilities measured at fair value on a recurring basis by the fair value hierarchy (in thousands):
December 31, 2014
|
|
Fair Value Measurements
|
Netting(1)
|
Assets/Liabilities at Fair Value
|
||||||||||||||||
|
|
Level 1
|
Level 2
|
Level 3
|
||||||||||||||||
|
Assets
|
|||||||||||||||||||
|
Commodity derivative contracts
|
$
|
—
|
|
$
|
338,067
|
|
$
|
350
|
|
$
|
—
|
|
$
|
338,417
|
|
||||
|
Investments
|
11,106
|
|
—
|
|
—
|
|
—
|
|
11,106
|
|
|||||||||
|
$
|
11,106
|
|
$
|
338,067
|
|
$
|
350
|
|
$
|
—
|
|
$
|
349,523
|
|
|||||
|
Liabilities
|
|||||||||||||||||||
|
Guarantees
|
$
|
—
|
|
$
|
—
|
|
$
|
5,104
|
|
$
|
—
|
|
$
|
5,104
|
|
||||
|
$
|
—
|
|
$
|
—
|
|
$
|
5,104
|
|
$
|
—
|
|
$
|
5,104
|
|
|||||
December 31, 2013
|
|
Fair Value Measurements
|
Netting(1)
|
Assets/Liabilities at Fair Value
|
||||||||||||||||
|
|
Level 1
|
Level 2
|
Level 3
|
||||||||||||||||
|
Assets
|
|||||||||||||||||||
|
Restricted deposits
|
$
|
27,955
|
|
$
|
—
|
|
$
|
—
|
|
$
|
—
|
|
$
|
27,955
|
|
||||
|
Commodity derivative contracts
|
—
|
|
50,274
|
|
—
|
|
(23,369
|
)
|
26,905
|
|
|||||||||
|
Investments
|
13,708
|
|
—
|
|
—
|
|
—
|
|
13,708
|
|
|||||||||
|
$
|
41,663
|
|
$
|
50,274
|
|
$
|
—
|
|
$
|
(23,369
|
)
|
$
|
68,568
|
|
|||||
|
Liabilities
|
|||||||||||||||||||
|
Commodity derivative contracts
|
$
|
—
|
|
$
|
78,200
|
|
$
|
—
|
|
$
|
(23,369
|
)
|
$
|
54,831
|
|
||||
|
$
|
—
|
|
$
|
78,200
|
|
$
|
—
|
|
$
|
(23,369
|
)
|
$
|
54,831
|
|
|||||
____________________
(1)
Represents the impact of netting assets and liabilities with counterparties with which the right of offset exists.
The table below sets forth a reconciliation of the Company’s Level 3 fair value measurements for guarantees during the year ended
December 31, 2014
(in thousands):
|
Level 3 Fair Value Measurements - Guarantees
|
Year Ended December 31, 2014
|
||
|
Beginning balance
|
$
|
—
|
|
|
Issuances(1)
|
9,446
|
|
|
|
Gain on guarantees
|
(4,342
|
)
|
|
|
Ending balance
|
$
|
5,104
|
|
____________________
|
(1)
|
Represents the fair value of the guarantees of certain plugging and abandonment obligations on behalf of Fieldwood as of February 25, 2014, the closing date for the sale of the Gulf Properties.
|
The fair value of the guarantees is determined quarterly with changes in fair value recorded as an adjustment to the full cost pool. See Note
3
for discussion of the sale of the Gulf Properties. The fair value of the guarantees as of
December 31, 2014
is included in other current liabilities in the accompanying consolidated balance sheet.
F-26
SandRidge Energy, Inc. and Subsidiaries
Notes to Consolidated Financial Statements - (Continued)
The table below sets forth a reconciliation of the Company’s Level 3 fair value measurements for commodity derivative contracts during the years ended
December 31, 2014
,
2013
and
2012
(in thousands):
|
2014
|
2013
|
2012
|
|||||||||
|
Level 3 commodity derivative contracts at January 1
|
$
|
—
|
|
$
|
(512
|
)
|
$
|
(4,252
|
)
|
||
|
Loss on derivative contracts
|
—
|
|
(133
|
)
|
(5,460
|
)
|
|||||
|
Purchases
|
350
|
|
—
|
|
5,697
|
|
|||||
|
Settlements paid
|
—
|
|
645
|
|
3,503
|
|
|||||
|
Level 3 commodity derivative contracts at December 31
|
$
|
350
|
|
$
|
—
|
|
$
|
(512
|
)
|
||
Losses due to changes in fair value of the Company’s Level 3 commodity derivative contracts have been included in (gain) loss on derivative contracts in the accompanying consolidated statements of operations. There were no outstanding Level 3 commodity derivative contracts at December 31, 2013.
See Note
13
for further discussion of the Company’s derivative contracts.
The Company recognizes transfers between fair value hierarchy levels as of the end of the reporting period in which the event or change in circumstances causing the transfer occurred. During the years ended
December 31, 2014
,
2013
and
2012
, the Company did not have any transfers between Level 1, Level 2 or Level 3 fair value measurements.
Fair Value of Financial Instruments
The Company measures the fair value of its senior notes using pricing for the Company’s senior notes that is readily available in the public market. The Company classifies these inputs as Level 2 in the fair value hierarchy. The estimated fair values and carrying values of the Company’s senior notes at
December 31, 2014
and
2013
were as follows (in thousands):
|
|
December 31, 2014
|
December 31, 2013
|
|||||||||||||
|
|
Fair Value
|
Carrying Value
|
Fair Value
|
Carrying Value
|
|||||||||||
|
8.75% Senior Notes due 2020(1)
|
$
|
303,750
|
|
$
|
445,402
|
|
$
|
486,000
|
|
$
|
444,736
|
|
|||
|
7.5% Senior Notes due 2021(2)
|
$
|
752,000
|
|
$
|
1,178,486
|
|
$
|
1,230,813
|
|
$
|
1,178,922
|
|
|||
|
8.125% Senior Notes due 2022
|
$
|
472,500
|
|
$
|
750,000
|
|
$
|
795,000
|
|
$
|
750,000
|
|
|||
|
7.5% Senior Notes due 2023(3)
|
$
|
519,750
|
|
$
|
821,548
|
|
$
|
837,375
|
|
$
|
821,249
|
|
|||
___________________
|
(1)
|
Carrying value is net of
$4,598
and
$5,264
discount at
December 31, 2014
and
2013
, respectively.
|
|
(2)
|
Carrying value includes a premium, applicable to notes issued in August 2012, of
$3,486
and
$3,922
at
December 31, 2014
and
2013
, respectively.
|
|
(3)
|
Carrying value is net of
$3,452
and
$3,751
discount at
December 31, 2014
and
2013
, respectively.
|
See Note
12
for discussion of the Company’s long-term debt, including the purchase, redemption and issuance of senior notes in 2012 and 2013.
Fair Value of Non-Financial Assets and Liabilities
See Note
3
for information regarding the Company’s valuation of its acquisitions and Note
8
for discussion of the Company’s impairment valuation.
F-27
SandRidge Energy, Inc. and Subsidiaries
Notes to Consolidated Financial Statements - (Continued)
6
. Accounts Receivable
A summary of accounts receivable is as follows (in thousands):
|
|
December 31,
|
||||||
|
|
2014
|
2013
|
|||||
|
Oil, natural gas and NGL sales
|
$
|
139,848
|
|
$
|
166,157
|
|
|
|
Joint interest billing
|
170,937
|
|
168,596
|
|
|||
|
Oil and natural gas services
|
21,436
|
|
17,904
|
|
|||
|
Insurance receivable
|
—
|
|
2,500
|
|
|||
|
Other
|
4,939
|
|
5,122
|
|
|||
|
337,160
|
|
360,279
|
|
||||
|
Less: allowance for doubtful accounts
|
(7,083
|
)
|
(11,061
|
)
|
|||
|
Total accounts receivable, net
|
$
|
330,077
|
|
$
|
349,218
|
|
|
The following table presents the balance and activity in the allowance for doubtful accounts for the years ended December 31,
2014
,
2013
and
2012
(in thousands):
|
|
Year Ended December 31,
|
||||||||||
|
|
2014
|
2013
|
2012
|
||||||||
|
Allowance for doubtful accounts at January 1
|
$
|
11,061
|
|
$
|
5,635
|
|
$
|
3,906
|
|
||
|
Additions charged to costs and expenses(1)
|
818
|
|
5,497
|
|
1,735
|
|
|||||
|
Deductions(2)
|
(4,796
|
)
|
(71
|
)
|
(6
|
)
|
|||||
|
Allowance for doubtful accounts at December 31
|
$
|
7,083
|
|
$
|
11,061
|
|
$
|
5,635
|
|
||
|
(1)
|
Includes
$2.7 million
of allowance for receivables deemed uncollectible at
December 31, 2013
primarily due to bankruptcy status of customers.
|
|
(2)
|
Deductions represent write-off of receivables and collections of amounts for which an allowance had previously been established. Year ended
December 31, 2014
represents write-off of allowance related to the sale of the Gulf Properties.
|
F-28
SandRidge Energy, Inc. and Subsidiaries
Notes to Consolidated Financial Statements - (Continued)
7
. Property, Plant and Equipment
Property, plant and equipment consists of the following (in thousands):
|
December 31,
|
|||||||
|
2014
|
2013
|
||||||
|
Oil and natural gas properties
|
|||||||
|
Proved(1)
|
$
|
11,707,147
|
|
$
|
10,972,816
|
|
|
|
Unproved
|
290,596
|
|
531,606
|
|
|||
|
Total oil and natural gas properties
|
11,997,743
|
|
11,504,422
|
|
|||
|
Less accumulated depreciation, depletion and impairment
|
(6,359,149
|
)
|
(5,762,969
|
)
|
|||
|
Net oil and natural gas properties capitalized costs
|
5,638,594
|
|
5,741,453
|
|
|||
|
Land
|
16,300
|
|
18,423
|
|
|||
|
Non-oil and natural gas equipment(2)
|
602,392
|
|
600,603
|
|
|||
|
Buildings and structures(3)
|
263,191
|
|
233,405
|
|
|||
|
Total
|
881,883
|
|
852,431
|
|
|||
|
Less accumulated depreciation and amortization
|
(305,420
|
)
|
(286,209
|
)
|
|||
|
Other property, plant and equipment, net
|
576,463
|
|
566,222
|
|
|||
|
Total property, plant and equipment, net
|
$
|
6,215,057
|
|
$
|
6,307,675
|
|
|
____________________
|
(1)
|
Includes cumulative capitalized interest of approximately
$38.1 million
and
$23.4 million
at
December 31, 2014
and
2013
, respectively.
|
|
(2)
|
Includes cumulative capitalized interest of approximately
$4.3 million
at both
December 31, 2014
and
2013
.
|
|
(3)
|
Includes cumulative capitalized interest of approximately
$17.1 million
and
$12.0 million
at
December 31, 2014
and
2013
, respectively.
|
Accumulated depreciation, depletion and impairment for oil and natural gas properties includes cumulative full cost ceiling limitation impairment of
$3.7 billion
and
$3.5 billion
at
December 31, 2014
and
2013
, respectively. During the year ended
December 31, 2014
, the Company reduced the net carrying value of its oil and natural gas properties by
$164.8 million
as a result of its first quarter full cost ceiling analysis. There was
no
full cost ceiling impairment during the years ended
December 31, 2013
or
2012
. See Note
8
for discussion of impairment of other property, plant and equipment.
The average rates used for depreciation and depletion of oil and natural gas properties were
$15.00
per Boe in
2014
,
$16.81
per Boe in
2013
and
$16.93
per Boe in
2012
.
Century Plant Construction Costs
Included in proved oil and natural gas properties at
December 31, 2014
and
2013
is approximately
$180.0 million
of costs in excess of contracted and reimbursed amounts incurred by the Company during construction of the Century Plant pursuant to an agreement with Occidental Petroleum Corporation (“Occidental”). Due to the high-CO
2
content of the Company’s reserves in the Piñon Field and the absence of adequate processing capacity in the Piñon Field area, construction of a large-scale processing facility, such as the Century Plant, was necessary for the development of the Company’s natural gas reserves in that area. The Company entered into the construction agreement and a related treating agreement with Occidental solely to facilitate the development of its reserves in the Piñon Field and greater West Texas Overthrust area and, accordingly, has recorded these unreimbursed costs as development costs within its full cost pool. See Note
15
for discussion of the related treating agreement.
Drilling Carry Commitments
During the years ended
December 31, 2014
,
2013
and
2012
, the Company was party to agreements with two co-working interest parties, which contain carry commitments to fund a portion of its future drilling, completing and equipping costs within areas of mutual interest. The Company recorded approximately
$205.6 million
for Repsol’s carry during the year ended
December 31, 2014
, and a combined
$408.0 million
and
$367.6 million
for both Atinum’s and Repsol’s drilling carries during the years ended
December 31, 2013
and
2012
, respectively, which reduced the Company’s capital expenditures for the respective periods. Atinum fully funded its carry commitment in the third quarter of
2013
, and the carry commitment from Repsol was fully utilized during the third quarter of
2014
.
F-29
SandRidge Energy, Inc. and Subsidiaries
Notes to Consolidated Financial Statements - (Continued)
Under the agreement with Repsol, the carry commitment could have been reduced if a certain number of wells were not drilled within the area of mutual interest during a 12-month period and the Company failed to drill such wells following a proposal by Repsol to drill the wells. During
2013
, the Company temporarily reduced its rate of drilling activity. As a result, the Company drilled less than the targeted number of wells for such 12-month period, which resulted in Repsol having a right to propose additional wells. In the second quarter of
2014
, the Company and Repsol amended their agreement to eliminate Repsol’s right to propose such additional wells in exchange for a commitment by the Company to drill
484
net wells in the area of mutual interest between January 1, 2014 and May 31, 2015, subject to delays due to factors beyond the Company’s control. If the Company does not drill the committed number of wells within such time period, it will be required to carry Repsol’s drilling, completing and equipping costs for subsequent wells drilled in the area of mutual interest, up to a maximum of
$75.0 million
in carry costs. As of
December 31, 2014
, the Company has drilled
340
net wells under this arrangement and currently anticipates satisfying its drilling commitment within the required time period. Other than the above, the Company has no drilling obligations to Repsol.
Costs Excluded from Amortization
The following table summarizes the costs, by year incurred, related to unproved properties and pipe inventory, which were excluded from oil and natural gas properties subject to amortization at
December 31, 2014
(in thousands):
|
|
|
Year Cost Incurred
|
|||||||||||||||||
|
|
Total
|
2014
|
2013
|
2012
|
2011 and Prior
|
||||||||||||||
|
Property acquisition
|
$
|
247,485
|
|
$
|
64,776
|
|
$
|
21,723
|
|
$
|
98,530
|
|
$
|
62,456
|
|
||||
|
Exploration(1)
|
96,752
|
|
48,614
|
|
36,938
|
|
4,302
|
|
6,898
|
|
|||||||||
|
Total costs incurred
|
$
|
344,237
|
|
$
|
113,390
|
|
$
|
58,661
|
|
$
|
102,832
|
|
$
|
69,354
|
|
||||
____________________
|
(1)
|
Includes
$53.6 million
of pipe inventory costs incurred (
$21.3 million
in
2014
,
$30.7 million
in
2013
and
$1.6 million
in
2012
and prior years).
|
The Company expects to complete the majority of the evaluation activities within
10
years from the applicable date of acquisition, contingent on the Company’s capital expenditures and drilling program. In addition, the Company’s internal engineers evaluate all properties on at least an annual basis.
8
. Impairment
Property, Plant and Equipment
As deemed necessary based on events in 2014, 2013 and 2012, the Company analyzed various property, plant and equipment for impairment. Estimated fair values of these assets were determined using a combination of the discounted cash flow method, recent offers from third-party purchasers or prices of comparable assets with consideration of current market conditions. Given the significance of the unobservable nature of a number of the inputs, these are considered Level 3 on the fair value hierarchy discussed in Note 5.
Oil and Natural Gas Properties.
The Company incurred an impairment of
$164.8 million
for the year ended December 31, 2014 due to a full cost ceiling limitation resulting from the divestiture of the Gulf Properties, as the present value of future net revenues associated with the Gulf Properties exceeded the associated reduction to the full cost pool.
Drilling Assets.
As a result of the Company’s fulfillment of its drilling obligation with the Permian Trust and the downward trend in oil prices that began in the second half of 2014, demand for the Company’s drilling and oilfield services in the Permian region declined significantly. At December 31, 2014, the Company determined the future use of its drilling and oilfield services assets in this region was limited and recorded an impairment of
$24.3 million
on these assets.
During 2014 and 2013, the Company committed to plans to sell various drilling assets. The net book value of these drilling assets was adjusted to fair value, resulting in impairments of
$3.1 million
and
$11.1 million
for the years ended December 31, 2014 and 2013, respectively. The remaining net book value of these assets is included in other current assets in the accompanying consolidated balance sheet at December 31, 2014 as the Company intends to sell the assets within a year.
As a result of the Company’s entry into an agreement to sell the Permian Properties, the Company performed an impairment assessment of its drilling rigs as of December 31, 2012 by calculating the estimated future cash flows to be generated by the rigs
F-30
SandRidge Energy, Inc. and Subsidiaries
Notes to Consolidated Financial Statements - (Continued)
and their related assets. As the undiscounted future cash flows were in excess of the assets’ carrying value,
no
impairment was indicated at that time.
Gas Treating Plants and Other Midstream Assets.
During 2014 and 2013, the Company evaluated certain midstream pipe inventory, natural gas compressors, gas treating plants and a CO
2
compressor station for impairment after determining that their future use was limited. As a result of these evaluations, the Company recorded impairments of
$0.6 million
and
$12.2 million
during the years ended December 31, 2014 and 2013, respectively, on these assets to reduce their carrying value to market value.
In the fourth quarter of 2012, the Company substantially completed construction of the Century Plant, a CO
2
treatment plant in Pecos County, Texas, and associated compression and pipeline facilities pursuant to the agreement with Occidental. In conjunction with the substantial completion and resulting diversion of the Company’s high CO
2
natural gas production from its legacy gas treating plants to the Century Plant, the Company evaluated its legacy gas treating plants and CO
2
compression facilities for impairment. Due to prevailing low natural gas prices, the Company’s natural gas production was not projected to reach the available treating capacity at the Century Plant. As such, the Company determined the use of its legacy gas treating plants and CO
2
compression facilities in west Texas was limited, and accordingly, recorded a
$79.3 million
impairment of its gas treating plants and CO
2
compression facilities at December 31, 2012.
Other Property, Plant and Equipment.
In the second quarter of 2013, the Company committed to a plan to sell a corporate asset. The net book value of the corporate asset was adjusted to fair value, resulting in an impairment of
$2.9 million
during the year ended December 31, 2013. The corporate asset was sold in the fourth quarter of 2013.
The Company recorded a
$1.3 million
impairment in 2012 due to the write-off of certain software costs as the software was determined to be obsolete.
Goodwill
In December 2012, the Company entered into an agreement to sell the Permian Properties, which the Company determined to be a triggering event for purposes of evaluating goodwill as the Permian Properties are included in the exploration and production segment, the reporting unit to which goodwill was assigned. As such, an impairment test was performed as of December 31, 2012. Primarily as a result of a decrease in the Company’s probable reserves as of December 31, 2012, which are one of the significant components in the determination of the fair value of the reporting unit, the carrying value of the reporting unit exceeded the fair value. Probable reserves used in the reporting unit fair value calculation decreased due to their reclassification to possible reserves as a result of the Company’s year-end evaluation of drilling results across its acreage in the Mississippian formation. Possible reserves are not included in the fair value calculation of the reporting unit. The Company performed step two of the impairment test, which indicated the entire balance of goodwill was impaired. As a result, the Company recorded an impairment equal to the carrying amount of goodwill, or
$235.4 million
, at December 31, 2012, which is included in impairment in the accompanying consolidated statement of operations for the year ended December 31, 2012.
9
. Other Assets
Other assets consist of the following (in thousands):
|
December 31,
|
|||||||
|
2014
|
2013
|
||||||
|
Debt issuance costs, net of amortization(1)
|
$
|
56,445
|
|
$
|
61,923
|
|
|
|
Deferred tax asset
|
95,843
|
|
—
|
|
|||
|
Restricted deposits(2)
|
—
|
|
27,955
|
|
|||
|
Notes receivable on asset retirement obligations(2)
|
—
|
|
11,640
|
|
|||
|
Investments
|
11,106
|
|
13,708
|
|
|||
|
Other
|
1,853
|
|
5,945
|
|
|||
|
Total other assets
|
$
|
165,247
|
|
$
|
121,171
|
|
|
____________________
|
(1)
|
Unamortized debt issuance costs associated with the 9.875% Senior Notes due 2016 and 8.0% Senior Notes due 2018 were written off in March 2013 when the Company redeemed these notes. See Note 12 for discussion of the senior note redemptions.
|
|
(2)
|
Assets at
December 31, 2013
were included in the sale of the Gulf Properties in February 2014, as discussed in Note
3
.
|
F-31
10
. Accounts Payable and Accrued Expenses
Accounts payable and accrued expenses consist of the following (in thousands):
|
|
December 31,
|
||||||
|
|
2014
|
2013
|
|||||
|
Accounts payable and other accrued expenses
|
$
|
392,500
|
|
$
|
341,008
|
|
|
|
Accrued interest
|
79,704
|
|
80,740
|
|
|||
|
Production payable
|
120,573
|
|
127,647
|
|
|||
|
Drilling advances
|
33,195
|
|
184,203
|
|
|||
|
Payroll and benefits
|
44,496
|
|
59,785
|
|
|||
|
Convertible perpetual preferred stock dividends
|
11,072
|
|
16,572
|
|
|||
|
Related party
|
1,852
|
|
2,533
|
|
|||
|
Total accounts payable and accrued expenses
|
$
|
683,392
|
|
$
|
812,488
|
|
|
11
. Construction Contract
In the second quarter of 2013, the Company substantially completed the construction of a series of electrical transmission expansion and upgrade projects in northern Oklahoma for a third party. The Company constructed these projects for a contract price of
$23.3 million
, which included agreed upon change orders. Upon substantial completion of the contract, the Company recognized construction contract revenue and costs equal to the revised contract price of
$23.3 million
, which are included in the accompanying consolidated statement of operations for the year ended
December 31, 2013
.
12
. Long-Term Debt
Long-term debt consists of the following (in thousands):
|
December 31,
|
|||||||
|
2014
|
2013
|
||||||
|
Senior credit facility
|
$
|
—
|
|
$
|
—
|
|
|
|
Senior notes
|
|||||||
|
8.75% Senior Notes due 2020, net of $4,598 and
$5,264 discount, respectively
|
445,402
|
|
444,736
|
|
|||
|
7.5% Senior Notes due 2021, including a premium of $3,486 and $3,922, respectively
|
1,178,486
|
|
1,178,922
|
|
|||
|
8.125% Senior Notes due 2022
|
750,000
|
|
750,000
|
|
|||
|
7.5% Senior Notes due 2023, net of $3,452 and $3,751 discount, respectively
|
821,548
|
|
821,249
|
|
|||
|
Total debt
|
3,195,436
|
|
3,194,907
|
|
|||
|
Less: current maturities of long-term debt
|
—
|
|
—
|
|
|||
|
Long-term debt
|
$
|
3,195,436
|
|
$
|
3,194,907
|
|
|
Senior Credit Facility
The senior credit facility, which was amended and restated on October 22, 2014, is available to be drawn on subject to limitations based on its terms and certain financial covenants, as described below. As of
December 31, 2014
, the senior credit facility contained financial covenants, including maintenance of agreed upon levels for the (i) ratio of total net debt to EBITDA, which may not exceed
4.50
:1.00 at each quarter end, calculated using the last four completed fiscal quarters and (ii) ratio of current assets to current liabilities, which must be at least
1.00
:1.00 at each quarter end. If no amounts are drawn under the senior credit facility when calculating the ratio of total net debt to EBITDA, the Company’s debt is reduced by its cash balance in excess of
$10.0 million
. In the current ratio calculation, any amounts available to be drawn under the senior credit facility are included in current assets, and unrealized assets and liabilities resulting from mark-to-market adjustments on the Company’s derivative contracts are disregarded. The senior credit facility matures in
October 2019
.
On November 14, 2014, the Company and its lenders amended the senior credit agreement to waive certain defaults that may have arisen as a result of the Company’s failure to timely deliver its quarterly financial statements for the quarter ended September 30, 2014 and extend the period for delivering the unaudited condensed consolidated statements for such interim period.
F-32
SandRidge Energy, Inc. and Subsidiaries
Notes to Consolidated Financial Statements - (Continued)
On February 23, 2015, the Company and its lenders further amended the credit agreement. The amendment, among other things, (i) temporarily suspends until June 30, 2016 the financial covenant requiring maintenance of certain levels for the ratio of total net debt to EBITDA, and (ii) adopts additional financial covenants requiring the maintenance of agreed upon levels for the (a) ratio of total debt secured by assets of the Company and certain of its subsidiaries to EBITDA, which may not exceed
2.25
:1.00 at each quarter end, calculated using the last four completed fiscal quarters, and (b) ratio of EBITDA to interest expense, which must be at least
2.00
:1.00 at March 31, 2015 and June 30, 2015,
1.75
:1.00 at September 30, 2015,
1.50
:1.00 at each quarter end from December 31, 2015 to September 30, 2016, and
2.00
:1.00 at December 31, 2016 and thereafter, calculated using the last four completed fiscal quarters. The ratio of total net debt to EBITDA may not exceed
6.25
:1.00 at June 30, 2016,
6.00
:1.00 at September 30, 2016 and December 31, 2016,
5.50
:1.00 at March 31, 2017 and June 30, 2017,
5.00
:1.00 at September 30, 2017 and December 31, 2017 and
4.50
:1.00 at March 31, 2018 and thereafter, calculated using annualized EBITDA for the fiscal quarter ended June 30, 2016 and the two subsequent fiscal quarters and otherwise calculated using the last four completed fiscal quarters.
The senior credit facility also contains various covenants that limit the ability of the Company and certain of its subsidiaries to: grant certain liens; make certain loans and investments; make distributions; redeem stock; redeem or prepay debt; merge or consolidate with or into a third party; or engage in certain asset dispositions, including a sale of all or substantially all of the Company’s assets. Additionally, the senior credit facility limits the ability of the Company and certain of its subsidiaries to incur additional indebtedness with certain exceptions. As of and during the year ended
December 31, 2014
, the Company was in compliance with all applicable financial covenants under the senior credit facility.
The obligations under the senior credit facility are guaranteed by certain Company subsidiaries and are secured by first priority liens on all shares of capital stock of certain of the Company’s material present and future subsidiaries; certain intercompany debt of the Company; and substantially all of the Company’s assets, including proved oil, natural gas and NGL reserves representing at least
80.0%
of the discounted present value (as defined in the senior credit facility) of proved oil, natural gas and NGL reserves considered by the lenders in determining the borrowing base for the senior credit facility.
At the Company’s election, interest under the senior credit facility is determined by reference to (a) the London Interbank Offered Rate (“LIBOR”) plus an applicable margin between
1.50%
and
2.50%
per annum or (b) the “base rate,” which is the highest of (i) the federal funds rate plus
0.5%
, (ii) the prime rate published by Bank of America or (iii) the one-month Eurodollar rate (as defined in the senior credit facility) plus
1.00%
per annum, plus, in each case under scenario (b), an applicable margin between
0.50%
and
1.50%
per annum. Interest is payable quarterly for base rate loans and at the end of the applicable interest period for LIBOR loans, except that if the interest period for a LIBOR loan is six months or longer, interest is paid at the end of each three-month period. Quarterly, the Company pays commitment fees assessed at annual rates ranging from
0.375%
to
0.5%
on any available portion of the senior credit facility. There were
no
amounts outstanding under the senior credit facility during
2014
or
2013
. The senior credit facility amendment, effective February 23, 2015, increases the applicable margin used in the calculation of interest under the senior credit facility to (a) between
1.750%
and
2.750%
for interest determined by reference to LIBOR, and (b) between
0.750%
and
1.750%
for interest determined by reference to the base rate.
Borrowings under the senior credit facility may not exceed the lower of the committed amount or the borrowing base, which is subject to periodic redeterminations. In October 2014, in connection with the amendment and restatement of the senior credit facility, the borrowing base was increased to
$1.2 billion
from
$775.0 million
and the availability of the borrowing base limited to a facility amount of
$900.0 million
. On February 23, 2015, in connection with the amendment to the senior credit agreement described above, the borrowing base was reduced to
$900.0 million
from $1.2 billion. The next scheduled borrowing base redetermination is expected to take place in October 2015. With respect to each redetermination, the administrative agent and the lenders under the senior credit facility consider several factors, including the Company’s proved reserves and projected cash requirements, and make assumptions regarding, among other things, oil and natural gas prices and production. Because the value of the Company’s proved reserves is a key factor in determining the amount of the borrowing base, changing commodity prices and the Company’s success in developing reserves may affect the borrowing base. The Company at times incurs additional costs related to the senior credit facility as a result of amendments to the credit agreement and changes to the borrowing base.
Additionally, the amended senior credit agreement permits the Company and certain of its subsidiaries to incur additional indebtedness in an aggregate principal amount not to exceed
$500.0 million
, which may be secured solely by collateral securing the senior credit facility on a junior lien basis. Any junior lien debt shall be subject to the terms and conditions set forth in an intercreditor agreement and shall mature no earlier than January 21, 2020. The borrowing base under the senior credit facility will be reduced by
$0.25
for every $1.00 of junior debt incurred.
The senior credit facility was undrawn at
December 31, 2014
and had
$100.0 million
drawn at February 20, 2015. On each such date, the Company had
$11.6 million
and
$11.3 million
, respectively, in outstanding letters of credit secured by the senior credit facility, which reduce availability under the senior credit facility on a dollar for dollar basis. At February 23, 2015, the Company had neither incurred junior debt nor entered into any intercreditor agreement.
F-33
SandRidge Energy, Inc. and Subsidiaries
Notes to Consolidated Financial Statements - (Continued)
Senior Notes
The Company’s unsecured senior fixed rate notes (“Senior Notes”) bear interest at a fixed rate per annum, payable semi-annually, with the principal due upon maturity. Certain of the Senior Notes were issued at a discount or a premium. The discount or premium is amortized to interest expense over the term of the respective series of Senior Notes. The Senior Notes are redeemable, in whole or in part, prior to their maturity at specified redemption prices and are jointly and severally guaranteed unconditionally, in full, on an unsecured basis by certain of the Company’s wholly owned subsidiaries. See Note
23
for condensed financial information of the subsidiary guarantors.
Debt issuance costs of
$70.2 million
incurred in connection with the offerings and subsequent registered exchange offers, including those discussed below, of the Senior Notes outstanding at
December 31, 2014
are included in other assets in the accompanying consolidated balance sheet and are being amortized to interest expense over the term of the respective series of Senior Notes.
2013 Activity.
In March 2013, the Company redeemed
$365.5 million
aggregate principal amount of its
9.875%
Senior Notes due 2016 and
$750.0 million
aggregate principal amount of its
8.0%
Senior Notes due 2018 for total consideration of
$1,061.34
per
$1,000
principal amount and
$1,052.77
per
$1,000
principal amount, respectively. The premium paid to redeem these notes and the expense incurred to write off the remaining associated unamortized debt issuance costs, totaling
$82.0 million
, were recorded as a loss on extinguishment of debt in the accompanying consolidated statement of operations for the year ended December 31, 2013.
2012 Activity.
In 2012, the Company completed offerings of senior notes (the “2012 Senior Notes”), as further discussed below, to qualified institutional buyers eligible under Rule 144A of the Securities Act and to persons outside the United States under Regulation S of the Securities Act. The Company incurred
$41.0 million
of debt issuance costs in connection with the 2012 Senior Notes offerings.
In
April 2012
, the Company issued
$750.0 million
of unsecured
8.125%
Senior Notes due 2022. Net proceeds from the offering were approximately
$730.1 million
after deducting offering expenses, and were used to finance the cash portion of the Dynamic Acquisition purchase price and to pay related fees and expenses, with any remaining amount used for general corporate purposes.
In
August 2012
, the Company issued
$825.0 million
of unsecured
7.5%
Senior Notes due 2023 at
99.5%
of par and
$275.0 million
of additional unsecured
7.5%
Senior Notes due 2021 at
101.625%
of par, plus accrued interest from
March 15, 2012
. The Company received net proceeds from this offering of approximately
$1.1 billion
, after deducting offering expenses and excluding accrued interest received. The net proceeds of the offering were used to fund the Company’s tender offer for, and subsequent redemption of, its Senior Floating Rate Notes due 2014 (the “Senior Floating Rate Notes”), discussed under
Senior Floating Rate Notes due 2014
below, to fund the Company’s capital expenditures and for general corporate purposes.
In November 2012, pursuant to registered exchange offers, the Company replaced the initial 2012 Senior Notes with equivalent 2012 Senior Notes that are registered under the Securities Act. The exchange offers did not result in the incurrence of any additional indebtedness.
Indentures.
Each of the indentures governing the Company’s Senior Notes contains covenants that restrict the Company’s ability to take a variety of actions, including limitations on the incurrence of indebtedness, payment of dividends, investments, asset sales, certain asset purchases, transactions with related parties and consolidations or mergers. As of and during the year ended
December 31, 2014
, the Company was in compliance with all of the covenants contained in the indentures governing its outstanding Senior Notes.
Senior Floating Rate Notes Due 2014
In the third quarter of 2012, the Company purchased
100.0%
or
$350.0 million
of the outstanding aggregate principal amount of its Senior Floating Rate Notes. All holders whose notes were purchased in the tender offer or redemption received accrued and unpaid interest from
July 1, 2012
through the date of purchase. The premium paid to purchase these notes and the write off of the remaining unamortized debt issuance costs associated with the notes, totaling
$3.1 million
, were recorded as a loss on extinguishment of debt and included in the accompanying consolidated statement of operations for the year ended
December 31, 2012
. The Senior Floating Rate Notes were issued in
May 2008
and bore interest at LIBOR plus
3.625%
prior to their retirement.
F-34
SandRidge Energy, Inc. and Subsidiaries
Notes to Consolidated Financial Statements - (Continued)
Maturities of Long-Term Debt
As of
December 31, 2014
, there are no maturities of long-term debt until January 2020.
13
. Derivatives
The Company has not designated any of its derivative contracts as hedges for accounting purposes. The Company records all derivative contracts at fair value. Changes in derivative contract fair values are recognized in earnings. Cash settlements and valuation gains and losses are included in (gain) loss on derivative contracts for commodity derivative contracts in the consolidated statements of operations. Commodity derivative contracts are settled on a monthly or quarterly basis. Derivative assets and liabilities arising from the Company’s derivative contracts with the same counterparty that provide for net settlement are reported on a net basis in the consolidated balance sheets.
Commodity Derivatives.
The Company is exposed to commodity price risk, which impacts the predictability of its cash flows from the sale of oil and natural gas. The Company seeks to manage this risk through the use of commodity derivative contracts. These derivative contracts allow the Company to limit its exposure to commodity price volatility on a portion of its forecasted oil and natural gas sales. None of the Company’s derivative contracts may be terminated prior to contractual maturity solely as a result of a downgrade in the credit rating of a party to the contract. At
December 31, 2014
, the Company’s commodity derivative contracts consisted of fixed price swaps and collars, which are described below:
|
Fixed price swaps
|
The Company receives a fixed price for the contract and pays a floating market price to the counterparty over a specified period for a contracted volume.
|
|
Basis swaps
|
The Company receives a payment from the counterparty if the settled price differential is greater than the stated terms of the contract and pays the counterparty if the settled price differential is less than the stated terms of the contract, which guarantees the Company a price differential for oil or natural gas from a specified delivery point.
|
|
Collars
|
Two-way collars contain a fixed floor price (put) and a fixed ceiling price (call). If the market price exceeds the call strike price or falls below the put strike price, the Company receives the fixed price and pays the market price. If the market price is between the call and the put strike price, no payments are due from either party.
|
|
Three-way collars have two fixed floor prices (a purchased put and a sold put) and a fixed ceiling price (call). The purchased put establishes a minimum price unless the market price falls below the sold put, at which point the minimum price would be New York Mercantile Exchange plus the difference between the purchased put and the sold put strike price. The call establishes a maximum price (ceiling) the Company will receive for the volumes under the contract.
|
|
Interest Rate Swaps.
The Company is exposed to interest rate risk on its long-term fixed rate debt and will be exposed to variable interest rates if it draws on its senior credit facility. Fixed rate debt, where the interest rate is fixed over the life of the instrument, exposes the Company to (i) changes in market interest rates reflected in the fair value of the debt and (ii) the risk that the Company may need to refinance maturing debt with new debt at a higher rate. Variable rate debt, where the interest rate fluctuates, exposes the Company to short-term changes in market interest rates as the Company’s interest obligations on these instruments are periodically redetermined based on prevailing market interest rates, primarily LIBOR and the federal funds rate.
Prior to its maturity on
April 1, 2013
, the Company had a
$350.0 million
notional interest rate swap agreement which effectively fixed the variable interest rate on the Senior Floating Rate Notes at an annual rate of
6.69%
for periods prior to their repurchase and redemption in the third quarter of 2012. The interest rate swap was not designated as a hedge.
Derivatives Agreements with Royalty Trusts.
The Company is party to derivatives agreements with the Mississippian Trust I, Permian Trust and Mississippian Trust II to provide each Royalty Trust with the economic effect of certain oil and natural gas derivative contracts entered into by the Company with third parties. The underlying commodity derivative contracts cover volumes of oil and natural gas production through
December 31, 2015
for the Mississippian Trust I and Mississippian Trust II and through
March 31, 2015
for the Permian Trust. Under these arrangements, the Company pays the Royalty Trusts amounts it receives from its counterparties in accordance with the underlying contracts, and the Royalty Trusts pay the Company any amounts that the Company is required to pay its counterparties under such contracts.
In accordance with the terms of the respective derivatives agreements, the Company novated certain of the derivative contracts underlying the derivatives agreements to each of the Permian Trust and Mississippian Trust II. As a party to these contracts, the Permian Trust and Mississippian Trust II receive payment directly from the counterparty and pay any amounts owed
F-35
SandRidge Energy, Inc. and Subsidiaries
Notes to Consolidated Financial Statements - (Continued)
directly to the counterparty. To secure its obligations under the respective derivative contracts novated to it, each of the Permian Trust and Mississippian Trust II granted the counterparties liens on the royalty interests held by each respective Royalty Trust. Under the derivatives agreements, as development wells are drilled for the benefit of the Permian Trust and Mississippian Trust II, the Company has the right, under certain circumstances, to assign or novate additional derivative contracts to the Permian Trust and Mississippian Trust II.
All contracts underlying the derivatives agreements with the Royalty Trusts, including those novated to the Permian Trust and Mississippian Trust II, have been included in the Company’s consolidated derivative disclosures. See Note
4
for the Royalty Trusts’ open derivative contracts.
Fair Value of Derivatives.
The following table presents the fair value of the Company’s derivative contracts as of
December 31, 2014
and
2013
on a gross basis without regard to same-counterparty netting (in thousands):
|
December 31,
|
||||||||||
|
Type of Contract
|
Balance Sheet Classification
|
2014
|
2013
|
|||||||
|
Derivative assets
|
||||||||||
|
Oil price swaps
|
Derivative contracts—current
|
$
|
204,072
|
|
$
|
15,887
|
|
|||
|
Natural gas price swaps
|
Derivative contracts—current
|
29,648
|
|
1,598
|
|
|||||
|
Natural gas basis swaps
|
Derivative contracts—current
|
350
|
|
—
|
|
|||||
|
Oil collars—three way
|
Derivative contracts—current
|
56,289
|
|
706
|
|
|||||
|
Natural gas collars
|
Derivative contracts—current
|
1,055
|
|
177
|
|
|||||
|
Oil price swaps
|
Derivative contracts—noncurrent
|
36,288
|
|
19,376
|
|
|||||
|
Oil collars—three way
|
Derivative contracts—noncurrent
|
10,715
|
|
12,189
|
|
|||||
|
Natural gas collars
|
Derivative contracts—noncurrent
|
—
|
|
341
|
|
|||||
|
Derivative liabilities
|
||||||||||
|
Oil price swaps
|
Derivative contracts—current
|
—
|
|
(38,396
|
)
|
|||||
|
Natural gas price swaps
|
Derivative contracts—current
|
—
|
|
(1,460
|
)
|
|||||
|
Oil price swaps
|
Derivative contracts—noncurrent
|
—
|
|
(38,344
|
)
|
|||||
|
Total net derivative contracts
|
$
|
338,417
|
|
$
|
(27,926
|
)
|
||||
Refer to Note
5
for additional discussion of the fair value measurement of the Company’s derivative contracts.
F-36
SandRidge Energy, Inc. and Subsidiaries
Notes to Consolidated Financial Statements - (Continued)
Master Netting Agreements and the Right of Offset.
The Company has master netting agreements with all of its derivative counterparties, which allow the Company to present its derivative assets and liabilities with the same counterparty on a net basis in the consolidated balance sheets. As a result, the Company's maximum amount of loss under derivative transactions due to credit risk is limited to the net amounts due from its counterparties. As of
December 31, 2014
, the counterparties to the Company’s open derivative contracts consisted of
nine
financial institutions, all of which are also lenders under the Company’s senior credit facility. As a result, the Company is not required to post additional collateral under derivative contracts as the majority of the counterparties to the Company’s derivative contracts share in the collateral supporting the Company’s senior credit facility. To secure their obligations under the derivative contracts novated by the Company, the Permian Trust and Mississippian Trust II have each given the counterparties to such contracts a lien on its royalty interests. The following tables summarize (i) the Company's derivative contracts on a gross basis, (ii) the effects of netting assets and liabilities for which the right of offset exists based on master netting arrangements and (iii) for the Company’s derivative liability positions, the applicable portion of shared collateral under the senior credit facility (for SandRidge's derivative contracts) and under liens granted on the royalty interests (for the Permian Trust and the Mississippian Trust II) (in thousands):
December 31, 2014
|
Gross Amounts
|
Gross Amounts Offset
|
Amounts Net of Offset
|
Financial Collateral
|
Net Amount
|
||||||||||||||||
|
Assets
|
||||||||||||||||||||
|
Derivative contracts - current
|
$
|
291,414
|
|
$
|
—
|
|
$
|
291,414
|
|
$
|
—
|
|
$
|
291,414
|
|
|||||
|
Derivative contracts - noncurrent
|
47,003
|
|
—
|
|
47,003
|
|
—
|
|
47,003
|
|
||||||||||
|
Total
|
$
|
338,417
|
|
$
|
—
|
|
$
|
338,417
|
|
$
|
—
|
|
$
|
338,417
|
|
|||||
|
Liabilities
|
||||||||||||||||||||
|
Derivative contracts - current
|
$
|
—
|
|
$
|
—
|
|
$
|
—
|
|
$
|
—
|
|
$
|
—
|
|
|||||
|
Derivative contracts - noncurrent
|
—
|
|
—
|
|
—
|
|
—
|
|
—
|
|
||||||||||
|
Total
|
$
|
—
|
|
$
|
—
|
|
$
|
—
|
|
$
|
—
|
|
$
|
—
|
|
|||||
December 31,
2013
|
Gross Amounts
|
Gross Amounts Offset
|
Amounts Net of Offset
|
Financial Collateral
|
Net Amount
|
||||||||||||||||
|
Assets
|
||||||||||||||||||||
|
Derivative contracts - current
|
$
|
18,368
|
|
$
|
(5,589
|
)
|
$
|
12,779
|
|
$
|
—
|
|
$
|
12,779
|
|
|||||
|
Derivative contracts - noncurrent
|
31,906
|
|
(17,780
|
)
|
14,126
|
|
—
|
|
14,126
|
|
||||||||||
|
Total
|
$
|
50,274
|
|
$
|
(23,369
|
)
|
$
|
26,905
|
|
$
|
—
|
|
$
|
26,905
|
|
|||||
|
Liabilities
|
||||||||||||||||||||
|
Derivative contracts - current
|
$
|
39,856
|
|
$
|
(5,589
|
)
|
$
|
34,267
|
|
$
|
(34,267
|
)
|
$
|
—
|
|
|||||
|
Derivative contracts - noncurrent
|
38,344
|
|
(17,780
|
)
|
20,564
|
|
(20,564
|
)
|
—
|
|
||||||||||
|
Total
|
$
|
78,200
|
|
$
|
(23,369
|
)
|
$
|
54,831
|
|
$
|
(54,831
|
)
|
$
|
—
|
|
|||||
The Company recorded (gain) loss on commodity derivative contracts of
$(334.0) million
,
$47.1 million
and
$(241.4) million
for the years ended
December 31, 2014
,
2013
and
2012
, respectively, as reflected in the accompanying consolidated statements of operations, which includes net cash payments (receipts) upon settlement of
$32.3 million
,
$(0.8) million
and
$(91.4) million
, respectively. Included in these net cash payments are
$69.6 million
and
$29.6 million
of cash payments related to settlements of commodity derivative contracts with contractual maturities after the year in which they were settled primarily as a result of the sale of the Gulf Properties in February 2014 and the Permian Properties in February 2013, respectively. For the year ended December 31,
2012
, the gain on commodity derivative contracts is net of a non-cash loss of
$117.1 million
resulting from the amendment of certain 2012 derivative contracts to contracts maturing in 2014 and 2015.
F-37
SandRidge Energy, Inc. and Subsidiaries
Notes to Consolidated Financial Statements - (Continued)
The Company recorded a loss on its interest rate swaps of
$0.01 million
and
$1.2 million
for the years ended
December 31, 2013
and
2012
, respectively, which is included in interest expense in the accompanying consolidated statements of operations. Included in the loss for the years ended
December 31, 2013
and
2012
are cash payments upon contract settlement of
$2.4 million
and
$9.2 million
, respectively.
At
December 31, 2014
, the Company’s open commodity derivative contracts consisted of the following:
Oil Price Swaps
|
Notional (MBbls)
|
Weighted Average
Fixed Price
|
|||||
|
January 2015 - December 2015
|
5,588
|
|
$
|
92.44
|
|
|
|
January 2016 - December 2016
|
1,464
|
|
$
|
88.36
|
|
|
Natural Gas Price Swaps
|
Notional (MMcf)
|
Weighted Average
Fixed Price
|
|||||
|
January 2015 - December 2015
|
19,900
|
|
$
|
4.51
|
|
|
Natural Gas Basis Swaps
|
Notional (MMcf)
|
Weighted Average
Fixed Price
|
|||||
|
January 2015 - December 2015
|
21,900
|
|
$
|
(0.27
|
)
|
|
Oil Collars - Three-way
|
Notional (MBbls)
|
Sold Put
|
Purchased Put
|
Sold Call
|
|||||||||||
|
January 2015 - December 2015
|
4,576
|
|
$
|
76.56
|
|
$
|
90.28
|
|
$
|
103.48
|
|
|||
|
January 2016 - December 2016
|
2,556
|
|
$
|
83.14
|
|
$
|
90.00
|
|
$
|
100.85
|
|
|||
Natural Gas Collars
|
Notional (MMcf)
|
Collar Range
|
|||||
|
January 2015 - December 2015
|
1,010
|
|
$4.00
|
—
|
$8.55
|
|
F-38
SandRidge Energy, Inc. and Subsidiaries
Notes to Consolidated Financial Statements - (Continued)
14
. Asset Retirement Obligations
The following table presents the balance and activity of the asset retirement obligations for the years ended
December 31, 2014
,
2013
and
2012
(in thousands).
|
2014(1)
|
2013
|
2012(2)
|
|||||||||
|
Asset retirement obligations at January 1
|
$
|
424,117
|
|
$
|
498,410
|
|
$
|
128,116
|
|
||
|
Liability incurred upon acquiring and drilling wells
|
4,968
|
|
5,078
|
|
7,479
|
|
|||||
|
Liability assumed in acquisition
|
—
|
|
—
|
|
371,365
|
|
|||||
|
Revisions in estimated cash flows
|
(5,848
|
)
|
(3,077
|
)
|
34,654
|
|
|||||
|
Liability settled or disposed in current period
|
(377,927
|
)
|
(113,071
|
)
|
(72,200
|
)
|
|||||
|
Accretion
|
9,092
|
|
36,777
|
|
28,996
|
|
|||||
|
Asset retirement obligations at December 31
|
54,402
|
|
424,117
|
|
498,410
|
|
|||||
|
Less: current portion
|
—
|
|
87,063
|
|
118,504
|
|
|||||
|
Asset retirement obligations, net of current
|
$
|
54,402
|
|
$
|
337,054
|
|
$
|
379,906
|
|
||
____________________
|
(1)
|
Liability settled or disposed in the current period includes
$366.0 million
associated with the Gulf Properties sold in February 2014, as discussed in Note
3
.
|
|
(2)
|
Liability assumed in acquisition represents asset retirement obligations assumed in the acquisition of oil and natural gas properties in the Gulf of Mexico during the second quarter of 2012.
|
15
. Commitments and Contingencies
Operating Leases.
The Company has obligations under noncancelable operating leases, primarily for office space and equipment used in drilling and services activities. Total rental expense under operating leases for the years ended
December 31, 2014
,
2013
and
2012
was approximately
$1.7 million
,
$3.6 million
and
$2.6 million
, respectively.
Future minimum payments under noncancelable operating leases (with initial lease terms exceeding one year) as of
December 31, 2014
were as follows (in thousands):
|
Years ending December 31
|
|||
|
2015
|
$
|
1,087
|
|
|
2016
|
982
|
|
|
|
2017
|
759
|
|
|
|
2018
|
572
|
|
|
|
2019
|
—
|
|
|
|
Thereafter
|
—
|
|
|
|
$
|
3,400
|
|
|
Rig Commitments.
The Company has contracts with third-party drilling rig operators for the use of their rigs at specified day or footage rates. These commitments are not recorded in the consolidated balance sheets. Minimum future commitments as of
December 31, 2014
were
$30.0 million
for 2015 and
$1.7 million
for 2016.
F-39
SandRidge Energy, Inc. and Subsidiaries
Notes to Consolidated Financial Statements - (Continued)
Oil and Natural Gas Transportation and Throughput Agreements.
The Company has subscribed firm gas transportation service under a transportation service agreement on the Midcontinent Express Pipeline, the term of which continues until July 2019. This commitment is not recorded in the consolidated balance sheets. Under the terms of the agreement, the Company is obligated to pay a demand charge and in exchange, obtains the right to flow natural gas production through this pipeline to more competitive marketing areas. The Company also has oil and natural gas throughput agreements in place, which require fixed fees based on minimum volume requirements for the right to flow oil and natural gas through certain pipelines. The amounts of the required payments related to the transportation and throughput agreements as of
December 31, 2014
were as follows (in thousands):
|
Years ending December 31
|
|||
|
2015
|
$
|
12,467
|
|
|
2016
|
12,498
|
|
|
|
2017
|
12,467
|
|
|
|
2018
|
12,899
|
|
|
|
2019
|
8,156
|
|
|
|
Thereafter
|
12,672
|
|
|
|
$
|
71,159
|
|
|
Natural Gas Gathering Agreement.
The Company has a gas gathering agreement with PGC related to its properties located in the Piñon Field in west Texas. Under the gas gathering agreement, the Company has dedicated its west Texas acreage for priority gathering services through
June 30, 2029
and will pay a fee for such services. Pursuant to the gas gathering agreement, the base fee can be reduced if certain criteria are met. The table below presents the base fee contractual obligations under this agreement as of
December 31, 2014
(in thousands).
|
Years ending December 31
|
|||
|
2015
|
$
|
42,334
|
|
|
2016
|
42,272
|
|
|
|
2017
|
41,991
|
|
|
|
2018
|
41,825
|
|
|
|
2019
|
41,703
|
|
|
|
Thereafter
|
82,594
|
|
|
|
$
|
292,719
|
|
|
Development Agreements with Royalty Trusts.
The Company’s development agreement with the Mississippian Trust II obligates the Company to drill, or cause to be drilled, a specified number of wells within an area of mutual interest by
December 31, 2016
. The estimated cost to fulfill the drilling obligation remaining at
December 31, 2014
totaled approximately
$8.8 million
. The Company fulfilled its drilling obligation to the Mississippian Trust I during 2013 and fulfilled its drilling obligation to the Permian Trust in 2014.
Treating Agreement
. In conjunction with the Century Plant construction agreement, the Company entered into a
30
-year treating agreement with Occidental for the removal of CO
2
from natural gas volumes delivered by the Company. Under the agreement, the Company is required to deliver a total of approximately
3,200
Bcf of CO
2
during the agreement period. The Company is obligated to pay Occidental
$0.25
per Mcf to the extent minimum annual CO
2
volume requirements are not met. Through
December 31, 2014
, the Company had delivered to Occidental
54.7
Bcf of CO
2,
which is
300.1
Bcf less than the cumulative minimum annual CO
2
volume requirements for the same period and had accrued associated annual shortfall penalties of approximately
$75.0 million
. Based on current projected natural gas production levels, the Company expects to accrue between approximately
$31.0 million
and
$38.0 million
during the year ending December 31, 2015 for amounts related to the Company’s anticipated shortfall in meeting its 2015 annual delivery obligations. If such under delivered volumes are not made up with commensurate over deliveries in the future, the Company will be obligated to pay Occidental
$0.70
per Mcf (approximately
$210.1 million
total) in 2041, which amount has not been accrued as the Company does not currently believe such payment is probable.
If CO
2
volumes delivered to Occidental do not materially increase from current levels, the Company will have the right, beginning in 2020, to reduce future minimum annual CO
2
volume requirements under the agreement by paying Occidental an amount equal to the present value of $0.70 multiplied by such reduced CO
2
volume requirements as designated by the Company. As of
December 31, 2014
, if the Company were to cease delivering natural gas for processing and made no future CO
2
deliveries from such date until 2020, the Company would be required to pay annual delivery shortfall penalties, in the aggregate, of
F-40
SandRidge Energy, Inc. and Subsidiaries
Notes to Consolidated Financial Statements - (Continued)
approximately
$292.6 million
for the contract years 2012 through 2019, which includes
$75.0 million
for penalties incurred through
December 31, 2014
. Further, by paying approximately
$291.4 million
in 2020, which includes the present value of $0.70 multiplied by delivery shortfalls incurred through such date, the Company could adjust the future CO
2
volume requirements to zero. This amount will continue to decrease as future deliveries of CO
2
are made. The Company also may terminate the treating agreement at any time, which would require a termination payment by the Company to Occidental of an amount equal to (a) the present value of
$0.70
multiplied by the remaining CO
2
volumes required to be delivered under the agreement, plus (b) Occidental’s current net book value of the Century Plant.
The Company has first priority on daily available processing capacity for properly nominated and delivered volumes; however, based on cumulative delivered volumes as of the balance sheet date, if the Company makes no further deliveries from that date until 2025, beginning in 2025 the Century Plant, even if fully utilized, would not have adequate capacity to allow the Company to deliver CO
2
volumes attributable to previously incurred delivery shortfalls at that time.
Guarantees of Plugging and Abandonment Obligations.
Under the equity purchase agreement associated with the sale of the Gulf Properties, the Company guaranteed on behalf of Fieldwood certain plugging and abandonment obligations associated with the Gulf Properties for a period of up to one year from the date of closing. The Company paid no amounts under this guarantee, which, as of February 25, 2015, it was permitted to terminate under the terms of the agreement with Fieldwood. See Note
3
for additional information regarding the guarantees.
Risks and Uncertainties.
The Company’s revenue, profitability and future growth are substantially dependent upon the prevailing and future prices for oil and natural gas, each of which depends on numerous factors beyond the Company’s control such as overall oil and natural gas production and inventories in relevant markets, economic conditions, the global political environment, regulatory developments and competition from other energy sources. Oil and natural gas prices historically have been volatile, and may be subject to significant fluctuations in the future. The Company enters into derivative arrangements in order to mitigate a portion of the effect of this price volatility on the Company’s cash flows. See Note
13
for the Company’s open oil and natural gas commodity derivative contracts.
Production targets contained in certain gathering and treating agreements require the Company to incur capital expenditures or make associated shortfall payments, as discussed above. The Company depends on cash flows from operating activities and, as necessary, borrowings under its senior credit facility to fund its capital expenditures. Additionally, the Company may use proceeds from the issuance of equity and debt securities in the capital markets and from the sales or other monetizations of assets to fund its capital expenditures. Based on current cash balances, cash flows from operating activities and availability under the senior credit facility, the Company expects to be able to fund its planned capital expenditures budget, debt service requirements and working capital needs for 2015; however, if the current depressed oil or natural gas prices persist for a prolonged period or further decline, they would have a material adverse effect on the Company’s financial position, results of operations, cash flows and quantities of oil, natural gas and NGL reserves that may be economically produced, which would adversely impact the Company’s ability to comply with the financial covenants under its senior credit facility. See Note
12
for discussion of the financial covenants in the senior credit facility.
Litigation and Claims.
On April 5, 2011, Wesley West Minerals, Ltd. and Longfellow Ranch Partners, LP filed suit against the Company and SandRidge Exploration and Production, LLC (collectively, the “SandRidge Entities”) in the 83rd District Court of Pecos County, Texas. The plaintiffs, who have leased mineral rights to the SandRidge Entities in Pecos County, allege that the SandRidge Entities have not properly paid royalties on all volumes of natural gas and CO
2
produced from the acreage leased from the plaintiffs. The plaintiffs also allege that the SandRidge Entities have inappropriately failed to pay royalties on CO
2
produced from the plaintiffs' acreage that results from the treatment of natural gas at the Century Plant. The plaintiffs seek approximately
$45.5 million
in actual damages for the period of time between January 2004 and December 2011, punitive damages and a declaration that the SandRidge Entities must pay royalties on CO
2
produced from the plaintiffs' acreage that results from treatment of natural gas at the Century Plant. The Commissioner of the General Land Office of the State of Texas (“GLO”) is named as an additional defendant in the lawsuit as some of the affected oil and natural gas leases described in the plaintiffs' allegations cover mineral classified lands in which the GLO is entitled to one-half of the royalties attributable to such leases. The GLO has filed a cross-claim against the SandRidge Entities asserting the same claims as the plaintiffs with respect to the leases covering mineral classified lands and seeking approximately
$13.0 million
in actual damages, inclusive of penalties and interest. On February 5, 2013, the Company received a favorable summary judgment ruling that effectively removes a majority of the plaintiffs' and GLO's claims. On April 29, 2013, the court entered an order allowing for an interlocutory appeal of its summary judgment ruling.
The plaintiffs appealed the rulings to the Texas Court of Appeals in El Paso. On November 19, 2014, that Court issued its opinion, which affirmed the trial court’s summary judgment rulings in part, but reversing them in part. The Court of Appeals affirmed the summary judgment rulings in the SandRidge Entities’ favor against the GLO. The Court also affirmed the summary judgment rulings in the SandRidge Entities’ favor against Wesley West Minerals, Ltd., on the largest oil and gas lease involved
F-41
SandRidge Energy, Inc. and Subsidiaries
Notes to Consolidated Financial Statements - (Continued)
in the case, which accounted for much of the total damages the plaintiffs are claiming. The Court reversed certain rulings on other leases, thus deciding those matters for the plaintiffs. It is anticipated that the plaintiffs will seek rehearing by the Court of Appeals and possibly petition the Supreme Court of Texas for review of the Court of Appeals’ decision.
The Company intends to continue to defend the remaining issues in the trial court, as well as future appellate proceedings. At the time of the ruling on summary judgment, the lawsuit was still in the discovery stage and, accordingly, an estimate of reasonably possible losses associated with the remaining causes of action, if any, cannot be made until all of the facts, circumstances and legal theories relating to such claims and the SandRidge Entities' defenses are fully disclosed and analyzed. The Company has not established any reserves relating to this action.
On August 4, 2011, Patriot Exploration, LLC, Jonathan Feldman, Redwing Drilling Partners, Mapleleaf Drilling Partners, Avalanche Drilling Partners, Penguin Drilling Partners and Gramax Insurance Company Ltd. filed a lawsuit against the Company, SandRidge Exploration and Production, LLC (“SandRidge E&P”) and certain current and former directors and senior executive officers of the Company (collectively, the “defendants”) in the U.S. District Court for the District of Connecticut. On October 28, 2011, the plaintiffs filed an amended complaint alleging substantially the same allegations as those contained in the original complaint. The plaintiffs allege that the defendants made false and misleading statements to U.S. Drilling Capital Management LLC and to the plaintiffs prior to the entry into a participation agreement among Patriot Exploration, LLC, U.S. Drilling Capital Management LLC and SandRidge E&P, which provided for the investment by the plaintiffs in certain of SandRidge E&P's oil and natural gas properties. To date, the plaintiffs have invested approximately
$16.0 million
under the participation agreement. The plaintiffs seek compensatory and punitive damages and rescission of the participation agreement. On November 28, 2011, the defendants filed a motion to dismiss the amended complaint. On June 29, 2013, the court granted in part and denied in part the defendants’ motion. The Company and the other defendants intend to defend this lawsuit vigorously and believe the plaintiffs' claims are without merit. This lawsuit is in the early stages and, accordingly, an estimate of reasonably possible losses associated with this action, if any, cannot be made until the facts, circumstances and legal theories relating to the plaintiffs' claims and the defendants’ defenses are fully disclosed and analyzed. The Company has not established any reserves relating to this action.
Between December 2012 and March 2013, seven putative shareholder derivative actions were filed in state and federal court in Oklahoma:
|
•
|
Arthur I. Levine v. Tom L. Ward, et al., and SandRidge Energy, Inc., Nominal Defendant - filed on December 19, 2012 in the U.S. District Court for the Western District of Oklahoma
|
|
•
|
Deborah Depuy v. Tom L. Ward, et al., and SandRidge Energy, Inc., Nominal Defendant - filed on January 22, 2013 in the U.S. District Court for the Western District of Oklahoma
|
|
•
|
Paul Elliot, on Behalf of the Paul Elliot IRA R/O, v. Tom L. Ward, et al., and SandRidge Energy, Inc., Nominal Defendant - filed on January 29, 2013 in the U.S. District Court for the Western District of Oklahoma
|
|
•
|
Dale Hefner v. Tom L. Ward, et al., and SandRidge Energy, Inc., Nominal Defendant - filed on January 4, 2013 in the District Court of Oklahoma County, Oklahoma
|
|
•
|
Rocky Romano v. Tom L. Ward, et al., and SandRidge Energy, Inc., Nominal Defendant - filed on January 22, 2013 in the District Court of Oklahoma County, Oklahoma
|
|
•
|
Joan Brothers v. Tom L. Ward, et al., and SandRidge Energy, Inc., Nominal Defendant - filed on February 15, 2013 in the U.S. District Court for the Western District of Oklahoma
|
|
•
|
Lisa Ezell, Jefferson L. Mangus, and Tyler D. Mangus v. Tom L. Ward, et al., and SandRidge Energy, Inc., Nominal Defendant - filed on March 22, 2013 in the U.S. District Court for the Western District of Oklahoma
|
Each lawsuit identified above was filed derivatively on behalf of the Company and names as defendants current and former directors of the Company. The Hefner lawsuit also names as defendants certain current and former directors and senior executive officers of the Company. All seven lawsuits assert overlapping claims - generally that the defendants breached their fiduciary duties, mismanaged the Company, wasted corporate assets, and engaged in, facilitated or approved self-dealing transactions in breach of their fiduciary obligations. The Depuy lawsuit also alleges violations of federal securities laws in connection with the Company allegedly filing and distributing certain misleading proxy statements. The lawsuits seek, among other relief, injunctive relief related to the Company's corporate governance and unspecified damages.
On April 10, 2013, the U.S. District Court for the Western District of Oklahoma consolidated the Levine, Depuy, Elliot, Brothers, and Ezell actions (the “Federal Shareholder Derivative Litigation”) under the caption “In re SandRidge Energy, Inc. Shareholder Derivative Litigation,” appointed a lead plaintiff and lead counsel, and ordered the lead plaintiff to file a consolidated complaint by May 1, 2013. On June 3, 2013, the Company and the individual defendants filed their respective motions to dismiss
F-42
SandRidge Energy, Inc. and Subsidiaries
Notes to Consolidated Financial Statements - (Continued)
the consolidated complaint. On September 11, 2013, the court granted the defendants’ respective motions to dismiss the consolidated complaint without prejudice, and granted plaintiffs leave to file an amended consolidated complaint. The plaintiffs filed an amended consolidated complaint on October 9, 2013, in which plaintiffs allege that: (i) the Company’s former Chief Executive Officer (“CEO”), Tom Ward, breached his fiduciary duties by usurping corporate opportunities, (ii) certain of the Company’s current and former directors breached their fiduciary duties of care, (iii) Mr. Ward and certain of the Company’s current and former directors wasted corporate assets, (iv) certain entities allegedly affiliated with Mr. Ward aided and abetted Mr. Ward’s breaches of fiduciary duties, (v) Mr. Ward and entities allegedly affiliated with Mr. Ward misappropriated the Company’s confidential and proprietary information, and (vi) entities allegedly affiliated with Mr. Ward were unjustly enriched. On November 15, 2013, the Company and the individual defendants filed their respective motions to dismiss the amended consolidated complaint. On September 22, 2014, the court denied the motion to dismiss filed on behalf of the Company and the director defendants. The court also granted in part and denied in part the respective motions to dismiss filed on behalf of the other defendants.
On September 26, 2014, the Board of Directors for the Company formed a Special Litigation Committee (“SLC”), composed of two independent and disinterested Company directors, and delegated absolute and final authority to the SLC to review and investigate the claims alleged by the plaintiffs in the Federal Shareholder Derivative Litigation and in the Hefner action, and to determine whether and how those claims should be asserted on the Company’s behalf.
The Company and the individual defendants in the Hefner and Romano actions (the “State Shareholder Derivative Litigation”) moved to stay each of the actions in favor of the Federal Shareholder Derivative Litigation, in order to avoid duplicative proceedings, and also requested, in the alternative, the dismissal of the State Shareholder Derivative Litigation.
On June 19, 2013, the court stayed the Hefner action until at least November 29, 2013. The court subsequently lifted its stay for purposes of hearing and deciding the defendants’ respective motions to dismiss. On September 18, 2013, the court denied the defendants’ motions to dismiss. The parties have agreed to stay this action pending the review and investigation by the SLC of the claims alleged by the plaintiffs in the Federal Shareholder Derivative Litigation and in this action, and to determine whether and how those claims should be asserted on the Company’s behalf.
On May 8, 2013, the court stayed the Romano action pending further order of the court. On October 31, 2013, the plaintiff filed a motion to lift the stay, which was denied by the court on February 7, 2014. On October 29, 2014, the court granted plaintiff’s application to dismiss the action without prejudice.
Because the Federal Shareholder Derivative Litigation and the State Shareholder Derivative Litigation are in the early stages, an estimate of reasonably possible losses associated with each of them, if any, cannot be made until the facts, circumstances and legal theories relating to the plaintiffs’ claims and the defendants’ defenses are fully disclosed and analyzed. The Company has not established any reserves relating to these actions.
On December 5, 2012, James Glitz and Rodger A. Thornberry, on behalf of themselves and all other similarly situated stockholders, filed a putative class action complaint in the U.S. District Court for the Western District of Oklahoma against SandRidge Energy, Inc. and certain current and former executive officers of the Company. On January 4, 2013, Louis Carbone, on behalf of himself and all other similarly situated stockholders, filed a substantially similar putative class action complaint in the same court and against the same defendants. On March 6, 2013, the court consolidated these two actions under the caption “In re SandRidge Energy, Inc. Securities Litigation” (the “Securities Litigation”) and appointed a lead plaintiff and lead counsel. On July 23, 2013, plaintiffs filed a consolidated amended complaint, which asserts a variety of federal securities claims against the Company and certain of its current and former officers and directors, among other defendants, on behalf of a putative class of (a) purchasers of SandRidge common stock during the period from February 24, 2011 to November 8, 2012, (b) purchasers of common units of the Mississippian Trust I in or traceable to its initial public offering on or about April 12, 2011, and (c) purchasers of common units of the Mississippian Trust II (together with the Mississippian Trust I, the “Mississippian Trusts”) in or traceable to its initial public offering on or about April 23, 2012. The claims are based on allegations that the Company, certain of its current and former officers and directors, and the Mississippian Trusts, among other defendants, are responsible for making false and misleading statements, and omitting material information, concerning a variety of subjects, including oil and natural gas reserves, the Company's capital expenditures, and certain transactions entered into by companies allegedly affiliated with the Company's former CEO Tom Ward. The defendants have filed respective motions to dismiss the consolidated amended complaint, which are pending before the court. Because the Securities Litigation is in the early stages, an estimate of reasonably possible losses associated with it, if any, cannot be made until the facts, circumstances and legal theories relating to the plaintiffs' claims and defendants’ defenses are fully disclosed and analyzed. The Company has not established any reserves relating to the Securities Litigation. Each of the Mississippian Trusts has requested that the Company indemnify it for any losses it may incur in connection with the Securities Litigation.
F-43
SandRidge Energy, Inc. and Subsidiaries
Notes to Consolidated Financial Statements - (Continued)
On July 15, 2013, James Hart and 15 other named plaintiffs filed an Amended Complaint in the United States District Court for the District of Kansas in an action undertaken individually and on behalf of others similarly situated against SandRidge Energy, Inc., SandRidge Operating Company, SandRidge E&P, SandRidge Midstream, Inc., and Lariat Services, Inc. In their Amended Complaint, plaintiffs allege that the defendants failed to properly calculate overtime pay for the plaintiffs and for other similarly situated current and former employees. The plaintiffs further allege that the defendants required the plaintiffs and other similarly situated current and former employees to engage in work-related activities without pay. The plaintiffs assert claims against the defendants for (i) violations of the Fair Labor Standards Act, (ii) violations of the Kansas Wage Payment Act, (iii) breach of contract, and (iv) fraud, and seek to recover unpaid wages and overtime pay, liquidated damages, statutory penalties, economic damages, compensatory and punitive damages, attorneys’ fees and costs, and both pre- and post-judgment interest.
On October 3, 2013, the plaintiffs filed a Motion for Conditional Collective Action Certification and for Judicial Notice to Class and a Motion to Toll the Statute of Limitations. On October 11, 2013, the defendants filed a Motion to Dismiss and a Motion to Transfer Venue to the United States District Court for the Western District of Oklahoma. All of these motions are pending before the court.
On April 2, 2014, the court granted the defendants’ Motion to Dismiss and granted plaintiffs leave to file an amended complaint by April 16, 2014, which they did on such date. On July 1, 2014, the court granted plaintiffs’ Motion for Conditional Collective Action Certification and for Judicial Notice to the Class, and denied plaintiffs’ Motion to Toll the Statute of Limitations. The Company and the other defendants intend to defend this lawsuit vigorously. This lawsuit is in the early stages and, accordingly, an estimate of reasonably possible losses associated with this action, if any, cannot be made until the facts, circumstances and legal theories relating to the plaintiffs' claims and the defendants’ defenses are fully disclosed and analyzed. The Company has not established any reserves relating to this action.
On
December 18, 2013
,
the Company received a subpoena duces tecum from the U.S. Department of Justice in connection with an ongoing
investigation of possible violations of antitrust laws in connection with the purchase or lease of land, oil or gas rights. The Company is cooperating with the investigation.
On November 10, 2014, a class action complaint was filed in the U. S. District Court for the Western District of Oklahoma against certain current and former directors and officers of the Company in the case styled Steve Surbaugh vs. SandRidge Energy, Inc., Tom L. Ward, James D. Bennett, Eddie M. LeBlanc, and Randall D. Cooley. The complaint asserts a federal securities class action on behalf of a putative class consisting of all persons other than defendants who purchased SandRidge securities between March 1, 2013, through November 4, 2014, seeking to recover damages allegedly caused by the defendants’ violations of federal securities laws under Sections 10(b) and 20(a) of the Securities Exchange Act of 1934, and Rule 10b-5 promulgated thereunder. The complaint alleges that, throughout the class period, the defendants made materially false and misleading statements regarding SandRidge’s business, operations and future prospects because such statements failed to properly account for the penalties SandRidge accrued under its treating agreement with Occidental Petroleum Corporation and, as a result, SandRidge’s financial statements were materially false and misleading during the class period. An estimate of reasonably possible losses associated with this action cannot be made at this time. The Company has not established any reserves relating to this action.
On November 11, 2014, a class action complaint was filed in the U. S. District Court for the Western District of Oklahoma against certain current and former directors and officers of the Company in the case styled Steven T. Dakil vs. SandRidge Energy, Inc., Tom L. Ward, James D. Bennett, and Eddie M. LeBlanc. The complaint asserts a federal securities class action on behalf of a putative class consisting of all persons other than defendants who purchased or otherwise acquired SandRidge securities between February 28, 2013, and November 3, 2014, seeking to recover damages allegedly caused by the defendants’ violations of federal securities laws under Sections 10(b) and 20(a) of the Securities Exchange Act of 1934, and Rule 10b-5 promulgated thereunder. The complaint alleges that, throughout the class period, defendants made materially false and misleading statements regarding SandRidge’s business, operational and compliance policies. Specifically, plaintiff alleges that defendants made false and/or misleading statements and/or failed to disclose that: (i) SandRidge was improperly accounting for penalties owed to Occidental Petroleum Corp. under a treating agreement on an annual basis when it was required to do so on a quarterly basis; (ii) SandRidge's quarterly and annual financial and operating results for the periods ending December 31, 2012 through June 30, 2014, were overstated and required restatement; (iii) defendant Ward engaged in improper related party transactions; (iv) SandRidge lacked proper internal controls over financial reporting; and (v) as a result of the foregoing, SandRidge’s financial statements were materially false and misleading during the class period. An estimate of reasonably possible losses associated with this action cannot be made at this time. The Company has not established any reserves relating to this action.
In addition to the litigation described above, the Company is a defendant in lawsuits from time to time in the normal course of business. While the results of litigation and claims cannot be predicted with certainty, the Company believes the reasonably possible losses of such matters, individually and in the aggregate, are not material. Additionally, the Company believes the probable
F-44
SandRidge Energy, Inc. and Subsidiaries
Notes to Consolidated Financial Statements - (Continued)
final outcome of such matters will not have a material adverse effect on the Company’s consolidated financial position, results of operations, cash flows or liquidity.
16
. Equity
Preferred Stock
The following table presents information regarding the Company’s preferred stock (in thousands):
|
December 31,
|
|||||
|
2014
|
2013
|
||||
|
Shares authorized
|
50,000
|
|
50,000
|
|
|
|
Shares outstanding at end of period
|
|||||
|
8.5% Convertible perpetual preferred stock
|
2,650
|
|
2,650
|
|
|
|
6.0% Convertible perpetual preferred stock
|
—
|
|
2,000
|
|
|
|
7.0% Convertible perpetual preferred stock
|
3,000
|
|
3,000
|
|
|
The Company is authorized to issue
50.0 million
shares of preferred stock,
$0.001
par value, of which
5.7 million
shares and
7.7 million
shares were designated as convertible perpetual preferred stock at
December 31, 2014
and
2013
, respectively. All of the outstanding shares of the Company’s convertible perpetual preferred stock were issued in private transactions, but are now freely tradable, to the extent not owned by affiliates. In December 2014, all outstanding shares of the
6.0%
convertible preferred stock converted automatically into shares of the Company’s common stock at the then-prevailing conversion rate, resulting in the issuance of approximately
18.4 million
shares of common stock. The final dividend payment for the 6.0% convertible preferred stock was made during the year ended
December 31, 2014
.
Each outstanding share of convertible perpetual preferred stock is convertible at the holder’s option at any time into shares of the Company’s common stock at the specified conversion rate, subject to customary adjustments in certain circumstances. Each holder is entitled to an annual dividend payable semi-annually in cash, common stock or a combination thereof, at the Company’s election. After a specified conversion date, the Company may cause all outstanding shares of the convertible perpetual preferred stock to convert automatically into common stock at the then-prevailing conversion rate if certain conditions are met. The convertible perpetual preferred stock is not redeemable by the Company at any time. The following table summarizes information about each series of the Company’s convertible perpetual preferred stock outstanding at December 31, 2014:
|
Convertible Perpetual Preferred Stock
|
||||||||
|
8.5%
|
7.0%
|
|||||||
|
Liquidation preference per share
|
$
|
100.00
|
|
$
|
100.00
|
|
||
|
Annual dividend per share
|
$
|
8.50
|
|
$
|
7.00
|
|
||
|
Conversion rate per share to common stock
|
12.4805
|
|
12.8791
|
|
||||
|
Conversion date to common stock at Company's option(1)
|
February 20, 2014
|
|
November 20, 2015
|
|
||||
____________________
|
(1)
|
Conversion is dependent on certain factors, including the Company’s stock trading above specified prices for a set period.
|
F-45
SandRidge Energy, Inc. and Subsidiaries
Notes to Consolidated Financial Statements - (Continued)
Preferred stock dividends.
All dividend payments to date on the Company’s 8.5%, 6.0% and 7.0% convertible perpetual preferred stock have been paid in cash. Paid and unpaid dividends included in the calculation of income available (loss applicable) to the Company’s common stockholders and the Company’s basic earnings (loss) per share calculation for the years ended
December 31, 2014
,
2013
and
2012
as presented in the accompanying consolidated statements of operations, are included in the tables below (in thousands):
|
Dividends Paid
|
Dividends Unpaid
|
Total
|
|||||||||
|
Year Ended December 31, 2014
|
|||||||||||
|
8.5% Convertible perpetual preferred stock
|
$
|
14,078
|
|
$
|
8,447
|
|
$
|
22,525
|
|
||
|
6.0% Convertible perpetual preferred stock
|
6,500
|
|
—
|
|
6,500
|
|
|||||
|
7.0% Convertible perpetual preferred stock
|
18,375
|
|
2,625
|
|
21,000
|
|
|||||
|
Total
|
$
|
38,953
|
|
$
|
11,072
|
|
$
|
50,025
|
|
||
|
Year Ended December 31, 2013
|
|||||||||||
|
8.5% Convertible perpetual preferred stock
|
$
|
14,078
|
|
$
|
8,447
|
|
$
|
22,525
|
|
||
|
6.0% Convertible perpetual preferred stock
|
6,500
|
|
5,500
|
|
12,000
|
|
|||||
|
7.0% Convertible perpetual preferred stock
|
18,375
|
|
2,625
|
|
21,000
|
|
|||||
|
Total
|
$
|
38,953
|
|
$
|
16,572
|
|
$
|
55,525
|
|
||
|
Year Ended December 31, 2012
|
|||||||||||
|
8.5% Convertible perpetual preferred stock
|
$
|
14,078
|
|
$
|
8,447
|
|
$
|
22,525
|
|
||
|
6.0% Convertible perpetual preferred stock
|
6,500
|
|
5,500
|
|
12,000
|
|
|||||
|
7.0% Convertible perpetual preferred stock
|
18,375
|
|
2,625
|
|
21,000
|
|
|||||
|
Total
|
$
|
38,953
|
|
$
|
16,572
|
|
$
|
55,525
|
|
||
Common Stock
The following table presents information regarding the Company’s common stock (in thousands):
|
December 31,
|
|||||
|
2014
|
2013
|
||||
|
Shares authorized
|
800,000
|
|
800,000
|
|
|
|
Shares outstanding at end of period
|
484,819
|
|
490,290
|
|
|
|
Shares held in treasury
|
1,113
|
|
1,319
|
|
|
On April 17, 2012, the Company issued approximately
74.0 million
shares of SandRidge common stock to satisfy the stock portion of the consideration paid in the Dynamic Acquisition. See Note
3
for further discussion of the Dynamic Acquisition.
Stock Repurchase Program.
In 2014, the Company’s Board of Directors approved a share repurchase program under which the Company can repurchase up to
$200.0 million
of the Company’s common stock. Under the program’s terms, shares may be repurchased on the open market, through privately negotiated transactions such as block trades, or by other means as determined by the Company’s management and in accordance with the requirements of the Securities and Exchange Commission. The timing and actual number of shares repurchased will depend on a variety of factors including price, corporate and regulatory requirements, and other conditions. There is no fixed termination date for this repurchase program, and the repurchase program may be suspended or discontinued at any time. Payment for shares repurchased under the program will be funded using the Company's working capital. During the year ended
December 31, 2014
,
27,411,000
shares totaling
$111.3 million
, net of
$0.5 million
in broker fees and commissions, were repurchased under the program at prices equivalent to the then current market price and immediately retired. As the Company had an accumulated deficit balance, the excess of the repurchase price over the par value was fully applied to additional paid-in capital.
Stockholder Rights Plan.
On November 19, 2012, the Company’s Board adopted a stockholder rights plan pursuant to which the Board authorized and declared to stockholders of record on November 29, 2012 a dividend of
one
preferred share purchase right (the “Right”) for each outstanding share of common stock. Effective April 29, 2013, at the direction of the Board, the Company amended the stockholder rights plan to accelerate the expiration date of the Rights to April 29, 2013, resulting in expiration of the Rights and termination of the stockholder rights plan.
F-46
SandRidge Energy, Inc. and Subsidiaries
Notes to Consolidated Financial Statements - (Continued)
Treasury Stock
The Company makes required statutory tax payments on behalf of employees when their restricted stock awards vest and then withholds a number of vested shares of common stock having a value on the date of vesting equal to the tax obligation. The following table shows the number of shares withheld for taxes and the associated value of those shares for the years ended
December 31, 2014
,
2013
and
2012
. These shares were accounted for as treasury stock when withheld, and then immediately retired.
|
Year Ended December 31,
|
|||||||||||
|
2014
|
2013
|
2012
|
|||||||||
|
(In thousands)
|
|||||||||||
|
Number of shares withheld for taxes
|
1,034
|
|
5,679
|
|
1,547
|
|
|||||
|
Value of shares withheld for taxes
|
$
|
6,373
|
|
$
|
30,126
|
|
$
|
11,312
|
|
||
Shares of Company common stock held as assets in a trust for the Company’s non-qualified deferred compensation plan are accounted for as treasury shares. These shares are not included as outstanding shares of common stock for accounting purposes. For corporate purposes, including for the purpose of voting at Company stockholder meetings, these shares are considered outstanding and have voting rights, which are exercised by the Company.
Stockholder Receivable
On November 9, 2012, Tom L. Ward, the Company’s Chairman and CEO at that time, and the Company entered into a settlement agreement with a stockholder plaintiff relating to a third-party claim under Section 16(b) of the Securities Exchange Act of 1934, as amended. The claim was filed in December 2010 and related to certain transactions involving Company common stock entered into by Mr. Ward in 2008 and 2009. The settlement agreement found no liability or other wrongdoing under Section 16(b) regarding the transactions in question. Under the settlement agreement, Mr. Ward agreed to pay to the Company
$5.0 million
in
four
installments over
four years
commencing October 2013 and to waive his rights under his indemnification agreement with the Company with respect to this Section 16(b) action. The Company agreed to pay the fees of the plaintiff’s lawyers and paid Mr. Ward’s legal expenses as required under his indemnification agreement.
Based on the nature of the settlement as well as Mr. Ward’s position as an officer of the Company at that time, a receivable was recorded as a component of additional paid-in capital. Amounts receivable from Mr. Ward at
December 31, 2014
and
2013
of
$2.5 million
and
$3.8 million
, respectively, are included in the accompanying consolidated balance sheets.
Restricted Common Stock
The Company awards restricted common stock under its long-term incentive compensation plan that generally vests over a
four
-year period, subject to certain conditions, and is valued based upon the market value of common stock on the date of grant. Shares of restricted common stock are subject to restriction on transfer. Unvested restricted stock awards are included in the Company’s outstanding shares of common stock.
F-47
SandRidge Energy, Inc. and Subsidiaries
Notes to Consolidated Financial Statements - (Continued)
Restricted stock activity for the years ended
December 31, 2012
,
2013
and
2014
was as follows (shares in thousands):
|
Number of
Shares
|
Weighted-
Average Grant
Date Fair Value
|
|||||
|
Unvested restricted shares outstanding at December 31, 2011
|
13,386
|
|
$
|
9.34
|
|
|
|
Granted
|
7,604
|
|
$
|
7.46
|
|
|
|
Vested
|
(4,394
|
)
|
$
|
10.73
|
|
|
|
Forfeited / Canceled
|
(1,268
|
)
|
$
|
8.54
|
|
|
|
Unvested restricted shares outstanding at December 31, 2012
|
15,328
|
|
$
|
8.07
|
|
|
|
Granted
|
7,462
|
|
$
|
6.32
|
|
|
|
Vested
|
(13,395
|
)
|
$
|
7.85
|
|
|
|
Forfeited / Canceled
|
(1,752
|
)
|
$
|
7.33
|
|
|
|
Unvested restricted shares outstanding at December 31, 2013
|
7,643
|
|
$
|
6.92
|
|
|
|
Granted
|
6,367
|
|
$
|
6.17
|
|
|
|
Vested
|
(3,432
|
)
|
$
|
7.04
|
|
|
|
Forfeited / Canceled
|
(2,022
|
)
|
$
|
6.60
|
|
|
|
Unvested restricted shares outstanding at December 31, 2014
|
8,556
|
|
$
|
6.39
|
|
|
For the years ended
December 31, 2014
,
2013
and
2012
, the Company recognized equity compensation expense of
$17.6 million
,
$82.8 million
, and
$39.7 million
, net of
$6.0 million
,
$5.5 million
, and
$7.5 million
capitalized, respectively, related to restricted common stock. Amounts recognized during the year ended December 31, 2013 include approximately
$48.5 million
recognized in connection with the separation of certain former executives from the Company.
The total fair value of restricted stock that vested during the years ended
December 31, 2014
,
2013
and
2012
, was
$21.4 million
,
$71.6 million
and
$32.1 million
, respectively. As of
December 31, 2014
, there was approximately
$39.3 million
of unrecognized compensation cost related to unvested restricted stock awards, which is expected to be recognized over a weighted average period of
2.3
years. The Company had approximately
6.2 million
shares available for grant under its existing incentive compensation plan at
December 31, 2014
.
See Note
17
for discussion of the Company’s performance units.
17
. Incentive, Retirement and Deferred Compensation Plans
Annual Incentive Plan.
In June 2013, the Compensation Committee of the Company’s Board (the “Compensation Committee”) approved an annual incentive plan effective June 2013 for all employees and discontinued the Company’s then existing cash bonus program with final payments under the program of approximately
$10.9 million
made in July 2013. For certain members of management, the annual incentive plan incorporates objective performance criteria, individual performance goals and competitive target award levels for the 2014 performance year with payout percentages ranging from
0%
to
200%
of specified target levels based on actual performance. As of December 31,
2014
, the Company had accrued approximately
$21.1 million
for the 2014 annual incentive for all employees, including an accrual for an annual incentive for specified members of management based on actual performance compared to target levels specified in the annual incentive plan.
Performance Units.
The Company periodically grants performance units to certain members of senior management under the Company’s existing long-term incentive plan which vest over a performance period of approximately three years with cash settlement, if any, occurring at the end of the performance period. The value, and ultimate cash settlement, of the performance units is determined based upon the Company’s total shareholder return relative to that of a predetermined peer group over a specific performance period. If performance exceeds established minimum thresholds, cash settlement could range from
$50
to
$200
per unit. If minimum target thresholds are not met, the cash settlement is reduced to zero.
F-48
SandRidge Energy, Inc. and Subsidiaries
Notes to Consolidated Financial Statements - (Continued)
The performance units are valued for accounting purposes using a Monte Carlo simulation based on certain assumptions, including (i) a volatility assumption based on the historical realized price volatility of the Company’s common stock and the common stock of the predetermined peer group and (ii) a risk-free interest rate based on the U.S. Treasury bond yields for a term commensurate with the approximate remaining vesting period for each grant. As of
December 31, 2014
and 2013, the Company’s liability associated with performance units totaled
$0.7 million
and
$1.8 million
, respectively, which represents the fair value of the performance units for which requisite service has been completed. The liability will continue to be adjusted in future periods based upon changes in fair value of the performance units and the portion of requisite service completed. The following table presents a summary of the fair value of the performance units and the related assumptions for all outstanding units as of
December 31, 2014
and
2013
.
|
December 31,
|
|||||||||||||
|
2014
|
2013
|
||||||||||||
|
Expected price volatility range
|
26.6
|
%
|
-
|
86.6
|
%
|
27.0
|
%
|
-
|
44.8
|
%
|
|||
|
Weighted-average risk-free interest rate
|
0.5
|
%
|
0.4
|
%
|
|||||||||
|
Weighted-average fair value per unit
|
$
|
13.85
|
|
$
|
97.06
|
|
|||||||
Performance unit activity for the years ended
December 31, 2014
and 2013 was as follows:
|
December 31,
|
|||||
|
2014
|
2013
|
||||
|
Outstanding at January 1
|
31,142
|
|
—
|
|
|
|
Granted
|
47,015
|
|
31,142
|
|
|
|
Forfeited /canceled
|
(12,060
|
)
|
—
|
|
|
|
Outstanding at December 31
|
66,097
|
|
31,142
|
|
|
|
Performance period ending December 31, 2015
|
|||||
|
Vested
|
9,208
|
|
12,178
|
|
|
|
Unvested
|
18,874
|
|
18,964
|
|
|
|
Performance period ending December 31, 2016
|
|||||
|
Vested
|
12,671
|
|
—
|
|
|
|
Unvested
|
25,344
|
|
—
|
|
|
For the years ended
December 31, 2014
and
2013
, the Company recognized equity compensation expense of
$(1.0) million
and
$1.6 million
, respectively, net of amounts capitalized of
$(0.05) million
and
$0.2 million
, respectively, related to performance units. Based upon the fair value per unit as of
December 31, 2014
, the total fair value of the performance units that vested during the year ended
December 31, 2014
and
2013
was
$0.3 million
and
$0.1 million
, respectively.
No
payments for performance units were made in the years ended
December 31, 2014
and
2013
. As of
December 31, 2014
, there was approximately
$0.3 million
of unrecognized compensation cost related to unvested performance units, which is expected to be recognized over a weighted average period of
1.6
years.
In addition to performance units, the Company’s incentive plan permits cash incentive awards as well as the grant of stock options, stock appreciation rights, restricted stock units and any other form of award based on the value (or the increase in value) of shares of the common stock of the Company.
Deferred Compensation Plans.
The Company maintains a 401(k) retirement plan for its employees. Under the plan, eligible employees may elect to defer a portion of their earnings up to the maximum allowed by regulations promulgated by the Internal Revenue Service (“IRS”). The Company made matching contributions to the plan through cash purchases of Company stock equal to
100%
on the first
10%
employee deferred wages for the year ended December 31, 2014 and
100%
on the first
15%
of employee deferred wages for the years ended December 31, 2013 and 2012. Retirement plan expense for the years ended December 31,
2014
,
2013
and
2012
was approximately
$8.7 million
,
$11.0 million
and
$11.4 million
, respectively.
The Company maintains a non-qualified deferred compensation plan that allows eligible highly compensated employees to elect to defer income exceeding the IRS annual limitations on qualified 401(k) retirement plans. The Company made matching contributions on non-qualified contributions up to a maximum of
10%
of employee compensation for the year ended December 31, 2014 and
15%
of employee compensation for the years ended December 31, 2013 and 2012. For the years ended December
F-49
SandRidge Energy, Inc. and Subsidiaries
Notes to Consolidated Financial Statements - (Continued)
31,
2014
,
2013
and
2012
, employer contributions of cash purchases of Company stock were approximately
$2.0 million
,
$2.7 million
and
$3.5 million
, respectively. Any assets placed in trust by the Company to fund future obligations of the Company’s non-qualified deferred compensation plan are subject to the claims of creditors in the event of insolvency or bankruptcy, and participants are general creditors of the Company as to their own deferred compensation in, and the Company’s contributions to, the plan.
18
. Income Taxes
The Company’s income tax (benefit) provision consisted of the following components for the years ended December 31,
2014
,
2013
and
2012
(in thousands):
|
|
Year Ended December 31,
|
||||||||||
|
|
2014
|
2013
|
2012
|
||||||||
|
Current
|
|||||||||||
|
Federal
|
$
|
(1,160
|
)
|
$
|
3,842
|
|
$
|
(72
|
)
|
||
|
State
|
(1,133
|
)
|
1,842
|
|
(2
|
)
|
|||||
|
(2,293
|
)
|
5,684
|
|
(74
|
)
|
||||||
|
Deferred
|
|||||||||||
|
Federal
|
—
|
|
—
|
|
(97,410
|
)
|
|||||
|
State
|
—
|
|
—
|
|
(2,878
|
)
|
|||||
|
—
|
|
—
|
|
(100,288
|
)
|
||||||
|
Total (benefit) provision
|
(2,293
|
)
|
5,684
|
|
(100,362
|
)
|
|||||
|
Less: income tax provision attributable to noncontrolling interest
|
283
|
|
308
|
|
304
|
|
|||||
|
Total (benefit) provision attributable to SandRidge Energy, Inc.
|
$
|
(2,576
|
)
|
$
|
5,376
|
|
$
|
(100,666
|
)
|
||
A reconciliation of the (benefit) provision for income taxes at the statutory federal tax rate to the Company’s actual income tax benefit is as follows for the years ended December 31,
2014
,
2013
and
2012
(in thousands):
|
|
2014
|
2013
|
2012
|
||||||||
|
Computed at federal statutory rate
|
$
|
122,362
|
|
$
|
(178,078
|
)
|
$
|
51,173
|
|
||
|
State taxes, net of federal benefit
|
4,145
|
|
(886
|
)
|
8,913
|
|
|||||
|
Non-deductible expenses
|
1,895
|
|
2,589
|
|
7,247
|
|
|||||
|
Stock-based compensation
|
1,467
|
|
7,611
|
|
7,172
|
|
|||||
|
Net effects of consolidating the non-controlling interests’ tax provisions
|
(34,614
|
)
|
(13,901
|
)
|
(37,047
|
)
|
|||||
|
Bargain purchase gain
|
—
|
|
—
|
|
(42,944
|
)
|
|||||
|
Impairment of non-deductible goodwill
|
—
|
|
—
|
|
71,885
|
|
|||||
|
Change in valuation allowance
|
(96,769
|
)
|
188,599
|
|
(66,429
|
)
|
|||||
|
Valuation allowance release
|
—
|
|
—
|
|
(100,288
|
)
|
|||||
|
Other
|
(1,062
|
)
|
(558
|
)
|
(348
|
)
|
|||||
|
Total (benefit) provision attributable to SandRidge Energy, Inc.
|
$
|
(2,576
|
)
|
$
|
5,376
|
|
$
|
(100,666
|
)
|
||
Deferred income taxes are provided to reflect the future tax consequences of temporary differences between the tax basis of assets and liabilities and their reported amounts in the financial statements. The Company’s deferred tax assets have been reduced by a valuation allowance due to a determination made that it is more likely than not that some or all of the deferred assets will not be realized based on the weight of all available evidence. As of
December 31, 2014
,
2013
and
2012
the balance of the valuation allowance was
$649.6 million
,
$753.5 million
, and
$557.3 million
, respectively. During the year ended December 31, 2012, the Company recorded a net deferred tax liability of
$100.3 million
associated with the Dynamic Acquisition and released a corresponding portion of the previously recorded valuation allowance. The partial release of the valuation allowance in 2012 was based on management’s assessment that it is more likely than not that the Company will realize a benefit from more of its existing deferred tax assets as the Dynamic deferred tax liabilities are available to offset the reversal of the Company’s deferred tax assets. Although the Company had a full valuation allowance against its net deferred tax asset at each year
December 31, 2014
,
2013
and
2012
, the partial release of the valuation allowance resulted in a deferred tax benefit in 2012. The Company continues to closely monitor and weigh all available evidence, including both positive and negative, in making its determination whether to
F-50
SandRidge Energy, Inc. and Subsidiaries
Notes to Consolidated Financial Statements - (Continued)
maintain a valuation allowance. As a result of the significant weight placed on the Company’s cumulative negative earnings position, the Company continued to maintain the full valuation allowance against its net deferred tax asset at
December 31, 2014
.
Significant components of the Company’s deferred tax assets and liabilities are as follows (in thousands):
|
|
December 31,
|
||||||
|
|
2014
|
2013
|
|||||
|
Deferred tax liabilities
|
|||||||
|
Investments(1)
|
$
|
272,902
|
|
$
|
301,447
|
|
|
|
Property, plant and equipment
|
364,576
|
|
180,140
|
|
|||
|
Derivative contracts
|
113,735
|
|
—
|
|
|||
|
Total deferred tax liabilities
|
751,213
|
|
481,587
|
|
|||
|
Deferred tax assets
|
|||||||
|
Derivative contracts
|
—
|
|
3,692
|
|
|||
|
Allowance for doubtful accounts
|
19,086
|
|
20,358
|
|
|||
|
Net operating loss carryforwards
|
1,265,458
|
|
973,675
|
|
|||
|
Compensation and benefits
|
19,867
|
|
24,895
|
|
|||
|
Alternative minimum tax credits and other carryforwards
|
43,840
|
|
46,624
|
|
|||
|
Asset retirement obligations
|
21,946
|
|
147,626
|
|
|||
|
CO
2
under-delivery shortfall penalty
|
27,674
|
|
15,012
|
|
|||
|
Other
|
2,934
|
|
3,156
|
|
|||
|
Total deferred tax assets
|
1,400,805
|
|
1,235,038
|
|
|||
|
Valuation allowance
|
(649,592
|
)
|
(753,451
|
)
|
|||
|
Net deferred tax liability
|
$
|
—
|
|
$
|
—
|
|
|
____________________
|
(1)
|
Includes the Company’s deferred tax liability resulting from its investment in the Royalty Trusts. See Note
4
for further discussion of the Royalty Trusts.
|
As of
December 31, 2014
, the Company had approximately
$9.3 million
of alternative minimum tax credits available that do not expire. In addition, the Company had approximately
$3.4 billion
of federal net operating loss carryovers that expire during the years
2023
through
2034
. Excess tax benefits of approximately
$17.7 million
associated with the vesting of restricted stock awards are included in the federal net operating loss carryovers, but will not be recognized as a tax benefit recorded to additional paid-in capital until realized.
Internal Revenue Code (“IRC”) Section 382 addresses company ownership changes and specifically limits the utilization of certain deductions and other tax attributes on an annual basis following an ownership change. The Company experienced ownership changes within the meaning of IRC Section 382 during 2008 and 2010 that subjected certain of the Company’s tax attributes, including
$929.4 million
of federal net operating loss carryforwards, to an IRC Section 382 limitation. The limitation could result in a material amount of existing loss carryforwards expiring unused. The limitation did not result in a current federal tax liability at
December 31, 2014
.
At
December 31, 2014
and
2013
, respectively, the Company had a liability of approximately
$0.1 million
and
$1.4 million
for unrecognized tax benefits. A reconciliation of the beginning and ending amount of unrecognized tax benefits is as follows (in thousands):
|
|
December 31,
|
||||||
|
|
2014
|
2013
|
|||||
|
Unrecognized tax benefit at January 1
|
$
|
1,382
|
|
$
|
1,330
|
|
|
|
Changes to unrecognized tax benefits related to the current year
|
—
|
|
262
|
|
|||
|
Changes to unrecognized tax benefits related to a prior year
|
(17
|
)
|
(210
|
)
|
|||
|
Decreases to unrecognized tax benefits for settlements with tax authorities
|
(1,288
|
)
|
—
|
|
|||
|
Unrecognized tax benefit at December 31
|
$
|
77
|
|
$
|
1,382
|
|
|
F-51
SandRidge Energy, Inc. and Subsidiaries
Notes to Consolidated Financial Statements - (Continued)
Consistent with its policy to record interest and penalties on income taxes as a component of the income tax provision, the Company has included approximately
$(0.1) million
,
$(0.1) million
and
$0.3 million
of accrued gross interest with respect to unrecognized tax benefits in its accompanying consolidated statements of operations during the years ended
December 31, 2014
,
2013
and
2012
, respectively. Included in the
$1.4 million
liability for unrecognized tax benefits at December 31, 2013 was
$0.1 million
for interest and penalties relating to uncertain tax positions. The company does not expect a significant change in its gross unrecognized tax benefits balance within the next 12 months.
The Company’s only taxing jurisdiction is the United States (federal and state). The Company’s tax years
2011
to present remain open for federal examination. Additionally, tax years
2005
through
2010
remain subject to examination for the purpose of determining the amount of federal net operating loss and other carryforwards. The number of years open for state tax audits varies, depending on the state, but are generally from
three
to
five
years.
19
. Earnings per Share
Basic earnings per share are computed using the weighted average number of common shares outstanding during the period. Diluted earnings per share are computed using the weighted average shares outstanding during the period, but also include the dilutive effect of awards of restricted stock, using the treasury stock method, and outstanding convertible preferred stock. Under the treasury stock method, the amount of unrecognized compensation expense related to unvested stock-based compensation grants is assumed to be used to repurchase shares at the average market price. The following table summarizes the calculation of weighted average common shares outstanding used in the computation of diluted earnings per share, for the years ended
December 31, 2014
,
2013
and
2012
(in thousands):
|
Income (Loss)
|
Weighted Average Shares
|
Earnings (Loss) Per Share
|
||||||||
|
(In thousands, except per share amounts)
|
||||||||||
|
Year Ended December 31, 2014
|
||||||||||
|
Basic earnings per share
|
$
|
203,260
|
|
479,644
|
|
$
|
0.42
|
|
||
|
Effect of dilutive securities
|
||||||||||
|
Restricted stock
|
—
|
|
2,181
|
|
||||||
|
Convertible preferred stock(1)
|
6,500
|
|
17,918
|
|
||||||
|
Diluted earnings per share
|
$
|
209,760
|
|
499,743
|
|
$
|
0.42
|
|
||
|
Year Ended December 31, 2013
|
||||||||||
|
Basic loss per share
|
$
|
(609,414
|
)
|
481,148
|
|
$
|
(1.27
|
)
|
||
|
Effect of dilutive securities
|
||||||||||
|
Restricted stock(2)
|
—
|
|
—
|
|
||||||
|
Convertible preferred stock(3)
|
—
|
|
—
|
|
||||||
|
Diluted loss per share
|
$
|
(609,414
|
)
|
481,148
|
|
$
|
(1.27
|
)
|
||
|
Year Ended December 31, 2012
|
||||||||||
|
Basic earnings per share
|
$
|
86,046
|
|
453,595
|
|
$
|
0.19
|
|
||
|
Effect of dilutive securities
|
||||||||||
|
Restricted stock
|
—
|
|
2,420
|
|
||||||
|
Convertible preferred stock(3)
|
—
|
|
—
|
|
||||||
|
Diluted earnings per share
|
$
|
86,046
|
|
456,015
|
|
$
|
0.19
|
|
||
____________________
|
(1)
|
Potential common shares related to the Company’s outstanding 8.5% and 7.0% convertible perpetual preferred stock covering
71.7 million
shares for the year ended
December 31, 2014
were excluded from the computation of earnings per share because their effect would have been antidilutive under the if-converted method.
|
|
(2)
|
Restricted stock awards covering
0.5 million
shares were excluded from the computation of loss per share because their effect would have been antidilutive.
|
|
(3)
|
Potential common shares related to the Company’s outstanding
8.5%
,
6.0%
and
7.0%
convertible perpetual preferred stock covering
90.1 million
shares for the years ended
December 31, 2013
and
2012
, were excluded from the computation of earnings (loss) per share because their effect would have been antidilutive under the if-converted method.
|
See Note
16
for discussion of the Company’s convertible perpetual preferred stock.
F-52
SandRidge Energy, Inc. and Subsidiaries
Notes to Consolidated Financial Statements - (Continued)
As discussed in Note
16
, the Company’s Board adopted a stockholder rights plan in November 2012 under which holders of common stock were issued Rights. As the contingency for exercising these Rights had not been met as of December 31, 2012, the Company did not include the conversion of any Rights in its computation of diluted earnings per share for the year ended December 31, 2012. The Rights expired and the stockholder rights plan was terminated in 2013.
20
. Related Party Transactions
The Company enters into transactions in the ordinary course of business with certain related parties. These transactions primarily consist of sales of oil and natural gas. See Note
10
for accounts payable attributable to related party transactions. During the years ended
December 31, 2013
and
2012
, sales to and reimbursements from related parties were
$1.6 million
and
$12.8 million
, respectively. These amounts primarily relate to sales of natural gas from the Permian Properties, which were sold in February 2013, to the Company’s partner in GRLP.
Former Chairman and CEO Severance.
On June 28, 2013, the Company’s then current CEO, Tom Ward, separated employment from the Company. In accordance with the terms of Mr. Ward’s employment agreement, the Company incurred $
57.9 million
in salary and bonus expense and
$36.8 million
associated with the accelerated vesting of approximately
6.3 million
shares of restricted stock awards during the third quarter of 2013. As of
December 31, 2014
, the remaining amounts due under the terms of his employment agreement include
$3.1 million
to be paid in monthly installments through December 2016. These amounts are included in other current liabilities and other long-term obligations in the accompanying consolidated balance sheet. See Note
16
for discussion of the stockholder receivable due from Mr. Ward.
Other Employee Termination Benefits.
Certain employees received termination benefits, including severance and accelerated stock vesting, upon separation of service from the Company during the years ended
December 31, 2014
and
2013
. For the year ended
December 31, 2014
, employee termination benefits were
$8.9 million
primarily as a result of the sale of the Gulf Properties. For the year ended
December 31, 2013
, employee termination benefits, excluding amounts attributable to the Company’s former chairman and CEO, were
$23.2 million
primarily as a result of other executives’ separation from employment.
Oklahoma City Thunder Agreements.
Until April 2014 the Company’s former Chairman and CEO owned, and one of the Company’s directors currently owns, minority interests in a limited liability company that owns and operates the Oklahoma City Thunder basketball team. The Company was party to a sponsorship agreement, whereby it paid approximately
$3.3 million
per year for advertising and promotional activities related to the Oklahoma City Thunder, which terminated with the conclusion of the 2012-2013 season.
Office Lease.
In July 2012, the Company entered into a commercial lease to rent space in a building owned by an entity that is partially owned by one of the Company’s directors. The terms provides for a lease term through December 2017 with annual rent of approximately
$0.5 million
. Any renovation costs paid by the Company with respect to the leased space are applied toward future rent payments. As of
December 31, 2014
, the Company has made renovations costing approximately
$3.3 million
. The terms of the lease were reviewed and approved by the disinterested members of the Board and the Company believes that the rent expense to be paid under the lease is at a fair market rate.
2014 Divestiture.
See Note
3
for discussion of the sale of the Gulf Properties to Fieldwood and the Company’s guarantee on behalf of Fieldwood of certain associated plugging and abandonment obligations associated with the Gulf Properties. Fieldwood is a portfolio company of Riverstone Holdings LLC, affiliates of which own a significant number of shares of the Company’s common stock.
Acquisition of Ownership Interest.
In March 2014, the Company purchased the additional ownership interest owned by its partner in GRLP and Genpar, which was deemed a related party at the time. See Note
4
for additional discussion.
F-53
SandRidge Energy, Inc. and Subsidiaries
Notes to Consolidated Financial Statements - (Continued)
21
. Subsequent Events
Royalty Trust Distributions
. On
January 29, 2015
, the Royalty Trusts announced quarterly distributions for the three-month period ended
December 31, 2014
. The following distributions will be paid on
February 27, 2015
to holders of record as of the close of business on
February 13, 2015
(in thousands):
|
Royalty Trust
|
Total Distribution
|
Amount to be Distributed to Third-Party Unitholders
|
||||||
|
Mississippian Trust I
|
$
|
8,538
|
|
$
|
6,242
|
|
||
|
Permian Trust
|
27,681
|
|
25,830
|
|
||||
|
Mississippian Trust II
|
13,985
|
|
11,644
|
|
||||
|
Total
|
$
|
50,204
|
|
$
|
43,716
|
|
||
Senior Credit Facility Amendment.
On February 23, 2015, the Company amended the terms of its senior credit facility. See Note
12
for additional discussion.
22
. Business Segment Information
The Company has
three
reportable business segments: exploration and production, drilling and oil field services and midstream services. These segments represent the Company’s
three
main business units, each offering different products and services. The exploration and production segment is engaged in the exploration and production of oil and natural gas properties and includes the activities of the Royalty Trusts. The drilling and oil field services segment is engaged in the contract drilling of oil and natural gas wells and provides various oil field services. The midstream services segment is engaged in the purchasing, gathering, treating and selling of natural gas and coordinates the delivery of electricity to the Company’s exploration and production operations in the Mid-Continent. The All Other column in the tables below includes items not related to the Company’s reportable segments, including the Company’s corporate operations.
F-54
SandRidge Energy, Inc. and Subsidiaries
Notes to Consolidated Financial Statements - (Continued)
Management evaluates the performance of the Company’s business segments based on income (loss) from operations. Summarized financial information concerning the Company’s segments is shown in the following table (in thousands):
|
Exploration and
Production(1)
|
Drilling and Oil
Field Services(2)
|
Midstream
Services(3)
|
All Other(4)
|
Consolidated
Total
|
|||||||||||||||
|
Year Ended December 31, 2014
|
|||||||||||||||||||
|
Revenues
|
$
|
1,423,073
|
|
$
|
192,944
|
|
$
|
142,987
|
|
$
|
4,376
|
|
$
|
1,763,380
|
|
||||
|
Inter-segment revenue
|
(173
|
)
|
(116,856
|
)
|
(87,593
|
)
|
—
|
|
(204,622
|
)
|
|||||||||
|
Total revenues
|
$
|
1,422,900
|
|
$
|
76,088
|
|
$
|
55,394
|
|
$
|
4,376
|
|
$
|
1,558,758
|
|
||||
|
Income (loss) from operations
|
$
|
713,716
|
|
$
|
(37,564
|
)
|
$
|
(9,094
|
)
|
$
|
(76,834
|
)
|
$
|
590,224
|
|
||||
|
Interest income (expense), net
|
100
|
|
—
|
|
—
|
|
(244,209
|
)
|
(244,109
|
)
|
|||||||||
|
Other (expense) income, net
|
(423
|
)
|
(541
|
)
|
9
|
|
4,445
|
|
3,490
|
|
|||||||||
|
Income (loss) before income taxes
|
$
|
713,393
|
|
$
|
(38,105
|
)
|
$
|
(9,085
|
)
|
$
|
(316,598
|
)
|
$
|
349,605
|
|
||||
|
Capital expenditures(5)
|
$
|
1,508,100
|
|
$
|
18,385
|
|
$
|
44,606
|
|
$
|
37,798
|
|
$
|
1,608,889
|
|
||||
|
Depreciation, depletion, amortization and accretion
|
$
|
443,573
|
|
$
|
29,105
|
|
$
|
10,085
|
|
$
|
20,260
|
|
$
|
503,023
|
|
||||
|
At December 31, 2014
|
|||||||||||||||||||
|
Total assets
|
$
|
6,273,802
|
|
$
|
115,083
|
|
$
|
219,691
|
|
$
|
650,649
|
|
$
|
7,259,225
|
|
||||
|
Year Ended December 31, 2013
|
|||||||||||||||||||
|
Revenues
|
$
|
1,834,480
|
|
$
|
187,456
|
|
$
|
179,989
|
|
$
|
3,127
|
|
$
|
2,205,052
|
|
||||
|
Inter-segment revenue
|
(320
|
)
|
(120,815
|
)
|
(100,529
|
)
|
—
|
|
(221,664
|
)
|
|||||||||
|
Total revenues
|
$
|
1,834,160
|
|
$
|
66,641
|
|
$
|
79,460
|
|
$
|
3,127
|
|
$
|
1,983,388
|
|
||||
|
Income (loss) from operations
|
$
|
62,509
|
|
$
|
(40,155
|
)
|
$
|
(21,567
|
)
|
$
|
(169,788
|
)
|
$
|
(169,001
|
)
|
||||
|
Interest income (expense), net
|
1,168
|
|
—
|
|
(209
|
)
|
(271,193
|
)
|
(270,234
|
)
|
|||||||||
|
Loss on extinguishment of debt
|
—
|
|
—
|
|
—
|
|
(82,005
|
)
|
(82,005
|
)
|
|||||||||
|
Other income (expense), net
|
5,487
|
|
—
|
|
(3,222
|
)
|
10,180
|
|
12,445
|
|
|||||||||
|
Income (loss) before income taxes
|
$
|
69,164
|
|
$
|
(40,155
|
)
|
$
|
(24,998
|
)
|
$
|
(512,806
|
)
|
$
|
(508,795
|
)
|
||||
|
Capital expenditures(5)
|
$
|
1,319,012
|
|
$
|
7,125
|
|
$
|
55,706
|
|
$
|
42,040
|
|
$
|
1,423,883
|
|
||||
|
Depreciation, depletion, amortization and accretion
|
$
|
605,242
|
|
$
|
33,291
|
|
$
|
7,972
|
|
$
|
20,140
|
|
$
|
666,645
|
|
||||
|
At December 31, 2013
|
|
|
|
|
|
||||||||||||||
|
Total assets
|
$
|
6,157,225
|
|
$
|
158,737
|
|
$
|
188,165
|
|
$
|
1,180,668
|
|
$
|
7,684,795
|
|
||||
|
Year Ended December 31, 2012
|
|||||||||||||||||||
|
Revenues
|
$
|
1,775,221
|
|
$
|
379,345
|
|
$
|
116,659
|
|
$
|
4,356
|
|
$
|
2,275,581
|
|
||||
|
Inter-segment revenue
|
(403
|
)
|
(262,712
|
)
|
(77,824
|
)
|
—
|
|
(340,939
|
)
|
|||||||||
|
Total revenues
|
$
|
1,774,818
|
|
$
|
116,633
|
|
$
|
38,835
|
|
$
|
4,356
|
|
$
|
1,934,642
|
|
||||
|
Income (loss) from operations
|
$
|
518,144
|
|
$
|
11,911
|
|
$
|
(73,027
|
)
|
$
|
(131,832
|
)
|
$
|
325,196
|
|
||||
|
Interest income (expense), net
|
1,286
|
|
—
|
|
(559
|
)
|
(304,076
|
)
|
(303,349
|
)
|
|||||||||
|
Bargain purchase gain
|
122,696
|
|
—
|
|
—
|
|
—
|
|
122,696
|
|
|||||||||
|
Loss on extinguishment of debt
|
—
|
|
—
|
|
—
|
|
(3,075
|
)
|
(3,075
|
)
|
|||||||||
|
Other income, net
|
1,868
|
|
—
|
|
—
|
|
2,873
|
|
4,741
|
|
|||||||||
|
Income (loss) before income taxes
|
$
|
643,994
|
|
$
|
11,911
|
|
$
|
(73,586
|
)
|
$
|
(436,110
|
)
|
$
|
146,209
|
|
||||
|
Capital expenditures(5)
|
$
|
2,001,490
|
|
$
|
27,527
|
|
$
|
80,413
|
|
$
|
114,552
|
|
$
|
2,223,982
|
|
||||
|
Depreciation, depletion, amortization and accretion
|
$
|
598,101
|
|
$
|
34,677
|
|
$
|
7,188
|
|
$
|
17,864
|
|
$
|
657,830
|
|
||||
F-55
SandRidge Energy, Inc. and Subsidiaries
Notes to Consolidated Financial Statements - (Continued)
____________________
|
(1)
|
Income (loss) from operations includes a full cost ceiling impairment of
$164.8 million
for the year ended December 31, 2014, a loss on the sale of the Permian Properties of
$398.9 million
for the year ended
December 31, 2013
, an impairment of the Company’s goodwill of
$235.4 million
for the year ended
December 31, 2012
and the Company’s (gain) loss on derivative contracts, including net cash payments upon settlement, for the years ended
December 31, 2014
,
2013
and 2012. See Note
13
for discussion of derivative contracts.
|
|
(2)
|
For the years ended
December 31, 2014
and 2013, income (loss) from operations includes impairments of
$27.4 million
and
$11.1 million
, respectively, on certain drilling assets.
|
|
(3)
|
For the years ended
December 31, 2014
,
2013
and 2012, loss from operations includes impairments of the Company’s gas treating plants in west Texas and other midstream assets of
$0.6 million
,
$3.9 million
and
$59.7 million
, respectively.
|
|
(4)
|
For the year ended
December 31, 2013
, loss from operations includes a
$2.9 million
impairment of a corporate asset and an
$8.3 million
impairment of the Company’s CO
2
compression facilities. For the year ended
December 31, 2012
, loss from operations includes a
$19.6 million
impairment of the Company’s CO
2
compression facilities.
|
|
(5)
|
On an accrual basis and exclusive of acquisitions.
|
Major Customers.
For the years ended
December 31, 2014
,
2013
and
2012
, the Company had sales exceeding 10% of total revenues to the following oil and natural gas purchasers (in thousands):
|
|
2014
|
|||||
|
|
Sales
|
% of Revenue
|
||||
|
Plains Marketing, L.P.
|
$
|
597,117
|
|
38.3
|
%
|
|
|
Atlas Pipeline Mid-Continent West OK LLC
|
$
|
333,027
|
|
21.4
|
%
|
|
|
|
2013
|
|||||
|
|
Sales
|
% of Revenue
|
||||
|
Plains Marketing, L.P.
|
$
|
491,258
|
|
24.8
|
%
|
|
|
Shell Trading (US) Company
|
$
|
347,422
|
|
17.5
|
%
|
|
|
Atlas Pipeline Mid-Continent West OK LLC
|
$
|
211,838
|
|
10.7
|
%
|
|
|
|
2012
|
|||||
|
|
Sales
|
% of Revenue
|
||||
|
Plains Marketing, L.P.
|
$
|
426,339
|
|
15.6
|
%
|
|
|
Enterprise Crude Oil, LLC
|
$
|
394,162
|
|
14.4
|
%
|
|
Plains Marketing, L.P., Atlas Pipeline Mid-Continent West OK LLC, Shell Trading (US) Company and Enterprise Crude Oil, LLC are purchasers of oil, natural gas and NGLs sold by the Company’s exploration and production segment.
F-56
SandRidge Energy, Inc. and Subsidiaries
Notes to Consolidated Financial Statements - (Continued)
23
. Condensed Consolidating Financial Information
The Company provides condensed consolidating financial information for its subsidiaries that are guarantors of its registered debt. As of
December 31, 2014
, the subsidiary guarantors, which are 100% owned by the Company, have jointly and severally guaranteed, on a full, unconditional and unsecured basis, the Company’s outstanding Senior Notes. The Senior Floating Rate Notes, prior to their purchase and redemption in 2012, were also jointly and severally guaranteed, on a full, unconditional and unsecured basis by the subsidiary guarantors. The subsidiary guarantees (i) rank equally in right of payment with all of the existing and future senior debt of the subsidiary guarantors; (ii) rank senior to all of the existing and future subordinated debt of the subsidiary guarantors; (iii) are effectively subordinated in right of payment to any existing or future secured obligations of the subsidiary guarantors to the extent of the value of the assets securing such obligations; (iv) are structurally subordinated to all debt and other obligations of the subsidiaries of the guarantors who are not themselves subsidiary guarantors; and (v) are only released under certain customary circumstances. The Company’s subsidiary guarantors guarantee payments of principal and interest under the Company’s registered notes.
The following condensed consolidating financial information represents the financial information of SandRidge Energy, Inc., its wholly owned subsidiary guarantors and its non-guarantor subsidiaries, prepared on the equity basis of accounting. The non-guarantor subsidiaries, including consolidated VIEs, majority owned subsidiaries and certain immaterial wholly owned subsidiaries, are included in the non-guarantors column in the tables below. The financial information may not necessarily be indicative of the financial position, results of operations or cash flows had the subsidiary guarantors operated as independent entities.
F-57
SandRidge Energy, Inc. and Subsidiaries
Notes to Consolidated Financial Statements - (Continued)
Condensed Consolidating Balance Sheets
|
|
December 31, 2014
|
||||||||||||||||||
|
|
Parent
|
Guarantors
|
Non-Guarantors
|
Eliminations
|
Consolidated
|
||||||||||||||
|
|
(In thousands)
|
||||||||||||||||||
|
ASSETS
|
|||||||||||||||||||
|
Current assets
|
|||||||||||||||||||
|
Cash and cash equivalents
|
$
|
170,468
|
|
$
|
1,398
|
|
$
|
9,387
|
|
$
|
—
|
|
$
|
181,253
|
|
||||
|
Accounts receivable, net
|
7
|
|
299,764
|
|
30,313
|
|
(7
|
)
|
330,077
|
|
|||||||||
|
Intercompany accounts receivable
|
751,376
|
|
1,339,152
|
|
41,679
|
|
(2,132,207
|
)
|
—
|
|
|||||||||
|
Derivative contracts
|
—
|
|
284,825
|
|
45,043
|
|
(38,454
|
)
|
291,414
|
|
|||||||||
|
Prepaid expenses
|
—
|
|
7,971
|
|
10
|
|
—
|
|
7,981
|
|
|||||||||
|
Other current assets
|
—
|
|
21,193
|
|
—
|
|
—
|
|
21,193
|
|
|||||||||
|
Total current assets
|
921,851
|
|
1,954,303
|
|
126,432
|
|
(2,170,668
|
)
|
831,918
|
|
|||||||||
|
Property, plant and equipment, net
|
—
|
|
4,987,281
|
|
1,227,776
|
|
—
|
|
6,215,057
|
|
|||||||||
|
Investment in subsidiaries
|
6,606,198
|
|
176,365
|
|
—
|
|
(6,782,563
|
)
|
—
|
|
|||||||||
|
Derivative contracts
|
—
|
|
47,003
|
|
—
|
|
—
|
|
47,003
|
|
|||||||||
|
Other assets
|
152,286
|
|
18,197
|
|
666
|
|
(5,902
|
)
|
165,247
|
|
|||||||||
|
Total assets
|
$
|
7,680,335
|
|
$
|
7,183,149
|
|
$
|
1,354,874
|
|
$
|
(8,959,133
|
)
|
$
|
7,259,225
|
|
||||
|
LIABILITIES AND EQUITY
|
|||||||||||||||||||
|
Current liabilities
|
|||||||||||||||||||
|
Accounts payable and accrued expenses
|
$
|
201,368
|
|
$
|
477,399
|
|
$
|
4,632
|
|
$
|
(7
|
)
|
$
|
683,392
|
|
||||
|
Intercompany accounts payable
|
1,315,667
|
|
780,645
|
|
35,895
|
|
(2,132,207
|
)
|
—
|
|
|||||||||
|
Derivative contracts
|
—
|
|
38,454
|
|
—
|
|
(38,454
|
)
|
—
|
|
|||||||||
|
Deferred tax liability
|
95,843
|
|
—
|
|
—
|
|
—
|
|
95,843
|
|
|||||||||
|
Other current liabilities
|
—
|
|
5,216
|
|
—
|
|
—
|
|
5,216
|
|
|||||||||
|
Total current liabilities
|
1,612,878
|
|
1,301,714
|
|
40,527
|
|
(2,170,668
|
)
|
784,451
|
|
|||||||||
|
Investment in subsidiaries
|
928,217
|
|
134,013
|
|
—
|
|
(1,062,230
|
)
|
—
|
|
|||||||||
|
Long-term debt
|
3,201,338
|
|
—
|
|
—
|
|
(5,902
|
)
|
3,195,436
|
|
|||||||||
|
Asset retirement obligations
|
—
|
|
54,402
|
|
—
|
|
—
|
|
54,402
|
|
|||||||||
|
Other long-term obligations
|
77
|
|
15,039
|
|
—
|
|
—
|
|
15,116
|
|
|||||||||
|
Total liabilities
|
5,742,510
|
|
1,505,168
|
|
40,527
|
|
(3,238,800
|
)
|
4,049,405
|
|
|||||||||
|
Equity
|
|||||||||||||||||||
|
SandRidge Energy, Inc. stockholders’ equity
|
1,937,825
|
|
5,677,981
|
|
1,314,347
|
|
(6,992,328
|
)
|
1,937,825
|
|
|||||||||
|
Noncontrolling interest
|
—
|
|
—
|
|
—
|
|
1,271,995
|
|
1,271,995
|
|
|||||||||
|
Total equity
|
1,937,825
|
|
5,677,981
|
|
1,314,347
|
|
(5,720,333
|
)
|
3,209,820
|
|
|||||||||
|
Total liabilities and equity
|
$
|
7,680,335
|
|
$
|
7,183,149
|
|
$
|
1,354,874
|
|
$
|
(8,959,133
|
)
|
$
|
7,259,225
|
|
||||
F-58
SandRidge Energy, Inc. and Subsidiaries
Notes to Consolidated Financial Statements - (Continued)
|
|
December 31, 2013
|
||||||||||||||||||
|
|
Parent
|
Guarantors
|
Non-Guarantors
|
Eliminations
|
Consolidated
|
||||||||||||||
|
|
(In thousands)
|
||||||||||||||||||
|
ASSETS
|
|||||||||||||||||||
|
Current assets
|
|||||||||||||||||||
|
Cash and cash equivalents
|
$
|
805,505
|
|
$
|
1,013
|
|
$
|
8,145
|
|
$
|
—
|
|
$
|
814,663
|
|
||||
|
Accounts receivable, net
|
—
|
|
326,345
|
|
22,873
|
|
—
|
|
349,218
|
|
|||||||||
|
Intercompany accounts receivable
|
153,325
|
|
982,524
|
|
70,107
|
|
(1,205,956
|
)
|
—
|
|
|||||||||
|
Derivative contracts
|
—
|
|
7,796
|
|
14,748
|
|
(9,765
|
)
|
12,779
|
|
|||||||||
|
Prepaid expenses
|
—
|
|
39,165
|
|
88
|
|
—
|
|
39,253
|
|
|||||||||
|
Other current assets
|
1,376
|
|
24,410
|
|
124
|
|
—
|
|
25,910
|
|
|||||||||
|
Total current assets
|
960,206
|
|
1,381,253
|
|
116,085
|
|
(1,215,721
|
)
|
1,241,823
|
|
|||||||||
|
Property, plant and equipment, net
|
—
|
|
5,125,543
|
|
1,182,132
|
|
—
|
|
6,307,675
|
|
|||||||||
|
Investment in subsidiaries
|
6,009,603
|
|
49,418
|
|
—
|
|
(6,059,021
|
)
|
—
|
|
|||||||||
|
Derivative contracts
|
—
|
|
12,650
|
|
9,585
|
|
(8,109
|
)
|
14,126
|
|
|||||||||
|
Other assets
|
61,923
|
|
65,123
|
|
27
|
|
(5,902
|
)
|
121,171
|
|
|||||||||
|
Total assets
|
$
|
7,031,732
|
|
$
|
6,633,987
|
|
$
|
1,307,829
|
|
$
|
(7,288,753
|
)
|
$
|
7,684,795
|
|
||||
|
LIABILITIES AND EQUITY
|
|||||||||||||||||||
|
Current liabilities
|
|||||||||||||||||||
|
Accounts payable and accrued expenses
|
$
|
207,572
|
|
$
|
601,074
|
|
$
|
3,842
|
|
$
|
—
|
|
$
|
812,488
|
|
||||
|
Intercompany accounts payable
|
967,365
|
|
181,573
|
|
57,018
|
|
(1,205,956
|
)
|
—
|
|
|||||||||
|
Derivative contracts
|
—
|
|
44,032
|
|
—
|
|
(9,765
|
)
|
34,267
|
|
|||||||||
|
Asset retirement obligations
|
—
|
|
87,063
|
|
—
|
|
—
|
|
87,063
|
|
|||||||||
|
Total current liabilities
|
1,174,937
|
|
913,742
|
|
60,860
|
|
(1,215,721
|
)
|
933,818
|
|
|||||||||
|
Investment in subsidiaries
|
828,794
|
|
152,266
|
|
—
|
|
(981,060
|
)
|
—
|
|
|||||||||
|
Long-term debt
|
3,200,809
|
|
—
|
|
—
|
|
(5,902
|
)
|
3,194,907
|
|
|||||||||
|
Derivative contracts
|
—
|
|
28,673
|
|
—
|
|
(8,109
|
)
|
20,564
|
|
|||||||||
|
Asset retirement obligations
|
—
|
|
337,054
|
|
—
|
|
—
|
|
337,054
|
|
|||||||||
|
Other long-term obligations
|
1,382
|
|
21,443
|
|
—
|
|
—
|
|
22,825
|
|
|||||||||
|
Total liabilities
|
5,205,922
|
|
1,453,178
|
|
60,860
|
|
(2,210,792
|
)
|
4,509,168
|
|
|||||||||
|
Equity
|
|||||||||||||||||||
|
SandRidge Energy, Inc. stockholders’ equity
|
1,825,810
|
|
5,180,809
|
|
1,246,969
|
|
(6,427,778
|
)
|
1,825,810
|
|
|||||||||
|
Noncontrolling interest
|
—
|
|
—
|
|
—
|
|
1,349,817
|
|
1,349,817
|
|
|||||||||
|
Total equity
|
1,825,810
|
|
5,180,809
|
|
1,246,969
|
|
(5,077,961
|
)
|
3,175,627
|
|
|||||||||
|
Total liabilities and equity
|
$
|
7,031,732
|
|
$
|
6,633,987
|
|
$
|
1,307,829
|
|
$
|
(7,288,753
|
)
|
$
|
7,684,795
|
|
||||
F-59
SandRidge Energy, Inc. and Subsidiaries
Notes to Consolidated Financial Statements - (Continued)
Condensed Consolidating Statements of Operations
|
Parent
|
Guarantors
|
Non-Guarantors
|
Eliminations
|
Consolidated
|
|||||||||||||||
|
|
(In thousands)
|
||||||||||||||||||
|
Year Ended December 31, 2014
|
|||||||||||||||||||
|
Total revenues
|
$
|
—
|
|
$
|
1,341,531
|
|
$
|
217,367
|
|
$
|
(140
|
)
|
$
|
1,558,758
|
|
||||
|
Expenses
|
|||||||||||||||||||
|
Direct operating expenses
|
—
|
|
467,175
|
|
16,854
|
|
(140
|
)
|
483,889
|
|
|||||||||
|
General and administrative
|
331
|
|
118,249
|
|
4,285
|
|
—
|
|
122,865
|
|
|||||||||
|
Depreciation, depletion, amortization and accretion
|
—
|
|
446,149
|
|
56,874
|
|
—
|
|
503,023
|
|
|||||||||
|
Impairment
|
—
|
|
150,125
|
|
42,643
|
|
—
|
|
192,768
|
|
|||||||||
|
Gain on derivative contracts
|
—
|
|
(292,733
|
)
|
(41,278
|
)
|
—
|
|
(334,011
|
)
|
|||||||||
|
Total expenses
|
331
|
|
888,965
|
|
79,378
|
|
(140
|
)
|
968,534
|
|
|||||||||
|
(Loss) income from operations
|
(331
|
)
|
452,566
|
|
137,989
|
|
—
|
|
590,224
|
|
|||||||||
|
Equity earnings from subsidiaries
|
495,154
|
|
38,967
|
|
—
|
|
(534,121
|
)
|
—
|
|
|||||||||
|
Interest (expense) income, net
|
(244,209
|
)
|
100
|
|
—
|
|
—
|
|
(244,109
|
)
|
|||||||||
|
Other income (expense), net
|
—
|
|
3,521
|
|
(31
|
)
|
—
|
|
3,490
|
|
|||||||||
|
Income before income taxes
|
250,614
|
|
495,154
|
|
137,958
|
|
(534,121
|
)
|
349,605
|
|
|||||||||
|
Income tax (benefit) expense
|
(2,671
|
)
|
—
|
|
378
|
|
—
|
|
(2,293
|
)
|
|||||||||
|
Net income
|
253,285
|
|
495,154
|
|
137,580
|
|
(534,121
|
)
|
351,898
|
|
|||||||||
|
Less: net income attributable to noncontrolling interest
|
—
|
|
—
|
|
—
|
|
98,613
|
|
98,613
|
|
|||||||||
|
Net income attributable to SandRidge Energy, Inc.
|
$
|
253,285
|
|
$
|
495,154
|
|
$
|
137,580
|
|
$
|
(632,734
|
)
|
$
|
253,285
|
|
||||
F-60
SandRidge Energy, Inc. and Subsidiaries
Notes to Consolidated Financial Statements - (Continued)
|
Parent
|
Guarantors
|
Non-Guarantors
|
Eliminations
|
Consolidated
|
|||||||||||||||
|
(In thousands)
|
|||||||||||||||||||
|
Year Ended December 31, 2013
|
|||||||||||||||||||
|
Total revenues
|
$
|
—
|
|
$
|
1,675,481
|
|
$
|
308,300
|
|
$
|
(393
|
)
|
$
|
1,983,388
|
|
||||
|
Expenses
|
|||||||||||||||||||
|
Direct operating expenses
|
—
|
|
654,080
|
|
29,143
|
|
(393
|
)
|
682,830
|
|
|||||||||
|
General and administrative
|
329
|
|
323,808
|
|
6,288
|
|
—
|
|
330,425
|
|
|||||||||
|
Depreciation, depletion, amortization and accretion
|
—
|
|
581,435
|
|
85,210
|
|
—
|
|
666,645
|
|
|||||||||
|
Impairment
|
—
|
|
15,038
|
|
11,242
|
|
—
|
|
26,280
|
|
|||||||||
|
Loss on derivative contracts
|
—
|
|
24,702
|
|
22,421
|
|
—
|
|
47,123
|
|
|||||||||
|
Loss on sale of assets
|
—
|
|
291,743
|
|
107,343
|
|
—
|
|
399,086
|
|
|||||||||
|
Total expenses
|
329
|
|
1,890,806
|
|
261,647
|
|
(393
|
)
|
2,152,389
|
|
|||||||||
|
(Loss) income from operations
|
(329
|
)
|
(215,325
|
)
|
46,653
|
|
—
|
|
(169,001
|
)
|
|||||||||
|
Equity earnings from subsidiaries
|
(195,118
|
)
|
3,075
|
|
—
|
|
192,043
|
|
—
|
|
|||||||||
|
Interest (expense) income, net
|
(271,193
|
)
|
959
|
|
—
|
|
—
|
|
(270,234
|
)
|
|||||||||
|
Loss on extinguishment of debt
|
(82,005
|
)
|
—
|
|
—
|
|
—
|
|
(82,005
|
)
|
|||||||||
|
Other income (expense), net
|
—
|
|
16,173
|
|
(3,728
|
)
|
—
|
|
12,445
|
|
|||||||||
|
(Loss) income before income taxes
|
(548,645
|
)
|
(195,118
|
)
|
42,925
|
|
192,043
|
|
(508,795
|
)
|
|||||||||
|
Income tax expense
|
5,244
|
|
—
|
|
440
|
|
—
|
|
5,684
|
|
|||||||||
|
Net (loss) income
|
(553,889
|
)
|
(195,118
|
)
|
42,485
|
|
192,043
|
|
(514,479
|
)
|
|||||||||
|
Less: net income attributable to noncontrolling interest
|
—
|
|
—
|
|
—
|
|
39,410
|
|
39,410
|
|
|||||||||
|
Net (loss) income attributable to SandRidge Energy, Inc.
|
$
|
(553,889
|
)
|
$
|
(195,118
|
)
|
$
|
42,485
|
|
$
|
152,633
|
|
$
|
(553,889
|
)
|
||||
F-61
SandRidge Energy, Inc. and Subsidiaries
Notes to Consolidated Financial Statements - (Continued)
|
Parent
|
Guarantors
|
Non-Guarantors
|
Eliminations
|
Consolidated
|
|||||||||||||||
|
(In thousands)
|
|||||||||||||||||||
|
Year Ended December 31, 2012
|
|||||||||||||||||||
|
Total revenues
|
$
|
—
|
|
$
|
1,638,741
|
|
$
|
404,418
|
|
$
|
(108,517
|
)
|
$
|
1,934,642
|
|
||||
|
Expenses
|
|||||||||||||||||||
|
Direct operating expenses
|
—
|
|
596,028
|
|
146,416
|
|
(107,095
|
)
|
635,349
|
|
|||||||||
|
General and administrative
|
367
|
|
235,102
|
|
7,635
|
|
(1,422
|
)
|
241,682
|
|
|||||||||
|
Depreciation, depletion, amortization and accretion
|
—
|
|
570,786
|
|
87,044
|
|
—
|
|
657,830
|
|
|||||||||
|
Impairment
|
—
|
|
236,671
|
|
79,333
|
|
—
|
|
316,004
|
|
|||||||||
|
Gain on derivative contracts
|
—
|
|
(198,732
|
)
|
(42,687
|
)
|
—
|
|
(241,419
|
)
|
|||||||||
|
Total expenses
|
367
|
|
1,439,855
|
|
277,741
|
|
(108,517
|
)
|
1,609,446
|
|
|||||||||
|
(Loss) income from operations
|
(367
|
)
|
198,886
|
|
126,677
|
|
—
|
|
325,196
|
|
|||||||||
|
Equity earnings from subsidiaries
|
347,715
|
|
20,667
|
|
—
|
|
(368,382
|
)
|
—
|
|
|||||||||
|
Interest (expense) income, net
|
(303,510
|
)
|
725
|
|
(564
|
)
|
—
|
|
(303,349
|
)
|
|||||||||
|
Bargain purchase gain
|
—
|
|
122,696
|
|
—
|
|
—
|
|
122,696
|
|
|||||||||
|
Loss on extinguishment of debt
|
(3,075
|
)
|
—
|
|
—
|
|
—
|
|
(3,075
|
)
|
|||||||||
|
Other income, net
|
—
|
|
4,741
|
|
—
|
|
—
|
|
4,741
|
|
|||||||||
|
Income before income taxes
|
40,763
|
|
347,715
|
|
126,113
|
|
(368,382
|
)
|
146,209
|
|
|||||||||
|
Income tax (benefit) expense
|
(100,808
|
)
|
—
|
|
446
|
|
—
|
|
(100,362
|
)
|
|||||||||
|
Net income
|
141,571
|
|
347,715
|
|
125,667
|
|
(368,382
|
)
|
246,571
|
|
|||||||||
|
Less: net income attributable to noncontrolling interest
|
—
|
|
—
|
|
—
|
|
105,000
|
|
105,000
|
|
|||||||||
|
Net income attributable to SandRidge Energy, Inc.
|
$
|
141,571
|
|
$
|
347,715
|
|
$
|
125,667
|
|
$
|
(473,382
|
)
|
$
|
141,571
|
|
||||
F-62
SandRidge Energy, Inc. and Subsidiaries
Notes to Consolidated Financial Statements - (Continued)
Condensed Consolidating Statements of Cash Flows
|
Parent
|
Guarantors
|
Non-Guarantors
|
Eliminations
|
Consolidated
|
|||||||||||||||
|
|
(In thousands)
|
||||||||||||||||||
|
Year Ended December 31, 2014
|
|||||||||||||||||||
|
Net cash provided by operating activities
|
$
|
141,751
|
|
$
|
258,498
|
|
$
|
212,427
|
|
$
|
8,438
|
|
$
|
621,114
|
|
||||
|
Cash flows from investing activities
|
|||||||||||||||||||
|
Capital expenditures for property, plant and equipment
|
—
|
|
(1,553,332
|
)
|
—
|
|
—
|
|
(1,553,332
|
)
|
|||||||||
|
Proceeds from sale of assets
|
—
|
|
711,728
|
|
2,747
|
|
—
|
|
714,475
|
|
|||||||||
|
Other
|
—
|
|
(165,551
|
)
|
1,140
|
|
146,027
|
|
(18,384
|
)
|
|||||||||
|
Net cash (used in) provided by investing activities
|
—
|
|
(1,007,155
|
)
|
3,887
|
|
146,027
|
|
(857,241
|
)
|
|||||||||
|
Cash flows from financing activities
|
|
|
|||||||||||||||||
|
Distributions to unitholders
|
—
|
|
—
|
|
(234,327
|
)
|
40,520
|
|
(193,807
|
)
|
|||||||||
|
Repurchase of common stock
|
(111,827
|
)
|
—
|
|
—
|
|
—
|
|
(111,827
|
)
|
|||||||||
|
Intercompany (advances) borrowings, net
|
(598,051
|
)
|
598,056
|
|
(5
|
)
|
—
|
|
—
|
|
|||||||||
|
Other
|
(66,910
|
)
|
150,986
|
|
19,260
|
|
(194,985
|
)
|
(91,649
|
)
|
|||||||||
|
Net cash (used in) provided by financing activities
|
(776,788
|
)
|
749,042
|
|
(215,072
|
)
|
(154,465
|
)
|
(397,283
|
)
|
|||||||||
|
Net (decrease) increase in cash and cash equivalents
|
(635,037
|
)
|
385
|
|
1,242
|
|
—
|
|
(633,410
|
)
|
|||||||||
|
Cash and cash equivalents at beginning of year
|
805,505
|
|
1,013
|
|
8,145
|
|
—
|
|
814,663
|
|
|||||||||
|
Cash and cash equivalents at end of year
|
$
|
170,468
|
|
$
|
1,398
|
|
$
|
9,387
|
|
$
|
—
|
|
$
|
181,253
|
|
||||
F-63
SandRidge Energy, Inc. and Subsidiaries
Notes to Consolidated Financial Statements - (Continued)
|
Parent
|
Guarantors
|
Non-Guarantors
|
Eliminations
|
Consolidated
|
|||||||||||||||
|
(In thousands)
|
|||||||||||||||||||
|
Year Ended December 31, 2013
|
|||||||||||||||||||
|
Net cash (used in) provided by operating activities
|
$
|
(239,026
|
)
|
$
|
852,026
|
|
$
|
254,723
|
|
$
|
907
|
|
$
|
868,630
|
|
||||
|
Cash flows from investing activities
|
|||||||||||||||||||
|
Capital expenditures for property, plant and equipment
|
—
|
|
(1,496,731
|
)
|
—
|
|
—
|
|
(1,496,731
|
)
|
|||||||||
|
Proceeds from sale of assets
|
—
|
|
2,566,742
|
|
17,373
|
|
—
|
|
2,584,115
|
|
|||||||||
|
Other
|
—
|
|
89,606
|
|
3,197
|
|
(109,831
|
)
|
(17,028
|
)
|
|||||||||
|
Net cash provided by investing activities
|
—
|
|
1,159,617
|
|
20,570
|
|
(109,831
|
)
|
1,070,356
|
|
|||||||||
|
Cash flows from financing activities
|
|||||||||||||||||||
|
Repayments of borrowings
|
(1,115,500
|
)
|
—
|
|
—
|
|
—
|
|
(1,115,500
|
)
|
|||||||||
|
Premium on debt redemption
|
(61,997
|
)
|
—
|
|
—
|
|
—
|
|
(61,997
|
)
|
|||||||||
|
Distributions to unitholders
|
—
|
|
—
|
|
(299,675
|
)
|
93,205
|
|
(206,470
|
)
|
|||||||||
|
Dividends paid—preferred
|
(55,525
|
)
|
—
|
|
—
|
|
—
|
|
(55,525
|
)
|
|||||||||
|
Intercompany borrowings (advances), net
|
2,009,146
|
|
(2,018,212
|
)
|
9,066
|
|
—
|
|
—
|
|
|||||||||
|
Other
|
(31,821
|
)
|
6,660
|
|
14,845
|
|
15,719
|
|
5,403
|
|
|||||||||
|
Net cash provided by (used in) financing activities
|
744,303
|
|
(2,011,552
|
)
|
(275,764
|
)
|
108,924
|
|
(1,434,089
|
)
|
|||||||||
|
Net increase (decrease) in cash and cash equivalents
|
505,277
|
|
91
|
|
(471
|
)
|
—
|
|
504,897
|
|
|||||||||
|
Cash and cash equivalents at beginning of year
|
300,228
|
|
922
|
|
8,616
|
|
—
|
|
309,766
|
|
|||||||||
|
Cash and cash equivalents at end of year
|
$
|
805,505
|
|
$
|
1,013
|
|
$
|
8,145
|
|
$
|
—
|
|
$
|
814,663
|
|
||||
F-64
SandRidge Energy, Inc. and Subsidiaries
Notes to Consolidated Financial Statements - (Continued)
|
Parent
|
Guarantors
|
Non-Guarantors
|
Eliminations
|
Consolidated
|
|||||||||||||||
|
(In thousands)
|
|||||||||||||||||||
|
Year Ended December 31, 2012
|
|||||||||||||||||||
|
Net cash provided by operating activities
|
$
|
285,567
|
|
$
|
264,717
|
|
$
|
162,281
|
|
$
|
70,595
|
|
$
|
783,160
|
|
||||
|
Cash flows from investing activities
|
|||||||||||||||||||
|
Capital expenditures for property, plant and equipment
|
—
|
|
(2,112,547
|
)
|
(33,825
|
)
|
—
|
|
(2,146,372
|
)
|
|||||||||
|
Acquisitions, net of cash received
|
(693,091
|
)
|
(147,649
|
)
|
(587,086
|
)
|
587,086
|
|
(840,740
|
)
|
|||||||||
|
Proceeds from sale of assets
|
129,830
|
|
942,675
|
|
1,333
|
|
(642,671
|
)
|
431,167
|
|
|||||||||
|
Other
|
(61,343
|
)
|
278,708
|
|
—
|
|
(217,365
|
)
|
—
|
|
|||||||||
|
Net cash used in investing activities
|
(624,604
|
)
|
(1,038,813
|
)
|
(619,578
|
)
|
(272,950
|
)
|
(2,555,945
|
)
|
|||||||||
|
Cash flows from financing activities
|
|||||||||||||||||||
|
Proceeds from borrowings
|
1,850,344
|
|
—
|
|
—
|
|
—
|
|
1,850,344
|
|
|||||||||
|
Repayments of borrowings
|
(350,000
|
)
|
—
|
|
(16,029
|
)
|
—
|
|
(366,029
|
)
|
|||||||||
|
Proceeds from issuance royalty trust units
|
—
|
|
—
|
|
587,086
|
|
—
|
|
587,086
|
|
|||||||||
|
Proceeds from sale of royalty trust units
|
—
|
|
—
|
|
—
|
|
139,360
|
|
139,360
|
|
|||||||||
|
Distributions to unitholders
|
—
|
|
—
|
|
(274,980
|
)
|
93,253
|
|
(181,727
|
)
|
|||||||||
|
Dividends paid—preferred
|
(55,525
|
)
|
—
|
|
—
|
|
—
|
|
(55,525
|
)
|
|||||||||
|
Intercompany (advances) borrowings, net
|
(945,448
|
)
|
809,099
|
|
136,349
|
|
—
|
|
—
|
|
|||||||||
|
Other
|
(64,121
|
)
|
(34,518
|
)
|
30,258
|
|
(30,258
|
)
|
(98,639
|
)
|
|||||||||
|
Net cash provided by financing activities
|
435,250
|
|
774,581
|
|
462,684
|
|
202,355
|
|
1,874,870
|
|
|||||||||
|
Net increase in cash and cash equivalents
|
96,213
|
|
485
|
|
5,387
|
|
—
|
|
102,085
|
|
|||||||||
|
Cash and cash equivalents at beginning of year
|
204,015
|
|
437
|
|
3,229
|
|
—
|
|
207,681
|
|
|||||||||
|
Cash and cash equivalents at end of year
|
$
|
300,228
|
|
$
|
922
|
|
$
|
8,616
|
|
$
|
—
|
|
$
|
309,766
|
|
||||
F-65
SandRidge Energy, Inc. and Subsidiaries
Notes to Consolidated Financial Statements - (Continued)
24
. Supplemental Information on Oil and Natural Gas Producing Activities
The supplemental information includes capitalized costs related to oil and natural gas producing activities; costs incurred in oil and natural gas property acquisition, exploration and development; and the results of operations for oil and natural gas producing activities. Supplemental information is also provided for oil, natural gas and NGL production and average sales prices; the estimated quantities of proved oil, natural gas and NGL reserves; the standardized measure of discounted future net cash flows associated with proved oil, natural gas and NGL reserves; and a summary of the changes in the standardized measure of discounted future net cash flows associated with proved oil, natural gas and NGL reserves.
Capitalized Costs Related to Oil and Natural Gas Producing Activities
The Company’s capitalized costs for oil and natural gas activities consisted of the following (in thousands):
|
|
December 31,
|
||||||||||
|
|
2014
|
2013
|
2012
|
||||||||
|
Oil and natural gas properties
|
|||||||||||
|
Proved
|
$
|
11,707,147
|
|
$
|
10,972,816
|
|
$
|
12,262,921
|
|
||
|
Unproved
|
290,596
|
|
531,606
|
|
865,863
|
|
|||||
|
Total oil and natural gas properties
|
11,997,743
|
|
11,504,422
|
|
13,128,784
|
|
|||||
|
Less accumulated depreciation, depletion and impairment
|
(6,359,149
|
)
|
(5,762,969
|
)
|
(5,231,182
|
)
|
|||||
|
Net oil and natural gas properties capitalized costs
|
$
|
5,638,594
|
|
$
|
5,741,453
|
|
$
|
7,897,602
|
|
||
Costs Incurred in Oil and Natural Gas Property Acquisition, Exploration and Development
Costs incurred in oil and natural gas property acquisition, exploration and development activities which have been capitalized are summarized as follows (in thousands):
|
|
Year Ended December 31,
|
||||||||||
|
|
2014
|
2013
|
2012
|
||||||||
|
Acquisitions of properties
|
|||||||||||
|
Proved
|
$
|
73,370
|
|
$
|
21,130
|
|
$
|
1,761,556
|
|
||
|
Unproved
|
123,649
|
|
100,242
|
|
377,185
|
|
|||||
|
Exploration(1)
|
41,070
|
|
82,775
|
|
120,438
|
|
|||||
|
Development(2)
|
1,288,395
|
|
1,131,269
|
|
1,704,991
|
|
|||||
|
Total cost incurred
|
$
|
1,526,484
|
|
$
|
1,335,416
|
|
$
|
3,964,170
|
|
||
|
(1)
|
Includes seismic costs of
$10.8 million
,
$6.7 million
and
$15.3 million
for
2014
,
2013
and
2012
, respectively.
|
|
(2)
|
Includes the Company’s share of Century Plant construction costs of
$50.0 million
for
2012
. See Note
7
.
|
F-66
SandRidge Energy, Inc. and Subsidiaries
Notes to Consolidated Financial Statements - (Continued)
Results of Operations for Oil and Natural Gas Producing Activities (Unaudited)
The Company’s results of operations from oil and natural gas producing activities for each of the years
2014
,
2013
and
2012
are shown in the following table (in thousands):
|
Year Ended December 31,
|
|||||||||||
|
2014
|
2013
|
2012
|
|||||||||
|
Revenues
|
$
|
1,420,879
|
|
$
|
1,820,278
|
|
$
|
1,759,282
|
|
||
|
Expenses
|
|||||||||||
|
Production costs
|
377,819
|
|
548,719
|
|
524,364
|
|
|||||
|
Depreciation and depletion
|
434,295
|
|
567,732
|
|
568,029
|
|
|||||
|
Accretion of asset retirement obligations
|
9,092
|
|
36,777
|
|
28,996
|
|
|||||
|
Total expenses
|
821,206
|
|
1,153,228
|
|
1,121,389
|
|
|||||
|
Income before income taxes
|
599,673
|
|
667,050
|
|
637,893
|
|
|||||
|
Benefit of income taxes(1)
|
(3,933
|
)
|
(7,471
|
)
|
(437,595
|
)
|
|||||
|
Results of operations for oil and natural gas producing activities (excluding corporate overhead and interest costs)
|
$
|
603,606
|
|
$
|
674,521
|
|
$
|
1,075,488
|
|
||
|
(1)
|
Reflects the Company’s effective tax rate, including the partial valuation allowance releases.
|
Oil, Natural Gas and NGL Reserve Quantities (Unaudited)
Proved oil, natural gas and NGL reserves are those quantities, which, by analysis of geoscience and engineering data, can be estimated with reasonable certainty to be economically producible, based on prices used to estimate reserves, from a given date forward from known reservoirs, and under existing economic conditions, operating methods, and government regulation prior to the time at which contracts providing the right to operate expire, unless evidence indicates that renewal is reasonably certain.
The term “reasonable certainty” implies a high degree of confidence that the quantities of oil, natural gas and NGLs actually recovered will equal or exceed the estimate. To achieve reasonable certainty, the Company’s engineers and independent petroleum consultants relied on technologies that have been demonstrated to yield results with consistency and repeatability. The technologies and economic data used to estimate the Company’s proved reserves include, but are not limited to, well logs, geologic maps, seismic data, well test data, production data, historical price and cost information and property ownership interests. The accuracy of the reserve estimates is dependent on many factors, including the following:
|
•
|
the quality and quantity of available data and the engineering and geological interpretation of that data;
|
|
•
|
estimates regarding the amount and timing of future costs, which could vary considerably from actual costs;
|
|
•
|
the accuracy of mandated economic assumptions such as the future prices of oil, natural gas and NGLs; and
|
|
•
|
the judgment of the personnel preparing the estimates.
|
Proved developed reserves are proved reserves expected to be recovered through existing wells with existing equipment and operating methods or in which the cost of the required equipment is relatively minor compared with the cost of a new well. Proved undeveloped reserves are reserves that are expected to be recovered from new wells on undrilled acreage, or from existing wells where a relatively large major expenditure is required for recompletion.
The table below represents the Company’s estimate of proved oil, natural gas and NGL reserves attributable to the Company’s net interest in oil and natural gas properties, all of which are located in the continental United States, based upon the evaluation by the Company and its independent petroleum engineers of pertinent geoscience and engineering data in accordance with the SEC’s regulations. Estimates of the substantial majority of the Company’s proved reserves have been prepared by independent reservoir engineers and geoscience professionals and are reviewed by members of the Company’s senior management with professional training in petroleum engineering to ensure that the Company consistently applies rigorous professional standards and the reserve definitions prescribed by the SEC.
Cawley, Gillespie & Associates, Inc., (“CG&A”), Netherland, Sewell & Associates, Inc. (“Netherland Sewell”) and Lee Keeling and Associates, Inc. (“Lee Keeling”), independent oil and natural gas consultants, prepared the estimates of proved reserves
F-67
SandRidge Energy, Inc. and Subsidiaries
Notes to Consolidated Financial Statements - (Continued)
of oil, natural gas and NGLs attributable to the majority of the Company’s net interest in oil and natural gas properties as of the end of one or more of
2014
,
2013
and
2012
. CG&A, Netherland Sewell, and Lee Keeling are independent petroleum engineers, geologists, geophysicists and petrophysicists and do not own an interest in the Company or its properties and are not employed on a contingent basis. CG&A and Netherland Sewell prepared the estimates of proved reserves for a majority of the Company’s properties as of
December 31, 2014
. The remaining
13.9%
of estimates of proved reserves was based on Company estimates.
The Company believes the geoscience and engineering data examined provides reasonable assurance that the proved reserves are economically producible in future years from known reservoirs, and under existing economic conditions, operating methods and governmental regulations. Estimates of proved reserves are subject to change, either positively or negatively, as additional information is available and contractual and economic conditions change.
2012 Activity.
During 2012, excluding asset sales, the Company recognized an overall net increase in its proved oil and NGL reserves of approximately
67.9
MMBbls and
40.9
MMBbls, respectively, primarily due to additional reserves from extensions and discoveries associated with successful drilling in the Mississippian formation in the Mid-Continent area and the Central Basin Platform in the Permian Basin. These increases to proved oil reserves were slightly offset by downward revisions of
22.3
MMBbls due to well performance in the Mid-Continent and Permian Basin during 2012. Additionally, the Company recognized an overall net increase of
60.5
Bcf in its proved natural gas reserve quantities primarily due to
489.3
Bcf attributable to extensions and discoveries associated with successful drilling in the Mississippian formation in the Mid-Continent and the Central Basin Platform in the Permian Basin. These increases were partially offset by downward revisions of
538.2
Bcf, primarily due to lower natural gas prices, and, to a lesser extent, due to well performance in the Mid-Continent and Permian Basin during 2012 and production of
93.5
Bcf. Continued low natural gas prices could result in additional negative revisions to the Company’s natural gas reserves.
Sales of proved reserves during 2012 totaled
23.6
MMBoe from the divestiture of the Company’s tertiary recovery properties.
2013 Activity.
The Company sold its Permian Properties in February 2013. Proved reserves were
198.9
MMBoe,
55%
of which were proved developed reserves, for the Permian Properties at December 31, 2012. Estimated standardized measure of discounted cash flows for the Permian Properties, determined by allocating the Company's standardized measure of discounted cash flows to the Permian Properties based on the present value of discounted cash flows attributable to the Permian Properties relative to the Company's total present value of discounted cash flows was
$2.5 billion
. See Note
3
for additional information regarding the sale. The Company recognized an increase of
119.2
MMBoe in total reserves primarily attributable to extensions and discoveries associated with successful drilling in the Mississippian formation in the Mid-Continent.
2014 Activity.
During 2014, the Company recognized additional oil, NGL and natural gas reserves from extensions and discoveries of
37.6
MMBbls,
27.5
MMBbls, and
467.2
Bcf, respectively, primarily due to successful drilling in the Mississippian formation in the Mid-Continent area. Revisions of previous estimates decreased oil reserves by
18.7
MMBbls, primarily comprised of (i) approximately
9
MMBbls from Permian Basin proved undeveloped reserves, largely due to removal of drilling locations not expected to be drilled within a five year period, (ii) approximately
8
MMBbls from well performance in the Mid-Continent and (iii) approximately
2
MMBbls from acreage losses or revisions to well interest ownerships. These negative revisions were offset by positive revisions to NGL and gas reserves of
11.1
MMBbls and
167.6
Bcf, respectively, primarily from well performance in the Mid-Continent area. Acquisitions of reserves added
3.5
MMBoe.
Sales of proved reserves during 2014 totaled
55.5
MMBoe from the sale of the Gulf Properties.
F-68
SandRidge Energy, Inc. and Subsidiaries
Notes to Consolidated Financial Statements - (Continued)
The summary below presents changes in the Company’s estimated reserves for
2012
,
2013
and
2014
.
|
Oil
|
NGL
|
Natural Gas
|
||||||
|
|
(MBbls)
|
(MBbls)
|
(MMcf)(1)
|
|||||
|
Proved developed and undeveloped reserves
|
||||||||
|
As of December 31, 2011
|
214,450
|
|
30,335
|
|
1,355,056
|
|
||
|
Revisions of previous estimates
|
(37,394
|
)
|
15,098
|
|
(538,214
|
)
|
||
|
Acquisitions of new reserves
|
31,470
|
|
683
|
|
202,995
|
|
||
|
Extensions and discoveries
|
89,656
|
|
27,259
|
|
489,302
|
|
||
|
Sales of reserves in place
|
(20,269
|
)
|
(3,287
|
)
|
(548
|
)
|
||
|
Production
|
(15,868
|
)
|
(2,094
|
)
|
(93,549
|
)
|
||
|
As of December 31, 2012(2)
|
262,045
|
|
67,994
|
|
1,415,042
|
|
||
|
Revisions of previous estimates
|
(13,969
|
)
|
3,717
|
|
(53,432
|
)
|
||
|
Acquisitions of new reserves
|
43
|
|
13
|
|
363
|
|
||
|
Extensions and discoveries
|
40,570
|
|
18,686
|
|
359,918
|
|
||
|
Sales of reserves in place
|
(131,769
|
)
|
(29,067
|
)
|
(228,229
|
)
|
||
|
Production
|
(14,279
|
)
|
(2,291
|
)
|
(103,233
|
)
|
||
|
As of December 31, 2013(2)
|
142,641
|
|
59,052
|
|
1,390,429
|
|
||
|
Revisions of previous estimates
|
(18,687
|
)
|
11,103
|
|
167,589
|
|
||
|
Acquisitions of new reserves
|
1,009
|
|
441
|
|
12,527
|
|
||
|
Extensions and discoveries
|
37,603
|
|
27,500
|
|
467,185
|
|
||
|
Sales of reserves in place
|
(25,659
|
)
|
(2,516
|
)
|
(163,800
|
)
|
||
|
Production
|
(10,876
|
)
|
(3,794
|
)
|
(85,697
|
)
|
||
|
As of December 31, 2014(2)
|
126,031
|
|
91,786
|
|
1,788,233
|
|
||
|
Proved developed reserves
|
||||||||
|
As of December 31, 2011
|
101,578
|
|
17,150
|
|
670,382
|
|
||
|
As of December 31, 2012
|
136,605
|
|
33,785
|
|
896,701
|
|
||
|
As of December 31, 2013
|
83,893
|
|
35,807
|
|
951,609
|
|
||
|
As of December 31, 2014
|
79,022
|
|
56,823
|
|
1,203,447
|
|
||
|
Proved undeveloped reserves
|
||||||||
|
As of December 31, 2011
|
112,872
|
|
13,185
|
|
684,674
|
|
||
|
As of December 31, 2012
|
125,440
|
|
34,209
|
|
518,341
|
|
||
|
As of December 31, 2013
|
58,748
|
|
23,245
|
|
438,820
|
|
||
|
As of December 31, 2014
|
47,009
|
|
34,963
|
|
584,786
|
|
||
____________________
|
(1)
|
Natural gas reserves are computed at
14.65
pounds per square inch absolute and
60
degrees Fahrenheit.
|
|
(2)
|
Includes proved reserves attributable to noncontrolling interests at
December 31, 2014
,
2013
and
2012
as shown in the table below:
|
|
|
December 31,
|
|||||||
|
|
2014
|
2013
|
2012
|
|||||
|
Oil (MBbl)
|
11,027
|
|
13,569
|
|
17,340
|
|
||
|
NGL (MBbl)
|
4,761
|
|
4,737
|
|
5,132
|
|
||
|
Natural gas (MMcf)
|
70,833
|
|
69,693
|
|
94,543
|
|
||
F-69
SandRidge Energy, Inc. and Subsidiaries
Notes to Consolidated Financial Statements - (Continued)
Standardized Measure of Discounted Future Net Cash Flows (Unaudited)
The standardized measure of discounted cash flows and summary of the changes in the standardized measure computation from year to year are prepared in accordance with Accounting Standards Codification Topic 932, Extractive Activities—Oil and Gas (“ASC Topic 932”). The assumptions underlying the computation of the standardized measure of discounted cash flows may be summarized as follows:
|
•
|
the standardized measure includes the Company’s estimate of proved oil, natural gas and NGL reserves and projected future production volumes based upon economic conditions;
|
|
•
|
pricing is applied based upon 12-month average market prices at
December 31, 2014
,
2013
and
2012
adjusted for fixed or determinable contracts that are in existence at year-end. The calculated weighted average per unit prices for the Company’s proved reserves and future net revenues were as follows:
|
|
|
At December 31,
|
||||||||||
|
|
2014
|
2013
|
2012
|
||||||||
|
Oil (per barrel)
|
$
|
91.65
|
|
$
|
95.67
|
|
$
|
91.65
|
|
||
|
NGL (per barrel)
|
$
|
32.79
|
|
$
|
31.40
|
|
$
|
32.64
|
|
||
|
Natural gas (per Mcf)
|
$
|
3.61
|
|
$
|
3.65
|
|
$
|
2.29
|
|
||
|
•
|
future development and production costs are determined based upon actual cost at year-end;
|
|
•
|
the standardized measure includes projections of future abandonment costs based upon actual costs at year-end; and
|
|
•
|
a discount factor of 10% per year is applied annually to the future net cash flows.
|
The summary below presents the Company’s future net cash flows relating to proved oil, natural gas and NGL reserves based on the standardized measure in ASC Topic 932 (in thousands).
|
At December 31,
|
|||||||||||
|
2014
|
2013
|
2012
|
|||||||||
|
Future cash inflows from production
|
$
|
21,022,320
|
|
$
|
19,937,484
|
|
$
|
29,482,544
|
|
||
|
Future production costs
|
(6,499,366
|
)
|
(6,843,713
|
)
|
(8,899,465
|
)
|
|||||
|
Future development costs(1)
|
(1,810,201
|
)
|
(2,546,680
|
)
|
(4,021,051
|
)
|
|||||
|
Future income tax expenses
|
(3,223,740
|
)
|
(2,283,541
|
)
|
(3,721,509
|
)
|
|||||
|
Undiscounted future net cash flows
|
9,489,013
|
|
8,263,550
|
|
12,840,519
|
|
|||||
|
10% annual discount
|
(5,401,261
|
)
|
(4,245,939
|
)
|
(7,000,151
|
)
|
|||||
|
Standardized measure of discounted future net cash flows(2)
|
$
|
4,087,752
|
|
$
|
4,017,611
|
|
$
|
5,840,368
|
|
||
|
(1)
|
Includes abandonment costs.
|
|
(2)
|
Includes approximately
$643.3 million
,
$781.6 million
and
$952.7 million
attributable to noncontrolling interests at
December 31, 2014
,
2013
and
2012
respectively.
|
F-70
SandRidge Energy, Inc. and Subsidiaries
Notes to Consolidated Financial Statements - (Continued)
The following table represents the Company’s estimate of changes in the standardized measure of discounted future net cash flows from proved reserves (in thousands):
|
Present value as of December 31, 2011
|
$
|
5,216,337
|
|
|
Changes during the year
|
|||
|
Revenues less production and other costs
|
(1,234,918
|
)
|
|
|
Net changes in prices, production and other costs
|
(2,555,391
|
)
|
|
|
Development costs incurred
|
766,943
|
|
|
|
Net changes in future development costs
|
(45,397
|
)
|
|
|
Extensions and discoveries
|
2,092,423
|
|
|
|
Revisions of previous quantity estimates
|
(530,755
|
)
|
|
|
Accretion of discount
|
678,200
|
|
|
|
Net change in income taxes
|
11,433
|
|
|
|
Purchases of reserves in-place
|
1,708,301
|
|
|
|
Sales of reserves in-place
|
(410,415
|
)
|
|
|
Timing differences and other(1)
|
143,607
|
|
|
|
Net change for the year
|
624,031
|
|
|
|
Present value as of December 31, 2012(2)
|
5,840,368
|
|
|
|
Changes during the year
|
|||
|
Revenues less production and other costs
|
(1,271,559
|
)
|
|
|
Net changes in prices, production and other costs
|
271,566
|
|
|
|
Development costs incurred
|
474,275
|
|
|
|
Net changes in future development costs
|
(207,729
|
)
|
|
|
Extensions and discoveries
|
1,406,102
|
|
|
|
Revisions of previous quantity estimates
|
(296,418
|
)
|
|
|
Accretion of discount
|
711,385
|
|
|
|
Net change in income taxes
|
477,328
|
|
|
|
Purchases of reserves in-place
|
1,628
|
|
|
|
Sales of reserves in-place
|
(3,172,187
|
)
|
|
|
Timing differences and other(1)
|
(217,148
|
)
|
|
|
Net change for the year
|
(1,822,757
|
)
|
|
|
Present value as of December 31, 2013(2)
|
4,017,611
|
|
|
|
Changes during the year
|
|||
|
Revenues less production and other costs
|
(1,043,060
|
)
|
|
|
Net changes in prices, production and other costs
|
331,694
|
|
|
|
Development costs incurred
|
364,262
|
|
|
|
Net changes in future development costs
|
(341,183
|
)
|
|
|
Extensions and discoveries
|
1,785,963
|
|
|
|
Revisions of previous quantity estimates
|
(77,688
|
)
|
|
|
Accretion of discount
|
477,458
|
|
|
|
Net change in income taxes
|
(256,371
|
)
|
|
|
Purchases of reserves in-place
|
50,958
|
|
|
|
Sales of reserves in-place
|
(1,058,330
|
)
|
|
|
Timing differences and other(1)
|
(163,562
|
)
|
|
|
Net change for the year
|
70,141
|
|
|
|
Present value as of December 31, 2014(2)
|
$
|
4,087,752
|
|
|
(1)
|
The change in timing differences and other are related to revisions in the Company’s estimated time of production and development.
|
|
(2)
|
Includes approximately
$643.3 million
,
$781.6 million
and
$952.7 million
attributable to noncontrolling interests at
December 31, 2014
,
2013
, and 2012 respectively.
|
F-71
SandRidge Energy, Inc. and Subsidiaries
Notes to Consolidated Financial Statements - (Continued)
25
. Quarterly Financial Results (Unaudited)
The Company’s operating results for each quarter of
2014
and
2013
are summarized below (in thousands, except per share data).
|
First
Quarter
|
Second
Quarter
|
Third
Quarter
|
Fourth
Quarter
|
||||||||||||
|
2014
|
|||||||||||||||
|
Total revenues
|
$
|
443,056
|
|
$
|
374,714
|
|
$
|
394,107
|
|
$
|
346,881
|
|
|||
|
(Loss) income from operations(1)(2)
|
$
|
(82,330
|
)
|
$
|
42,079
|
|
$
|
256,491
|
|
$
|
373,984
|
|
|||
|
Net (loss) income(1)(2)
|
$
|
(142,406
|
)
|
$
|
(17,252
|
)
|
$
|
197,499
|
|
$
|
314,057
|
|
|||
|
(Loss applicable) income available to SandRidge Energy, Inc. common stockholders(1)(2)
|
$
|
(150,217
|
)
|
$
|
(46,775
|
)
|
$
|
145,957
|
|
$
|
254,295
|
|
|||
|
(Loss applicable) income available per share to SandRidge Energy, Inc. common stockholders(3)
|
|||||||||||||||
|
Basic
|
$
|
(0.31
|
)
|
$
|
(0.10
|
)
|
$
|
0.30
|
|
$
|
0.55
|
|
|||
|
Diluted
|
$
|
(0.31
|
)
|
$
|
(0.10
|
)
|
$
|
0.27
|
|
$
|
0.48
|
|
|||
|
2013
|
|||||||||||||||
|
Total revenues
|
$
|
511,690
|
|
$
|
512,987
|
|
$
|
493,603
|
|
$
|
465,108
|
|
|||
|
(Loss) income from operations(4)(5)(6)
|
$
|
(367,482
|
)
|
$
|
78,386
|
|
$
|
(2,166
|
)
|
$
|
122,261
|
|
|||
|
Net (loss) income(4)(5)(6)
|
$
|
(539,215
|
)
|
$
|
16,613
|
|
$
|
(65,256
|
)
|
$
|
73,379
|
|
|||
|
(Loss applicable) income available to SandRidge Energy, Inc. common stockholders(4)(5)(6)
|
$
|
(501,177
|
)
|
$
|
(42,389
|
)
|
$
|
(95,328
|
)
|
$
|
29,480
|
|
|||
|
(Loss applicable) income available per share to SandRidge Energy, Inc. common stockholders(3)
|
|||||||||||||||
|
Basic
|
$
|
(1.05
|
)
|
$
|
(0.09
|
)
|
$
|
(0.20
|
)
|
$
|
0.06
|
|
|||
|
Diluted
|
$
|
(1.05
|
)
|
$
|
(0.09
|
)
|
$
|
(0.20
|
)
|
$
|
0.06
|
|
|||
|
(1)
|
Includes a full cost ceiling limitation impairment of
$164.8 million
in the first quarter and impairments of drilling assets of
$3.1 million
and
$24.3 million
in the second and fourth quarters, respectively.
|
|
(2)
|
Includes loss (gain) on derivative contracts of
$42.5 million
,
$85.3 million
,
$(132.6) million
and
$(329.2) million
for the first, second, third and fourth quarters, respectively.
|
|
(3)
|
(Loss applicable) income available per share to common stockholders for each quarter is computed using the weighted-average number of shares outstanding during the quarter, while earnings per share for the fiscal year is computed using the weighted-average number of shares outstanding during the year. Thus, the sum of (loss applicable) income available per share to common stockholders for each of the four quarters may not equal the fiscal year amount.
|
|
(4)
|
Includes a
$10.6 million
impairment of various drilling assets and a
$2.9 million
impairment of a corporate asset in the second quarter of 2013 and a
$2.1 million
and
$10.0 million
impairment of certain midstream inventory, natural gas compressors, gas treating plants and a CO
2
compression station in the second and fourth quarters of 2013, respectively.
|
|
(5)
|
Includes loss (gain) on derivative contracts of
$40.9 million
,
$(103.7) million
,
$132.8 million
and
$(22.9) million
for the first, second, third and fourth quarters, respectively.
|
|
(6)
|
Includes loss on sale of Permian Properties of
$398.9 million
in the first quarter of 2013.
|
F-72
SIGNATURES
Pursuant to the requirements of Section 13 or 15(d) of the Securities Exchange Act of 1934, the registrant has duly caused this report to be signed on its behalf by the undersigned, thereunto duly authorized.
|
SANDRIDGE ENERGY, INC.
|
||
|
By
|
/s/ J
AMES
D. B
ENNETT
|
|
|
James D. Bennett,
|
||
|
President and Chief Executive Officer
|
||
|
February 27, 2015
|
||
KNOW ALL MEN BY THESE PRESENTS, that each person whose signature appears below constitutes and appoints Eddie M. LeBlanc, Philip T. Warman and Justin P. Byrne, and each of them severally, his true and lawful attorney or attorneys-in-fact and agents, with full power to act with or without the others and with full power of substitution and resubstitution, to execute in his name, place and stead, in any and all capacities, any or all amendments to this report, and to file the same, with all exhibits thereto, and other documents in connection therewith, with the Securities and Exchange Commission, granting unto said attorneys-in-fact and agents and each of them, full power and authority to do and perform in the name of on behalf of the undersigned, in any and all capacities, each and every act and thing necessary or desirable to be done in and about the premises, to all intents and purposes and as fully as they might or could do in person, hereby ratifying, approving and confirming all that said attorneys-in-fact and agents or their substitutes may lawfully do or cause to be done by virtue hereof.
Pursuant to the requirements of the Securities Exchange Act of 1934, this report has been signed below by the following persons on behalf of the registrant and in the capacities and on the dates indicated.
|
Signature
|
|
Title
|
Date
|
|
/s/ JAMES D. BENNETT
|
|
President, Chief Executive Officer and Director (Principal Executive Officer)
|
February 27, 2015
|
|
James D. Bennett
|
|||
|
/s/ EDDIE M. LEBLANC
|
|
Chief Financial Officer and Executive Vice President (Principal Financial Officer)
|
February 27, 2015
|
|
Eddie M. LeBlanc
|
|||
|
/s/ RANDALL D. COOLEY
|
|
Senior Vice President—Accounting (Principal Accounting Officer)
|
February 27, 2015
|
|
Randall D. Cooley
|
|||
|
/s/ J. MIKE STICE
|
|
Director
|
February 27, 2015
|
|
J. Mike Stice
|
|||
|
/s/ EVERETT R. DOBSON
|
|
Director
|
February 27, 2015
|
|
Everett R. Dobson
|
|||
|
/s/ JIM J. BREWER
|
|
Director
|
February 27, 2015
|
|
Jim J. Brewer
|
|||
|
/s/ JEFFERY S. SEROTA
|
|
Director
|
February 27, 2015
|
|
Jeffery S. Serota
|
|||
|
/s/ EDWARD W. MONEYPENNY
|
|
Director
|
February 27, 2015
|
|
Edward W. Moneypenny
|
|||
|
/s/ STEPHEN C. BEASLEY
|
|
Director
|
February 27, 2015
|
|
Stephen C. Beasley
|
|||
|
/s/ ALAN J. WEBER
|
|
Director
|
February 27, 2015
|
|
Alan J. Weber
|
|||
|
/s/ DAN A. WESTBROOK
|
|
Director
|
February 27, 2015
|
|
Dan A. Westbrook
|
|||
EXHIBIT INDEX
|
|
|
Incorporated by Reference
|
|
||||
|
Exhibit
No.
|
Exhibit Description
|
Form
|
SEC
File No.
|
Exhibit
|
Filing Date
|
Filed
Herewith
|
|
|
2.1
|
Equity Purchase Agreement dated as of January 6, 2014, between SandRidge Energy, Inc., SandRidge Holdings, Inc. and Fieldwood Energy LLC
|
8-K
|
001-33784
|
2.1
|
|
1/9/2014
|
|
|
3.1
|
Certificate of Incorporation of SandRidge Energy, Inc.
|
S-1
|
333-148956
|
3.1
|
|
1/30/2008
|
|
|
3.2
|
Certificate of Amendment to the Certificate of Incorporation of SandRidge Energy, Inc., dated July 16, 2010
|
10-Q
|
001-33784
|
3.2
|
|
8/9/2010
|
|
|
3.3
|
Certificate of Designation of 8.5% Convertible Perpetual Preferred Stock of SandRidge Energy, Inc.
|
8-K
|
001-33784
|
3.1
|
|
1/21/2009
|
|
|
3.4
|
Certificate of Designation of 6.0% Convertible Perpetual Preferred Stock of SandRidge Energy, Inc.
|
8-K
|
001-33784
|
3.1
|
|
12/22/2009
|
|
|
3.5
|
Certificate of Designation of 7.0% Convertible Perpetual Preferred Stock of SandRidge Energy, Inc.
|
8-K
|
001-33784
|
3.1
|
|
11/10/2010
|
|
|
3.6
|
Certificate of Designations of Series A Junior Participating Preferred Stock of SandRidge Energy, Inc.
|
8-K
|
001-33784
|
3.1
|
|
11/20/2012
|
|
|
3.7
|
Certificate of Elimination of Series A Junior Participating Preferred Stock of SandRidge Energy, Inc.
|
8-K
|
001-33784
|
3.1
|
|
4/30/2013
|
|
|
3.8
|
Amended and Restated Bylaws of SandRidge Energy, Inc.
|
8-K
|
001-33784
|
3.1
|
|
3/9/2009
|
|
|
3.9
|
Amendments to the March 3, 2009 Amended and Restated Bylaws of SandRidge Energy, Inc. effective November 19, 2012
|
8-K
|
001-33784
|
3.2
|
|
11/20/2012
|
|
|
4.1
|
Specimen Stock Certificate representing common stock of SandRidge Energy, Inc.
|
S-1
|
333-148956
|
4.1
|
|
1/30/2008
|
|
|
4.2
|
Indenture, dated December 16, 2009, by and among SandRidge Energy, Inc., certain subsidiary guarantors named therein and Wells Fargo Bank, National Association, as trustee
|
8-K
|
001-33784
|
4.1
|
|
12/22/2009
|
|
|
4.3
|
Indenture, dated March 15, 2011, by and among the SandRidge Energy, Inc., certain subsidiary guarantors named therein, and Wells Fargo Bank, National Association, as trustee
|
8-K
|
001-33784
|
4.1
|
|
3/18/2011
|
|
|
4.4
|
Indenture, dated as of April 17, 2012, among SandRidge Energy, Inc., certain subsidiary guarantors named therein, and Wells Fargo Bank, National Association
|
8-K
|
001-33784
|
4.1
|
|
4/17/2012
|
|
|
4.5
|
Supplemental Indenture, dated April 17, 2012, among SandRidge Energy, Inc., certain subsidiary guarantors named therein, and Wells Fargo Bank, National Association, as trustee
|
8-K
|
001-33784
|
4.3
|
|
4/17/2012
|
|
|
4.6
|
Supplemental Indenture, dated June 1, 2012, among SandRidge Energy, Inc., certain subsidiary guarantors named therein, and Wells Fargo Bank, National Association, as trustee
|
10-Q
|
001-33784
|
4.3
|
|
8/6/2012
|
|
|
4.7
|
Indenture, dated as of August 20, 2012, among SandRidge Energy, Inc., certain subsidiary guarantors named therein, and Wells Fargo Bank, National Association, as trustee
|
8-K
|
001-33784
|
4.4
|
|
8/21/2012
|
|
|
10.1†
|
Executive Nonqualified Excess Plan
|
8-K
|
001-33784
|
10.1
|
|
7/15/2008
|
|
|
10.2.1†
|
SandRidge Energy, Inc. 2009 Incentive Plan (as amended on July 1, 2013)
|
10-K
|
001-33784
|
10.2
|
|
2/28/2014
|
|
|
|
|
Incorporated by Reference
|
|
||||
|
Exhibit
No.
|
Exhibit Description
|
Form
|
SEC
File No.
|
Exhibit
|
Filing Date
|
Filed
Herewith
|
|
|
10.2.2†
|
Amendment to the SandRidge Energy, Inc. 2009 Incentive Plan
|
10-Q
|
001-33784
|
10.3
|
|
8/8/2013
|
|
|
10.2.3†
|
Form of Restricted Stock Certificate for SandRidge Energy, Inc. 2009 Incentive Plan
|
*
|
|||||
|
10.2.4†
|
Form of Performance Unit Certificate for SandRidge Energy, Inc. 2009 Incentive Plan
|
*
|
|||||
|
10.2.5†
|
Form of Restricted Stock Unit Certificate for SandRidge Energy, Inc. 2009 Incentive Plan
|
*
|
|||||
|
10.2.6†
|
Form of Performance Share Unit Certificate for SandRidge Energy, Inc. 2009 Incentive Plan
|
*
|
|||||
|
10.3.1
|
Employment Agreement, effective as of August 12, 2014, between SandRidge Energy, Inc. and James D. Bennett
|
*
|
|||||
|
10.3.2
|
Employment Agreement, effective as of December 30, 2013, between SandRidge Energy, Inc. and Duane Grubert
|
*
|
|||||
|
10.3.3
|
Form of Employment Agreement for Executive Vice Presidents and Senior Vice Presidents of SandRidge Energy, Inc.
|
*
|
|||||
|
10.4†
|
Form of Indemnification Agreement for directors and officers
|
S-1
|
333-148956
|
10.5
|
|
1/30/2008
|
|
|
10.5
|
Third Amended and Restated Credit Agreement, dated as of October 22, 2014, among SandRidge Energy, Inc., Bank of America, N.A., as Administrative Agent, Swing Line Lender and L/C Issuer, and the other lenders party thereto
|
8-K
|
001-33784
|
10.1
|
|
10/24/2014
|
|
|
10.5.2
|
Amendment No. 1 to the Third Amended and Restated Credit Agreement and Waiver, dated as of November 14, 2014, among SandRidge Energy, Inc., Bank of America, N.A., as Administrative Agent, Swing Line Lender and L/C Issuer, and the other lenders party thereto
|
8-K
|
001-33784
|
10.1
|
|
11/19/2014
|
|
|
10.5.3
|
Amendment No. 2 and Scheduled Determination of the Borrowing Base, dated as of February 23, 2015, to the Third Amended and Restated Credit Agreement among SandRidge Energy, Inc., Bank of America, N.A., as Administrative Agent, Swing Line Lender and L/C Issuer, and the other lenders party thereto
|
*
|
|||||
|
10.6
|
Gas Treating and CO
2
Delivery Agreement, dated June 29, 2008, by and between Oxy USA Inc. and SandRidge Energy Exploration and Production, LLC
|
10-Q
|
001-33784
|
10.2
|
|
8/7/2008
|
|
|
10.7
|
Gas Gathering Agreement, dated June 30, 2009, by and between Piñon Gathering Company, LLC and SandRidge Exploration and Production, LLC
|
10-Q
|
001-33784
|
10.5
|
|
8/6/2009
|
|
|
10.8
|
Operations and Maintenance Agreement, dated June 30, 2009, by and between Piñon Gathering Company, LLC and SandRidge Midstream, Inc.
|
10-Q
|
001-33784
|
10.6
|
|
8/6/2009
|
|
|
10.9
|
Development Agreement, by and between SandRidge Energy, Inc., SandRidge Exploration and Production, LLC and SandRidge Permian Trust
|
8-K
|
001-33784
|
10.1
|
|
8/19/2011
|
|
|
10.10
|
Development Agreement, by and between SandRidge Energy, Inc., SandRidge Exploration and Production, LLC and SandRidge Mississippian Trust II
|
8-K
|
001-33784
|
10.1
|
|
4/24/2012
|
|
|
|
|
Incorporated by Reference
|
|
||||
|
Exhibit
No.
|
Exhibit Description
|
Form
|
SEC
File No.
|
Exhibit
|
Filing Date
|
Filed
Herewith
|
|
|
10.11
|
Settlement Agreement, dated March 13, 2013, by and among the TPG-Axon Partners, L.P., TPG-Axon Management LP, TPG-Axon Partners GP, L.P., TPG-Axon GP, LLC, TPG-Axon International, L.P., TPG-Axon International GP, LLC and Dinakar Singh LLC and SandRidge Energy, Inc.
|
8-K
|
001-33784
|
10.1
|
|
3/13/2013
|
|
|
21.1
|
Subsidiaries of SandRidge Energy, Inc.
|
*
|
|||||
|
23.1
|
Consent of PricewaterhouseCoopers LLP
|
*
|
|||||
|
23.2
|
Consent of Cawley, Gillespie & Associates
|
*
|
|||||
|
23.3
|
Consent of Netherland, Sewell & Associates, Inc.
|
*
|
|||||
|
23.4
|
Consent of Lee Keeling and Associates, Inc.
|
*
|
|||||
|
31.1
|
Section 302 Certification—Chief Executive Officer
|
*
|
|||||
|
31.2
|
Section 302 Certification—Chief Financial Officer
|
*
|
|||||
|
32.1
|
Section 906 Certifications of Chief Executive Officer and Chief Financial Officer
|
*
|
|||||
|
99.1
|
Report of Cawley, Gillespie & Associates
|
*
|
|||||
|
99.2
|
Report of Netherland, Sewell & Associates, Inc.
|
*
|
|||||
|
101.INS
|
XBRL Instance Document
|
*
|
|||||
|
101.SCH
|
XBRL Taxonomy Extension Schema Document
|
*
|
|||||
|
101.CAL
|
XBRL Taxonomy Extension Calculation Linkbase Document
|
*
|
|||||
|
101.DEF
|
XBRL Taxonomy Extension Definition Document
|
*
|
|||||
|
101.LAB
|
XBRL Taxonomy Extension Label Linkbase Document
|
*
|
|||||
|
101.PRE
|
XBRL Taxonomy Extension Presentation Linkbase Document
|
*
|
|||||
|
† Management contract or compensatory plan or arrangement
|
|||||||
TABLE OF CONTENTS
Part IItem 1. BusinessItem 1A. Risk FactorsItem 1B. Unresolved Staff CommentsItem 2. PropertiesItem 3. Legal ProceedingsItem 4. Mine Safety DisclosuresPart IIItem 5. Market For Registrant S Common Equity, Related Stockholder Matters and Issuer Purchases Of Equity SecuritiesItem 6. Selected Financial DataItem 7. Management S Discussion and Analysis Of Financial Condition and Results Of OperationsItem 7A. Quantitative and Qualitative Disclosures About Market RiskItem 8. Financial Statements and Supplementary DataItem 9. Changes in and Disagreements with Accountants on Accounting and Financial DisclosureItem 9A. Controls and ProceduresItem 9B. Other InformationPart IIIItem 10. Directors, Executive Officers and Corporate GovernanceItem 11. Executive CompensationItem 12. Security Ownership Of Certain Beneficial Owners and Management and Related Stockholder MattersItem 13. Certain Relationships and Related Transactions and Director IndependenceItem 14. Principal Accounting Fees and ServicesPart IVItem 15. Exhibits and Financial Statement Schedules